Embed Size (px)
Citation preview
FURTHER MATHEMATICSWritten examination 2
Monday 4 November 2019 Reading time: 9.00 am to 9.15 am (15 minutes) Writing time: 9.15 am to 10.45 am (1 hour 30 minutes)
QUESTION AND ANSWER BOOK
Structure of bookSection A – Core Number of
questionsNumber of questions
to be answeredNumber of
marks
9 9 36Section B – Modules Number of
modulesNumber of modules
to be answeredNumber of
marks
4 2 24 Total 60
• Studentsaretowriteinblueorblackpen.• Studentsarepermittedtobringintotheexaminationroom:pens,pencils,highlighters,erasers,
sharpeners,rulers,oneboundreference,oneapprovedtechnology(calculatororsoftware)and,ifdesired,onescientificcalculator.CalculatormemoryDOESNOTneedtobecleared.Forapprovedcomputer-basedCAS,fullfunctionalitymaybeused.
• StudentsareNOTpermittedtobringintotheexaminationroom:blanksheetsofpaperand/orcorrectionfluid/tape.
Materials supplied• Questionandanswerbookof37pages• Formulasheet• Workingspaceisprovidedthroughoutthebook.
Instructions• Writeyourstudent numberinthespaceprovidedaboveonthispage.• Unlessotherwiseindicated,thediagramsinthisbookarenotdrawntoscale.• AllwrittenresponsesmustbeinEnglish.
At the end of the examination• Youmaykeeptheformulasheet.
Students are NOT permitted to bring mobile phones and/or any other unauthorised electronic devices into the examination room.
©VICTORIANCURRICULUMANDASSESSMENTAUTHORITY2019
SUPERVISOR TO ATTACH PROCESSING LABEL HEREVictorian Certificate of Education 2019
STUDENT NUMBER
Letter
2019 FURMATH EXAM 2 2
do
no
t w
rit
e i
n t
his
ar
ea
do
no
t w
rit
e i
n t
his
ar
ea
SECTION A – Question 1 – continued
Data analysis
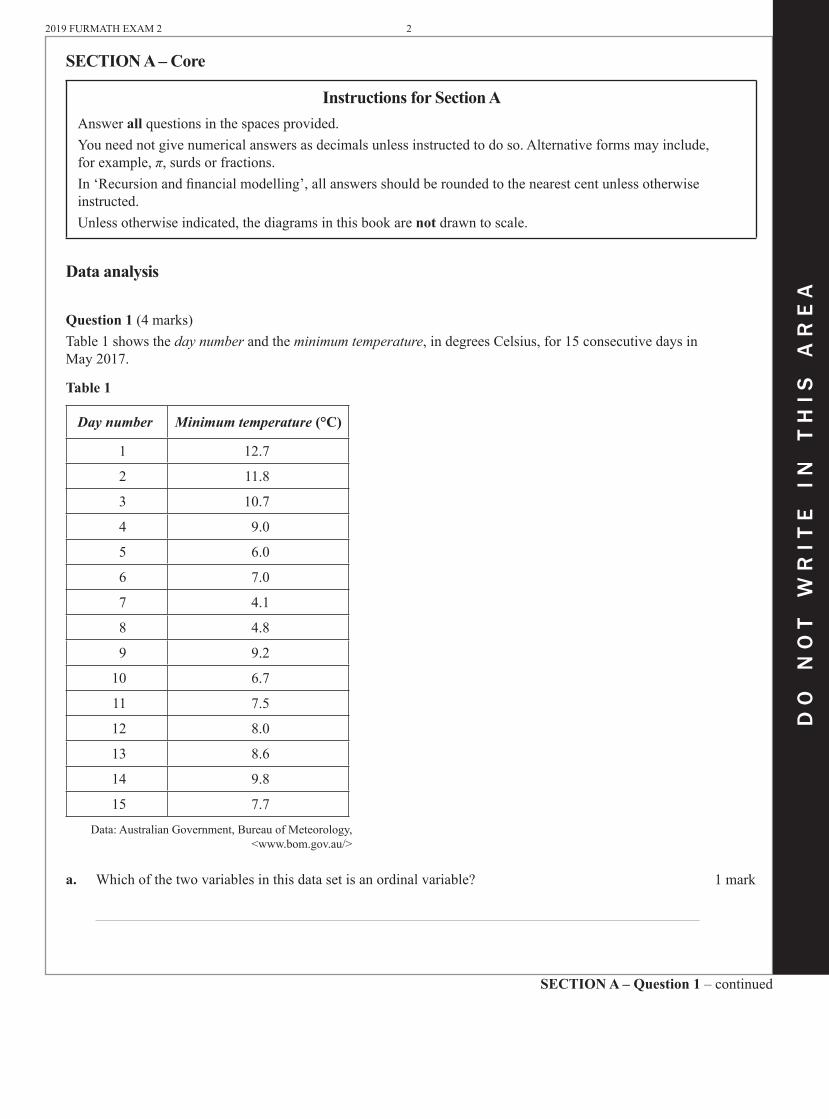
Question 1 (4 marks)Table 1 shows the day number and the minimum temperature, in degrees Celsius, for 15 consecutive days in May 2017.
Table 1
Day number Minimum temperature (°C)
1 12.7
2 11.8
3 10.7
4 9.0
5 6.0
6 7.0
7 4.1
8 4.8
9 9.2
10 6.7
11 7.5
12 8.0
13 8.6
14 9.8
15 7.7
Data: Australian Government, Bureau of Meteorology, <www.bom.gov.au/>
a. Which of the two variables in this data set is an ordinal variable? 1 mark
SECTION A – Core
Instructions for Section AAnswer all questions in the spaces provided.You need not give numerical answers as decimals unless instructed to do so. Alternative forms may include, for example, π, surds or fractions.In ‘Recursion and financial modelling’, all answers should be rounded to the nearest cent unless otherwise instructed.Unless otherwise indicated, the diagrams in this book are not drawn to scale.

3 2019 FURMATH EXAM 2
SECTION A – continuedTURN OVER
do
no
t w
rit
e i
n t
his
ar
ea
do
no
t w
rit
e i
n t
his
ar
ea
The incomplete ordered stem plot below has been constructed using the data values for days 1 to 10.
key: 4|1 = 4.1 n = 15 minimum temperature (°C)
4 1 8
5
6 0 7
7 0
8
9 0 2
10 7
11 8
12 7
b. Complete the stem plot above by adding the data values for days 11 to 15. 1 mark
(Answer on the stem plot above.)
c. The ordered stem plot below shows the maximum temperature, in degrees Celsius, for the same 15 days.
key: 9|2 = 9.2 n = 15
maximum temperature (°C)
9 2
10
11 5 6
12 2 5
13 5 5 7
14 9 9
15 0 2 5 6
16 0
Data: Australian Government, Bureau of Meteorology, <www.bom.gov.au/>
Use this stem plot to determine
i. thevalueofthefirstquartile(Q1) 1 mark
ii. the percentage of days with a maximum temperature higher than 15.3 °C. 1 mark
2019 FURMATH EXAM 2 4
SECTION A – continued
do
no
t w
rit
e i
n t
his
ar
ea
do
no
t w
rit
e i
n t
his
ar
ea
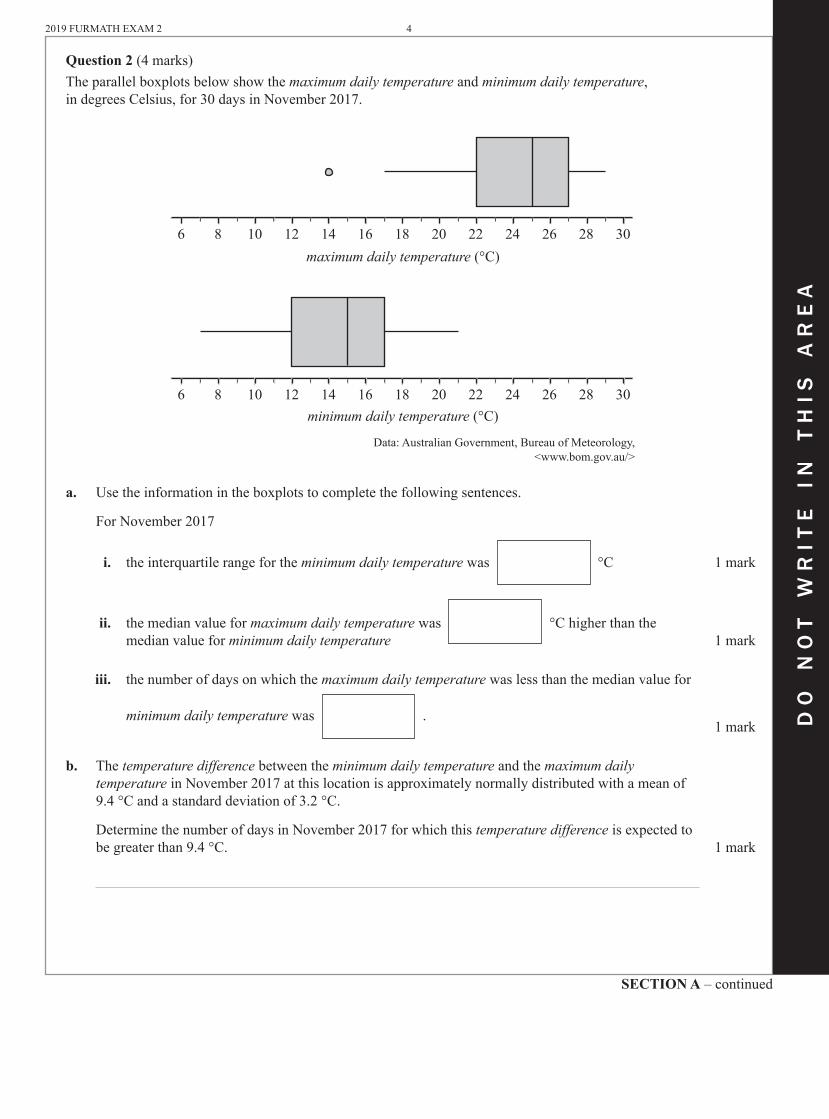
Question 2 (4 marks)The parallel boxplots below show the maximum daily temperature and minimum daily temperature, in degrees Celsius, for 30 days in November 2017.
6 8 10 12 14 16 18 20 22 24 26 28 30
6 8 10 12 14 16 18 20 22 24 26 28 30
maximum daily temperature (°C)
minimum daily temperature (°C)
Data: Australian Government, Bureau of Meteorology, <www.bom.gov.au/>
a. Use the information in the boxplots to complete the following sentences.
For November 2017
i. the interquartile range for the minimum daily temperature was °C 1 mark
ii. the median value for maximum daily temperature was °C higher than the median value for minimum daily temperature 1 mark
iii. the number of days on which the maximum daily temperature was less than the median value for
minimum daily temperature was .1 mark
b. The temperature difference between the minimum daily temperature and the maximum daily temperature in November 2017 at this location is approximately normally distributed with a mean of 9.4 °C and a standard deviation of 3.2 °C.
Determine the number of days in November 2017 for which this temperature difference is expected to be greater than 9.4 °C. 1 mark
5 2019 FURMATH EXAM 2
SECTION A – continuedTURN OVER
do
no
t w
rit
e i
n t
his
ar
ea
do
no
t w
rit
e i
n t
his
ar
ea
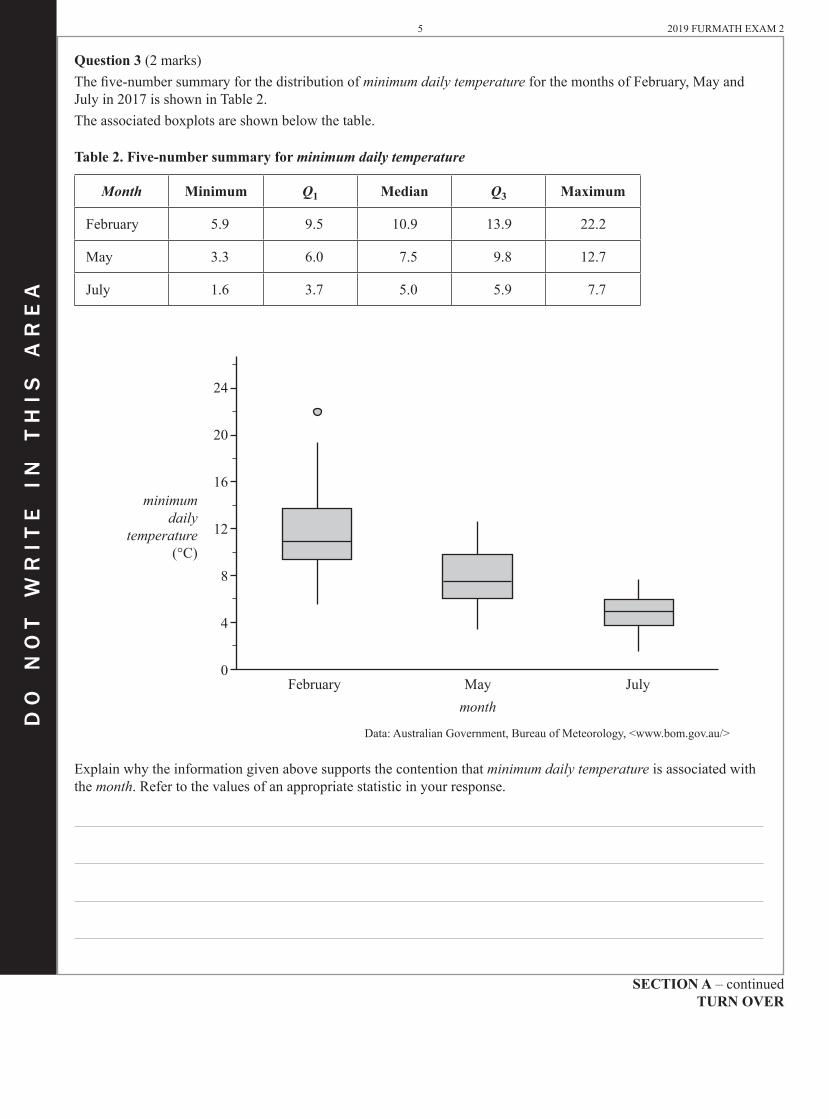
Question 3 (2 marks)The five-number summary for the distribution of minimum daily temperature for the months of February, May and July in 2017 is shown in Table 2.The associated boxplots are shown below the table.
Table 2. Five-number summary for minimum daily temperature
Month Minimum Q1 Median Q3 Maximum
February 5.9 9.5 10.9 13.9 22.2
May 3.3 6.0 7.5 9.8 12.7
July 1.6 3.7 5.0 5.9 7.7
24
20
16
12
8
4
0
minimum daily
temperature(°C)
February Maymonth
July
Data: Australian Government, Bureau of Meteorology, <www.bom.gov.au/>
Explain why the information given above supports the contention that minimum daily temperature is associated with the month. Refer to the values of an appropriate statistic in your response.

2019FURMATHEXAM2 6
do
no
t w
rit
e i
n t
his
ar
ea
do
no
t w
rit
e i
n t
his
ar
ea
SECTION A – Question 4 – continued
Question 4(3marks)Therelativehumidity(%)at9amand3pmon14daysinNovember2017isshowninTable3below.
Table 3
Relative humidity (%)
9 am 3 pm
100 87
99 75
95 67
63 57
81 57
94 74
96 71
81 62
73 53
53 54
57 36
77 39
51 30
41 32
Data:AustralianGovernment, BureauofMeteorology,
<www.bom.gov.au/>
Aleastsquareslineistobefittedtothedatawiththeaimofpredictingtherelativehumidityat3pm(humidity 3 pm)fromtherelativehumidityat9am(humidity 9 am).
a. Nametheexplanatoryvariable. 1mark

7 2019FURMATHEXAM2
SECTION A – continuedTURN OVER
do
no
t w
rit
e i
n t
his
ar
ea
do
no
t w
rit
e i
n t
his
ar
ea
b. Determinethevaluesoftheinterceptandtheslopeofthisleastsquaresline. Roundbothvaluestothreesignificantfiguresandwritethemintheappropriateboxesprovided. 1mark
humidity 3 pm = + × humidity 9 am
c. Determinethevalueofthecorrelationcoefficientforthisdataset. Roundyouranswertothreedecimalplaces. 1mark

2019FURMATHEXAM2 8
do
no
t w
rit
e i
n t
his
ar
ea
do
no
t w
rit
e i
n t
his
ar
ea
SECTION A – Question 5 – continued
Question 5 (8marks)Thescatterplotbelowshowstheatmosphericpressure,inhectopascals(hPa),at3pm(pressure 3 pm)plottedagainsttheatmosphericpressure,inhectopascals,at9am(pressure 9 am)for23daysinNovember2017ataparticularweatherstation.
1030
1025
1020
1015
1010
pressure 3 pm (hPa)
1010 1015 1020pressure 9 am (hPa)
1025 1030
Data:AustralianGovernment,BureauofMeteorology,<www.bom.gov.au/>
Aleastsquareslinehasbeenfittedtothescatterplotasshown.Theequationofthislineis
pressure 3 pm=111.4+0.8894×pressure 9 am
a. Interprettheslopeofthisleastsquareslineintermsoftheatmosphericpressureatthisweatherstationat9amandat3pm. 1mark
b. Usetheequationoftheleastsquareslinetopredicttheatmosphericpressureat3pmwhentheatmosphericpressureat9amis1025hPa.
Roundyouranswertothenearestwholenumber. 1mark

9 2019FURMATHEXAM2
do
no
t w
rit
e i
n t
his
ar
ea
do
no
t w
rit
e i
n t
his
ar
ea
SECTION A – Question 5 – continuedTURN OVER
c. Isthepredictionmadein part b.anexampleofextrapolationorinterpolation? 1mark
d. Determinetheresidualwhentheatmosphericpressureat9amis1013hPa. Roundyouranswertothenearestwholenumber. 1mark
e. Themeanandthestandarddeviationofpressure 9 am and pressure 3 pmforthese23daysareshowninTable4 below.
Table 4
Pressure 9 am Pressure 3 pm
Mean 1019.7 1018.3
Standard deviation 4.5477 4.1884
i. UsetheequationoftheleastsquareslineandtheinformationinTable4toshowthatthecorrelationcoefficientforthisdata,roundedtothreedecimalplaces,isr=0.966 1mark
ii. Whatpercentageofthevariationinpressure 3 pmisexplainedbythevariationinpressure 9 am? Roundyouranswertoonedecimalplace. 1mark
2019FURMATHEXAM2 10
SECTION A – continued
do
no
t w
rit
e i
n t
his
ar
ea
do
no
t w
rit
e i
n t
his
ar
ea
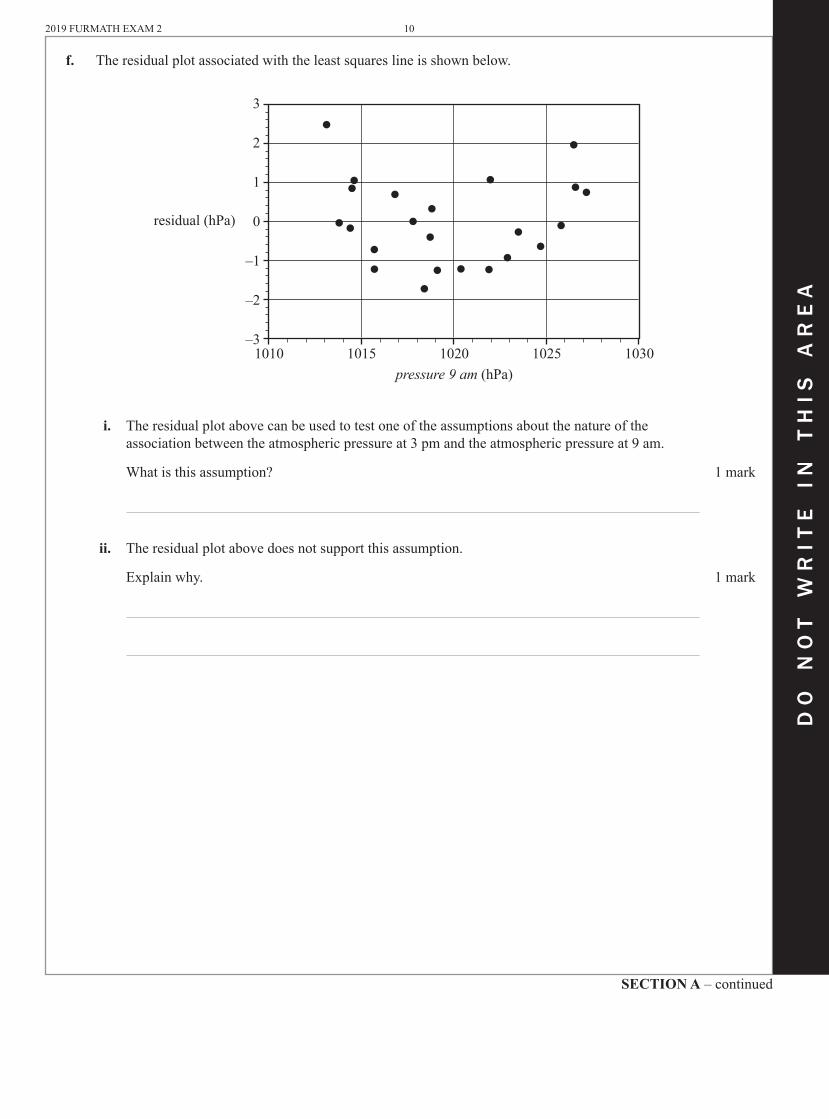
f. Theresidualplotassociatedwiththeleastsquareslineisshownbelow.
3
2
1
0
–1
–2
–3
residual (hPa)
1010 1015 1020pressure 9 am (hPa)
1025 1030
i. Theresidualplotabovecanbeusedtotestoneoftheassumptionsaboutthenatureoftheassociationbetweentheatmosphericpressureat3pmandtheatmosphericpressureat9am.
Whatisthisassumption? 1mark
ii. Theresidualplotabovedoesnotsupportthisassumption.
Explainwhy. 1mark

11 2019FURMATHEXAM2
SECTION A – continuedTURN OVER
do
no
t w
rit
e i
n t
his
ar
ea
do
no
t w
rit
e i
n t
his
ar
ea
Question 6 (3marks)Thetotalrainfall,inmillimetres,foreachofthefourseasonsin2015and2016isshowninTable5 below.
Table 5
Total rainfall (mm)
Year Summer Autumn Winter Spring
2015 142 156 222 120
2016 135 153 216 96
a. TheseasonalindexforwinterisshowninTable6below.
UsethevaluesinTable5tofindtheseasonalindicesforsummer,autumnandspring. WriteyouranswersinTable6,roundedtotwodecimalplaces. 2marks
Table 6
Summer Autumn Winter Spring
Seasonal index 1.41
b. Thetotalrainfallforeachofthefourseasonsin2017isshowninTable7below.
Table 7
Total rainfall (mm)
Year Summer Autumn Winter Spring
2017 141 156 262 120
UsetheappropriateseasonalindexfromTable6todeseasonalisethetotalrainfallforwinterin2017. Roundyouranswertothenearestwholenumber. 1mark
2019FURMATHEXAM2 12
SECTION A – continued
do
no
t w
rit
e i
n t
his
ar
ea
do
no
t w
rit
e i
n t
his
ar
ea
Recursion and financial modelling
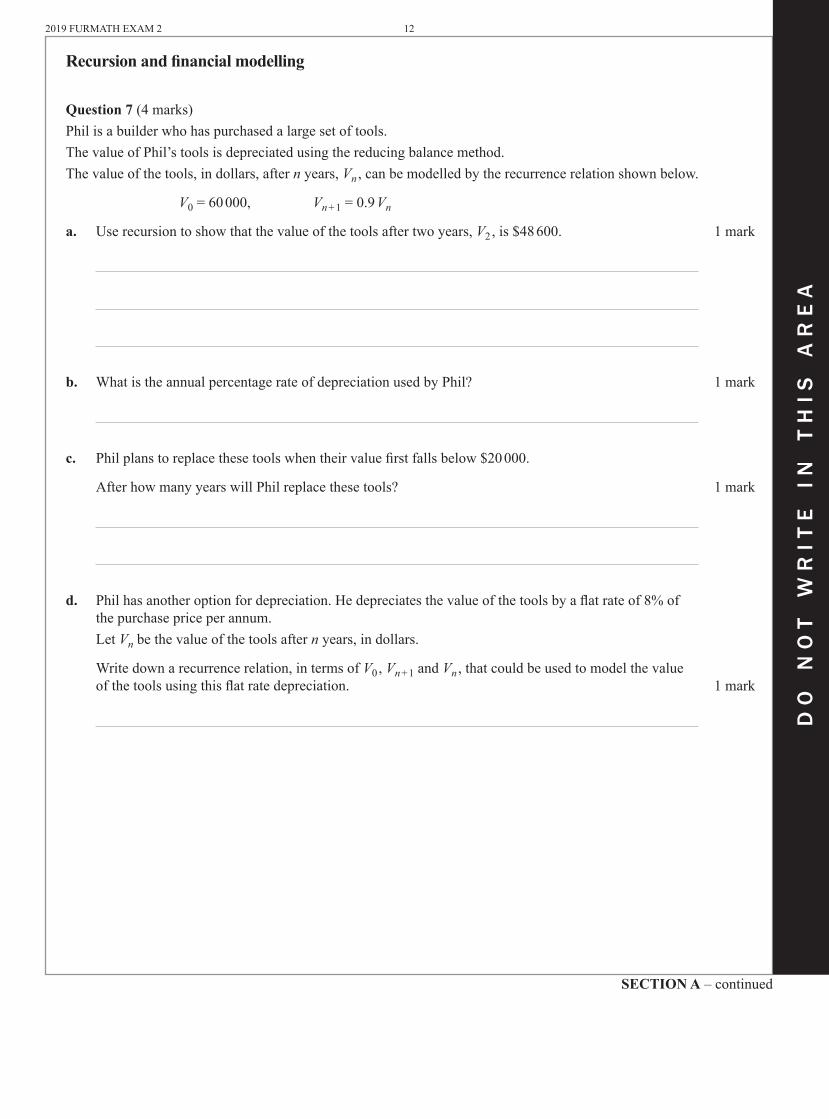
Question 7 (4marks)Philisabuilderwhohaspurchasedalargesetoftools.ThevalueofPhil’stoolsisdepreciatedusingthereducingbalancemethod.Thevalueofthetools,indollars,aftern years,Vn ,canbemodelledbytherecurrencerelationshownbelow.
V0=60000, Vn +1=0.9Vn
a. Userecursiontoshowthatthevalueofthetoolsaftertwoyears,V2 ,is$48600. 1mark
b. WhatistheannualpercentagerateofdepreciationusedbyPhil? 1mark
c. Philplanstoreplacethesetoolswhentheirvaluefirstfallsbelow$20000.
AfterhowmanyyearswillPhilreplacethesetools? 1mark
d. Philhasanotheroptionfordepreciation.Hedepreciatesthevalueofthetoolsbyaflatrateof8%ofthepurchasepriceperannum.
LetVnbethevalueofthetoolsaftern years,indollars.
Writedownarecurrencerelation,intermsofV0 ,Vn+1 and Vn ,thatcouldbeusedtomodelthevalueofthetoolsusingthisflatratedepreciation. 1mark

13 2019FURMATHEXAM2
SECTION A – continuedTURN OVER
do
no
t w
rit
e i
n t
his
ar
ea
do
no
t w
rit
e i
n t
his
ar
ea
Question 8 (4marks)Philinvests$200000inanannuityfromwhichhereceivesaregularmonthlypayment.Thebalanceoftheannuity,indollars,aftern months,An ,canbemodelledbytherecurrencerelation
A0=200000, An+1=1.0035An–3700
a. WhatmonthlypaymentdoesPhilreceive? 1mark
b. Showthattheannualpercentagecompoundinterestrateforthisannuityis4.2%. 1mark
Atsomepointinthefuture,theannuitywillhaveabalancethatislowerthanthemonthlypaymentamount.
c. Whatisthebalanceoftheannuitywhenitfirstfallsbelowthemonthlypaymentamount? Roundyouranswertothenearestcent. 1mark
d. IfthepaymentreceivedeachmonthbyPhilhadbeenadifferentamount,theinvestmentwouldactasasimpleperpetuity.
WhatmonthlypaymentcouldPhilhavereceivedfromthisperpetuity? 1mark
2019FURMATHEXAM2 14
do
no
t w
rit
e i
n t
his
ar
ea
do
no
t w
rit
e i
n t
his
ar
ea
END OF SECTION A
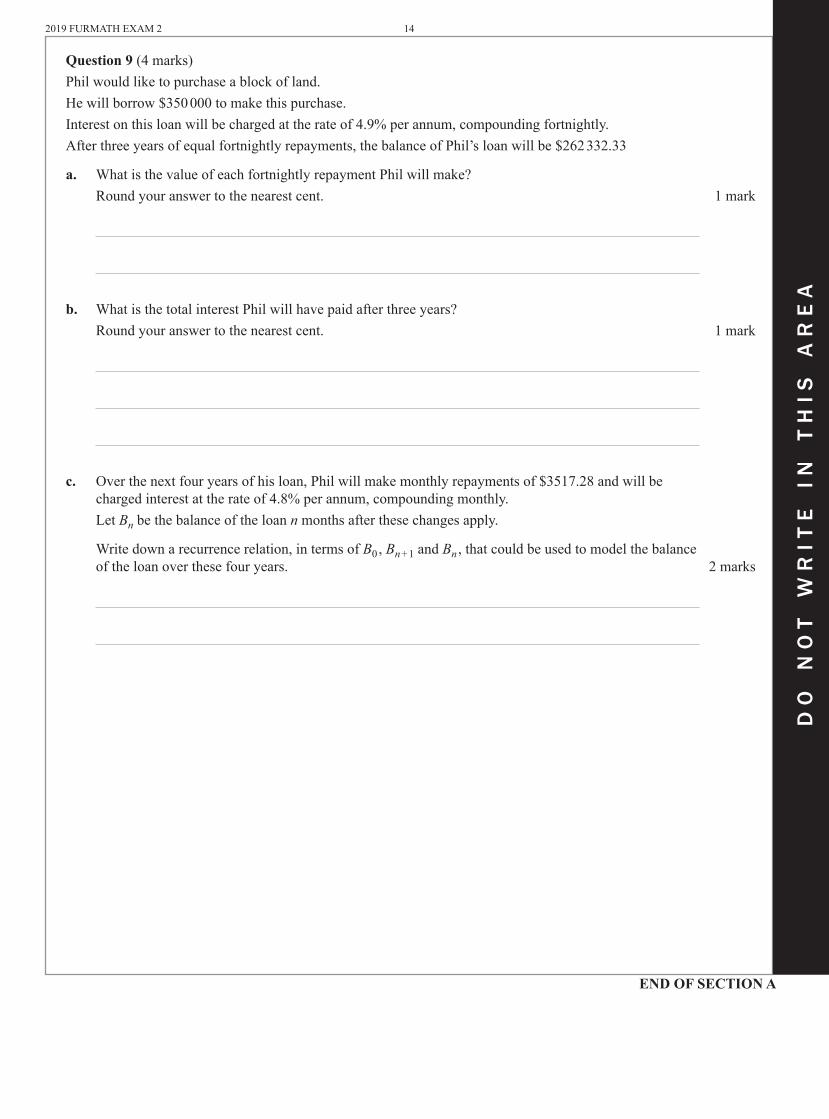
Question 9 (4marks)Philwouldliketopurchaseablockofland.Hewillborrow$350000tomakethispurchase.Interestonthisloanwillbechargedattherateof4.9%perannum,compoundingfortnightly.Afterthreeyearsofequalfortnightlyrepayments,thebalanceofPhil’sloanwillbe$262332.33
a. WhatisthevalueofeachfortnightlyrepaymentPhilwillmake? Roundyouranswertothenearestcent. 1mark
b. Whatisthetotal interestPhilwillhavepaidafterthreeyears? Roundyouranswertothenearestcent. 1mark
c. Overthenextfouryearsofhisloan,Philwillmakemonthlyrepaymentsof$3517.28andwillbechargedinterestattherateof4.8%perannum,compoundingmonthly.
LetBnbethebalanceoftheloannmonthsafterthesechangesapply.
Writedownarecurrencerelation,intermsofB0 ,Bn +1 and Bn ,thatcouldbeusedtomodelthebalanceoftheloanoverthesefouryears. 2marks
15 2019FURMATHEXAM2
do
no
t w
rit
e i
n t
his
ar
ea
do
no
t w
rit
e i
n t
his
ar
ea
SECTION B – continuedTURN OVER
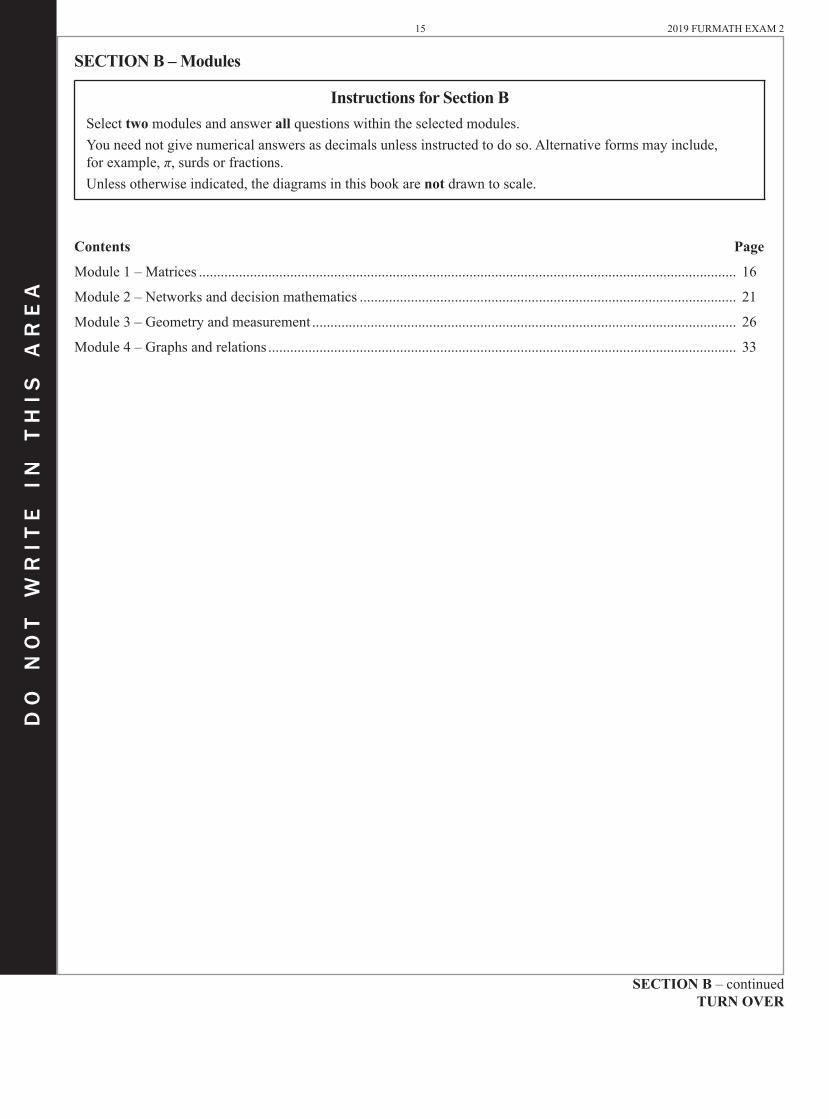
SECTION B – Modules
Instructions for Section BSelect twomodulesandanswerallquestionswithintheselectedmodules.Youneednotgivenumericalanswersasdecimalsunlessinstructedtodoso.Alternativeformsmayinclude, forexample,π,surdsorfractions.Unlessotherwiseindicated,thediagramsinthisbookarenotdrawntoscale.
Contents Page
Module1–Matrices................................................................................................................................................... 16
Module2–Networksanddecisionmathematics....................................................................................................... 21
Module3–Geometryandmeasurement.................................................................................................................... 26
Module4–Graphsandrelations................................................................................................................................ 33

2019 FURMATH EXAM 2 16
do
no
t w
rit
e i
n t
his
ar
ea
do
no
t w
rit
e i
n t
his
ar
ea
SECTION B – Module 1 – Question 1 – continued
Module 1 – Matrices
Question 1 (5 marks)The car park at a theme park has three areas, A, B and C.The number of empty (E) and full (F) parking spaces in each of the three areas at 1 pm on Friday are shown in matrix Q below.
E F
QABC
area=
70 5030 2040 40
a. What is the order of matrix Q? 1 mark
b. Write down a calculation to show that 110 parking spaces are full at 1 pm. 1 mark
Drivers must pay a parking fee for each hour of parking.Matrix P, below, shows the hourly fee, in dollars, for a car parked in each of the three areas.
areaA B C
P = [ ]1 30 3 50 1 80. . .
c. The total parking fee, in dollars, collected from these 110 parked cars if they were parked for one hour is calculated as follows.
P L× = [ ]207 00.
where matrix L is a 3 × 1 matrix.
Write down matrix L. 1 mark
L =
17 2019FURMATHEXAM2
do
no
t w
rit
e i
n t
his
ar
ea
do
no
t w
rit
e i
n t
his
ar
ea
SECTION B – Module 1 – continuedTURN OVER
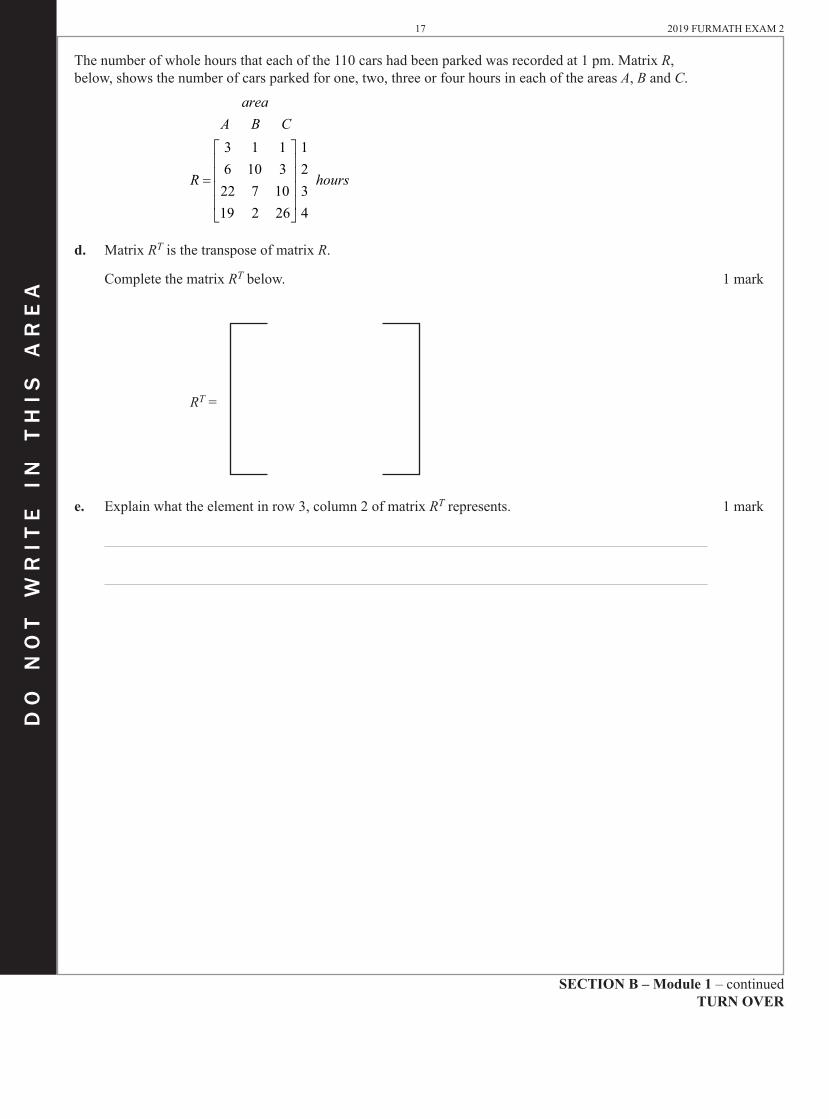
Thenumberofwholehoursthateachofthe110carshadbeenparkedwasrecordedat1pm.MatrixR,below,showsthenumberofcarsparkedforone,two,threeorfourhoursineachoftheareasA,B and C.
areaA B C
R hours=
3 1 16 10 322 7 1019 2 26
1234
d. MatrixRTisthetransposeofmatrixR.
Completethematrix RTbelow. 1mark
RT =
e. Explainwhattheelementinrow3,column2ofmatrix RTrepresents. 1mark
2019 FURMATH EXAM 2 18
do
no
t w
rit
e i
n t
his
ar
ea
do
no
t w
rit
e i
n t
his
ar
ea
SECTION B – Module 1 – Question 2 – continued
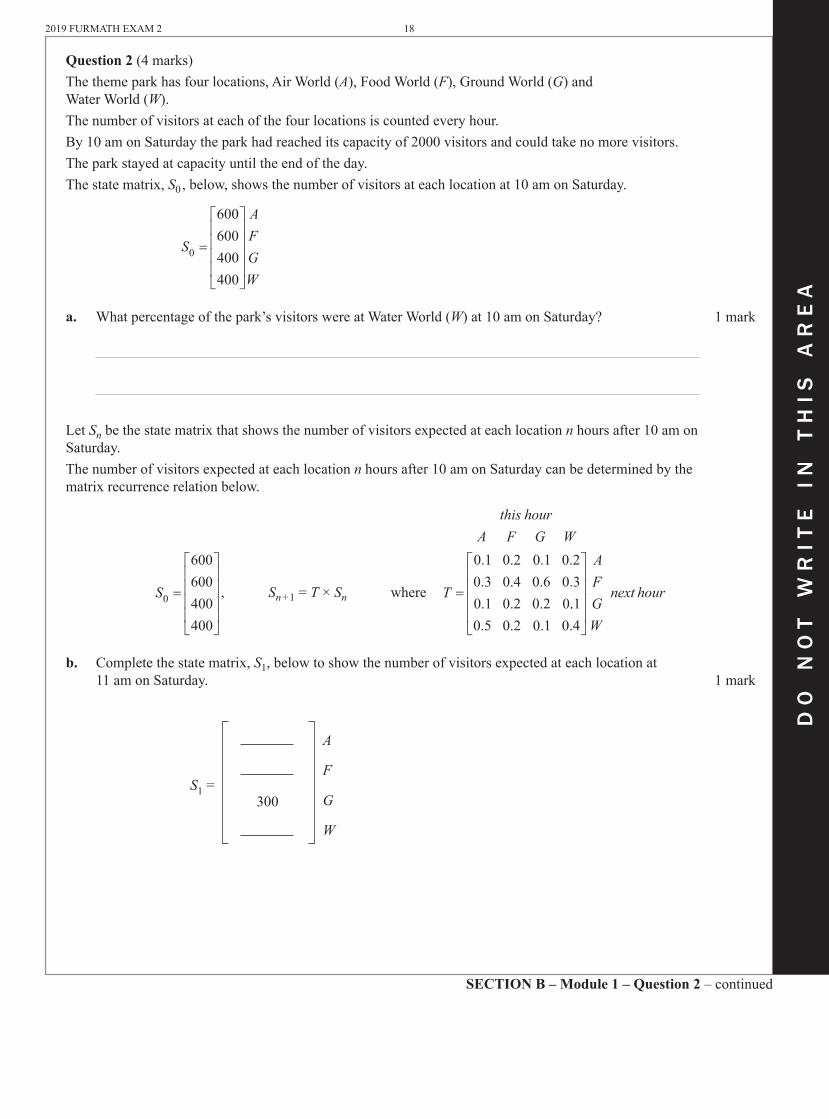
Question 2 (4 marks)The theme park has four locations, Air World (A), Food World (F), Ground World (G) and Water World (W).The number of visitors at each of the four locations is counted every hour.By 10 am on Saturday the park had reached its capacity of 2000 visitors and could take no more visitors.The park stayed at capacity until the end of the day.The state matrix, S0 , below, shows the number of visitors at each location at 10 am on Saturday.
S
AFGW
0
600600400400
=
a. What percentage of the park’s visitors were at Water World (W) at 10 am on Saturday? 1 mark
Let Sn be the state matrix that shows the number of visitors expected at each location n hours after 10 am on Saturday.The number of visitors expected at each location n hours after 10 am on Saturday can be determined by the matrix recurrence relation below.
S0
600600400400
=
, Sn + 1 = T × Sn where
this hourA F G W
T =
0 10 30 10 5
0 20 40 20 2
0 10 60 20 1
0 20 30
.
.
.
.
.
.
.
.
.
.
.
.
.
.
..
.1
0 4
AFGW
next hour
b. Complete the state matrix, S1, below to show the number of visitors expected at each location at 11 am on Saturday. 1 mark
S1 =
A
F
G300
W

19 2019FURMATHEXAM2
do
no
t w
rit
e i
n t
his
ar
ea
do
no
t w
rit
e i
n t
his
ar
ea
SECTION B – Module 1 – continuedTURN OVER
c. Ofthe300visitorsexpectedatGroundWorld(G)at11am,whatpercentagewasateither AirWorld(A)orFoodWorld(F)at10am? 1mark
d. TheproportionofvisitorsmovingfromonelocationtoanothereachhouronSundayisdifferentfromSaturday.
MatrixV, below,showstheproportionofvisitorsmovingfromonelocationtoanothereachhourafter10amonSunday.
this hourA F G W
V =
0 30 10 10 5
0 40 20 20 2
0 60 10 20 1
0 30 20
.
.
.
.
.
.
.
.
.
.
.
.
.
.
..
.1
0 4
AFGW
next hour
MatrixVissimilartomatrixT buthasthefirsttworowsofmatrixTinterchanged. ThematrixproductthatwillgeneratematrixV from matrixT is
V=M × T
wherematrixMisabinarymatrix.
WritedownmatrixM. 1mark
M =

2019 FURMATH EXAM 2 20
do
no
t w
rit
e i
n t
his
ar
ea
do
no
t w
rit
e i
n t
his
ar
ea
End of Module 1 – SECTION B – continued
Question 3 (3 marks)On Sunday, matrix V is used when calculating the expected number of visitors at each location every hour after 10 am. It is assumed that the park will be at its capacity of 2000 visitors for all of Sunday.Let L0 be the state matrix that shows the number of visitors at each location at 10 am on Sunday.The number of visitors expected at each location at 11 am on Sunday can be determined by the matrix product
V × L0 where L
AFGW
0
500600500400
=
and
this hourA F G W
V =
0 30 10 10 5
0 40 20 20 2
0 60 10 20 1
0 30 20
.
.
.
.
.
.
.
.
.
.
.
.
.
.
..
.1
0 4
AFGW
next hour
a. Safety restrictions require that all four locations have a maximum of 600 visitors.
Which location is expected to have more than 600 visitors at 11 am on Sunday? 1 mark
b. Whenever more than 600 visitors are expected to be at a location on Sunday, the first 600 visitors can stay at that location and all others will be moved directly to Ground World (G).
State matrix Rn contains the number of visitors at each location n hours after 10 am on Sunday, after the safety restrictions have been enforced.
Matrix R1 can be determined from the matrix recurrence relation
R
AFGW
0
500600500400
=
, R1 = V × R0 + B1
where matrix B1 shows the required movement of visitors at 11 am.
i. Determine the matrix B1. 1 mark
B1 =
ii. State matrix R2 can be determined from the new matrix rule
R2 = VR1 + B2
where matrix B2 shows the required movement of visitors at 12 noon.
Determine the state matrix R2. 1 mark
R2 =
21 2019FURMATHEXAM2
do
no
t w
rit
e i
n t
his
ar
ea
do
no
t w
rit
e i
n t
his
ar
ea
SECTION B – Module 2 – continuedTURN OVER
Module 2 – Networks and decision mathematics
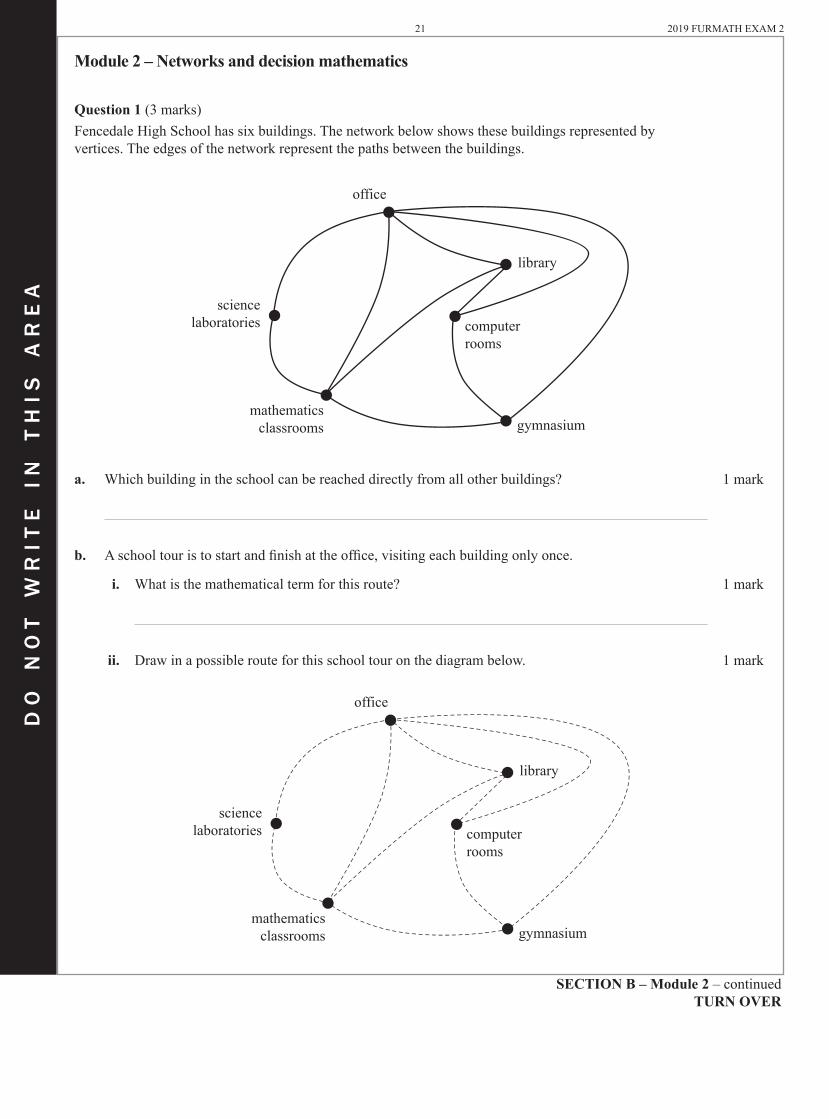
Question 1 (3marks)FencedaleHighSchoolhassixbuildings.Thenetworkbelowshowsthesebuildingsrepresentedbyvertices.Theedgesofthenetworkrepresentthepathsbetweenthebuildings.
office
library
computerrooms
sciencelaboratories
mathematicsclassrooms gymnasium
a. Whichbuildingintheschoolcanbereacheddirectlyfromallotherbuildings? 1mark
b. Aschooltouristostartandfinishattheoffice,visitingeachbuildingonlyonce.
i. Whatisthemathematicaltermforthisroute? 1mark
ii. Drawinapossiblerouteforthisschooltouronthediagrambelow. 1mark
office
library
computerrooms
sciencelaboratories
mathematicsclassrooms gymnasium
2019 FURMATH EXAM 2 22
do
no
t w
rit
e i
n t
his
ar
ea
do
no
t w
rit
e i
n t
his
ar
ea
SECTION B – Module 2 – Question 2 – continued
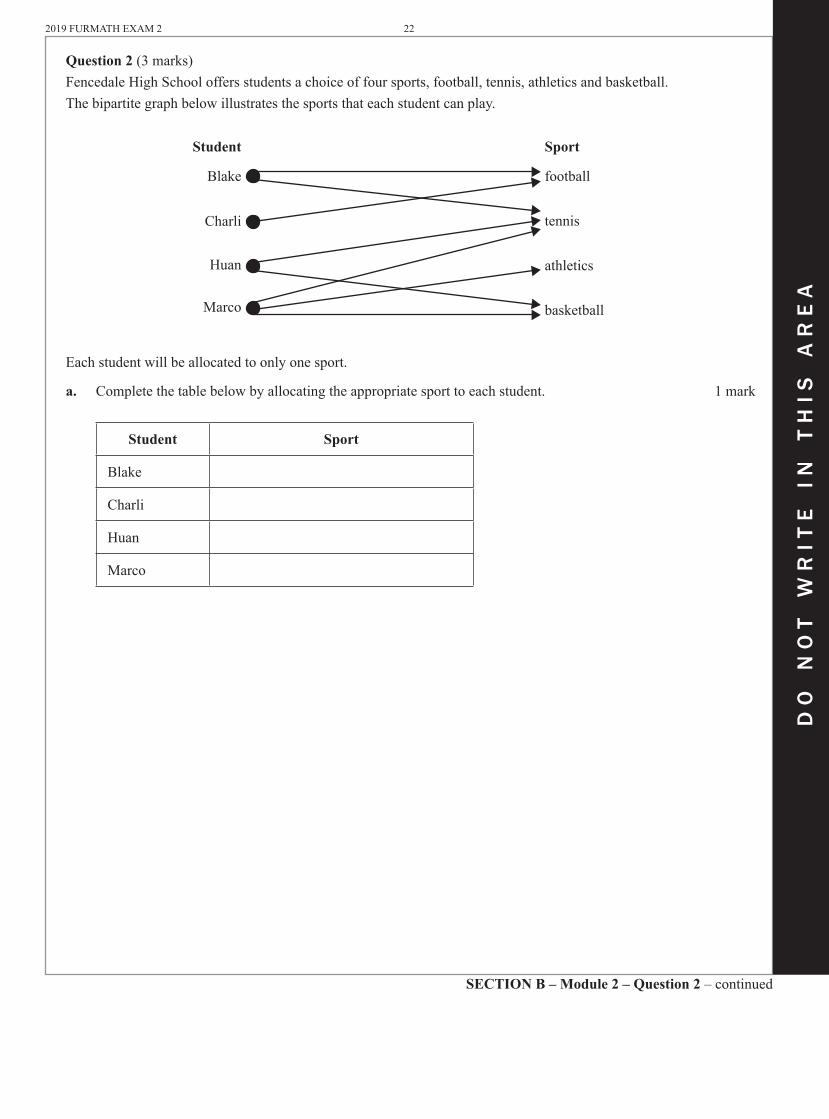
Question 2 (3 marks)Fencedale High School offers students a choice of four sports, football, tennis, athletics and basketball.The bipartite graph below illustrates the sports that each student can play.
Blake
Charli
Huan
Marco
football
tennis
athletics
basketball
Student Sport
Each student will be allocated to only one sport.
a. Complete the table below by allocating the appropriate sport to each student. 1 mark
Student Sport
Blake
Charli
Huan
Marco

23 2019FURMATHEXAM2
do
no
t w
rit
e i
n t
his
ar
ea
do
no
t w
rit
e i
n t
his
ar
ea
SECTION B – Module 2 – continuedTURN OVER
b. Theschoolmedleyrelayteamconsistsoffourstudents,Anita,Imani,JordanandLola. Themedleyrelayraceisacombinationoffourdifferentsprintingdistances:100m,200m,300mand
400m,runinthatorder. Thefollowingtableshowsthebesttime,inseconds,foreachstudentforeachsprintingdistance.
Best time for each sprinting distance (seconds)
Student 100 m 200 m 300 m 400 m
Anita 13.3 29.6 61.8 87.1
Imani 14.5 29.6 63.5 88.9
Jordan 13.3 29.3 63.6 89.1
Lola 15.2 29.2 61.6 87.9
Theschoolwillallocateeachstudenttoonesprintingdistanceinordertominimisethetotaltimetakentocompletetherace.
Towhichdistanceshouldeachstudentbeallocated? Writeyouranswersinthetablebelow. 2marks
Student Sprinting distance (m)
Anita
Imani
Jordan
Lola
2019FURMATHEXAM2 24
do
no
t w
rit
e i
n t
his
ar
ea
do
no
t w
rit
e i
n t
his
ar
ea
SECTION B – Module 2 – Question 3 – continued
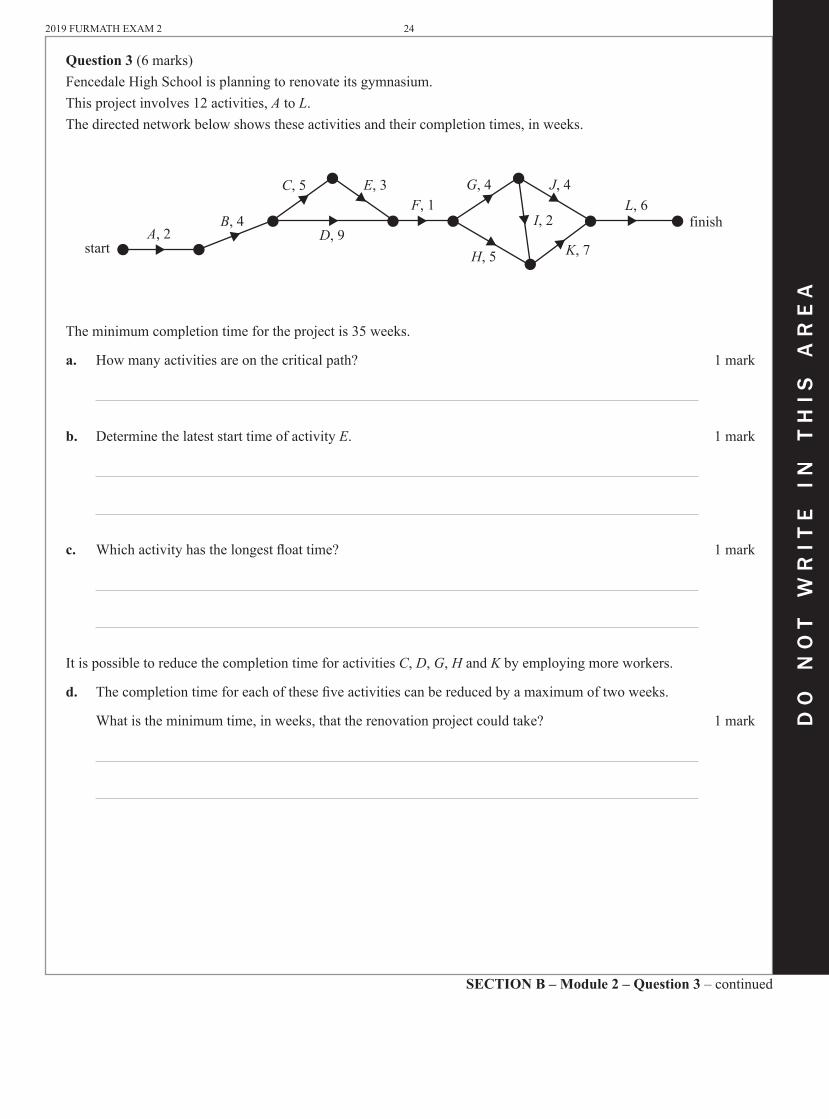
Question 3 (6marks)FencedaleHighSchoolisplanningtorenovateitsgymnasium.Thisprojectinvolves12activities,A to L.Thedirectednetworkbelowshowstheseactivitiesandtheircompletiontimes,inweeks.
start
finishA, 2
B, 4
C, 5 E, 3F, 1
G, 4 J, 4L, 6
I, 2D, 9
H, 5 K, 7
Theminimumcompletiontimefortheprojectis35weeks.
a. Howmanyactivitiesareonthecriticalpath? 1mark
b. DeterminethelateststarttimeofactivityE. 1mark
c. Whichactivityhasthelongestfloattime? 1mark
ItispossibletoreducethecompletiontimeforactivitiesC,D,G,H and K byemployingmoreworkers.
d. Thecompletiontimeforeachofthesefiveactivitiescanbereducedbyamaximumoftwoweeks.
Whatistheminimumtime,inweeks,thattherenovationprojectcouldtake? 1mark
25 2019 FURMATH EXAM 2
do
no
t w
rit
e i
n t
his
ar
ea
do
no
t w
rit
e i
n t
his
ar
ea
End of Module 2 – SECTION B – continuedTURN OVER
e. The reduction in completion time for each of these five activities will incur an additional cost to the school.
The table below shows the five activities that can have their completion times reduced and the associated weekly cost, in dollars.
Activity Weekly cost ($)
C 3000
D 2000
G 2500
H 1000
K 4000
The completion time for each of these five activities can be reduced by a maximum of two weeks. Fencedale High School requires the overall completion time for the renovation project to be reduced
by four weeks at minimum cost.
Complete the table below, showing the reductions in individual activity completion times that would achieve this. 2 marks
Activity Reduction in completion time (0, 1 or 2 weeks)
C
D
G
H
K
2019 FURMATH EXAM 2 26
do
no
t w
rit
e i
n t
his
ar
ea
do
no
t w
rit
e i
n t
his
ar
ea
SECTION B – Module 3 – Question 1 – continued
Module 3 – Geometry and measurement
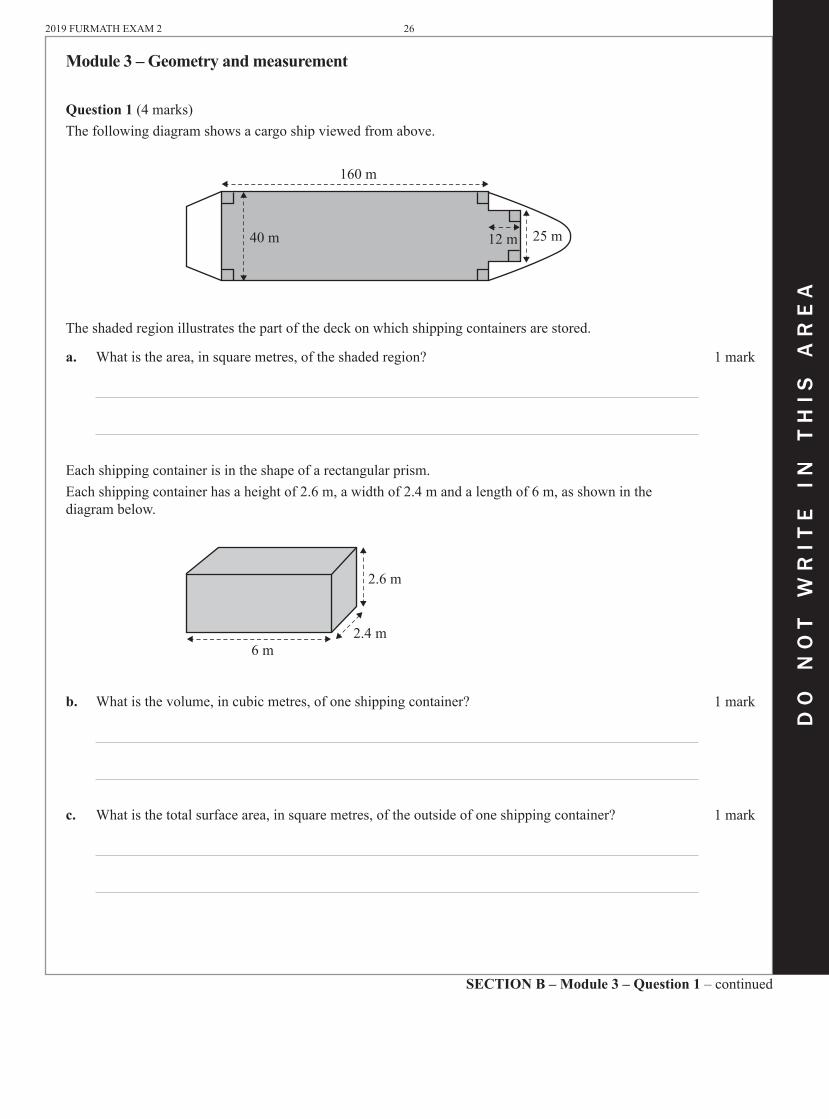
Question 1 (4 marks)The following diagram shows a cargo ship viewed from above.
12 m 25 m
160 m
40 m
The shaded region illustrates the part of the deck on which shipping containers are stored.
a. What is the area, in square metres, of the shaded region? 1 mark
Each shipping container is in the shape of a rectangular prism. Each shipping container has a height of 2.6 m, a width of 2.4 m and a length of 6 m, as shown in the diagram below.
2.6 m
2.4 m6 m
b. What is the volume, in cubic metres, of one shipping container? 1 mark
c. What is the total surface area, in square metres, of the outside of one shipping container? 1 mark

27 2019FURMATHEXAM2
do
no
t w
rit
e i
n t
his
ar
ea
do
no
t w
rit
e i
n t
his
ar
ea
SECTION B – Module 3 – continuedTURN OVER
d. Oneshippingcontainerisusedtocarrybarrels.Eachbarrelisintheshapeofacylinder. Eachbarrelis1.25mhighandhasadiameterof0.73m,asshowninthediagrambelow. Eachbarrelmustremainuprightintheshippingcontainer.
1.25 m
0.73 m
Whatisthemaximumnumberofbarrelsthatcanfitinoneshippingcontainer? 1mark

2019FURMATHEXAM2 28
do
no
t w
rit
e i
n t
his
ar
ea
do
no
t w
rit
e i
n t
his
ar
ea
SECTION B – Module 3 – continued
Question 2 (3marks)AcargoshiptravelsfromMagadan(60°N,151°E)toSydney(34°S,151°E).
a. Explain,withreferencetotheinformationprovided,howweknowthatSydneyisclosertotheequatorthanMagadan. 1mark
b. AssumethattheradiusofEarthis6400km.
FindtheshortestgreatcircledistancebetweenMagadanandSydney. Roundyouranswertothenearestkilometre. 1mark
c. ThecargoshipleftSydney(34°S,151°E)at6amon1JuneandarrivedinPerth(32°S,116°E)at 10amon11June.
Thereisatwo-hourtimedifferencebetweenSydneyandPerthatthattimeofyear.
HowmanyhoursdidittakethecargoshiptotravelfromSydneytoPerth? 1mark
29 2019FURMATHEXAM2
do
no
t w
rit
e i
n t
his
ar
ea
do
no
t w
rit
e i
n t
his
ar
ea
SECTION B – Module 3 – Question 3 – continuedTURN OVER
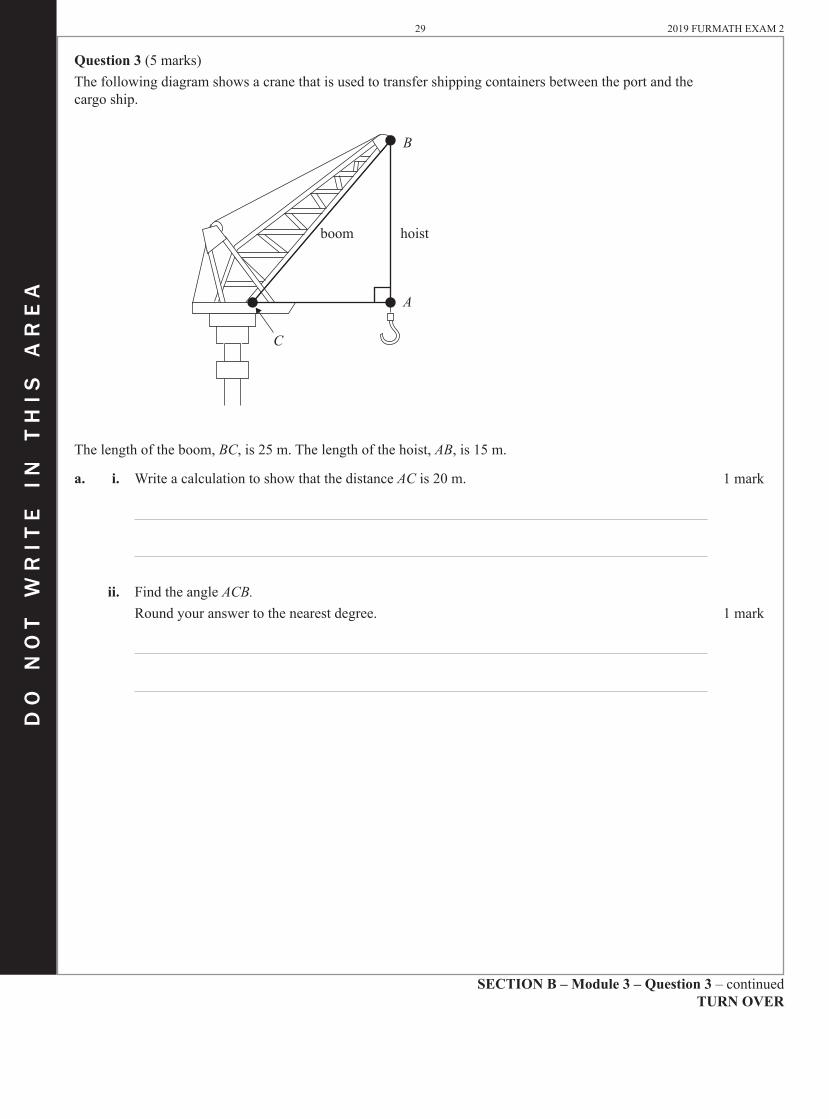
Question 3 (5marks)Thefollowingdiagramshowsacranethatisusedtotransfershippingcontainersbetweentheportandthecargoship.
boom hoist
B
A
C
Thelengthoftheboom,BC, is25m.Thelengthofthehoist,AB,is15m.
a. i. WriteacalculationtoshowthatthedistanceACis20m. 1mark
ii. FindtheangleACB. Roundyouranswertothenearestdegree. 1mark
2019FURMATHEXAM2 30
do
no
t w
rit
e i
n t
his
ar
ea
do
no
t w
rit
e i
n t
his
ar
ea
SECTION B – Module 3 – Question 3 – continued
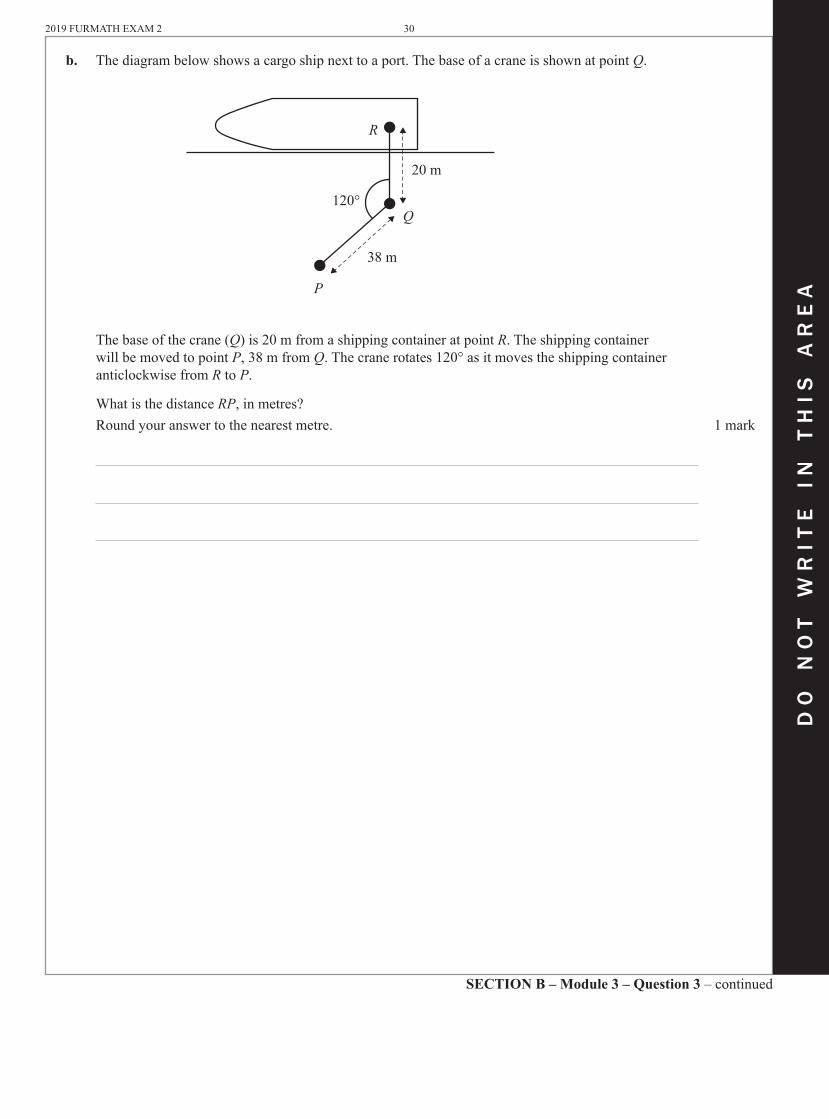
b. Thediagrambelowshowsacargoshipnexttoaport.ThebaseofacraneisshownatpointQ.
120°Q
R
P
20 m
38 m
Thebaseofthecrane(Q)is20mfromashippingcontaineratpointR.TheshippingcontainerwillbemovedtopointP,38mfromQ.Thecranerotates120°asitmovestheshippingcontaineranticlockwisefromR to P.
WhatisthedistanceRP,inmetres? Roundyouranswertothenearestmetre. 1mark
31 2019FURMATHEXAM2
do
no
t w
rit
e i
n t
his
ar
ea
do
no
t w
rit
e i
n t
his
ar
ea
End of Module 3 – SECTION B – continuedTURN OVER
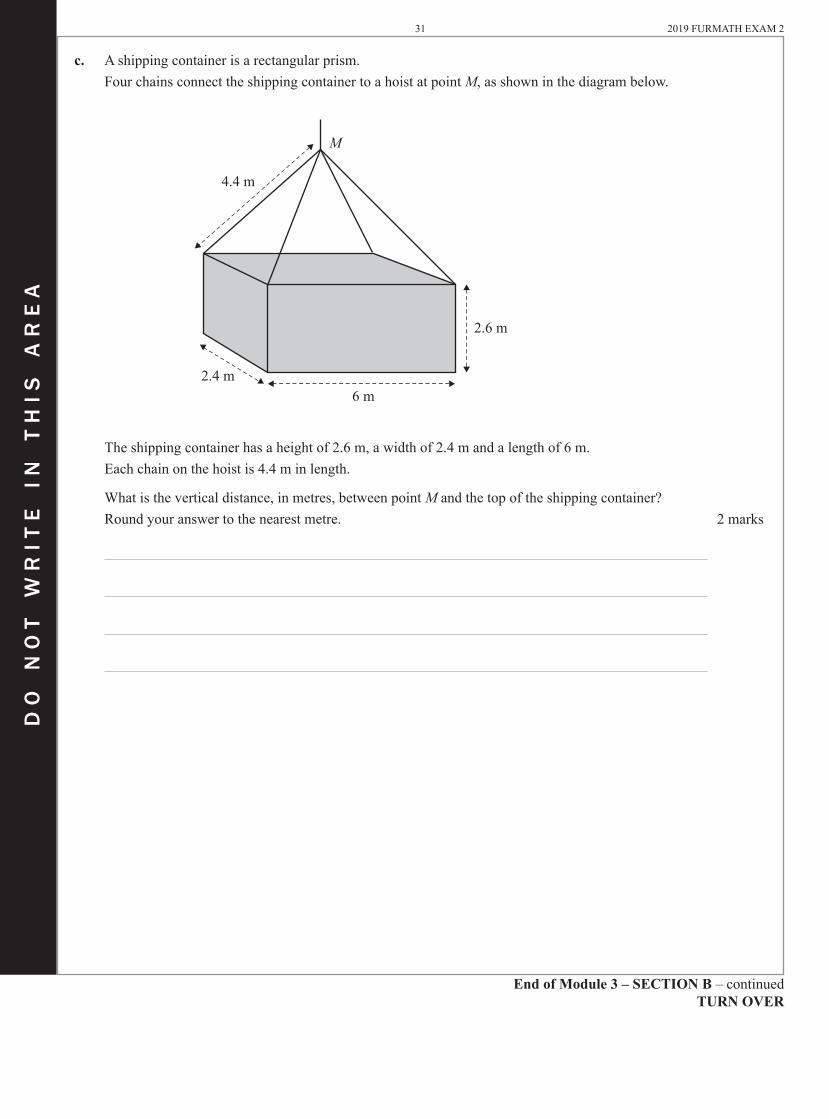
c. Ashippingcontainerisarectangularprism. FourchainsconnecttheshippingcontainertoahoistatpointM,asshowninthediagrambelow.
2.6 m
6 m2.4 m
M
4.4 m
Theshippingcontainerhasaheightof2.6m,awidthof2.4mandalengthof6m. Eachchainonthehoistis4.4minlength.
Whatistheverticaldistance,inmetres,betweenpointMandthetopoftheshippingcontainer? Roundyouranswertothenearestmetre. 2marks

2019FURMATHEXAM2 32
do
no
t w
rit
e i
n t
his
ar
ea
do
no
t w
rit
e i
n t
his
ar
ea
THIS PAGE IS BLANK
SECTION B – continued

33 2019FURMATHEXAM2
do
no
t w
rit
e i
n t
his
ar
ea
do
no
t w
rit
e i
n t
his
ar
ea
SECTION B – Module 4 – continuedTURN OVER
Module 4 – Graphs and relations
Question 1 (3marks)Thegraphbelowshowsthemembership numbers oftheWombatongRuralWomen’sAssociationeachyearfortheyears2008–2018.
membership numbers
year
70
60
50
40
30
20
10
02008 2009 2010 2011 2012 2013 2014 2015 2016 2017 2018
a. Howmanymembersweretherein2009? 1mark
b. i. Showthattheaveragerateofchangeofmembership numbersfrom2013to2018was –6membersperyear. 1mark
ii. Ifthechangeinmembership numberscontinuesatthisrate,howmanymemberswilltherebein2021? 1mark
2019FURMATHEXAM2 34
do
no
t w
rit
e i
n t
his
ar
ea
do
no
t w
rit
e i
n t
his
ar
ea
SECTION B – Module 4 – Question 2 – continued
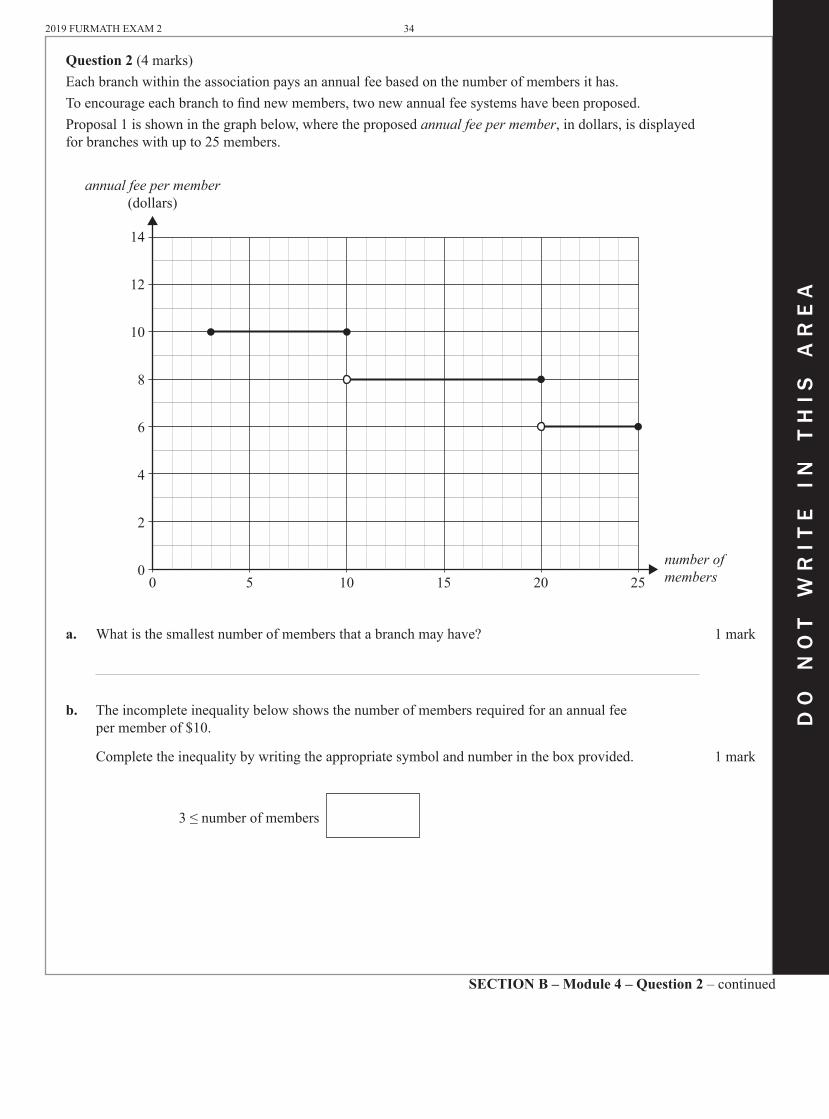
Question 2 (4marks)Eachbranchwithintheassociationpaysanannualfeebasedonthenumberofmembersithas.Toencourageeachbranchtofindnewmembers,twonewannualfeesystemshavebeenproposed.Proposal1isshowninthegraphbelow,wheretheproposedannual fee per member,indollars,isdisplayedforbrancheswithupto25members.
14
12
10
8
6
4
2
00 5 10 15 20 25
annual fee per member(dollars)
number of members
a. Whatisthesmallestnumberofmembersthatabranchmayhave? 1mark
b. Theincompleteinequalitybelowshowsthenumberofmembersrequiredforanannualfee permemberof$10.
Completetheinequalitybywritingtheappropriatesymbolandnumberintheboxprovided. 1mark
3≤numberofmembers

35 2019 FURMATH EXAM 2
do
no
t w
rit
e i
n t
his
ar
ea
do
no
t w
rit
e i
n t
his
ar
ea
SECTION B – Module 4 – continuedTURN OVER
Proposal 2 is modelled by the following equation.
annual fee per member = –0.25 × number of members + 12.25
c. Sketch this equation on the graph for Proposal 1, shown below. 1 mark
14
12
10
8
6
4
2
00 5 10 15 20 25
annual fee per member(dollars)
number of members
d. Proposal 1 and Proposal 2 have the same annual fee per member for some values of the number of members.
Write down all values of the number of members for which this is the case. 1 mark

2019 FURMATH EXAM 2 36
do
no
t w
rit
e i
n t
his
ar
ea
do
no
t w
rit
e i
n t
his
ar
ea
SECTION B – Module 4 – Question 3 – continued
Question 3 (5 marks)Members of the association will travel to a conference in cars and minibuses:• Let x be the number of cars used for travel.• Let y be the number of minibuses used for travel.• A maximum of eight cars and minibuses in total can be used.• At least three cars must be used.• At least two minibuses must be used.
The constraints above can be represented by the following three inequalities.
Inequality 1 x + y ≤ 8Inequality 2 x ≥ 3Inequality 3 y ≥ 2
a. Each car can carry a total of five people and each minibus can carry a total of 10 people. A maximum of 60 people can attend the conference.
Use this information to write Inequality 4. 1 mark
The graph below shows the four lines representing Inequalities 1 to 4.Also shown on this graph are four of the integer points that satisfy Inequalities 1 to 4. Each of these integer points is marked with a cross ( ).
10
9
8
7
6
5
4
3
2
1
00 1 2 3 4 5 6 7 8 9 10
y
x
b. On the graph above, mark clearly, with a circle (○), the remaining integer points that satisfy Inequalities 1 to 4. 1 mark
(Answer on the graph above.)

37 2019FURMATHEXAM2
do
no
t w
rit
e i
n t
his
ar
ea
do
no
t w
rit
e i
n t
his
ar
ea
Eachcarwillcost$70tohireandeachminibuswillcost$100tohire.
c. Whatisthecostfor60memberstotraveltotheconference? 1mark
d. Whatistheminimumcostfor55memberstotraveltotheconference? 1mark
e. Justbeforethecarswerebooked,thecostofhiringeachcarincreased. Thecostofhiringeachminibusremained$100. Alloriginalconstraintsapply. Iftheincreaseinthecostofhiringeachcarismore than kdollars,thenthemaximumcostof
transportingmemberstothisconferencecanonlyoccurwhenusingsixcarsandtwominibuses.
Determinethevalueofk. 1mark
END OF QUESTION AND ANSWER BOOK

FURTHER MATHEMATICS
Written examination 2
FORMULA SHEET
Instructions
This formula sheet is provided for your reference.A question and answer book is provided with this formula sheet.
Students are NOT permitted to bring mobile phones and/or any other unauthorised electronic devices into the examination room.
© VICTORIAN CURRICULUM AND ASSESSMENT AUTHORITY 2019
Victorian Certificate of Education 2019
FURMATH EXAM 2
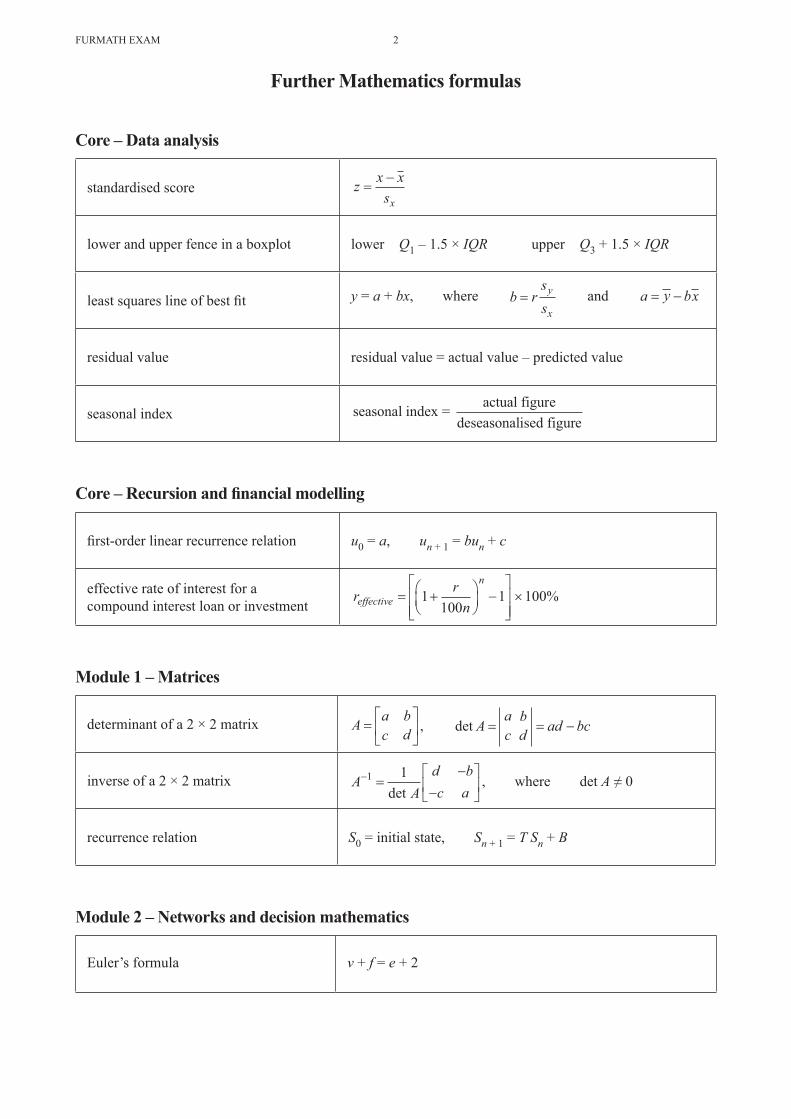
Further Mathematics formulas
Core – Data analysis
standardised score z x xsx
=−
lower and upper fence in a boxplot lower Q1 – 1.5 × IQR upper Q3 + 1.5 × IQR
least squares line of best fit y = a + bx, where b rss
y
x= and a y bx= −
residual value residual value = actual value – predicted value
seasonal index seasonal index = actual figuredeseasonalised figure
Core – Recursion and financial modelling
first-order linear recurrence relation u0 = a, un + 1 = bun + c
effective rate of interest for a compound interest loan or investment
r rneffective
n= +
−
×1
1001 100%
Module 1 – Matrices
determinant of a 2 × 2 matrix A a bc d=
, det A
ac
bd ad bc= = −
inverse of a 2 × 2 matrix AA
d bc a
− =−
−
1 1det
, where det A ≠ 0
recurrence relation S0 = initial state, Sn + 1 = T Sn + B
Module 2 – Networks and decision mathematics
Euler’s formula v + f = e + 2
3 FURMATH EXAM
END OF FORMULA SHEET
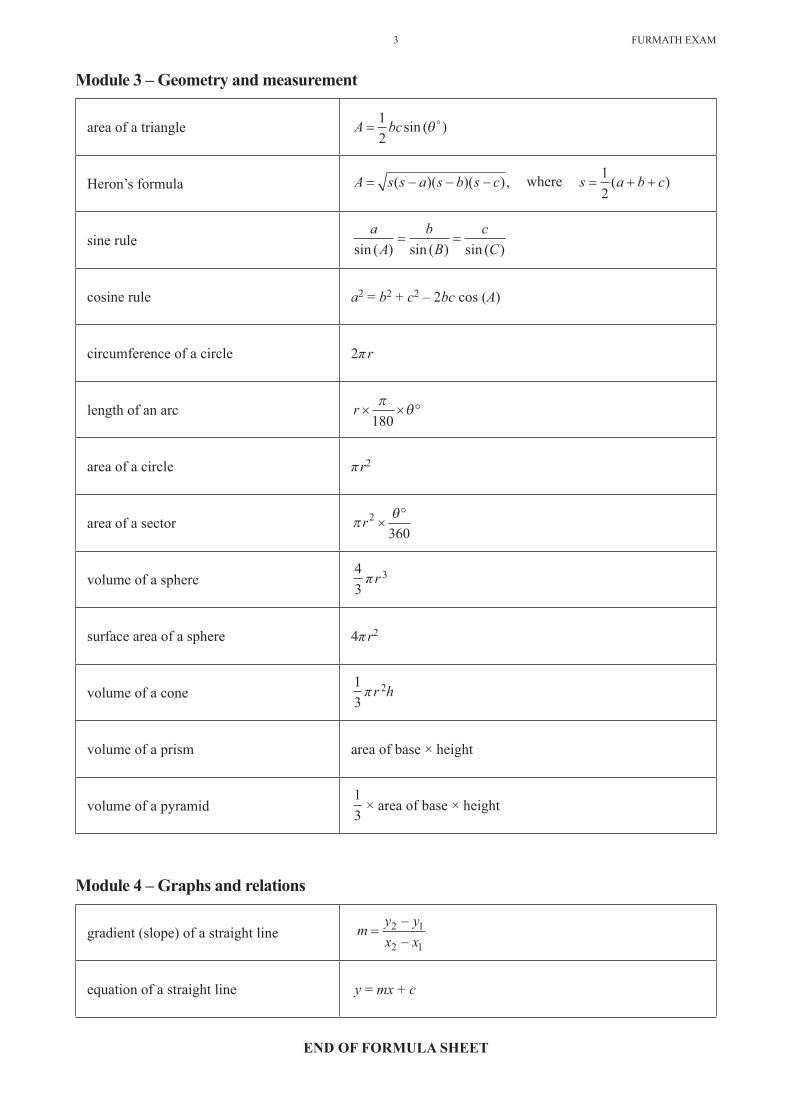
Module 3 – Geometry and measurement
area of a triangle A bc=12
sin ( )θ
Heron’s formula A s s a s b s c= − − −( )( )( ), where s a b c= + +12
( )
sine rulea
Ab
Bc
Csin ( ) sin ( ) sin ( )= =
cosine rule a2 = b2 + c2 – 2bc cos (A)
circumference of a circle 2π r
length of an arc r × × °π
θ180
area of a circle π r2
area of a sector πθr2
360×
°
volume of a sphere43π r 3
surface area of a sphere 4π r2
volume of a cone13π r 2h
volume of a prism area of base × height
volume of a pyramid13
× area of base × height
Module 4 – Graphs and relations
gradient (slope) of a straight line m y y
x x=
−−
2 1
2 1
equation of a straight line y = mx + c


![Court Interpreter Written Examination: Overview Interpreter Oral Examination: Test Administration Standards [1] Court Interpreter Written Examination: Overview ... (the specific form](https://img.pdfslide.net/doc/110x75/5b497a207f8b9aa82c8b6312/court-interpreter-written-examination-overview-interpreter-oral-examination-test.jpg)