Embed Size (px)
Citation preview

2019 Global Market Report
Cruise Lines International Association (CLIA), the world’s largest cruise industry trade organization, is releasing the latest global cruise passenger statistics. Playing a significant role in international tourism, cruising continues at a paced growth around the world with a 4% increase from 2018 to 2019, totaling 29.7 million passengers. Research also shows North American travelers continued to embrace cruising with an annual passenger increase of 8% (15.4 million passengers) in 2019. Europe experienced a healthy 7.4% increase as new ships were launched in two key markets. The average age of cruisers has been remarkably consistent at 46.8, while the average cruise length has also been stable, at around seven days. As expected, due to a reduction in deployment in Asia and Australia, the number of cruisers in these regions was lower than in previous years. The Caribbean, once again, benefited from the healthy gain in the U.S. market, and the volume of cruisers to the region grew by 6%. The growth in Alaska accelerated with a sharp 19% increase, the third year in a row with double-digit growth. The rebound in the Eastern Mediterranean has accelerated with a healthy 19%, following a 15% increase last year and following a few years of retraction before 2018.While the cruise industry experienced growth in 2019, the emergence of COVID-19 in 2020 led the cruise industry to take immediate and aggressive action to mitigate the risk of the virus—which culminated in a global pause in operations in mid-March. Following the pause in operations, with strict protocols in place, and with the approval and support of local and regional authorities, cruise lines were able to successfully resume limited operations in Europe and other parts of the world. The successes of these initial sailings demonstrate that the new protocols are working as designed, and CLIA and our cruise line members look forward to continue welcoming back passengers from around the world.

2016 2017 2018 2019
29,673 (4.1% ▲)28,515 (6.7% ▲)26,716 (6.2% ▲)25,155
Passenger Volume (K)
2016 2017 2018 2019
46.846.746.746.7
Average Age
2016 2017 2018 2019
7.17.07.17.2
Average Duration, in Days
2016 2017 2018 2019
North America
Western Europe
Asia
Australia/NZ/Pacific
South America
Eastern Europe
Scandinavia/Iceland
Africa
Middle East/Arabia
Caribbean
Central America 49 (5.7% ▲)
57 (1.0% ▲)
108 (-2.2% ▼)
169 (9.8% ▲)
218 (-3.0% ▼)
263 (23.3% ▲)
935 (5.9% ▲)
1,351 (-7.5% ▼)
3,738 (-11.8% ▼)
7,226 (7.4% ▲)
15,408 (8.2% ▲)
47 (-8.3% ▼)
56 (3.1% ▲)
111 (6.6% ▲)
154 (1.9% ▲)
225 (-1.8% ▼)
213 (10.9% ▲)
883 (10.5% ▲)
1,460 (1.8% ▲)
4,240 (4.6% ▲)
6,731 (3.3% ▲)
14,240 (9.4% ▲)
51 (30.3% ▲)
54 (8.7% ▲)
104 (-7.7% ▼)
151 (4.8% ▲)
229 (-4.8% ▼)
192 (-6.0% ▼)
799 (1.0% ▲)
1,434 (4.7% ▲)
4,052 (20.3% ▲)
6,516 (2.7% ▲)
13,019 (5.0% ▲)
39
50
112
144
241
205
791
1,370
3,370
6,344
12,403
Passenger Volume (K) by Source Passenger Regions
2019
2018
2017
2016
14%
14%
13%
13%
19%
19%
19%
19%
18%
18%
18%
18%
14%
15%
15%
15%
11%
11%
11%
11%
9%
9%
9%
9%
6%
6%
6%
6%
9%
9%
9%
8%
Average Passenger Age Groups
<=12 Years 13-19 20-29 30-39 40-49 50-59 60-69 >=70 Years
2019
2018
2017
2016
15%
15%
15%
16%
41%
40%
39%
40%
26%
27%
28%
25%
11%
11%
11%
11%
3%
2%
2%
2%
4%
4%
4%
4%
Average Cruise Duration
Up to 3 Days 4-6 Days 7 Days 8-13 Days 14 Days 15-20 Days 21 Days Plus
Global Report: 2016 to 2019

Global Report (Continued)
2016 2017 2018 2019
United States
Germany
UK & Ireland
Mainland China
Australia
Canada
Italy
Brazil
Spain
France
Taiwan Region
Singapore
India
Japan
Hong Kong
Mexico
South Africa
Argentina
Switzerland
Austria
Netherlands
Malaysia
New Zealand
Norway 98 (-3.0% ▼)
106 (-5.1% ▼)
121 (-19.6% ▼)
123 (8.7% ▲)
136 (0.1% ▲)
140 (-9.2% ▼)
151 (-19.2% ▼)
158 (10.2% ▲)
167 (-3.6% ▼)
191 (-23.4% ▼)
296 (11.4% ▲)
313 (41.5% ▲)
325 (-12.7% ▼)
389 (-0.4% ▼)
545 (4.6% ▲)
553 (4.3% ▲)
567 (11.3% ▲)
950 (14.3% ▲)
1,037 (6.8% ▲)
1,241 (-7.7% ▼)
1,919 (-18.6% ▼)
1,992 (-0.9% ▼)
2,587 (15.8% ▲)
14,199 (8.5% ▲)
101 (-2.7% ▼)
112 (14.7% ▲)
150 (-19.9% ▼)
113 (2.2% ▲)
136 (4.8% ▲)
154 (1.5% ▲)
187 (4.9% ▲)
143 (2.1% ▲)
174 (16.6% ▲)
250 (8.6% ▲)
266 (4.5% ▲)
221 (28.1% ▲)
373 (39.9% ▲)
391 (4.7% ▲)
521 (3.4% ▲)
530 (3.9% ▲)
510 (14.6% ▲)
831 (8.0% ▲)
971 (5.4% ▲)
1,345 (0.9% ▲)
2,357 (-1.6% ▼)
2,009 (2.0% ▲)
2,233 (3.0% ▲)
13,091 (9.6% ▲)
104 (-6.8% ▼)
98 (13.5% ▲)
188 (87.8% ▲)
110 (5.9% ▲)
130 (3.5% ▲)
152 (3.2% ▲)
178 (9.1% ▲)
140 (6.7% ▲)
149 (4.8% ▲)
230 (80.6% ▲)
255 (22.9% ▲)
172 (16.1% ▲)
267 (24.4% ▲)
374 (24.8% ▲)
504 (-9.1% ▼)
510 (6.4% ▲)
445 (-4.2% ▼)
769 (2.5% ▲)
921 (6.5% ▲)
1,333 (4.1% ▲)
2,397 (13.4% ▲)
1,971 (0.5% ▲)
2,169 (7.5% ▲)
11,944 (4.9% ▲)
111
86
100
104
125
147
163
132
142
127
207
148
214
299
554
480
465
751
865
1,281
2,113
1,960
2,018
11,392
Passenger Volume (K) for Top Countries
Caribbean/Bahamas/Bermuda
Asia & China
Central & Western Med.
Northern Europe
Australia/New Zealand/Pacific
NA West Coast/Mexico/California/Pacific Coast
Eastern Med.
Alaska
Panama Canal/South Am
Baltics
Canary Isl.
Africa/Middle East
Other
Transatlantic & World Cruise
Canada/New England
Hawaii
Exploration Dest.
11,982.6
3,977.4
3,211.0
1,707.8
1,177.7
1,164.9
1,226.0
1,215.4
807.1
593.6
496.5
515.4
303.7
392.8
301.7
243.1
186.9
Volume of Passengers (in K) to Destinations, 2019At least 4K Passengers per Destination

Caribbean/Bahamas/Bermuda
Asia & China
Central & Western Med.
Northern Europe
Australia/New Zealand/Pacific
NA West Coast/Mexico/California/Pa..
Eastern Med.
Alaska
Panama Canal/South Am
Baltics
Canary Isl.
Africa/Middle East
Other
Transatlantic & World Cruise
Canada/New England
Hawaii
Exploration Dest.
10,536, 24%
3,475, 22%
2,234, 18%
1,318, 21%
1,126, 25%
1,088, 28%
963, 20%
833, 20%
803, 2%
Passenger Volume (K) by Trade & Source Regions in 2019
Global Report (Continued)
2016 2017 2018 2019
Caribbean/Bahamas/Bermuda
Asia & China
Central & Western Med.
Northern Europe
Eastern Med.
Alaska
Australia/New Zealand/Pacific
NA West Coast/Mexico/California/Pacific Coast
Panama Canal/South Am
Baltics
Africa/Middle East
Canary Isl.
Transatlantic & World Cruise
Other
Canada/New England
Hawaii
Exploration Dest.
No Trade Identified 170 (50% ▲)
187 (26% ▲)
243 (11% ▲)
302 (39% ▲)
304 (-38% ▼)
393 (8% ▲)
496 (12% ▲)
515 (39% ▲)
594 (10% ▲)
807 (8% ▲)
1,165 (3% ▲)
1,178 (-9% ▼)
1,215 (19% ▲)
1,226 (19% ▲)
1,708 (-1% ▼)
3,211 (5% ▲)
3,977 (-7% ▼)
11,983 (6% ▲)
113 (-48% ▼)
148 (30% ▲)
218 (1% ▲)
218 (6% ▲)
490 (54% ▲)
365 (26% ▲)
444 (10% ▲)
370 (-3% ▼)
539 (-4% ▼)
745 (10% ▲)
1,126 (3% ▲)
1,299 (3% ▲)
1,025 (13% ▲)
1,027 (15% ▲)
1,731 (10% ▲)
3,068 (6% ▲)
4,254 (6% ▲)
11,335 (6% ▲)
220 (-25% ▼)
114 (39% ▲)
215 (14% ▲)
205 (23% ▲)
318 (46% ▲)
288 (10% ▲)
403 (9% ▲)
383 (-2% ▼)
564 (18% ▲)
678 (3% ▲)
1,089 (-10% ▼)
1,262 (7% ▲)
905 (16% ▲)
896 (-12% ▼)
1,569 (11% ▲)
2,907 (0% ▲)
4,005 (18% ▲)
10,695 (6% ▲)
292
82
190
167
218
261
371
390
480
657
1,209
1,180
779
1,020
1,419
2,920
3,386
10,135
Passenger Volume by Trade (K)
2019
Q1
Q2
Q3
Q4
3,584, 15%
3,956, 15%
3,998, 14%
3,771, 14%
1,077, 4%
1,171, 5%
1,783, 7%
2,173, 7%
1,589, 6%
464, 2%419, 2%
387, 1%
645, 3%
943, 4%
794, 3%
Passenger Volume (K) by Quarter & 10 Source Regions in 2019
Central America
Caribbean
Middle East/Arabia
Africa
Eastern Europe
Scandinavia/Iceland
South America
Australia/NZ/Pacific
Asia
Western Europe
North America
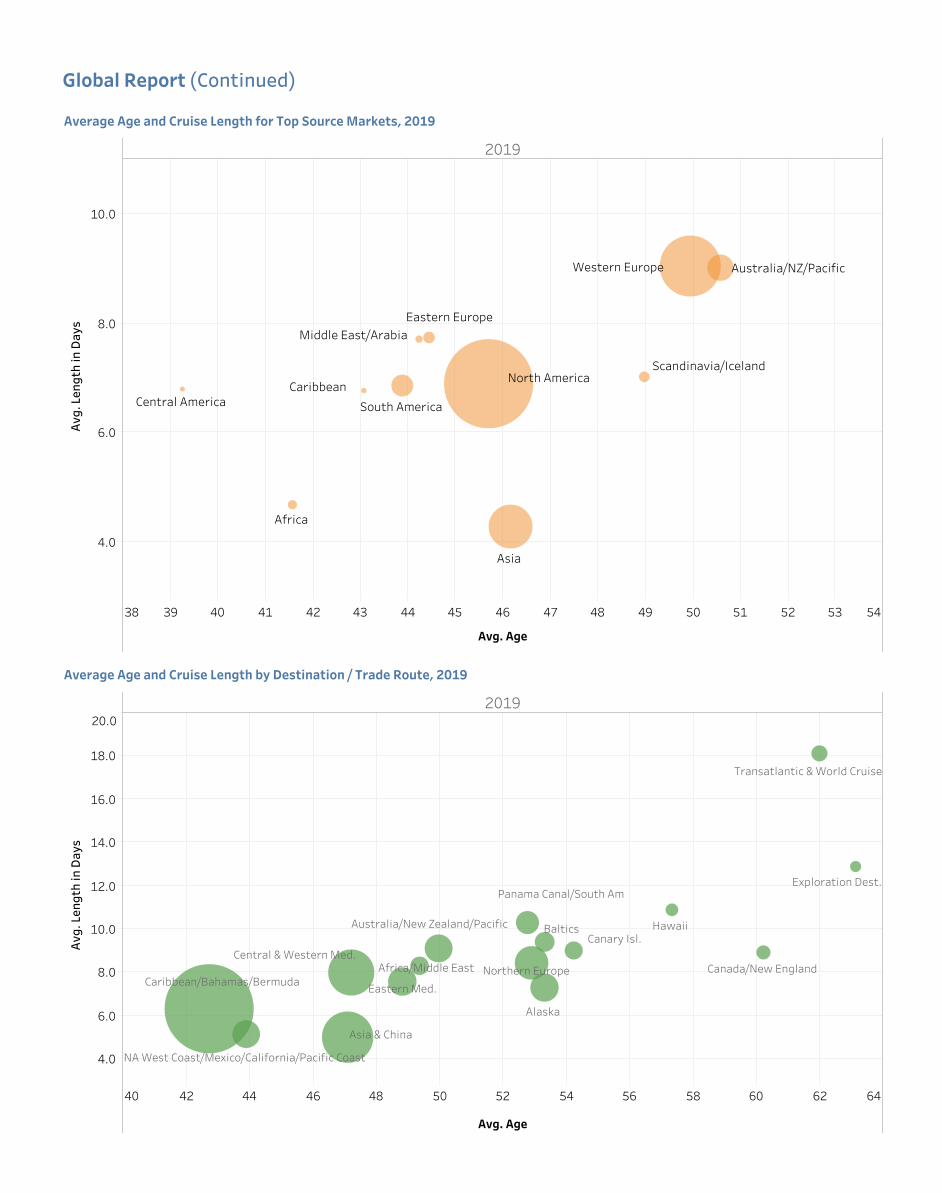
2019
38 39 40 41 42 43 44 45 46 47 48 49 50 51 52 53 54
Avg. Age
4.0
6.0
8.0
10.0
Avg. Length in Days
Western Europe
Scandinavia/IcelandNorth America
Middle East/ArabiaEastern Europe
Caribbean
Australia/NZ/Pacific
South AmericaCentral America
Asia
Africa
Average Age and Cruise Length for Top Source Markets, 2019
2019
40 42 44 46 48 50 52 54 56 58 60 62 64
Avg. Age
4.0
6.0
8.0
10.0
12.0
14.0
16.0
18.0
20.0
Avg. Length in Days
Panama Canal/South Am
Northern Europe
Eastern Med.
Central & Western Med.
Caribbean/Bahamas/Bermuda
Canary Isl.BalticsAustralia/New Zealand/Pacific
Asia & China
Africa/Middle East
Transatlantic & World Cruise
NA West Coast/Mexico/California/Pacific Coast
Hawaii
Exploration Dest.
Canada/New England
Alaska
Average Age and Cruise Length by Destination / Trade Route, 2019
Global Report (Continued)