Embed Size (px)
Citation preview
Michael Kavanagh, CEO and President McGregor Grant, Chief Financial Officer
2019
Half Year ResultsInvestor Presentation
For
per
sona
l use
onl
y
22019 Half Year Results
This presentation is intended to provide a general outline only and is not intended to be a definitive statement on the subject matter covered in it. The information in this presentation, whether written or verbal, has been prepared without taking into account the commercial, financial or other needs of any individual or organisation.
Certain information may relate to protected intellectual property rights owned by Nanosonics Limited (Nanosonics) and its subsidiaries (together the Group).
While due care has been taken in compiling the information based on the information available to Nanosonics at the date of this presentation material, neither Nanosonics nor its officers or advisors or any other person warrants the accuracy, reliability, completeness or timeliness of the information or guarantees the commercial or investment performance of the Group.
The information does not constitute advice of any kind and should not be relied on as such. Investors must make their own independent assessment of the Group and undertake such additional enquiries as they deem necessary or appropriate for their own investment purposes. Any and all use of the information is at your own risk.
No representation, warranty or assurance (express or implied) is given or made in relation to any forward looking statement or estimate by any person (including Nanosonics). In particular, no representation, warranty or assurance (express or implied) is given in relation to any underlying assumption or that any forward looking statement will be achieved. Actual future events may vary materially from the forward looking statements and the assumptions on which the forward looking statements are based.
Subject to any continuing obligations under applicable law or any relevant listing rules of the Australian Securities Exchange, Nanosonics disclaims any obligation or undertaking to disseminate any updates or revisions to any forward looking statements in these materials to reflect any change in expectations in relation to any forward looking statements or any change in events, conditions or circumstances on which any such statement is based. Nothing in these materials shall under any circumstances create an implication that there has been no change in the affairs of the Group since the date of these materials.
DISCLAIMERF
or p
erso
nal u
se o
nly
2019 Half Year Results 3
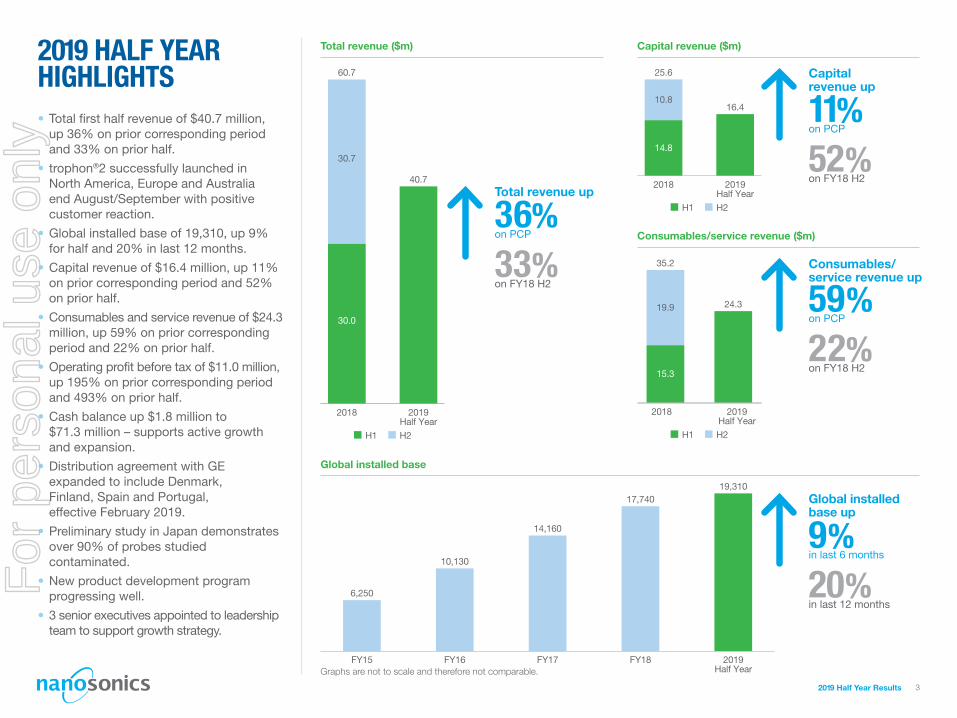
2019 HALF YEAR HIGHLIGHTS• Total first half revenue of $40.7 million,
up 36% on prior corresponding period and 33% on prior half.
• trophon®2 successfully launched in North America, Europe and Australia end August/September with positive customer reaction.
• Global installed base of 19,310, up 9% for half and 20% in last 12 months.
• Capital revenue of $16.4 million, up 11% on prior corresponding period and 52% on prior half.
• Consumables and service revenue of $24.3 million, up 59% on prior corresponding period and 22% on prior half.
• Operating profit before tax of $11.0 million, up 195% on prior corresponding period and 493% on prior half.
• Cash balance up $1.8 million to $71.3 million – supports active growth and expansion.
• Distribution agreement with GE expanded to include Denmark, Finland, Spain and Portugal, effective February 2019.
• Preliminary study in Japan demonstrates over 90% of probes studied contaminated.
• New product development program progressing well.
• 3 senior executives appointed to leadership team to support growth strategy.
Capital revenue ($m)
Capital revenue up
on PCP11%
on FY18 H252%
25.6
14.8
10.816.4
2018 2019Half Year
H1 H2
6,250
10,130
14,160
19,310
FY15 FY16 FY17 2019Half Year
FY18
17,740
Global installed base
Global installed base up
in last 6 months9%
in last 12 months20%
Total revenue ($m)
Total revenue up
on PCP36%
on FY18 H233%
30.0
30.7
60.7
40.7
2018 2019Half Year
H1 H2
Consumables/service revenue ($m)
Consumables/service revenue up
on PCP59%
on FY18 H222%
15.3
19.9
35.2
24.3
2018 2019Half Year
H1 H2
Graphs are not to scale and therefore not comparable.
For
per
sona
l use
onl
y
2019 Half Year Results 4
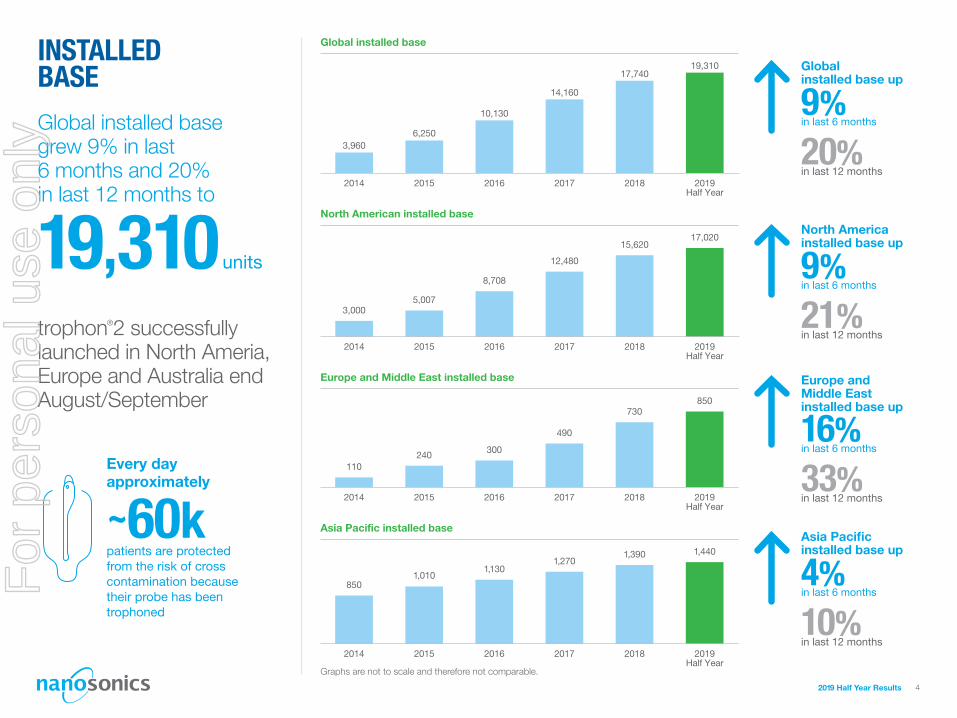
INSTALLED BASEGlobal installed base grew 9% in last 6 months and 20% in last 12 months to
trophon®2 successfully launched in North Ameria, Europe and Australia end August/September
units19,310
Every day approximately
patients are protected from the risk of cross contamination because their probe has been trophoned
~60k
Global installed base
3,960
2014 2015
6,250
2016
10,130
2017
14,160
2019Half Year
19,310
2018
17,740Global installed base up
in last 6 months9%
in last 12 months20%
North American installed base
3,000
2014 2015
5,007
2016
8,708
2017
12,480
2019Half Year
17,020
2018
15,620
North America installed base up
in last 6 months9%
in last 12 months21%
Europe and Middle East installed base
110
2014 2015
240
2016
300
2017
490
2019Half Year
850
2018
730
Europe and Middle East installed base up
in last 6 months16%
in last 12 months33%
Asia Pacific installed base
850
2014 2015
1,010
2016
1,130
2017
1,270
2019Half Year
1,440
2018
1,390
Asia Pacific installed base up
in last 6 months4%
in last 12 months10%
Graphs are not to scale and therefore not comparable.
For
per
sona
l use
onl
y
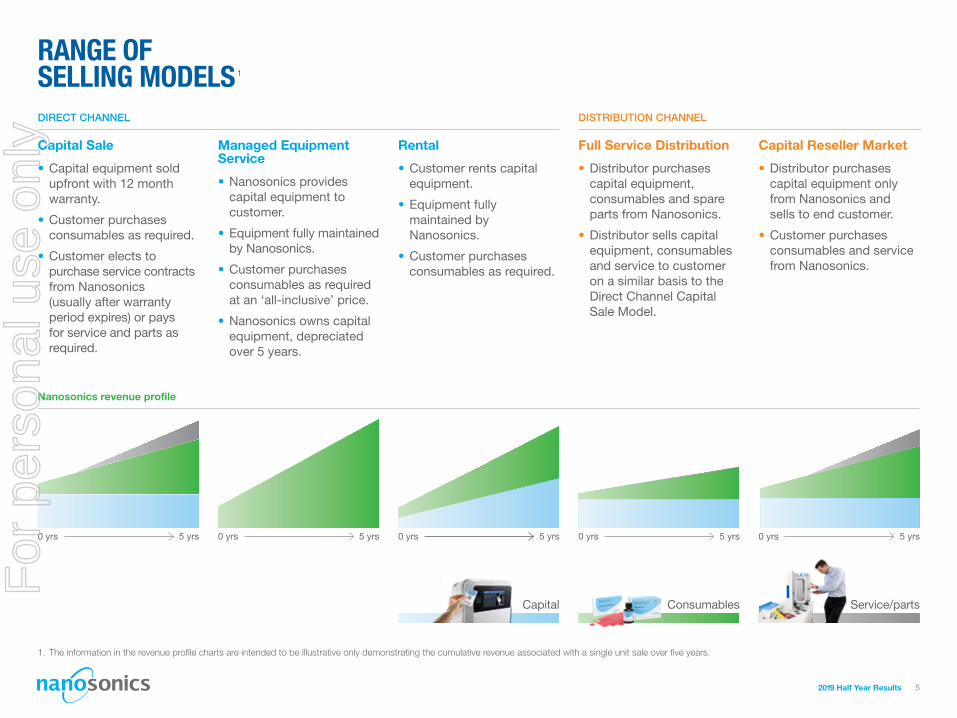
Capital Sale
• Capital equipment sold upfront with 12 month warranty.
• Customer purchases consumables as required.
• Customer elects to purchase service contracts from Nanosonics (usually after warranty period expires) or pays for service and parts as required.
Managed Equipment Service
• Nanosonics provides capital equipment to customer.
• Equipment fully maintained by Nanosonics.
• Customer purchases consumables as required at an ‘all-inclusive’ price.
• Nanosonics owns capital equipment, depreciated over 5 years.
Rental
• Customer rents capital equipment.
• Equipment fully maintained by Nanosonics.
• Customer purchases consumables as required.
Full Service Distribution
• Distributor purchases capital equipment, consumables and spare parts from Nanosonics.
• Distributor sells capital equipment, consumables and service to customer on a similar basis to the Direct Channel Capital Sale Model.
Capital Reseller Market
• Distributor purchases capital equipment only from Nanosonics and sells to end customer.
• Customer purchases consumables and service from Nanosonics.
RANGE OF SELLING MODELS 1
DIRECT CHANNEL DISTRIBUTION CHANNEL
Service/partsConsumablesCapital
Nanosonics revenue profile
1. The information in the revenue profile charts are intended to be illustrative only demonstrating the cumulative revenue associated with a single unit sale over five years.
0 yrs 5 yrs 0 yrs 5 yrs 0 yrs 5 yrs 0 yrs 5 yrs 0 yrs 5 yrs
2019 Half Year Results 5
For
per
sona
l use
onl
y
2019 Half Year Results 62019 Half Year Results
FY19
6
Financial Results Review
For
per
sona
l use
onl
y
2019 Half Year Results 7
on FY18 H252%
on FY18 H222%
REVENUE
2019Half Year
40.7
2015
14.3
7.9
22.2
2016
15.6
27.2
42.8
2017
36.1
31.4
67.5
2018
30.0
30.7
60.7
H1 H2
*
Total revenue ($m)
Total renevue up
million
33%on FY18 H2
Record half year revenue of
$40.7
Capital revenue ($m)
2019Half Year
16.4
2018 H1 2018 H2
10.8
14.8
Capital revenue up
Consumables/service revenue ($m)
2019Half Year
24.3
2018 H1 2018 H2
19.9
15.3
Consumables/service revenue up
on PCP11%
on PCP59%
36%on PCP
Graphs are not to scale and therefore not comparable.
* Reduction in 2018 revenue reflects:
• Transitionary reduction in capital revenue associated with the earlier than anticipated regulatory approval of trophon®2 and subsequent run down of trophon EPR inventory by distributors; and
• Some customers deferring purchase, pending launch of trophon2 in Q1 of FY19.
H1 H2
For
per
sona
l use
onl
y
2019 Half Year Results 8
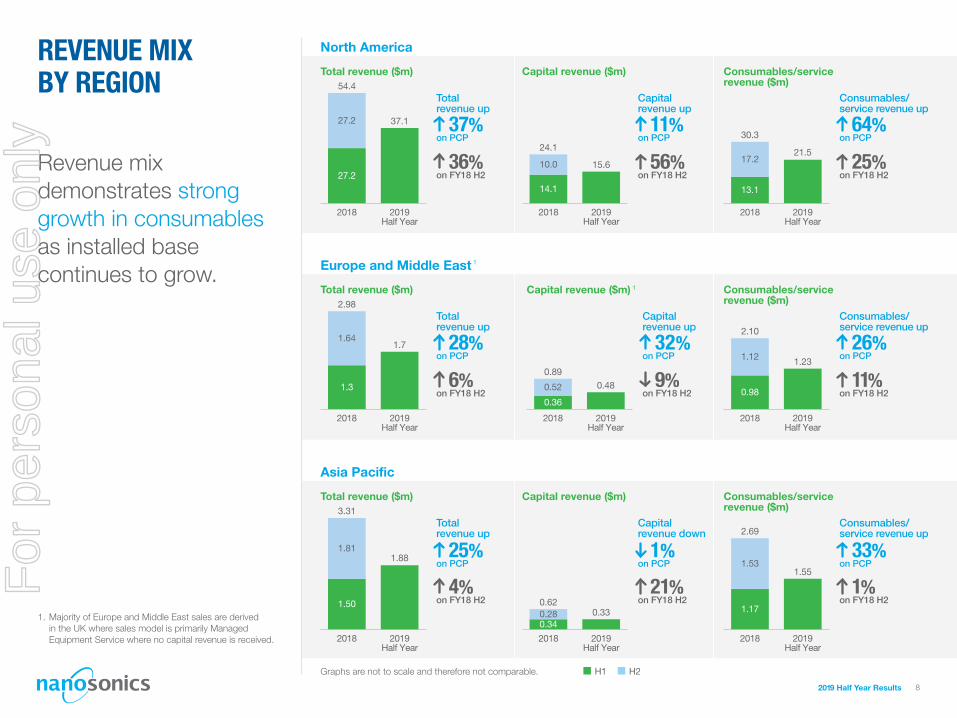
REVENUE MIX BY REGION
Revenue mix demonstrates strong growth in consumables as installed base continues to grow.
1. Majority of Europe and Middle East sales are derived in the UK where sales model is primarily Managed Equipment Service where no capital revenue is received.
North America
Total revenue ($m)
37.1
54.4
2018
27.2
27.2
2019Half Year
Capital revenue ($m)
15.6
2019Half Year
24.1
2018
14.1
10.0
Consumables/service revenue ($m)
21.5
30.3
2018 2019Half Year
13.1
17.236%on FY18 H2
Total revenue up
Capital revenue up
56%on FY18 H2
Consumables/ service revenue up
25%on FY18 H2
37%on PCP
11%on PCP
64%on PCP
Europe and Middle East 1
Total revenue ($m)
2019Half Year
1.7
2018
1.3
1.64
2.98
Capital revenue ($m) 1
0.480.89
2018 2019Half Year
0.36
0.52
Consumables/service revenue ($m)
2019Half Year
1.23
2018
0.98
1.12
2.10
Total revenue up
6%on FY18 H2
28%on PCP
Consumables/ service revenue up
11%on FY18 H2
26%on PCP
Capital revenue up
9%on FY18 H2
32%on PCP
Asia Pacific
2019Half Year
1.88
2018
1.81
3.31
1.50
Total revenue ($m)
2019Half Year
0.33
2018
0.340.280.62
Capital revenue ($m)
2019Half Year
1.55
2.69
2018
1.17
1.53
Total revenue up
4%on FY18 H2
Capital revenue down
21%on FY18 H2
Consumables/ service revenue up
1%on FY18 H2
Consumables/service revenue ($m)
25%on PCP
1%on PCP
33%on PCP
H1 H2Graphs are not to scale and therefore not comparable.
For
per
sona
l use
onl
y
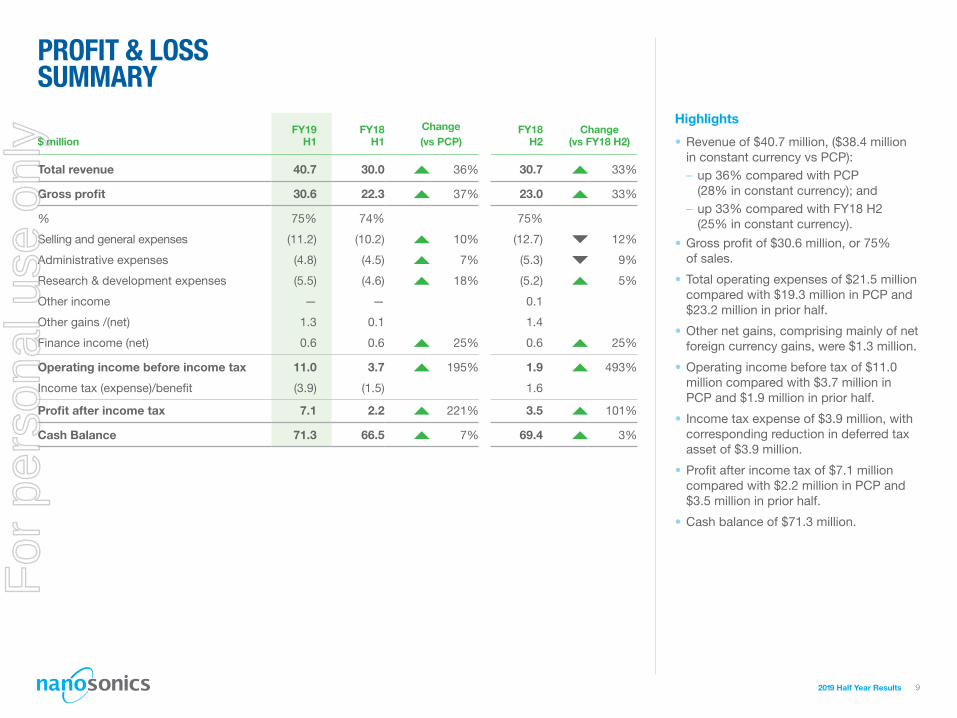
PROFIT & LOSS SUMMARY
Highlights
• Revenue of $40.7 million, ($38.4 million in constant currency vs PCP): – up 36% compared with PCP (28% in constant currency); and
– up 33% compared with FY18 H2 (25% in constant currency).
• Gross profit of $30.6 million, or 75% of sales.
• Total operating expenses of $21.5 million compared with $19.3 million in PCP and $23.2 million in prior half.
• Other net gains, comprising mainly of net foreign currency gains, were $1.3 million.
• Operating income before tax of $11.0 million compared with $3.7 million in PCP and $1.9 million in prior half.
• Income tax expense of $3.9 million, with corresponding reduction in deferred tax asset of $3.9 million.
• Profit after income tax of $7.1 million compared with $2.2 million in PCP and $3.5 million in prior half.
• Cash balance of $71.3 million.
FY19 FY18 Change FY18 Change $ million H1 H1 (vs PCP) H2 (vs FY18 H2)
Total revenue 40.7 30.0 36% 30.7 33%
Gross profit 30.6 22.3 37% 23.0 33%
% 75% 74% 75%
Selling and general expenses (11.2) (10.2) 10% (12.7) 12%
Administrative expenses (4.8) (4.5) 7% (5.3) 9%
Research & development expenses (5.5) (4.6) 18% (5.2) 5%
Other income — — 0.1
Other gains /(net) 1.3 0.1 1.4
Finance income (net) 0.6 0.6 25% 0.6 25%
Operating income before income tax 11.0 3.7 195% 1.9 493%
Income tax (expense)/benefit (3.9) (1.5) 1.6
Profit after income tax 7.1 2.2 221% 3.5 101%
Cash Balance 71.3 66.5 7% 69.4 3%
2019 Half Year Results 9
For
per
sona
l use
onl
y
2019 Half Year Results 10
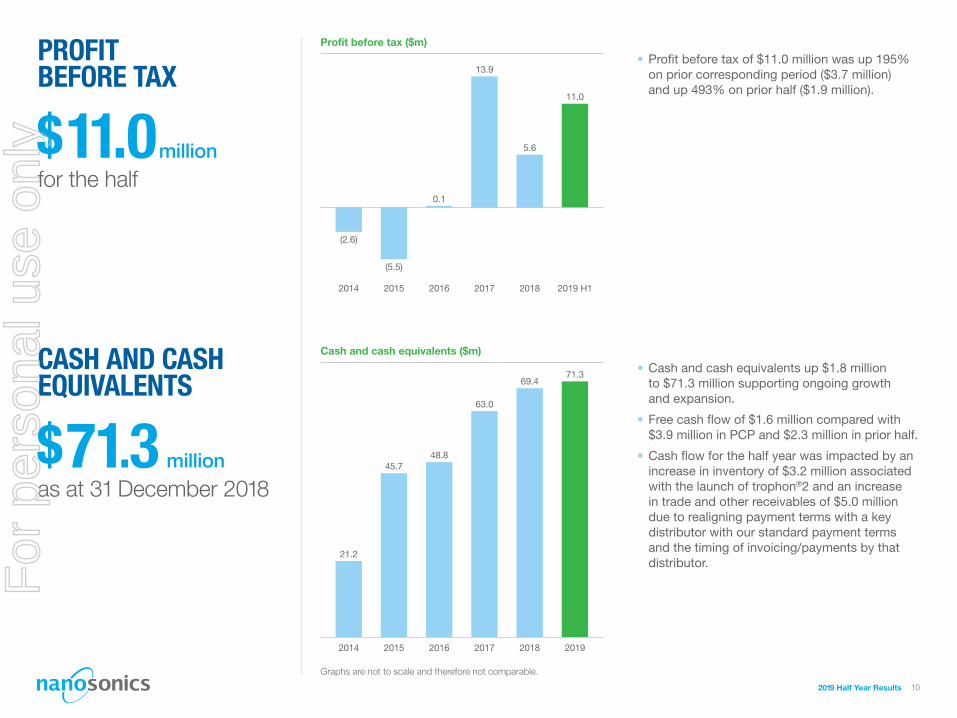
PROFIT BEFORE TAX
21.2
2014 2015
45.7
2016
48.8
2017
63.0
2018
69.4
2019
71.3CASH AND CASH EQUIVALENTS
• Cash and cash equivalents up $1.8 million to $71.3 million supporting ongoing growth and expansion.
• Free cash flow of $1.6 million compared with $3.9 million in PCP and $2.3 million in prior half.
• Cash flow for the half year was impacted by an increase in inventory of $3.2 million associated with the launch of trophon®2 and an increase in trade and other receivables of $5.0 million due to realigning payment terms with a key distributor with our standard payment terms and the timing of invoicing/payments by that distributor.
Cash and cash equivalents ($m)
(2.6)
2014 2015
(5.5)
2016
0.1
2017
13.9
2018
5.6
2019 H1
11.0
• Profit before tax of $11.0 million was up 195% on prior corresponding period ($3.7 million) and up 493% on prior half ($1.9 million).
Profit before tax ($m)
Graphs are not to scale and therefore not comparable.
for the half
as at 31 December 2018
$11.0
$71.3
million
million
For
per
sona
l use
onl
y
2019 Half Year Results 11
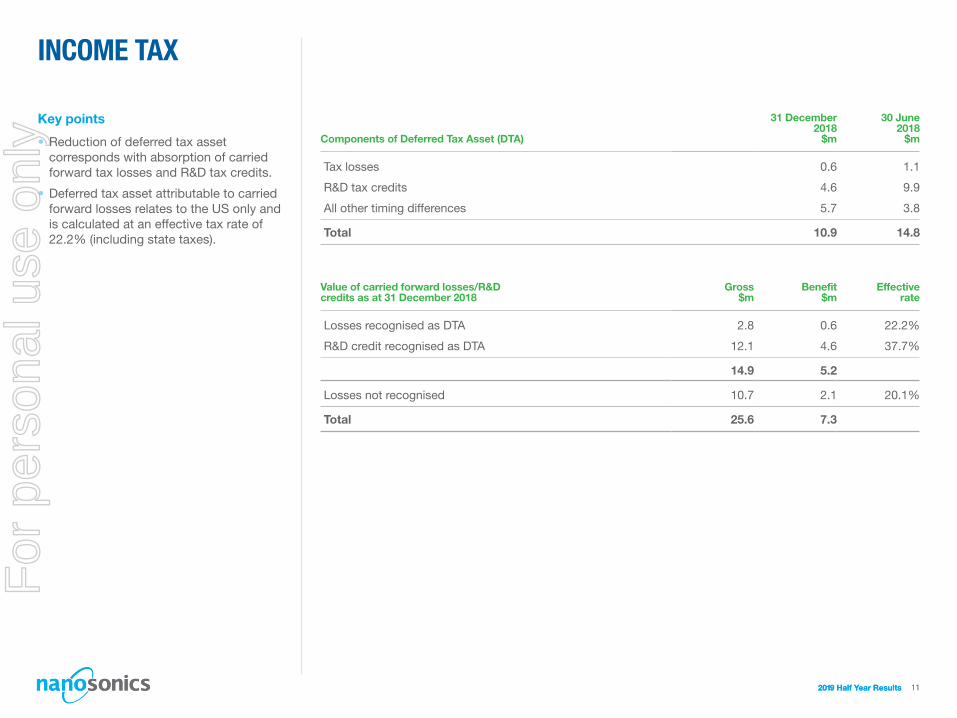
INCOME TAX
Key points
• Reduction of deferred tax asset corresponds with absorption of carried forward tax losses and R&D tax credits.
• Deferred tax asset attributable to carried forward losses relates to the US only and is calculated at an effective tax rate of 22.2% (including state taxes).
Components of Deferred Tax Asset (DTA)
31 December 2018
$m
30 June 2018
$m
Tax losses 0.6 1.1
R&D tax credits 4.6 9.9
All other timing differences 5.7 3.8
Total 10.9 14.8
Value of carried forward losses/R&D credits as at 31 December 2018
Gross $m
Benefit $m
Effective rate
Losses recognised as DTA 2.8 0.6 22.2%
R&D credit recognised as DTA 12.1 4.6 37.7%
14.9 5.2
Losses not recognised 10.7 2.1 20.1%
Total 25.6 7.3
2019 Half Year Results 11
For
per
sona
l use
onl
y
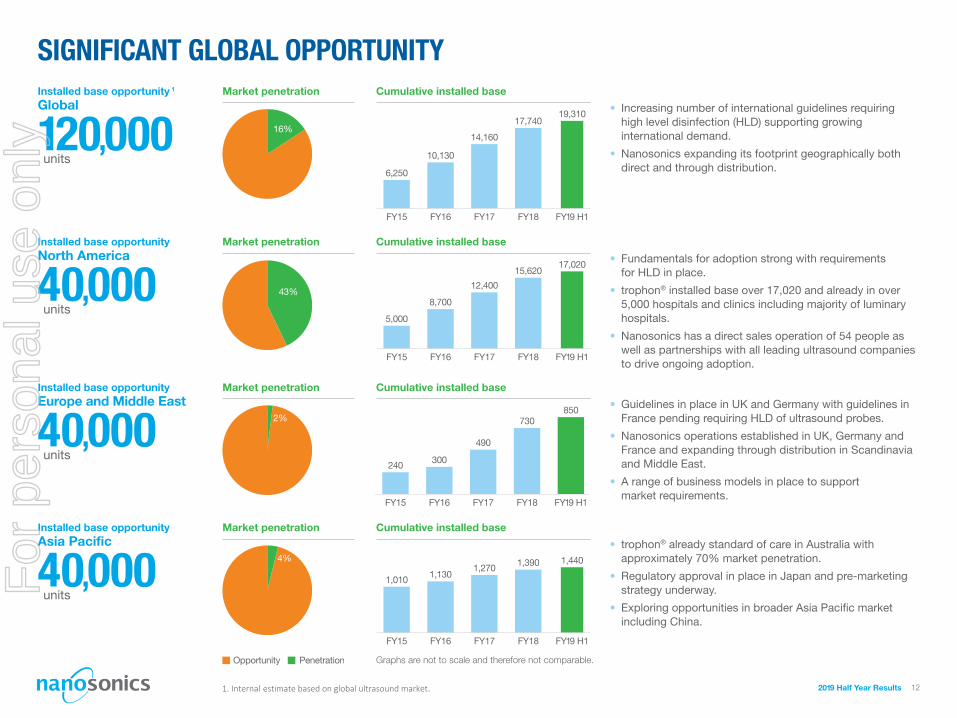
SIGNIFICANT GLOBAL OPPORTUNITY
2019 Half Year Results 12
Installed base opportunity 1
Global
120,000units
19,310
FY19 H1
17,740
FY18
14,160
FY17
10,130
FY16
6,250
FY15
• Increasing number of international guidelines requiring high level disinfection (HLD) supporting growing international demand.
• Nanosonics expanding its footprint geographically both direct and through distribution.
Cumulative installed baseMarket penetration
16%
Installed base opportunityNorth America
40,000units
17,020
FY19 H1
15,620
FY18
12,400
FY17
8,700
FY16
5,000
FY15
• Fundamentals for adoption strong with requirements for HLD in place.
• trophon® installed base over 17,020 and already in over 5,000 hospitals and clinics including majority of luminary hospitals.
• Nanosonics has a direct sales operation of 54 people as well as partnerships with all leading ultrasound companies to drive ongoing adoption.
Cumulative installed baseMarket penetration
43%
Installed base opportunityEurope and Middle East
40,000units
850
FY19 H1
730
FY18
490
FY17
300
FY16
240
FY15
• Guidelines in place in UK and Germany with guidelines in France pending requiring HLD of ultrasound probes.
• Nanosonics operations established in UK, Germany and France and expanding through distribution in Scandinavia and Middle East.
• A range of business models in place to support market requirements.
Cumulative installed baseMarket penetration
2%
Installed base opportunityAsia Pacific
40,000units
Cumulative installed baseMarket penetration
1,440
FY19 H1
1,390
FY18
1,270
FY17
1,130
FY16
1,010
FY15
• trophon® already standard of care in Australia with approximately 70% market penetration.
• Regulatory approval in place in Japan and pre-marketing strategy underway.
• Exploring opportunities in broader Asia Pacific market including China.
4%
PenetrationOpportunity Graphs are not to scale and therefore not comparable.
1. Internal estimate based on global ultrasound market.
For
per
sona
l use
onl
y
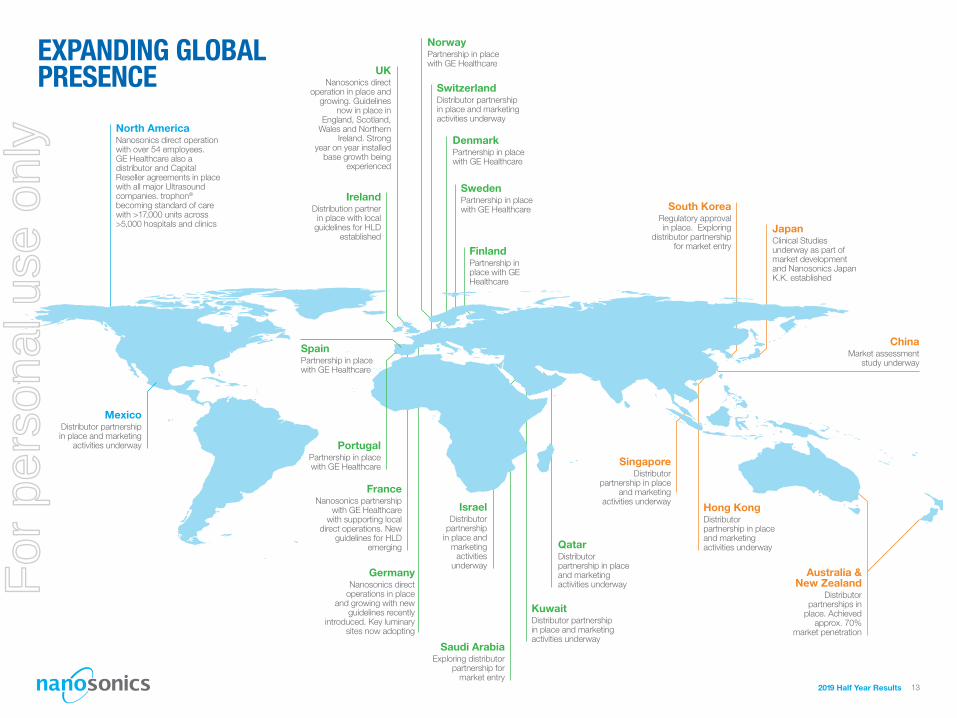
North AmericaNanosonics direct operation with over 54 employees. GE Healthcare also a distributor and Capital Reseller agreements in place with all major Ultrasound companies. trophon® becoming standard of care with >17,000 units across >5,000 hospitals and clinics
IrelandDistribution partner
in place with local guidelines for HLD
established
FranceNanosonics partnership
with GE Healthcare with supporting local
direct operations. New guidelines for HLD
emerging
KuwaitDistributor partnership in place and marketing activities underway
Australia & New Zealand
Distributor partnerships in
place. Achieved approx. 70%
market penetration
SingaporeDistributor
partnership in place and marketing
activities underwayHong KongDistributor partnership in place and marketing activities underway
GermanyNanosonics direct
operations in place and growing with new
guidelines recently introduced. Key luminary
sites now adopting
SwitzerlandDistributor partnership in place and marketing activities underway
IsraelDistributor
partnership in place and
marketing activities
underway
UKNanosonics direct
operation in place and growing. Guidelines
now in place in England, Scotland,
Wales and Northern Ireland. Strong
year on year installed base growth being
experienced
FinlandPartnership in place with GE Healthcare
DenmarkPartnership in place with GE Healthcare
SwedenPartnership in place with GE Healthcare
NorwayPartnership in place with GE Healthcare
QatarDistributor partnership in place and marketing activities underway
JapanClinical Studies underway as part of market development and Nanosonics Japan K.K. established
South KoreaRegulatory approval in place. Exploring
distributor partnership for market entry
ChinaMarket assessment
study underway
Saudi ArabiaExploring distributor
partnership for market entry
EXPANDING GLOBAL PRESENCE
2019 Half Year Results 13
SpainPartnership in place with GE Healthcare
PortugalPartnership in place with GE Healthcare
MexicoDistributor partnership in place and marketing
activities underway
For
per
sona
l use
onl
y
2019 Half Year Results 14
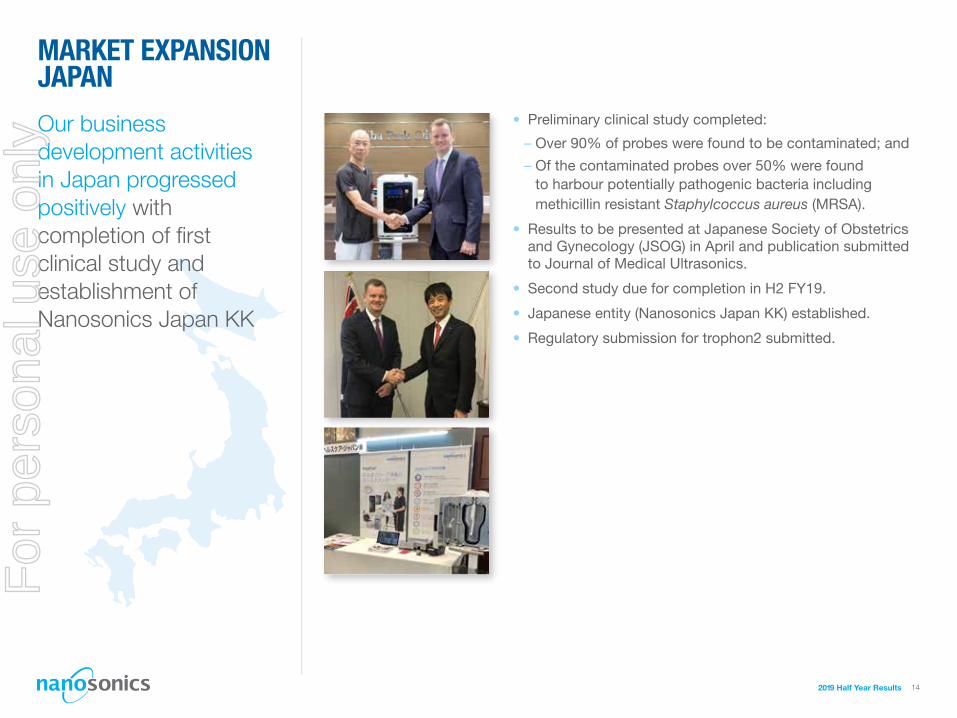
MARKET EXPANSION JAPAN
• Preliminary clinical study completed:
– Over 90% of probes were found to be contaminated; and
– Of the contaminated probes over 50% were found to harbour potentially pathogenic bacteria including methicillin resistant Staphylcoccus aureus (MRSA).
• Results to be presented at Japanese Society of Obstetrics and Gynecology (JSOG) in April and publication submitted to Journal of Medical Ultrasonics.
• Second study due for completion in H2 FY19.
• Japanese entity (Nanosonics Japan KK) established.
• Regulatory submission for trophon2 submitted.
Our business development activities in Japan progressed positively with completion of first clinical study and establishment of Nanosonics Japan KK
For
per
sona
l use
onl
y
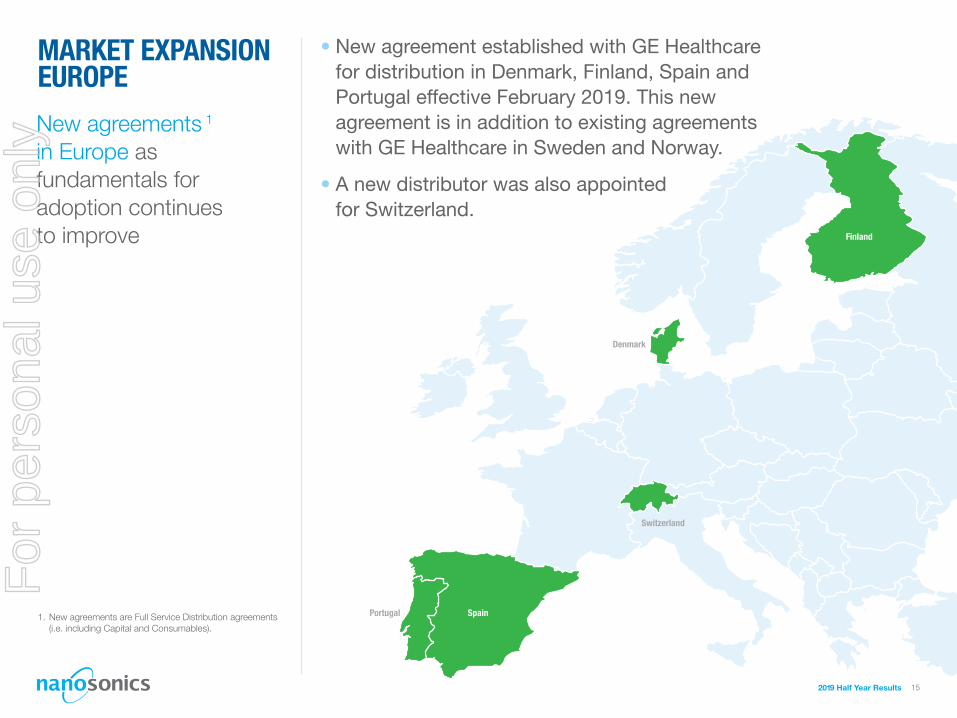
Switzerland
Portugal
Denmark
Finland
Spain
MARKET EXPANSION EUROPE
New agreements 1 in Europe as fundamentals for adoption continues to improve
152019 Half Year Results
1. New agreements are Full Service Distribution agreements (i.e. including Capital and Consumables).
• New agreement established with GE Healthcare for distribution in Denmark, Finland, Spain and Portugal effective February 2019. This new agreement is in addition to existing agreements with GE Healthcare in Sweden and Norway.
• A new distributor was also appointed for Switzerland.
For
per
sona
l use
onl
y
2019 Half Year Results 16
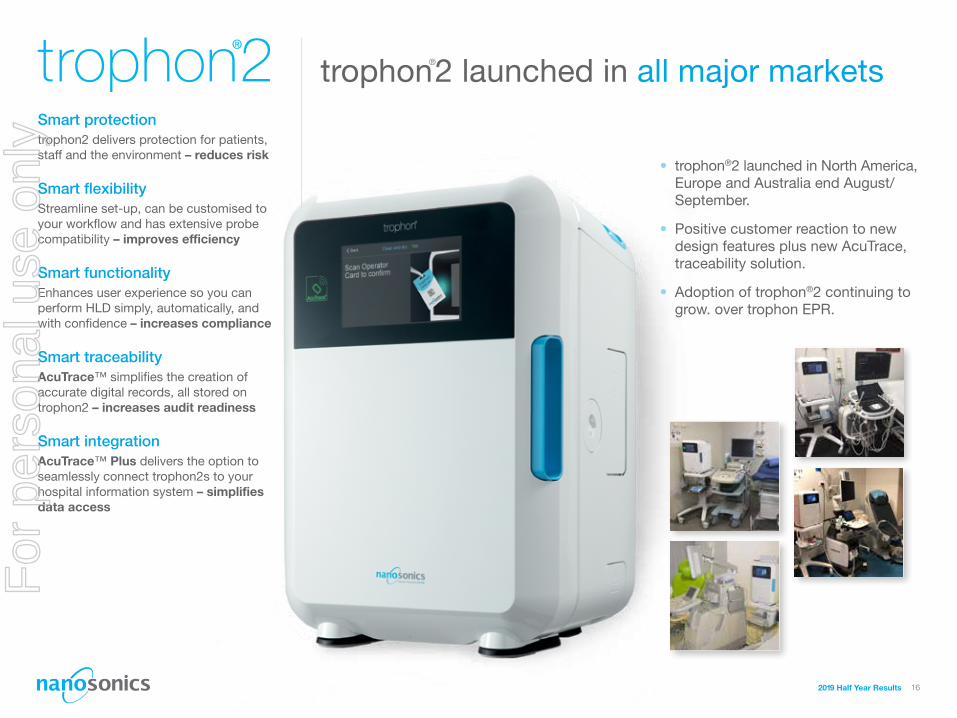
Smart protectiontrophon2 delivers protection for patients, staff and the environment – reduces risk
Smart flexibilityStreamline set-up, can be customised to your workflow and has extensive probe compatibility – improves efficiency
Smart functionalityEnhances user experience so you can perform HLD simply, automatically, and with confidence – increases compliance
Smart traceabilityAcuTrace™ simplifies the creation of accurate digital records, all stored on trophon2 – increases audit readiness
Smart integrationAcuTrace™ Plus delivers the option to seamlessly connect trophon2s to your hospital information system – simplifies data access
• trophon®2 launched in North America, Europe and Australia end August/September.
• Positive customer reaction to new design features plus new AcuTrace, traceability solution.
• Adoption of trophon®2 continuing to grow. over trophon EPR.
trophon®2 launched in all major marketsF
or p
erso
nal u
se o
nly
2019 Half Year Results 17
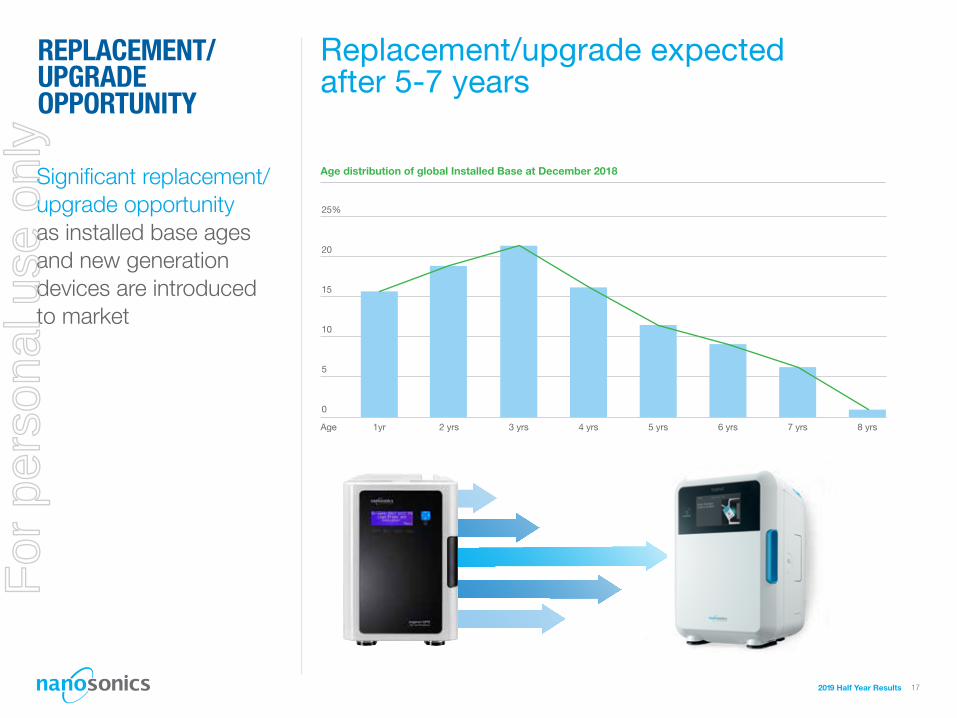
REPLACEMENT/ UPGRADE OPPORTUNITY
Significant replacement/ upgrade opportunity as installed base ages and new generation devices are introduced to market
Age distribution of global Installed Base at December 2018
10
20
15
25%
5
Age 2 yrs
0
7 yrs 8 yrs1yr 3 yrs 4 yrs 5 yrs 6 yrs
Replacement/upgrade expected after 5-7 years
For
per
sona
l use
onl
y
2019 Half Year Results 18
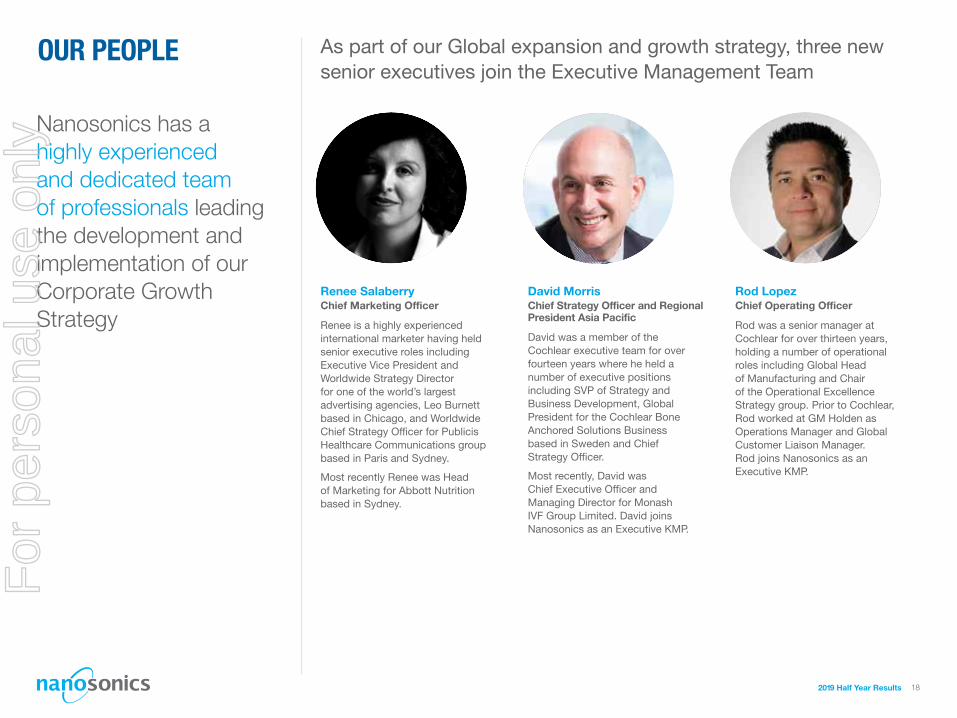
OUR PEOPLE
Nanosonics has a highly experienced and dedicated team of professionals leading the development and implementation of our Corporate Growth Strategy
As part of our Global expansion and growth strategy, three new senior executives join the Executive Management Team
Renee is a highly experienced international marketer having held senior executive roles including Executive Vice President and Worldwide Strategy Director for one of the world’s largest advertising agencies, Leo Burnett based in Chicago, and Worldwide Chief Strategy Officer for Publicis Healthcare Communications group based in Paris and Sydney.
Most recently Renee was Head of Marketing for Abbott Nutrition based in Sydney.
Renee SalaberryChief Marketing Officer
David was a member of the Cochlear executive team for over fourteen years where he held a number of executive positions including SVP of Strategy and Business Development, Global President for the Cochlear Bone Anchored Solutions Business based in Sweden and Chief Strategy Officer.
Most recently, David was Chief Executive Officer and Managing Director for Monash IVF Group Limited. David joins Nanosonics as an Executive KMP.
David MorrisChief Strategy Officer and Regional President Asia Pacific
Rod was a senior manager at Cochlear for over thirteen years, holding a number of operational roles including Global Head of Manufacturing and Chair of the Operational Excellence Strategy group. Prior to Cochlear, Rod worked at GM Holden as Operations Manager and Global Customer Liaison Manager. Rod joins Nanosonics as an Executive KMP.
Rod LopezChief Operating Officer
For
per
sona
l use
onl
y
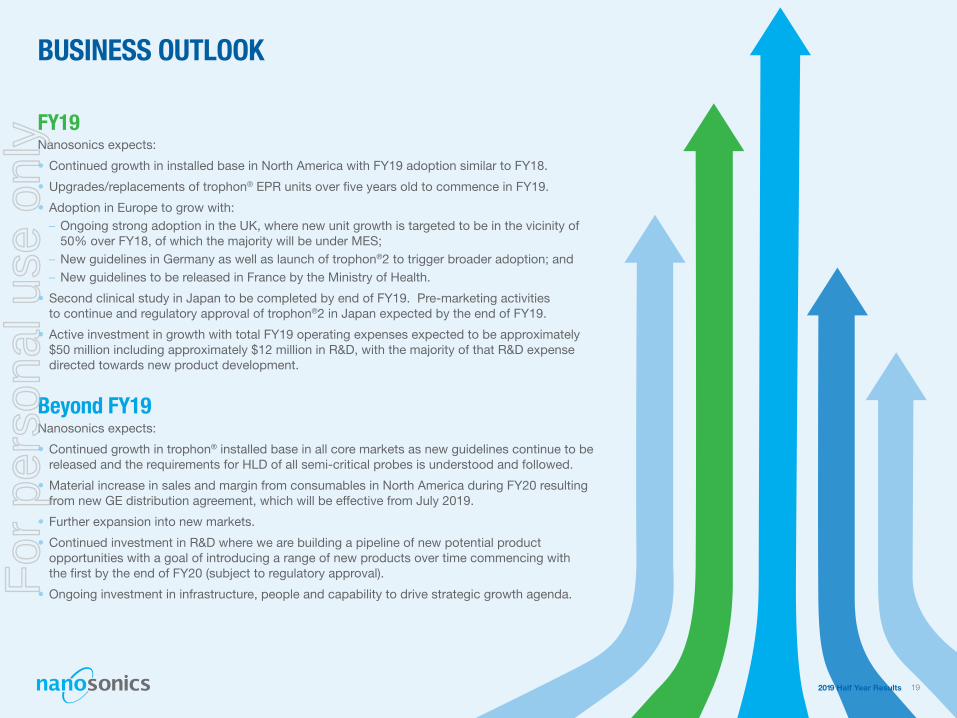
BUSINESS OUTLOOK
FY19Nanosonics expects:
• Continued growth in installed base in North America with FY19 adoption similar to FY18.
• Upgrades/replacements of trophon® EPR units over five years old to commence in FY19.
• Adoption in Europe to grow with: – Ongoing strong adoption in the UK, where new unit growth is targeted to be in the vicinity of 50% over FY18, of which the majority will be under MES;
– New guidelines in Germany as well as launch of trophon®2 to trigger broader adoption; and – New guidelines to be released in France by the Ministry of Health.
• Second clinical study in Japan to be completed by end of FY19. Pre-marketing activities to continue and regulatory approval of trophon®2 in Japan expected by the end of FY19.
• Active investment in growth with total FY19 operating expenses expected to be approximately $50 million including approximately $12 million in R&D, with the majority of that R&D expense directed towards new product development.
Beyond FY19Nanosonics expects:
• Continued growth in trophon® installed base in all core markets as new guidelines continue to be released and the requirements for HLD of all semi-critical probes is understood and followed.
• Material increase in sales and margin from consumables in North America during FY20 resulting from new GE distribution agreement, which will be effective from July 2019.
• Further expansion into new markets.
• Continued investment in R&D where we are building a pipeline of new potential product opportunities with a goal of introducing a range of new products over time commencing with the first by the end of FY20 (subject to regulatory approval).
• Ongoing investment in infrastructure, people and capability to drive strategic growth agenda.
2019 Half Year Results 19
For
per
sona
l use
onl
y
Thank youF
or p
erso
nal u
se o
nly