Embed Size (px)
Citation preview
NSW Education Standards Authority
2019 HIGHER SCHOOL CERTIFICATE EXAMINATION
Earth and Environmental Science General Instructions
• Reading time – 5 minutes • Working time – 3 hours • Write using black pen • Draw diagrams using pencil • Calculators approved by NESA may be used • A Geological Time Scale is provided at the back of this paper
Total marks: 100
Section I – 20 marks (pages 2–15) • Attempt Questions 1–20 • Allow about 35 minutes for this section
Section II – 80 marks (pages 17–36) • Attempt Questions 21–35 • Allow about 2 hours and 25 minutes for this section
2050
Section I
20 marks Attempt Questions 1–20 Allow about 35 minutes for this section
Use the multiple-choice answer sheet for Questions 1–20.
1 In which of the following are all the resources renewable?
A. Timber, water, wind
B. Tidal energy, oil, timber
C. Water, solar radiation, coal
D. Solar radiation, water, uranium
2 Which of the following would have the greatest immediate impact on biodiversity?
A. Air pollution
B. Habitat destruction
C. Human population growth
D. Infrastructure development
3 Human activity is most likely to be a contributing factor in the occurrence of which of the following natural disasters?
A. Earthquakes
B. Lahars
C. Landslides
D. Tsunamis
– 2 –
4
To gather evidence for climate variation, a dendrochronologist studies
A. isotope ratios in corals.
B. gas bubbles in ice cores.
C. the annual growth rings of trees.
D. species depicted in Aboriginal art sites.
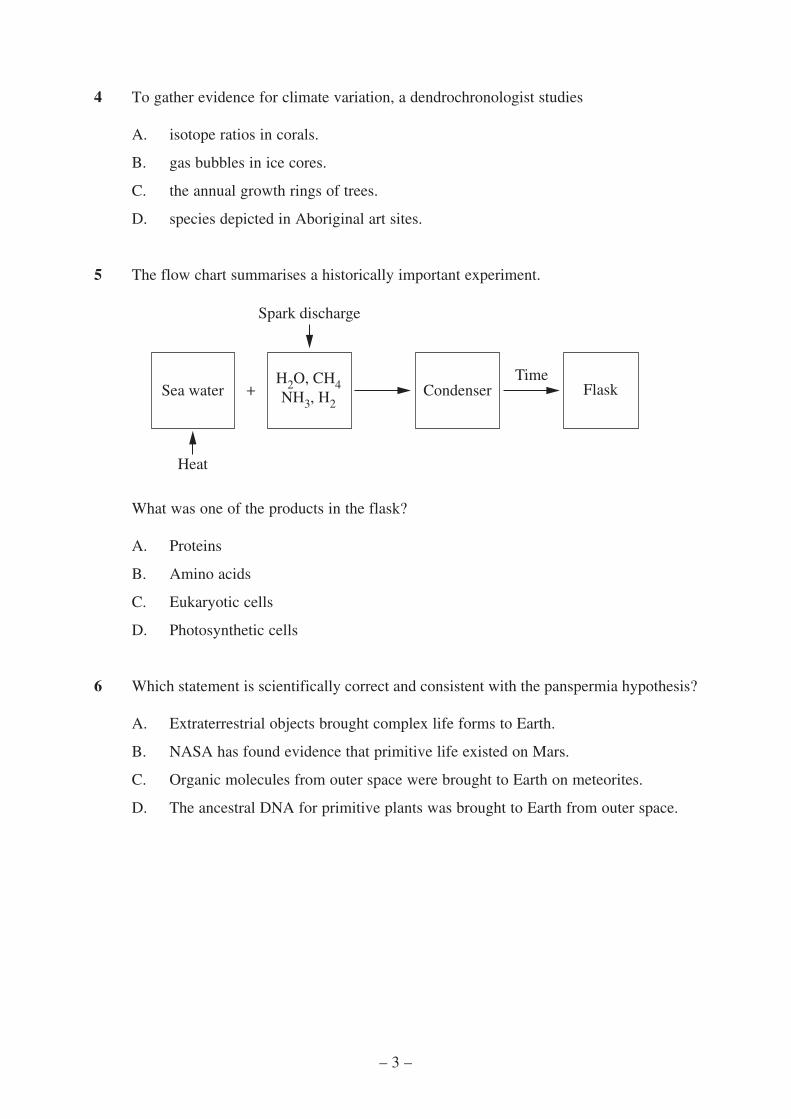
5 The flow chart summarises a historically important experiment.
Spark discharge
Sea water + H2O, CH4 NH3, H2
Condenser Time
Flask
Heat
What was one of the products in the flask?
A. Proteins
B. Amino acids
C. Eukaryotic cells
D. Photosynthetic cells
6 Which statement is scientifically correct and consistent with the panspermia hypothesis?
A. Extraterrestrial objects brought complex life forms to Earth.
B. NASA has found evidence that primitive life existed on Mars.
C. Organic molecules from outer space were brought to Earth on meteorites.
D. The ancestral DNA for primitive plants was brought to Earth from outer space.
– 3 –

– 4 –
7 Which of the following is an example of a geological hazard?
A. A cyclone approaching the Australian coastline
B. An active volcano that poses a threat to life and property
C. An earthquake that has affected thousands of people and caused enormous damage
D. A tsunami that wipes out coastal communities causing damage and loss of human life
8 In June 1991, Mt Pinatubo in the Philippines erupted, producing ash-rich volcanic plumes that reached a height of more than 40 km.
Which of the following decreased as a result of the eruption?
A. Rainfall on Mt Pinatubo
B. Aerosols in the stratosphere
C. Carbon dioxide levels in the ocean
D. Solar radiation reaching Earth’s surface
9 The picture shows a fossil trilobite (specimen X ).
Specimen X
Replacement image. Original image awaiting copyright.
© FossilEra/Matt Heaton
What type of fossil is specimen X ?
A. Cast
B. Mould
C. Trace fossil
D. Organic fossil

10 The graph shows data from the Mauna Loa Observatory, Hawaii, recording variations in atmospheric carbon dioxide.
Atmospheric CO2 at Mauna Loa Observatory
320
340
360
380
400A
tmos
pher
ic C
O2
(par
ts p
er m
illio
n)
1960 1970 1980 1990 2000 2010 2020
Year KEY
Trend line Actual measurements
– 5 –
What causes the ‘sawtooth’ fluctuations in the graph?
A. Seasonal changes in the rate of photosynthesis
B. Data taken at intervals rather than continuously
C. Monthly changes in the combustion of fuel for heating
D. Random volcanic eruptions occurring throughout the northern hemisphere
National Oceanic and Atmospheric Administration, US Department of Commerce

11 The graph shows the number of severe and non-severe tropical cyclones from 1970–2017 which have occurred in the Australian region.
0
2
4
6
8
10
12
14
16
18
20 N
umbe
r of
cyc
lone
s KEY
Non-severe
Severe
1970
/197
1
1975
/197
6
1980
/198
1
1985
/198
6
1990
/199
1
1995
/199
6
2000
/200
1
2005
/200
6
2010
/201
1
2015
/201
6
Year www.csiro.au
What conclusion is supported by data in the graph?
A. The total number of cyclones is decreasing.
B. The severity of cyclones has consistently decreased over time.
C. The number of both severe and non-severe cyclones has not changed over time.
D. The number of non-severe cyclones is decreasing while the number of severe cyclones is increasing.
– 6 –

12 The diagram shows a model of solar energy transformations occurring in the atmosphere, producing the greenhouse effect.
Sun
Earth X
Z
Y W
KEY
W X Y Z
Solar radiation Majority of Some infrared Reabsorption of enters the solar radiation radiation escapes trapped infrared atmosphere is absorbed by but most is trapped radiation by
Earth’s surface and then re-emitted as
by the atmosphere Earth’s surface
infrared radiation
Which statement correctly explains the ‘enhanced’ greenhouse effect?
A. Increased melting of ice caps increased the reflection of solar radiation from the surface at X.
B. Increased ozone levels led to greater absorbance of solar radiation by Earth’s surface at X.
C. A hole in the ozone layer decreased the solar radiation being reflected by the atmosphere at W.
D. Increased carbon dioxide levels have increased the trapping of infrared radiation in the atmosphere at Y.
– 7 –

– 8 –
13 A company discovered an ore body after prospecting in an area of NSW. The flow chart shows subsequent stages of the proposed mine.
Which row in the table correctly identifies the appropriate stage for undertaking each activity?
A.
B.
C.
D.
Activity
Submission of an Environmental Impact
Statement
Collection and propagation of
indigenous plants
Consultation with traditional owners
Planning Development All stages
Development All stages Development
All stages Planning Extraction
Planning Extraction All stages
Due to copyright restrictions, this material cannot be displayed.
Source is accessible at https://www.superfund.arizona.edu/learning-modules/tribal-modules/copper/mine-life-cycle
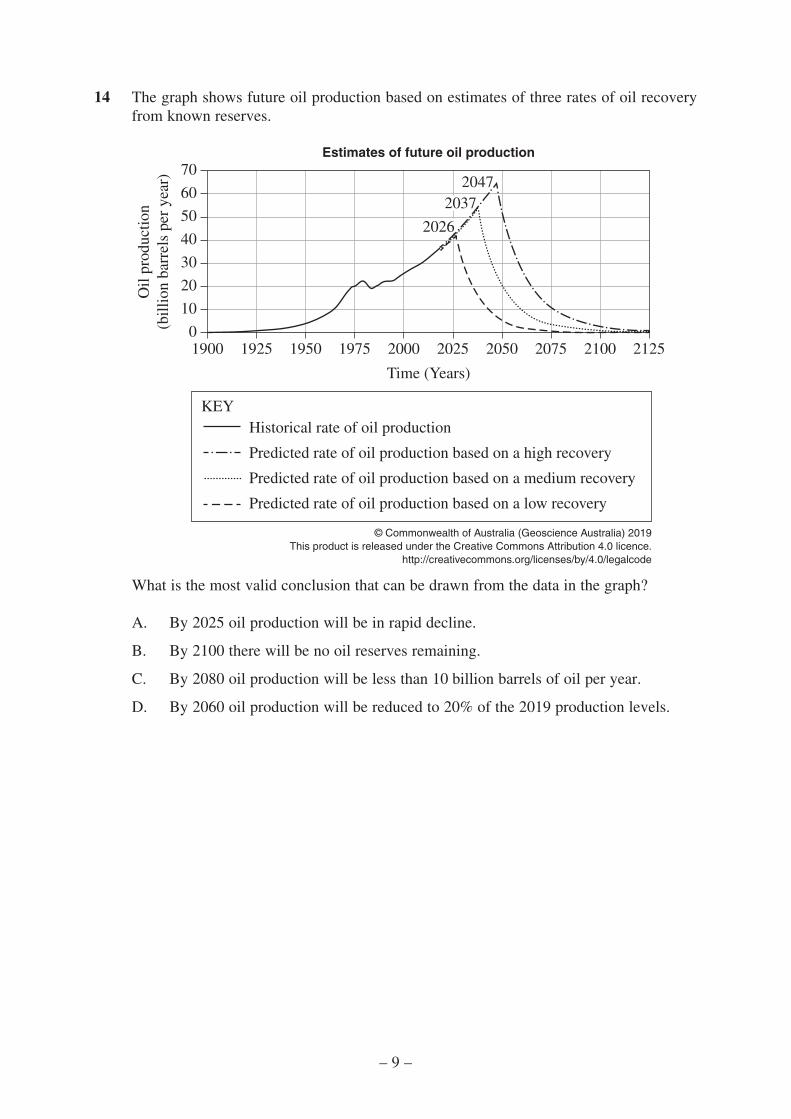
14 The graph shows future oil production based on estimates of three rates of oil recovery from known reserves.
Estimates of future oil production
1900 0
10
20
30
40
50
60
70
1925 1950 1975 2000 2025
Oil
prod
uctio
n(b
illio
n ba
rrel
s pe
r ye
ar)
2050
2047 2037
2026
2075 2100 2125
Time (Years)
KEY Historical rate of oil production
Predicted rate of oil production based on a high recovery
Predicted rate of oil production based on a medium recovery
Predicted rate of oil production based on a low recovery
– 9 –
© Commonwealth of Australia (Geoscience Australia) 2019This product is released under the Creative Commons Attribution 4.0 licence.
http://creativecommons.org/licenses/by/4.0/legalcode
What is the most valid conclusion that can be drawn from the data in the graph?
A. By 2025 oil production will be in rapid decline.
B. By 2100 there will be no oil reserves remaining.
C. By 2080 oil production will be less than 10 billion barrels of oil per year.
D. By 2060 oil production will be reduced to 20% of the 2019 production levels.

15 During the Permian period, the supercontinent Pangaea formed during a plate tectonic supercycle. The diagram shows four stages of the plate tectonic supercycle.
W X
Y Z
KEY
Continental crust Mantle
Oceanic crust Direction of movement
Ocean Creative Commons, Philip J Heron – A Simplified ‘Wilson Cycle’
Which sequence shows the correct order of the stages that resulted in the formation of Pangaea?
A. W, X, Y, Z
B. Z, W, X, Y
C. X, Z, W, Y
D. Y, X, W, Z
– 10 –

16 The diagram is one model showing the influence of oceanic conditions on coral reef systems.
– 11 –
Algal survival
Algal abundance
Coral survival
Coral abundance
Grazing organisms
?
–
–
+
++
–
+ +
Nutrients
Oceanic CO2
Algal growth
Coral +growth
Ocean warming
?–
+– +–
+– KEY
Global Local + Positive impact – Negative impact ? Unknown impact
According to the model, which of the following is a likely consequence of changing ocean conditions?
A. A change in pH from 8.2 to 8 which will lead to a reduction in coral survival and a reduction in algal growth
B. An increase of 5% in nutrients which will lead to an increase in coral growth and a decrease in algal abundance
C. An atmospheric temperature increase of 2°C which will lead to an increase in coral abundance and an increase in algal abundance
D. An increase in the population of grazing organisms which will lead to an increase in coral abundance and a decrease in algal survival
© John Wiley & Sons, Inc. All rights reserved.

17 The graph shows world plastics production from 1950 to 2020.
Plas
tics
prod
uctio
n (m
illio
n to
nnes
)
350
300
250
200
150
100
50
0 1950 1960 1970 1980 1990 2000 2010 2020
Year China Plastic & Rubber Journal (www.adsalecprj.com)
By what percentage did plastics production increase between 1990 and 2010?
A. 1 50%
B. 200%
C. 2 50%
D. 3 00%
18 Which combination of plate boundary and volcanic feature would result in both effusive volcanic eruptions and shallow focus earthquakes?
A.
B.
C.
D.
Plate boundary Volcanic feature
Ocean–continent divergent Shield volcano
Ocean–ocean convergent Stratovolcano
Ocean–continent convergent Stratovolcano
Continent–continent divergent Continental rift volcano
– 12 –

19 The satellite image shows a 2007 weather event.
Which sequence explains this event?
A. Warmer than normal ocean temperatures moist air rises low air pressure system
B. Colder than normal ocean temperatures dry air falls low air pressure system
C. Warmer than normal ocean temperatures moist air rises high air pressure system
D. Colder than normal ocean temperatures dry air falls high air pressure system
© Australian Government Bureau of Meteorology
– 13 –

20 A recent theory for the origin of life on Earth suggests that the simple organic precursor molecules for amino acids and proteins were formed at black smokers.
Which diagram best represents this theory?
UVAnoxic atmosphere
Alkaline Acidic vent water sea water
Metallic coat
Granite 300–600°C
H2
NH3
NH3
CH4
H2
CO2
A.
Limited oxygen in the atmosphere
Alkaline sea water
Acidic vent water
Iron molybdenum coating
Basalt with porous surface 200°C
H2
NH3CO2
CH4
Primordial soup
B.
Lightning UVOxygen-rich
atmosphere
Acidic vent water
Iron oxide covering
Primordial soup
Acidic sea water
Solid basalt 900–1500°C
H2
NH3 CO2 CH4
C.
Anoxic atmosphere
CO2
Acidic sea water
Alkaline vent water
Metallic deposits
Basalt with porous surface 200–400°C
H2
NH3
NH3
CH4
CH4
H2
D.
NOT TO SCALE
– 14 –

BLANK PAGE
– 15 –
BLANK PAGE
– 16 –
© 2019 NSW Education Standards Authority
Do
NO
T w
rite
in
th
is a
rea
.
HIGHER SCHOOL CERTIFICATE EXAMINATION
Centre Number Earth and Environmental Science
Student Number Section II Answer Booklet
80 marks Attempt Questions 21–35 Allow about 2 hours and 25 minutes for this section
Instructions • Write your Centre Number and Student Number at the top of this page.
• Answer the questions in the spaces provided. These spacesprovide guidance for the expected length of response.
• Show all relevant working in questions involving calculations.
• Extra writing space is provided at the back of this booklet.If you use this space, clearly indicate which question you areanswering.
Please turn over
2051 15100
2019
– 17 – Office Use Only – Do NOT write anything, or make any marks below this line. 5638310365
.........................................................................................................................................
.........................................................................................................................................
.........................................................................................................................................
.........................................................................................................................................
.........................................................................................................................................
.........................................................................................................................................
.........................................................................................................................................
.........................................................................................................................................
.........................................................................................................................................
.........................................................................................................................................
.........................................................................................................................................
.........................................................................................................................................
.........................................................................................................................................
.........................................................................................................................................
.........................................................................................................................................
.........................................................................................................................................
.........................................................................................................................................
.........................................................................................................................................
.........................................................................................................................................
.........................................................................................................................................
.........................................................................................................................................
.........................................................................................................................................
.........................................................................................................................................
.........................................................................................................................................
.........................................................................................................................................
.........................................................................................................................................
.........................................................................................................................................
Do
NO
T w
rite in
this a
rea
.
Question 21 (5 marks)
– 18 – Office Use Only – Do NOT write anything, or make any marks below this line. 0589310365
Assess the sustainability of processes used by Aboriginal Peoples or Torres Strait Islander Peoples as resource managers. Use examples to support your answer.
5

Question 22 (5 marks)
Construct a flow diagram to summarise the processes used to manage different types of household solid waste.
5
Do
NO
T w
rite
in
th
is a
rea
.
– 19 – Office Use Only – Do NOT write anything, or make any marks below this line. 1024310360

Question 23 (8 marks)
The table gives information about the generation and the reuse of some materials in Australia in 2016.
Metals Organics Paper and cardboard
Plastics Glass
Generation (Mt) 5.2 12.8 5.3 2.5 1.1
Energy recovery (Mt) 0.0 1.4 0.5 0.02 0.0
Recycling (Mt) 4.6 5.2 3.2 0.3 0.6
Disposal (Mt) 0.6 6.2 1.6 2.2 0.5
(a) Complete the graph for Organics using information in the table. 3
Generation and reuse of materials in Australia in 2016
Gen
erat
ion
(Mt)
14
13
12
11
10
9
8
7
6
5
4
3
2
1
0
Recycling
Energy recovery
Disposal
KEY
Metals Organics Paper and Plastics Glass cardboard
© Australian Government Department of the Environment and Energy
Question 23 continues on page 21 – 20 –
Do N
OT w
rite in this area.
Office Use Only – Do NOT write anything, or make any marks below this line. 5486310366

Do
NO
T w
rite
in
th
is a
rea
.
Question 23 (continued)
In the table on page 20, the recovery rates of different classes of materials are given as ‘Energy recovery’ and ‘Recycling’ rates. ‘Energy recovery’ is where the material is converted into some form of energy and reused in this fashion, whereas ‘Recycling’ is where the material is reused to make new products.
The percentage total recovery (PTR) can be calculated as
Energy recovery (Mt) + Recycling (Mt) 100 PTR = ×
Generation (Mt) 1
(b) Complete the table by adding the missing data for Organics and Plastics and calculate the PTR (to one decimal place) for Organics and Plastics.
2
Material class Energy recovery (Mt)
Recycling (Mt)
Generation (Mt)
PTR (%)
Metals 0.0 4.6 5.2 88.5
Organics
Paper and cardboard
0.5 3.2 5.3 69.8
Plastics
Glass 0.0 0.6 1.1 54.5
(c) Identify the material with the lowest percentage total recovery (PTR) and justify a strategy to improve its recovery rate.
3
...............................................................................................................................
...............................................................................................................................
...............................................................................................................................
...............................................................................................................................
...............................................................................................................................
...............................................................................................................................
...............................................................................................................................
...............................................................................................................................
– 21 – Office Use Only – Do NOT write anything, or make any marks below this line. 7986310363
End of Question 23
– 22 –
Do N
OT w
rite in this area.
Question 24 (8 marks)
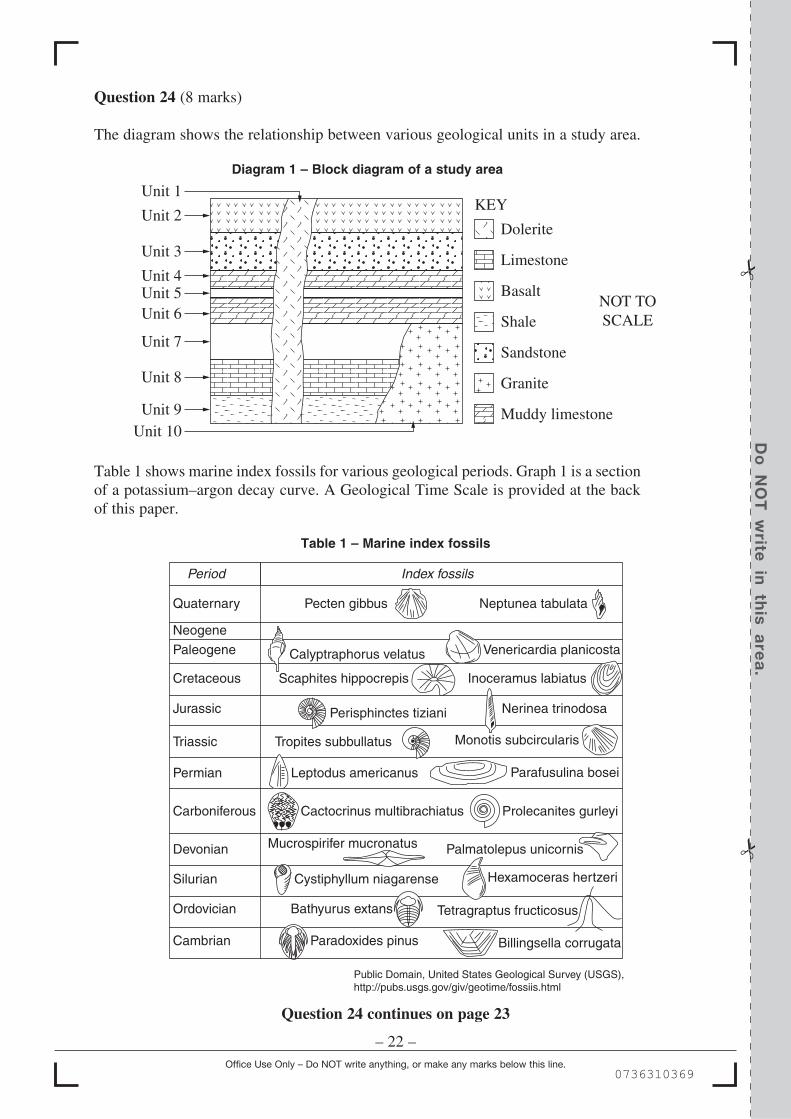
The diagram shows the relationship between various geological units in a study area.
Office Use Only – Do NOT write anything, or make any marks below this line. 0736310369
Diagram 1 – Block diagram of a study area
Unit 1 KEY
Unit 2 Dolerite
Unit 3 Limestone Unit 4 Unit 5 Basalt
NOT TO Unit 6 Shale SCALE Unit 7
Sandstone
Unit 8 Granite
Unit 9 Muddy limestone Unit 10
Table 1 shows marine index fossils for various geological periods. Graph 1 is a section of a potassium–argon decay curve. A Geological Time Scale is provided at the back of this paper.
Period Index fossils
Quaternary Pecten gibbus Neptunea tabulata
Neogene
Paleogene Venericardia planicosta Calyptraphorus velatus
Cretaceous Inoceramus labiatus Scaphites hippocrepis
Jurassic Nerinea trinodosa Perisphinctes tiziani
Triassic Monotis subcircularis Tropites subbullatus
Permian Parafusulina bosei Leptodus americanus
Carboniferous Prolecanites gurleyi Cactocrinus multibrachiatus
Devonian Palmatolepus unicornis Mucrospirifer mucronatus
Silurian Hexamoceras hertzeri Cystiphyllum niagarense
Ordovician Tetragraptus fructicosus Bathyurus extans
Cambrian Billingsella corrugata Paradoxides pinus
Public Domain, United States Geological Survey (USGS), http://pubs.usgs.gov/giv/geotime/fossiis.html
Table 1 – Marine index fossils
Question 24 continues on page 23

Do
NO
T w
rite
in
this
are
a.
– 23 –
Question 24 (continued)
Office Use Only – Do NOT write anything, or make any marks below this line. 6277310365
Graph 1 – Section of a potassium–argon decay curve
1.00
Prop
ortio
n of
pot
assi
um-4
0 re
mai
ning
0.98
0.96
0.94
0.92
0.90
0.88
0.86
0.84 0 100 200 300 400
Age (millions of years) Isotopic Dating Methods, © Steve Earle
(a) Complete the table by adding the missing data. 4
Unit Lithology An index fossil
Proportion potassium-40
remaining
Geological Period
Absolute age in millions
of years
1 0.99
2 Basalt 0.96 Cretaceous 80
3 Sandstone Perisphinctes tiziani
Jurassic
4 Muddy limestone Triassic
5
6 Muddy limestone Triassic
7
8 Cystiphyllum niagarense
9 Shale Tetragraptus fructicosus
Ordovician
10 Granite 0.865 Permian
Question 24 continues on page 24

(b) What is the likely age of Unit 7? Give reasons for your answer. 4
...............................................................................................................................
...............................................................................................................................
...............................................................................................................................
...............................................................................................................................
...............................................................................................................................
...............................................................................................................................
...............................................................................................................................
...............................................................................................................................
...............................................................................................................................
...............................................................................................................................
Question 24 (continued)
End of Question 24
Do
NO
T w
rite in
this a
rea
.
– 24 – Office Use Only – Do NOT write anything, or make any marks below this line. 1032310369

Do
NO
T w
rite
in
this
are
a.
Question 25 (2 marks)
How can the reliability of the data from a first-hand investigation be tested? 2
.........................................................................................................................................
.........................................................................................................................................
.........................................................................................................................................
.........................................................................................................................................
Question 26 (4 marks)
The graph shows the abundance of oxygen and carbon dioxide in Earth’s atmosphere and the relative abundance of banded iron formations (BIF) produced over time.
4
Time (billions of years before present)
Carbon dioxide
Oxygen
Relative deposition
of BIF
4.0 3.0 2.0 1.0 0
100% 1%
100% 10% 1% 1000 ppm 100 ppm 10 ppm 1 ppm
Atm
osph
eric
CO
2 co
ncen
trat
ion
Atm
osph
eric
O2
conc
entr
atio
n 100 ppm 1 ppm
10–2 ppm 10–4 ppm 10–6 ppm 10–8 0.1 ppm ppm
Creative Commons
Explain how the biosphere has influenced Earth’s atmosphere and hydrosphere over time. Use information from the graph to support your answer.
.........................................................................................................................................
.........................................................................................................................................
.........................................................................................................................................
.........................................................................................................................................
.........................................................................................................................................
.........................................................................................................................................
.........................................................................................................................................
.........................................................................................................................................
.........................................................................................................................................
.........................................................................................................................................
.........................................................................................................................................
.........................................................................................................................................
– 25 – Office Use Only – Do NOT write anything, or make any marks below this line.
0136310363

.........................................................................................................................................
.........................................................................................................................................
.........................................................................................................................................
.........................................................................................................................................
.........................................................................................................................................
.........................................................................................................................................
.........................................................................................................................................
.........................................................................................................................................
Do
NO
T w
rite in
this a
rea
.
Question 27 (3 marks)
– 26 – Office Use Only – Do NOT write anything, or make any marks below this line. 7037310360
The average abundance of iridium in meteorites is 0.5 ppm and the average abundance of iridium in general crustal rocks is less than 0.001 ppm.
How can the iridium content of BOTH meteorites and Earth’s crust be used to support the theory that the end-Cretaceous mass extinction was caused by a meteorite impact?
3

Do
NO
T w
rite
in
th
is a
rea
.
.........................................................................................................................................
.........................................................................................................................................
.........................................................................................................................................
.........................................................................................................................................
.........................................................................................................................................
.........................................................................................................................................
.........................................................................................................................................
.........................................................................................................................................
.........................................................................................................................................
.........................................................................................................................................
.........................................................................................................................................
.........................................................................................................................................
Question 28 (4 marks)
– 27 – Office Use Only – Do NOT write anything, or make any marks below this line. 2207310364
Explain how BOTH tsunamis and lahars are produced. 4
Please turn over

.........................................................................................................................................
.........................................................................................................................................
.........................................................................................................................................
.........................................................................................................................................
.........................................................................................................................................
.........................................................................................................................................
.........................................................................................................................................
.........................................................................................................................................
.........................................................................................................................................
.........................................................................................................................................
.........................................................................................................................................
.........................................................................................................................................
.........................................................................................................................................
.........................................................................................................................................
.........................................................................................................................................
.........................................................................................................................................
.........................................................................................................................................
.........................................................................................................................................
.........................................................................................................................................
.........................................................................................................................................
.........................................................................................................................................
.........................................................................................................................................
.........................................................................................................................................
.........................................................................................................................................
.........................................................................................................................................
.........................................................................................................................................
.........................................................................................................................................
Do
NO
T w
rite in
this a
rea
.
Question 29 (7 marks)
– 28 – Office Use Only – Do NOT write anything, or make any marks below this line. 1619310360
Evaluate technologies used in meteorology to predict extreme weather events. 7

Do
NO
T w
rite
in
th
is a
rea
.
...............................................................................................................................
...............................................................................................................................
...............................................................................................................................
...............................................................................................................................
...............................................................................................................................
...............................................................................................................................
Question 30 (7 marks)
(a) Account for the difference in the depth at which earthquakes originate at divergent and convergent boundaries.
3
(b) Compare the effects of explosive and effusive volcanism on BOTH the biosphere and atmosphere.
4
– 29 – Office Use Only – Do NOT write anything, or make any marks below this line. 0585310361
Biosphere
Explosive volcanism Effusive volcanism
Atmosphere
Explosive volcanism Effusive volcanism

.........................................................................................................................................
.........................................................................................................................................
.........................................................................................................................................
.........................................................................................................................................
.........................................................................................................................................
.........................................................................................................................................
.........................................................................................................................................
.........................................................................................................................................
.........................................................................................................................................
.........................................................................................................................................
.........................................................................................................................................
.........................................................................................................................................
.........................................................................................................................................
.........................................................................................................................................
.........................................................................................................................................
.........................................................................................................................................
Do
NO
T w
rite in
this a
rea
.
Question 31 (4 marks)
– 30 – Office Use Only – Do NOT write anything, or make any marks below this line. 6577310368
Why are some scientists investigating the current trend of increasing atmospheric CO2 when Earth’s history has shown the planet has undergone several periods of increasing levels of atmospheric CO2?
4

Do
NO
T w
rite
in
th
is a
rea
.
...............................................................................................................................
...............................................................................................................................
...............................................................................................................................
...............................................................................................................................
...............................................................................................................................
...............................................................................................................................
...............................................................................................................................
...............................................................................................................................
...............................................................................................................................
...............................................................................................................................
...............................................................................................................................
...............................................................................................................................
Question 32 (5 marks)
– 31 – Office Use Only – Do NOT write anything, or make any marks below this line. 4074310368
(a) Explain how oceans become acidified. 3
(b) Describe ONE effect of ocean acidification. 2
Please turn over
...............................................................................................................................
...............................................................................................................................
...............................................................................................................................
...............................................................................................................................
...............................................................................................................................
...............................................................................................................................
Question 33 (6 marks)
(a) How can Aboriginal art be used as evidence of the changing biodiversity of Australia?
2
...............................................................................................................................
...............................................................................................................................
...............................................................................................................................
...............................................................................................................................
...............................................................................................................................
...............................................................................................................................
...............................................................................................................................
...............................................................................................................................
...............................................................................................................................
...............................................................................................................................
...............................................................................................................................
...............................................................................................................................
...............................................................................................................................
...............................................................................................................................
Do
NO
T w
rite in
this a
rea
.
(b) Explain how scientists can interpret past environments from the study of sedimentary rocks. Support your answer using examples.
– 32 – Office Use Only – Do NOT write anything, or make any marks below this line. 9566310369
4

Do
NO
T w
rite
in
th
is a
rea
.
.........................................................................................................................................
.........................................................................................................................................
.........................................................................................................................................
.........................................................................................................................................
.........................................................................................................................................
.........................................................................................................................................
.........................................................................................................................................
.........................................................................................................................................
Question 34 (3 marks)
– 33 – Office Use Only – Do NOT write anything, or make any marks below this line. 0008310361
Assess the use of ONE geo-engineering strategy in mitigating global temperature increases.
3
Please turn over
.........................................................................................................................................
.........................................................................................................................................
.........................................................................................................................................
.........................................................................................................................................
.........................................................................................................................................
.........................................................................................................................................
.........................................................................................................................................
.........................................................................................................................................
.........................................................................................................................................
.........................................................................................................................................
.........................................................................................................................................
.........................................................................................................................................
.........................................................................................................................................
.........................................................................................................................................
.........................................................................................................................................
.........................................................................................................................................
.........................................................................................................................................
.........................................................................................................................................
.........................................................................................................................................
.........................................................................................................................................
.........................................................................................................................................
.........................................................................................................................................
.........................................................................................................................................
Do
NO
T w
rite in
this a
rea
.
Question 35 (9 marks)
– 34 – Office Use Only – Do NOT write anything, or make any marks below this line. 8952310367
Analyse the use of working scientifically skills in BOTH investigating major anthropogenic environmental problems facing Australia AND developing management strategies to minimise the effects of these problems. Use examples to support your answer.
9
Question 35 continues on page 35

Do
NO
T w
rite
in
th
is a
rea
.
Question 35 (continued)
.........................................................................................................................................
.........................................................................................................................................
.........................................................................................................................................
.........................................................................................................................................
.........................................................................................................................................
.........................................................................................................................................
.........................................................................................................................................
.........................................................................................................................................
.........................................................................................................................................
.........................................................................................................................................
.........................................................................................................................................
.........................................................................................................................................
.........................................................................................................................................
.........................................................................................................................................
.........................................................................................................................................
.........................................................................................................................................
.........................................................................................................................................
.........................................................................................................................................
.........................................................................................................................................
.........................................................................................................................................
.........................................................................................................................................
.........................................................................................................................................
.........................................................................................................................................
.........................................................................................................................................
.........................................................................................................................................
.........................................................................................................................................
End of paper
– 35 – Office Use Only – Do NOT write anything, or make any marks below this line. 2306310364

Section II extra writing space
If you use this space, clearly indicate which question you are answering.
Do
NO
T w
rite in
this a
rea
.
– 36 – © 2019 NSW Education Standards Authority
Office Use Only – Do NOT write anything, or make any marks below this line. 2770310369

2019 HIGHER SCHOOL CERTIFICATE EXAMINATION
Earth and Environmental Science Geological Time Scale
EON ERA PERIOD EPOCH
Ma
BP
0
2
5
10
20
30
40
50
60
70
100
200
300
400
500
600
1000
2000
3000
4000 Hadean
Archaean
Oligocene
Eocene
Pliocene
PleistoceneQuaternary
Neogene
Cretaceous
Paleogene
Permian
Jurassic
Triassic
Devonian Silurian
Ordovician
Cambrian
Ediacaran
Carboniferous
Miocene
Palaeocene
Prot
eroz
oic
Prec
ambr
ian
Phan
eroz
oic
Cen
ozoi
cPa
laeo
zoic
Neo
pro
tero
zoic
M
esoz
oic
Holocene
2052 – 1 –

BLANK PAGE
– 2 –
© 2019 NSW Education Standards Authority