Upload
others
View
2
Download
0
Embed Size (px)
Citation preview

copy 2019 Lawson Products Inc All rights reserved Confidential Material Reproduction In Whole or in Part Prohibited
Investor Presentation
Third Quarter 2019
Presenters Michael DeCata President amp CEORonald Knutson EVP amp CFO
copy 2019 Lawson Products Inc All rights reserved Confidential Material Reproduction In Whole or in Part Prohibited
Safe Harbor Statement under the Securities Litigation Reform Act of 1995
This presentation contains certain forward-looking statements within the meaning of the Private SecuritiesLitigation Reform Act of 1995 that involve risks and uncertainties The terms ldquomayrdquo ldquoshouldrdquo ldquocouldrdquoldquoanticipaterdquo ldquobelieverdquo ldquocontinuesrdquo ldquoestimaterdquo ldquoexpectrdquo ldquointendrdquo ldquoobjectiverdquo ldquoplanrdquo ldquopotentialrdquo ldquoprojectrdquoand similar expressions are intended to identify forward-looking statements These statements are notguarantees of future performance and involve risks uncertainties and assumptions that are difficult to predictThese statements are based on managementrsquos current expectations intentions or beliefs and are subject to anumber of factors assumptions and uncertainties that could cause actual results to differ materially fromthose described in the forward-looking statements Factors that could cause or contribute to such differencesor that might otherwise impact the business include failure to retain a talented workforce including productivesales representatives the inability of management to successfully implement strategic initiatives failure tomanage change the ability to adequately fund our operating and working capital needs through cashgenerated from operations the ability to meet the covenant requirements of our line of credit disruptions ofthe Companyrsquos information and communication systems the effect of general economic and marketconditions inventory obsolescence work stoppages and other disruptions at transportation centers orshipping ports changing customer demand and product mixes increases in commodity prices violations ofenvironmental protection regulations a negative outcome related to tax matters and all other factorsdiscussed in the Companyrsquos ldquoRisk Factorsrdquo set forth in its Annual Report on Form 10-K for the year endedDecember 31 2018
The Company undertakes no obligation to update any such factors or to publicly announce the results of anyrevisions to any forward-looking statements contained herein whether as a result of new information futureevents or otherwise
Lawson Products Inc
2
copy 2019 Lawson Products Inc All rights reserved Confidential Material Reproduction In Whole or in Part Prohibited
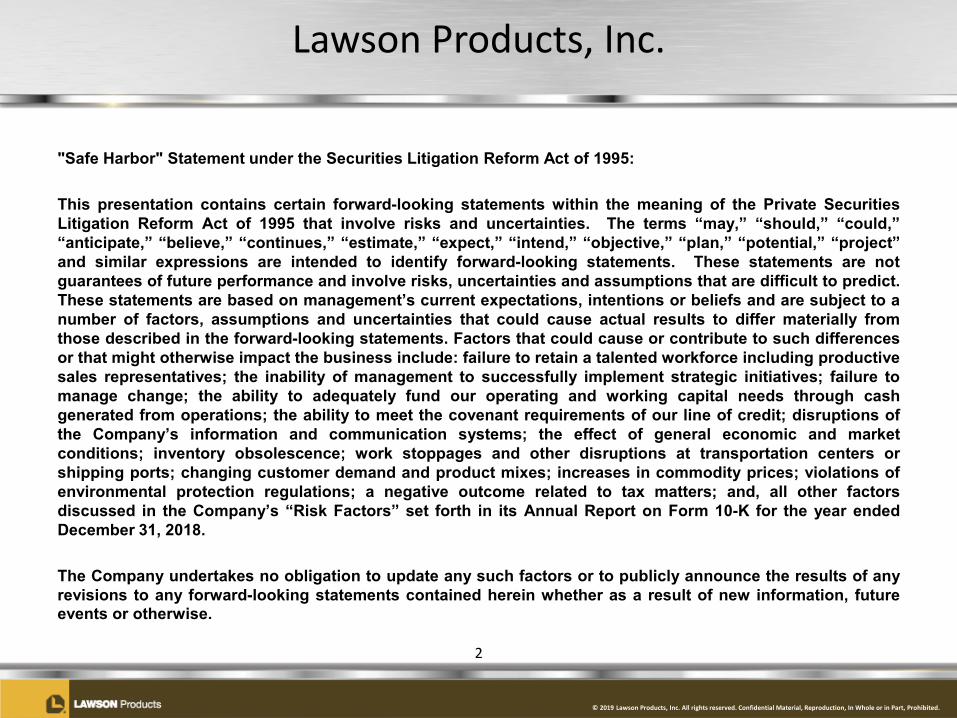
bull Leading service based provider of consumables in MRO marketbull Serves industrial commercial institutional and government markets in all 50
states Canada Mexico Puerto Rico and the Caribbeanbull Headquartered in Chicago IL
ndash Strategically located distribution centersndash Workforce ~1600 (~ 1000 sales reps)
bull Supplies a comprehensive line of products to the MRO marketplacebull VMI and private label drives high gross margins
Lawson Products At a Glance
Fasteners Cutting Tools Chemicals Hydraulics Other
3
copy 2019 Lawson Products Inc All rights reserved Confidential Material Reproduction In Whole or in Part Prohibited
Competitive Advantages and Differentiators
What differentiates Lawsonbull Service intensive ldquohigh touchrdquo
value propositionbull Vendor managed inventory or
ldquokeep fillrdquobull Deep product knowledge bull Broad geographic sales and
service coverage throughout the US and Canada
bull Leverage investments in sales team facilities and technology to enable outstanding customer service
bull Lowest total cost
4
copy 2019 Lawson Products Inc All rights reserved Confidential Material Reproduction In Whole or in Part Prohibited
Our Commitment to our 70000+ Customers
High touch service and technical expertise drives customer relationshipsBefore After
One Company Zero Headaches Inventory Management Options Access to Industry Knowledge amp Expertise
bull Comprehensive line of products bull Lawson Managed Inventory bull Product recommendations from your Lawson Representative
bull Hundreds of pre-built assortments bull Industrial vending bull Application advice from our test and application engineers
bull Unlimited sourcing of hard-to-find items
bull Self-service inventory management
bull Complimentary on-site safety amp product usage training
5
copy 2019 Lawson Products Inc All rights reserved Confidential Material Reproduction In Whole or in Part Prohibited
Customer and Product Profile
6
Retain over 90 of customer revenues from year to year
Fastening Systems
23
Fluid Power15
Specialty Chemicals
12
Cutting Tools and Abrasives
13
Electrical11
Aftermarket Automotive
Supplies8
Safety5
Welding and Metal Repair
2
Other10
Product Mix
Regional Accounts
47
Strategic14
Kent Automotive
15
Bolt Supply11
Government 11
Other2
Customer Mix
copy 2019 Lawson Products Inc All rights reserved Confidential Material Reproduction In Whole or in Part Prohibited
Lawson Growth Strategy
Sales Growth Driven By
Foundational SupportERP Network
OptimizationSales
TransformationLean Six Sigma
Website
7
New Sales Reps
Sales RepProductivity
Acquisitions
copy 2019 Lawson Products Inc All rights reserved Confidential Material Reproduction In Whole or in Part Prohibited
2019 Focus Actions Across the Value Chain Driving Growth
Add New Sales Reps and Drive Rep Productivity
Sales Process Sales Reps
Customer Service Order
Entry
ProductManagement
PricingDC Operations Sourcing
Purchasing
bull Increase sales rep count
bull Onboardingprocesstraining
bull SalesManagement dashboard
bull EDI with customers
bull Reduction of cycle times
bull Order padbull Consolidation of
shipmentsbull Sales service reps
bull Leverage vendor drop-ship programs
bull Fleet maintenance focus
bull Pricing enhancements
bull Website
bull Reduce cycle timebull Refine ldquoPullrdquo
strategybull Freight
enhancementsbull Minimize
backordersbull Improve service
levelsbull Forecasting tool
bull Supplier negotiation process
bull Vendor metricsbull Electronic
communication
Information Technology ndash Integration of Web and SAPLean Six Sigma
8
copy 2019 Lawson Products Inc All rights reserved Confidential Material Reproduction In Whole or in Part Prohibited
Longer Sales Rep Tenure Drives Rep Productivity
9
$0
$50000
$100000
$150000
$200000
$250000
$300000
$350000
$400000
$450000
$500000
lt 12 Mos 1 - 2 Yrs 3 - 5 Yrs 5 - 10 Yrs gt 10 Yrs0
50
100
150
200
250
300
350
Aver
age
Annu
al S
ales
Tenure With Lawson (as of 93019)
Num
ber O
f Sal
es R
eps
Number of Reps Average Annual Sales
copy 2019 Lawson Products Inc All rights reserved Confidential Material Reproduction In Whole or in Part Prohibited
Historical Financial Performance
Recent sales growth and earnings expansion providing financial flexibility
10
$200000
$250000
$300000
$350000
$400000
2014 2015 2016 2017 2018 TTM93019
Consolidated Revenues
$0$5000
$10000$15000$20000$25000$30000$35000
2014 2015 2016 2017 2018 TTM93019
Adjusted Reg G EBITDA
-$15000
-$10000
-$5000
$0
$5000
$10000
$15000
2014 2015 2016 2017 2018 9302019
Net Cash(Debt)
$0
$2000
$4000
$6000
$8000
$10000
$12000
Q1 Q2 Q3 Q4
Quarterly Adjusted Reg G EBITDA
2017
20172017
2017
2018
20182018
2018
20192019
2019
copy 2019 Lawson Products Inc All rights reserved Confidential Material Reproduction In Whole or in Part Prohibited
Financial Highlights for Third Quarter 2019
bull Sales increased 71 YOY (74 excluding currency fluctuation)
bull MRO LawsonKent gross margins consistent at 609
bull Adjusted Reg G EBITDA margin improving 109 in Q3 2019 v 83 in Q3 2018 Continued investment in new sales reps and rep productivity
bull Key trends MRO operating leverage of 54 13 increase in sales rep productivity Continued government strength +30 YOY Growth across multiple segments and product categories Cash flow from operations of $103 million in Q3
11
copy 2019 Lawson Products Inc All rights reserved Confidential Material Reproduction In Whole or in Part Prohibited
Pursue Disciplined MampA
Reinvest for Growth
Return Capital
bull Increased our borrowing capacity to $1000 million (additional $500 million accordion) with our new borrowing agreement
bull Capital expenditures expected to be $20 - $30 million in 2019bull Growth initiatives add new reps and increase sales rep productivity
bull Share repurchase to offset award dilution opportunistic purchasesbull $75 million stock repurchase program announced on May 16 2019 $63
million remaining after repurchase of shares worth $12 million in August 2019
bull Bolt-on acquisitions to enhance core growth strategiesbull Closed Screw Products Inc acquisition on 10118
Maintain Strong Balance Sheet
bull $86 million cash on hand and positive cash position of $64 million at the end of Q3
bull Consistent free cash flow generation
Capital Allocation Priorities
12
copy 2019 Lawson Products Inc All rights reserved Confidential Material Reproduction In Whole or in Part Prohibited
Lawson Products Poised for Growth
bull Leverage Current Infrastructure
bull Continued Sales Growth
bull Foundational Investments Completed
bull Operational Excellence
bull Large Fragmented Market
13
copy 2019 Lawson Products Inc All rights reserved Confidential Material Reproduction In Whole or in Part Prohibited
For More Information
Contact
Ronald J KnutsonEVP CFOInvestor Relations(773) 304-5665ronknutsonlawsonproductscom
And see our Website athttpwwwlawsonproductscomcompany-infoinvestor-relationsjsp
14
copy 2019 Lawson Products Inc All rights reserved Confidential Material Reproduction In Whole or in Part Prohibited
Appendices
15
copy 2019 Lawson Products Inc All rights reserved Confidential Material Reproduction In Whole or in Part Prohibited
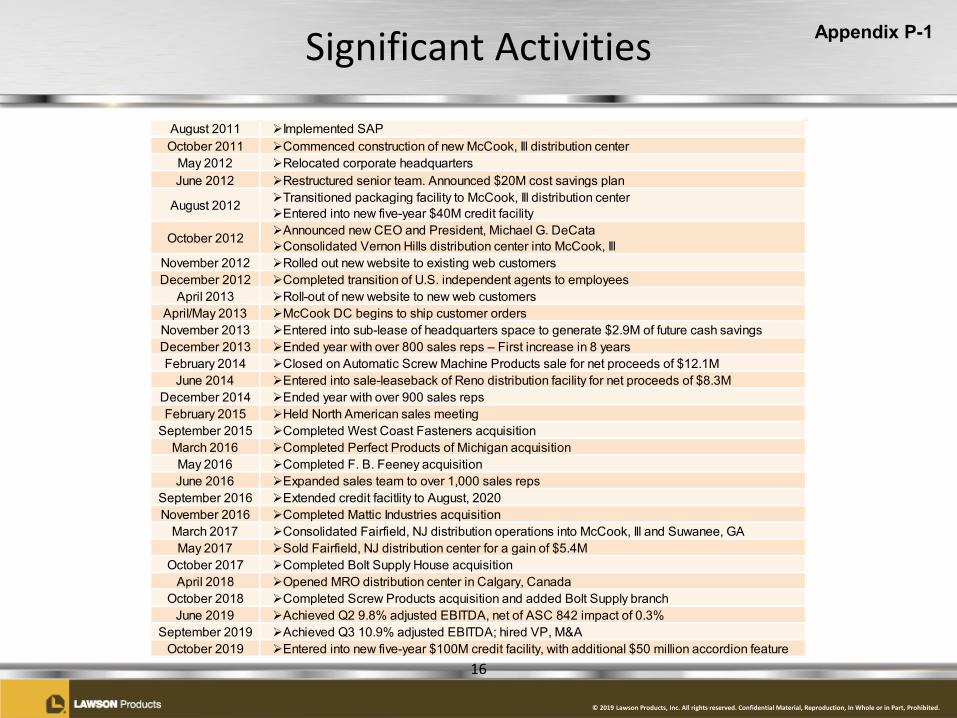
Significant Activities
16
Appendix P-1
August 2011 Implemented SAPOctober 2011 Commenced construction of new McCook Ill distribution center
May 2012 Relocated corporate headquartersJune 2012 Restructured senior team Announced $20M cost savings plan
Transitioned packaging facility to McCook Ill distribution centerEntered into new five-year $40M credit facilityAnnounced new CEO and President Michael G DeCataConsolidated Vernon Hills distribution center into McCook Ill
November 2012 Rolled out new website to existing web customersDecember 2012 Completed transition of US independent agents to employees
April 2013 Roll-out of new website to new web customersAprilMay 2013 McCook DC begins to ship customer ordersNovember 2013 Entered into sub-lease of headquarters space to generate $29M of future cash savingsDecember 2013 Ended year with over 800 sales reps ndash First increase in 8 yearsFebruary 2014 Closed on Automatic Screw Machine Products sale for net proceeds of $121M
June 2014 Entered into sale-leaseback of Reno distribution facility for net proceeds of $83MDecember 2014 Ended year with over 900 sales repsFebruary 2015 Held North American sales meeting
September 2015 Completed West Coast Fasteners acquisitionMarch 2016 Completed Perfect Products of Michigan acquisitionMay 2016 Completed F B Feeney acquisitionJune 2016 Expanded sales team to over 1000 sales reps
September 2016 Extended credit facitlity to August 2020November 2016 Completed Mattic Industries acquisition
March 2017 Consolidated Fairfield NJ distribution operations into McCook Ill and Suwanee GAMay 2017 Sold Fairfield NJ distribution center for a gain of $54M
October 2017 Completed Bolt Supply House acquisitionApril 2018 Opened MRO distribution center in Calgary Canada
October 2018 Completed Screw Products acquisition and added Bolt Supply branchJune 2019 Achieved Q2 98 adjusted EBITDA net of ASC 842 impact of 03
September 2019 Achieved Q3 109 adjusted EBITDA hired VP MampAOctober 2019 Entered into new five-year $100M credit facility with additional $50 million accordion feature
August 2012
October 2012
Adjusted EBITDA $ in 000s
Adjusted EBITDA Q4 2016Q1 2017Q2 2017Q3 2017Q4 201722192852451954433026
Adjusted EBITDA of Sales
Adjusted EBITDA of SalesQ3 2016Q4 2016Q1 2017Q2 2017Q3 2017Q4 201760926793828971926E-232964421005719377E-23822185292895721E-260248513452257152E-271948817596594883E-237528059231332088E-2
Adjusted Operating Income of Sales
Adjusted Operating IncomeQ3 2016Q4 2016Q1 2017Q2 2017Q3 2017Q4 201723045391147287538521196
Adjusted Op Inc $ in 000s
Adjusted EBITDA Q4 2016Q1 2017Q2 2017Q3 2017Q4 20175391147287538521196
Net Sales by Quarter $ in 000s
Net SalesQ1 2013Q2 2013Q3 2013Q4 2013Q1 2014Q2 2014Q3 2014Q4 2014Q1 2015672136831768235657386920472080741287028169904
Adjusted SGampA $ in 000s
Adjusted SGampA Q4 2015Q1 2016Q2 2016Q3 2016Q4 2016Q1 2017Q2 2017Q3 2017Q4 2017391634230341839404474008543732422664243946222
copy 2019 Lawson Products Inc All rights reserved Confidential Material Reproduction In Whole or in Part Prohibited
Regulation G ndash GAAP ReconciliationAppendix P-2
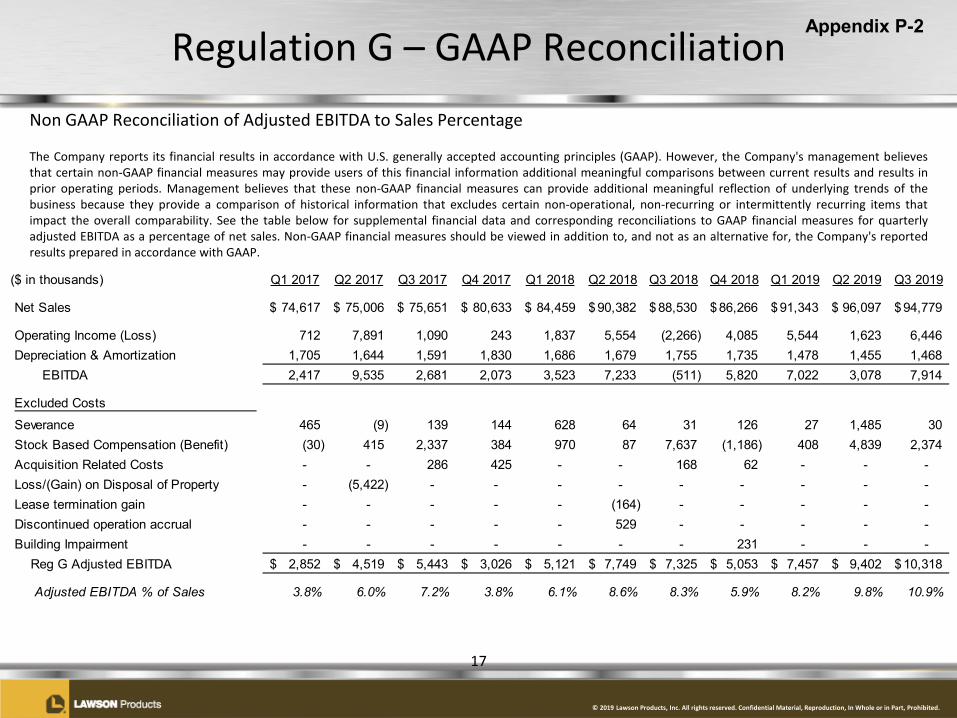
Non GAAP Reconciliation of Adjusted EBITDA to Sales Percentage
The Company reports its financial results in accordance with US generally accepted accounting principles (GAAP) However the Companys management believesthat certain non-GAAP financial measures may provide users of this financial information additional meaningful comparisons between current results and results inprior operating periods Management believes that these non-GAAP financial measures can provide additional meaningful reflection of underlying trends of thebusiness because they provide a comparison of historical information that excludes certain non-operational non-recurring or intermittently recurring items thatimpact the overall comparability See the table below for supplemental financial data and corresponding reconciliations to GAAP financial measures for quarterlyadjusted EBITDA as a percentage of net sales Non-GAAP financial measures should be viewed in addition to and not as an alternative for the Companys reportedresults prepared in accordance with GAAP
17
($ in thousands) Q1 2017 Q2 2017 Q3 2017 Q4 2017 Q1 2018 Q2 2018 Q3 2018 Q4 2018 Q1 2019 Q2 2019 Q3 2019
Net Sales 74617$ 75006$ 75651$ 80633$ 84459$ 90382$ 88530$ 86266$ 91343$ 96097$ 94779$
Operating Income (Loss) 712 7891 1090 243 1837 5554 (2266) 4085 5544 1623 6446 Depreciation amp Amortization 1705 1644 1591 1830 1686 1679 1755 1735 1478 1455 1468 EBITDA 2417 9535 2681 2073 3523 7233 (511) 5820 7022 3078 7914
Excluded CostsSeverance 465 (9) 139 144 628 64 31 126 27 1485 30 Stock Based Compensation (Benefit) (30) 415 2337 384 970 87 7637 (1186) 408 4839 2374 Acquisition Related Costs - - 286 425 - - 168 62 - - - Loss(Gain) on Disposal of Property - (5422) - - - - - - - - - Lease termination gain - - - - - (164) - - - - - Discontinued operation accrual - - - - - 529 - - - - - Building Impairment - - - - - - - 231 - - - Reg G Adjusted EBITDA 2852$ 4519$ 5443$ 3026$ 5121$ 7749$ 7325$ 5053$ 7457$ 9402$ 10318$
Adjusted EBITDA of Sales 38 60 72 38 61 86 83 59 82 98 109
Customer Mix
Regional Accounts48
Kent Automotive16
Regional AccountsStrategicKent AutomotiveBolt SupplyGovernment Screw ProductsOther047014000000000000001016011010002
ampDampF ampA
Product Mix
Fastening Systems23
Specialty Chemicals12
Fastening SystemsFluid PowerSpecialy ChemicalsCutting Tools and AbrasivesElectricalAftermarket Automotive SuppliesSafetyWelding and Metal RepairOther02401501201301100800500201
Number Of Sales Reps
Tenure With Lawson (as of 63019)
Average Annual Sales
Consolidated Revenues
Consolidated Revenues20142015201620172018TTM 63019285693275834276573305907349637362236Net Cash(Debt)2014201520162017201843646420798409580-101271060-1908Rep Count201320142015201620172018436468069169371009983994982
Adjusted Reg G EBITDA
Adjusted EBITDA20142015201620172018TTM 63019136581719912065158402524829237
Quarterly Adjusted Reg G EBITDA
2017Q1Q2Q3Q428524519544330262018Q1Q2Q3Q451217749732550532019Q1Q2Q3Q474579402
Adjusted EBITDA $ in 000s
Reg G Adjusted EBITDA Q1 2017Q2 2017Q3 2017Q4 20172852451954433026
Adjusted EBITDA of Sales
Adjusted EBITDA of SalesQ1 2017Q2 2017Q3 2017Q4 20173822185292895721E-260248513452257152E-271948817596594883E-237528059231332088E-2
Adjusted Operating Income of Sales
Adjusted Operating IncomeQ1 2017Q2 2017Q3 2017Q4 2017
Adjusted Op Inc $ in 000s
Reg G Adjusted EBITDA Q1 2017Q2 2017Q3 2017Q4 2017
copy 2019 Lawson Products Inc All rights reserved Confidential Material Reproduction In Whole or in Part Prohibited
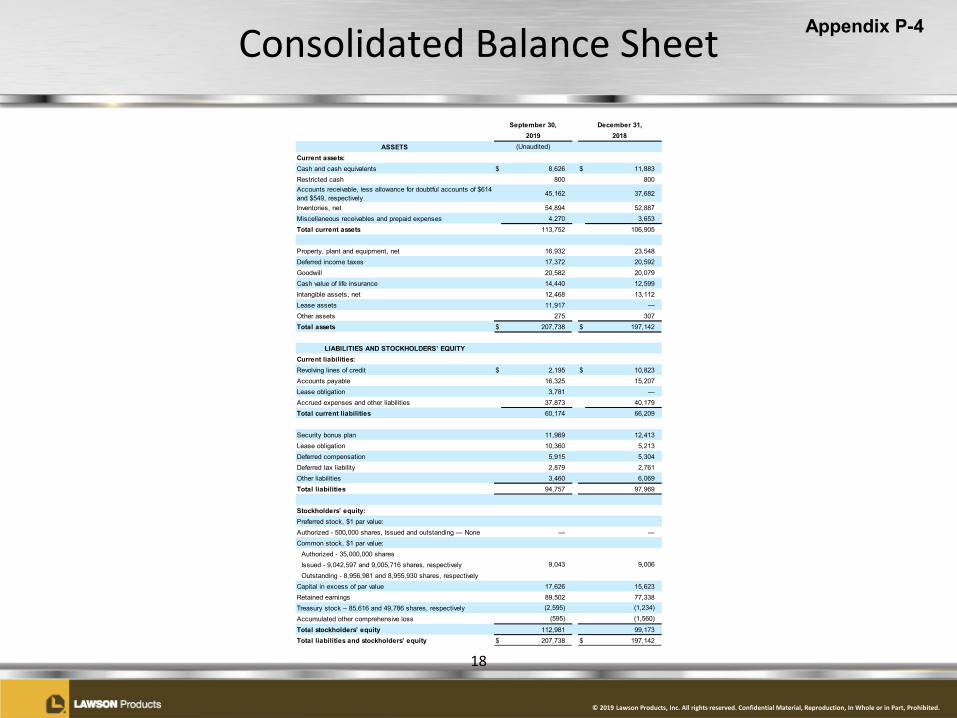
Consolidated Balance Sheet Appendix P-4
18
ASSETSCurrent assetsCash and cash equivalents $ 8626 $ 11883Restricted cash 800 800Accounts receivable less allowance for doubtful accounts of $614 and $549 respectively
45162 37682
Inventories net 54894 52887Miscellaneous receivables and prepaid expenses 4270 3653Total current assets 113752 106905
Property plant and equipment net 16932 23548Deferred income taxes 17372 20592Goodwill 20582 20079Cash value of life insurance 14440 12599Intangible assets net 12468 13112Lease assets 11917 mdashOther assets 275 307Total assets $ 207738 $ 197142
LIABILITIES AND STOCKHOLDERSrsquo EQUITYCurrent liabilitiesRevolving lines of credit $ 2195 $ 10823Accounts payable 16325 15207Lease obligation 3781 mdashAccrued expenses and other liabilities 37873 40179Total current liabilities 60174 66209
Security bonus plan 11969 12413Lease obligation 10360 5213Deferred compensation 5915 5304Deferred tax liability 2879 2761Other liabilities 3460 6069Total liabilities 94757 97969
Stockholdersrsquo equityPreferred stock $1 par valueAuthorized - 500000 shares Issued and outstanding mdash None mdash mdashCommon stock $1 par value
Authorized - 35000000 sharesIssued - 9042597 and 9005716 shares respectivelyOutstanding - 8956981 and 8955930 shares respectively
Capital in excess of par value 17626 15623Retained earnings 89502 77338Treasury stock ndash 85616 and 49786 shares respectivelyAccumulated other comprehensive lossTotal stockholdersrsquo equity 112981 99173Total liabilities and stockholdersrsquo equity $ 207738 $ 197142
September 30 December 312019 2018
(Unaudited)
(2595) (1234)(595) (1560)
9043 9006
Customer Mix
Regional Accounts48
Kent Automotive16
Regional AccountsStrategicKent AutomotiveBolt SupplyGovernment Screw ProductsOther0470140000000000000010150110110002
ampDampF ampA
Product Mix
Fastening Systems23
Specialty Chemicals12
Fastening SystemsFluid PowerSpecialy ChemicalsCutting Tools and AbrasivesElectricalAftermarket Automotive SuppliesSafetyWelding and Metal RepairOther02401501201301100800500201
Number Of Sales Reps
Tenure With Lawson (as of 63019)
Average Annual Sales
Consolidated Revenues
Consolidated Revenues20142015201620172018TTM 93019285693275834276573305907349637368485Net Cash(Debt)2014201520162017201843738420798409580-1012710606431Rep Count201320142015201620172018437388069169371009983994993
Adjusted Reg G EBITDA
Adjusted EBITDA20142015201620172018TTM 93019136581719912065158402524832230
Quarterly Adjusted Reg G EBITDA
2017Q1Q2Q3Q428524519544330262018Q1Q2Q3Q451217749732550532019Q1Q2Q3Q47457940210318
Adjusted EBITDA $ in 000s
Reg G Adjusted EBITDA Q1 2017Q2 2017Q3 2017Q4 20172852451954433026
Adjusted EBITDA of Sales
Adjusted EBITDA of SalesQ1 2017Q2 2017Q3 2017Q4 20173822185292895721E-260248513452257152E-271948817596594883E-237528059231332088E-2
Adjusted Operating Income of Sales
Adjusted Operating IncomeQ1 2017Q2 2017Q3 2017Q4 2017
Adjusted Op Inc $ in 000s
Reg G Adjusted EBITDA Q1 2017Q2 2017Q3 2017Q4 2017
| September 30 | December 31 | ||||||||||
| 2019 | 2018 | ||||||||||
| ASSETS | (Unaudited) | ||||||||||
| Current assets | |||||||||||
| Cash and cash equivalents | $ | 8626 | $ | 11883 | |||||||
| Restricted cash | 800 | 800 | |||||||||
| Accounts receivable less allowance for doubtful accounts of $614 and $549 respectively | 45162 | 37682 | |||||||||
| Inventories net | 54894 | 52887 | |||||||||
| Miscellaneous receivables and prepaid expenses | 4270 | 3653 | |||||||||
| Total current assets | 113752 | 106905 | |||||||||
| Property plant and equipment net | 16932 | 23548 | |||||||||
| Deferred income taxes | 17372 | 20592 | |||||||||
| Goodwill | 20582 | 20079 | |||||||||
| Cash value of life insurance | 14440 | 12599 | |||||||||
| Intangible assets net | 12468 | 13112 | |||||||||
| Lease assets | 11917 | mdash | |||||||||
| Other assets | 275 | 307 | |||||||||
| Total assets | $ | 207738 | $ | 197142 | |||||||
| LIABILITIES AND STOCKHOLDERSrsquo EQUITY | |||||||||||
| Current liabilities | |||||||||||
| Revolving lines of credit | $ | 2195 | $ | 10823 | |||||||
| Accounts payable | 16325 | 15207 | |||||||||
| Lease obligation | 3781 | mdash | |||||||||
| Accrued expenses and other liabilities | 37873 | 40179 | |||||||||
| Total current liabilities | 60174 | 66209 | |||||||||
| Security bonus plan | 11969 | 12413 | |||||||||
| Lease obligation | 10360 | 5213 | |||||||||
| Deferred compensation | 5915 | 5304 | |||||||||
| Deferred tax liability | 2879 | 2761 | |||||||||
| Other liabilities | 3460 | 6069 | |||||||||
| Total liabilities | 94757 | 97969 | |||||||||
| Stockholdersrsquo equity | |||||||||||
| Preferred stock $1 par value | |||||||||||
| Authorized - 500000 shares Issued and outstanding mdash None | mdash | mdash | |||||||||
| Common stock $1 par value | |||||||||||
| Authorized - 35000000 shares | 9043 | 9006 | |||||||||
| Issued - 9042597 and 9005716 shares respectively | |||||||||||
| Outstanding - 8956981 and 8955930 shares respectively | |||||||||||
| Capital in excess of par value | 17626 | 15623 | |||||||||
| Retained earnings | 89502 | 77338 | |||||||||
| Treasury stock ndash 85616 and 49786 shares respectively | (2595) | (1234) | |||||||||
| Accumulated other comprehensive loss | (595) | (1560) | |||||||||
| Total stockholdersrsquo equity | 112981 | 99173 | |||||||||
| Total liabilities and stockholdersrsquo equity | $ | 207738 | $ | 197142 | |||||||
| Three Months Ended | |||||||||||||||||||||||||||||
| Jun 30 2019 | Mar 31 2019 | Dec 31 2018 | Sep 30 2018 | Jun 30 2018 | |||||||||||||||||||||||||
| Average daily net sales | $ | 1502 | $ | 1450 | $ | 1414 | $ | 1405 | $ | 1412 | |||||||||||||||||||
| Year over year increase | 63 | 82 | 70 | 170 | 205 | ||||||||||||||||||||||||
| Sequential quarter increase (decrease) | 36 | 25 | 06 | (05) | 53 | ||||||||||||||||||||||||
| Net Sales | $ | 96097 | $ | 91343 | $ | 86266 | $ | 88530 | $ | 90382 | |||||||||||||||||||
| Gross profit (1) | 51043 | 48923 | 46083 | 48108 | 49131 | ||||||||||||||||||||||||
| Gross profit percentage (1) | 531 | 536 | 534 | 543 | 544 | ||||||||||||||||||||||||
| Selling general amp administrative expenses | $ | 49420 | $ | 43379 | $ | 41998 | $ | 50374 | $ | 43577 | |||||||||||||||||||
| Operating income (loss) | $ | 1623 | $ | 5544 | $ | 4085 | $ | (2266) | $ | 5554 | |||||||||||||||||||
| Full Year | |||||||||||||||||||||||||||||||||||||||||||||||||||||||||||||||||||||||||||
| ($ in thousands) | Q1 2011 | Q2 2011 | Q3 2011 | Q4 2011 | Q1 2012 | Q2 2012 | Q3 2012 | Q4 2012 | Q1 2013 | Q2 2013 | Q3 2013 | Q4 2013 | Q1 2014 | Q2 2014 | Q3 2014 | Q4 2014 | Q1 2015 | Q2 2015 | Q3 2015 | Q4 2015 | Q1 2016 | Q2 2016 | Q3 2016 | Q4 2016 | Q1 2017 | Q2 2017 | Q3 2017 | Q4 2017 | Q1 2018 | Q2 2018 | Q3 2018 | Q4 2018 | Q1 2019 | Q2 2019 | Q3 2019 | 2014 | 2015 | ||||||||||||||||||||||||||||||||||||||
| Net Sales | $ 79255 | $ 80625 | $ 71490 | $ 69029 | $ 71364 | $ 69830 | $ 67863 | $ 64505 | $ 67213 | $ 68317 | $ 68235 | $ 65738 | $ 69204 | $ 72080 | $ 74128 | $ 70281 | $ 69904 | $ 70726 | $ 70243 | $ 64961 | $ 69711 | $ 69348 | $ 70199 | $ 67315 | $ 74617 | $ 75006 | $ 75651 | $ 80633 | $ 84459 | $ 90382 | $ 88530 | $ 86266 | $ 91343 | $ 96097 | $ 94779 | $ 285693 | $ 275834 | ||||||||||||||||||||||||||||||||||||||
| Operating Income (Loss) | 3542 | 1397 | (3480) | (6995) | (3466) | (42084) | (1740) | 2057 | (3530) | (201) | 870 | (3002) | (4713) | 1241 | 678 | (2169) | (947) | 3243 | 2810 | (2985) | 1169 | 29 | 2389 | (5044) | 712 | 7891 | 1090 | 243 | 1837 | 5554 | (2266) | 4085 | 5544 | 1623 | 6446 | (4963) | 2121 | ||||||||||||||||||||||||||||||||||||||
| Depreciation amp Amortization | 1260 | 1315 | 1160 | 1675 | 1715 | 1566 | 1963 | 1841 | 2061 | 2244 | 2367 | 2358 | 2295 | 2163 | 2160 | 2133 | 2096 | 2126 | 2119 | 2202 | 2187 | 2226 | 1973 | 1680 | 1705 | 1644 | 1591 | 1830 | 1686 | 1679 | 1755 | 1735 | 1478 | 1455 | 1468 | 8751 | 8543 | ||||||||||||||||||||||||||||||||||||||
| EBITDA | 4802 | 2712 | (2320) | (5320) | (1751) | (40518) | 223 | 3898 | (1469) | 2043 | 3237 | (644) | (2418) | 3404 | 2838 | (36) | 1149 | 5369 | 4929 | (783) | 3356 | 2255 | 4362 | (3364) | 2417 | 9535 | 2681 | 2073 | 3523 | 7233 | (511) | 5820 | 7022 | 3078 | 7914 | 3788 | 10664 | ||||||||||||||||||||||||||||||||||||||
| Excluded Costs | |||||||||||||||||||||||||||||||||||||||||||||||||||||||||||||||||||||||||||
| Severance | 745 | 465 | 282 | 122 | 185 | 6585 | 1410 | (159) | - 0 | 2 | 962 | (127) | 728 | 290 | (328) | (59) | 571 | 50 | 372 | 280 | 204 | 143 | 367 | 1662 | 465 | (9) | 139 | 144 | 628 | 64 | 31 | 126 | 27 | 1485 | 30 | 631 | 1273 | ||||||||||||||||||||||||||||||||||||||
| Stock Based Compensation (Benefit) | 227 | (95) | (538) | 467 | 198 | (1015) | 77 | 434 | 1596 | 76 | 33 | 562 | 1125 | 408 | 2423 | 2443 | (541) | 971 | (30) | 1693 | (1217) | 515 | (630) | 3801 | (30) | 415 | 2337 | 384 | 970 | 87 | 7637 | (1186) | 408 | 4839 | 2374 | 6399 | 2093 | ||||||||||||||||||||||||||||||||||||||
| Acquisition Related Costs | - 0 | - 0 | - 0 | - 0 | - 0 | - 0 | 310 | 32 | 115 | 198 | 178 | 120 | - 0 | - 0 | 286 | 425 | - 0 | - 0 | 168 | 62 | - 0 | - 0 | - 0 | ||||||||||||||||||||||||||||||||||||||||||||||||||||
| ERP Implementation Costs | 1902 | 2388 | 2344 | 339 | - 0 | - 0 | - 0 | - 0 | - 0 | - 0 | - 0 | - 0 | - 0 | - 0 | - 0 | - 0 | - 0 | - 0 | - 0 | - 0 | - 0 | - 0 | - 0 | - 0 | - 0 | - 0 | - 0 | - 0 | - 0 | - 0 | - 0 | - 0 | - 0 | ||||||||||||||||||||||||||||||||||||||||||
| Loss(Gain) on Disposal of Property | - 0 | - 0 | - 0 | 22 | - 0 | (2122) | (11) | (1588) | - 0 | - 0 | (36) | 32 | - 0 | - 0 | 97 | 45 | - 0 | - 0 | (2) | 9 | - 0 | - 0 | - 0 | - 0 | - 0 | (5422) | - 0 | - 0 | - 0 | - 0 | - 0 | - 0 | - 0 | - 0 | - 0 | 142 | 7 | ||||||||||||||||||||||||||||||||||||||
| Legal Settlement | - 0 | - 0 | - 0 | - 0 | - 0 | - 0 | - 0 | - 0 | - 0 | - 0 | - 0 | - 0 | - 0 | - 0 | (688) | - 0 | - 0 | - 0 | - 0 | - 0 | - 0 | - 0 | - 0 | - 0 | - 0 | - 0 | - 0 | - 0 | - 0 | - 0 | - 0 | - 0 | (688) | - 0 | |||||||||||||||||||||||||||||||||||||||||
| Employment Tax Matter | - 0 | - 0 | - 0 | 1200 | - 0 | - 0 | - 0 | - 0 | - 0 | - 0 | - 0 | (400) | - 0 | - 0 | - 0 | - 0 | - 0 | - 0 | - 0 | - 0 | - 0 | - 0 | - 0 | - 0 | - 0 | - 0 | - 0 | - 0 | - 0 | - 0 | - 0 | - 0 | - 0 | - 0 | |||||||||||||||||||||||||||||||||||||||||
| Lease termination gain | - 0 | - 0 | - 0 | - 0 | - 0 | - 0 | - 0 | - 0 | - 0 | - 0 | - 0 | 2928 | - 0 | - 0 | - 0 | - 0 | - 0 | - 0 | - 0 | - 0 | - 0 | - 0 | - 0 | - 0 | - 0 | - 0 | - 0 | - 0 | - 0 | (164) | - 0 | - 0 | - 0 | - 0 | - 0 | - 0 | - 0 | ||||||||||||||||||||||||||||||||||||||
| Goodwill Impairment | - 0 | - 0 | - 0 | - 0 | - 0 | 28306 | - 0 | - 0 | - 0 | - 0 | - 0 | - 0 | - 0 | - 0 | - 0 | - 0 | - 0 | - 0 | - 0 | - 0 | - 0 | - 0 | - 0 | - 0 | - 0 | - 0 | - 0 | - 0 | - 0 | - 0 | - 0 | - 0 | - 0 | - 0 | |||||||||||||||||||||||||||||||||||||||||
| Inventory Rationalization | - 0 | - 0 | - 0 | - 0 | - 0 | 3893 | - 0 | - 0 | - 0 | - 0 | - 0 | - 0 | - 0 | - 0 | - 0 | - 0 | - 0 | - 0 | - 0 | - 0 | - 0 | - 0 | - 0 | - 0 | - 0 | - 0 | - 0 | - 0 | - 0 | - 0 | - 0 | - 0 | - 0 | - 0 | |||||||||||||||||||||||||||||||||||||||||
| Discontinued operation accrual | - 0 | - 0 | - 0 | - 0 | - 0 | - 0 | - 0 | - 0 | - 0 | - 0 | - 0 | - 0 | - 0 | - 0 | - 0 | 340 | - 0 | - 0 | - 0 | 931 | - 0 | - 0 | - 0 | - 0 | - 0 | - 0 | - 0 | - 0 | - 0 | 529 | - 0 | - 0 | - 0 | - 0 | - 0 | 340 | 931 | ||||||||||||||||||||||||||||||||||||||
| North American sales meeting | - 0 | - 0 | - 0 | - 0 | - 0 | - 0 | - 0 | - 0 | 1225 | - 0 | - 0 | - 0 | - 0 | - 0 | - 0 | - 0 | 1889 | - 0 | - 0 | - 0 | - 0 | - 0 | - 0 | - 0 | - 0 | - 0 | - 0 | - 0 | - 0 | - 0 | - 0 | - 0 | - 0 | 1889 | |||||||||||||||||||||||||||||||||||||||||
| Property Impairment Loss | - 0 | - 0 | - 0 | - 0 | - 0 | - 0 | - 0 | - 0 | - 0 | - 0 | - 0 | - 0 | 2914 | 132 | - 0 | - 0 | - 0 | - 0 | - 0 | - 0 | - 0 | - 0 | - 0 | - 0 | - 0 | - 0 | - 0 | - 0 | - 0 | - 0 | - 0 | - 0 | 3046 | - 0 | |||||||||||||||||||||||||||||||||||||||||
| Building Impairment | - 0 | - 0 | - 0 | - 0 | - 0 | - 0 | - 0 | 231 | - 0 | - 0 | - 0 | ||||||||||||||||||||||||||||||||||||||||||||||||||||||||||||||||
| Reg G Adjusted EBITDA | $ 7676 | $ 5470 | $ (232) | $ (3170) | $ (1368) | $ (4871) | $ 1699 | $ 2585 | $ 1352 | $ 2121 | $ 4196 | $ 2351 | $ 2349 | $ 4234 | $ 4342 | $ 2733 | $ 3068 | $ 6390 | $ 5579 | $ 2162 | $ 2458 | $ 3111 | $ 4277 | $ 2219 | $ 2852 | $ 4519 | $ 5443 | $ 3026 | $ 5121 | $ 7749 | $ 7325 | $ 5053 | $ 7457 | $ 9402 | $ 10318 | $ 13658 | $ 17199 | ||||||||||||||||||||||||||||||||||||||
| Adjusted EBITDA of Sales | 97 | 68 | -03 | -46 | -19 | -70 | 25 | 40 | 20 | 31 | 61 | 36 | 34 | 59 | 59 | 39 | 44 | 90 | 79 | 33 | 35 | 45 | 61 | 33 | 38 | 60 | 72 | 38 | 61 | 86 | 83 | 59 | 82 | 98 | 109 | 48 | 62 | ||||||||||||||||||||||||||||||||||||||
| Annual Adjusted EBITDA of Sales | 44 | 58 | |||||||||||||||||||||||||||||||||||||||||||||||||||||||||||||||||||||||||
| Adjusted Operating Income | (3083) | (6437) | (264) | 744 | (709) | (123) | 1829 | (7) | 54 | 2071 | 2182 | 600 | 972 | 4264 | 3460 | (40) | 271 | 885 | 2304 | 539 | 1147 | 2875 | 3852 | 1196 | 3435 | 6070 | 5570 | 3087 | 5979 | 7947 | 8850 | 4907 | 8314 | ||||||||||||||||||||||||||||||||||||||||||
| Consolidated Revenues | |||||||
| 2013 | 269503 | ||||||
| 2014 | 285693 | ||||||
| 2015 | 275834 | ||||||
| 2016 | 276573 | ||||||
| 2017 | 305907 | ||||||
| 2018 | 349637 | ||||||
| TTM 93019 | 368485 | ||||||
| Net Cash(Debt) | |||||||
| 2013 | (15380) | ||||||
| 2014 | 4207 | ||||||
| 2015 | 9840 | ||||||
| 2016 | 9580 | ||||||
| 2017 | (10127) | ||||||
| 2018 | 1060 | ||||||
| 93019 | 6431 | ||||||
| Rep Count | |||||||
| 2013 | 806 | ||||||
| 2014 | 916 | ||||||
| 2015 | 937 | ||||||
| 2016 | 1009 | ||||||
| 2017 | 983 | ||||||
| 2018 | 994 | ||||||
| 93019 | 993 | ||||||
| Adjusted OI | DampA | Adjusted EBITDA | |||||
| 2013 | 990 | 9030 | 10020 | ||||
| 2014 | 4907 | 8751 | 13658 | ||||
| 2015 | 8315 | 8543 | 17199 | ||||
| 2016 | 3388 | 8066 | 12065 | ||||
| 2017 | 15840 | ||||||
| 2018 | 25248 | ||||||
| TTM 93019 | 32230 | ||||||
| Reg G EBITDA By Quarter | |||||||
| Quarter | 2017 | 2018 | 2019 | ||||
| Q1 | 2852 | 5121 | 7457 | ||||
| Q2 | 4519 | 7749 | 9402 | ||||
| Q3 | 5443 | 7325 | 10318 | ||||
| Q4 | 3026 | 5053 |
| Months of Experience | Average Annual Sales | Number of Reps | |||
| lt 12 Mos | ERRORVALUE | ERRORVALUE | |||
| 1 - 2 Yrs | ERRORVALUE | ERRORVALUE | |||
| 3 - 5 Yrs | ERRORVALUE | ERRORVALUE | |||
| 5 - 10 Yrs | ERRORVALUE | ERRORVALUE | |||
| gt 10 Yrs | ERRORVALUE | ERRORVALUE | |||
| ERRORVALUE | |||||
| Excludes ISR MSS CRS | |||||
| Excludes Freight | |||||
| Product mix | ||||||||
| Verticals | Q3 2019 Sales | |||||||
| Fastening Systems | 240 | 22485606 | ||||||
| Fluid Power | 151 | 14156064 | ||||||
| Specialy Chemicals | 117 | 10917433 | ||||||
| Cutting Tools and Abrasives | 131 | 12296596 | ||||||
| Electrical | 104 | 9724849 | ||||||
| Aftermarket Automotive Supplies | 76 | 7154688 | ||||||
| Safety | 47 | 4445846 | ||||||
| Welding and Metal Repair | 13 | 1218030 | ||||||
| Other | 120 | 11237322 | ||||||
| Total | 100 | 93636434 | ||||||
| Verticals | YTD 2019 Sales | |||||||
| Fastening Systems | 24 | 66611555 | ||||||
| Fluid Power | 15 | 42224416 | ||||||
| Specialy Chemicals | 12 | 32166853 | ||||||
| Cutting Tools and Abrasives | 13 | 36587482 | ||||||
| Electrical | 11 | 30150144 | ||||||
| Aftermarket Automotive Supplies | 8 | 21960561 | ||||||
| Safety | 5 | 13072228 | ||||||
| Welding and Metal Repair | 2 | 4306548 | ||||||
| Other | 10 | 31279779 | ||||||
| Total | 100 | 278359566 |
| Lawson core customer mix | ||||||||
| Account Tyoe | Q3 | |||||||
| Regional Accounts | 43045893 | 45 | ||||||
| Strategic | 14086813 | 15 | ||||||
| Kent Automotive | 14300065 | 15 | ||||||
| Bolt Supply | 11318703 | 12 | ||||||
| Government | 10291732 | 11 | ||||||
| Screw Products | 0 | 0 | ||||||
| Other (1) | 1735236 | 2 | ||||||
| Total | 94778443 | 100 | ||||||
| Account Tyoe | YTD September | |||||||
| Regional Accounts | 131389537 | 47 | ||||||
| Strategic | 40364305 | 14 | ||||||
| Kent Automotive | 43371411 | 15 | ||||||
| Bolt Supply | 31324209 | 11 | ||||||
| Government | 29794959 | 11 | ||||||
| Screw Products | 0 | 0 | ||||||
| Other | 5974302 | 2 | ||||||
| Total | 282218723 | 100 | ||||||
| Total Reported |
| September 30 | December 31 | ||||||||||
| 2019 | 2018 | ||||||||||
| ASSETS | (Unaudited) | ||||||||||
| Current assets | |||||||||||
| Cash and cash equivalents | $ | 8626 | $ | 11883 | |||||||
| Restricted cash | 800 | 800 | |||||||||
| Accounts receivable less allowance for doubtful accounts of $614 and $549 respectively | 45162 | 37682 | |||||||||
| Inventories net | 54894 | 52887 | |||||||||
| Miscellaneous receivables and prepaid expenses | 4270 | 3653 | |||||||||
| Total current assets | 113752 | 106905 | |||||||||
| Property plant and equipment net | 16932 | 23548 | |||||||||
| Deferred income taxes | 17372 | 20592 | |||||||||
| Goodwill | 20582 | 20079 | |||||||||
| Cash value of life insurance | 14440 | 12599 | |||||||||
| Intangible assets net | 12468 | 13112 | |||||||||
| Lease assets | 11917 | mdash | |||||||||
| Other assets | 275 | 307 | |||||||||
| Total assets | $ | 207738 | $ | 197142 | |||||||
| LIABILITIES AND STOCKHOLDERSrsquo EQUITY | |||||||||||
| Current liabilities | |||||||||||
| Revolving lines of credit | $ | 2195 | $ | 10823 | |||||||
| Accounts payable | 16325 | 15207 | |||||||||
| Lease obligation | 3781 | mdash | |||||||||
| Accrued expenses and other liabilities | 37873 | 40179 | |||||||||
| Total current liabilities | 60174 | 66209 | |||||||||
| Security bonus plan | 11969 | 12413 | |||||||||
| Lease obligation | 10360 | 5213 | |||||||||
| Deferred compensation | 5915 | 5304 | |||||||||
| Deferred tax liability | 2879 | 2761 | |||||||||
| Other liabilities | 3460 | 6069 | |||||||||
| Total liabilities | 94757 | 97969 | |||||||||
| Stockholdersrsquo equity | |||||||||||
| Preferred stock $1 par value | |||||||||||
| Authorized - 500000 shares Issued and outstanding mdash None | mdash | mdash | |||||||||
| Common stock $1 par value | |||||||||||
| Authorized - 35000000 shares | 9043 | 9006 | |||||||||
| Issued - 9042597 and 9005716 shares respectively | |||||||||||
| Outstanding - 8956981 and 8955930 shares respectively | |||||||||||
| Capital in excess of par value | 17626 | 15623 | |||||||||
| Retained earnings | 89502 | 77338 | |||||||||
| Treasury stock ndash 85616 and 49786 shares respectively | (2595) | (1234) | |||||||||
| Accumulated other comprehensive loss | (595) | (1560) | |||||||||
| Total stockholdersrsquo equity | 112981 | 99173 | |||||||||
| Total liabilities and stockholdersrsquo equity | $ | 207738 | $ | 197142 | |||||||
| Three Months Ended | |||||||||||||||||||||||||||||
| Jun 30 2019 | Mar 31 2019 | Dec 31 2018 | Sep 30 2018 | Jun 30 2018 | |||||||||||||||||||||||||
| Average daily net sales | $ | 1502 | $ | 1450 | $ | 1414 | $ | 1405 | $ | 1412 | |||||||||||||||||||
| Year over year increase | 63 | 82 | 70 | 170 | 205 | ||||||||||||||||||||||||
| Sequential quarter increase (decrease) | 36 | 25 | 06 | (05) | 53 | ||||||||||||||||||||||||
| Net Sales | $ | 96097 | $ | 91343 | $ | 86266 | $ | 88530 | $ | 90382 | |||||||||||||||||||
| Gross profit (1) | 51043 | 48923 | 46083 | 48108 | 49131 | ||||||||||||||||||||||||
| Gross profit percentage (1) | 531 | 536 | 534 | 543 | 544 | ||||||||||||||||||||||||
| Selling general amp administrative expenses | $ | 49420 | $ | 43379 | $ | 41998 | $ | 50374 | $ | 43577 | |||||||||||||||||||
| Operating income (loss) | $ | 1623 | $ | 5544 | $ | 4085 | $ | (2266) | $ | 5554 | |||||||||||||||||||
| Full Year | |||||||||||||||||||||||||||||||||||||||||||||||||||||||||||||||||||||||||||
| ($ in thousands) | Q1 2011 | Q2 2011 | Q3 2011 | Q4 2011 | Q1 2012 | Q2 2012 | Q3 2012 | Q4 2012 | Q1 2013 | Q2 2013 | Q3 2013 | Q4 2013 | Q1 2014 | Q2 2014 | Q3 2014 | Q4 2014 | Q1 2015 | Q2 2015 | Q3 2015 | Q4 2015 | Q1 2016 | Q2 2016 | Q3 2016 | Q4 2016 | Q1 2017 | Q2 2017 | Q3 2017 | Q4 2017 | Q1 2018 | Q2 2018 | Q3 2018 | Q4 2018 | Q1 2019 | Q2 2019 | Q3 2019 | 2014 | 2015 | ||||||||||||||||||||||||||||||||||||||
| Net Sales | $ 79255 | $ 80625 | $ 71490 | $ 69029 | $ 71364 | $ 69830 | $ 67863 | $ 64505 | $ 67213 | $ 68317 | $ 68235 | $ 65738 | $ 69204 | $ 72080 | $ 74128 | $ 70281 | $ 69904 | $ 70726 | $ 70243 | $ 64961 | $ 69711 | $ 69348 | $ 70199 | $ 67315 | $ 74617 | $ 75006 | $ 75651 | $ 80633 | $ 84459 | $ 90382 | $ 88530 | $ 86266 | $ 91343 | $ 96097 | $ 94779 | $ 285693 | $ 275834 | ||||||||||||||||||||||||||||||||||||||
| Operating Income (Loss) | 3542 | 1397 | (3480) | (6995) | (3466) | (42084) | (1740) | 2057 | (3530) | (201) | 870 | (3002) | (4713) | 1241 | 678 | (2169) | (947) | 3243 | 2810 | (2985) | 1169 | 29 | 2389 | (5044) | 712 | 7891 | 1090 | 243 | 1837 | 5554 | (2266) | 4085 | 5544 | 1623 | 6446 | (4963) | 2121 | ||||||||||||||||||||||||||||||||||||||
| Depreciation amp Amortization | 1260 | 1315 | 1160 | 1675 | 1715 | 1566 | 1963 | 1841 | 2061 | 2244 | 2367 | 2358 | 2295 | 2163 | 2160 | 2133 | 2096 | 2126 | 2119 | 2202 | 2187 | 2226 | 1973 | 1680 | 1705 | 1644 | 1591 | 1830 | 1686 | 1679 | 1755 | 1735 | 1478 | 1455 | 1468 | 8751 | 8543 | ||||||||||||||||||||||||||||||||||||||
| EBITDA | 4802 | 2712 | (2320) | (5320) | (1751) | (40518) | 223 | 3898 | (1469) | 2043 | 3237 | (644) | (2418) | 3404 | 2838 | (36) | 1149 | 5369 | 4929 | (783) | 3356 | 2255 | 4362 | (3364) | 2417 | 9535 | 2681 | 2073 | 3523 | 7233 | (511) | 5820 | 7022 | 3078 | 7914 | 3788 | 10664 | ||||||||||||||||||||||||||||||||||||||
| Excluded Costs | |||||||||||||||||||||||||||||||||||||||||||||||||||||||||||||||||||||||||||
| Severance | 745 | 465 | 282 | 122 | 185 | 6585 | 1410 | (159) | - 0 | 2 | 962 | (127) | 728 | 290 | (328) | (59) | 571 | 50 | 372 | 280 | 204 | 143 | 367 | 1662 | 465 | (9) | 139 | 144 | 628 | 64 | 31 | 126 | 27 | 1485 | 30 | 631 | 1273 | ||||||||||||||||||||||||||||||||||||||
| Stock Based Compensation (Benefit) | 227 | (95) | (538) | 467 | 198 | (1015) | 77 | 434 | 1596 | 76 | 33 | 562 | 1125 | 408 | 2423 | 2443 | (541) | 971 | (30) | 1693 | (1217) | 515 | (630) | 3801 | (30) | 415 | 2337 | 384 | 970 | 87 | 7637 | (1186) | 408 | 4839 | 2374 | 6399 | 2093 | ||||||||||||||||||||||||||||||||||||||
| Acquisition Related Costs | - 0 | - 0 | - 0 | - 0 | - 0 | - 0 | 310 | 32 | 115 | 198 | 178 | 120 | - 0 | - 0 | 286 | 425 | - 0 | - 0 | 168 | 62 | - 0 | - 0 | - 0 | ||||||||||||||||||||||||||||||||||||||||||||||||||||
| ERP Implementation Costs | 1902 | 2388 | 2344 | 339 | - 0 | - 0 | - 0 | - 0 | - 0 | - 0 | - 0 | - 0 | - 0 | - 0 | - 0 | - 0 | - 0 | - 0 | - 0 | - 0 | - 0 | - 0 | - 0 | - 0 | - 0 | - 0 | - 0 | - 0 | - 0 | - 0 | - 0 | - 0 | - 0 | ||||||||||||||||||||||||||||||||||||||||||
| Loss(Gain) on Disposal of Property | - 0 | - 0 | - 0 | 22 | - 0 | (2122) | (11) | (1588) | - 0 | - 0 | (36) | 32 | - 0 | - 0 | 97 | 45 | - 0 | - 0 | (2) | 9 | - 0 | - 0 | - 0 | - 0 | - 0 | (5422) | - 0 | - 0 | - 0 | - 0 | - 0 | - 0 | - 0 | - 0 | - 0 | 142 | 7 | ||||||||||||||||||||||||||||||||||||||
| Legal Settlement | - 0 | - 0 | - 0 | - 0 | - 0 | - 0 | - 0 | - 0 | - 0 | - 0 | - 0 | - 0 | - 0 | - 0 | (688) | - 0 | - 0 | - 0 | - 0 | - 0 | - 0 | - 0 | - 0 | - 0 | - 0 | - 0 | - 0 | - 0 | - 0 | - 0 | - 0 | - 0 | (688) | - 0 | |||||||||||||||||||||||||||||||||||||||||
| Employment Tax Matter | - 0 | - 0 | - 0 | 1200 | - 0 | - 0 | - 0 | - 0 | - 0 | - 0 | - 0 | (400) | - 0 | - 0 | - 0 | - 0 | - 0 | - 0 | - 0 | - 0 | - 0 | - 0 | - 0 | - 0 | - 0 | - 0 | - 0 | - 0 | - 0 | - 0 | - 0 | - 0 | - 0 | - 0 | |||||||||||||||||||||||||||||||||||||||||
| Lease termination gain | - 0 | - 0 | - 0 | - 0 | - 0 | - 0 | - 0 | - 0 | - 0 | - 0 | - 0 | 2928 | - 0 | - 0 | - 0 | - 0 | - 0 | - 0 | - 0 | - 0 | - 0 | - 0 | - 0 | - 0 | - 0 | - 0 | - 0 | - 0 | - 0 | (164) | - 0 | - 0 | - 0 | - 0 | - 0 | - 0 | - 0 | ||||||||||||||||||||||||||||||||||||||
| Goodwill Impairment | - 0 | - 0 | - 0 | - 0 | - 0 | 28306 | - 0 | - 0 | - 0 | - 0 | - 0 | - 0 | - 0 | - 0 | - 0 | - 0 | - 0 | - 0 | - 0 | - 0 | - 0 | - 0 | - 0 | - 0 | - 0 | - 0 | - 0 | - 0 | - 0 | - 0 | - 0 | - 0 | - 0 | - 0 | |||||||||||||||||||||||||||||||||||||||||
| Inventory Rationalization | - 0 | - 0 | - 0 | - 0 | - 0 | 3893 | - 0 | - 0 | - 0 | - 0 | - 0 | - 0 | - 0 | - 0 | - 0 | - 0 | - 0 | - 0 | - 0 | - 0 | - 0 | - 0 | - 0 | - 0 | - 0 | - 0 | - 0 | - 0 | - 0 | - 0 | - 0 | - 0 | - 0 | - 0 | |||||||||||||||||||||||||||||||||||||||||
| Discontinued operation accrual | - 0 | - 0 | - 0 | - 0 | - 0 | - 0 | - 0 | - 0 | - 0 | - 0 | - 0 | - 0 | - 0 | - 0 | - 0 | 340 | - 0 | - 0 | - 0 | 931 | - 0 | - 0 | - 0 | - 0 | - 0 | - 0 | - 0 | - 0 | - 0 | 529 | - 0 | - 0 | - 0 | - 0 | - 0 | 340 | 931 | ||||||||||||||||||||||||||||||||||||||
| North American sales meeting | - 0 | - 0 | - 0 | - 0 | - 0 | - 0 | - 0 | - 0 | 1225 | - 0 | - 0 | - 0 | - 0 | - 0 | - 0 | - 0 | 1889 | - 0 | - 0 | - 0 | - 0 | - 0 | - 0 | - 0 | - 0 | - 0 | - 0 | - 0 | - 0 | - 0 | - 0 | - 0 | - 0 | 1889 | |||||||||||||||||||||||||||||||||||||||||
| Property Impairment Loss | - 0 | - 0 | - 0 | - 0 | - 0 | - 0 | - 0 | - 0 | - 0 | - 0 | - 0 | - 0 | 2914 | 132 | - 0 | - 0 | - 0 | - 0 | - 0 | - 0 | - 0 | - 0 | - 0 | - 0 | - 0 | - 0 | - 0 | - 0 | - 0 | - 0 | - 0 | - 0 | 3046 | - 0 | |||||||||||||||||||||||||||||||||||||||||
| Building Impairment | - 0 | - 0 | - 0 | - 0 | - 0 | - 0 | - 0 | 231 | - 0 | - 0 | - 0 | ||||||||||||||||||||||||||||||||||||||||||||||||||||||||||||||||
| Reg G Adjusted EBITDA | $ 7676 | $ 5470 | $ (232) | $ (3170) | $ (1368) | $ (4871) | $ 1699 | $ 2585 | $ 1352 | $ 2121 | $ 4196 | $ 2351 | $ 2349 | $ 4234 | $ 4342 | $ 2733 | $ 3068 | $ 6390 | $ 5579 | $ 2162 | $ 2458 | $ 3111 | $ 4277 | $ 2219 | $ 2852 | $ 4519 | $ 5443 | $ 3026 | $ 5121 | $ 7749 | $ 7325 | $ 5053 | $ 7457 | $ 9402 | $ 10318 | $ 13658 | $ 17199 | ||||||||||||||||||||||||||||||||||||||
| Adjusted EBITDA of Sales | 97 | 68 | -03 | -46 | -19 | -70 | 25 | 40 | 20 | 31 | 61 | 36 | 34 | 59 | 59 | 39 | 44 | 90 | 79 | 33 | 35 | 45 | 61 | 33 | 38 | 60 | 72 | 38 | 61 | 86 | 83 | 59 | 82 | 98 | 109 | 48 | 62 | ||||||||||||||||||||||||||||||||||||||
| Annual Adjusted EBITDA of Sales | 44 | 58 | |||||||||||||||||||||||||||||||||||||||||||||||||||||||||||||||||||||||||
| Adjusted Operating Income | (3083) | (6437) | (264) | 744 | (709) | (123) | 1829 | (7) | 54 | 2071 | 2182 | 600 | 972 | 4264 | 3460 | (40) | 271 | 885 | 2304 | 539 | 1147 | 2875 | 3852 | 1196 | 3435 | 6070 | 5570 | 3087 | 5979 | 7947 | 8850 | 4907 | 8314 | ||||||||||||||||||||||||||||||||||||||||||
| Consolidated Revenues | |||||||
| 2013 | 269503 | ||||||
| 2014 | 285693 | ||||||
| 2015 | 275834 | ||||||
| 2016 | 276573 | ||||||
| 2017 | 305907 | ||||||
| 2018 | 349637 | ||||||
| TTM 63019 | 362236 | ||||||
| Net Cash(Debt) | |||||||
| 2013 | (15380) | ||||||
| 2014 | 4207 | ||||||
| 2015 | 9840 | ||||||
| 2016 | 9580 | ||||||
| 2017 | (10127) | ||||||
| 2018 | 1060 | ||||||
| 63019 | (1908) | ||||||
| Rep Count | |||||||
| 2013 | 806 | ||||||
| 2014 | 916 | ||||||
| 2015 | 937 | ||||||
| 2016 | 1009 | ||||||
| 2017 | 983 | ||||||
| 2018 | 994 | ||||||
| 63019 | 982 | ||||||
| Adjusted OI | DampA | Adjusted EBITDA | |||||
| 2013 | 990 | 9030 | 10020 | ||||
| 2014 | 4907 | 8751 | 13658 | ||||
| 2015 | 8315 | 8543 | 17199 | ||||
| 2016 | 3388 | 8066 | 12065 | ||||
| 2017 | 15840 | ||||||
| 2018 | 25248 | ||||||
| TTM 63019 | 29237 | ||||||
| Reg G EBITDA By Quarter | |||||||
| Quarter | 2017 | 2018 | 2019 | ||||
| Q1 | 2852 | 5121 | 7457 | ||||
| Q2 | 4519 | 7749 | 9402 | ||||
| Q3 | 5443 | 7325 | |||||
| Q4 | 3026 | 5053 |
| Months of Experience | Average Annual Sales | Number of Reps | |||
| lt 12 Mos | ERRORVALUE | ERRORVALUE | |||
| 1 - 2 Yrs | ERRORVALUE | ERRORVALUE | |||
| 3 - 5 Yrs | ERRORVALUE | ERRORVALUE | |||
| 5 - 10 Yrs | ERRORVALUE | ERRORVALUE | |||
| gt 10 Yrs | ERRORVALUE | ERRORVALUE | |||
| ERRORVALUE | |||||
| Excludes ISR MSS CRS | |||||
| Excludes Freight | |||||
| Product mix | ||||||||
| Verticals | Q2 2019 Sales | |||||||
| Fastening Systems | 243 | 23008646 | ||||||
| Fluid Power | 152 | 14395529 | ||||||
| Specialy Chemicals | 117 | 11074332 | ||||||
| Cutting Tools and Abrasives | 130 | 12319702 | ||||||
| Electrical | 107 | 10102828 | ||||||
| Aftermarket Automotive Supplies | 77 | 7255974 | ||||||
| Safety | 47 | 4458217 | ||||||
| Welding and Metal Repair | 16 | 1539172 | ||||||
| Other | 112 | 10633378 | ||||||
| Total | 100 | 94787779 | ||||||
| Verticals | YTD 2019 Sales | |||||||
| Fastening Systems | 24 | 44125949 | ||||||
| Fluid Power | 15 | 28068352 | ||||||
| Specialy Chemicals | 12 | 21249420 | ||||||
| Cutting Tools and Abrasives | 13 | 24290887 | ||||||
| Electrical | 11 | 20425294 | ||||||
| Aftermarket Automotive Supplies | 8 | 14805874 | ||||||
| Safety | 5 | 8626381 | ||||||
| Welding and Metal Repair | 2 | 3088518 | ||||||
| Other | 10 | 20042457 | ||||||
| Total | 100 | 184723132 |
| Lawson core customer mix | ||||||||
| Account Tyoe | Q2 | |||||||
| Regional Accounts | 44933707 | 47 | ||||||
| Strategic | 13542786 | 14 | ||||||
| Kent Automotive | 14370813 | 15 | ||||||
| Bolt Supply | 11129675 | 12 | ||||||
| Government | 10087561 | 10 | ||||||
| Screw Products | 0 | 0 | ||||||
| Other (1) | 1428268 | 1 | ||||||
| Total | 96097363 | 100 | ||||||
| Account Tyoe | YTD June | |||||||
| Regional Accounts | 88400675 | 47 | ||||||
| Strategic | 26218365 | 14 | ||||||
| Kent Automotive | 29071347 | 16 | ||||||
| Bolt Supply | 20005505 | 11 | ||||||
| Government | 19505323 | 10 | ||||||
| Screw Products | 0 | 0 | ||||||
| Other | 4239066 | 2 | ||||||
| Total | 187440280 | 100 | ||||||
| Total Reported |
| August 2011 | OslashImplemented SAP | ||
| October 2011 | OslashCommenced construction of new McCook Ill distribution center | ||
| May 2012 | OslashRelocated corporate headquarters | ||
| June 2012 | OslashRestructured senior team Announced $20M cost savings plan | ||
| August 2012 | OslashTransitioned packaging facility to McCook Ill distribution center | ||
| OslashEntered into new five-year $40M credit facility | |||
| October 2012 | OslashAnnounced new CEO and President Michael G DeCata | ||
| OslashConsolidated Vernon Hills distribution center into McCook Ill | |||
| November 2012 | OslashRolled out new website to existing web customers | ||
| December 2012 | OslashCompleted transition of US independent agents to employees | ||
| April 2013 | OslashRoll-out of new website to new web customers | ||
| AprilMay 2013 | OslashMcCook DC begins to ship customer orders | ||
| November 2013 | OslashEntered into sub-lease of headquarters space to generate $29M of future cash savings | ||
| December 2013 | OslashEnded year with over 800 sales reps ndash First increase in 8 years | ||
| February 2014 | OslashClosed on Automatic Screw Machine Products sale for net proceeds of $121M | ||
| June 2014 | OslashEntered into sale-leaseback of Reno distribution facility for net proceeds of $83M | ||
| December 2014 | OslashEnded year with over 900 sales reps | ||
| February 2015 | OslashHeld North American sales meeting | ||
| September 2015 | OslashCompleted West Coast Fasteners acquisition | ||
| March 2016 | OslashCompleted Perfect Products of Michigan acquisition | ||
| May 2016 | OslashCompleted F B Feeney acquisition | ||
| June 2016 | OslashExpanded sales team to over 1000 sales reps | ||
| September 2016 | OslashExtended credit facitlity to August 2020 | ||
| November 2016 | OslashCompleted Mattic Industries acquisition | ||
| March 2017 | OslashConsolidated Fairfield NJ distribution operations into McCook Ill and Suwanee GA | ||
| May 2017 | OslashSold Fairfield NJ distribution center for a gain of $54M | ||
| October 2017 | OslashCompleted Bolt Supply House acquisition | ||
| April 2018 | OslashOpened MRO distribution center in Calgary Canada | ||
| October 2018 | OslashCompleted Screw Products acquisition and added Bolt Supply branch | ||
| June 2019 | OslashAchieved Q2 98 adjusted EBITDA net of ASC 842 impact of 03 | ||
| September 2019 | OslashAchieved Q3 109 adjusted EBITDA hired VP MampA | ||
| October 2019 | OslashEntered into new five-year $100M credit facility with additional $50 million accordion feature |
| ($ in thousands) | Q3 2013 | Q4 2013 | Q1 2014 | Q2 2014 | Q3 2014 | Q4 2014 | Q1 2015 | Q2 2015 | Q3 2015 | Q4 2015 | Q1 2016 | Q2 2016 | Q3 2016 | Q4 2016 | Q1 2017 | Q2 2017 | Q3 2017 | Q4 2017 | ||||||||||||||||||||||||||||||||||||||||||||||
| SGampA | 40350 | 42856 | 45991 | 42562 | 43855 | 44764 | 43830 | 40565 | 40532 | 41145 | 41290 | 42497 | 40184 | 45548 | 44167 | 42672 | 44915 | 46750 | $ 173014 | |||||||||||||||||||||||||||||||||||||||||||||
| $ - | ||||||||||||||||||||||||||||||||||||||||||||||||||||||||||||||||
| Excluded Costs | $ - | 40196 | ||||||||||||||||||||||||||||||||||||||||||||||||||||||||||||||
| Severance | (962) | 127 | (728) | (290) | 328 | 59 | (571) | (50) | (372) | (280) | (204) | (143) | (367) | (1662) | (465) | 9 | (139) | (144) | $ (234) | 127 | ||||||||||||||||||||||||||||||||||||||||||||
| Stock Based Compensation (Benefit) | (33) | (562) | (1125) | (408) | (2423) | (2443) | 541 | (971) | 30 | (1693) | 1217 | (515) | 630 | (3801) | 30 | (415) | (2337) | (384) | $ (5296) | -32 | ||||||||||||||||||||||||||||||||||||||||||||
| Loss(Gain) on Disposal of Property | 36 | (32) | - 0 | - 0 | (97) | (45) | - 0 | - 0 | 2 | (9) | - 0 | - 0 | - 0 | - 0 | - 0 | - 0 | - 0 | - 0 | $ (142) | |||||||||||||||||||||||||||||||||||||||||||||
| Legal Settlement | - 0 | - 0 | - 0 | - 0 | 688 | - 0 | - 0 | - 0 | - 0 | - 0 | - 0 | - 0 | - 0 | - 0 | - 0 | - 0 | - 0 | - 0 | $ 688 | -562 | ||||||||||||||||||||||||||||||||||||||||||||
| Employment Tax Matter | - 0 | 400 | - 0 | - 0 | - 0 | - 0 | - 0 | - 0 | - 0 | - 0 | - 0 | - 0 | - 0 | - 0 | - 0 | - 0 | - 0 | - 0 | $ - | 39729 | ||||||||||||||||||||||||||||||||||||||||||||
| Loss on Sub-Lease | - 0 | (2928) | - 0 | - 0 | - 0 | - 0 | - 0 | - 0 | - 0 | - 0 | - 0 | - 0 | - 0 | - 0 | - 0 | - 0 | - 0 | - 0 | $ - | |||||||||||||||||||||||||||||||||||||||||||||
| National sales meeting | - 0 | - 0 | - 0 | - 0 | - 0 | - 0 | (1889) | - 0 | - 0 | - 0 | - 0 | - 0 | - 0 | - 0 | - 0 | - 0 | - 0 | - 0 | $ (1889) | |||||||||||||||||||||||||||||||||||||||||||||
| Remediation expense | - 0 | - 0 | - 0 | - 0 | - 0 | (340) | - 0 | - 0 | - 0 | - 0 | - 0 | - 0 | - 0 | - 0 | - 0 | - 0 | - 0 | - 0 | $ (340) | |||||||||||||||||||||||||||||||||||||||||||||
| Property Impairment Loss | - 0 | - 0 | (2914) | (132) | - 0 | - 0 | - 0 | - 0 | - 0 | - 0 | - 0 | - 0 | - 0 | - 0 | - 0 | - 0 | - 0 | - 0 | $ - | |||||||||||||||||||||||||||||||||||||||||||||
| Adjusted SGampA | $ 39391 | $ 39861 | $ 41224 | $ 41732 | $ 42351 | $ 41995 | $ 41911 | $ 39544 | $ 40192 | $ 39163 | $ 42303 | $ 41839 | $ 40447 | $ 40085 | $ 43732 | $ 42266 | $ 42439 | $ 46222 | $ 165801 | |||||||||||||||||||||||||||||||||||||||||||||
| Annual Adjusted EBITDA of Sales | ERRORREF | ERRORREF | ||||||||||||||||||||||||||||||||||||||||||||||||||||||||||||||
| Q1 2013 | Q2 2013 | Q3 2013 | Q4 2013 | Q1 2014 | Q2 2014 | Q3 2014 | Q4 2014 | Q1 2015 | |||||||||||
| Selling Days | 63 | 64 | 64 | 61 | 63 | 64 | 64 | 61 | 63 | ||||||||||
| Net Sales | 67213 | 68317 | 68235 | 65738 | 69204 | 72080 | 74128 | 70281 | 69904 | ||||||||||
| Average Daily Sales | 1067 | 1067 | 1066 | 1078 | 1098 | 1126 | 1158 | 1152 | 1110 | ||||||||||
| Average Sales Rep Count | 762 | 764 | 774 | 794 | 819 | 854 | 882 | 908 | 911 | ||||||||||
| Sales per Sales Rep per Day | 1400 | 1397 | 1377 | 1358 | 1341 | 1319 | 1313 | 1269 | 1218 | ||||||||||
| Full Year | ||||||||||||||||||||||||||||||||||||||||||||||||||||||||||||||||||||
| ($ in thousands) | Q1 2011 | Q2 2011 | Q3 2011 | Q4 2011 | Q1 2012 | Q2 2012 | Q3 2012 | Q4 2012 | Q1 2013 | Q2 2013 | Q3 2013 | Q4 2013 | Q1 2014 | Q2 2014 | Q3 2014 | Q4 2014 | Q1 2015 | Q2 2015 | Q3 2015 | Q4 2015 | Q1 2016 | Q2 2016 | Q3 2016 | Q4 2016 | Q1 2017 | Q2 2017 | Q3 2017 | Q4 2017 | Q1 2018 | Q2 2018 | Q3 2018 | 2014 | 2015 | |||||||||||||||||||||||||||||||||||
| Net Sales | $ 79255 | $ 80625 | $ 71490 | $ 69029 | $ 71364 | $ 69830 | $ 67863 | $ 64505 | $ 67213 | $ 68317 | $ 68235 | $ 65738 | $ 69204 | $ 72080 | $ 74128 | $ 70281 | $ 69904 | $ 70726 | $ 70243 | $ 64961 | $ 69711 | $ 69348 | $ 70199 | $ 67315 | $ 74617 | $ 75006 | $ 75651 | $ 80633 | $ 84459 | $ 90382 | $ 88530 | $ 285693 | $ 275834 | |||||||||||||||||||||||||||||||||||
| Operating Income (Loss) | 3542 | 1397 | (3480) | (6995) | (3466) | (42084) | (1740) | 2057 | (3530) | (201) | 870 | (3002) | (4713) | 1241 | 678 | (2169) | (947) | 3243 | 2810 | (2985) | 1169 | 29 | 2389 | (5044) | 712 | 7891 | 1090 | 243 | 1837 | 5554 | (2266) | (4963) | 2121 | |||||||||||||||||||||||||||||||||||
| Depreciation amp Amortization | 1260 | 1315 | 1160 | 1675 | 1715 | 1566 | 1963 | 1841 | 2061 | 2244 | 2367 | 2358 | 2295 | 2163 | 2160 | 2133 | 2096 | 2126 | 2119 | 2202 | 2187 | 2226 | 1973 | 1680 | 1705 | 1644 | 1591 | 1830 | 1686 | 1679 | 1755 | 8751 | 8543 | |||||||||||||||||||||||||||||||||||
| EBITDA | 4802 | 2712 | (2320) | (5320) | (1751) | (40518) | 223 | 3898 | (1469) | 2043 | 3237 | (644) | (2418) | 3404 | 2838 | (36) | 1149 | 5369 | 4929 | (783) | 3356 | 2255 | 4362 | (3364) | 2417 | 9535 | 2681 | 2073 | 3523 | 7233 | (511) | 3788 | 10664 | |||||||||||||||||||||||||||||||||||
| Excluded Costs | ||||||||||||||||||||||||||||||||||||||||||||||||||||||||||||||||||||
| Severance | 745 | 465 | 282 | 122 | 185 | 6585 | 1410 | (159) | - 0 | 2 | 962 | (127) | 728 | 290 | (328) | (59) | 571 | 50 | 372 | 280 | 204 | 143 | 367 | 1662 | 465 | (9) | 139 | 144 | 628 | 64 | 31 | 631 | 1273 | |||||||||||||||||||||||||||||||||||
| Stock Based Compensation (Benefit) | 227 | (95) | (538) | 467 | 198 | (1015) | 77 | 434 | 1596 | 76 | 33 | 562 | 1125 | 408 | 2423 | 2443 | (541) | 971 | (30) | 1693 | (1217) | 515 | (630) | 3801 | (30) | 415 | 2337 | 384 | 970 | 87 | 7637 | 6399 | 2093 | |||||||||||||||||||||||||||||||||||
| Acquisition Related Costs | - 0 | - 0 | - 0 | - 0 | - 0 | - 0 | 310 | 32 | 115 | 198 | 178 | 120 | - 0 | - 0 | 286 | 425 | - 0 | - 0 | 168 | |||||||||||||||||||||||||||||||||||||||||||||||||
| ERP Implementation Costs | 1902 | 2388 | 2344 | 339 | - 0 | - 0 | - 0 | - 0 | - 0 | - 0 | - 0 | - 0 | - 0 | - 0 | - 0 | - 0 | - 0 | - 0 | - 0 | - 0 | - 0 | - 0 | - 0 | - 0 | - 0 | - 0 | - 0 | - 0 | - 0 | - 0 | - 0 | - 0 | ||||||||||||||||||||||||||||||||||||
| Loss(Gain) on Disposal of Property | - 0 | - 0 | - 0 | 22 | - 0 | (2122) | (11) | (1588) | - 0 | - 0 | (36) | 32 | - 0 | - 0 | 97 | 45 | - 0 | - 0 | (2) | 9 | - 0 | - 0 | - 0 | - 0 | - 0 | (5422) | - 0 | - 0 | - 0 | - 0 | - 0 | 142 | 7 | |||||||||||||||||||||||||||||||||||
| Legal Settlement | - 0 | - 0 | - 0 | - 0 | - 0 | - 0 | - 0 | - 0 | - 0 | - 0 | - 0 | - 0 | - 0 | - 0 | (688) | - 0 | - 0 | - 0 | - 0 | - 0 | - 0 | - 0 | - 0 | - 0 | - 0 | - 0 | - 0 | - 0 | - 0 | - 0 | - 0 | (688) | - 0 | |||||||||||||||||||||||||||||||||||
| Employment Tax Matter | - 0 | - 0 | - 0 | 1200 | - 0 | - 0 | - 0 | - 0 | - 0 | - 0 | - 0 | (400) | - 0 | - 0 | - 0 | - 0 | - 0 | - 0 | - 0 | - 0 | - 0 | - 0 | - 0 | - 0 | - 0 | - 0 | - 0 | - 0 | - 0 | - 0 | - 0 | - 0 | - 0 | |||||||||||||||||||||||||||||||||||
| Lease termination gain | - 0 | - 0 | - 0 | - 0 | - 0 | - 0 | - 0 | - 0 | - 0 | - 0 | - 0 | 2928 | - 0 | - 0 | - 0 | - 0 | - 0 | - 0 | - 0 | - 0 | - 0 | - 0 | - 0 | - 0 | - 0 | - 0 | - 0 | - 0 | - 0 | (164) | - 0 | - 0 | - 0 | |||||||||||||||||||||||||||||||||||
| Goodwill Impairment | - 0 | - 0 | - 0 | - 0 | - 0 | 28306 | - 0 | - 0 | - 0 | - 0 | - 0 | - 0 | - 0 | - 0 | - 0 | - 0 | - 0 | - 0 | - 0 | - 0 | - 0 | - 0 | - 0 | - 0 | - 0 | - 0 | - 0 | - 0 | - 0 | - 0 | - 0 | - 0 | - 0 | |||||||||||||||||||||||||||||||||||
| Inventory Rationalization | - 0 | - 0 | - 0 | - 0 | - 0 | 3893 | - 0 | - 0 | - 0 | - 0 | - 0 | - 0 | - 0 | - 0 | - 0 | - 0 | - 0 | - 0 | - 0 | - 0 | - 0 | - 0 | - 0 | - 0 | - 0 | - 0 | - 0 | - 0 | - 0 | - 0 | - 0 | - 0 | - 0 | |||||||||||||||||||||||||||||||||||
| Discontinued operation accrual | - 0 | - 0 | - 0 | - 0 | - 0 | - 0 | - 0 | - 0 | - 0 | - 0 | - 0 | - 0 | - 0 | - 0 | - 0 | 340 | - 0 | - 0 | - 0 | 931 | - 0 | - 0 | - 0 | - 0 | - 0 | - 0 | - 0 | - 0 | - 0 | 529 | - 0 | 340 | 931 | |||||||||||||||||||||||||||||||||||
| North American sales meeting | - 0 | - 0 | - 0 | - 0 | - 0 | - 0 | - 0 | - 0 | 1225 | - 0 | - 0 | - 0 | - 0 | - 0 | - 0 | - 0 | 1889 | - 0 | - 0 | - 0 | - 0 | - 0 | - 0 | - 0 | - 0 | - 0 | - 0 | - 0 | - 0 | - 0 | - 0 | - 0 | 1889 | |||||||||||||||||||||||||||||||||||
| Property Impairment Loss | - 0 | - 0 | - 0 | - 0 | - 0 | - 0 | - 0 | - 0 | - 0 | - 0 | - 0 | - 0 | 2914 | 132 | - 0 | - 0 | - 0 | - 0 | - 0 | - 0 | - 0 | - 0 | - 0 | - 0 | - 0 | - 0 | - 0 | - 0 | - 0 | - 0 | - 0 | 3046 | - 0 | |||||||||||||||||||||||||||||||||||
| Adjusted EBITDA | $ 7676 | $ 5470 | $ (232) | $ (3170) | $ (1368) | $ (4871) | $ 1699 | $ 2585 | $ 1352 | $ 2121 | $ 4196 | $ 2351 | $ 2349 | $ 4234 | $ 4342 | $ 2733 | $ 3068 | $ 6390 | $ 5579 | $ 2162 | $ 2458 | $ 3111 | $ 4277 | $ 2219 | $ 2852 | $ 4519 | $ 5443 | $ 3026 | $ 5121 | $ 7749 | $ 7325 | $ 13658 | $ 17199 | |||||||||||||||||||||||||||||||||||
| Adjusted EBITDA of Sales | 97 | 68 | -03 | -46 | -19 | -70 | 25 | 40 | 20 | 31 | 61 | 36 | 34 | 59 | 59 | 39 | 44 | 90 | 79 | 33 | 35 | 45 | 61 | 33 | 38 | 60 | 72 | 38 | 61 | 86 | 83 | 48 | 62 | |||||||||||||||||||||||||||||||||||
| Annual Adjusted EBITDA of Sales | 44 | 58 | ||||||||||||||||||||||||||||||||||||||||||||||||||||||||||||||||||
| Adjusted Operating Income | (3083) | (6437) | (264) | 744 | (709) | (123) | 1829 | (7) | 54 | 2071 | 2182 | 600 | 972 | 4264 | 3460 | (40) | 271 | 885 | 2304 | 539 | 1147 | 2875 | 3852 | 1196 | 3435 | 6070 | 5570 | - 0 | 4907 | 8314 | ||||||||||||||||||||||||||||||||||||||
| Sales | |||
| Broad Based MRO Market | $150000000000 | ||
| Service Based VMI Market | $25000000000 | ||
| 3rd Qtr | 12 | ||
| 4th Qtr | 12 | ||
| To resize chart data range drag lower right corner of range |
| Broad Based MRO Market | |
| Service Based VMI Market |
copy 2019 Lawson Products Inc All rights reserved Confidential Material Reproduction In Whole or in Part Prohibited
Safe Harbor Statement under the Securities Litigation Reform Act of 1995
This presentation contains certain forward-looking statements within the meaning of the Private SecuritiesLitigation Reform Act of 1995 that involve risks and uncertainties The terms ldquomayrdquo ldquoshouldrdquo ldquocouldrdquoldquoanticipaterdquo ldquobelieverdquo ldquocontinuesrdquo ldquoestimaterdquo ldquoexpectrdquo ldquointendrdquo ldquoobjectiverdquo ldquoplanrdquo ldquopotentialrdquo ldquoprojectrdquoand similar expressions are intended to identify forward-looking statements These statements are notguarantees of future performance and involve risks uncertainties and assumptions that are difficult to predictThese statements are based on managementrsquos current expectations intentions or beliefs and are subject to anumber of factors assumptions and uncertainties that could cause actual results to differ materially fromthose described in the forward-looking statements Factors that could cause or contribute to such differencesor that might otherwise impact the business include failure to retain a talented workforce including productivesales representatives the inability of management to successfully implement strategic initiatives failure tomanage change the ability to adequately fund our operating and working capital needs through cashgenerated from operations the ability to meet the covenant requirements of our line of credit disruptions ofthe Companyrsquos information and communication systems the effect of general economic and marketconditions inventory obsolescence work stoppages and other disruptions at transportation centers orshipping ports changing customer demand and product mixes increases in commodity prices violations ofenvironmental protection regulations a negative outcome related to tax matters and all other factorsdiscussed in the Companyrsquos ldquoRisk Factorsrdquo set forth in its Annual Report on Form 10-K for the year endedDecember 31 2018
The Company undertakes no obligation to update any such factors or to publicly announce the results of anyrevisions to any forward-looking statements contained herein whether as a result of new information futureevents or otherwise
Lawson Products Inc
2
copy 2019 Lawson Products Inc All rights reserved Confidential Material Reproduction In Whole or in Part Prohibited
bull Leading service based provider of consumables in MRO marketbull Serves industrial commercial institutional and government markets in all 50
states Canada Mexico Puerto Rico and the Caribbeanbull Headquartered in Chicago IL
ndash Strategically located distribution centersndash Workforce ~1600 (~ 1000 sales reps)
bull Supplies a comprehensive line of products to the MRO marketplacebull VMI and private label drives high gross margins
Lawson Products At a Glance
Fasteners Cutting Tools Chemicals Hydraulics Other
3
copy 2019 Lawson Products Inc All rights reserved Confidential Material Reproduction In Whole or in Part Prohibited
Competitive Advantages and Differentiators
What differentiates Lawsonbull Service intensive ldquohigh touchrdquo
value propositionbull Vendor managed inventory or
ldquokeep fillrdquobull Deep product knowledge bull Broad geographic sales and
service coverage throughout the US and Canada
bull Leverage investments in sales team facilities and technology to enable outstanding customer service
bull Lowest total cost
4
copy 2019 Lawson Products Inc All rights reserved Confidential Material Reproduction In Whole or in Part Prohibited
Our Commitment to our 70000+ Customers
High touch service and technical expertise drives customer relationshipsBefore After
One Company Zero Headaches Inventory Management Options Access to Industry Knowledge amp Expertise
bull Comprehensive line of products bull Lawson Managed Inventory bull Product recommendations from your Lawson Representative
bull Hundreds of pre-built assortments bull Industrial vending bull Application advice from our test and application engineers
bull Unlimited sourcing of hard-to-find items
bull Self-service inventory management
bull Complimentary on-site safety amp product usage training
5
copy 2019 Lawson Products Inc All rights reserved Confidential Material Reproduction In Whole or in Part Prohibited
Customer and Product Profile
6
Retain over 90 of customer revenues from year to year
Fastening Systems
23
Fluid Power15
Specialty Chemicals
12
Cutting Tools and Abrasives
13
Electrical11
Aftermarket Automotive
Supplies8
Safety5
Welding and Metal Repair
2
Other10
Product Mix
Regional Accounts
47
Strategic14
Kent Automotive
15
Bolt Supply11
Government 11
Other2
Customer Mix
copy 2019 Lawson Products Inc All rights reserved Confidential Material Reproduction In Whole or in Part Prohibited
Lawson Growth Strategy
Sales Growth Driven By
Foundational SupportERP Network
OptimizationSales
TransformationLean Six Sigma
Website
7
New Sales Reps
Sales RepProductivity
Acquisitions
copy 2019 Lawson Products Inc All rights reserved Confidential Material Reproduction In Whole or in Part Prohibited
2019 Focus Actions Across the Value Chain Driving Growth
Add New Sales Reps and Drive Rep Productivity
Sales Process Sales Reps
Customer Service Order
Entry
ProductManagement
PricingDC Operations Sourcing
Purchasing
bull Increase sales rep count
bull Onboardingprocesstraining
bull SalesManagement dashboard
bull EDI with customers
bull Reduction of cycle times
bull Order padbull Consolidation of
shipmentsbull Sales service reps
bull Leverage vendor drop-ship programs
bull Fleet maintenance focus
bull Pricing enhancements
bull Website
bull Reduce cycle timebull Refine ldquoPullrdquo
strategybull Freight
enhancementsbull Minimize
backordersbull Improve service
levelsbull Forecasting tool
bull Supplier negotiation process
bull Vendor metricsbull Electronic
communication
Information Technology ndash Integration of Web and SAPLean Six Sigma
8
copy 2019 Lawson Products Inc All rights reserved Confidential Material Reproduction In Whole or in Part Prohibited
Longer Sales Rep Tenure Drives Rep Productivity
9
$0
$50000
$100000
$150000
$200000
$250000
$300000
$350000
$400000
$450000
$500000
lt 12 Mos 1 - 2 Yrs 3 - 5 Yrs 5 - 10 Yrs gt 10 Yrs0
50
100
150
200
250
300
350
Aver
age
Annu
al S
ales
Tenure With Lawson (as of 93019)
Num
ber O
f Sal
es R
eps
Number of Reps Average Annual Sales
copy 2019 Lawson Products Inc All rights reserved Confidential Material Reproduction In Whole or in Part Prohibited
Historical Financial Performance
Recent sales growth and earnings expansion providing financial flexibility
10
$200000
$250000
$300000
$350000
$400000
2014 2015 2016 2017 2018 TTM93019
Consolidated Revenues
$0$5000
$10000$15000$20000$25000$30000$35000
2014 2015 2016 2017 2018 TTM93019
Adjusted Reg G EBITDA
-$15000
-$10000
-$5000
$0
$5000
$10000
$15000
2014 2015 2016 2017 2018 9302019
Net Cash(Debt)
$0
$2000
$4000
$6000
$8000
$10000
$12000
Q1 Q2 Q3 Q4
Quarterly Adjusted Reg G EBITDA
2017
20172017
2017
2018
20182018
2018
20192019
2019
copy 2019 Lawson Products Inc All rights reserved Confidential Material Reproduction In Whole or in Part Prohibited
Financial Highlights for Third Quarter 2019
bull Sales increased 71 YOY (74 excluding currency fluctuation)
bull MRO LawsonKent gross margins consistent at 609
bull Adjusted Reg G EBITDA margin improving 109 in Q3 2019 v 83 in Q3 2018 Continued investment in new sales reps and rep productivity
bull Key trends MRO operating leverage of 54 13 increase in sales rep productivity Continued government strength +30 YOY Growth across multiple segments and product categories Cash flow from operations of $103 million in Q3
11
copy 2019 Lawson Products Inc All rights reserved Confidential Material Reproduction In Whole or in Part Prohibited
Pursue Disciplined MampA
Reinvest for Growth
Return Capital
bull Increased our borrowing capacity to $1000 million (additional $500 million accordion) with our new borrowing agreement
bull Capital expenditures expected to be $20 - $30 million in 2019bull Growth initiatives add new reps and increase sales rep productivity
bull Share repurchase to offset award dilution opportunistic purchasesbull $75 million stock repurchase program announced on May 16 2019 $63
million remaining after repurchase of shares worth $12 million in August 2019
bull Bolt-on acquisitions to enhance core growth strategiesbull Closed Screw Products Inc acquisition on 10118
Maintain Strong Balance Sheet
bull $86 million cash on hand and positive cash position of $64 million at the end of Q3
bull Consistent free cash flow generation
Capital Allocation Priorities
12
copy 2019 Lawson Products Inc All rights reserved Confidential Material Reproduction In Whole or in Part Prohibited
Lawson Products Poised for Growth
bull Leverage Current Infrastructure
bull Continued Sales Growth
bull Foundational Investments Completed
bull Operational Excellence
bull Large Fragmented Market
13
copy 2019 Lawson Products Inc All rights reserved Confidential Material Reproduction In Whole or in Part Prohibited
For More Information
Contact
Ronald J KnutsonEVP CFOInvestor Relations(773) 304-5665ronknutsonlawsonproductscom
And see our Website athttpwwwlawsonproductscomcompany-infoinvestor-relationsjsp
14
copy 2019 Lawson Products Inc All rights reserved Confidential Material Reproduction In Whole or in Part Prohibited
Appendices
15
copy 2019 Lawson Products Inc All rights reserved Confidential Material Reproduction In Whole or in Part Prohibited
Significant Activities
16
Appendix P-1
August 2011 Implemented SAPOctober 2011 Commenced construction of new McCook Ill distribution center
May 2012 Relocated corporate headquartersJune 2012 Restructured senior team Announced $20M cost savings plan
Transitioned packaging facility to McCook Ill distribution centerEntered into new five-year $40M credit facilityAnnounced new CEO and President Michael G DeCataConsolidated Vernon Hills distribution center into McCook Ill
November 2012 Rolled out new website to existing web customersDecember 2012 Completed transition of US independent agents to employees
April 2013 Roll-out of new website to new web customersAprilMay 2013 McCook DC begins to ship customer ordersNovember 2013 Entered into sub-lease of headquarters space to generate $29M of future cash savingsDecember 2013 Ended year with over 800 sales reps ndash First increase in 8 yearsFebruary 2014 Closed on Automatic Screw Machine Products sale for net proceeds of $121M
June 2014 Entered into sale-leaseback of Reno distribution facility for net proceeds of $83MDecember 2014 Ended year with over 900 sales repsFebruary 2015 Held North American sales meeting
September 2015 Completed West Coast Fasteners acquisitionMarch 2016 Completed Perfect Products of Michigan acquisitionMay 2016 Completed F B Feeney acquisitionJune 2016 Expanded sales team to over 1000 sales reps
September 2016 Extended credit facitlity to August 2020November 2016 Completed Mattic Industries acquisition
March 2017 Consolidated Fairfield NJ distribution operations into McCook Ill and Suwanee GAMay 2017 Sold Fairfield NJ distribution center for a gain of $54M
October 2017 Completed Bolt Supply House acquisitionApril 2018 Opened MRO distribution center in Calgary Canada
October 2018 Completed Screw Products acquisition and added Bolt Supply branchJune 2019 Achieved Q2 98 adjusted EBITDA net of ASC 842 impact of 03
September 2019 Achieved Q3 109 adjusted EBITDA hired VP MampAOctober 2019 Entered into new five-year $100M credit facility with additional $50 million accordion feature
August 2012
October 2012
Adjusted EBITDA $ in 000s
Adjusted EBITDA Q4 2016Q1 2017Q2 2017Q3 2017Q4 201722192852451954433026
Adjusted EBITDA of Sales
Adjusted EBITDA of SalesQ3 2016Q4 2016Q1 2017Q2 2017Q3 2017Q4 201760926793828971926E-232964421005719377E-23822185292895721E-260248513452257152E-271948817596594883E-237528059231332088E-2
Adjusted Operating Income of Sales
Adjusted Operating IncomeQ3 2016Q4 2016Q1 2017Q2 2017Q3 2017Q4 201723045391147287538521196
Adjusted Op Inc $ in 000s
Adjusted EBITDA Q4 2016Q1 2017Q2 2017Q3 2017Q4 20175391147287538521196
Net Sales by Quarter $ in 000s
Net SalesQ1 2013Q2 2013Q3 2013Q4 2013Q1 2014Q2 2014Q3 2014Q4 2014Q1 2015672136831768235657386920472080741287028169904
Adjusted SGampA $ in 000s
Adjusted SGampA Q4 2015Q1 2016Q2 2016Q3 2016Q4 2016Q1 2017Q2 2017Q3 2017Q4 2017391634230341839404474008543732422664243946222
copy 2019 Lawson Products Inc All rights reserved Confidential Material Reproduction In Whole or in Part Prohibited
Regulation G ndash GAAP ReconciliationAppendix P-2
Non GAAP Reconciliation of Adjusted EBITDA to Sales Percentage
The Company reports its financial results in accordance with US generally accepted accounting principles (GAAP) However the Companys management believesthat certain non-GAAP financial measures may provide users of this financial information additional meaningful comparisons between current results and results inprior operating periods Management believes that these non-GAAP financial measures can provide additional meaningful reflection of underlying trends of thebusiness because they provide a comparison of historical information that excludes certain non-operational non-recurring or intermittently recurring items thatimpact the overall comparability See the table below for supplemental financial data and corresponding reconciliations to GAAP financial measures for quarterlyadjusted EBITDA as a percentage of net sales Non-GAAP financial measures should be viewed in addition to and not as an alternative for the Companys reportedresults prepared in accordance with GAAP
17
($ in thousands) Q1 2017 Q2 2017 Q3 2017 Q4 2017 Q1 2018 Q2 2018 Q3 2018 Q4 2018 Q1 2019 Q2 2019 Q3 2019
Net Sales 74617$ 75006$ 75651$ 80633$ 84459$ 90382$ 88530$ 86266$ 91343$ 96097$ 94779$
Operating Income (Loss) 712 7891 1090 243 1837 5554 (2266) 4085 5544 1623 6446 Depreciation amp Amortization 1705 1644 1591 1830 1686 1679 1755 1735 1478 1455 1468 EBITDA 2417 9535 2681 2073 3523 7233 (511) 5820 7022 3078 7914
Excluded CostsSeverance 465 (9) 139 144 628 64 31 126 27 1485 30 Stock Based Compensation (Benefit) (30) 415 2337 384 970 87 7637 (1186) 408 4839 2374 Acquisition Related Costs - - 286 425 - - 168 62 - - - Loss(Gain) on Disposal of Property - (5422) - - - - - - - - - Lease termination gain - - - - - (164) - - - - - Discontinued operation accrual - - - - - 529 - - - - - Building Impairment - - - - - - - 231 - - - Reg G Adjusted EBITDA 2852$ 4519$ 5443$ 3026$ 5121$ 7749$ 7325$ 5053$ 7457$ 9402$ 10318$
Adjusted EBITDA of Sales 38 60 72 38 61 86 83 59 82 98 109
Customer Mix
Regional Accounts48
Kent Automotive16
Regional AccountsStrategicKent AutomotiveBolt SupplyGovernment Screw ProductsOther047014000000000000001016011010002
ampDampF ampA
Product Mix
Fastening Systems23
Specialty Chemicals12
Fastening SystemsFluid PowerSpecialy ChemicalsCutting Tools and AbrasivesElectricalAftermarket Automotive SuppliesSafetyWelding and Metal RepairOther02401501201301100800500201
Number Of Sales Reps
Tenure With Lawson (as of 63019)
Average Annual Sales
Consolidated Revenues
Consolidated Revenues20142015201620172018TTM 63019285693275834276573305907349637362236Net Cash(Debt)2014201520162017201843646420798409580-101271060-1908Rep Count201320142015201620172018436468069169371009983994982
Adjusted Reg G EBITDA
Adjusted EBITDA20142015201620172018TTM 63019136581719912065158402524829237
Quarterly Adjusted Reg G EBITDA
2017Q1Q2Q3Q428524519544330262018Q1Q2Q3Q451217749732550532019Q1Q2Q3Q474579402
Adjusted EBITDA $ in 000s
Reg G Adjusted EBITDA Q1 2017Q2 2017Q3 2017Q4 20172852451954433026
Adjusted EBITDA of Sales
Adjusted EBITDA of SalesQ1 2017Q2 2017Q3 2017Q4 20173822185292895721E-260248513452257152E-271948817596594883E-237528059231332088E-2
Adjusted Operating Income of Sales
Adjusted Operating IncomeQ1 2017Q2 2017Q3 2017Q4 2017
Adjusted Op Inc $ in 000s
Reg G Adjusted EBITDA Q1 2017Q2 2017Q3 2017Q4 2017
copy 2019 Lawson Products Inc All rights reserved Confidential Material Reproduction In Whole or in Part Prohibited
Consolidated Balance Sheet Appendix P-4
18
ASSETSCurrent assetsCash and cash equivalents $ 8626 $ 11883Restricted cash 800 800Accounts receivable less allowance for doubtful accounts of $614 and $549 respectively
45162 37682
Inventories net 54894 52887Miscellaneous receivables and prepaid expenses 4270 3653Total current assets 113752 106905
Property plant and equipment net 16932 23548Deferred income taxes 17372 20592Goodwill 20582 20079Cash value of life insurance 14440 12599Intangible assets net 12468 13112Lease assets 11917 mdashOther assets 275 307Total assets $ 207738 $ 197142
LIABILITIES AND STOCKHOLDERSrsquo EQUITYCurrent liabilitiesRevolving lines of credit $ 2195 $ 10823Accounts payable 16325 15207Lease obligation 3781 mdashAccrued expenses and other liabilities 37873 40179Total current liabilities 60174 66209
Security bonus plan 11969 12413Lease obligation 10360 5213Deferred compensation 5915 5304Deferred tax liability 2879 2761Other liabilities 3460 6069Total liabilities 94757 97969
Stockholdersrsquo equityPreferred stock $1 par valueAuthorized - 500000 shares Issued and outstanding mdash None mdash mdashCommon stock $1 par value
Authorized - 35000000 sharesIssued - 9042597 and 9005716 shares respectivelyOutstanding - 8956981 and 8955930 shares respectively
Capital in excess of par value 17626 15623Retained earnings 89502 77338Treasury stock ndash 85616 and 49786 shares respectivelyAccumulated other comprehensive lossTotal stockholdersrsquo equity 112981 99173Total liabilities and stockholdersrsquo equity $ 207738 $ 197142
September 30 December 312019 2018
(Unaudited)
(2595) (1234)(595) (1560)
9043 9006
Customer Mix
Regional Accounts48
Kent Automotive16
Regional AccountsStrategicKent AutomotiveBolt SupplyGovernment Screw ProductsOther0470140000000000000010150110110002
ampDampF ampA
Product Mix
Fastening Systems23
Specialty Chemicals12
Fastening SystemsFluid PowerSpecialy ChemicalsCutting Tools and AbrasivesElectricalAftermarket Automotive SuppliesSafetyWelding and Metal RepairOther02401501201301100800500201
Number Of Sales Reps
Tenure With Lawson (as of 63019)
Average Annual Sales
Consolidated Revenues
Consolidated Revenues20142015201620172018TTM 93019285693275834276573305907349637368485Net Cash(Debt)2014201520162017201843738420798409580-1012710606431Rep Count201320142015201620172018437388069169371009983994993
Adjusted Reg G EBITDA
Adjusted EBITDA20142015201620172018TTM 93019136581719912065158402524832230
Quarterly Adjusted Reg G EBITDA
2017Q1Q2Q3Q428524519544330262018Q1Q2Q3Q451217749732550532019Q1Q2Q3Q47457940210318
Adjusted EBITDA $ in 000s
Reg G Adjusted EBITDA Q1 2017Q2 2017Q3 2017Q4 20172852451954433026
Adjusted EBITDA of Sales
Adjusted EBITDA of SalesQ1 2017Q2 2017Q3 2017Q4 20173822185292895721E-260248513452257152E-271948817596594883E-237528059231332088E-2
Adjusted Operating Income of Sales
Adjusted Operating IncomeQ1 2017Q2 2017Q3 2017Q4 2017
Adjusted Op Inc $ in 000s
Reg G Adjusted EBITDA Q1 2017Q2 2017Q3 2017Q4 2017
| September 30 | December 31 | ||||||||||
| 2019 | 2018 | ||||||||||
| ASSETS | (Unaudited) | ||||||||||
| Current assets | |||||||||||
| Cash and cash equivalents | $ | 8626 | $ | 11883 | |||||||
| Restricted cash | 800 | 800 | |||||||||
| Accounts receivable less allowance for doubtful accounts of $614 and $549 respectively | 45162 | 37682 | |||||||||
| Inventories net | 54894 | 52887 | |||||||||
| Miscellaneous receivables and prepaid expenses | 4270 | 3653 | |||||||||
| Total current assets | 113752 | 106905 | |||||||||
| Property plant and equipment net | 16932 | 23548 | |||||||||
| Deferred income taxes | 17372 | 20592 | |||||||||
| Goodwill | 20582 | 20079 | |||||||||
| Cash value of life insurance | 14440 | 12599 | |||||||||
| Intangible assets net | 12468 | 13112 | |||||||||
| Lease assets | 11917 | mdash | |||||||||
| Other assets | 275 | 307 | |||||||||
| Total assets | $ | 207738 | $ | 197142 | |||||||
| LIABILITIES AND STOCKHOLDERSrsquo EQUITY | |||||||||||
| Current liabilities | |||||||||||
| Revolving lines of credit | $ | 2195 | $ | 10823 | |||||||
| Accounts payable | 16325 | 15207 | |||||||||
| Lease obligation | 3781 | mdash | |||||||||
| Accrued expenses and other liabilities | 37873 | 40179 | |||||||||
| Total current liabilities | 60174 | 66209 | |||||||||
| Security bonus plan | 11969 | 12413 | |||||||||
| Lease obligation | 10360 | 5213 | |||||||||
| Deferred compensation | 5915 | 5304 | |||||||||
| Deferred tax liability | 2879 | 2761 | |||||||||
| Other liabilities | 3460 | 6069 | |||||||||
| Total liabilities | 94757 | 97969 | |||||||||
| Stockholdersrsquo equity | |||||||||||
| Preferred stock $1 par value | |||||||||||
| Authorized - 500000 shares Issued and outstanding mdash None | mdash | mdash | |||||||||
| Common stock $1 par value | |||||||||||
| Authorized - 35000000 shares | 9043 | 9006 | |||||||||
| Issued - 9042597 and 9005716 shares respectively | |||||||||||
| Outstanding - 8956981 and 8955930 shares respectively | |||||||||||
| Capital in excess of par value | 17626 | 15623 | |||||||||
| Retained earnings | 89502 | 77338 | |||||||||
| Treasury stock ndash 85616 and 49786 shares respectively | (2595) | (1234) | |||||||||
| Accumulated other comprehensive loss | (595) | (1560) | |||||||||
| Total stockholdersrsquo equity | 112981 | 99173 | |||||||||
| Total liabilities and stockholdersrsquo equity | $ | 207738 | $ | 197142 | |||||||
| Three Months Ended | |||||||||||||||||||||||||||||
| Jun 30 2019 | Mar 31 2019 | Dec 31 2018 | Sep 30 2018 | Jun 30 2018 | |||||||||||||||||||||||||
| Average daily net sales | $ | 1502 | $ | 1450 | $ | 1414 | $ | 1405 | $ | 1412 | |||||||||||||||||||
| Year over year increase | 63 | 82 | 70 | 170 | 205 | ||||||||||||||||||||||||
| Sequential quarter increase (decrease) | 36 | 25 | 06 | (05) | 53 | ||||||||||||||||||||||||
| Net Sales | $ | 96097 | $ | 91343 | $ | 86266 | $ | 88530 | $ | 90382 | |||||||||||||||||||
| Gross profit (1) | 51043 | 48923 | 46083 | 48108 | 49131 | ||||||||||||||||||||||||
| Gross profit percentage (1) | 531 | 536 | 534 | 543 | 544 | ||||||||||||||||||||||||
| Selling general amp administrative expenses | $ | 49420 | $ | 43379 | $ | 41998 | $ | 50374 | $ | 43577 | |||||||||||||||||||
| Operating income (loss) | $ | 1623 | $ | 5544 | $ | 4085 | $ | (2266) | $ | 5554 | |||||||||||||||||||
| Full Year | |||||||||||||||||||||||||||||||||||||||||||||||||||||||||||||||||||||||||||
| ($ in thousands) | Q1 2011 | Q2 2011 | Q3 2011 | Q4 2011 | Q1 2012 | Q2 2012 | Q3 2012 | Q4 2012 | Q1 2013 | Q2 2013 | Q3 2013 | Q4 2013 | Q1 2014 | Q2 2014 | Q3 2014 | Q4 2014 | Q1 2015 | Q2 2015 | Q3 2015 | Q4 2015 | Q1 2016 | Q2 2016 | Q3 2016 | Q4 2016 | Q1 2017 | Q2 2017 | Q3 2017 | Q4 2017 | Q1 2018 | Q2 2018 | Q3 2018 | Q4 2018 | Q1 2019 | Q2 2019 | Q3 2019 | 2014 | 2015 | ||||||||||||||||||||||||||||||||||||||
| Net Sales | $ 79255 | $ 80625 | $ 71490 | $ 69029 | $ 71364 | $ 69830 | $ 67863 | $ 64505 | $ 67213 | $ 68317 | $ 68235 | $ 65738 | $ 69204 | $ 72080 | $ 74128 | $ 70281 | $ 69904 | $ 70726 | $ 70243 | $ 64961 | $ 69711 | $ 69348 | $ 70199 | $ 67315 | $ 74617 | $ 75006 | $ 75651 | $ 80633 | $ 84459 | $ 90382 | $ 88530 | $ 86266 | $ 91343 | $ 96097 | $ 94779 | $ 285693 | $ 275834 | ||||||||||||||||||||||||||||||||||||||
| Operating Income (Loss) | 3542 | 1397 | (3480) | (6995) | (3466) | (42084) | (1740) | 2057 | (3530) | (201) | 870 | (3002) | (4713) | 1241 | 678 | (2169) | (947) | 3243 | 2810 | (2985) | 1169 | 29 | 2389 | (5044) | 712 | 7891 | 1090 | 243 | 1837 | 5554 | (2266) | 4085 | 5544 | 1623 | 6446 | (4963) | 2121 | ||||||||||||||||||||||||||||||||||||||
| Depreciation amp Amortization | 1260 | 1315 | 1160 | 1675 | 1715 | 1566 | 1963 | 1841 | 2061 | 2244 | 2367 | 2358 | 2295 | 2163 | 2160 | 2133 | 2096 | 2126 | 2119 | 2202 | 2187 | 2226 | 1973 | 1680 | 1705 | 1644 | 1591 | 1830 | 1686 | 1679 | 1755 | 1735 | 1478 | 1455 | 1468 | 8751 | 8543 | ||||||||||||||||||||||||||||||||||||||
| EBITDA | 4802 | 2712 | (2320) | (5320) | (1751) | (40518) | 223 | 3898 | (1469) | 2043 | 3237 | (644) | (2418) | 3404 | 2838 | (36) | 1149 | 5369 | 4929 | (783) | 3356 | 2255 | 4362 | (3364) | 2417 | 9535 | 2681 | 2073 | 3523 | 7233 | (511) | 5820 | 7022 | 3078 | 7914 | 3788 | 10664 | ||||||||||||||||||||||||||||||||||||||
| Excluded Costs | |||||||||||||||||||||||||||||||||||||||||||||||||||||||||||||||||||||||||||
| Severance | 745 | 465 | 282 | 122 | 185 | 6585 | 1410 | (159) | - 0 | 2 | 962 | (127) | 728 | 290 | (328) | (59) | 571 | 50 | 372 | 280 | 204 | 143 | 367 | 1662 | 465 | (9) | 139 | 144 | 628 | 64 | 31 | 126 | 27 | 1485 | 30 | 631 | 1273 | ||||||||||||||||||||||||||||||||||||||
| Stock Based Compensation (Benefit) | 227 | (95) | (538) | 467 | 198 | (1015) | 77 | 434 | 1596 | 76 | 33 | 562 | 1125 | 408 | 2423 | 2443 | (541) | 971 | (30) | 1693 | (1217) | 515 | (630) | 3801 | (30) | 415 | 2337 | 384 | 970 | 87 | 7637 | (1186) | 408 | 4839 | 2374 | 6399 | 2093 | ||||||||||||||||||||||||||||||||||||||
| Acquisition Related Costs | - 0 | - 0 | - 0 | - 0 | - 0 | - 0 | 310 | 32 | 115 | 198 | 178 | 120 | - 0 | - 0 | 286 | 425 | - 0 | - 0 | 168 | 62 | - 0 | - 0 | - 0 | ||||||||||||||||||||||||||||||||||||||||||||||||||||
| ERP Implementation Costs | 1902 | 2388 | 2344 | 339 | - 0 | - 0 | - 0 | - 0 | - 0 | - 0 | - 0 | - 0 | - 0 | - 0 | - 0 | - 0 | - 0 | - 0 | - 0 | - 0 | - 0 | - 0 | - 0 | - 0 | - 0 | - 0 | - 0 | - 0 | - 0 | - 0 | - 0 | - 0 | - 0 | ||||||||||||||||||||||||||||||||||||||||||
| Loss(Gain) on Disposal of Property | - 0 | - 0 | - 0 | 22 | - 0 | (2122) | (11) | (1588) | - 0 | - 0 | (36) | 32 | - 0 | - 0 | 97 | 45 | - 0 | - 0 | (2) | 9 | - 0 | - 0 | - 0 | - 0 | - 0 | (5422) | - 0 | - 0 | - 0 | - 0 | - 0 | - 0 | - 0 | - 0 | - 0 | 142 | 7 | ||||||||||||||||||||||||||||||||||||||
| Legal Settlement | - 0 | - 0 | - 0 | - 0 | - 0 | - 0 | - 0 | - 0 | - 0 | - 0 | - 0 | - 0 | - 0 | - 0 | (688) | - 0 | - 0 | - 0 | - 0 | - 0 | - 0 | - 0 | - 0 | - 0 | - 0 | - 0 | - 0 | - 0 | - 0 | - 0 | - 0 | - 0 | (688) | - 0 | |||||||||||||||||||||||||||||||||||||||||
| Employment Tax Matter | - 0 | - 0 | - 0 | 1200 | - 0 | - 0 | - 0 | - 0 | - 0 | - 0 | - 0 | (400) | - 0 | - 0 | - 0 | - 0 | - 0 | - 0 | - 0 | - 0 | - 0 | - 0 | - 0 | - 0 | - 0 | - 0 | - 0 | - 0 | - 0 | - 0 | - 0 | - 0 | - 0 | - 0 | |||||||||||||||||||||||||||||||||||||||||
| Lease termination gain | - 0 | - 0 | - 0 | - 0 | - 0 | - 0 | - 0 | - 0 | - 0 | - 0 | - 0 | 2928 | - 0 | - 0 | - 0 | - 0 | - 0 | - 0 | - 0 | - 0 | - 0 | - 0 | - 0 | - 0 | - 0 | - 0 | - 0 | - 0 | - 0 | (164) | - 0 | - 0 | - 0 | - 0 | - 0 | - 0 | - 0 | ||||||||||||||||||||||||||||||||||||||
| Goodwill Impairment | - 0 | - 0 | - 0 | - 0 | - 0 | 28306 | - 0 | - 0 | - 0 | - 0 | - 0 | - 0 | - 0 | - 0 | - 0 | - 0 | - 0 | - 0 | - 0 | - 0 | - 0 | - 0 | - 0 | - 0 | - 0 | - 0 | - 0 | - 0 | - 0 | - 0 | - 0 | - 0 | - 0 | - 0 | |||||||||||||||||||||||||||||||||||||||||
| Inventory Rationalization | - 0 | - 0 | - 0 | - 0 | - 0 | 3893 | - 0 | - 0 | - 0 | - 0 | - 0 | - 0 | - 0 | - 0 | - 0 | - 0 | - 0 | - 0 | - 0 | - 0 | - 0 | - 0 | - 0 | - 0 | - 0 | - 0 | - 0 | - 0 | - 0 | - 0 | - 0 | - 0 | - 0 | - 0 | |||||||||||||||||||||||||||||||||||||||||
| Discontinued operation accrual | - 0 | - 0 | - 0 | - 0 | - 0 | - 0 | - 0 | - 0 | - 0 | - 0 | - 0 | - 0 | - 0 | - 0 | - 0 | 340 | - 0 | - 0 | - 0 | 931 | - 0 | - 0 | - 0 | - 0 | - 0 | - 0 | - 0 | - 0 | - 0 | 529 | - 0 | - 0 | - 0 | - 0 | - 0 | 340 | 931 | ||||||||||||||||||||||||||||||||||||||
| North American sales meeting | - 0 | - 0 | - 0 | - 0 | - 0 | - 0 | - 0 | - 0 | 1225 | - 0 | - 0 | - 0 | - 0 | - 0 | - 0 | - 0 | 1889 | - 0 | - 0 | - 0 | - 0 | - 0 | - 0 | - 0 | - 0 | - 0 | - 0 | - 0 | - 0 | - 0 | - 0 | - 0 | - 0 | 1889 | |||||||||||||||||||||||||||||||||||||||||
| Property Impairment Loss | - 0 | - 0 | - 0 | - 0 | - 0 | - 0 | - 0 | - 0 | - 0 | - 0 | - 0 | - 0 | 2914 | 132 | - 0 | - 0 | - 0 | - 0 | - 0 | - 0 | - 0 | - 0 | - 0 | - 0 | - 0 | - 0 | - 0 | - 0 | - 0 | - 0 | - 0 | - 0 | 3046 | - 0 | |||||||||||||||||||||||||||||||||||||||||
| Building Impairment | - 0 | - 0 | - 0 | - 0 | - 0 | - 0 | - 0 | 231 | - 0 | - 0 | - 0 | ||||||||||||||||||||||||||||||||||||||||||||||||||||||||||||||||
| Reg G Adjusted EBITDA | $ 7676 | $ 5470 | $ (232) | $ (3170) | $ (1368) | $ (4871) | $ 1699 | $ 2585 | $ 1352 | $ 2121 | $ 4196 | $ 2351 | $ 2349 | $ 4234 | $ 4342 | $ 2733 | $ 3068 | $ 6390 | $ 5579 | $ 2162 | $ 2458 | $ 3111 | $ 4277 | $ 2219 | $ 2852 | $ 4519 | $ 5443 | $ 3026 | $ 5121 | $ 7749 | $ 7325 | $ 5053 | $ 7457 | $ 9402 | $ 10318 | $ 13658 | $ 17199 | ||||||||||||||||||||||||||||||||||||||
| Adjusted EBITDA of Sales | 97 | 68 | -03 | -46 | -19 | -70 | 25 | 40 | 20 | 31 | 61 | 36 | 34 | 59 | 59 | 39 | 44 | 90 | 79 | 33 | 35 | 45 | 61 | 33 | 38 | 60 | 72 | 38 | 61 | 86 | 83 | 59 | 82 | 98 | 109 | 48 | 62 | ||||||||||||||||||||||||||||||||||||||
| Annual Adjusted EBITDA of Sales | 44 | 58 | |||||||||||||||||||||||||||||||||||||||||||||||||||||||||||||||||||||||||
| Adjusted Operating Income | (3083) | (6437) | (264) | 744 | (709) | (123) | 1829 | (7) | 54 | 2071 | 2182 | 600 | 972 | 4264 | 3460 | (40) | 271 | 885 | 2304 | 539 | 1147 | 2875 | 3852 | 1196 | 3435 | 6070 | 5570 | 3087 | 5979 | 7947 | 8850 | 4907 | 8314 | ||||||||||||||||||||||||||||||||||||||||||
| Consolidated Revenues | |||||||
| 2013 | 269503 | ||||||
| 2014 | 285693 | ||||||
| 2015 | 275834 | ||||||
| 2016 | 276573 | ||||||
| 2017 | 305907 | ||||||
| 2018 | 349637 | ||||||
| TTM 93019 | 368485 | ||||||
| Net Cash(Debt) | |||||||
| 2013 | (15380) | ||||||
| 2014 | 4207 | ||||||
| 2015 | 9840 | ||||||
| 2016 | 9580 | ||||||
| 2017 | (10127) | ||||||
| 2018 | 1060 | ||||||
| 93019 | 6431 | ||||||
| Rep Count | |||||||
| 2013 | 806 | ||||||
| 2014 | 916 | ||||||
| 2015 | 937 | ||||||
| 2016 | 1009 | ||||||
| 2017 | 983 | ||||||
| 2018 | 994 | ||||||
| 93019 | 993 | ||||||
| Adjusted OI | DampA | Adjusted EBITDA | |||||
| 2013 | 990 | 9030 | 10020 | ||||
| 2014 | 4907 | 8751 | 13658 | ||||
| 2015 | 8315 | 8543 | 17199 | ||||
| 2016 | 3388 | 8066 | 12065 | ||||
| 2017 | 15840 | ||||||
| 2018 | 25248 | ||||||
| TTM 93019 | 32230 | ||||||
| Reg G EBITDA By Quarter | |||||||
| Quarter | 2017 | 2018 | 2019 | ||||
| Q1 | 2852 | 5121 | 7457 | ||||
| Q2 | 4519 | 7749 | 9402 | ||||
| Q3 | 5443 | 7325 | 10318 | ||||
| Q4 | 3026 | 5053 |
| Months of Experience | Average Annual Sales | Number of Reps | |||
| lt 12 Mos | ERRORVALUE | ERRORVALUE | |||
| 1 - 2 Yrs | ERRORVALUE | ERRORVALUE | |||
| 3 - 5 Yrs | ERRORVALUE | ERRORVALUE | |||
| 5 - 10 Yrs | ERRORVALUE | ERRORVALUE | |||
| gt 10 Yrs | ERRORVALUE | ERRORVALUE | |||
| ERRORVALUE | |||||
| Excludes ISR MSS CRS | |||||
| Excludes Freight | |||||
| Product mix | ||||||||
| Verticals | Q3 2019 Sales | |||||||
| Fastening Systems | 240 | 22485606 | ||||||
| Fluid Power | 151 | 14156064 | ||||||
| Specialy Chemicals | 117 | 10917433 | ||||||
| Cutting Tools and Abrasives | 131 | 12296596 | ||||||
| Electrical | 104 | 9724849 | ||||||
| Aftermarket Automotive Supplies | 76 | 7154688 | ||||||
| Safety | 47 | 4445846 | ||||||
| Welding and Metal Repair | 13 | 1218030 | ||||||
| Other | 120 | 11237322 | ||||||
| Total | 100 | 93636434 | ||||||
| Verticals | YTD 2019 Sales | |||||||
| Fastening Systems | 24 | 66611555 | ||||||
| Fluid Power | 15 | 42224416 | ||||||
| Specialy Chemicals | 12 | 32166853 | ||||||
| Cutting Tools and Abrasives | 13 | 36587482 | ||||||
| Electrical | 11 | 30150144 | ||||||
| Aftermarket Automotive Supplies | 8 | 21960561 | ||||||
| Safety | 5 | 13072228 | ||||||
| Welding and Metal Repair | 2 | 4306548 | ||||||
| Other | 10 | 31279779 | ||||||
| Total | 100 | 278359566 |
| Lawson core customer mix | ||||||||
| Account Tyoe | Q3 | |||||||
| Regional Accounts | 43045893 | 45 | ||||||
| Strategic | 14086813 | 15 | ||||||
| Kent Automotive | 14300065 | 15 | ||||||
| Bolt Supply | 11318703 | 12 | ||||||
| Government | 10291732 | 11 | ||||||
| Screw Products | 0 | 0 | ||||||
| Other (1) | 1735236 | 2 | ||||||
| Total | 94778443 | 100 | ||||||
| Account Tyoe | YTD September | |||||||
| Regional Accounts | 131389537 | 47 | ||||||
| Strategic | 40364305 | 14 | ||||||
| Kent Automotive | 43371411 | 15 | ||||||
| Bolt Supply | 31324209 | 11 | ||||||
| Government | 29794959 | 11 | ||||||
| Screw Products | 0 | 0 | ||||||
| Other | 5974302 | 2 | ||||||
| Total | 282218723 | 100 | ||||||
| Total Reported |
| September 30 | December 31 | ||||||||||
| 2019 | 2018 | ||||||||||
| ASSETS | (Unaudited) | ||||||||||
| Current assets | |||||||||||
| Cash and cash equivalents | $ | 8626 | $ | 11883 | |||||||
| Restricted cash | 800 | 800 | |||||||||
| Accounts receivable less allowance for doubtful accounts of $614 and $549 respectively | 45162 | 37682 | |||||||||
| Inventories net | 54894 | 52887 | |||||||||
| Miscellaneous receivables and prepaid expenses | 4270 | 3653 | |||||||||
| Total current assets | 113752 | 106905 | |||||||||
| Property plant and equipment net | 16932 | 23548 | |||||||||
| Deferred income taxes | 17372 | 20592 | |||||||||
| Goodwill | 20582 | 20079 | |||||||||
| Cash value of life insurance | 14440 | 12599 | |||||||||
| Intangible assets net | 12468 | 13112 | |||||||||
| Lease assets | 11917 | mdash | |||||||||
| Other assets | 275 | 307 | |||||||||
| Total assets | $ | 207738 | $ | 197142 | |||||||
| LIABILITIES AND STOCKHOLDERSrsquo EQUITY | |||||||||||
| Current liabilities | |||||||||||
| Revolving lines of credit | $ | 2195 | $ | 10823 | |||||||
| Accounts payable | 16325 | 15207 | |||||||||
| Lease obligation | 3781 | mdash | |||||||||
| Accrued expenses and other liabilities | 37873 | 40179 | |||||||||
| Total current liabilities | 60174 | 66209 | |||||||||
| Security bonus plan | 11969 | 12413 | |||||||||
| Lease obligation | 10360 | 5213 | |||||||||
| Deferred compensation | 5915 | 5304 | |||||||||
| Deferred tax liability | 2879 | 2761 | |||||||||
| Other liabilities | 3460 | 6069 | |||||||||
| Total liabilities | 94757 | 97969 | |||||||||
| Stockholdersrsquo equity | |||||||||||
| Preferred stock $1 par value | |||||||||||
| Authorized - 500000 shares Issued and outstanding mdash None | mdash | mdash | |||||||||
| Common stock $1 par value | |||||||||||
| Authorized - 35000000 shares | 9043 | 9006 | |||||||||
| Issued - 9042597 and 9005716 shares respectively | |||||||||||
| Outstanding - 8956981 and 8955930 shares respectively | |||||||||||
| Capital in excess of par value | 17626 | 15623 | |||||||||
| Retained earnings | 89502 | 77338 | |||||||||
| Treasury stock ndash 85616 and 49786 shares respectively | (2595) | (1234) | |||||||||
| Accumulated other comprehensive loss | (595) | (1560) | |||||||||
| Total stockholdersrsquo equity | 112981 | 99173 | |||||||||
| Total liabilities and stockholdersrsquo equity | $ | 207738 | $ | 197142 | |||||||
| Three Months Ended | |||||||||||||||||||||||||||||
| Jun 30 2019 | Mar 31 2019 | Dec 31 2018 | Sep 30 2018 | Jun 30 2018 | |||||||||||||||||||||||||
| Average daily net sales | $ | 1502 | $ | 1450 | $ | 1414 | $ | 1405 | $ | 1412 | |||||||||||||||||||
| Year over year increase | 63 | 82 | 70 | 170 | 205 | ||||||||||||||||||||||||
| Sequential quarter increase (decrease) | 36 | 25 | 06 | (05) | 53 | ||||||||||||||||||||||||
| Net Sales | $ | 96097 | $ | 91343 | $ | 86266 | $ | 88530 | $ | 90382 | |||||||||||||||||||
| Gross profit (1) | 51043 | 48923 | 46083 | 48108 | 49131 | ||||||||||||||||||||||||
| Gross profit percentage (1) | 531 | 536 | 534 | 543 | 544 | ||||||||||||||||||||||||
| Selling general amp administrative expenses | $ | 49420 | $ | 43379 | $ | 41998 | $ | 50374 | $ | 43577 | |||||||||||||||||||
| Operating income (loss) | $ | 1623 | $ | 5544 | $ | 4085 | $ | (2266) | $ | 5554 | |||||||||||||||||||
| Full Year | |||||||||||||||||||||||||||||||||||||||||||||||||||||||||||||||||||||||||||
| ($ in thousands) | Q1 2011 | Q2 2011 | Q3 2011 | Q4 2011 | Q1 2012 | Q2 2012 | Q3 2012 | Q4 2012 | Q1 2013 | Q2 2013 | Q3 2013 | Q4 2013 | Q1 2014 | Q2 2014 | Q3 2014 | Q4 2014 | Q1 2015 | Q2 2015 | Q3 2015 | Q4 2015 | Q1 2016 | Q2 2016 | Q3 2016 | Q4 2016 | Q1 2017 | Q2 2017 | Q3 2017 | Q4 2017 | Q1 2018 | Q2 2018 | Q3 2018 | Q4 2018 | Q1 2019 | Q2 2019 | Q3 2019 | 2014 | 2015 | ||||||||||||||||||||||||||||||||||||||
| Net Sales | $ 79255 | $ 80625 | $ 71490 | $ 69029 | $ 71364 | $ 69830 | $ 67863 | $ 64505 | $ 67213 | $ 68317 | $ 68235 | $ 65738 | $ 69204 | $ 72080 | $ 74128 | $ 70281 | $ 69904 | $ 70726 | $ 70243 | $ 64961 | $ 69711 | $ 69348 | $ 70199 | $ 67315 | $ 74617 | $ 75006 | $ 75651 | $ 80633 | $ 84459 | $ 90382 | $ 88530 | $ 86266 | $ 91343 | $ 96097 | $ 94779 | $ 285693 | $ 275834 | ||||||||||||||||||||||||||||||||||||||
| Operating Income (Loss) | 3542 | 1397 | (3480) | (6995) | (3466) | (42084) | (1740) | 2057 | (3530) | (201) | 870 | (3002) | (4713) | 1241 | 678 | (2169) | (947) | 3243 | 2810 | (2985) | 1169 | 29 | 2389 | (5044) | 712 | 7891 | 1090 | 243 | 1837 | 5554 | (2266) | 4085 | 5544 | 1623 | 6446 | (4963) | 2121 | ||||||||||||||||||||||||||||||||||||||
| Depreciation amp Amortization | 1260 | 1315 | 1160 | 1675 | 1715 | 1566 | 1963 | 1841 | 2061 | 2244 | 2367 | 2358 | 2295 | 2163 | 2160 | 2133 | 2096 | 2126 | 2119 | 2202 | 2187 | 2226 | 1973 | 1680 | 1705 | 1644 | 1591 | 1830 | 1686 | 1679 | 1755 | 1735 | 1478 | 1455 | 1468 | 8751 | 8543 | ||||||||||||||||||||||||||||||||||||||
| EBITDA | 4802 | 2712 | (2320) | (5320) | (1751) | (40518) | 223 | 3898 | (1469) | 2043 | 3237 | (644) | (2418) | 3404 | 2838 | (36) | 1149 | 5369 | 4929 | (783) | 3356 | 2255 | 4362 | (3364) | 2417 | 9535 | 2681 | 2073 | 3523 | 7233 | (511) | 5820 | 7022 | 3078 | 7914 | 3788 | 10664 | ||||||||||||||||||||||||||||||||||||||
| Excluded Costs | |||||||||||||||||||||||||||||||||||||||||||||||||||||||||||||||||||||||||||
| Severance | 745 | 465 | 282 | 122 | 185 | 6585 | 1410 | (159) | - 0 | 2 | 962 | (127) | 728 | 290 | (328) | (59) | 571 | 50 | 372 | 280 | 204 | 143 | 367 | 1662 | 465 | (9) | 139 | 144 | 628 | 64 | 31 | 126 | 27 | 1485 | 30 | 631 | 1273 | ||||||||||||||||||||||||||||||||||||||
| Stock Based Compensation (Benefit) | 227 | (95) | (538) | 467 | 198 | (1015) | 77 | 434 | 1596 | 76 | 33 | 562 | 1125 | 408 | 2423 | 2443 | (541) | 971 | (30) | 1693 | (1217) | 515 | (630) | 3801 | (30) | 415 | 2337 | 384 | 970 | 87 | 7637 | (1186) | 408 | 4839 | 2374 | 6399 | 2093 | ||||||||||||||||||||||||||||||||||||||
| Acquisition Related Costs | - 0 | - 0 | - 0 | - 0 | - 0 | - 0 | 310 | 32 | 115 | 198 | 178 | 120 | - 0 | - 0 | 286 | 425 | - 0 | - 0 | 168 | 62 | - 0 | - 0 | - 0 | ||||||||||||||||||||||||||||||||||||||||||||||||||||
| ERP Implementation Costs | 1902 | 2388 | 2344 | 339 | - 0 | - 0 | - 0 | - 0 | - 0 | - 0 | - 0 | - 0 | - 0 | - 0 | - 0 | - 0 | - 0 | - 0 | - 0 | - 0 | - 0 | - 0 | - 0 | - 0 | - 0 | - 0 | - 0 | - 0 | - 0 | - 0 | - 0 | - 0 | - 0 | ||||||||||||||||||||||||||||||||||||||||||
| Loss(Gain) on Disposal of Property | - 0 | - 0 | - 0 | 22 | - 0 | (2122) | (11) | (1588) | - 0 | - 0 | (36) | 32 | - 0 | - 0 | 97 | 45 | - 0 | - 0 | (2) | 9 | - 0 | - 0 | - 0 | - 0 | - 0 | (5422) | - 0 | - 0 | - 0 | - 0 | - 0 | - 0 | - 0 | - 0 | - 0 | 142 | 7 | ||||||||||||||||||||||||||||||||||||||
| Legal Settlement | - 0 | - 0 | - 0 | - 0 | - 0 | - 0 | - 0 | - 0 | - 0 | - 0 | - 0 | - 0 | - 0 | - 0 | (688) | - 0 | - 0 | - 0 | - 0 | - 0 | - 0 | - 0 | - 0 | - 0 | - 0 | - 0 | - 0 | - 0 | - 0 | - 0 | - 0 | - 0 | (688) | - 0 | |||||||||||||||||||||||||||||||||||||||||
| Employment Tax Matter | - 0 | - 0 | - 0 | 1200 | - 0 | - 0 | - 0 | - 0 | - 0 | - 0 | - 0 | (400) | - 0 | - 0 | - 0 | - 0 | - 0 | - 0 | - 0 | - 0 | - 0 | - 0 | - 0 | - 0 | - 0 | - 0 | - 0 | - 0 | - 0 | - 0 | - 0 | - 0 | - 0 | - 0 | |||||||||||||||||||||||||||||||||||||||||
| Lease termination gain | - 0 | - 0 | - 0 | - 0 | - 0 | - 0 | - 0 | - 0 | - 0 | - 0 | - 0 | 2928 | - 0 | - 0 | - 0 | - 0 | - 0 | - 0 | - 0 | - 0 | - 0 | - 0 | - 0 | - 0 | - 0 | - 0 | - 0 | - 0 | - 0 | (164) | - 0 | - 0 | - 0 | - 0 | - 0 | - 0 | - 0 | ||||||||||||||||||||||||||||||||||||||
| Goodwill Impairment | - 0 | - 0 | - 0 | - 0 | - 0 | 28306 | - 0 | - 0 | - 0 | - 0 | - 0 | - 0 | - 0 | - 0 | - 0 | - 0 | - 0 | - 0 | - 0 | - 0 | - 0 | - 0 | - 0 | - 0 | - 0 | - 0 | - 0 | - 0 | - 0 | - 0 | - 0 | - 0 | - 0 | - 0 | |||||||||||||||||||||||||||||||||||||||||
| Inventory Rationalization | - 0 | - 0 | - 0 | - 0 | - 0 | 3893 | - 0 | - 0 | - 0 | - 0 | - 0 | - 0 | - 0 | - 0 | - 0 | - 0 | - 0 | - 0 | - 0 | - 0 | - 0 | - 0 | - 0 | - 0 | - 0 | - 0 | - 0 | - 0 | - 0 | - 0 | - 0 | - 0 | - 0 | - 0 | |||||||||||||||||||||||||||||||||||||||||
| Discontinued operation accrual | - 0 | - 0 | - 0 | - 0 | - 0 | - 0 | - 0 | - 0 | - 0 | - 0 | - 0 | - 0 | - 0 | - 0 | - 0 | 340 | - 0 | - 0 | - 0 | 931 | - 0 | - 0 | - 0 | - 0 | - 0 | - 0 | - 0 | - 0 | - 0 | 529 | - 0 | - 0 | - 0 | - 0 | - 0 | 340 | 931 | ||||||||||||||||||||||||||||||||||||||
| North American sales meeting | - 0 | - 0 | - 0 | - 0 | - 0 | - 0 | - 0 | - 0 | 1225 | - 0 | - 0 | - 0 | - 0 | - 0 | - 0 | - 0 | 1889 | - 0 | - 0 | - 0 | - 0 | - 0 | - 0 | - 0 | - 0 | - 0 | - 0 | - 0 | - 0 | - 0 | - 0 | - 0 | - 0 | 1889 | |||||||||||||||||||||||||||||||||||||||||
| Property Impairment Loss | - 0 | - 0 | - 0 | - 0 | - 0 | - 0 | - 0 | - 0 | - 0 | - 0 | - 0 | - 0 | 2914 | 132 | - 0 | - 0 | - 0 | - 0 | - 0 | - 0 | - 0 | - 0 | - 0 | - 0 | - 0 | - 0 | - 0 | - 0 | - 0 | - 0 | - 0 | - 0 | 3046 | - 0 | |||||||||||||||||||||||||||||||||||||||||
| Building Impairment | - 0 | - 0 | - 0 | - 0 | - 0 | - 0 | - 0 | 231 | - 0 | - 0 | - 0 | ||||||||||||||||||||||||||||||||||||||||||||||||||||||||||||||||
| Reg G Adjusted EBITDA | $ 7676 | $ 5470 | $ (232) | $ (3170) | $ (1368) | $ (4871) | $ 1699 | $ 2585 | $ 1352 | $ 2121 | $ 4196 | $ 2351 | $ 2349 | $ 4234 | $ 4342 | $ 2733 | $ 3068 | $ 6390 | $ 5579 | $ 2162 | $ 2458 | $ 3111 | $ 4277 | $ 2219 | $ 2852 | $ 4519 | $ 5443 | $ 3026 | $ 5121 | $ 7749 | $ 7325 | $ 5053 | $ 7457 | $ 9402 | $ 10318 | $ 13658 | $ 17199 | ||||||||||||||||||||||||||||||||||||||
| Adjusted EBITDA of Sales | 97 | 68 | -03 | -46 | -19 | -70 | 25 | 40 | 20 | 31 | 61 | 36 | 34 | 59 | 59 | 39 | 44 | 90 | 79 | 33 | 35 | 45 | 61 | 33 | 38 | 60 | 72 | 38 | 61 | 86 | 83 | 59 | 82 | 98 | 109 | 48 | 62 | ||||||||||||||||||||||||||||||||||||||
| Annual Adjusted EBITDA of Sales | 44 | 58 | |||||||||||||||||||||||||||||||||||||||||||||||||||||||||||||||||||||||||
| Adjusted Operating Income | (3083) | (6437) | (264) | 744 | (709) | (123) | 1829 | (7) | 54 | 2071 | 2182 | 600 | 972 | 4264 | 3460 | (40) | 271 | 885 | 2304 | 539 | 1147 | 2875 | 3852 | 1196 | 3435 | 6070 | 5570 | 3087 | 5979 | 7947 | 8850 | 4907 | 8314 | ||||||||||||||||||||||||||||||||||||||||||
| Consolidated Revenues | |||||||
| 2013 | 269503 | ||||||
| 2014 | 285693 | ||||||
| 2015 | 275834 | ||||||
| 2016 | 276573 | ||||||
| 2017 | 305907 | ||||||
| 2018 | 349637 | ||||||
| TTM 63019 | 362236 | ||||||
| Net Cash(Debt) | |||||||
| 2013 | (15380) | ||||||
| 2014 | 4207 | ||||||
| 2015 | 9840 | ||||||
| 2016 | 9580 | ||||||
| 2017 | (10127) | ||||||
| 2018 | 1060 | ||||||
| 63019 | (1908) | ||||||
| Rep Count | |||||||
| 2013 | 806 | ||||||
| 2014 | 916 | ||||||
| 2015 | 937 | ||||||
| 2016 | 1009 | ||||||
| 2017 | 983 | ||||||
| 2018 | 994 | ||||||
| 63019 | 982 | ||||||
| Adjusted OI | DampA | Adjusted EBITDA | |||||
| 2013 | 990 | 9030 | 10020 | ||||
| 2014 | 4907 | 8751 | 13658 | ||||
| 2015 | 8315 | 8543 | 17199 | ||||
| 2016 | 3388 | 8066 | 12065 | ||||
| 2017 | 15840 | ||||||
| 2018 | 25248 | ||||||
| TTM 63019 | 29237 | ||||||
| Reg G EBITDA By Quarter | |||||||
| Quarter | 2017 | 2018 | 2019 | ||||
| Q1 | 2852 | 5121 | 7457 | ||||
| Q2 | 4519 | 7749 | 9402 | ||||
| Q3 | 5443 | 7325 | |||||
| Q4 | 3026 | 5053 |
| Months of Experience | Average Annual Sales | Number of Reps | |||
| lt 12 Mos | ERRORVALUE | ERRORVALUE | |||
| 1 - 2 Yrs | ERRORVALUE | ERRORVALUE | |||
| 3 - 5 Yrs | ERRORVALUE | ERRORVALUE | |||
| 5 - 10 Yrs | ERRORVALUE | ERRORVALUE | |||
| gt 10 Yrs | ERRORVALUE | ERRORVALUE | |||
| ERRORVALUE | |||||
| Excludes ISR MSS CRS | |||||
| Excludes Freight | |||||
| Product mix | ||||||||
| Verticals | Q2 2019 Sales | |||||||
| Fastening Systems | 243 | 23008646 | ||||||
| Fluid Power | 152 | 14395529 | ||||||
| Specialy Chemicals | 117 | 11074332 | ||||||
| Cutting Tools and Abrasives | 130 | 12319702 | ||||||
| Electrical | 107 | 10102828 | ||||||
| Aftermarket Automotive Supplies | 77 | 7255974 | ||||||
| Safety | 47 | 4458217 | ||||||
| Welding and Metal Repair | 16 | 1539172 | ||||||
| Other | 112 | 10633378 | ||||||
| Total | 100 | 94787779 | ||||||
| Verticals | YTD 2019 Sales | |||||||
| Fastening Systems | 24 | 44125949 | ||||||
| Fluid Power | 15 | 28068352 | ||||||
| Specialy Chemicals | 12 | 21249420 | ||||||
| Cutting Tools and Abrasives | 13 | 24290887 | ||||||
| Electrical | 11 | 20425294 | ||||||
| Aftermarket Automotive Supplies | 8 | 14805874 | ||||||
| Safety | 5 | 8626381 | ||||||
| Welding and Metal Repair | 2 | 3088518 | ||||||
| Other | 10 | 20042457 | ||||||
| Total | 100 | 184723132 |
| Lawson core customer mix | ||||||||
| Account Tyoe | Q2 | |||||||
| Regional Accounts | 44933707 | 47 | ||||||
| Strategic | 13542786 | 14 | ||||||
| Kent Automotive | 14370813 | 15 | ||||||
| Bolt Supply | 11129675 | 12 | ||||||
| Government | 10087561 | 10 | ||||||
| Screw Products | 0 | 0 | ||||||
| Other (1) | 1428268 | 1 | ||||||
| Total | 96097363 | 100 | ||||||
| Account Tyoe | YTD June | |||||||
| Regional Accounts | 88400675 | 47 | ||||||
| Strategic | 26218365 | 14 | ||||||
| Kent Automotive | 29071347 | 16 | ||||||
| Bolt Supply | 20005505 | 11 | ||||||
| Government | 19505323 | 10 | ||||||
| Screw Products | 0 | 0 | ||||||
| Other | 4239066 | 2 | ||||||
| Total | 187440280 | 100 | ||||||
| Total Reported |
| August 2011 | OslashImplemented SAP | ||
| October 2011 | OslashCommenced construction of new McCook Ill distribution center | ||
| May 2012 | OslashRelocated corporate headquarters | ||
| June 2012 | OslashRestructured senior team Announced $20M cost savings plan | ||
| August 2012 | OslashTransitioned packaging facility to McCook Ill distribution center | ||
| OslashEntered into new five-year $40M credit facility | |||
| October 2012 | OslashAnnounced new CEO and President Michael G DeCata | ||
| OslashConsolidated Vernon Hills distribution center into McCook Ill | |||
| November 2012 | OslashRolled out new website to existing web customers | ||
| December 2012 | OslashCompleted transition of US independent agents to employees | ||
| April 2013 | OslashRoll-out of new website to new web customers | ||
| AprilMay 2013 | OslashMcCook DC begins to ship customer orders | ||
| November 2013 | OslashEntered into sub-lease of headquarters space to generate $29M of future cash savings | ||
| December 2013 | OslashEnded year with over 800 sales reps ndash First increase in 8 years | ||
| February 2014 | OslashClosed on Automatic Screw Machine Products sale for net proceeds of $121M | ||
| June 2014 | OslashEntered into sale-leaseback of Reno distribution facility for net proceeds of $83M | ||
| December 2014 | OslashEnded year with over 900 sales reps | ||
| February 2015 | OslashHeld North American sales meeting | ||
| September 2015 | OslashCompleted West Coast Fasteners acquisition | ||
| March 2016 | OslashCompleted Perfect Products of Michigan acquisition | ||
| May 2016 | OslashCompleted F B Feeney acquisition | ||
| June 2016 | OslashExpanded sales team to over 1000 sales reps | ||
| September 2016 | OslashExtended credit facitlity to August 2020 | ||
| November 2016 | OslashCompleted Mattic Industries acquisition | ||
| March 2017 | OslashConsolidated Fairfield NJ distribution operations into McCook Ill and Suwanee GA | ||
| May 2017 | OslashSold Fairfield NJ distribution center for a gain of $54M | ||
| October 2017 | OslashCompleted Bolt Supply House acquisition | ||
| April 2018 | OslashOpened MRO distribution center in Calgary Canada | ||
| October 2018 | OslashCompleted Screw Products acquisition and added Bolt Supply branch | ||
| June 2019 | OslashAchieved Q2 98 adjusted EBITDA net of ASC 842 impact of 03 | ||
| September 2019 | OslashAchieved Q3 109 adjusted EBITDA hired VP MampA | ||
| October 2019 | OslashEntered into new five-year $100M credit facility with additional $50 million accordion feature |
| ($ in thousands) | Q3 2013 | Q4 2013 | Q1 2014 | Q2 2014 | Q3 2014 | Q4 2014 | Q1 2015 | Q2 2015 | Q3 2015 | Q4 2015 | Q1 2016 | Q2 2016 | Q3 2016 | Q4 2016 | Q1 2017 | Q2 2017 | Q3 2017 | Q4 2017 | ||||||||||||||||||||||||||||||||||||||||||||||
| SGampA | 40350 | 42856 | 45991 | 42562 | 43855 | 44764 | 43830 | 40565 | 40532 | 41145 | 41290 | 42497 | 40184 | 45548 | 44167 | 42672 | 44915 | 46750 | $ 173014 | |||||||||||||||||||||||||||||||||||||||||||||
| $ - | ||||||||||||||||||||||||||||||||||||||||||||||||||||||||||||||||
| Excluded Costs | $ - | 40196 | ||||||||||||||||||||||||||||||||||||||||||||||||||||||||||||||
| Severance | (962) | 127 | (728) | (290) | 328 | 59 | (571) | (50) | (372) | (280) | (204) | (143) | (367) | (1662) | (465) | 9 | (139) | (144) | $ (234) | 127 | ||||||||||||||||||||||||||||||||||||||||||||
| Stock Based Compensation (Benefit) | (33) | (562) | (1125) | (408) | (2423) | (2443) | 541 | (971) | 30 | (1693) | 1217 | (515) | 630 | (3801) | 30 | (415) | (2337) | (384) | $ (5296) | -32 | ||||||||||||||||||||||||||||||||||||||||||||
| Loss(Gain) on Disposal of Property | 36 | (32) | - 0 | - 0 | (97) | (45) | - 0 | - 0 | 2 | (9) | - 0 | - 0 | - 0 | - 0 | - 0 | - 0 | - 0 | - 0 | $ (142) | |||||||||||||||||||||||||||||||||||||||||||||
| Legal Settlement | - 0 | - 0 | - 0 | - 0 | 688 | - 0 | - 0 | - 0 | - 0 | - 0 | - 0 | - 0 | - 0 | - 0 | - 0 | - 0 | - 0 | - 0 | $ 688 | -562 | ||||||||||||||||||||||||||||||||||||||||||||
| Employment Tax Matter | - 0 | 400 | - 0 | - 0 | - 0 | - 0 | - 0 | - 0 | - 0 | - 0 | - 0 | - 0 | - 0 | - 0 | - 0 | - 0 | - 0 | - 0 | $ - | 39729 | ||||||||||||||||||||||||||||||||||||||||||||
| Loss on Sub-Lease | - 0 | (2928) | - 0 | - 0 | - 0 | - 0 | - 0 | - 0 | - 0 | - 0 | - 0 | - 0 | - 0 | - 0 | - 0 | - 0 | - 0 | - 0 | $ - | |||||||||||||||||||||||||||||||||||||||||||||
| National sales meeting | - 0 | - 0 | - 0 | - 0 | - 0 | - 0 | (1889) | - 0 | - 0 | - 0 | - 0 | - 0 | - 0 | - 0 | - 0 | - 0 | - 0 | - 0 | $ (1889) | |||||||||||||||||||||||||||||||||||||||||||||
| Remediation expense | - 0 | - 0 | - 0 | - 0 | - 0 | (340) | - 0 | - 0 | - 0 | - 0 | - 0 | - 0 | - 0 | - 0 | - 0 | - 0 | - 0 | - 0 | $ (340) | |||||||||||||||||||||||||||||||||||||||||||||
| Property Impairment Loss | - 0 | - 0 | (2914) | (132) | - 0 | - 0 | - 0 | - 0 | - 0 | - 0 | - 0 | - 0 | - 0 | - 0 | - 0 | - 0 | - 0 | - 0 | $ - | |||||||||||||||||||||||||||||||||||||||||||||
| Adjusted SGampA | $ 39391 | $ 39861 | $ 41224 | $ 41732 | $ 42351 | $ 41995 | $ 41911 | $ 39544 | $ 40192 | $ 39163 | $ 42303 | $ 41839 | $ 40447 | $ 40085 | $ 43732 | $ 42266 | $ 42439 | $ 46222 | $ 165801 | |||||||||||||||||||||||||||||||||||||||||||||
| Annual Adjusted EBITDA of Sales | ERRORREF | ERRORREF | ||||||||||||||||||||||||||||||||||||||||||||||||||||||||||||||
| Q1 2013 | Q2 2013 | Q3 2013 | Q4 2013 | Q1 2014 | Q2 2014 | Q3 2014 | Q4 2014 | Q1 2015 | |||||||||||
| Selling Days | 63 | 64 | 64 | 61 | 63 | 64 | 64 | 61 | 63 | ||||||||||
| Net Sales | 67213 | 68317 | 68235 | 65738 | 69204 | 72080 | 74128 | 70281 | 69904 | ||||||||||
| Average Daily Sales | 1067 | 1067 | 1066 | 1078 | 1098 | 1126 | 1158 | 1152 | 1110 | ||||||||||
| Average Sales Rep Count | 762 | 764 | 774 | 794 | 819 | 854 | 882 | 908 | 911 | ||||||||||
| Sales per Sales Rep per Day | 1400 | 1397 | 1377 | 1358 | 1341 | 1319 | 1313 | 1269 | 1218 | ||||||||||
| Full Year | ||||||||||||||||||||||||||||||||||||||||||||||||||||||||||||||||||||
| ($ in thousands) | Q1 2011 | Q2 2011 | Q3 2011 | Q4 2011 | Q1 2012 | Q2 2012 | Q3 2012 | Q4 2012 | Q1 2013 | Q2 2013 | Q3 2013 | Q4 2013 | Q1 2014 | Q2 2014 | Q3 2014 | Q4 2014 | Q1 2015 | Q2 2015 | Q3 2015 | Q4 2015 | Q1 2016 | Q2 2016 | Q3 2016 | Q4 2016 | Q1 2017 | Q2 2017 | Q3 2017 | Q4 2017 | Q1 2018 | Q2 2018 | Q3 2018 | 2014 | 2015 | |||||||||||||||||||||||||||||||||||
| Net Sales | $ 79255 | $ 80625 | $ 71490 | $ 69029 | $ 71364 | $ 69830 | $ 67863 | $ 64505 | $ 67213 | $ 68317 | $ 68235 | $ 65738 | $ 69204 | $ 72080 | $ 74128 | $ 70281 | $ 69904 | $ 70726 | $ 70243 | $ 64961 | $ 69711 | $ 69348 | $ 70199 | $ 67315 | $ 74617 | $ 75006 | $ 75651 | $ 80633 | $ 84459 | $ 90382 | $ 88530 | $ 285693 | $ 275834 | |||||||||||||||||||||||||||||||||||
| Operating Income (Loss) | 3542 | 1397 | (3480) | (6995) | (3466) | (42084) | (1740) | 2057 | (3530) | (201) | 870 | (3002) | (4713) | 1241 | 678 | (2169) | (947) | 3243 | 2810 | (2985) | 1169 | 29 | 2389 | (5044) | 712 | 7891 | 1090 | 243 | 1837 | 5554 | (2266) | (4963) | 2121 | |||||||||||||||||||||||||||||||||||
| Depreciation amp Amortization | 1260 | 1315 | 1160 | 1675 | 1715 | 1566 | 1963 | 1841 | 2061 | 2244 | 2367 | 2358 | 2295 | 2163 | 2160 | 2133 | 2096 | 2126 | 2119 | 2202 | 2187 | 2226 | 1973 | 1680 | 1705 | 1644 | 1591 | 1830 | 1686 | 1679 | 1755 | 8751 | 8543 | |||||||||||||||||||||||||||||||||||
| EBITDA | 4802 | 2712 | (2320) | (5320) | (1751) | (40518) | 223 | 3898 | (1469) | 2043 | 3237 | (644) | (2418) | 3404 | 2838 | (36) | 1149 | 5369 | 4929 | (783) | 3356 | 2255 | 4362 | (3364) | 2417 | 9535 | 2681 | 2073 | 3523 | 7233 | (511) | 3788 | 10664 | |||||||||||||||||||||||||||||||||||
| Excluded Costs | ||||||||||||||||||||||||||||||||||||||||||||||||||||||||||||||||||||
| Severance | 745 | 465 | 282 | 122 | 185 | 6585 | 1410 | (159) | - 0 | 2 | 962 | (127) | 728 | 290 | (328) | (59) | 571 | 50 | 372 | 280 | 204 | 143 | 367 | 1662 | 465 | (9) | 139 | 144 | 628 | 64 | 31 | 631 | 1273 | |||||||||||||||||||||||||||||||||||
| Stock Based Compensation (Benefit) | 227 | (95) | (538) | 467 | 198 | (1015) | 77 | 434 | 1596 | 76 | 33 | 562 | 1125 | 408 | 2423 | 2443 | (541) | 971 | (30) | 1693 | (1217) | 515 | (630) | 3801 | (30) | 415 | 2337 | 384 | 970 | 87 | 7637 | 6399 | 2093 | |||||||||||||||||||||||||||||||||||
| Acquisition Related Costs | - 0 | - 0 | - 0 | - 0 | - 0 | - 0 | 310 | 32 | 115 | 198 | 178 | 120 | - 0 | - 0 | 286 | 425 | - 0 | - 0 | 168 | |||||||||||||||||||||||||||||||||||||||||||||||||
| ERP Implementation Costs | 1902 | 2388 | 2344 | 339 | - 0 | - 0 | - 0 | - 0 | - 0 | - 0 | - 0 | - 0 | - 0 | - 0 | - 0 | - 0 | - 0 | - 0 | - 0 | - 0 | - 0 | - 0 | - 0 | - 0 | - 0 | - 0 | - 0 | - 0 | - 0 | - 0 | - 0 | - 0 | ||||||||||||||||||||||||||||||||||||
| Loss(Gain) on Disposal of Property | - 0 | - 0 | - 0 | 22 | - 0 | (2122) | (11) | (1588) | - 0 | - 0 | (36) | 32 | - 0 | - 0 | 97 | 45 | - 0 | - 0 | (2) | 9 | - 0 | - 0 | - 0 | - 0 | - 0 | (5422) | - 0 | - 0 | - 0 | - 0 | - 0 | 142 | 7 | |||||||||||||||||||||||||||||||||||
| Legal Settlement | - 0 | - 0 | - 0 | - 0 | - 0 | - 0 | - 0 | - 0 | - 0 | - 0 | - 0 | - 0 | - 0 | - 0 | (688) | - 0 | - 0 | - 0 | - 0 | - 0 | - 0 | - 0 | - 0 | - 0 | - 0 | - 0 | - 0 | - 0 | - 0 | - 0 | - 0 | (688) | - 0 | |||||||||||||||||||||||||||||||||||
| Employment Tax Matter | - 0 | - 0 | - 0 | 1200 | - 0 | - 0 | - 0 | - 0 | - 0 | - 0 | - 0 | (400) | - 0 | - 0 | - 0 | - 0 | - 0 | - 0 | - 0 | - 0 | - 0 | - 0 | - 0 | - 0 | - 0 | - 0 | - 0 | - 0 | - 0 | - 0 | - 0 | - 0 | - 0 | |||||||||||||||||||||||||||||||||||
| Lease termination gain | - 0 | - 0 | - 0 | - 0 | - 0 | - 0 | - 0 | - 0 | - 0 | - 0 | - 0 | 2928 | - 0 | - 0 | - 0 | - 0 | - 0 | - 0 | - 0 | - 0 | - 0 | - 0 | - 0 | - 0 | - 0 | - 0 | - 0 | - 0 | - 0 | (164) | - 0 | - 0 | - 0 | |||||||||||||||||||||||||||||||||||
| Goodwill Impairment | - 0 | - 0 | - 0 | - 0 | - 0 | 28306 | - 0 | - 0 | - 0 | - 0 | - 0 | - 0 | - 0 | - 0 | - 0 | - 0 | - 0 | - 0 | - 0 | - 0 | - 0 | - 0 | - 0 | - 0 | - 0 | - 0 | - 0 | - 0 | - 0 | - 0 | - 0 | - 0 | - 0 | |||||||||||||||||||||||||||||||||||
| Inventory Rationalization | - 0 | - 0 | - 0 | - 0 | - 0 | 3893 | - 0 | - 0 | - 0 | - 0 | - 0 | - 0 | - 0 | - 0 | - 0 | - 0 | - 0 | - 0 | - 0 | - 0 | - 0 | - 0 | - 0 | - 0 | - 0 | - 0 | - 0 | - 0 | - 0 | - 0 | - 0 | - 0 | - 0 | |||||||||||||||||||||||||||||||||||
| Discontinued operation accrual | - 0 | - 0 | - 0 | - 0 | - 0 | - 0 | - 0 | - 0 | - 0 | - 0 | - 0 | - 0 | - 0 | - 0 | - 0 | 340 | - 0 | - 0 | - 0 | 931 | - 0 | - 0 | - 0 | - 0 | - 0 | - 0 | - 0 | - 0 | - 0 | 529 | - 0 | 340 | 931 | |||||||||||||||||||||||||||||||||||
| North American sales meeting | - 0 | - 0 | - 0 | - 0 | - 0 | - 0 | - 0 | - 0 | 1225 | - 0 | - 0 | - 0 | - 0 | - 0 | - 0 | - 0 | 1889 | - 0 | - 0 | - 0 | - 0 | - 0 | - 0 | - 0 | - 0 | - 0 | - 0 | - 0 | - 0 | - 0 | - 0 | - 0 | 1889 | |||||||||||||||||||||||||||||||||||
| Property Impairment Loss | - 0 | - 0 | - 0 | - 0 | - 0 | - 0 | - 0 | - 0 | - 0 | - 0 | - 0 | - 0 | 2914 | 132 | - 0 | - 0 | - 0 | - 0 | - 0 | - 0 | - 0 | - 0 | - 0 | - 0 | - 0 | - 0 | - 0 | - 0 | - 0 | - 0 | - 0 | 3046 | - 0 | |||||||||||||||||||||||||||||||||||
| Adjusted EBITDA | $ 7676 | $ 5470 | $ (232) | $ (3170) | $ (1368) | $ (4871) | $ 1699 | $ 2585 | $ 1352 | $ 2121 | $ 4196 | $ 2351 | $ 2349 | $ 4234 | $ 4342 | $ 2733 | $ 3068 | $ 6390 | $ 5579 | $ 2162 | $ 2458 | $ 3111 | $ 4277 | $ 2219 | $ 2852 | $ 4519 | $ 5443 | $ 3026 | $ 5121 | $ 7749 | $ 7325 | $ 13658 | $ 17199 | |||||||||||||||||||||||||||||||||||
| Adjusted EBITDA of Sales | 97 | 68 | -03 | -46 | -19 | -70 | 25 | 40 | 20 | 31 | 61 | 36 | 34 | 59 | 59 | 39 | 44 | 90 | 79 | 33 | 35 | 45 | 61 | 33 | 38 | 60 | 72 | 38 | 61 | 86 | 83 | 48 | 62 | |||||||||||||||||||||||||||||||||||
| Annual Adjusted EBITDA of Sales | 44 | 58 | ||||||||||||||||||||||||||||||||||||||||||||||||||||||||||||||||||
| Adjusted Operating Income | (3083) | (6437) | (264) | 744 | (709) | (123) | 1829 | (7) | 54 | 2071 | 2182 | 600 | 972 | 4264 | 3460 | (40) | 271 | 885 | 2304 | 539 | 1147 | 2875 | 3852 | 1196 | 3435 | 6070 | 5570 | - 0 | 4907 | 8314 | ||||||||||||||||||||||||||||||||||||||
| Sales | |||
| Broad Based MRO Market | $150000000000 | ||
| Service Based VMI Market | $25000000000 | ||
| 3rd Qtr | 12 | ||
| 4th Qtr | 12 | ||
| To resize chart data range drag lower right corner of range |
| Broad Based MRO Market | |
| Service Based VMI Market |
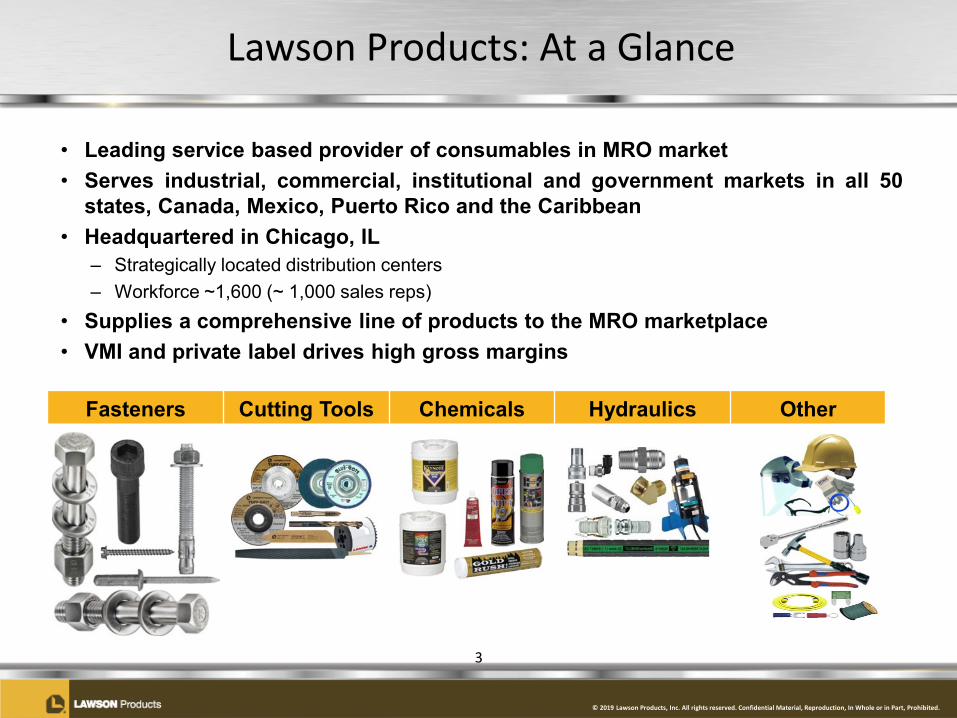
copy 2019 Lawson Products Inc All rights reserved Confidential Material Reproduction In Whole or in Part Prohibited
Competitive Advantages and Differentiators
What differentiates Lawsonbull Service intensive ldquohigh touchrdquo
value propositionbull Vendor managed inventory or
ldquokeep fillrdquobull Deep product knowledge bull Broad geographic sales and
service coverage throughout the US and Canada
bull Leverage investments in sales team facilities and technology to enable outstanding customer service
bull Lowest total cost
4
copy 2019 Lawson Products Inc All rights reserved Confidential Material Reproduction In Whole or in Part Prohibited
Our Commitment to our 70000+ Customers
High touch service and technical expertise drives customer relationshipsBefore After
One Company Zero Headaches Inventory Management Options Access to Industry Knowledge amp Expertise
bull Comprehensive line of products bull Lawson Managed Inventory bull Product recommendations from your Lawson Representative
bull Hundreds of pre-built assortments bull Industrial vending bull Application advice from our test and application engineers
bull Unlimited sourcing of hard-to-find items
bull Self-service inventory management
bull Complimentary on-site safety amp product usage training
5
copy 2019 Lawson Products Inc All rights reserved Confidential Material Reproduction In Whole or in Part Prohibited
Customer and Product Profile
6
Retain over 90 of customer revenues from year to year
Fastening Systems
23
Fluid Power15
Specialty Chemicals
12
Cutting Tools and Abrasives
13
Electrical11
Aftermarket Automotive
Supplies8
Safety5
Welding and Metal Repair
2
Other10
Product Mix
Regional Accounts
47
Strategic14
Kent Automotive
15
Bolt Supply11
Government 11
Other2
Customer Mix
copy 2019 Lawson Products Inc All rights reserved Confidential Material Reproduction In Whole or in Part Prohibited
Lawson Growth Strategy
Sales Growth Driven By
Foundational SupportERP Network
OptimizationSales
TransformationLean Six Sigma
Website
7
New Sales Reps
Sales RepProductivity
Acquisitions
copy 2019 Lawson Products Inc All rights reserved Confidential Material Reproduction In Whole or in Part Prohibited
2019 Focus Actions Across the Value Chain Driving Growth
Add New Sales Reps and Drive Rep Productivity
Sales Process Sales Reps
Customer Service Order
Entry
ProductManagement
PricingDC Operations Sourcing
Purchasing
bull Increase sales rep count
bull Onboardingprocesstraining
bull SalesManagement dashboard
bull EDI with customers
bull Reduction of cycle times
bull Order padbull Consolidation of
shipmentsbull Sales service reps
bull Leverage vendor drop-ship programs
bull Fleet maintenance focus
bull Pricing enhancements
bull Website
bull Reduce cycle timebull Refine ldquoPullrdquo
strategybull Freight
enhancementsbull Minimize
backordersbull Improve service
levelsbull Forecasting tool
bull Supplier negotiation process
bull Vendor metricsbull Electronic
communication
Information Technology ndash Integration of Web and SAPLean Six Sigma
8
copy 2019 Lawson Products Inc All rights reserved Confidential Material Reproduction In Whole or in Part Prohibited
Longer Sales Rep Tenure Drives Rep Productivity
9
$0
$50000
$100000
$150000
$200000
$250000
$300000
$350000
$400000
$450000
$500000
lt 12 Mos 1 - 2 Yrs 3 - 5 Yrs 5 - 10 Yrs gt 10 Yrs0
50
100
150
200
250
300
350
Aver
age
Annu
al S
ales
Tenure With Lawson (as of 93019)
Num
ber O
f Sal
es R
eps
Number of Reps Average Annual Sales
copy 2019 Lawson Products Inc All rights reserved Confidential Material Reproduction In Whole or in Part Prohibited
Historical Financial Performance
Recent sales growth and earnings expansion providing financial flexibility
10
$200000
$250000
$300000
$350000
$400000
2014 2015 2016 2017 2018 TTM93019
Consolidated Revenues
$0$5000
$10000$15000$20000$25000$30000$35000
2014 2015 2016 2017 2018 TTM93019
Adjusted Reg G EBITDA
-$15000
-$10000
-$5000
$0
$5000
$10000
$15000
2014 2015 2016 2017 2018 9302019
Net Cash(Debt)
$0
$2000
$4000
$6000
$8000
$10000
$12000
Q1 Q2 Q3 Q4
Quarterly Adjusted Reg G EBITDA
2017
20172017
2017
2018
20182018
2018
20192019
2019
copy 2019 Lawson Products Inc All rights reserved Confidential Material Reproduction In Whole or in Part Prohibited
Financial Highlights for Third Quarter 2019
bull Sales increased 71 YOY (74 excluding currency fluctuation)
bull MRO LawsonKent gross margins consistent at 609
bull Adjusted Reg G EBITDA margin improving 109 in Q3 2019 v 83 in Q3 2018 Continued investment in new sales reps and rep productivity
bull Key trends MRO operating leverage of 54 13 increase in sales rep productivity Continued government strength +30 YOY Growth across multiple segments and product categories Cash flow from operations of $103 million in Q3
11
copy 2019 Lawson Products Inc All rights reserved Confidential Material Reproduction In Whole or in Part Prohibited
Pursue Disciplined MampA
Reinvest for Growth
Return Capital
bull Increased our borrowing capacity to $1000 million (additional $500 million accordion) with our new borrowing agreement
bull Capital expenditures expected to be $20 - $30 million in 2019bull Growth initiatives add new reps and increase sales rep productivity
bull Share repurchase to offset award dilution opportunistic purchasesbull $75 million stock repurchase program announced on May 16 2019 $63
million remaining after repurchase of shares worth $12 million in August 2019
bull Bolt-on acquisitions to enhance core growth strategiesbull Closed Screw Products Inc acquisition on 10118
Maintain Strong Balance Sheet
bull $86 million cash on hand and positive cash position of $64 million at the end of Q3
bull Consistent free cash flow generation
Capital Allocation Priorities
12
copy 2019 Lawson Products Inc All rights reserved Confidential Material Reproduction In Whole or in Part Prohibited
Lawson Products Poised for Growth
bull Leverage Current Infrastructure
bull Continued Sales Growth
bull Foundational Investments Completed
bull Operational Excellence
bull Large Fragmented Market
13
copy 2019 Lawson Products Inc All rights reserved Confidential Material Reproduction In Whole or in Part Prohibited
For More Information
Contact
Ronald J KnutsonEVP CFOInvestor Relations(773) 304-5665ronknutsonlawsonproductscom
And see our Website athttpwwwlawsonproductscomcompany-infoinvestor-relationsjsp
14
copy 2019 Lawson Products Inc All rights reserved Confidential Material Reproduction In Whole or in Part Prohibited
Appendices
15
copy 2019 Lawson Products Inc All rights reserved Confidential Material Reproduction In Whole or in Part Prohibited
Significant Activities
16
Appendix P-1
August 2011 Implemented SAPOctober 2011 Commenced construction of new McCook Ill distribution center
May 2012 Relocated corporate headquartersJune 2012 Restructured senior team Announced $20M cost savings plan
Transitioned packaging facility to McCook Ill distribution centerEntered into new five-year $40M credit facilityAnnounced new CEO and President Michael G DeCataConsolidated Vernon Hills distribution center into McCook Ill
November 2012 Rolled out new website to existing web customersDecember 2012 Completed transition of US independent agents to employees
April 2013 Roll-out of new website to new web customersAprilMay 2013 McCook DC begins to ship customer ordersNovember 2013 Entered into sub-lease of headquarters space to generate $29M of future cash savingsDecember 2013 Ended year with over 800 sales reps ndash First increase in 8 yearsFebruary 2014 Closed on Automatic Screw Machine Products sale for net proceeds of $121M
June 2014 Entered into sale-leaseback of Reno distribution facility for net proceeds of $83MDecember 2014 Ended year with over 900 sales repsFebruary 2015 Held North American sales meeting
September 2015 Completed West Coast Fasteners acquisitionMarch 2016 Completed Perfect Products of Michigan acquisitionMay 2016 Completed F B Feeney acquisitionJune 2016 Expanded sales team to over 1000 sales reps
September 2016 Extended credit facitlity to August 2020November 2016 Completed Mattic Industries acquisition
March 2017 Consolidated Fairfield NJ distribution operations into McCook Ill and Suwanee GAMay 2017 Sold Fairfield NJ distribution center for a gain of $54M
October 2017 Completed Bolt Supply House acquisitionApril 2018 Opened MRO distribution center in Calgary Canada
October 2018 Completed Screw Products acquisition and added Bolt Supply branchJune 2019 Achieved Q2 98 adjusted EBITDA net of ASC 842 impact of 03
September 2019 Achieved Q3 109 adjusted EBITDA hired VP MampAOctober 2019 Entered into new five-year $100M credit facility with additional $50 million accordion feature
August 2012
October 2012
Adjusted EBITDA $ in 000s
Adjusted EBITDA Q4 2016Q1 2017Q2 2017Q3 2017Q4 201722192852451954433026
Adjusted EBITDA of Sales
Adjusted EBITDA of SalesQ3 2016Q4 2016Q1 2017Q2 2017Q3 2017Q4 201760926793828971926E-232964421005719377E-23822185292895721E-260248513452257152E-271948817596594883E-237528059231332088E-2
Adjusted Operating Income of Sales
Adjusted Operating IncomeQ3 2016Q4 2016Q1 2017Q2 2017Q3 2017Q4 201723045391147287538521196
Adjusted Op Inc $ in 000s
Adjusted EBITDA Q4 2016Q1 2017Q2 2017Q3 2017Q4 20175391147287538521196
Net Sales by Quarter $ in 000s
Net SalesQ1 2013Q2 2013Q3 2013Q4 2013Q1 2014Q2 2014Q3 2014Q4 2014Q1 2015672136831768235657386920472080741287028169904
Adjusted SGampA $ in 000s
Adjusted SGampA Q4 2015Q1 2016Q2 2016Q3 2016Q4 2016Q1 2017Q2 2017Q3 2017Q4 2017391634230341839404474008543732422664243946222
copy 2019 Lawson Products Inc All rights reserved Confidential Material Reproduction In Whole or in Part Prohibited
Regulation G ndash GAAP ReconciliationAppendix P-2
Non GAAP Reconciliation of Adjusted EBITDA to Sales Percentage
The Company reports its financial results in accordance with US generally accepted accounting principles (GAAP) However the Companys management believesthat certain non-GAAP financial measures may provide users of this financial information additional meaningful comparisons between current results and results inprior operating periods Management believes that these non-GAAP financial measures can provide additional meaningful reflection of underlying trends of thebusiness because they provide a comparison of historical information that excludes certain non-operational non-recurring or intermittently recurring items thatimpact the overall comparability See the table below for supplemental financial data and corresponding reconciliations to GAAP financial measures for quarterlyadjusted EBITDA as a percentage of net sales Non-GAAP financial measures should be viewed in addition to and not as an alternative for the Companys reportedresults prepared in accordance with GAAP
17
($ in thousands) Q1 2017 Q2 2017 Q3 2017 Q4 2017 Q1 2018 Q2 2018 Q3 2018 Q4 2018 Q1 2019 Q2 2019 Q3 2019
Net Sales 74617$ 75006$ 75651$ 80633$ 84459$ 90382$ 88530$ 86266$ 91343$ 96097$ 94779$
Operating Income (Loss) 712 7891 1090 243 1837 5554 (2266) 4085 5544 1623 6446 Depreciation amp Amortization 1705 1644 1591 1830 1686 1679 1755 1735 1478 1455 1468 EBITDA 2417 9535 2681 2073 3523 7233 (511) 5820 7022 3078 7914
Excluded CostsSeverance 465 (9) 139 144 628 64 31 126 27 1485 30 Stock Based Compensation (Benefit) (30) 415 2337 384 970 87 7637 (1186) 408 4839 2374 Acquisition Related Costs - - 286 425 - - 168 62 - - - Loss(Gain) on Disposal of Property - (5422) - - - - - - - - - Lease termination gain - - - - - (164) - - - - - Discontinued operation accrual - - - - - 529 - - - - - Building Impairment - - - - - - - 231 - - - Reg G Adjusted EBITDA 2852$ 4519$ 5443$ 3026$ 5121$ 7749$ 7325$ 5053$ 7457$ 9402$ 10318$
Adjusted EBITDA of Sales 38 60 72 38 61 86 83 59 82 98 109
Customer Mix
Regional Accounts48
Kent Automotive16
Regional AccountsStrategicKent AutomotiveBolt SupplyGovernment Screw ProductsOther047014000000000000001016011010002
ampDampF ampA
Product Mix
Fastening Systems23
Specialty Chemicals12
Fastening SystemsFluid PowerSpecialy ChemicalsCutting Tools and AbrasivesElectricalAftermarket Automotive SuppliesSafetyWelding and Metal RepairOther02401501201301100800500201
Number Of Sales Reps
Tenure With Lawson (as of 63019)
Average Annual Sales
Consolidated Revenues
Consolidated Revenues20142015201620172018TTM 63019285693275834276573305907349637362236Net Cash(Debt)2014201520162017201843646420798409580-101271060-1908Rep Count201320142015201620172018436468069169371009983994982
Adjusted Reg G EBITDA
Adjusted EBITDA20142015201620172018TTM 63019136581719912065158402524829237
Quarterly Adjusted Reg G EBITDA
2017Q1Q2Q3Q428524519544330262018Q1Q2Q3Q451217749732550532019Q1Q2Q3Q474579402
Adjusted EBITDA $ in 000s
Reg G Adjusted EBITDA Q1 2017Q2 2017Q3 2017Q4 20172852451954433026
Adjusted EBITDA of Sales
Adjusted EBITDA of SalesQ1 2017Q2 2017Q3 2017Q4 20173822185292895721E-260248513452257152E-271948817596594883E-237528059231332088E-2
Adjusted Operating Income of Sales
Adjusted Operating IncomeQ1 2017Q2 2017Q3 2017Q4 2017
Adjusted Op Inc $ in 000s
Reg G Adjusted EBITDA Q1 2017Q2 2017Q3 2017Q4 2017
copy 2019 Lawson Products Inc All rights reserved Confidential Material Reproduction In Whole or in Part Prohibited
Consolidated Balance Sheet Appendix P-4
18
ASSETSCurrent assetsCash and cash equivalents $ 8626 $ 11883Restricted cash 800 800Accounts receivable less allowance for doubtful accounts of $614 and $549 respectively
45162 37682
Inventories net 54894 52887Miscellaneous receivables and prepaid expenses 4270 3653Total current assets 113752 106905
Property plant and equipment net 16932 23548Deferred income taxes 17372 20592Goodwill 20582 20079Cash value of life insurance 14440 12599Intangible assets net 12468 13112Lease assets 11917 mdashOther assets 275 307Total assets $ 207738 $ 197142
LIABILITIES AND STOCKHOLDERSrsquo EQUITYCurrent liabilitiesRevolving lines of credit $ 2195 $ 10823Accounts payable 16325 15207Lease obligation 3781 mdashAccrued expenses and other liabilities 37873 40179Total current liabilities 60174 66209
Security bonus plan 11969 12413Lease obligation 10360 5213Deferred compensation 5915 5304Deferred tax liability 2879 2761Other liabilities 3460 6069Total liabilities 94757 97969
Stockholdersrsquo equityPreferred stock $1 par valueAuthorized - 500000 shares Issued and outstanding mdash None mdash mdashCommon stock $1 par value
Authorized - 35000000 sharesIssued - 9042597 and 9005716 shares respectivelyOutstanding - 8956981 and 8955930 shares respectively
Capital in excess of par value 17626 15623Retained earnings 89502 77338Treasury stock ndash 85616 and 49786 shares respectivelyAccumulated other comprehensive lossTotal stockholdersrsquo equity 112981 99173Total liabilities and stockholdersrsquo equity $ 207738 $ 197142
September 30 December 312019 2018
(Unaudited)
(2595) (1234)(595) (1560)
9043 9006
Customer Mix
Regional Accounts48
Kent Automotive16
Regional AccountsStrategicKent AutomotiveBolt SupplyGovernment Screw ProductsOther0470140000000000000010150110110002
ampDampF ampA
Product Mix
Fastening Systems23
Specialty Chemicals12
Fastening SystemsFluid PowerSpecialy ChemicalsCutting Tools and AbrasivesElectricalAftermarket Automotive SuppliesSafetyWelding and Metal RepairOther02401501201301100800500201
Number Of Sales Reps
Tenure With Lawson (as of 63019)
Average Annual Sales
Consolidated Revenues
Consolidated Revenues20142015201620172018TTM 93019285693275834276573305907349637368485Net Cash(Debt)2014201520162017201843738420798409580-1012710606431Rep Count201320142015201620172018437388069169371009983994993
Adjusted Reg G EBITDA
Adjusted EBITDA20142015201620172018TTM 93019136581719912065158402524832230
Quarterly Adjusted Reg G EBITDA
2017Q1Q2Q3Q428524519544330262018Q1Q2Q3Q451217749732550532019Q1Q2Q3Q47457940210318
Adjusted EBITDA $ in 000s
Reg G Adjusted EBITDA Q1 2017Q2 2017Q3 2017Q4 20172852451954433026
Adjusted EBITDA of Sales
Adjusted EBITDA of SalesQ1 2017Q2 2017Q3 2017Q4 20173822185292895721E-260248513452257152E-271948817596594883E-237528059231332088E-2
Adjusted Operating Income of Sales
Adjusted Operating IncomeQ1 2017Q2 2017Q3 2017Q4 2017
Adjusted Op Inc $ in 000s
Reg G Adjusted EBITDA Q1 2017Q2 2017Q3 2017Q4 2017
| September 30 | December 31 | ||||||||||
| 2019 | 2018 | ||||||||||
| ASSETS | (Unaudited) | ||||||||||
| Current assets | |||||||||||
| Cash and cash equivalents | $ | 8626 | $ | 11883 | |||||||
| Restricted cash | 800 | 800 | |||||||||
| Accounts receivable less allowance for doubtful accounts of $614 and $549 respectively | 45162 | 37682 | |||||||||
| Inventories net | 54894 | 52887 | |||||||||
| Miscellaneous receivables and prepaid expenses | 4270 | 3653 | |||||||||
| Total current assets | 113752 | 106905 | |||||||||
| Property plant and equipment net | 16932 | 23548 | |||||||||
| Deferred income taxes | 17372 | 20592 | |||||||||
| Goodwill | 20582 | 20079 | |||||||||
| Cash value of life insurance | 14440 | 12599 | |||||||||
| Intangible assets net | 12468 | 13112 | |||||||||
| Lease assets | 11917 | mdash | |||||||||
| Other assets | 275 | 307 | |||||||||
| Total assets | $ | 207738 | $ | 197142 | |||||||
| LIABILITIES AND STOCKHOLDERSrsquo EQUITY | |||||||||||
| Current liabilities | |||||||||||
| Revolving lines of credit | $ | 2195 | $ | 10823 | |||||||
| Accounts payable | 16325 | 15207 | |||||||||
| Lease obligation | 3781 | mdash | |||||||||
| Accrued expenses and other liabilities | 37873 | 40179 | |||||||||
| Total current liabilities | 60174 | 66209 | |||||||||
| Security bonus plan | 11969 | 12413 | |||||||||
| Lease obligation | 10360 | 5213 | |||||||||
| Deferred compensation | 5915 | 5304 | |||||||||
| Deferred tax liability | 2879 | 2761 | |||||||||
| Other liabilities | 3460 | 6069 | |||||||||
| Total liabilities | 94757 | 97969 | |||||||||
| Stockholdersrsquo equity | |||||||||||
| Preferred stock $1 par value | |||||||||||
| Authorized - 500000 shares Issued and outstanding mdash None | mdash | mdash | |||||||||
| Common stock $1 par value | |||||||||||
| Authorized - 35000000 shares | 9043 | 9006 | |||||||||
| Issued - 9042597 and 9005716 shares respectively | |||||||||||
| Outstanding - 8956981 and 8955930 shares respectively | |||||||||||
| Capital in excess of par value | 17626 | 15623 | |||||||||
| Retained earnings | 89502 | 77338 | |||||||||
| Treasury stock ndash 85616 and 49786 shares respectively | (2595) | (1234) | |||||||||
| Accumulated other comprehensive loss | (595) | (1560) | |||||||||
| Total stockholdersrsquo equity | 112981 | 99173 | |||||||||
| Total liabilities and stockholdersrsquo equity | $ | 207738 | $ | 197142 | |||||||
| Three Months Ended | |||||||||||||||||||||||||||||
| Jun 30 2019 | Mar 31 2019 | Dec 31 2018 | Sep 30 2018 | Jun 30 2018 | |||||||||||||||||||||||||
| Average daily net sales | $ | 1502 | $ | 1450 | $ | 1414 | $ | 1405 | $ | 1412 | |||||||||||||||||||
| Year over year increase | 63 | 82 | 70 | 170 | 205 | ||||||||||||||||||||||||
| Sequential quarter increase (decrease) | 36 | 25 | 06 | (05) | 53 | ||||||||||||||||||||||||
| Net Sales | $ | 96097 | $ | 91343 | $ | 86266 | $ | 88530 | $ | 90382 | |||||||||||||||||||
| Gross profit (1) | 51043 | 48923 | 46083 | 48108 | 49131 | ||||||||||||||||||||||||
| Gross profit percentage (1) | 531 | 536 | 534 | 543 | 544 | ||||||||||||||||||||||||
| Selling general amp administrative expenses | $ | 49420 | $ | 43379 | $ | 41998 | $ | 50374 | $ | 43577 | |||||||||||||||||||
| Operating income (loss) | $ | 1623 | $ | 5544 | $ | 4085 | $ | (2266) | $ | 5554 | |||||||||||||||||||
| Full Year | |||||||||||||||||||||||||||||||||||||||||||||||||||||||||||||||||||||||||||
| ($ in thousands) | Q1 2011 | Q2 2011 | Q3 2011 | Q4 2011 | Q1 2012 | Q2 2012 | Q3 2012 | Q4 2012 | Q1 2013 | Q2 2013 | Q3 2013 | Q4 2013 | Q1 2014 | Q2 2014 | Q3 2014 | Q4 2014 | Q1 2015 | Q2 2015 | Q3 2015 | Q4 2015 | Q1 2016 | Q2 2016 | Q3 2016 | Q4 2016 | Q1 2017 | Q2 2017 | Q3 2017 | Q4 2017 | Q1 2018 | Q2 2018 | Q3 2018 | Q4 2018 | Q1 2019 | Q2 2019 | Q3 2019 | 2014 | 2015 | ||||||||||||||||||||||||||||||||||||||
| Net Sales | $ 79255 | $ 80625 | $ 71490 | $ 69029 | $ 71364 | $ 69830 | $ 67863 | $ 64505 | $ 67213 | $ 68317 | $ 68235 | $ 65738 | $ 69204 | $ 72080 | $ 74128 | $ 70281 | $ 69904 | $ 70726 | $ 70243 | $ 64961 | $ 69711 | $ 69348 | $ 70199 | $ 67315 | $ 74617 | $ 75006 | $ 75651 | $ 80633 | $ 84459 | $ 90382 | $ 88530 | $ 86266 | $ 91343 | $ 96097 | $ 94779 | $ 285693 | $ 275834 | ||||||||||||||||||||||||||||||||||||||
| Operating Income (Loss) | 3542 | 1397 | (3480) | (6995) | (3466) | (42084) | (1740) | 2057 | (3530) | (201) | 870 | (3002) | (4713) | 1241 | 678 | (2169) | (947) | 3243 | 2810 | (2985) | 1169 | 29 | 2389 | (5044) | 712 | 7891 | 1090 | 243 | 1837 | 5554 | (2266) | 4085 | 5544 | 1623 | 6446 | (4963) | 2121 | ||||||||||||||||||||||||||||||||||||||
| Depreciation amp Amortization | 1260 | 1315 | 1160 | 1675 | 1715 | 1566 | 1963 | 1841 | 2061 | 2244 | 2367 | 2358 | 2295 | 2163 | 2160 | 2133 | 2096 | 2126 | 2119 | 2202 | 2187 | 2226 | 1973 | 1680 | 1705 | 1644 | 1591 | 1830 | 1686 | 1679 | 1755 | 1735 | 1478 | 1455 | 1468 | 8751 | 8543 | ||||||||||||||||||||||||||||||||||||||
| EBITDA | 4802 | 2712 | (2320) | (5320) | (1751) | (40518) | 223 | 3898 | (1469) | 2043 | 3237 | (644) | (2418) | 3404 | 2838 | (36) | 1149 | 5369 | 4929 | (783) | 3356 | 2255 | 4362 | (3364) | 2417 | 9535 | 2681 | 2073 | 3523 | 7233 | (511) | 5820 | 7022 | 3078 | 7914 | 3788 | 10664 | ||||||||||||||||||||||||||||||||||||||
| Excluded Costs | |||||||||||||||||||||||||||||||||||||||||||||||||||||||||||||||||||||||||||
| Severance | 745 | 465 | 282 | 122 | 185 | 6585 | 1410 | (159) | - 0 | 2 | 962 | (127) | 728 | 290 | (328) | (59) | 571 | 50 | 372 | 280 | 204 | 143 | 367 | 1662 | 465 | (9) | 139 | 144 | 628 | 64 | 31 | 126 | 27 | 1485 | 30 | 631 | 1273 | ||||||||||||||||||||||||||||||||||||||
| Stock Based Compensation (Benefit) | 227 | (95) | (538) | 467 | 198 | (1015) | 77 | 434 | 1596 | 76 | 33 | 562 | 1125 | 408 | 2423 | 2443 | (541) | 971 | (30) | 1693 | (1217) | 515 | (630) | 3801 | (30) | 415 | 2337 | 384 | 970 | 87 | 7637 | (1186) | 408 | 4839 | 2374 | 6399 | 2093 | ||||||||||||||||||||||||||||||||||||||
| Acquisition Related Costs | - 0 | - 0 | - 0 | - 0 | - 0 | - 0 | 310 | 32 | 115 | 198 | 178 | 120 | - 0 | - 0 | 286 | 425 | - 0 | - 0 | 168 | 62 | - 0 | - 0 | - 0 | ||||||||||||||||||||||||||||||||||||||||||||||||||||
| ERP Implementation Costs | 1902 | 2388 | 2344 | 339 | - 0 | - 0 | - 0 | - 0 | - 0 | - 0 | - 0 | - 0 | - 0 | - 0 | - 0 | - 0 | - 0 | - 0 | - 0 | - 0 | - 0 | - 0 | - 0 | - 0 | - 0 | - 0 | - 0 | - 0 | - 0 | - 0 | - 0 | - 0 | - 0 | ||||||||||||||||||||||||||||||||||||||||||
| Loss(Gain) on Disposal of Property | - 0 | - 0 | - 0 | 22 | - 0 | (2122) | (11) | (1588) | - 0 | - 0 | (36) | 32 | - 0 | - 0 | 97 | 45 | - 0 | - 0 | (2) | 9 | - 0 | - 0 | - 0 | - 0 | - 0 | (5422) | - 0 | - 0 | - 0 | - 0 | - 0 | - 0 | - 0 | - 0 | - 0 | 142 | 7 | ||||||||||||||||||||||||||||||||||||||
| Legal Settlement | - 0 | - 0 | - 0 | - 0 | - 0 | - 0 | - 0 | - 0 | - 0 | - 0 | - 0 | - 0 | - 0 | - 0 | (688) | - 0 | - 0 | - 0 | - 0 | - 0 | - 0 | - 0 | - 0 | - 0 | - 0 | - 0 | - 0 | - 0 | - 0 | - 0 | - 0 | - 0 | (688) | - 0 | |||||||||||||||||||||||||||||||||||||||||
| Employment Tax Matter | - 0 | - 0 | - 0 | 1200 | - 0 | - 0 | - 0 | - 0 | - 0 | - 0 | - 0 | (400) | - 0 | - 0 | - 0 | - 0 | - 0 | - 0 | - 0 | - 0 | - 0 | - 0 | - 0 | - 0 | - 0 | - 0 | - 0 | - 0 | - 0 | - 0 | - 0 | - 0 | - 0 | - 0 | |||||||||||||||||||||||||||||||||||||||||
| Lease termination gain | - 0 | - 0 | - 0 | - 0 | - 0 | - 0 | - 0 | - 0 | - 0 | - 0 | - 0 | 2928 | - 0 | - 0 | - 0 | - 0 | - 0 | - 0 | - 0 | - 0 | - 0 | - 0 | - 0 | - 0 | - 0 | - 0 | - 0 | - 0 | - 0 | (164) | - 0 | - 0 | - 0 | - 0 | - 0 | - 0 | - 0 | ||||||||||||||||||||||||||||||||||||||
| Goodwill Impairment | - 0 | - 0 | - 0 | - 0 | - 0 | 28306 | - 0 | - 0 | - 0 | - 0 | - 0 | - 0 | - 0 | - 0 | - 0 | - 0 | - 0 | - 0 | - 0 | - 0 | - 0 | - 0 | - 0 | - 0 | - 0 | - 0 | - 0 | - 0 | - 0 | - 0 | - 0 | - 0 | - 0 | - 0 | |||||||||||||||||||||||||||||||||||||||||
| Inventory Rationalization | - 0 | - 0 | - 0 | - 0 | - 0 | 3893 | - 0 | - 0 | - 0 | - 0 | - 0 | - 0 | - 0 | - 0 | - 0 | - 0 | - 0 | - 0 | - 0 | - 0 | - 0 | - 0 | - 0 | - 0 | - 0 | - 0 | - 0 | - 0 | - 0 | - 0 | - 0 | - 0 | - 0 | - 0 | |||||||||||||||||||||||||||||||||||||||||
| Discontinued operation accrual | - 0 | - 0 | - 0 | - 0 | - 0 | - 0 | - 0 | - 0 | - 0 | - 0 | - 0 | - 0 | - 0 | - 0 | - 0 | 340 | - 0 | - 0 | - 0 | 931 | - 0 | - 0 | - 0 | - 0 | - 0 | - 0 | - 0 | - 0 | - 0 | 529 | - 0 | - 0 | - 0 | - 0 | - 0 | 340 | 931 | ||||||||||||||||||||||||||||||||||||||
| North American sales meeting | - 0 | - 0 | - 0 | - 0 | - 0 | - 0 | - 0 | - 0 | 1225 | - 0 | - 0 | - 0 | - 0 | - 0 | - 0 | - 0 | 1889 | - 0 | - 0 | - 0 | - 0 | - 0 | - 0 | - 0 | - 0 | - 0 | - 0 | - 0 | - 0 | - 0 | - 0 | - 0 | - 0 | 1889 | |||||||||||||||||||||||||||||||||||||||||
| Property Impairment Loss | - 0 | - 0 | - 0 | - 0 | - 0 | - 0 | - 0 | - 0 | - 0 | - 0 | - 0 | - 0 | 2914 | 132 | - 0 | - 0 | - 0 | - 0 | - 0 | - 0 | - 0 | - 0 | - 0 | - 0 | - 0 | - 0 | - 0 | - 0 | - 0 | - 0 | - 0 | - 0 | 3046 | - 0 | |||||||||||||||||||||||||||||||||||||||||
| Building Impairment | - 0 | - 0 | - 0 | - 0 | - 0 | - 0 | - 0 | 231 | - 0 | - 0 | - 0 | ||||||||||||||||||||||||||||||||||||||||||||||||||||||||||||||||
| Reg G Adjusted EBITDA | $ 7676 | $ 5470 | $ (232) | $ (3170) | $ (1368) | $ (4871) | $ 1699 | $ 2585 | $ 1352 | $ 2121 | $ 4196 | $ 2351 | $ 2349 | $ 4234 | $ 4342 | $ 2733 | $ 3068 | $ 6390 | $ 5579 | $ 2162 | $ 2458 | $ 3111 | $ 4277 | $ 2219 | $ 2852 | $ 4519 | $ 5443 | $ 3026 | $ 5121 | $ 7749 | $ 7325 | $ 5053 | $ 7457 | $ 9402 | $ 10318 | $ 13658 | $ 17199 | ||||||||||||||||||||||||||||||||||||||
| Adjusted EBITDA of Sales | 97 | 68 | -03 | -46 | -19 | -70 | 25 | 40 | 20 | 31 | 61 | 36 | 34 | 59 | 59 | 39 | 44 | 90 | 79 | 33 | 35 | 45 | 61 | 33 | 38 | 60 | 72 | 38 | 61 | 86 | 83 | 59 | 82 | 98 | 109 | 48 | 62 | ||||||||||||||||||||||||||||||||||||||
| Annual Adjusted EBITDA of Sales | 44 | 58 | |||||||||||||||||||||||||||||||||||||||||||||||||||||||||||||||||||||||||
| Adjusted Operating Income | (3083) | (6437) | (264) | 744 | (709) | (123) | 1829 | (7) | 54 | 2071 | 2182 | 600 | 972 | 4264 | 3460 | (40) | 271 | 885 | 2304 | 539 | 1147 | 2875 | 3852 | 1196 | 3435 | 6070 | 5570 | 3087 | 5979 | 7947 | 8850 | 4907 | 8314 | ||||||||||||||||||||||||||||||||||||||||||
| Consolidated Revenues | |||||||
| 2013 | 269503 | ||||||
| 2014 | 285693 | ||||||
| 2015 | 275834 | ||||||
| 2016 | 276573 | ||||||
| 2017 | 305907 | ||||||
| 2018 | 349637 | ||||||
| TTM 93019 | 368485 | ||||||
| Net Cash(Debt) | |||||||
| 2013 | (15380) | ||||||
| 2014 | 4207 | ||||||
| 2015 | 9840 | ||||||
| 2016 | 9580 | ||||||
| 2017 | (10127) | ||||||
| 2018 | 1060 | ||||||
| 93019 | 6431 | ||||||
| Rep Count | |||||||
| 2013 | 806 | ||||||
| 2014 | 916 | ||||||
| 2015 | 937 | ||||||
| 2016 | 1009 | ||||||
| 2017 | 983 | ||||||
| 2018 | 994 | ||||||
| 93019 | 993 | ||||||
| Adjusted OI | DampA | Adjusted EBITDA | |||||
| 2013 | 990 | 9030 | 10020 | ||||
| 2014 | 4907 | 8751 | 13658 | ||||
| 2015 | 8315 | 8543 | 17199 | ||||
| 2016 | 3388 | 8066 | 12065 | ||||
| 2017 | 15840 | ||||||
| 2018 | 25248 | ||||||
| TTM 93019 | 32230 | ||||||
| Reg G EBITDA By Quarter | |||||||
| Quarter | 2017 | 2018 | 2019 | ||||
| Q1 | 2852 | 5121 | 7457 | ||||
| Q2 | 4519 | 7749 | 9402 | ||||
| Q3 | 5443 | 7325 | 10318 | ||||
| Q4 | 3026 | 5053 |
| Months of Experience | Average Annual Sales | Number of Reps | |||
| lt 12 Mos | ERRORVALUE | ERRORVALUE | |||
| 1 - 2 Yrs | ERRORVALUE | ERRORVALUE | |||
| 3 - 5 Yrs | ERRORVALUE | ERRORVALUE | |||
| 5 - 10 Yrs | ERRORVALUE | ERRORVALUE | |||
| gt 10 Yrs | ERRORVALUE | ERRORVALUE | |||
| ERRORVALUE | |||||
| Excludes ISR MSS CRS | |||||
| Excludes Freight | |||||
| Product mix | ||||||||
| Verticals | Q3 2019 Sales | |||||||
| Fastening Systems | 240 | 22485606 | ||||||
| Fluid Power | 151 | 14156064 | ||||||
| Specialy Chemicals | 117 | 10917433 | ||||||
| Cutting Tools and Abrasives | 131 | 12296596 | ||||||
| Electrical | 104 | 9724849 | ||||||
| Aftermarket Automotive Supplies | 76 | 7154688 | ||||||
| Safety | 47 | 4445846 | ||||||
| Welding and Metal Repair | 13 | 1218030 | ||||||
| Other | 120 | 11237322 | ||||||
| Total | 100 | 93636434 | ||||||
| Verticals | YTD 2019 Sales | |||||||
| Fastening Systems | 24 | 66611555 | ||||||
| Fluid Power | 15 | 42224416 | ||||||
| Specialy Chemicals | 12 | 32166853 | ||||||
| Cutting Tools and Abrasives | 13 | 36587482 | ||||||
| Electrical | 11 | 30150144 | ||||||
| Aftermarket Automotive Supplies | 8 | 21960561 | ||||||
| Safety | 5 | 13072228 | ||||||
| Welding and Metal Repair | 2 | 4306548 | ||||||
| Other | 10 | 31279779 | ||||||
| Total | 100 | 278359566 |
| Lawson core customer mix | ||||||||
| Account Tyoe | Q3 | |||||||
| Regional Accounts | 43045893 | 45 | ||||||
| Strategic | 14086813 | 15 | ||||||
| Kent Automotive | 14300065 | 15 | ||||||
| Bolt Supply | 11318703 | 12 | ||||||
| Government | 10291732 | 11 | ||||||
| Screw Products | 0 | 0 | ||||||
| Other (1) | 1735236 | 2 | ||||||
| Total | 94778443 | 100 | ||||||
| Account Tyoe | YTD September | |||||||
| Regional Accounts | 131389537 | 47 | ||||||
| Strategic | 40364305 | 14 | ||||||
| Kent Automotive | 43371411 | 15 | ||||||
| Bolt Supply | 31324209 | 11 | ||||||
| Government | 29794959 | 11 | ||||||
| Screw Products | 0 | 0 | ||||||
| Other | 5974302 | 2 | ||||||
| Total | 282218723 | 100 | ||||||
| Total Reported |
| September 30 | December 31 | ||||||||||
| 2019 | 2018 | ||||||||||
| ASSETS | (Unaudited) | ||||||||||
| Current assets | |||||||||||
| Cash and cash equivalents | $ | 8626 | $ | 11883 | |||||||
| Restricted cash | 800 | 800 | |||||||||
| Accounts receivable less allowance for doubtful accounts of $614 and $549 respectively | 45162 | 37682 | |||||||||
| Inventories net | 54894 | 52887 | |||||||||
| Miscellaneous receivables and prepaid expenses | 4270 | 3653 | |||||||||
| Total current assets | 113752 | 106905 | |||||||||
| Property plant and equipment net | 16932 | 23548 | |||||||||
| Deferred income taxes | 17372 | 20592 | |||||||||
| Goodwill | 20582 | 20079 | |||||||||
| Cash value of life insurance | 14440 | 12599 | |||||||||
| Intangible assets net | 12468 | 13112 | |||||||||
| Lease assets | 11917 | mdash | |||||||||
| Other assets | 275 | 307 | |||||||||
| Total assets | $ | 207738 | $ | 197142 | |||||||
| LIABILITIES AND STOCKHOLDERSrsquo EQUITY | |||||||||||
| Current liabilities | |||||||||||
| Revolving lines of credit | $ | 2195 | $ | 10823 | |||||||
| Accounts payable | 16325 | 15207 | |||||||||
| Lease obligation | 3781 | mdash | |||||||||
| Accrued expenses and other liabilities | 37873 | 40179 | |||||||||
| Total current liabilities | 60174 | 66209 | |||||||||
| Security bonus plan | 11969 | 12413 | |||||||||
| Lease obligation | 10360 | 5213 | |||||||||
| Deferred compensation | 5915 | 5304 | |||||||||
| Deferred tax liability | 2879 | 2761 | |||||||||
| Other liabilities | 3460 | 6069 | |||||||||
| Total liabilities | 94757 | 97969 | |||||||||
| Stockholdersrsquo equity | |||||||||||
| Preferred stock $1 par value | |||||||||||
| Authorized - 500000 shares Issued and outstanding mdash None | mdash | mdash | |||||||||
| Common stock $1 par value | |||||||||||
| Authorized - 35000000 shares | 9043 | 9006 | |||||||||
| Issued - 9042597 and 9005716 shares respectively | |||||||||||
| Outstanding - 8956981 and 8955930 shares respectively | |||||||||||
| Capital in excess of par value | 17626 | 15623 | |||||||||
| Retained earnings | 89502 | 77338 | |||||||||
| Treasury stock ndash 85616 and 49786 shares respectively | (2595) | (1234) | |||||||||
| Accumulated other comprehensive loss | (595) | (1560) | |||||||||
| Total stockholdersrsquo equity | 112981 | 99173 | |||||||||
| Total liabilities and stockholdersrsquo equity | $ | 207738 | $ | 197142 | |||||||
| Three Months Ended | |||||||||||||||||||||||||||||
| Jun 30 2019 | Mar 31 2019 | Dec 31 2018 | Sep 30 2018 | Jun 30 2018 | |||||||||||||||||||||||||
| Average daily net sales | $ | 1502 | $ | 1450 | $ | 1414 | $ | 1405 | $ | 1412 | |||||||||||||||||||
| Year over year increase | 63 | 82 | 70 | 170 | 205 | ||||||||||||||||||||||||
| Sequential quarter increase (decrease) | 36 | 25 | 06 | (05) | 53 | ||||||||||||||||||||||||
| Net Sales | $ | 96097 | $ | 91343 | $ | 86266 | $ | 88530 | $ | 90382 | |||||||||||||||||||
| Gross profit (1) | 51043 | 48923 | 46083 | 48108 | 49131 | ||||||||||||||||||||||||
| Gross profit percentage (1) | 531 | 536 | 534 | 543 | 544 | ||||||||||||||||||||||||
| Selling general amp administrative expenses | $ | 49420 | $ | 43379 | $ | 41998 | $ | 50374 | $ | 43577 | |||||||||||||||||||
| Operating income (loss) | $ | 1623 | $ | 5544 | $ | 4085 | $ | (2266) | $ | 5554 | |||||||||||||||||||
| Full Year | |||||||||||||||||||||||||||||||||||||||||||||||||||||||||||||||||||||||||||
| ($ in thousands) | Q1 2011 | Q2 2011 | Q3 2011 | Q4 2011 | Q1 2012 | Q2 2012 | Q3 2012 | Q4 2012 | Q1 2013 | Q2 2013 | Q3 2013 | Q4 2013 | Q1 2014 | Q2 2014 | Q3 2014 | Q4 2014 | Q1 2015 | Q2 2015 | Q3 2015 | Q4 2015 | Q1 2016 | Q2 2016 | Q3 2016 | Q4 2016 | Q1 2017 | Q2 2017 | Q3 2017 | Q4 2017 | Q1 2018 | Q2 2018 | Q3 2018 | Q4 2018 | Q1 2019 | Q2 2019 | Q3 2019 | 2014 | 2015 | ||||||||||||||||||||||||||||||||||||||
| Net Sales | $ 79255 | $ 80625 | $ 71490 | $ 69029 | $ 71364 | $ 69830 | $ 67863 | $ 64505 | $ 67213 | $ 68317 | $ 68235 | $ 65738 | $ 69204 | $ 72080 | $ 74128 | $ 70281 | $ 69904 | $ 70726 | $ 70243 | $ 64961 | $ 69711 | $ 69348 | $ 70199 | $ 67315 | $ 74617 | $ 75006 | $ 75651 | $ 80633 | $ 84459 | $ 90382 | $ 88530 | $ 86266 | $ 91343 | $ 96097 | $ 94779 | $ 285693 | $ 275834 | ||||||||||||||||||||||||||||||||||||||
| Operating Income (Loss) | 3542 | 1397 | (3480) | (6995) | (3466) | (42084) | (1740) | 2057 | (3530) | (201) | 870 | (3002) | (4713) | 1241 | 678 | (2169) | (947) | 3243 | 2810 | (2985) | 1169 | 29 | 2389 | (5044) | 712 | 7891 | 1090 | 243 | 1837 | 5554 | (2266) | 4085 | 5544 | 1623 | 6446 | (4963) | 2121 | ||||||||||||||||||||||||||||||||||||||
| Depreciation amp Amortization | 1260 | 1315 | 1160 | 1675 | 1715 | 1566 | 1963 | 1841 | 2061 | 2244 | 2367 | 2358 | 2295 | 2163 | 2160 | 2133 | 2096 | 2126 | 2119 | 2202 | 2187 | 2226 | 1973 | 1680 | 1705 | 1644 | 1591 | 1830 | 1686 | 1679 | 1755 | 1735 | 1478 | 1455 | 1468 | 8751 | 8543 | ||||||||||||||||||||||||||||||||||||||
| EBITDA | 4802 | 2712 | (2320) | (5320) | (1751) | (40518) | 223 | 3898 | (1469) | 2043 | 3237 | (644) | (2418) | 3404 | 2838 | (36) | 1149 | 5369 | 4929 | (783) | 3356 | 2255 | 4362 | (3364) | 2417 | 9535 | 2681 | 2073 | 3523 | 7233 | (511) | 5820 | 7022 | 3078 | 7914 | 3788 | 10664 | ||||||||||||||||||||||||||||||||||||||
| Excluded Costs | |||||||||||||||||||||||||||||||||||||||||||||||||||||||||||||||||||||||||||
| Severance | 745 | 465 | 282 | 122 | 185 | 6585 | 1410 | (159) | - 0 | 2 | 962 | (127) | 728 | 290 | (328) | (59) | 571 | 50 | 372 | 280 | 204 | 143 | 367 | 1662 | 465 | (9) | 139 | 144 | 628 | 64 | 31 | 126 | 27 | 1485 | 30 | 631 | 1273 | ||||||||||||||||||||||||||||||||||||||
| Stock Based Compensation (Benefit) | 227 | (95) | (538) | 467 | 198 | (1015) | 77 | 434 | 1596 | 76 | 33 | 562 | 1125 | 408 | 2423 | 2443 | (541) | 971 | (30) | 1693 | (1217) | 515 | (630) | 3801 | (30) | 415 | 2337 | 384 | 970 | 87 | 7637 | (1186) | 408 | 4839 | 2374 | 6399 | 2093 | ||||||||||||||||||||||||||||||||||||||
| Acquisition Related Costs | - 0 | - 0 | - 0 | - 0 | - 0 | - 0 | 310 | 32 | 115 | 198 | 178 | 120 | - 0 | - 0 | 286 | 425 | - 0 | - 0 | 168 | 62 | - 0 | - 0 | - 0 | ||||||||||||||||||||||||||||||||||||||||||||||||||||
| ERP Implementation Costs | 1902 | 2388 | 2344 | 339 | - 0 | - 0 | - 0 | - 0 | - 0 | - 0 | - 0 | - 0 | - 0 | - 0 | - 0 | - 0 | - 0 | - 0 | - 0 | - 0 | - 0 | - 0 | - 0 | - 0 | - 0 | - 0 | - 0 | - 0 | - 0 | - 0 | - 0 | - 0 | - 0 | ||||||||||||||||||||||||||||||||||||||||||
| Loss(Gain) on Disposal of Property | - 0 | - 0 | - 0 | 22 | - 0 | (2122) | (11) | (1588) | - 0 | - 0 | (36) | 32 | - 0 | - 0 | 97 | 45 | - 0 | - 0 | (2) | 9 | - 0 | - 0 | - 0 | - 0 | - 0 | (5422) | - 0 | - 0 | - 0 | - 0 | - 0 | - 0 | - 0 | - 0 | - 0 | 142 | 7 | ||||||||||||||||||||||||||||||||||||||
| Legal Settlement | - 0 | - 0 | - 0 | - 0 | - 0 | - 0 | - 0 | - 0 | - 0 | - 0 | - 0 | - 0 | - 0 | - 0 | (688) | - 0 | - 0 | - 0 | - 0 | - 0 | - 0 | - 0 | - 0 | - 0 | - 0 | - 0 | - 0 | - 0 | - 0 | - 0 | - 0 | - 0 | (688) | - 0 | |||||||||||||||||||||||||||||||||||||||||
| Employment Tax Matter | - 0 | - 0 | - 0 | 1200 | - 0 | - 0 | - 0 | - 0 | - 0 | - 0 | - 0 | (400) | - 0 | - 0 | - 0 | - 0 | - 0 | - 0 | - 0 | - 0 | - 0 | - 0 | - 0 | - 0 | - 0 | - 0 | - 0 | - 0 | - 0 | - 0 | - 0 | - 0 | - 0 | - 0 | |||||||||||||||||||||||||||||||||||||||||
| Lease termination gain | - 0 | - 0 | - 0 | - 0 | - 0 | - 0 | - 0 | - 0 | - 0 | - 0 | - 0 | 2928 | - 0 | - 0 | - 0 | - 0 | - 0 | - 0 | - 0 | - 0 | - 0 | - 0 | - 0 | - 0 | - 0 | - 0 | - 0 | - 0 | - 0 | (164) | - 0 | - 0 | - 0 | - 0 | - 0 | - 0 | - 0 | ||||||||||||||||||||||||||||||||||||||
| Goodwill Impairment | - 0 | - 0 | - 0 | - 0 | - 0 | 28306 | - 0 | - 0 | - 0 | - 0 | - 0 | - 0 | - 0 | - 0 | - 0 | - 0 | - 0 | - 0 | - 0 | - 0 | - 0 | - 0 | - 0 | - 0 | - 0 | - 0 | - 0 | - 0 | - 0 | - 0 | - 0 | - 0 | - 0 | - 0 | |||||||||||||||||||||||||||||||||||||||||
| Inventory Rationalization | - 0 | - 0 | - 0 | - 0 | - 0 | 3893 | - 0 | - 0 | - 0 | - 0 | - 0 | - 0 | - 0 | - 0 | - 0 | - 0 | - 0 | - 0 | - 0 | - 0 | - 0 | - 0 | - 0 | - 0 | - 0 | - 0 | - 0 | - 0 | - 0 | - 0 | - 0 | - 0 | - 0 | - 0 | |||||||||||||||||||||||||||||||||||||||||
| Discontinued operation accrual | - 0 | - 0 | - 0 | - 0 | - 0 | - 0 | - 0 | - 0 | - 0 | - 0 | - 0 | - 0 | - 0 | - 0 | - 0 | 340 | - 0 | - 0 | - 0 | 931 | - 0 | - 0 | - 0 | - 0 | - 0 | - 0 | - 0 | - 0 | - 0 | 529 | - 0 | - 0 | - 0 | - 0 | - 0 | 340 | 931 | ||||||||||||||||||||||||||||||||||||||
| North American sales meeting | - 0 | - 0 | - 0 | - 0 | - 0 | - 0 | - 0 | - 0 | 1225 | - 0 | - 0 | - 0 | - 0 | - 0 | - 0 | - 0 | 1889 | - 0 | - 0 | - 0 | - 0 | - 0 | - 0 | - 0 | - 0 | - 0 | - 0 | - 0 | - 0 | - 0 | - 0 | - 0 | - 0 | 1889 | |||||||||||||||||||||||||||||||||||||||||
| Property Impairment Loss | - 0 | - 0 | - 0 | - 0 | - 0 | - 0 | - 0 | - 0 | - 0 | - 0 | - 0 | - 0 | 2914 | 132 | - 0 | - 0 | - 0 | - 0 | - 0 | - 0 | - 0 | - 0 | - 0 | - 0 | - 0 | - 0 | - 0 | - 0 | - 0 | - 0 | - 0 | - 0 | 3046 | - 0 | |||||||||||||||||||||||||||||||||||||||||
| Building Impairment | - 0 | - 0 | - 0 | - 0 | - 0 | - 0 | - 0 | 231 | - 0 | - 0 | - 0 | ||||||||||||||||||||||||||||||||||||||||||||||||||||||||||||||||
| Reg G Adjusted EBITDA | $ 7676 | $ 5470 | $ (232) | $ (3170) | $ (1368) | $ (4871) | $ 1699 | $ 2585 | $ 1352 | $ 2121 | $ 4196 | $ 2351 | $ 2349 | $ 4234 | $ 4342 | $ 2733 | $ 3068 | $ 6390 | $ 5579 | $ 2162 | $ 2458 | $ 3111 | $ 4277 | $ 2219 | $ 2852 | $ 4519 | $ 5443 | $ 3026 | $ 5121 | $ 7749 | $ 7325 | $ 5053 | $ 7457 | $ 9402 | $ 10318 | $ 13658 | $ 17199 | ||||||||||||||||||||||||||||||||||||||
| Adjusted EBITDA of Sales | 97 | 68 | -03 | -46 | -19 | -70 | 25 | 40 | 20 | 31 | 61 | 36 | 34 | 59 | 59 | 39 | 44 | 90 | 79 | 33 | 35 | 45 | 61 | 33 | 38 | 60 | 72 | 38 | 61 | 86 | 83 | 59 | 82 | 98 | 109 | 48 | 62 | ||||||||||||||||||||||||||||||||||||||
| Annual Adjusted EBITDA of Sales | 44 | 58 | |||||||||||||||||||||||||||||||||||||||||||||||||||||||||||||||||||||||||
| Adjusted Operating Income | (3083) | (6437) | (264) | 744 | (709) | (123) | 1829 | (7) | 54 | 2071 | 2182 | 600 | 972 | 4264 | 3460 | (40) | 271 | 885 | 2304 | 539 | 1147 | 2875 | 3852 | 1196 | 3435 | 6070 | 5570 | 3087 | 5979 | 7947 | 8850 | 4907 | 8314 | ||||||||||||||||||||||||||||||||||||||||||
| Consolidated Revenues | |||||||
| 2013 | 269503 | ||||||
| 2014 | 285693 | ||||||
| 2015 | 275834 | ||||||
| 2016 | 276573 | ||||||
| 2017 | 305907 | ||||||
| 2018 | 349637 | ||||||
| TTM 63019 | 362236 | ||||||
| Net Cash(Debt) | |||||||
| 2013 | (15380) | ||||||
| 2014 | 4207 | ||||||
| 2015 | 9840 | ||||||
| 2016 | 9580 | ||||||
| 2017 | (10127) | ||||||
| 2018 | 1060 | ||||||
| 63019 | (1908) | ||||||
| Rep Count | |||||||
| 2013 | 806 | ||||||
| 2014 | 916 | ||||||
| 2015 | 937 | ||||||
| 2016 | 1009 | ||||||
| 2017 | 983 | ||||||
| 2018 | 994 | ||||||
| 63019 | 982 | ||||||
| Adjusted OI | DampA | Adjusted EBITDA | |||||
| 2013 | 990 | 9030 | 10020 | ||||
| 2014 | 4907 | 8751 | 13658 | ||||
| 2015 | 8315 | 8543 | 17199 | ||||
| 2016 | 3388 | 8066 | 12065 | ||||
| 2017 | 15840 | ||||||
| 2018 | 25248 | ||||||
| TTM 63019 | 29237 | ||||||
| Reg G EBITDA By Quarter | |||||||
| Quarter | 2017 | 2018 | 2019 | ||||
| Q1 | 2852 | 5121 | 7457 | ||||
| Q2 | 4519 | 7749 | 9402 | ||||
| Q3 | 5443 | 7325 | |||||
| Q4 | 3026 | 5053 |
| Months of Experience | Average Annual Sales | Number of Reps | |||
| lt 12 Mos | ERRORVALUE | ERRORVALUE | |||
| 1 - 2 Yrs | ERRORVALUE | ERRORVALUE | |||
| 3 - 5 Yrs | ERRORVALUE | ERRORVALUE | |||
| 5 - 10 Yrs | ERRORVALUE | ERRORVALUE | |||
| gt 10 Yrs | ERRORVALUE | ERRORVALUE | |||
| ERRORVALUE | |||||
| Excludes ISR MSS CRS | |||||
| Excludes Freight | |||||
| Product mix | ||||||||
| Verticals | Q2 2019 Sales | |||||||
| Fastening Systems | 243 | 23008646 | ||||||
| Fluid Power | 152 | 14395529 | ||||||
| Specialy Chemicals | 117 | 11074332 | ||||||
| Cutting Tools and Abrasives | 130 | 12319702 | ||||||
| Electrical | 107 | 10102828 | ||||||
| Aftermarket Automotive Supplies | 77 | 7255974 | ||||||
| Safety | 47 | 4458217 | ||||||
| Welding and Metal Repair | 16 | 1539172 | ||||||
| Other | 112 | 10633378 | ||||||
| Total | 100 | 94787779 | ||||||
| Verticals | YTD 2019 Sales | |||||||
| Fastening Systems | 24 | 44125949 | ||||||
| Fluid Power | 15 | 28068352 | ||||||
| Specialy Chemicals | 12 | 21249420 | ||||||
| Cutting Tools and Abrasives | 13 | 24290887 | ||||||
| Electrical | 11 | 20425294 | ||||||
| Aftermarket Automotive Supplies | 8 | 14805874 | ||||||
| Safety | 5 | 8626381 | ||||||
| Welding and Metal Repair | 2 | 3088518 | ||||||
| Other | 10 | 20042457 | ||||||
| Total | 100 | 184723132 |
| Lawson core customer mix | ||||||||
| Account Tyoe | Q2 | |||||||
| Regional Accounts | 44933707 | 47 | ||||||
| Strategic | 13542786 | 14 | ||||||
| Kent Automotive | 14370813 | 15 | ||||||
| Bolt Supply | 11129675 | 12 | ||||||
| Government | 10087561 | 10 | ||||||
| Screw Products | 0 | 0 | ||||||
| Other (1) | 1428268 | 1 | ||||||
| Total | 96097363 | 100 | ||||||
| Account Tyoe | YTD June | |||||||
| Regional Accounts | 88400675 | 47 | ||||||
| Strategic | 26218365 | 14 | ||||||
| Kent Automotive | 29071347 | 16 | ||||||
| Bolt Supply | 20005505 | 11 | ||||||
| Government | 19505323 | 10 | ||||||
| Screw Products | 0 | 0 | ||||||
| Other | 4239066 | 2 | ||||||
| Total | 187440280 | 100 | ||||||
| Total Reported |
| August 2011 | OslashImplemented SAP | ||
| October 2011 | OslashCommenced construction of new McCook Ill distribution center | ||
| May 2012 | OslashRelocated corporate headquarters | ||
| June 2012 | OslashRestructured senior team Announced $20M cost savings plan | ||
| August 2012 | OslashTransitioned packaging facility to McCook Ill distribution center | ||
| OslashEntered into new five-year $40M credit facility | |||
| October 2012 | OslashAnnounced new CEO and President Michael G DeCata | ||
| OslashConsolidated Vernon Hills distribution center into McCook Ill | |||
| November 2012 | OslashRolled out new website to existing web customers | ||
| December 2012 | OslashCompleted transition of US independent agents to employees | ||
| April 2013 | OslashRoll-out of new website to new web customers | ||
| AprilMay 2013 | OslashMcCook DC begins to ship customer orders | ||
| November 2013 | OslashEntered into sub-lease of headquarters space to generate $29M of future cash savings | ||
| December 2013 | OslashEnded year with over 800 sales reps ndash First increase in 8 years | ||
| February 2014 | OslashClosed on Automatic Screw Machine Products sale for net proceeds of $121M | ||
| June 2014 | OslashEntered into sale-leaseback of Reno distribution facility for net proceeds of $83M | ||
| December 2014 | OslashEnded year with over 900 sales reps | ||
| February 2015 | OslashHeld North American sales meeting | ||
| September 2015 | OslashCompleted West Coast Fasteners acquisition | ||
| March 2016 | OslashCompleted Perfect Products of Michigan acquisition | ||
| May 2016 | OslashCompleted F B Feeney acquisition | ||
| June 2016 | OslashExpanded sales team to over 1000 sales reps | ||
| September 2016 | OslashExtended credit facitlity to August 2020 | ||
| November 2016 | OslashCompleted Mattic Industries acquisition | ||
| March 2017 | OslashConsolidated Fairfield NJ distribution operations into McCook Ill and Suwanee GA | ||
| May 2017 | OslashSold Fairfield NJ distribution center for a gain of $54M | ||
| October 2017 | OslashCompleted Bolt Supply House acquisition | ||
| April 2018 | OslashOpened MRO distribution center in Calgary Canada | ||
| October 2018 | OslashCompleted Screw Products acquisition and added Bolt Supply branch | ||
| June 2019 | OslashAchieved Q2 98 adjusted EBITDA net of ASC 842 impact of 03 | ||
| September 2019 | OslashAchieved Q3 109 adjusted EBITDA hired VP MampA | ||
| October 2019 | OslashEntered into new five-year $100M credit facility with additional $50 million accordion feature |
| ($ in thousands) | Q3 2013 | Q4 2013 | Q1 2014 | Q2 2014 | Q3 2014 | Q4 2014 | Q1 2015 | Q2 2015 | Q3 2015 | Q4 2015 | Q1 2016 | Q2 2016 | Q3 2016 | Q4 2016 | Q1 2017 | Q2 2017 | Q3 2017 | Q4 2017 | ||||||||||||||||||||||||||||||||||||||||||||||
| SGampA | 40350 | 42856 | 45991 | 42562 | 43855 | 44764 | 43830 | 40565 | 40532 | 41145 | 41290 | 42497 | 40184 | 45548 | 44167 | 42672 | 44915 | 46750 | $ 173014 | |||||||||||||||||||||||||||||||||||||||||||||
| $ - | ||||||||||||||||||||||||||||||||||||||||||||||||||||||||||||||||
| Excluded Costs | $ - | 40196 | ||||||||||||||||||||||||||||||||||||||||||||||||||||||||||||||
| Severance | (962) | 127 | (728) | (290) | 328 | 59 | (571) | (50) | (372) | (280) | (204) | (143) | (367) | (1662) | (465) | 9 | (139) | (144) | $ (234) | 127 | ||||||||||||||||||||||||||||||||||||||||||||
| Stock Based Compensation (Benefit) | (33) | (562) | (1125) | (408) | (2423) | (2443) | 541 | (971) | 30 | (1693) | 1217 | (515) | 630 | (3801) | 30 | (415) | (2337) | (384) | $ (5296) | -32 | ||||||||||||||||||||||||||||||||||||||||||||
| Loss(Gain) on Disposal of Property | 36 | (32) | - 0 | - 0 | (97) | (45) | - 0 | - 0 | 2 | (9) | - 0 | - 0 | - 0 | - 0 | - 0 | - 0 | - 0 | - 0 | $ (142) | |||||||||||||||||||||||||||||||||||||||||||||
| Legal Settlement | - 0 | - 0 | - 0 | - 0 | 688 | - 0 | - 0 | - 0 | - 0 | - 0 | - 0 | - 0 | - 0 | - 0 | - 0 | - 0 | - 0 | - 0 | $ 688 | -562 | ||||||||||||||||||||||||||||||||||||||||||||
| Employment Tax Matter | - 0 | 400 | - 0 | - 0 | - 0 | - 0 | - 0 | - 0 | - 0 | - 0 | - 0 | - 0 | - 0 | - 0 | - 0 | - 0 | - 0 | - 0 | $ - | 39729 | ||||||||||||||||||||||||||||||||||||||||||||
| Loss on Sub-Lease | - 0 | (2928) | - 0 | - 0 | - 0 | - 0 | - 0 | - 0 | - 0 | - 0 | - 0 | - 0 | - 0 | - 0 | - 0 | - 0 | - 0 | - 0 | $ - | |||||||||||||||||||||||||||||||||||||||||||||
| National sales meeting | - 0 | - 0 | - 0 | - 0 | - 0 | - 0 | (1889) | - 0 | - 0 | - 0 | - 0 | - 0 | - 0 | - 0 | - 0 | - 0 | - 0 | - 0 | $ (1889) | |||||||||||||||||||||||||||||||||||||||||||||
| Remediation expense | - 0 | - 0 | - 0 | - 0 | - 0 | (340) | - 0 | - 0 | - 0 | - 0 | - 0 | - 0 | - 0 | - 0 | - 0 | - 0 | - 0 | - 0 | $ (340) | |||||||||||||||||||||||||||||||||||||||||||||
| Property Impairment Loss | - 0 | - 0 | (2914) | (132) | - 0 | - 0 | - 0 | - 0 | - 0 | - 0 | - 0 | - 0 | - 0 | - 0 | - 0 | - 0 | - 0 | - 0 | $ - | |||||||||||||||||||||||||||||||||||||||||||||
| Adjusted SGampA | $ 39391 | $ 39861 | $ 41224 | $ 41732 | $ 42351 | $ 41995 | $ 41911 | $ 39544 | $ 40192 | $ 39163 | $ 42303 | $ 41839 | $ 40447 | $ 40085 | $ 43732 | $ 42266 | $ 42439 | $ 46222 | $ 165801 | |||||||||||||||||||||||||||||||||||||||||||||
| Annual Adjusted EBITDA of Sales | ERRORREF | ERRORREF | ||||||||||||||||||||||||||||||||||||||||||||||||||||||||||||||
| Q1 2013 | Q2 2013 | Q3 2013 | Q4 2013 | Q1 2014 | Q2 2014 | Q3 2014 | Q4 2014 | Q1 2015 | |||||||||||
| Selling Days | 63 | 64 | 64 | 61 | 63 | 64 | 64 | 61 | 63 | ||||||||||
| Net Sales | 67213 | 68317 | 68235 | 65738 | 69204 | 72080 | 74128 | 70281 | 69904 | ||||||||||
| Average Daily Sales | 1067 | 1067 | 1066 | 1078 | 1098 | 1126 | 1158 | 1152 | 1110 | ||||||||||
| Average Sales Rep Count | 762 | 764 | 774 | 794 | 819 | 854 | 882 | 908 | 911 | ||||||||||
| Sales per Sales Rep per Day | 1400 | 1397 | 1377 | 1358 | 1341 | 1319 | 1313 | 1269 | 1218 | ||||||||||
| Full Year | ||||||||||||||||||||||||||||||||||||||||||||||||||||||||||||||||||||
| ($ in thousands) | Q1 2011 | Q2 2011 | Q3 2011 | Q4 2011 | Q1 2012 | Q2 2012 | Q3 2012 | Q4 2012 | Q1 2013 | Q2 2013 | Q3 2013 | Q4 2013 | Q1 2014 | Q2 2014 | Q3 2014 | Q4 2014 | Q1 2015 | Q2 2015 | Q3 2015 | Q4 2015 | Q1 2016 | Q2 2016 | Q3 2016 | Q4 2016 | Q1 2017 | Q2 2017 | Q3 2017 | Q4 2017 | Q1 2018 | Q2 2018 | Q3 2018 | 2014 | 2015 | |||||||||||||||||||||||||||||||||||
| Net Sales | $ 79255 | $ 80625 | $ 71490 | $ 69029 | $ 71364 | $ 69830 | $ 67863 | $ 64505 | $ 67213 | $ 68317 | $ 68235 | $ 65738 | $ 69204 | $ 72080 | $ 74128 | $ 70281 | $ 69904 | $ 70726 | $ 70243 | $ 64961 | $ 69711 | $ 69348 | $ 70199 | $ 67315 | $ 74617 | $ 75006 | $ 75651 | $ 80633 | $ 84459 | $ 90382 | $ 88530 | $ 285693 | $ 275834 | |||||||||||||||||||||||||||||||||||
| Operating Income (Loss) | 3542 | 1397 | (3480) | (6995) | (3466) | (42084) | (1740) | 2057 | (3530) | (201) | 870 | (3002) | (4713) | 1241 | 678 | (2169) | (947) | 3243 | 2810 | (2985) | 1169 | 29 | 2389 | (5044) | 712 | 7891 | 1090 | 243 | 1837 | 5554 | (2266) | (4963) | 2121 | |||||||||||||||||||||||||||||||||||
| Depreciation amp Amortization | 1260 | 1315 | 1160 | 1675 | 1715 | 1566 | 1963 | 1841 | 2061 | 2244 | 2367 | 2358 | 2295 | 2163 | 2160 | 2133 | 2096 | 2126 | 2119 | 2202 | 2187 | 2226 | 1973 | 1680 | 1705 | 1644 | 1591 | 1830 | 1686 | 1679 | 1755 | 8751 | 8543 | |||||||||||||||||||||||||||||||||||
| EBITDA | 4802 | 2712 | (2320) | (5320) | (1751) | (40518) | 223 | 3898 | (1469) | 2043 | 3237 | (644) | (2418) | 3404 | 2838 | (36) | 1149 | 5369 | 4929 | (783) | 3356 | 2255 | 4362 | (3364) | 2417 | 9535 | 2681 | 2073 | 3523 | 7233 | (511) | 3788 | 10664 | |||||||||||||||||||||||||||||||||||
| Excluded Costs | ||||||||||||||||||||||||||||||||||||||||||||||||||||||||||||||||||||
| Severance | 745 | 465 | 282 | 122 | 185 | 6585 | 1410 | (159) | - 0 | 2 | 962 | (127) | 728 | 290 | (328) | (59) | 571 | 50 | 372 | 280 | 204 | 143 | 367 | 1662 | 465 | (9) | 139 | 144 | 628 | 64 | 31 | 631 | 1273 | |||||||||||||||||||||||||||||||||||
| Stock Based Compensation (Benefit) | 227 | (95) | (538) | 467 | 198 | (1015) | 77 | 434 | 1596 | 76 | 33 | 562 | 1125 | 408 | 2423 | 2443 | (541) | 971 | (30) | 1693 | (1217) | 515 | (630) | 3801 | (30) | 415 | 2337 | 384 | 970 | 87 | 7637 | 6399 | 2093 | |||||||||||||||||||||||||||||||||||
| Acquisition Related Costs | - 0 | - 0 | - 0 | - 0 | - 0 | - 0 | 310 | 32 | 115 | 198 | 178 | 120 | - 0 | - 0 | 286 | 425 | - 0 | - 0 | 168 | |||||||||||||||||||||||||||||||||||||||||||||||||
| ERP Implementation Costs | 1902 | 2388 | 2344 | 339 | - 0 | - 0 | - 0 | - 0 | - 0 | - 0 | - 0 | - 0 | - 0 | - 0 | - 0 | - 0 | - 0 | - 0 | - 0 | - 0 | - 0 | - 0 | - 0 | - 0 | - 0 | - 0 | - 0 | - 0 | - 0 | - 0 | - 0 | - 0 | ||||||||||||||||||||||||||||||||||||
| Loss(Gain) on Disposal of Property | - 0 | - 0 | - 0 | 22 | - 0 | (2122) | (11) | (1588) | - 0 | - 0 | (36) | 32 | - 0 | - 0 | 97 | 45 | - 0 | - 0 | (2) | 9 | - 0 | - 0 | - 0 | - 0 | - 0 | (5422) | - 0 | - 0 | - 0 | - 0 | - 0 | 142 | 7 | |||||||||||||||||||||||||||||||||||
| Legal Settlement | - 0 | - 0 | - 0 | - 0 | - 0 | - 0 | - 0 | - 0 | - 0 | - 0 | - 0 | - 0 | - 0 | - 0 | (688) | - 0 | - 0 | - 0 | - 0 | - 0 | - 0 | - 0 | - 0 | - 0 | - 0 | - 0 | - 0 | - 0 | - 0 | - 0 | - 0 | (688) | - 0 | |||||||||||||||||||||||||||||||||||
| Employment Tax Matter | - 0 | - 0 | - 0 | 1200 | - 0 | - 0 | - 0 | - 0 | - 0 | - 0 | - 0 | (400) | - 0 | - 0 | - 0 | - 0 | - 0 | - 0 | - 0 | - 0 | - 0 | - 0 | - 0 | - 0 | - 0 | - 0 | - 0 | - 0 | - 0 | - 0 | - 0 | - 0 | - 0 | |||||||||||||||||||||||||||||||||||
| Lease termination gain | - 0 | - 0 | - 0 | - 0 | - 0 | - 0 | - 0 | - 0 | - 0 | - 0 | - 0 | 2928 | - 0 | - 0 | - 0 | - 0 | - 0 | - 0 | - 0 | - 0 | - 0 | - 0 | - 0 | - 0 | - 0 | - 0 | - 0 | - 0 | - 0 | (164) | - 0 | - 0 | - 0 | |||||||||||||||||||||||||||||||||||
| Goodwill Impairment | - 0 | - 0 | - 0 | - 0 | - 0 | 28306 | - 0 | - 0 | - 0 | - 0 | - 0 | - 0 | - 0 | - 0 | - 0 | - 0 | - 0 | - 0 | - 0 | - 0 | - 0 | - 0 | - 0 | - 0 | - 0 | - 0 | - 0 | - 0 | - 0 | - 0 | - 0 | - 0 | - 0 | |||||||||||||||||||||||||||||||||||
| Inventory Rationalization | - 0 | - 0 | - 0 | - 0 | - 0 | 3893 | - 0 | - 0 | - 0 | - 0 | - 0 | - 0 | - 0 | - 0 | - 0 | - 0 | - 0 | - 0 | - 0 | - 0 | - 0 | - 0 | - 0 | - 0 | - 0 | - 0 | - 0 | - 0 | - 0 | - 0 | - 0 | - 0 | - 0 | |||||||||||||||||||||||||||||||||||
| Discontinued operation accrual | - 0 | - 0 | - 0 | - 0 | - 0 | - 0 | - 0 | - 0 | - 0 | - 0 | - 0 | - 0 | - 0 | - 0 | - 0 | 340 | - 0 | - 0 | - 0 | 931 | - 0 | - 0 | - 0 | - 0 | - 0 | - 0 | - 0 | - 0 | - 0 | 529 | - 0 | 340 | 931 | |||||||||||||||||||||||||||||||||||
| North American sales meeting | - 0 | - 0 | - 0 | - 0 | - 0 | - 0 | - 0 | - 0 | 1225 | - 0 | - 0 | - 0 | - 0 | - 0 | - 0 | - 0 | 1889 | - 0 | - 0 | - 0 | - 0 | - 0 | - 0 | - 0 | - 0 | - 0 | - 0 | - 0 | - 0 | - 0 | - 0 | - 0 | 1889 | |||||||||||||||||||||||||||||||||||
| Property Impairment Loss | - 0 | - 0 | - 0 | - 0 | - 0 | - 0 | - 0 | - 0 | - 0 | - 0 | - 0 | - 0 | 2914 | 132 | - 0 | - 0 | - 0 | - 0 | - 0 | - 0 | - 0 | - 0 | - 0 | - 0 | - 0 | - 0 | - 0 | - 0 | - 0 | - 0 | - 0 | 3046 | - 0 | |||||||||||||||||||||||||||||||||||
| Adjusted EBITDA | $ 7676 | $ 5470 | $ (232) | $ (3170) | $ (1368) | $ (4871) | $ 1699 | $ 2585 | $ 1352 | $ 2121 | $ 4196 | $ 2351 | $ 2349 | $ 4234 | $ 4342 | $ 2733 | $ 3068 | $ 6390 | $ 5579 | $ 2162 | $ 2458 | $ 3111 | $ 4277 | $ 2219 | $ 2852 | $ 4519 | $ 5443 | $ 3026 | $ 5121 | $ 7749 | $ 7325 | $ 13658 | $ 17199 | |||||||||||||||||||||||||||||||||||
| Adjusted EBITDA of Sales | 97 | 68 | -03 | -46 | -19 | -70 | 25 | 40 | 20 | 31 | 61 | 36 | 34 | 59 | 59 | 39 | 44 | 90 | 79 | 33 | 35 | 45 | 61 | 33 | 38 | 60 | 72 | 38 | 61 | 86 | 83 | 48 | 62 | |||||||||||||||||||||||||||||||||||
| Annual Adjusted EBITDA of Sales | 44 | 58 | ||||||||||||||||||||||||||||||||||||||||||||||||||||||||||||||||||
| Adjusted Operating Income | (3083) | (6437) | (264) | 744 | (709) | (123) | 1829 | (7) | 54 | 2071 | 2182 | 600 | 972 | 4264 | 3460 | (40) | 271 | 885 | 2304 | 539 | 1147 | 2875 | 3852 | 1196 | 3435 | 6070 | 5570 | - 0 | 4907 | 8314 | ||||||||||||||||||||||||||||||||||||||
| Sales | |||
| Broad Based MRO Market | $150000000000 | ||
| Service Based VMI Market | $25000000000 | ||
| 3rd Qtr | 12 | ||
| 4th Qtr | 12 | ||
| To resize chart data range drag lower right corner of range |
| Broad Based MRO Market | |
| Service Based VMI Market |
copy 2019 Lawson Products Inc All rights reserved Confidential Material Reproduction In Whole or in Part Prohibited
Our Commitment to our 70000+ Customers
High touch service and technical expertise drives customer relationshipsBefore After
One Company Zero Headaches Inventory Management Options Access to Industry Knowledge amp Expertise
bull Comprehensive line of products bull Lawson Managed Inventory bull Product recommendations from your Lawson Representative
bull Hundreds of pre-built assortments bull Industrial vending bull Application advice from our test and application engineers
bull Unlimited sourcing of hard-to-find items
bull Self-service inventory management
bull Complimentary on-site safety amp product usage training
5
copy 2019 Lawson Products Inc All rights reserved Confidential Material Reproduction In Whole or in Part Prohibited
Customer and Product Profile
6
Retain over 90 of customer revenues from year to year
Fastening Systems
23
Fluid Power15
Specialty Chemicals
12
Cutting Tools and Abrasives
13
Electrical11
Aftermarket Automotive
Supplies8
Safety5
Welding and Metal Repair
2
Other10
Product Mix
Regional Accounts
47
Strategic14
Kent Automotive
15
Bolt Supply11
Government 11
Other2
Customer Mix
copy 2019 Lawson Products Inc All rights reserved Confidential Material Reproduction In Whole or in Part Prohibited
Lawson Growth Strategy
Sales Growth Driven By
Foundational SupportERP Network
OptimizationSales
TransformationLean Six Sigma
Website
7
New Sales Reps
Sales RepProductivity
Acquisitions
copy 2019 Lawson Products Inc All rights reserved Confidential Material Reproduction In Whole or in Part Prohibited
2019 Focus Actions Across the Value Chain Driving Growth
Add New Sales Reps and Drive Rep Productivity
Sales Process Sales Reps
Customer Service Order
Entry
ProductManagement
PricingDC Operations Sourcing
Purchasing
bull Increase sales rep count
bull Onboardingprocesstraining
bull SalesManagement dashboard
bull EDI with customers
bull Reduction of cycle times
bull Order padbull Consolidation of
shipmentsbull Sales service reps
bull Leverage vendor drop-ship programs
bull Fleet maintenance focus
bull Pricing enhancements
bull Website
bull Reduce cycle timebull Refine ldquoPullrdquo
strategybull Freight
enhancementsbull Minimize
backordersbull Improve service
levelsbull Forecasting tool
bull Supplier negotiation process
bull Vendor metricsbull Electronic
communication
Information Technology ndash Integration of Web and SAPLean Six Sigma
8
copy 2019 Lawson Products Inc All rights reserved Confidential Material Reproduction In Whole or in Part Prohibited
Longer Sales Rep Tenure Drives Rep Productivity
9
$0
$50000
$100000
$150000
$200000
$250000
$300000
$350000
$400000
$450000
$500000
lt 12 Mos 1 - 2 Yrs 3 - 5 Yrs 5 - 10 Yrs gt 10 Yrs0
50
100
150
200
250
300
350
Aver
age
Annu
al S
ales
Tenure With Lawson (as of 93019)
Num
ber O
f Sal
es R
eps
Number of Reps Average Annual Sales
copy 2019 Lawson Products Inc All rights reserved Confidential Material Reproduction In Whole or in Part Prohibited
Historical Financial Performance
Recent sales growth and earnings expansion providing financial flexibility
10
$200000
$250000
$300000
$350000
$400000
2014 2015 2016 2017 2018 TTM93019
Consolidated Revenues
$0$5000
$10000$15000$20000$25000$30000$35000
2014 2015 2016 2017 2018 TTM93019
Adjusted Reg G EBITDA
-$15000
-$10000
-$5000
$0
$5000
$10000
$15000
2014 2015 2016 2017 2018 9302019
Net Cash(Debt)
$0
$2000
$4000
$6000
$8000
$10000
$12000
Q1 Q2 Q3 Q4
Quarterly Adjusted Reg G EBITDA
2017
20172017
2017
2018
20182018
2018
20192019
2019
copy 2019 Lawson Products Inc All rights reserved Confidential Material Reproduction In Whole or in Part Prohibited
Financial Highlights for Third Quarter 2019
bull Sales increased 71 YOY (74 excluding currency fluctuation)
bull MRO LawsonKent gross margins consistent at 609
bull Adjusted Reg G EBITDA margin improving 109 in Q3 2019 v 83 in Q3 2018 Continued investment in new sales reps and rep productivity
bull Key trends MRO operating leverage of 54 13 increase in sales rep productivity Continued government strength +30 YOY Growth across multiple segments and product categories Cash flow from operations of $103 million in Q3
11
copy 2019 Lawson Products Inc All rights reserved Confidential Material Reproduction In Whole or in Part Prohibited
Pursue Disciplined MampA
Reinvest for Growth
Return Capital
bull Increased our borrowing capacity to $1000 million (additional $500 million accordion) with our new borrowing agreement
bull Capital expenditures expected to be $20 - $30 million in 2019bull Growth initiatives add new reps and increase sales rep productivity
bull Share repurchase to offset award dilution opportunistic purchasesbull $75 million stock repurchase program announced on May 16 2019 $63
million remaining after repurchase of shares worth $12 million in August 2019
bull Bolt-on acquisitions to enhance core growth strategiesbull Closed Screw Products Inc acquisition on 10118
Maintain Strong Balance Sheet
bull $86 million cash on hand and positive cash position of $64 million at the end of Q3
bull Consistent free cash flow generation
Capital Allocation Priorities
12
copy 2019 Lawson Products Inc All rights reserved Confidential Material Reproduction In Whole or in Part Prohibited
Lawson Products Poised for Growth
bull Leverage Current Infrastructure
bull Continued Sales Growth
bull Foundational Investments Completed
bull Operational Excellence
bull Large Fragmented Market
13
copy 2019 Lawson Products Inc All rights reserved Confidential Material Reproduction In Whole or in Part Prohibited
For More Information
Contact
Ronald J KnutsonEVP CFOInvestor Relations(773) 304-5665ronknutsonlawsonproductscom
And see our Website athttpwwwlawsonproductscomcompany-infoinvestor-relationsjsp
14
copy 2019 Lawson Products Inc All rights reserved Confidential Material Reproduction In Whole or in Part Prohibited
Appendices
15
copy 2019 Lawson Products Inc All rights reserved Confidential Material Reproduction In Whole or in Part Prohibited
Significant Activities
16
Appendix P-1
August 2011 Implemented SAPOctober 2011 Commenced construction of new McCook Ill distribution center
May 2012 Relocated corporate headquartersJune 2012 Restructured senior team Announced $20M cost savings plan
Transitioned packaging facility to McCook Ill distribution centerEntered into new five-year $40M credit facilityAnnounced new CEO and President Michael G DeCataConsolidated Vernon Hills distribution center into McCook Ill
November 2012 Rolled out new website to existing web customersDecember 2012 Completed transition of US independent agents to employees
April 2013 Roll-out of new website to new web customersAprilMay 2013 McCook DC begins to ship customer ordersNovember 2013 Entered into sub-lease of headquarters space to generate $29M of future cash savingsDecember 2013 Ended year with over 800 sales reps ndash First increase in 8 yearsFebruary 2014 Closed on Automatic Screw Machine Products sale for net proceeds of $121M
June 2014 Entered into sale-leaseback of Reno distribution facility for net proceeds of $83MDecember 2014 Ended year with over 900 sales repsFebruary 2015 Held North American sales meeting
September 2015 Completed West Coast Fasteners acquisitionMarch 2016 Completed Perfect Products of Michigan acquisitionMay 2016 Completed F B Feeney acquisitionJune 2016 Expanded sales team to over 1000 sales reps
September 2016 Extended credit facitlity to August 2020November 2016 Completed Mattic Industries acquisition
March 2017 Consolidated Fairfield NJ distribution operations into McCook Ill and Suwanee GAMay 2017 Sold Fairfield NJ distribution center for a gain of $54M
October 2017 Completed Bolt Supply House acquisitionApril 2018 Opened MRO distribution center in Calgary Canada
October 2018 Completed Screw Products acquisition and added Bolt Supply branchJune 2019 Achieved Q2 98 adjusted EBITDA net of ASC 842 impact of 03
September 2019 Achieved Q3 109 adjusted EBITDA hired VP MampAOctober 2019 Entered into new five-year $100M credit facility with additional $50 million accordion feature
August 2012
October 2012
Adjusted EBITDA $ in 000s
Adjusted EBITDA Q4 2016Q1 2017Q2 2017Q3 2017Q4 201722192852451954433026
Adjusted EBITDA of Sales
Adjusted EBITDA of SalesQ3 2016Q4 2016Q1 2017Q2 2017Q3 2017Q4 201760926793828971926E-232964421005719377E-23822185292895721E-260248513452257152E-271948817596594883E-237528059231332088E-2
Adjusted Operating Income of Sales
Adjusted Operating IncomeQ3 2016Q4 2016Q1 2017Q2 2017Q3 2017Q4 201723045391147287538521196
Adjusted Op Inc $ in 000s
Adjusted EBITDA Q4 2016Q1 2017Q2 2017Q3 2017Q4 20175391147287538521196
Net Sales by Quarter $ in 000s
Net SalesQ1 2013Q2 2013Q3 2013Q4 2013Q1 2014Q2 2014Q3 2014Q4 2014Q1 2015672136831768235657386920472080741287028169904
Adjusted SGampA $ in 000s
Adjusted SGampA Q4 2015Q1 2016Q2 2016Q3 2016Q4 2016Q1 2017Q2 2017Q3 2017Q4 2017391634230341839404474008543732422664243946222
copy 2019 Lawson Products Inc All rights reserved Confidential Material Reproduction In Whole or in Part Prohibited
Regulation G ndash GAAP ReconciliationAppendix P-2
Non GAAP Reconciliation of Adjusted EBITDA to Sales Percentage
The Company reports its financial results in accordance with US generally accepted accounting principles (GAAP) However the Companys management believesthat certain non-GAAP financial measures may provide users of this financial information additional meaningful comparisons between current results and results inprior operating periods Management believes that these non-GAAP financial measures can provide additional meaningful reflection of underlying trends of thebusiness because they provide a comparison of historical information that excludes certain non-operational non-recurring or intermittently recurring items thatimpact the overall comparability See the table below for supplemental financial data and corresponding reconciliations to GAAP financial measures for quarterlyadjusted EBITDA as a percentage of net sales Non-GAAP financial measures should be viewed in addition to and not as an alternative for the Companys reportedresults prepared in accordance with GAAP
17
($ in thousands) Q1 2017 Q2 2017 Q3 2017 Q4 2017 Q1 2018 Q2 2018 Q3 2018 Q4 2018 Q1 2019 Q2 2019 Q3 2019
Net Sales 74617$ 75006$ 75651$ 80633$ 84459$ 90382$ 88530$ 86266$ 91343$ 96097$ 94779$
Operating Income (Loss) 712 7891 1090 243 1837 5554 (2266) 4085 5544 1623 6446 Depreciation amp Amortization 1705 1644 1591 1830 1686 1679 1755 1735 1478 1455 1468 EBITDA 2417 9535 2681 2073 3523 7233 (511) 5820 7022 3078 7914
Excluded CostsSeverance 465 (9) 139 144 628 64 31 126 27 1485 30 Stock Based Compensation (Benefit) (30) 415 2337 384 970 87 7637 (1186) 408 4839 2374 Acquisition Related Costs - - 286 425 - - 168 62 - - - Loss(Gain) on Disposal of Property - (5422) - - - - - - - - - Lease termination gain - - - - - (164) - - - - - Discontinued operation accrual - - - - - 529 - - - - - Building Impairment - - - - - - - 231 - - - Reg G Adjusted EBITDA 2852$ 4519$ 5443$ 3026$ 5121$ 7749$ 7325$ 5053$ 7457$ 9402$ 10318$
Adjusted EBITDA of Sales 38 60 72 38 61 86 83 59 82 98 109
Customer Mix
Regional Accounts48
Kent Automotive16
Regional AccountsStrategicKent AutomotiveBolt SupplyGovernment Screw ProductsOther047014000000000000001016011010002
ampDampF ampA
Product Mix
Fastening Systems23
Specialty Chemicals12
Fastening SystemsFluid PowerSpecialy ChemicalsCutting Tools and AbrasivesElectricalAftermarket Automotive SuppliesSafetyWelding and Metal RepairOther02401501201301100800500201
Number Of Sales Reps
Tenure With Lawson (as of 63019)
Average Annual Sales
Consolidated Revenues
Consolidated Revenues20142015201620172018TTM 63019285693275834276573305907349637362236Net Cash(Debt)2014201520162017201843646420798409580-101271060-1908Rep Count201320142015201620172018436468069169371009983994982
Adjusted Reg G EBITDA
Adjusted EBITDA20142015201620172018TTM 63019136581719912065158402524829237
Quarterly Adjusted Reg G EBITDA
2017Q1Q2Q3Q428524519544330262018Q1Q2Q3Q451217749732550532019Q1Q2Q3Q474579402
Adjusted EBITDA $ in 000s
Reg G Adjusted EBITDA Q1 2017Q2 2017Q3 2017Q4 20172852451954433026
Adjusted EBITDA of Sales
Adjusted EBITDA of SalesQ1 2017Q2 2017Q3 2017Q4 20173822185292895721E-260248513452257152E-271948817596594883E-237528059231332088E-2
Adjusted Operating Income of Sales
Adjusted Operating IncomeQ1 2017Q2 2017Q3 2017Q4 2017
Adjusted Op Inc $ in 000s
Reg G Adjusted EBITDA Q1 2017Q2 2017Q3 2017Q4 2017
copy 2019 Lawson Products Inc All rights reserved Confidential Material Reproduction In Whole or in Part Prohibited
Consolidated Balance Sheet Appendix P-4
18
ASSETSCurrent assetsCash and cash equivalents $ 8626 $ 11883Restricted cash 800 800Accounts receivable less allowance for doubtful accounts of $614 and $549 respectively
45162 37682
Inventories net 54894 52887Miscellaneous receivables and prepaid expenses 4270 3653Total current assets 113752 106905
Property plant and equipment net 16932 23548Deferred income taxes 17372 20592Goodwill 20582 20079Cash value of life insurance 14440 12599Intangible assets net 12468 13112Lease assets 11917 mdashOther assets 275 307Total assets $ 207738 $ 197142
LIABILITIES AND STOCKHOLDERSrsquo EQUITYCurrent liabilitiesRevolving lines of credit $ 2195 $ 10823Accounts payable 16325 15207Lease obligation 3781 mdashAccrued expenses and other liabilities 37873 40179Total current liabilities 60174 66209
Security bonus plan 11969 12413Lease obligation 10360 5213Deferred compensation 5915 5304Deferred tax liability 2879 2761Other liabilities 3460 6069Total liabilities 94757 97969
Stockholdersrsquo equityPreferred stock $1 par valueAuthorized - 500000 shares Issued and outstanding mdash None mdash mdashCommon stock $1 par value
Authorized - 35000000 sharesIssued - 9042597 and 9005716 shares respectivelyOutstanding - 8956981 and 8955930 shares respectively
Capital in excess of par value 17626 15623Retained earnings 89502 77338Treasury stock ndash 85616 and 49786 shares respectivelyAccumulated other comprehensive lossTotal stockholdersrsquo equity 112981 99173Total liabilities and stockholdersrsquo equity $ 207738 $ 197142
September 30 December 312019 2018
(Unaudited)
(2595) (1234)(595) (1560)
9043 9006
Customer Mix
Regional Accounts48
Kent Automotive16
Regional AccountsStrategicKent AutomotiveBolt SupplyGovernment Screw ProductsOther0470140000000000000010150110110002
ampDampF ampA
Product Mix
Fastening Systems23
Specialty Chemicals12
Fastening SystemsFluid PowerSpecialy ChemicalsCutting Tools and AbrasivesElectricalAftermarket Automotive SuppliesSafetyWelding and Metal RepairOther02401501201301100800500201
Number Of Sales Reps
Tenure With Lawson (as of 63019)
Average Annual Sales
Consolidated Revenues
Consolidated Revenues20142015201620172018TTM 93019285693275834276573305907349637368485Net Cash(Debt)2014201520162017201843738420798409580-1012710606431Rep Count201320142015201620172018437388069169371009983994993
Adjusted Reg G EBITDA
Adjusted EBITDA20142015201620172018TTM 93019136581719912065158402524832230
Quarterly Adjusted Reg G EBITDA
2017Q1Q2Q3Q428524519544330262018Q1Q2Q3Q451217749732550532019Q1Q2Q3Q47457940210318
Adjusted EBITDA $ in 000s
Reg G Adjusted EBITDA Q1 2017Q2 2017Q3 2017Q4 20172852451954433026
Adjusted EBITDA of Sales
Adjusted EBITDA of SalesQ1 2017Q2 2017Q3 2017Q4 20173822185292895721E-260248513452257152E-271948817596594883E-237528059231332088E-2
Adjusted Operating Income of Sales
Adjusted Operating IncomeQ1 2017Q2 2017Q3 2017Q4 2017
Adjusted Op Inc $ in 000s
Reg G Adjusted EBITDA Q1 2017Q2 2017Q3 2017Q4 2017
| September 30 | December 31 | ||||||||||
| 2019 | 2018 | ||||||||||
| ASSETS | (Unaudited) | ||||||||||
| Current assets | |||||||||||
| Cash and cash equivalents | $ | 8626 | $ | 11883 | |||||||
| Restricted cash | 800 | 800 | |||||||||
| Accounts receivable less allowance for doubtful accounts of $614 and $549 respectively | 45162 | 37682 | |||||||||
| Inventories net | 54894 | 52887 | |||||||||
| Miscellaneous receivables and prepaid expenses | 4270 | 3653 | |||||||||
| Total current assets | 113752 | 106905 | |||||||||
| Property plant and equipment net | 16932 | 23548 | |||||||||
| Deferred income taxes | 17372 | 20592 | |||||||||
| Goodwill | 20582 | 20079 | |||||||||
| Cash value of life insurance | 14440 | 12599 | |||||||||
| Intangible assets net | 12468 | 13112 | |||||||||
| Lease assets | 11917 | mdash | |||||||||
| Other assets | 275 | 307 | |||||||||
| Total assets | $ | 207738 | $ | 197142 | |||||||
| LIABILITIES AND STOCKHOLDERSrsquo EQUITY | |||||||||||
| Current liabilities | |||||||||||
| Revolving lines of credit | $ | 2195 | $ | 10823 | |||||||
| Accounts payable | 16325 | 15207 | |||||||||
| Lease obligation | 3781 | mdash | |||||||||
| Accrued expenses and other liabilities | 37873 | 40179 | |||||||||
| Total current liabilities | 60174 | 66209 | |||||||||
| Security bonus plan | 11969 | 12413 | |||||||||
| Lease obligation | 10360 | 5213 | |||||||||
| Deferred compensation | 5915 | 5304 | |||||||||
| Deferred tax liability | 2879 | 2761 | |||||||||
| Other liabilities | 3460 | 6069 | |||||||||
| Total liabilities | 94757 | 97969 | |||||||||
| Stockholdersrsquo equity | |||||||||||
| Preferred stock $1 par value | |||||||||||
| Authorized - 500000 shares Issued and outstanding mdash None | mdash | mdash | |||||||||
| Common stock $1 par value | |||||||||||
| Authorized - 35000000 shares | 9043 | 9006 | |||||||||
| Issued - 9042597 and 9005716 shares respectively | |||||||||||
| Outstanding - 8956981 and 8955930 shares respectively | |||||||||||
| Capital in excess of par value | 17626 | 15623 | |||||||||
| Retained earnings | 89502 | 77338 | |||||||||
| Treasury stock ndash 85616 and 49786 shares respectively | (2595) | (1234) | |||||||||
| Accumulated other comprehensive loss | (595) | (1560) | |||||||||
| Total stockholdersrsquo equity | 112981 | 99173 | |||||||||
| Total liabilities and stockholdersrsquo equity | $ | 207738 | $ | 197142 | |||||||
| Three Months Ended | |||||||||||||||||||||||||||||
| Jun 30 2019 | Mar 31 2019 | Dec 31 2018 | Sep 30 2018 | Jun 30 2018 | |||||||||||||||||||||||||
| Average daily net sales | $ | 1502 | $ | 1450 | $ | 1414 | $ | 1405 | $ | 1412 | |||||||||||||||||||
| Year over year increase | 63 | 82 | 70 | 170 | 205 | ||||||||||||||||||||||||
| Sequential quarter increase (decrease) | 36 | 25 | 06 | (05) | 53 | ||||||||||||||||||||||||
| Net Sales | $ | 96097 | $ | 91343 | $ | 86266 | $ | 88530 | $ | 90382 | |||||||||||||||||||
| Gross profit (1) | 51043 | 48923 | 46083 | 48108 | 49131 | ||||||||||||||||||||||||
| Gross profit percentage (1) | 531 | 536 | 534 | 543 | 544 | ||||||||||||||||||||||||
| Selling general amp administrative expenses | $ | 49420 | $ | 43379 | $ | 41998 | $ | 50374 | $ | 43577 | |||||||||||||||||||
| Operating income (loss) | $ | 1623 | $ | 5544 | $ | 4085 | $ | (2266) | $ | 5554 | |||||||||||||||||||
| Full Year | |||||||||||||||||||||||||||||||||||||||||||||||||||||||||||||||||||||||||||
| ($ in thousands) | Q1 2011 | Q2 2011 | Q3 2011 | Q4 2011 | Q1 2012 | Q2 2012 | Q3 2012 | Q4 2012 | Q1 2013 | Q2 2013 | Q3 2013 | Q4 2013 | Q1 2014 | Q2 2014 | Q3 2014 | Q4 2014 | Q1 2015 | Q2 2015 | Q3 2015 | Q4 2015 | Q1 2016 | Q2 2016 | Q3 2016 | Q4 2016 | Q1 2017 | Q2 2017 | Q3 2017 | Q4 2017 | Q1 2018 | Q2 2018 | Q3 2018 | Q4 2018 | Q1 2019 | Q2 2019 | Q3 2019 | 2014 | 2015 | ||||||||||||||||||||||||||||||||||||||
| Net Sales | $ 79255 | $ 80625 | $ 71490 | $ 69029 | $ 71364 | $ 69830 | $ 67863 | $ 64505 | $ 67213 | $ 68317 | $ 68235 | $ 65738 | $ 69204 | $ 72080 | $ 74128 | $ 70281 | $ 69904 | $ 70726 | $ 70243 | $ 64961 | $ 69711 | $ 69348 | $ 70199 | $ 67315 | $ 74617 | $ 75006 | $ 75651 | $ 80633 | $ 84459 | $ 90382 | $ 88530 | $ 86266 | $ 91343 | $ 96097 | $ 94779 | $ 285693 | $ 275834 | ||||||||||||||||||||||||||||||||||||||
| Operating Income (Loss) | 3542 | 1397 | (3480) | (6995) | (3466) | (42084) | (1740) | 2057 | (3530) | (201) | 870 | (3002) | (4713) | 1241 | 678 | (2169) | (947) | 3243 | 2810 | (2985) | 1169 | 29 | 2389 | (5044) | 712 | 7891 | 1090 | 243 | 1837 | 5554 | (2266) | 4085 | 5544 | 1623 | 6446 | (4963) | 2121 | ||||||||||||||||||||||||||||||||||||||
| Depreciation amp Amortization | 1260 | 1315 | 1160 | 1675 | 1715 | 1566 | 1963 | 1841 | 2061 | 2244 | 2367 | 2358 | 2295 | 2163 | 2160 | 2133 | 2096 | 2126 | 2119 | 2202 | 2187 | 2226 | 1973 | 1680 | 1705 | 1644 | 1591 | 1830 | 1686 | 1679 | 1755 | 1735 | 1478 | 1455 | 1468 | 8751 | 8543 | ||||||||||||||||||||||||||||||||||||||
| EBITDA | 4802 | 2712 | (2320) | (5320) | (1751) | (40518) | 223 | 3898 | (1469) | 2043 | 3237 | (644) | (2418) | 3404 | 2838 | (36) | 1149 | 5369 | 4929 | (783) | 3356 | 2255 | 4362 | (3364) | 2417 | 9535 | 2681 | 2073 | 3523 | 7233 | (511) | 5820 | 7022 | 3078 | 7914 | 3788 | 10664 | ||||||||||||||||||||||||||||||||||||||
| Excluded Costs | |||||||||||||||||||||||||||||||||||||||||||||||||||||||||||||||||||||||||||
| Severance | 745 | 465 | 282 | 122 | 185 | 6585 | 1410 | (159) | - 0 | 2 | 962 | (127) | 728 | 290 | (328) | (59) | 571 | 50 | 372 | 280 | 204 | 143 | 367 | 1662 | 465 | (9) | 139 | 144 | 628 | 64 | 31 | 126 | 27 | 1485 | 30 | 631 | 1273 | ||||||||||||||||||||||||||||||||||||||
| Stock Based Compensation (Benefit) | 227 | (95) | (538) | 467 | 198 | (1015) | 77 | 434 | 1596 | 76 | 33 | 562 | 1125 | 408 | 2423 | 2443 | (541) | 971 | (30) | 1693 | (1217) | 515 | (630) | 3801 | (30) | 415 | 2337 | 384 | 970 | 87 | 7637 | (1186) | 408 | 4839 | 2374 | 6399 | 2093 | ||||||||||||||||||||||||||||||||||||||
| Acquisition Related Costs | - 0 | - 0 | - 0 | - 0 | - 0 | - 0 | 310 | 32 | 115 | 198 | 178 | 120 | - 0 | - 0 | 286 | 425 | - 0 | - 0 | 168 | 62 | - 0 | - 0 | - 0 | ||||||||||||||||||||||||||||||||||||||||||||||||||||
| ERP Implementation Costs | 1902 | 2388 | 2344 | 339 | - 0 | - 0 | - 0 | - 0 | - 0 | - 0 | - 0 | - 0 | - 0 | - 0 | - 0 | - 0 | - 0 | - 0 | - 0 | - 0 | - 0 | - 0 | - 0 | - 0 | - 0 | - 0 | - 0 | - 0 | - 0 | - 0 | - 0 | - 0 | - 0 | ||||||||||||||||||||||||||||||||||||||||||
| Loss(Gain) on Disposal of Property | - 0 | - 0 | - 0 | 22 | - 0 | (2122) | (11) | (1588) | - 0 | - 0 | (36) | 32 | - 0 | - 0 | 97 | 45 | - 0 | - 0 | (2) | 9 | - 0 | - 0 | - 0 | - 0 | - 0 | (5422) | - 0 | - 0 | - 0 | - 0 | - 0 | - 0 | - 0 | - 0 | - 0 | 142 | 7 | ||||||||||||||||||||||||||||||||||||||
| Legal Settlement | - 0 | - 0 | - 0 | - 0 | - 0 | - 0 | - 0 | - 0 | - 0 | - 0 | - 0 | - 0 | - 0 | - 0 | (688) | - 0 | - 0 | - 0 | - 0 | - 0 | - 0 | - 0 | - 0 | - 0 | - 0 | - 0 | - 0 | - 0 | - 0 | - 0 | - 0 | - 0 | (688) | - 0 | |||||||||||||||||||||||||||||||||||||||||
| Employment Tax Matter | - 0 | - 0 | - 0 | 1200 | - 0 | - 0 | - 0 | - 0 | - 0 | - 0 | - 0 | (400) | - 0 | - 0 | - 0 | - 0 | - 0 | - 0 | - 0 | - 0 | - 0 | - 0 | - 0 | - 0 | - 0 | - 0 | - 0 | - 0 | - 0 | - 0 | - 0 | - 0 | - 0 | - 0 | |||||||||||||||||||||||||||||||||||||||||
| Lease termination gain | - 0 | - 0 | - 0 | - 0 | - 0 | - 0 | - 0 | - 0 | - 0 | - 0 | - 0 | 2928 | - 0 | - 0 | - 0 | - 0 | - 0 | - 0 | - 0 | - 0 | - 0 | - 0 | - 0 | - 0 | - 0 | - 0 | - 0 | - 0 | - 0 | (164) | - 0 | - 0 | - 0 | - 0 | - 0 | - 0 | - 0 | ||||||||||||||||||||||||||||||||||||||
| Goodwill Impairment | - 0 | - 0 | - 0 | - 0 | - 0 | 28306 | - 0 | - 0 | - 0 | - 0 | - 0 | - 0 | - 0 | - 0 | - 0 | - 0 | - 0 | - 0 | - 0 | - 0 | - 0 | - 0 | - 0 | - 0 | - 0 | - 0 | - 0 | - 0 | - 0 | - 0 | - 0 | - 0 | - 0 | - 0 | |||||||||||||||||||||||||||||||||||||||||
| Inventory Rationalization | - 0 | - 0 | - 0 | - 0 | - 0 | 3893 | - 0 | - 0 | - 0 | - 0 | - 0 | - 0 | - 0 | - 0 | - 0 | - 0 | - 0 | - 0 | - 0 | - 0 | - 0 | - 0 | - 0 | - 0 | - 0 | - 0 | - 0 | - 0 | - 0 | - 0 | - 0 | - 0 | - 0 | - 0 | |||||||||||||||||||||||||||||||||||||||||
| Discontinued operation accrual | - 0 | - 0 | - 0 | - 0 | - 0 | - 0 | - 0 | - 0 | - 0 | - 0 | - 0 | - 0 | - 0 | - 0 | - 0 | 340 | - 0 | - 0 | - 0 | 931 | - 0 | - 0 | - 0 | - 0 | - 0 | - 0 | - 0 | - 0 | - 0 | 529 | - 0 | - 0 | - 0 | - 0 | - 0 | 340 | 931 | ||||||||||||||||||||||||||||||||||||||
| North American sales meeting | - 0 | - 0 | - 0 | - 0 | - 0 | - 0 | - 0 | - 0 | 1225 | - 0 | - 0 | - 0 | - 0 | - 0 | - 0 | - 0 | 1889 | - 0 | - 0 | - 0 | - 0 | - 0 | - 0 | - 0 | - 0 | - 0 | - 0 | - 0 | - 0 | - 0 | - 0 | - 0 | - 0 | 1889 | |||||||||||||||||||||||||||||||||||||||||
| Property Impairment Loss | - 0 | - 0 | - 0 | - 0 | - 0 | - 0 | - 0 | - 0 | - 0 | - 0 | - 0 | - 0 | 2914 | 132 | - 0 | - 0 | - 0 | - 0 | - 0 | - 0 | - 0 | - 0 | - 0 | - 0 | - 0 | - 0 | - 0 | - 0 | - 0 | - 0 | - 0 | - 0 | 3046 | - 0 | |||||||||||||||||||||||||||||||||||||||||
| Building Impairment | - 0 | - 0 | - 0 | - 0 | - 0 | - 0 | - 0 | 231 | - 0 | - 0 | - 0 | ||||||||||||||||||||||||||||||||||||||||||||||||||||||||||||||||
| Reg G Adjusted EBITDA | $ 7676 | $ 5470 | $ (232) | $ (3170) | $ (1368) | $ (4871) | $ 1699 | $ 2585 | $ 1352 | $ 2121 | $ 4196 | $ 2351 | $ 2349 | $ 4234 | $ 4342 | $ 2733 | $ 3068 | $ 6390 | $ 5579 | $ 2162 | $ 2458 | $ 3111 | $ 4277 | $ 2219 | $ 2852 | $ 4519 | $ 5443 | $ 3026 | $ 5121 | $ 7749 | $ 7325 | $ 5053 | $ 7457 | $ 9402 | $ 10318 | $ 13658 | $ 17199 | ||||||||||||||||||||||||||||||||||||||
| Adjusted EBITDA of Sales | 97 | 68 | -03 | -46 | -19 | -70 | 25 | 40 | 20 | 31 | 61 | 36 | 34 | 59 | 59 | 39 | 44 | 90 | 79 | 33 | 35 | 45 | 61 | 33 | 38 | 60 | 72 | 38 | 61 | 86 | 83 | 59 | 82 | 98 | 109 | 48 | 62 | ||||||||||||||||||||||||||||||||||||||
| Annual Adjusted EBITDA of Sales | 44 | 58 | |||||||||||||||||||||||||||||||||||||||||||||||||||||||||||||||||||||||||
| Adjusted Operating Income | (3083) | (6437) | (264) | 744 | (709) | (123) | 1829 | (7) | 54 | 2071 | 2182 | 600 | 972 | 4264 | 3460 | (40) | 271 | 885 | 2304 | 539 | 1147 | 2875 | 3852 | 1196 | 3435 | 6070 | 5570 | 3087 | 5979 | 7947 | 8850 | 4907 | 8314 | ||||||||||||||||||||||||||||||||||||||||||
| Consolidated Revenues | |||||||
| 2013 | 269503 | ||||||
| 2014 | 285693 | ||||||
| 2015 | 275834 | ||||||
| 2016 | 276573 | ||||||
| 2017 | 305907 | ||||||
| 2018 | 349637 | ||||||
| TTM 93019 | 368485 | ||||||
| Net Cash(Debt) | |||||||
| 2013 | (15380) | ||||||
| 2014 | 4207 | ||||||
| 2015 | 9840 | ||||||
| 2016 | 9580 | ||||||
| 2017 | (10127) | ||||||
| 2018 | 1060 | ||||||
| 93019 | 6431 | ||||||
| Rep Count | |||||||
| 2013 | 806 | ||||||
| 2014 | 916 | ||||||
| 2015 | 937 | ||||||
| 2016 | 1009 | ||||||
| 2017 | 983 | ||||||
| 2018 | 994 | ||||||
| 93019 | 993 | ||||||
| Adjusted OI | DampA | Adjusted EBITDA | |||||
| 2013 | 990 | 9030 | 10020 | ||||
| 2014 | 4907 | 8751 | 13658 | ||||
| 2015 | 8315 | 8543 | 17199 | ||||
| 2016 | 3388 | 8066 | 12065 | ||||
| 2017 | 15840 | ||||||
| 2018 | 25248 | ||||||
| TTM 93019 | 32230 | ||||||
| Reg G EBITDA By Quarter | |||||||
| Quarter | 2017 | 2018 | 2019 | ||||
| Q1 | 2852 | 5121 | 7457 | ||||
| Q2 | 4519 | 7749 | 9402 | ||||
| Q3 | 5443 | 7325 | 10318 | ||||
| Q4 | 3026 | 5053 |
| Months of Experience | Average Annual Sales | Number of Reps | |||
| lt 12 Mos | ERRORVALUE | ERRORVALUE | |||
| 1 - 2 Yrs | ERRORVALUE | ERRORVALUE | |||
| 3 - 5 Yrs | ERRORVALUE | ERRORVALUE | |||
| 5 - 10 Yrs | ERRORVALUE | ERRORVALUE | |||
| gt 10 Yrs | ERRORVALUE | ERRORVALUE | |||
| ERRORVALUE | |||||
| Excludes ISR MSS CRS | |||||
| Excludes Freight | |||||
| Product mix | ||||||||
| Verticals | Q3 2019 Sales | |||||||
| Fastening Systems | 240 | 22485606 | ||||||
| Fluid Power | 151 | 14156064 | ||||||
| Specialy Chemicals | 117 | 10917433 | ||||||
| Cutting Tools and Abrasives | 131 | 12296596 | ||||||
| Electrical | 104 | 9724849 | ||||||
| Aftermarket Automotive Supplies | 76 | 7154688 | ||||||
| Safety | 47 | 4445846 | ||||||
| Welding and Metal Repair | 13 | 1218030 | ||||||
| Other | 120 | 11237322 | ||||||
| Total | 100 | 93636434 | ||||||
| Verticals | YTD 2019 Sales | |||||||
| Fastening Systems | 24 | 66611555 | ||||||
| Fluid Power | 15 | 42224416 | ||||||
| Specialy Chemicals | 12 | 32166853 | ||||||
| Cutting Tools and Abrasives | 13 | 36587482 | ||||||
| Electrical | 11 | 30150144 | ||||||
| Aftermarket Automotive Supplies | 8 | 21960561 | ||||||
| Safety | 5 | 13072228 | ||||||
| Welding and Metal Repair | 2 | 4306548 | ||||||
| Other | 10 | 31279779 | ||||||
| Total | 100 | 278359566 |
| Lawson core customer mix | ||||||||
| Account Tyoe | Q3 | |||||||
| Regional Accounts | 43045893 | 45 | ||||||
| Strategic | 14086813 | 15 | ||||||
| Kent Automotive | 14300065 | 15 | ||||||
| Bolt Supply | 11318703 | 12 | ||||||
| Government | 10291732 | 11 | ||||||
| Screw Products | 0 | 0 | ||||||
| Other (1) | 1735236 | 2 | ||||||
| Total | 94778443 | 100 | ||||||
| Account Tyoe | YTD September | |||||||
| Regional Accounts | 131389537 | 47 | ||||||
| Strategic | 40364305 | 14 | ||||||
| Kent Automotive | 43371411 | 15 | ||||||
| Bolt Supply | 31324209 | 11 | ||||||
| Government | 29794959 | 11 | ||||||
| Screw Products | 0 | 0 | ||||||
| Other | 5974302 | 2 | ||||||
| Total | 282218723 | 100 | ||||||
| Total Reported |
| September 30 | December 31 | ||||||||||
| 2019 | 2018 | ||||||||||
| ASSETS | (Unaudited) | ||||||||||
| Current assets | |||||||||||
| Cash and cash equivalents | $ | 8626 | $ | 11883 | |||||||
| Restricted cash | 800 | 800 | |||||||||
| Accounts receivable less allowance for doubtful accounts of $614 and $549 respectively | 45162 | 37682 | |||||||||
| Inventories net | 54894 | 52887 | |||||||||
| Miscellaneous receivables and prepaid expenses | 4270 | 3653 | |||||||||
| Total current assets | 113752 | 106905 | |||||||||
| Property plant and equipment net | 16932 | 23548 | |||||||||
| Deferred income taxes | 17372 | 20592 | |||||||||
| Goodwill | 20582 | 20079 | |||||||||
| Cash value of life insurance | 14440 | 12599 | |||||||||
| Intangible assets net | 12468 | 13112 | |||||||||
| Lease assets | 11917 | mdash | |||||||||
| Other assets | 275 | 307 | |||||||||
| Total assets | $ | 207738 | $ | 197142 | |||||||
| LIABILITIES AND STOCKHOLDERSrsquo EQUITY | |||||||||||
| Current liabilities | |||||||||||
| Revolving lines of credit | $ | 2195 | $ | 10823 | |||||||
| Accounts payable | 16325 | 15207 | |||||||||
| Lease obligation | 3781 | mdash | |||||||||
| Accrued expenses and other liabilities | 37873 | 40179 | |||||||||
| Total current liabilities | 60174 | 66209 | |||||||||
| Security bonus plan | 11969 | 12413 | |||||||||
| Lease obligation | 10360 | 5213 | |||||||||
| Deferred compensation | 5915 | 5304 | |||||||||
| Deferred tax liability | 2879 | 2761 | |||||||||
| Other liabilities | 3460 | 6069 | |||||||||
| Total liabilities | 94757 | 97969 | |||||||||
| Stockholdersrsquo equity | |||||||||||
| Preferred stock $1 par value | |||||||||||
| Authorized - 500000 shares Issued and outstanding mdash None | mdash | mdash | |||||||||
| Common stock $1 par value | |||||||||||
| Authorized - 35000000 shares | 9043 | 9006 | |||||||||
| Issued - 9042597 and 9005716 shares respectively | |||||||||||
| Outstanding - 8956981 and 8955930 shares respectively | |||||||||||
| Capital in excess of par value | 17626 | 15623 | |||||||||
| Retained earnings | 89502 | 77338 | |||||||||
| Treasury stock ndash 85616 and 49786 shares respectively | (2595) | (1234) | |||||||||
| Accumulated other comprehensive loss | (595) | (1560) | |||||||||
| Total stockholdersrsquo equity | 112981 | 99173 | |||||||||
| Total liabilities and stockholdersrsquo equity | $ | 207738 | $ | 197142 | |||||||
| Three Months Ended | |||||||||||||||||||||||||||||
| Jun 30 2019 | Mar 31 2019 | Dec 31 2018 | Sep 30 2018 | Jun 30 2018 | |||||||||||||||||||||||||
| Average daily net sales | $ | 1502 | $ | 1450 | $ | 1414 | $ | 1405 | $ | 1412 | |||||||||||||||||||
| Year over year increase | 63 | 82 | 70 | 170 | 205 | ||||||||||||||||||||||||
| Sequential quarter increase (decrease) | 36 | 25 | 06 | (05) | 53 | ||||||||||||||||||||||||
| Net Sales | $ | 96097 | $ | 91343 | $ | 86266 | $ | 88530 | $ | 90382 | |||||||||||||||||||
| Gross profit (1) | 51043 | 48923 | 46083 | 48108 | 49131 | ||||||||||||||||||||||||
| Gross profit percentage (1) | 531 | 536 | 534 | 543 | 544 | ||||||||||||||||||||||||
| Selling general amp administrative expenses | $ | 49420 | $ | 43379 | $ | 41998 | $ | 50374 | $ | 43577 | |||||||||||||||||||
| Operating income (loss) | $ | 1623 | $ | 5544 | $ | 4085 | $ | (2266) | $ | 5554 | |||||||||||||||||||
| Full Year | |||||||||||||||||||||||||||||||||||||||||||||||||||||||||||||||||||||||||||
| ($ in thousands) | Q1 2011 | Q2 2011 | Q3 2011 | Q4 2011 | Q1 2012 | Q2 2012 | Q3 2012 | Q4 2012 | Q1 2013 | Q2 2013 | Q3 2013 | Q4 2013 | Q1 2014 | Q2 2014 | Q3 2014 | Q4 2014 | Q1 2015 | Q2 2015 | Q3 2015 | Q4 2015 | Q1 2016 | Q2 2016 | Q3 2016 | Q4 2016 | Q1 2017 | Q2 2017 | Q3 2017 | Q4 2017 | Q1 2018 | Q2 2018 | Q3 2018 | Q4 2018 | Q1 2019 | Q2 2019 | Q3 2019 | 2014 | 2015 | ||||||||||||||||||||||||||||||||||||||
| Net Sales | $ 79255 | $ 80625 | $ 71490 | $ 69029 | $ 71364 | $ 69830 | $ 67863 | $ 64505 | $ 67213 | $ 68317 | $ 68235 | $ 65738 | $ 69204 | $ 72080 | $ 74128 | $ 70281 | $ 69904 | $ 70726 | $ 70243 | $ 64961 | $ 69711 | $ 69348 | $ 70199 | $ 67315 | $ 74617 | $ 75006 | $ 75651 | $ 80633 | $ 84459 | $ 90382 | $ 88530 | $ 86266 | $ 91343 | $ 96097 | $ 94779 | $ 285693 | $ 275834 | ||||||||||||||||||||||||||||||||||||||
| Operating Income (Loss) | 3542 | 1397 | (3480) | (6995) | (3466) | (42084) | (1740) | 2057 | (3530) | (201) | 870 | (3002) | (4713) | 1241 | 678 | (2169) | (947) | 3243 | 2810 | (2985) | 1169 | 29 | 2389 | (5044) | 712 | 7891 | 1090 | 243 | 1837 | 5554 | (2266) | 4085 | 5544 | 1623 | 6446 | (4963) | 2121 | ||||||||||||||||||||||||||||||||||||||
| Depreciation amp Amortization | 1260 | 1315 | 1160 | 1675 | 1715 | 1566 | 1963 | 1841 | 2061 | 2244 | 2367 | 2358 | 2295 | 2163 | 2160 | 2133 | 2096 | 2126 | 2119 | 2202 | 2187 | 2226 | 1973 | 1680 | 1705 | 1644 | 1591 | 1830 | 1686 | 1679 | 1755 | 1735 | 1478 | 1455 | 1468 | 8751 | 8543 | ||||||||||||||||||||||||||||||||||||||
| EBITDA | 4802 | 2712 | (2320) | (5320) | (1751) | (40518) | 223 | 3898 | (1469) | 2043 | 3237 | (644) | (2418) | 3404 | 2838 | (36) | 1149 | 5369 | 4929 | (783) | 3356 | 2255 | 4362 | (3364) | 2417 | 9535 | 2681 | 2073 | 3523 | 7233 | (511) | 5820 | 7022 | 3078 | 7914 | 3788 | 10664 | ||||||||||||||||||||||||||||||||||||||
| Excluded Costs | |||||||||||||||||||||||||||||||||||||||||||||||||||||||||||||||||||||||||||
| Severance | 745 | 465 | 282 | 122 | 185 | 6585 | 1410 | (159) | - 0 | 2 | 962 | (127) | 728 | 290 | (328) | (59) | 571 | 50 | 372 | 280 | 204 | 143 | 367 | 1662 | 465 | (9) | 139 | 144 | 628 | 64 | 31 | 126 | 27 | 1485 | 30 | 631 | 1273 | ||||||||||||||||||||||||||||||||||||||
| Stock Based Compensation (Benefit) | 227 | (95) | (538) | 467 | 198 | (1015) | 77 | 434 | 1596 | 76 | 33 | 562 | 1125 | 408 | 2423 | 2443 | (541) | 971 | (30) | 1693 | (1217) | 515 | (630) | 3801 | (30) | 415 | 2337 | 384 | 970 | 87 | 7637 | (1186) | 408 | 4839 | 2374 | 6399 | 2093 | ||||||||||||||||||||||||||||||||||||||
| Acquisition Related Costs | - 0 | - 0 | - 0 | - 0 | - 0 | - 0 | 310 | 32 | 115 | 198 | 178 | 120 | - 0 | - 0 | 286 | 425 | - 0 | - 0 | 168 | 62 | - 0 | - 0 | - 0 | ||||||||||||||||||||||||||||||||||||||||||||||||||||
| ERP Implementation Costs | 1902 | 2388 | 2344 | 339 | - 0 | - 0 | - 0 | - 0 | - 0 | - 0 | - 0 | - 0 | - 0 | - 0 | - 0 | - 0 | - 0 | - 0 | - 0 | - 0 | - 0 | - 0 | - 0 | - 0 | - 0 | - 0 | - 0 | - 0 | - 0 | - 0 | - 0 | - 0 | - 0 | ||||||||||||||||||||||||||||||||||||||||||
| Loss(Gain) on Disposal of Property | - 0 | - 0 | - 0 | 22 | - 0 | (2122) | (11) | (1588) | - 0 | - 0 | (36) | 32 | - 0 | - 0 | 97 | 45 | - 0 | - 0 | (2) | 9 | - 0 | - 0 | - 0 | - 0 | - 0 | (5422) | - 0 | - 0 | - 0 | - 0 | - 0 | - 0 | - 0 | - 0 | - 0 | 142 | 7 | ||||||||||||||||||||||||||||||||||||||
| Legal Settlement | - 0 | - 0 | - 0 | - 0 | - 0 | - 0 | - 0 | - 0 | - 0 | - 0 | - 0 | - 0 | - 0 | - 0 | (688) | - 0 | - 0 | - 0 | - 0 | - 0 | - 0 | - 0 | - 0 | - 0 | - 0 | - 0 | - 0 | - 0 | - 0 | - 0 | - 0 | - 0 | (688) | - 0 | |||||||||||||||||||||||||||||||||||||||||
| Employment Tax Matter | - 0 | - 0 | - 0 | 1200 | - 0 | - 0 | - 0 | - 0 | - 0 | - 0 | - 0 | (400) | - 0 | - 0 | - 0 | - 0 | - 0 | - 0 | - 0 | - 0 | - 0 | - 0 | - 0 | - 0 | - 0 | - 0 | - 0 | - 0 | - 0 | - 0 | - 0 | - 0 | - 0 | - 0 | |||||||||||||||||||||||||||||||||||||||||
| Lease termination gain | - 0 | - 0 | - 0 | - 0 | - 0 | - 0 | - 0 | - 0 | - 0 | - 0 | - 0 | 2928 | - 0 | - 0 | - 0 | - 0 | - 0 | - 0 | - 0 | - 0 | - 0 | - 0 | - 0 | - 0 | - 0 | - 0 | - 0 | - 0 | - 0 | (164) | - 0 | - 0 | - 0 | - 0 | - 0 | - 0 | - 0 | ||||||||||||||||||||||||||||||||||||||
| Goodwill Impairment | - 0 | - 0 | - 0 | - 0 | - 0 | 28306 | - 0 | - 0 | - 0 | - 0 | - 0 | - 0 | - 0 | - 0 | - 0 | - 0 | - 0 | - 0 | - 0 | - 0 | - 0 | - 0 | - 0 | - 0 | - 0 | - 0 | - 0 | - 0 | - 0 | - 0 | - 0 | - 0 | - 0 | - 0 | |||||||||||||||||||||||||||||||||||||||||
| Inventory Rationalization | - 0 | - 0 | - 0 | - 0 | - 0 | 3893 | - 0 | - 0 | - 0 | - 0 | - 0 | - 0 | - 0 | - 0 | - 0 | - 0 | - 0 | - 0 | - 0 | - 0 | - 0 | - 0 | - 0 | - 0 | - 0 | - 0 | - 0 | - 0 | - 0 | - 0 | - 0 | - 0 | - 0 | - 0 | |||||||||||||||||||||||||||||||||||||||||
| Discontinued operation accrual | - 0 | - 0 | - 0 | - 0 | - 0 | - 0 | - 0 | - 0 | - 0 | - 0 | - 0 | - 0 | - 0 | - 0 | - 0 | 340 | - 0 | - 0 | - 0 | 931 | - 0 | - 0 | - 0 | - 0 | - 0 | - 0 | - 0 | - 0 | - 0 | 529 | - 0 | - 0 | - 0 | - 0 | - 0 | 340 | 931 | ||||||||||||||||||||||||||||||||||||||
| North American sales meeting | - 0 | - 0 | - 0 | - 0 | - 0 | - 0 | - 0 | - 0 | 1225 | - 0 | - 0 | - 0 | - 0 | - 0 | - 0 | - 0 | 1889 | - 0 | - 0 | - 0 | - 0 | - 0 | - 0 | - 0 | - 0 | - 0 | - 0 | - 0 | - 0 | - 0 | - 0 | - 0 | - 0 | 1889 | |||||||||||||||||||||||||||||||||||||||||
| Property Impairment Loss | - 0 | - 0 | - 0 | - 0 | - 0 | - 0 | - 0 | - 0 | - 0 | - 0 | - 0 | - 0 | 2914 | 132 | - 0 | - 0 | - 0 | - 0 | - 0 | - 0 | - 0 | - 0 | - 0 | - 0 | - 0 | - 0 | - 0 | - 0 | - 0 | - 0 | - 0 | - 0 | 3046 | - 0 | |||||||||||||||||||||||||||||||||||||||||
| Building Impairment | - 0 | - 0 | - 0 | - 0 | - 0 | - 0 | - 0 | 231 | - 0 | - 0 | - 0 | ||||||||||||||||||||||||||||||||||||||||||||||||||||||||||||||||
| Reg G Adjusted EBITDA | $ 7676 | $ 5470 | $ (232) | $ (3170) | $ (1368) | $ (4871) | $ 1699 | $ 2585 | $ 1352 | $ 2121 | $ 4196 | $ 2351 | $ 2349 | $ 4234 | $ 4342 | $ 2733 | $ 3068 | $ 6390 | $ 5579 | $ 2162 | $ 2458 | $ 3111 | $ 4277 | $ 2219 | $ 2852 | $ 4519 | $ 5443 | $ 3026 | $ 5121 | $ 7749 | $ 7325 | $ 5053 | $ 7457 | $ 9402 | $ 10318 | $ 13658 | $ 17199 | ||||||||||||||||||||||||||||||||||||||
| Adjusted EBITDA of Sales | 97 | 68 | -03 | -46 | -19 | -70 | 25 | 40 | 20 | 31 | 61 | 36 | 34 | 59 | 59 | 39 | 44 | 90 | 79 | 33 | 35 | 45 | 61 | 33 | 38 | 60 | 72 | 38 | 61 | 86 | 83 | 59 | 82 | 98 | 109 | 48 | 62 | ||||||||||||||||||||||||||||||||||||||
| Annual Adjusted EBITDA of Sales | 44 | 58 | |||||||||||||||||||||||||||||||||||||||||||||||||||||||||||||||||||||||||
| Adjusted Operating Income | (3083) | (6437) | (264) | 744 | (709) | (123) | 1829 | (7) | 54 | 2071 | 2182 | 600 | 972 | 4264 | 3460 | (40) | 271 | 885 | 2304 | 539 | 1147 | 2875 | 3852 | 1196 | 3435 | 6070 | 5570 | 3087 | 5979 | 7947 | 8850 | 4907 | 8314 | ||||||||||||||||||||||||||||||||||||||||||
| Consolidated Revenues | |||||||
| 2013 | 269503 | ||||||
| 2014 | 285693 | ||||||
| 2015 | 275834 | ||||||
| 2016 | 276573 | ||||||
| 2017 | 305907 | ||||||
| 2018 | 349637 | ||||||
| TTM 63019 | 362236 | ||||||
| Net Cash(Debt) | |||||||
| 2013 | (15380) | ||||||
| 2014 | 4207 | ||||||
| 2015 | 9840 | ||||||
| 2016 | 9580 | ||||||
| 2017 | (10127) | ||||||
| 2018 | 1060 | ||||||
| 63019 | (1908) | ||||||
| Rep Count | |||||||
| 2013 | 806 | ||||||
| 2014 | 916 | ||||||
| 2015 | 937 | ||||||
| 2016 | 1009 | ||||||
| 2017 | 983 | ||||||
| 2018 | 994 | ||||||
| 63019 | 982 | ||||||
| Adjusted OI | DampA | Adjusted EBITDA | |||||
| 2013 | 990 | 9030 | 10020 | ||||
| 2014 | 4907 | 8751 | 13658 | ||||
| 2015 | 8315 | 8543 | 17199 | ||||
| 2016 | 3388 | 8066 | 12065 | ||||
| 2017 | 15840 | ||||||
| 2018 | 25248 | ||||||
| TTM 63019 | 29237 | ||||||
| Reg G EBITDA By Quarter | |||||||
| Quarter | 2017 | 2018 | 2019 | ||||
| Q1 | 2852 | 5121 | 7457 | ||||
| Q2 | 4519 | 7749 | 9402 | ||||
| Q3 | 5443 | 7325 | |||||
| Q4 | 3026 | 5053 |
| Months of Experience | Average Annual Sales | Number of Reps | |||
| lt 12 Mos | ERRORVALUE | ERRORVALUE | |||
| 1 - 2 Yrs | ERRORVALUE | ERRORVALUE | |||
| 3 - 5 Yrs | ERRORVALUE | ERRORVALUE | |||
| 5 - 10 Yrs | ERRORVALUE | ERRORVALUE | |||
| gt 10 Yrs | ERRORVALUE | ERRORVALUE | |||
| ERRORVALUE | |||||
| Excludes ISR MSS CRS | |||||
| Excludes Freight | |||||
| Product mix | ||||||||
| Verticals | Q2 2019 Sales | |||||||
| Fastening Systems | 243 | 23008646 | ||||||
| Fluid Power | 152 | 14395529 | ||||||
| Specialy Chemicals | 117 | 11074332 | ||||||
| Cutting Tools and Abrasives | 130 | 12319702 | ||||||
| Electrical | 107 | 10102828 | ||||||
| Aftermarket Automotive Supplies | 77 | 7255974 | ||||||
| Safety | 47 | 4458217 | ||||||
| Welding and Metal Repair | 16 | 1539172 | ||||||
| Other | 112 | 10633378 | ||||||
| Total | 100 | 94787779 | ||||||
| Verticals | YTD 2019 Sales | |||||||
| Fastening Systems | 24 | 44125949 | ||||||
| Fluid Power | 15 | 28068352 | ||||||
| Specialy Chemicals | 12 | 21249420 | ||||||
| Cutting Tools and Abrasives | 13 | 24290887 | ||||||
| Electrical | 11 | 20425294 | ||||||
| Aftermarket Automotive Supplies | 8 | 14805874 | ||||||
| Safety | 5 | 8626381 | ||||||
| Welding and Metal Repair | 2 | 3088518 | ||||||
| Other | 10 | 20042457 | ||||||
| Total | 100 | 184723132 |
| Lawson core customer mix | ||||||||
| Account Tyoe | Q2 | |||||||
| Regional Accounts | 44933707 | 47 | ||||||
| Strategic | 13542786 | 14 | ||||||
| Kent Automotive | 14370813 | 15 | ||||||
| Bolt Supply | 11129675 | 12 | ||||||
| Government | 10087561 | 10 | ||||||
| Screw Products | 0 | 0 | ||||||
| Other (1) | 1428268 | 1 | ||||||
| Total | 96097363 | 100 | ||||||
| Account Tyoe | YTD June | |||||||
| Regional Accounts | 88400675 | 47 | ||||||
| Strategic | 26218365 | 14 | ||||||
| Kent Automotive | 29071347 | 16 | ||||||
| Bolt Supply | 20005505 | 11 | ||||||
| Government | 19505323 | 10 | ||||||
| Screw Products | 0 | 0 | ||||||
| Other | 4239066 | 2 | ||||||
| Total | 187440280 | 100 | ||||||
| Total Reported |
| August 2011 | OslashImplemented SAP | ||
| October 2011 | OslashCommenced construction of new McCook Ill distribution center | ||
| May 2012 | OslashRelocated corporate headquarters | ||
| June 2012 | OslashRestructured senior team Announced $20M cost savings plan | ||
| August 2012 | OslashTransitioned packaging facility to McCook Ill distribution center | ||
| OslashEntered into new five-year $40M credit facility | |||
| October 2012 | OslashAnnounced new CEO and President Michael G DeCata | ||
| OslashConsolidated Vernon Hills distribution center into McCook Ill | |||
| November 2012 | OslashRolled out new website to existing web customers | ||
| December 2012 | OslashCompleted transition of US independent agents to employees | ||
| April 2013 | OslashRoll-out of new website to new web customers | ||
| AprilMay 2013 | OslashMcCook DC begins to ship customer orders | ||
| November 2013 | OslashEntered into sub-lease of headquarters space to generate $29M of future cash savings | ||
| December 2013 | OslashEnded year with over 800 sales reps ndash First increase in 8 years | ||
| February 2014 | OslashClosed on Automatic Screw Machine Products sale for net proceeds of $121M | ||
| June 2014 | OslashEntered into sale-leaseback of Reno distribution facility for net proceeds of $83M | ||
| December 2014 | OslashEnded year with over 900 sales reps | ||
| February 2015 | OslashHeld North American sales meeting | ||
| September 2015 | OslashCompleted West Coast Fasteners acquisition | ||
| March 2016 | OslashCompleted Perfect Products of Michigan acquisition | ||
| May 2016 | OslashCompleted F B Feeney acquisition | ||
| June 2016 | OslashExpanded sales team to over 1000 sales reps | ||
| September 2016 | OslashExtended credit facitlity to August 2020 | ||
| November 2016 | OslashCompleted Mattic Industries acquisition | ||
| March 2017 | OslashConsolidated Fairfield NJ distribution operations into McCook Ill and Suwanee GA | ||
| May 2017 | OslashSold Fairfield NJ distribution center for a gain of $54M | ||
| October 2017 | OslashCompleted Bolt Supply House acquisition | ||
| April 2018 | OslashOpened MRO distribution center in Calgary Canada | ||
| October 2018 | OslashCompleted Screw Products acquisition and added Bolt Supply branch | ||
| June 2019 | OslashAchieved Q2 98 adjusted EBITDA net of ASC 842 impact of 03 | ||
| September 2019 | OslashAchieved Q3 109 adjusted EBITDA hired VP MampA | ||
| October 2019 | OslashEntered into new five-year $100M credit facility with additional $50 million accordion feature |
| ($ in thousands) | Q3 2013 | Q4 2013 | Q1 2014 | Q2 2014 | Q3 2014 | Q4 2014 | Q1 2015 | Q2 2015 | Q3 2015 | Q4 2015 | Q1 2016 | Q2 2016 | Q3 2016 | Q4 2016 | Q1 2017 | Q2 2017 | Q3 2017 | Q4 2017 | ||||||||||||||||||||||||||||||||||||||||||||||
| SGampA | 40350 | 42856 | 45991 | 42562 | 43855 | 44764 | 43830 | 40565 | 40532 | 41145 | 41290 | 42497 | 40184 | 45548 | 44167 | 42672 | 44915 | 46750 | $ 173014 | |||||||||||||||||||||||||||||||||||||||||||||
| $ - | ||||||||||||||||||||||||||||||||||||||||||||||||||||||||||||||||
| Excluded Costs | $ - | 40196 | ||||||||||||||||||||||||||||||||||||||||||||||||||||||||||||||
| Severance | (962) | 127 | (728) | (290) | 328 | 59 | (571) | (50) | (372) | (280) | (204) | (143) | (367) | (1662) | (465) | 9 | (139) | (144) | $ (234) | 127 | ||||||||||||||||||||||||||||||||||||||||||||
| Stock Based Compensation (Benefit) | (33) | (562) | (1125) | (408) | (2423) | (2443) | 541 | (971) | 30 | (1693) | 1217 | (515) | 630 | (3801) | 30 | (415) | (2337) | (384) | $ (5296) | -32 | ||||||||||||||||||||||||||||||||||||||||||||
| Loss(Gain) on Disposal of Property | 36 | (32) | - 0 | - 0 | (97) | (45) | - 0 | - 0 | 2 | (9) | - 0 | - 0 | - 0 | - 0 | - 0 | - 0 | - 0 | - 0 | $ (142) | |||||||||||||||||||||||||||||||||||||||||||||
| Legal Settlement | - 0 | - 0 | - 0 | - 0 | 688 | - 0 | - 0 | - 0 | - 0 | - 0 | - 0 | - 0 | - 0 | - 0 | - 0 | - 0 | - 0 | - 0 | $ 688 | -562 | ||||||||||||||||||||||||||||||||||||||||||||
| Employment Tax Matter | - 0 | 400 | - 0 | - 0 | - 0 | - 0 | - 0 | - 0 | - 0 | - 0 | - 0 | - 0 | - 0 | - 0 | - 0 | - 0 | - 0 | - 0 | $ - | 39729 | ||||||||||||||||||||||||||||||||||||||||||||
| Loss on Sub-Lease | - 0 | (2928) | - 0 | - 0 | - 0 | - 0 | - 0 | - 0 | - 0 | - 0 | - 0 | - 0 | - 0 | - 0 | - 0 | - 0 | - 0 | - 0 | $ - | |||||||||||||||||||||||||||||||||||||||||||||
| National sales meeting | - 0 | - 0 | - 0 | - 0 | - 0 | - 0 | (1889) | - 0 | - 0 | - 0 | - 0 | - 0 | - 0 | - 0 | - 0 | - 0 | - 0 | - 0 | $ (1889) | |||||||||||||||||||||||||||||||||||||||||||||
| Remediation expense | - 0 | - 0 | - 0 | - 0 | - 0 | (340) | - 0 | - 0 | - 0 | - 0 | - 0 | - 0 | - 0 | - 0 | - 0 | - 0 | - 0 | - 0 | $ (340) | |||||||||||||||||||||||||||||||||||||||||||||
| Property Impairment Loss | - 0 | - 0 | (2914) | (132) | - 0 | - 0 | - 0 | - 0 | - 0 | - 0 | - 0 | - 0 | - 0 | - 0 | - 0 | - 0 | - 0 | - 0 | $ - | |||||||||||||||||||||||||||||||||||||||||||||
| Adjusted SGampA | $ 39391 | $ 39861 | $ 41224 | $ 41732 | $ 42351 | $ 41995 | $ 41911 | $ 39544 | $ 40192 | $ 39163 | $ 42303 | $ 41839 | $ 40447 | $ 40085 | $ 43732 | $ 42266 | $ 42439 | $ 46222 | $ 165801 | |||||||||||||||||||||||||||||||||||||||||||||
| Annual Adjusted EBITDA of Sales | ERRORREF | ERRORREF | ||||||||||||||||||||||||||||||||||||||||||||||||||||||||||||||
| Q1 2013 | Q2 2013 | Q3 2013 | Q4 2013 | Q1 2014 | Q2 2014 | Q3 2014 | Q4 2014 | Q1 2015 | |||||||||||
| Selling Days | 63 | 64 | 64 | 61 | 63 | 64 | 64 | 61 | 63 | ||||||||||
| Net Sales | 67213 | 68317 | 68235 | 65738 | 69204 | 72080 | 74128 | 70281 | 69904 | ||||||||||
| Average Daily Sales | 1067 | 1067 | 1066 | 1078 | 1098 | 1126 | 1158 | 1152 | 1110 | ||||||||||
| Average Sales Rep Count | 762 | 764 | 774 | 794 | 819 | 854 | 882 | 908 | 911 | ||||||||||
| Sales per Sales Rep per Day | 1400 | 1397 | 1377 | 1358 | 1341 | 1319 | 1313 | 1269 | 1218 | ||||||||||
| Full Year | ||||||||||||||||||||||||||||||||||||||||||||||||||||||||||||||||||||
| ($ in thousands) | Q1 2011 | Q2 2011 | Q3 2011 | Q4 2011 | Q1 2012 | Q2 2012 | Q3 2012 | Q4 2012 | Q1 2013 | Q2 2013 | Q3 2013 | Q4 2013 | Q1 2014 | Q2 2014 | Q3 2014 | Q4 2014 | Q1 2015 | Q2 2015 | Q3 2015 | Q4 2015 | Q1 2016 | Q2 2016 | Q3 2016 | Q4 2016 | Q1 2017 | Q2 2017 | Q3 2017 | Q4 2017 | Q1 2018 | Q2 2018 | Q3 2018 | 2014 | 2015 | |||||||||||||||||||||||||||||||||||
| Net Sales | $ 79255 | $ 80625 | $ 71490 | $ 69029 | $ 71364 | $ 69830 | $ 67863 | $ 64505 | $ 67213 | $ 68317 | $ 68235 | $ 65738 | $ 69204 | $ 72080 | $ 74128 | $ 70281 | $ 69904 | $ 70726 | $ 70243 | $ 64961 | $ 69711 | $ 69348 | $ 70199 | $ 67315 | $ 74617 | $ 75006 | $ 75651 | $ 80633 | $ 84459 | $ 90382 | $ 88530 | $ 285693 | $ 275834 | |||||||||||||||||||||||||||||||||||
| Operating Income (Loss) | 3542 | 1397 | (3480) | (6995) | (3466) | (42084) | (1740) | 2057 | (3530) | (201) | 870 | (3002) | (4713) | 1241 | 678 | (2169) | (947) | 3243 | 2810 | (2985) | 1169 | 29 | 2389 | (5044) | 712 | 7891 | 1090 | 243 | 1837 | 5554 | (2266) | (4963) | 2121 | |||||||||||||||||||||||||||||||||||
| Depreciation amp Amortization | 1260 | 1315 | 1160 | 1675 | 1715 | 1566 | 1963 | 1841 | 2061 | 2244 | 2367 | 2358 | 2295 | 2163 | 2160 | 2133 | 2096 | 2126 | 2119 | 2202 | 2187 | 2226 | 1973 | 1680 | 1705 | 1644 | 1591 | 1830 | 1686 | 1679 | 1755 | 8751 | 8543 | |||||||||||||||||||||||||||||||||||
| EBITDA | 4802 | 2712 | (2320) | (5320) | (1751) | (40518) | 223 | 3898 | (1469) | 2043 | 3237 | (644) | (2418) | 3404 | 2838 | (36) | 1149 | 5369 | 4929 | (783) | 3356 | 2255 | 4362 | (3364) | 2417 | 9535 | 2681 | 2073 | 3523 | 7233 | (511) | 3788 | 10664 | |||||||||||||||||||||||||||||||||||
| Excluded Costs | ||||||||||||||||||||||||||||||||||||||||||||||||||||||||||||||||||||
| Severance | 745 | 465 | 282 | 122 | 185 | 6585 | 1410 | (159) | - 0 | 2 | 962 | (127) | 728 | 290 | (328) | (59) | 571 | 50 | 372 | 280 | 204 | 143 | 367 | 1662 | 465 | (9) | 139 | 144 | 628 | 64 | 31 | 631 | 1273 | |||||||||||||||||||||||||||||||||||
| Stock Based Compensation (Benefit) | 227 | (95) | (538) | 467 | 198 | (1015) | 77 | 434 | 1596 | 76 | 33 | 562 | 1125 | 408 | 2423 | 2443 | (541) | 971 | (30) | 1693 | (1217) | 515 | (630) | 3801 | (30) | 415 | 2337 | 384 | 970 | 87 | 7637 | 6399 | 2093 | |||||||||||||||||||||||||||||||||||
| Acquisition Related Costs | - 0 | - 0 | - 0 | - 0 | - 0 | - 0 | 310 | 32 | 115 | 198 | 178 | 120 | - 0 | - 0 | 286 | 425 | - 0 | - 0 | 168 | |||||||||||||||||||||||||||||||||||||||||||||||||
| ERP Implementation Costs | 1902 | 2388 | 2344 | 339 | - 0 | - 0 | - 0 | - 0 | - 0 | - 0 | - 0 | - 0 | - 0 | - 0 | - 0 | - 0 | - 0 | - 0 | - 0 | - 0 | - 0 | - 0 | - 0 | - 0 | - 0 | - 0 | - 0 | - 0 | - 0 | - 0 | - 0 | - 0 | ||||||||||||||||||||||||||||||||||||
| Loss(Gain) on Disposal of Property | - 0 | - 0 | - 0 | 22 | - 0 | (2122) | (11) | (1588) | - 0 | - 0 | (36) | 32 | - 0 | - 0 | 97 | 45 | - 0 | - 0 | (2) | 9 | - 0 | - 0 | - 0 | - 0 | - 0 | (5422) | - 0 | - 0 | - 0 | - 0 | - 0 | 142 | 7 | |||||||||||||||||||||||||||||||||||
| Legal Settlement | - 0 | - 0 | - 0 | - 0 | - 0 | - 0 | - 0 | - 0 | - 0 | - 0 | - 0 | - 0 | - 0 | - 0 | (688) | - 0 | - 0 | - 0 | - 0 | - 0 | - 0 | - 0 | - 0 | - 0 | - 0 | - 0 | - 0 | - 0 | - 0 | - 0 | - 0 | (688) | - 0 | |||||||||||||||||||||||||||||||||||
| Employment Tax Matter | - 0 | - 0 | - 0 | 1200 | - 0 | - 0 | - 0 | - 0 | - 0 | - 0 | - 0 | (400) | - 0 | - 0 | - 0 | - 0 | - 0 | - 0 | - 0 | - 0 | - 0 | - 0 | - 0 | - 0 | - 0 | - 0 | - 0 | - 0 | - 0 | - 0 | - 0 | - 0 | - 0 | |||||||||||||||||||||||||||||||||||
| Lease termination gain | - 0 | - 0 | - 0 | - 0 | - 0 | - 0 | - 0 | - 0 | - 0 | - 0 | - 0 | 2928 | - 0 | - 0 | - 0 | - 0 | - 0 | - 0 | - 0 | - 0 | - 0 | - 0 | - 0 | - 0 | - 0 | - 0 | - 0 | - 0 | - 0 | (164) | - 0 | - 0 | - 0 | |||||||||||||||||||||||||||||||||||
| Goodwill Impairment | - 0 | - 0 | - 0 | - 0 | - 0 | 28306 | - 0 | - 0 | - 0 | - 0 | - 0 | - 0 | - 0 | - 0 | - 0 | - 0 | - 0 | - 0 | - 0 | - 0 | - 0 | - 0 | - 0 | - 0 | - 0 | - 0 | - 0 | - 0 | - 0 | - 0 | - 0 | - 0 | - 0 | |||||||||||||||||||||||||||||||||||
| Inventory Rationalization | - 0 | - 0 | - 0 | - 0 | - 0 | 3893 | - 0 | - 0 | - 0 | - 0 | - 0 | - 0 | - 0 | - 0 | - 0 | - 0 | - 0 | - 0 | - 0 | - 0 | - 0 | - 0 | - 0 | - 0 | - 0 | - 0 | - 0 | - 0 | - 0 | - 0 | - 0 | - 0 | - 0 | |||||||||||||||||||||||||||||||||||
| Discontinued operation accrual | - 0 | - 0 | - 0 | - 0 | - 0 | - 0 | - 0 | - 0 | - 0 | - 0 | - 0 | - 0 | - 0 | - 0 | - 0 | 340 | - 0 | - 0 | - 0 | 931 | - 0 | - 0 | - 0 | - 0 | - 0 | - 0 | - 0 | - 0 | - 0 | 529 | - 0 | 340 | 931 | |||||||||||||||||||||||||||||||||||
| North American sales meeting | - 0 | - 0 | - 0 | - 0 | - 0 | - 0 | - 0 | - 0 | 1225 | - 0 | - 0 | - 0 | - 0 | - 0 | - 0 | - 0 | 1889 | - 0 | - 0 | - 0 | - 0 | - 0 | - 0 | - 0 | - 0 | - 0 | - 0 | - 0 | - 0 | - 0 | - 0 | - 0 | 1889 | |||||||||||||||||||||||||||||||||||
| Property Impairment Loss | - 0 | - 0 | - 0 | - 0 | - 0 | - 0 | - 0 | - 0 | - 0 | - 0 | - 0 | - 0 | 2914 | 132 | - 0 | - 0 | - 0 | - 0 | - 0 | - 0 | - 0 | - 0 | - 0 | - 0 | - 0 | - 0 | - 0 | - 0 | - 0 | - 0 | - 0 | 3046 | - 0 | |||||||||||||||||||||||||||||||||||
| Adjusted EBITDA | $ 7676 | $ 5470 | $ (232) | $ (3170) | $ (1368) | $ (4871) | $ 1699 | $ 2585 | $ 1352 | $ 2121 | $ 4196 | $ 2351 | $ 2349 | $ 4234 | $ 4342 | $ 2733 | $ 3068 | $ 6390 | $ 5579 | $ 2162 | $ 2458 | $ 3111 | $ 4277 | $ 2219 | $ 2852 | $ 4519 | $ 5443 | $ 3026 | $ 5121 | $ 7749 | $ 7325 | $ 13658 | $ 17199 | |||||||||||||||||||||||||||||||||||
| Adjusted EBITDA of Sales | 97 | 68 | -03 | -46 | -19 | -70 | 25 | 40 | 20 | 31 | 61 | 36 | 34 | 59 | 59 | 39 | 44 | 90 | 79 | 33 | 35 | 45 | 61 | 33 | 38 | 60 | 72 | 38 | 61 | 86 | 83 | 48 | 62 | |||||||||||||||||||||||||||||||||||
| Annual Adjusted EBITDA of Sales | 44 | 58 | ||||||||||||||||||||||||||||||||||||||||||||||||||||||||||||||||||
| Adjusted Operating Income | (3083) | (6437) | (264) | 744 | (709) | (123) | 1829 | (7) | 54 | 2071 | 2182 | 600 | 972 | 4264 | 3460 | (40) | 271 | 885 | 2304 | 539 | 1147 | 2875 | 3852 | 1196 | 3435 | 6070 | 5570 | - 0 | 4907 | 8314 | ||||||||||||||||||||||||||||||||||||||
| Sales | |||
| Broad Based MRO Market | $150000000000 | ||
| Service Based VMI Market | $25000000000 | ||
| 3rd Qtr | 12 | ||
| 4th Qtr | 12 | ||
| To resize chart data range drag lower right corner of range |
| Broad Based MRO Market | |
| Service Based VMI Market |
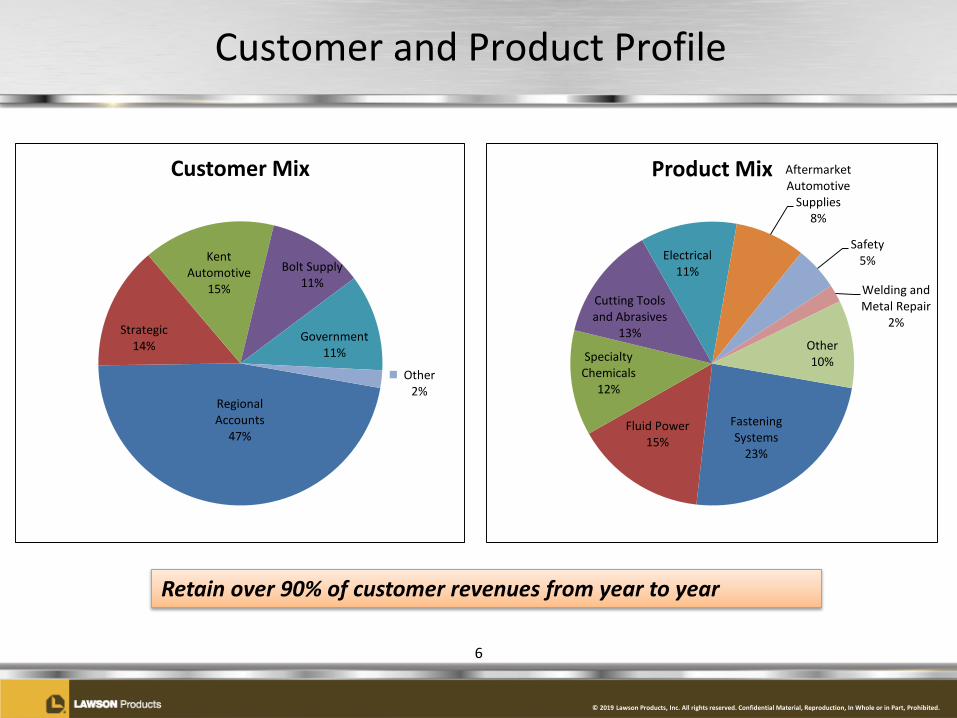
copy 2019 Lawson Products Inc All rights reserved Confidential Material Reproduction In Whole or in Part Prohibited
Our Commitment to our 70000+ Customers
High touch service and technical expertise drives customer relationshipsBefore After
One Company Zero Headaches Inventory Management Options Access to Industry Knowledge amp Expertise
bull Comprehensive line of products bull Lawson Managed Inventory bull Product recommendations from your Lawson Representative
bull Hundreds of pre-built assortments bull Industrial vending bull Application advice from our test and application engineers
bull Unlimited sourcing of hard-to-find items
bull Self-service inventory management
bull Complimentary on-site safety amp product usage training
5
copy 2019 Lawson Products Inc All rights reserved Confidential Material Reproduction In Whole or in Part Prohibited
Customer and Product Profile
6
Retain over 90 of customer revenues from year to year
Fastening Systems
23
Fluid Power15
Specialty Chemicals
12
Cutting Tools and Abrasives
13
Electrical11
Aftermarket Automotive
Supplies8
Safety5
Welding and Metal Repair
2
Other10
Product Mix
Regional Accounts
47
Strategic14
Kent Automotive
15
Bolt Supply11
Government 11
Other2
Customer Mix
copy 2019 Lawson Products Inc All rights reserved Confidential Material Reproduction In Whole or in Part Prohibited
Lawson Growth Strategy
Sales Growth Driven By
Foundational SupportERP Network
OptimizationSales
TransformationLean Six Sigma
Website
7
New Sales Reps
Sales RepProductivity
Acquisitions
copy 2019 Lawson Products Inc All rights reserved Confidential Material Reproduction In Whole or in Part Prohibited
2019 Focus Actions Across the Value Chain Driving Growth
Add New Sales Reps and Drive Rep Productivity
Sales Process Sales Reps
Customer Service Order
Entry
ProductManagement
PricingDC Operations Sourcing
Purchasing
bull Increase sales rep count
bull Onboardingprocesstraining
bull SalesManagement dashboard
bull EDI with customers
bull Reduction of cycle times
bull Order padbull Consolidation of
shipmentsbull Sales service reps
bull Leverage vendor drop-ship programs
bull Fleet maintenance focus
bull Pricing enhancements
bull Website
bull Reduce cycle timebull Refine ldquoPullrdquo
strategybull Freight
enhancementsbull Minimize
backordersbull Improve service
levelsbull Forecasting tool
bull Supplier negotiation process
bull Vendor metricsbull Electronic
communication
Information Technology ndash Integration of Web and SAPLean Six Sigma
8
copy 2019 Lawson Products Inc All rights reserved Confidential Material Reproduction In Whole or in Part Prohibited
Longer Sales Rep Tenure Drives Rep Productivity
9
$0
$50000
$100000
$150000
$200000
$250000
$300000
$350000
$400000
$450000
$500000
lt 12 Mos 1 - 2 Yrs 3 - 5 Yrs 5 - 10 Yrs gt 10 Yrs0
50
100
150
200
250
300
350
Aver
age
Annu
al S
ales
Tenure With Lawson (as of 93019)
Num
ber O
f Sal
es R
eps
Number of Reps Average Annual Sales
copy 2019 Lawson Products Inc All rights reserved Confidential Material Reproduction In Whole or in Part Prohibited
Historical Financial Performance
Recent sales growth and earnings expansion providing financial flexibility
10
$200000
$250000
$300000
$350000
$400000
2014 2015 2016 2017 2018 TTM93019
Consolidated Revenues
$0$5000
$10000$15000$20000$25000$30000$35000
2014 2015 2016 2017 2018 TTM93019
Adjusted Reg G EBITDA
-$15000
-$10000
-$5000
$0
$5000
$10000
$15000
2014 2015 2016 2017 2018 9302019
Net Cash(Debt)
$0
$2000
$4000
$6000
$8000
$10000
$12000
Q1 Q2 Q3 Q4
Quarterly Adjusted Reg G EBITDA
2017
20172017
2017
2018
20182018
2018
20192019
2019
copy 2019 Lawson Products Inc All rights reserved Confidential Material Reproduction In Whole or in Part Prohibited
Financial Highlights for Third Quarter 2019
bull Sales increased 71 YOY (74 excluding currency fluctuation)
bull MRO LawsonKent gross margins consistent at 609
bull Adjusted Reg G EBITDA margin improving 109 in Q3 2019 v 83 in Q3 2018 Continued investment in new sales reps and rep productivity
bull Key trends MRO operating leverage of 54 13 increase in sales rep productivity Continued government strength +30 YOY Growth across multiple segments and product categories Cash flow from operations of $103 million in Q3
11
copy 2019 Lawson Products Inc All rights reserved Confidential Material Reproduction In Whole or in Part Prohibited
Pursue Disciplined MampA
Reinvest for Growth
Return Capital
bull Increased our borrowing capacity to $1000 million (additional $500 million accordion) with our new borrowing agreement
bull Capital expenditures expected to be $20 - $30 million in 2019bull Growth initiatives add new reps and increase sales rep productivity
bull Share repurchase to offset award dilution opportunistic purchasesbull $75 million stock repurchase program announced on May 16 2019 $63
million remaining after repurchase of shares worth $12 million in August 2019
bull Bolt-on acquisitions to enhance core growth strategiesbull Closed Screw Products Inc acquisition on 10118
Maintain Strong Balance Sheet
bull $86 million cash on hand and positive cash position of $64 million at the end of Q3
bull Consistent free cash flow generation
Capital Allocation Priorities
12
copy 2019 Lawson Products Inc All rights reserved Confidential Material Reproduction In Whole or in Part Prohibited
Lawson Products Poised for Growth
bull Leverage Current Infrastructure
bull Continued Sales Growth
bull Foundational Investments Completed
bull Operational Excellence
bull Large Fragmented Market
13
copy 2019 Lawson Products Inc All rights reserved Confidential Material Reproduction In Whole or in Part Prohibited
For More Information
Contact
Ronald J KnutsonEVP CFOInvestor Relations(773) 304-5665ronknutsonlawsonproductscom
And see our Website athttpwwwlawsonproductscomcompany-infoinvestor-relationsjsp
14
copy 2019 Lawson Products Inc All rights reserved Confidential Material Reproduction In Whole or in Part Prohibited
Appendices
15
copy 2019 Lawson Products Inc All rights reserved Confidential Material Reproduction In Whole or in Part Prohibited
Significant Activities
16
Appendix P-1
August 2011 Implemented SAPOctober 2011 Commenced construction of new McCook Ill distribution center
May 2012 Relocated corporate headquartersJune 2012 Restructured senior team Announced $20M cost savings plan
Transitioned packaging facility to McCook Ill distribution centerEntered into new five-year $40M credit facilityAnnounced new CEO and President Michael G DeCataConsolidated Vernon Hills distribution center into McCook Ill
November 2012 Rolled out new website to existing web customersDecember 2012 Completed transition of US independent agents to employees
April 2013 Roll-out of new website to new web customersAprilMay 2013 McCook DC begins to ship customer ordersNovember 2013 Entered into sub-lease of headquarters space to generate $29M of future cash savingsDecember 2013 Ended year with over 800 sales reps ndash First increase in 8 yearsFebruary 2014 Closed on Automatic Screw Machine Products sale for net proceeds of $121M
June 2014 Entered into sale-leaseback of Reno distribution facility for net proceeds of $83MDecember 2014 Ended year with over 900 sales repsFebruary 2015 Held North American sales meeting
September 2015 Completed West Coast Fasteners acquisitionMarch 2016 Completed Perfect Products of Michigan acquisitionMay 2016 Completed F B Feeney acquisitionJune 2016 Expanded sales team to over 1000 sales reps
September 2016 Extended credit facitlity to August 2020November 2016 Completed Mattic Industries acquisition
March 2017 Consolidated Fairfield NJ distribution operations into McCook Ill and Suwanee GAMay 2017 Sold Fairfield NJ distribution center for a gain of $54M
October 2017 Completed Bolt Supply House acquisitionApril 2018 Opened MRO distribution center in Calgary Canada
October 2018 Completed Screw Products acquisition and added Bolt Supply branchJune 2019 Achieved Q2 98 adjusted EBITDA net of ASC 842 impact of 03
September 2019 Achieved Q3 109 adjusted EBITDA hired VP MampAOctober 2019 Entered into new five-year $100M credit facility with additional $50 million accordion feature
August 2012
October 2012
Adjusted EBITDA $ in 000s
Adjusted EBITDA Q4 2016Q1 2017Q2 2017Q3 2017Q4 201722192852451954433026
Adjusted EBITDA of Sales
Adjusted EBITDA of SalesQ3 2016Q4 2016Q1 2017Q2 2017Q3 2017Q4 201760926793828971926E-232964421005719377E-23822185292895721E-260248513452257152E-271948817596594883E-237528059231332088E-2
Adjusted Operating Income of Sales
Adjusted Operating IncomeQ3 2016Q4 2016Q1 2017Q2 2017Q3 2017Q4 201723045391147287538521196
Adjusted Op Inc $ in 000s
Adjusted EBITDA Q4 2016Q1 2017Q2 2017Q3 2017Q4 20175391147287538521196
Net Sales by Quarter $ in 000s
Net SalesQ1 2013Q2 2013Q3 2013Q4 2013Q1 2014Q2 2014Q3 2014Q4 2014Q1 2015672136831768235657386920472080741287028169904
Adjusted SGampA $ in 000s
Adjusted SGampA Q4 2015Q1 2016Q2 2016Q3 2016Q4 2016Q1 2017Q2 2017Q3 2017Q4 2017391634230341839404474008543732422664243946222
copy 2019 Lawson Products Inc All rights reserved Confidential Material Reproduction In Whole or in Part Prohibited
Regulation G ndash GAAP ReconciliationAppendix P-2
Non GAAP Reconciliation of Adjusted EBITDA to Sales Percentage
The Company reports its financial results in accordance with US generally accepted accounting principles (GAAP) However the Companys management believesthat certain non-GAAP financial measures may provide users of this financial information additional meaningful comparisons between current results and results inprior operating periods Management believes that these non-GAAP financial measures can provide additional meaningful reflection of underlying trends of thebusiness because they provide a comparison of historical information that excludes certain non-operational non-recurring or intermittently recurring items thatimpact the overall comparability See the table below for supplemental financial data and corresponding reconciliations to GAAP financial measures for quarterlyadjusted EBITDA as a percentage of net sales Non-GAAP financial measures should be viewed in addition to and not as an alternative for the Companys reportedresults prepared in accordance with GAAP
17
($ in thousands) Q1 2017 Q2 2017 Q3 2017 Q4 2017 Q1 2018 Q2 2018 Q3 2018 Q4 2018 Q1 2019 Q2 2019 Q3 2019
Net Sales 74617$ 75006$ 75651$ 80633$ 84459$ 90382$ 88530$ 86266$ 91343$ 96097$ 94779$
Operating Income (Loss) 712 7891 1090 243 1837 5554 (2266) 4085 5544 1623 6446 Depreciation amp Amortization 1705 1644 1591 1830 1686 1679 1755 1735 1478 1455 1468 EBITDA 2417 9535 2681 2073 3523 7233 (511) 5820 7022 3078 7914
Excluded CostsSeverance 465 (9) 139 144 628 64 31 126 27 1485 30 Stock Based Compensation (Benefit) (30) 415 2337 384 970 87 7637 (1186) 408 4839 2374 Acquisition Related Costs - - 286 425 - - 168 62 - - - Loss(Gain) on Disposal of Property - (5422) - - - - - - - - - Lease termination gain - - - - - (164) - - - - - Discontinued operation accrual - - - - - 529 - - - - - Building Impairment - - - - - - - 231 - - - Reg G Adjusted EBITDA 2852$ 4519$ 5443$ 3026$ 5121$ 7749$ 7325$ 5053$ 7457$ 9402$ 10318$
Adjusted EBITDA of Sales 38 60 72 38 61 86 83 59 82 98 109
Customer Mix
Regional Accounts48
Kent Automotive16
Regional AccountsStrategicKent AutomotiveBolt SupplyGovernment Screw ProductsOther047014000000000000001016011010002
ampDampF ampA
Product Mix
Fastening Systems23
Specialty Chemicals12
Fastening SystemsFluid PowerSpecialy ChemicalsCutting Tools and AbrasivesElectricalAftermarket Automotive SuppliesSafetyWelding and Metal RepairOther02401501201301100800500201
Number Of Sales Reps
Tenure With Lawson (as of 63019)
Average Annual Sales
Consolidated Revenues
Consolidated Revenues20142015201620172018TTM 63019285693275834276573305907349637362236Net Cash(Debt)2014201520162017201843646420798409580-101271060-1908Rep Count201320142015201620172018436468069169371009983994982
Adjusted Reg G EBITDA
Adjusted EBITDA20142015201620172018TTM 63019136581719912065158402524829237
Quarterly Adjusted Reg G EBITDA
2017Q1Q2Q3Q428524519544330262018Q1Q2Q3Q451217749732550532019Q1Q2Q3Q474579402
Adjusted EBITDA $ in 000s
Reg G Adjusted EBITDA Q1 2017Q2 2017Q3 2017Q4 20172852451954433026
Adjusted EBITDA of Sales
Adjusted EBITDA of SalesQ1 2017Q2 2017Q3 2017Q4 20173822185292895721E-260248513452257152E-271948817596594883E-237528059231332088E-2
Adjusted Operating Income of Sales
Adjusted Operating IncomeQ1 2017Q2 2017Q3 2017Q4 2017
Adjusted Op Inc $ in 000s
Reg G Adjusted EBITDA Q1 2017Q2 2017Q3 2017Q4 2017
copy 2019 Lawson Products Inc All rights reserved Confidential Material Reproduction In Whole or in Part Prohibited
Consolidated Balance Sheet Appendix P-4
18
ASSETSCurrent assetsCash and cash equivalents $ 8626 $ 11883Restricted cash 800 800Accounts receivable less allowance for doubtful accounts of $614 and $549 respectively
45162 37682
Inventories net 54894 52887Miscellaneous receivables and prepaid expenses 4270 3653Total current assets 113752 106905
Property plant and equipment net 16932 23548Deferred income taxes 17372 20592Goodwill 20582 20079Cash value of life insurance 14440 12599Intangible assets net 12468 13112Lease assets 11917 mdashOther assets 275 307Total assets $ 207738 $ 197142
LIABILITIES AND STOCKHOLDERSrsquo EQUITYCurrent liabilitiesRevolving lines of credit $ 2195 $ 10823Accounts payable 16325 15207Lease obligation 3781 mdashAccrued expenses and other liabilities 37873 40179Total current liabilities 60174 66209
Security bonus plan 11969 12413Lease obligation 10360 5213Deferred compensation 5915 5304Deferred tax liability 2879 2761Other liabilities 3460 6069Total liabilities 94757 97969
Stockholdersrsquo equityPreferred stock $1 par valueAuthorized - 500000 shares Issued and outstanding mdash None mdash mdashCommon stock $1 par value
Authorized - 35000000 sharesIssued - 9042597 and 9005716 shares respectivelyOutstanding - 8956981 and 8955930 shares respectively
Capital in excess of par value 17626 15623Retained earnings 89502 77338Treasury stock ndash 85616 and 49786 shares respectivelyAccumulated other comprehensive lossTotal stockholdersrsquo equity 112981 99173Total liabilities and stockholdersrsquo equity $ 207738 $ 197142
September 30 December 312019 2018
(Unaudited)
(2595) (1234)(595) (1560)
9043 9006
Customer Mix
Regional Accounts48
Kent Automotive16
Regional AccountsStrategicKent AutomotiveBolt SupplyGovernment Screw ProductsOther0470140000000000000010150110110002
ampDampF ampA
Product Mix
Fastening Systems23
Specialty Chemicals12
Fastening SystemsFluid PowerSpecialy ChemicalsCutting Tools and AbrasivesElectricalAftermarket Automotive SuppliesSafetyWelding and Metal RepairOther02401501201301100800500201
Number Of Sales Reps
Tenure With Lawson (as of 63019)
Average Annual Sales
Consolidated Revenues
Consolidated Revenues20142015201620172018TTM 93019285693275834276573305907349637368485Net Cash(Debt)2014201520162017201843738420798409580-1012710606431Rep Count201320142015201620172018437388069169371009983994993
Adjusted Reg G EBITDA
Adjusted EBITDA20142015201620172018TTM 93019136581719912065158402524832230
Quarterly Adjusted Reg G EBITDA
2017Q1Q2Q3Q428524519544330262018Q1Q2Q3Q451217749732550532019Q1Q2Q3Q47457940210318
Adjusted EBITDA $ in 000s
Reg G Adjusted EBITDA Q1 2017Q2 2017Q3 2017Q4 20172852451954433026
Adjusted EBITDA of Sales
Adjusted EBITDA of SalesQ1 2017Q2 2017Q3 2017Q4 20173822185292895721E-260248513452257152E-271948817596594883E-237528059231332088E-2
Adjusted Operating Income of Sales
Adjusted Operating IncomeQ1 2017Q2 2017Q3 2017Q4 2017
Adjusted Op Inc $ in 000s
Reg G Adjusted EBITDA Q1 2017Q2 2017Q3 2017Q4 2017
| September 30 | December 31 | ||||||||||
| 2019 | 2018 | ||||||||||
| ASSETS | (Unaudited) | ||||||||||
| Current assets | |||||||||||
| Cash and cash equivalents | $ | 8626 | $ | 11883 | |||||||
| Restricted cash | 800 | 800 | |||||||||
| Accounts receivable less allowance for doubtful accounts of $614 and $549 respectively | 45162 | 37682 | |||||||||
| Inventories net | 54894 | 52887 | |||||||||
| Miscellaneous receivables and prepaid expenses | 4270 | 3653 | |||||||||
| Total current assets | 113752 | 106905 | |||||||||
| Property plant and equipment net | 16932 | 23548 | |||||||||
| Deferred income taxes | 17372 | 20592 | |||||||||
| Goodwill | 20582 | 20079 | |||||||||
| Cash value of life insurance | 14440 | 12599 | |||||||||
| Intangible assets net | 12468 | 13112 | |||||||||
| Lease assets | 11917 | mdash | |||||||||
| Other assets | 275 | 307 | |||||||||
| Total assets | $ | 207738 | $ | 197142 | |||||||
| LIABILITIES AND STOCKHOLDERSrsquo EQUITY | |||||||||||
| Current liabilities | |||||||||||
| Revolving lines of credit | $ | 2195 | $ | 10823 | |||||||
| Accounts payable | 16325 | 15207 | |||||||||
| Lease obligation | 3781 | mdash | |||||||||
| Accrued expenses and other liabilities | 37873 | 40179 | |||||||||
| Total current liabilities | 60174 | 66209 | |||||||||
| Security bonus plan | 11969 | 12413 | |||||||||
| Lease obligation | 10360 | 5213 | |||||||||
| Deferred compensation | 5915 | 5304 | |||||||||
| Deferred tax liability | 2879 | 2761 | |||||||||
| Other liabilities | 3460 | 6069 | |||||||||
| Total liabilities | 94757 | 97969 | |||||||||
| Stockholdersrsquo equity | |||||||||||
| Preferred stock $1 par value | |||||||||||
| Authorized - 500000 shares Issued and outstanding mdash None | mdash | mdash | |||||||||
| Common stock $1 par value | |||||||||||
| Authorized - 35000000 shares | 9043 | 9006 | |||||||||
| Issued - 9042597 and 9005716 shares respectively | |||||||||||
| Outstanding - 8956981 and 8955930 shares respectively | |||||||||||
| Capital in excess of par value | 17626 | 15623 | |||||||||
| Retained earnings | 89502 | 77338 | |||||||||
| Treasury stock ndash 85616 and 49786 shares respectively | (2595) | (1234) | |||||||||
| Accumulated other comprehensive loss | (595) | (1560) | |||||||||
| Total stockholdersrsquo equity | 112981 | 99173 | |||||||||
| Total liabilities and stockholdersrsquo equity | $ | 207738 | $ | 197142 | |||||||
| Three Months Ended | |||||||||||||||||||||||||||||
| Jun 30 2019 | Mar 31 2019 | Dec 31 2018 | Sep 30 2018 | Jun 30 2018 | |||||||||||||||||||||||||
| Average daily net sales | $ | 1502 | $ | 1450 | $ | 1414 | $ | 1405 | $ | 1412 | |||||||||||||||||||
| Year over year increase | 63 | 82 | 70 | 170 | 205 | ||||||||||||||||||||||||
| Sequential quarter increase (decrease) | 36 | 25 | 06 | (05) | 53 | ||||||||||||||||||||||||
| Net Sales | $ | 96097 | $ | 91343 | $ | 86266 | $ | 88530 | $ | 90382 | |||||||||||||||||||
| Gross profit (1) | 51043 | 48923 | 46083 | 48108 | 49131 | ||||||||||||||||||||||||
| Gross profit percentage (1) | 531 | 536 | 534 | 543 | 544 | ||||||||||||||||||||||||
| Selling general amp administrative expenses | $ | 49420 | $ | 43379 | $ | 41998 | $ | 50374 | $ | 43577 | |||||||||||||||||||
| Operating income (loss) | $ | 1623 | $ | 5544 | $ | 4085 | $ | (2266) | $ | 5554 | |||||||||||||||||||
| Full Year | |||||||||||||||||||||||||||||||||||||||||||||||||||||||||||||||||||||||||||
| ($ in thousands) | Q1 2011 | Q2 2011 | Q3 2011 | Q4 2011 | Q1 2012 | Q2 2012 | Q3 2012 | Q4 2012 | Q1 2013 | Q2 2013 | Q3 2013 | Q4 2013 | Q1 2014 | Q2 2014 | Q3 2014 | Q4 2014 | Q1 2015 | Q2 2015 | Q3 2015 | Q4 2015 | Q1 2016 | Q2 2016 | Q3 2016 | Q4 2016 | Q1 2017 | Q2 2017 | Q3 2017 | Q4 2017 | Q1 2018 | Q2 2018 | Q3 2018 | Q4 2018 | Q1 2019 | Q2 2019 | Q3 2019 | 2014 | 2015 | ||||||||||||||||||||||||||||||||||||||
| Net Sales | $ 79255 | $ 80625 | $ 71490 | $ 69029 | $ 71364 | $ 69830 | $ 67863 | $ 64505 | $ 67213 | $ 68317 | $ 68235 | $ 65738 | $ 69204 | $ 72080 | $ 74128 | $ 70281 | $ 69904 | $ 70726 | $ 70243 | $ 64961 | $ 69711 | $ 69348 | $ 70199 | $ 67315 | $ 74617 | $ 75006 | $ 75651 | $ 80633 | $ 84459 | $ 90382 | $ 88530 | $ 86266 | $ 91343 | $ 96097 | $ 94779 | $ 285693 | $ 275834 | ||||||||||||||||||||||||||||||||||||||
| Operating Income (Loss) | 3542 | 1397 | (3480) | (6995) | (3466) | (42084) | (1740) | 2057 | (3530) | (201) | 870 | (3002) | (4713) | 1241 | 678 | (2169) | (947) | 3243 | 2810 | (2985) | 1169 | 29 | 2389 | (5044) | 712 | 7891 | 1090 | 243 | 1837 | 5554 | (2266) | 4085 | 5544 | 1623 | 6446 | (4963) | 2121 | ||||||||||||||||||||||||||||||||||||||
| Depreciation amp Amortization | 1260 | 1315 | 1160 | 1675 | 1715 | 1566 | 1963 | 1841 | 2061 | 2244 | 2367 | 2358 | 2295 | 2163 | 2160 | 2133 | 2096 | 2126 | 2119 | 2202 | 2187 | 2226 | 1973 | 1680 | 1705 | 1644 | 1591 | 1830 | 1686 | 1679 | 1755 | 1735 | 1478 | 1455 | 1468 | 8751 | 8543 | ||||||||||||||||||||||||||||||||||||||
| EBITDA | 4802 | 2712 | (2320) | (5320) | (1751) | (40518) | 223 | 3898 | (1469) | 2043 | 3237 | (644) | (2418) | 3404 | 2838 | (36) | 1149 | 5369 | 4929 | (783) | 3356 | 2255 | 4362 | (3364) | 2417 | 9535 | 2681 | 2073 | 3523 | 7233 | (511) | 5820 | 7022 | 3078 | 7914 | 3788 | 10664 | ||||||||||||||||||||||||||||||||||||||
| Excluded Costs | |||||||||||||||||||||||||||||||||||||||||||||||||||||||||||||||||||||||||||
| Severance | 745 | 465 | 282 | 122 | 185 | 6585 | 1410 | (159) | - 0 | 2 | 962 | (127) | 728 | 290 | (328) | (59) | 571 | 50 | 372 | 280 | 204 | 143 | 367 | 1662 | 465 | (9) | 139 | 144 | 628 | 64 | 31 | 126 | 27 | 1485 | 30 | 631 | 1273 | ||||||||||||||||||||||||||||||||||||||
| Stock Based Compensation (Benefit) | 227 | (95) | (538) | 467 | 198 | (1015) | 77 | 434 | 1596 | 76 | 33 | 562 | 1125 | 408 | 2423 | 2443 | (541) | 971 | (30) | 1693 | (1217) | 515 | (630) | 3801 | (30) | 415 | 2337 | 384 | 970 | 87 | 7637 | (1186) | 408 | 4839 | 2374 | 6399 | 2093 | ||||||||||||||||||||||||||||||||||||||
| Acquisition Related Costs | - 0 | - 0 | - 0 | - 0 | - 0 | - 0 | 310 | 32 | 115 | 198 | 178 | 120 | - 0 | - 0 | 286 | 425 | - 0 | - 0 | 168 | 62 | - 0 | - 0 | - 0 | ||||||||||||||||||||||||||||||||||||||||||||||||||||
| ERP Implementation Costs | 1902 | 2388 | 2344 | 339 | - 0 | - 0 | - 0 | - 0 | - 0 | - 0 | - 0 | - 0 | - 0 | - 0 | - 0 | - 0 | - 0 | - 0 | - 0 | - 0 | - 0 | - 0 | - 0 | - 0 | - 0 | - 0 | - 0 | - 0 | - 0 | - 0 | - 0 | - 0 | - 0 | ||||||||||||||||||||||||||||||||||||||||||
| Loss(Gain) on Disposal of Property | - 0 | - 0 | - 0 | 22 | - 0 | (2122) | (11) | (1588) | - 0 | - 0 | (36) | 32 | - 0 | - 0 | 97 | 45 | - 0 | - 0 | (2) | 9 | - 0 | - 0 | - 0 | - 0 | - 0 | (5422) | - 0 | - 0 | - 0 | - 0 | - 0 | - 0 | - 0 | - 0 | - 0 | 142 | 7 | ||||||||||||||||||||||||||||||||||||||
| Legal Settlement | - 0 | - 0 | - 0 | - 0 | - 0 | - 0 | - 0 | - 0 | - 0 | - 0 | - 0 | - 0 | - 0 | - 0 | (688) | - 0 | - 0 | - 0 | - 0 | - 0 | - 0 | - 0 | - 0 | - 0 | - 0 | - 0 | - 0 | - 0 | - 0 | - 0 | - 0 | - 0 | (688) | - 0 | |||||||||||||||||||||||||||||||||||||||||
| Employment Tax Matter | - 0 | - 0 | - 0 | 1200 | - 0 | - 0 | - 0 | - 0 | - 0 | - 0 | - 0 | (400) | - 0 | - 0 | - 0 | - 0 | - 0 | - 0 | - 0 | - 0 | - 0 | - 0 | - 0 | - 0 | - 0 | - 0 | - 0 | - 0 | - 0 | - 0 | - 0 | - 0 | - 0 | - 0 | |||||||||||||||||||||||||||||||||||||||||
| Lease termination gain | - 0 | - 0 | - 0 | - 0 | - 0 | - 0 | - 0 | - 0 | - 0 | - 0 | - 0 | 2928 | - 0 | - 0 | - 0 | - 0 | - 0 | - 0 | - 0 | - 0 | - 0 | - 0 | - 0 | - 0 | - 0 | - 0 | - 0 | - 0 | - 0 | (164) | - 0 | - 0 | - 0 | - 0 | - 0 | - 0 | - 0 | ||||||||||||||||||||||||||||||||||||||
| Goodwill Impairment | - 0 | - 0 | - 0 | - 0 | - 0 | 28306 | - 0 | - 0 | - 0 | - 0 | - 0 | - 0 | - 0 | - 0 | - 0 | - 0 | - 0 | - 0 | - 0 | - 0 | - 0 | - 0 | - 0 | - 0 | - 0 | - 0 | - 0 | - 0 | - 0 | - 0 | - 0 | - 0 | - 0 | - 0 | |||||||||||||||||||||||||||||||||||||||||
| Inventory Rationalization | - 0 | - 0 | - 0 | - 0 | - 0 | 3893 | - 0 | - 0 | - 0 | - 0 | - 0 | - 0 | - 0 | - 0 | - 0 | - 0 | - 0 | - 0 | - 0 | - 0 | - 0 | - 0 | - 0 | - 0 | - 0 | - 0 | - 0 | - 0 | - 0 | - 0 | - 0 | - 0 | - 0 | - 0 | |||||||||||||||||||||||||||||||||||||||||
| Discontinued operation accrual | - 0 | - 0 | - 0 | - 0 | - 0 | - 0 | - 0 | - 0 | - 0 | - 0 | - 0 | - 0 | - 0 | - 0 | - 0 | 340 | - 0 | - 0 | - 0 | 931 | - 0 | - 0 | - 0 | - 0 | - 0 | - 0 | - 0 | - 0 | - 0 | 529 | - 0 | - 0 | - 0 | - 0 | - 0 | 340 | 931 | ||||||||||||||||||||||||||||||||||||||
| North American sales meeting | - 0 | - 0 | - 0 | - 0 | - 0 | - 0 | - 0 | - 0 | 1225 | - 0 | - 0 | - 0 | - 0 | - 0 | - 0 | - 0 | 1889 | - 0 | - 0 | - 0 | - 0 | - 0 | - 0 | - 0 | - 0 | - 0 | - 0 | - 0 | - 0 | - 0 | - 0 | - 0 | - 0 | 1889 | |||||||||||||||||||||||||||||||||||||||||
| Property Impairment Loss | - 0 | - 0 | - 0 | - 0 | - 0 | - 0 | - 0 | - 0 | - 0 | - 0 | - 0 | - 0 | 2914 | 132 | - 0 | - 0 | - 0 | - 0 | - 0 | - 0 | - 0 | - 0 | - 0 | - 0 | - 0 | - 0 | - 0 | - 0 | - 0 | - 0 | - 0 | - 0 | 3046 | - 0 | |||||||||||||||||||||||||||||||||||||||||
| Building Impairment | - 0 | - 0 | - 0 | - 0 | - 0 | - 0 | - 0 | 231 | - 0 | - 0 | - 0 | ||||||||||||||||||||||||||||||||||||||||||||||||||||||||||||||||
| Reg G Adjusted EBITDA | $ 7676 | $ 5470 | $ (232) | $ (3170) | $ (1368) | $ (4871) | $ 1699 | $ 2585 | $ 1352 | $ 2121 | $ 4196 | $ 2351 | $ 2349 | $ 4234 | $ 4342 | $ 2733 | $ 3068 | $ 6390 | $ 5579 | $ 2162 | $ 2458 | $ 3111 | $ 4277 | $ 2219 | $ 2852 | $ 4519 | $ 5443 | $ 3026 | $ 5121 | $ 7749 | $ 7325 | $ 5053 | $ 7457 | $ 9402 | $ 10318 | $ 13658 | $ 17199 | ||||||||||||||||||||||||||||||||||||||
| Adjusted EBITDA of Sales | 97 | 68 | -03 | -46 | -19 | -70 | 25 | 40 | 20 | 31 | 61 | 36 | 34 | 59 | 59 | 39 | 44 | 90 | 79 | 33 | 35 | 45 | 61 | 33 | 38 | 60 | 72 | 38 | 61 | 86 | 83 | 59 | 82 | 98 | 109 | 48 | 62 | ||||||||||||||||||||||||||||||||||||||
| Annual Adjusted EBITDA of Sales | 44 | 58 | |||||||||||||||||||||||||||||||||||||||||||||||||||||||||||||||||||||||||
| Adjusted Operating Income | (3083) | (6437) | (264) | 744 | (709) | (123) | 1829 | (7) | 54 | 2071 | 2182 | 600 | 972 | 4264 | 3460 | (40) | 271 | 885 | 2304 | 539 | 1147 | 2875 | 3852 | 1196 | 3435 | 6070 | 5570 | 3087 | 5979 | 7947 | 8850 | 4907 | 8314 | ||||||||||||||||||||||||||||||||||||||||||
| Consolidated Revenues | |||||||
| 2013 | 269503 | ||||||
| 2014 | 285693 | ||||||
| 2015 | 275834 | ||||||
| 2016 | 276573 | ||||||
| 2017 | 305907 | ||||||
| 2018 | 349637 | ||||||
| TTM 93019 | 368485 | ||||||
| Net Cash(Debt) | |||||||
| 2013 | (15380) | ||||||
| 2014 | 4207 | ||||||
| 2015 | 9840 | ||||||
| 2016 | 9580 | ||||||
| 2017 | (10127) | ||||||
| 2018 | 1060 | ||||||
| 93019 | 6431 | ||||||
| Rep Count | |||||||
| 2013 | 806 | ||||||
| 2014 | 916 | ||||||
| 2015 | 937 | ||||||
| 2016 | 1009 | ||||||
| 2017 | 983 | ||||||
| 2018 | 994 | ||||||
| 93019 | 993 | ||||||
| Adjusted OI | DampA | Adjusted EBITDA | |||||
| 2013 | 990 | 9030 | 10020 | ||||
| 2014 | 4907 | 8751 | 13658 | ||||
| 2015 | 8315 | 8543 | 17199 | ||||
| 2016 | 3388 | 8066 | 12065 | ||||
| 2017 | 15840 | ||||||
| 2018 | 25248 | ||||||
| TTM 93019 | 32230 | ||||||
| Reg G EBITDA By Quarter | |||||||
| Quarter | 2017 | 2018 | 2019 | ||||
| Q1 | 2852 | 5121 | 7457 | ||||
| Q2 | 4519 | 7749 | 9402 | ||||
| Q3 | 5443 | 7325 | 10318 | ||||
| Q4 | 3026 | 5053 |
| Months of Experience | Average Annual Sales | Number of Reps | |||
| lt 12 Mos | ERRORVALUE | ERRORVALUE | |||
| 1 - 2 Yrs | ERRORVALUE | ERRORVALUE | |||
| 3 - 5 Yrs | ERRORVALUE | ERRORVALUE | |||
| 5 - 10 Yrs | ERRORVALUE | ERRORVALUE | |||
| gt 10 Yrs | ERRORVALUE | ERRORVALUE | |||
| ERRORVALUE | |||||
| Excludes ISR MSS CRS | |||||
| Excludes Freight | |||||
| Product mix | ||||||||
| Verticals | Q3 2019 Sales | |||||||
| Fastening Systems | 240 | 22485606 | ||||||
| Fluid Power | 151 | 14156064 | ||||||
| Specialy Chemicals | 117 | 10917433 | ||||||
| Cutting Tools and Abrasives | 131 | 12296596 | ||||||
| Electrical | 104 | 9724849 | ||||||
| Aftermarket Automotive Supplies | 76 | 7154688 | ||||||
| Safety | 47 | 4445846 | ||||||
| Welding and Metal Repair | 13 | 1218030 | ||||||
| Other | 120 | 11237322 | ||||||
| Total | 100 | 93636434 | ||||||
| Verticals | YTD 2019 Sales | |||||||
| Fastening Systems | 24 | 66611555 | ||||||
| Fluid Power | 15 | 42224416 | ||||||
| Specialy Chemicals | 12 | 32166853 | ||||||
| Cutting Tools and Abrasives | 13 | 36587482 | ||||||
| Electrical | 11 | 30150144 | ||||||
| Aftermarket Automotive Supplies | 8 | 21960561 | ||||||
| Safety | 5 | 13072228 | ||||||
| Welding and Metal Repair | 2 | 4306548 | ||||||
| Other | 10 | 31279779 | ||||||
| Total | 100 | 278359566 |
| Lawson core customer mix | ||||||||
| Account Tyoe | Q3 | |||||||
| Regional Accounts | 43045893 | 45 | ||||||
| Strategic | 14086813 | 15 | ||||||
| Kent Automotive | 14300065 | 15 | ||||||
| Bolt Supply | 11318703 | 12 | ||||||
| Government | 10291732 | 11 | ||||||
| Screw Products | 0 | 0 | ||||||
| Other (1) | 1735236 | 2 | ||||||
| Total | 94778443 | 100 | ||||||
| Account Tyoe | YTD September | |||||||
| Regional Accounts | 131389537 | 47 | ||||||
| Strategic | 40364305 | 14 | ||||||
| Kent Automotive | 43371411 | 15 | ||||||
| Bolt Supply | 31324209 | 11 | ||||||
| Government | 29794959 | 11 | ||||||
| Screw Products | 0 | 0 | ||||||
| Other | 5974302 | 2 | ||||||
| Total | 282218723 | 100 | ||||||
| Total Reported |
| September 30 | December 31 | ||||||||||
| 2019 | 2018 | ||||||||||
| ASSETS | (Unaudited) | ||||||||||
| Current assets | |||||||||||
| Cash and cash equivalents | $ | 8626 | $ | 11883 | |||||||
| Restricted cash | 800 | 800 | |||||||||
| Accounts receivable less allowance for doubtful accounts of $614 and $549 respectively | 45162 | 37682 | |||||||||
| Inventories net | 54894 | 52887 | |||||||||
| Miscellaneous receivables and prepaid expenses | 4270 | 3653 | |||||||||
| Total current assets | 113752 | 106905 | |||||||||
| Property plant and equipment net | 16932 | 23548 | |||||||||
| Deferred income taxes | 17372 | 20592 | |||||||||
| Goodwill | 20582 | 20079 | |||||||||
| Cash value of life insurance | 14440 | 12599 | |||||||||
| Intangible assets net | 12468 | 13112 | |||||||||
| Lease assets | 11917 | mdash | |||||||||
| Other assets | 275 | 307 | |||||||||
| Total assets | $ | 207738 | $ | 197142 | |||||||
| LIABILITIES AND STOCKHOLDERSrsquo EQUITY | |||||||||||
| Current liabilities | |||||||||||
| Revolving lines of credit | $ | 2195 | $ | 10823 | |||||||
| Accounts payable | 16325 | 15207 | |||||||||
| Lease obligation | 3781 | mdash | |||||||||
| Accrued expenses and other liabilities | 37873 | 40179 | |||||||||
| Total current liabilities | 60174 | 66209 | |||||||||
| Security bonus plan | 11969 | 12413 | |||||||||
| Lease obligation | 10360 | 5213 | |||||||||
| Deferred compensation | 5915 | 5304 | |||||||||
| Deferred tax liability | 2879 | 2761 | |||||||||
| Other liabilities | 3460 | 6069 | |||||||||
| Total liabilities | 94757 | 97969 | |||||||||
| Stockholdersrsquo equity | |||||||||||
| Preferred stock $1 par value | |||||||||||
| Authorized - 500000 shares Issued and outstanding mdash None | mdash | mdash | |||||||||
| Common stock $1 par value | |||||||||||
| Authorized - 35000000 shares | 9043 | 9006 | |||||||||
| Issued - 9042597 and 9005716 shares respectively | |||||||||||
| Outstanding - 8956981 and 8955930 shares respectively | |||||||||||
| Capital in excess of par value | 17626 | 15623 | |||||||||
| Retained earnings | 89502 | 77338 | |||||||||
| Treasury stock ndash 85616 and 49786 shares respectively | (2595) | (1234) | |||||||||
| Accumulated other comprehensive loss | (595) | (1560) | |||||||||
| Total stockholdersrsquo equity | 112981 | 99173 | |||||||||
| Total liabilities and stockholdersrsquo equity | $ | 207738 | $ | 197142 | |||||||
| Three Months Ended | |||||||||||||||||||||||||||||
| Jun 30 2019 | Mar 31 2019 | Dec 31 2018 | Sep 30 2018 | Jun 30 2018 | |||||||||||||||||||||||||
| Average daily net sales | $ | 1502 | $ | 1450 | $ | 1414 | $ | 1405 | $ | 1412 | |||||||||||||||||||
| Year over year increase | 63 | 82 | 70 | 170 | 205 | ||||||||||||||||||||||||
| Sequential quarter increase (decrease) | 36 | 25 | 06 | (05) | 53 | ||||||||||||||||||||||||
| Net Sales | $ | 96097 | $ | 91343 | $ | 86266 | $ | 88530 | $ | 90382 | |||||||||||||||||||
| Gross profit (1) | 51043 | 48923 | 46083 | 48108 | 49131 | ||||||||||||||||||||||||
| Gross profit percentage (1) | 531 | 536 | 534 | 543 | 544 | ||||||||||||||||||||||||
| Selling general amp administrative expenses | $ | 49420 | $ | 43379 | $ | 41998 | $ | 50374 | $ | 43577 | |||||||||||||||||||
| Operating income (loss) | $ | 1623 | $ | 5544 | $ | 4085 | $ | (2266) | $ | 5554 | |||||||||||||||||||
| Full Year | |||||||||||||||||||||||||||||||||||||||||||||||||||||||||||||||||||||||||||
| ($ in thousands) | Q1 2011 | Q2 2011 | Q3 2011 | Q4 2011 | Q1 2012 | Q2 2012 | Q3 2012 | Q4 2012 | Q1 2013 | Q2 2013 | Q3 2013 | Q4 2013 | Q1 2014 | Q2 2014 | Q3 2014 | Q4 2014 | Q1 2015 | Q2 2015 | Q3 2015 | Q4 2015 | Q1 2016 | Q2 2016 | Q3 2016 | Q4 2016 | Q1 2017 | Q2 2017 | Q3 2017 | Q4 2017 | Q1 2018 | Q2 2018 | Q3 2018 | Q4 2018 | Q1 2019 | Q2 2019 | Q3 2019 | 2014 | 2015 | ||||||||||||||||||||||||||||||||||||||
| Net Sales | $ 79255 | $ 80625 | $ 71490 | $ 69029 | $ 71364 | $ 69830 | $ 67863 | $ 64505 | $ 67213 | $ 68317 | $ 68235 | $ 65738 | $ 69204 | $ 72080 | $ 74128 | $ 70281 | $ 69904 | $ 70726 | $ 70243 | $ 64961 | $ 69711 | $ 69348 | $ 70199 | $ 67315 | $ 74617 | $ 75006 | $ 75651 | $ 80633 | $ 84459 | $ 90382 | $ 88530 | $ 86266 | $ 91343 | $ 96097 | $ 94779 | $ 285693 | $ 275834 | ||||||||||||||||||||||||||||||||||||||
| Operating Income (Loss) | 3542 | 1397 | (3480) | (6995) | (3466) | (42084) | (1740) | 2057 | (3530) | (201) | 870 | (3002) | (4713) | 1241 | 678 | (2169) | (947) | 3243 | 2810 | (2985) | 1169 | 29 | 2389 | (5044) | 712 | 7891 | 1090 | 243 | 1837 | 5554 | (2266) | 4085 | 5544 | 1623 | 6446 | (4963) | 2121 | ||||||||||||||||||||||||||||||||||||||
| Depreciation amp Amortization | 1260 | 1315 | 1160 | 1675 | 1715 | 1566 | 1963 | 1841 | 2061 | 2244 | 2367 | 2358 | 2295 | 2163 | 2160 | 2133 | 2096 | 2126 | 2119 | 2202 | 2187 | 2226 | 1973 | 1680 | 1705 | 1644 | 1591 | 1830 | 1686 | 1679 | 1755 | 1735 | 1478 | 1455 | 1468 | 8751 | 8543 | ||||||||||||||||||||||||||||||||||||||
| EBITDA | 4802 | 2712 | (2320) | (5320) | (1751) | (40518) | 223 | 3898 | (1469) | 2043 | 3237 | (644) | (2418) | 3404 | 2838 | (36) | 1149 | 5369 | 4929 | (783) | 3356 | 2255 | 4362 | (3364) | 2417 | 9535 | 2681 | 2073 | 3523 | 7233 | (511) | 5820 | 7022 | 3078 | 7914 | 3788 | 10664 | ||||||||||||||||||||||||||||||||||||||
| Excluded Costs | |||||||||||||||||||||||||||||||||||||||||||||||||||||||||||||||||||||||||||
| Severance | 745 | 465 | 282 | 122 | 185 | 6585 | 1410 | (159) | - 0 | 2 | 962 | (127) | 728 | 290 | (328) | (59) | 571 | 50 | 372 | 280 | 204 | 143 | 367 | 1662 | 465 | (9) | 139 | 144 | 628 | 64 | 31 | 126 | 27 | 1485 | 30 | 631 | 1273 | ||||||||||||||||||||||||||||||||||||||
| Stock Based Compensation (Benefit) | 227 | (95) | (538) | 467 | 198 | (1015) | 77 | 434 | 1596 | 76 | 33 | 562 | 1125 | 408 | 2423 | 2443 | (541) | 971 | (30) | 1693 | (1217) | 515 | (630) | 3801 | (30) | 415 | 2337 | 384 | 970 | 87 | 7637 | (1186) | 408 | 4839 | 2374 | 6399 | 2093 | ||||||||||||||||||||||||||||||||||||||
| Acquisition Related Costs | - 0 | - 0 | - 0 | - 0 | - 0 | - 0 | 310 | 32 | 115 | 198 | 178 | 120 | - 0 | - 0 | 286 | 425 | - 0 | - 0 | 168 | 62 | - 0 | - 0 | - 0 | ||||||||||||||||||||||||||||||||||||||||||||||||||||
| ERP Implementation Costs | 1902 | 2388 | 2344 | 339 | - 0 | - 0 | - 0 | - 0 | - 0 | - 0 | - 0 | - 0 | - 0 | - 0 | - 0 | - 0 | - 0 | - 0 | - 0 | - 0 | - 0 | - 0 | - 0 | - 0 | - 0 | - 0 | - 0 | - 0 | - 0 | - 0 | - 0 | - 0 | - 0 | ||||||||||||||||||||||||||||||||||||||||||
| Loss(Gain) on Disposal of Property | - 0 | - 0 | - 0 | 22 | - 0 | (2122) | (11) | (1588) | - 0 | - 0 | (36) | 32 | - 0 | - 0 | 97 | 45 | - 0 | - 0 | (2) | 9 | - 0 | - 0 | - 0 | - 0 | - 0 | (5422) | - 0 | - 0 | - 0 | - 0 | - 0 | - 0 | - 0 | - 0 | - 0 | 142 | 7 | ||||||||||||||||||||||||||||||||||||||
| Legal Settlement | - 0 | - 0 | - 0 | - 0 | - 0 | - 0 | - 0 | - 0 | - 0 | - 0 | - 0 | - 0 | - 0 | - 0 | (688) | - 0 | - 0 | - 0 | - 0 | - 0 | - 0 | - 0 | - 0 | - 0 | - 0 | - 0 | - 0 | - 0 | - 0 | - 0 | - 0 | - 0 | (688) | - 0 | |||||||||||||||||||||||||||||||||||||||||
| Employment Tax Matter | - 0 | - 0 | - 0 | 1200 | - 0 | - 0 | - 0 | - 0 | - 0 | - 0 | - 0 | (400) | - 0 | - 0 | - 0 | - 0 | - 0 | - 0 | - 0 | - 0 | - 0 | - 0 | - 0 | - 0 | - 0 | - 0 | - 0 | - 0 | - 0 | - 0 | - 0 | - 0 | - 0 | - 0 | |||||||||||||||||||||||||||||||||||||||||
| Lease termination gain | - 0 | - 0 | - 0 | - 0 | - 0 | - 0 | - 0 | - 0 | - 0 | - 0 | - 0 | 2928 | - 0 | - 0 | - 0 | - 0 | - 0 | - 0 | - 0 | - 0 | - 0 | - 0 | - 0 | - 0 | - 0 | - 0 | - 0 | - 0 | - 0 | (164) | - 0 | - 0 | - 0 | - 0 | - 0 | - 0 | - 0 | ||||||||||||||||||||||||||||||||||||||
| Goodwill Impairment | - 0 | - 0 | - 0 | - 0 | - 0 | 28306 | - 0 | - 0 | - 0 | - 0 | - 0 | - 0 | - 0 | - 0 | - 0 | - 0 | - 0 | - 0 | - 0 | - 0 | - 0 | - 0 | - 0 | - 0 | - 0 | - 0 | - 0 | - 0 | - 0 | - 0 | - 0 | - 0 | - 0 | - 0 | |||||||||||||||||||||||||||||||||||||||||
| Inventory Rationalization | - 0 | - 0 | - 0 | - 0 | - 0 | 3893 | - 0 | - 0 | - 0 | - 0 | - 0 | - 0 | - 0 | - 0 | - 0 | - 0 | - 0 | - 0 | - 0 | - 0 | - 0 | - 0 | - 0 | - 0 | - 0 | - 0 | - 0 | - 0 | - 0 | - 0 | - 0 | - 0 | - 0 | - 0 | |||||||||||||||||||||||||||||||||||||||||
| Discontinued operation accrual | - 0 | - 0 | - 0 | - 0 | - 0 | - 0 | - 0 | - 0 | - 0 | - 0 | - 0 | - 0 | - 0 | - 0 | - 0 | 340 | - 0 | - 0 | - 0 | 931 | - 0 | - 0 | - 0 | - 0 | - 0 | - 0 | - 0 | - 0 | - 0 | 529 | - 0 | - 0 | - 0 | - 0 | - 0 | 340 | 931 | ||||||||||||||||||||||||||||||||||||||
| North American sales meeting | - 0 | - 0 | - 0 | - 0 | - 0 | - 0 | - 0 | - 0 | 1225 | - 0 | - 0 | - 0 | - 0 | - 0 | - 0 | - 0 | 1889 | - 0 | - 0 | - 0 | - 0 | - 0 | - 0 | - 0 | - 0 | - 0 | - 0 | - 0 | - 0 | - 0 | - 0 | - 0 | - 0 | 1889 | |||||||||||||||||||||||||||||||||||||||||
| Property Impairment Loss | - 0 | - 0 | - 0 | - 0 | - 0 | - 0 | - 0 | - 0 | - 0 | - 0 | - 0 | - 0 | 2914 | 132 | - 0 | - 0 | - 0 | - 0 | - 0 | - 0 | - 0 | - 0 | - 0 | - 0 | - 0 | - 0 | - 0 | - 0 | - 0 | - 0 | - 0 | - 0 | 3046 | - 0 | |||||||||||||||||||||||||||||||||||||||||
| Building Impairment | - 0 | - 0 | - 0 | - 0 | - 0 | - 0 | - 0 | 231 | - 0 | - 0 | - 0 | ||||||||||||||||||||||||||||||||||||||||||||||||||||||||||||||||
| Reg G Adjusted EBITDA | $ 7676 | $ 5470 | $ (232) | $ (3170) | $ (1368) | $ (4871) | $ 1699 | $ 2585 | $ 1352 | $ 2121 | $ 4196 | $ 2351 | $ 2349 | $ 4234 | $ 4342 | $ 2733 | $ 3068 | $ 6390 | $ 5579 | $ 2162 | $ 2458 | $ 3111 | $ 4277 | $ 2219 | $ 2852 | $ 4519 | $ 5443 | $ 3026 | $ 5121 | $ 7749 | $ 7325 | $ 5053 | $ 7457 | $ 9402 | $ 10318 | $ 13658 | $ 17199 | ||||||||||||||||||||||||||||||||||||||
| Adjusted EBITDA of Sales | 97 | 68 | -03 | -46 | -19 | -70 | 25 | 40 | 20 | 31 | 61 | 36 | 34 | 59 | 59 | 39 | 44 | 90 | 79 | 33 | 35 | 45 | 61 | 33 | 38 | 60 | 72 | 38 | 61 | 86 | 83 | 59 | 82 | 98 | 109 | 48 | 62 | ||||||||||||||||||||||||||||||||||||||
| Annual Adjusted EBITDA of Sales | 44 | 58 | |||||||||||||||||||||||||||||||||||||||||||||||||||||||||||||||||||||||||
| Adjusted Operating Income | (3083) | (6437) | (264) | 744 | (709) | (123) | 1829 | (7) | 54 | 2071 | 2182 | 600 | 972 | 4264 | 3460 | (40) | 271 | 885 | 2304 | 539 | 1147 | 2875 | 3852 | 1196 | 3435 | 6070 | 5570 | 3087 | 5979 | 7947 | 8850 | 4907 | 8314 | ||||||||||||||||||||||||||||||||||||||||||
| Consolidated Revenues | |||||||
| 2013 | 269503 | ||||||
| 2014 | 285693 | ||||||
| 2015 | 275834 | ||||||
| 2016 | 276573 | ||||||
| 2017 | 305907 | ||||||
| 2018 | 349637 | ||||||
| TTM 63019 | 362236 | ||||||
| Net Cash(Debt) | |||||||
| 2013 | (15380) | ||||||
| 2014 | 4207 | ||||||
| 2015 | 9840 | ||||||
| 2016 | 9580 | ||||||
| 2017 | (10127) | ||||||
| 2018 | 1060 | ||||||
| 63019 | (1908) | ||||||
| Rep Count | |||||||
| 2013 | 806 | ||||||
| 2014 | 916 | ||||||
| 2015 | 937 | ||||||
| 2016 | 1009 | ||||||
| 2017 | 983 | ||||||
| 2018 | 994 | ||||||
| 63019 | 982 | ||||||
| Adjusted OI | DampA | Adjusted EBITDA | |||||
| 2013 | 990 | 9030 | 10020 | ||||
| 2014 | 4907 | 8751 | 13658 | ||||
| 2015 | 8315 | 8543 | 17199 | ||||
| 2016 | 3388 | 8066 | 12065 | ||||
| 2017 | 15840 | ||||||
| 2018 | 25248 | ||||||
| TTM 63019 | 29237 | ||||||
| Reg G EBITDA By Quarter | |||||||
| Quarter | 2017 | 2018 | 2019 | ||||
| Q1 | 2852 | 5121 | 7457 | ||||
| Q2 | 4519 | 7749 | 9402 | ||||
| Q3 | 5443 | 7325 | |||||
| Q4 | 3026 | 5053 |
| Months of Experience | Average Annual Sales | Number of Reps | |||
| lt 12 Mos | ERRORVALUE | ERRORVALUE | |||
| 1 - 2 Yrs | ERRORVALUE | ERRORVALUE | |||
| 3 - 5 Yrs | ERRORVALUE | ERRORVALUE | |||
| 5 - 10 Yrs | ERRORVALUE | ERRORVALUE | |||
| gt 10 Yrs | ERRORVALUE | ERRORVALUE | |||
| ERRORVALUE | |||||
| Excludes ISR MSS CRS | |||||
| Excludes Freight | |||||
| Product mix | ||||||||
| Verticals | Q2 2019 Sales | |||||||
| Fastening Systems | 243 | 23008646 | ||||||
| Fluid Power | 152 | 14395529 | ||||||
| Specialy Chemicals | 117 | 11074332 | ||||||
| Cutting Tools and Abrasives | 130 | 12319702 | ||||||
| Electrical | 107 | 10102828 | ||||||
| Aftermarket Automotive Supplies | 77 | 7255974 | ||||||
| Safety | 47 | 4458217 | ||||||
| Welding and Metal Repair | 16 | 1539172 | ||||||
| Other | 112 | 10633378 | ||||||
| Total | 100 | 94787779 | ||||||
| Verticals | YTD 2019 Sales | |||||||
| Fastening Systems | 24 | 44125949 | ||||||
| Fluid Power | 15 | 28068352 | ||||||
| Specialy Chemicals | 12 | 21249420 | ||||||
| Cutting Tools and Abrasives | 13 | 24290887 | ||||||
| Electrical | 11 | 20425294 | ||||||
| Aftermarket Automotive Supplies | 8 | 14805874 | ||||||
| Safety | 5 | 8626381 | ||||||
| Welding and Metal Repair | 2 | 3088518 | ||||||
| Other | 10 | 20042457 | ||||||
| Total | 100 | 184723132 |
| Lawson core customer mix | ||||||||
| Account Tyoe | Q2 | |||||||
| Regional Accounts | 44933707 | 47 | ||||||
| Strategic | 13542786 | 14 | ||||||
| Kent Automotive | 14370813 | 15 | ||||||
| Bolt Supply | 11129675 | 12 | ||||||
| Government | 10087561 | 10 | ||||||
| Screw Products | 0 | 0 | ||||||
| Other (1) | 1428268 | 1 | ||||||
| Total | 96097363 | 100 | ||||||
| Account Tyoe | YTD June | |||||||
| Regional Accounts | 88400675 | 47 | ||||||
| Strategic | 26218365 | 14 | ||||||
| Kent Automotive | 29071347 | 16 | ||||||
| Bolt Supply | 20005505 | 11 | ||||||
| Government | 19505323 | 10 | ||||||
| Screw Products | 0 | 0 | ||||||
| Other | 4239066 | 2 | ||||||
| Total | 187440280 | 100 | ||||||
| Total Reported |
| August 2011 | OslashImplemented SAP | ||
| October 2011 | OslashCommenced construction of new McCook Ill distribution center | ||
| May 2012 | OslashRelocated corporate headquarters | ||
| June 2012 | OslashRestructured senior team Announced $20M cost savings plan | ||
| August 2012 | OslashTransitioned packaging facility to McCook Ill distribution center | ||
| OslashEntered into new five-year $40M credit facility | |||
| October 2012 | OslashAnnounced new CEO and President Michael G DeCata | ||
| OslashConsolidated Vernon Hills distribution center into McCook Ill | |||
| November 2012 | OslashRolled out new website to existing web customers | ||
| December 2012 | OslashCompleted transition of US independent agents to employees | ||
| April 2013 | OslashRoll-out of new website to new web customers | ||
| AprilMay 2013 | OslashMcCook DC begins to ship customer orders | ||
| November 2013 | OslashEntered into sub-lease of headquarters space to generate $29M of future cash savings | ||
| December 2013 | OslashEnded year with over 800 sales reps ndash First increase in 8 years | ||
| February 2014 | OslashClosed on Automatic Screw Machine Products sale for net proceeds of $121M | ||
| June 2014 | OslashEntered into sale-leaseback of Reno distribution facility for net proceeds of $83M | ||
| December 2014 | OslashEnded year with over 900 sales reps | ||
| February 2015 | OslashHeld North American sales meeting | ||
| September 2015 | OslashCompleted West Coast Fasteners acquisition | ||
| March 2016 | OslashCompleted Perfect Products of Michigan acquisition | ||
| May 2016 | OslashCompleted F B Feeney acquisition | ||
| June 2016 | OslashExpanded sales team to over 1000 sales reps | ||
| September 2016 | OslashExtended credit facitlity to August 2020 | ||
| November 2016 | OslashCompleted Mattic Industries acquisition | ||
| March 2017 | OslashConsolidated Fairfield NJ distribution operations into McCook Ill and Suwanee GA | ||
| May 2017 | OslashSold Fairfield NJ distribution center for a gain of $54M | ||
| October 2017 | OslashCompleted Bolt Supply House acquisition | ||
| April 2018 | OslashOpened MRO distribution center in Calgary Canada | ||
| October 2018 | OslashCompleted Screw Products acquisition and added Bolt Supply branch | ||
| June 2019 | OslashAchieved Q2 98 adjusted EBITDA net of ASC 842 impact of 03 | ||
| September 2019 | OslashAchieved Q3 109 adjusted EBITDA hired VP MampA | ||
| October 2019 | OslashEntered into new five-year $100M credit facility with additional $50 million accordion feature |
| ($ in thousands) | Q3 2013 | Q4 2013 | Q1 2014 | Q2 2014 | Q3 2014 | Q4 2014 | Q1 2015 | Q2 2015 | Q3 2015 | Q4 2015 | Q1 2016 | Q2 2016 | Q3 2016 | Q4 2016 | Q1 2017 | Q2 2017 | Q3 2017 | Q4 2017 | ||||||||||||||||||||||||||||||||||||||||||||||
| SGampA | 40350 | 42856 | 45991 | 42562 | 43855 | 44764 | 43830 | 40565 | 40532 | 41145 | 41290 | 42497 | 40184 | 45548 | 44167 | 42672 | 44915 | 46750 | $ 173014 | |||||||||||||||||||||||||||||||||||||||||||||
| $ - | ||||||||||||||||||||||||||||||||||||||||||||||||||||||||||||||||
| Excluded Costs | $ - | 40196 | ||||||||||||||||||||||||||||||||||||||||||||||||||||||||||||||
| Severance | (962) | 127 | (728) | (290) | 328 | 59 | (571) | (50) | (372) | (280) | (204) | (143) | (367) | (1662) | (465) | 9 | (139) | (144) | $ (234) | 127 | ||||||||||||||||||||||||||||||||||||||||||||
| Stock Based Compensation (Benefit) | (33) | (562) | (1125) | (408) | (2423) | (2443) | 541 | (971) | 30 | (1693) | 1217 | (515) | 630 | (3801) | 30 | (415) | (2337) | (384) | $ (5296) | -32 | ||||||||||||||||||||||||||||||||||||||||||||
| Loss(Gain) on Disposal of Property | 36 | (32) | - 0 | - 0 | (97) | (45) | - 0 | - 0 | 2 | (9) | - 0 | - 0 | - 0 | - 0 | - 0 | - 0 | - 0 | - 0 | $ (142) | |||||||||||||||||||||||||||||||||||||||||||||
| Legal Settlement | - 0 | - 0 | - 0 | - 0 | 688 | - 0 | - 0 | - 0 | - 0 | - 0 | - 0 | - 0 | - 0 | - 0 | - 0 | - 0 | - 0 | - 0 | $ 688 | -562 | ||||||||||||||||||||||||||||||||||||||||||||
| Employment Tax Matter | - 0 | 400 | - 0 | - 0 | - 0 | - 0 | - 0 | - 0 | - 0 | - 0 | - 0 | - 0 | - 0 | - 0 | - 0 | - 0 | - 0 | - 0 | $ - | 39729 | ||||||||||||||||||||||||||||||||||||||||||||
| Loss on Sub-Lease | - 0 | (2928) | - 0 | - 0 | - 0 | - 0 | - 0 | - 0 | - 0 | - 0 | - 0 | - 0 | - 0 | - 0 | - 0 | - 0 | - 0 | - 0 | $ - | |||||||||||||||||||||||||||||||||||||||||||||
| National sales meeting | - 0 | - 0 | - 0 | - 0 | - 0 | - 0 | (1889) | - 0 | - 0 | - 0 | - 0 | - 0 | - 0 | - 0 | - 0 | - 0 | - 0 | - 0 | $ (1889) | |||||||||||||||||||||||||||||||||||||||||||||
| Remediation expense | - 0 | - 0 | - 0 | - 0 | - 0 | (340) | - 0 | - 0 | - 0 | - 0 | - 0 | - 0 | - 0 | - 0 | - 0 | - 0 | - 0 | - 0 | $ (340) | |||||||||||||||||||||||||||||||||||||||||||||
| Property Impairment Loss | - 0 | - 0 | (2914) | (132) | - 0 | - 0 | - 0 | - 0 | - 0 | - 0 | - 0 | - 0 | - 0 | - 0 | - 0 | - 0 | - 0 | - 0 | $ - | |||||||||||||||||||||||||||||||||||||||||||||
| Adjusted SGampA | $ 39391 | $ 39861 | $ 41224 | $ 41732 | $ 42351 | $ 41995 | $ 41911 | $ 39544 | $ 40192 | $ 39163 | $ 42303 | $ 41839 | $ 40447 | $ 40085 | $ 43732 | $ 42266 | $ 42439 | $ 46222 | $ 165801 | |||||||||||||||||||||||||||||||||||||||||||||
| Annual Adjusted EBITDA of Sales | ERRORREF | ERRORREF | ||||||||||||||||||||||||||||||||||||||||||||||||||||||||||||||
| Q1 2013 | Q2 2013 | Q3 2013 | Q4 2013 | Q1 2014 | Q2 2014 | Q3 2014 | Q4 2014 | Q1 2015 | |||||||||||
| Selling Days | 63 | 64 | 64 | 61 | 63 | 64 | 64 | 61 | 63 | ||||||||||
| Net Sales | 67213 | 68317 | 68235 | 65738 | 69204 | 72080 | 74128 | 70281 | 69904 | ||||||||||
| Average Daily Sales | 1067 | 1067 | 1066 | 1078 | 1098 | 1126 | 1158 | 1152 | 1110 | ||||||||||
| Average Sales Rep Count | 762 | 764 | 774 | 794 | 819 | 854 | 882 | 908 | 911 | ||||||||||
| Sales per Sales Rep per Day | 1400 | 1397 | 1377 | 1358 | 1341 | 1319 | 1313 | 1269 | 1218 | ||||||||||
| Full Year | ||||||||||||||||||||||||||||||||||||||||||||||||||||||||||||||||||||
| ($ in thousands) | Q1 2011 | Q2 2011 | Q3 2011 | Q4 2011 | Q1 2012 | Q2 2012 | Q3 2012 | Q4 2012 | Q1 2013 | Q2 2013 | Q3 2013 | Q4 2013 | Q1 2014 | Q2 2014 | Q3 2014 | Q4 2014 | Q1 2015 | Q2 2015 | Q3 2015 | Q4 2015 | Q1 2016 | Q2 2016 | Q3 2016 | Q4 2016 | Q1 2017 | Q2 2017 | Q3 2017 | Q4 2017 | Q1 2018 | Q2 2018 | Q3 2018 | 2014 | 2015 | |||||||||||||||||||||||||||||||||||
| Net Sales | $ 79255 | $ 80625 | $ 71490 | $ 69029 | $ 71364 | $ 69830 | $ 67863 | $ 64505 | $ 67213 | $ 68317 | $ 68235 | $ 65738 | $ 69204 | $ 72080 | $ 74128 | $ 70281 | $ 69904 | $ 70726 | $ 70243 | $ 64961 | $ 69711 | $ 69348 | $ 70199 | $ 67315 | $ 74617 | $ 75006 | $ 75651 | $ 80633 | $ 84459 | $ 90382 | $ 88530 | $ 285693 | $ 275834 | |||||||||||||||||||||||||||||||||||
| Operating Income (Loss) | 3542 | 1397 | (3480) | (6995) | (3466) | (42084) | (1740) | 2057 | (3530) | (201) | 870 | (3002) | (4713) | 1241 | 678 | (2169) | (947) | 3243 | 2810 | (2985) | 1169 | 29 | 2389 | (5044) | 712 | 7891 | 1090 | 243 | 1837 | 5554 | (2266) | (4963) | 2121 | |||||||||||||||||||||||||||||||||||
| Depreciation amp Amortization | 1260 | 1315 | 1160 | 1675 | 1715 | 1566 | 1963 | 1841 | 2061 | 2244 | 2367 | 2358 | 2295 | 2163 | 2160 | 2133 | 2096 | 2126 | 2119 | 2202 | 2187 | 2226 | 1973 | 1680 | 1705 | 1644 | 1591 | 1830 | 1686 | 1679 | 1755 | 8751 | 8543 | |||||||||||||||||||||||||||||||||||
| EBITDA | 4802 | 2712 | (2320) | (5320) | (1751) | (40518) | 223 | 3898 | (1469) | 2043 | 3237 | (644) | (2418) | 3404 | 2838 | (36) | 1149 | 5369 | 4929 | (783) | 3356 | 2255 | 4362 | (3364) | 2417 | 9535 | 2681 | 2073 | 3523 | 7233 | (511) | 3788 | 10664 | |||||||||||||||||||||||||||||||||||
| Excluded Costs | ||||||||||||||||||||||||||||||||||||||||||||||||||||||||||||||||||||
| Severance | 745 | 465 | 282 | 122 | 185 | 6585 | 1410 | (159) | - 0 | 2 | 962 | (127) | 728 | 290 | (328) | (59) | 571 | 50 | 372 | 280 | 204 | 143 | 367 | 1662 | 465 | (9) | 139 | 144 | 628 | 64 | 31 | 631 | 1273 | |||||||||||||||||||||||||||||||||||
| Stock Based Compensation (Benefit) | 227 | (95) | (538) | 467 | 198 | (1015) | 77 | 434 | 1596 | 76 | 33 | 562 | 1125 | 408 | 2423 | 2443 | (541) | 971 | (30) | 1693 | (1217) | 515 | (630) | 3801 | (30) | 415 | 2337 | 384 | 970 | 87 | 7637 | 6399 | 2093 | |||||||||||||||||||||||||||||||||||
| Acquisition Related Costs | - 0 | - 0 | - 0 | - 0 | - 0 | - 0 | 310 | 32 | 115 | 198 | 178 | 120 | - 0 | - 0 | 286 | 425 | - 0 | - 0 | 168 | |||||||||||||||||||||||||||||||||||||||||||||||||
| ERP Implementation Costs | 1902 | 2388 | 2344 | 339 | - 0 | - 0 | - 0 | - 0 | - 0 | - 0 | - 0 | - 0 | - 0 | - 0 | - 0 | - 0 | - 0 | - 0 | - 0 | - 0 | - 0 | - 0 | - 0 | - 0 | - 0 | - 0 | - 0 | - 0 | - 0 | - 0 | - 0 | - 0 | ||||||||||||||||||||||||||||||||||||
| Loss(Gain) on Disposal of Property | - 0 | - 0 | - 0 | 22 | - 0 | (2122) | (11) | (1588) | - 0 | - 0 | (36) | 32 | - 0 | - 0 | 97 | 45 | - 0 | - 0 | (2) | 9 | - 0 | - 0 | - 0 | - 0 | - 0 | (5422) | - 0 | - 0 | - 0 | - 0 | - 0 | 142 | 7 | |||||||||||||||||||||||||||||||||||
| Legal Settlement | - 0 | - 0 | - 0 | - 0 | - 0 | - 0 | - 0 | - 0 | - 0 | - 0 | - 0 | - 0 | - 0 | - 0 | (688) | - 0 | - 0 | - 0 | - 0 | - 0 | - 0 | - 0 | - 0 | - 0 | - 0 | - 0 | - 0 | - 0 | - 0 | - 0 | - 0 | (688) | - 0 | |||||||||||||||||||||||||||||||||||
| Employment Tax Matter | - 0 | - 0 | - 0 | 1200 | - 0 | - 0 | - 0 | - 0 | - 0 | - 0 | - 0 | (400) | - 0 | - 0 | - 0 | - 0 | - 0 | - 0 | - 0 | - 0 | - 0 | - 0 | - 0 | - 0 | - 0 | - 0 | - 0 | - 0 | - 0 | - 0 | - 0 | - 0 | - 0 | |||||||||||||||||||||||||||||||||||
| Lease termination gain | - 0 | - 0 | - 0 | - 0 | - 0 | - 0 | - 0 | - 0 | - 0 | - 0 | - 0 | 2928 | - 0 | - 0 | - 0 | - 0 | - 0 | - 0 | - 0 | - 0 | - 0 | - 0 | - 0 | - 0 | - 0 | - 0 | - 0 | - 0 | - 0 | (164) | - 0 | - 0 | - 0 | |||||||||||||||||||||||||||||||||||
| Goodwill Impairment | - 0 | - 0 | - 0 | - 0 | - 0 | 28306 | - 0 | - 0 | - 0 | - 0 | - 0 | - 0 | - 0 | - 0 | - 0 | - 0 | - 0 | - 0 | - 0 | - 0 | - 0 | - 0 | - 0 | - 0 | - 0 | - 0 | - 0 | - 0 | - 0 | - 0 | - 0 | - 0 | - 0 | |||||||||||||||||||||||||||||||||||
| Inventory Rationalization | - 0 | - 0 | - 0 | - 0 | - 0 | 3893 | - 0 | - 0 | - 0 | - 0 | - 0 | - 0 | - 0 | - 0 | - 0 | - 0 | - 0 | - 0 | - 0 | - 0 | - 0 | - 0 | - 0 | - 0 | - 0 | - 0 | - 0 | - 0 | - 0 | - 0 | - 0 | - 0 | - 0 | |||||||||||||||||||||||||||||||||||
| Discontinued operation accrual | - 0 | - 0 | - 0 | - 0 | - 0 | - 0 | - 0 | - 0 | - 0 | - 0 | - 0 | - 0 | - 0 | - 0 | - 0 | 340 | - 0 | - 0 | - 0 | 931 | - 0 | - 0 | - 0 | - 0 | - 0 | - 0 | - 0 | - 0 | - 0 | 529 | - 0 | 340 | 931 | |||||||||||||||||||||||||||||||||||
| North American sales meeting | - 0 | - 0 | - 0 | - 0 | - 0 | - 0 | - 0 | - 0 | 1225 | - 0 | - 0 | - 0 | - 0 | - 0 | - 0 | - 0 | 1889 | - 0 | - 0 | - 0 | - 0 | - 0 | - 0 | - 0 | - 0 | - 0 | - 0 | - 0 | - 0 | - 0 | - 0 | - 0 | 1889 | |||||||||||||||||||||||||||||||||||
| Property Impairment Loss | - 0 | - 0 | - 0 | - 0 | - 0 | - 0 | - 0 | - 0 | - 0 | - 0 | - 0 | - 0 | 2914 | 132 | - 0 | - 0 | - 0 | - 0 | - 0 | - 0 | - 0 | - 0 | - 0 | - 0 | - 0 | - 0 | - 0 | - 0 | - 0 | - 0 | - 0 | 3046 | - 0 | |||||||||||||||||||||||||||||||||||
| Adjusted EBITDA | $ 7676 | $ 5470 | $ (232) | $ (3170) | $ (1368) | $ (4871) | $ 1699 | $ 2585 | $ 1352 | $ 2121 | $ 4196 | $ 2351 | $ 2349 | $ 4234 | $ 4342 | $ 2733 | $ 3068 | $ 6390 | $ 5579 | $ 2162 | $ 2458 | $ 3111 | $ 4277 | $ 2219 | $ 2852 | $ 4519 | $ 5443 | $ 3026 | $ 5121 | $ 7749 | $ 7325 | $ 13658 | $ 17199 | |||||||||||||||||||||||||||||||||||
| Adjusted EBITDA of Sales | 97 | 68 | -03 | -46 | -19 | -70 | 25 | 40 | 20 | 31 | 61 | 36 | 34 | 59 | 59 | 39 | 44 | 90 | 79 | 33 | 35 | 45 | 61 | 33 | 38 | 60 | 72 | 38 | 61 | 86 | 83 | 48 | 62 | |||||||||||||||||||||||||||||||||||
| Annual Adjusted EBITDA of Sales | 44 | 58 | ||||||||||||||||||||||||||||||||||||||||||||||||||||||||||||||||||
| Adjusted Operating Income | (3083) | (6437) | (264) | 744 | (709) | (123) | 1829 | (7) | 54 | 2071 | 2182 | 600 | 972 | 4264 | 3460 | (40) | 271 | 885 | 2304 | 539 | 1147 | 2875 | 3852 | 1196 | 3435 | 6070 | 5570 | - 0 | 4907 | 8314 | ||||||||||||||||||||||||||||||||||||||
| Sales | |||
| Broad Based MRO Market | $150000000000 | ||
| Service Based VMI Market | $25000000000 | ||
| 3rd Qtr | 12 | ||
| 4th Qtr | 12 | ||
| To resize chart data range drag lower right corner of range |
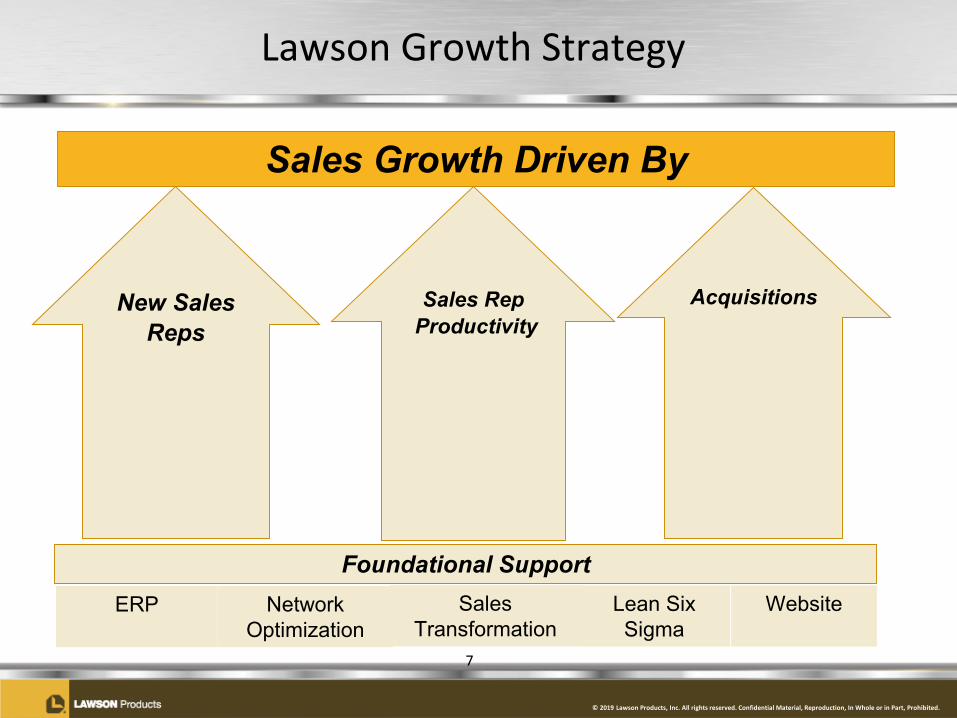
copy 2019 Lawson Products Inc All rights reserved Confidential Material Reproduction In Whole or in Part Prohibited
Our Commitment to our 70000+ Customers
High touch service and technical expertise drives customer relationshipsBefore After
One Company Zero Headaches Inventory Management Options Access to Industry Knowledge amp Expertise
bull Comprehensive line of products bull Lawson Managed Inventory bull Product recommendations from your Lawson Representative
bull Hundreds of pre-built assortments bull Industrial vending bull Application advice from our test and application engineers
bull Unlimited sourcing of hard-to-find items
bull Self-service inventory management
bull Complimentary on-site safety amp product usage training
5
copy 2019 Lawson Products Inc All rights reserved Confidential Material Reproduction In Whole or in Part Prohibited
Customer and Product Profile
6
Retain over 90 of customer revenues from year to year
Fastening Systems
23
Fluid Power15
Specialty Chemicals
12
Cutting Tools and Abrasives
13
Electrical11
Aftermarket Automotive
Supplies8
Safety5
Welding and Metal Repair
2
Other10
Product Mix
Regional Accounts
47
Strategic14
Kent Automotive
15
Bolt Supply11
Government 11
Other2
Customer Mix
copy 2019 Lawson Products Inc All rights reserved Confidential Material Reproduction In Whole or in Part Prohibited
Lawson Growth Strategy
Sales Growth Driven By
Foundational SupportERP Network
OptimizationSales
TransformationLean Six Sigma
Website
7
New Sales Reps
Sales RepProductivity
Acquisitions
copy 2019 Lawson Products Inc All rights reserved Confidential Material Reproduction In Whole or in Part Prohibited
2019 Focus Actions Across the Value Chain Driving Growth
Add New Sales Reps and Drive Rep Productivity
Sales Process Sales Reps
Customer Service Order
Entry
ProductManagement
PricingDC Operations Sourcing
Purchasing
bull Increase sales rep count
bull Onboardingprocesstraining
bull SalesManagement dashboard
bull EDI with customers
bull Reduction of cycle times
bull Order padbull Consolidation of
shipmentsbull Sales service reps
bull Leverage vendor drop-ship programs
bull Fleet maintenance focus
bull Pricing enhancements
bull Website
bull Reduce cycle timebull Refine ldquoPullrdquo
strategybull Freight
enhancementsbull Minimize
backordersbull Improve service
levelsbull Forecasting tool
bull Supplier negotiation process
bull Vendor metricsbull Electronic
communication
Information Technology ndash Integration of Web and SAPLean Six Sigma
8
copy 2019 Lawson Products Inc All rights reserved Confidential Material Reproduction In Whole or in Part Prohibited
Longer Sales Rep Tenure Drives Rep Productivity
9
$0
$50000
$100000
$150000
$200000
$250000
$300000
$350000
$400000
$450000
$500000
lt 12 Mos 1 - 2 Yrs 3 - 5 Yrs 5 - 10 Yrs gt 10 Yrs0
50
100
150
200
250
300
350
Aver
age
Annu
al S
ales
Tenure With Lawson (as of 93019)
Num
ber O
f Sal
es R
eps
Number of Reps Average Annual Sales
copy 2019 Lawson Products Inc All rights reserved Confidential Material Reproduction In Whole or in Part Prohibited
Historical Financial Performance
Recent sales growth and earnings expansion providing financial flexibility
10
$200000
$250000
$300000
$350000
$400000
2014 2015 2016 2017 2018 TTM93019
Consolidated Revenues
$0$5000
$10000$15000$20000$25000$30000$35000
2014 2015 2016 2017 2018 TTM93019
Adjusted Reg G EBITDA
-$15000
-$10000
-$5000
$0
$5000
$10000
$15000
2014 2015 2016 2017 2018 9302019
Net Cash(Debt)
$0
$2000
$4000
$6000
$8000
$10000
$12000
Q1 Q2 Q3 Q4
Quarterly Adjusted Reg G EBITDA
2017
20172017
2017
2018
20182018
2018
20192019
2019
copy 2019 Lawson Products Inc All rights reserved Confidential Material Reproduction In Whole or in Part Prohibited
Financial Highlights for Third Quarter 2019
bull Sales increased 71 YOY (74 excluding currency fluctuation)
bull MRO LawsonKent gross margins consistent at 609
bull Adjusted Reg G EBITDA margin improving 109 in Q3 2019 v 83 in Q3 2018 Continued investment in new sales reps and rep productivity
bull Key trends MRO operating leverage of 54 13 increase in sales rep productivity Continued government strength +30 YOY Growth across multiple segments and product categories Cash flow from operations of $103 million in Q3
11
copy 2019 Lawson Products Inc All rights reserved Confidential Material Reproduction In Whole or in Part Prohibited
Pursue Disciplined MampA
Reinvest for Growth
Return Capital
bull Increased our borrowing capacity to $1000 million (additional $500 million accordion) with our new borrowing agreement
bull Capital expenditures expected to be $20 - $30 million in 2019bull Growth initiatives add new reps and increase sales rep productivity
bull Share repurchase to offset award dilution opportunistic purchasesbull $75 million stock repurchase program announced on May 16 2019 $63
million remaining after repurchase of shares worth $12 million in August 2019
bull Bolt-on acquisitions to enhance core growth strategiesbull Closed Screw Products Inc acquisition on 10118
Maintain Strong Balance Sheet
bull $86 million cash on hand and positive cash position of $64 million at the end of Q3
bull Consistent free cash flow generation
Capital Allocation Priorities
12
copy 2019 Lawson Products Inc All rights reserved Confidential Material Reproduction In Whole or in Part Prohibited
Lawson Products Poised for Growth
bull Leverage Current Infrastructure
bull Continued Sales Growth
bull Foundational Investments Completed
bull Operational Excellence
bull Large Fragmented Market
13
copy 2019 Lawson Products Inc All rights reserved Confidential Material Reproduction In Whole or in Part Prohibited
For More Information
Contact
Ronald J KnutsonEVP CFOInvestor Relations(773) 304-5665ronknutsonlawsonproductscom
And see our Website athttpwwwlawsonproductscomcompany-infoinvestor-relationsjsp
14
copy 2019 Lawson Products Inc All rights reserved Confidential Material Reproduction In Whole or in Part Prohibited
Appendices
15
copy 2019 Lawson Products Inc All rights reserved Confidential Material Reproduction In Whole or in Part Prohibited
Significant Activities
16
Appendix P-1
August 2011 Implemented SAPOctober 2011 Commenced construction of new McCook Ill distribution center
May 2012 Relocated corporate headquartersJune 2012 Restructured senior team Announced $20M cost savings plan
Transitioned packaging facility to McCook Ill distribution centerEntered into new five-year $40M credit facilityAnnounced new CEO and President Michael G DeCataConsolidated Vernon Hills distribution center into McCook Ill
November 2012 Rolled out new website to existing web customersDecember 2012 Completed transition of US independent agents to employees
April 2013 Roll-out of new website to new web customersAprilMay 2013 McCook DC begins to ship customer ordersNovember 2013 Entered into sub-lease of headquarters space to generate $29M of future cash savingsDecember 2013 Ended year with over 800 sales reps ndash First increase in 8 yearsFebruary 2014 Closed on Automatic Screw Machine Products sale for net proceeds of $121M
June 2014 Entered into sale-leaseback of Reno distribution facility for net proceeds of $83MDecember 2014 Ended year with over 900 sales repsFebruary 2015 Held North American sales meeting
September 2015 Completed West Coast Fasteners acquisitionMarch 2016 Completed Perfect Products of Michigan acquisitionMay 2016 Completed F B Feeney acquisitionJune 2016 Expanded sales team to over 1000 sales reps
September 2016 Extended credit facitlity to August 2020November 2016 Completed Mattic Industries acquisition
March 2017 Consolidated Fairfield NJ distribution operations into McCook Ill and Suwanee GAMay 2017 Sold Fairfield NJ distribution center for a gain of $54M
October 2017 Completed Bolt Supply House acquisitionApril 2018 Opened MRO distribution center in Calgary Canada
October 2018 Completed Screw Products acquisition and added Bolt Supply branchJune 2019 Achieved Q2 98 adjusted EBITDA net of ASC 842 impact of 03
September 2019 Achieved Q3 109 adjusted EBITDA hired VP MampAOctober 2019 Entered into new five-year $100M credit facility with additional $50 million accordion feature
August 2012
October 2012
Adjusted EBITDA $ in 000s
Adjusted EBITDA Q4 2016Q1 2017Q2 2017Q3 2017Q4 201722192852451954433026
Adjusted EBITDA of Sales
Adjusted EBITDA of SalesQ3 2016Q4 2016Q1 2017Q2 2017Q3 2017Q4 201760926793828971926E-232964421005719377E-23822185292895721E-260248513452257152E-271948817596594883E-237528059231332088E-2
Adjusted Operating Income of Sales
Adjusted Operating IncomeQ3 2016Q4 2016Q1 2017Q2 2017Q3 2017Q4 201723045391147287538521196
Adjusted Op Inc $ in 000s
Adjusted EBITDA Q4 2016Q1 2017Q2 2017Q3 2017Q4 20175391147287538521196
Net Sales by Quarter $ in 000s
Net SalesQ1 2013Q2 2013Q3 2013Q4 2013Q1 2014Q2 2014Q3 2014Q4 2014Q1 2015672136831768235657386920472080741287028169904
Adjusted SGampA $ in 000s
Adjusted SGampA Q4 2015Q1 2016Q2 2016Q3 2016Q4 2016Q1 2017Q2 2017Q3 2017Q4 2017391634230341839404474008543732422664243946222
copy 2019 Lawson Products Inc All rights reserved Confidential Material Reproduction In Whole or in Part Prohibited
Regulation G ndash GAAP ReconciliationAppendix P-2
Non GAAP Reconciliation of Adjusted EBITDA to Sales Percentage
The Company reports its financial results in accordance with US generally accepted accounting principles (GAAP) However the Companys management believesthat certain non-GAAP financial measures may provide users of this financial information additional meaningful comparisons between current results and results inprior operating periods Management believes that these non-GAAP financial measures can provide additional meaningful reflection of underlying trends of thebusiness because they provide a comparison of historical information that excludes certain non-operational non-recurring or intermittently recurring items thatimpact the overall comparability See the table below for supplemental financial data and corresponding reconciliations to GAAP financial measures for quarterlyadjusted EBITDA as a percentage of net sales Non-GAAP financial measures should be viewed in addition to and not as an alternative for the Companys reportedresults prepared in accordance with GAAP
17
($ in thousands) Q1 2017 Q2 2017 Q3 2017 Q4 2017 Q1 2018 Q2 2018 Q3 2018 Q4 2018 Q1 2019 Q2 2019 Q3 2019
Net Sales 74617$ 75006$ 75651$ 80633$ 84459$ 90382$ 88530$ 86266$ 91343$ 96097$ 94779$
Operating Income (Loss) 712 7891 1090 243 1837 5554 (2266) 4085 5544 1623 6446 Depreciation amp Amortization 1705 1644 1591 1830 1686 1679 1755 1735 1478 1455 1468 EBITDA 2417 9535 2681 2073 3523 7233 (511) 5820 7022 3078 7914
Excluded CostsSeverance 465 (9) 139 144 628 64 31 126 27 1485 30 Stock Based Compensation (Benefit) (30) 415 2337 384 970 87 7637 (1186) 408 4839 2374 Acquisition Related Costs - - 286 425 - - 168 62 - - - Loss(Gain) on Disposal of Property - (5422) - - - - - - - - - Lease termination gain - - - - - (164) - - - - - Discontinued operation accrual - - - - - 529 - - - - - Building Impairment - - - - - - - 231 - - - Reg G Adjusted EBITDA 2852$ 4519$ 5443$ 3026$ 5121$ 7749$ 7325$ 5053$ 7457$ 9402$ 10318$
Adjusted EBITDA of Sales 38 60 72 38 61 86 83 59 82 98 109
Customer Mix
Regional Accounts48
Kent Automotive16
Regional AccountsStrategicKent AutomotiveBolt SupplyGovernment Screw ProductsOther047014000000000000001016011010002
ampDampF ampA
Product Mix
Fastening Systems23
Specialty Chemicals12
Fastening SystemsFluid PowerSpecialy ChemicalsCutting Tools and AbrasivesElectricalAftermarket Automotive SuppliesSafetyWelding and Metal RepairOther02401501201301100800500201
Number Of Sales Reps
Tenure With Lawson (as of 63019)
Average Annual Sales
Consolidated Revenues
Consolidated Revenues20142015201620172018TTM 63019285693275834276573305907349637362236Net Cash(Debt)2014201520162017201843646420798409580-101271060-1908Rep Count201320142015201620172018436468069169371009983994982
Adjusted Reg G EBITDA
Adjusted EBITDA20142015201620172018TTM 63019136581719912065158402524829237
Quarterly Adjusted Reg G EBITDA
2017Q1Q2Q3Q428524519544330262018Q1Q2Q3Q451217749732550532019Q1Q2Q3Q474579402
Adjusted EBITDA $ in 000s
Reg G Adjusted EBITDA Q1 2017Q2 2017Q3 2017Q4 20172852451954433026
Adjusted EBITDA of Sales
Adjusted EBITDA of SalesQ1 2017Q2 2017Q3 2017Q4 20173822185292895721E-260248513452257152E-271948817596594883E-237528059231332088E-2
Adjusted Operating Income of Sales
Adjusted Operating IncomeQ1 2017Q2 2017Q3 2017Q4 2017
Adjusted Op Inc $ in 000s
Reg G Adjusted EBITDA Q1 2017Q2 2017Q3 2017Q4 2017
copy 2019 Lawson Products Inc All rights reserved Confidential Material Reproduction In Whole or in Part Prohibited
Consolidated Balance Sheet Appendix P-4
18
ASSETSCurrent assetsCash and cash equivalents $ 8626 $ 11883Restricted cash 800 800Accounts receivable less allowance for doubtful accounts of $614 and $549 respectively
45162 37682
Inventories net 54894 52887Miscellaneous receivables and prepaid expenses 4270 3653Total current assets 113752 106905
Property plant and equipment net 16932 23548Deferred income taxes 17372 20592Goodwill 20582 20079Cash value of life insurance 14440 12599Intangible assets net 12468 13112Lease assets 11917 mdashOther assets 275 307Total assets $ 207738 $ 197142
LIABILITIES AND STOCKHOLDERSrsquo EQUITYCurrent liabilitiesRevolving lines of credit $ 2195 $ 10823Accounts payable 16325 15207Lease obligation 3781 mdashAccrued expenses and other liabilities 37873 40179Total current liabilities 60174 66209
Security bonus plan 11969 12413Lease obligation 10360 5213Deferred compensation 5915 5304Deferred tax liability 2879 2761Other liabilities 3460 6069Total liabilities 94757 97969
Stockholdersrsquo equityPreferred stock $1 par valueAuthorized - 500000 shares Issued and outstanding mdash None mdash mdashCommon stock $1 par value
Authorized - 35000000 sharesIssued - 9042597 and 9005716 shares respectivelyOutstanding - 8956981 and 8955930 shares respectively
Capital in excess of par value 17626 15623Retained earnings 89502 77338Treasury stock ndash 85616 and 49786 shares respectivelyAccumulated other comprehensive lossTotal stockholdersrsquo equity 112981 99173Total liabilities and stockholdersrsquo equity $ 207738 $ 197142
September 30 December 312019 2018
(Unaudited)
(2595) (1234)(595) (1560)
9043 9006
Customer Mix
Regional Accounts48
Kent Automotive16
Regional AccountsStrategicKent AutomotiveBolt SupplyGovernment Screw ProductsOther0470140000000000000010150110110002
ampDampF ampA
Product Mix
Fastening Systems23
Specialty Chemicals12
Fastening SystemsFluid PowerSpecialy ChemicalsCutting Tools and AbrasivesElectricalAftermarket Automotive SuppliesSafetyWelding and Metal RepairOther02401501201301100800500201
Number Of Sales Reps
Tenure With Lawson (as of 63019)
Average Annual Sales
Consolidated Revenues
Consolidated Revenues20142015201620172018TTM 93019285693275834276573305907349637368485Net Cash(Debt)2014201520162017201843738420798409580-1012710606431Rep Count201320142015201620172018437388069169371009983994993
Adjusted Reg G EBITDA
Adjusted EBITDA20142015201620172018TTM 93019136581719912065158402524832230
Quarterly Adjusted Reg G EBITDA
2017Q1Q2Q3Q428524519544330262018Q1Q2Q3Q451217749732550532019Q1Q2Q3Q47457940210318
Adjusted EBITDA $ in 000s
Reg G Adjusted EBITDA Q1 2017Q2 2017Q3 2017Q4 20172852451954433026
Adjusted EBITDA of Sales
Adjusted EBITDA of SalesQ1 2017Q2 2017Q3 2017Q4 20173822185292895721E-260248513452257152E-271948817596594883E-237528059231332088E-2
Adjusted Operating Income of Sales
Adjusted Operating IncomeQ1 2017Q2 2017Q3 2017Q4 2017
Adjusted Op Inc $ in 000s
Reg G Adjusted EBITDA Q1 2017Q2 2017Q3 2017Q4 2017
| September 30 | December 31 | ||||||||||
| 2019 | 2018 | ||||||||||
| ASSETS | (Unaudited) | ||||||||||
| Current assets | |||||||||||
| Cash and cash equivalents | $ | 8626 | $ | 11883 | |||||||
| Restricted cash | 800 | 800 | |||||||||
| Accounts receivable less allowance for doubtful accounts of $614 and $549 respectively | 45162 | 37682 | |||||||||
| Inventories net | 54894 | 52887 | |||||||||
| Miscellaneous receivables and prepaid expenses | 4270 | 3653 | |||||||||
| Total current assets | 113752 | 106905 | |||||||||
| Property plant and equipment net | 16932 | 23548 | |||||||||
| Deferred income taxes | 17372 | 20592 | |||||||||
| Goodwill | 20582 | 20079 | |||||||||
| Cash value of life insurance | 14440 | 12599 | |||||||||
| Intangible assets net | 12468 | 13112 | |||||||||
| Lease assets | 11917 | mdash | |||||||||
| Other assets | 275 | 307 | |||||||||
| Total assets | $ | 207738 | $ | 197142 | |||||||
| LIABILITIES AND STOCKHOLDERSrsquo EQUITY | |||||||||||
| Current liabilities | |||||||||||
| Revolving lines of credit | $ | 2195 | $ | 10823 | |||||||
| Accounts payable | 16325 | 15207 | |||||||||
| Lease obligation | 3781 | mdash | |||||||||
| Accrued expenses and other liabilities | 37873 | 40179 | |||||||||
| Total current liabilities | 60174 | 66209 | |||||||||
| Security bonus plan | 11969 | 12413 | |||||||||
| Lease obligation | 10360 | 5213 | |||||||||
| Deferred compensation | 5915 | 5304 | |||||||||
| Deferred tax liability | 2879 | 2761 | |||||||||
| Other liabilities | 3460 | 6069 | |||||||||
| Total liabilities | 94757 | 97969 | |||||||||
| Stockholdersrsquo equity | |||||||||||
| Preferred stock $1 par value | |||||||||||
| Authorized - 500000 shares Issued and outstanding mdash None | mdash | mdash | |||||||||
| Common stock $1 par value | |||||||||||
| Authorized - 35000000 shares | 9043 | 9006 | |||||||||
| Issued - 9042597 and 9005716 shares respectively | |||||||||||
| Outstanding - 8956981 and 8955930 shares respectively | |||||||||||
| Capital in excess of par value | 17626 | 15623 | |||||||||
| Retained earnings | 89502 | 77338 | |||||||||
| Treasury stock ndash 85616 and 49786 shares respectively | (2595) | (1234) | |||||||||
| Accumulated other comprehensive loss | (595) | (1560) | |||||||||
| Total stockholdersrsquo equity | 112981 | 99173 | |||||||||
| Total liabilities and stockholdersrsquo equity | $ | 207738 | $ | 197142 | |||||||
| Three Months Ended | |||||||||||||||||||||||||||||
| Jun 30 2019 | Mar 31 2019 | Dec 31 2018 | Sep 30 2018 | Jun 30 2018 | |||||||||||||||||||||||||
| Average daily net sales | $ | 1502 | $ | 1450 | $ | 1414 | $ | 1405 | $ | 1412 | |||||||||||||||||||
| Year over year increase | 63 | 82 | 70 | 170 | 205 | ||||||||||||||||||||||||
| Sequential quarter increase (decrease) | 36 | 25 | 06 | (05) | 53 | ||||||||||||||||||||||||
| Net Sales | $ | 96097 | $ | 91343 | $ | 86266 | $ | 88530 | $ | 90382 | |||||||||||||||||||
| Gross profit (1) | 51043 | 48923 | 46083 | 48108 | 49131 | ||||||||||||||||||||||||
| Gross profit percentage (1) | 531 | 536 | 534 | 543 | 544 | ||||||||||||||||||||||||
| Selling general amp administrative expenses | $ | 49420 | $ | 43379 | $ | 41998 | $ | 50374 | $ | 43577 | |||||||||||||||||||
| Operating income (loss) | $ | 1623 | $ | 5544 | $ | 4085 | $ | (2266) | $ | 5554 | |||||||||||||||||||
| Full Year | |||||||||||||||||||||||||||||||||||||||||||||||||||||||||||||||||||||||||||
| ($ in thousands) | Q1 2011 | Q2 2011 | Q3 2011 | Q4 2011 | Q1 2012 | Q2 2012 | Q3 2012 | Q4 2012 | Q1 2013 | Q2 2013 | Q3 2013 | Q4 2013 | Q1 2014 | Q2 2014 | Q3 2014 | Q4 2014 | Q1 2015 | Q2 2015 | Q3 2015 | Q4 2015 | Q1 2016 | Q2 2016 | Q3 2016 | Q4 2016 | Q1 2017 | Q2 2017 | Q3 2017 | Q4 2017 | Q1 2018 | Q2 2018 | Q3 2018 | Q4 2018 | Q1 2019 | Q2 2019 | Q3 2019 | 2014 | 2015 | ||||||||||||||||||||||||||||||||||||||
| Net Sales | $ 79255 | $ 80625 | $ 71490 | $ 69029 | $ 71364 | $ 69830 | $ 67863 | $ 64505 | $ 67213 | $ 68317 | $ 68235 | $ 65738 | $ 69204 | $ 72080 | $ 74128 | $ 70281 | $ 69904 | $ 70726 | $ 70243 | $ 64961 | $ 69711 | $ 69348 | $ 70199 | $ 67315 | $ 74617 | $ 75006 | $ 75651 | $ 80633 | $ 84459 | $ 90382 | $ 88530 | $ 86266 | $ 91343 | $ 96097 | $ 94779 | $ 285693 | $ 275834 | ||||||||||||||||||||||||||||||||||||||
| Operating Income (Loss) | 3542 | 1397 | (3480) | (6995) | (3466) | (42084) | (1740) | 2057 | (3530) | (201) | 870 | (3002) | (4713) | 1241 | 678 | (2169) | (947) | 3243 | 2810 | (2985) | 1169 | 29 | 2389 | (5044) | 712 | 7891 | 1090 | 243 | 1837 | 5554 | (2266) | 4085 | 5544 | 1623 | 6446 | (4963) | 2121 | ||||||||||||||||||||||||||||||||||||||
| Depreciation amp Amortization | 1260 | 1315 | 1160 | 1675 | 1715 | 1566 | 1963 | 1841 | 2061 | 2244 | 2367 | 2358 | 2295 | 2163 | 2160 | 2133 | 2096 | 2126 | 2119 | 2202 | 2187 | 2226 | 1973 | 1680 | 1705 | 1644 | 1591 | 1830 | 1686 | 1679 | 1755 | 1735 | 1478 | 1455 | 1468 | 8751 | 8543 | ||||||||||||||||||||||||||||||||||||||
| EBITDA | 4802 | 2712 | (2320) | (5320) | (1751) | (40518) | 223 | 3898 | (1469) | 2043 | 3237 | (644) | (2418) | 3404 | 2838 | (36) | 1149 | 5369 | 4929 | (783) | 3356 | 2255 | 4362 | (3364) | 2417 | 9535 | 2681 | 2073 | 3523 | 7233 | (511) | 5820 | 7022 | 3078 | 7914 | 3788 | 10664 | ||||||||||||||||||||||||||||||||||||||
| Excluded Costs | |||||||||||||||||||||||||||||||||||||||||||||||||||||||||||||||||||||||||||
| Severance | 745 | 465 | 282 | 122 | 185 | 6585 | 1410 | (159) | - 0 | 2 | 962 | (127) | 728 | 290 | (328) | (59) | 571 | 50 | 372 | 280 | 204 | 143 | 367 | 1662 | 465 | (9) | 139 | 144 | 628 | 64 | 31 | 126 | 27 | 1485 | 30 | 631 | 1273 | ||||||||||||||||||||||||||||||||||||||
| Stock Based Compensation (Benefit) | 227 | (95) | (538) | 467 | 198 | (1015) | 77 | 434 | 1596 | 76 | 33 | 562 | 1125 | 408 | 2423 | 2443 | (541) | 971 | (30) | 1693 | (1217) | 515 | (630) | 3801 | (30) | 415 | 2337 | 384 | 970 | 87 | 7637 | (1186) | 408 | 4839 | 2374 | 6399 | 2093 | ||||||||||||||||||||||||||||||||||||||
| Acquisition Related Costs | - 0 | - 0 | - 0 | - 0 | - 0 | - 0 | 310 | 32 | 115 | 198 | 178 | 120 | - 0 | - 0 | 286 | 425 | - 0 | - 0 | 168 | 62 | - 0 | - 0 | - 0 | ||||||||||||||||||||||||||||||||||||||||||||||||||||
| ERP Implementation Costs | 1902 | 2388 | 2344 | 339 | - 0 | - 0 | - 0 | - 0 | - 0 | - 0 | - 0 | - 0 | - 0 | - 0 | - 0 | - 0 | - 0 | - 0 | - 0 | - 0 | - 0 | - 0 | - 0 | - 0 | - 0 | - 0 | - 0 | - 0 | - 0 | - 0 | - 0 | - 0 | - 0 | ||||||||||||||||||||||||||||||||||||||||||
| Loss(Gain) on Disposal of Property | - 0 | - 0 | - 0 | 22 | - 0 | (2122) | (11) | (1588) | - 0 | - 0 | (36) | 32 | - 0 | - 0 | 97 | 45 | - 0 | - 0 | (2) | 9 | - 0 | - 0 | - 0 | - 0 | - 0 | (5422) | - 0 | - 0 | - 0 | - 0 | - 0 | - 0 | - 0 | - 0 | - 0 | 142 | 7 | ||||||||||||||||||||||||||||||||||||||
| Legal Settlement | - 0 | - 0 | - 0 | - 0 | - 0 | - 0 | - 0 | - 0 | - 0 | - 0 | - 0 | - 0 | - 0 | - 0 | (688) | - 0 | - 0 | - 0 | - 0 | - 0 | - 0 | - 0 | - 0 | - 0 | - 0 | - 0 | - 0 | - 0 | - 0 | - 0 | - 0 | - 0 | (688) | - 0 | |||||||||||||||||||||||||||||||||||||||||
| Employment Tax Matter | - 0 | - 0 | - 0 | 1200 | - 0 | - 0 | - 0 | - 0 | - 0 | - 0 | - 0 | (400) | - 0 | - 0 | - 0 | - 0 | - 0 | - 0 | - 0 | - 0 | - 0 | - 0 | - 0 | - 0 | - 0 | - 0 | - 0 | - 0 | - 0 | - 0 | - 0 | - 0 | - 0 | - 0 | |||||||||||||||||||||||||||||||||||||||||
| Lease termination gain | - 0 | - 0 | - 0 | - 0 | - 0 | - 0 | - 0 | - 0 | - 0 | - 0 | - 0 | 2928 | - 0 | - 0 | - 0 | - 0 | - 0 | - 0 | - 0 | - 0 | - 0 | - 0 | - 0 | - 0 | - 0 | - 0 | - 0 | - 0 | - 0 | (164) | - 0 | - 0 | - 0 | - 0 | - 0 | - 0 | - 0 | ||||||||||||||||||||||||||||||||||||||
| Goodwill Impairment | - 0 | - 0 | - 0 | - 0 | - 0 | 28306 | - 0 | - 0 | - 0 | - 0 | - 0 | - 0 | - 0 | - 0 | - 0 | - 0 | - 0 | - 0 | - 0 | - 0 | - 0 | - 0 | - 0 | - 0 | - 0 | - 0 | - 0 | - 0 | - 0 | - 0 | - 0 | - 0 | - 0 | - 0 | |||||||||||||||||||||||||||||||||||||||||
| Inventory Rationalization | - 0 | - 0 | - 0 | - 0 | - 0 | 3893 | - 0 | - 0 | - 0 | - 0 | - 0 | - 0 | - 0 | - 0 | - 0 | - 0 | - 0 | - 0 | - 0 | - 0 | - 0 | - 0 | - 0 | - 0 | - 0 | - 0 | - 0 | - 0 | - 0 | - 0 | - 0 | - 0 | - 0 | - 0 | |||||||||||||||||||||||||||||||||||||||||
| Discontinued operation accrual | - 0 | - 0 | - 0 | - 0 | - 0 | - 0 | - 0 | - 0 | - 0 | - 0 | - 0 | - 0 | - 0 | - 0 | - 0 | 340 | - 0 | - 0 | - 0 | 931 | - 0 | - 0 | - 0 | - 0 | - 0 | - 0 | - 0 | - 0 | - 0 | 529 | - 0 | - 0 | - 0 | - 0 | - 0 | 340 | 931 | ||||||||||||||||||||||||||||||||||||||
| North American sales meeting | - 0 | - 0 | - 0 | - 0 | - 0 | - 0 | - 0 | - 0 | 1225 | - 0 | - 0 | - 0 | - 0 | - 0 | - 0 | - 0 | 1889 | - 0 | - 0 | - 0 | - 0 | - 0 | - 0 | - 0 | - 0 | - 0 | - 0 | - 0 | - 0 | - 0 | - 0 | - 0 | - 0 | 1889 | |||||||||||||||||||||||||||||||||||||||||
| Property Impairment Loss | - 0 | - 0 | - 0 | - 0 | - 0 | - 0 | - 0 | - 0 | - 0 | - 0 | - 0 | - 0 | 2914 | 132 | - 0 | - 0 | - 0 | - 0 | - 0 | - 0 | - 0 | - 0 | - 0 | - 0 | - 0 | - 0 | - 0 | - 0 | - 0 | - 0 | - 0 | - 0 | 3046 | - 0 | |||||||||||||||||||||||||||||||||||||||||
| Building Impairment | - 0 | - 0 | - 0 | - 0 | - 0 | - 0 | - 0 | 231 | - 0 | - 0 | - 0 | ||||||||||||||||||||||||||||||||||||||||||||||||||||||||||||||||
| Reg G Adjusted EBITDA | $ 7676 | $ 5470 | $ (232) | $ (3170) | $ (1368) | $ (4871) | $ 1699 | $ 2585 | $ 1352 | $ 2121 | $ 4196 | $ 2351 | $ 2349 | $ 4234 | $ 4342 | $ 2733 | $ 3068 | $ 6390 | $ 5579 | $ 2162 | $ 2458 | $ 3111 | $ 4277 | $ 2219 | $ 2852 | $ 4519 | $ 5443 | $ 3026 | $ 5121 | $ 7749 | $ 7325 | $ 5053 | $ 7457 | $ 9402 | $ 10318 | $ 13658 | $ 17199 | ||||||||||||||||||||||||||||||||||||||
| Adjusted EBITDA of Sales | 97 | 68 | -03 | -46 | -19 | -70 | 25 | 40 | 20 | 31 | 61 | 36 | 34 | 59 | 59 | 39 | 44 | 90 | 79 | 33 | 35 | 45 | 61 | 33 | 38 | 60 | 72 | 38 | 61 | 86 | 83 | 59 | 82 | 98 | 109 | 48 | 62 | ||||||||||||||||||||||||||||||||||||||
| Annual Adjusted EBITDA of Sales | 44 | 58 | |||||||||||||||||||||||||||||||||||||||||||||||||||||||||||||||||||||||||
| Adjusted Operating Income | (3083) | (6437) | (264) | 744 | (709) | (123) | 1829 | (7) | 54 | 2071 | 2182 | 600 | 972 | 4264 | 3460 | (40) | 271 | 885 | 2304 | 539 | 1147 | 2875 | 3852 | 1196 | 3435 | 6070 | 5570 | 3087 | 5979 | 7947 | 8850 | 4907 | 8314 | ||||||||||||||||||||||||||||||||||||||||||
| Consolidated Revenues | |||||||
| 2013 | 269503 | ||||||
| 2014 | 285693 | ||||||
| 2015 | 275834 | ||||||
| 2016 | 276573 | ||||||
| 2017 | 305907 | ||||||
| 2018 | 349637 | ||||||
| TTM 93019 | 368485 | ||||||
| Net Cash(Debt) | |||||||
| 2013 | (15380) | ||||||
| 2014 | 4207 | ||||||
| 2015 | 9840 | ||||||
| 2016 | 9580 | ||||||
| 2017 | (10127) | ||||||
| 2018 | 1060 | ||||||
| 93019 | 6431 | ||||||
| Rep Count | |||||||
| 2013 | 806 | ||||||
| 2014 | 916 | ||||||
| 2015 | 937 | ||||||
| 2016 | 1009 | ||||||
| 2017 | 983 | ||||||
| 2018 | 994 | ||||||
| 93019 | 993 | ||||||
| Adjusted OI | DampA | Adjusted EBITDA | |||||
| 2013 | 990 | 9030 | 10020 | ||||
| 2014 | 4907 | 8751 | 13658 | ||||
| 2015 | 8315 | 8543 | 17199 | ||||
| 2016 | 3388 | 8066 | 12065 | ||||
| 2017 | 15840 | ||||||
| 2018 | 25248 | ||||||
| TTM 93019 | 32230 | ||||||
| Reg G EBITDA By Quarter | |||||||
| Quarter | 2017 | 2018 | 2019 | ||||
| Q1 | 2852 | 5121 | 7457 | ||||
| Q2 | 4519 | 7749 | 9402 | ||||
| Q3 | 5443 | 7325 | 10318 | ||||
| Q4 | 3026 | 5053 |
| Months of Experience | Average Annual Sales | Number of Reps | |||
| lt 12 Mos | ERRORVALUE | ERRORVALUE | |||
| 1 - 2 Yrs | ERRORVALUE | ERRORVALUE | |||
| 3 - 5 Yrs | ERRORVALUE | ERRORVALUE | |||
| 5 - 10 Yrs | ERRORVALUE | ERRORVALUE | |||
| gt 10 Yrs | ERRORVALUE | ERRORVALUE | |||
| ERRORVALUE | |||||
| Excludes ISR MSS CRS | |||||
| Excludes Freight | |||||
| Product mix | ||||||||
| Verticals | Q3 2019 Sales | |||||||
| Fastening Systems | 240 | 22485606 | ||||||
| Fluid Power | 151 | 14156064 | ||||||
| Specialy Chemicals | 117 | 10917433 | ||||||
| Cutting Tools and Abrasives | 131 | 12296596 | ||||||
| Electrical | 104 | 9724849 | ||||||
| Aftermarket Automotive Supplies | 76 | 7154688 | ||||||
| Safety | 47 | 4445846 | ||||||
| Welding and Metal Repair | 13 | 1218030 | ||||||
| Other | 120 | 11237322 | ||||||
| Total | 100 | 93636434 | ||||||
| Verticals | YTD 2019 Sales | |||||||
| Fastening Systems | 24 | 66611555 | ||||||
| Fluid Power | 15 | 42224416 | ||||||
| Specialy Chemicals | 12 | 32166853 | ||||||
| Cutting Tools and Abrasives | 13 | 36587482 | ||||||
| Electrical | 11 | 30150144 | ||||||
| Aftermarket Automotive Supplies | 8 | 21960561 | ||||||
| Safety | 5 | 13072228 | ||||||
| Welding and Metal Repair | 2 | 4306548 | ||||||
| Other | 10 | 31279779 | ||||||
| Total | 100 | 278359566 |
| Lawson core customer mix | ||||||||
| Account Tyoe | Q3 | |||||||
| Regional Accounts | 43045893 | 45 | ||||||
| Strategic | 14086813 | 15 | ||||||
| Kent Automotive | 14300065 | 15 | ||||||
| Bolt Supply | 11318703 | 12 | ||||||
| Government | 10291732 | 11 | ||||||
| Screw Products | 0 | 0 | ||||||
| Other (1) | 1735236 | 2 | ||||||
| Total | 94778443 | 100 | ||||||
| Account Tyoe | YTD September | |||||||
| Regional Accounts | 131389537 | 47 | ||||||
| Strategic | 40364305 | 14 | ||||||
| Kent Automotive | 43371411 | 15 | ||||||
| Bolt Supply | 31324209 | 11 | ||||||
| Government | 29794959 | 11 | ||||||
| Screw Products | 0 | 0 | ||||||
| Other | 5974302 | 2 | ||||||
| Total | 282218723 | 100 | ||||||
| Total Reported |
| September 30 | December 31 | ||||||||||
| 2019 | 2018 | ||||||||||
| ASSETS | (Unaudited) | ||||||||||
| Current assets | |||||||||||
| Cash and cash equivalents | $ | 8626 | $ | 11883 | |||||||
| Restricted cash | 800 | 800 | |||||||||
| Accounts receivable less allowance for doubtful accounts of $614 and $549 respectively | 45162 | 37682 | |||||||||
| Inventories net | 54894 | 52887 | |||||||||
| Miscellaneous receivables and prepaid expenses | 4270 | 3653 | |||||||||
| Total current assets | 113752 | 106905 | |||||||||
| Property plant and equipment net | 16932 | 23548 | |||||||||
| Deferred income taxes | 17372 | 20592 | |||||||||
| Goodwill | 20582 | 20079 | |||||||||
| Cash value of life insurance | 14440 | 12599 | |||||||||
| Intangible assets net | 12468 | 13112 | |||||||||
| Lease assets | 11917 | mdash | |||||||||
| Other assets | 275 | 307 | |||||||||
| Total assets | $ | 207738 | $ | 197142 | |||||||
| LIABILITIES AND STOCKHOLDERSrsquo EQUITY | |||||||||||
| Current liabilities | |||||||||||
| Revolving lines of credit | $ | 2195 | $ | 10823 | |||||||
| Accounts payable | 16325 | 15207 | |||||||||
| Lease obligation | 3781 | mdash | |||||||||
| Accrued expenses and other liabilities | 37873 | 40179 | |||||||||
| Total current liabilities | 60174 | 66209 | |||||||||
| Security bonus plan | 11969 | 12413 | |||||||||
| Lease obligation | 10360 | 5213 | |||||||||
| Deferred compensation | 5915 | 5304 | |||||||||
| Deferred tax liability | 2879 | 2761 | |||||||||
| Other liabilities | 3460 | 6069 | |||||||||
| Total liabilities | 94757 | 97969 | |||||||||
| Stockholdersrsquo equity | |||||||||||
| Preferred stock $1 par value | |||||||||||
| Authorized - 500000 shares Issued and outstanding mdash None | mdash | mdash | |||||||||
| Common stock $1 par value | |||||||||||
| Authorized - 35000000 shares | 9043 | 9006 | |||||||||
| Issued - 9042597 and 9005716 shares respectively | |||||||||||
| Outstanding - 8956981 and 8955930 shares respectively | |||||||||||
| Capital in excess of par value | 17626 | 15623 | |||||||||
| Retained earnings | 89502 | 77338 | |||||||||
| Treasury stock ndash 85616 and 49786 shares respectively | (2595) | (1234) | |||||||||
| Accumulated other comprehensive loss | (595) | (1560) | |||||||||
| Total stockholdersrsquo equity | 112981 | 99173 | |||||||||
| Total liabilities and stockholdersrsquo equity | $ | 207738 | $ | 197142 | |||||||
| Three Months Ended | |||||||||||||||||||||||||||||
| Jun 30 2019 | Mar 31 2019 | Dec 31 2018 | Sep 30 2018 | Jun 30 2018 | |||||||||||||||||||||||||
| Average daily net sales | $ | 1502 | $ | 1450 | $ | 1414 | $ | 1405 | $ | 1412 | |||||||||||||||||||
| Year over year increase | 63 | 82 | 70 | 170 | 205 | ||||||||||||||||||||||||
| Sequential quarter increase (decrease) | 36 | 25 | 06 | (05) | 53 | ||||||||||||||||||||||||
| Net Sales | $ | 96097 | $ | 91343 | $ | 86266 | $ | 88530 | $ | 90382 | |||||||||||||||||||
| Gross profit (1) | 51043 | 48923 | 46083 | 48108 | 49131 | ||||||||||||||||||||||||
| Gross profit percentage (1) | 531 | 536 | 534 | 543 | 544 | ||||||||||||||||||||||||
| Selling general amp administrative expenses | $ | 49420 | $ | 43379 | $ | 41998 | $ | 50374 | $ | 43577 | |||||||||||||||||||
| Operating income (loss) | $ | 1623 | $ | 5544 | $ | 4085 | $ | (2266) | $ | 5554 | |||||||||||||||||||
| Full Year | |||||||||||||||||||||||||||||||||||||||||||||||||||||||||||||||||||||||||||
| ($ in thousands) | Q1 2011 | Q2 2011 | Q3 2011 | Q4 2011 | Q1 2012 | Q2 2012 | Q3 2012 | Q4 2012 | Q1 2013 | Q2 2013 | Q3 2013 | Q4 2013 | Q1 2014 | Q2 2014 | Q3 2014 | Q4 2014 | Q1 2015 | Q2 2015 | Q3 2015 | Q4 2015 | Q1 2016 | Q2 2016 | Q3 2016 | Q4 2016 | Q1 2017 | Q2 2017 | Q3 2017 | Q4 2017 | Q1 2018 | Q2 2018 | Q3 2018 | Q4 2018 | Q1 2019 | Q2 2019 | Q3 2019 | 2014 | 2015 | ||||||||||||||||||||||||||||||||||||||
| Net Sales | $ 79255 | $ 80625 | $ 71490 | $ 69029 | $ 71364 | $ 69830 | $ 67863 | $ 64505 | $ 67213 | $ 68317 | $ 68235 | $ 65738 | $ 69204 | $ 72080 | $ 74128 | $ 70281 | $ 69904 | $ 70726 | $ 70243 | $ 64961 | $ 69711 | $ 69348 | $ 70199 | $ 67315 | $ 74617 | $ 75006 | $ 75651 | $ 80633 | $ 84459 | $ 90382 | $ 88530 | $ 86266 | $ 91343 | $ 96097 | $ 94779 | $ 285693 | $ 275834 | ||||||||||||||||||||||||||||||||||||||
| Operating Income (Loss) | 3542 | 1397 | (3480) | (6995) | (3466) | (42084) | (1740) | 2057 | (3530) | (201) | 870 | (3002) | (4713) | 1241 | 678 | (2169) | (947) | 3243 | 2810 | (2985) | 1169 | 29 | 2389 | (5044) | 712 | 7891 | 1090 | 243 | 1837 | 5554 | (2266) | 4085 | 5544 | 1623 | 6446 | (4963) | 2121 | ||||||||||||||||||||||||||||||||||||||
| Depreciation amp Amortization | 1260 | 1315 | 1160 | 1675 | 1715 | 1566 | 1963 | 1841 | 2061 | 2244 | 2367 | 2358 | 2295 | 2163 | 2160 | 2133 | 2096 | 2126 | 2119 | 2202 | 2187 | 2226 | 1973 | 1680 | 1705 | 1644 | 1591 | 1830 | 1686 | 1679 | 1755 | 1735 | 1478 | 1455 | 1468 | 8751 | 8543 | ||||||||||||||||||||||||||||||||||||||
| EBITDA | 4802 | 2712 | (2320) | (5320) | (1751) | (40518) | 223 | 3898 | (1469) | 2043 | 3237 | (644) | (2418) | 3404 | 2838 | (36) | 1149 | 5369 | 4929 | (783) | 3356 | 2255 | 4362 | (3364) | 2417 | 9535 | 2681 | 2073 | 3523 | 7233 | (511) | 5820 | 7022 | 3078 | 7914 | 3788 | 10664 | ||||||||||||||||||||||||||||||||||||||
| Excluded Costs | |||||||||||||||||||||||||||||||||||||||||||||||||||||||||||||||||||||||||||
| Severance | 745 | 465 | 282 | 122 | 185 | 6585 | 1410 | (159) | - 0 | 2 | 962 | (127) | 728 | 290 | (328) | (59) | 571 | 50 | 372 | 280 | 204 | 143 | 367 | 1662 | 465 | (9) | 139 | 144 | 628 | 64 | 31 | 126 | 27 | 1485 | 30 | 631 | 1273 | ||||||||||||||||||||||||||||||||||||||
| Stock Based Compensation (Benefit) | 227 | (95) | (538) | 467 | 198 | (1015) | 77 | 434 | 1596 | 76 | 33 | 562 | 1125 | 408 | 2423 | 2443 | (541) | 971 | (30) | 1693 | (1217) | 515 | (630) | 3801 | (30) | 415 | 2337 | 384 | 970 | 87 | 7637 | (1186) | 408 | 4839 | 2374 | 6399 | 2093 | ||||||||||||||||||||||||||||||||||||||
| Acquisition Related Costs | - 0 | - 0 | - 0 | - 0 | - 0 | - 0 | 310 | 32 | 115 | 198 | 178 | 120 | - 0 | - 0 | 286 | 425 | - 0 | - 0 | 168 | 62 | - 0 | - 0 | - 0 | ||||||||||||||||||||||||||||||||||||||||||||||||||||
| ERP Implementation Costs | 1902 | 2388 | 2344 | 339 | - 0 | - 0 | - 0 | - 0 | - 0 | - 0 | - 0 | - 0 | - 0 | - 0 | - 0 | - 0 | - 0 | - 0 | - 0 | - 0 | - 0 | - 0 | - 0 | - 0 | - 0 | - 0 | - 0 | - 0 | - 0 | - 0 | - 0 | - 0 | - 0 | ||||||||||||||||||||||||||||||||||||||||||
| Loss(Gain) on Disposal of Property | - 0 | - 0 | - 0 | 22 | - 0 | (2122) | (11) | (1588) | - 0 | - 0 | (36) | 32 | - 0 | - 0 | 97 | 45 | - 0 | - 0 | (2) | 9 | - 0 | - 0 | - 0 | - 0 | - 0 | (5422) | - 0 | - 0 | - 0 | - 0 | - 0 | - 0 | - 0 | - 0 | - 0 | 142 | 7 | ||||||||||||||||||||||||||||||||||||||
| Legal Settlement | - 0 | - 0 | - 0 | - 0 | - 0 | - 0 | - 0 | - 0 | - 0 | - 0 | - 0 | - 0 | - 0 | - 0 | (688) | - 0 | - 0 | - 0 | - 0 | - 0 | - 0 | - 0 | - 0 | - 0 | - 0 | - 0 | - 0 | - 0 | - 0 | - 0 | - 0 | - 0 | (688) | - 0 | |||||||||||||||||||||||||||||||||||||||||
| Employment Tax Matter | - 0 | - 0 | - 0 | 1200 | - 0 | - 0 | - 0 | - 0 | - 0 | - 0 | - 0 | (400) | - 0 | - 0 | - 0 | - 0 | - 0 | - 0 | - 0 | - 0 | - 0 | - 0 | - 0 | - 0 | - 0 | - 0 | - 0 | - 0 | - 0 | - 0 | - 0 | - 0 | - 0 | - 0 | |||||||||||||||||||||||||||||||||||||||||
| Lease termination gain | - 0 | - 0 | - 0 | - 0 | - 0 | - 0 | - 0 | - 0 | - 0 | - 0 | - 0 | 2928 | - 0 | - 0 | - 0 | - 0 | - 0 | - 0 | - 0 | - 0 | - 0 | - 0 | - 0 | - 0 | - 0 | - 0 | - 0 | - 0 | - 0 | (164) | - 0 | - 0 | - 0 | - 0 | - 0 | - 0 | - 0 | ||||||||||||||||||||||||||||||||||||||
| Goodwill Impairment | - 0 | - 0 | - 0 | - 0 | - 0 | 28306 | - 0 | - 0 | - 0 | - 0 | - 0 | - 0 | - 0 | - 0 | - 0 | - 0 | - 0 | - 0 | - 0 | - 0 | - 0 | - 0 | - 0 | - 0 | - 0 | - 0 | - 0 | - 0 | - 0 | - 0 | - 0 | - 0 | - 0 | - 0 | |||||||||||||||||||||||||||||||||||||||||
| Inventory Rationalization | - 0 | - 0 | - 0 | - 0 | - 0 | 3893 | - 0 | - 0 | - 0 | - 0 | - 0 | - 0 | - 0 | - 0 | - 0 | - 0 | - 0 | - 0 | - 0 | - 0 | - 0 | - 0 | - 0 | - 0 | - 0 | - 0 | - 0 | - 0 | - 0 | - 0 | - 0 | - 0 | - 0 | - 0 | |||||||||||||||||||||||||||||||||||||||||
| Discontinued operation accrual | - 0 | - 0 | - 0 | - 0 | - 0 | - 0 | - 0 | - 0 | - 0 | - 0 | - 0 | - 0 | - 0 | - 0 | - 0 | 340 | - 0 | - 0 | - 0 | 931 | - 0 | - 0 | - 0 | - 0 | - 0 | - 0 | - 0 | - 0 | - 0 | 529 | - 0 | - 0 | - 0 | - 0 | - 0 | 340 | 931 | ||||||||||||||||||||||||||||||||||||||
| North American sales meeting | - 0 | - 0 | - 0 | - 0 | - 0 | - 0 | - 0 | - 0 | 1225 | - 0 | - 0 | - 0 | - 0 | - 0 | - 0 | - 0 | 1889 | - 0 | - 0 | - 0 | - 0 | - 0 | - 0 | - 0 | - 0 | - 0 | - 0 | - 0 | - 0 | - 0 | - 0 | - 0 | - 0 | 1889 | |||||||||||||||||||||||||||||||||||||||||
| Property Impairment Loss | - 0 | - 0 | - 0 | - 0 | - 0 | - 0 | - 0 | - 0 | - 0 | - 0 | - 0 | - 0 | 2914 | 132 | - 0 | - 0 | - 0 | - 0 | - 0 | - 0 | - 0 | - 0 | - 0 | - 0 | - 0 | - 0 | - 0 | - 0 | - 0 | - 0 | - 0 | - 0 | 3046 | - 0 | |||||||||||||||||||||||||||||||||||||||||
| Building Impairment | - 0 | - 0 | - 0 | - 0 | - 0 | - 0 | - 0 | 231 | - 0 | - 0 | - 0 | ||||||||||||||||||||||||||||||||||||||||||||||||||||||||||||||||
| Reg G Adjusted EBITDA | $ 7676 | $ 5470 | $ (232) | $ (3170) | $ (1368) | $ (4871) | $ 1699 | $ 2585 | $ 1352 | $ 2121 | $ 4196 | $ 2351 | $ 2349 | $ 4234 | $ 4342 | $ 2733 | $ 3068 | $ 6390 | $ 5579 | $ 2162 | $ 2458 | $ 3111 | $ 4277 | $ 2219 | $ 2852 | $ 4519 | $ 5443 | $ 3026 | $ 5121 | $ 7749 | $ 7325 | $ 5053 | $ 7457 | $ 9402 | $ 10318 | $ 13658 | $ 17199 | ||||||||||||||||||||||||||||||||||||||
| Adjusted EBITDA of Sales | 97 | 68 | -03 | -46 | -19 | -70 | 25 | 40 | 20 | 31 | 61 | 36 | 34 | 59 | 59 | 39 | 44 | 90 | 79 | 33 | 35 | 45 | 61 | 33 | 38 | 60 | 72 | 38 | 61 | 86 | 83 | 59 | 82 | 98 | 109 | 48 | 62 | ||||||||||||||||||||||||||||||||||||||
| Annual Adjusted EBITDA of Sales | 44 | 58 | |||||||||||||||||||||||||||||||||||||||||||||||||||||||||||||||||||||||||
| Adjusted Operating Income | (3083) | (6437) | (264) | 744 | (709) | (123) | 1829 | (7) | 54 | 2071 | 2182 | 600 | 972 | 4264 | 3460 | (40) | 271 | 885 | 2304 | 539 | 1147 | 2875 | 3852 | 1196 | 3435 | 6070 | 5570 | 3087 | 5979 | 7947 | 8850 | 4907 | 8314 | ||||||||||||||||||||||||||||||||||||||||||
| Consolidated Revenues | |||||||
| 2013 | 269503 | ||||||
| 2014 | 285693 | ||||||
| 2015 | 275834 | ||||||
| 2016 | 276573 | ||||||
| 2017 | 305907 | ||||||
| 2018 | 349637 | ||||||
| TTM 63019 | 362236 | ||||||
| Net Cash(Debt) | |||||||
| 2013 | (15380) | ||||||
| 2014 | 4207 | ||||||
| 2015 | 9840 | ||||||
| 2016 | 9580 | ||||||
| 2017 | (10127) | ||||||
| 2018 | 1060 | ||||||
| 63019 | (1908) | ||||||
| Rep Count | |||||||
| 2013 | 806 | ||||||
| 2014 | 916 | ||||||
| 2015 | 937 | ||||||
| 2016 | 1009 | ||||||
| 2017 | 983 | ||||||
| 2018 | 994 | ||||||
| 63019 | 982 | ||||||
| Adjusted OI | DampA | Adjusted EBITDA | |||||
| 2013 | 990 | 9030 | 10020 | ||||
| 2014 | 4907 | 8751 | 13658 | ||||
| 2015 | 8315 | 8543 | 17199 | ||||
| 2016 | 3388 | 8066 | 12065 | ||||
| 2017 | 15840 | ||||||
| 2018 | 25248 | ||||||
| TTM 63019 | 29237 | ||||||
| Reg G EBITDA By Quarter | |||||||
| Quarter | 2017 | 2018 | 2019 | ||||
| Q1 | 2852 | 5121 | 7457 | ||||
| Q2 | 4519 | 7749 | 9402 | ||||
| Q3 | 5443 | 7325 | |||||
| Q4 | 3026 | 5053 |
| Months of Experience | Average Annual Sales | Number of Reps | |||
| lt 12 Mos | ERRORVALUE | ERRORVALUE | |||
| 1 - 2 Yrs | ERRORVALUE | ERRORVALUE | |||
| 3 - 5 Yrs | ERRORVALUE | ERRORVALUE | |||
| 5 - 10 Yrs | ERRORVALUE | ERRORVALUE | |||
| gt 10 Yrs | ERRORVALUE | ERRORVALUE | |||
| ERRORVALUE | |||||
| Excludes ISR MSS CRS | |||||
| Excludes Freight | |||||
| Product mix | ||||||||
| Verticals | Q2 2019 Sales | |||||||
| Fastening Systems | 243 | 23008646 | ||||||
| Fluid Power | 152 | 14395529 | ||||||
| Specialy Chemicals | 117 | 11074332 | ||||||
| Cutting Tools and Abrasives | 130 | 12319702 | ||||||
| Electrical | 107 | 10102828 | ||||||
| Aftermarket Automotive Supplies | 77 | 7255974 | ||||||
| Safety | 47 | 4458217 | ||||||
| Welding and Metal Repair | 16 | 1539172 | ||||||
| Other | 112 | 10633378 | ||||||
| Total | 100 | 94787779 | ||||||
| Verticals | YTD 2019 Sales | |||||||
| Fastening Systems | 24 | 44125949 | ||||||
| Fluid Power | 15 | 28068352 | ||||||
| Specialy Chemicals | 12 | 21249420 | ||||||
| Cutting Tools and Abrasives | 13 | 24290887 | ||||||
| Electrical | 11 | 20425294 | ||||||
| Aftermarket Automotive Supplies | 8 | 14805874 | ||||||
| Safety | 5 | 8626381 | ||||||
| Welding and Metal Repair | 2 | 3088518 | ||||||
| Other | 10 | 20042457 | ||||||
| Total | 100 | 184723132 |
| Lawson core customer mix | ||||||||
| Account Tyoe | Q2 | |||||||
| Regional Accounts | 44933707 | 47 | ||||||
| Strategic | 13542786 | 14 | ||||||
| Kent Automotive | 14370813 | 15 | ||||||
| Bolt Supply | 11129675 | 12 | ||||||
| Government | 10087561 | 10 | ||||||
| Screw Products | 0 | 0 | ||||||
| Other (1) | 1428268 | 1 | ||||||
| Total | 96097363 | 100 | ||||||
| Account Tyoe | YTD June | |||||||
| Regional Accounts | 88400675 | 47 | ||||||
| Strategic | 26218365 | 14 | ||||||
| Kent Automotive | 29071347 | 16 | ||||||
| Bolt Supply | 20005505 | 11 | ||||||
| Government | 19505323 | 10 | ||||||
| Screw Products | 0 | 0 | ||||||
| Other | 4239066 | 2 | ||||||
| Total | 187440280 | 100 | ||||||
| Total Reported |
| August 2011 | OslashImplemented SAP | ||
| October 2011 | OslashCommenced construction of new McCook Ill distribution center | ||
| May 2012 | OslashRelocated corporate headquarters | ||
| June 2012 | OslashRestructured senior team Announced $20M cost savings plan | ||
| August 2012 | OslashTransitioned packaging facility to McCook Ill distribution center | ||
| OslashEntered into new five-year $40M credit facility | |||
| October 2012 | OslashAnnounced new CEO and President Michael G DeCata | ||
| OslashConsolidated Vernon Hills distribution center into McCook Ill | |||
| November 2012 | OslashRolled out new website to existing web customers | ||
| December 2012 | OslashCompleted transition of US independent agents to employees | ||
| April 2013 | OslashRoll-out of new website to new web customers | ||
| AprilMay 2013 | OslashMcCook DC begins to ship customer orders | ||
| November 2013 | OslashEntered into sub-lease of headquarters space to generate $29M of future cash savings | ||
| December 2013 | OslashEnded year with over 800 sales reps ndash First increase in 8 years | ||
| February 2014 | OslashClosed on Automatic Screw Machine Products sale for net proceeds of $121M | ||
| June 2014 | OslashEntered into sale-leaseback of Reno distribution facility for net proceeds of $83M | ||
| December 2014 | OslashEnded year with over 900 sales reps | ||
| February 2015 | OslashHeld North American sales meeting | ||
| September 2015 | OslashCompleted West Coast Fasteners acquisition | ||
| March 2016 | OslashCompleted Perfect Products of Michigan acquisition | ||
| May 2016 | OslashCompleted F B Feeney acquisition | ||
| June 2016 | OslashExpanded sales team to over 1000 sales reps | ||
| September 2016 | OslashExtended credit facitlity to August 2020 | ||
| November 2016 | OslashCompleted Mattic Industries acquisition | ||
| March 2017 | OslashConsolidated Fairfield NJ distribution operations into McCook Ill and Suwanee GA | ||
| May 2017 | OslashSold Fairfield NJ distribution center for a gain of $54M | ||
| October 2017 | OslashCompleted Bolt Supply House acquisition | ||
| April 2018 | OslashOpened MRO distribution center in Calgary Canada | ||
| October 2018 | OslashCompleted Screw Products acquisition and added Bolt Supply branch | ||
| June 2019 | OslashAchieved Q2 98 adjusted EBITDA net of ASC 842 impact of 03 | ||
| September 2019 | OslashAchieved Q3 109 adjusted EBITDA hired VP MampA | ||
| October 2019 | OslashEntered into new five-year $100M credit facility with additional $50 million accordion feature |
| ($ in thousands) | Q3 2013 | Q4 2013 | Q1 2014 | Q2 2014 | Q3 2014 | Q4 2014 | Q1 2015 | Q2 2015 | Q3 2015 | Q4 2015 | Q1 2016 | Q2 2016 | Q3 2016 | Q4 2016 | Q1 2017 | Q2 2017 | Q3 2017 | Q4 2017 | ||||||||||||||||||||||||||||||||||||||||||||||
| SGampA | 40350 | 42856 | 45991 | 42562 | 43855 | 44764 | 43830 | 40565 | 40532 | 41145 | 41290 | 42497 | 40184 | 45548 | 44167 | 42672 | 44915 | 46750 | $ 173014 | |||||||||||||||||||||||||||||||||||||||||||||
| $ - | ||||||||||||||||||||||||||||||||||||||||||||||||||||||||||||||||
| Excluded Costs | $ - | 40196 | ||||||||||||||||||||||||||||||||||||||||||||||||||||||||||||||
| Severance | (962) | 127 | (728) | (290) | 328 | 59 | (571) | (50) | (372) | (280) | (204) | (143) | (367) | (1662) | (465) | 9 | (139) | (144) | $ (234) | 127 | ||||||||||||||||||||||||||||||||||||||||||||
| Stock Based Compensation (Benefit) | (33) | (562) | (1125) | (408) | (2423) | (2443) | 541 | (971) | 30 | (1693) | 1217 | (515) | 630 | (3801) | 30 | (415) | (2337) | (384) | $ (5296) | -32 | ||||||||||||||||||||||||||||||||||||||||||||
| Loss(Gain) on Disposal of Property | 36 | (32) | - 0 | - 0 | (97) | (45) | - 0 | - 0 | 2 | (9) | - 0 | - 0 | - 0 | - 0 | - 0 | - 0 | - 0 | - 0 | $ (142) | |||||||||||||||||||||||||||||||||||||||||||||
| Legal Settlement | - 0 | - 0 | - 0 | - 0 | 688 | - 0 | - 0 | - 0 | - 0 | - 0 | - 0 | - 0 | - 0 | - 0 | - 0 | - 0 | - 0 | - 0 | $ 688 | -562 | ||||||||||||||||||||||||||||||||||||||||||||
| Employment Tax Matter | - 0 | 400 | - 0 | - 0 | - 0 | - 0 | - 0 | - 0 | - 0 | - 0 | - 0 | - 0 | - 0 | - 0 | - 0 | - 0 | - 0 | - 0 | $ - | 39729 | ||||||||||||||||||||||||||||||||||||||||||||
| Loss on Sub-Lease | - 0 | (2928) | - 0 | - 0 | - 0 | - 0 | - 0 | - 0 | - 0 | - 0 | - 0 | - 0 | - 0 | - 0 | - 0 | - 0 | - 0 | - 0 | $ - | |||||||||||||||||||||||||||||||||||||||||||||
| National sales meeting | - 0 | - 0 | - 0 | - 0 | - 0 | - 0 | (1889) | - 0 | - 0 | - 0 | - 0 | - 0 | - 0 | - 0 | - 0 | - 0 | - 0 | - 0 | $ (1889) | |||||||||||||||||||||||||||||||||||||||||||||
| Remediation expense | - 0 | - 0 | - 0 | - 0 | - 0 | (340) | - 0 | - 0 | - 0 | - 0 | - 0 | - 0 | - 0 | - 0 | - 0 | - 0 | - 0 | - 0 | $ (340) | |||||||||||||||||||||||||||||||||||||||||||||
| Property Impairment Loss | - 0 | - 0 | (2914) | (132) | - 0 | - 0 | - 0 | - 0 | - 0 | - 0 | - 0 | - 0 | - 0 | - 0 | - 0 | - 0 | - 0 | - 0 | $ - | |||||||||||||||||||||||||||||||||||||||||||||
| Adjusted SGampA | $ 39391 | $ 39861 | $ 41224 | $ 41732 | $ 42351 | $ 41995 | $ 41911 | $ 39544 | $ 40192 | $ 39163 | $ 42303 | $ 41839 | $ 40447 | $ 40085 | $ 43732 | $ 42266 | $ 42439 | $ 46222 | $ 165801 | |||||||||||||||||||||||||||||||||||||||||||||
| Annual Adjusted EBITDA of Sales | ERRORREF | ERRORREF | ||||||||||||||||||||||||||||||||||||||||||||||||||||||||||||||
| Q1 2013 | Q2 2013 | Q3 2013 | Q4 2013 | Q1 2014 | Q2 2014 | Q3 2014 | Q4 2014 | Q1 2015 | |||||||||||
| Selling Days | 63 | 64 | 64 | 61 | 63 | 64 | 64 | 61 | 63 | ||||||||||
| Net Sales | 67213 | 68317 | 68235 | 65738 | 69204 | 72080 | 74128 | 70281 | 69904 | ||||||||||
| Average Daily Sales | 1067 | 1067 | 1066 | 1078 | 1098 | 1126 | 1158 | 1152 | 1110 | ||||||||||
| Average Sales Rep Count | 762 | 764 | 774 | 794 | 819 | 854 | 882 | 908 | 911 | ||||||||||
| Sales per Sales Rep per Day | 1400 | 1397 | 1377 | 1358 | 1341 | 1319 | 1313 | 1269 | 1218 | ||||||||||
| Full Year | ||||||||||||||||||||||||||||||||||||||||||||||||||||||||||||||||||||
| ($ in thousands) | Q1 2011 | Q2 2011 | Q3 2011 | Q4 2011 | Q1 2012 | Q2 2012 | Q3 2012 | Q4 2012 | Q1 2013 | Q2 2013 | Q3 2013 | Q4 2013 | Q1 2014 | Q2 2014 | Q3 2014 | Q4 2014 | Q1 2015 | Q2 2015 | Q3 2015 | Q4 2015 | Q1 2016 | Q2 2016 | Q3 2016 | Q4 2016 | Q1 2017 | Q2 2017 | Q3 2017 | Q4 2017 | Q1 2018 | Q2 2018 | Q3 2018 | 2014 | 2015 | |||||||||||||||||||||||||||||||||||
| Net Sales | $ 79255 | $ 80625 | $ 71490 | $ 69029 | $ 71364 | $ 69830 | $ 67863 | $ 64505 | $ 67213 | $ 68317 | $ 68235 | $ 65738 | $ 69204 | $ 72080 | $ 74128 | $ 70281 | $ 69904 | $ 70726 | $ 70243 | $ 64961 | $ 69711 | $ 69348 | $ 70199 | $ 67315 | $ 74617 | $ 75006 | $ 75651 | $ 80633 | $ 84459 | $ 90382 | $ 88530 | $ 285693 | $ 275834 | |||||||||||||||||||||||||||||||||||
| Operating Income (Loss) | 3542 | 1397 | (3480) | (6995) | (3466) | (42084) | (1740) | 2057 | (3530) | (201) | 870 | (3002) | (4713) | 1241 | 678 | (2169) | (947) | 3243 | 2810 | (2985) | 1169 | 29 | 2389 | (5044) | 712 | 7891 | 1090 | 243 | 1837 | 5554 | (2266) | (4963) | 2121 | |||||||||||||||||||||||||||||||||||
| Depreciation amp Amortization | 1260 | 1315 | 1160 | 1675 | 1715 | 1566 | 1963 | 1841 | 2061 | 2244 | 2367 | 2358 | 2295 | 2163 | 2160 | 2133 | 2096 | 2126 | 2119 | 2202 | 2187 | 2226 | 1973 | 1680 | 1705 | 1644 | 1591 | 1830 | 1686 | 1679 | 1755 | 8751 | 8543 | |||||||||||||||||||||||||||||||||||
| EBITDA | 4802 | 2712 | (2320) | (5320) | (1751) | (40518) | 223 | 3898 | (1469) | 2043 | 3237 | (644) | (2418) | 3404 | 2838 | (36) | 1149 | 5369 | 4929 | (783) | 3356 | 2255 | 4362 | (3364) | 2417 | 9535 | 2681 | 2073 | 3523 | 7233 | (511) | 3788 | 10664 | |||||||||||||||||||||||||||||||||||
| Excluded Costs | ||||||||||||||||||||||||||||||||||||||||||||||||||||||||||||||||||||
| Severance | 745 | 465 | 282 | 122 | 185 | 6585 | 1410 | (159) | - 0 | 2 | 962 | (127) | 728 | 290 | (328) | (59) | 571 | 50 | 372 | 280 | 204 | 143 | 367 | 1662 | 465 | (9) | 139 | 144 | 628 | 64 | 31 | 631 | 1273 | |||||||||||||||||||||||||||||||||||
| Stock Based Compensation (Benefit) | 227 | (95) | (538) | 467 | 198 | (1015) | 77 | 434 | 1596 | 76 | 33 | 562 | 1125 | 408 | 2423 | 2443 | (541) | 971 | (30) | 1693 | (1217) | 515 | (630) | 3801 | (30) | 415 | 2337 | 384 | 970 | 87 | 7637 | 6399 | 2093 | |||||||||||||||||||||||||||||||||||
| Acquisition Related Costs | - 0 | - 0 | - 0 | - 0 | - 0 | - 0 | 310 | 32 | 115 | 198 | 178 | 120 | - 0 | - 0 | 286 | 425 | - 0 | - 0 | 168 | |||||||||||||||||||||||||||||||||||||||||||||||||
| ERP Implementation Costs | 1902 | 2388 | 2344 | 339 | - 0 | - 0 | - 0 | - 0 | - 0 | - 0 | - 0 | - 0 | - 0 | - 0 | - 0 | - 0 | - 0 | - 0 | - 0 | - 0 | - 0 | - 0 | - 0 | - 0 | - 0 | - 0 | - 0 | - 0 | - 0 | - 0 | - 0 | - 0 | ||||||||||||||||||||||||||||||||||||
| Loss(Gain) on Disposal of Property | - 0 | - 0 | - 0 | 22 | - 0 | (2122) | (11) | (1588) | - 0 | - 0 | (36) | 32 | - 0 | - 0 | 97 | 45 | - 0 | - 0 | (2) | 9 | - 0 | - 0 | - 0 | - 0 | - 0 | (5422) | - 0 | - 0 | - 0 | - 0 | - 0 | 142 | 7 | |||||||||||||||||||||||||||||||||||
| Legal Settlement | - 0 | - 0 | - 0 | - 0 | - 0 | - 0 | - 0 | - 0 | - 0 | - 0 | - 0 | - 0 | - 0 | - 0 | (688) | - 0 | - 0 | - 0 | - 0 | - 0 | - 0 | - 0 | - 0 | - 0 | - 0 | - 0 | - 0 | - 0 | - 0 | - 0 | - 0 | (688) | - 0 | |||||||||||||||||||||||||||||||||||
| Employment Tax Matter | - 0 | - 0 | - 0 | 1200 | - 0 | - 0 | - 0 | - 0 | - 0 | - 0 | - 0 | (400) | - 0 | - 0 | - 0 | - 0 | - 0 | - 0 | - 0 | - 0 | - 0 | - 0 | - 0 | - 0 | - 0 | - 0 | - 0 | - 0 | - 0 | - 0 | - 0 | - 0 | - 0 | |||||||||||||||||||||||||||||||||||
| Lease termination gain | - 0 | - 0 | - 0 | - 0 | - 0 | - 0 | - 0 | - 0 | - 0 | - 0 | - 0 | 2928 | - 0 | - 0 | - 0 | - 0 | - 0 | - 0 | - 0 | - 0 | - 0 | - 0 | - 0 | - 0 | - 0 | - 0 | - 0 | - 0 | - 0 | (164) | - 0 | - 0 | - 0 | |||||||||||||||||||||||||||||||||||
| Goodwill Impairment | - 0 | - 0 | - 0 | - 0 | - 0 | 28306 | - 0 | - 0 | - 0 | - 0 | - 0 | - 0 | - 0 | - 0 | - 0 | - 0 | - 0 | - 0 | - 0 | - 0 | - 0 | - 0 | - 0 | - 0 | - 0 | - 0 | - 0 | - 0 | - 0 | - 0 | - 0 | - 0 | - 0 | |||||||||||||||||||||||||||||||||||
| Inventory Rationalization | - 0 | - 0 | - 0 | - 0 | - 0 | 3893 | - 0 | - 0 | - 0 | - 0 | - 0 | - 0 | - 0 | - 0 | - 0 | - 0 | - 0 | - 0 | - 0 | - 0 | - 0 | - 0 | - 0 | - 0 | - 0 | - 0 | - 0 | - 0 | - 0 | - 0 | - 0 | - 0 | - 0 | |||||||||||||||||||||||||||||||||||
| Discontinued operation accrual | - 0 | - 0 | - 0 | - 0 | - 0 | - 0 | - 0 | - 0 | - 0 | - 0 | - 0 | - 0 | - 0 | - 0 | - 0 | 340 | - 0 | - 0 | - 0 | 931 | - 0 | - 0 | - 0 | - 0 | - 0 | - 0 | - 0 | - 0 | - 0 | 529 | - 0 | 340 | 931 | |||||||||||||||||||||||||||||||||||
| North American sales meeting | - 0 | - 0 | - 0 | - 0 | - 0 | - 0 | - 0 | - 0 | 1225 | - 0 | - 0 | - 0 | - 0 | - 0 | - 0 | - 0 | 1889 | - 0 | - 0 | - 0 | - 0 | - 0 | - 0 | - 0 | - 0 | - 0 | - 0 | - 0 | - 0 | - 0 | - 0 | - 0 | 1889 | |||||||||||||||||||||||||||||||||||
| Property Impairment Loss | - 0 | - 0 | - 0 | - 0 | - 0 | - 0 | - 0 | - 0 | - 0 | - 0 | - 0 | - 0 | 2914 | 132 | - 0 | - 0 | - 0 | - 0 | - 0 | - 0 | - 0 | - 0 | - 0 | - 0 | - 0 | - 0 | - 0 | - 0 | - 0 | - 0 | - 0 | 3046 | - 0 | |||||||||||||||||||||||||||||||||||
| Adjusted EBITDA | $ 7676 | $ 5470 | $ (232) | $ (3170) | $ (1368) | $ (4871) | $ 1699 | $ 2585 | $ 1352 | $ 2121 | $ 4196 | $ 2351 | $ 2349 | $ 4234 | $ 4342 | $ 2733 | $ 3068 | $ 6390 | $ 5579 | $ 2162 | $ 2458 | $ 3111 | $ 4277 | $ 2219 | $ 2852 | $ 4519 | $ 5443 | $ 3026 | $ 5121 | $ 7749 | $ 7325 | $ 13658 | $ 17199 | |||||||||||||||||||||||||||||||||||
| Adjusted EBITDA of Sales | 97 | 68 | -03 | -46 | -19 | -70 | 25 | 40 | 20 | 31 | 61 | 36 | 34 | 59 | 59 | 39 | 44 | 90 | 79 | 33 | 35 | 45 | 61 | 33 | 38 | 60 | 72 | 38 | 61 | 86 | 83 | 48 | 62 | |||||||||||||||||||||||||||||||||||
| Annual Adjusted EBITDA of Sales | 44 | 58 | ||||||||||||||||||||||||||||||||||||||||||||||||||||||||||||||||||
| Adjusted Operating Income | (3083) | (6437) | (264) | 744 | (709) | (123) | 1829 | (7) | 54 | 2071 | 2182 | 600 | 972 | 4264 | 3460 | (40) | 271 | 885 | 2304 | 539 | 1147 | 2875 | 3852 | 1196 | 3435 | 6070 | 5570 | - 0 | 4907 | 8314 | ||||||||||||||||||||||||||||||||||||||
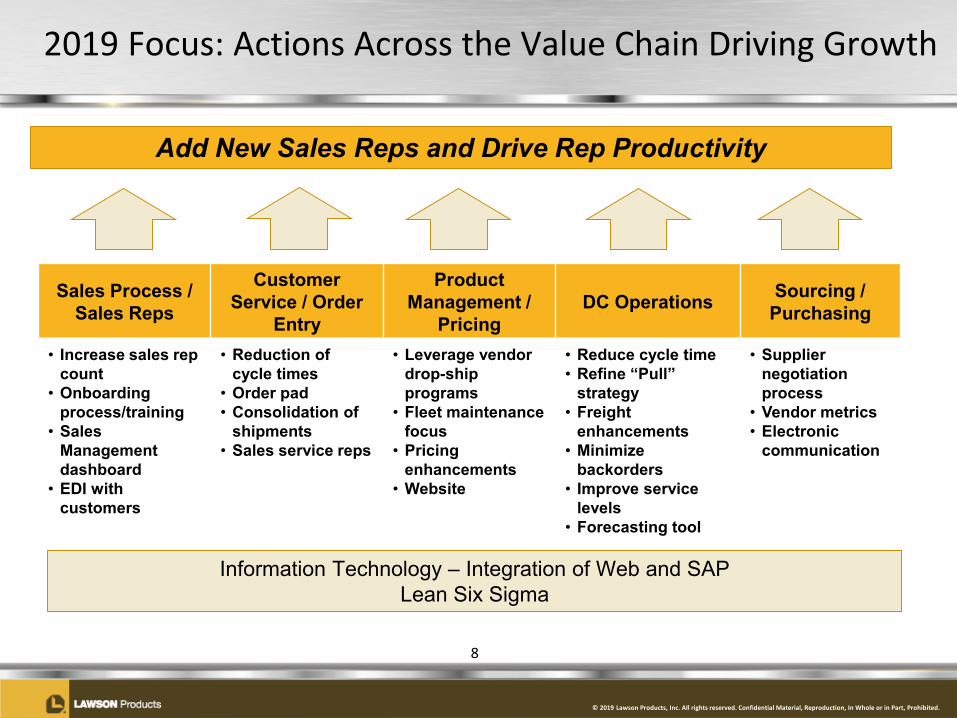
copy 2019 Lawson Products Inc All rights reserved Confidential Material Reproduction In Whole or in Part Prohibited
Customer and Product Profile
6
Retain over 90 of customer revenues from year to year
Fastening Systems
23
Fluid Power15
Specialty Chemicals
12
Cutting Tools and Abrasives
13
Electrical11
Aftermarket Automotive
Supplies8
Safety5
Welding and Metal Repair
2
Other10
Product Mix
Regional Accounts
47
Strategic14
Kent Automotive
15
Bolt Supply11
Government 11
Other2
Customer Mix
copy 2019 Lawson Products Inc All rights reserved Confidential Material Reproduction In Whole or in Part Prohibited
Lawson Growth Strategy
Sales Growth Driven By
Foundational SupportERP Network
OptimizationSales
TransformationLean Six Sigma
Website
7
New Sales Reps
Sales RepProductivity
Acquisitions
copy 2019 Lawson Products Inc All rights reserved Confidential Material Reproduction In Whole or in Part Prohibited
2019 Focus Actions Across the Value Chain Driving Growth
Add New Sales Reps and Drive Rep Productivity
Sales Process Sales Reps
Customer Service Order
Entry
ProductManagement
PricingDC Operations Sourcing
Purchasing
bull Increase sales rep count
bull Onboardingprocesstraining
bull SalesManagement dashboard
bull EDI with customers
bull Reduction of cycle times
bull Order padbull Consolidation of
shipmentsbull Sales service reps
bull Leverage vendor drop-ship programs
bull Fleet maintenance focus
bull Pricing enhancements
bull Website
bull Reduce cycle timebull Refine ldquoPullrdquo
strategybull Freight
enhancementsbull Minimize
backordersbull Improve service
levelsbull Forecasting tool
bull Supplier negotiation process
bull Vendor metricsbull Electronic
communication
Information Technology ndash Integration of Web and SAPLean Six Sigma
8
copy 2019 Lawson Products Inc All rights reserved Confidential Material Reproduction In Whole or in Part Prohibited
Longer Sales Rep Tenure Drives Rep Productivity
9
$0
$50000
$100000
$150000
$200000
$250000
$300000
$350000
$400000
$450000
$500000
lt 12 Mos 1 - 2 Yrs 3 - 5 Yrs 5 - 10 Yrs gt 10 Yrs0
50
100
150
200
250
300
350
Aver
age
Annu
al S
ales
Tenure With Lawson (as of 93019)
Num
ber O
f Sal
es R
eps
Number of Reps Average Annual Sales
copy 2019 Lawson Products Inc All rights reserved Confidential Material Reproduction In Whole or in Part Prohibited
Historical Financial Performance
Recent sales growth and earnings expansion providing financial flexibility
10
$200000
$250000
$300000
$350000
$400000
2014 2015 2016 2017 2018 TTM93019
Consolidated Revenues
$0$5000
$10000$15000$20000$25000$30000$35000
2014 2015 2016 2017 2018 TTM93019
Adjusted Reg G EBITDA
-$15000
-$10000
-$5000
$0
$5000
$10000
$15000
2014 2015 2016 2017 2018 9302019
Net Cash(Debt)
$0
$2000
$4000
$6000
$8000
$10000
$12000
Q1 Q2 Q3 Q4
Quarterly Adjusted Reg G EBITDA
2017
20172017
2017
2018
20182018
2018
20192019
2019
copy 2019 Lawson Products Inc All rights reserved Confidential Material Reproduction In Whole or in Part Prohibited
Financial Highlights for Third Quarter 2019
bull Sales increased 71 YOY (74 excluding currency fluctuation)
bull MRO LawsonKent gross margins consistent at 609
bull Adjusted Reg G EBITDA margin improving 109 in Q3 2019 v 83 in Q3 2018 Continued investment in new sales reps and rep productivity
bull Key trends MRO operating leverage of 54 13 increase in sales rep productivity Continued government strength +30 YOY Growth across multiple segments and product categories Cash flow from operations of $103 million in Q3
11
copy 2019 Lawson Products Inc All rights reserved Confidential Material Reproduction In Whole or in Part Prohibited
Pursue Disciplined MampA
Reinvest for Growth
Return Capital
bull Increased our borrowing capacity to $1000 million (additional $500 million accordion) with our new borrowing agreement
bull Capital expenditures expected to be $20 - $30 million in 2019bull Growth initiatives add new reps and increase sales rep productivity
bull Share repurchase to offset award dilution opportunistic purchasesbull $75 million stock repurchase program announced on May 16 2019 $63
million remaining after repurchase of shares worth $12 million in August 2019
bull Bolt-on acquisitions to enhance core growth strategiesbull Closed Screw Products Inc acquisition on 10118
Maintain Strong Balance Sheet
bull $86 million cash on hand and positive cash position of $64 million at the end of Q3
bull Consistent free cash flow generation
Capital Allocation Priorities
12
copy 2019 Lawson Products Inc All rights reserved Confidential Material Reproduction In Whole or in Part Prohibited
Lawson Products Poised for Growth
bull Leverage Current Infrastructure
bull Continued Sales Growth
bull Foundational Investments Completed
bull Operational Excellence
bull Large Fragmented Market
13
copy 2019 Lawson Products Inc All rights reserved Confidential Material Reproduction In Whole or in Part Prohibited
For More Information
Contact
Ronald J KnutsonEVP CFOInvestor Relations(773) 304-5665ronknutsonlawsonproductscom
And see our Website athttpwwwlawsonproductscomcompany-infoinvestor-relationsjsp
14
copy 2019 Lawson Products Inc All rights reserved Confidential Material Reproduction In Whole or in Part Prohibited
Appendices
15
copy 2019 Lawson Products Inc All rights reserved Confidential Material Reproduction In Whole or in Part Prohibited
Significant Activities
16
Appendix P-1
August 2011 Implemented SAPOctober 2011 Commenced construction of new McCook Ill distribution center
May 2012 Relocated corporate headquartersJune 2012 Restructured senior team Announced $20M cost savings plan
Transitioned packaging facility to McCook Ill distribution centerEntered into new five-year $40M credit facilityAnnounced new CEO and President Michael G DeCataConsolidated Vernon Hills distribution center into McCook Ill
November 2012 Rolled out new website to existing web customersDecember 2012 Completed transition of US independent agents to employees
April 2013 Roll-out of new website to new web customersAprilMay 2013 McCook DC begins to ship customer ordersNovember 2013 Entered into sub-lease of headquarters space to generate $29M of future cash savingsDecember 2013 Ended year with over 800 sales reps ndash First increase in 8 yearsFebruary 2014 Closed on Automatic Screw Machine Products sale for net proceeds of $121M
June 2014 Entered into sale-leaseback of Reno distribution facility for net proceeds of $83MDecember 2014 Ended year with over 900 sales repsFebruary 2015 Held North American sales meeting
September 2015 Completed West Coast Fasteners acquisitionMarch 2016 Completed Perfect Products of Michigan acquisitionMay 2016 Completed F B Feeney acquisitionJune 2016 Expanded sales team to over 1000 sales reps
September 2016 Extended credit facitlity to August 2020November 2016 Completed Mattic Industries acquisition
March 2017 Consolidated Fairfield NJ distribution operations into McCook Ill and Suwanee GAMay 2017 Sold Fairfield NJ distribution center for a gain of $54M
October 2017 Completed Bolt Supply House acquisitionApril 2018 Opened MRO distribution center in Calgary Canada
October 2018 Completed Screw Products acquisition and added Bolt Supply branchJune 2019 Achieved Q2 98 adjusted EBITDA net of ASC 842 impact of 03
September 2019 Achieved Q3 109 adjusted EBITDA hired VP MampAOctober 2019 Entered into new five-year $100M credit facility with additional $50 million accordion feature
August 2012
October 2012
Adjusted EBITDA $ in 000s
Adjusted EBITDA Q4 2016Q1 2017Q2 2017Q3 2017Q4 201722192852451954433026
Adjusted EBITDA of Sales
Adjusted EBITDA of SalesQ3 2016Q4 2016Q1 2017Q2 2017Q3 2017Q4 201760926793828971926E-232964421005719377E-23822185292895721E-260248513452257152E-271948817596594883E-237528059231332088E-2
Adjusted Operating Income of Sales
Adjusted Operating IncomeQ3 2016Q4 2016Q1 2017Q2 2017Q3 2017Q4 201723045391147287538521196
Adjusted Op Inc $ in 000s
Adjusted EBITDA Q4 2016Q1 2017Q2 2017Q3 2017Q4 20175391147287538521196
Net Sales by Quarter $ in 000s
Net SalesQ1 2013Q2 2013Q3 2013Q4 2013Q1 2014Q2 2014Q3 2014Q4 2014Q1 2015672136831768235657386920472080741287028169904
Adjusted SGampA $ in 000s
Adjusted SGampA Q4 2015Q1 2016Q2 2016Q3 2016Q4 2016Q1 2017Q2 2017Q3 2017Q4 2017391634230341839404474008543732422664243946222
copy 2019 Lawson Products Inc All rights reserved Confidential Material Reproduction In Whole or in Part Prohibited
Regulation G ndash GAAP ReconciliationAppendix P-2
Non GAAP Reconciliation of Adjusted EBITDA to Sales Percentage
The Company reports its financial results in accordance with US generally accepted accounting principles (GAAP) However the Companys management believesthat certain non-GAAP financial measures may provide users of this financial information additional meaningful comparisons between current results and results inprior operating periods Management believes that these non-GAAP financial measures can provide additional meaningful reflection of underlying trends of thebusiness because they provide a comparison of historical information that excludes certain non-operational non-recurring or intermittently recurring items thatimpact the overall comparability See the table below for supplemental financial data and corresponding reconciliations to GAAP financial measures for quarterlyadjusted EBITDA as a percentage of net sales Non-GAAP financial measures should be viewed in addition to and not as an alternative for the Companys reportedresults prepared in accordance with GAAP
17
($ in thousands) Q1 2017 Q2 2017 Q3 2017 Q4 2017 Q1 2018 Q2 2018 Q3 2018 Q4 2018 Q1 2019 Q2 2019 Q3 2019
Net Sales 74617$ 75006$ 75651$ 80633$ 84459$ 90382$ 88530$ 86266$ 91343$ 96097$ 94779$
Operating Income (Loss) 712 7891 1090 243 1837 5554 (2266) 4085 5544 1623 6446 Depreciation amp Amortization 1705 1644 1591 1830 1686 1679 1755 1735 1478 1455 1468 EBITDA 2417 9535 2681 2073 3523 7233 (511) 5820 7022 3078 7914
Excluded CostsSeverance 465 (9) 139 144 628 64 31 126 27 1485 30 Stock Based Compensation (Benefit) (30) 415 2337 384 970 87 7637 (1186) 408 4839 2374 Acquisition Related Costs - - 286 425 - - 168 62 - - - Loss(Gain) on Disposal of Property - (5422) - - - - - - - - - Lease termination gain - - - - - (164) - - - - - Discontinued operation accrual - - - - - 529 - - - - - Building Impairment - - - - - - - 231 - - - Reg G Adjusted EBITDA 2852$ 4519$ 5443$ 3026$ 5121$ 7749$ 7325$ 5053$ 7457$ 9402$ 10318$
Adjusted EBITDA of Sales 38 60 72 38 61 86 83 59 82 98 109
Customer Mix
Regional Accounts48
Kent Automotive16
Regional AccountsStrategicKent AutomotiveBolt SupplyGovernment Screw ProductsOther047014000000000000001016011010002
ampDampF ampA
Product Mix
Fastening Systems23
Specialty Chemicals12
Fastening SystemsFluid PowerSpecialy ChemicalsCutting Tools and AbrasivesElectricalAftermarket Automotive SuppliesSafetyWelding and Metal RepairOther02401501201301100800500201
Number Of Sales Reps
Tenure With Lawson (as of 63019)
Average Annual Sales
Consolidated Revenues
Consolidated Revenues20142015201620172018TTM 63019285693275834276573305907349637362236Net Cash(Debt)2014201520162017201843646420798409580-101271060-1908Rep Count201320142015201620172018436468069169371009983994982
Adjusted Reg G EBITDA
Adjusted EBITDA20142015201620172018TTM 63019136581719912065158402524829237
Quarterly Adjusted Reg G EBITDA
2017Q1Q2Q3Q428524519544330262018Q1Q2Q3Q451217749732550532019Q1Q2Q3Q474579402
Adjusted EBITDA $ in 000s
Reg G Adjusted EBITDA Q1 2017Q2 2017Q3 2017Q4 20172852451954433026
Adjusted EBITDA of Sales
Adjusted EBITDA of SalesQ1 2017Q2 2017Q3 2017Q4 20173822185292895721E-260248513452257152E-271948817596594883E-237528059231332088E-2
Adjusted Operating Income of Sales
Adjusted Operating IncomeQ1 2017Q2 2017Q3 2017Q4 2017
Adjusted Op Inc $ in 000s
Reg G Adjusted EBITDA Q1 2017Q2 2017Q3 2017Q4 2017
copy 2019 Lawson Products Inc All rights reserved Confidential Material Reproduction In Whole or in Part Prohibited
Consolidated Balance Sheet Appendix P-4
18
ASSETSCurrent assetsCash and cash equivalents $ 8626 $ 11883Restricted cash 800 800Accounts receivable less allowance for doubtful accounts of $614 and $549 respectively
45162 37682
Inventories net 54894 52887Miscellaneous receivables and prepaid expenses 4270 3653Total current assets 113752 106905
Property plant and equipment net 16932 23548Deferred income taxes 17372 20592Goodwill 20582 20079Cash value of life insurance 14440 12599Intangible assets net 12468 13112Lease assets 11917 mdashOther assets 275 307Total assets $ 207738 $ 197142
LIABILITIES AND STOCKHOLDERSrsquo EQUITYCurrent liabilitiesRevolving lines of credit $ 2195 $ 10823Accounts payable 16325 15207Lease obligation 3781 mdashAccrued expenses and other liabilities 37873 40179Total current liabilities 60174 66209
Security bonus plan 11969 12413Lease obligation 10360 5213Deferred compensation 5915 5304Deferred tax liability 2879 2761Other liabilities 3460 6069Total liabilities 94757 97969
Stockholdersrsquo equityPreferred stock $1 par valueAuthorized - 500000 shares Issued and outstanding mdash None mdash mdashCommon stock $1 par value
Authorized - 35000000 sharesIssued - 9042597 and 9005716 shares respectivelyOutstanding - 8956981 and 8955930 shares respectively
Capital in excess of par value 17626 15623Retained earnings 89502 77338Treasury stock ndash 85616 and 49786 shares respectivelyAccumulated other comprehensive lossTotal stockholdersrsquo equity 112981 99173Total liabilities and stockholdersrsquo equity $ 207738 $ 197142
September 30 December 312019 2018
(Unaudited)
(2595) (1234)(595) (1560)
9043 9006
Customer Mix
Regional Accounts48
Kent Automotive16
Regional AccountsStrategicKent AutomotiveBolt SupplyGovernment Screw ProductsOther0470140000000000000010150110110002
ampDampF ampA
Product Mix
Fastening Systems23
Specialty Chemicals12
Fastening SystemsFluid PowerSpecialy ChemicalsCutting Tools and AbrasivesElectricalAftermarket Automotive SuppliesSafetyWelding and Metal RepairOther02401501201301100800500201
Number Of Sales Reps
Tenure With Lawson (as of 63019)
Average Annual Sales
Consolidated Revenues
Consolidated Revenues20142015201620172018TTM 93019285693275834276573305907349637368485Net Cash(Debt)2014201520162017201843738420798409580-1012710606431Rep Count201320142015201620172018437388069169371009983994993
Adjusted Reg G EBITDA
Adjusted EBITDA20142015201620172018TTM 93019136581719912065158402524832230
Quarterly Adjusted Reg G EBITDA
2017Q1Q2Q3Q428524519544330262018Q1Q2Q3Q451217749732550532019Q1Q2Q3Q47457940210318
Adjusted EBITDA $ in 000s
Reg G Adjusted EBITDA Q1 2017Q2 2017Q3 2017Q4 20172852451954433026
Adjusted EBITDA of Sales
Adjusted EBITDA of SalesQ1 2017Q2 2017Q3 2017Q4 20173822185292895721E-260248513452257152E-271948817596594883E-237528059231332088E-2
Adjusted Operating Income of Sales
Adjusted Operating IncomeQ1 2017Q2 2017Q3 2017Q4 2017
Adjusted Op Inc $ in 000s
Reg G Adjusted EBITDA Q1 2017Q2 2017Q3 2017Q4 2017
| September 30 | December 31 | ||||||||||
| 2019 | 2018 | ||||||||||
| ASSETS | (Unaudited) | ||||||||||
| Current assets | |||||||||||
| Cash and cash equivalents | $ | 8626 | $ | 11883 | |||||||
| Restricted cash | 800 | 800 | |||||||||
| Accounts receivable less allowance for doubtful accounts of $614 and $549 respectively | 45162 | 37682 | |||||||||
| Inventories net | 54894 | 52887 | |||||||||
| Miscellaneous receivables and prepaid expenses | 4270 | 3653 | |||||||||
| Total current assets | 113752 | 106905 | |||||||||
| Property plant and equipment net | 16932 | 23548 | |||||||||
| Deferred income taxes | 17372 | 20592 | |||||||||
| Goodwill | 20582 | 20079 | |||||||||
| Cash value of life insurance | 14440 | 12599 | |||||||||
| Intangible assets net | 12468 | 13112 | |||||||||
| Lease assets | 11917 | mdash | |||||||||
| Other assets | 275 | 307 | |||||||||
| Total assets | $ | 207738 | $ | 197142 | |||||||
| LIABILITIES AND STOCKHOLDERSrsquo EQUITY | |||||||||||
| Current liabilities | |||||||||||
| Revolving lines of credit | $ | 2195 | $ | 10823 | |||||||
| Accounts payable | 16325 | 15207 | |||||||||
| Lease obligation | 3781 | mdash | |||||||||
| Accrued expenses and other liabilities | 37873 | 40179 | |||||||||
| Total current liabilities | 60174 | 66209 | |||||||||
| Security bonus plan | 11969 | 12413 | |||||||||
| Lease obligation | 10360 | 5213 | |||||||||
| Deferred compensation | 5915 | 5304 | |||||||||
| Deferred tax liability | 2879 | 2761 | |||||||||
| Other liabilities | 3460 | 6069 | |||||||||
| Total liabilities | 94757 | 97969 | |||||||||
| Stockholdersrsquo equity | |||||||||||
| Preferred stock $1 par value | |||||||||||
| Authorized - 500000 shares Issued and outstanding mdash None | mdash | mdash | |||||||||
| Common stock $1 par value | |||||||||||
| Authorized - 35000000 shares | 9043 | 9006 | |||||||||
| Issued - 9042597 and 9005716 shares respectively | |||||||||||
| Outstanding - 8956981 and 8955930 shares respectively | |||||||||||
| Capital in excess of par value | 17626 | 15623 | |||||||||
| Retained earnings | 89502 | 77338 | |||||||||
| Treasury stock ndash 85616 and 49786 shares respectively | (2595) | (1234) | |||||||||
| Accumulated other comprehensive loss | (595) | (1560) | |||||||||
| Total stockholdersrsquo equity | 112981 | 99173 | |||||||||
| Total liabilities and stockholdersrsquo equity | $ | 207738 | $ | 197142 | |||||||
| Three Months Ended | |||||||||||||||||||||||||||||
| Jun 30 2019 | Mar 31 2019 | Dec 31 2018 | Sep 30 2018 | Jun 30 2018 | |||||||||||||||||||||||||
| Average daily net sales | $ | 1502 | $ | 1450 | $ | 1414 | $ | 1405 | $ | 1412 | |||||||||||||||||||
| Year over year increase | 63 | 82 | 70 | 170 | 205 | ||||||||||||||||||||||||
| Sequential quarter increase (decrease) | 36 | 25 | 06 | (05) | 53 | ||||||||||||||||||||||||
| Net Sales | $ | 96097 | $ | 91343 | $ | 86266 | $ | 88530 | $ | 90382 | |||||||||||||||||||
| Gross profit (1) | 51043 | 48923 | 46083 | 48108 | 49131 | ||||||||||||||||||||||||
| Gross profit percentage (1) | 531 | 536 | 534 | 543 | 544 | ||||||||||||||||||||||||
| Selling general amp administrative expenses | $ | 49420 | $ | 43379 | $ | 41998 | $ | 50374 | $ | 43577 | |||||||||||||||||||
| Operating income (loss) | $ | 1623 | $ | 5544 | $ | 4085 | $ | (2266) | $ | 5554 | |||||||||||||||||||
| Full Year | |||||||||||||||||||||||||||||||||||||||||||||||||||||||||||||||||||||||||||
| ($ in thousands) | Q1 2011 | Q2 2011 | Q3 2011 | Q4 2011 | Q1 2012 | Q2 2012 | Q3 2012 | Q4 2012 | Q1 2013 | Q2 2013 | Q3 2013 | Q4 2013 | Q1 2014 | Q2 2014 | Q3 2014 | Q4 2014 | Q1 2015 | Q2 2015 | Q3 2015 | Q4 2015 | Q1 2016 | Q2 2016 | Q3 2016 | Q4 2016 | Q1 2017 | Q2 2017 | Q3 2017 | Q4 2017 | Q1 2018 | Q2 2018 | Q3 2018 | Q4 2018 | Q1 2019 | Q2 2019 | Q3 2019 | 2014 | 2015 | ||||||||||||||||||||||||||||||||||||||
| Net Sales | $ 79255 | $ 80625 | $ 71490 | $ 69029 | $ 71364 | $ 69830 | $ 67863 | $ 64505 | $ 67213 | $ 68317 | $ 68235 | $ 65738 | $ 69204 | $ 72080 | $ 74128 | $ 70281 | $ 69904 | $ 70726 | $ 70243 | $ 64961 | $ 69711 | $ 69348 | $ 70199 | $ 67315 | $ 74617 | $ 75006 | $ 75651 | $ 80633 | $ 84459 | $ 90382 | $ 88530 | $ 86266 | $ 91343 | $ 96097 | $ 94779 | $ 285693 | $ 275834 | ||||||||||||||||||||||||||||||||||||||
| Operating Income (Loss) | 3542 | 1397 | (3480) | (6995) | (3466) | (42084) | (1740) | 2057 | (3530) | (201) | 870 | (3002) | (4713) | 1241 | 678 | (2169) | (947) | 3243 | 2810 | (2985) | 1169 | 29 | 2389 | (5044) | 712 | 7891 | 1090 | 243 | 1837 | 5554 | (2266) | 4085 | 5544 | 1623 | 6446 | (4963) | 2121 | ||||||||||||||||||||||||||||||||||||||
| Depreciation amp Amortization | 1260 | 1315 | 1160 | 1675 | 1715 | 1566 | 1963 | 1841 | 2061 | 2244 | 2367 | 2358 | 2295 | 2163 | 2160 | 2133 | 2096 | 2126 | 2119 | 2202 | 2187 | 2226 | 1973 | 1680 | 1705 | 1644 | 1591 | 1830 | 1686 | 1679 | 1755 | 1735 | 1478 | 1455 | 1468 | 8751 | 8543 | ||||||||||||||||||||||||||||||||||||||
| EBITDA | 4802 | 2712 | (2320) | (5320) | (1751) | (40518) | 223 | 3898 | (1469) | 2043 | 3237 | (644) | (2418) | 3404 | 2838 | (36) | 1149 | 5369 | 4929 | (783) | 3356 | 2255 | 4362 | (3364) | 2417 | 9535 | 2681 | 2073 | 3523 | 7233 | (511) | 5820 | 7022 | 3078 | 7914 | 3788 | 10664 | ||||||||||||||||||||||||||||||||||||||
| Excluded Costs | |||||||||||||||||||||||||||||||||||||||||||||||||||||||||||||||||||||||||||
| Severance | 745 | 465 | 282 | 122 | 185 | 6585 | 1410 | (159) | - 0 | 2 | 962 | (127) | 728 | 290 | (328) | (59) | 571 | 50 | 372 | 280 | 204 | 143 | 367 | 1662 | 465 | (9) | 139 | 144 | 628 | 64 | 31 | 126 | 27 | 1485 | 30 | 631 | 1273 | ||||||||||||||||||||||||||||||||||||||
| Stock Based Compensation (Benefit) | 227 | (95) | (538) | 467 | 198 | (1015) | 77 | 434 | 1596 | 76 | 33 | 562 | 1125 | 408 | 2423 | 2443 | (541) | 971 | (30) | 1693 | (1217) | 515 | (630) | 3801 | (30) | 415 | 2337 | 384 | 970 | 87 | 7637 | (1186) | 408 | 4839 | 2374 | 6399 | 2093 | ||||||||||||||||||||||||||||||||||||||
| Acquisition Related Costs | - 0 | - 0 | - 0 | - 0 | - 0 | - 0 | 310 | 32 | 115 | 198 | 178 | 120 | - 0 | - 0 | 286 | 425 | - 0 | - 0 | 168 | 62 | - 0 | - 0 | - 0 | ||||||||||||||||||||||||||||||||||||||||||||||||||||
| ERP Implementation Costs | 1902 | 2388 | 2344 | 339 | - 0 | - 0 | - 0 | - 0 | - 0 | - 0 | - 0 | - 0 | - 0 | - 0 | - 0 | - 0 | - 0 | - 0 | - 0 | - 0 | - 0 | - 0 | - 0 | - 0 | - 0 | - 0 | - 0 | - 0 | - 0 | - 0 | - 0 | - 0 | - 0 | ||||||||||||||||||||||||||||||||||||||||||
| Loss(Gain) on Disposal of Property | - 0 | - 0 | - 0 | 22 | - 0 | (2122) | (11) | (1588) | - 0 | - 0 | (36) | 32 | - 0 | - 0 | 97 | 45 | - 0 | - 0 | (2) | 9 | - 0 | - 0 | - 0 | - 0 | - 0 | (5422) | - 0 | - 0 | - 0 | - 0 | - 0 | - 0 | - 0 | - 0 | - 0 | 142 | 7 | ||||||||||||||||||||||||||||||||||||||
| Legal Settlement | - 0 | - 0 | - 0 | - 0 | - 0 | - 0 | - 0 | - 0 | - 0 | - 0 | - 0 | - 0 | - 0 | - 0 | (688) | - 0 | - 0 | - 0 | - 0 | - 0 | - 0 | - 0 | - 0 | - 0 | - 0 | - 0 | - 0 | - 0 | - 0 | - 0 | - 0 | - 0 | (688) | - 0 | |||||||||||||||||||||||||||||||||||||||||
| Employment Tax Matter | - 0 | - 0 | - 0 | 1200 | - 0 | - 0 | - 0 | - 0 | - 0 | - 0 | - 0 | (400) | - 0 | - 0 | - 0 | - 0 | - 0 | - 0 | - 0 | - 0 | - 0 | - 0 | - 0 | - 0 | - 0 | - 0 | - 0 | - 0 | - 0 | - 0 | - 0 | - 0 | - 0 | - 0 | |||||||||||||||||||||||||||||||||||||||||
| Lease termination gain | - 0 | - 0 | - 0 | - 0 | - 0 | - 0 | - 0 | - 0 | - 0 | - 0 | - 0 | 2928 | - 0 | - 0 | - 0 | - 0 | - 0 | - 0 | - 0 | - 0 | - 0 | - 0 | - 0 | - 0 | - 0 | - 0 | - 0 | - 0 | - 0 | (164) | - 0 | - 0 | - 0 | - 0 | - 0 | - 0 | - 0 | ||||||||||||||||||||||||||||||||||||||
| Goodwill Impairment | - 0 | - 0 | - 0 | - 0 | - 0 | 28306 | - 0 | - 0 | - 0 | - 0 | - 0 | - 0 | - 0 | - 0 | - 0 | - 0 | - 0 | - 0 | - 0 | - 0 | - 0 | - 0 | - 0 | - 0 | - 0 | - 0 | - 0 | - 0 | - 0 | - 0 | - 0 | - 0 | - 0 | - 0 | |||||||||||||||||||||||||||||||||||||||||
| Inventory Rationalization | - 0 | - 0 | - 0 | - 0 | - 0 | 3893 | - 0 | - 0 | - 0 | - 0 | - 0 | - 0 | - 0 | - 0 | - 0 | - 0 | - 0 | - 0 | - 0 | - 0 | - 0 | - 0 | - 0 | - 0 | - 0 | - 0 | - 0 | - 0 | - 0 | - 0 | - 0 | - 0 | - 0 | - 0 | |||||||||||||||||||||||||||||||||||||||||
| Discontinued operation accrual | - 0 | - 0 | - 0 | - 0 | - 0 | - 0 | - 0 | - 0 | - 0 | - 0 | - 0 | - 0 | - 0 | - 0 | - 0 | 340 | - 0 | - 0 | - 0 | 931 | - 0 | - 0 | - 0 | - 0 | - 0 | - 0 | - 0 | - 0 | - 0 | 529 | - 0 | - 0 | - 0 | - 0 | - 0 | 340 | 931 | ||||||||||||||||||||||||||||||||||||||
| North American sales meeting | - 0 | - 0 | - 0 | - 0 | - 0 | - 0 | - 0 | - 0 | 1225 | - 0 | - 0 | - 0 | - 0 | - 0 | - 0 | - 0 | 1889 | - 0 | - 0 | - 0 | - 0 | - 0 | - 0 | - 0 | - 0 | - 0 | - 0 | - 0 | - 0 | - 0 | - 0 | - 0 | - 0 | 1889 | |||||||||||||||||||||||||||||||||||||||||
| Property Impairment Loss | - 0 | - 0 | - 0 | - 0 | - 0 | - 0 | - 0 | - 0 | - 0 | - 0 | - 0 | - 0 | 2914 | 132 | - 0 | - 0 | - 0 | - 0 | - 0 | - 0 | - 0 | - 0 | - 0 | - 0 | - 0 | - 0 | - 0 | - 0 | - 0 | - 0 | - 0 | - 0 | 3046 | - 0 | |||||||||||||||||||||||||||||||||||||||||
| Building Impairment | - 0 | - 0 | - 0 | - 0 | - 0 | - 0 | - 0 | 231 | - 0 | - 0 | - 0 | ||||||||||||||||||||||||||||||||||||||||||||||||||||||||||||||||
| Reg G Adjusted EBITDA | $ 7676 | $ 5470 | $ (232) | $ (3170) | $ (1368) | $ (4871) | $ 1699 | $ 2585 | $ 1352 | $ 2121 | $ 4196 | $ 2351 | $ 2349 | $ 4234 | $ 4342 | $ 2733 | $ 3068 | $ 6390 | $ 5579 | $ 2162 | $ 2458 | $ 3111 | $ 4277 | $ 2219 | $ 2852 | $ 4519 | $ 5443 | $ 3026 | $ 5121 | $ 7749 | $ 7325 | $ 5053 | $ 7457 | $ 9402 | $ 10318 | $ 13658 | $ 17199 | ||||||||||||||||||||||||||||||||||||||
| Adjusted EBITDA of Sales | 97 | 68 | -03 | -46 | -19 | -70 | 25 | 40 | 20 | 31 | 61 | 36 | 34 | 59 | 59 | 39 | 44 | 90 | 79 | 33 | 35 | 45 | 61 | 33 | 38 | 60 | 72 | 38 | 61 | 86 | 83 | 59 | 82 | 98 | 109 | 48 | 62 | ||||||||||||||||||||||||||||||||||||||
| Annual Adjusted EBITDA of Sales | 44 | 58 | |||||||||||||||||||||||||||||||||||||||||||||||||||||||||||||||||||||||||
| Adjusted Operating Income | (3083) | (6437) | (264) | 744 | (709) | (123) | 1829 | (7) | 54 | 2071 | 2182 | 600 | 972 | 4264 | 3460 | (40) | 271 | 885 | 2304 | 539 | 1147 | 2875 | 3852 | 1196 | 3435 | 6070 | 5570 | 3087 | 5979 | 7947 | 8850 | 4907 | 8314 | ||||||||||||||||||||||||||||||||||||||||||
| Consolidated Revenues | |||||||
| 2013 | 269503 | ||||||
| 2014 | 285693 | ||||||
| 2015 | 275834 | ||||||
| 2016 | 276573 | ||||||
| 2017 | 305907 | ||||||
| 2018 | 349637 | ||||||
| TTM 93019 | 368485 | ||||||
| Net Cash(Debt) | |||||||
| 2013 | (15380) | ||||||
| 2014 | 4207 | ||||||
| 2015 | 9840 | ||||||
| 2016 | 9580 | ||||||
| 2017 | (10127) | ||||||
| 2018 | 1060 | ||||||
| 93019 | 6431 | ||||||
| Rep Count | |||||||
| 2013 | 806 | ||||||
| 2014 | 916 | ||||||
| 2015 | 937 | ||||||
| 2016 | 1009 | ||||||
| 2017 | 983 | ||||||
| 2018 | 994 | ||||||
| 93019 | 993 | ||||||
| Adjusted OI | DampA | Adjusted EBITDA | |||||
| 2013 | 990 | 9030 | 10020 | ||||
| 2014 | 4907 | 8751 | 13658 | ||||
| 2015 | 8315 | 8543 | 17199 | ||||
| 2016 | 3388 | 8066 | 12065 | ||||
| 2017 | 15840 | ||||||
| 2018 | 25248 | ||||||
| TTM 93019 | 32230 | ||||||
| Reg G EBITDA By Quarter | |||||||
| Quarter | 2017 | 2018 | 2019 | ||||
| Q1 | 2852 | 5121 | 7457 | ||||
| Q2 | 4519 | 7749 | 9402 | ||||
| Q3 | 5443 | 7325 | 10318 | ||||
| Q4 | 3026 | 5053 |
| Months of Experience | Average Annual Sales | Number of Reps | |||
| lt 12 Mos | ERRORVALUE | ERRORVALUE | |||
| 1 - 2 Yrs | ERRORVALUE | ERRORVALUE | |||
| 3 - 5 Yrs | ERRORVALUE | ERRORVALUE | |||
| 5 - 10 Yrs | ERRORVALUE | ERRORVALUE | |||
| gt 10 Yrs | ERRORVALUE | ERRORVALUE | |||
| ERRORVALUE | |||||
| Excludes ISR MSS CRS | |||||
| Excludes Freight | |||||
| Product mix | ||||||||
| Verticals | Q3 2019 Sales | |||||||
| Fastening Systems | 240 | 22485606 | ||||||
| Fluid Power | 151 | 14156064 | ||||||
| Specialy Chemicals | 117 | 10917433 | ||||||
| Cutting Tools and Abrasives | 131 | 12296596 | ||||||
| Electrical | 104 | 9724849 | ||||||
| Aftermarket Automotive Supplies | 76 | 7154688 | ||||||
| Safety | 47 | 4445846 | ||||||
| Welding and Metal Repair | 13 | 1218030 | ||||||
| Other | 120 | 11237322 | ||||||
| Total | 100 | 93636434 | ||||||
| Verticals | YTD 2019 Sales | |||||||
| Fastening Systems | 24 | 66611555 | ||||||
| Fluid Power | 15 | 42224416 | ||||||
| Specialy Chemicals | 12 | 32166853 | ||||||
| Cutting Tools and Abrasives | 13 | 36587482 | ||||||
| Electrical | 11 | 30150144 | ||||||
| Aftermarket Automotive Supplies | 8 | 21960561 | ||||||
| Safety | 5 | 13072228 | ||||||
| Welding and Metal Repair | 2 | 4306548 | ||||||
| Other | 10 | 31279779 | ||||||
| Total | 100 | 278359566 |
| Lawson core customer mix | ||||||||
| Account Tyoe | Q3 | |||||||
| Regional Accounts | 43045893 | 45 | ||||||
| Strategic | 14086813 | 15 | ||||||
| Kent Automotive | 14300065 | 15 | ||||||
| Bolt Supply | 11318703 | 12 | ||||||
| Government | 10291732 | 11 | ||||||
| Screw Products | 0 | 0 | ||||||
| Other (1) | 1735236 | 2 | ||||||
| Total | 94778443 | 100 | ||||||
| Account Tyoe | YTD September | |||||||
| Regional Accounts | 131389537 | 47 | ||||||
| Strategic | 40364305 | 14 | ||||||
| Kent Automotive | 43371411 | 15 | ||||||
| Bolt Supply | 31324209 | 11 | ||||||
| Government | 29794959 | 11 | ||||||
| Screw Products | 0 | 0 | ||||||
| Other | 5974302 | 2 | ||||||
| Total | 282218723 | 100 | ||||||
| Total Reported |
| September 30 | December 31 | ||||||||||
| 2019 | 2018 | ||||||||||
| ASSETS | (Unaudited) | ||||||||||
| Current assets | |||||||||||
| Cash and cash equivalents | $ | 8626 | $ | 11883 | |||||||
| Restricted cash | 800 | 800 | |||||||||
| Accounts receivable less allowance for doubtful accounts of $614 and $549 respectively | 45162 | 37682 | |||||||||
| Inventories net | 54894 | 52887 | |||||||||
| Miscellaneous receivables and prepaid expenses | 4270 | 3653 | |||||||||
| Total current assets | 113752 | 106905 | |||||||||
| Property plant and equipment net | 16932 | 23548 | |||||||||
| Deferred income taxes | 17372 | 20592 | |||||||||
| Goodwill | 20582 | 20079 | |||||||||
| Cash value of life insurance | 14440 | 12599 | |||||||||
| Intangible assets net | 12468 | 13112 | |||||||||
| Lease assets | 11917 | mdash | |||||||||
| Other assets | 275 | 307 | |||||||||
| Total assets | $ | 207738 | $ | 197142 | |||||||
| LIABILITIES AND STOCKHOLDERSrsquo EQUITY | |||||||||||
| Current liabilities | |||||||||||
| Revolving lines of credit | $ | 2195 | $ | 10823 | |||||||
| Accounts payable | 16325 | 15207 | |||||||||
| Lease obligation | 3781 | mdash | |||||||||
| Accrued expenses and other liabilities | 37873 | 40179 | |||||||||
| Total current liabilities | 60174 | 66209 | |||||||||
| Security bonus plan | 11969 | 12413 | |||||||||
| Lease obligation | 10360 | 5213 | |||||||||
| Deferred compensation | 5915 | 5304 | |||||||||
| Deferred tax liability | 2879 | 2761 | |||||||||
| Other liabilities | 3460 | 6069 | |||||||||
| Total liabilities | 94757 | 97969 | |||||||||
| Stockholdersrsquo equity | |||||||||||
| Preferred stock $1 par value | |||||||||||
| Authorized - 500000 shares Issued and outstanding mdash None | mdash | mdash | |||||||||
| Common stock $1 par value | |||||||||||
| Authorized - 35000000 shares | 9043 | 9006 | |||||||||
| Issued - 9042597 and 9005716 shares respectively | |||||||||||
| Outstanding - 8956981 and 8955930 shares respectively | |||||||||||
| Capital in excess of par value | 17626 | 15623 | |||||||||
| Retained earnings | 89502 | 77338 | |||||||||
| Treasury stock ndash 85616 and 49786 shares respectively | (2595) | (1234) | |||||||||
| Accumulated other comprehensive loss | (595) | (1560) | |||||||||
| Total stockholdersrsquo equity | 112981 | 99173 | |||||||||
| Total liabilities and stockholdersrsquo equity | $ | 207738 | $ | 197142 | |||||||
| Three Months Ended | |||||||||||||||||||||||||||||
| Jun 30 2019 | Mar 31 2019 | Dec 31 2018 | Sep 30 2018 | Jun 30 2018 | |||||||||||||||||||||||||
| Average daily net sales | $ | 1502 | $ | 1450 | $ | 1414 | $ | 1405 | $ | 1412 | |||||||||||||||||||
| Year over year increase | 63 | 82 | 70 | 170 | 205 | ||||||||||||||||||||||||
| Sequential quarter increase (decrease) | 36 | 25 | 06 | (05) | 53 | ||||||||||||||||||||||||
| Net Sales | $ | 96097 | $ | 91343 | $ | 86266 | $ | 88530 | $ | 90382 | |||||||||||||||||||
| Gross profit (1) | 51043 | 48923 | 46083 | 48108 | 49131 | ||||||||||||||||||||||||
| Gross profit percentage (1) | 531 | 536 | 534 | 543 | 544 | ||||||||||||||||||||||||
| Selling general amp administrative expenses | $ | 49420 | $ | 43379 | $ | 41998 | $ | 50374 | $ | 43577 | |||||||||||||||||||
| Operating income (loss) | $ | 1623 | $ | 5544 | $ | 4085 | $ | (2266) | $ | 5554 | |||||||||||||||||||
| Full Year | |||||||||||||||||||||||||||||||||||||||||||||||||||||||||||||||||||||||||||
| ($ in thousands) | Q1 2011 | Q2 2011 | Q3 2011 | Q4 2011 | Q1 2012 | Q2 2012 | Q3 2012 | Q4 2012 | Q1 2013 | Q2 2013 | Q3 2013 | Q4 2013 | Q1 2014 | Q2 2014 | Q3 2014 | Q4 2014 | Q1 2015 | Q2 2015 | Q3 2015 | Q4 2015 | Q1 2016 | Q2 2016 | Q3 2016 | Q4 2016 | Q1 2017 | Q2 2017 | Q3 2017 | Q4 2017 | Q1 2018 | Q2 2018 | Q3 2018 | Q4 2018 | Q1 2019 | Q2 2019 | Q3 2019 | 2014 | 2015 | ||||||||||||||||||||||||||||||||||||||
| Net Sales | $ 79255 | $ 80625 | $ 71490 | $ 69029 | $ 71364 | $ 69830 | $ 67863 | $ 64505 | $ 67213 | $ 68317 | $ 68235 | $ 65738 | $ 69204 | $ 72080 | $ 74128 | $ 70281 | $ 69904 | $ 70726 | $ 70243 | $ 64961 | $ 69711 | $ 69348 | $ 70199 | $ 67315 | $ 74617 | $ 75006 | $ 75651 | $ 80633 | $ 84459 | $ 90382 | $ 88530 | $ 86266 | $ 91343 | $ 96097 | $ 94779 | $ 285693 | $ 275834 | ||||||||||||||||||||||||||||||||||||||
| Operating Income (Loss) | 3542 | 1397 | (3480) | (6995) | (3466) | (42084) | (1740) | 2057 | (3530) | (201) | 870 | (3002) | (4713) | 1241 | 678 | (2169) | (947) | 3243 | 2810 | (2985) | 1169 | 29 | 2389 | (5044) | 712 | 7891 | 1090 | 243 | 1837 | 5554 | (2266) | 4085 | 5544 | 1623 | 6446 | (4963) | 2121 | ||||||||||||||||||||||||||||||||||||||
| Depreciation amp Amortization | 1260 | 1315 | 1160 | 1675 | 1715 | 1566 | 1963 | 1841 | 2061 | 2244 | 2367 | 2358 | 2295 | 2163 | 2160 | 2133 | 2096 | 2126 | 2119 | 2202 | 2187 | 2226 | 1973 | 1680 | 1705 | 1644 | 1591 | 1830 | 1686 | 1679 | 1755 | 1735 | 1478 | 1455 | 1468 | 8751 | 8543 | ||||||||||||||||||||||||||||||||||||||
| EBITDA | 4802 | 2712 | (2320) | (5320) | (1751) | (40518) | 223 | 3898 | (1469) | 2043 | 3237 | (644) | (2418) | 3404 | 2838 | (36) | 1149 | 5369 | 4929 | (783) | 3356 | 2255 | 4362 | (3364) | 2417 | 9535 | 2681 | 2073 | 3523 | 7233 | (511) | 5820 | 7022 | 3078 | 7914 | 3788 | 10664 | ||||||||||||||||||||||||||||||||||||||
| Excluded Costs | |||||||||||||||||||||||||||||||||||||||||||||||||||||||||||||||||||||||||||
| Severance | 745 | 465 | 282 | 122 | 185 | 6585 | 1410 | (159) | - 0 | 2 | 962 | (127) | 728 | 290 | (328) | (59) | 571 | 50 | 372 | 280 | 204 | 143 | 367 | 1662 | 465 | (9) | 139 | 144 | 628 | 64 | 31 | 126 | 27 | 1485 | 30 | 631 | 1273 | ||||||||||||||||||||||||||||||||||||||
| Stock Based Compensation (Benefit) | 227 | (95) | (538) | 467 | 198 | (1015) | 77 | 434 | 1596 | 76 | 33 | 562 | 1125 | 408 | 2423 | 2443 | (541) | 971 | (30) | 1693 | (1217) | 515 | (630) | 3801 | (30) | 415 | 2337 | 384 | 970 | 87 | 7637 | (1186) | 408 | 4839 | 2374 | 6399 | 2093 | ||||||||||||||||||||||||||||||||||||||
| Acquisition Related Costs | - 0 | - 0 | - 0 | - 0 | - 0 | - 0 | 310 | 32 | 115 | 198 | 178 | 120 | - 0 | - 0 | 286 | 425 | - 0 | - 0 | 168 | 62 | - 0 | - 0 | - 0 | ||||||||||||||||||||||||||||||||||||||||||||||||||||
| ERP Implementation Costs | 1902 | 2388 | 2344 | 339 | - 0 | - 0 | - 0 | - 0 | - 0 | - 0 | - 0 | - 0 | - 0 | - 0 | - 0 | - 0 | - 0 | - 0 | - 0 | - 0 | - 0 | - 0 | - 0 | - 0 | - 0 | - 0 | - 0 | - 0 | - 0 | - 0 | - 0 | - 0 | - 0 | ||||||||||||||||||||||||||||||||||||||||||
| Loss(Gain) on Disposal of Property | - 0 | - 0 | - 0 | 22 | - 0 | (2122) | (11) | (1588) | - 0 | - 0 | (36) | 32 | - 0 | - 0 | 97 | 45 | - 0 | - 0 | (2) | 9 | - 0 | - 0 | - 0 | - 0 | - 0 | (5422) | - 0 | - 0 | - 0 | - 0 | - 0 | - 0 | - 0 | - 0 | - 0 | 142 | 7 | ||||||||||||||||||||||||||||||||||||||
| Legal Settlement | - 0 | - 0 | - 0 | - 0 | - 0 | - 0 | - 0 | - 0 | - 0 | - 0 | - 0 | - 0 | - 0 | - 0 | (688) | - 0 | - 0 | - 0 | - 0 | - 0 | - 0 | - 0 | - 0 | - 0 | - 0 | - 0 | - 0 | - 0 | - 0 | - 0 | - 0 | - 0 | (688) | - 0 | |||||||||||||||||||||||||||||||||||||||||
| Employment Tax Matter | - 0 | - 0 | - 0 | 1200 | - 0 | - 0 | - 0 | - 0 | - 0 | - 0 | - 0 | (400) | - 0 | - 0 | - 0 | - 0 | - 0 | - 0 | - 0 | - 0 | - 0 | - 0 | - 0 | - 0 | - 0 | - 0 | - 0 | - 0 | - 0 | - 0 | - 0 | - 0 | - 0 | - 0 | |||||||||||||||||||||||||||||||||||||||||
| Lease termination gain | - 0 | - 0 | - 0 | - 0 | - 0 | - 0 | - 0 | - 0 | - 0 | - 0 | - 0 | 2928 | - 0 | - 0 | - 0 | - 0 | - 0 | - 0 | - 0 | - 0 | - 0 | - 0 | - 0 | - 0 | - 0 | - 0 | - 0 | - 0 | - 0 | (164) | - 0 | - 0 | - 0 | - 0 | - 0 | - 0 | - 0 | ||||||||||||||||||||||||||||||||||||||
| Goodwill Impairment | - 0 | - 0 | - 0 | - 0 | - 0 | 28306 | - 0 | - 0 | - 0 | - 0 | - 0 | - 0 | - 0 | - 0 | - 0 | - 0 | - 0 | - 0 | - 0 | - 0 | - 0 | - 0 | - 0 | - 0 | - 0 | - 0 | - 0 | - 0 | - 0 | - 0 | - 0 | - 0 | - 0 | - 0 | |||||||||||||||||||||||||||||||||||||||||
| Inventory Rationalization | - 0 | - 0 | - 0 | - 0 | - 0 | 3893 | - 0 | - 0 | - 0 | - 0 | - 0 | - 0 | - 0 | - 0 | - 0 | - 0 | - 0 | - 0 | - 0 | - 0 | - 0 | - 0 | - 0 | - 0 | - 0 | - 0 | - 0 | - 0 | - 0 | - 0 | - 0 | - 0 | - 0 | - 0 | |||||||||||||||||||||||||||||||||||||||||
| Discontinued operation accrual | - 0 | - 0 | - 0 | - 0 | - 0 | - 0 | - 0 | - 0 | - 0 | - 0 | - 0 | - 0 | - 0 | - 0 | - 0 | 340 | - 0 | - 0 | - 0 | 931 | - 0 | - 0 | - 0 | - 0 | - 0 | - 0 | - 0 | - 0 | - 0 | 529 | - 0 | - 0 | - 0 | - 0 | - 0 | 340 | 931 | ||||||||||||||||||||||||||||||||||||||
| North American sales meeting | - 0 | - 0 | - 0 | - 0 | - 0 | - 0 | - 0 | - 0 | 1225 | - 0 | - 0 | - 0 | - 0 | - 0 | - 0 | - 0 | 1889 | - 0 | - 0 | - 0 | - 0 | - 0 | - 0 | - 0 | - 0 | - 0 | - 0 | - 0 | - 0 | - 0 | - 0 | - 0 | - 0 | 1889 | |||||||||||||||||||||||||||||||||||||||||
| Property Impairment Loss | - 0 | - 0 | - 0 | - 0 | - 0 | - 0 | - 0 | - 0 | - 0 | - 0 | - 0 | - 0 | 2914 | 132 | - 0 | - 0 | - 0 | - 0 | - 0 | - 0 | - 0 | - 0 | - 0 | - 0 | - 0 | - 0 | - 0 | - 0 | - 0 | - 0 | - 0 | - 0 | 3046 | - 0 | |||||||||||||||||||||||||||||||||||||||||
| Building Impairment | - 0 | - 0 | - 0 | - 0 | - 0 | - 0 | - 0 | 231 | - 0 | - 0 | - 0 | ||||||||||||||||||||||||||||||||||||||||||||||||||||||||||||||||
| Reg G Adjusted EBITDA | $ 7676 | $ 5470 | $ (232) | $ (3170) | $ (1368) | $ (4871) | $ 1699 | $ 2585 | $ 1352 | $ 2121 | $ 4196 | $ 2351 | $ 2349 | $ 4234 | $ 4342 | $ 2733 | $ 3068 | $ 6390 | $ 5579 | $ 2162 | $ 2458 | $ 3111 | $ 4277 | $ 2219 | $ 2852 | $ 4519 | $ 5443 | $ 3026 | $ 5121 | $ 7749 | $ 7325 | $ 5053 | $ 7457 | $ 9402 | $ 10318 | $ 13658 | $ 17199 | ||||||||||||||||||||||||||||||||||||||
| Adjusted EBITDA of Sales | 97 | 68 | -03 | -46 | -19 | -70 | 25 | 40 | 20 | 31 | 61 | 36 | 34 | 59 | 59 | 39 | 44 | 90 | 79 | 33 | 35 | 45 | 61 | 33 | 38 | 60 | 72 | 38 | 61 | 86 | 83 | 59 | 82 | 98 | 109 | 48 | 62 | ||||||||||||||||||||||||||||||||||||||
| Annual Adjusted EBITDA of Sales | 44 | 58 | |||||||||||||||||||||||||||||||||||||||||||||||||||||||||||||||||||||||||
| Adjusted Operating Income | (3083) | (6437) | (264) | 744 | (709) | (123) | 1829 | (7) | 54 | 2071 | 2182 | 600 | 972 | 4264 | 3460 | (40) | 271 | 885 | 2304 | 539 | 1147 | 2875 | 3852 | 1196 | 3435 | 6070 | 5570 | 3087 | 5979 | 7947 | 8850 | 4907 | 8314 | ||||||||||||||||||||||||||||||||||||||||||
| Consolidated Revenues | |||||||
| 2013 | 269503 | ||||||
| 2014 | 285693 | ||||||
| 2015 | 275834 | ||||||
| 2016 | 276573 | ||||||
| 2017 | 305907 | ||||||
| 2018 | 349637 | ||||||
| TTM 63019 | 362236 | ||||||
| Net Cash(Debt) | |||||||
| 2013 | (15380) | ||||||
| 2014 | 4207 | ||||||
| 2015 | 9840 | ||||||
| 2016 | 9580 | ||||||
| 2017 | (10127) | ||||||
| 2018 | 1060 | ||||||
| 63019 | (1908) | ||||||
| Rep Count | |||||||
| 2013 | 806 | ||||||
| 2014 | 916 | ||||||
| 2015 | 937 | ||||||
| 2016 | 1009 | ||||||
| 2017 | 983 | ||||||
| 2018 | 994 | ||||||
| 63019 | 982 | ||||||
| Adjusted OI | DampA | Adjusted EBITDA | |||||
| 2013 | 990 | 9030 | 10020 | ||||
| 2014 | 4907 | 8751 | 13658 | ||||
| 2015 | 8315 | 8543 | 17199 | ||||
| 2016 | 3388 | 8066 | 12065 | ||||
| 2017 | 15840 | ||||||
| 2018 | 25248 | ||||||
| TTM 63019 | 29237 | ||||||
| Reg G EBITDA By Quarter | |||||||
| Quarter | 2017 | 2018 | 2019 | ||||
| Q1 | 2852 | 5121 | 7457 | ||||
| Q2 | 4519 | 7749 | 9402 | ||||
| Q3 | 5443 | 7325 | |||||
| Q4 | 3026 | 5053 |
| Months of Experience | Average Annual Sales | Number of Reps | |||
| lt 12 Mos | ERRORVALUE | ERRORVALUE | |||
| 1 - 2 Yrs | ERRORVALUE | ERRORVALUE | |||
| 3 - 5 Yrs | ERRORVALUE | ERRORVALUE | |||
| 5 - 10 Yrs | ERRORVALUE | ERRORVALUE | |||
| gt 10 Yrs | ERRORVALUE | ERRORVALUE | |||
| ERRORVALUE | |||||
| Excludes ISR MSS CRS | |||||
| Excludes Freight | |||||
| Product mix | ||||||||
| Verticals | Q2 2019 Sales | |||||||
| Fastening Systems | 243 | 23008646 | ||||||
| Fluid Power | 152 | 14395529 | ||||||
| Specialy Chemicals | 117 | 11074332 | ||||||
| Cutting Tools and Abrasives | 130 | 12319702 | ||||||
| Electrical | 107 | 10102828 | ||||||
| Aftermarket Automotive Supplies | 77 | 7255974 | ||||||
| Safety | 47 | 4458217 | ||||||
| Welding and Metal Repair | 16 | 1539172 | ||||||
| Other | 112 | 10633378 | ||||||
| Total | 100 | 94787779 | ||||||
| Verticals | YTD 2019 Sales | |||||||
| Fastening Systems | 24 | 44125949 | ||||||
| Fluid Power | 15 | 28068352 | ||||||
| Specialy Chemicals | 12 | 21249420 | ||||||
| Cutting Tools and Abrasives | 13 | 24290887 | ||||||
| Electrical | 11 | 20425294 | ||||||
| Aftermarket Automotive Supplies | 8 | 14805874 | ||||||
| Safety | 5 | 8626381 | ||||||
| Welding and Metal Repair | 2 | 3088518 | ||||||
| Other | 10 | 20042457 | ||||||
| Total | 100 | 184723132 |
| Lawson core customer mix | ||||||||
| Account Tyoe | Q2 | |||||||
| Regional Accounts | 44933707 | 47 | ||||||
| Strategic | 13542786 | 14 | ||||||
| Kent Automotive | 14370813 | 15 | ||||||
| Bolt Supply | 11129675 | 12 | ||||||
| Government | 10087561 | 10 | ||||||
| Screw Products | 0 | 0 | ||||||
| Other (1) | 1428268 | 1 | ||||||
| Total | 96097363 | 100 | ||||||
| Account Tyoe | YTD June | |||||||
| Regional Accounts | 88400675 | 47 | ||||||
| Strategic | 26218365 | 14 | ||||||
| Kent Automotive | 29071347 | 16 | ||||||
| Bolt Supply | 20005505 | 11 | ||||||
| Government | 19505323 | 10 | ||||||
| Screw Products | 0 | 0 | ||||||
| Other | 4239066 | 2 | ||||||
| Total | 187440280 | 100 | ||||||
| Total Reported |
| August 2011 | OslashImplemented SAP | ||
| October 2011 | OslashCommenced construction of new McCook Ill distribution center | ||
| May 2012 | OslashRelocated corporate headquarters | ||
| June 2012 | OslashRestructured senior team Announced $20M cost savings plan | ||
| August 2012 | OslashTransitioned packaging facility to McCook Ill distribution center | ||
| OslashEntered into new five-year $40M credit facility | |||
| October 2012 | OslashAnnounced new CEO and President Michael G DeCata | ||
| OslashConsolidated Vernon Hills distribution center into McCook Ill | |||
| November 2012 | OslashRolled out new website to existing web customers | ||
| December 2012 | OslashCompleted transition of US independent agents to employees | ||
| April 2013 | OslashRoll-out of new website to new web customers | ||
| AprilMay 2013 | OslashMcCook DC begins to ship customer orders | ||
| November 2013 | OslashEntered into sub-lease of headquarters space to generate $29M of future cash savings | ||
| December 2013 | OslashEnded year with over 800 sales reps ndash First increase in 8 years | ||
| February 2014 | OslashClosed on Automatic Screw Machine Products sale for net proceeds of $121M | ||
| June 2014 | OslashEntered into sale-leaseback of Reno distribution facility for net proceeds of $83M | ||
| December 2014 | OslashEnded year with over 900 sales reps | ||
| February 2015 | OslashHeld North American sales meeting | ||
| September 2015 | OslashCompleted West Coast Fasteners acquisition | ||
| March 2016 | OslashCompleted Perfect Products of Michigan acquisition | ||
| May 2016 | OslashCompleted F B Feeney acquisition | ||
| June 2016 | OslashExpanded sales team to over 1000 sales reps | ||
| September 2016 | OslashExtended credit facitlity to August 2020 | ||
| November 2016 | OslashCompleted Mattic Industries acquisition | ||
| March 2017 | OslashConsolidated Fairfield NJ distribution operations into McCook Ill and Suwanee GA | ||
| May 2017 | OslashSold Fairfield NJ distribution center for a gain of $54M | ||
| October 2017 | OslashCompleted Bolt Supply House acquisition | ||
| April 2018 | OslashOpened MRO distribution center in Calgary Canada | ||
| October 2018 | OslashCompleted Screw Products acquisition and added Bolt Supply branch | ||
| June 2019 | OslashAchieved Q2 98 adjusted EBITDA net of ASC 842 impact of 03 | ||
| September 2019 | OslashAchieved Q3 109 adjusted EBITDA hired VP MampA | ||
| October 2019 | OslashEntered into new five-year $100M credit facility with additional $50 million accordion feature |
| ($ in thousands) | Q3 2013 | Q4 2013 | Q1 2014 | Q2 2014 | Q3 2014 | Q4 2014 | Q1 2015 | Q2 2015 | Q3 2015 | Q4 2015 | Q1 2016 | Q2 2016 | Q3 2016 | Q4 2016 | Q1 2017 | Q2 2017 | Q3 2017 | Q4 2017 | ||||||||||||||||||||||||||||||||||||||||||||||
| SGampA | 40350 | 42856 | 45991 | 42562 | 43855 | 44764 | 43830 | 40565 | 40532 | 41145 | 41290 | 42497 | 40184 | 45548 | 44167 | 42672 | 44915 | 46750 | $ 173014 | |||||||||||||||||||||||||||||||||||||||||||||
| $ - | ||||||||||||||||||||||||||||||||||||||||||||||||||||||||||||||||
| Excluded Costs | $ - | 40196 | ||||||||||||||||||||||||||||||||||||||||||||||||||||||||||||||
| Severance | (962) | 127 | (728) | (290) | 328 | 59 | (571) | (50) | (372) | (280) | (204) | (143) | (367) | (1662) | (465) | 9 | (139) | (144) | $ (234) | 127 | ||||||||||||||||||||||||||||||||||||||||||||
| Stock Based Compensation (Benefit) | (33) | (562) | (1125) | (408) | (2423) | (2443) | 541 | (971) | 30 | (1693) | 1217 | (515) | 630 | (3801) | 30 | (415) | (2337) | (384) | $ (5296) | -32 | ||||||||||||||||||||||||||||||||||||||||||||
| Loss(Gain) on Disposal of Property | 36 | (32) | - 0 | - 0 | (97) | (45) | - 0 | - 0 | 2 | (9) | - 0 | - 0 | - 0 | - 0 | - 0 | - 0 | - 0 | - 0 | $ (142) | |||||||||||||||||||||||||||||||||||||||||||||
| Legal Settlement | - 0 | - 0 | - 0 | - 0 | 688 | - 0 | - 0 | - 0 | - 0 | - 0 | - 0 | - 0 | - 0 | - 0 | - 0 | - 0 | - 0 | - 0 | $ 688 | -562 | ||||||||||||||||||||||||||||||||||||||||||||
| Employment Tax Matter | - 0 | 400 | - 0 | - 0 | - 0 | - 0 | - 0 | - 0 | - 0 | - 0 | - 0 | - 0 | - 0 | - 0 | - 0 | - 0 | - 0 | - 0 | $ - | 39729 | ||||||||||||||||||||||||||||||||||||||||||||
| Loss on Sub-Lease | - 0 | (2928) | - 0 | - 0 | - 0 | - 0 | - 0 | - 0 | - 0 | - 0 | - 0 | - 0 | - 0 | - 0 | - 0 | - 0 | - 0 | - 0 | $ - | |||||||||||||||||||||||||||||||||||||||||||||
| National sales meeting | - 0 | - 0 | - 0 | - 0 | - 0 | - 0 | (1889) | - 0 | - 0 | - 0 | - 0 | - 0 | - 0 | - 0 | - 0 | - 0 | - 0 | - 0 | $ (1889) | |||||||||||||||||||||||||||||||||||||||||||||
| Remediation expense | - 0 | - 0 | - 0 | - 0 | - 0 | (340) | - 0 | - 0 | - 0 | - 0 | - 0 | - 0 | - 0 | - 0 | - 0 | - 0 | - 0 | - 0 | $ (340) | |||||||||||||||||||||||||||||||||||||||||||||
| Property Impairment Loss | - 0 | - 0 | (2914) | (132) | - 0 | - 0 | - 0 | - 0 | - 0 | - 0 | - 0 | - 0 | - 0 | - 0 | - 0 | - 0 | - 0 | - 0 | $ - | |||||||||||||||||||||||||||||||||||||||||||||
| Adjusted SGampA | $ 39391 | $ 39861 | $ 41224 | $ 41732 | $ 42351 | $ 41995 | $ 41911 | $ 39544 | $ 40192 | $ 39163 | $ 42303 | $ 41839 | $ 40447 | $ 40085 | $ 43732 | $ 42266 | $ 42439 | $ 46222 | $ 165801 | |||||||||||||||||||||||||||||||||||||||||||||
| Annual Adjusted EBITDA of Sales | ERRORREF | ERRORREF | ||||||||||||||||||||||||||||||||||||||||||||||||||||||||||||||
| Q1 2013 | Q2 2013 | Q3 2013 | Q4 2013 | Q1 2014 | Q2 2014 | Q3 2014 | Q4 2014 | Q1 2015 | |||||||||||
| Selling Days | 63 | 64 | 64 | 61 | 63 | 64 | 64 | 61 | 63 | ||||||||||
| Net Sales | 67213 | 68317 | 68235 | 65738 | 69204 | 72080 | 74128 | 70281 | 69904 | ||||||||||
| Average Daily Sales | 1067 | 1067 | 1066 | 1078 | 1098 | 1126 | 1158 | 1152 | 1110 | ||||||||||
| Average Sales Rep Count | 762 | 764 | 774 | 794 | 819 | 854 | 882 | 908 | 911 | ||||||||||
| Sales per Sales Rep per Day | 1400 | 1397 | 1377 | 1358 | 1341 | 1319 | 1313 | 1269 | 1218 | ||||||||||
| Full Year | ||||||||||||||||||||||||||||||||||||||||||||||||||||||||||||||||||||
| ($ in thousands) | Q1 2011 | Q2 2011 | Q3 2011 | Q4 2011 | Q1 2012 | Q2 2012 | Q3 2012 | Q4 2012 | Q1 2013 | Q2 2013 | Q3 2013 | Q4 2013 | Q1 2014 | Q2 2014 | Q3 2014 | Q4 2014 | Q1 2015 | Q2 2015 | Q3 2015 | Q4 2015 | Q1 2016 | Q2 2016 | Q3 2016 | Q4 2016 | Q1 2017 | Q2 2017 | Q3 2017 | Q4 2017 | Q1 2018 | Q2 2018 | Q3 2018 | 2014 | 2015 | |||||||||||||||||||||||||||||||||||
| Net Sales | $ 79255 | $ 80625 | $ 71490 | $ 69029 | $ 71364 | $ 69830 | $ 67863 | $ 64505 | $ 67213 | $ 68317 | $ 68235 | $ 65738 | $ 69204 | $ 72080 | $ 74128 | $ 70281 | $ 69904 | $ 70726 | $ 70243 | $ 64961 | $ 69711 | $ 69348 | $ 70199 | $ 67315 | $ 74617 | $ 75006 | $ 75651 | $ 80633 | $ 84459 | $ 90382 | $ 88530 | $ 285693 | $ 275834 | |||||||||||||||||||||||||||||||||||
| Operating Income (Loss) | 3542 | 1397 | (3480) | (6995) | (3466) | (42084) | (1740) | 2057 | (3530) | (201) | 870 | (3002) | (4713) | 1241 | 678 | (2169) | (947) | 3243 | 2810 | (2985) | 1169 | 29 | 2389 | (5044) | 712 | 7891 | 1090 | 243 | 1837 | 5554 | (2266) | (4963) | 2121 | |||||||||||||||||||||||||||||||||||
| Depreciation amp Amortization | 1260 | 1315 | 1160 | 1675 | 1715 | 1566 | 1963 | 1841 | 2061 | 2244 | 2367 | 2358 | 2295 | 2163 | 2160 | 2133 | 2096 | 2126 | 2119 | 2202 | 2187 | 2226 | 1973 | 1680 | 1705 | 1644 | 1591 | 1830 | 1686 | 1679 | 1755 | 8751 | 8543 | |||||||||||||||||||||||||||||||||||
| EBITDA | 4802 | 2712 | (2320) | (5320) | (1751) | (40518) | 223 | 3898 | (1469) | 2043 | 3237 | (644) | (2418) | 3404 | 2838 | (36) | 1149 | 5369 | 4929 | (783) | 3356 | 2255 | 4362 | (3364) | 2417 | 9535 | 2681 | 2073 | 3523 | 7233 | (511) | 3788 | 10664 | |||||||||||||||||||||||||||||||||||
| Excluded Costs | ||||||||||||||||||||||||||||||||||||||||||||||||||||||||||||||||||||
| Severance | 745 | 465 | 282 | 122 | 185 | 6585 | 1410 | (159) | - 0 | 2 | 962 | (127) | 728 | 290 | (328) | (59) | 571 | 50 | 372 | 280 | 204 | 143 | 367 | 1662 | 465 | (9) | 139 | 144 | 628 | 64 | 31 | 631 | 1273 | |||||||||||||||||||||||||||||||||||
| Stock Based Compensation (Benefit) | 227 | (95) | (538) | 467 | 198 | (1015) | 77 | 434 | 1596 | 76 | 33 | 562 | 1125 | 408 | 2423 | 2443 | (541) | 971 | (30) | 1693 | (1217) | 515 | (630) | 3801 | (30) | 415 | 2337 | 384 | 970 | 87 | 7637 | 6399 | 2093 | |||||||||||||||||||||||||||||||||||
| Acquisition Related Costs | - 0 | - 0 | - 0 | - 0 | - 0 | - 0 | 310 | 32 | 115 | 198 | 178 | 120 | - 0 | - 0 | 286 | 425 | - 0 | - 0 | 168 | |||||||||||||||||||||||||||||||||||||||||||||||||
| ERP Implementation Costs | 1902 | 2388 | 2344 | 339 | - 0 | - 0 | - 0 | - 0 | - 0 | - 0 | - 0 | - 0 | - 0 | - 0 | - 0 | - 0 | - 0 | - 0 | - 0 | - 0 | - 0 | - 0 | - 0 | - 0 | - 0 | - 0 | - 0 | - 0 | - 0 | - 0 | - 0 | - 0 | ||||||||||||||||||||||||||||||||||||
| Loss(Gain) on Disposal of Property | - 0 | - 0 | - 0 | 22 | - 0 | (2122) | (11) | (1588) | - 0 | - 0 | (36) | 32 | - 0 | - 0 | 97 | 45 | - 0 | - 0 | (2) | 9 | - 0 | - 0 | - 0 | - 0 | - 0 | (5422) | - 0 | - 0 | - 0 | - 0 | - 0 | 142 | 7 | |||||||||||||||||||||||||||||||||||
| Legal Settlement | - 0 | - 0 | - 0 | - 0 | - 0 | - 0 | - 0 | - 0 | - 0 | - 0 | - 0 | - 0 | - 0 | - 0 | (688) | - 0 | - 0 | - 0 | - 0 | - 0 | - 0 | - 0 | - 0 | - 0 | - 0 | - 0 | - 0 | - 0 | - 0 | - 0 | - 0 | (688) | - 0 | |||||||||||||||||||||||||||||||||||
| Employment Tax Matter | - 0 | - 0 | - 0 | 1200 | - 0 | - 0 | - 0 | - 0 | - 0 | - 0 | - 0 | (400) | - 0 | - 0 | - 0 | - 0 | - 0 | - 0 | - 0 | - 0 | - 0 | - 0 | - 0 | - 0 | - 0 | - 0 | - 0 | - 0 | - 0 | - 0 | - 0 | - 0 | - 0 | |||||||||||||||||||||||||||||||||||
| Lease termination gain | - 0 | - 0 | - 0 | - 0 | - 0 | - 0 | - 0 | - 0 | - 0 | - 0 | - 0 | 2928 | - 0 | - 0 | - 0 | - 0 | - 0 | - 0 | - 0 | - 0 | - 0 | - 0 | - 0 | - 0 | - 0 | - 0 | - 0 | - 0 | - 0 | (164) | - 0 | - 0 | - 0 | |||||||||||||||||||||||||||||||||||
| Goodwill Impairment | - 0 | - 0 | - 0 | - 0 | - 0 | 28306 | - 0 | - 0 | - 0 | - 0 | - 0 | - 0 | - 0 | - 0 | - 0 | - 0 | - 0 | - 0 | - 0 | - 0 | - 0 | - 0 | - 0 | - 0 | - 0 | - 0 | - 0 | - 0 | - 0 | - 0 | - 0 | - 0 | - 0 | |||||||||||||||||||||||||||||||||||
| Inventory Rationalization | - 0 | - 0 | - 0 | - 0 | - 0 | 3893 | - 0 | - 0 | - 0 | - 0 | - 0 | - 0 | - 0 | - 0 | - 0 | - 0 | - 0 | - 0 | - 0 | - 0 | - 0 | - 0 | - 0 | - 0 | - 0 | - 0 | - 0 | - 0 | - 0 | - 0 | - 0 | - 0 | - 0 | |||||||||||||||||||||||||||||||||||
| Discontinued operation accrual | - 0 | - 0 | - 0 | - 0 | - 0 | - 0 | - 0 | - 0 | - 0 | - 0 | - 0 | - 0 | - 0 | - 0 | - 0 | 340 | - 0 | - 0 | - 0 | 931 | - 0 | - 0 | - 0 | - 0 | - 0 | - 0 | - 0 | - 0 | - 0 | 529 | - 0 | 340 | 931 | |||||||||||||||||||||||||||||||||||
| North American sales meeting | - 0 | - 0 | - 0 | - 0 | - 0 | - 0 | - 0 | - 0 | 1225 | - 0 | - 0 | - 0 | - 0 | - 0 | - 0 | - 0 | 1889 | - 0 | - 0 | - 0 | - 0 | - 0 | - 0 | - 0 | - 0 | - 0 | - 0 | - 0 | - 0 | - 0 | - 0 | - 0 | 1889 | |||||||||||||||||||||||||||||||||||
| Property Impairment Loss | - 0 | - 0 | - 0 | - 0 | - 0 | - 0 | - 0 | - 0 | - 0 | - 0 | - 0 | - 0 | 2914 | 132 | - 0 | - 0 | - 0 | - 0 | - 0 | - 0 | - 0 | - 0 | - 0 | - 0 | - 0 | - 0 | - 0 | - 0 | - 0 | - 0 | - 0 | 3046 | - 0 | |||||||||||||||||||||||||||||||||||
| Adjusted EBITDA | $ 7676 | $ 5470 | $ (232) | $ (3170) | $ (1368) | $ (4871) | $ 1699 | $ 2585 | $ 1352 | $ 2121 | $ 4196 | $ 2351 | $ 2349 | $ 4234 | $ 4342 | $ 2733 | $ 3068 | $ 6390 | $ 5579 | $ 2162 | $ 2458 | $ 3111 | $ 4277 | $ 2219 | $ 2852 | $ 4519 | $ 5443 | $ 3026 | $ 5121 | $ 7749 | $ 7325 | $ 13658 | $ 17199 | |||||||||||||||||||||||||||||||||||
| Adjusted EBITDA of Sales | 97 | 68 | -03 | -46 | -19 | -70 | 25 | 40 | 20 | 31 | 61 | 36 | 34 | 59 | 59 | 39 | 44 | 90 | 79 | 33 | 35 | 45 | 61 | 33 | 38 | 60 | 72 | 38 | 61 | 86 | 83 | 48 | 62 | |||||||||||||||||||||||||||||||||||
| Annual Adjusted EBITDA of Sales | 44 | 58 | ||||||||||||||||||||||||||||||||||||||||||||||||||||||||||||||||||
| Adjusted Operating Income | (3083) | (6437) | (264) | 744 | (709) | (123) | 1829 | (7) | 54 | 2071 | 2182 | 600 | 972 | 4264 | 3460 | (40) | 271 | 885 | 2304 | 539 | 1147 | 2875 | 3852 | 1196 | 3435 | 6070 | 5570 | - 0 | 4907 | 8314 | ||||||||||||||||||||||||||||||||||||||
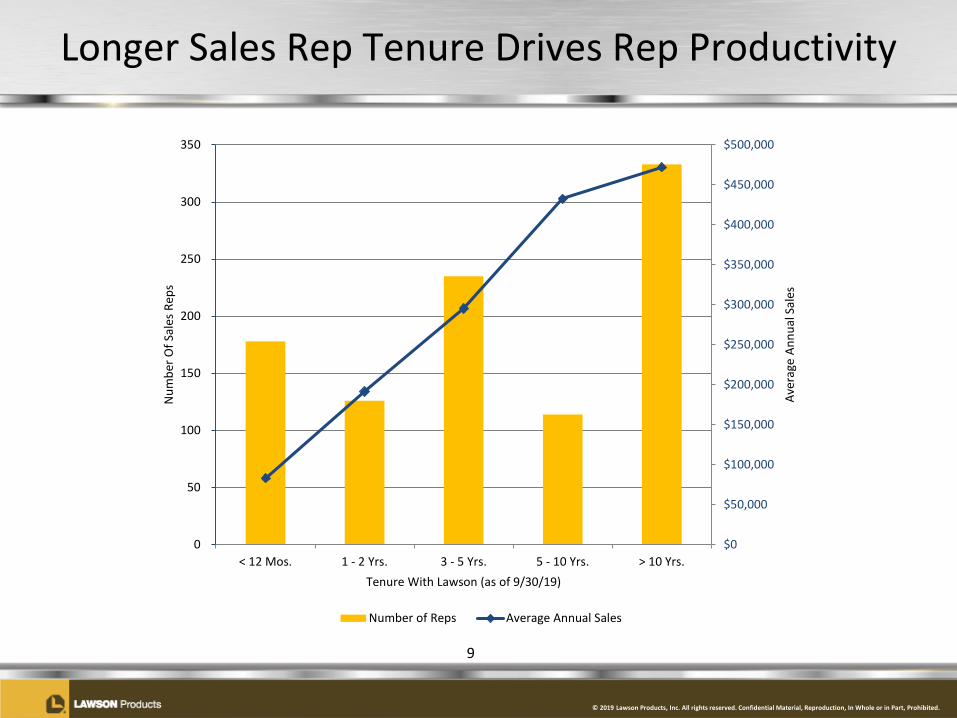
copy 2019 Lawson Products Inc All rights reserved Confidential Material Reproduction In Whole or in Part Prohibited
Lawson Growth Strategy
Sales Growth Driven By
Foundational SupportERP Network
OptimizationSales
TransformationLean Six Sigma
Website
7
New Sales Reps
Sales RepProductivity
Acquisitions
copy 2019 Lawson Products Inc All rights reserved Confidential Material Reproduction In Whole or in Part Prohibited
2019 Focus Actions Across the Value Chain Driving Growth
Add New Sales Reps and Drive Rep Productivity
Sales Process Sales Reps
Customer Service Order
Entry
ProductManagement
PricingDC Operations Sourcing
Purchasing
bull Increase sales rep count
bull Onboardingprocesstraining
bull SalesManagement dashboard
bull EDI with customers
bull Reduction of cycle times
bull Order padbull Consolidation of
shipmentsbull Sales service reps
bull Leverage vendor drop-ship programs
bull Fleet maintenance focus
bull Pricing enhancements
bull Website
bull Reduce cycle timebull Refine ldquoPullrdquo
strategybull Freight
enhancementsbull Minimize
backordersbull Improve service
levelsbull Forecasting tool
bull Supplier negotiation process
bull Vendor metricsbull Electronic
communication
Information Technology ndash Integration of Web and SAPLean Six Sigma
8
copy 2019 Lawson Products Inc All rights reserved Confidential Material Reproduction In Whole or in Part Prohibited
Longer Sales Rep Tenure Drives Rep Productivity
9
$0
$50000
$100000
$150000
$200000
$250000
$300000
$350000
$400000
$450000
$500000
lt 12 Mos 1 - 2 Yrs 3 - 5 Yrs 5 - 10 Yrs gt 10 Yrs0
50
100
150
200
250
300
350
Aver
age
Annu
al S
ales
Tenure With Lawson (as of 93019)
Num
ber O
f Sal
es R
eps
Number of Reps Average Annual Sales
copy 2019 Lawson Products Inc All rights reserved Confidential Material Reproduction In Whole or in Part Prohibited
Historical Financial Performance
Recent sales growth and earnings expansion providing financial flexibility
10
$200000
$250000
$300000
$350000
$400000
2014 2015 2016 2017 2018 TTM93019
Consolidated Revenues
$0$5000
$10000$15000$20000$25000$30000$35000
2014 2015 2016 2017 2018 TTM93019
Adjusted Reg G EBITDA
-$15000
-$10000
-$5000
$0
$5000
$10000
$15000
2014 2015 2016 2017 2018 9302019
Net Cash(Debt)
$0
$2000
$4000
$6000
$8000
$10000
$12000
Q1 Q2 Q3 Q4
Quarterly Adjusted Reg G EBITDA
2017
20172017
2017
2018
20182018
2018
20192019
2019
copy 2019 Lawson Products Inc All rights reserved Confidential Material Reproduction In Whole or in Part Prohibited
Financial Highlights for Third Quarter 2019
bull Sales increased 71 YOY (74 excluding currency fluctuation)
bull MRO LawsonKent gross margins consistent at 609
bull Adjusted Reg G EBITDA margin improving 109 in Q3 2019 v 83 in Q3 2018 Continued investment in new sales reps and rep productivity
bull Key trends MRO operating leverage of 54 13 increase in sales rep productivity Continued government strength +30 YOY Growth across multiple segments and product categories Cash flow from operations of $103 million in Q3
11
copy 2019 Lawson Products Inc All rights reserved Confidential Material Reproduction In Whole or in Part Prohibited
Pursue Disciplined MampA
Reinvest for Growth
Return Capital
bull Increased our borrowing capacity to $1000 million (additional $500 million accordion) with our new borrowing agreement
bull Capital expenditures expected to be $20 - $30 million in 2019bull Growth initiatives add new reps and increase sales rep productivity
bull Share repurchase to offset award dilution opportunistic purchasesbull $75 million stock repurchase program announced on May 16 2019 $63
million remaining after repurchase of shares worth $12 million in August 2019
bull Bolt-on acquisitions to enhance core growth strategiesbull Closed Screw Products Inc acquisition on 10118
Maintain Strong Balance Sheet
bull $86 million cash on hand and positive cash position of $64 million at the end of Q3
bull Consistent free cash flow generation
Capital Allocation Priorities
12
copy 2019 Lawson Products Inc All rights reserved Confidential Material Reproduction In Whole or in Part Prohibited
Lawson Products Poised for Growth
bull Leverage Current Infrastructure
bull Continued Sales Growth
bull Foundational Investments Completed
bull Operational Excellence
bull Large Fragmented Market
13
copy 2019 Lawson Products Inc All rights reserved Confidential Material Reproduction In Whole or in Part Prohibited
For More Information
Contact
Ronald J KnutsonEVP CFOInvestor Relations(773) 304-5665ronknutsonlawsonproductscom
And see our Website athttpwwwlawsonproductscomcompany-infoinvestor-relationsjsp
14
copy 2019 Lawson Products Inc All rights reserved Confidential Material Reproduction In Whole or in Part Prohibited
Appendices
15
copy 2019 Lawson Products Inc All rights reserved Confidential Material Reproduction In Whole or in Part Prohibited
Significant Activities
16
Appendix P-1
August 2011 Implemented SAPOctober 2011 Commenced construction of new McCook Ill distribution center
May 2012 Relocated corporate headquartersJune 2012 Restructured senior team Announced $20M cost savings plan
Transitioned packaging facility to McCook Ill distribution centerEntered into new five-year $40M credit facilityAnnounced new CEO and President Michael G DeCataConsolidated Vernon Hills distribution center into McCook Ill
November 2012 Rolled out new website to existing web customersDecember 2012 Completed transition of US independent agents to employees
April 2013 Roll-out of new website to new web customersAprilMay 2013 McCook DC begins to ship customer ordersNovember 2013 Entered into sub-lease of headquarters space to generate $29M of future cash savingsDecember 2013 Ended year with over 800 sales reps ndash First increase in 8 yearsFebruary 2014 Closed on Automatic Screw Machine Products sale for net proceeds of $121M
June 2014 Entered into sale-leaseback of Reno distribution facility for net proceeds of $83MDecember 2014 Ended year with over 900 sales repsFebruary 2015 Held North American sales meeting
September 2015 Completed West Coast Fasteners acquisitionMarch 2016 Completed Perfect Products of Michigan acquisitionMay 2016 Completed F B Feeney acquisitionJune 2016 Expanded sales team to over 1000 sales reps
September 2016 Extended credit facitlity to August 2020November 2016 Completed Mattic Industries acquisition
March 2017 Consolidated Fairfield NJ distribution operations into McCook Ill and Suwanee GAMay 2017 Sold Fairfield NJ distribution center for a gain of $54M
October 2017 Completed Bolt Supply House acquisitionApril 2018 Opened MRO distribution center in Calgary Canada
October 2018 Completed Screw Products acquisition and added Bolt Supply branchJune 2019 Achieved Q2 98 adjusted EBITDA net of ASC 842 impact of 03
September 2019 Achieved Q3 109 adjusted EBITDA hired VP MampAOctober 2019 Entered into new five-year $100M credit facility with additional $50 million accordion feature
August 2012
October 2012
Adjusted EBITDA $ in 000s
Adjusted EBITDA Q4 2016Q1 2017Q2 2017Q3 2017Q4 201722192852451954433026
Adjusted EBITDA of Sales
Adjusted EBITDA of SalesQ3 2016Q4 2016Q1 2017Q2 2017Q3 2017Q4 201760926793828971926E-232964421005719377E-23822185292895721E-260248513452257152E-271948817596594883E-237528059231332088E-2
Adjusted Operating Income of Sales
Adjusted Operating IncomeQ3 2016Q4 2016Q1 2017Q2 2017Q3 2017Q4 201723045391147287538521196
Adjusted Op Inc $ in 000s
Adjusted EBITDA Q4 2016Q1 2017Q2 2017Q3 2017Q4 20175391147287538521196
Net Sales by Quarter $ in 000s
Net SalesQ1 2013Q2 2013Q3 2013Q4 2013Q1 2014Q2 2014Q3 2014Q4 2014Q1 2015672136831768235657386920472080741287028169904
Adjusted SGampA $ in 000s
Adjusted SGampA Q4 2015Q1 2016Q2 2016Q3 2016Q4 2016Q1 2017Q2 2017Q3 2017Q4 2017391634230341839404474008543732422664243946222
copy 2019 Lawson Products Inc All rights reserved Confidential Material Reproduction In Whole or in Part Prohibited
Regulation G ndash GAAP ReconciliationAppendix P-2
Non GAAP Reconciliation of Adjusted EBITDA to Sales Percentage
The Company reports its financial results in accordance with US generally accepted accounting principles (GAAP) However the Companys management believesthat certain non-GAAP financial measures may provide users of this financial information additional meaningful comparisons between current results and results inprior operating periods Management believes that these non-GAAP financial measures can provide additional meaningful reflection of underlying trends of thebusiness because they provide a comparison of historical information that excludes certain non-operational non-recurring or intermittently recurring items thatimpact the overall comparability See the table below for supplemental financial data and corresponding reconciliations to GAAP financial measures for quarterlyadjusted EBITDA as a percentage of net sales Non-GAAP financial measures should be viewed in addition to and not as an alternative for the Companys reportedresults prepared in accordance with GAAP
17
($ in thousands) Q1 2017 Q2 2017 Q3 2017 Q4 2017 Q1 2018 Q2 2018 Q3 2018 Q4 2018 Q1 2019 Q2 2019 Q3 2019
Net Sales 74617$ 75006$ 75651$ 80633$ 84459$ 90382$ 88530$ 86266$ 91343$ 96097$ 94779$
Operating Income (Loss) 712 7891 1090 243 1837 5554 (2266) 4085 5544 1623 6446 Depreciation amp Amortization 1705 1644 1591 1830 1686 1679 1755 1735 1478 1455 1468 EBITDA 2417 9535 2681 2073 3523 7233 (511) 5820 7022 3078 7914
Excluded CostsSeverance 465 (9) 139 144 628 64 31 126 27 1485 30 Stock Based Compensation (Benefit) (30) 415 2337 384 970 87 7637 (1186) 408 4839 2374 Acquisition Related Costs - - 286 425 - - 168 62 - - - Loss(Gain) on Disposal of Property - (5422) - - - - - - - - - Lease termination gain - - - - - (164) - - - - - Discontinued operation accrual - - - - - 529 - - - - - Building Impairment - - - - - - - 231 - - - Reg G Adjusted EBITDA 2852$ 4519$ 5443$ 3026$ 5121$ 7749$ 7325$ 5053$ 7457$ 9402$ 10318$
Adjusted EBITDA of Sales 38 60 72 38 61 86 83 59 82 98 109
Customer Mix
Regional Accounts48
Kent Automotive16
Regional AccountsStrategicKent AutomotiveBolt SupplyGovernment Screw ProductsOther047014000000000000001016011010002
ampDampF ampA
Product Mix
Fastening Systems23
Specialty Chemicals12
Fastening SystemsFluid PowerSpecialy ChemicalsCutting Tools and AbrasivesElectricalAftermarket Automotive SuppliesSafetyWelding and Metal RepairOther02401501201301100800500201
Number Of Sales Reps
Tenure With Lawson (as of 63019)
Average Annual Sales
Consolidated Revenues
Consolidated Revenues20142015201620172018TTM 63019285693275834276573305907349637362236Net Cash(Debt)2014201520162017201843646420798409580-101271060-1908Rep Count201320142015201620172018436468069169371009983994982
Adjusted Reg G EBITDA
Adjusted EBITDA20142015201620172018TTM 63019136581719912065158402524829237
Quarterly Adjusted Reg G EBITDA
2017Q1Q2Q3Q428524519544330262018Q1Q2Q3Q451217749732550532019Q1Q2Q3Q474579402
Adjusted EBITDA $ in 000s
Reg G Adjusted EBITDA Q1 2017Q2 2017Q3 2017Q4 20172852451954433026
Adjusted EBITDA of Sales
Adjusted EBITDA of SalesQ1 2017Q2 2017Q3 2017Q4 20173822185292895721E-260248513452257152E-271948817596594883E-237528059231332088E-2
Adjusted Operating Income of Sales
Adjusted Operating IncomeQ1 2017Q2 2017Q3 2017Q4 2017
Adjusted Op Inc $ in 000s
Reg G Adjusted EBITDA Q1 2017Q2 2017Q3 2017Q4 2017
copy 2019 Lawson Products Inc All rights reserved Confidential Material Reproduction In Whole or in Part Prohibited
Consolidated Balance Sheet Appendix P-4
18
ASSETSCurrent assetsCash and cash equivalents $ 8626 $ 11883Restricted cash 800 800Accounts receivable less allowance for doubtful accounts of $614 and $549 respectively
45162 37682
Inventories net 54894 52887Miscellaneous receivables and prepaid expenses 4270 3653Total current assets 113752 106905
Property plant and equipment net 16932 23548Deferred income taxes 17372 20592Goodwill 20582 20079Cash value of life insurance 14440 12599Intangible assets net 12468 13112Lease assets 11917 mdashOther assets 275 307Total assets $ 207738 $ 197142
LIABILITIES AND STOCKHOLDERSrsquo EQUITYCurrent liabilitiesRevolving lines of credit $ 2195 $ 10823Accounts payable 16325 15207Lease obligation 3781 mdashAccrued expenses and other liabilities 37873 40179Total current liabilities 60174 66209
Security bonus plan 11969 12413Lease obligation 10360 5213Deferred compensation 5915 5304Deferred tax liability 2879 2761Other liabilities 3460 6069Total liabilities 94757 97969
Stockholdersrsquo equityPreferred stock $1 par valueAuthorized - 500000 shares Issued and outstanding mdash None mdash mdashCommon stock $1 par value
Authorized - 35000000 sharesIssued - 9042597 and 9005716 shares respectivelyOutstanding - 8956981 and 8955930 shares respectively
Capital in excess of par value 17626 15623Retained earnings 89502 77338Treasury stock ndash 85616 and 49786 shares respectivelyAccumulated other comprehensive lossTotal stockholdersrsquo equity 112981 99173Total liabilities and stockholdersrsquo equity $ 207738 $ 197142
September 30 December 312019 2018
(Unaudited)
(2595) (1234)(595) (1560)
9043 9006
Customer Mix
Regional Accounts48
Kent Automotive16
Regional AccountsStrategicKent AutomotiveBolt SupplyGovernment Screw ProductsOther0470140000000000000010150110110002
ampDampF ampA
Product Mix
Fastening Systems23
Specialty Chemicals12
Fastening SystemsFluid PowerSpecialy ChemicalsCutting Tools and AbrasivesElectricalAftermarket Automotive SuppliesSafetyWelding and Metal RepairOther02401501201301100800500201
Number Of Sales Reps
Tenure With Lawson (as of 63019)
Average Annual Sales
Consolidated Revenues
Consolidated Revenues20142015201620172018TTM 93019285693275834276573305907349637368485Net Cash(Debt)2014201520162017201843738420798409580-1012710606431Rep Count201320142015201620172018437388069169371009983994993
Adjusted Reg G EBITDA
Adjusted EBITDA20142015201620172018TTM 93019136581719912065158402524832230
Quarterly Adjusted Reg G EBITDA
2017Q1Q2Q3Q428524519544330262018Q1Q2Q3Q451217749732550532019Q1Q2Q3Q47457940210318
Adjusted EBITDA $ in 000s
Reg G Adjusted EBITDA Q1 2017Q2 2017Q3 2017Q4 20172852451954433026
Adjusted EBITDA of Sales
Adjusted EBITDA of SalesQ1 2017Q2 2017Q3 2017Q4 20173822185292895721E-260248513452257152E-271948817596594883E-237528059231332088E-2
Adjusted Operating Income of Sales
Adjusted Operating IncomeQ1 2017Q2 2017Q3 2017Q4 2017
Adjusted Op Inc $ in 000s
Reg G Adjusted EBITDA Q1 2017Q2 2017Q3 2017Q4 2017
| September 30 | December 31 | ||||||||||
| 2019 | 2018 | ||||||||||
| ASSETS | (Unaudited) | ||||||||||
| Current assets | |||||||||||
| Cash and cash equivalents | $ | 8626 | $ | 11883 | |||||||
| Restricted cash | 800 | 800 | |||||||||
| Accounts receivable less allowance for doubtful accounts of $614 and $549 respectively | 45162 | 37682 | |||||||||
| Inventories net | 54894 | 52887 | |||||||||
| Miscellaneous receivables and prepaid expenses | 4270 | 3653 | |||||||||
| Total current assets | 113752 | 106905 | |||||||||
| Property plant and equipment net | 16932 | 23548 | |||||||||
| Deferred income taxes | 17372 | 20592 | |||||||||
| Goodwill | 20582 | 20079 | |||||||||
| Cash value of life insurance | 14440 | 12599 | |||||||||
| Intangible assets net | 12468 | 13112 | |||||||||
| Lease assets | 11917 | mdash | |||||||||
| Other assets | 275 | 307 | |||||||||
| Total assets | $ | 207738 | $ | 197142 | |||||||
| LIABILITIES AND STOCKHOLDERSrsquo EQUITY | |||||||||||
| Current liabilities | |||||||||||
| Revolving lines of credit | $ | 2195 | $ | 10823 | |||||||
| Accounts payable | 16325 | 15207 | |||||||||
| Lease obligation | 3781 | mdash | |||||||||
| Accrued expenses and other liabilities | 37873 | 40179 | |||||||||
| Total current liabilities | 60174 | 66209 | |||||||||
| Security bonus plan | 11969 | 12413 | |||||||||
| Lease obligation | 10360 | 5213 | |||||||||
| Deferred compensation | 5915 | 5304 | |||||||||
| Deferred tax liability | 2879 | 2761 | |||||||||
| Other liabilities | 3460 | 6069 | |||||||||
| Total liabilities | 94757 | 97969 | |||||||||
| Stockholdersrsquo equity | |||||||||||
| Preferred stock $1 par value | |||||||||||
| Authorized - 500000 shares Issued and outstanding mdash None | mdash | mdash | |||||||||
| Common stock $1 par value | |||||||||||
| Authorized - 35000000 shares | 9043 | 9006 | |||||||||
| Issued - 9042597 and 9005716 shares respectively | |||||||||||
| Outstanding - 8956981 and 8955930 shares respectively | |||||||||||
| Capital in excess of par value | 17626 | 15623 | |||||||||
| Retained earnings | 89502 | 77338 | |||||||||
| Treasury stock ndash 85616 and 49786 shares respectively | (2595) | (1234) | |||||||||
| Accumulated other comprehensive loss | (595) | (1560) | |||||||||
| Total stockholdersrsquo equity | 112981 | 99173 | |||||||||
| Total liabilities and stockholdersrsquo equity | $ | 207738 | $ | 197142 | |||||||
| Three Months Ended | |||||||||||||||||||||||||||||
| Jun 30 2019 | Mar 31 2019 | Dec 31 2018 | Sep 30 2018 | Jun 30 2018 | |||||||||||||||||||||||||
| Average daily net sales | $ | 1502 | $ | 1450 | $ | 1414 | $ | 1405 | $ | 1412 | |||||||||||||||||||
| Year over year increase | 63 | 82 | 70 | 170 | 205 | ||||||||||||||||||||||||
| Sequential quarter increase (decrease) | 36 | 25 | 06 | (05) | 53 | ||||||||||||||||||||||||
| Net Sales | $ | 96097 | $ | 91343 | $ | 86266 | $ | 88530 | $ | 90382 | |||||||||||||||||||
| Gross profit (1) | 51043 | 48923 | 46083 | 48108 | 49131 | ||||||||||||||||||||||||
| Gross profit percentage (1) | 531 | 536 | 534 | 543 | 544 | ||||||||||||||||||||||||
| Selling general amp administrative expenses | $ | 49420 | $ | 43379 | $ | 41998 | $ | 50374 | $ | 43577 | |||||||||||||||||||
| Operating income (loss) | $ | 1623 | $ | 5544 | $ | 4085 | $ | (2266) | $ | 5554 | |||||||||||||||||||
| Full Year | |||||||||||||||||||||||||||||||||||||||||||||||||||||||||||||||||||||||||||
| ($ in thousands) | Q1 2011 | Q2 2011 | Q3 2011 | Q4 2011 | Q1 2012 | Q2 2012 | Q3 2012 | Q4 2012 | Q1 2013 | Q2 2013 | Q3 2013 | Q4 2013 | Q1 2014 | Q2 2014 | Q3 2014 | Q4 2014 | Q1 2015 | Q2 2015 | Q3 2015 | Q4 2015 | Q1 2016 | Q2 2016 | Q3 2016 | Q4 2016 | Q1 2017 | Q2 2017 | Q3 2017 | Q4 2017 | Q1 2018 | Q2 2018 | Q3 2018 | Q4 2018 | Q1 2019 | Q2 2019 | Q3 2019 | 2014 | 2015 | ||||||||||||||||||||||||||||||||||||||
| Net Sales | $ 79255 | $ 80625 | $ 71490 | $ 69029 | $ 71364 | $ 69830 | $ 67863 | $ 64505 | $ 67213 | $ 68317 | $ 68235 | $ 65738 | $ 69204 | $ 72080 | $ 74128 | $ 70281 | $ 69904 | $ 70726 | $ 70243 | $ 64961 | $ 69711 | $ 69348 | $ 70199 | $ 67315 | $ 74617 | $ 75006 | $ 75651 | $ 80633 | $ 84459 | $ 90382 | $ 88530 | $ 86266 | $ 91343 | $ 96097 | $ 94779 | $ 285693 | $ 275834 | ||||||||||||||||||||||||||||||||||||||
| Operating Income (Loss) | 3542 | 1397 | (3480) | (6995) | (3466) | (42084) | (1740) | 2057 | (3530) | (201) | 870 | (3002) | (4713) | 1241 | 678 | (2169) | (947) | 3243 | 2810 | (2985) | 1169 | 29 | 2389 | (5044) | 712 | 7891 | 1090 | 243 | 1837 | 5554 | (2266) | 4085 | 5544 | 1623 | 6446 | (4963) | 2121 | ||||||||||||||||||||||||||||||||||||||
| Depreciation amp Amortization | 1260 | 1315 | 1160 | 1675 | 1715 | 1566 | 1963 | 1841 | 2061 | 2244 | 2367 | 2358 | 2295 | 2163 | 2160 | 2133 | 2096 | 2126 | 2119 | 2202 | 2187 | 2226 | 1973 | 1680 | 1705 | 1644 | 1591 | 1830 | 1686 | 1679 | 1755 | 1735 | 1478 | 1455 | 1468 | 8751 | 8543 | ||||||||||||||||||||||||||||||||||||||
| EBITDA | 4802 | 2712 | (2320) | (5320) | (1751) | (40518) | 223 | 3898 | (1469) | 2043 | 3237 | (644) | (2418) | 3404 | 2838 | (36) | 1149 | 5369 | 4929 | (783) | 3356 | 2255 | 4362 | (3364) | 2417 | 9535 | 2681 | 2073 | 3523 | 7233 | (511) | 5820 | 7022 | 3078 | 7914 | 3788 | 10664 | ||||||||||||||||||||||||||||||||||||||
| Excluded Costs | |||||||||||||||||||||||||||||||||||||||||||||||||||||||||||||||||||||||||||
| Severance | 745 | 465 | 282 | 122 | 185 | 6585 | 1410 | (159) | - 0 | 2 | 962 | (127) | 728 | 290 | (328) | (59) | 571 | 50 | 372 | 280 | 204 | 143 | 367 | 1662 | 465 | (9) | 139 | 144 | 628 | 64 | 31 | 126 | 27 | 1485 | 30 | 631 | 1273 | ||||||||||||||||||||||||||||||||||||||
| Stock Based Compensation (Benefit) | 227 | (95) | (538) | 467 | 198 | (1015) | 77 | 434 | 1596 | 76 | 33 | 562 | 1125 | 408 | 2423 | 2443 | (541) | 971 | (30) | 1693 | (1217) | 515 | (630) | 3801 | (30) | 415 | 2337 | 384 | 970 | 87 | 7637 | (1186) | 408 | 4839 | 2374 | 6399 | 2093 | ||||||||||||||||||||||||||||||||||||||
| Acquisition Related Costs | - 0 | - 0 | - 0 | - 0 | - 0 | - 0 | 310 | 32 | 115 | 198 | 178 | 120 | - 0 | - 0 | 286 | 425 | - 0 | - 0 | 168 | 62 | - 0 | - 0 | - 0 | ||||||||||||||||||||||||||||||||||||||||||||||||||||
| ERP Implementation Costs | 1902 | 2388 | 2344 | 339 | - 0 | - 0 | - 0 | - 0 | - 0 | - 0 | - 0 | - 0 | - 0 | - 0 | - 0 | - 0 | - 0 | - 0 | - 0 | - 0 | - 0 | - 0 | - 0 | - 0 | - 0 | - 0 | - 0 | - 0 | - 0 | - 0 | - 0 | - 0 | - 0 | ||||||||||||||||||||||||||||||||||||||||||
| Loss(Gain) on Disposal of Property | - 0 | - 0 | - 0 | 22 | - 0 | (2122) | (11) | (1588) | - 0 | - 0 | (36) | 32 | - 0 | - 0 | 97 | 45 | - 0 | - 0 | (2) | 9 | - 0 | - 0 | - 0 | - 0 | - 0 | (5422) | - 0 | - 0 | - 0 | - 0 | - 0 | - 0 | - 0 | - 0 | - 0 | 142 | 7 | ||||||||||||||||||||||||||||||||||||||
| Legal Settlement | - 0 | - 0 | - 0 | - 0 | - 0 | - 0 | - 0 | - 0 | - 0 | - 0 | - 0 | - 0 | - 0 | - 0 | (688) | - 0 | - 0 | - 0 | - 0 | - 0 | - 0 | - 0 | - 0 | - 0 | - 0 | - 0 | - 0 | - 0 | - 0 | - 0 | - 0 | - 0 | (688) | - 0 | |||||||||||||||||||||||||||||||||||||||||
| Employment Tax Matter | - 0 | - 0 | - 0 | 1200 | - 0 | - 0 | - 0 | - 0 | - 0 | - 0 | - 0 | (400) | - 0 | - 0 | - 0 | - 0 | - 0 | - 0 | - 0 | - 0 | - 0 | - 0 | - 0 | - 0 | - 0 | - 0 | - 0 | - 0 | - 0 | - 0 | - 0 | - 0 | - 0 | - 0 | |||||||||||||||||||||||||||||||||||||||||
| Lease termination gain | - 0 | - 0 | - 0 | - 0 | - 0 | - 0 | - 0 | - 0 | - 0 | - 0 | - 0 | 2928 | - 0 | - 0 | - 0 | - 0 | - 0 | - 0 | - 0 | - 0 | - 0 | - 0 | - 0 | - 0 | - 0 | - 0 | - 0 | - 0 | - 0 | (164) | - 0 | - 0 | - 0 | - 0 | - 0 | - 0 | - 0 | ||||||||||||||||||||||||||||||||||||||
| Goodwill Impairment | - 0 | - 0 | - 0 | - 0 | - 0 | 28306 | - 0 | - 0 | - 0 | - 0 | - 0 | - 0 | - 0 | - 0 | - 0 | - 0 | - 0 | - 0 | - 0 | - 0 | - 0 | - 0 | - 0 | - 0 | - 0 | - 0 | - 0 | - 0 | - 0 | - 0 | - 0 | - 0 | - 0 | - 0 | |||||||||||||||||||||||||||||||||||||||||
| Inventory Rationalization | - 0 | - 0 | - 0 | - 0 | - 0 | 3893 | - 0 | - 0 | - 0 | - 0 | - 0 | - 0 | - 0 | - 0 | - 0 | - 0 | - 0 | - 0 | - 0 | - 0 | - 0 | - 0 | - 0 | - 0 | - 0 | - 0 | - 0 | - 0 | - 0 | - 0 | - 0 | - 0 | - 0 | - 0 | |||||||||||||||||||||||||||||||||||||||||
| Discontinued operation accrual | - 0 | - 0 | - 0 | - 0 | - 0 | - 0 | - 0 | - 0 | - 0 | - 0 | - 0 | - 0 | - 0 | - 0 | - 0 | 340 | - 0 | - 0 | - 0 | 931 | - 0 | - 0 | - 0 | - 0 | - 0 | - 0 | - 0 | - 0 | - 0 | 529 | - 0 | - 0 | - 0 | - 0 | - 0 | 340 | 931 | ||||||||||||||||||||||||||||||||||||||
| North American sales meeting | - 0 | - 0 | - 0 | - 0 | - 0 | - 0 | - 0 | - 0 | 1225 | - 0 | - 0 | - 0 | - 0 | - 0 | - 0 | - 0 | 1889 | - 0 | - 0 | - 0 | - 0 | - 0 | - 0 | - 0 | - 0 | - 0 | - 0 | - 0 | - 0 | - 0 | - 0 | - 0 | - 0 | 1889 | |||||||||||||||||||||||||||||||||||||||||
| Property Impairment Loss | - 0 | - 0 | - 0 | - 0 | - 0 | - 0 | - 0 | - 0 | - 0 | - 0 | - 0 | - 0 | 2914 | 132 | - 0 | - 0 | - 0 | - 0 | - 0 | - 0 | - 0 | - 0 | - 0 | - 0 | - 0 | - 0 | - 0 | - 0 | - 0 | - 0 | - 0 | - 0 | 3046 | - 0 | |||||||||||||||||||||||||||||||||||||||||
| Building Impairment | - 0 | - 0 | - 0 | - 0 | - 0 | - 0 | - 0 | 231 | - 0 | - 0 | - 0 | ||||||||||||||||||||||||||||||||||||||||||||||||||||||||||||||||
| Reg G Adjusted EBITDA | $ 7676 | $ 5470 | $ (232) | $ (3170) | $ (1368) | $ (4871) | $ 1699 | $ 2585 | $ 1352 | $ 2121 | $ 4196 | $ 2351 | $ 2349 | $ 4234 | $ 4342 | $ 2733 | $ 3068 | $ 6390 | $ 5579 | $ 2162 | $ 2458 | $ 3111 | $ 4277 | $ 2219 | $ 2852 | $ 4519 | $ 5443 | $ 3026 | $ 5121 | $ 7749 | $ 7325 | $ 5053 | $ 7457 | $ 9402 | $ 10318 | $ 13658 | $ 17199 | ||||||||||||||||||||||||||||||||||||||
| Adjusted EBITDA of Sales | 97 | 68 | -03 | -46 | -19 | -70 | 25 | 40 | 20 | 31 | 61 | 36 | 34 | 59 | 59 | 39 | 44 | 90 | 79 | 33 | 35 | 45 | 61 | 33 | 38 | 60 | 72 | 38 | 61 | 86 | 83 | 59 | 82 | 98 | 109 | 48 | 62 | ||||||||||||||||||||||||||||||||||||||
| Annual Adjusted EBITDA of Sales | 44 | 58 | |||||||||||||||||||||||||||||||||||||||||||||||||||||||||||||||||||||||||
| Adjusted Operating Income | (3083) | (6437) | (264) | 744 | (709) | (123) | 1829 | (7) | 54 | 2071 | 2182 | 600 | 972 | 4264 | 3460 | (40) | 271 | 885 | 2304 | 539 | 1147 | 2875 | 3852 | 1196 | 3435 | 6070 | 5570 | 3087 | 5979 | 7947 | 8850 | 4907 | 8314 | ||||||||||||||||||||||||||||||||||||||||||
| Consolidated Revenues | |||||||
| 2013 | 269503 | ||||||
| 2014 | 285693 | ||||||
| 2015 | 275834 | ||||||
| 2016 | 276573 | ||||||
| 2017 | 305907 | ||||||
| 2018 | 349637 | ||||||
| TTM 93019 | 368485 | ||||||
| Net Cash(Debt) | |||||||
| 2013 | (15380) | ||||||
| 2014 | 4207 | ||||||
| 2015 | 9840 | ||||||
| 2016 | 9580 | ||||||
| 2017 | (10127) | ||||||
| 2018 | 1060 | ||||||
| 93019 | 6431 | ||||||
| Rep Count | |||||||
| 2013 | 806 | ||||||
| 2014 | 916 | ||||||
| 2015 | 937 | ||||||
| 2016 | 1009 | ||||||
| 2017 | 983 | ||||||
| 2018 | 994 | ||||||
| 93019 | 993 | ||||||
| Adjusted OI | DampA | Adjusted EBITDA | |||||
| 2013 | 990 | 9030 | 10020 | ||||
| 2014 | 4907 | 8751 | 13658 | ||||
| 2015 | 8315 | 8543 | 17199 | ||||
| 2016 | 3388 | 8066 | 12065 | ||||
| 2017 | 15840 | ||||||
| 2018 | 25248 | ||||||
| TTM 93019 | 32230 | ||||||
| Reg G EBITDA By Quarter | |||||||
| Quarter | 2017 | 2018 | 2019 | ||||
| Q1 | 2852 | 5121 | 7457 | ||||
| Q2 | 4519 | 7749 | 9402 | ||||
| Q3 | 5443 | 7325 | 10318 | ||||
| Q4 | 3026 | 5053 |
| Months of Experience | Average Annual Sales | Number of Reps | |||
| lt 12 Mos | ERRORVALUE | ERRORVALUE | |||
| 1 - 2 Yrs | ERRORVALUE | ERRORVALUE | |||
| 3 - 5 Yrs | ERRORVALUE | ERRORVALUE | |||
| 5 - 10 Yrs | ERRORVALUE | ERRORVALUE | |||
| gt 10 Yrs | ERRORVALUE | ERRORVALUE | |||
| ERRORVALUE | |||||
| Excludes ISR MSS CRS | |||||
| Excludes Freight | |||||
| Product mix | ||||||||
| Verticals | Q3 2019 Sales | |||||||
| Fastening Systems | 240 | 22485606 | ||||||
| Fluid Power | 151 | 14156064 | ||||||
| Specialy Chemicals | 117 | 10917433 | ||||||
| Cutting Tools and Abrasives | 131 | 12296596 | ||||||
| Electrical | 104 | 9724849 | ||||||
| Aftermarket Automotive Supplies | 76 | 7154688 | ||||||
| Safety | 47 | 4445846 | ||||||
| Welding and Metal Repair | 13 | 1218030 | ||||||
| Other | 120 | 11237322 | ||||||
| Total | 100 | 93636434 | ||||||
| Verticals | YTD 2019 Sales | |||||||
| Fastening Systems | 24 | 66611555 | ||||||
| Fluid Power | 15 | 42224416 | ||||||
| Specialy Chemicals | 12 | 32166853 | ||||||
| Cutting Tools and Abrasives | 13 | 36587482 | ||||||
| Electrical | 11 | 30150144 | ||||||
| Aftermarket Automotive Supplies | 8 | 21960561 | ||||||
| Safety | 5 | 13072228 | ||||||
| Welding and Metal Repair | 2 | 4306548 | ||||||
| Other | 10 | 31279779 | ||||||
| Total | 100 | 278359566 |
| Lawson core customer mix | ||||||||
| Account Tyoe | Q3 | |||||||
| Regional Accounts | 43045893 | 45 | ||||||
| Strategic | 14086813 | 15 | ||||||
| Kent Automotive | 14300065 | 15 | ||||||
| Bolt Supply | 11318703 | 12 | ||||||
| Government | 10291732 | 11 | ||||||
| Screw Products | 0 | 0 | ||||||
| Other (1) | 1735236 | 2 | ||||||
| Total | 94778443 | 100 | ||||||
| Account Tyoe | YTD September | |||||||
| Regional Accounts | 131389537 | 47 | ||||||
| Strategic | 40364305 | 14 | ||||||
| Kent Automotive | 43371411 | 15 | ||||||
| Bolt Supply | 31324209 | 11 | ||||||
| Government | 29794959 | 11 | ||||||
| Screw Products | 0 | 0 | ||||||
| Other | 5974302 | 2 | ||||||
| Total | 282218723 | 100 | ||||||
| Total Reported |
| September 30 | December 31 | ||||||||||
| 2019 | 2018 | ||||||||||
| ASSETS | (Unaudited) | ||||||||||
| Current assets | |||||||||||
| Cash and cash equivalents | $ | 8626 | $ | 11883 | |||||||
| Restricted cash | 800 | 800 | |||||||||
| Accounts receivable less allowance for doubtful accounts of $614 and $549 respectively | 45162 | 37682 | |||||||||
| Inventories net | 54894 | 52887 | |||||||||
| Miscellaneous receivables and prepaid expenses | 4270 | 3653 | |||||||||
| Total current assets | 113752 | 106905 | |||||||||
| Property plant and equipment net | 16932 | 23548 | |||||||||
| Deferred income taxes | 17372 | 20592 | |||||||||
| Goodwill | 20582 | 20079 | |||||||||
| Cash value of life insurance | 14440 | 12599 | |||||||||
| Intangible assets net | 12468 | 13112 | |||||||||
| Lease assets | 11917 | mdash | |||||||||
| Other assets | 275 | 307 | |||||||||
| Total assets | $ | 207738 | $ | 197142 | |||||||
| LIABILITIES AND STOCKHOLDERSrsquo EQUITY | |||||||||||
| Current liabilities | |||||||||||
| Revolving lines of credit | $ | 2195 | $ | 10823 | |||||||
| Accounts payable | 16325 | 15207 | |||||||||
| Lease obligation | 3781 | mdash | |||||||||
| Accrued expenses and other liabilities | 37873 | 40179 | |||||||||
| Total current liabilities | 60174 | 66209 | |||||||||
| Security bonus plan | 11969 | 12413 | |||||||||
| Lease obligation | 10360 | 5213 | |||||||||
| Deferred compensation | 5915 | 5304 | |||||||||
| Deferred tax liability | 2879 | 2761 | |||||||||
| Other liabilities | 3460 | 6069 | |||||||||
| Total liabilities | 94757 | 97969 | |||||||||
| Stockholdersrsquo equity | |||||||||||
| Preferred stock $1 par value | |||||||||||
| Authorized - 500000 shares Issued and outstanding mdash None | mdash | mdash | |||||||||
| Common stock $1 par value | |||||||||||
| Authorized - 35000000 shares | 9043 | 9006 | |||||||||
| Issued - 9042597 and 9005716 shares respectively | |||||||||||
| Outstanding - 8956981 and 8955930 shares respectively | |||||||||||
| Capital in excess of par value | 17626 | 15623 | |||||||||
| Retained earnings | 89502 | 77338 | |||||||||
| Treasury stock ndash 85616 and 49786 shares respectively | (2595) | (1234) | |||||||||
| Accumulated other comprehensive loss | (595) | (1560) | |||||||||
| Total stockholdersrsquo equity | 112981 | 99173 | |||||||||
| Total liabilities and stockholdersrsquo equity | $ | 207738 | $ | 197142 | |||||||
| Three Months Ended | |||||||||||||||||||||||||||||
| Jun 30 2019 | Mar 31 2019 | Dec 31 2018 | Sep 30 2018 | Jun 30 2018 | |||||||||||||||||||||||||
| Average daily net sales | $ | 1502 | $ | 1450 | $ | 1414 | $ | 1405 | $ | 1412 | |||||||||||||||||||
| Year over year increase | 63 | 82 | 70 | 170 | 205 | ||||||||||||||||||||||||
| Sequential quarter increase (decrease) | 36 | 25 | 06 | (05) | 53 | ||||||||||||||||||||||||
| Net Sales | $ | 96097 | $ | 91343 | $ | 86266 | $ | 88530 | $ | 90382 | |||||||||||||||||||
| Gross profit (1) | 51043 | 48923 | 46083 | 48108 | 49131 | ||||||||||||||||||||||||
| Gross profit percentage (1) | 531 | 536 | 534 | 543 | 544 | ||||||||||||||||||||||||
| Selling general amp administrative expenses | $ | 49420 | $ | 43379 | $ | 41998 | $ | 50374 | $ | 43577 | |||||||||||||||||||
| Operating income (loss) | $ | 1623 | $ | 5544 | $ | 4085 | $ | (2266) | $ | 5554 | |||||||||||||||||||
| Full Year | |||||||||||||||||||||||||||||||||||||||||||||||||||||||||||||||||||||||||||
| ($ in thousands) | Q1 2011 | Q2 2011 | Q3 2011 | Q4 2011 | Q1 2012 | Q2 2012 | Q3 2012 | Q4 2012 | Q1 2013 | Q2 2013 | Q3 2013 | Q4 2013 | Q1 2014 | Q2 2014 | Q3 2014 | Q4 2014 | Q1 2015 | Q2 2015 | Q3 2015 | Q4 2015 | Q1 2016 | Q2 2016 | Q3 2016 | Q4 2016 | Q1 2017 | Q2 2017 | Q3 2017 | Q4 2017 | Q1 2018 | Q2 2018 | Q3 2018 | Q4 2018 | Q1 2019 | Q2 2019 | Q3 2019 | 2014 | 2015 | ||||||||||||||||||||||||||||||||||||||
| Net Sales | $ 79255 | $ 80625 | $ 71490 | $ 69029 | $ 71364 | $ 69830 | $ 67863 | $ 64505 | $ 67213 | $ 68317 | $ 68235 | $ 65738 | $ 69204 | $ 72080 | $ 74128 | $ 70281 | $ 69904 | $ 70726 | $ 70243 | $ 64961 | $ 69711 | $ 69348 | $ 70199 | $ 67315 | $ 74617 | $ 75006 | $ 75651 | $ 80633 | $ 84459 | $ 90382 | $ 88530 | $ 86266 | $ 91343 | $ 96097 | $ 94779 | $ 285693 | $ 275834 | ||||||||||||||||||||||||||||||||||||||
| Operating Income (Loss) | 3542 | 1397 | (3480) | (6995) | (3466) | (42084) | (1740) | 2057 | (3530) | (201) | 870 | (3002) | (4713) | 1241 | 678 | (2169) | (947) | 3243 | 2810 | (2985) | 1169 | 29 | 2389 | (5044) | 712 | 7891 | 1090 | 243 | 1837 | 5554 | (2266) | 4085 | 5544 | 1623 | 6446 | (4963) | 2121 | ||||||||||||||||||||||||||||||||||||||
| Depreciation amp Amortization | 1260 | 1315 | 1160 | 1675 | 1715 | 1566 | 1963 | 1841 | 2061 | 2244 | 2367 | 2358 | 2295 | 2163 | 2160 | 2133 | 2096 | 2126 | 2119 | 2202 | 2187 | 2226 | 1973 | 1680 | 1705 | 1644 | 1591 | 1830 | 1686 | 1679 | 1755 | 1735 | 1478 | 1455 | 1468 | 8751 | 8543 | ||||||||||||||||||||||||||||||||||||||
| EBITDA | 4802 | 2712 | (2320) | (5320) | (1751) | (40518) | 223 | 3898 | (1469) | 2043 | 3237 | (644) | (2418) | 3404 | 2838 | (36) | 1149 | 5369 | 4929 | (783) | 3356 | 2255 | 4362 | (3364) | 2417 | 9535 | 2681 | 2073 | 3523 | 7233 | (511) | 5820 | 7022 | 3078 | 7914 | 3788 | 10664 | ||||||||||||||||||||||||||||||||||||||
| Excluded Costs | |||||||||||||||||||||||||||||||||||||||||||||||||||||||||||||||||||||||||||
| Severance | 745 | 465 | 282 | 122 | 185 | 6585 | 1410 | (159) | - 0 | 2 | 962 | (127) | 728 | 290 | (328) | (59) | 571 | 50 | 372 | 280 | 204 | 143 | 367 | 1662 | 465 | (9) | 139 | 144 | 628 | 64 | 31 | 126 | 27 | 1485 | 30 | 631 | 1273 | ||||||||||||||||||||||||||||||||||||||
| Stock Based Compensation (Benefit) | 227 | (95) | (538) | 467 | 198 | (1015) | 77 | 434 | 1596 | 76 | 33 | 562 | 1125 | 408 | 2423 | 2443 | (541) | 971 | (30) | 1693 | (1217) | 515 | (630) | 3801 | (30) | 415 | 2337 | 384 | 970 | 87 | 7637 | (1186) | 408 | 4839 | 2374 | 6399 | 2093 | ||||||||||||||||||||||||||||||||||||||
| Acquisition Related Costs | - 0 | - 0 | - 0 | - 0 | - 0 | - 0 | 310 | 32 | 115 | 198 | 178 | 120 | - 0 | - 0 | 286 | 425 | - 0 | - 0 | 168 | 62 | - 0 | - 0 | - 0 | ||||||||||||||||||||||||||||||||||||||||||||||||||||
| ERP Implementation Costs | 1902 | 2388 | 2344 | 339 | - 0 | - 0 | - 0 | - 0 | - 0 | - 0 | - 0 | - 0 | - 0 | - 0 | - 0 | - 0 | - 0 | - 0 | - 0 | - 0 | - 0 | - 0 | - 0 | - 0 | - 0 | - 0 | - 0 | - 0 | - 0 | - 0 | - 0 | - 0 | - 0 | ||||||||||||||||||||||||||||||||||||||||||
| Loss(Gain) on Disposal of Property | - 0 | - 0 | - 0 | 22 | - 0 | (2122) | (11) | (1588) | - 0 | - 0 | (36) | 32 | - 0 | - 0 | 97 | 45 | - 0 | - 0 | (2) | 9 | - 0 | - 0 | - 0 | - 0 | - 0 | (5422) | - 0 | - 0 | - 0 | - 0 | - 0 | - 0 | - 0 | - 0 | - 0 | 142 | 7 | ||||||||||||||||||||||||||||||||||||||
| Legal Settlement | - 0 | - 0 | - 0 | - 0 | - 0 | - 0 | - 0 | - 0 | - 0 | - 0 | - 0 | - 0 | - 0 | - 0 | (688) | - 0 | - 0 | - 0 | - 0 | - 0 | - 0 | - 0 | - 0 | - 0 | - 0 | - 0 | - 0 | - 0 | - 0 | - 0 | - 0 | - 0 | (688) | - 0 | |||||||||||||||||||||||||||||||||||||||||
| Employment Tax Matter | - 0 | - 0 | - 0 | 1200 | - 0 | - 0 | - 0 | - 0 | - 0 | - 0 | - 0 | (400) | - 0 | - 0 | - 0 | - 0 | - 0 | - 0 | - 0 | - 0 | - 0 | - 0 | - 0 | - 0 | - 0 | - 0 | - 0 | - 0 | - 0 | - 0 | - 0 | - 0 | - 0 | - 0 | |||||||||||||||||||||||||||||||||||||||||
| Lease termination gain | - 0 | - 0 | - 0 | - 0 | - 0 | - 0 | - 0 | - 0 | - 0 | - 0 | - 0 | 2928 | - 0 | - 0 | - 0 | - 0 | - 0 | - 0 | - 0 | - 0 | - 0 | - 0 | - 0 | - 0 | - 0 | - 0 | - 0 | - 0 | - 0 | (164) | - 0 | - 0 | - 0 | - 0 | - 0 | - 0 | - 0 | ||||||||||||||||||||||||||||||||||||||
| Goodwill Impairment | - 0 | - 0 | - 0 | - 0 | - 0 | 28306 | - 0 | - 0 | - 0 | - 0 | - 0 | - 0 | - 0 | - 0 | - 0 | - 0 | - 0 | - 0 | - 0 | - 0 | - 0 | - 0 | - 0 | - 0 | - 0 | - 0 | - 0 | - 0 | - 0 | - 0 | - 0 | - 0 | - 0 | - 0 | |||||||||||||||||||||||||||||||||||||||||
| Inventory Rationalization | - 0 | - 0 | - 0 | - 0 | - 0 | 3893 | - 0 | - 0 | - 0 | - 0 | - 0 | - 0 | - 0 | - 0 | - 0 | - 0 | - 0 | - 0 | - 0 | - 0 | - 0 | - 0 | - 0 | - 0 | - 0 | - 0 | - 0 | - 0 | - 0 | - 0 | - 0 | - 0 | - 0 | - 0 | |||||||||||||||||||||||||||||||||||||||||
| Discontinued operation accrual | - 0 | - 0 | - 0 | - 0 | - 0 | - 0 | - 0 | - 0 | - 0 | - 0 | - 0 | - 0 | - 0 | - 0 | - 0 | 340 | - 0 | - 0 | - 0 | 931 | - 0 | - 0 | - 0 | - 0 | - 0 | - 0 | - 0 | - 0 | - 0 | 529 | - 0 | - 0 | - 0 | - 0 | - 0 | 340 | 931 | ||||||||||||||||||||||||||||||||||||||
| North American sales meeting | - 0 | - 0 | - 0 | - 0 | - 0 | - 0 | - 0 | - 0 | 1225 | - 0 | - 0 | - 0 | - 0 | - 0 | - 0 | - 0 | 1889 | - 0 | - 0 | - 0 | - 0 | - 0 | - 0 | - 0 | - 0 | - 0 | - 0 | - 0 | - 0 | - 0 | - 0 | - 0 | - 0 | 1889 | |||||||||||||||||||||||||||||||||||||||||
| Property Impairment Loss | - 0 | - 0 | - 0 | - 0 | - 0 | - 0 | - 0 | - 0 | - 0 | - 0 | - 0 | - 0 | 2914 | 132 | - 0 | - 0 | - 0 | - 0 | - 0 | - 0 | - 0 | - 0 | - 0 | - 0 | - 0 | - 0 | - 0 | - 0 | - 0 | - 0 | - 0 | - 0 | 3046 | - 0 | |||||||||||||||||||||||||||||||||||||||||
| Building Impairment | - 0 | - 0 | - 0 | - 0 | - 0 | - 0 | - 0 | 231 | - 0 | - 0 | - 0 | ||||||||||||||||||||||||||||||||||||||||||||||||||||||||||||||||
| Reg G Adjusted EBITDA | $ 7676 | $ 5470 | $ (232) | $ (3170) | $ (1368) | $ (4871) | $ 1699 | $ 2585 | $ 1352 | $ 2121 | $ 4196 | $ 2351 | $ 2349 | $ 4234 | $ 4342 | $ 2733 | $ 3068 | $ 6390 | $ 5579 | $ 2162 | $ 2458 | $ 3111 | $ 4277 | $ 2219 | $ 2852 | $ 4519 | $ 5443 | $ 3026 | $ 5121 | $ 7749 | $ 7325 | $ 5053 | $ 7457 | $ 9402 | $ 10318 | $ 13658 | $ 17199 | ||||||||||||||||||||||||||||||||||||||
| Adjusted EBITDA of Sales | 97 | 68 | -03 | -46 | -19 | -70 | 25 | 40 | 20 | 31 | 61 | 36 | 34 | 59 | 59 | 39 | 44 | 90 | 79 | 33 | 35 | 45 | 61 | 33 | 38 | 60 | 72 | 38 | 61 | 86 | 83 | 59 | 82 | 98 | 109 | 48 | 62 | ||||||||||||||||||||||||||||||||||||||
| Annual Adjusted EBITDA of Sales | 44 | 58 | |||||||||||||||||||||||||||||||||||||||||||||||||||||||||||||||||||||||||
| Adjusted Operating Income | (3083) | (6437) | (264) | 744 | (709) | (123) | 1829 | (7) | 54 | 2071 | 2182 | 600 | 972 | 4264 | 3460 | (40) | 271 | 885 | 2304 | 539 | 1147 | 2875 | 3852 | 1196 | 3435 | 6070 | 5570 | 3087 | 5979 | 7947 | 8850 | 4907 | 8314 | ||||||||||||||||||||||||||||||||||||||||||
| Consolidated Revenues | |||||||
| 2013 | 269503 | ||||||
| 2014 | 285693 | ||||||
| 2015 | 275834 | ||||||
| 2016 | 276573 | ||||||
| 2017 | 305907 | ||||||
| 2018 | 349637 | ||||||
| TTM 63019 | 362236 | ||||||
| Net Cash(Debt) | |||||||
| 2013 | (15380) | ||||||
| 2014 | 4207 | ||||||
| 2015 | 9840 | ||||||
| 2016 | 9580 | ||||||
| 2017 | (10127) | ||||||
| 2018 | 1060 | ||||||
| 63019 | (1908) | ||||||
| Rep Count | |||||||
| 2013 | 806 | ||||||
| 2014 | 916 | ||||||
| 2015 | 937 | ||||||
| 2016 | 1009 | ||||||
| 2017 | 983 | ||||||
| 2018 | 994 | ||||||
| 63019 | 982 | ||||||
| Adjusted OI | DampA | Adjusted EBITDA | |||||
| 2013 | 990 | 9030 | 10020 | ||||
| 2014 | 4907 | 8751 | 13658 | ||||
| 2015 | 8315 | 8543 | 17199 | ||||
| 2016 | 3388 | 8066 | 12065 | ||||
| 2017 | 15840 | ||||||
| 2018 | 25248 | ||||||
| TTM 63019 | 29237 | ||||||
| Reg G EBITDA By Quarter | |||||||
| Quarter | 2017 | 2018 | 2019 | ||||
| Q1 | 2852 | 5121 | 7457 | ||||
| Q2 | 4519 | 7749 | 9402 | ||||
| Q3 | 5443 | 7325 | |||||
| Q4 | 3026 | 5053 |
| Months of Experience | Average Annual Sales | Number of Reps | |||
| lt 12 Mos | ERRORVALUE | ERRORVALUE | |||
| 1 - 2 Yrs | ERRORVALUE | ERRORVALUE | |||
| 3 - 5 Yrs | ERRORVALUE | ERRORVALUE | |||
| 5 - 10 Yrs | ERRORVALUE | ERRORVALUE | |||
| gt 10 Yrs | ERRORVALUE | ERRORVALUE | |||
| ERRORVALUE | |||||
| Excludes ISR MSS CRS | |||||
| Excludes Freight | |||||
| Product mix | ||||||||
| Verticals | Q2 2019 Sales | |||||||
| Fastening Systems | 243 | 23008646 | ||||||
| Fluid Power | 152 | 14395529 | ||||||
| Specialy Chemicals | 117 | 11074332 | ||||||
| Cutting Tools and Abrasives | 130 | 12319702 | ||||||
| Electrical | 107 | 10102828 | ||||||
| Aftermarket Automotive Supplies | 77 | 7255974 | ||||||
| Safety | 47 | 4458217 | ||||||
| Welding and Metal Repair | 16 | 1539172 | ||||||
| Other | 112 | 10633378 | ||||||
| Total | 100 | 94787779 | ||||||
| Verticals | YTD 2019 Sales | |||||||
| Fastening Systems | 24 | 44125949 | ||||||
| Fluid Power | 15 | 28068352 | ||||||
| Specialy Chemicals | 12 | 21249420 | ||||||
| Cutting Tools and Abrasives | 13 | 24290887 | ||||||
| Electrical | 11 | 20425294 | ||||||
| Aftermarket Automotive Supplies | 8 | 14805874 | ||||||
| Safety | 5 | 8626381 | ||||||
| Welding and Metal Repair | 2 | 3088518 | ||||||
| Other | 10 | 20042457 | ||||||
| Total | 100 | 184723132 |
| Lawson core customer mix | ||||||||
| Account Tyoe | Q2 | |||||||
| Regional Accounts | 44933707 | 47 | ||||||
| Strategic | 13542786 | 14 | ||||||
| Kent Automotive | 14370813 | 15 | ||||||
| Bolt Supply | 11129675 | 12 | ||||||
| Government | 10087561 | 10 | ||||||
| Screw Products | 0 | 0 | ||||||
| Other (1) | 1428268 | 1 | ||||||
| Total | 96097363 | 100 | ||||||
| Account Tyoe | YTD June | |||||||
| Regional Accounts | 88400675 | 47 | ||||||
| Strategic | 26218365 | 14 | ||||||
| Kent Automotive | 29071347 | 16 | ||||||
| Bolt Supply | 20005505 | 11 | ||||||
| Government | 19505323 | 10 | ||||||
| Screw Products | 0 | 0 | ||||||
| Other | 4239066 | 2 | ||||||
| Total | 187440280 | 100 | ||||||
| Total Reported |
| August 2011 | OslashImplemented SAP | ||
| October 2011 | OslashCommenced construction of new McCook Ill distribution center | ||
| May 2012 | OslashRelocated corporate headquarters | ||
| June 2012 | OslashRestructured senior team Announced $20M cost savings plan | ||
| August 2012 | OslashTransitioned packaging facility to McCook Ill distribution center | ||
| OslashEntered into new five-year $40M credit facility | |||
| October 2012 | OslashAnnounced new CEO and President Michael G DeCata | ||
| OslashConsolidated Vernon Hills distribution center into McCook Ill | |||
| November 2012 | OslashRolled out new website to existing web customers | ||
| December 2012 | OslashCompleted transition of US independent agents to employees | ||
| April 2013 | OslashRoll-out of new website to new web customers | ||
| AprilMay 2013 | OslashMcCook DC begins to ship customer orders | ||
| November 2013 | OslashEntered into sub-lease of headquarters space to generate $29M of future cash savings | ||
| December 2013 | OslashEnded year with over 800 sales reps ndash First increase in 8 years | ||
| February 2014 | OslashClosed on Automatic Screw Machine Products sale for net proceeds of $121M | ||
| June 2014 | OslashEntered into sale-leaseback of Reno distribution facility for net proceeds of $83M | ||
| December 2014 | OslashEnded year with over 900 sales reps | ||
| February 2015 | OslashHeld North American sales meeting | ||
| September 2015 | OslashCompleted West Coast Fasteners acquisition | ||
| March 2016 | OslashCompleted Perfect Products of Michigan acquisition | ||
| May 2016 | OslashCompleted F B Feeney acquisition | ||
| June 2016 | OslashExpanded sales team to over 1000 sales reps | ||
| September 2016 | OslashExtended credit facitlity to August 2020 | ||
| November 2016 | OslashCompleted Mattic Industries acquisition | ||
| March 2017 | OslashConsolidated Fairfield NJ distribution operations into McCook Ill and Suwanee GA | ||
| May 2017 | OslashSold Fairfield NJ distribution center for a gain of $54M | ||
| October 2017 | OslashCompleted Bolt Supply House acquisition | ||
| April 2018 | OslashOpened MRO distribution center in Calgary Canada | ||
| October 2018 | OslashCompleted Screw Products acquisition and added Bolt Supply branch | ||
| June 2019 | OslashAchieved Q2 98 adjusted EBITDA net of ASC 842 impact of 03 | ||
| September 2019 | OslashAchieved Q3 109 adjusted EBITDA hired VP MampA | ||
| October 2019 | OslashEntered into new five-year $100M credit facility with additional $50 million accordion feature |
| ($ in thousands) | Q3 2013 | Q4 2013 | Q1 2014 | Q2 2014 | Q3 2014 | Q4 2014 | Q1 2015 | Q2 2015 | Q3 2015 | Q4 2015 | Q1 2016 | Q2 2016 | Q3 2016 | Q4 2016 | Q1 2017 | Q2 2017 | Q3 2017 | Q4 2017 | ||||||||||||||||||||||||||||||||||||||||||||||
| SGampA | 40350 | 42856 | 45991 | 42562 | 43855 | 44764 | 43830 | 40565 | 40532 | 41145 | 41290 | 42497 | 40184 | 45548 | 44167 | 42672 | 44915 | 46750 | $ 173014 | |||||||||||||||||||||||||||||||||||||||||||||
| $ - | ||||||||||||||||||||||||||||||||||||||||||||||||||||||||||||||||
| Excluded Costs | $ - | 40196 | ||||||||||||||||||||||||||||||||||||||||||||||||||||||||||||||
| Severance | (962) | 127 | (728) | (290) | 328 | 59 | (571) | (50) | (372) | (280) | (204) | (143) | (367) | (1662) | (465) | 9 | (139) | (144) | $ (234) | 127 | ||||||||||||||||||||||||||||||||||||||||||||
| Stock Based Compensation (Benefit) | (33) | (562) | (1125) | (408) | (2423) | (2443) | 541 | (971) | 30 | (1693) | 1217 | (515) | 630 | (3801) | 30 | (415) | (2337) | (384) | $ (5296) | -32 | ||||||||||||||||||||||||||||||||||||||||||||
| Loss(Gain) on Disposal of Property | 36 | (32) | - 0 | - 0 | (97) | (45) | - 0 | - 0 | 2 | (9) | - 0 | - 0 | - 0 | - 0 | - 0 | - 0 | - 0 | - 0 | $ (142) | |||||||||||||||||||||||||||||||||||||||||||||
| Legal Settlement | - 0 | - 0 | - 0 | - 0 | 688 | - 0 | - 0 | - 0 | - 0 | - 0 | - 0 | - 0 | - 0 | - 0 | - 0 | - 0 | - 0 | - 0 | $ 688 | -562 | ||||||||||||||||||||||||||||||||||||||||||||
| Employment Tax Matter | - 0 | 400 | - 0 | - 0 | - 0 | - 0 | - 0 | - 0 | - 0 | - 0 | - 0 | - 0 | - 0 | - 0 | - 0 | - 0 | - 0 | - 0 | $ - | 39729 | ||||||||||||||||||||||||||||||||||||||||||||
| Loss on Sub-Lease | - 0 | (2928) | - 0 | - 0 | - 0 | - 0 | - 0 | - 0 | - 0 | - 0 | - 0 | - 0 | - 0 | - 0 | - 0 | - 0 | - 0 | - 0 | $ - | |||||||||||||||||||||||||||||||||||||||||||||
| National sales meeting | - 0 | - 0 | - 0 | - 0 | - 0 | - 0 | (1889) | - 0 | - 0 | - 0 | - 0 | - 0 | - 0 | - 0 | - 0 | - 0 | - 0 | - 0 | $ (1889) | |||||||||||||||||||||||||||||||||||||||||||||
| Remediation expense | - 0 | - 0 | - 0 | - 0 | - 0 | (340) | - 0 | - 0 | - 0 | - 0 | - 0 | - 0 | - 0 | - 0 | - 0 | - 0 | - 0 | - 0 | $ (340) | |||||||||||||||||||||||||||||||||||||||||||||
| Property Impairment Loss | - 0 | - 0 | (2914) | (132) | - 0 | - 0 | - 0 | - 0 | - 0 | - 0 | - 0 | - 0 | - 0 | - 0 | - 0 | - 0 | - 0 | - 0 | $ - | |||||||||||||||||||||||||||||||||||||||||||||
| Adjusted SGampA | $ 39391 | $ 39861 | $ 41224 | $ 41732 | $ 42351 | $ 41995 | $ 41911 | $ 39544 | $ 40192 | $ 39163 | $ 42303 | $ 41839 | $ 40447 | $ 40085 | $ 43732 | $ 42266 | $ 42439 | $ 46222 | $ 165801 | |||||||||||||||||||||||||||||||||||||||||||||
| Annual Adjusted EBITDA of Sales | ERRORREF | ERRORREF | ||||||||||||||||||||||||||||||||||||||||||||||||||||||||||||||
| Q1 2013 | Q2 2013 | Q3 2013 | Q4 2013 | Q1 2014 | Q2 2014 | Q3 2014 | Q4 2014 | Q1 2015 | |||||||||||
| Selling Days | 63 | 64 | 64 | 61 | 63 | 64 | 64 | 61 | 63 | ||||||||||
| Net Sales | 67213 | 68317 | 68235 | 65738 | 69204 | 72080 | 74128 | 70281 | 69904 | ||||||||||
| Average Daily Sales | 1067 | 1067 | 1066 | 1078 | 1098 | 1126 | 1158 | 1152 | 1110 | ||||||||||
| Average Sales Rep Count | 762 | 764 | 774 | 794 | 819 | 854 | 882 | 908 | 911 | ||||||||||
| Sales per Sales Rep per Day | 1400 | 1397 | 1377 | 1358 | 1341 | 1319 | 1313 | 1269 | 1218 | ||||||||||
| Full Year | ||||||||||||||||||||||||||||||||||||||||||||||||||||||||||||||||||||
| ($ in thousands) | Q1 2011 | Q2 2011 | Q3 2011 | Q4 2011 | Q1 2012 | Q2 2012 | Q3 2012 | Q4 2012 | Q1 2013 | Q2 2013 | Q3 2013 | Q4 2013 | Q1 2014 | Q2 2014 | Q3 2014 | Q4 2014 | Q1 2015 | Q2 2015 | Q3 2015 | Q4 2015 | Q1 2016 | Q2 2016 | Q3 2016 | Q4 2016 | Q1 2017 | Q2 2017 | Q3 2017 | Q4 2017 | Q1 2018 | Q2 2018 | Q3 2018 | 2014 | 2015 | |||||||||||||||||||||||||||||||||||
| Net Sales | $ 79255 | $ 80625 | $ 71490 | $ 69029 | $ 71364 | $ 69830 | $ 67863 | $ 64505 | $ 67213 | $ 68317 | $ 68235 | $ 65738 | $ 69204 | $ 72080 | $ 74128 | $ 70281 | $ 69904 | $ 70726 | $ 70243 | $ 64961 | $ 69711 | $ 69348 | $ 70199 | $ 67315 | $ 74617 | $ 75006 | $ 75651 | $ 80633 | $ 84459 | $ 90382 | $ 88530 | $ 285693 | $ 275834 | |||||||||||||||||||||||||||||||||||
| Operating Income (Loss) | 3542 | 1397 | (3480) | (6995) | (3466) | (42084) | (1740) | 2057 | (3530) | (201) | 870 | (3002) | (4713) | 1241 | 678 | (2169) | (947) | 3243 | 2810 | (2985) | 1169 | 29 | 2389 | (5044) | 712 | 7891 | 1090 | 243 | 1837 | 5554 | (2266) | (4963) | 2121 | |||||||||||||||||||||||||||||||||||
| Depreciation amp Amortization | 1260 | 1315 | 1160 | 1675 | 1715 | 1566 | 1963 | 1841 | 2061 | 2244 | 2367 | 2358 | 2295 | 2163 | 2160 | 2133 | 2096 | 2126 | 2119 | 2202 | 2187 | 2226 | 1973 | 1680 | 1705 | 1644 | 1591 | 1830 | 1686 | 1679 | 1755 | 8751 | 8543 | |||||||||||||||||||||||||||||||||||
| EBITDA | 4802 | 2712 | (2320) | (5320) | (1751) | (40518) | 223 | 3898 | (1469) | 2043 | 3237 | (644) | (2418) | 3404 | 2838 | (36) | 1149 | 5369 | 4929 | (783) | 3356 | 2255 | 4362 | (3364) | 2417 | 9535 | 2681 | 2073 | 3523 | 7233 | (511) | 3788 | 10664 | |||||||||||||||||||||||||||||||||||
| Excluded Costs | ||||||||||||||||||||||||||||||||||||||||||||||||||||||||||||||||||||
| Severance | 745 | 465 | 282 | 122 | 185 | 6585 | 1410 | (159) | - 0 | 2 | 962 | (127) | 728 | 290 | (328) | (59) | 571 | 50 | 372 | 280 | 204 | 143 | 367 | 1662 | 465 | (9) | 139 | 144 | 628 | 64 | 31 | 631 | 1273 | |||||||||||||||||||||||||||||||||||
| Stock Based Compensation (Benefit) | 227 | (95) | (538) | 467 | 198 | (1015) | 77 | 434 | 1596 | 76 | 33 | 562 | 1125 | 408 | 2423 | 2443 | (541) | 971 | (30) | 1693 | (1217) | 515 | (630) | 3801 | (30) | 415 | 2337 | 384 | 970 | 87 | 7637 | 6399 | 2093 | |||||||||||||||||||||||||||||||||||
| Acquisition Related Costs | - 0 | - 0 | - 0 | - 0 | - 0 | - 0 | 310 | 32 | 115 | 198 | 178 | 120 | - 0 | - 0 | 286 | 425 | - 0 | - 0 | 168 | |||||||||||||||||||||||||||||||||||||||||||||||||
| ERP Implementation Costs | 1902 | 2388 | 2344 | 339 | - 0 | - 0 | - 0 | - 0 | - 0 | - 0 | - 0 | - 0 | - 0 | - 0 | - 0 | - 0 | - 0 | - 0 | - 0 | - 0 | - 0 | - 0 | - 0 | - 0 | - 0 | - 0 | - 0 | - 0 | - 0 | - 0 | - 0 | - 0 | ||||||||||||||||||||||||||||||||||||
| Loss(Gain) on Disposal of Property | - 0 | - 0 | - 0 | 22 | - 0 | (2122) | (11) | (1588) | - 0 | - 0 | (36) | 32 | - 0 | - 0 | 97 | 45 | - 0 | - 0 | (2) | 9 | - 0 | - 0 | - 0 | - 0 | - 0 | (5422) | - 0 | - 0 | - 0 | - 0 | - 0 | 142 | 7 | |||||||||||||||||||||||||||||||||||
| Legal Settlement | - 0 | - 0 | - 0 | - 0 | - 0 | - 0 | - 0 | - 0 | - 0 | - 0 | - 0 | - 0 | - 0 | - 0 | (688) | - 0 | - 0 | - 0 | - 0 | - 0 | - 0 | - 0 | - 0 | - 0 | - 0 | - 0 | - 0 | - 0 | - 0 | - 0 | - 0 | (688) | - 0 | |||||||||||||||||||||||||||||||||||
| Employment Tax Matter | - 0 | - 0 | - 0 | 1200 | - 0 | - 0 | - 0 | - 0 | - 0 | - 0 | - 0 | (400) | - 0 | - 0 | - 0 | - 0 | - 0 | - 0 | - 0 | - 0 | - 0 | - 0 | - 0 | - 0 | - 0 | - 0 | - 0 | - 0 | - 0 | - 0 | - 0 | - 0 | - 0 | |||||||||||||||||||||||||||||||||||
| Lease termination gain | - 0 | - 0 | - 0 | - 0 | - 0 | - 0 | - 0 | - 0 | - 0 | - 0 | - 0 | 2928 | - 0 | - 0 | - 0 | - 0 | - 0 | - 0 | - 0 | - 0 | - 0 | - 0 | - 0 | - 0 | - 0 | - 0 | - 0 | - 0 | - 0 | (164) | - 0 | - 0 | - 0 | |||||||||||||||||||||||||||||||||||
| Goodwill Impairment | - 0 | - 0 | - 0 | - 0 | - 0 | 28306 | - 0 | - 0 | - 0 | - 0 | - 0 | - 0 | - 0 | - 0 | - 0 | - 0 | - 0 | - 0 | - 0 | - 0 | - 0 | - 0 | - 0 | - 0 | - 0 | - 0 | - 0 | - 0 | - 0 | - 0 | - 0 | - 0 | - 0 | |||||||||||||||||||||||||||||||||||
| Inventory Rationalization | - 0 | - 0 | - 0 | - 0 | - 0 | 3893 | - 0 | - 0 | - 0 | - 0 | - 0 | - 0 | - 0 | - 0 | - 0 | - 0 | - 0 | - 0 | - 0 | - 0 | - 0 | - 0 | - 0 | - 0 | - 0 | - 0 | - 0 | - 0 | - 0 | - 0 | - 0 | - 0 | - 0 | |||||||||||||||||||||||||||||||||||
| Discontinued operation accrual | - 0 | - 0 | - 0 | - 0 | - 0 | - 0 | - 0 | - 0 | - 0 | - 0 | - 0 | - 0 | - 0 | - 0 | - 0 | 340 | - 0 | - 0 | - 0 | 931 | - 0 | - 0 | - 0 | - 0 | - 0 | - 0 | - 0 | - 0 | - 0 | 529 | - 0 | 340 | 931 | |||||||||||||||||||||||||||||||||||
| North American sales meeting | - 0 | - 0 | - 0 | - 0 | - 0 | - 0 | - 0 | - 0 | 1225 | - 0 | - 0 | - 0 | - 0 | - 0 | - 0 | - 0 | 1889 | - 0 | - 0 | - 0 | - 0 | - 0 | - 0 | - 0 | - 0 | - 0 | - 0 | - 0 | - 0 | - 0 | - 0 | - 0 | 1889 | |||||||||||||||||||||||||||||||||||
| Property Impairment Loss | - 0 | - 0 | - 0 | - 0 | - 0 | - 0 | - 0 | - 0 | - 0 | - 0 | - 0 | - 0 | 2914 | 132 | - 0 | - 0 | - 0 | - 0 | - 0 | - 0 | - 0 | - 0 | - 0 | - 0 | - 0 | - 0 | - 0 | - 0 | - 0 | - 0 | - 0 | 3046 | - 0 | |||||||||||||||||||||||||||||||||||
| Adjusted EBITDA | $ 7676 | $ 5470 | $ (232) | $ (3170) | $ (1368) | $ (4871) | $ 1699 | $ 2585 | $ 1352 | $ 2121 | $ 4196 | $ 2351 | $ 2349 | $ 4234 | $ 4342 | $ 2733 | $ 3068 | $ 6390 | $ 5579 | $ 2162 | $ 2458 | $ 3111 | $ 4277 | $ 2219 | $ 2852 | $ 4519 | $ 5443 | $ 3026 | $ 5121 | $ 7749 | $ 7325 | $ 13658 | $ 17199 | |||||||||||||||||||||||||||||||||||
| Adjusted EBITDA of Sales | 97 | 68 | -03 | -46 | -19 | -70 | 25 | 40 | 20 | 31 | 61 | 36 | 34 | 59 | 59 | 39 | 44 | 90 | 79 | 33 | 35 | 45 | 61 | 33 | 38 | 60 | 72 | 38 | 61 | 86 | 83 | 48 | 62 | |||||||||||||||||||||||||||||||||||
| Annual Adjusted EBITDA of Sales | 44 | 58 | ||||||||||||||||||||||||||||||||||||||||||||||||||||||||||||||||||
| Adjusted Operating Income | (3083) | (6437) | (264) | 744 | (709) | (123) | 1829 | (7) | 54 | 2071 | 2182 | 600 | 972 | 4264 | 3460 | (40) | 271 | 885 | 2304 | 539 | 1147 | 2875 | 3852 | 1196 | 3435 | 6070 | 5570 | - 0 | 4907 | 8314 | ||||||||||||||||||||||||||||||||||||||
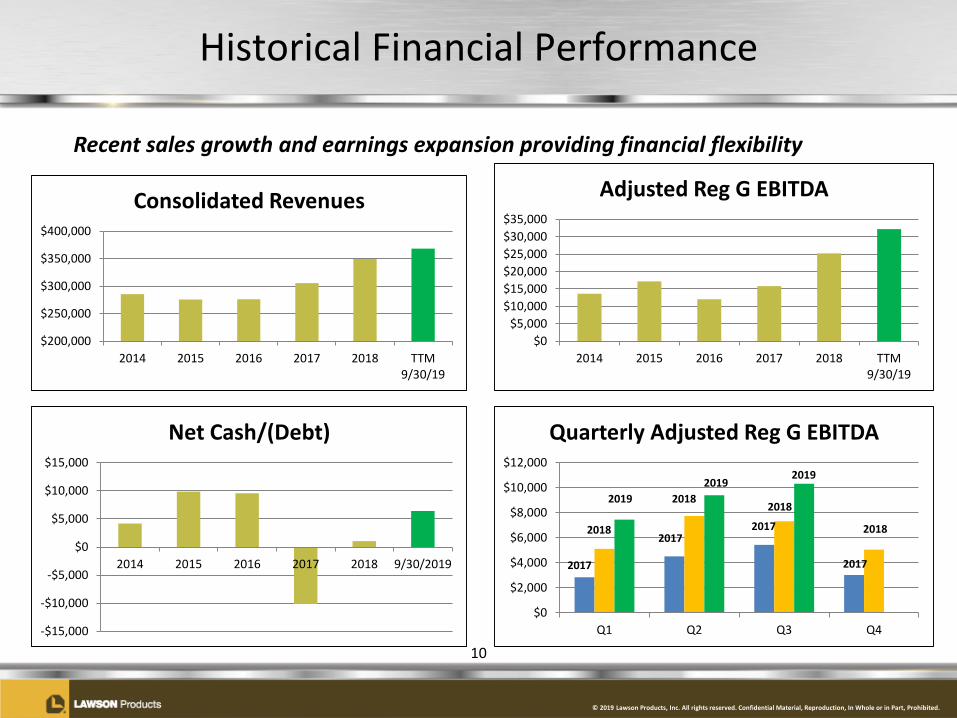
copy 2019 Lawson Products Inc All rights reserved Confidential Material Reproduction In Whole or in Part Prohibited
2019 Focus Actions Across the Value Chain Driving Growth
Add New Sales Reps and Drive Rep Productivity
Sales Process Sales Reps
Customer Service Order
Entry
ProductManagement
PricingDC Operations Sourcing
Purchasing
bull Increase sales rep count
bull Onboardingprocesstraining
bull SalesManagement dashboard
bull EDI with customers
bull Reduction of cycle times
bull Order padbull Consolidation of
shipmentsbull Sales service reps
bull Leverage vendor drop-ship programs
bull Fleet maintenance focus
bull Pricing enhancements
bull Website
bull Reduce cycle timebull Refine ldquoPullrdquo
strategybull Freight
enhancementsbull Minimize
backordersbull Improve service
levelsbull Forecasting tool
bull Supplier negotiation process
bull Vendor metricsbull Electronic
communication
Information Technology ndash Integration of Web and SAPLean Six Sigma
8
copy 2019 Lawson Products Inc All rights reserved Confidential Material Reproduction In Whole or in Part Prohibited
Longer Sales Rep Tenure Drives Rep Productivity
9
$0
$50000
$100000
$150000
$200000
$250000
$300000
$350000
$400000
$450000
$500000
lt 12 Mos 1 - 2 Yrs 3 - 5 Yrs 5 - 10 Yrs gt 10 Yrs0
50
100
150
200
250
300
350
Aver
age
Annu
al S
ales
Tenure With Lawson (as of 93019)
Num
ber O
f Sal
es R
eps
Number of Reps Average Annual Sales
copy 2019 Lawson Products Inc All rights reserved Confidential Material Reproduction In Whole or in Part Prohibited
Historical Financial Performance
Recent sales growth and earnings expansion providing financial flexibility
10
$200000
$250000
$300000
$350000
$400000
2014 2015 2016 2017 2018 TTM93019
Consolidated Revenues
$0$5000
$10000$15000$20000$25000$30000$35000
2014 2015 2016 2017 2018 TTM93019
Adjusted Reg G EBITDA
-$15000
-$10000
-$5000
$0
$5000
$10000
$15000
2014 2015 2016 2017 2018 9302019
Net Cash(Debt)
$0
$2000
$4000
$6000
$8000
$10000
$12000
Q1 Q2 Q3 Q4
Quarterly Adjusted Reg G EBITDA
2017
20172017
2017
2018
20182018
2018
20192019
2019
copy 2019 Lawson Products Inc All rights reserved Confidential Material Reproduction In Whole or in Part Prohibited
Financial Highlights for Third Quarter 2019
bull Sales increased 71 YOY (74 excluding currency fluctuation)
bull MRO LawsonKent gross margins consistent at 609
bull Adjusted Reg G EBITDA margin improving 109 in Q3 2019 v 83 in Q3 2018 Continued investment in new sales reps and rep productivity
bull Key trends MRO operating leverage of 54 13 increase in sales rep productivity Continued government strength +30 YOY Growth across multiple segments and product categories Cash flow from operations of $103 million in Q3
11
copy 2019 Lawson Products Inc All rights reserved Confidential Material Reproduction In Whole or in Part Prohibited
Pursue Disciplined MampA
Reinvest for Growth
Return Capital
bull Increased our borrowing capacity to $1000 million (additional $500 million accordion) with our new borrowing agreement
bull Capital expenditures expected to be $20 - $30 million in 2019bull Growth initiatives add new reps and increase sales rep productivity
bull Share repurchase to offset award dilution opportunistic purchasesbull $75 million stock repurchase program announced on May 16 2019 $63
million remaining after repurchase of shares worth $12 million in August 2019
bull Bolt-on acquisitions to enhance core growth strategiesbull Closed Screw Products Inc acquisition on 10118
Maintain Strong Balance Sheet
bull $86 million cash on hand and positive cash position of $64 million at the end of Q3
bull Consistent free cash flow generation
Capital Allocation Priorities
12
copy 2019 Lawson Products Inc All rights reserved Confidential Material Reproduction In Whole or in Part Prohibited
Lawson Products Poised for Growth
bull Leverage Current Infrastructure
bull Continued Sales Growth
bull Foundational Investments Completed
bull Operational Excellence
bull Large Fragmented Market
13
copy 2019 Lawson Products Inc All rights reserved Confidential Material Reproduction In Whole or in Part Prohibited
For More Information
Contact
Ronald J KnutsonEVP CFOInvestor Relations(773) 304-5665ronknutsonlawsonproductscom
And see our Website athttpwwwlawsonproductscomcompany-infoinvestor-relationsjsp
14
copy 2019 Lawson Products Inc All rights reserved Confidential Material Reproduction In Whole or in Part Prohibited
Appendices
15
copy 2019 Lawson Products Inc All rights reserved Confidential Material Reproduction In Whole or in Part Prohibited
Significant Activities
16
Appendix P-1
August 2011 Implemented SAPOctober 2011 Commenced construction of new McCook Ill distribution center
May 2012 Relocated corporate headquartersJune 2012 Restructured senior team Announced $20M cost savings plan
Transitioned packaging facility to McCook Ill distribution centerEntered into new five-year $40M credit facilityAnnounced new CEO and President Michael G DeCataConsolidated Vernon Hills distribution center into McCook Ill
November 2012 Rolled out new website to existing web customersDecember 2012 Completed transition of US independent agents to employees
April 2013 Roll-out of new website to new web customersAprilMay 2013 McCook DC begins to ship customer ordersNovember 2013 Entered into sub-lease of headquarters space to generate $29M of future cash savingsDecember 2013 Ended year with over 800 sales reps ndash First increase in 8 yearsFebruary 2014 Closed on Automatic Screw Machine Products sale for net proceeds of $121M
June 2014 Entered into sale-leaseback of Reno distribution facility for net proceeds of $83MDecember 2014 Ended year with over 900 sales repsFebruary 2015 Held North American sales meeting
September 2015 Completed West Coast Fasteners acquisitionMarch 2016 Completed Perfect Products of Michigan acquisitionMay 2016 Completed F B Feeney acquisitionJune 2016 Expanded sales team to over 1000 sales reps
September 2016 Extended credit facitlity to August 2020November 2016 Completed Mattic Industries acquisition
March 2017 Consolidated Fairfield NJ distribution operations into McCook Ill and Suwanee GAMay 2017 Sold Fairfield NJ distribution center for a gain of $54M
October 2017 Completed Bolt Supply House acquisitionApril 2018 Opened MRO distribution center in Calgary Canada
October 2018 Completed Screw Products acquisition and added Bolt Supply branchJune 2019 Achieved Q2 98 adjusted EBITDA net of ASC 842 impact of 03
September 2019 Achieved Q3 109 adjusted EBITDA hired VP MampAOctober 2019 Entered into new five-year $100M credit facility with additional $50 million accordion feature
August 2012
October 2012
Adjusted EBITDA $ in 000s
Adjusted EBITDA Q4 2016Q1 2017Q2 2017Q3 2017Q4 201722192852451954433026
Adjusted EBITDA of Sales
Adjusted EBITDA of SalesQ3 2016Q4 2016Q1 2017Q2 2017Q3 2017Q4 201760926793828971926E-232964421005719377E-23822185292895721E-260248513452257152E-271948817596594883E-237528059231332088E-2
Adjusted Operating Income of Sales
Adjusted Operating IncomeQ3 2016Q4 2016Q1 2017Q2 2017Q3 2017Q4 201723045391147287538521196
Adjusted Op Inc $ in 000s
Adjusted EBITDA Q4 2016Q1 2017Q2 2017Q3 2017Q4 20175391147287538521196
Net Sales by Quarter $ in 000s
Net SalesQ1 2013Q2 2013Q3 2013Q4 2013Q1 2014Q2 2014Q3 2014Q4 2014Q1 2015672136831768235657386920472080741287028169904
Adjusted SGampA $ in 000s
Adjusted SGampA Q4 2015Q1 2016Q2 2016Q3 2016Q4 2016Q1 2017Q2 2017Q3 2017Q4 2017391634230341839404474008543732422664243946222
copy 2019 Lawson Products Inc All rights reserved Confidential Material Reproduction In Whole or in Part Prohibited
Regulation G ndash GAAP ReconciliationAppendix P-2
Non GAAP Reconciliation of Adjusted EBITDA to Sales Percentage
The Company reports its financial results in accordance with US generally accepted accounting principles (GAAP) However the Companys management believesthat certain non-GAAP financial measures may provide users of this financial information additional meaningful comparisons between current results and results inprior operating periods Management believes that these non-GAAP financial measures can provide additional meaningful reflection of underlying trends of thebusiness because they provide a comparison of historical information that excludes certain non-operational non-recurring or intermittently recurring items thatimpact the overall comparability See the table below for supplemental financial data and corresponding reconciliations to GAAP financial measures for quarterlyadjusted EBITDA as a percentage of net sales Non-GAAP financial measures should be viewed in addition to and not as an alternative for the Companys reportedresults prepared in accordance with GAAP
17
($ in thousands) Q1 2017 Q2 2017 Q3 2017 Q4 2017 Q1 2018 Q2 2018 Q3 2018 Q4 2018 Q1 2019 Q2 2019 Q3 2019
Net Sales 74617$ 75006$ 75651$ 80633$ 84459$ 90382$ 88530$ 86266$ 91343$ 96097$ 94779$
Operating Income (Loss) 712 7891 1090 243 1837 5554 (2266) 4085 5544 1623 6446 Depreciation amp Amortization 1705 1644 1591 1830 1686 1679 1755 1735 1478 1455 1468 EBITDA 2417 9535 2681 2073 3523 7233 (511) 5820 7022 3078 7914
Excluded CostsSeverance 465 (9) 139 144 628 64 31 126 27 1485 30 Stock Based Compensation (Benefit) (30) 415 2337 384 970 87 7637 (1186) 408 4839 2374 Acquisition Related Costs - - 286 425 - - 168 62 - - - Loss(Gain) on Disposal of Property - (5422) - - - - - - - - - Lease termination gain - - - - - (164) - - - - - Discontinued operation accrual - - - - - 529 - - - - - Building Impairment - - - - - - - 231 - - - Reg G Adjusted EBITDA 2852$ 4519$ 5443$ 3026$ 5121$ 7749$ 7325$ 5053$ 7457$ 9402$ 10318$
Adjusted EBITDA of Sales 38 60 72 38 61 86 83 59 82 98 109
Customer Mix
Regional Accounts48
Kent Automotive16
Regional AccountsStrategicKent AutomotiveBolt SupplyGovernment Screw ProductsOther047014000000000000001016011010002
ampDampF ampA
Product Mix
Fastening Systems23
Specialty Chemicals12
Fastening SystemsFluid PowerSpecialy ChemicalsCutting Tools and AbrasivesElectricalAftermarket Automotive SuppliesSafetyWelding and Metal RepairOther02401501201301100800500201
Number Of Sales Reps
Tenure With Lawson (as of 63019)
Average Annual Sales
Consolidated Revenues
Consolidated Revenues20142015201620172018TTM 63019285693275834276573305907349637362236Net Cash(Debt)2014201520162017201843646420798409580-101271060-1908Rep Count201320142015201620172018436468069169371009983994982
Adjusted Reg G EBITDA
Adjusted EBITDA20142015201620172018TTM 63019136581719912065158402524829237
Quarterly Adjusted Reg G EBITDA
2017Q1Q2Q3Q428524519544330262018Q1Q2Q3Q451217749732550532019Q1Q2Q3Q474579402
Adjusted EBITDA $ in 000s
Reg G Adjusted EBITDA Q1 2017Q2 2017Q3 2017Q4 20172852451954433026
Adjusted EBITDA of Sales
Adjusted EBITDA of SalesQ1 2017Q2 2017Q3 2017Q4 20173822185292895721E-260248513452257152E-271948817596594883E-237528059231332088E-2
Adjusted Operating Income of Sales
Adjusted Operating IncomeQ1 2017Q2 2017Q3 2017Q4 2017
Adjusted Op Inc $ in 000s
Reg G Adjusted EBITDA Q1 2017Q2 2017Q3 2017Q4 2017
copy 2019 Lawson Products Inc All rights reserved Confidential Material Reproduction In Whole or in Part Prohibited
Consolidated Balance Sheet Appendix P-4
18
ASSETSCurrent assetsCash and cash equivalents $ 8626 $ 11883Restricted cash 800 800Accounts receivable less allowance for doubtful accounts of $614 and $549 respectively
45162 37682
Inventories net 54894 52887Miscellaneous receivables and prepaid expenses 4270 3653Total current assets 113752 106905
Property plant and equipment net 16932 23548Deferred income taxes 17372 20592Goodwill 20582 20079Cash value of life insurance 14440 12599Intangible assets net 12468 13112Lease assets 11917 mdashOther assets 275 307Total assets $ 207738 $ 197142
LIABILITIES AND STOCKHOLDERSrsquo EQUITYCurrent liabilitiesRevolving lines of credit $ 2195 $ 10823Accounts payable 16325 15207Lease obligation 3781 mdashAccrued expenses and other liabilities 37873 40179Total current liabilities 60174 66209
Security bonus plan 11969 12413Lease obligation 10360 5213Deferred compensation 5915 5304Deferred tax liability 2879 2761Other liabilities 3460 6069Total liabilities 94757 97969
Stockholdersrsquo equityPreferred stock $1 par valueAuthorized - 500000 shares Issued and outstanding mdash None mdash mdashCommon stock $1 par value
Authorized - 35000000 sharesIssued - 9042597 and 9005716 shares respectivelyOutstanding - 8956981 and 8955930 shares respectively
Capital in excess of par value 17626 15623Retained earnings 89502 77338Treasury stock ndash 85616 and 49786 shares respectivelyAccumulated other comprehensive lossTotal stockholdersrsquo equity 112981 99173Total liabilities and stockholdersrsquo equity $ 207738 $ 197142
September 30 December 312019 2018
(Unaudited)
(2595) (1234)(595) (1560)
9043 9006
Customer Mix
Regional Accounts48
Kent Automotive16
Regional AccountsStrategicKent AutomotiveBolt SupplyGovernment Screw ProductsOther0470140000000000000010150110110002
ampDampF ampA
Product Mix
Fastening Systems23
Specialty Chemicals12
Fastening SystemsFluid PowerSpecialy ChemicalsCutting Tools and AbrasivesElectricalAftermarket Automotive SuppliesSafetyWelding and Metal RepairOther02401501201301100800500201
Number Of Sales Reps
Tenure With Lawson (as of 63019)
Average Annual Sales
Consolidated Revenues
Consolidated Revenues20142015201620172018TTM 93019285693275834276573305907349637368485Net Cash(Debt)2014201520162017201843738420798409580-1012710606431Rep Count201320142015201620172018437388069169371009983994993
Adjusted Reg G EBITDA
Adjusted EBITDA20142015201620172018TTM 93019136581719912065158402524832230
Quarterly Adjusted Reg G EBITDA
2017Q1Q2Q3Q428524519544330262018Q1Q2Q3Q451217749732550532019Q1Q2Q3Q47457940210318
Adjusted EBITDA $ in 000s
Reg G Adjusted EBITDA Q1 2017Q2 2017Q3 2017Q4 20172852451954433026
Adjusted EBITDA of Sales
Adjusted EBITDA of SalesQ1 2017Q2 2017Q3 2017Q4 20173822185292895721E-260248513452257152E-271948817596594883E-237528059231332088E-2
Adjusted Operating Income of Sales
Adjusted Operating IncomeQ1 2017Q2 2017Q3 2017Q4 2017
Adjusted Op Inc $ in 000s
Reg G Adjusted EBITDA Q1 2017Q2 2017Q3 2017Q4 2017
| September 30 | December 31 | ||||||||||
| 2019 | 2018 | ||||||||||
| ASSETS | (Unaudited) | ||||||||||
| Current assets | |||||||||||
| Cash and cash equivalents | $ | 8626 | $ | 11883 | |||||||
| Restricted cash | 800 | 800 | |||||||||
| Accounts receivable less allowance for doubtful accounts of $614 and $549 respectively | 45162 | 37682 | |||||||||
| Inventories net | 54894 | 52887 | |||||||||
| Miscellaneous receivables and prepaid expenses | 4270 | 3653 | |||||||||
| Total current assets | 113752 | 106905 | |||||||||
| Property plant and equipment net | 16932 | 23548 | |||||||||
| Deferred income taxes | 17372 | 20592 | |||||||||
| Goodwill | 20582 | 20079 | |||||||||
| Cash value of life insurance | 14440 | 12599 | |||||||||
| Intangible assets net | 12468 | 13112 | |||||||||
| Lease assets | 11917 | mdash | |||||||||
| Other assets | 275 | 307 | |||||||||
| Total assets | $ | 207738 | $ | 197142 | |||||||
| LIABILITIES AND STOCKHOLDERSrsquo EQUITY | |||||||||||
| Current liabilities | |||||||||||
| Revolving lines of credit | $ | 2195 | $ | 10823 | |||||||
| Accounts payable | 16325 | 15207 | |||||||||
| Lease obligation | 3781 | mdash | |||||||||
| Accrued expenses and other liabilities | 37873 | 40179 | |||||||||
| Total current liabilities | 60174 | 66209 | |||||||||
| Security bonus plan | 11969 | 12413 | |||||||||
| Lease obligation | 10360 | 5213 | |||||||||
| Deferred compensation | 5915 | 5304 | |||||||||
| Deferred tax liability | 2879 | 2761 | |||||||||
| Other liabilities | 3460 | 6069 | |||||||||
| Total liabilities | 94757 | 97969 | |||||||||
| Stockholdersrsquo equity | |||||||||||
| Preferred stock $1 par value | |||||||||||
| Authorized - 500000 shares Issued and outstanding mdash None | mdash | mdash | |||||||||
| Common stock $1 par value | |||||||||||
| Authorized - 35000000 shares | 9043 | 9006 | |||||||||
| Issued - 9042597 and 9005716 shares respectively | |||||||||||
| Outstanding - 8956981 and 8955930 shares respectively | |||||||||||
| Capital in excess of par value | 17626 | 15623 | |||||||||
| Retained earnings | 89502 | 77338 | |||||||||
| Treasury stock ndash 85616 and 49786 shares respectively | (2595) | (1234) | |||||||||
| Accumulated other comprehensive loss | (595) | (1560) | |||||||||
| Total stockholdersrsquo equity | 112981 | 99173 | |||||||||
| Total liabilities and stockholdersrsquo equity | $ | 207738 | $ | 197142 | |||||||
| Three Months Ended | |||||||||||||||||||||||||||||
| Jun 30 2019 | Mar 31 2019 | Dec 31 2018 | Sep 30 2018 | Jun 30 2018 | |||||||||||||||||||||||||
| Average daily net sales | $ | 1502 | $ | 1450 | $ | 1414 | $ | 1405 | $ | 1412 | |||||||||||||||||||
| Year over year increase | 63 | 82 | 70 | 170 | 205 | ||||||||||||||||||||||||
| Sequential quarter increase (decrease) | 36 | 25 | 06 | (05) | 53 | ||||||||||||||||||||||||
| Net Sales | $ | 96097 | $ | 91343 | $ | 86266 | $ | 88530 | $ | 90382 | |||||||||||||||||||
| Gross profit (1) | 51043 | 48923 | 46083 | 48108 | 49131 | ||||||||||||||||||||||||
| Gross profit percentage (1) | 531 | 536 | 534 | 543 | 544 | ||||||||||||||||||||||||
| Selling general amp administrative expenses | $ | 49420 | $ | 43379 | $ | 41998 | $ | 50374 | $ | 43577 | |||||||||||||||||||
| Operating income (loss) | $ | 1623 | $ | 5544 | $ | 4085 | $ | (2266) | $ | 5554 | |||||||||||||||||||
| Full Year | |||||||||||||||||||||||||||||||||||||||||||||||||||||||||||||||||||||||||||
| ($ in thousands) | Q1 2011 | Q2 2011 | Q3 2011 | Q4 2011 | Q1 2012 | Q2 2012 | Q3 2012 | Q4 2012 | Q1 2013 | Q2 2013 | Q3 2013 | Q4 2013 | Q1 2014 | Q2 2014 | Q3 2014 | Q4 2014 | Q1 2015 | Q2 2015 | Q3 2015 | Q4 2015 | Q1 2016 | Q2 2016 | Q3 2016 | Q4 2016 | Q1 2017 | Q2 2017 | Q3 2017 | Q4 2017 | Q1 2018 | Q2 2018 | Q3 2018 | Q4 2018 | Q1 2019 | Q2 2019 | Q3 2019 | 2014 | 2015 | ||||||||||||||||||||||||||||||||||||||
| Net Sales | $ 79255 | $ 80625 | $ 71490 | $ 69029 | $ 71364 | $ 69830 | $ 67863 | $ 64505 | $ 67213 | $ 68317 | $ 68235 | $ 65738 | $ 69204 | $ 72080 | $ 74128 | $ 70281 | $ 69904 | $ 70726 | $ 70243 | $ 64961 | $ 69711 | $ 69348 | $ 70199 | $ 67315 | $ 74617 | $ 75006 | $ 75651 | $ 80633 | $ 84459 | $ 90382 | $ 88530 | $ 86266 | $ 91343 | $ 96097 | $ 94779 | $ 285693 | $ 275834 | ||||||||||||||||||||||||||||||||||||||
| Operating Income (Loss) | 3542 | 1397 | (3480) | (6995) | (3466) | (42084) | (1740) | 2057 | (3530) | (201) | 870 | (3002) | (4713) | 1241 | 678 | (2169) | (947) | 3243 | 2810 | (2985) | 1169 | 29 | 2389 | (5044) | 712 | 7891 | 1090 | 243 | 1837 | 5554 | (2266) | 4085 | 5544 | 1623 | 6446 | (4963) | 2121 | ||||||||||||||||||||||||||||||||||||||
| Depreciation amp Amortization | 1260 | 1315 | 1160 | 1675 | 1715 | 1566 | 1963 | 1841 | 2061 | 2244 | 2367 | 2358 | 2295 | 2163 | 2160 | 2133 | 2096 | 2126 | 2119 | 2202 | 2187 | 2226 | 1973 | 1680 | 1705 | 1644 | 1591 | 1830 | 1686 | 1679 | 1755 | 1735 | 1478 | 1455 | 1468 | 8751 | 8543 | ||||||||||||||||||||||||||||||||||||||
| EBITDA | 4802 | 2712 | (2320) | (5320) | (1751) | (40518) | 223 | 3898 | (1469) | 2043 | 3237 | (644) | (2418) | 3404 | 2838 | (36) | 1149 | 5369 | 4929 | (783) | 3356 | 2255 | 4362 | (3364) | 2417 | 9535 | 2681 | 2073 | 3523 | 7233 | (511) | 5820 | 7022 | 3078 | 7914 | 3788 | 10664 | ||||||||||||||||||||||||||||||||||||||
| Excluded Costs | |||||||||||||||||||||||||||||||||||||||||||||||||||||||||||||||||||||||||||
| Severance | 745 | 465 | 282 | 122 | 185 | 6585 | 1410 | (159) | - 0 | 2 | 962 | (127) | 728 | 290 | (328) | (59) | 571 | 50 | 372 | 280 | 204 | 143 | 367 | 1662 | 465 | (9) | 139 | 144 | 628 | 64 | 31 | 126 | 27 | 1485 | 30 | 631 | 1273 | ||||||||||||||||||||||||||||||||||||||
| Stock Based Compensation (Benefit) | 227 | (95) | (538) | 467 | 198 | (1015) | 77 | 434 | 1596 | 76 | 33 | 562 | 1125 | 408 | 2423 | 2443 | (541) | 971 | (30) | 1693 | (1217) | 515 | (630) | 3801 | (30) | 415 | 2337 | 384 | 970 | 87 | 7637 | (1186) | 408 | 4839 | 2374 | 6399 | 2093 | ||||||||||||||||||||||||||||||||||||||
| Acquisition Related Costs | - 0 | - 0 | - 0 | - 0 | - 0 | - 0 | 310 | 32 | 115 | 198 | 178 | 120 | - 0 | - 0 | 286 | 425 | - 0 | - 0 | 168 | 62 | - 0 | - 0 | - 0 | ||||||||||||||||||||||||||||||||||||||||||||||||||||
| ERP Implementation Costs | 1902 | 2388 | 2344 | 339 | - 0 | - 0 | - 0 | - 0 | - 0 | - 0 | - 0 | - 0 | - 0 | - 0 | - 0 | - 0 | - 0 | - 0 | - 0 | - 0 | - 0 | - 0 | - 0 | - 0 | - 0 | - 0 | - 0 | - 0 | - 0 | - 0 | - 0 | - 0 | - 0 | ||||||||||||||||||||||||||||||||||||||||||
| Loss(Gain) on Disposal of Property | - 0 | - 0 | - 0 | 22 | - 0 | (2122) | (11) | (1588) | - 0 | - 0 | (36) | 32 | - 0 | - 0 | 97 | 45 | - 0 | - 0 | (2) | 9 | - 0 | - 0 | - 0 | - 0 | - 0 | (5422) | - 0 | - 0 | - 0 | - 0 | - 0 | - 0 | - 0 | - 0 | - 0 | 142 | 7 | ||||||||||||||||||||||||||||||||||||||
| Legal Settlement | - 0 | - 0 | - 0 | - 0 | - 0 | - 0 | - 0 | - 0 | - 0 | - 0 | - 0 | - 0 | - 0 | - 0 | (688) | - 0 | - 0 | - 0 | - 0 | - 0 | - 0 | - 0 | - 0 | - 0 | - 0 | - 0 | - 0 | - 0 | - 0 | - 0 | - 0 | - 0 | (688) | - 0 | |||||||||||||||||||||||||||||||||||||||||
| Employment Tax Matter | - 0 | - 0 | - 0 | 1200 | - 0 | - 0 | - 0 | - 0 | - 0 | - 0 | - 0 | (400) | - 0 | - 0 | - 0 | - 0 | - 0 | - 0 | - 0 | - 0 | - 0 | - 0 | - 0 | - 0 | - 0 | - 0 | - 0 | - 0 | - 0 | - 0 | - 0 | - 0 | - 0 | - 0 | |||||||||||||||||||||||||||||||||||||||||
| Lease termination gain | - 0 | - 0 | - 0 | - 0 | - 0 | - 0 | - 0 | - 0 | - 0 | - 0 | - 0 | 2928 | - 0 | - 0 | - 0 | - 0 | - 0 | - 0 | - 0 | - 0 | - 0 | - 0 | - 0 | - 0 | - 0 | - 0 | - 0 | - 0 | - 0 | (164) | - 0 | - 0 | - 0 | - 0 | - 0 | - 0 | - 0 | ||||||||||||||||||||||||||||||||||||||
| Goodwill Impairment | - 0 | - 0 | - 0 | - 0 | - 0 | 28306 | - 0 | - 0 | - 0 | - 0 | - 0 | - 0 | - 0 | - 0 | - 0 | - 0 | - 0 | - 0 | - 0 | - 0 | - 0 | - 0 | - 0 | - 0 | - 0 | - 0 | - 0 | - 0 | - 0 | - 0 | - 0 | - 0 | - 0 | - 0 | |||||||||||||||||||||||||||||||||||||||||
| Inventory Rationalization | - 0 | - 0 | - 0 | - 0 | - 0 | 3893 | - 0 | - 0 | - 0 | - 0 | - 0 | - 0 | - 0 | - 0 | - 0 | - 0 | - 0 | - 0 | - 0 | - 0 | - 0 | - 0 | - 0 | - 0 | - 0 | - 0 | - 0 | - 0 | - 0 | - 0 | - 0 | - 0 | - 0 | - 0 | |||||||||||||||||||||||||||||||||||||||||
| Discontinued operation accrual | - 0 | - 0 | - 0 | - 0 | - 0 | - 0 | - 0 | - 0 | - 0 | - 0 | - 0 | - 0 | - 0 | - 0 | - 0 | 340 | - 0 | - 0 | - 0 | 931 | - 0 | - 0 | - 0 | - 0 | - 0 | - 0 | - 0 | - 0 | - 0 | 529 | - 0 | - 0 | - 0 | - 0 | - 0 | 340 | 931 | ||||||||||||||||||||||||||||||||||||||
| North American sales meeting | - 0 | - 0 | - 0 | - 0 | - 0 | - 0 | - 0 | - 0 | 1225 | - 0 | - 0 | - 0 | - 0 | - 0 | - 0 | - 0 | 1889 | - 0 | - 0 | - 0 | - 0 | - 0 | - 0 | - 0 | - 0 | - 0 | - 0 | - 0 | - 0 | - 0 | - 0 | - 0 | - 0 | 1889 | |||||||||||||||||||||||||||||||||||||||||
| Property Impairment Loss | - 0 | - 0 | - 0 | - 0 | - 0 | - 0 | - 0 | - 0 | - 0 | - 0 | - 0 | - 0 | 2914 | 132 | - 0 | - 0 | - 0 | - 0 | - 0 | - 0 | - 0 | - 0 | - 0 | - 0 | - 0 | - 0 | - 0 | - 0 | - 0 | - 0 | - 0 | - 0 | 3046 | - 0 | |||||||||||||||||||||||||||||||||||||||||
| Building Impairment | - 0 | - 0 | - 0 | - 0 | - 0 | - 0 | - 0 | 231 | - 0 | - 0 | - 0 | ||||||||||||||||||||||||||||||||||||||||||||||||||||||||||||||||
| Reg G Adjusted EBITDA | $ 7676 | $ 5470 | $ (232) | $ (3170) | $ (1368) | $ (4871) | $ 1699 | $ 2585 | $ 1352 | $ 2121 | $ 4196 | $ 2351 | $ 2349 | $ 4234 | $ 4342 | $ 2733 | $ 3068 | $ 6390 | $ 5579 | $ 2162 | $ 2458 | $ 3111 | $ 4277 | $ 2219 | $ 2852 | $ 4519 | $ 5443 | $ 3026 | $ 5121 | $ 7749 | $ 7325 | $ 5053 | $ 7457 | $ 9402 | $ 10318 | $ 13658 | $ 17199 | ||||||||||||||||||||||||||||||||||||||
| Adjusted EBITDA of Sales | 97 | 68 | -03 | -46 | -19 | -70 | 25 | 40 | 20 | 31 | 61 | 36 | 34 | 59 | 59 | 39 | 44 | 90 | 79 | 33 | 35 | 45 | 61 | 33 | 38 | 60 | 72 | 38 | 61 | 86 | 83 | 59 | 82 | 98 | 109 | 48 | 62 | ||||||||||||||||||||||||||||||||||||||
| Annual Adjusted EBITDA of Sales | 44 | 58 | |||||||||||||||||||||||||||||||||||||||||||||||||||||||||||||||||||||||||
| Adjusted Operating Income | (3083) | (6437) | (264) | 744 | (709) | (123) | 1829 | (7) | 54 | 2071 | 2182 | 600 | 972 | 4264 | 3460 | (40) | 271 | 885 | 2304 | 539 | 1147 | 2875 | 3852 | 1196 | 3435 | 6070 | 5570 | 3087 | 5979 | 7947 | 8850 | 4907 | 8314 | ||||||||||||||||||||||||||||||||||||||||||
| Consolidated Revenues | |||||||
| 2013 | 269503 | ||||||
| 2014 | 285693 | ||||||
| 2015 | 275834 | ||||||
| 2016 | 276573 | ||||||
| 2017 | 305907 | ||||||
| 2018 | 349637 | ||||||
| TTM 93019 | 368485 | ||||||
| Net Cash(Debt) | |||||||
| 2013 | (15380) | ||||||
| 2014 | 4207 | ||||||
| 2015 | 9840 | ||||||
| 2016 | 9580 | ||||||
| 2017 | (10127) | ||||||
| 2018 | 1060 | ||||||
| 93019 | 6431 | ||||||
| Rep Count | |||||||
| 2013 | 806 | ||||||
| 2014 | 916 | ||||||
| 2015 | 937 | ||||||
| 2016 | 1009 | ||||||
| 2017 | 983 | ||||||
| 2018 | 994 | ||||||
| 93019 | 993 | ||||||
| Adjusted OI | DampA | Adjusted EBITDA | |||||
| 2013 | 990 | 9030 | 10020 | ||||
| 2014 | 4907 | 8751 | 13658 | ||||
| 2015 | 8315 | 8543 | 17199 | ||||
| 2016 | 3388 | 8066 | 12065 | ||||
| 2017 | 15840 | ||||||
| 2018 | 25248 | ||||||
| TTM 93019 | 32230 | ||||||
| Reg G EBITDA By Quarter | |||||||
| Quarter | 2017 | 2018 | 2019 | ||||
| Q1 | 2852 | 5121 | 7457 | ||||
| Q2 | 4519 | 7749 | 9402 | ||||
| Q3 | 5443 | 7325 | 10318 | ||||
| Q4 | 3026 | 5053 |
| Months of Experience | Average Annual Sales | Number of Reps | |||
| lt 12 Mos | ERRORVALUE | ERRORVALUE | |||
| 1 - 2 Yrs | ERRORVALUE | ERRORVALUE | |||
| 3 - 5 Yrs | ERRORVALUE | ERRORVALUE | |||
| 5 - 10 Yrs | ERRORVALUE | ERRORVALUE | |||
| gt 10 Yrs | ERRORVALUE | ERRORVALUE | |||
| ERRORVALUE | |||||
| Excludes ISR MSS CRS | |||||
| Excludes Freight | |||||
| Product mix | ||||||||
| Verticals | Q3 2019 Sales | |||||||
| Fastening Systems | 240 | 22485606 | ||||||
| Fluid Power | 151 | 14156064 | ||||||
| Specialy Chemicals | 117 | 10917433 | ||||||
| Cutting Tools and Abrasives | 131 | 12296596 | ||||||
| Electrical | 104 | 9724849 | ||||||
| Aftermarket Automotive Supplies | 76 | 7154688 | ||||||
| Safety | 47 | 4445846 | ||||||
| Welding and Metal Repair | 13 | 1218030 | ||||||
| Other | 120 | 11237322 | ||||||
| Total | 100 | 93636434 | ||||||
| Verticals | YTD 2019 Sales | |||||||
| Fastening Systems | 24 | 66611555 | ||||||
| Fluid Power | 15 | 42224416 | ||||||
| Specialy Chemicals | 12 | 32166853 | ||||||
| Cutting Tools and Abrasives | 13 | 36587482 | ||||||
| Electrical | 11 | 30150144 | ||||||
| Aftermarket Automotive Supplies | 8 | 21960561 | ||||||
| Safety | 5 | 13072228 | ||||||
| Welding and Metal Repair | 2 | 4306548 | ||||||
| Other | 10 | 31279779 | ||||||
| Total | 100 | 278359566 |
| Lawson core customer mix | ||||||||
| Account Tyoe | Q3 | |||||||
| Regional Accounts | 43045893 | 45 | ||||||
| Strategic | 14086813 | 15 | ||||||
| Kent Automotive | 14300065 | 15 | ||||||
| Bolt Supply | 11318703 | 12 | ||||||
| Government | 10291732 | 11 | ||||||
| Screw Products | 0 | 0 | ||||||
| Other (1) | 1735236 | 2 | ||||||
| Total | 94778443 | 100 | ||||||
| Account Tyoe | YTD September | |||||||
| Regional Accounts | 131389537 | 47 | ||||||
| Strategic | 40364305 | 14 | ||||||
| Kent Automotive | 43371411 | 15 | ||||||
| Bolt Supply | 31324209 | 11 | ||||||
| Government | 29794959 | 11 | ||||||
| Screw Products | 0 | 0 | ||||||
| Other | 5974302 | 2 | ||||||
| Total | 282218723 | 100 | ||||||
| Total Reported |
| September 30 | December 31 | ||||||||||
| 2019 | 2018 | ||||||||||
| ASSETS | (Unaudited) | ||||||||||
| Current assets | |||||||||||
| Cash and cash equivalents | $ | 8626 | $ | 11883 | |||||||
| Restricted cash | 800 | 800 | |||||||||
| Accounts receivable less allowance for doubtful accounts of $614 and $549 respectively | 45162 | 37682 | |||||||||
| Inventories net | 54894 | 52887 | |||||||||
| Miscellaneous receivables and prepaid expenses | 4270 | 3653 | |||||||||
| Total current assets | 113752 | 106905 | |||||||||
| Property plant and equipment net | 16932 | 23548 | |||||||||
| Deferred income taxes | 17372 | 20592 | |||||||||
| Goodwill | 20582 | 20079 | |||||||||
| Cash value of life insurance | 14440 | 12599 | |||||||||
| Intangible assets net | 12468 | 13112 | |||||||||
| Lease assets | 11917 | mdash | |||||||||
| Other assets | 275 | 307 | |||||||||
| Total assets | $ | 207738 | $ | 197142 | |||||||
| LIABILITIES AND STOCKHOLDERSrsquo EQUITY | |||||||||||
| Current liabilities | |||||||||||
| Revolving lines of credit | $ | 2195 | $ | 10823 | |||||||
| Accounts payable | 16325 | 15207 | |||||||||
| Lease obligation | 3781 | mdash | |||||||||
| Accrued expenses and other liabilities | 37873 | 40179 | |||||||||
| Total current liabilities | 60174 | 66209 | |||||||||
| Security bonus plan | 11969 | 12413 | |||||||||
| Lease obligation | 10360 | 5213 | |||||||||
| Deferred compensation | 5915 | 5304 | |||||||||
| Deferred tax liability | 2879 | 2761 | |||||||||
| Other liabilities | 3460 | 6069 | |||||||||
| Total liabilities | 94757 | 97969 | |||||||||
| Stockholdersrsquo equity | |||||||||||
| Preferred stock $1 par value | |||||||||||
| Authorized - 500000 shares Issued and outstanding mdash None | mdash | mdash | |||||||||
| Common stock $1 par value | |||||||||||
| Authorized - 35000000 shares | 9043 | 9006 | |||||||||
| Issued - 9042597 and 9005716 shares respectively | |||||||||||
| Outstanding - 8956981 and 8955930 shares respectively | |||||||||||
| Capital in excess of par value | 17626 | 15623 | |||||||||
| Retained earnings | 89502 | 77338 | |||||||||
| Treasury stock ndash 85616 and 49786 shares respectively | (2595) | (1234) | |||||||||
| Accumulated other comprehensive loss | (595) | (1560) | |||||||||
| Total stockholdersrsquo equity | 112981 | 99173 | |||||||||
| Total liabilities and stockholdersrsquo equity | $ | 207738 | $ | 197142 | |||||||
| Three Months Ended | |||||||||||||||||||||||||||||
| Jun 30 2019 | Mar 31 2019 | Dec 31 2018 | Sep 30 2018 | Jun 30 2018 | |||||||||||||||||||||||||
| Average daily net sales | $ | 1502 | $ | 1450 | $ | 1414 | $ | 1405 | $ | 1412 | |||||||||||||||||||
| Year over year increase | 63 | 82 | 70 | 170 | 205 | ||||||||||||||||||||||||
| Sequential quarter increase (decrease) | 36 | 25 | 06 | (05) | 53 | ||||||||||||||||||||||||
| Net Sales | $ | 96097 | $ | 91343 | $ | 86266 | $ | 88530 | $ | 90382 | |||||||||||||||||||
| Gross profit (1) | 51043 | 48923 | 46083 | 48108 | 49131 | ||||||||||||||||||||||||
| Gross profit percentage (1) | 531 | 536 | 534 | 543 | 544 | ||||||||||||||||||||||||
| Selling general amp administrative expenses | $ | 49420 | $ | 43379 | $ | 41998 | $ | 50374 | $ | 43577 | |||||||||||||||||||
| Operating income (loss) | $ | 1623 | $ | 5544 | $ | 4085 | $ | (2266) | $ | 5554 | |||||||||||||||||||
| Full Year | |||||||||||||||||||||||||||||||||||||||||||||||||||||||||||||||||||||||||||
| ($ in thousands) | Q1 2011 | Q2 2011 | Q3 2011 | Q4 2011 | Q1 2012 | Q2 2012 | Q3 2012 | Q4 2012 | Q1 2013 | Q2 2013 | Q3 2013 | Q4 2013 | Q1 2014 | Q2 2014 | Q3 2014 | Q4 2014 | Q1 2015 | Q2 2015 | Q3 2015 | Q4 2015 | Q1 2016 | Q2 2016 | Q3 2016 | Q4 2016 | Q1 2017 | Q2 2017 | Q3 2017 | Q4 2017 | Q1 2018 | Q2 2018 | Q3 2018 | Q4 2018 | Q1 2019 | Q2 2019 | Q3 2019 | 2014 | 2015 | ||||||||||||||||||||||||||||||||||||||
| Net Sales | $ 79255 | $ 80625 | $ 71490 | $ 69029 | $ 71364 | $ 69830 | $ 67863 | $ 64505 | $ 67213 | $ 68317 | $ 68235 | $ 65738 | $ 69204 | $ 72080 | $ 74128 | $ 70281 | $ 69904 | $ 70726 | $ 70243 | $ 64961 | $ 69711 | $ 69348 | $ 70199 | $ 67315 | $ 74617 | $ 75006 | $ 75651 | $ 80633 | $ 84459 | $ 90382 | $ 88530 | $ 86266 | $ 91343 | $ 96097 | $ 94779 | $ 285693 | $ 275834 | ||||||||||||||||||||||||||||||||||||||
| Operating Income (Loss) | 3542 | 1397 | (3480) | (6995) | (3466) | (42084) | (1740) | 2057 | (3530) | (201) | 870 | (3002) | (4713) | 1241 | 678 | (2169) | (947) | 3243 | 2810 | (2985) | 1169 | 29 | 2389 | (5044) | 712 | 7891 | 1090 | 243 | 1837 | 5554 | (2266) | 4085 | 5544 | 1623 | 6446 | (4963) | 2121 | ||||||||||||||||||||||||||||||||||||||
| Depreciation amp Amortization | 1260 | 1315 | 1160 | 1675 | 1715 | 1566 | 1963 | 1841 | 2061 | 2244 | 2367 | 2358 | 2295 | 2163 | 2160 | 2133 | 2096 | 2126 | 2119 | 2202 | 2187 | 2226 | 1973 | 1680 | 1705 | 1644 | 1591 | 1830 | 1686 | 1679 | 1755 | 1735 | 1478 | 1455 | 1468 | 8751 | 8543 | ||||||||||||||||||||||||||||||||||||||
| EBITDA | 4802 | 2712 | (2320) | (5320) | (1751) | (40518) | 223 | 3898 | (1469) | 2043 | 3237 | (644) | (2418) | 3404 | 2838 | (36) | 1149 | 5369 | 4929 | (783) | 3356 | 2255 | 4362 | (3364) | 2417 | 9535 | 2681 | 2073 | 3523 | 7233 | (511) | 5820 | 7022 | 3078 | 7914 | 3788 | 10664 | ||||||||||||||||||||||||||||||||||||||
| Excluded Costs | |||||||||||||||||||||||||||||||||||||||||||||||||||||||||||||||||||||||||||
| Severance | 745 | 465 | 282 | 122 | 185 | 6585 | 1410 | (159) | - 0 | 2 | 962 | (127) | 728 | 290 | (328) | (59) | 571 | 50 | 372 | 280 | 204 | 143 | 367 | 1662 | 465 | (9) | 139 | 144 | 628 | 64 | 31 | 126 | 27 | 1485 | 30 | 631 | 1273 | ||||||||||||||||||||||||||||||||||||||
| Stock Based Compensation (Benefit) | 227 | (95) | (538) | 467 | 198 | (1015) | 77 | 434 | 1596 | 76 | 33 | 562 | 1125 | 408 | 2423 | 2443 | (541) | 971 | (30) | 1693 | (1217) | 515 | (630) | 3801 | (30) | 415 | 2337 | 384 | 970 | 87 | 7637 | (1186) | 408 | 4839 | 2374 | 6399 | 2093 | ||||||||||||||||||||||||||||||||||||||
| Acquisition Related Costs | - 0 | - 0 | - 0 | - 0 | - 0 | - 0 | 310 | 32 | 115 | 198 | 178 | 120 | - 0 | - 0 | 286 | 425 | - 0 | - 0 | 168 | 62 | - 0 | - 0 | - 0 | ||||||||||||||||||||||||||||||||||||||||||||||||||||
| ERP Implementation Costs | 1902 | 2388 | 2344 | 339 | - 0 | - 0 | - 0 | - 0 | - 0 | - 0 | - 0 | - 0 | - 0 | - 0 | - 0 | - 0 | - 0 | - 0 | - 0 | - 0 | - 0 | - 0 | - 0 | - 0 | - 0 | - 0 | - 0 | - 0 | - 0 | - 0 | - 0 | - 0 | - 0 | ||||||||||||||||||||||||||||||||||||||||||
| Loss(Gain) on Disposal of Property | - 0 | - 0 | - 0 | 22 | - 0 | (2122) | (11) | (1588) | - 0 | - 0 | (36) | 32 | - 0 | - 0 | 97 | 45 | - 0 | - 0 | (2) | 9 | - 0 | - 0 | - 0 | - 0 | - 0 | (5422) | - 0 | - 0 | - 0 | - 0 | - 0 | - 0 | - 0 | - 0 | - 0 | 142 | 7 | ||||||||||||||||||||||||||||||||||||||
| Legal Settlement | - 0 | - 0 | - 0 | - 0 | - 0 | - 0 | - 0 | - 0 | - 0 | - 0 | - 0 | - 0 | - 0 | - 0 | (688) | - 0 | - 0 | - 0 | - 0 | - 0 | - 0 | - 0 | - 0 | - 0 | - 0 | - 0 | - 0 | - 0 | - 0 | - 0 | - 0 | - 0 | (688) | - 0 | |||||||||||||||||||||||||||||||||||||||||
| Employment Tax Matter | - 0 | - 0 | - 0 | 1200 | - 0 | - 0 | - 0 | - 0 | - 0 | - 0 | - 0 | (400) | - 0 | - 0 | - 0 | - 0 | - 0 | - 0 | - 0 | - 0 | - 0 | - 0 | - 0 | - 0 | - 0 | - 0 | - 0 | - 0 | - 0 | - 0 | - 0 | - 0 | - 0 | - 0 | |||||||||||||||||||||||||||||||||||||||||
| Lease termination gain | - 0 | - 0 | - 0 | - 0 | - 0 | - 0 | - 0 | - 0 | - 0 | - 0 | - 0 | 2928 | - 0 | - 0 | - 0 | - 0 | - 0 | - 0 | - 0 | - 0 | - 0 | - 0 | - 0 | - 0 | - 0 | - 0 | - 0 | - 0 | - 0 | (164) | - 0 | - 0 | - 0 | - 0 | - 0 | - 0 | - 0 | ||||||||||||||||||||||||||||||||||||||
| Goodwill Impairment | - 0 | - 0 | - 0 | - 0 | - 0 | 28306 | - 0 | - 0 | - 0 | - 0 | - 0 | - 0 | - 0 | - 0 | - 0 | - 0 | - 0 | - 0 | - 0 | - 0 | - 0 | - 0 | - 0 | - 0 | - 0 | - 0 | - 0 | - 0 | - 0 | - 0 | - 0 | - 0 | - 0 | - 0 | |||||||||||||||||||||||||||||||||||||||||
| Inventory Rationalization | - 0 | - 0 | - 0 | - 0 | - 0 | 3893 | - 0 | - 0 | - 0 | - 0 | - 0 | - 0 | - 0 | - 0 | - 0 | - 0 | - 0 | - 0 | - 0 | - 0 | - 0 | - 0 | - 0 | - 0 | - 0 | - 0 | - 0 | - 0 | - 0 | - 0 | - 0 | - 0 | - 0 | - 0 | |||||||||||||||||||||||||||||||||||||||||
| Discontinued operation accrual | - 0 | - 0 | - 0 | - 0 | - 0 | - 0 | - 0 | - 0 | - 0 | - 0 | - 0 | - 0 | - 0 | - 0 | - 0 | 340 | - 0 | - 0 | - 0 | 931 | - 0 | - 0 | - 0 | - 0 | - 0 | - 0 | - 0 | - 0 | - 0 | 529 | - 0 | - 0 | - 0 | - 0 | - 0 | 340 | 931 | ||||||||||||||||||||||||||||||||||||||
| North American sales meeting | - 0 | - 0 | - 0 | - 0 | - 0 | - 0 | - 0 | - 0 | 1225 | - 0 | - 0 | - 0 | - 0 | - 0 | - 0 | - 0 | 1889 | - 0 | - 0 | - 0 | - 0 | - 0 | - 0 | - 0 | - 0 | - 0 | - 0 | - 0 | - 0 | - 0 | - 0 | - 0 | - 0 | 1889 | |||||||||||||||||||||||||||||||||||||||||
| Property Impairment Loss | - 0 | - 0 | - 0 | - 0 | - 0 | - 0 | - 0 | - 0 | - 0 | - 0 | - 0 | - 0 | 2914 | 132 | - 0 | - 0 | - 0 | - 0 | - 0 | - 0 | - 0 | - 0 | - 0 | - 0 | - 0 | - 0 | - 0 | - 0 | - 0 | - 0 | - 0 | - 0 | 3046 | - 0 | |||||||||||||||||||||||||||||||||||||||||
| Building Impairment | - 0 | - 0 | - 0 | - 0 | - 0 | - 0 | - 0 | 231 | - 0 | - 0 | - 0 | ||||||||||||||||||||||||||||||||||||||||||||||||||||||||||||||||
| Reg G Adjusted EBITDA | $ 7676 | $ 5470 | $ (232) | $ (3170) | $ (1368) | $ (4871) | $ 1699 | $ 2585 | $ 1352 | $ 2121 | $ 4196 | $ 2351 | $ 2349 | $ 4234 | $ 4342 | $ 2733 | $ 3068 | $ 6390 | $ 5579 | $ 2162 | $ 2458 | $ 3111 | $ 4277 | $ 2219 | $ 2852 | $ 4519 | $ 5443 | $ 3026 | $ 5121 | $ 7749 | $ 7325 | $ 5053 | $ 7457 | $ 9402 | $ 10318 | $ 13658 | $ 17199 | ||||||||||||||||||||||||||||||||||||||
| Adjusted EBITDA of Sales | 97 | 68 | -03 | -46 | -19 | -70 | 25 | 40 | 20 | 31 | 61 | 36 | 34 | 59 | 59 | 39 | 44 | 90 | 79 | 33 | 35 | 45 | 61 | 33 | 38 | 60 | 72 | 38 | 61 | 86 | 83 | 59 | 82 | 98 | 109 | 48 | 62 | ||||||||||||||||||||||||||||||||||||||
| Annual Adjusted EBITDA of Sales | 44 | 58 | |||||||||||||||||||||||||||||||||||||||||||||||||||||||||||||||||||||||||
| Adjusted Operating Income | (3083) | (6437) | (264) | 744 | (709) | (123) | 1829 | (7) | 54 | 2071 | 2182 | 600 | 972 | 4264 | 3460 | (40) | 271 | 885 | 2304 | 539 | 1147 | 2875 | 3852 | 1196 | 3435 | 6070 | 5570 | 3087 | 5979 | 7947 | 8850 | 4907 | 8314 | ||||||||||||||||||||||||||||||||||||||||||
| Consolidated Revenues | |||||||
| 2013 | 269503 | ||||||
| 2014 | 285693 | ||||||
| 2015 | 275834 | ||||||
| 2016 | 276573 | ||||||
| 2017 | 305907 | ||||||
| 2018 | 349637 | ||||||
| TTM 63019 | 362236 | ||||||
| Net Cash(Debt) | |||||||
| 2013 | (15380) | ||||||
| 2014 | 4207 | ||||||
| 2015 | 9840 | ||||||
| 2016 | 9580 | ||||||
| 2017 | (10127) | ||||||
| 2018 | 1060 | ||||||
| 63019 | (1908) | ||||||
| Rep Count | |||||||
| 2013 | 806 | ||||||
| 2014 | 916 | ||||||
| 2015 | 937 | ||||||
| 2016 | 1009 | ||||||
| 2017 | 983 | ||||||
| 2018 | 994 | ||||||
| 63019 | 982 | ||||||
| Adjusted OI | DampA | Adjusted EBITDA | |||||
| 2013 | 990 | 9030 | 10020 | ||||
| 2014 | 4907 | 8751 | 13658 | ||||
| 2015 | 8315 | 8543 | 17199 | ||||
| 2016 | 3388 | 8066 | 12065 | ||||
| 2017 | 15840 | ||||||
| 2018 | 25248 | ||||||
| TTM 63019 | 29237 | ||||||
| Reg G EBITDA By Quarter | |||||||
| Quarter | 2017 | 2018 | 2019 | ||||
| Q1 | 2852 | 5121 | 7457 | ||||
| Q2 | 4519 | 7749 | 9402 | ||||
| Q3 | 5443 | 7325 | |||||
| Q4 | 3026 | 5053 |
| Months of Experience | Average Annual Sales | Number of Reps | |||
| lt 12 Mos | ERRORVALUE | ERRORVALUE | |||
| 1 - 2 Yrs | ERRORVALUE | ERRORVALUE | |||
| 3 - 5 Yrs | ERRORVALUE | ERRORVALUE | |||
| 5 - 10 Yrs | ERRORVALUE | ERRORVALUE | |||
| gt 10 Yrs | ERRORVALUE | ERRORVALUE | |||
| ERRORVALUE | |||||
| Excludes ISR MSS CRS | |||||
| Excludes Freight | |||||
| Product mix | ||||||||
| Verticals | Q2 2019 Sales | |||||||
| Fastening Systems | 243 | 23008646 | ||||||
| Fluid Power | 152 | 14395529 | ||||||
| Specialy Chemicals | 117 | 11074332 | ||||||
| Cutting Tools and Abrasives | 130 | 12319702 | ||||||
| Electrical | 107 | 10102828 | ||||||
| Aftermarket Automotive Supplies | 77 | 7255974 | ||||||
| Safety | 47 | 4458217 | ||||||
| Welding and Metal Repair | 16 | 1539172 | ||||||
| Other | 112 | 10633378 | ||||||
| Total | 100 | 94787779 | ||||||
| Verticals | YTD 2019 Sales | |||||||
| Fastening Systems | 24 | 44125949 | ||||||
| Fluid Power | 15 | 28068352 | ||||||
| Specialy Chemicals | 12 | 21249420 | ||||||
| Cutting Tools and Abrasives | 13 | 24290887 | ||||||
| Electrical | 11 | 20425294 | ||||||
| Aftermarket Automotive Supplies | 8 | 14805874 | ||||||
| Safety | 5 | 8626381 | ||||||
| Welding and Metal Repair | 2 | 3088518 | ||||||
| Other | 10 | 20042457 | ||||||
| Total | 100 | 184723132 |
| Lawson core customer mix | ||||||||
| Account Tyoe | Q2 | |||||||
| Regional Accounts | 44933707 | 47 | ||||||
| Strategic | 13542786 | 14 | ||||||
| Kent Automotive | 14370813 | 15 | ||||||
| Bolt Supply | 11129675 | 12 | ||||||
| Government | 10087561 | 10 | ||||||
| Screw Products | 0 | 0 | ||||||
| Other (1) | 1428268 | 1 | ||||||
| Total | 96097363 | 100 | ||||||
| Account Tyoe | YTD June | |||||||
| Regional Accounts | 88400675 | 47 | ||||||
| Strategic | 26218365 | 14 | ||||||
| Kent Automotive | 29071347 | 16 | ||||||
| Bolt Supply | 20005505 | 11 | ||||||
| Government | 19505323 | 10 | ||||||
| Screw Products | 0 | 0 | ||||||
| Other | 4239066 | 2 | ||||||
| Total | 187440280 | 100 | ||||||
| Total Reported |
| August 2011 | OslashImplemented SAP | ||
| October 2011 | OslashCommenced construction of new McCook Ill distribution center | ||
| May 2012 | OslashRelocated corporate headquarters | ||
| June 2012 | OslashRestructured senior team Announced $20M cost savings plan | ||
| August 2012 | OslashTransitioned packaging facility to McCook Ill distribution center | ||
| OslashEntered into new five-year $40M credit facility | |||
| October 2012 | OslashAnnounced new CEO and President Michael G DeCata | ||
| OslashConsolidated Vernon Hills distribution center into McCook Ill | |||
| November 2012 | OslashRolled out new website to existing web customers | ||
| December 2012 | OslashCompleted transition of US independent agents to employees | ||
| April 2013 | OslashRoll-out of new website to new web customers | ||
| AprilMay 2013 | OslashMcCook DC begins to ship customer orders | ||
| November 2013 | OslashEntered into sub-lease of headquarters space to generate $29M of future cash savings | ||
| December 2013 | OslashEnded year with over 800 sales reps ndash First increase in 8 years | ||
| February 2014 | OslashClosed on Automatic Screw Machine Products sale for net proceeds of $121M | ||
| June 2014 | OslashEntered into sale-leaseback of Reno distribution facility for net proceeds of $83M | ||
| December 2014 | OslashEnded year with over 900 sales reps | ||
| February 2015 | OslashHeld North American sales meeting | ||
| September 2015 | OslashCompleted West Coast Fasteners acquisition | ||
| March 2016 | OslashCompleted Perfect Products of Michigan acquisition | ||
| May 2016 | OslashCompleted F B Feeney acquisition | ||
| June 2016 | OslashExpanded sales team to over 1000 sales reps | ||
| September 2016 | OslashExtended credit facitlity to August 2020 | ||
| November 2016 | OslashCompleted Mattic Industries acquisition | ||
| March 2017 | OslashConsolidated Fairfield NJ distribution operations into McCook Ill and Suwanee GA | ||
| May 2017 | OslashSold Fairfield NJ distribution center for a gain of $54M | ||
| October 2017 | OslashCompleted Bolt Supply House acquisition | ||
| April 2018 | OslashOpened MRO distribution center in Calgary Canada | ||
| October 2018 | OslashCompleted Screw Products acquisition and added Bolt Supply branch | ||
| June 2019 | OslashAchieved Q2 98 adjusted EBITDA net of ASC 842 impact of 03 | ||
| September 2019 | OslashAchieved Q3 109 adjusted EBITDA hired VP MampA | ||
| October 2019 | OslashEntered into new five-year $100M credit facility with additional $50 million accordion feature |
| ($ in thousands) | Q3 2013 | Q4 2013 | Q1 2014 | Q2 2014 | Q3 2014 | Q4 2014 | Q1 2015 | Q2 2015 | Q3 2015 | Q4 2015 | Q1 2016 | Q2 2016 | Q3 2016 | Q4 2016 | Q1 2017 | Q2 2017 | Q3 2017 | Q4 2017 | ||||||||||||||||||||||||||||||||||||||||||||||
| SGampA | 40350 | 42856 | 45991 | 42562 | 43855 | 44764 | 43830 | 40565 | 40532 | 41145 | 41290 | 42497 | 40184 | 45548 | 44167 | 42672 | 44915 | 46750 | $ 173014 | |||||||||||||||||||||||||||||||||||||||||||||
| $ - | ||||||||||||||||||||||||||||||||||||||||||||||||||||||||||||||||
| Excluded Costs | $ - | 40196 | ||||||||||||||||||||||||||||||||||||||||||||||||||||||||||||||
| Severance | (962) | 127 | (728) | (290) | 328 | 59 | (571) | (50) | (372) | (280) | (204) | (143) | (367) | (1662) | (465) | 9 | (139) | (144) | $ (234) | 127 | ||||||||||||||||||||||||||||||||||||||||||||
| Stock Based Compensation (Benefit) | (33) | (562) | (1125) | (408) | (2423) | (2443) | 541 | (971) | 30 | (1693) | 1217 | (515) | 630 | (3801) | 30 | (415) | (2337) | (384) | $ (5296) | -32 | ||||||||||||||||||||||||||||||||||||||||||||
| Loss(Gain) on Disposal of Property | 36 | (32) | - 0 | - 0 | (97) | (45) | - 0 | - 0 | 2 | (9) | - 0 | - 0 | - 0 | - 0 | - 0 | - 0 | - 0 | - 0 | $ (142) | |||||||||||||||||||||||||||||||||||||||||||||
| Legal Settlement | - 0 | - 0 | - 0 | - 0 | 688 | - 0 | - 0 | - 0 | - 0 | - 0 | - 0 | - 0 | - 0 | - 0 | - 0 | - 0 | - 0 | - 0 | $ 688 | -562 | ||||||||||||||||||||||||||||||||||||||||||||
| Employment Tax Matter | - 0 | 400 | - 0 | - 0 | - 0 | - 0 | - 0 | - 0 | - 0 | - 0 | - 0 | - 0 | - 0 | - 0 | - 0 | - 0 | - 0 | - 0 | $ - | 39729 | ||||||||||||||||||||||||||||||||||||||||||||
| Loss on Sub-Lease | - 0 | (2928) | - 0 | - 0 | - 0 | - 0 | - 0 | - 0 | - 0 | - 0 | - 0 | - 0 | - 0 | - 0 | - 0 | - 0 | - 0 | - 0 | $ - | |||||||||||||||||||||||||||||||||||||||||||||
| National sales meeting | - 0 | - 0 | - 0 | - 0 | - 0 | - 0 | (1889) | - 0 | - 0 | - 0 | - 0 | - 0 | - 0 | - 0 | - 0 | - 0 | - 0 | - 0 | $ (1889) | |||||||||||||||||||||||||||||||||||||||||||||
| Remediation expense | - 0 | - 0 | - 0 | - 0 | - 0 | (340) | - 0 | - 0 | - 0 | - 0 | - 0 | - 0 | - 0 | - 0 | - 0 | - 0 | - 0 | - 0 | $ (340) | |||||||||||||||||||||||||||||||||||||||||||||
| Property Impairment Loss | - 0 | - 0 | (2914) | (132) | - 0 | - 0 | - 0 | - 0 | - 0 | - 0 | - 0 | - 0 | - 0 | - 0 | - 0 | - 0 | - 0 | - 0 | $ - | |||||||||||||||||||||||||||||||||||||||||||||
| Adjusted SGampA | $ 39391 | $ 39861 | $ 41224 | $ 41732 | $ 42351 | $ 41995 | $ 41911 | $ 39544 | $ 40192 | $ 39163 | $ 42303 | $ 41839 | $ 40447 | $ 40085 | $ 43732 | $ 42266 | $ 42439 | $ 46222 | $ 165801 | |||||||||||||||||||||||||||||||||||||||||||||
| Annual Adjusted EBITDA of Sales | ERRORREF | ERRORREF | ||||||||||||||||||||||||||||||||||||||||||||||||||||||||||||||
| Q1 2013 | Q2 2013 | Q3 2013 | Q4 2013 | Q1 2014 | Q2 2014 | Q3 2014 | Q4 2014 | Q1 2015 | |||||||||||
| Selling Days | 63 | 64 | 64 | 61 | 63 | 64 | 64 | 61 | 63 | ||||||||||
| Net Sales | 67213 | 68317 | 68235 | 65738 | 69204 | 72080 | 74128 | 70281 | 69904 | ||||||||||
| Average Daily Sales | 1067 | 1067 | 1066 | 1078 | 1098 | 1126 | 1158 | 1152 | 1110 | ||||||||||
| Average Sales Rep Count | 762 | 764 | 774 | 794 | 819 | 854 | 882 | 908 | 911 | ||||||||||
| Sales per Sales Rep per Day | 1400 | 1397 | 1377 | 1358 | 1341 | 1319 | 1313 | 1269 | 1218 | ||||||||||
| Full Year | ||||||||||||||||||||||||||||||||||||||||||||||||||||||||||||||||||||
| ($ in thousands) | Q1 2011 | Q2 2011 | Q3 2011 | Q4 2011 | Q1 2012 | Q2 2012 | Q3 2012 | Q4 2012 | Q1 2013 | Q2 2013 | Q3 2013 | Q4 2013 | Q1 2014 | Q2 2014 | Q3 2014 | Q4 2014 | Q1 2015 | Q2 2015 | Q3 2015 | Q4 2015 | Q1 2016 | Q2 2016 | Q3 2016 | Q4 2016 | Q1 2017 | Q2 2017 | Q3 2017 | Q4 2017 | Q1 2018 | Q2 2018 | Q3 2018 | 2014 | 2015 | |||||||||||||||||||||||||||||||||||
| Net Sales | $ 79255 | $ 80625 | $ 71490 | $ 69029 | $ 71364 | $ 69830 | $ 67863 | $ 64505 | $ 67213 | $ 68317 | $ 68235 | $ 65738 | $ 69204 | $ 72080 | $ 74128 | $ 70281 | $ 69904 | $ 70726 | $ 70243 | $ 64961 | $ 69711 | $ 69348 | $ 70199 | $ 67315 | $ 74617 | $ 75006 | $ 75651 | $ 80633 | $ 84459 | $ 90382 | $ 88530 | $ 285693 | $ 275834 | |||||||||||||||||||||||||||||||||||
| Operating Income (Loss) | 3542 | 1397 | (3480) | (6995) | (3466) | (42084) | (1740) | 2057 | (3530) | (201) | 870 | (3002) | (4713) | 1241 | 678 | (2169) | (947) | 3243 | 2810 | (2985) | 1169 | 29 | 2389 | (5044) | 712 | 7891 | 1090 | 243 | 1837 | 5554 | (2266) | (4963) | 2121 | |||||||||||||||||||||||||||||||||||
| Depreciation amp Amortization | 1260 | 1315 | 1160 | 1675 | 1715 | 1566 | 1963 | 1841 | 2061 | 2244 | 2367 | 2358 | 2295 | 2163 | 2160 | 2133 | 2096 | 2126 | 2119 | 2202 | 2187 | 2226 | 1973 | 1680 | 1705 | 1644 | 1591 | 1830 | 1686 | 1679 | 1755 | 8751 | 8543 | |||||||||||||||||||||||||||||||||||
| EBITDA | 4802 | 2712 | (2320) | (5320) | (1751) | (40518) | 223 | 3898 | (1469) | 2043 | 3237 | (644) | (2418) | 3404 | 2838 | (36) | 1149 | 5369 | 4929 | (783) | 3356 | 2255 | 4362 | (3364) | 2417 | 9535 | 2681 | 2073 | 3523 | 7233 | (511) | 3788 | 10664 | |||||||||||||||||||||||||||||||||||
| Excluded Costs | ||||||||||||||||||||||||||||||||||||||||||||||||||||||||||||||||||||
| Severance | 745 | 465 | 282 | 122 | 185 | 6585 | 1410 | (159) | - 0 | 2 | 962 | (127) | 728 | 290 | (328) | (59) | 571 | 50 | 372 | 280 | 204 | 143 | 367 | 1662 | 465 | (9) | 139 | 144 | 628 | 64 | 31 | 631 | 1273 | |||||||||||||||||||||||||||||||||||
| Stock Based Compensation (Benefit) | 227 | (95) | (538) | 467 | 198 | (1015) | 77 | 434 | 1596 | 76 | 33 | 562 | 1125 | 408 | 2423 | 2443 | (541) | 971 | (30) | 1693 | (1217) | 515 | (630) | 3801 | (30) | 415 | 2337 | 384 | 970 | 87 | 7637 | 6399 | 2093 | |||||||||||||||||||||||||||||||||||
| Acquisition Related Costs | - 0 | - 0 | - 0 | - 0 | - 0 | - 0 | 310 | 32 | 115 | 198 | 178 | 120 | - 0 | - 0 | 286 | 425 | - 0 | - 0 | 168 | |||||||||||||||||||||||||||||||||||||||||||||||||
| ERP Implementation Costs | 1902 | 2388 | 2344 | 339 | - 0 | - 0 | - 0 | - 0 | - 0 | - 0 | - 0 | - 0 | - 0 | - 0 | - 0 | - 0 | - 0 | - 0 | - 0 | - 0 | - 0 | - 0 | - 0 | - 0 | - 0 | - 0 | - 0 | - 0 | - 0 | - 0 | - 0 | - 0 | ||||||||||||||||||||||||||||||||||||
| Loss(Gain) on Disposal of Property | - 0 | - 0 | - 0 | 22 | - 0 | (2122) | (11) | (1588) | - 0 | - 0 | (36) | 32 | - 0 | - 0 | 97 | 45 | - 0 | - 0 | (2) | 9 | - 0 | - 0 | - 0 | - 0 | - 0 | (5422) | - 0 | - 0 | - 0 | - 0 | - 0 | 142 | 7 | |||||||||||||||||||||||||||||||||||
| Legal Settlement | - 0 | - 0 | - 0 | - 0 | - 0 | - 0 | - 0 | - 0 | - 0 | - 0 | - 0 | - 0 | - 0 | - 0 | (688) | - 0 | - 0 | - 0 | - 0 | - 0 | - 0 | - 0 | - 0 | - 0 | - 0 | - 0 | - 0 | - 0 | - 0 | - 0 | - 0 | (688) | - 0 | |||||||||||||||||||||||||||||||||||
| Employment Tax Matter | - 0 | - 0 | - 0 | 1200 | - 0 | - 0 | - 0 | - 0 | - 0 | - 0 | - 0 | (400) | - 0 | - 0 | - 0 | - 0 | - 0 | - 0 | - 0 | - 0 | - 0 | - 0 | - 0 | - 0 | - 0 | - 0 | - 0 | - 0 | - 0 | - 0 | - 0 | - 0 | - 0 | |||||||||||||||||||||||||||||||||||
| Lease termination gain | - 0 | - 0 | - 0 | - 0 | - 0 | - 0 | - 0 | - 0 | - 0 | - 0 | - 0 | 2928 | - 0 | - 0 | - 0 | - 0 | - 0 | - 0 | - 0 | - 0 | - 0 | - 0 | - 0 | - 0 | - 0 | - 0 | - 0 | - 0 | - 0 | (164) | - 0 | - 0 | - 0 | |||||||||||||||||||||||||||||||||||
| Goodwill Impairment | - 0 | - 0 | - 0 | - 0 | - 0 | 28306 | - 0 | - 0 | - 0 | - 0 | - 0 | - 0 | - 0 | - 0 | - 0 | - 0 | - 0 | - 0 | - 0 | - 0 | - 0 | - 0 | - 0 | - 0 | - 0 | - 0 | - 0 | - 0 | - 0 | - 0 | - 0 | - 0 | - 0 | |||||||||||||||||||||||||||||||||||
| Inventory Rationalization | - 0 | - 0 | - 0 | - 0 | - 0 | 3893 | - 0 | - 0 | - 0 | - 0 | - 0 | - 0 | - 0 | - 0 | - 0 | - 0 | - 0 | - 0 | - 0 | - 0 | - 0 | - 0 | - 0 | - 0 | - 0 | - 0 | - 0 | - 0 | - 0 | - 0 | - 0 | - 0 | - 0 | |||||||||||||||||||||||||||||||||||
| Discontinued operation accrual | - 0 | - 0 | - 0 | - 0 | - 0 | - 0 | - 0 | - 0 | - 0 | - 0 | - 0 | - 0 | - 0 | - 0 | - 0 | 340 | - 0 | - 0 | - 0 | 931 | - 0 | - 0 | - 0 | - 0 | - 0 | - 0 | - 0 | - 0 | - 0 | 529 | - 0 | 340 | 931 | |||||||||||||||||||||||||||||||||||
| North American sales meeting | - 0 | - 0 | - 0 | - 0 | - 0 | - 0 | - 0 | - 0 | 1225 | - 0 | - 0 | - 0 | - 0 | - 0 | - 0 | - 0 | 1889 | - 0 | - 0 | - 0 | - 0 | - 0 | - 0 | - 0 | - 0 | - 0 | - 0 | - 0 | - 0 | - 0 | - 0 | - 0 | 1889 | |||||||||||||||||||||||||||||||||||
| Property Impairment Loss | - 0 | - 0 | - 0 | - 0 | - 0 | - 0 | - 0 | - 0 | - 0 | - 0 | - 0 | - 0 | 2914 | 132 | - 0 | - 0 | - 0 | - 0 | - 0 | - 0 | - 0 | - 0 | - 0 | - 0 | - 0 | - 0 | - 0 | - 0 | - 0 | - 0 | - 0 | 3046 | - 0 | |||||||||||||||||||||||||||||||||||
| Adjusted EBITDA | $ 7676 | $ 5470 | $ (232) | $ (3170) | $ (1368) | $ (4871) | $ 1699 | $ 2585 | $ 1352 | $ 2121 | $ 4196 | $ 2351 | $ 2349 | $ 4234 | $ 4342 | $ 2733 | $ 3068 | $ 6390 | $ 5579 | $ 2162 | $ 2458 | $ 3111 | $ 4277 | $ 2219 | $ 2852 | $ 4519 | $ 5443 | $ 3026 | $ 5121 | $ 7749 | $ 7325 | $ 13658 | $ 17199 | |||||||||||||||||||||||||||||||||||
| Adjusted EBITDA of Sales | 97 | 68 | -03 | -46 | -19 | -70 | 25 | 40 | 20 | 31 | 61 | 36 | 34 | 59 | 59 | 39 | 44 | 90 | 79 | 33 | 35 | 45 | 61 | 33 | 38 | 60 | 72 | 38 | 61 | 86 | 83 | 48 | 62 | |||||||||||||||||||||||||||||||||||
| Annual Adjusted EBITDA of Sales | 44 | 58 | ||||||||||||||||||||||||||||||||||||||||||||||||||||||||||||||||||
| Adjusted Operating Income | (3083) | (6437) | (264) | 744 | (709) | (123) | 1829 | (7) | 54 | 2071 | 2182 | 600 | 972 | 4264 | 3460 | (40) | 271 | 885 | 2304 | 539 | 1147 | 2875 | 3852 | 1196 | 3435 | 6070 | 5570 | - 0 | 4907 | 8314 | ||||||||||||||||||||||||||||||||||||||
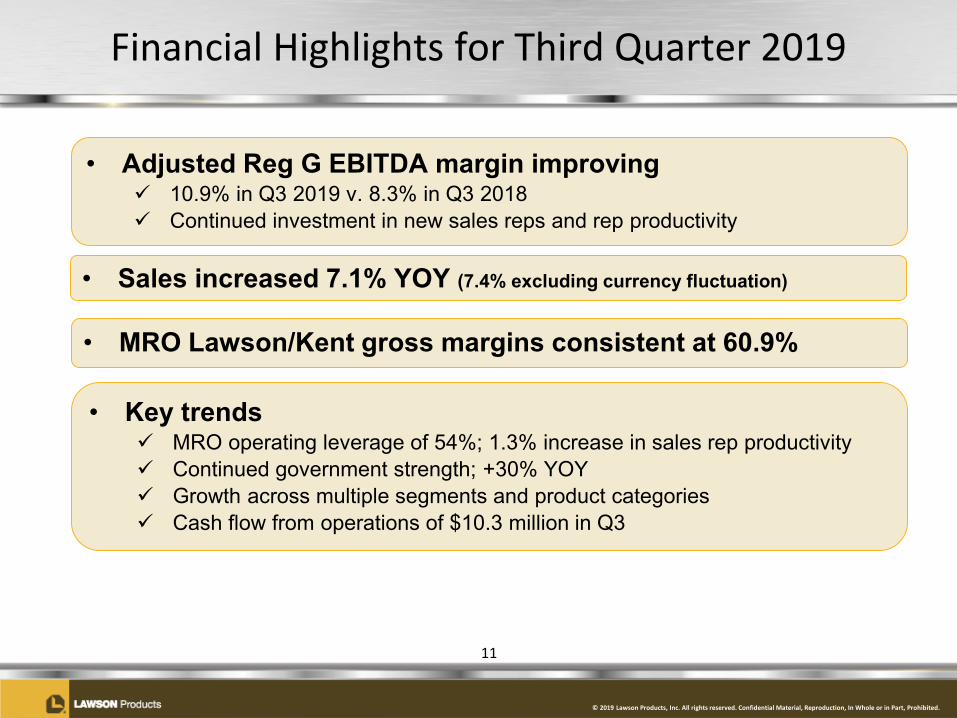
copy 2019 Lawson Products Inc All rights reserved Confidential Material Reproduction In Whole or in Part Prohibited
Longer Sales Rep Tenure Drives Rep Productivity
9
$0
$50000
$100000
$150000
$200000
$250000
$300000
$350000
$400000
$450000
$500000
lt 12 Mos 1 - 2 Yrs 3 - 5 Yrs 5 - 10 Yrs gt 10 Yrs0
50
100
150
200
250
300
350
Aver
age
Annu
al S
ales
Tenure With Lawson (as of 93019)
Num
ber O
f Sal
es R
eps
Number of Reps Average Annual Sales
copy 2019 Lawson Products Inc All rights reserved Confidential Material Reproduction In Whole or in Part Prohibited
Historical Financial Performance
Recent sales growth and earnings expansion providing financial flexibility
10
$200000
$250000
$300000
$350000
$400000
2014 2015 2016 2017 2018 TTM93019
Consolidated Revenues
$0$5000
$10000$15000$20000$25000$30000$35000
2014 2015 2016 2017 2018 TTM93019
Adjusted Reg G EBITDA
-$15000
-$10000
-$5000
$0
$5000
$10000
$15000
2014 2015 2016 2017 2018 9302019
Net Cash(Debt)
$0
$2000
$4000
$6000
$8000
$10000
$12000
Q1 Q2 Q3 Q4
Quarterly Adjusted Reg G EBITDA
2017
20172017
2017
2018
20182018
2018
20192019
2019
copy 2019 Lawson Products Inc All rights reserved Confidential Material Reproduction In Whole or in Part Prohibited
Financial Highlights for Third Quarter 2019
bull Sales increased 71 YOY (74 excluding currency fluctuation)
bull MRO LawsonKent gross margins consistent at 609
bull Adjusted Reg G EBITDA margin improving 109 in Q3 2019 v 83 in Q3 2018 Continued investment in new sales reps and rep productivity
bull Key trends MRO operating leverage of 54 13 increase in sales rep productivity Continued government strength +30 YOY Growth across multiple segments and product categories Cash flow from operations of $103 million in Q3
11
copy 2019 Lawson Products Inc All rights reserved Confidential Material Reproduction In Whole or in Part Prohibited
Pursue Disciplined MampA
Reinvest for Growth
Return Capital
bull Increased our borrowing capacity to $1000 million (additional $500 million accordion) with our new borrowing agreement
bull Capital expenditures expected to be $20 - $30 million in 2019bull Growth initiatives add new reps and increase sales rep productivity
bull Share repurchase to offset award dilution opportunistic purchasesbull $75 million stock repurchase program announced on May 16 2019 $63
million remaining after repurchase of shares worth $12 million in August 2019
bull Bolt-on acquisitions to enhance core growth strategiesbull Closed Screw Products Inc acquisition on 10118
Maintain Strong Balance Sheet
bull $86 million cash on hand and positive cash position of $64 million at the end of Q3
bull Consistent free cash flow generation
Capital Allocation Priorities
12
copy 2019 Lawson Products Inc All rights reserved Confidential Material Reproduction In Whole or in Part Prohibited
Lawson Products Poised for Growth
bull Leverage Current Infrastructure
bull Continued Sales Growth
bull Foundational Investments Completed
bull Operational Excellence
bull Large Fragmented Market
13
copy 2019 Lawson Products Inc All rights reserved Confidential Material Reproduction In Whole or in Part Prohibited
For More Information
Contact
Ronald J KnutsonEVP CFOInvestor Relations(773) 304-5665ronknutsonlawsonproductscom
And see our Website athttpwwwlawsonproductscomcompany-infoinvestor-relationsjsp
14
copy 2019 Lawson Products Inc All rights reserved Confidential Material Reproduction In Whole or in Part Prohibited
Appendices
15
copy 2019 Lawson Products Inc All rights reserved Confidential Material Reproduction In Whole or in Part Prohibited
Significant Activities
16
Appendix P-1
August 2011 Implemented SAPOctober 2011 Commenced construction of new McCook Ill distribution center
May 2012 Relocated corporate headquartersJune 2012 Restructured senior team Announced $20M cost savings plan
Transitioned packaging facility to McCook Ill distribution centerEntered into new five-year $40M credit facilityAnnounced new CEO and President Michael G DeCataConsolidated Vernon Hills distribution center into McCook Ill
November 2012 Rolled out new website to existing web customersDecember 2012 Completed transition of US independent agents to employees
April 2013 Roll-out of new website to new web customersAprilMay 2013 McCook DC begins to ship customer ordersNovember 2013 Entered into sub-lease of headquarters space to generate $29M of future cash savingsDecember 2013 Ended year with over 800 sales reps ndash First increase in 8 yearsFebruary 2014 Closed on Automatic Screw Machine Products sale for net proceeds of $121M
June 2014 Entered into sale-leaseback of Reno distribution facility for net proceeds of $83MDecember 2014 Ended year with over 900 sales repsFebruary 2015 Held North American sales meeting
September 2015 Completed West Coast Fasteners acquisitionMarch 2016 Completed Perfect Products of Michigan acquisitionMay 2016 Completed F B Feeney acquisitionJune 2016 Expanded sales team to over 1000 sales reps
September 2016 Extended credit facitlity to August 2020November 2016 Completed Mattic Industries acquisition
March 2017 Consolidated Fairfield NJ distribution operations into McCook Ill and Suwanee GAMay 2017 Sold Fairfield NJ distribution center for a gain of $54M
October 2017 Completed Bolt Supply House acquisitionApril 2018 Opened MRO distribution center in Calgary Canada
October 2018 Completed Screw Products acquisition and added Bolt Supply branchJune 2019 Achieved Q2 98 adjusted EBITDA net of ASC 842 impact of 03
September 2019 Achieved Q3 109 adjusted EBITDA hired VP MampAOctober 2019 Entered into new five-year $100M credit facility with additional $50 million accordion feature
August 2012
October 2012
Adjusted EBITDA $ in 000s
Adjusted EBITDA Q4 2016Q1 2017Q2 2017Q3 2017Q4 201722192852451954433026
Adjusted EBITDA of Sales
Adjusted EBITDA of SalesQ3 2016Q4 2016Q1 2017Q2 2017Q3 2017Q4 201760926793828971926E-232964421005719377E-23822185292895721E-260248513452257152E-271948817596594883E-237528059231332088E-2
Adjusted Operating Income of Sales
Adjusted Operating IncomeQ3 2016Q4 2016Q1 2017Q2 2017Q3 2017Q4 201723045391147287538521196
Adjusted Op Inc $ in 000s
Adjusted EBITDA Q4 2016Q1 2017Q2 2017Q3 2017Q4 20175391147287538521196
Net Sales by Quarter $ in 000s
Net SalesQ1 2013Q2 2013Q3 2013Q4 2013Q1 2014Q2 2014Q3 2014Q4 2014Q1 2015672136831768235657386920472080741287028169904
Adjusted SGampA $ in 000s
Adjusted SGampA Q4 2015Q1 2016Q2 2016Q3 2016Q4 2016Q1 2017Q2 2017Q3 2017Q4 2017391634230341839404474008543732422664243946222
copy 2019 Lawson Products Inc All rights reserved Confidential Material Reproduction In Whole or in Part Prohibited
Regulation G ndash GAAP ReconciliationAppendix P-2
Non GAAP Reconciliation of Adjusted EBITDA to Sales Percentage
The Company reports its financial results in accordance with US generally accepted accounting principles (GAAP) However the Companys management believesthat certain non-GAAP financial measures may provide users of this financial information additional meaningful comparisons between current results and results inprior operating periods Management believes that these non-GAAP financial measures can provide additional meaningful reflection of underlying trends of thebusiness because they provide a comparison of historical information that excludes certain non-operational non-recurring or intermittently recurring items thatimpact the overall comparability See the table below for supplemental financial data and corresponding reconciliations to GAAP financial measures for quarterlyadjusted EBITDA as a percentage of net sales Non-GAAP financial measures should be viewed in addition to and not as an alternative for the Companys reportedresults prepared in accordance with GAAP
17
($ in thousands) Q1 2017 Q2 2017 Q3 2017 Q4 2017 Q1 2018 Q2 2018 Q3 2018 Q4 2018 Q1 2019 Q2 2019 Q3 2019
Net Sales 74617$ 75006$ 75651$ 80633$ 84459$ 90382$ 88530$ 86266$ 91343$ 96097$ 94779$
Operating Income (Loss) 712 7891 1090 243 1837 5554 (2266) 4085 5544 1623 6446 Depreciation amp Amortization 1705 1644 1591 1830 1686 1679 1755 1735 1478 1455 1468 EBITDA 2417 9535 2681 2073 3523 7233 (511) 5820 7022 3078 7914
Excluded CostsSeverance 465 (9) 139 144 628 64 31 126 27 1485 30 Stock Based Compensation (Benefit) (30) 415 2337 384 970 87 7637 (1186) 408 4839 2374 Acquisition Related Costs - - 286 425 - - 168 62 - - - Loss(Gain) on Disposal of Property - (5422) - - - - - - - - - Lease termination gain - - - - - (164) - - - - - Discontinued operation accrual - - - - - 529 - - - - - Building Impairment - - - - - - - 231 - - - Reg G Adjusted EBITDA 2852$ 4519$ 5443$ 3026$ 5121$ 7749$ 7325$ 5053$ 7457$ 9402$ 10318$
Adjusted EBITDA of Sales 38 60 72 38 61 86 83 59 82 98 109
Customer Mix
Regional Accounts48
Kent Automotive16
Regional AccountsStrategicKent AutomotiveBolt SupplyGovernment Screw ProductsOther047014000000000000001016011010002
ampDampF ampA
Product Mix
Fastening Systems23
Specialty Chemicals12
Fastening SystemsFluid PowerSpecialy ChemicalsCutting Tools and AbrasivesElectricalAftermarket Automotive SuppliesSafetyWelding and Metal RepairOther02401501201301100800500201
Number Of Sales Reps
Tenure With Lawson (as of 63019)
Average Annual Sales
Consolidated Revenues
Consolidated Revenues20142015201620172018TTM 63019285693275834276573305907349637362236Net Cash(Debt)2014201520162017201843646420798409580-101271060-1908Rep Count201320142015201620172018436468069169371009983994982
Adjusted Reg G EBITDA
Adjusted EBITDA20142015201620172018TTM 63019136581719912065158402524829237
Quarterly Adjusted Reg G EBITDA
2017Q1Q2Q3Q428524519544330262018Q1Q2Q3Q451217749732550532019Q1Q2Q3Q474579402
Adjusted EBITDA $ in 000s
Reg G Adjusted EBITDA Q1 2017Q2 2017Q3 2017Q4 20172852451954433026
Adjusted EBITDA of Sales
Adjusted EBITDA of SalesQ1 2017Q2 2017Q3 2017Q4 20173822185292895721E-260248513452257152E-271948817596594883E-237528059231332088E-2
Adjusted Operating Income of Sales
Adjusted Operating IncomeQ1 2017Q2 2017Q3 2017Q4 2017
Adjusted Op Inc $ in 000s
Reg G Adjusted EBITDA Q1 2017Q2 2017Q3 2017Q4 2017
copy 2019 Lawson Products Inc All rights reserved Confidential Material Reproduction In Whole or in Part Prohibited
Consolidated Balance Sheet Appendix P-4
18
ASSETSCurrent assetsCash and cash equivalents $ 8626 $ 11883Restricted cash 800 800Accounts receivable less allowance for doubtful accounts of $614 and $549 respectively
45162 37682
Inventories net 54894 52887Miscellaneous receivables and prepaid expenses 4270 3653Total current assets 113752 106905
Property plant and equipment net 16932 23548Deferred income taxes 17372 20592Goodwill 20582 20079Cash value of life insurance 14440 12599Intangible assets net 12468 13112Lease assets 11917 mdashOther assets 275 307Total assets $ 207738 $ 197142
LIABILITIES AND STOCKHOLDERSrsquo EQUITYCurrent liabilitiesRevolving lines of credit $ 2195 $ 10823Accounts payable 16325 15207Lease obligation 3781 mdashAccrued expenses and other liabilities 37873 40179Total current liabilities 60174 66209
Security bonus plan 11969 12413Lease obligation 10360 5213Deferred compensation 5915 5304Deferred tax liability 2879 2761Other liabilities 3460 6069Total liabilities 94757 97969
Stockholdersrsquo equityPreferred stock $1 par valueAuthorized - 500000 shares Issued and outstanding mdash None mdash mdashCommon stock $1 par value
Authorized - 35000000 sharesIssued - 9042597 and 9005716 shares respectivelyOutstanding - 8956981 and 8955930 shares respectively
Capital in excess of par value 17626 15623Retained earnings 89502 77338Treasury stock ndash 85616 and 49786 shares respectivelyAccumulated other comprehensive lossTotal stockholdersrsquo equity 112981 99173Total liabilities and stockholdersrsquo equity $ 207738 $ 197142
September 30 December 312019 2018
(Unaudited)
(2595) (1234)(595) (1560)
9043 9006
Customer Mix
Regional Accounts48
Kent Automotive16
Regional AccountsStrategicKent AutomotiveBolt SupplyGovernment Screw ProductsOther0470140000000000000010150110110002
ampDampF ampA
Product Mix
Fastening Systems23
Specialty Chemicals12
Fastening SystemsFluid PowerSpecialy ChemicalsCutting Tools and AbrasivesElectricalAftermarket Automotive SuppliesSafetyWelding and Metal RepairOther02401501201301100800500201
Number Of Sales Reps
Tenure With Lawson (as of 63019)
Average Annual Sales
Consolidated Revenues
Consolidated Revenues20142015201620172018TTM 93019285693275834276573305907349637368485Net Cash(Debt)2014201520162017201843738420798409580-1012710606431Rep Count201320142015201620172018437388069169371009983994993
Adjusted Reg G EBITDA
Adjusted EBITDA20142015201620172018TTM 93019136581719912065158402524832230
Quarterly Adjusted Reg G EBITDA
2017Q1Q2Q3Q428524519544330262018Q1Q2Q3Q451217749732550532019Q1Q2Q3Q47457940210318
Adjusted EBITDA $ in 000s
Reg G Adjusted EBITDA Q1 2017Q2 2017Q3 2017Q4 20172852451954433026
Adjusted EBITDA of Sales
Adjusted EBITDA of SalesQ1 2017Q2 2017Q3 2017Q4 20173822185292895721E-260248513452257152E-271948817596594883E-237528059231332088E-2
Adjusted Operating Income of Sales
Adjusted Operating IncomeQ1 2017Q2 2017Q3 2017Q4 2017
Adjusted Op Inc $ in 000s
Reg G Adjusted EBITDA Q1 2017Q2 2017Q3 2017Q4 2017
| September 30 | December 31 | ||||||||||
| 2019 | 2018 | ||||||||||
| ASSETS | (Unaudited) | ||||||||||
| Current assets | |||||||||||
| Cash and cash equivalents | $ | 8626 | $ | 11883 | |||||||
| Restricted cash | 800 | 800 | |||||||||
| Accounts receivable less allowance for doubtful accounts of $614 and $549 respectively | 45162 | 37682 | |||||||||
| Inventories net | 54894 | 52887 | |||||||||
| Miscellaneous receivables and prepaid expenses | 4270 | 3653 | |||||||||
| Total current assets | 113752 | 106905 | |||||||||
| Property plant and equipment net | 16932 | 23548 | |||||||||
| Deferred income taxes | 17372 | 20592 | |||||||||
| Goodwill | 20582 | 20079 | |||||||||
| Cash value of life insurance | 14440 | 12599 | |||||||||
| Intangible assets net | 12468 | 13112 | |||||||||
| Lease assets | 11917 | mdash | |||||||||
| Other assets | 275 | 307 | |||||||||
| Total assets | $ | 207738 | $ | 197142 | |||||||
| LIABILITIES AND STOCKHOLDERSrsquo EQUITY | |||||||||||
| Current liabilities | |||||||||||
| Revolving lines of credit | $ | 2195 | $ | 10823 | |||||||
| Accounts payable | 16325 | 15207 | |||||||||
| Lease obligation | 3781 | mdash | |||||||||
| Accrued expenses and other liabilities | 37873 | 40179 | |||||||||
| Total current liabilities | 60174 | 66209 | |||||||||
| Security bonus plan | 11969 | 12413 | |||||||||
| Lease obligation | 10360 | 5213 | |||||||||
| Deferred compensation | 5915 | 5304 | |||||||||
| Deferred tax liability | 2879 | 2761 | |||||||||
| Other liabilities | 3460 | 6069 | |||||||||
| Total liabilities | 94757 | 97969 | |||||||||
| Stockholdersrsquo equity | |||||||||||
| Preferred stock $1 par value | |||||||||||
| Authorized - 500000 shares Issued and outstanding mdash None | mdash | mdash | |||||||||
| Common stock $1 par value | |||||||||||
| Authorized - 35000000 shares | 9043 | 9006 | |||||||||
| Issued - 9042597 and 9005716 shares respectively | |||||||||||
| Outstanding - 8956981 and 8955930 shares respectively | |||||||||||
| Capital in excess of par value | 17626 | 15623 | |||||||||
| Retained earnings | 89502 | 77338 | |||||||||
| Treasury stock ndash 85616 and 49786 shares respectively | (2595) | (1234) | |||||||||
| Accumulated other comprehensive loss | (595) | (1560) | |||||||||
| Total stockholdersrsquo equity | 112981 | 99173 | |||||||||
| Total liabilities and stockholdersrsquo equity | $ | 207738 | $ | 197142 | |||||||
| Three Months Ended | |||||||||||||||||||||||||||||
| Jun 30 2019 | Mar 31 2019 | Dec 31 2018 | Sep 30 2018 | Jun 30 2018 | |||||||||||||||||||||||||
| Average daily net sales | $ | 1502 | $ | 1450 | $ | 1414 | $ | 1405 | $ | 1412 | |||||||||||||||||||
| Year over year increase | 63 | 82 | 70 | 170 | 205 | ||||||||||||||||||||||||
| Sequential quarter increase (decrease) | 36 | 25 | 06 | (05) | 53 | ||||||||||||||||||||||||
| Net Sales | $ | 96097 | $ | 91343 | $ | 86266 | $ | 88530 | $ | 90382 | |||||||||||||||||||
| Gross profit (1) | 51043 | 48923 | 46083 | 48108 | 49131 | ||||||||||||||||||||||||
| Gross profit percentage (1) | 531 | 536 | 534 | 543 | 544 | ||||||||||||||||||||||||
| Selling general amp administrative expenses | $ | 49420 | $ | 43379 | $ | 41998 | $ | 50374 | $ | 43577 | |||||||||||||||||||
| Operating income (loss) | $ | 1623 | $ | 5544 | $ | 4085 | $ | (2266) | $ | 5554 | |||||||||||||||||||
| Full Year | |||||||||||||||||||||||||||||||||||||||||||||||||||||||||||||||||||||||||||
| ($ in thousands) | Q1 2011 | Q2 2011 | Q3 2011 | Q4 2011 | Q1 2012 | Q2 2012 | Q3 2012 | Q4 2012 | Q1 2013 | Q2 2013 | Q3 2013 | Q4 2013 | Q1 2014 | Q2 2014 | Q3 2014 | Q4 2014 | Q1 2015 | Q2 2015 | Q3 2015 | Q4 2015 | Q1 2016 | Q2 2016 | Q3 2016 | Q4 2016 | Q1 2017 | Q2 2017 | Q3 2017 | Q4 2017 | Q1 2018 | Q2 2018 | Q3 2018 | Q4 2018 | Q1 2019 | Q2 2019 | Q3 2019 | 2014 | 2015 | ||||||||||||||||||||||||||||||||||||||
| Net Sales | $ 79255 | $ 80625 | $ 71490 | $ 69029 | $ 71364 | $ 69830 | $ 67863 | $ 64505 | $ 67213 | $ 68317 | $ 68235 | $ 65738 | $ 69204 | $ 72080 | $ 74128 | $ 70281 | $ 69904 | $ 70726 | $ 70243 | $ 64961 | $ 69711 | $ 69348 | $ 70199 | $ 67315 | $ 74617 | $ 75006 | $ 75651 | $ 80633 | $ 84459 | $ 90382 | $ 88530 | $ 86266 | $ 91343 | $ 96097 | $ 94779 | $ 285693 | $ 275834 | ||||||||||||||||||||||||||||||||||||||
| Operating Income (Loss) | 3542 | 1397 | (3480) | (6995) | (3466) | (42084) | (1740) | 2057 | (3530) | (201) | 870 | (3002) | (4713) | 1241 | 678 | (2169) | (947) | 3243 | 2810 | (2985) | 1169 | 29 | 2389 | (5044) | 712 | 7891 | 1090 | 243 | 1837 | 5554 | (2266) | 4085 | 5544 | 1623 | 6446 | (4963) | 2121 | ||||||||||||||||||||||||||||||||||||||
| Depreciation amp Amortization | 1260 | 1315 | 1160 | 1675 | 1715 | 1566 | 1963 | 1841 | 2061 | 2244 | 2367 | 2358 | 2295 | 2163 | 2160 | 2133 | 2096 | 2126 | 2119 | 2202 | 2187 | 2226 | 1973 | 1680 | 1705 | 1644 | 1591 | 1830 | 1686 | 1679 | 1755 | 1735 | 1478 | 1455 | 1468 | 8751 | 8543 | ||||||||||||||||||||||||||||||||||||||
| EBITDA | 4802 | 2712 | (2320) | (5320) | (1751) | (40518) | 223 | 3898 | (1469) | 2043 | 3237 | (644) | (2418) | 3404 | 2838 | (36) | 1149 | 5369 | 4929 | (783) | 3356 | 2255 | 4362 | (3364) | 2417 | 9535 | 2681 | 2073 | 3523 | 7233 | (511) | 5820 | 7022 | 3078 | 7914 | 3788 | 10664 | ||||||||||||||||||||||||||||||||||||||
| Excluded Costs | |||||||||||||||||||||||||||||||||||||||||||||||||||||||||||||||||||||||||||
| Severance | 745 | 465 | 282 | 122 | 185 | 6585 | 1410 | (159) | - 0 | 2 | 962 | (127) | 728 | 290 | (328) | (59) | 571 | 50 | 372 | 280 | 204 | 143 | 367 | 1662 | 465 | (9) | 139 | 144 | 628 | 64 | 31 | 126 | 27 | 1485 | 30 | 631 | 1273 | ||||||||||||||||||||||||||||||||||||||
| Stock Based Compensation (Benefit) | 227 | (95) | (538) | 467 | 198 | (1015) | 77 | 434 | 1596 | 76 | 33 | 562 | 1125 | 408 | 2423 | 2443 | (541) | 971 | (30) | 1693 | (1217) | 515 | (630) | 3801 | (30) | 415 | 2337 | 384 | 970 | 87 | 7637 | (1186) | 408 | 4839 | 2374 | 6399 | 2093 | ||||||||||||||||||||||||||||||||||||||
| Acquisition Related Costs | - 0 | - 0 | - 0 | - 0 | - 0 | - 0 | 310 | 32 | 115 | 198 | 178 | 120 | - 0 | - 0 | 286 | 425 | - 0 | - 0 | 168 | 62 | - 0 | - 0 | - 0 | ||||||||||||||||||||||||||||||||||||||||||||||||||||
| ERP Implementation Costs | 1902 | 2388 | 2344 | 339 | - 0 | - 0 | - 0 | - 0 | - 0 | - 0 | - 0 | - 0 | - 0 | - 0 | - 0 | - 0 | - 0 | - 0 | - 0 | - 0 | - 0 | - 0 | - 0 | - 0 | - 0 | - 0 | - 0 | - 0 | - 0 | - 0 | - 0 | - 0 | - 0 | ||||||||||||||||||||||||||||||||||||||||||
| Loss(Gain) on Disposal of Property | - 0 | - 0 | - 0 | 22 | - 0 | (2122) | (11) | (1588) | - 0 | - 0 | (36) | 32 | - 0 | - 0 | 97 | 45 | - 0 | - 0 | (2) | 9 | - 0 | - 0 | - 0 | - 0 | - 0 | (5422) | - 0 | - 0 | - 0 | - 0 | - 0 | - 0 | - 0 | - 0 | - 0 | 142 | 7 | ||||||||||||||||||||||||||||||||||||||
| Legal Settlement | - 0 | - 0 | - 0 | - 0 | - 0 | - 0 | - 0 | - 0 | - 0 | - 0 | - 0 | - 0 | - 0 | - 0 | (688) | - 0 | - 0 | - 0 | - 0 | - 0 | - 0 | - 0 | - 0 | - 0 | - 0 | - 0 | - 0 | - 0 | - 0 | - 0 | - 0 | - 0 | (688) | - 0 | |||||||||||||||||||||||||||||||||||||||||
| Employment Tax Matter | - 0 | - 0 | - 0 | 1200 | - 0 | - 0 | - 0 | - 0 | - 0 | - 0 | - 0 | (400) | - 0 | - 0 | - 0 | - 0 | - 0 | - 0 | - 0 | - 0 | - 0 | - 0 | - 0 | - 0 | - 0 | - 0 | - 0 | - 0 | - 0 | - 0 | - 0 | - 0 | - 0 | - 0 | |||||||||||||||||||||||||||||||||||||||||
| Lease termination gain | - 0 | - 0 | - 0 | - 0 | - 0 | - 0 | - 0 | - 0 | - 0 | - 0 | - 0 | 2928 | - 0 | - 0 | - 0 | - 0 | - 0 | - 0 | - 0 | - 0 | - 0 | - 0 | - 0 | - 0 | - 0 | - 0 | - 0 | - 0 | - 0 | (164) | - 0 | - 0 | - 0 | - 0 | - 0 | - 0 | - 0 | ||||||||||||||||||||||||||||||||||||||
| Goodwill Impairment | - 0 | - 0 | - 0 | - 0 | - 0 | 28306 | - 0 | - 0 | - 0 | - 0 | - 0 | - 0 | - 0 | - 0 | - 0 | - 0 | - 0 | - 0 | - 0 | - 0 | - 0 | - 0 | - 0 | - 0 | - 0 | - 0 | - 0 | - 0 | - 0 | - 0 | - 0 | - 0 | - 0 | - 0 | |||||||||||||||||||||||||||||||||||||||||
| Inventory Rationalization | - 0 | - 0 | - 0 | - 0 | - 0 | 3893 | - 0 | - 0 | - 0 | - 0 | - 0 | - 0 | - 0 | - 0 | - 0 | - 0 | - 0 | - 0 | - 0 | - 0 | - 0 | - 0 | - 0 | - 0 | - 0 | - 0 | - 0 | - 0 | - 0 | - 0 | - 0 | - 0 | - 0 | - 0 | |||||||||||||||||||||||||||||||||||||||||
| Discontinued operation accrual | - 0 | - 0 | - 0 | - 0 | - 0 | - 0 | - 0 | - 0 | - 0 | - 0 | - 0 | - 0 | - 0 | - 0 | - 0 | 340 | - 0 | - 0 | - 0 | 931 | - 0 | - 0 | - 0 | - 0 | - 0 | - 0 | - 0 | - 0 | - 0 | 529 | - 0 | - 0 | - 0 | - 0 | - 0 | 340 | 931 | ||||||||||||||||||||||||||||||||||||||
| North American sales meeting | - 0 | - 0 | - 0 | - 0 | - 0 | - 0 | - 0 | - 0 | 1225 | - 0 | - 0 | - 0 | - 0 | - 0 | - 0 | - 0 | 1889 | - 0 | - 0 | - 0 | - 0 | - 0 | - 0 | - 0 | - 0 | - 0 | - 0 | - 0 | - 0 | - 0 | - 0 | - 0 | - 0 | 1889 | |||||||||||||||||||||||||||||||||||||||||
| Property Impairment Loss | - 0 | - 0 | - 0 | - 0 | - 0 | - 0 | - 0 | - 0 | - 0 | - 0 | - 0 | - 0 | 2914 | 132 | - 0 | - 0 | - 0 | - 0 | - 0 | - 0 | - 0 | - 0 | - 0 | - 0 | - 0 | - 0 | - 0 | - 0 | - 0 | - 0 | - 0 | - 0 | 3046 | - 0 | |||||||||||||||||||||||||||||||||||||||||
| Building Impairment | - 0 | - 0 | - 0 | - 0 | - 0 | - 0 | - 0 | 231 | - 0 | - 0 | - 0 | ||||||||||||||||||||||||||||||||||||||||||||||||||||||||||||||||
| Reg G Adjusted EBITDA | $ 7676 | $ 5470 | $ (232) | $ (3170) | $ (1368) | $ (4871) | $ 1699 | $ 2585 | $ 1352 | $ 2121 | $ 4196 | $ 2351 | $ 2349 | $ 4234 | $ 4342 | $ 2733 | $ 3068 | $ 6390 | $ 5579 | $ 2162 | $ 2458 | $ 3111 | $ 4277 | $ 2219 | $ 2852 | $ 4519 | $ 5443 | $ 3026 | $ 5121 | $ 7749 | $ 7325 | $ 5053 | $ 7457 | $ 9402 | $ 10318 | $ 13658 | $ 17199 | ||||||||||||||||||||||||||||||||||||||
| Adjusted EBITDA of Sales | 97 | 68 | -03 | -46 | -19 | -70 | 25 | 40 | 20 | 31 | 61 | 36 | 34 | 59 | 59 | 39 | 44 | 90 | 79 | 33 | 35 | 45 | 61 | 33 | 38 | 60 | 72 | 38 | 61 | 86 | 83 | 59 | 82 | 98 | 109 | 48 | 62 | ||||||||||||||||||||||||||||||||||||||
| Annual Adjusted EBITDA of Sales | 44 | 58 | |||||||||||||||||||||||||||||||||||||||||||||||||||||||||||||||||||||||||
| Adjusted Operating Income | (3083) | (6437) | (264) | 744 | (709) | (123) | 1829 | (7) | 54 | 2071 | 2182 | 600 | 972 | 4264 | 3460 | (40) | 271 | 885 | 2304 | 539 | 1147 | 2875 | 3852 | 1196 | 3435 | 6070 | 5570 | 3087 | 5979 | 7947 | 8850 | 4907 | 8314 | ||||||||||||||||||||||||||||||||||||||||||
| Consolidated Revenues | |||||||
| 2013 | 269503 | ||||||
| 2014 | 285693 | ||||||
| 2015 | 275834 | ||||||
| 2016 | 276573 | ||||||
| 2017 | 305907 | ||||||
| 2018 | 349637 | ||||||
| TTM 93019 | 368485 | ||||||
| Net Cash(Debt) | |||||||
| 2013 | (15380) | ||||||
| 2014 | 4207 | ||||||
| 2015 | 9840 | ||||||
| 2016 | 9580 | ||||||
| 2017 | (10127) | ||||||
| 2018 | 1060 | ||||||
| 93019 | 6431 | ||||||
| Rep Count | |||||||
| 2013 | 806 | ||||||
| 2014 | 916 | ||||||
| 2015 | 937 | ||||||
| 2016 | 1009 | ||||||
| 2017 | 983 | ||||||
| 2018 | 994 | ||||||
| 93019 | 993 | ||||||
| Adjusted OI | DampA | Adjusted EBITDA | |||||
| 2013 | 990 | 9030 | 10020 | ||||
| 2014 | 4907 | 8751 | 13658 | ||||
| 2015 | 8315 | 8543 | 17199 | ||||
| 2016 | 3388 | 8066 | 12065 | ||||
| 2017 | 15840 | ||||||
| 2018 | 25248 | ||||||
| TTM 93019 | 32230 | ||||||
| Reg G EBITDA By Quarter | |||||||
| Quarter | 2017 | 2018 | 2019 | ||||
| Q1 | 2852 | 5121 | 7457 | ||||
| Q2 | 4519 | 7749 | 9402 | ||||
| Q3 | 5443 | 7325 | 10318 | ||||
| Q4 | 3026 | 5053 |
| Months of Experience | Average Annual Sales | Number of Reps | |||
| lt 12 Mos | ERRORVALUE | ERRORVALUE | |||
| 1 - 2 Yrs | ERRORVALUE | ERRORVALUE | |||
| 3 - 5 Yrs | ERRORVALUE | ERRORVALUE | |||
| 5 - 10 Yrs | ERRORVALUE | ERRORVALUE | |||
| gt 10 Yrs | ERRORVALUE | ERRORVALUE | |||
| ERRORVALUE | |||||
| Excludes ISR MSS CRS | |||||
| Excludes Freight | |||||
| Product mix | ||||||||
| Verticals | Q3 2019 Sales | |||||||
| Fastening Systems | 240 | 22485606 | ||||||
| Fluid Power | 151 | 14156064 | ||||||
| Specialy Chemicals | 117 | 10917433 | ||||||
| Cutting Tools and Abrasives | 131 | 12296596 | ||||||
| Electrical | 104 | 9724849 | ||||||
| Aftermarket Automotive Supplies | 76 | 7154688 | ||||||
| Safety | 47 | 4445846 | ||||||
| Welding and Metal Repair | 13 | 1218030 | ||||||
| Other | 120 | 11237322 | ||||||
| Total | 100 | 93636434 | ||||||
| Verticals | YTD 2019 Sales | |||||||
| Fastening Systems | 24 | 66611555 | ||||||
| Fluid Power | 15 | 42224416 | ||||||
| Specialy Chemicals | 12 | 32166853 | ||||||
| Cutting Tools and Abrasives | 13 | 36587482 | ||||||
| Electrical | 11 | 30150144 | ||||||
| Aftermarket Automotive Supplies | 8 | 21960561 | ||||||
| Safety | 5 | 13072228 | ||||||
| Welding and Metal Repair | 2 | 4306548 | ||||||
| Other | 10 | 31279779 | ||||||
| Total | 100 | 278359566 |
| Lawson core customer mix | ||||||||
| Account Tyoe | Q3 | |||||||
| Regional Accounts | 43045893 | 45 | ||||||
| Strategic | 14086813 | 15 | ||||||
| Kent Automotive | 14300065 | 15 | ||||||
| Bolt Supply | 11318703 | 12 | ||||||
| Government | 10291732 | 11 | ||||||
| Screw Products | 0 | 0 | ||||||
| Other (1) | 1735236 | 2 | ||||||
| Total | 94778443 | 100 | ||||||
| Account Tyoe | YTD September | |||||||
| Regional Accounts | 131389537 | 47 | ||||||
| Strategic | 40364305 | 14 | ||||||
| Kent Automotive | 43371411 | 15 | ||||||
| Bolt Supply | 31324209 | 11 | ||||||
| Government | 29794959 | 11 | ||||||
| Screw Products | 0 | 0 | ||||||
| Other | 5974302 | 2 | ||||||
| Total | 282218723 | 100 | ||||||
| Total Reported |
| September 30 | December 31 | ||||||||||
| 2019 | 2018 | ||||||||||
| ASSETS | (Unaudited) | ||||||||||
| Current assets | |||||||||||
| Cash and cash equivalents | $ | 8626 | $ | 11883 | |||||||
| Restricted cash | 800 | 800 | |||||||||
| Accounts receivable less allowance for doubtful accounts of $614 and $549 respectively | 45162 | 37682 | |||||||||
| Inventories net | 54894 | 52887 | |||||||||
| Miscellaneous receivables and prepaid expenses | 4270 | 3653 | |||||||||
| Total current assets | 113752 | 106905 | |||||||||
| Property plant and equipment net | 16932 | 23548 | |||||||||
| Deferred income taxes | 17372 | 20592 | |||||||||
| Goodwill | 20582 | 20079 | |||||||||
| Cash value of life insurance | 14440 | 12599 | |||||||||
| Intangible assets net | 12468 | 13112 | |||||||||
| Lease assets | 11917 | mdash | |||||||||
| Other assets | 275 | 307 | |||||||||
| Total assets | $ | 207738 | $ | 197142 | |||||||
| LIABILITIES AND STOCKHOLDERSrsquo EQUITY | |||||||||||
| Current liabilities | |||||||||||
| Revolving lines of credit | $ | 2195 | $ | 10823 | |||||||
| Accounts payable | 16325 | 15207 | |||||||||
| Lease obligation | 3781 | mdash | |||||||||
| Accrued expenses and other liabilities | 37873 | 40179 | |||||||||
| Total current liabilities | 60174 | 66209 | |||||||||
| Security bonus plan | 11969 | 12413 | |||||||||
| Lease obligation | 10360 | 5213 | |||||||||
| Deferred compensation | 5915 | 5304 | |||||||||
| Deferred tax liability | 2879 | 2761 | |||||||||
| Other liabilities | 3460 | 6069 | |||||||||
| Total liabilities | 94757 | 97969 | |||||||||
| Stockholdersrsquo equity | |||||||||||
| Preferred stock $1 par value | |||||||||||
| Authorized - 500000 shares Issued and outstanding mdash None | mdash | mdash | |||||||||
| Common stock $1 par value | |||||||||||
| Authorized - 35000000 shares | 9043 | 9006 | |||||||||
| Issued - 9042597 and 9005716 shares respectively | |||||||||||
| Outstanding - 8956981 and 8955930 shares respectively | |||||||||||
| Capital in excess of par value | 17626 | 15623 | |||||||||
| Retained earnings | 89502 | 77338 | |||||||||
| Treasury stock ndash 85616 and 49786 shares respectively | (2595) | (1234) | |||||||||
| Accumulated other comprehensive loss | (595) | (1560) | |||||||||
| Total stockholdersrsquo equity | 112981 | 99173 | |||||||||
| Total liabilities and stockholdersrsquo equity | $ | 207738 | $ | 197142 | |||||||
| Three Months Ended | |||||||||||||||||||||||||||||
| Jun 30 2019 | Mar 31 2019 | Dec 31 2018 | Sep 30 2018 | Jun 30 2018 | |||||||||||||||||||||||||
| Average daily net sales | $ | 1502 | $ | 1450 | $ | 1414 | $ | 1405 | $ | 1412 | |||||||||||||||||||
| Year over year increase | 63 | 82 | 70 | 170 | 205 | ||||||||||||||||||||||||
| Sequential quarter increase (decrease) | 36 | 25 | 06 | (05) | 53 | ||||||||||||||||||||||||
| Net Sales | $ | 96097 | $ | 91343 | $ | 86266 | $ | 88530 | $ | 90382 | |||||||||||||||||||
| Gross profit (1) | 51043 | 48923 | 46083 | 48108 | 49131 | ||||||||||||||||||||||||
| Gross profit percentage (1) | 531 | 536 | 534 | 543 | 544 | ||||||||||||||||||||||||
| Selling general amp administrative expenses | $ | 49420 | $ | 43379 | $ | 41998 | $ | 50374 | $ | 43577 | |||||||||||||||||||
| Operating income (loss) | $ | 1623 | $ | 5544 | $ | 4085 | $ | (2266) | $ | 5554 | |||||||||||||||||||
| Full Year | |||||||||||||||||||||||||||||||||||||||||||||||||||||||||||||||||||||||||||
| ($ in thousands) | Q1 2011 | Q2 2011 | Q3 2011 | Q4 2011 | Q1 2012 | Q2 2012 | Q3 2012 | Q4 2012 | Q1 2013 | Q2 2013 | Q3 2013 | Q4 2013 | Q1 2014 | Q2 2014 | Q3 2014 | Q4 2014 | Q1 2015 | Q2 2015 | Q3 2015 | Q4 2015 | Q1 2016 | Q2 2016 | Q3 2016 | Q4 2016 | Q1 2017 | Q2 2017 | Q3 2017 | Q4 2017 | Q1 2018 | Q2 2018 | Q3 2018 | Q4 2018 | Q1 2019 | Q2 2019 | Q3 2019 | 2014 | 2015 | ||||||||||||||||||||||||||||||||||||||
| Net Sales | $ 79255 | $ 80625 | $ 71490 | $ 69029 | $ 71364 | $ 69830 | $ 67863 | $ 64505 | $ 67213 | $ 68317 | $ 68235 | $ 65738 | $ 69204 | $ 72080 | $ 74128 | $ 70281 | $ 69904 | $ 70726 | $ 70243 | $ 64961 | $ 69711 | $ 69348 | $ 70199 | $ 67315 | $ 74617 | $ 75006 | $ 75651 | $ 80633 | $ 84459 | $ 90382 | $ 88530 | $ 86266 | $ 91343 | $ 96097 | $ 94779 | $ 285693 | $ 275834 | ||||||||||||||||||||||||||||||||||||||
| Operating Income (Loss) | 3542 | 1397 | (3480) | (6995) | (3466) | (42084) | (1740) | 2057 | (3530) | (201) | 870 | (3002) | (4713) | 1241 | 678 | (2169) | (947) | 3243 | 2810 | (2985) | 1169 | 29 | 2389 | (5044) | 712 | 7891 | 1090 | 243 | 1837 | 5554 | (2266) | 4085 | 5544 | 1623 | 6446 | (4963) | 2121 | ||||||||||||||||||||||||||||||||||||||
| Depreciation amp Amortization | 1260 | 1315 | 1160 | 1675 | 1715 | 1566 | 1963 | 1841 | 2061 | 2244 | 2367 | 2358 | 2295 | 2163 | 2160 | 2133 | 2096 | 2126 | 2119 | 2202 | 2187 | 2226 | 1973 | 1680 | 1705 | 1644 | 1591 | 1830 | 1686 | 1679 | 1755 | 1735 | 1478 | 1455 | 1468 | 8751 | 8543 | ||||||||||||||||||||||||||||||||||||||
| EBITDA | 4802 | 2712 | (2320) | (5320) | (1751) | (40518) | 223 | 3898 | (1469) | 2043 | 3237 | (644) | (2418) | 3404 | 2838 | (36) | 1149 | 5369 | 4929 | (783) | 3356 | 2255 | 4362 | (3364) | 2417 | 9535 | 2681 | 2073 | 3523 | 7233 | (511) | 5820 | 7022 | 3078 | 7914 | 3788 | 10664 | ||||||||||||||||||||||||||||||||||||||
| Excluded Costs | |||||||||||||||||||||||||||||||||||||||||||||||||||||||||||||||||||||||||||
| Severance | 745 | 465 | 282 | 122 | 185 | 6585 | 1410 | (159) | - 0 | 2 | 962 | (127) | 728 | 290 | (328) | (59) | 571 | 50 | 372 | 280 | 204 | 143 | 367 | 1662 | 465 | (9) | 139 | 144 | 628 | 64 | 31 | 126 | 27 | 1485 | 30 | 631 | 1273 | ||||||||||||||||||||||||||||||||||||||
| Stock Based Compensation (Benefit) | 227 | (95) | (538) | 467 | 198 | (1015) | 77 | 434 | 1596 | 76 | 33 | 562 | 1125 | 408 | 2423 | 2443 | (541) | 971 | (30) | 1693 | (1217) | 515 | (630) | 3801 | (30) | 415 | 2337 | 384 | 970 | 87 | 7637 | (1186) | 408 | 4839 | 2374 | 6399 | 2093 | ||||||||||||||||||||||||||||||||||||||
| Acquisition Related Costs | - 0 | - 0 | - 0 | - 0 | - 0 | - 0 | 310 | 32 | 115 | 198 | 178 | 120 | - 0 | - 0 | 286 | 425 | - 0 | - 0 | 168 | 62 | - 0 | - 0 | - 0 | ||||||||||||||||||||||||||||||||||||||||||||||||||||
| ERP Implementation Costs | 1902 | 2388 | 2344 | 339 | - 0 | - 0 | - 0 | - 0 | - 0 | - 0 | - 0 | - 0 | - 0 | - 0 | - 0 | - 0 | - 0 | - 0 | - 0 | - 0 | - 0 | - 0 | - 0 | - 0 | - 0 | - 0 | - 0 | - 0 | - 0 | - 0 | - 0 | - 0 | - 0 | ||||||||||||||||||||||||||||||||||||||||||
| Loss(Gain) on Disposal of Property | - 0 | - 0 | - 0 | 22 | - 0 | (2122) | (11) | (1588) | - 0 | - 0 | (36) | 32 | - 0 | - 0 | 97 | 45 | - 0 | - 0 | (2) | 9 | - 0 | - 0 | - 0 | - 0 | - 0 | (5422) | - 0 | - 0 | - 0 | - 0 | - 0 | - 0 | - 0 | - 0 | - 0 | 142 | 7 | ||||||||||||||||||||||||||||||||||||||
| Legal Settlement | - 0 | - 0 | - 0 | - 0 | - 0 | - 0 | - 0 | - 0 | - 0 | - 0 | - 0 | - 0 | - 0 | - 0 | (688) | - 0 | - 0 | - 0 | - 0 | - 0 | - 0 | - 0 | - 0 | - 0 | - 0 | - 0 | - 0 | - 0 | - 0 | - 0 | - 0 | - 0 | (688) | - 0 | |||||||||||||||||||||||||||||||||||||||||
| Employment Tax Matter | - 0 | - 0 | - 0 | 1200 | - 0 | - 0 | - 0 | - 0 | - 0 | - 0 | - 0 | (400) | - 0 | - 0 | - 0 | - 0 | - 0 | - 0 | - 0 | - 0 | - 0 | - 0 | - 0 | - 0 | - 0 | - 0 | - 0 | - 0 | - 0 | - 0 | - 0 | - 0 | - 0 | - 0 | |||||||||||||||||||||||||||||||||||||||||
| Lease termination gain | - 0 | - 0 | - 0 | - 0 | - 0 | - 0 | - 0 | - 0 | - 0 | - 0 | - 0 | 2928 | - 0 | - 0 | - 0 | - 0 | - 0 | - 0 | - 0 | - 0 | - 0 | - 0 | - 0 | - 0 | - 0 | - 0 | - 0 | - 0 | - 0 | (164) | - 0 | - 0 | - 0 | - 0 | - 0 | - 0 | - 0 | ||||||||||||||||||||||||||||||||||||||
| Goodwill Impairment | - 0 | - 0 | - 0 | - 0 | - 0 | 28306 | - 0 | - 0 | - 0 | - 0 | - 0 | - 0 | - 0 | - 0 | - 0 | - 0 | - 0 | - 0 | - 0 | - 0 | - 0 | - 0 | - 0 | - 0 | - 0 | - 0 | - 0 | - 0 | - 0 | - 0 | - 0 | - 0 | - 0 | - 0 | |||||||||||||||||||||||||||||||||||||||||
| Inventory Rationalization | - 0 | - 0 | - 0 | - 0 | - 0 | 3893 | - 0 | - 0 | - 0 | - 0 | - 0 | - 0 | - 0 | - 0 | - 0 | - 0 | - 0 | - 0 | - 0 | - 0 | - 0 | - 0 | - 0 | - 0 | - 0 | - 0 | - 0 | - 0 | - 0 | - 0 | - 0 | - 0 | - 0 | - 0 | |||||||||||||||||||||||||||||||||||||||||
| Discontinued operation accrual | - 0 | - 0 | - 0 | - 0 | - 0 | - 0 | - 0 | - 0 | - 0 | - 0 | - 0 | - 0 | - 0 | - 0 | - 0 | 340 | - 0 | - 0 | - 0 | 931 | - 0 | - 0 | - 0 | - 0 | - 0 | - 0 | - 0 | - 0 | - 0 | 529 | - 0 | - 0 | - 0 | - 0 | - 0 | 340 | 931 | ||||||||||||||||||||||||||||||||||||||
| North American sales meeting | - 0 | - 0 | - 0 | - 0 | - 0 | - 0 | - 0 | - 0 | 1225 | - 0 | - 0 | - 0 | - 0 | - 0 | - 0 | - 0 | 1889 | - 0 | - 0 | - 0 | - 0 | - 0 | - 0 | - 0 | - 0 | - 0 | - 0 | - 0 | - 0 | - 0 | - 0 | - 0 | - 0 | 1889 | |||||||||||||||||||||||||||||||||||||||||
| Property Impairment Loss | - 0 | - 0 | - 0 | - 0 | - 0 | - 0 | - 0 | - 0 | - 0 | - 0 | - 0 | - 0 | 2914 | 132 | - 0 | - 0 | - 0 | - 0 | - 0 | - 0 | - 0 | - 0 | - 0 | - 0 | - 0 | - 0 | - 0 | - 0 | - 0 | - 0 | - 0 | - 0 | 3046 | - 0 | |||||||||||||||||||||||||||||||||||||||||
| Building Impairment | - 0 | - 0 | - 0 | - 0 | - 0 | - 0 | - 0 | 231 | - 0 | - 0 | - 0 | ||||||||||||||||||||||||||||||||||||||||||||||||||||||||||||||||
| Reg G Adjusted EBITDA | $ 7676 | $ 5470 | $ (232) | $ (3170) | $ (1368) | $ (4871) | $ 1699 | $ 2585 | $ 1352 | $ 2121 | $ 4196 | $ 2351 | $ 2349 | $ 4234 | $ 4342 | $ 2733 | $ 3068 | $ 6390 | $ 5579 | $ 2162 | $ 2458 | $ 3111 | $ 4277 | $ 2219 | $ 2852 | $ 4519 | $ 5443 | $ 3026 | $ 5121 | $ 7749 | $ 7325 | $ 5053 | $ 7457 | $ 9402 | $ 10318 | $ 13658 | $ 17199 | ||||||||||||||||||||||||||||||||||||||
| Adjusted EBITDA of Sales | 97 | 68 | -03 | -46 | -19 | -70 | 25 | 40 | 20 | 31 | 61 | 36 | 34 | 59 | 59 | 39 | 44 | 90 | 79 | 33 | 35 | 45 | 61 | 33 | 38 | 60 | 72 | 38 | 61 | 86 | 83 | 59 | 82 | 98 | 109 | 48 | 62 | ||||||||||||||||||||||||||||||||||||||
| Annual Adjusted EBITDA of Sales | 44 | 58 | |||||||||||||||||||||||||||||||||||||||||||||||||||||||||||||||||||||||||
| Adjusted Operating Income | (3083) | (6437) | (264) | 744 | (709) | (123) | 1829 | (7) | 54 | 2071 | 2182 | 600 | 972 | 4264 | 3460 | (40) | 271 | 885 | 2304 | 539 | 1147 | 2875 | 3852 | 1196 | 3435 | 6070 | 5570 | 3087 | 5979 | 7947 | 8850 | 4907 | 8314 | ||||||||||||||||||||||||||||||||||||||||||
| Consolidated Revenues | |||||||
| 2013 | 269503 | ||||||
| 2014 | 285693 | ||||||
| 2015 | 275834 | ||||||
| 2016 | 276573 | ||||||
| 2017 | 305907 | ||||||
| 2018 | 349637 | ||||||
| TTM 63019 | 362236 | ||||||
| Net Cash(Debt) | |||||||
| 2013 | (15380) | ||||||
| 2014 | 4207 | ||||||
| 2015 | 9840 | ||||||
| 2016 | 9580 | ||||||
| 2017 | (10127) | ||||||
| 2018 | 1060 | ||||||
| 63019 | (1908) | ||||||
| Rep Count | |||||||
| 2013 | 806 | ||||||
| 2014 | 916 | ||||||
| 2015 | 937 | ||||||
| 2016 | 1009 | ||||||
| 2017 | 983 | ||||||
| 2018 | 994 | ||||||
| 63019 | 982 | ||||||
| Adjusted OI | DampA | Adjusted EBITDA | |||||
| 2013 | 990 | 9030 | 10020 | ||||
| 2014 | 4907 | 8751 | 13658 | ||||
| 2015 | 8315 | 8543 | 17199 | ||||
| 2016 | 3388 | 8066 | 12065 | ||||
| 2017 | 15840 | ||||||
| 2018 | 25248 | ||||||
| TTM 63019 | 29237 | ||||||
| Reg G EBITDA By Quarter | |||||||
| Quarter | 2017 | 2018 | 2019 | ||||
| Q1 | 2852 | 5121 | 7457 | ||||
| Q2 | 4519 | 7749 | 9402 | ||||
| Q3 | 5443 | 7325 | |||||
| Q4 | 3026 | 5053 |
| Months of Experience | Average Annual Sales | Number of Reps | |||
| lt 12 Mos | ERRORVALUE | ERRORVALUE | |||
| 1 - 2 Yrs | ERRORVALUE | ERRORVALUE | |||
| 3 - 5 Yrs | ERRORVALUE | ERRORVALUE | |||
| 5 - 10 Yrs | ERRORVALUE | ERRORVALUE | |||
| gt 10 Yrs | ERRORVALUE | ERRORVALUE | |||
| ERRORVALUE | |||||
| Excludes ISR MSS CRS | |||||
| Excludes Freight | |||||
| Product mix | ||||||||
| Verticals | Q2 2019 Sales | |||||||
| Fastening Systems | 243 | 23008646 | ||||||
| Fluid Power | 152 | 14395529 | ||||||
| Specialy Chemicals | 117 | 11074332 | ||||||
| Cutting Tools and Abrasives | 130 | 12319702 | ||||||
| Electrical | 107 | 10102828 | ||||||
| Aftermarket Automotive Supplies | 77 | 7255974 | ||||||
| Safety | 47 | 4458217 | ||||||
| Welding and Metal Repair | 16 | 1539172 | ||||||
| Other | 112 | 10633378 | ||||||
| Total | 100 | 94787779 | ||||||
| Verticals | YTD 2019 Sales | |||||||
| Fastening Systems | 24 | 44125949 | ||||||
| Fluid Power | 15 | 28068352 | ||||||
| Specialy Chemicals | 12 | 21249420 | ||||||
| Cutting Tools and Abrasives | 13 | 24290887 | ||||||
| Electrical | 11 | 20425294 | ||||||
| Aftermarket Automotive Supplies | 8 | 14805874 | ||||||
| Safety | 5 | 8626381 | ||||||
| Welding and Metal Repair | 2 | 3088518 | ||||||
| Other | 10 | 20042457 | ||||||
| Total | 100 | 184723132 |
| Lawson core customer mix | ||||||||
| Account Tyoe | Q2 | |||||||
| Regional Accounts | 44933707 | 47 | ||||||
| Strategic | 13542786 | 14 | ||||||
| Kent Automotive | 14370813 | 15 | ||||||
| Bolt Supply | 11129675 | 12 | ||||||
| Government | 10087561 | 10 | ||||||
| Screw Products | 0 | 0 | ||||||
| Other (1) | 1428268 | 1 | ||||||
| Total | 96097363 | 100 | ||||||
| Account Tyoe | YTD June | |||||||
| Regional Accounts | 88400675 | 47 | ||||||
| Strategic | 26218365 | 14 | ||||||
| Kent Automotive | 29071347 | 16 | ||||||
| Bolt Supply | 20005505 | 11 | ||||||
| Government | 19505323 | 10 | ||||||
| Screw Products | 0 | 0 | ||||||
| Other | 4239066 | 2 | ||||||
| Total | 187440280 | 100 | ||||||
| Total Reported |
| August 2011 | OslashImplemented SAP | ||
| October 2011 | OslashCommenced construction of new McCook Ill distribution center | ||
| May 2012 | OslashRelocated corporate headquarters | ||
| June 2012 | OslashRestructured senior team Announced $20M cost savings plan | ||
| August 2012 | OslashTransitioned packaging facility to McCook Ill distribution center | ||
| OslashEntered into new five-year $40M credit facility | |||
| October 2012 | OslashAnnounced new CEO and President Michael G DeCata | ||
| OslashConsolidated Vernon Hills distribution center into McCook Ill | |||
| November 2012 | OslashRolled out new website to existing web customers | ||
| December 2012 | OslashCompleted transition of US independent agents to employees | ||
| April 2013 | OslashRoll-out of new website to new web customers | ||
| AprilMay 2013 | OslashMcCook DC begins to ship customer orders | ||
| November 2013 | OslashEntered into sub-lease of headquarters space to generate $29M of future cash savings | ||
| December 2013 | OslashEnded year with over 800 sales reps ndash First increase in 8 years | ||
| February 2014 | OslashClosed on Automatic Screw Machine Products sale for net proceeds of $121M | ||
| June 2014 | OslashEntered into sale-leaseback of Reno distribution facility for net proceeds of $83M | ||
| December 2014 | OslashEnded year with over 900 sales reps | ||
| February 2015 | OslashHeld North American sales meeting | ||
| September 2015 | OslashCompleted West Coast Fasteners acquisition | ||
| March 2016 | OslashCompleted Perfect Products of Michigan acquisition | ||
| May 2016 | OslashCompleted F B Feeney acquisition | ||
| June 2016 | OslashExpanded sales team to over 1000 sales reps | ||
| September 2016 | OslashExtended credit facitlity to August 2020 | ||
| November 2016 | OslashCompleted Mattic Industries acquisition | ||
| March 2017 | OslashConsolidated Fairfield NJ distribution operations into McCook Ill and Suwanee GA | ||
| May 2017 | OslashSold Fairfield NJ distribution center for a gain of $54M | ||
| October 2017 | OslashCompleted Bolt Supply House acquisition | ||
| April 2018 | OslashOpened MRO distribution center in Calgary Canada | ||
| October 2018 | OslashCompleted Screw Products acquisition and added Bolt Supply branch | ||
| June 2019 | OslashAchieved Q2 98 adjusted EBITDA net of ASC 842 impact of 03 | ||
| September 2019 | OslashAchieved Q3 109 adjusted EBITDA hired VP MampA | ||
| October 2019 | OslashEntered into new five-year $100M credit facility with additional $50 million accordion feature |
| ($ in thousands) | Q3 2013 | Q4 2013 | Q1 2014 | Q2 2014 | Q3 2014 | Q4 2014 | Q1 2015 | Q2 2015 | Q3 2015 | Q4 2015 | Q1 2016 | Q2 2016 | Q3 2016 | Q4 2016 | Q1 2017 | Q2 2017 | Q3 2017 | Q4 2017 | ||||||||||||||||||||||||||||||||||||||||||||||
| SGampA | 40350 | 42856 | 45991 | 42562 | 43855 | 44764 | 43830 | 40565 | 40532 | 41145 | 41290 | 42497 | 40184 | 45548 | 44167 | 42672 | 44915 | 46750 | $ 173014 | |||||||||||||||||||||||||||||||||||||||||||||
| $ - | ||||||||||||||||||||||||||||||||||||||||||||||||||||||||||||||||
| Excluded Costs | $ - | 40196 | ||||||||||||||||||||||||||||||||||||||||||||||||||||||||||||||
| Severance | (962) | 127 | (728) | (290) | 328 | 59 | (571) | (50) | (372) | (280) | (204) | (143) | (367) | (1662) | (465) | 9 | (139) | (144) | $ (234) | 127 | ||||||||||||||||||||||||||||||||||||||||||||
| Stock Based Compensation (Benefit) | (33) | (562) | (1125) | (408) | (2423) | (2443) | 541 | (971) | 30 | (1693) | 1217 | (515) | 630 | (3801) | 30 | (415) | (2337) | (384) | $ (5296) | -32 | ||||||||||||||||||||||||||||||||||||||||||||
| Loss(Gain) on Disposal of Property | 36 | (32) | - 0 | - 0 | (97) | (45) | - 0 | - 0 | 2 | (9) | - 0 | - 0 | - 0 | - 0 | - 0 | - 0 | - 0 | - 0 | $ (142) | |||||||||||||||||||||||||||||||||||||||||||||
| Legal Settlement | - 0 | - 0 | - 0 | - 0 | 688 | - 0 | - 0 | - 0 | - 0 | - 0 | - 0 | - 0 | - 0 | - 0 | - 0 | - 0 | - 0 | - 0 | $ 688 | -562 | ||||||||||||||||||||||||||||||||||||||||||||
| Employment Tax Matter | - 0 | 400 | - 0 | - 0 | - 0 | - 0 | - 0 | - 0 | - 0 | - 0 | - 0 | - 0 | - 0 | - 0 | - 0 | - 0 | - 0 | - 0 | $ - | 39729 | ||||||||||||||||||||||||||||||||||||||||||||
| Loss on Sub-Lease | - 0 | (2928) | - 0 | - 0 | - 0 | - 0 | - 0 | - 0 | - 0 | - 0 | - 0 | - 0 | - 0 | - 0 | - 0 | - 0 | - 0 | - 0 | $ - | |||||||||||||||||||||||||||||||||||||||||||||
| National sales meeting | - 0 | - 0 | - 0 | - 0 | - 0 | - 0 | (1889) | - 0 | - 0 | - 0 | - 0 | - 0 | - 0 | - 0 | - 0 | - 0 | - 0 | - 0 | $ (1889) | |||||||||||||||||||||||||||||||||||||||||||||
| Remediation expense | - 0 | - 0 | - 0 | - 0 | - 0 | (340) | - 0 | - 0 | - 0 | - 0 | - 0 | - 0 | - 0 | - 0 | - 0 | - 0 | - 0 | - 0 | $ (340) | |||||||||||||||||||||||||||||||||||||||||||||
| Property Impairment Loss | - 0 | - 0 | (2914) | (132) | - 0 | - 0 | - 0 | - 0 | - 0 | - 0 | - 0 | - 0 | - 0 | - 0 | - 0 | - 0 | - 0 | - 0 | $ - | |||||||||||||||||||||||||||||||||||||||||||||
| Adjusted SGampA | $ 39391 | $ 39861 | $ 41224 | $ 41732 | $ 42351 | $ 41995 | $ 41911 | $ 39544 | $ 40192 | $ 39163 | $ 42303 | $ 41839 | $ 40447 | $ 40085 | $ 43732 | $ 42266 | $ 42439 | $ 46222 | $ 165801 | |||||||||||||||||||||||||||||||||||||||||||||
| Annual Adjusted EBITDA of Sales | ERRORREF | ERRORREF | ||||||||||||||||||||||||||||||||||||||||||||||||||||||||||||||
| Q1 2013 | Q2 2013 | Q3 2013 | Q4 2013 | Q1 2014 | Q2 2014 | Q3 2014 | Q4 2014 | Q1 2015 | |||||||||||
| Selling Days | 63 | 64 | 64 | 61 | 63 | 64 | 64 | 61 | 63 | ||||||||||
| Net Sales | 67213 | 68317 | 68235 | 65738 | 69204 | 72080 | 74128 | 70281 | 69904 | ||||||||||
| Average Daily Sales | 1067 | 1067 | 1066 | 1078 | 1098 | 1126 | 1158 | 1152 | 1110 | ||||||||||
| Average Sales Rep Count | 762 | 764 | 774 | 794 | 819 | 854 | 882 | 908 | 911 | ||||||||||
| Sales per Sales Rep per Day | 1400 | 1397 | 1377 | 1358 | 1341 | 1319 | 1313 | 1269 | 1218 | ||||||||||
| Full Year | ||||||||||||||||||||||||||||||||||||||||||||||||||||||||||||||||||||
| ($ in thousands) | Q1 2011 | Q2 2011 | Q3 2011 | Q4 2011 | Q1 2012 | Q2 2012 | Q3 2012 | Q4 2012 | Q1 2013 | Q2 2013 | Q3 2013 | Q4 2013 | Q1 2014 | Q2 2014 | Q3 2014 | Q4 2014 | Q1 2015 | Q2 2015 | Q3 2015 | Q4 2015 | Q1 2016 | Q2 2016 | Q3 2016 | Q4 2016 | Q1 2017 | Q2 2017 | Q3 2017 | Q4 2017 | Q1 2018 | Q2 2018 | Q3 2018 | 2014 | 2015 | |||||||||||||||||||||||||||||||||||
| Net Sales | $ 79255 | $ 80625 | $ 71490 | $ 69029 | $ 71364 | $ 69830 | $ 67863 | $ 64505 | $ 67213 | $ 68317 | $ 68235 | $ 65738 | $ 69204 | $ 72080 | $ 74128 | $ 70281 | $ 69904 | $ 70726 | $ 70243 | $ 64961 | $ 69711 | $ 69348 | $ 70199 | $ 67315 | $ 74617 | $ 75006 | $ 75651 | $ 80633 | $ 84459 | $ 90382 | $ 88530 | $ 285693 | $ 275834 | |||||||||||||||||||||||||||||||||||
| Operating Income (Loss) | 3542 | 1397 | (3480) | (6995) | (3466) | (42084) | (1740) | 2057 | (3530) | (201) | 870 | (3002) | (4713) | 1241 | 678 | (2169) | (947) | 3243 | 2810 | (2985) | 1169 | 29 | 2389 | (5044) | 712 | 7891 | 1090 | 243 | 1837 | 5554 | (2266) | (4963) | 2121 | |||||||||||||||||||||||||||||||||||
| Depreciation amp Amortization | 1260 | 1315 | 1160 | 1675 | 1715 | 1566 | 1963 | 1841 | 2061 | 2244 | 2367 | 2358 | 2295 | 2163 | 2160 | 2133 | 2096 | 2126 | 2119 | 2202 | 2187 | 2226 | 1973 | 1680 | 1705 | 1644 | 1591 | 1830 | 1686 | 1679 | 1755 | 8751 | 8543 | |||||||||||||||||||||||||||||||||||
| EBITDA | 4802 | 2712 | (2320) | (5320) | (1751) | (40518) | 223 | 3898 | (1469) | 2043 | 3237 | (644) | (2418) | 3404 | 2838 | (36) | 1149 | 5369 | 4929 | (783) | 3356 | 2255 | 4362 | (3364) | 2417 | 9535 | 2681 | 2073 | 3523 | 7233 | (511) | 3788 | 10664 | |||||||||||||||||||||||||||||||||||
| Excluded Costs | ||||||||||||||||||||||||||||||||||||||||||||||||||||||||||||||||||||
| Severance | 745 | 465 | 282 | 122 | 185 | 6585 | 1410 | (159) | - 0 | 2 | 962 | (127) | 728 | 290 | (328) | (59) | 571 | 50 | 372 | 280 | 204 | 143 | 367 | 1662 | 465 | (9) | 139 | 144 | 628 | 64 | 31 | 631 | 1273 | |||||||||||||||||||||||||||||||||||
| Stock Based Compensation (Benefit) | 227 | (95) | (538) | 467 | 198 | (1015) | 77 | 434 | 1596 | 76 | 33 | 562 | 1125 | 408 | 2423 | 2443 | (541) | 971 | (30) | 1693 | (1217) | 515 | (630) | 3801 | (30) | 415 | 2337 | 384 | 970 | 87 | 7637 | 6399 | 2093 | |||||||||||||||||||||||||||||||||||
| Acquisition Related Costs | - 0 | - 0 | - 0 | - 0 | - 0 | - 0 | 310 | 32 | 115 | 198 | 178 | 120 | - 0 | - 0 | 286 | 425 | - 0 | - 0 | 168 | |||||||||||||||||||||||||||||||||||||||||||||||||
| ERP Implementation Costs | 1902 | 2388 | 2344 | 339 | - 0 | - 0 | - 0 | - 0 | - 0 | - 0 | - 0 | - 0 | - 0 | - 0 | - 0 | - 0 | - 0 | - 0 | - 0 | - 0 | - 0 | - 0 | - 0 | - 0 | - 0 | - 0 | - 0 | - 0 | - 0 | - 0 | - 0 | - 0 | ||||||||||||||||||||||||||||||||||||
| Loss(Gain) on Disposal of Property | - 0 | - 0 | - 0 | 22 | - 0 | (2122) | (11) | (1588) | - 0 | - 0 | (36) | 32 | - 0 | - 0 | 97 | 45 | - 0 | - 0 | (2) | 9 | - 0 | - 0 | - 0 | - 0 | - 0 | (5422) | - 0 | - 0 | - 0 | - 0 | - 0 | 142 | 7 | |||||||||||||||||||||||||||||||||||
| Legal Settlement | - 0 | - 0 | - 0 | - 0 | - 0 | - 0 | - 0 | - 0 | - 0 | - 0 | - 0 | - 0 | - 0 | - 0 | (688) | - 0 | - 0 | - 0 | - 0 | - 0 | - 0 | - 0 | - 0 | - 0 | - 0 | - 0 | - 0 | - 0 | - 0 | - 0 | - 0 | (688) | - 0 | |||||||||||||||||||||||||||||||||||
| Employment Tax Matter | - 0 | - 0 | - 0 | 1200 | - 0 | - 0 | - 0 | - 0 | - 0 | - 0 | - 0 | (400) | - 0 | - 0 | - 0 | - 0 | - 0 | - 0 | - 0 | - 0 | - 0 | - 0 | - 0 | - 0 | - 0 | - 0 | - 0 | - 0 | - 0 | - 0 | - 0 | - 0 | - 0 | |||||||||||||||||||||||||||||||||||
| Lease termination gain | - 0 | - 0 | - 0 | - 0 | - 0 | - 0 | - 0 | - 0 | - 0 | - 0 | - 0 | 2928 | - 0 | - 0 | - 0 | - 0 | - 0 | - 0 | - 0 | - 0 | - 0 | - 0 | - 0 | - 0 | - 0 | - 0 | - 0 | - 0 | - 0 | (164) | - 0 | - 0 | - 0 | |||||||||||||||||||||||||||||||||||
| Goodwill Impairment | - 0 | - 0 | - 0 | - 0 | - 0 | 28306 | - 0 | - 0 | - 0 | - 0 | - 0 | - 0 | - 0 | - 0 | - 0 | - 0 | - 0 | - 0 | - 0 | - 0 | - 0 | - 0 | - 0 | - 0 | - 0 | - 0 | - 0 | - 0 | - 0 | - 0 | - 0 | - 0 | - 0 | |||||||||||||||||||||||||||||||||||
| Inventory Rationalization | - 0 | - 0 | - 0 | - 0 | - 0 | 3893 | - 0 | - 0 | - 0 | - 0 | - 0 | - 0 | - 0 | - 0 | - 0 | - 0 | - 0 | - 0 | - 0 | - 0 | - 0 | - 0 | - 0 | - 0 | - 0 | - 0 | - 0 | - 0 | - 0 | - 0 | - 0 | - 0 | - 0 | |||||||||||||||||||||||||||||||||||
| Discontinued operation accrual | - 0 | - 0 | - 0 | - 0 | - 0 | - 0 | - 0 | - 0 | - 0 | - 0 | - 0 | - 0 | - 0 | - 0 | - 0 | 340 | - 0 | - 0 | - 0 | 931 | - 0 | - 0 | - 0 | - 0 | - 0 | - 0 | - 0 | - 0 | - 0 | 529 | - 0 | 340 | 931 | |||||||||||||||||||||||||||||||||||
| North American sales meeting | - 0 | - 0 | - 0 | - 0 | - 0 | - 0 | - 0 | - 0 | 1225 | - 0 | - 0 | - 0 | - 0 | - 0 | - 0 | - 0 | 1889 | - 0 | - 0 | - 0 | - 0 | - 0 | - 0 | - 0 | - 0 | - 0 | - 0 | - 0 | - 0 | - 0 | - 0 | - 0 | 1889 | |||||||||||||||||||||||||||||||||||
| Property Impairment Loss | - 0 | - 0 | - 0 | - 0 | - 0 | - 0 | - 0 | - 0 | - 0 | - 0 | - 0 | - 0 | 2914 | 132 | - 0 | - 0 | - 0 | - 0 | - 0 | - 0 | - 0 | - 0 | - 0 | - 0 | - 0 | - 0 | - 0 | - 0 | - 0 | - 0 | - 0 | 3046 | - 0 | |||||||||||||||||||||||||||||||||||
| Adjusted EBITDA | $ 7676 | $ 5470 | $ (232) | $ (3170) | $ (1368) | $ (4871) | $ 1699 | $ 2585 | $ 1352 | $ 2121 | $ 4196 | $ 2351 | $ 2349 | $ 4234 | $ 4342 | $ 2733 | $ 3068 | $ 6390 | $ 5579 | $ 2162 | $ 2458 | $ 3111 | $ 4277 | $ 2219 | $ 2852 | $ 4519 | $ 5443 | $ 3026 | $ 5121 | $ 7749 | $ 7325 | $ 13658 | $ 17199 | |||||||||||||||||||||||||||||||||||
| Adjusted EBITDA of Sales | 97 | 68 | -03 | -46 | -19 | -70 | 25 | 40 | 20 | 31 | 61 | 36 | 34 | 59 | 59 | 39 | 44 | 90 | 79 | 33 | 35 | 45 | 61 | 33 | 38 | 60 | 72 | 38 | 61 | 86 | 83 | 48 | 62 | |||||||||||||||||||||||||||||||||||
| Annual Adjusted EBITDA of Sales | 44 | 58 | ||||||||||||||||||||||||||||||||||||||||||||||||||||||||||||||||||
| Adjusted Operating Income | (3083) | (6437) | (264) | 744 | (709) | (123) | 1829 | (7) | 54 | 2071 | 2182 | 600 | 972 | 4264 | 3460 | (40) | 271 | 885 | 2304 | 539 | 1147 | 2875 | 3852 | 1196 | 3435 | 6070 | 5570 | - 0 | 4907 | 8314 | ||||||||||||||||||||||||||||||||||||||
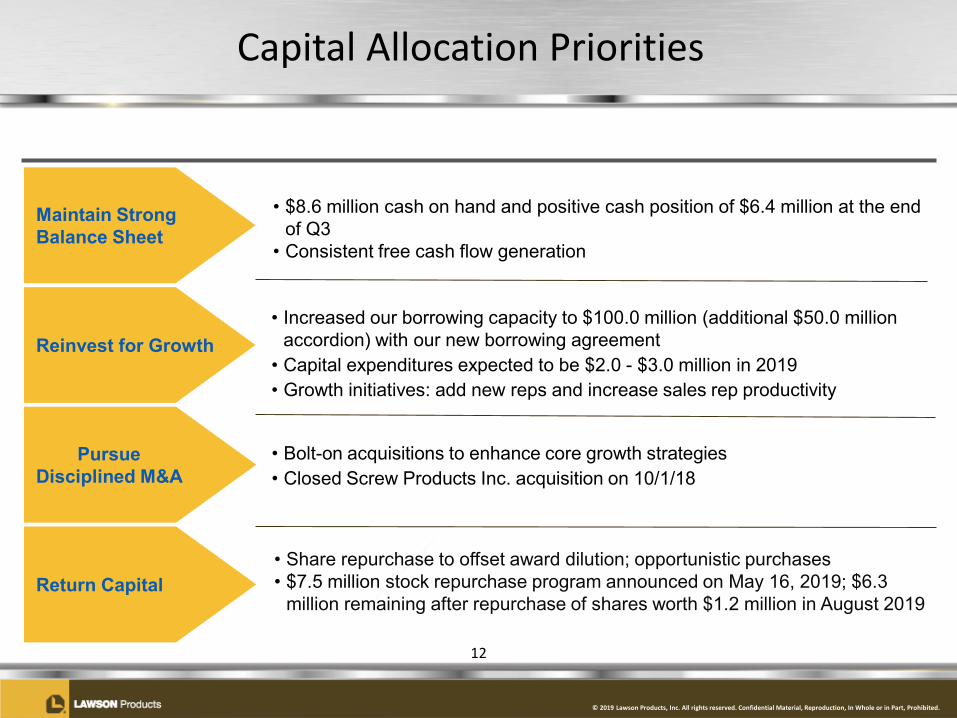
copy 2019 Lawson Products Inc All rights reserved Confidential Material Reproduction In Whole or in Part Prohibited
Financial Highlights for Third Quarter 2019
bull Sales increased 71 YOY (74 excluding currency fluctuation)
bull MRO LawsonKent gross margins consistent at 609
bull Adjusted Reg G EBITDA margin improving 109 in Q3 2019 v 83 in Q3 2018 Continued investment in new sales reps and rep productivity
bull Key trends MRO operating leverage of 54 13 increase in sales rep productivity Continued government strength +30 YOY Growth across multiple segments and product categories Cash flow from operations of $103 million in Q3
11
copy 2019 Lawson Products Inc All rights reserved Confidential Material Reproduction In Whole or in Part Prohibited
Pursue Disciplined MampA
Reinvest for Growth
Return Capital
bull Increased our borrowing capacity to $1000 million (additional $500 million accordion) with our new borrowing agreement
bull Capital expenditures expected to be $20 - $30 million in 2019bull Growth initiatives add new reps and increase sales rep productivity
bull Share repurchase to offset award dilution opportunistic purchasesbull $75 million stock repurchase program announced on May 16 2019 $63
million remaining after repurchase of shares worth $12 million in August 2019
bull Bolt-on acquisitions to enhance core growth strategiesbull Closed Screw Products Inc acquisition on 10118
Maintain Strong Balance Sheet
bull $86 million cash on hand and positive cash position of $64 million at the end of Q3
bull Consistent free cash flow generation
Capital Allocation Priorities
12
copy 2019 Lawson Products Inc All rights reserved Confidential Material Reproduction In Whole or in Part Prohibited
Lawson Products Poised for Growth
bull Leverage Current Infrastructure
bull Continued Sales Growth
bull Foundational Investments Completed
bull Operational Excellence
bull Large Fragmented Market
13
copy 2019 Lawson Products Inc All rights reserved Confidential Material Reproduction In Whole or in Part Prohibited
For More Information
Contact
Ronald J KnutsonEVP CFOInvestor Relations(773) 304-5665ronknutsonlawsonproductscom
And see our Website athttpwwwlawsonproductscomcompany-infoinvestor-relationsjsp
14
copy 2019 Lawson Products Inc All rights reserved Confidential Material Reproduction In Whole or in Part Prohibited
Appendices
15
copy 2019 Lawson Products Inc All rights reserved Confidential Material Reproduction In Whole or in Part Prohibited
Significant Activities
16
Appendix P-1
August 2011 Implemented SAPOctober 2011 Commenced construction of new McCook Ill distribution center
May 2012 Relocated corporate headquartersJune 2012 Restructured senior team Announced $20M cost savings plan
Transitioned packaging facility to McCook Ill distribution centerEntered into new five-year $40M credit facilityAnnounced new CEO and President Michael G DeCataConsolidated Vernon Hills distribution center into McCook Ill
November 2012 Rolled out new website to existing web customersDecember 2012 Completed transition of US independent agents to employees
April 2013 Roll-out of new website to new web customersAprilMay 2013 McCook DC begins to ship customer ordersNovember 2013 Entered into sub-lease of headquarters space to generate $29M of future cash savingsDecember 2013 Ended year with over 800 sales reps ndash First increase in 8 yearsFebruary 2014 Closed on Automatic Screw Machine Products sale for net proceeds of $121M
June 2014 Entered into sale-leaseback of Reno distribution facility for net proceeds of $83MDecember 2014 Ended year with over 900 sales repsFebruary 2015 Held North American sales meeting
September 2015 Completed West Coast Fasteners acquisitionMarch 2016 Completed Perfect Products of Michigan acquisitionMay 2016 Completed F B Feeney acquisitionJune 2016 Expanded sales team to over 1000 sales reps
September 2016 Extended credit facitlity to August 2020November 2016 Completed Mattic Industries acquisition
March 2017 Consolidated Fairfield NJ distribution operations into McCook Ill and Suwanee GAMay 2017 Sold Fairfield NJ distribution center for a gain of $54M
October 2017 Completed Bolt Supply House acquisitionApril 2018 Opened MRO distribution center in Calgary Canada
October 2018 Completed Screw Products acquisition and added Bolt Supply branchJune 2019 Achieved Q2 98 adjusted EBITDA net of ASC 842 impact of 03
September 2019 Achieved Q3 109 adjusted EBITDA hired VP MampAOctober 2019 Entered into new five-year $100M credit facility with additional $50 million accordion feature
August 2012
October 2012
Adjusted EBITDA $ in 000s
Adjusted EBITDA Q4 2016Q1 2017Q2 2017Q3 2017Q4 201722192852451954433026
Adjusted EBITDA of Sales
Adjusted EBITDA of SalesQ3 2016Q4 2016Q1 2017Q2 2017Q3 2017Q4 201760926793828971926E-232964421005719377E-23822185292895721E-260248513452257152E-271948817596594883E-237528059231332088E-2
Adjusted Operating Income of Sales
Adjusted Operating IncomeQ3 2016Q4 2016Q1 2017Q2 2017Q3 2017Q4 201723045391147287538521196
Adjusted Op Inc $ in 000s
Adjusted EBITDA Q4 2016Q1 2017Q2 2017Q3 2017Q4 20175391147287538521196
Net Sales by Quarter $ in 000s
Net SalesQ1 2013Q2 2013Q3 2013Q4 2013Q1 2014Q2 2014Q3 2014Q4 2014Q1 2015672136831768235657386920472080741287028169904
Adjusted SGampA $ in 000s
Adjusted SGampA Q4 2015Q1 2016Q2 2016Q3 2016Q4 2016Q1 2017Q2 2017Q3 2017Q4 2017391634230341839404474008543732422664243946222
copy 2019 Lawson Products Inc All rights reserved Confidential Material Reproduction In Whole or in Part Prohibited
Regulation G ndash GAAP ReconciliationAppendix P-2
Non GAAP Reconciliation of Adjusted EBITDA to Sales Percentage
The Company reports its financial results in accordance with US generally accepted accounting principles (GAAP) However the Companys management believesthat certain non-GAAP financial measures may provide users of this financial information additional meaningful comparisons between current results and results inprior operating periods Management believes that these non-GAAP financial measures can provide additional meaningful reflection of underlying trends of thebusiness because they provide a comparison of historical information that excludes certain non-operational non-recurring or intermittently recurring items thatimpact the overall comparability See the table below for supplemental financial data and corresponding reconciliations to GAAP financial measures for quarterlyadjusted EBITDA as a percentage of net sales Non-GAAP financial measures should be viewed in addition to and not as an alternative for the Companys reportedresults prepared in accordance with GAAP
17
($ in thousands) Q1 2017 Q2 2017 Q3 2017 Q4 2017 Q1 2018 Q2 2018 Q3 2018 Q4 2018 Q1 2019 Q2 2019 Q3 2019
Net Sales 74617$ 75006$ 75651$ 80633$ 84459$ 90382$ 88530$ 86266$ 91343$ 96097$ 94779$
Operating Income (Loss) 712 7891 1090 243 1837 5554 (2266) 4085 5544 1623 6446 Depreciation amp Amortization 1705 1644 1591 1830 1686 1679 1755 1735 1478 1455 1468 EBITDA 2417 9535 2681 2073 3523 7233 (511) 5820 7022 3078 7914
Excluded CostsSeverance 465 (9) 139 144 628 64 31 126 27 1485 30 Stock Based Compensation (Benefit) (30) 415 2337 384 970 87 7637 (1186) 408 4839 2374 Acquisition Related Costs - - 286 425 - - 168 62 - - - Loss(Gain) on Disposal of Property - (5422) - - - - - - - - - Lease termination gain - - - - - (164) - - - - - Discontinued operation accrual - - - - - 529 - - - - - Building Impairment - - - - - - - 231 - - - Reg G Adjusted EBITDA 2852$ 4519$ 5443$ 3026$ 5121$ 7749$ 7325$ 5053$ 7457$ 9402$ 10318$
Adjusted EBITDA of Sales 38 60 72 38 61 86 83 59 82 98 109
Customer Mix
Regional Accounts48
Kent Automotive16
Regional AccountsStrategicKent AutomotiveBolt SupplyGovernment Screw ProductsOther047014000000000000001016011010002
ampDampF ampA
Product Mix
Fastening Systems23
Specialty Chemicals12
Fastening SystemsFluid PowerSpecialy ChemicalsCutting Tools and AbrasivesElectricalAftermarket Automotive SuppliesSafetyWelding and Metal RepairOther02401501201301100800500201
Number Of Sales Reps
Tenure With Lawson (as of 63019)
Average Annual Sales
Consolidated Revenues
Consolidated Revenues20142015201620172018TTM 63019285693275834276573305907349637362236Net Cash(Debt)2014201520162017201843646420798409580-101271060-1908Rep Count201320142015201620172018436468069169371009983994982
Adjusted Reg G EBITDA
Adjusted EBITDA20142015201620172018TTM 63019136581719912065158402524829237
Quarterly Adjusted Reg G EBITDA
2017Q1Q2Q3Q428524519544330262018Q1Q2Q3Q451217749732550532019Q1Q2Q3Q474579402
Adjusted EBITDA $ in 000s
Reg G Adjusted EBITDA Q1 2017Q2 2017Q3 2017Q4 20172852451954433026
Adjusted EBITDA of Sales
Adjusted EBITDA of SalesQ1 2017Q2 2017Q3 2017Q4 20173822185292895721E-260248513452257152E-271948817596594883E-237528059231332088E-2
Adjusted Operating Income of Sales
Adjusted Operating IncomeQ1 2017Q2 2017Q3 2017Q4 2017
Adjusted Op Inc $ in 000s
Reg G Adjusted EBITDA Q1 2017Q2 2017Q3 2017Q4 2017
copy 2019 Lawson Products Inc All rights reserved Confidential Material Reproduction In Whole or in Part Prohibited
Consolidated Balance Sheet Appendix P-4
18
ASSETSCurrent assetsCash and cash equivalents $ 8626 $ 11883Restricted cash 800 800Accounts receivable less allowance for doubtful accounts of $614 and $549 respectively
45162 37682
Inventories net 54894 52887Miscellaneous receivables and prepaid expenses 4270 3653Total current assets 113752 106905
Property plant and equipment net 16932 23548Deferred income taxes 17372 20592Goodwill 20582 20079Cash value of life insurance 14440 12599Intangible assets net 12468 13112Lease assets 11917 mdashOther assets 275 307Total assets $ 207738 $ 197142
LIABILITIES AND STOCKHOLDERSrsquo EQUITYCurrent liabilitiesRevolving lines of credit $ 2195 $ 10823Accounts payable 16325 15207Lease obligation 3781 mdashAccrued expenses and other liabilities 37873 40179Total current liabilities 60174 66209
Security bonus plan 11969 12413Lease obligation 10360 5213Deferred compensation 5915 5304Deferred tax liability 2879 2761Other liabilities 3460 6069Total liabilities 94757 97969
Stockholdersrsquo equityPreferred stock $1 par valueAuthorized - 500000 shares Issued and outstanding mdash None mdash mdashCommon stock $1 par value
Authorized - 35000000 sharesIssued - 9042597 and 9005716 shares respectivelyOutstanding - 8956981 and 8955930 shares respectively
Capital in excess of par value 17626 15623Retained earnings 89502 77338Treasury stock ndash 85616 and 49786 shares respectivelyAccumulated other comprehensive lossTotal stockholdersrsquo equity 112981 99173Total liabilities and stockholdersrsquo equity $ 207738 $ 197142
September 30 December 312019 2018
(Unaudited)
(2595) (1234)(595) (1560)
9043 9006
Customer Mix
Regional Accounts48
Kent Automotive16
Regional AccountsStrategicKent AutomotiveBolt SupplyGovernment Screw ProductsOther0470140000000000000010150110110002
ampDampF ampA
Product Mix
Fastening Systems23
Specialty Chemicals12
Fastening SystemsFluid PowerSpecialy ChemicalsCutting Tools and AbrasivesElectricalAftermarket Automotive SuppliesSafetyWelding and Metal RepairOther02401501201301100800500201
Number Of Sales Reps
Tenure With Lawson (as of 63019)
Average Annual Sales
Consolidated Revenues
Consolidated Revenues20142015201620172018TTM 93019285693275834276573305907349637368485Net Cash(Debt)2014201520162017201843738420798409580-1012710606431Rep Count201320142015201620172018437388069169371009983994993
Adjusted Reg G EBITDA
Adjusted EBITDA20142015201620172018TTM 93019136581719912065158402524832230
Quarterly Adjusted Reg G EBITDA
2017Q1Q2Q3Q428524519544330262018Q1Q2Q3Q451217749732550532019Q1Q2Q3Q47457940210318
Adjusted EBITDA $ in 000s
Reg G Adjusted EBITDA Q1 2017Q2 2017Q3 2017Q4 20172852451954433026
Adjusted EBITDA of Sales
Adjusted EBITDA of SalesQ1 2017Q2 2017Q3 2017Q4 20173822185292895721E-260248513452257152E-271948817596594883E-237528059231332088E-2
Adjusted Operating Income of Sales
Adjusted Operating IncomeQ1 2017Q2 2017Q3 2017Q4 2017
Adjusted Op Inc $ in 000s
Reg G Adjusted EBITDA Q1 2017Q2 2017Q3 2017Q4 2017
| September 30 | December 31 | ||||||||||
| 2019 | 2018 | ||||||||||
| ASSETS | (Unaudited) | ||||||||||
| Current assets | |||||||||||
| Cash and cash equivalents | $ | 8626 | $ | 11883 | |||||||
| Restricted cash | 800 | 800 | |||||||||
| Accounts receivable less allowance for doubtful accounts of $614 and $549 respectively | 45162 | 37682 | |||||||||
| Inventories net | 54894 | 52887 | |||||||||
| Miscellaneous receivables and prepaid expenses | 4270 | 3653 | |||||||||
| Total current assets | 113752 | 106905 | |||||||||
| Property plant and equipment net | 16932 | 23548 | |||||||||
| Deferred income taxes | 17372 | 20592 | |||||||||
| Goodwill | 20582 | 20079 | |||||||||
| Cash value of life insurance | 14440 | 12599 | |||||||||
| Intangible assets net | 12468 | 13112 | |||||||||
| Lease assets | 11917 | mdash | |||||||||
| Other assets | 275 | 307 | |||||||||
| Total assets | $ | 207738 | $ | 197142 | |||||||
| LIABILITIES AND STOCKHOLDERSrsquo EQUITY | |||||||||||
| Current liabilities | |||||||||||
| Revolving lines of credit | $ | 2195 | $ | 10823 | |||||||
| Accounts payable | 16325 | 15207 | |||||||||
| Lease obligation | 3781 | mdash | |||||||||
| Accrued expenses and other liabilities | 37873 | 40179 | |||||||||
| Total current liabilities | 60174 | 66209 | |||||||||
| Security bonus plan | 11969 | 12413 | |||||||||
| Lease obligation | 10360 | 5213 | |||||||||
| Deferred compensation | 5915 | 5304 | |||||||||
| Deferred tax liability | 2879 | 2761 | |||||||||
| Other liabilities | 3460 | 6069 | |||||||||
| Total liabilities | 94757 | 97969 | |||||||||
| Stockholdersrsquo equity | |||||||||||
| Preferred stock $1 par value | |||||||||||
| Authorized - 500000 shares Issued and outstanding mdash None | mdash | mdash | |||||||||
| Common stock $1 par value | |||||||||||
| Authorized - 35000000 shares | 9043 | 9006 | |||||||||
| Issued - 9042597 and 9005716 shares respectively | |||||||||||
| Outstanding - 8956981 and 8955930 shares respectively | |||||||||||
| Capital in excess of par value | 17626 | 15623 | |||||||||
| Retained earnings | 89502 | 77338 | |||||||||
| Treasury stock ndash 85616 and 49786 shares respectively | (2595) | (1234) | |||||||||
| Accumulated other comprehensive loss | (595) | (1560) | |||||||||
| Total stockholdersrsquo equity | 112981 | 99173 | |||||||||
| Total liabilities and stockholdersrsquo equity | $ | 207738 | $ | 197142 | |||||||
| Three Months Ended | |||||||||||||||||||||||||||||
| Jun 30 2019 | Mar 31 2019 | Dec 31 2018 | Sep 30 2018 | Jun 30 2018 | |||||||||||||||||||||||||
| Average daily net sales | $ | 1502 | $ | 1450 | $ | 1414 | $ | 1405 | $ | 1412 | |||||||||||||||||||
| Year over year increase | 63 | 82 | 70 | 170 | 205 | ||||||||||||||||||||||||
| Sequential quarter increase (decrease) | 36 | 25 | 06 | (05) | 53 | ||||||||||||||||||||||||
| Net Sales | $ | 96097 | $ | 91343 | $ | 86266 | $ | 88530 | $ | 90382 | |||||||||||||||||||
| Gross profit (1) | 51043 | 48923 | 46083 | 48108 | 49131 | ||||||||||||||||||||||||
| Gross profit percentage (1) | 531 | 536 | 534 | 543 | 544 | ||||||||||||||||||||||||
| Selling general amp administrative expenses | $ | 49420 | $ | 43379 | $ | 41998 | $ | 50374 | $ | 43577 | |||||||||||||||||||
| Operating income (loss) | $ | 1623 | $ | 5544 | $ | 4085 | $ | (2266) | $ | 5554 | |||||||||||||||||||
| Full Year | |||||||||||||||||||||||||||||||||||||||||||||||||||||||||||||||||||||||||||
| ($ in thousands) | Q1 2011 | Q2 2011 | Q3 2011 | Q4 2011 | Q1 2012 | Q2 2012 | Q3 2012 | Q4 2012 | Q1 2013 | Q2 2013 | Q3 2013 | Q4 2013 | Q1 2014 | Q2 2014 | Q3 2014 | Q4 2014 | Q1 2015 | Q2 2015 | Q3 2015 | Q4 2015 | Q1 2016 | Q2 2016 | Q3 2016 | Q4 2016 | Q1 2017 | Q2 2017 | Q3 2017 | Q4 2017 | Q1 2018 | Q2 2018 | Q3 2018 | Q4 2018 | Q1 2019 | Q2 2019 | Q3 2019 | 2014 | 2015 | ||||||||||||||||||||||||||||||||||||||
| Net Sales | $ 79255 | $ 80625 | $ 71490 | $ 69029 | $ 71364 | $ 69830 | $ 67863 | $ 64505 | $ 67213 | $ 68317 | $ 68235 | $ 65738 | $ 69204 | $ 72080 | $ 74128 | $ 70281 | $ 69904 | $ 70726 | $ 70243 | $ 64961 | $ 69711 | $ 69348 | $ 70199 | $ 67315 | $ 74617 | $ 75006 | $ 75651 | $ 80633 | $ 84459 | $ 90382 | $ 88530 | $ 86266 | $ 91343 | $ 96097 | $ 94779 | $ 285693 | $ 275834 | ||||||||||||||||||||||||||||||||||||||
| Operating Income (Loss) | 3542 | 1397 | (3480) | (6995) | (3466) | (42084) | (1740) | 2057 | (3530) | (201) | 870 | (3002) | (4713) | 1241 | 678 | (2169) | (947) | 3243 | 2810 | (2985) | 1169 | 29 | 2389 | (5044) | 712 | 7891 | 1090 | 243 | 1837 | 5554 | (2266) | 4085 | 5544 | 1623 | 6446 | (4963) | 2121 | ||||||||||||||||||||||||||||||||||||||
| Depreciation amp Amortization | 1260 | 1315 | 1160 | 1675 | 1715 | 1566 | 1963 | 1841 | 2061 | 2244 | 2367 | 2358 | 2295 | 2163 | 2160 | 2133 | 2096 | 2126 | 2119 | 2202 | 2187 | 2226 | 1973 | 1680 | 1705 | 1644 | 1591 | 1830 | 1686 | 1679 | 1755 | 1735 | 1478 | 1455 | 1468 | 8751 | 8543 | ||||||||||||||||||||||||||||||||||||||
| EBITDA | 4802 | 2712 | (2320) | (5320) | (1751) | (40518) | 223 | 3898 | (1469) | 2043 | 3237 | (644) | (2418) | 3404 | 2838 | (36) | 1149 | 5369 | 4929 | (783) | 3356 | 2255 | 4362 | (3364) | 2417 | 9535 | 2681 | 2073 | 3523 | 7233 | (511) | 5820 | 7022 | 3078 | 7914 | 3788 | 10664 | ||||||||||||||||||||||||||||||||||||||
| Excluded Costs | |||||||||||||||||||||||||||||||||||||||||||||||||||||||||||||||||||||||||||
| Severance | 745 | 465 | 282 | 122 | 185 | 6585 | 1410 | (159) | - 0 | 2 | 962 | (127) | 728 | 290 | (328) | (59) | 571 | 50 | 372 | 280 | 204 | 143 | 367 | 1662 | 465 | (9) | 139 | 144 | 628 | 64 | 31 | 126 | 27 | 1485 | 30 | 631 | 1273 | ||||||||||||||||||||||||||||||||||||||
| Stock Based Compensation (Benefit) | 227 | (95) | (538) | 467 | 198 | (1015) | 77 | 434 | 1596 | 76 | 33 | 562 | 1125 | 408 | 2423 | 2443 | (541) | 971 | (30) | 1693 | (1217) | 515 | (630) | 3801 | (30) | 415 | 2337 | 384 | 970 | 87 | 7637 | (1186) | 408 | 4839 | 2374 | 6399 | 2093 | ||||||||||||||||||||||||||||||||||||||
| Acquisition Related Costs | - 0 | - 0 | - 0 | - 0 | - 0 | - 0 | 310 | 32 | 115 | 198 | 178 | 120 | - 0 | - 0 | 286 | 425 | - 0 | - 0 | 168 | 62 | - 0 | - 0 | - 0 | ||||||||||||||||||||||||||||||||||||||||||||||||||||
| ERP Implementation Costs | 1902 | 2388 | 2344 | 339 | - 0 | - 0 | - 0 | - 0 | - 0 | - 0 | - 0 | - 0 | - 0 | - 0 | - 0 | - 0 | - 0 | - 0 | - 0 | - 0 | - 0 | - 0 | - 0 | - 0 | - 0 | - 0 | - 0 | - 0 | - 0 | - 0 | - 0 | - 0 | - 0 | ||||||||||||||||||||||||||||||||||||||||||
| Loss(Gain) on Disposal of Property | - 0 | - 0 | - 0 | 22 | - 0 | (2122) | (11) | (1588) | - 0 | - 0 | (36) | 32 | - 0 | - 0 | 97 | 45 | - 0 | - 0 | (2) | 9 | - 0 | - 0 | - 0 | - 0 | - 0 | (5422) | - 0 | - 0 | - 0 | - 0 | - 0 | - 0 | - 0 | - 0 | - 0 | 142 | 7 | ||||||||||||||||||||||||||||||||||||||
| Legal Settlement | - 0 | - 0 | - 0 | - 0 | - 0 | - 0 | - 0 | - 0 | - 0 | - 0 | - 0 | - 0 | - 0 | - 0 | (688) | - 0 | - 0 | - 0 | - 0 | - 0 | - 0 | - 0 | - 0 | - 0 | - 0 | - 0 | - 0 | - 0 | - 0 | - 0 | - 0 | - 0 | (688) | - 0 | |||||||||||||||||||||||||||||||||||||||||
| Employment Tax Matter | - 0 | - 0 | - 0 | 1200 | - 0 | - 0 | - 0 | - 0 | - 0 | - 0 | - 0 | (400) | - 0 | - 0 | - 0 | - 0 | - 0 | - 0 | - 0 | - 0 | - 0 | - 0 | - 0 | - 0 | - 0 | - 0 | - 0 | - 0 | - 0 | - 0 | - 0 | - 0 | - 0 | - 0 | |||||||||||||||||||||||||||||||||||||||||
| Lease termination gain | - 0 | - 0 | - 0 | - 0 | - 0 | - 0 | - 0 | - 0 | - 0 | - 0 | - 0 | 2928 | - 0 | - 0 | - 0 | - 0 | - 0 | - 0 | - 0 | - 0 | - 0 | - 0 | - 0 | - 0 | - 0 | - 0 | - 0 | - 0 | - 0 | (164) | - 0 | - 0 | - 0 | - 0 | - 0 | - 0 | - 0 | ||||||||||||||||||||||||||||||||||||||
| Goodwill Impairment | - 0 | - 0 | - 0 | - 0 | - 0 | 28306 | - 0 | - 0 | - 0 | - 0 | - 0 | - 0 | - 0 | - 0 | - 0 | - 0 | - 0 | - 0 | - 0 | - 0 | - 0 | - 0 | - 0 | - 0 | - 0 | - 0 | - 0 | - 0 | - 0 | - 0 | - 0 | - 0 | - 0 | - 0 | |||||||||||||||||||||||||||||||||||||||||
| Inventory Rationalization | - 0 | - 0 | - 0 | - 0 | - 0 | 3893 | - 0 | - 0 | - 0 | - 0 | - 0 | - 0 | - 0 | - 0 | - 0 | - 0 | - 0 | - 0 | - 0 | - 0 | - 0 | - 0 | - 0 | - 0 | - 0 | - 0 | - 0 | - 0 | - 0 | - 0 | - 0 | - 0 | - 0 | - 0 | |||||||||||||||||||||||||||||||||||||||||
| Discontinued operation accrual | - 0 | - 0 | - 0 | - 0 | - 0 | - 0 | - 0 | - 0 | - 0 | - 0 | - 0 | - 0 | - 0 | - 0 | - 0 | 340 | - 0 | - 0 | - 0 | 931 | - 0 | - 0 | - 0 | - 0 | - 0 | - 0 | - 0 | - 0 | - 0 | 529 | - 0 | - 0 | - 0 | - 0 | - 0 | 340 | 931 | ||||||||||||||||||||||||||||||||||||||
| North American sales meeting | - 0 | - 0 | - 0 | - 0 | - 0 | - 0 | - 0 | - 0 | 1225 | - 0 | - 0 | - 0 | - 0 | - 0 | - 0 | - 0 | 1889 | - 0 | - 0 | - 0 | - 0 | - 0 | - 0 | - 0 | - 0 | - 0 | - 0 | - 0 | - 0 | - 0 | - 0 | - 0 | - 0 | 1889 | |||||||||||||||||||||||||||||||||||||||||
| Property Impairment Loss | - 0 | - 0 | - 0 | - 0 | - 0 | - 0 | - 0 | - 0 | - 0 | - 0 | - 0 | - 0 | 2914 | 132 | - 0 | - 0 | - 0 | - 0 | - 0 | - 0 | - 0 | - 0 | - 0 | - 0 | - 0 | - 0 | - 0 | - 0 | - 0 | - 0 | - 0 | - 0 | 3046 | - 0 | |||||||||||||||||||||||||||||||||||||||||
| Building Impairment | - 0 | - 0 | - 0 | - 0 | - 0 | - 0 | - 0 | 231 | - 0 | - 0 | - 0 | ||||||||||||||||||||||||||||||||||||||||||||||||||||||||||||||||
| Reg G Adjusted EBITDA | $ 7676 | $ 5470 | $ (232) | $ (3170) | $ (1368) | $ (4871) | $ 1699 | $ 2585 | $ 1352 | $ 2121 | $ 4196 | $ 2351 | $ 2349 | $ 4234 | $ 4342 | $ 2733 | $ 3068 | $ 6390 | $ 5579 | $ 2162 | $ 2458 | $ 3111 | $ 4277 | $ 2219 | $ 2852 | $ 4519 | $ 5443 | $ 3026 | $ 5121 | $ 7749 | $ 7325 | $ 5053 | $ 7457 | $ 9402 | $ 10318 | $ 13658 | $ 17199 | ||||||||||||||||||||||||||||||||||||||
| Adjusted EBITDA of Sales | 97 | 68 | -03 | -46 | -19 | -70 | 25 | 40 | 20 | 31 | 61 | 36 | 34 | 59 | 59 | 39 | 44 | 90 | 79 | 33 | 35 | 45 | 61 | 33 | 38 | 60 | 72 | 38 | 61 | 86 | 83 | 59 | 82 | 98 | 109 | 48 | 62 | ||||||||||||||||||||||||||||||||||||||
| Annual Adjusted EBITDA of Sales | 44 | 58 | |||||||||||||||||||||||||||||||||||||||||||||||||||||||||||||||||||||||||
| Adjusted Operating Income | (3083) | (6437) | (264) | 744 | (709) | (123) | 1829 | (7) | 54 | 2071 | 2182 | 600 | 972 | 4264 | 3460 | (40) | 271 | 885 | 2304 | 539 | 1147 | 2875 | 3852 | 1196 | 3435 | 6070 | 5570 | 3087 | 5979 | 7947 | 8850 | 4907 | 8314 | ||||||||||||||||||||||||||||||||||||||||||
| Consolidated Revenues | |||||||
| 2013 | 269503 | ||||||
| 2014 | 285693 | ||||||
| 2015 | 275834 | ||||||
| 2016 | 276573 | ||||||
| 2017 | 305907 | ||||||
| 2018 | 349637 | ||||||
| TTM 93019 | 368485 | ||||||
| Net Cash(Debt) | |||||||
| 2013 | (15380) | ||||||
| 2014 | 4207 | ||||||
| 2015 | 9840 | ||||||
| 2016 | 9580 | ||||||
| 2017 | (10127) | ||||||
| 2018 | 1060 | ||||||
| 93019 | 6431 | ||||||
| Rep Count | |||||||
| 2013 | 806 | ||||||
| 2014 | 916 | ||||||
| 2015 | 937 | ||||||
| 2016 | 1009 | ||||||
| 2017 | 983 | ||||||
| 2018 | 994 | ||||||
| 93019 | 993 | ||||||
| Adjusted OI | DampA | Adjusted EBITDA | |||||
| 2013 | 990 | 9030 | 10020 | ||||
| 2014 | 4907 | 8751 | 13658 | ||||
| 2015 | 8315 | 8543 | 17199 | ||||
| 2016 | 3388 | 8066 | 12065 | ||||
| 2017 | 15840 | ||||||
| 2018 | 25248 | ||||||
| TTM 93019 | 32230 | ||||||
| Reg G EBITDA By Quarter | |||||||
| Quarter | 2017 | 2018 | 2019 | ||||
| Q1 | 2852 | 5121 | 7457 | ||||
| Q2 | 4519 | 7749 | 9402 | ||||
| Q3 | 5443 | 7325 | 10318 | ||||
| Q4 | 3026 | 5053 |
| Months of Experience | Average Annual Sales | Number of Reps | |||
| lt 12 Mos | ERRORVALUE | ERRORVALUE | |||
| 1 - 2 Yrs | ERRORVALUE | ERRORVALUE | |||
| 3 - 5 Yrs | ERRORVALUE | ERRORVALUE | |||
| 5 - 10 Yrs | ERRORVALUE | ERRORVALUE | |||
| gt 10 Yrs | ERRORVALUE | ERRORVALUE | |||
| ERRORVALUE | |||||
| Excludes ISR MSS CRS | |||||
| Excludes Freight | |||||
| Product mix | ||||||||
| Verticals | Q3 2019 Sales | |||||||
| Fastening Systems | 240 | 22485606 | ||||||
| Fluid Power | 151 | 14156064 | ||||||
| Specialy Chemicals | 117 | 10917433 | ||||||
| Cutting Tools and Abrasives | 131 | 12296596 | ||||||
| Electrical | 104 | 9724849 | ||||||
| Aftermarket Automotive Supplies | 76 | 7154688 | ||||||
| Safety | 47 | 4445846 | ||||||
| Welding and Metal Repair | 13 | 1218030 | ||||||
| Other | 120 | 11237322 | ||||||
| Total | 100 | 93636434 | ||||||
| Verticals | YTD 2019 Sales | |||||||
| Fastening Systems | 24 | 66611555 | ||||||
| Fluid Power | 15 | 42224416 | ||||||
| Specialy Chemicals | 12 | 32166853 | ||||||
| Cutting Tools and Abrasives | 13 | 36587482 | ||||||
| Electrical | 11 | 30150144 | ||||||
| Aftermarket Automotive Supplies | 8 | 21960561 | ||||||
| Safety | 5 | 13072228 | ||||||
| Welding and Metal Repair | 2 | 4306548 | ||||||
| Other | 10 | 31279779 | ||||||
| Total | 100 | 278359566 |
| Lawson core customer mix | ||||||||
| Account Tyoe | Q3 | |||||||
| Regional Accounts | 43045893 | 45 | ||||||
| Strategic | 14086813 | 15 | ||||||
| Kent Automotive | 14300065 | 15 | ||||||
| Bolt Supply | 11318703 | 12 | ||||||
| Government | 10291732 | 11 | ||||||
| Screw Products | 0 | 0 | ||||||
| Other (1) | 1735236 | 2 | ||||||
| Total | 94778443 | 100 | ||||||
| Account Tyoe | YTD September | |||||||
| Regional Accounts | 131389537 | 47 | ||||||
| Strategic | 40364305 | 14 | ||||||
| Kent Automotive | 43371411 | 15 | ||||||
| Bolt Supply | 31324209 | 11 | ||||||
| Government | 29794959 | 11 | ||||||
| Screw Products | 0 | 0 | ||||||
| Other | 5974302 | 2 | ||||||
| Total | 282218723 | 100 | ||||||
| Total Reported |
| September 30 | December 31 | ||||||||||
| 2019 | 2018 | ||||||||||
| ASSETS | (Unaudited) | ||||||||||
| Current assets | |||||||||||
| Cash and cash equivalents | $ | 8626 | $ | 11883 | |||||||
| Restricted cash | 800 | 800 | |||||||||
| Accounts receivable less allowance for doubtful accounts of $614 and $549 respectively | 45162 | 37682 | |||||||||
| Inventories net | 54894 | 52887 | |||||||||
| Miscellaneous receivables and prepaid expenses | 4270 | 3653 | |||||||||
| Total current assets | 113752 | 106905 | |||||||||
| Property plant and equipment net | 16932 | 23548 | |||||||||
| Deferred income taxes | 17372 | 20592 | |||||||||
| Goodwill | 20582 | 20079 | |||||||||
| Cash value of life insurance | 14440 | 12599 | |||||||||
| Intangible assets net | 12468 | 13112 | |||||||||
| Lease assets | 11917 | mdash | |||||||||
| Other assets | 275 | 307 | |||||||||
| Total assets | $ | 207738 | $ | 197142 | |||||||
| LIABILITIES AND STOCKHOLDERSrsquo EQUITY | |||||||||||
| Current liabilities | |||||||||||
| Revolving lines of credit | $ | 2195 | $ | 10823 | |||||||
| Accounts payable | 16325 | 15207 | |||||||||
| Lease obligation | 3781 | mdash | |||||||||
| Accrued expenses and other liabilities | 37873 | 40179 | |||||||||
| Total current liabilities | 60174 | 66209 | |||||||||
| Security bonus plan | 11969 | 12413 | |||||||||
| Lease obligation | 10360 | 5213 | |||||||||
| Deferred compensation | 5915 | 5304 | |||||||||
| Deferred tax liability | 2879 | 2761 | |||||||||
| Other liabilities | 3460 | 6069 | |||||||||
| Total liabilities | 94757 | 97969 | |||||||||
| Stockholdersrsquo equity | |||||||||||
| Preferred stock $1 par value | |||||||||||
| Authorized - 500000 shares Issued and outstanding mdash None | mdash | mdash | |||||||||
| Common stock $1 par value | |||||||||||
| Authorized - 35000000 shares | 9043 | 9006 | |||||||||
| Issued - 9042597 and 9005716 shares respectively | |||||||||||
| Outstanding - 8956981 and 8955930 shares respectively | |||||||||||
| Capital in excess of par value | 17626 | 15623 | |||||||||
| Retained earnings | 89502 | 77338 | |||||||||
| Treasury stock ndash 85616 and 49786 shares respectively | (2595) | (1234) | |||||||||
| Accumulated other comprehensive loss | (595) | (1560) | |||||||||
| Total stockholdersrsquo equity | 112981 | 99173 | |||||||||
| Total liabilities and stockholdersrsquo equity | $ | 207738 | $ | 197142 | |||||||
| Three Months Ended | |||||||||||||||||||||||||||||
| Jun 30 2019 | Mar 31 2019 | Dec 31 2018 | Sep 30 2018 | Jun 30 2018 | |||||||||||||||||||||||||
| Average daily net sales | $ | 1502 | $ | 1450 | $ | 1414 | $ | 1405 | $ | 1412 | |||||||||||||||||||
| Year over year increase | 63 | 82 | 70 | 170 | 205 | ||||||||||||||||||||||||
| Sequential quarter increase (decrease) | 36 | 25 | 06 | (05) | 53 | ||||||||||||||||||||||||
| Net Sales | $ | 96097 | $ | 91343 | $ | 86266 | $ | 88530 | $ | 90382 | |||||||||||||||||||
| Gross profit (1) | 51043 | 48923 | 46083 | 48108 | 49131 | ||||||||||||||||||||||||
| Gross profit percentage (1) | 531 | 536 | 534 | 543 | 544 | ||||||||||||||||||||||||
| Selling general amp administrative expenses | $ | 49420 | $ | 43379 | $ | 41998 | $ | 50374 | $ | 43577 | |||||||||||||||||||
| Operating income (loss) | $ | 1623 | $ | 5544 | $ | 4085 | $ | (2266) | $ | 5554 | |||||||||||||||||||
| Full Year | |||||||||||||||||||||||||||||||||||||||||||||||||||||||||||||||||||||||||||
| ($ in thousands) | Q1 2011 | Q2 2011 | Q3 2011 | Q4 2011 | Q1 2012 | Q2 2012 | Q3 2012 | Q4 2012 | Q1 2013 | Q2 2013 | Q3 2013 | Q4 2013 | Q1 2014 | Q2 2014 | Q3 2014 | Q4 2014 | Q1 2015 | Q2 2015 | Q3 2015 | Q4 2015 | Q1 2016 | Q2 2016 | Q3 2016 | Q4 2016 | Q1 2017 | Q2 2017 | Q3 2017 | Q4 2017 | Q1 2018 | Q2 2018 | Q3 2018 | Q4 2018 | Q1 2019 | Q2 2019 | Q3 2019 | 2014 | 2015 | ||||||||||||||||||||||||||||||||||||||
| Net Sales | $ 79255 | $ 80625 | $ 71490 | $ 69029 | $ 71364 | $ 69830 | $ 67863 | $ 64505 | $ 67213 | $ 68317 | $ 68235 | $ 65738 | $ 69204 | $ 72080 | $ 74128 | $ 70281 | $ 69904 | $ 70726 | $ 70243 | $ 64961 | $ 69711 | $ 69348 | $ 70199 | $ 67315 | $ 74617 | $ 75006 | $ 75651 | $ 80633 | $ 84459 | $ 90382 | $ 88530 | $ 86266 | $ 91343 | $ 96097 | $ 94779 | $ 285693 | $ 275834 | ||||||||||||||||||||||||||||||||||||||
| Operating Income (Loss) | 3542 | 1397 | (3480) | (6995) | (3466) | (42084) | (1740) | 2057 | (3530) | (201) | 870 | (3002) | (4713) | 1241 | 678 | (2169) | (947) | 3243 | 2810 | (2985) | 1169 | 29 | 2389 | (5044) | 712 | 7891 | 1090 | 243 | 1837 | 5554 | (2266) | 4085 | 5544 | 1623 | 6446 | (4963) | 2121 | ||||||||||||||||||||||||||||||||||||||
| Depreciation amp Amortization | 1260 | 1315 | 1160 | 1675 | 1715 | 1566 | 1963 | 1841 | 2061 | 2244 | 2367 | 2358 | 2295 | 2163 | 2160 | 2133 | 2096 | 2126 | 2119 | 2202 | 2187 | 2226 | 1973 | 1680 | 1705 | 1644 | 1591 | 1830 | 1686 | 1679 | 1755 | 1735 | 1478 | 1455 | 1468 | 8751 | 8543 | ||||||||||||||||||||||||||||||||||||||
| EBITDA | 4802 | 2712 | (2320) | (5320) | (1751) | (40518) | 223 | 3898 | (1469) | 2043 | 3237 | (644) | (2418) | 3404 | 2838 | (36) | 1149 | 5369 | 4929 | (783) | 3356 | 2255 | 4362 | (3364) | 2417 | 9535 | 2681 | 2073 | 3523 | 7233 | (511) | 5820 | 7022 | 3078 | 7914 | 3788 | 10664 | ||||||||||||||||||||||||||||||||||||||
| Excluded Costs | |||||||||||||||||||||||||||||||||||||||||||||||||||||||||||||||||||||||||||
| Severance | 745 | 465 | 282 | 122 | 185 | 6585 | 1410 | (159) | - 0 | 2 | 962 | (127) | 728 | 290 | (328) | (59) | 571 | 50 | 372 | 280 | 204 | 143 | 367 | 1662 | 465 | (9) | 139 | 144 | 628 | 64 | 31 | 126 | 27 | 1485 | 30 | 631 | 1273 | ||||||||||||||||||||||||||||||||||||||
| Stock Based Compensation (Benefit) | 227 | (95) | (538) | 467 | 198 | (1015) | 77 | 434 | 1596 | 76 | 33 | 562 | 1125 | 408 | 2423 | 2443 | (541) | 971 | (30) | 1693 | (1217) | 515 | (630) | 3801 | (30) | 415 | 2337 | 384 | 970 | 87 | 7637 | (1186) | 408 | 4839 | 2374 | 6399 | 2093 | ||||||||||||||||||||||||||||||||||||||
| Acquisition Related Costs | - 0 | - 0 | - 0 | - 0 | - 0 | - 0 | 310 | 32 | 115 | 198 | 178 | 120 | - 0 | - 0 | 286 | 425 | - 0 | - 0 | 168 | 62 | - 0 | - 0 | - 0 | ||||||||||||||||||||||||||||||||||||||||||||||||||||
| ERP Implementation Costs | 1902 | 2388 | 2344 | 339 | - 0 | - 0 | - 0 | - 0 | - 0 | - 0 | - 0 | - 0 | - 0 | - 0 | - 0 | - 0 | - 0 | - 0 | - 0 | - 0 | - 0 | - 0 | - 0 | - 0 | - 0 | - 0 | - 0 | - 0 | - 0 | - 0 | - 0 | - 0 | - 0 | ||||||||||||||||||||||||||||||||||||||||||
| Loss(Gain) on Disposal of Property | - 0 | - 0 | - 0 | 22 | - 0 | (2122) | (11) | (1588) | - 0 | - 0 | (36) | 32 | - 0 | - 0 | 97 | 45 | - 0 | - 0 | (2) | 9 | - 0 | - 0 | - 0 | - 0 | - 0 | (5422) | - 0 | - 0 | - 0 | - 0 | - 0 | - 0 | - 0 | - 0 | - 0 | 142 | 7 | ||||||||||||||||||||||||||||||||||||||
| Legal Settlement | - 0 | - 0 | - 0 | - 0 | - 0 | - 0 | - 0 | - 0 | - 0 | - 0 | - 0 | - 0 | - 0 | - 0 | (688) | - 0 | - 0 | - 0 | - 0 | - 0 | - 0 | - 0 | - 0 | - 0 | - 0 | - 0 | - 0 | - 0 | - 0 | - 0 | - 0 | - 0 | (688) | - 0 | |||||||||||||||||||||||||||||||||||||||||
| Employment Tax Matter | - 0 | - 0 | - 0 | 1200 | - 0 | - 0 | - 0 | - 0 | - 0 | - 0 | - 0 | (400) | - 0 | - 0 | - 0 | - 0 | - 0 | - 0 | - 0 | - 0 | - 0 | - 0 | - 0 | - 0 | - 0 | - 0 | - 0 | - 0 | - 0 | - 0 | - 0 | - 0 | - 0 | - 0 | |||||||||||||||||||||||||||||||||||||||||
| Lease termination gain | - 0 | - 0 | - 0 | - 0 | - 0 | - 0 | - 0 | - 0 | - 0 | - 0 | - 0 | 2928 | - 0 | - 0 | - 0 | - 0 | - 0 | - 0 | - 0 | - 0 | - 0 | - 0 | - 0 | - 0 | - 0 | - 0 | - 0 | - 0 | - 0 | (164) | - 0 | - 0 | - 0 | - 0 | - 0 | - 0 | - 0 | ||||||||||||||||||||||||||||||||||||||
| Goodwill Impairment | - 0 | - 0 | - 0 | - 0 | - 0 | 28306 | - 0 | - 0 | - 0 | - 0 | - 0 | - 0 | - 0 | - 0 | - 0 | - 0 | - 0 | - 0 | - 0 | - 0 | - 0 | - 0 | - 0 | - 0 | - 0 | - 0 | - 0 | - 0 | - 0 | - 0 | - 0 | - 0 | - 0 | - 0 | |||||||||||||||||||||||||||||||||||||||||
| Inventory Rationalization | - 0 | - 0 | - 0 | - 0 | - 0 | 3893 | - 0 | - 0 | - 0 | - 0 | - 0 | - 0 | - 0 | - 0 | - 0 | - 0 | - 0 | - 0 | - 0 | - 0 | - 0 | - 0 | - 0 | - 0 | - 0 | - 0 | - 0 | - 0 | - 0 | - 0 | - 0 | - 0 | - 0 | - 0 | |||||||||||||||||||||||||||||||||||||||||
| Discontinued operation accrual | - 0 | - 0 | - 0 | - 0 | - 0 | - 0 | - 0 | - 0 | - 0 | - 0 | - 0 | - 0 | - 0 | - 0 | - 0 | 340 | - 0 | - 0 | - 0 | 931 | - 0 | - 0 | - 0 | - 0 | - 0 | - 0 | - 0 | - 0 | - 0 | 529 | - 0 | - 0 | - 0 | - 0 | - 0 | 340 | 931 | ||||||||||||||||||||||||||||||||||||||
| North American sales meeting | - 0 | - 0 | - 0 | - 0 | - 0 | - 0 | - 0 | - 0 | 1225 | - 0 | - 0 | - 0 | - 0 | - 0 | - 0 | - 0 | 1889 | - 0 | - 0 | - 0 | - 0 | - 0 | - 0 | - 0 | - 0 | - 0 | - 0 | - 0 | - 0 | - 0 | - 0 | - 0 | - 0 | 1889 | |||||||||||||||||||||||||||||||||||||||||
| Property Impairment Loss | - 0 | - 0 | - 0 | - 0 | - 0 | - 0 | - 0 | - 0 | - 0 | - 0 | - 0 | - 0 | 2914 | 132 | - 0 | - 0 | - 0 | - 0 | - 0 | - 0 | - 0 | - 0 | - 0 | - 0 | - 0 | - 0 | - 0 | - 0 | - 0 | - 0 | - 0 | - 0 | 3046 | - 0 | |||||||||||||||||||||||||||||||||||||||||
| Building Impairment | - 0 | - 0 | - 0 | - 0 | - 0 | - 0 | - 0 | 231 | - 0 | - 0 | - 0 | ||||||||||||||||||||||||||||||||||||||||||||||||||||||||||||||||
| Reg G Adjusted EBITDA | $ 7676 | $ 5470 | $ (232) | $ (3170) | $ (1368) | $ (4871) | $ 1699 | $ 2585 | $ 1352 | $ 2121 | $ 4196 | $ 2351 | $ 2349 | $ 4234 | $ 4342 | $ 2733 | $ 3068 | $ 6390 | $ 5579 | $ 2162 | $ 2458 | $ 3111 | $ 4277 | $ 2219 | $ 2852 | $ 4519 | $ 5443 | $ 3026 | $ 5121 | $ 7749 | $ 7325 | $ 5053 | $ 7457 | $ 9402 | $ 10318 | $ 13658 | $ 17199 | ||||||||||||||||||||||||||||||||||||||
| Adjusted EBITDA of Sales | 97 | 68 | -03 | -46 | -19 | -70 | 25 | 40 | 20 | 31 | 61 | 36 | 34 | 59 | 59 | 39 | 44 | 90 | 79 | 33 | 35 | 45 | 61 | 33 | 38 | 60 | 72 | 38 | 61 | 86 | 83 | 59 | 82 | 98 | 109 | 48 | 62 | ||||||||||||||||||||||||||||||||||||||
| Annual Adjusted EBITDA of Sales | 44 | 58 | |||||||||||||||||||||||||||||||||||||||||||||||||||||||||||||||||||||||||
| Adjusted Operating Income | (3083) | (6437) | (264) | 744 | (709) | (123) | 1829 | (7) | 54 | 2071 | 2182 | 600 | 972 | 4264 | 3460 | (40) | 271 | 885 | 2304 | 539 | 1147 | 2875 | 3852 | 1196 | 3435 | 6070 | 5570 | 3087 | 5979 | 7947 | 8850 | 4907 | 8314 | ||||||||||||||||||||||||||||||||||||||||||
| Consolidated Revenues | |||||||
| 2013 | 269503 | ||||||
| 2014 | 285693 | ||||||
| 2015 | 275834 | ||||||
| 2016 | 276573 | ||||||
| 2017 | 305907 | ||||||
| 2018 | 349637 | ||||||
| TTM 63019 | 362236 | ||||||
| Net Cash(Debt) | |||||||
| 2013 | (15380) | ||||||
| 2014 | 4207 | ||||||
| 2015 | 9840 | ||||||
| 2016 | 9580 | ||||||
| 2017 | (10127) | ||||||
| 2018 | 1060 | ||||||
| 63019 | (1908) | ||||||
| Rep Count | |||||||
| 2013 | 806 | ||||||
| 2014 | 916 | ||||||
| 2015 | 937 | ||||||
| 2016 | 1009 | ||||||
| 2017 | 983 | ||||||
| 2018 | 994 | ||||||
| 63019 | 982 | ||||||
| Adjusted OI | DampA | Adjusted EBITDA | |||||
| 2013 | 990 | 9030 | 10020 | ||||
| 2014 | 4907 | 8751 | 13658 | ||||
| 2015 | 8315 | 8543 | 17199 | ||||
| 2016 | 3388 | 8066 | 12065 | ||||
| 2017 | 15840 | ||||||
| 2018 | 25248 | ||||||
| TTM 63019 | 29237 | ||||||
| Reg G EBITDA By Quarter | |||||||
| Quarter | 2017 | 2018 | 2019 | ||||
| Q1 | 2852 | 5121 | 7457 | ||||
| Q2 | 4519 | 7749 | 9402 | ||||
| Q3 | 5443 | 7325 | |||||
| Q4 | 3026 | 5053 |
| Months of Experience | Average Annual Sales | Number of Reps | |||
| lt 12 Mos | ERRORVALUE | ERRORVALUE | |||
| 1 - 2 Yrs | ERRORVALUE | ERRORVALUE | |||
| 3 - 5 Yrs | ERRORVALUE | ERRORVALUE | |||
| 5 - 10 Yrs | ERRORVALUE | ERRORVALUE | |||
| gt 10 Yrs | ERRORVALUE | ERRORVALUE | |||
| ERRORVALUE | |||||
| Excludes ISR MSS CRS | |||||
| Excludes Freight | |||||
| Product mix | ||||||||
| Verticals | Q2 2019 Sales | |||||||
| Fastening Systems | 243 | 23008646 | ||||||
| Fluid Power | 152 | 14395529 | ||||||
| Specialy Chemicals | 117 | 11074332 | ||||||
| Cutting Tools and Abrasives | 130 | 12319702 | ||||||
| Electrical | 107 | 10102828 | ||||||
| Aftermarket Automotive Supplies | 77 | 7255974 | ||||||
| Safety | 47 | 4458217 | ||||||
| Welding and Metal Repair | 16 | 1539172 | ||||||
| Other | 112 | 10633378 | ||||||
| Total | 100 | 94787779 | ||||||
| Verticals | YTD 2019 Sales | |||||||
| Fastening Systems | 24 | 44125949 | ||||||
| Fluid Power | 15 | 28068352 | ||||||
| Specialy Chemicals | 12 | 21249420 | ||||||
| Cutting Tools and Abrasives | 13 | 24290887 | ||||||
| Electrical | 11 | 20425294 | ||||||
| Aftermarket Automotive Supplies | 8 | 14805874 | ||||||
| Safety | 5 | 8626381 | ||||||
| Welding and Metal Repair | 2 | 3088518 | ||||||
| Other | 10 | 20042457 | ||||||
| Total | 100 | 184723132 |
| Lawson core customer mix | ||||||||
| Account Tyoe | Q2 | |||||||
| Regional Accounts | 44933707 | 47 | ||||||
| Strategic | 13542786 | 14 | ||||||
| Kent Automotive | 14370813 | 15 | ||||||
| Bolt Supply | 11129675 | 12 | ||||||
| Government | 10087561 | 10 | ||||||
| Screw Products | 0 | 0 | ||||||
| Other (1) | 1428268 | 1 | ||||||
| Total | 96097363 | 100 | ||||||
| Account Tyoe | YTD June | |||||||
| Regional Accounts | 88400675 | 47 | ||||||
| Strategic | 26218365 | 14 | ||||||
| Kent Automotive | 29071347 | 16 | ||||||
| Bolt Supply | 20005505 | 11 | ||||||
| Government | 19505323 | 10 | ||||||
| Screw Products | 0 | 0 | ||||||
| Other | 4239066 | 2 | ||||||
| Total | 187440280 | 100 | ||||||
| Total Reported |
| August 2011 | OslashImplemented SAP | ||
| October 2011 | OslashCommenced construction of new McCook Ill distribution center | ||
| May 2012 | OslashRelocated corporate headquarters | ||
| June 2012 | OslashRestructured senior team Announced $20M cost savings plan | ||
| August 2012 | OslashTransitioned packaging facility to McCook Ill distribution center | ||
| OslashEntered into new five-year $40M credit facility | |||
| October 2012 | OslashAnnounced new CEO and President Michael G DeCata | ||
| OslashConsolidated Vernon Hills distribution center into McCook Ill | |||
| November 2012 | OslashRolled out new website to existing web customers | ||
| December 2012 | OslashCompleted transition of US independent agents to employees | ||
| April 2013 | OslashRoll-out of new website to new web customers | ||
| AprilMay 2013 | OslashMcCook DC begins to ship customer orders | ||
| November 2013 | OslashEntered into sub-lease of headquarters space to generate $29M of future cash savings | ||
| December 2013 | OslashEnded year with over 800 sales reps ndash First increase in 8 years | ||
| February 2014 | OslashClosed on Automatic Screw Machine Products sale for net proceeds of $121M | ||
| June 2014 | OslashEntered into sale-leaseback of Reno distribution facility for net proceeds of $83M | ||
| December 2014 | OslashEnded year with over 900 sales reps | ||
| February 2015 | OslashHeld North American sales meeting | ||
| September 2015 | OslashCompleted West Coast Fasteners acquisition | ||
| March 2016 | OslashCompleted Perfect Products of Michigan acquisition | ||
| May 2016 | OslashCompleted F B Feeney acquisition | ||
| June 2016 | OslashExpanded sales team to over 1000 sales reps | ||
| September 2016 | OslashExtended credit facitlity to August 2020 | ||
| November 2016 | OslashCompleted Mattic Industries acquisition | ||
| March 2017 | OslashConsolidated Fairfield NJ distribution operations into McCook Ill and Suwanee GA | ||
| May 2017 | OslashSold Fairfield NJ distribution center for a gain of $54M | ||
| October 2017 | OslashCompleted Bolt Supply House acquisition | ||
| April 2018 | OslashOpened MRO distribution center in Calgary Canada | ||
| October 2018 | OslashCompleted Screw Products acquisition and added Bolt Supply branch | ||
| June 2019 | OslashAchieved Q2 98 adjusted EBITDA net of ASC 842 impact of 03 | ||
| September 2019 | OslashAchieved Q3 109 adjusted EBITDA hired VP MampA | ||
| October 2019 | OslashEntered into new five-year $100M credit facility with additional $50 million accordion feature |
| ($ in thousands) | Q3 2013 | Q4 2013 | Q1 2014 | Q2 2014 | Q3 2014 | Q4 2014 | Q1 2015 | Q2 2015 | Q3 2015 | Q4 2015 | Q1 2016 | Q2 2016 | Q3 2016 | Q4 2016 | Q1 2017 | Q2 2017 | Q3 2017 | Q4 2017 | ||||||||||||||||||||||||||||||||||||||||||||||
| SGampA | 40350 | 42856 | 45991 | 42562 | 43855 | 44764 | 43830 | 40565 | 40532 | 41145 | 41290 | 42497 | 40184 | 45548 | 44167 | 42672 | 44915 | 46750 | $ 173014 | |||||||||||||||||||||||||||||||||||||||||||||
| $ - | ||||||||||||||||||||||||||||||||||||||||||||||||||||||||||||||||
| Excluded Costs | $ - | 40196 | ||||||||||||||||||||||||||||||||||||||||||||||||||||||||||||||
| Severance | (962) | 127 | (728) | (290) | 328 | 59 | (571) | (50) | (372) | (280) | (204) | (143) | (367) | (1662) | (465) | 9 | (139) | (144) | $ (234) | 127 | ||||||||||||||||||||||||||||||||||||||||||||
| Stock Based Compensation (Benefit) | (33) | (562) | (1125) | (408) | (2423) | (2443) | 541 | (971) | 30 | (1693) | 1217 | (515) | 630 | (3801) | 30 | (415) | (2337) | (384) | $ (5296) | -32 | ||||||||||||||||||||||||||||||||||||||||||||
| Loss(Gain) on Disposal of Property | 36 | (32) | - 0 | - 0 | (97) | (45) | - 0 | - 0 | 2 | (9) | - 0 | - 0 | - 0 | - 0 | - 0 | - 0 | - 0 | - 0 | $ (142) | |||||||||||||||||||||||||||||||||||||||||||||
| Legal Settlement | - 0 | - 0 | - 0 | - 0 | 688 | - 0 | - 0 | - 0 | - 0 | - 0 | - 0 | - 0 | - 0 | - 0 | - 0 | - 0 | - 0 | - 0 | $ 688 | -562 | ||||||||||||||||||||||||||||||||||||||||||||
| Employment Tax Matter | - 0 | 400 | - 0 | - 0 | - 0 | - 0 | - 0 | - 0 | - 0 | - 0 | - 0 | - 0 | - 0 | - 0 | - 0 | - 0 | - 0 | - 0 | $ - | 39729 | ||||||||||||||||||||||||||||||||||||||||||||
| Loss on Sub-Lease | - 0 | (2928) | - 0 | - 0 | - 0 | - 0 | - 0 | - 0 | - 0 | - 0 | - 0 | - 0 | - 0 | - 0 | - 0 | - 0 | - 0 | - 0 | $ - | |||||||||||||||||||||||||||||||||||||||||||||
| National sales meeting | - 0 | - 0 | - 0 | - 0 | - 0 | - 0 | (1889) | - 0 | - 0 | - 0 | - 0 | - 0 | - 0 | - 0 | - 0 | - 0 | - 0 | - 0 | $ (1889) | |||||||||||||||||||||||||||||||||||||||||||||
| Remediation expense | - 0 | - 0 | - 0 | - 0 | - 0 | (340) | - 0 | - 0 | - 0 | - 0 | - 0 | - 0 | - 0 | - 0 | - 0 | - 0 | - 0 | - 0 | $ (340) | |||||||||||||||||||||||||||||||||||||||||||||
| Property Impairment Loss | - 0 | - 0 | (2914) | (132) | - 0 | - 0 | - 0 | - 0 | - 0 | - 0 | - 0 | - 0 | - 0 | - 0 | - 0 | - 0 | - 0 | - 0 | $ - | |||||||||||||||||||||||||||||||||||||||||||||
| Adjusted SGampA | $ 39391 | $ 39861 | $ 41224 | $ 41732 | $ 42351 | $ 41995 | $ 41911 | $ 39544 | $ 40192 | $ 39163 | $ 42303 | $ 41839 | $ 40447 | $ 40085 | $ 43732 | $ 42266 | $ 42439 | $ 46222 | $ 165801 | |||||||||||||||||||||||||||||||||||||||||||||
| Annual Adjusted EBITDA of Sales | ERRORREF | ERRORREF | ||||||||||||||||||||||||||||||||||||||||||||||||||||||||||||||
| Q1 2013 | Q2 2013 | Q3 2013 | Q4 2013 | Q1 2014 | Q2 2014 | Q3 2014 | Q4 2014 | Q1 2015 | |||||||||||
| Selling Days | 63 | 64 | 64 | 61 | 63 | 64 | 64 | 61 | 63 | ||||||||||
| Net Sales | 67213 | 68317 | 68235 | 65738 | 69204 | 72080 | 74128 | 70281 | 69904 | ||||||||||
| Average Daily Sales | 1067 | 1067 | 1066 | 1078 | 1098 | 1126 | 1158 | 1152 | 1110 | ||||||||||
| Average Sales Rep Count | 762 | 764 | 774 | 794 | 819 | 854 | 882 | 908 | 911 | ||||||||||
| Sales per Sales Rep per Day | 1400 | 1397 | 1377 | 1358 | 1341 | 1319 | 1313 | 1269 | 1218 | ||||||||||
| Full Year | ||||||||||||||||||||||||||||||||||||||||||||||||||||||||||||||||||||
| ($ in thousands) | Q1 2011 | Q2 2011 | Q3 2011 | Q4 2011 | Q1 2012 | Q2 2012 | Q3 2012 | Q4 2012 | Q1 2013 | Q2 2013 | Q3 2013 | Q4 2013 | Q1 2014 | Q2 2014 | Q3 2014 | Q4 2014 | Q1 2015 | Q2 2015 | Q3 2015 | Q4 2015 | Q1 2016 | Q2 2016 | Q3 2016 | Q4 2016 | Q1 2017 | Q2 2017 | Q3 2017 | Q4 2017 | Q1 2018 | Q2 2018 | Q3 2018 | 2014 | 2015 | |||||||||||||||||||||||||||||||||||
| Net Sales | $ 79255 | $ 80625 | $ 71490 | $ 69029 | $ 71364 | $ 69830 | $ 67863 | $ 64505 | $ 67213 | $ 68317 | $ 68235 | $ 65738 | $ 69204 | $ 72080 | $ 74128 | $ 70281 | $ 69904 | $ 70726 | $ 70243 | $ 64961 | $ 69711 | $ 69348 | $ 70199 | $ 67315 | $ 74617 | $ 75006 | $ 75651 | $ 80633 | $ 84459 | $ 90382 | $ 88530 | $ 285693 | $ 275834 | |||||||||||||||||||||||||||||||||||
| Operating Income (Loss) | 3542 | 1397 | (3480) | (6995) | (3466) | (42084) | (1740) | 2057 | (3530) | (201) | 870 | (3002) | (4713) | 1241 | 678 | (2169) | (947) | 3243 | 2810 | (2985) | 1169 | 29 | 2389 | (5044) | 712 | 7891 | 1090 | 243 | 1837 | 5554 | (2266) | (4963) | 2121 | |||||||||||||||||||||||||||||||||||
| Depreciation amp Amortization | 1260 | 1315 | 1160 | 1675 | 1715 | 1566 | 1963 | 1841 | 2061 | 2244 | 2367 | 2358 | 2295 | 2163 | 2160 | 2133 | 2096 | 2126 | 2119 | 2202 | 2187 | 2226 | 1973 | 1680 | 1705 | 1644 | 1591 | 1830 | 1686 | 1679 | 1755 | 8751 | 8543 | |||||||||||||||||||||||||||||||||||
| EBITDA | 4802 | 2712 | (2320) | (5320) | (1751) | (40518) | 223 | 3898 | (1469) | 2043 | 3237 | (644) | (2418) | 3404 | 2838 | (36) | 1149 | 5369 | 4929 | (783) | 3356 | 2255 | 4362 | (3364) | 2417 | 9535 | 2681 | 2073 | 3523 | 7233 | (511) | 3788 | 10664 | |||||||||||||||||||||||||||||||||||
| Excluded Costs | ||||||||||||||||||||||||||||||||||||||||||||||||||||||||||||||||||||
| Severance | 745 | 465 | 282 | 122 | 185 | 6585 | 1410 | (159) | - 0 | 2 | 962 | (127) | 728 | 290 | (328) | (59) | 571 | 50 | 372 | 280 | 204 | 143 | 367 | 1662 | 465 | (9) | 139 | 144 | 628 | 64 | 31 | 631 | 1273 | |||||||||||||||||||||||||||||||||||
| Stock Based Compensation (Benefit) | 227 | (95) | (538) | 467 | 198 | (1015) | 77 | 434 | 1596 | 76 | 33 | 562 | 1125 | 408 | 2423 | 2443 | (541) | 971 | (30) | 1693 | (1217) | 515 | (630) | 3801 | (30) | 415 | 2337 | 384 | 970 | 87 | 7637 | 6399 | 2093 | |||||||||||||||||||||||||||||||||||
| Acquisition Related Costs | - 0 | - 0 | - 0 | - 0 | - 0 | - 0 | 310 | 32 | 115 | 198 | 178 | 120 | - 0 | - 0 | 286 | 425 | - 0 | - 0 | 168 | |||||||||||||||||||||||||||||||||||||||||||||||||
| ERP Implementation Costs | 1902 | 2388 | 2344 | 339 | - 0 | - 0 | - 0 | - 0 | - 0 | - 0 | - 0 | - 0 | - 0 | - 0 | - 0 | - 0 | - 0 | - 0 | - 0 | - 0 | - 0 | - 0 | - 0 | - 0 | - 0 | - 0 | - 0 | - 0 | - 0 | - 0 | - 0 | - 0 | ||||||||||||||||||||||||||||||||||||
| Loss(Gain) on Disposal of Property | - 0 | - 0 | - 0 | 22 | - 0 | (2122) | (11) | (1588) | - 0 | - 0 | (36) | 32 | - 0 | - 0 | 97 | 45 | - 0 | - 0 | (2) | 9 | - 0 | - 0 | - 0 | - 0 | - 0 | (5422) | - 0 | - 0 | - 0 | - 0 | - 0 | 142 | 7 | |||||||||||||||||||||||||||||||||||
| Legal Settlement | - 0 | - 0 | - 0 | - 0 | - 0 | - 0 | - 0 | - 0 | - 0 | - 0 | - 0 | - 0 | - 0 | - 0 | (688) | - 0 | - 0 | - 0 | - 0 | - 0 | - 0 | - 0 | - 0 | - 0 | - 0 | - 0 | - 0 | - 0 | - 0 | - 0 | - 0 | (688) | - 0 | |||||||||||||||||||||||||||||||||||
| Employment Tax Matter | - 0 | - 0 | - 0 | 1200 | - 0 | - 0 | - 0 | - 0 | - 0 | - 0 | - 0 | (400) | - 0 | - 0 | - 0 | - 0 | - 0 | - 0 | - 0 | - 0 | - 0 | - 0 | - 0 | - 0 | - 0 | - 0 | - 0 | - 0 | - 0 | - 0 | - 0 | - 0 | - 0 | |||||||||||||||||||||||||||||||||||
| Lease termination gain | - 0 | - 0 | - 0 | - 0 | - 0 | - 0 | - 0 | - 0 | - 0 | - 0 | - 0 | 2928 | - 0 | - 0 | - 0 | - 0 | - 0 | - 0 | - 0 | - 0 | - 0 | - 0 | - 0 | - 0 | - 0 | - 0 | - 0 | - 0 | - 0 | (164) | - 0 | - 0 | - 0 | |||||||||||||||||||||||||||||||||||
| Goodwill Impairment | - 0 | - 0 | - 0 | - 0 | - 0 | 28306 | - 0 | - 0 | - 0 | - 0 | - 0 | - 0 | - 0 | - 0 | - 0 | - 0 | - 0 | - 0 | - 0 | - 0 | - 0 | - 0 | - 0 | - 0 | - 0 | - 0 | - 0 | - 0 | - 0 | - 0 | - 0 | - 0 | - 0 | |||||||||||||||||||||||||||||||||||
| Inventory Rationalization | - 0 | - 0 | - 0 | - 0 | - 0 | 3893 | - 0 | - 0 | - 0 | - 0 | - 0 | - 0 | - 0 | - 0 | - 0 | - 0 | - 0 | - 0 | - 0 | - 0 | - 0 | - 0 | - 0 | - 0 | - 0 | - 0 | - 0 | - 0 | - 0 | - 0 | - 0 | - 0 | - 0 | |||||||||||||||||||||||||||||||||||
| Discontinued operation accrual | - 0 | - 0 | - 0 | - 0 | - 0 | - 0 | - 0 | - 0 | - 0 | - 0 | - 0 | - 0 | - 0 | - 0 | - 0 | 340 | - 0 | - 0 | - 0 | 931 | - 0 | - 0 | - 0 | - 0 | - 0 | - 0 | - 0 | - 0 | - 0 | 529 | - 0 | 340 | 931 | |||||||||||||||||||||||||||||||||||
| North American sales meeting | - 0 | - 0 | - 0 | - 0 | - 0 | - 0 | - 0 | - 0 | 1225 | - 0 | - 0 | - 0 | - 0 | - 0 | - 0 | - 0 | 1889 | - 0 | - 0 | - 0 | - 0 | - 0 | - 0 | - 0 | - 0 | - 0 | - 0 | - 0 | - 0 | - 0 | - 0 | - 0 | 1889 | |||||||||||||||||||||||||||||||||||
| Property Impairment Loss | - 0 | - 0 | - 0 | - 0 | - 0 | - 0 | - 0 | - 0 | - 0 | - 0 | - 0 | - 0 | 2914 | 132 | - 0 | - 0 | - 0 | - 0 | - 0 | - 0 | - 0 | - 0 | - 0 | - 0 | - 0 | - 0 | - 0 | - 0 | - 0 | - 0 | - 0 | 3046 | - 0 | |||||||||||||||||||||||||||||||||||
| Adjusted EBITDA | $ 7676 | $ 5470 | $ (232) | $ (3170) | $ (1368) | $ (4871) | $ 1699 | $ 2585 | $ 1352 | $ 2121 | $ 4196 | $ 2351 | $ 2349 | $ 4234 | $ 4342 | $ 2733 | $ 3068 | $ 6390 | $ 5579 | $ 2162 | $ 2458 | $ 3111 | $ 4277 | $ 2219 | $ 2852 | $ 4519 | $ 5443 | $ 3026 | $ 5121 | $ 7749 | $ 7325 | $ 13658 | $ 17199 | |||||||||||||||||||||||||||||||||||
| Adjusted EBITDA of Sales | 97 | 68 | -03 | -46 | -19 | -70 | 25 | 40 | 20 | 31 | 61 | 36 | 34 | 59 | 59 | 39 | 44 | 90 | 79 | 33 | 35 | 45 | 61 | 33 | 38 | 60 | 72 | 38 | 61 | 86 | 83 | 48 | 62 | |||||||||||||||||||||||||||||||||||
| Annual Adjusted EBITDA of Sales | 44 | 58 | ||||||||||||||||||||||||||||||||||||||||||||||||||||||||||||||||||
| Adjusted Operating Income | (3083) | (6437) | (264) | 744 | (709) | (123) | 1829 | (7) | 54 | 2071 | 2182 | 600 | 972 | 4264 | 3460 | (40) | 271 | 885 | 2304 | 539 | 1147 | 2875 | 3852 | 1196 | 3435 | 6070 | 5570 | - 0 | 4907 | 8314 | ||||||||||||||||||||||||||||||||||||||
copy 2019 Lawson Products Inc All rights reserved Confidential Material Reproduction In Whole or in Part Prohibited
Pursue Disciplined MampA
Reinvest for Growth
Return Capital
bull Increased our borrowing capacity to $1000 million (additional $500 million accordion) with our new borrowing agreement
bull Capital expenditures expected to be $20 - $30 million in 2019bull Growth initiatives add new reps and increase sales rep productivity
bull Share repurchase to offset award dilution opportunistic purchasesbull $75 million stock repurchase program announced on May 16 2019 $63
million remaining after repurchase of shares worth $12 million in August 2019
bull Bolt-on acquisitions to enhance core growth strategiesbull Closed Screw Products Inc acquisition on 10118
Maintain Strong Balance Sheet
bull $86 million cash on hand and positive cash position of $64 million at the end of Q3
bull Consistent free cash flow generation
Capital Allocation Priorities
12
copy 2019 Lawson Products Inc All rights reserved Confidential Material Reproduction In Whole or in Part Prohibited
Lawson Products Poised for Growth
bull Leverage Current Infrastructure
bull Continued Sales Growth
bull Foundational Investments Completed
bull Operational Excellence
bull Large Fragmented Market
13
copy 2019 Lawson Products Inc All rights reserved Confidential Material Reproduction In Whole or in Part Prohibited
For More Information
Contact
Ronald J KnutsonEVP CFOInvestor Relations(773) 304-5665ronknutsonlawsonproductscom
And see our Website athttpwwwlawsonproductscomcompany-infoinvestor-relationsjsp
14
copy 2019 Lawson Products Inc All rights reserved Confidential Material Reproduction In Whole or in Part Prohibited
Appendices
15
copy 2019 Lawson Products Inc All rights reserved Confidential Material Reproduction In Whole or in Part Prohibited
Significant Activities
16
Appendix P-1
August 2011 Implemented SAPOctober 2011 Commenced construction of new McCook Ill distribution center
May 2012 Relocated corporate headquartersJune 2012 Restructured senior team Announced $20M cost savings plan
Transitioned packaging facility to McCook Ill distribution centerEntered into new five-year $40M credit facilityAnnounced new CEO and President Michael G DeCataConsolidated Vernon Hills distribution center into McCook Ill
November 2012 Rolled out new website to existing web customersDecember 2012 Completed transition of US independent agents to employees
April 2013 Roll-out of new website to new web customersAprilMay 2013 McCook DC begins to ship customer ordersNovember 2013 Entered into sub-lease of headquarters space to generate $29M of future cash savingsDecember 2013 Ended year with over 800 sales reps ndash First increase in 8 yearsFebruary 2014 Closed on Automatic Screw Machine Products sale for net proceeds of $121M
June 2014 Entered into sale-leaseback of Reno distribution facility for net proceeds of $83MDecember 2014 Ended year with over 900 sales repsFebruary 2015 Held North American sales meeting
September 2015 Completed West Coast Fasteners acquisitionMarch 2016 Completed Perfect Products of Michigan acquisitionMay 2016 Completed F B Feeney acquisitionJune 2016 Expanded sales team to over 1000 sales reps
September 2016 Extended credit facitlity to August 2020November 2016 Completed Mattic Industries acquisition
March 2017 Consolidated Fairfield NJ distribution operations into McCook Ill and Suwanee GAMay 2017 Sold Fairfield NJ distribution center for a gain of $54M
October 2017 Completed Bolt Supply House acquisitionApril 2018 Opened MRO distribution center in Calgary Canada
October 2018 Completed Screw Products acquisition and added Bolt Supply branchJune 2019 Achieved Q2 98 adjusted EBITDA net of ASC 842 impact of 03
September 2019 Achieved Q3 109 adjusted EBITDA hired VP MampAOctober 2019 Entered into new five-year $100M credit facility with additional $50 million accordion feature
August 2012
October 2012
Adjusted EBITDA $ in 000s
Adjusted EBITDA Q4 2016Q1 2017Q2 2017Q3 2017Q4 201722192852451954433026
Adjusted EBITDA of Sales
Adjusted EBITDA of SalesQ3 2016Q4 2016Q1 2017Q2 2017Q3 2017Q4 201760926793828971926E-232964421005719377E-23822185292895721E-260248513452257152E-271948817596594883E-237528059231332088E-2
Adjusted Operating Income of Sales
Adjusted Operating IncomeQ3 2016Q4 2016Q1 2017Q2 2017Q3 2017Q4 201723045391147287538521196
Adjusted Op Inc $ in 000s
Adjusted EBITDA Q4 2016Q1 2017Q2 2017Q3 2017Q4 20175391147287538521196
Net Sales by Quarter $ in 000s
Net SalesQ1 2013Q2 2013Q3 2013Q4 2013Q1 2014Q2 2014Q3 2014Q4 2014Q1 2015672136831768235657386920472080741287028169904
Adjusted SGampA $ in 000s
Adjusted SGampA Q4 2015Q1 2016Q2 2016Q3 2016Q4 2016Q1 2017Q2 2017Q3 2017Q4 2017391634230341839404474008543732422664243946222
copy 2019 Lawson Products Inc All rights reserved Confidential Material Reproduction In Whole or in Part Prohibited
Regulation G ndash GAAP ReconciliationAppendix P-2
Non GAAP Reconciliation of Adjusted EBITDA to Sales Percentage
The Company reports its financial results in accordance with US generally accepted accounting principles (GAAP) However the Companys management believesthat certain non-GAAP financial measures may provide users of this financial information additional meaningful comparisons between current results and results inprior operating periods Management believes that these non-GAAP financial measures can provide additional meaningful reflection of underlying trends of thebusiness because they provide a comparison of historical information that excludes certain non-operational non-recurring or intermittently recurring items thatimpact the overall comparability See the table below for supplemental financial data and corresponding reconciliations to GAAP financial measures for quarterlyadjusted EBITDA as a percentage of net sales Non-GAAP financial measures should be viewed in addition to and not as an alternative for the Companys reportedresults prepared in accordance with GAAP
17
($ in thousands) Q1 2017 Q2 2017 Q3 2017 Q4 2017 Q1 2018 Q2 2018 Q3 2018 Q4 2018 Q1 2019 Q2 2019 Q3 2019
Net Sales 74617$ 75006$ 75651$ 80633$ 84459$ 90382$ 88530$ 86266$ 91343$ 96097$ 94779$
Operating Income (Loss) 712 7891 1090 243 1837 5554 (2266) 4085 5544 1623 6446 Depreciation amp Amortization 1705 1644 1591 1830 1686 1679 1755 1735 1478 1455 1468 EBITDA 2417 9535 2681 2073 3523 7233 (511) 5820 7022 3078 7914
Excluded CostsSeverance 465 (9) 139 144 628 64 31 126 27 1485 30 Stock Based Compensation (Benefit) (30) 415 2337 384 970 87 7637 (1186) 408 4839 2374 Acquisition Related Costs - - 286 425 - - 168 62 - - - Loss(Gain) on Disposal of Property - (5422) - - - - - - - - - Lease termination gain - - - - - (164) - - - - - Discontinued operation accrual - - - - - 529 - - - - - Building Impairment - - - - - - - 231 - - - Reg G Adjusted EBITDA 2852$ 4519$ 5443$ 3026$ 5121$ 7749$ 7325$ 5053$ 7457$ 9402$ 10318$
Adjusted EBITDA of Sales 38 60 72 38 61 86 83 59 82 98 109
Customer Mix
Regional Accounts48
Kent Automotive16
Regional AccountsStrategicKent AutomotiveBolt SupplyGovernment Screw ProductsOther047014000000000000001016011010002
ampDampF ampA
Product Mix
Fastening Systems23
Specialty Chemicals12
Fastening SystemsFluid PowerSpecialy ChemicalsCutting Tools and AbrasivesElectricalAftermarket Automotive SuppliesSafetyWelding and Metal RepairOther02401501201301100800500201
Number Of Sales Reps
Tenure With Lawson (as of 63019)
Average Annual Sales
Consolidated Revenues
Consolidated Revenues20142015201620172018TTM 63019285693275834276573305907349637362236Net Cash(Debt)2014201520162017201843646420798409580-101271060-1908Rep Count201320142015201620172018436468069169371009983994982
Adjusted Reg G EBITDA
Adjusted EBITDA20142015201620172018TTM 63019136581719912065158402524829237
Quarterly Adjusted Reg G EBITDA
2017Q1Q2Q3Q428524519544330262018Q1Q2Q3Q451217749732550532019Q1Q2Q3Q474579402
Adjusted EBITDA $ in 000s
Reg G Adjusted EBITDA Q1 2017Q2 2017Q3 2017Q4 20172852451954433026
Adjusted EBITDA of Sales
Adjusted EBITDA of SalesQ1 2017Q2 2017Q3 2017Q4 20173822185292895721E-260248513452257152E-271948817596594883E-237528059231332088E-2
Adjusted Operating Income of Sales
Adjusted Operating IncomeQ1 2017Q2 2017Q3 2017Q4 2017
Adjusted Op Inc $ in 000s
Reg G Adjusted EBITDA Q1 2017Q2 2017Q3 2017Q4 2017
copy 2019 Lawson Products Inc All rights reserved Confidential Material Reproduction In Whole or in Part Prohibited
Consolidated Balance Sheet Appendix P-4
18
ASSETSCurrent assetsCash and cash equivalents $ 8626 $ 11883Restricted cash 800 800Accounts receivable less allowance for doubtful accounts of $614 and $549 respectively
45162 37682
Inventories net 54894 52887Miscellaneous receivables and prepaid expenses 4270 3653Total current assets 113752 106905
Property plant and equipment net 16932 23548Deferred income taxes 17372 20592Goodwill 20582 20079Cash value of life insurance 14440 12599Intangible assets net 12468 13112Lease assets 11917 mdashOther assets 275 307Total assets $ 207738 $ 197142
LIABILITIES AND STOCKHOLDERSrsquo EQUITYCurrent liabilitiesRevolving lines of credit $ 2195 $ 10823Accounts payable 16325 15207Lease obligation 3781 mdashAccrued expenses and other liabilities 37873 40179Total current liabilities 60174 66209
Security bonus plan 11969 12413Lease obligation 10360 5213Deferred compensation 5915 5304Deferred tax liability 2879 2761Other liabilities 3460 6069Total liabilities 94757 97969
Stockholdersrsquo equityPreferred stock $1 par valueAuthorized - 500000 shares Issued and outstanding mdash None mdash mdashCommon stock $1 par value
Authorized - 35000000 sharesIssued - 9042597 and 9005716 shares respectivelyOutstanding - 8956981 and 8955930 shares respectively
Capital in excess of par value 17626 15623Retained earnings 89502 77338Treasury stock ndash 85616 and 49786 shares respectivelyAccumulated other comprehensive lossTotal stockholdersrsquo equity 112981 99173Total liabilities and stockholdersrsquo equity $ 207738 $ 197142
September 30 December 312019 2018
(Unaudited)
(2595) (1234)(595) (1560)
9043 9006
Customer Mix
Regional Accounts48
Kent Automotive16
Regional AccountsStrategicKent AutomotiveBolt SupplyGovernment Screw ProductsOther0470140000000000000010150110110002
ampDampF ampA
Product Mix
Fastening Systems23
Specialty Chemicals12
Fastening SystemsFluid PowerSpecialy ChemicalsCutting Tools and AbrasivesElectricalAftermarket Automotive SuppliesSafetyWelding and Metal RepairOther02401501201301100800500201
Number Of Sales Reps
Tenure With Lawson (as of 63019)
Average Annual Sales
Consolidated Revenues
Consolidated Revenues20142015201620172018TTM 93019285693275834276573305907349637368485Net Cash(Debt)2014201520162017201843738420798409580-1012710606431Rep Count201320142015201620172018437388069169371009983994993
Adjusted Reg G EBITDA
Adjusted EBITDA20142015201620172018TTM 93019136581719912065158402524832230
Quarterly Adjusted Reg G EBITDA
2017Q1Q2Q3Q428524519544330262018Q1Q2Q3Q451217749732550532019Q1Q2Q3Q47457940210318
Adjusted EBITDA $ in 000s
Reg G Adjusted EBITDA Q1 2017Q2 2017Q3 2017Q4 20172852451954433026
Adjusted EBITDA of Sales
Adjusted EBITDA of SalesQ1 2017Q2 2017Q3 2017Q4 20173822185292895721E-260248513452257152E-271948817596594883E-237528059231332088E-2
Adjusted Operating Income of Sales
Adjusted Operating IncomeQ1 2017Q2 2017Q3 2017Q4 2017
Adjusted Op Inc $ in 000s
Reg G Adjusted EBITDA Q1 2017Q2 2017Q3 2017Q4 2017
| September 30 | December 31 | ||||||||||
| 2019 | 2018 | ||||||||||
| ASSETS | (Unaudited) | ||||||||||
| Current assets | |||||||||||
| Cash and cash equivalents | $ | 8626 | $ | 11883 | |||||||
| Restricted cash | 800 | 800 | |||||||||
| Accounts receivable less allowance for doubtful accounts of $614 and $549 respectively | 45162 | 37682 | |||||||||
| Inventories net | 54894 | 52887 | |||||||||
| Miscellaneous receivables and prepaid expenses | 4270 | 3653 | |||||||||
| Total current assets | 113752 | 106905 | |||||||||
| Property plant and equipment net | 16932 | 23548 | |||||||||
| Deferred income taxes | 17372 | 20592 | |||||||||
| Goodwill | 20582 | 20079 | |||||||||
| Cash value of life insurance | 14440 | 12599 | |||||||||
| Intangible assets net | 12468 | 13112 | |||||||||
| Lease assets | 11917 | mdash | |||||||||
| Other assets | 275 | 307 | |||||||||
| Total assets | $ | 207738 | $ | 197142 | |||||||
| LIABILITIES AND STOCKHOLDERSrsquo EQUITY | |||||||||||
| Current liabilities | |||||||||||
| Revolving lines of credit | $ | 2195 | $ | 10823 | |||||||
| Accounts payable | 16325 | 15207 | |||||||||
| Lease obligation | 3781 | mdash | |||||||||
| Accrued expenses and other liabilities | 37873 | 40179 | |||||||||
| Total current liabilities | 60174 | 66209 | |||||||||
| Security bonus plan | 11969 | 12413 | |||||||||
| Lease obligation | 10360 | 5213 | |||||||||
| Deferred compensation | 5915 | 5304 | |||||||||
| Deferred tax liability | 2879 | 2761 | |||||||||
| Other liabilities | 3460 | 6069 | |||||||||
| Total liabilities | 94757 | 97969 | |||||||||
| Stockholdersrsquo equity | |||||||||||
| Preferred stock $1 par value | |||||||||||
| Authorized - 500000 shares Issued and outstanding mdash None | mdash | mdash | |||||||||
| Common stock $1 par value | |||||||||||
| Authorized - 35000000 shares | 9043 | 9006 | |||||||||
| Issued - 9042597 and 9005716 shares respectively | |||||||||||
| Outstanding - 8956981 and 8955930 shares respectively | |||||||||||
| Capital in excess of par value | 17626 | 15623 | |||||||||
| Retained earnings | 89502 | 77338 | |||||||||
| Treasury stock ndash 85616 and 49786 shares respectively | (2595) | (1234) | |||||||||
| Accumulated other comprehensive loss | (595) | (1560) | |||||||||
| Total stockholdersrsquo equity | 112981 | 99173 | |||||||||
| Total liabilities and stockholdersrsquo equity | $ | 207738 | $ | 197142 | |||||||
| Three Months Ended | |||||||||||||||||||||||||||||
| Jun 30 2019 | Mar 31 2019 | Dec 31 2018 | Sep 30 2018 | Jun 30 2018 | |||||||||||||||||||||||||
| Average daily net sales | $ | 1502 | $ | 1450 | $ | 1414 | $ | 1405 | $ | 1412 | |||||||||||||||||||
| Year over year increase | 63 | 82 | 70 | 170 | 205 | ||||||||||||||||||||||||
| Sequential quarter increase (decrease) | 36 | 25 | 06 | (05) | 53 | ||||||||||||||||||||||||
| Net Sales | $ | 96097 | $ | 91343 | $ | 86266 | $ | 88530 | $ | 90382 | |||||||||||||||||||
| Gross profit (1) | 51043 | 48923 | 46083 | 48108 | 49131 | ||||||||||||||||||||||||
| Gross profit percentage (1) | 531 | 536 | 534 | 543 | 544 | ||||||||||||||||||||||||
| Selling general amp administrative expenses | $ | 49420 | $ | 43379 | $ | 41998 | $ | 50374 | $ | 43577 | |||||||||||||||||||
| Operating income (loss) | $ | 1623 | $ | 5544 | $ | 4085 | $ | (2266) | $ | 5554 | |||||||||||||||||||
| Full Year | |||||||||||||||||||||||||||||||||||||||||||||||||||||||||||||||||||||||||||
| ($ in thousands) | Q1 2011 | Q2 2011 | Q3 2011 | Q4 2011 | Q1 2012 | Q2 2012 | Q3 2012 | Q4 2012 | Q1 2013 | Q2 2013 | Q3 2013 | Q4 2013 | Q1 2014 | Q2 2014 | Q3 2014 | Q4 2014 | Q1 2015 | Q2 2015 | Q3 2015 | Q4 2015 | Q1 2016 | Q2 2016 | Q3 2016 | Q4 2016 | Q1 2017 | Q2 2017 | Q3 2017 | Q4 2017 | Q1 2018 | Q2 2018 | Q3 2018 | Q4 2018 | Q1 2019 | Q2 2019 | Q3 2019 | 2014 | 2015 | ||||||||||||||||||||||||||||||||||||||
| Net Sales | $ 79255 | $ 80625 | $ 71490 | $ 69029 | $ 71364 | $ 69830 | $ 67863 | $ 64505 | $ 67213 | $ 68317 | $ 68235 | $ 65738 | $ 69204 | $ 72080 | $ 74128 | $ 70281 | $ 69904 | $ 70726 | $ 70243 | $ 64961 | $ 69711 | $ 69348 | $ 70199 | $ 67315 | $ 74617 | $ 75006 | $ 75651 | $ 80633 | $ 84459 | $ 90382 | $ 88530 | $ 86266 | $ 91343 | $ 96097 | $ 94779 | $ 285693 | $ 275834 | ||||||||||||||||||||||||||||||||||||||
| Operating Income (Loss) | 3542 | 1397 | (3480) | (6995) | (3466) | (42084) | (1740) | 2057 | (3530) | (201) | 870 | (3002) | (4713) | 1241 | 678 | (2169) | (947) | 3243 | 2810 | (2985) | 1169 | 29 | 2389 | (5044) | 712 | 7891 | 1090 | 243 | 1837 | 5554 | (2266) | 4085 | 5544 | 1623 | 6446 | (4963) | 2121 | ||||||||||||||||||||||||||||||||||||||
| Depreciation amp Amortization | 1260 | 1315 | 1160 | 1675 | 1715 | 1566 | 1963 | 1841 | 2061 | 2244 | 2367 | 2358 | 2295 | 2163 | 2160 | 2133 | 2096 | 2126 | 2119 | 2202 | 2187 | 2226 | 1973 | 1680 | 1705 | 1644 | 1591 | 1830 | 1686 | 1679 | 1755 | 1735 | 1478 | 1455 | 1468 | 8751 | 8543 | ||||||||||||||||||||||||||||||||||||||
| EBITDA | 4802 | 2712 | (2320) | (5320) | (1751) | (40518) | 223 | 3898 | (1469) | 2043 | 3237 | (644) | (2418) | 3404 | 2838 | (36) | 1149 | 5369 | 4929 | (783) | 3356 | 2255 | 4362 | (3364) | 2417 | 9535 | 2681 | 2073 | 3523 | 7233 | (511) | 5820 | 7022 | 3078 | 7914 | 3788 | 10664 | ||||||||||||||||||||||||||||||||||||||
| Excluded Costs | |||||||||||||||||||||||||||||||||||||||||||||||||||||||||||||||||||||||||||
| Severance | 745 | 465 | 282 | 122 | 185 | 6585 | 1410 | (159) | - 0 | 2 | 962 | (127) | 728 | 290 | (328) | (59) | 571 | 50 | 372 | 280 | 204 | 143 | 367 | 1662 | 465 | (9) | 139 | 144 | 628 | 64 | 31 | 126 | 27 | 1485 | 30 | 631 | 1273 | ||||||||||||||||||||||||||||||||||||||
| Stock Based Compensation (Benefit) | 227 | (95) | (538) | 467 | 198 | (1015) | 77 | 434 | 1596 | 76 | 33 | 562 | 1125 | 408 | 2423 | 2443 | (541) | 971 | (30) | 1693 | (1217) | 515 | (630) | 3801 | (30) | 415 | 2337 | 384 | 970 | 87 | 7637 | (1186) | 408 | 4839 | 2374 | 6399 | 2093 | ||||||||||||||||||||||||||||||||||||||
| Acquisition Related Costs | - 0 | - 0 | - 0 | - 0 | - 0 | - 0 | 310 | 32 | 115 | 198 | 178 | 120 | - 0 | - 0 | 286 | 425 | - 0 | - 0 | 168 | 62 | - 0 | - 0 | - 0 | ||||||||||||||||||||||||||||||||||||||||||||||||||||
| ERP Implementation Costs | 1902 | 2388 | 2344 | 339 | - 0 | - 0 | - 0 | - 0 | - 0 | - 0 | - 0 | - 0 | - 0 | - 0 | - 0 | - 0 | - 0 | - 0 | - 0 | - 0 | - 0 | - 0 | - 0 | - 0 | - 0 | - 0 | - 0 | - 0 | - 0 | - 0 | - 0 | - 0 | - 0 | ||||||||||||||||||||||||||||||||||||||||||
| Loss(Gain) on Disposal of Property | - 0 | - 0 | - 0 | 22 | - 0 | (2122) | (11) | (1588) | - 0 | - 0 | (36) | 32 | - 0 | - 0 | 97 | 45 | - 0 | - 0 | (2) | 9 | - 0 | - 0 | - 0 | - 0 | - 0 | (5422) | - 0 | - 0 | - 0 | - 0 | - 0 | - 0 | - 0 | - 0 | - 0 | 142 | 7 | ||||||||||||||||||||||||||||||||||||||
| Legal Settlement | - 0 | - 0 | - 0 | - 0 | - 0 | - 0 | - 0 | - 0 | - 0 | - 0 | - 0 | - 0 | - 0 | - 0 | (688) | - 0 | - 0 | - 0 | - 0 | - 0 | - 0 | - 0 | - 0 | - 0 | - 0 | - 0 | - 0 | - 0 | - 0 | - 0 | - 0 | - 0 | (688) | - 0 | |||||||||||||||||||||||||||||||||||||||||
| Employment Tax Matter | - 0 | - 0 | - 0 | 1200 | - 0 | - 0 | - 0 | - 0 | - 0 | - 0 | - 0 | (400) | - 0 | - 0 | - 0 | - 0 | - 0 | - 0 | - 0 | - 0 | - 0 | - 0 | - 0 | - 0 | - 0 | - 0 | - 0 | - 0 | - 0 | - 0 | - 0 | - 0 | - 0 | - 0 | |||||||||||||||||||||||||||||||||||||||||
| Lease termination gain | - 0 | - 0 | - 0 | - 0 | - 0 | - 0 | - 0 | - 0 | - 0 | - 0 | - 0 | 2928 | - 0 | - 0 | - 0 | - 0 | - 0 | - 0 | - 0 | - 0 | - 0 | - 0 | - 0 | - 0 | - 0 | - 0 | - 0 | - 0 | - 0 | (164) | - 0 | - 0 | - 0 | - 0 | - 0 | - 0 | - 0 | ||||||||||||||||||||||||||||||||||||||
| Goodwill Impairment | - 0 | - 0 | - 0 | - 0 | - 0 | 28306 | - 0 | - 0 | - 0 | - 0 | - 0 | - 0 | - 0 | - 0 | - 0 | - 0 | - 0 | - 0 | - 0 | - 0 | - 0 | - 0 | - 0 | - 0 | - 0 | - 0 | - 0 | - 0 | - 0 | - 0 | - 0 | - 0 | - 0 | - 0 | |||||||||||||||||||||||||||||||||||||||||
| Inventory Rationalization | - 0 | - 0 | - 0 | - 0 | - 0 | 3893 | - 0 | - 0 | - 0 | - 0 | - 0 | - 0 | - 0 | - 0 | - 0 | - 0 | - 0 | - 0 | - 0 | - 0 | - 0 | - 0 | - 0 | - 0 | - 0 | - 0 | - 0 | - 0 | - 0 | - 0 | - 0 | - 0 | - 0 | - 0 | |||||||||||||||||||||||||||||||||||||||||
| Discontinued operation accrual | - 0 | - 0 | - 0 | - 0 | - 0 | - 0 | - 0 | - 0 | - 0 | - 0 | - 0 | - 0 | - 0 | - 0 | - 0 | 340 | - 0 | - 0 | - 0 | 931 | - 0 | - 0 | - 0 | - 0 | - 0 | - 0 | - 0 | - 0 | - 0 | 529 | - 0 | - 0 | - 0 | - 0 | - 0 | 340 | 931 | ||||||||||||||||||||||||||||||||||||||
| North American sales meeting | - 0 | - 0 | - 0 | - 0 | - 0 | - 0 | - 0 | - 0 | 1225 | - 0 | - 0 | - 0 | - 0 | - 0 | - 0 | - 0 | 1889 | - 0 | - 0 | - 0 | - 0 | - 0 | - 0 | - 0 | - 0 | - 0 | - 0 | - 0 | - 0 | - 0 | - 0 | - 0 | - 0 | 1889 | |||||||||||||||||||||||||||||||||||||||||
| Property Impairment Loss | - 0 | - 0 | - 0 | - 0 | - 0 | - 0 | - 0 | - 0 | - 0 | - 0 | - 0 | - 0 | 2914 | 132 | - 0 | - 0 | - 0 | - 0 | - 0 | - 0 | - 0 | - 0 | - 0 | - 0 | - 0 | - 0 | - 0 | - 0 | - 0 | - 0 | - 0 | - 0 | 3046 | - 0 | |||||||||||||||||||||||||||||||||||||||||
| Building Impairment | - 0 | - 0 | - 0 | - 0 | - 0 | - 0 | - 0 | 231 | - 0 | - 0 | - 0 | ||||||||||||||||||||||||||||||||||||||||||||||||||||||||||||||||
| Reg G Adjusted EBITDA | $ 7676 | $ 5470 | $ (232) | $ (3170) | $ (1368) | $ (4871) | $ 1699 | $ 2585 | $ 1352 | $ 2121 | $ 4196 | $ 2351 | $ 2349 | $ 4234 | $ 4342 | $ 2733 | $ 3068 | $ 6390 | $ 5579 | $ 2162 | $ 2458 | $ 3111 | $ 4277 | $ 2219 | $ 2852 | $ 4519 | $ 5443 | $ 3026 | $ 5121 | $ 7749 | $ 7325 | $ 5053 | $ 7457 | $ 9402 | $ 10318 | $ 13658 | $ 17199 | ||||||||||||||||||||||||||||||||||||||
| Adjusted EBITDA of Sales | 97 | 68 | -03 | -46 | -19 | -70 | 25 | 40 | 20 | 31 | 61 | 36 | 34 | 59 | 59 | 39 | 44 | 90 | 79 | 33 | 35 | 45 | 61 | 33 | 38 | 60 | 72 | 38 | 61 | 86 | 83 | 59 | 82 | 98 | 109 | 48 | 62 | ||||||||||||||||||||||||||||||||||||||
| Annual Adjusted EBITDA of Sales | 44 | 58 | |||||||||||||||||||||||||||||||||||||||||||||||||||||||||||||||||||||||||
| Adjusted Operating Income | (3083) | (6437) | (264) | 744 | (709) | (123) | 1829 | (7) | 54 | 2071 | 2182 | 600 | 972 | 4264 | 3460 | (40) | 271 | 885 | 2304 | 539 | 1147 | 2875 | 3852 | 1196 | 3435 | 6070 | 5570 | 3087 | 5979 | 7947 | 8850 | 4907 | 8314 | ||||||||||||||||||||||||||||||||||||||||||
| Consolidated Revenues | |||||||
| 2013 | 269503 | ||||||
| 2014 | 285693 | ||||||
| 2015 | 275834 | ||||||
| 2016 | 276573 | ||||||
| 2017 | 305907 | ||||||
| 2018 | 349637 | ||||||
| TTM 93019 | 368485 | ||||||
| Net Cash(Debt) | |||||||
| 2013 | (15380) | ||||||
| 2014 | 4207 | ||||||
| 2015 | 9840 | ||||||
| 2016 | 9580 | ||||||
| 2017 | (10127) | ||||||
| 2018 | 1060 | ||||||
| 93019 | 6431 | ||||||
| Rep Count | |||||||
| 2013 | 806 | ||||||
| 2014 | 916 | ||||||
| 2015 | 937 | ||||||
| 2016 | 1009 | ||||||
| 2017 | 983 | ||||||
| 2018 | 994 | ||||||
| 93019 | 993 | ||||||
| Adjusted OI | DampA | Adjusted EBITDA | |||||
| 2013 | 990 | 9030 | 10020 | ||||
| 2014 | 4907 | 8751 | 13658 | ||||
| 2015 | 8315 | 8543 | 17199 | ||||
| 2016 | 3388 | 8066 | 12065 | ||||
| 2017 | 15840 | ||||||
| 2018 | 25248 | ||||||
| TTM 93019 | 32230 | ||||||
| Reg G EBITDA By Quarter | |||||||
| Quarter | 2017 | 2018 | 2019 | ||||
| Q1 | 2852 | 5121 | 7457 | ||||
| Q2 | 4519 | 7749 | 9402 | ||||
| Q3 | 5443 | 7325 | 10318 | ||||
| Q4 | 3026 | 5053 |
| Months of Experience | Average Annual Sales | Number of Reps | |||
| lt 12 Mos | ERRORVALUE | ERRORVALUE | |||
| 1 - 2 Yrs | ERRORVALUE | ERRORVALUE | |||
| 3 - 5 Yrs | ERRORVALUE | ERRORVALUE | |||
| 5 - 10 Yrs | ERRORVALUE | ERRORVALUE | |||
| gt 10 Yrs | ERRORVALUE | ERRORVALUE | |||
| ERRORVALUE | |||||
| Excludes ISR MSS CRS | |||||
| Excludes Freight | |||||
| Product mix | ||||||||
| Verticals | Q3 2019 Sales | |||||||
| Fastening Systems | 240 | 22485606 | ||||||
| Fluid Power | 151 | 14156064 | ||||||
| Specialy Chemicals | 117 | 10917433 | ||||||
| Cutting Tools and Abrasives | 131 | 12296596 | ||||||
| Electrical | 104 | 9724849 | ||||||
| Aftermarket Automotive Supplies | 76 | 7154688 | ||||||
| Safety | 47 | 4445846 | ||||||
| Welding and Metal Repair | 13 | 1218030 | ||||||
| Other | 120 | 11237322 | ||||||
| Total | 100 | 93636434 | ||||||
| Verticals | YTD 2019 Sales | |||||||
| Fastening Systems | 24 | 66611555 | ||||||
| Fluid Power | 15 | 42224416 | ||||||
| Specialy Chemicals | 12 | 32166853 | ||||||
| Cutting Tools and Abrasives | 13 | 36587482 | ||||||
| Electrical | 11 | 30150144 | ||||||
| Aftermarket Automotive Supplies | 8 | 21960561 | ||||||
| Safety | 5 | 13072228 | ||||||
| Welding and Metal Repair | 2 | 4306548 | ||||||
| Other | 10 | 31279779 | ||||||
| Total | 100 | 278359566 |
| Lawson core customer mix | ||||||||
| Account Tyoe | Q3 | |||||||
| Regional Accounts | 43045893 | 45 | ||||||
| Strategic | 14086813 | 15 | ||||||
| Kent Automotive | 14300065 | 15 | ||||||
| Bolt Supply | 11318703 | 12 | ||||||
| Government | 10291732 | 11 | ||||||
| Screw Products | 0 | 0 | ||||||
| Other (1) | 1735236 | 2 | ||||||
| Total | 94778443 | 100 | ||||||
| Account Tyoe | YTD September | |||||||
| Regional Accounts | 131389537 | 47 | ||||||
| Strategic | 40364305 | 14 | ||||||
| Kent Automotive | 43371411 | 15 | ||||||
| Bolt Supply | 31324209 | 11 | ||||||
| Government | 29794959 | 11 | ||||||
| Screw Products | 0 | 0 | ||||||
| Other | 5974302 | 2 | ||||||
| Total | 282218723 | 100 | ||||||
| Total Reported |
| September 30 | December 31 | ||||||||||
| 2019 | 2018 | ||||||||||
| ASSETS | (Unaudited) | ||||||||||
| Current assets | |||||||||||
| Cash and cash equivalents | $ | 8626 | $ | 11883 | |||||||
| Restricted cash | 800 | 800 | |||||||||
| Accounts receivable less allowance for doubtful accounts of $614 and $549 respectively | 45162 | 37682 | |||||||||
| Inventories net | 54894 | 52887 | |||||||||
| Miscellaneous receivables and prepaid expenses | 4270 | 3653 | |||||||||
| Total current assets | 113752 | 106905 | |||||||||
| Property plant and equipment net | 16932 | 23548 | |||||||||
| Deferred income taxes | 17372 | 20592 | |||||||||
| Goodwill | 20582 | 20079 | |||||||||
| Cash value of life insurance | 14440 | 12599 | |||||||||
| Intangible assets net | 12468 | 13112 | |||||||||
| Lease assets | 11917 | mdash | |||||||||
| Other assets | 275 | 307 | |||||||||
| Total assets | $ | 207738 | $ | 197142 | |||||||
| LIABILITIES AND STOCKHOLDERSrsquo EQUITY | |||||||||||
| Current liabilities | |||||||||||
| Revolving lines of credit | $ | 2195 | $ | 10823 | |||||||
| Accounts payable | 16325 | 15207 | |||||||||
| Lease obligation | 3781 | mdash | |||||||||
| Accrued expenses and other liabilities | 37873 | 40179 | |||||||||
| Total current liabilities | 60174 | 66209 | |||||||||
| Security bonus plan | 11969 | 12413 | |||||||||
| Lease obligation | 10360 | 5213 | |||||||||
| Deferred compensation | 5915 | 5304 | |||||||||
| Deferred tax liability | 2879 | 2761 | |||||||||
| Other liabilities | 3460 | 6069 | |||||||||
| Total liabilities | 94757 | 97969 | |||||||||
| Stockholdersrsquo equity | |||||||||||
| Preferred stock $1 par value | |||||||||||
| Authorized - 500000 shares Issued and outstanding mdash None | mdash | mdash | |||||||||
| Common stock $1 par value | |||||||||||
| Authorized - 35000000 shares | 9043 | 9006 | |||||||||
| Issued - 9042597 and 9005716 shares respectively | |||||||||||
| Outstanding - 8956981 and 8955930 shares respectively | |||||||||||
| Capital in excess of par value | 17626 | 15623 | |||||||||
| Retained earnings | 89502 | 77338 | |||||||||
| Treasury stock ndash 85616 and 49786 shares respectively | (2595) | (1234) | |||||||||
| Accumulated other comprehensive loss | (595) | (1560) | |||||||||
| Total stockholdersrsquo equity | 112981 | 99173 | |||||||||
| Total liabilities and stockholdersrsquo equity | $ | 207738 | $ | 197142 | |||||||
| Three Months Ended | |||||||||||||||||||||||||||||
| Jun 30 2019 | Mar 31 2019 | Dec 31 2018 | Sep 30 2018 | Jun 30 2018 | |||||||||||||||||||||||||
| Average daily net sales | $ | 1502 | $ | 1450 | $ | 1414 | $ | 1405 | $ | 1412 | |||||||||||||||||||
| Year over year increase | 63 | 82 | 70 | 170 | 205 | ||||||||||||||||||||||||
| Sequential quarter increase (decrease) | 36 | 25 | 06 | (05) | 53 | ||||||||||||||||||||||||
| Net Sales | $ | 96097 | $ | 91343 | $ | 86266 | $ | 88530 | $ | 90382 | |||||||||||||||||||
| Gross profit (1) | 51043 | 48923 | 46083 | 48108 | 49131 | ||||||||||||||||||||||||
| Gross profit percentage (1) | 531 | 536 | 534 | 543 | 544 | ||||||||||||||||||||||||
| Selling general amp administrative expenses | $ | 49420 | $ | 43379 | $ | 41998 | $ | 50374 | $ | 43577 | |||||||||||||||||||
| Operating income (loss) | $ | 1623 | $ | 5544 | $ | 4085 | $ | (2266) | $ | 5554 | |||||||||||||||||||
| Full Year | |||||||||||||||||||||||||||||||||||||||||||||||||||||||||||||||||||||||||||
| ($ in thousands) | Q1 2011 | Q2 2011 | Q3 2011 | Q4 2011 | Q1 2012 | Q2 2012 | Q3 2012 | Q4 2012 | Q1 2013 | Q2 2013 | Q3 2013 | Q4 2013 | Q1 2014 | Q2 2014 | Q3 2014 | Q4 2014 | Q1 2015 | Q2 2015 | Q3 2015 | Q4 2015 | Q1 2016 | Q2 2016 | Q3 2016 | Q4 2016 | Q1 2017 | Q2 2017 | Q3 2017 | Q4 2017 | Q1 2018 | Q2 2018 | Q3 2018 | Q4 2018 | Q1 2019 | Q2 2019 | Q3 2019 | 2014 | 2015 | ||||||||||||||||||||||||||||||||||||||
| Net Sales | $ 79255 | $ 80625 | $ 71490 | $ 69029 | $ 71364 | $ 69830 | $ 67863 | $ 64505 | $ 67213 | $ 68317 | $ 68235 | $ 65738 | $ 69204 | $ 72080 | $ 74128 | $ 70281 | $ 69904 | $ 70726 | $ 70243 | $ 64961 | $ 69711 | $ 69348 | $ 70199 | $ 67315 | $ 74617 | $ 75006 | $ 75651 | $ 80633 | $ 84459 | $ 90382 | $ 88530 | $ 86266 | $ 91343 | $ 96097 | $ 94779 | $ 285693 | $ 275834 | ||||||||||||||||||||||||||||||||||||||
| Operating Income (Loss) | 3542 | 1397 | (3480) | (6995) | (3466) | (42084) | (1740) | 2057 | (3530) | (201) | 870 | (3002) | (4713) | 1241 | 678 | (2169) | (947) | 3243 | 2810 | (2985) | 1169 | 29 | 2389 | (5044) | 712 | 7891 | 1090 | 243 | 1837 | 5554 | (2266) | 4085 | 5544 | 1623 | 6446 | (4963) | 2121 | ||||||||||||||||||||||||||||||||||||||
| Depreciation amp Amortization | 1260 | 1315 | 1160 | 1675 | 1715 | 1566 | 1963 | 1841 | 2061 | 2244 | 2367 | 2358 | 2295 | 2163 | 2160 | 2133 | 2096 | 2126 | 2119 | 2202 | 2187 | 2226 | 1973 | 1680 | 1705 | 1644 | 1591 | 1830 | 1686 | 1679 | 1755 | 1735 | 1478 | 1455 | 1468 | 8751 | 8543 | ||||||||||||||||||||||||||||||||||||||
| EBITDA | 4802 | 2712 | (2320) | (5320) | (1751) | (40518) | 223 | 3898 | (1469) | 2043 | 3237 | (644) | (2418) | 3404 | 2838 | (36) | 1149 | 5369 | 4929 | (783) | 3356 | 2255 | 4362 | (3364) | 2417 | 9535 | 2681 | 2073 | 3523 | 7233 | (511) | 5820 | 7022 | 3078 | 7914 | 3788 | 10664 | ||||||||||||||||||||||||||||||||||||||
| Excluded Costs | |||||||||||||||||||||||||||||||||||||||||||||||||||||||||||||||||||||||||||
| Severance | 745 | 465 | 282 | 122 | 185 | 6585 | 1410 | (159) | - 0 | 2 | 962 | (127) | 728 | 290 | (328) | (59) | 571 | 50 | 372 | 280 | 204 | 143 | 367 | 1662 | 465 | (9) | 139 | 144 | 628 | 64 | 31 | 126 | 27 | 1485 | 30 | 631 | 1273 | ||||||||||||||||||||||||||||||||||||||
| Stock Based Compensation (Benefit) | 227 | (95) | (538) | 467 | 198 | (1015) | 77 | 434 | 1596 | 76 | 33 | 562 | 1125 | 408 | 2423 | 2443 | (541) | 971 | (30) | 1693 | (1217) | 515 | (630) | 3801 | (30) | 415 | 2337 | 384 | 970 | 87 | 7637 | (1186) | 408 | 4839 | 2374 | 6399 | 2093 | ||||||||||||||||||||||||||||||||||||||
| Acquisition Related Costs | - 0 | - 0 | - 0 | - 0 | - 0 | - 0 | 310 | 32 | 115 | 198 | 178 | 120 | - 0 | - 0 | 286 | 425 | - 0 | - 0 | 168 | 62 | - 0 | - 0 | - 0 | ||||||||||||||||||||||||||||||||||||||||||||||||||||
| ERP Implementation Costs | 1902 | 2388 | 2344 | 339 | - 0 | - 0 | - 0 | - 0 | - 0 | - 0 | - 0 | - 0 | - 0 | - 0 | - 0 | - 0 | - 0 | - 0 | - 0 | - 0 | - 0 | - 0 | - 0 | - 0 | - 0 | - 0 | - 0 | - 0 | - 0 | - 0 | - 0 | - 0 | - 0 | ||||||||||||||||||||||||||||||||||||||||||
| Loss(Gain) on Disposal of Property | - 0 | - 0 | - 0 | 22 | - 0 | (2122) | (11) | (1588) | - 0 | - 0 | (36) | 32 | - 0 | - 0 | 97 | 45 | - 0 | - 0 | (2) | 9 | - 0 | - 0 | - 0 | - 0 | - 0 | (5422) | - 0 | - 0 | - 0 | - 0 | - 0 | - 0 | - 0 | - 0 | - 0 | 142 | 7 | ||||||||||||||||||||||||||||||||||||||
| Legal Settlement | - 0 | - 0 | - 0 | - 0 | - 0 | - 0 | - 0 | - 0 | - 0 | - 0 | - 0 | - 0 | - 0 | - 0 | (688) | - 0 | - 0 | - 0 | - 0 | - 0 | - 0 | - 0 | - 0 | - 0 | - 0 | - 0 | - 0 | - 0 | - 0 | - 0 | - 0 | - 0 | (688) | - 0 | |||||||||||||||||||||||||||||||||||||||||
| Employment Tax Matter | - 0 | - 0 | - 0 | 1200 | - 0 | - 0 | - 0 | - 0 | - 0 | - 0 | - 0 | (400) | - 0 | - 0 | - 0 | - 0 | - 0 | - 0 | - 0 | - 0 | - 0 | - 0 | - 0 | - 0 | - 0 | - 0 | - 0 | - 0 | - 0 | - 0 | - 0 | - 0 | - 0 | - 0 | |||||||||||||||||||||||||||||||||||||||||
| Lease termination gain | - 0 | - 0 | - 0 | - 0 | - 0 | - 0 | - 0 | - 0 | - 0 | - 0 | - 0 | 2928 | - 0 | - 0 | - 0 | - 0 | - 0 | - 0 | - 0 | - 0 | - 0 | - 0 | - 0 | - 0 | - 0 | - 0 | - 0 | - 0 | - 0 | (164) | - 0 | - 0 | - 0 | - 0 | - 0 | - 0 | - 0 | ||||||||||||||||||||||||||||||||||||||
| Goodwill Impairment | - 0 | - 0 | - 0 | - 0 | - 0 | 28306 | - 0 | - 0 | - 0 | - 0 | - 0 | - 0 | - 0 | - 0 | - 0 | - 0 | - 0 | - 0 | - 0 | - 0 | - 0 | - 0 | - 0 | - 0 | - 0 | - 0 | - 0 | - 0 | - 0 | - 0 | - 0 | - 0 | - 0 | - 0 | |||||||||||||||||||||||||||||||||||||||||
| Inventory Rationalization | - 0 | - 0 | - 0 | - 0 | - 0 | 3893 | - 0 | - 0 | - 0 | - 0 | - 0 | - 0 | - 0 | - 0 | - 0 | - 0 | - 0 | - 0 | - 0 | - 0 | - 0 | - 0 | - 0 | - 0 | - 0 | - 0 | - 0 | - 0 | - 0 | - 0 | - 0 | - 0 | - 0 | - 0 | |||||||||||||||||||||||||||||||||||||||||
| Discontinued operation accrual | - 0 | - 0 | - 0 | - 0 | - 0 | - 0 | - 0 | - 0 | - 0 | - 0 | - 0 | - 0 | - 0 | - 0 | - 0 | 340 | - 0 | - 0 | - 0 | 931 | - 0 | - 0 | - 0 | - 0 | - 0 | - 0 | - 0 | - 0 | - 0 | 529 | - 0 | - 0 | - 0 | - 0 | - 0 | 340 | 931 | ||||||||||||||||||||||||||||||||||||||
| North American sales meeting | - 0 | - 0 | - 0 | - 0 | - 0 | - 0 | - 0 | - 0 | 1225 | - 0 | - 0 | - 0 | - 0 | - 0 | - 0 | - 0 | 1889 | - 0 | - 0 | - 0 | - 0 | - 0 | - 0 | - 0 | - 0 | - 0 | - 0 | - 0 | - 0 | - 0 | - 0 | - 0 | - 0 | 1889 | |||||||||||||||||||||||||||||||||||||||||
| Property Impairment Loss | - 0 | - 0 | - 0 | - 0 | - 0 | - 0 | - 0 | - 0 | - 0 | - 0 | - 0 | - 0 | 2914 | 132 | - 0 | - 0 | - 0 | - 0 | - 0 | - 0 | - 0 | - 0 | - 0 | - 0 | - 0 | - 0 | - 0 | - 0 | - 0 | - 0 | - 0 | - 0 | 3046 | - 0 | |||||||||||||||||||||||||||||||||||||||||
| Building Impairment | - 0 | - 0 | - 0 | - 0 | - 0 | - 0 | - 0 | 231 | - 0 | - 0 | - 0 | ||||||||||||||||||||||||||||||||||||||||||||||||||||||||||||||||
| Reg G Adjusted EBITDA | $ 7676 | $ 5470 | $ (232) | $ (3170) | $ (1368) | $ (4871) | $ 1699 | $ 2585 | $ 1352 | $ 2121 | $ 4196 | $ 2351 | $ 2349 | $ 4234 | $ 4342 | $ 2733 | $ 3068 | $ 6390 | $ 5579 | $ 2162 | $ 2458 | $ 3111 | $ 4277 | $ 2219 | $ 2852 | $ 4519 | $ 5443 | $ 3026 | $ 5121 | $ 7749 | $ 7325 | $ 5053 | $ 7457 | $ 9402 | $ 10318 | $ 13658 | $ 17199 | ||||||||||||||||||||||||||||||||||||||
| Adjusted EBITDA of Sales | 97 | 68 | -03 | -46 | -19 | -70 | 25 | 40 | 20 | 31 | 61 | 36 | 34 | 59 | 59 | 39 | 44 | 90 | 79 | 33 | 35 | 45 | 61 | 33 | 38 | 60 | 72 | 38 | 61 | 86 | 83 | 59 | 82 | 98 | 109 | 48 | 62 | ||||||||||||||||||||||||||||||||||||||
| Annual Adjusted EBITDA of Sales | 44 | 58 | |||||||||||||||||||||||||||||||||||||||||||||||||||||||||||||||||||||||||
| Adjusted Operating Income | (3083) | (6437) | (264) | 744 | (709) | (123) | 1829 | (7) | 54 | 2071 | 2182 | 600 | 972 | 4264 | 3460 | (40) | 271 | 885 | 2304 | 539 | 1147 | 2875 | 3852 | 1196 | 3435 | 6070 | 5570 | 3087 | 5979 | 7947 | 8850 | 4907 | 8314 | ||||||||||||||||||||||||||||||||||||||||||
| Consolidated Revenues | |||||||
| 2013 | 269503 | ||||||
| 2014 | 285693 | ||||||
| 2015 | 275834 | ||||||
| 2016 | 276573 | ||||||
| 2017 | 305907 | ||||||
| 2018 | 349637 | ||||||
| TTM 63019 | 362236 | ||||||
| Net Cash(Debt) | |||||||
| 2013 | (15380) | ||||||
| 2014 | 4207 | ||||||
| 2015 | 9840 | ||||||
| 2016 | 9580 | ||||||
| 2017 | (10127) | ||||||
| 2018 | 1060 | ||||||
| 63019 | (1908) | ||||||
| Rep Count | |||||||
| 2013 | 806 | ||||||
| 2014 | 916 | ||||||
| 2015 | 937 | ||||||
| 2016 | 1009 | ||||||
| 2017 | 983 | ||||||
| 2018 | 994 | ||||||
| 63019 | 982 | ||||||
| Adjusted OI | DampA | Adjusted EBITDA | |||||
| 2013 | 990 | 9030 | 10020 | ||||
| 2014 | 4907 | 8751 | 13658 | ||||
| 2015 | 8315 | 8543 | 17199 | ||||
| 2016 | 3388 | 8066 | 12065 | ||||
| 2017 | 15840 | ||||||
| 2018 | 25248 | ||||||
| TTM 63019 | 29237 | ||||||
| Reg G EBITDA By Quarter | |||||||
| Quarter | 2017 | 2018 | 2019 | ||||
| Q1 | 2852 | 5121 | 7457 | ||||
| Q2 | 4519 | 7749 | 9402 | ||||
| Q3 | 5443 | 7325 | |||||
| Q4 | 3026 | 5053 |
| Months of Experience | Average Annual Sales | Number of Reps | |||
| lt 12 Mos | ERRORVALUE | ERRORVALUE | |||
| 1 - 2 Yrs | ERRORVALUE | ERRORVALUE | |||
| 3 - 5 Yrs | ERRORVALUE | ERRORVALUE | |||
| 5 - 10 Yrs | ERRORVALUE | ERRORVALUE | |||
| gt 10 Yrs | ERRORVALUE | ERRORVALUE | |||
| ERRORVALUE | |||||
| Excludes ISR MSS CRS | |||||
| Excludes Freight | |||||
| Product mix | ||||||||
| Verticals | Q2 2019 Sales | |||||||
| Fastening Systems | 243 | 23008646 | ||||||
| Fluid Power | 152 | 14395529 | ||||||
| Specialy Chemicals | 117 | 11074332 | ||||||
| Cutting Tools and Abrasives | 130 | 12319702 | ||||||
| Electrical | 107 | 10102828 | ||||||
| Aftermarket Automotive Supplies | 77 | 7255974 | ||||||
| Safety | 47 | 4458217 | ||||||
| Welding and Metal Repair | 16 | 1539172 | ||||||
| Other | 112 | 10633378 | ||||||
| Total | 100 | 94787779 | ||||||
| Verticals | YTD 2019 Sales | |||||||
| Fastening Systems | 24 | 44125949 | ||||||
| Fluid Power | 15 | 28068352 | ||||||
| Specialy Chemicals | 12 | 21249420 | ||||||
| Cutting Tools and Abrasives | 13 | 24290887 | ||||||
| Electrical | 11 | 20425294 | ||||||
| Aftermarket Automotive Supplies | 8 | 14805874 | ||||||
| Safety | 5 | 8626381 | ||||||
| Welding and Metal Repair | 2 | 3088518 | ||||||
| Other | 10 | 20042457 | ||||||
| Total | 100 | 184723132 |
| Lawson core customer mix | ||||||||
| Account Tyoe | Q2 | |||||||
| Regional Accounts | 44933707 | 47 | ||||||
| Strategic | 13542786 | 14 | ||||||
| Kent Automotive | 14370813 | 15 | ||||||
| Bolt Supply | 11129675 | 12 | ||||||
| Government | 10087561 | 10 | ||||||
| Screw Products | 0 | 0 | ||||||
| Other (1) | 1428268 | 1 | ||||||
| Total | 96097363 | 100 | ||||||
| Account Tyoe | YTD June | |||||||
| Regional Accounts | 88400675 | 47 | ||||||
| Strategic | 26218365 | 14 | ||||||
| Kent Automotive | 29071347 | 16 | ||||||
| Bolt Supply | 20005505 | 11 | ||||||
| Government | 19505323 | 10 | ||||||
| Screw Products | 0 | 0 | ||||||
| Other | 4239066 | 2 | ||||||
| Total | 187440280 | 100 | ||||||
| Total Reported |
| August 2011 | OslashImplemented SAP | ||
| October 2011 | OslashCommenced construction of new McCook Ill distribution center | ||
| May 2012 | OslashRelocated corporate headquarters | ||
| June 2012 | OslashRestructured senior team Announced $20M cost savings plan | ||
| August 2012 | OslashTransitioned packaging facility to McCook Ill distribution center | ||
| OslashEntered into new five-year $40M credit facility | |||
| October 2012 | OslashAnnounced new CEO and President Michael G DeCata | ||
| OslashConsolidated Vernon Hills distribution center into McCook Ill | |||
| November 2012 | OslashRolled out new website to existing web customers | ||
| December 2012 | OslashCompleted transition of US independent agents to employees | ||
| April 2013 | OslashRoll-out of new website to new web customers | ||
| AprilMay 2013 | OslashMcCook DC begins to ship customer orders | ||
| November 2013 | OslashEntered into sub-lease of headquarters space to generate $29M of future cash savings | ||
| December 2013 | OslashEnded year with over 800 sales reps ndash First increase in 8 years | ||
| February 2014 | OslashClosed on Automatic Screw Machine Products sale for net proceeds of $121M | ||
| June 2014 | OslashEntered into sale-leaseback of Reno distribution facility for net proceeds of $83M | ||
| December 2014 | OslashEnded year with over 900 sales reps | ||
| February 2015 | OslashHeld North American sales meeting | ||
| September 2015 | OslashCompleted West Coast Fasteners acquisition | ||
| March 2016 | OslashCompleted Perfect Products of Michigan acquisition | ||
| May 2016 | OslashCompleted F B Feeney acquisition | ||
| June 2016 | OslashExpanded sales team to over 1000 sales reps | ||
| September 2016 | OslashExtended credit facitlity to August 2020 | ||
| November 2016 | OslashCompleted Mattic Industries acquisition | ||
| March 2017 | OslashConsolidated Fairfield NJ distribution operations into McCook Ill and Suwanee GA | ||
| May 2017 | OslashSold Fairfield NJ distribution center for a gain of $54M | ||
| October 2017 | OslashCompleted Bolt Supply House acquisition | ||
| April 2018 | OslashOpened MRO distribution center in Calgary Canada | ||
| October 2018 | OslashCompleted Screw Products acquisition and added Bolt Supply branch | ||
| June 2019 | OslashAchieved Q2 98 adjusted EBITDA net of ASC 842 impact of 03 | ||
| September 2019 | OslashAchieved Q3 109 adjusted EBITDA hired VP MampA | ||
| October 2019 | OslashEntered into new five-year $100M credit facility with additional $50 million accordion feature |
| ($ in thousands) | Q3 2013 | Q4 2013 | Q1 2014 | Q2 2014 | Q3 2014 | Q4 2014 | Q1 2015 | Q2 2015 | Q3 2015 | Q4 2015 | Q1 2016 | Q2 2016 | Q3 2016 | Q4 2016 | Q1 2017 | Q2 2017 | Q3 2017 | Q4 2017 | ||||||||||||||||||||||||||||||||||||||||||||||
| SGampA | 40350 | 42856 | 45991 | 42562 | 43855 | 44764 | 43830 | 40565 | 40532 | 41145 | 41290 | 42497 | 40184 | 45548 | 44167 | 42672 | 44915 | 46750 | $ 173014 | |||||||||||||||||||||||||||||||||||||||||||||
| $ - | ||||||||||||||||||||||||||||||||||||||||||||||||||||||||||||||||
| Excluded Costs | $ - | 40196 | ||||||||||||||||||||||||||||||||||||||||||||||||||||||||||||||
| Severance | (962) | 127 | (728) | (290) | 328 | 59 | (571) | (50) | (372) | (280) | (204) | (143) | (367) | (1662) | (465) | 9 | (139) | (144) | $ (234) | 127 | ||||||||||||||||||||||||||||||||||||||||||||
| Stock Based Compensation (Benefit) | (33) | (562) | (1125) | (408) | (2423) | (2443) | 541 | (971) | 30 | (1693) | 1217 | (515) | 630 | (3801) | 30 | (415) | (2337) | (384) | $ (5296) | -32 | ||||||||||||||||||||||||||||||||||||||||||||
| Loss(Gain) on Disposal of Property | 36 | (32) | - 0 | - 0 | (97) | (45) | - 0 | - 0 | 2 | (9) | - 0 | - 0 | - 0 | - 0 | - 0 | - 0 | - 0 | - 0 | $ (142) | |||||||||||||||||||||||||||||||||||||||||||||
| Legal Settlement | - 0 | - 0 | - 0 | - 0 | 688 | - 0 | - 0 | - 0 | - 0 | - 0 | - 0 | - 0 | - 0 | - 0 | - 0 | - 0 | - 0 | - 0 | $ 688 | -562 | ||||||||||||||||||||||||||||||||||||||||||||
| Employment Tax Matter | - 0 | 400 | - 0 | - 0 | - 0 | - 0 | - 0 | - 0 | - 0 | - 0 | - 0 | - 0 | - 0 | - 0 | - 0 | - 0 | - 0 | - 0 | $ - | 39729 | ||||||||||||||||||||||||||||||||||||||||||||
| Loss on Sub-Lease | - 0 | (2928) | - 0 | - 0 | - 0 | - 0 | - 0 | - 0 | - 0 | - 0 | - 0 | - 0 | - 0 | - 0 | - 0 | - 0 | - 0 | - 0 | $ - | |||||||||||||||||||||||||||||||||||||||||||||
| National sales meeting | - 0 | - 0 | - 0 | - 0 | - 0 | - 0 | (1889) | - 0 | - 0 | - 0 | - 0 | - 0 | - 0 | - 0 | - 0 | - 0 | - 0 | - 0 | $ (1889) | |||||||||||||||||||||||||||||||||||||||||||||
| Remediation expense | - 0 | - 0 | - 0 | - 0 | - 0 | (340) | - 0 | - 0 | - 0 | - 0 | - 0 | - 0 | - 0 | - 0 | - 0 | - 0 | - 0 | - 0 | $ (340) | |||||||||||||||||||||||||||||||||||||||||||||
| Property Impairment Loss | - 0 | - 0 | (2914) | (132) | - 0 | - 0 | - 0 | - 0 | - 0 | - 0 | - 0 | - 0 | - 0 | - 0 | - 0 | - 0 | - 0 | - 0 | $ - | |||||||||||||||||||||||||||||||||||||||||||||
| Adjusted SGampA | $ 39391 | $ 39861 | $ 41224 | $ 41732 | $ 42351 | $ 41995 | $ 41911 | $ 39544 | $ 40192 | $ 39163 | $ 42303 | $ 41839 | $ 40447 | $ 40085 | $ 43732 | $ 42266 | $ 42439 | $ 46222 | $ 165801 | |||||||||||||||||||||||||||||||||||||||||||||
| Annual Adjusted EBITDA of Sales | ERRORREF | ERRORREF | ||||||||||||||||||||||||||||||||||||||||||||||||||||||||||||||
| Q1 2013 | Q2 2013 | Q3 2013 | Q4 2013 | Q1 2014 | Q2 2014 | Q3 2014 | Q4 2014 | Q1 2015 | |||||||||||
| Selling Days | 63 | 64 | 64 | 61 | 63 | 64 | 64 | 61 | 63 | ||||||||||
| Net Sales | 67213 | 68317 | 68235 | 65738 | 69204 | 72080 | 74128 | 70281 | 69904 | ||||||||||
| Average Daily Sales | 1067 | 1067 | 1066 | 1078 | 1098 | 1126 | 1158 | 1152 | 1110 | ||||||||||
| Average Sales Rep Count | 762 | 764 | 774 | 794 | 819 | 854 | 882 | 908 | 911 | ||||||||||
| Sales per Sales Rep per Day | 1400 | 1397 | 1377 | 1358 | 1341 | 1319 | 1313 | 1269 | 1218 | ||||||||||
| Full Year | ||||||||||||||||||||||||||||||||||||||||||||||||||||||||||||||||||||
| ($ in thousands) | Q1 2011 | Q2 2011 | Q3 2011 | Q4 2011 | Q1 2012 | Q2 2012 | Q3 2012 | Q4 2012 | Q1 2013 | Q2 2013 | Q3 2013 | Q4 2013 | Q1 2014 | Q2 2014 | Q3 2014 | Q4 2014 | Q1 2015 | Q2 2015 | Q3 2015 | Q4 2015 | Q1 2016 | Q2 2016 | Q3 2016 | Q4 2016 | Q1 2017 | Q2 2017 | Q3 2017 | Q4 2017 | Q1 2018 | Q2 2018 | Q3 2018 | 2014 | 2015 | |||||||||||||||||||||||||||||||||||
| Net Sales | $ 79255 | $ 80625 | $ 71490 | $ 69029 | $ 71364 | $ 69830 | $ 67863 | $ 64505 | $ 67213 | $ 68317 | $ 68235 | $ 65738 | $ 69204 | $ 72080 | $ 74128 | $ 70281 | $ 69904 | $ 70726 | $ 70243 | $ 64961 | $ 69711 | $ 69348 | $ 70199 | $ 67315 | $ 74617 | $ 75006 | $ 75651 | $ 80633 | $ 84459 | $ 90382 | $ 88530 | $ 285693 | $ 275834 | |||||||||||||||||||||||||||||||||||
| Operating Income (Loss) | 3542 | 1397 | (3480) | (6995) | (3466) | (42084) | (1740) | 2057 | (3530) | (201) | 870 | (3002) | (4713) | 1241 | 678 | (2169) | (947) | 3243 | 2810 | (2985) | 1169 | 29 | 2389 | (5044) | 712 | 7891 | 1090 | 243 | 1837 | 5554 | (2266) | (4963) | 2121 | |||||||||||||||||||||||||||||||||||
| Depreciation amp Amortization | 1260 | 1315 | 1160 | 1675 | 1715 | 1566 | 1963 | 1841 | 2061 | 2244 | 2367 | 2358 | 2295 | 2163 | 2160 | 2133 | 2096 | 2126 | 2119 | 2202 | 2187 | 2226 | 1973 | 1680 | 1705 | 1644 | 1591 | 1830 | 1686 | 1679 | 1755 | 8751 | 8543 | |||||||||||||||||||||||||||||||||||
| EBITDA | 4802 | 2712 | (2320) | (5320) | (1751) | (40518) | 223 | 3898 | (1469) | 2043 | 3237 | (644) | (2418) | 3404 | 2838 | (36) | 1149 | 5369 | 4929 | (783) | 3356 | 2255 | 4362 | (3364) | 2417 | 9535 | 2681 | 2073 | 3523 | 7233 | (511) | 3788 | 10664 | |||||||||||||||||||||||||||||||||||
| Excluded Costs | ||||||||||||||||||||||||||||||||||||||||||||||||||||||||||||||||||||
| Severance | 745 | 465 | 282 | 122 | 185 | 6585 | 1410 | (159) | - 0 | 2 | 962 | (127) | 728 | 290 | (328) | (59) | 571 | 50 | 372 | 280 | 204 | 143 | 367 | 1662 | 465 | (9) | 139 | 144 | 628 | 64 | 31 | 631 | 1273 | |||||||||||||||||||||||||||||||||||
| Stock Based Compensation (Benefit) | 227 | (95) | (538) | 467 | 198 | (1015) | 77 | 434 | 1596 | 76 | 33 | 562 | 1125 | 408 | 2423 | 2443 | (541) | 971 | (30) | 1693 | (1217) | 515 | (630) | 3801 | (30) | 415 | 2337 | 384 | 970 | 87 | 7637 | 6399 | 2093 | |||||||||||||||||||||||||||||||||||
| Acquisition Related Costs | - 0 | - 0 | - 0 | - 0 | - 0 | - 0 | 310 | 32 | 115 | 198 | 178 | 120 | - 0 | - 0 | 286 | 425 | - 0 | - 0 | 168 | |||||||||||||||||||||||||||||||||||||||||||||||||
| ERP Implementation Costs | 1902 | 2388 | 2344 | 339 | - 0 | - 0 | - 0 | - 0 | - 0 | - 0 | - 0 | - 0 | - 0 | - 0 | - 0 | - 0 | - 0 | - 0 | - 0 | - 0 | - 0 | - 0 | - 0 | - 0 | - 0 | - 0 | - 0 | - 0 | - 0 | - 0 | - 0 | - 0 | ||||||||||||||||||||||||||||||||||||
| Loss(Gain) on Disposal of Property | - 0 | - 0 | - 0 | 22 | - 0 | (2122) | (11) | (1588) | - 0 | - 0 | (36) | 32 | - 0 | - 0 | 97 | 45 | - 0 | - 0 | (2) | 9 | - 0 | - 0 | - 0 | - 0 | - 0 | (5422) | - 0 | - 0 | - 0 | - 0 | - 0 | 142 | 7 | |||||||||||||||||||||||||||||||||||
| Legal Settlement | - 0 | - 0 | - 0 | - 0 | - 0 | - 0 | - 0 | - 0 | - 0 | - 0 | - 0 | - 0 | - 0 | - 0 | (688) | - 0 | - 0 | - 0 | - 0 | - 0 | - 0 | - 0 | - 0 | - 0 | - 0 | - 0 | - 0 | - 0 | - 0 | - 0 | - 0 | (688) | - 0 | |||||||||||||||||||||||||||||||||||
| Employment Tax Matter | - 0 | - 0 | - 0 | 1200 | - 0 | - 0 | - 0 | - 0 | - 0 | - 0 | - 0 | (400) | - 0 | - 0 | - 0 | - 0 | - 0 | - 0 | - 0 | - 0 | - 0 | - 0 | - 0 | - 0 | - 0 | - 0 | - 0 | - 0 | - 0 | - 0 | - 0 | - 0 | - 0 | |||||||||||||||||||||||||||||||||||
| Lease termination gain | - 0 | - 0 | - 0 | - 0 | - 0 | - 0 | - 0 | - 0 | - 0 | - 0 | - 0 | 2928 | - 0 | - 0 | - 0 | - 0 | - 0 | - 0 | - 0 | - 0 | - 0 | - 0 | - 0 | - 0 | - 0 | - 0 | - 0 | - 0 | - 0 | (164) | - 0 | - 0 | - 0 | |||||||||||||||||||||||||||||||||||
| Goodwill Impairment | - 0 | - 0 | - 0 | - 0 | - 0 | 28306 | - 0 | - 0 | - 0 | - 0 | - 0 | - 0 | - 0 | - 0 | - 0 | - 0 | - 0 | - 0 | - 0 | - 0 | - 0 | - 0 | - 0 | - 0 | - 0 | - 0 | - 0 | - 0 | - 0 | - 0 | - 0 | - 0 | - 0 | |||||||||||||||||||||||||||||||||||
| Inventory Rationalization | - 0 | - 0 | - 0 | - 0 | - 0 | 3893 | - 0 | - 0 | - 0 | - 0 | - 0 | - 0 | - 0 | - 0 | - 0 | - 0 | - 0 | - 0 | - 0 | - 0 | - 0 | - 0 | - 0 | - 0 | - 0 | - 0 | - 0 | - 0 | - 0 | - 0 | - 0 | - 0 | - 0 | |||||||||||||||||||||||||||||||||||
| Discontinued operation accrual | - 0 | - 0 | - 0 | - 0 | - 0 | - 0 | - 0 | - 0 | - 0 | - 0 | - 0 | - 0 | - 0 | - 0 | - 0 | 340 | - 0 | - 0 | - 0 | 931 | - 0 | - 0 | - 0 | - 0 | - 0 | - 0 | - 0 | - 0 | - 0 | 529 | - 0 | 340 | 931 | |||||||||||||||||||||||||||||||||||
| North American sales meeting | - 0 | - 0 | - 0 | - 0 | - 0 | - 0 | - 0 | - 0 | 1225 | - 0 | - 0 | - 0 | - 0 | - 0 | - 0 | - 0 | 1889 | - 0 | - 0 | - 0 | - 0 | - 0 | - 0 | - 0 | - 0 | - 0 | - 0 | - 0 | - 0 | - 0 | - 0 | - 0 | 1889 | |||||||||||||||||||||||||||||||||||
| Property Impairment Loss | - 0 | - 0 | - 0 | - 0 | - 0 | - 0 | - 0 | - 0 | - 0 | - 0 | - 0 | - 0 | 2914 | 132 | - 0 | - 0 | - 0 | - 0 | - 0 | - 0 | - 0 | - 0 | - 0 | - 0 | - 0 | - 0 | - 0 | - 0 | - 0 | - 0 | - 0 | 3046 | - 0 | |||||||||||||||||||||||||||||||||||
| Adjusted EBITDA | $ 7676 | $ 5470 | $ (232) | $ (3170) | $ (1368) | $ (4871) | $ 1699 | $ 2585 | $ 1352 | $ 2121 | $ 4196 | $ 2351 | $ 2349 | $ 4234 | $ 4342 | $ 2733 | $ 3068 | $ 6390 | $ 5579 | $ 2162 | $ 2458 | $ 3111 | $ 4277 | $ 2219 | $ 2852 | $ 4519 | $ 5443 | $ 3026 | $ 5121 | $ 7749 | $ 7325 | $ 13658 | $ 17199 | |||||||||||||||||||||||||||||||||||
| Adjusted EBITDA of Sales | 97 | 68 | -03 | -46 | -19 | -70 | 25 | 40 | 20 | 31 | 61 | 36 | 34 | 59 | 59 | 39 | 44 | 90 | 79 | 33 | 35 | 45 | 61 | 33 | 38 | 60 | 72 | 38 | 61 | 86 | 83 | 48 | 62 | |||||||||||||||||||||||||||||||||||
| Annual Adjusted EBITDA of Sales | 44 | 58 | ||||||||||||||||||||||||||||||||||||||||||||||||||||||||||||||||||
| Adjusted Operating Income | (3083) | (6437) | (264) | 744 | (709) | (123) | 1829 | (7) | 54 | 2071 | 2182 | 600 | 972 | 4264 | 3460 | (40) | 271 | 885 | 2304 | 539 | 1147 | 2875 | 3852 | 1196 | 3435 | 6070 | 5570 | - 0 | 4907 | 8314 | ||||||||||||||||||||||||||||||||||||||

copy 2019 Lawson Products Inc All rights reserved Confidential Material Reproduction In Whole or in Part Prohibited
Lawson Products Poised for Growth
bull Leverage Current Infrastructure
bull Continued Sales Growth
bull Foundational Investments Completed
bull Operational Excellence
bull Large Fragmented Market
13
copy 2019 Lawson Products Inc All rights reserved Confidential Material Reproduction In Whole or in Part Prohibited
For More Information
Contact
Ronald J KnutsonEVP CFOInvestor Relations(773) 304-5665ronknutsonlawsonproductscom
And see our Website athttpwwwlawsonproductscomcompany-infoinvestor-relationsjsp
14
copy 2019 Lawson Products Inc All rights reserved Confidential Material Reproduction In Whole or in Part Prohibited
Appendices
15
copy 2019 Lawson Products Inc All rights reserved Confidential Material Reproduction In Whole or in Part Prohibited
Significant Activities
16
Appendix P-1
August 2011 Implemented SAPOctober 2011 Commenced construction of new McCook Ill distribution center
May 2012 Relocated corporate headquartersJune 2012 Restructured senior team Announced $20M cost savings plan
Transitioned packaging facility to McCook Ill distribution centerEntered into new five-year $40M credit facilityAnnounced new CEO and President Michael G DeCataConsolidated Vernon Hills distribution center into McCook Ill
November 2012 Rolled out new website to existing web customersDecember 2012 Completed transition of US independent agents to employees
April 2013 Roll-out of new website to new web customersAprilMay 2013 McCook DC begins to ship customer ordersNovember 2013 Entered into sub-lease of headquarters space to generate $29M of future cash savingsDecember 2013 Ended year with over 800 sales reps ndash First increase in 8 yearsFebruary 2014 Closed on Automatic Screw Machine Products sale for net proceeds of $121M
June 2014 Entered into sale-leaseback of Reno distribution facility for net proceeds of $83MDecember 2014 Ended year with over 900 sales repsFebruary 2015 Held North American sales meeting
September 2015 Completed West Coast Fasteners acquisitionMarch 2016 Completed Perfect Products of Michigan acquisitionMay 2016 Completed F B Feeney acquisitionJune 2016 Expanded sales team to over 1000 sales reps
September 2016 Extended credit facitlity to August 2020November 2016 Completed Mattic Industries acquisition
March 2017 Consolidated Fairfield NJ distribution operations into McCook Ill and Suwanee GAMay 2017 Sold Fairfield NJ distribution center for a gain of $54M
October 2017 Completed Bolt Supply House acquisitionApril 2018 Opened MRO distribution center in Calgary Canada
October 2018 Completed Screw Products acquisition and added Bolt Supply branchJune 2019 Achieved Q2 98 adjusted EBITDA net of ASC 842 impact of 03
September 2019 Achieved Q3 109 adjusted EBITDA hired VP MampAOctober 2019 Entered into new five-year $100M credit facility with additional $50 million accordion feature
August 2012
October 2012
Adjusted EBITDA $ in 000s
Adjusted EBITDA Q4 2016Q1 2017Q2 2017Q3 2017Q4 201722192852451954433026
Adjusted EBITDA of Sales
Adjusted EBITDA of SalesQ3 2016Q4 2016Q1 2017Q2 2017Q3 2017Q4 201760926793828971926E-232964421005719377E-23822185292895721E-260248513452257152E-271948817596594883E-237528059231332088E-2
Adjusted Operating Income of Sales
Adjusted Operating IncomeQ3 2016Q4 2016Q1 2017Q2 2017Q3 2017Q4 201723045391147287538521196
Adjusted Op Inc $ in 000s
Adjusted EBITDA Q4 2016Q1 2017Q2 2017Q3 2017Q4 20175391147287538521196
Net Sales by Quarter $ in 000s
Net SalesQ1 2013Q2 2013Q3 2013Q4 2013Q1 2014Q2 2014Q3 2014Q4 2014Q1 2015672136831768235657386920472080741287028169904
Adjusted SGampA $ in 000s
Adjusted SGampA Q4 2015Q1 2016Q2 2016Q3 2016Q4 2016Q1 2017Q2 2017Q3 2017Q4 2017391634230341839404474008543732422664243946222
copy 2019 Lawson Products Inc All rights reserved Confidential Material Reproduction In Whole or in Part Prohibited
Regulation G ndash GAAP ReconciliationAppendix P-2
Non GAAP Reconciliation of Adjusted EBITDA to Sales Percentage
The Company reports its financial results in accordance with US generally accepted accounting principles (GAAP) However the Companys management believesthat certain non-GAAP financial measures may provide users of this financial information additional meaningful comparisons between current results and results inprior operating periods Management believes that these non-GAAP financial measures can provide additional meaningful reflection of underlying trends of thebusiness because they provide a comparison of historical information that excludes certain non-operational non-recurring or intermittently recurring items thatimpact the overall comparability See the table below for supplemental financial data and corresponding reconciliations to GAAP financial measures for quarterlyadjusted EBITDA as a percentage of net sales Non-GAAP financial measures should be viewed in addition to and not as an alternative for the Companys reportedresults prepared in accordance with GAAP
17
($ in thousands) Q1 2017 Q2 2017 Q3 2017 Q4 2017 Q1 2018 Q2 2018 Q3 2018 Q4 2018 Q1 2019 Q2 2019 Q3 2019
Net Sales 74617$ 75006$ 75651$ 80633$ 84459$ 90382$ 88530$ 86266$ 91343$ 96097$ 94779$
Operating Income (Loss) 712 7891 1090 243 1837 5554 (2266) 4085 5544 1623 6446 Depreciation amp Amortization 1705 1644 1591 1830 1686 1679 1755 1735 1478 1455 1468 EBITDA 2417 9535 2681 2073 3523 7233 (511) 5820 7022 3078 7914
Excluded CostsSeverance 465 (9) 139 144 628 64 31 126 27 1485 30 Stock Based Compensation (Benefit) (30) 415 2337 384 970 87 7637 (1186) 408 4839 2374 Acquisition Related Costs - - 286 425 - - 168 62 - - - Loss(Gain) on Disposal of Property - (5422) - - - - - - - - - Lease termination gain - - - - - (164) - - - - - Discontinued operation accrual - - - - - 529 - - - - - Building Impairment - - - - - - - 231 - - - Reg G Adjusted EBITDA 2852$ 4519$ 5443$ 3026$ 5121$ 7749$ 7325$ 5053$ 7457$ 9402$ 10318$
Adjusted EBITDA of Sales 38 60 72 38 61 86 83 59 82 98 109
Customer Mix
Regional Accounts48
Kent Automotive16
Regional AccountsStrategicKent AutomotiveBolt SupplyGovernment Screw ProductsOther047014000000000000001016011010002
ampDampF ampA
Product Mix
Fastening Systems23
Specialty Chemicals12
Fastening SystemsFluid PowerSpecialy ChemicalsCutting Tools and AbrasivesElectricalAftermarket Automotive SuppliesSafetyWelding and Metal RepairOther02401501201301100800500201
Number Of Sales Reps
Tenure With Lawson (as of 63019)
Average Annual Sales
Consolidated Revenues
Consolidated Revenues20142015201620172018TTM 63019285693275834276573305907349637362236Net Cash(Debt)2014201520162017201843646420798409580-101271060-1908Rep Count201320142015201620172018436468069169371009983994982
Adjusted Reg G EBITDA
Adjusted EBITDA20142015201620172018TTM 63019136581719912065158402524829237
Quarterly Adjusted Reg G EBITDA
2017Q1Q2Q3Q428524519544330262018Q1Q2Q3Q451217749732550532019Q1Q2Q3Q474579402
Adjusted EBITDA $ in 000s
Reg G Adjusted EBITDA Q1 2017Q2 2017Q3 2017Q4 20172852451954433026
Adjusted EBITDA of Sales
Adjusted EBITDA of SalesQ1 2017Q2 2017Q3 2017Q4 20173822185292895721E-260248513452257152E-271948817596594883E-237528059231332088E-2
Adjusted Operating Income of Sales
Adjusted Operating IncomeQ1 2017Q2 2017Q3 2017Q4 2017
Adjusted Op Inc $ in 000s
Reg G Adjusted EBITDA Q1 2017Q2 2017Q3 2017Q4 2017
copy 2019 Lawson Products Inc All rights reserved Confidential Material Reproduction In Whole or in Part Prohibited
Consolidated Balance Sheet Appendix P-4
18
ASSETSCurrent assetsCash and cash equivalents $ 8626 $ 11883Restricted cash 800 800Accounts receivable less allowance for doubtful accounts of $614 and $549 respectively
45162 37682
Inventories net 54894 52887Miscellaneous receivables and prepaid expenses 4270 3653Total current assets 113752 106905
Property plant and equipment net 16932 23548Deferred income taxes 17372 20592Goodwill 20582 20079Cash value of life insurance 14440 12599Intangible assets net 12468 13112Lease assets 11917 mdashOther assets 275 307Total assets $ 207738 $ 197142
LIABILITIES AND STOCKHOLDERSrsquo EQUITYCurrent liabilitiesRevolving lines of credit $ 2195 $ 10823Accounts payable 16325 15207Lease obligation 3781 mdashAccrued expenses and other liabilities 37873 40179Total current liabilities 60174 66209
Security bonus plan 11969 12413Lease obligation 10360 5213Deferred compensation 5915 5304Deferred tax liability 2879 2761Other liabilities 3460 6069Total liabilities 94757 97969
Stockholdersrsquo equityPreferred stock $1 par valueAuthorized - 500000 shares Issued and outstanding mdash None mdash mdashCommon stock $1 par value
Authorized - 35000000 sharesIssued - 9042597 and 9005716 shares respectivelyOutstanding - 8956981 and 8955930 shares respectively
Capital in excess of par value 17626 15623Retained earnings 89502 77338Treasury stock ndash 85616 and 49786 shares respectivelyAccumulated other comprehensive lossTotal stockholdersrsquo equity 112981 99173Total liabilities and stockholdersrsquo equity $ 207738 $ 197142
September 30 December 312019 2018
(Unaudited)
(2595) (1234)(595) (1560)
9043 9006
Customer Mix
Regional Accounts48
Kent Automotive16
Regional AccountsStrategicKent AutomotiveBolt SupplyGovernment Screw ProductsOther0470140000000000000010150110110002
ampDampF ampA
Product Mix
Fastening Systems23
Specialty Chemicals12
Fastening SystemsFluid PowerSpecialy ChemicalsCutting Tools and AbrasivesElectricalAftermarket Automotive SuppliesSafetyWelding and Metal RepairOther02401501201301100800500201
Number Of Sales Reps
Tenure With Lawson (as of 63019)
Average Annual Sales
Consolidated Revenues
Consolidated Revenues20142015201620172018TTM 93019285693275834276573305907349637368485Net Cash(Debt)2014201520162017201843738420798409580-1012710606431Rep Count201320142015201620172018437388069169371009983994993
Adjusted Reg G EBITDA
Adjusted EBITDA20142015201620172018TTM 93019136581719912065158402524832230
Quarterly Adjusted Reg G EBITDA
2017Q1Q2Q3Q428524519544330262018Q1Q2Q3Q451217749732550532019Q1Q2Q3Q47457940210318
Adjusted EBITDA $ in 000s
Reg G Adjusted EBITDA Q1 2017Q2 2017Q3 2017Q4 20172852451954433026
Adjusted EBITDA of Sales
Adjusted EBITDA of SalesQ1 2017Q2 2017Q3 2017Q4 20173822185292895721E-260248513452257152E-271948817596594883E-237528059231332088E-2
Adjusted Operating Income of Sales
Adjusted Operating IncomeQ1 2017Q2 2017Q3 2017Q4 2017
Adjusted Op Inc $ in 000s
Reg G Adjusted EBITDA Q1 2017Q2 2017Q3 2017Q4 2017
| September 30 | December 31 | ||||||||||
| 2019 | 2018 | ||||||||||
| ASSETS | (Unaudited) | ||||||||||
| Current assets | |||||||||||
| Cash and cash equivalents | $ | 8626 | $ | 11883 | |||||||
| Restricted cash | 800 | 800 | |||||||||
| Accounts receivable less allowance for doubtful accounts of $614 and $549 respectively | 45162 | 37682 | |||||||||
| Inventories net | 54894 | 52887 | |||||||||
| Miscellaneous receivables and prepaid expenses | 4270 | 3653 | |||||||||
| Total current assets | 113752 | 106905 | |||||||||
| Property plant and equipment net | 16932 | 23548 | |||||||||
| Deferred income taxes | 17372 | 20592 | |||||||||
| Goodwill | 20582 | 20079 | |||||||||
| Cash value of life insurance | 14440 | 12599 | |||||||||
| Intangible assets net | 12468 | 13112 | |||||||||
| Lease assets | 11917 | mdash | |||||||||
| Other assets | 275 | 307 | |||||||||
| Total assets | $ | 207738 | $ | 197142 | |||||||
| LIABILITIES AND STOCKHOLDERSrsquo EQUITY | |||||||||||
| Current liabilities | |||||||||||
| Revolving lines of credit | $ | 2195 | $ | 10823 | |||||||
| Accounts payable | 16325 | 15207 | |||||||||
| Lease obligation | 3781 | mdash | |||||||||
| Accrued expenses and other liabilities | 37873 | 40179 | |||||||||
| Total current liabilities | 60174 | 66209 | |||||||||
| Security bonus plan | 11969 | 12413 | |||||||||
| Lease obligation | 10360 | 5213 | |||||||||
| Deferred compensation | 5915 | 5304 | |||||||||
| Deferred tax liability | 2879 | 2761 | |||||||||
| Other liabilities | 3460 | 6069 | |||||||||
| Total liabilities | 94757 | 97969 | |||||||||
| Stockholdersrsquo equity | |||||||||||
| Preferred stock $1 par value | |||||||||||
| Authorized - 500000 shares Issued and outstanding mdash None | mdash | mdash | |||||||||
| Common stock $1 par value | |||||||||||
| Authorized - 35000000 shares | 9043 | 9006 | |||||||||
| Issued - 9042597 and 9005716 shares respectively | |||||||||||
| Outstanding - 8956981 and 8955930 shares respectively | |||||||||||
| Capital in excess of par value | 17626 | 15623 | |||||||||
| Retained earnings | 89502 | 77338 | |||||||||
| Treasury stock ndash 85616 and 49786 shares respectively | (2595) | (1234) | |||||||||
| Accumulated other comprehensive loss | (595) | (1560) | |||||||||
| Total stockholdersrsquo equity | 112981 | 99173 | |||||||||
| Total liabilities and stockholdersrsquo equity | $ | 207738 | $ | 197142 | |||||||
| Three Months Ended | |||||||||||||||||||||||||||||
| Jun 30 2019 | Mar 31 2019 | Dec 31 2018 | Sep 30 2018 | Jun 30 2018 | |||||||||||||||||||||||||
| Average daily net sales | $ | 1502 | $ | 1450 | $ | 1414 | $ | 1405 | $ | 1412 | |||||||||||||||||||
| Year over year increase | 63 | 82 | 70 | 170 | 205 | ||||||||||||||||||||||||
| Sequential quarter increase (decrease) | 36 | 25 | 06 | (05) | 53 | ||||||||||||||||||||||||
| Net Sales | $ | 96097 | $ | 91343 | $ | 86266 | $ | 88530 | $ | 90382 | |||||||||||||||||||
| Gross profit (1) | 51043 | 48923 | 46083 | 48108 | 49131 | ||||||||||||||||||||||||
| Gross profit percentage (1) | 531 | 536 | 534 | 543 | 544 | ||||||||||||||||||||||||
| Selling general amp administrative expenses | $ | 49420 | $ | 43379 | $ | 41998 | $ | 50374 | $ | 43577 | |||||||||||||||||||
| Operating income (loss) | $ | 1623 | $ | 5544 | $ | 4085 | $ | (2266) | $ | 5554 | |||||||||||||||||||
| Full Year | |||||||||||||||||||||||||||||||||||||||||||||||||||||||||||||||||||||||||||
| ($ in thousands) | Q1 2011 | Q2 2011 | Q3 2011 | Q4 2011 | Q1 2012 | Q2 2012 | Q3 2012 | Q4 2012 | Q1 2013 | Q2 2013 | Q3 2013 | Q4 2013 | Q1 2014 | Q2 2014 | Q3 2014 | Q4 2014 | Q1 2015 | Q2 2015 | Q3 2015 | Q4 2015 | Q1 2016 | Q2 2016 | Q3 2016 | Q4 2016 | Q1 2017 | Q2 2017 | Q3 2017 | Q4 2017 | Q1 2018 | Q2 2018 | Q3 2018 | Q4 2018 | Q1 2019 | Q2 2019 | Q3 2019 | 2014 | 2015 | ||||||||||||||||||||||||||||||||||||||
| Net Sales | $ 79255 | $ 80625 | $ 71490 | $ 69029 | $ 71364 | $ 69830 | $ 67863 | $ 64505 | $ 67213 | $ 68317 | $ 68235 | $ 65738 | $ 69204 | $ 72080 | $ 74128 | $ 70281 | $ 69904 | $ 70726 | $ 70243 | $ 64961 | $ 69711 | $ 69348 | $ 70199 | $ 67315 | $ 74617 | $ 75006 | $ 75651 | $ 80633 | $ 84459 | $ 90382 | $ 88530 | $ 86266 | $ 91343 | $ 96097 | $ 94779 | $ 285693 | $ 275834 | ||||||||||||||||||||||||||||||||||||||
| Operating Income (Loss) | 3542 | 1397 | (3480) | (6995) | (3466) | (42084) | (1740) | 2057 | (3530) | (201) | 870 | (3002) | (4713) | 1241 | 678 | (2169) | (947) | 3243 | 2810 | (2985) | 1169 | 29 | 2389 | (5044) | 712 | 7891 | 1090 | 243 | 1837 | 5554 | (2266) | 4085 | 5544 | 1623 | 6446 | (4963) | 2121 | ||||||||||||||||||||||||||||||||||||||
| Depreciation amp Amortization | 1260 | 1315 | 1160 | 1675 | 1715 | 1566 | 1963 | 1841 | 2061 | 2244 | 2367 | 2358 | 2295 | 2163 | 2160 | 2133 | 2096 | 2126 | 2119 | 2202 | 2187 | 2226 | 1973 | 1680 | 1705 | 1644 | 1591 | 1830 | 1686 | 1679 | 1755 | 1735 | 1478 | 1455 | 1468 | 8751 | 8543 | ||||||||||||||||||||||||||||||||||||||
| EBITDA | 4802 | 2712 | (2320) | (5320) | (1751) | (40518) | 223 | 3898 | (1469) | 2043 | 3237 | (644) | (2418) | 3404 | 2838 | (36) | 1149 | 5369 | 4929 | (783) | 3356 | 2255 | 4362 | (3364) | 2417 | 9535 | 2681 | 2073 | 3523 | 7233 | (511) | 5820 | 7022 | 3078 | 7914 | 3788 | 10664 | ||||||||||||||||||||||||||||||||||||||
| Excluded Costs | |||||||||||||||||||||||||||||||||||||||||||||||||||||||||||||||||||||||||||
| Severance | 745 | 465 | 282 | 122 | 185 | 6585 | 1410 | (159) | - 0 | 2 | 962 | (127) | 728 | 290 | (328) | (59) | 571 | 50 | 372 | 280 | 204 | 143 | 367 | 1662 | 465 | (9) | 139 | 144 | 628 | 64 | 31 | 126 | 27 | 1485 | 30 | 631 | 1273 | ||||||||||||||||||||||||||||||||||||||
| Stock Based Compensation (Benefit) | 227 | (95) | (538) | 467 | 198 | (1015) | 77 | 434 | 1596 | 76 | 33 | 562 | 1125 | 408 | 2423 | 2443 | (541) | 971 | (30) | 1693 | (1217) | 515 | (630) | 3801 | (30) | 415 | 2337 | 384 | 970 | 87 | 7637 | (1186) | 408 | 4839 | 2374 | 6399 | 2093 | ||||||||||||||||||||||||||||||||||||||
| Acquisition Related Costs | - 0 | - 0 | - 0 | - 0 | - 0 | - 0 | 310 | 32 | 115 | 198 | 178 | 120 | - 0 | - 0 | 286 | 425 | - 0 | - 0 | 168 | 62 | - 0 | - 0 | - 0 | ||||||||||||||||||||||||||||||||||||||||||||||||||||
| ERP Implementation Costs | 1902 | 2388 | 2344 | 339 | - 0 | - 0 | - 0 | - 0 | - 0 | - 0 | - 0 | - 0 | - 0 | - 0 | - 0 | - 0 | - 0 | - 0 | - 0 | - 0 | - 0 | - 0 | - 0 | - 0 | - 0 | - 0 | - 0 | - 0 | - 0 | - 0 | - 0 | - 0 | - 0 | ||||||||||||||||||||||||||||||||||||||||||
| Loss(Gain) on Disposal of Property | - 0 | - 0 | - 0 | 22 | - 0 | (2122) | (11) | (1588) | - 0 | - 0 | (36) | 32 | - 0 | - 0 | 97 | 45 | - 0 | - 0 | (2) | 9 | - 0 | - 0 | - 0 | - 0 | - 0 | (5422) | - 0 | - 0 | - 0 | - 0 | - 0 | - 0 | - 0 | - 0 | - 0 | 142 | 7 | ||||||||||||||||||||||||||||||||||||||
| Legal Settlement | - 0 | - 0 | - 0 | - 0 | - 0 | - 0 | - 0 | - 0 | - 0 | - 0 | - 0 | - 0 | - 0 | - 0 | (688) | - 0 | - 0 | - 0 | - 0 | - 0 | - 0 | - 0 | - 0 | - 0 | - 0 | - 0 | - 0 | - 0 | - 0 | - 0 | - 0 | - 0 | (688) | - 0 | |||||||||||||||||||||||||||||||||||||||||
| Employment Tax Matter | - 0 | - 0 | - 0 | 1200 | - 0 | - 0 | - 0 | - 0 | - 0 | - 0 | - 0 | (400) | - 0 | - 0 | - 0 | - 0 | - 0 | - 0 | - 0 | - 0 | - 0 | - 0 | - 0 | - 0 | - 0 | - 0 | - 0 | - 0 | - 0 | - 0 | - 0 | - 0 | - 0 | - 0 | |||||||||||||||||||||||||||||||||||||||||
| Lease termination gain | - 0 | - 0 | - 0 | - 0 | - 0 | - 0 | - 0 | - 0 | - 0 | - 0 | - 0 | 2928 | - 0 | - 0 | - 0 | - 0 | - 0 | - 0 | - 0 | - 0 | - 0 | - 0 | - 0 | - 0 | - 0 | - 0 | - 0 | - 0 | - 0 | (164) | - 0 | - 0 | - 0 | - 0 | - 0 | - 0 | - 0 | ||||||||||||||||||||||||||||||||||||||
| Goodwill Impairment | - 0 | - 0 | - 0 | - 0 | - 0 | 28306 | - 0 | - 0 | - 0 | - 0 | - 0 | - 0 | - 0 | - 0 | - 0 | - 0 | - 0 | - 0 | - 0 | - 0 | - 0 | - 0 | - 0 | - 0 | - 0 | - 0 | - 0 | - 0 | - 0 | - 0 | - 0 | - 0 | - 0 | - 0 | |||||||||||||||||||||||||||||||||||||||||
| Inventory Rationalization | - 0 | - 0 | - 0 | - 0 | - 0 | 3893 | - 0 | - 0 | - 0 | - 0 | - 0 | - 0 | - 0 | - 0 | - 0 | - 0 | - 0 | - 0 | - 0 | - 0 | - 0 | - 0 | - 0 | - 0 | - 0 | - 0 | - 0 | - 0 | - 0 | - 0 | - 0 | - 0 | - 0 | - 0 | |||||||||||||||||||||||||||||||||||||||||
| Discontinued operation accrual | - 0 | - 0 | - 0 | - 0 | - 0 | - 0 | - 0 | - 0 | - 0 | - 0 | - 0 | - 0 | - 0 | - 0 | - 0 | 340 | - 0 | - 0 | - 0 | 931 | - 0 | - 0 | - 0 | - 0 | - 0 | - 0 | - 0 | - 0 | - 0 | 529 | - 0 | - 0 | - 0 | - 0 | - 0 | 340 | 931 | ||||||||||||||||||||||||||||||||||||||
| North American sales meeting | - 0 | - 0 | - 0 | - 0 | - 0 | - 0 | - 0 | - 0 | 1225 | - 0 | - 0 | - 0 | - 0 | - 0 | - 0 | - 0 | 1889 | - 0 | - 0 | - 0 | - 0 | - 0 | - 0 | - 0 | - 0 | - 0 | - 0 | - 0 | - 0 | - 0 | - 0 | - 0 | - 0 | 1889 | |||||||||||||||||||||||||||||||||||||||||
| Property Impairment Loss | - 0 | - 0 | - 0 | - 0 | - 0 | - 0 | - 0 | - 0 | - 0 | - 0 | - 0 | - 0 | 2914 | 132 | - 0 | - 0 | - 0 | - 0 | - 0 | - 0 | - 0 | - 0 | - 0 | - 0 | - 0 | - 0 | - 0 | - 0 | - 0 | - 0 | - 0 | - 0 | 3046 | - 0 | |||||||||||||||||||||||||||||||||||||||||
| Building Impairment | - 0 | - 0 | - 0 | - 0 | - 0 | - 0 | - 0 | 231 | - 0 | - 0 | - 0 | ||||||||||||||||||||||||||||||||||||||||||||||||||||||||||||||||
| Reg G Adjusted EBITDA | $ 7676 | $ 5470 | $ (232) | $ (3170) | $ (1368) | $ (4871) | $ 1699 | $ 2585 | $ 1352 | $ 2121 | $ 4196 | $ 2351 | $ 2349 | $ 4234 | $ 4342 | $ 2733 | $ 3068 | $ 6390 | $ 5579 | $ 2162 | $ 2458 | $ 3111 | $ 4277 | $ 2219 | $ 2852 | $ 4519 | $ 5443 | $ 3026 | $ 5121 | $ 7749 | $ 7325 | $ 5053 | $ 7457 | $ 9402 | $ 10318 | $ 13658 | $ 17199 | ||||||||||||||||||||||||||||||||||||||
| Adjusted EBITDA of Sales | 97 | 68 | -03 | -46 | -19 | -70 | 25 | 40 | 20 | 31 | 61 | 36 | 34 | 59 | 59 | 39 | 44 | 90 | 79 | 33 | 35 | 45 | 61 | 33 | 38 | 60 | 72 | 38 | 61 | 86 | 83 | 59 | 82 | 98 | 109 | 48 | 62 | ||||||||||||||||||||||||||||||||||||||
| Annual Adjusted EBITDA of Sales | 44 | 58 | |||||||||||||||||||||||||||||||||||||||||||||||||||||||||||||||||||||||||
| Adjusted Operating Income | (3083) | (6437) | (264) | 744 | (709) | (123) | 1829 | (7) | 54 | 2071 | 2182 | 600 | 972 | 4264 | 3460 | (40) | 271 | 885 | 2304 | 539 | 1147 | 2875 | 3852 | 1196 | 3435 | 6070 | 5570 | 3087 | 5979 | 7947 | 8850 | 4907 | 8314 | ||||||||||||||||||||||||||||||||||||||||||
| Consolidated Revenues | |||||||
| 2013 | 269503 | ||||||
| 2014 | 285693 | ||||||
| 2015 | 275834 | ||||||
| 2016 | 276573 | ||||||
| 2017 | 305907 | ||||||
| 2018 | 349637 | ||||||
| TTM 93019 | 368485 | ||||||
| Net Cash(Debt) | |||||||
| 2013 | (15380) | ||||||
| 2014 | 4207 | ||||||
| 2015 | 9840 | ||||||
| 2016 | 9580 | ||||||
| 2017 | (10127) | ||||||
| 2018 | 1060 | ||||||
| 93019 | 6431 | ||||||
| Rep Count | |||||||
| 2013 | 806 | ||||||
| 2014 | 916 | ||||||
| 2015 | 937 | ||||||
| 2016 | 1009 | ||||||
| 2017 | 983 | ||||||
| 2018 | 994 | ||||||
| 93019 | 993 | ||||||
| Adjusted OI | DampA | Adjusted EBITDA | |||||
| 2013 | 990 | 9030 | 10020 | ||||
| 2014 | 4907 | 8751 | 13658 | ||||
| 2015 | 8315 | 8543 | 17199 | ||||
| 2016 | 3388 | 8066 | 12065 | ||||
| 2017 | 15840 | ||||||
| 2018 | 25248 | ||||||
| TTM 93019 | 32230 | ||||||
| Reg G EBITDA By Quarter | |||||||
| Quarter | 2017 | 2018 | 2019 | ||||
| Q1 | 2852 | 5121 | 7457 | ||||
| Q2 | 4519 | 7749 | 9402 | ||||
| Q3 | 5443 | 7325 | 10318 | ||||
| Q4 | 3026 | 5053 |
| Months of Experience | Average Annual Sales | Number of Reps | |||
| lt 12 Mos | ERRORVALUE | ERRORVALUE | |||
| 1 - 2 Yrs | ERRORVALUE | ERRORVALUE | |||
| 3 - 5 Yrs | ERRORVALUE | ERRORVALUE | |||
| 5 - 10 Yrs | ERRORVALUE | ERRORVALUE | |||
| gt 10 Yrs | ERRORVALUE | ERRORVALUE | |||
| ERRORVALUE | |||||
| Excludes ISR MSS CRS | |||||
| Excludes Freight | |||||
| Product mix | ||||||||
| Verticals | Q3 2019 Sales | |||||||
| Fastening Systems | 240 | 22485606 | ||||||
| Fluid Power | 151 | 14156064 | ||||||
| Specialy Chemicals | 117 | 10917433 | ||||||
| Cutting Tools and Abrasives | 131 | 12296596 | ||||||
| Electrical | 104 | 9724849 | ||||||
| Aftermarket Automotive Supplies | 76 | 7154688 | ||||||
| Safety | 47 | 4445846 | ||||||
| Welding and Metal Repair | 13 | 1218030 | ||||||
| Other | 120 | 11237322 | ||||||
| Total | 100 | 93636434 | ||||||
| Verticals | YTD 2019 Sales | |||||||
| Fastening Systems | 24 | 66611555 | ||||||
| Fluid Power | 15 | 42224416 | ||||||
| Specialy Chemicals | 12 | 32166853 | ||||||
| Cutting Tools and Abrasives | 13 | 36587482 | ||||||
| Electrical | 11 | 30150144 | ||||||
| Aftermarket Automotive Supplies | 8 | 21960561 | ||||||
| Safety | 5 | 13072228 | ||||||
| Welding and Metal Repair | 2 | 4306548 | ||||||
| Other | 10 | 31279779 | ||||||
| Total | 100 | 278359566 |
| Lawson core customer mix | ||||||||
| Account Tyoe | Q3 | |||||||
| Regional Accounts | 43045893 | 45 | ||||||
| Strategic | 14086813 | 15 | ||||||
| Kent Automotive | 14300065 | 15 | ||||||
| Bolt Supply | 11318703 | 12 | ||||||
| Government | 10291732 | 11 | ||||||
| Screw Products | 0 | 0 | ||||||
| Other (1) | 1735236 | 2 | ||||||
| Total | 94778443 | 100 | ||||||
| Account Tyoe | YTD September | |||||||
| Regional Accounts | 131389537 | 47 | ||||||
| Strategic | 40364305 | 14 | ||||||
| Kent Automotive | 43371411 | 15 | ||||||
| Bolt Supply | 31324209 | 11 | ||||||
| Government | 29794959 | 11 | ||||||
| Screw Products | 0 | 0 | ||||||
| Other | 5974302 | 2 | ||||||
| Total | 282218723 | 100 | ||||||
| Total Reported |
| September 30 | December 31 | ||||||||||
| 2019 | 2018 | ||||||||||
| ASSETS | (Unaudited) | ||||||||||
| Current assets | |||||||||||
| Cash and cash equivalents | $ | 8626 | $ | 11883 | |||||||
| Restricted cash | 800 | 800 | |||||||||
| Accounts receivable less allowance for doubtful accounts of $614 and $549 respectively | 45162 | 37682 | |||||||||
| Inventories net | 54894 | 52887 | |||||||||
| Miscellaneous receivables and prepaid expenses | 4270 | 3653 | |||||||||
| Total current assets | 113752 | 106905 | |||||||||
| Property plant and equipment net | 16932 | 23548 | |||||||||
| Deferred income taxes | 17372 | 20592 | |||||||||
| Goodwill | 20582 | 20079 | |||||||||
| Cash value of life insurance | 14440 | 12599 | |||||||||
| Intangible assets net | 12468 | 13112 | |||||||||
| Lease assets | 11917 | mdash | |||||||||
| Other assets | 275 | 307 | |||||||||
| Total assets | $ | 207738 | $ | 197142 | |||||||
| LIABILITIES AND STOCKHOLDERSrsquo EQUITY | |||||||||||
| Current liabilities | |||||||||||
| Revolving lines of credit | $ | 2195 | $ | 10823 | |||||||
| Accounts payable | 16325 | 15207 | |||||||||
| Lease obligation | 3781 | mdash | |||||||||
| Accrued expenses and other liabilities | 37873 | 40179 | |||||||||
| Total current liabilities | 60174 | 66209 | |||||||||
| Security bonus plan | 11969 | 12413 | |||||||||
| Lease obligation | 10360 | 5213 | |||||||||
| Deferred compensation | 5915 | 5304 | |||||||||
| Deferred tax liability | 2879 | 2761 | |||||||||
| Other liabilities | 3460 | 6069 | |||||||||
| Total liabilities | 94757 | 97969 | |||||||||
| Stockholdersrsquo equity | |||||||||||
| Preferred stock $1 par value | |||||||||||
| Authorized - 500000 shares Issued and outstanding mdash None | mdash | mdash | |||||||||
| Common stock $1 par value | |||||||||||
| Authorized - 35000000 shares | 9043 | 9006 | |||||||||
| Issued - 9042597 and 9005716 shares respectively | |||||||||||
| Outstanding - 8956981 and 8955930 shares respectively | |||||||||||
| Capital in excess of par value | 17626 | 15623 | |||||||||
| Retained earnings | 89502 | 77338 | |||||||||
| Treasury stock ndash 85616 and 49786 shares respectively | (2595) | (1234) | |||||||||
| Accumulated other comprehensive loss | (595) | (1560) | |||||||||
| Total stockholdersrsquo equity | 112981 | 99173 | |||||||||
| Total liabilities and stockholdersrsquo equity | $ | 207738 | $ | 197142 | |||||||
| Three Months Ended | |||||||||||||||||||||||||||||
| Jun 30 2019 | Mar 31 2019 | Dec 31 2018 | Sep 30 2018 | Jun 30 2018 | |||||||||||||||||||||||||
| Average daily net sales | $ | 1502 | $ | 1450 | $ | 1414 | $ | 1405 | $ | 1412 | |||||||||||||||||||
| Year over year increase | 63 | 82 | 70 | 170 | 205 | ||||||||||||||||||||||||
| Sequential quarter increase (decrease) | 36 | 25 | 06 | (05) | 53 | ||||||||||||||||||||||||
| Net Sales | $ | 96097 | $ | 91343 | $ | 86266 | $ | 88530 | $ | 90382 | |||||||||||||||||||
| Gross profit (1) | 51043 | 48923 | 46083 | 48108 | 49131 | ||||||||||||||||||||||||
| Gross profit percentage (1) | 531 | 536 | 534 | 543 | 544 | ||||||||||||||||||||||||
| Selling general amp administrative expenses | $ | 49420 | $ | 43379 | $ | 41998 | $ | 50374 | $ | 43577 | |||||||||||||||||||
| Operating income (loss) | $ | 1623 | $ | 5544 | $ | 4085 | $ | (2266) | $ | 5554 | |||||||||||||||||||
| Full Year | |||||||||||||||||||||||||||||||||||||||||||||||||||||||||||||||||||||||||||
| ($ in thousands) | Q1 2011 | Q2 2011 | Q3 2011 | Q4 2011 | Q1 2012 | Q2 2012 | Q3 2012 | Q4 2012 | Q1 2013 | Q2 2013 | Q3 2013 | Q4 2013 | Q1 2014 | Q2 2014 | Q3 2014 | Q4 2014 | Q1 2015 | Q2 2015 | Q3 2015 | Q4 2015 | Q1 2016 | Q2 2016 | Q3 2016 | Q4 2016 | Q1 2017 | Q2 2017 | Q3 2017 | Q4 2017 | Q1 2018 | Q2 2018 | Q3 2018 | Q4 2018 | Q1 2019 | Q2 2019 | Q3 2019 | 2014 | 2015 | ||||||||||||||||||||||||||||||||||||||
| Net Sales | $ 79255 | $ 80625 | $ 71490 | $ 69029 | $ 71364 | $ 69830 | $ 67863 | $ 64505 | $ 67213 | $ 68317 | $ 68235 | $ 65738 | $ 69204 | $ 72080 | $ 74128 | $ 70281 | $ 69904 | $ 70726 | $ 70243 | $ 64961 | $ 69711 | $ 69348 | $ 70199 | $ 67315 | $ 74617 | $ 75006 | $ 75651 | $ 80633 | $ 84459 | $ 90382 | $ 88530 | $ 86266 | $ 91343 | $ 96097 | $ 94779 | $ 285693 | $ 275834 | ||||||||||||||||||||||||||||||||||||||
| Operating Income (Loss) | 3542 | 1397 | (3480) | (6995) | (3466) | (42084) | (1740) | 2057 | (3530) | (201) | 870 | (3002) | (4713) | 1241 | 678 | (2169) | (947) | 3243 | 2810 | (2985) | 1169 | 29 | 2389 | (5044) | 712 | 7891 | 1090 | 243 | 1837 | 5554 | (2266) | 4085 | 5544 | 1623 | 6446 | (4963) | 2121 | ||||||||||||||||||||||||||||||||||||||
| Depreciation amp Amortization | 1260 | 1315 | 1160 | 1675 | 1715 | 1566 | 1963 | 1841 | 2061 | 2244 | 2367 | 2358 | 2295 | 2163 | 2160 | 2133 | 2096 | 2126 | 2119 | 2202 | 2187 | 2226 | 1973 | 1680 | 1705 | 1644 | 1591 | 1830 | 1686 | 1679 | 1755 | 1735 | 1478 | 1455 | 1468 | 8751 | 8543 | ||||||||||||||||||||||||||||||||||||||
| EBITDA | 4802 | 2712 | (2320) | (5320) | (1751) | (40518) | 223 | 3898 | (1469) | 2043 | 3237 | (644) | (2418) | 3404 | 2838 | (36) | 1149 | 5369 | 4929 | (783) | 3356 | 2255 | 4362 | (3364) | 2417 | 9535 | 2681 | 2073 | 3523 | 7233 | (511) | 5820 | 7022 | 3078 | 7914 | 3788 | 10664 | ||||||||||||||||||||||||||||||||||||||
| Excluded Costs | |||||||||||||||||||||||||||||||||||||||||||||||||||||||||||||||||||||||||||
| Severance | 745 | 465 | 282 | 122 | 185 | 6585 | 1410 | (159) | - 0 | 2 | 962 | (127) | 728 | 290 | (328) | (59) | 571 | 50 | 372 | 280 | 204 | 143 | 367 | 1662 | 465 | (9) | 139 | 144 | 628 | 64 | 31 | 126 | 27 | 1485 | 30 | 631 | 1273 | ||||||||||||||||||||||||||||||||||||||
| Stock Based Compensation (Benefit) | 227 | (95) | (538) | 467 | 198 | (1015) | 77 | 434 | 1596 | 76 | 33 | 562 | 1125 | 408 | 2423 | 2443 | (541) | 971 | (30) | 1693 | (1217) | 515 | (630) | 3801 | (30) | 415 | 2337 | 384 | 970 | 87 | 7637 | (1186) | 408 | 4839 | 2374 | 6399 | 2093 | ||||||||||||||||||||||||||||||||||||||
| Acquisition Related Costs | - 0 | - 0 | - 0 | - 0 | - 0 | - 0 | 310 | 32 | 115 | 198 | 178 | 120 | - 0 | - 0 | 286 | 425 | - 0 | - 0 | 168 | 62 | - 0 | - 0 | - 0 | ||||||||||||||||||||||||||||||||||||||||||||||||||||
| ERP Implementation Costs | 1902 | 2388 | 2344 | 339 | - 0 | - 0 | - 0 | - 0 | - 0 | - 0 | - 0 | - 0 | - 0 | - 0 | - 0 | - 0 | - 0 | - 0 | - 0 | - 0 | - 0 | - 0 | - 0 | - 0 | - 0 | - 0 | - 0 | - 0 | - 0 | - 0 | - 0 | - 0 | - 0 | ||||||||||||||||||||||||||||||||||||||||||
| Loss(Gain) on Disposal of Property | - 0 | - 0 | - 0 | 22 | - 0 | (2122) | (11) | (1588) | - 0 | - 0 | (36) | 32 | - 0 | - 0 | 97 | 45 | - 0 | - 0 | (2) | 9 | - 0 | - 0 | - 0 | - 0 | - 0 | (5422) | - 0 | - 0 | - 0 | - 0 | - 0 | - 0 | - 0 | - 0 | - 0 | 142 | 7 | ||||||||||||||||||||||||||||||||||||||
| Legal Settlement | - 0 | - 0 | - 0 | - 0 | - 0 | - 0 | - 0 | - 0 | - 0 | - 0 | - 0 | - 0 | - 0 | - 0 | (688) | - 0 | - 0 | - 0 | - 0 | - 0 | - 0 | - 0 | - 0 | - 0 | - 0 | - 0 | - 0 | - 0 | - 0 | - 0 | - 0 | - 0 | (688) | - 0 | |||||||||||||||||||||||||||||||||||||||||
| Employment Tax Matter | - 0 | - 0 | - 0 | 1200 | - 0 | - 0 | - 0 | - 0 | - 0 | - 0 | - 0 | (400) | - 0 | - 0 | - 0 | - 0 | - 0 | - 0 | - 0 | - 0 | - 0 | - 0 | - 0 | - 0 | - 0 | - 0 | - 0 | - 0 | - 0 | - 0 | - 0 | - 0 | - 0 | - 0 | |||||||||||||||||||||||||||||||||||||||||
| Lease termination gain | - 0 | - 0 | - 0 | - 0 | - 0 | - 0 | - 0 | - 0 | - 0 | - 0 | - 0 | 2928 | - 0 | - 0 | - 0 | - 0 | - 0 | - 0 | - 0 | - 0 | - 0 | - 0 | - 0 | - 0 | - 0 | - 0 | - 0 | - 0 | - 0 | (164) | - 0 | - 0 | - 0 | - 0 | - 0 | - 0 | - 0 | ||||||||||||||||||||||||||||||||||||||
| Goodwill Impairment | - 0 | - 0 | - 0 | - 0 | - 0 | 28306 | - 0 | - 0 | - 0 | - 0 | - 0 | - 0 | - 0 | - 0 | - 0 | - 0 | - 0 | - 0 | - 0 | - 0 | - 0 | - 0 | - 0 | - 0 | - 0 | - 0 | - 0 | - 0 | - 0 | - 0 | - 0 | - 0 | - 0 | - 0 | |||||||||||||||||||||||||||||||||||||||||
| Inventory Rationalization | - 0 | - 0 | - 0 | - 0 | - 0 | 3893 | - 0 | - 0 | - 0 | - 0 | - 0 | - 0 | - 0 | - 0 | - 0 | - 0 | - 0 | - 0 | - 0 | - 0 | - 0 | - 0 | - 0 | - 0 | - 0 | - 0 | - 0 | - 0 | - 0 | - 0 | - 0 | - 0 | - 0 | - 0 | |||||||||||||||||||||||||||||||||||||||||
| Discontinued operation accrual | - 0 | - 0 | - 0 | - 0 | - 0 | - 0 | - 0 | - 0 | - 0 | - 0 | - 0 | - 0 | - 0 | - 0 | - 0 | 340 | - 0 | - 0 | - 0 | 931 | - 0 | - 0 | - 0 | - 0 | - 0 | - 0 | - 0 | - 0 | - 0 | 529 | - 0 | - 0 | - 0 | - 0 | - 0 | 340 | 931 | ||||||||||||||||||||||||||||||||||||||
| North American sales meeting | - 0 | - 0 | - 0 | - 0 | - 0 | - 0 | - 0 | - 0 | 1225 | - 0 | - 0 | - 0 | - 0 | - 0 | - 0 | - 0 | 1889 | - 0 | - 0 | - 0 | - 0 | - 0 | - 0 | - 0 | - 0 | - 0 | - 0 | - 0 | - 0 | - 0 | - 0 | - 0 | - 0 | 1889 | |||||||||||||||||||||||||||||||||||||||||
| Property Impairment Loss | - 0 | - 0 | - 0 | - 0 | - 0 | - 0 | - 0 | - 0 | - 0 | - 0 | - 0 | - 0 | 2914 | 132 | - 0 | - 0 | - 0 | - 0 | - 0 | - 0 | - 0 | - 0 | - 0 | - 0 | - 0 | - 0 | - 0 | - 0 | - 0 | - 0 | - 0 | - 0 | 3046 | - 0 | |||||||||||||||||||||||||||||||||||||||||
| Building Impairment | - 0 | - 0 | - 0 | - 0 | - 0 | - 0 | - 0 | 231 | - 0 | - 0 | - 0 | ||||||||||||||||||||||||||||||||||||||||||||||||||||||||||||||||
| Reg G Adjusted EBITDA | $ 7676 | $ 5470 | $ (232) | $ (3170) | $ (1368) | $ (4871) | $ 1699 | $ 2585 | $ 1352 | $ 2121 | $ 4196 | $ 2351 | $ 2349 | $ 4234 | $ 4342 | $ 2733 | $ 3068 | $ 6390 | $ 5579 | $ 2162 | $ 2458 | $ 3111 | $ 4277 | $ 2219 | $ 2852 | $ 4519 | $ 5443 | $ 3026 | $ 5121 | $ 7749 | $ 7325 | $ 5053 | $ 7457 | $ 9402 | $ 10318 | $ 13658 | $ 17199 | ||||||||||||||||||||||||||||||||||||||
| Adjusted EBITDA of Sales | 97 | 68 | -03 | -46 | -19 | -70 | 25 | 40 | 20 | 31 | 61 | 36 | 34 | 59 | 59 | 39 | 44 | 90 | 79 | 33 | 35 | 45 | 61 | 33 | 38 | 60 | 72 | 38 | 61 | 86 | 83 | 59 | 82 | 98 | 109 | 48 | 62 | ||||||||||||||||||||||||||||||||||||||
| Annual Adjusted EBITDA of Sales | 44 | 58 | |||||||||||||||||||||||||||||||||||||||||||||||||||||||||||||||||||||||||
| Adjusted Operating Income | (3083) | (6437) | (264) | 744 | (709) | (123) | 1829 | (7) | 54 | 2071 | 2182 | 600 | 972 | 4264 | 3460 | (40) | 271 | 885 | 2304 | 539 | 1147 | 2875 | 3852 | 1196 | 3435 | 6070 | 5570 | 3087 | 5979 | 7947 | 8850 | 4907 | 8314 | ||||||||||||||||||||||||||||||||||||||||||
| Consolidated Revenues | |||||||
| 2013 | 269503 | ||||||
| 2014 | 285693 | ||||||
| 2015 | 275834 | ||||||
| 2016 | 276573 | ||||||
| 2017 | 305907 | ||||||
| 2018 | 349637 | ||||||
| TTM 63019 | 362236 | ||||||
| Net Cash(Debt) | |||||||
| 2013 | (15380) | ||||||
| 2014 | 4207 | ||||||
| 2015 | 9840 | ||||||
| 2016 | 9580 | ||||||
| 2017 | (10127) | ||||||
| 2018 | 1060 | ||||||
| 63019 | (1908) | ||||||
| Rep Count | |||||||
| 2013 | 806 | ||||||
| 2014 | 916 | ||||||
| 2015 | 937 | ||||||
| 2016 | 1009 | ||||||
| 2017 | 983 | ||||||
| 2018 | 994 | ||||||
| 63019 | 982 | ||||||
| Adjusted OI | DampA | Adjusted EBITDA | |||||
| 2013 | 990 | 9030 | 10020 | ||||
| 2014 | 4907 | 8751 | 13658 | ||||
| 2015 | 8315 | 8543 | 17199 | ||||
| 2016 | 3388 | 8066 | 12065 | ||||
| 2017 | 15840 | ||||||
| 2018 | 25248 | ||||||
| TTM 63019 | 29237 | ||||||
| Reg G EBITDA By Quarter | |||||||
| Quarter | 2017 | 2018 | 2019 | ||||
| Q1 | 2852 | 5121 | 7457 | ||||
| Q2 | 4519 | 7749 | 9402 | ||||
| Q3 | 5443 | 7325 | |||||
| Q4 | 3026 | 5053 |
| Months of Experience | Average Annual Sales | Number of Reps | |||
| lt 12 Mos | ERRORVALUE | ERRORVALUE | |||
| 1 - 2 Yrs | ERRORVALUE | ERRORVALUE | |||
| 3 - 5 Yrs | ERRORVALUE | ERRORVALUE | |||
| 5 - 10 Yrs | ERRORVALUE | ERRORVALUE | |||
| gt 10 Yrs | ERRORVALUE | ERRORVALUE | |||
| ERRORVALUE | |||||
| Excludes ISR MSS CRS | |||||
| Excludes Freight | |||||
| Product mix | ||||||||
| Verticals | Q2 2019 Sales | |||||||
| Fastening Systems | 243 | 23008646 | ||||||
| Fluid Power | 152 | 14395529 | ||||||
| Specialy Chemicals | 117 | 11074332 | ||||||
| Cutting Tools and Abrasives | 130 | 12319702 | ||||||
| Electrical | 107 | 10102828 | ||||||
| Aftermarket Automotive Supplies | 77 | 7255974 | ||||||
| Safety | 47 | 4458217 | ||||||
| Welding and Metal Repair | 16 | 1539172 | ||||||
| Other | 112 | 10633378 | ||||||
| Total | 100 | 94787779 | ||||||
| Verticals | YTD 2019 Sales | |||||||
| Fastening Systems | 24 | 44125949 | ||||||
| Fluid Power | 15 | 28068352 | ||||||
| Specialy Chemicals | 12 | 21249420 | ||||||
| Cutting Tools and Abrasives | 13 | 24290887 | ||||||
| Electrical | 11 | 20425294 | ||||||
| Aftermarket Automotive Supplies | 8 | 14805874 | ||||||
| Safety | 5 | 8626381 | ||||||
| Welding and Metal Repair | 2 | 3088518 | ||||||
| Other | 10 | 20042457 | ||||||
| Total | 100 | 184723132 |
| Lawson core customer mix | ||||||||
| Account Tyoe | Q2 | |||||||
| Regional Accounts | 44933707 | 47 | ||||||
| Strategic | 13542786 | 14 | ||||||
| Kent Automotive | 14370813 | 15 | ||||||
| Bolt Supply | 11129675 | 12 | ||||||
| Government | 10087561 | 10 | ||||||
| Screw Products | 0 | 0 | ||||||
| Other (1) | 1428268 | 1 | ||||||
| Total | 96097363 | 100 | ||||||
| Account Tyoe | YTD June | |||||||
| Regional Accounts | 88400675 | 47 | ||||||
| Strategic | 26218365 | 14 | ||||||
| Kent Automotive | 29071347 | 16 | ||||||
| Bolt Supply | 20005505 | 11 | ||||||
| Government | 19505323 | 10 | ||||||
| Screw Products | 0 | 0 | ||||||
| Other | 4239066 | 2 | ||||||
| Total | 187440280 | 100 | ||||||
| Total Reported |
| August 2011 | OslashImplemented SAP | ||
| October 2011 | OslashCommenced construction of new McCook Ill distribution center | ||
| May 2012 | OslashRelocated corporate headquarters | ||
| June 2012 | OslashRestructured senior team Announced $20M cost savings plan | ||
| August 2012 | OslashTransitioned packaging facility to McCook Ill distribution center | ||
| OslashEntered into new five-year $40M credit facility | |||
| October 2012 | OslashAnnounced new CEO and President Michael G DeCata | ||
| OslashConsolidated Vernon Hills distribution center into McCook Ill | |||
| November 2012 | OslashRolled out new website to existing web customers | ||
| December 2012 | OslashCompleted transition of US independent agents to employees | ||
| April 2013 | OslashRoll-out of new website to new web customers | ||
| AprilMay 2013 | OslashMcCook DC begins to ship customer orders | ||
| November 2013 | OslashEntered into sub-lease of headquarters space to generate $29M of future cash savings | ||
| December 2013 | OslashEnded year with over 800 sales reps ndash First increase in 8 years | ||
| February 2014 | OslashClosed on Automatic Screw Machine Products sale for net proceeds of $121M | ||
| June 2014 | OslashEntered into sale-leaseback of Reno distribution facility for net proceeds of $83M | ||
| December 2014 | OslashEnded year with over 900 sales reps | ||
| February 2015 | OslashHeld North American sales meeting | ||
| September 2015 | OslashCompleted West Coast Fasteners acquisition | ||
| March 2016 | OslashCompleted Perfect Products of Michigan acquisition | ||
| May 2016 | OslashCompleted F B Feeney acquisition | ||
| June 2016 | OslashExpanded sales team to over 1000 sales reps | ||
| September 2016 | OslashExtended credit facitlity to August 2020 | ||
| November 2016 | OslashCompleted Mattic Industries acquisition | ||
| March 2017 | OslashConsolidated Fairfield NJ distribution operations into McCook Ill and Suwanee GA | ||
| May 2017 | OslashSold Fairfield NJ distribution center for a gain of $54M | ||
| October 2017 | OslashCompleted Bolt Supply House acquisition | ||
| April 2018 | OslashOpened MRO distribution center in Calgary Canada | ||
| October 2018 | OslashCompleted Screw Products acquisition and added Bolt Supply branch | ||
| June 2019 | OslashAchieved Q2 98 adjusted EBITDA net of ASC 842 impact of 03 | ||
| September 2019 | OslashAchieved Q3 109 adjusted EBITDA hired VP MampA | ||
| October 2019 | OslashEntered into new five-year $100M credit facility with additional $50 million accordion feature |
| ($ in thousands) | Q3 2013 | Q4 2013 | Q1 2014 | Q2 2014 | Q3 2014 | Q4 2014 | Q1 2015 | Q2 2015 | Q3 2015 | Q4 2015 | Q1 2016 | Q2 2016 | Q3 2016 | Q4 2016 | Q1 2017 | Q2 2017 | Q3 2017 | Q4 2017 | ||||||||||||||||||||||||||||||||||||||||||||||
| SGampA | 40350 | 42856 | 45991 | 42562 | 43855 | 44764 | 43830 | 40565 | 40532 | 41145 | 41290 | 42497 | 40184 | 45548 | 44167 | 42672 | 44915 | 46750 | $ 173014 | |||||||||||||||||||||||||||||||||||||||||||||
| $ - | ||||||||||||||||||||||||||||||||||||||||||||||||||||||||||||||||
| Excluded Costs | $ - | 40196 | ||||||||||||||||||||||||||||||||||||||||||||||||||||||||||||||
| Severance | (962) | 127 | (728) | (290) | 328 | 59 | (571) | (50) | (372) | (280) | (204) | (143) | (367) | (1662) | (465) | 9 | (139) | (144) | $ (234) | 127 | ||||||||||||||||||||||||||||||||||||||||||||
| Stock Based Compensation (Benefit) | (33) | (562) | (1125) | (408) | (2423) | (2443) | 541 | (971) | 30 | (1693) | 1217 | (515) | 630 | (3801) | 30 | (415) | (2337) | (384) | $ (5296) | -32 | ||||||||||||||||||||||||||||||||||||||||||||
| Loss(Gain) on Disposal of Property | 36 | (32) | - 0 | - 0 | (97) | (45) | - 0 | - 0 | 2 | (9) | - 0 | - 0 | - 0 | - 0 | - 0 | - 0 | - 0 | - 0 | $ (142) | |||||||||||||||||||||||||||||||||||||||||||||
| Legal Settlement | - 0 | - 0 | - 0 | - 0 | 688 | - 0 | - 0 | - 0 | - 0 | - 0 | - 0 | - 0 | - 0 | - 0 | - 0 | - 0 | - 0 | - 0 | $ 688 | -562 | ||||||||||||||||||||||||||||||||||||||||||||
| Employment Tax Matter | - 0 | 400 | - 0 | - 0 | - 0 | - 0 | - 0 | - 0 | - 0 | - 0 | - 0 | - 0 | - 0 | - 0 | - 0 | - 0 | - 0 | - 0 | $ - | 39729 | ||||||||||||||||||||||||||||||||||||||||||||
| Loss on Sub-Lease | - 0 | (2928) | - 0 | - 0 | - 0 | - 0 | - 0 | - 0 | - 0 | - 0 | - 0 | - 0 | - 0 | - 0 | - 0 | - 0 | - 0 | - 0 | $ - | |||||||||||||||||||||||||||||||||||||||||||||
| National sales meeting | - 0 | - 0 | - 0 | - 0 | - 0 | - 0 | (1889) | - 0 | - 0 | - 0 | - 0 | - 0 | - 0 | - 0 | - 0 | - 0 | - 0 | - 0 | $ (1889) | |||||||||||||||||||||||||||||||||||||||||||||
| Remediation expense | - 0 | - 0 | - 0 | - 0 | - 0 | (340) | - 0 | - 0 | - 0 | - 0 | - 0 | - 0 | - 0 | - 0 | - 0 | - 0 | - 0 | - 0 | $ (340) | |||||||||||||||||||||||||||||||||||||||||||||
| Property Impairment Loss | - 0 | - 0 | (2914) | (132) | - 0 | - 0 | - 0 | - 0 | - 0 | - 0 | - 0 | - 0 | - 0 | - 0 | - 0 | - 0 | - 0 | - 0 | $ - | |||||||||||||||||||||||||||||||||||||||||||||
| Adjusted SGampA | $ 39391 | $ 39861 | $ 41224 | $ 41732 | $ 42351 | $ 41995 | $ 41911 | $ 39544 | $ 40192 | $ 39163 | $ 42303 | $ 41839 | $ 40447 | $ 40085 | $ 43732 | $ 42266 | $ 42439 | $ 46222 | $ 165801 | |||||||||||||||||||||||||||||||||||||||||||||
| Annual Adjusted EBITDA of Sales | ERRORREF | ERRORREF | ||||||||||||||||||||||||||||||||||||||||||||||||||||||||||||||
| Q1 2013 | Q2 2013 | Q3 2013 | Q4 2013 | Q1 2014 | Q2 2014 | Q3 2014 | Q4 2014 | Q1 2015 | |||||||||||
| Selling Days | 63 | 64 | 64 | 61 | 63 | 64 | 64 | 61 | 63 | ||||||||||
| Net Sales | 67213 | 68317 | 68235 | 65738 | 69204 | 72080 | 74128 | 70281 | 69904 | ||||||||||
| Average Daily Sales | 1067 | 1067 | 1066 | 1078 | 1098 | 1126 | 1158 | 1152 | 1110 | ||||||||||
| Average Sales Rep Count | 762 | 764 | 774 | 794 | 819 | 854 | 882 | 908 | 911 | ||||||||||
| Sales per Sales Rep per Day | 1400 | 1397 | 1377 | 1358 | 1341 | 1319 | 1313 | 1269 | 1218 | ||||||||||
| Full Year | ||||||||||||||||||||||||||||||||||||||||||||||||||||||||||||||||||||
| ($ in thousands) | Q1 2011 | Q2 2011 | Q3 2011 | Q4 2011 | Q1 2012 | Q2 2012 | Q3 2012 | Q4 2012 | Q1 2013 | Q2 2013 | Q3 2013 | Q4 2013 | Q1 2014 | Q2 2014 | Q3 2014 | Q4 2014 | Q1 2015 | Q2 2015 | Q3 2015 | Q4 2015 | Q1 2016 | Q2 2016 | Q3 2016 | Q4 2016 | Q1 2017 | Q2 2017 | Q3 2017 | Q4 2017 | Q1 2018 | Q2 2018 | Q3 2018 | 2014 | 2015 | |||||||||||||||||||||||||||||||||||
| Net Sales | $ 79255 | $ 80625 | $ 71490 | $ 69029 | $ 71364 | $ 69830 | $ 67863 | $ 64505 | $ 67213 | $ 68317 | $ 68235 | $ 65738 | $ 69204 | $ 72080 | $ 74128 | $ 70281 | $ 69904 | $ 70726 | $ 70243 | $ 64961 | $ 69711 | $ 69348 | $ 70199 | $ 67315 | $ 74617 | $ 75006 | $ 75651 | $ 80633 | $ 84459 | $ 90382 | $ 88530 | $ 285693 | $ 275834 | |||||||||||||||||||||||||||||||||||
| Operating Income (Loss) | 3542 | 1397 | (3480) | (6995) | (3466) | (42084) | (1740) | 2057 | (3530) | (201) | 870 | (3002) | (4713) | 1241 | 678 | (2169) | (947) | 3243 | 2810 | (2985) | 1169 | 29 | 2389 | (5044) | 712 | 7891 | 1090 | 243 | 1837 | 5554 | (2266) | (4963) | 2121 | |||||||||||||||||||||||||||||||||||
| Depreciation amp Amortization | 1260 | 1315 | 1160 | 1675 | 1715 | 1566 | 1963 | 1841 | 2061 | 2244 | 2367 | 2358 | 2295 | 2163 | 2160 | 2133 | 2096 | 2126 | 2119 | 2202 | 2187 | 2226 | 1973 | 1680 | 1705 | 1644 | 1591 | 1830 | 1686 | 1679 | 1755 | 8751 | 8543 | |||||||||||||||||||||||||||||||||||
| EBITDA | 4802 | 2712 | (2320) | (5320) | (1751) | (40518) | 223 | 3898 | (1469) | 2043 | 3237 | (644) | (2418) | 3404 | 2838 | (36) | 1149 | 5369 | 4929 | (783) | 3356 | 2255 | 4362 | (3364) | 2417 | 9535 | 2681 | 2073 | 3523 | 7233 | (511) | 3788 | 10664 | |||||||||||||||||||||||||||||||||||
| Excluded Costs | ||||||||||||||||||||||||||||||||||||||||||||||||||||||||||||||||||||
| Severance | 745 | 465 | 282 | 122 | 185 | 6585 | 1410 | (159) | - 0 | 2 | 962 | (127) | 728 | 290 | (328) | (59) | 571 | 50 | 372 | 280 | 204 | 143 | 367 | 1662 | 465 | (9) | 139 | 144 | 628 | 64 | 31 | 631 | 1273 | |||||||||||||||||||||||||||||||||||
| Stock Based Compensation (Benefit) | 227 | (95) | (538) | 467 | 198 | (1015) | 77 | 434 | 1596 | 76 | 33 | 562 | 1125 | 408 | 2423 | 2443 | (541) | 971 | (30) | 1693 | (1217) | 515 | (630) | 3801 | (30) | 415 | 2337 | 384 | 970 | 87 | 7637 | 6399 | 2093 | |||||||||||||||||||||||||||||||||||
| Acquisition Related Costs | - 0 | - 0 | - 0 | - 0 | - 0 | - 0 | 310 | 32 | 115 | 198 | 178 | 120 | - 0 | - 0 | 286 | 425 | - 0 | - 0 | 168 | |||||||||||||||||||||||||||||||||||||||||||||||||
| ERP Implementation Costs | 1902 | 2388 | 2344 | 339 | - 0 | - 0 | - 0 | - 0 | - 0 | - 0 | - 0 | - 0 | - 0 | - 0 | - 0 | - 0 | - 0 | - 0 | - 0 | - 0 | - 0 | - 0 | - 0 | - 0 | - 0 | - 0 | - 0 | - 0 | - 0 | - 0 | - 0 | - 0 | ||||||||||||||||||||||||||||||||||||
| Loss(Gain) on Disposal of Property | - 0 | - 0 | - 0 | 22 | - 0 | (2122) | (11) | (1588) | - 0 | - 0 | (36) | 32 | - 0 | - 0 | 97 | 45 | - 0 | - 0 | (2) | 9 | - 0 | - 0 | - 0 | - 0 | - 0 | (5422) | - 0 | - 0 | - 0 | - 0 | - 0 | 142 | 7 | |||||||||||||||||||||||||||||||||||
| Legal Settlement | - 0 | - 0 | - 0 | - 0 | - 0 | - 0 | - 0 | - 0 | - 0 | - 0 | - 0 | - 0 | - 0 | - 0 | (688) | - 0 | - 0 | - 0 | - 0 | - 0 | - 0 | - 0 | - 0 | - 0 | - 0 | - 0 | - 0 | - 0 | - 0 | - 0 | - 0 | (688) | - 0 | |||||||||||||||||||||||||||||||||||
| Employment Tax Matter | - 0 | - 0 | - 0 | 1200 | - 0 | - 0 | - 0 | - 0 | - 0 | - 0 | - 0 | (400) | - 0 | - 0 | - 0 | - 0 | - 0 | - 0 | - 0 | - 0 | - 0 | - 0 | - 0 | - 0 | - 0 | - 0 | - 0 | - 0 | - 0 | - 0 | - 0 | - 0 | - 0 | |||||||||||||||||||||||||||||||||||
| Lease termination gain | - 0 | - 0 | - 0 | - 0 | - 0 | - 0 | - 0 | - 0 | - 0 | - 0 | - 0 | 2928 | - 0 | - 0 | - 0 | - 0 | - 0 | - 0 | - 0 | - 0 | - 0 | - 0 | - 0 | - 0 | - 0 | - 0 | - 0 | - 0 | - 0 | (164) | - 0 | - 0 | - 0 | |||||||||||||||||||||||||||||||||||
| Goodwill Impairment | - 0 | - 0 | - 0 | - 0 | - 0 | 28306 | - 0 | - 0 | - 0 | - 0 | - 0 | - 0 | - 0 | - 0 | - 0 | - 0 | - 0 | - 0 | - 0 | - 0 | - 0 | - 0 | - 0 | - 0 | - 0 | - 0 | - 0 | - 0 | - 0 | - 0 | - 0 | - 0 | - 0 | |||||||||||||||||||||||||||||||||||
| Inventory Rationalization | - 0 | - 0 | - 0 | - 0 | - 0 | 3893 | - 0 | - 0 | - 0 | - 0 | - 0 | - 0 | - 0 | - 0 | - 0 | - 0 | - 0 | - 0 | - 0 | - 0 | - 0 | - 0 | - 0 | - 0 | - 0 | - 0 | - 0 | - 0 | - 0 | - 0 | - 0 | - 0 | - 0 | |||||||||||||||||||||||||||||||||||
| Discontinued operation accrual | - 0 | - 0 | - 0 | - 0 | - 0 | - 0 | - 0 | - 0 | - 0 | - 0 | - 0 | - 0 | - 0 | - 0 | - 0 | 340 | - 0 | - 0 | - 0 | 931 | - 0 | - 0 | - 0 | - 0 | - 0 | - 0 | - 0 | - 0 | - 0 | 529 | - 0 | 340 | 931 | |||||||||||||||||||||||||||||||||||
| North American sales meeting | - 0 | - 0 | - 0 | - 0 | - 0 | - 0 | - 0 | - 0 | 1225 | - 0 | - 0 | - 0 | - 0 | - 0 | - 0 | - 0 | 1889 | - 0 | - 0 | - 0 | - 0 | - 0 | - 0 | - 0 | - 0 | - 0 | - 0 | - 0 | - 0 | - 0 | - 0 | - 0 | 1889 | |||||||||||||||||||||||||||||||||||
| Property Impairment Loss | - 0 | - 0 | - 0 | - 0 | - 0 | - 0 | - 0 | - 0 | - 0 | - 0 | - 0 | - 0 | 2914 | 132 | - 0 | - 0 | - 0 | - 0 | - 0 | - 0 | - 0 | - 0 | - 0 | - 0 | - 0 | - 0 | - 0 | - 0 | - 0 | - 0 | - 0 | 3046 | - 0 | |||||||||||||||||||||||||||||||||||
| Adjusted EBITDA | $ 7676 | $ 5470 | $ (232) | $ (3170) | $ (1368) | $ (4871) | $ 1699 | $ 2585 | $ 1352 | $ 2121 | $ 4196 | $ 2351 | $ 2349 | $ 4234 | $ 4342 | $ 2733 | $ 3068 | $ 6390 | $ 5579 | $ 2162 | $ 2458 | $ 3111 | $ 4277 | $ 2219 | $ 2852 | $ 4519 | $ 5443 | $ 3026 | $ 5121 | $ 7749 | $ 7325 | $ 13658 | $ 17199 | |||||||||||||||||||||||||||||||||||
| Adjusted EBITDA of Sales | 97 | 68 | -03 | -46 | -19 | -70 | 25 | 40 | 20 | 31 | 61 | 36 | 34 | 59 | 59 | 39 | 44 | 90 | 79 | 33 | 35 | 45 | 61 | 33 | 38 | 60 | 72 | 38 | 61 | 86 | 83 | 48 | 62 | |||||||||||||||||||||||||||||||||||
| Annual Adjusted EBITDA of Sales | 44 | 58 | ||||||||||||||||||||||||||||||||||||||||||||||||||||||||||||||||||
| Adjusted Operating Income | (3083) | (6437) | (264) | 744 | (709) | (123) | 1829 | (7) | 54 | 2071 | 2182 | 600 | 972 | 4264 | 3460 | (40) | 271 | 885 | 2304 | 539 | 1147 | 2875 | 3852 | 1196 | 3435 | 6070 | 5570 | - 0 | 4907 | 8314 | ||||||||||||||||||||||||||||||||||||||