Embed Size (px)
Citation preview

April 22, 2020
2019 Natural Hazards Mitigation Plan Update -Planning Committee Workshop #2

• Background and Purpose• Project Schedule and Timeline
• Public Outreach Strategy• Comments on Municipal Meeting Follow-up
• Background and Purpose• Review Hazard ID, Ranking, Risk Assessment Loss
Estimation• Review Updated Regional Goals, Objectives and
Actions• Regional Menu• Local Annexes
• “Breakout” Meetings• Reconvene and Next Steps
Today’s Agenda
2 |

Background and Purpose
3 |

• Authority• Disaster Mitigation Act of 2000
(amendments to Stafford Act of 1988)
• Goal of Disaster Mitigation Act• Encourage disaster preparedness• Encourage hazard mitigation actions to reduce losses of
life and property
• Status of Plans in Connecticut• Local plans are updated every five years.• RiverCOG municipal plans were last updated in 2014.• Must be updated in order to be eligible for FEMA HMA
grants.
Purpose and Need for a Hazard Mitigation Plan
4 |

• Planning Process Description
• Capability Assessment
• Hazard ID and Risk Assessment
• Vulnerability Analysis and Loss Estimations
• Hazard Mitigation Strategy
• Implementation Plan
Plan Components
5 |

Project Schedule and Timeline

Project Timeline
7 |

Project Schedule
8 |
Dec‐19 Jan‐20 Feb‐20 Mar‐20 Apr‐20 May‐20 Jun‐20 Jul‐20 Aug‐20 Sep‐20
1. Pre‐Planning, Data Collection, Planning Process1.1 Internal Kick‐Off Meeting1.2 Planning Team Workshop 1 /Public Meeting1.3 Data Collection and Municpal Meetings1.4 Stakeholder and Public Participation survey survey1.5 Record Keeping and Reporting
2. Capability Assessment2a Complete Data Collection2b Update Capability Assessment
3. Update Risk Assessments3.1 Hazard ID and Prioritization3.2 Hazard Profiles3.3 Critical Facilities and Assett Inventory3.4 Vulnerability Assessment and Loss Est.3.5 Planning Team Workshop 2 /Public Meeting
4. Mitigation Goals and Strategies4.1 Update 2014 Actions42 Jurisdiction Goals, Strategies, and Projects4.3 Plan Implementation Strategy Refinement4.4 Planning Team Workshop 3 / Public Meet
5. Final HMP Submission and Review5.1 Final Plan Adoption and Approval Proc.
DESPP/DEMHS Submittal*5.2 FEMA Final Plan Approval*
Final Deliverables

• Online Survey• Public
Meetings??• Public Review
of Draft Plan
Public Outreach Strategy
What is important to you? https://www.surveymonkey.com/r/WNMKMJH
9 |

• Review meeting minutes
• Complete 2014 strategy disposition table
• Letter of intent
• Participant worksheet
Municipal Meeting Follow Up
10 |

Hazard Identification and Risk Assessment

Purpose: Provides a factual basis for prioritizing hazard mitigation activities.Major components:
• Select and rank hazard priorities.• Profiles of natural hazards affecting the region• Vulnerability of the region as a whole• Vulnerability and lost estimations for individual communities• Integration of State hazard mitigation plan findings
Hazard Identification and Risk Assessment
12 |

Hazard Identification
13 |
RiverCOG’s Hazards• Winter Storms
o Snow, Ice, Nor’easters• Flooding
o Riverine, Drainage, Coastal Surge, Sea Level Rise, Dam Breach
• Severe Weather Eventso Thunderstorms, Wind, Hail,
Lightening• Earthquake• Drought• Wildfire• Extreme Heat and Cold• Tree Damage• Invasive Species
Climate Change:Climate change will amplify
the impact of natural hazards.

Hazard Profiles
14 |
For each hazard:• Hazard Profile
– Location– Severity– Frequency
• Previous Events• Climate Change
Impacts• Exposure• Vulnerability

• Probability: likelihood of occurrence from historical data.
• Affected Area: size of geographical area of community affected by hazard
• Primary Impact: percent of damage to typical facility in the community
• Secondary Impact: hazard impacts to economy and community health
• Community Survey Rating: community’s perceived risk in terms of hazards impacting the survey responders’ home and neighborhood.
Hazard Priority Ranking CriteriaNew for 2020 Plan Update
15 |
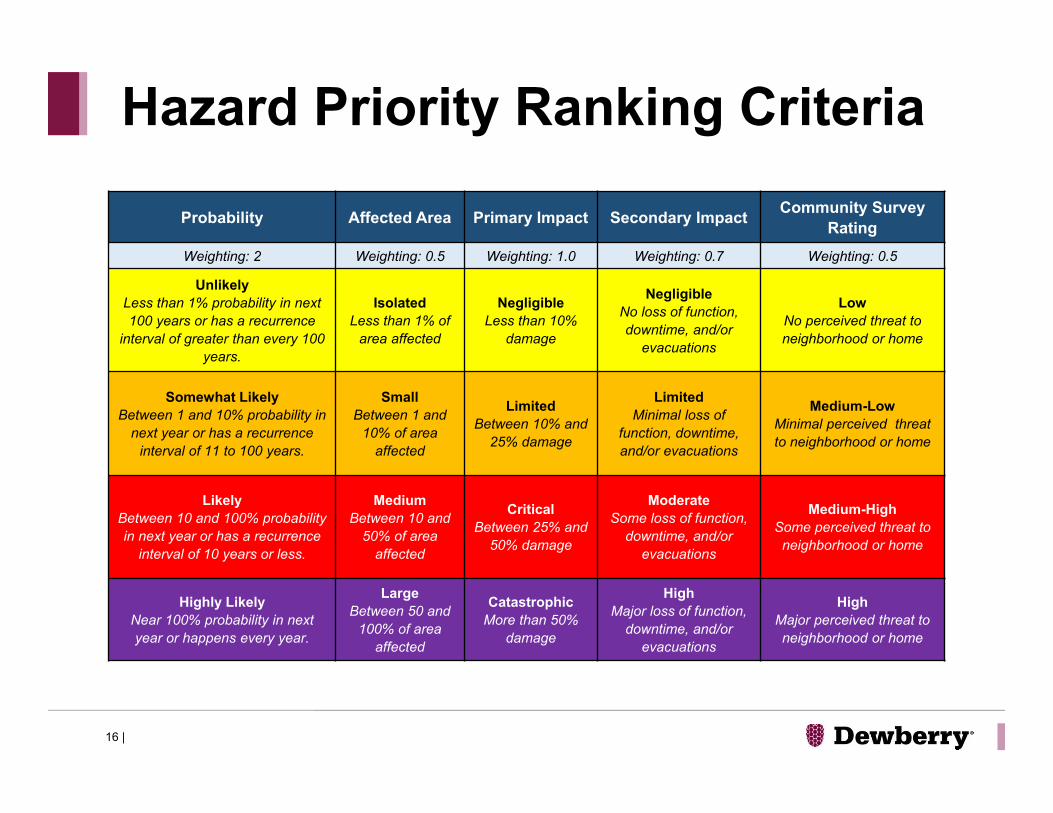
Hazard Priority Ranking Criteria
16 |
Probability Affected Area Primary Impact Secondary Impact Community Survey Rating
Weighting: 2 Weighting: 0.5 Weighting: 1.0 Weighting: 0.7 Weighting: 0.5
UnlikelyLess than 1% probability in next 100 years or has a recurrence
interval of greater than every 100 years.
IsolatedLess than 1% of
area affected
NegligibleLess than 10%
damage
NegligibleNo loss of function, downtime, and/or
evacuations
LowNo perceived threat to neighborhood or home
Somewhat LikelyBetween 1 and 10% probability in
next year or has a recurrence interval of 11 to 100 years.
SmallBetween 1 and
10% of area affected
Limited Between 10% and
25% damage
LimitedMinimal loss of
function, downtime, and/or evacuations
Medium-LowMinimal perceived threat to neighborhood or home
LikelyBetween 10 and 100% probability in next year or has a recurrence
interval of 10 years or less.
MediumBetween 10 and
50% of area affected
CriticalBetween 25% and
50% damage
ModerateSome loss of function,
downtime, and/or evacuations
Medium-HighSome perceived threat to neighborhood or home
Highly LikelyNear 100% probability in next year or happens every year.
LargeBetween 50 and
100% of area affected
Catastrophic More than 50%
damage
HighMajor loss of function,
downtime, and/or evacuations
HighMajor perceived threat to neighborhood or home

Hazard Ranking Comparison
17 |
Hazard Type ProbabilityImpact Community
Survey Ranking
Hazard Planning ConsiderationAffected Area Primary
ImpactSecondary
Impacts
Winter Storms Highly Likely Large Negligible Moderate High Significant
Flood Likely Medium Limited High Medium-High Significant
Hurricanes / Wind Likely Large Critical Moderate Medium-High Significant
Severe Weather (Thunderstorms) Highly Likely Small Negligible Limited High Moderate
Extreme Temps Likely Large Negligible Negligible Medium-High Limited
Tree Damage Likely Medium Negligible. Negligible Medium-High Limited
Tornado Somewhat Likely Isolated Catastrophic Limited Limited
Earthquake Unlikely Large Catastrophic High Limited
Drought Somewhat Likely Medium Negligible Negligible Medium-High Limited
Wildfire Somewhat Likely Small Negligible Negligible Medium-High Limited

In order of priority:
• Winter Storm (High Priority)
• Flooding (High Priority)
• Hurricane and Wind (High Priority)
• Severe Weather (Moderate Priority)
• Extreme Temperature
• Tree Damage / Invasive Species
• Tornado
• Earthquake
• Drought
• Wildfire
Hazard Specific Analysis
18 |

Loss Estimation Approaches
• HAZUS analysis for Flood, Hurricane Wind, and Earthquakes
• Improved methodology in most recent version• For the Non-HAZUS Hazards:
• Use NCEI (former NCDC)• Use NFIP losses• Use Public Assistance reimbursements• Downscale loss estimates from CT HMP• Ask for typical losses for the most challenging hazards
(i.e., wildfire losses)• Augment with Exposure Analysis
19 |

• Riverine
• Coastal Surge
• Drainage
• Sea Level Rise
• Statistical Susceptibility Model
Flooding
20 |

CromwellHazard Number
of ParcelsValue of At‐Risk Parcels(Millions)
Number of
Buildings
Value of At‐Risk Buildings(Millions)
Number of Critical Facilities
Value of At‐Risk Critical Facilities(Millions)
Number of Historic Assets
Value of At‐Risk Historic Assets
(Millions)
Hurricane/Tropical storm
6,011 1294 5,629 859 11 66 137 38
Severe Thunderstorm 6,011 1294 5,629 859 11 66 137 38
Severe Winter Storm/Nor'easter
6,011 1294 5,629 859 11 66 137 38
Tornado 6,011 1294 5,629 859 11 66 137 38
Drought 6,011 1294 5,629 859 11 66 137 38
Earthquake 6,011 1294 5,629 859 11 66 137 38
Flooding1% Annual 558 264 443 142 4 25 66 18
0.2% Annual 939 482 813 262 4 16 42 14
Dam Failure 92 62 82 36 1 5 0 0
Inland Sample – Flood Exposure
21 |

Old LymeHazard Number of
ParcelsValue of At‐Risk Parcels(Millions)
Number of Buildings
Value of At‐Risk Buildings(Millions)
Number Of Critical Facilities
Value of At‐Risk Critical Facilities(Millions)
Number of Historic Assets
Value of At‐Risk Historic Assets
(Millions)
Hurricane/Tropical storm
5,483 1554 4,750 761 7 29 113 137
Severe Thunderstorm 5,483 1554 4,750 761 7 29 113 137
Severe Winter Storm/Nor'easter
5,483 1554 4,750 761 7 29 113 137
Tornado 5,483 1554 4,750 761 7 29 113 137Drought 5,483 1554 4,750 761 7 29 113 137Earthquake 5,483 1554 4,750 761 7 29 113 137Flooding
1% Annual 2,006 678 1,646 289 2 2 22 260.2% Annual 3,686 1,243 3,096 566 3 2 42 39
Storm SurgeCategory 1 990 399 751 165 1 2 12 17Category 2 1,446 530 1,169 219 1 2 18 18Category 3 1,854 648 1,551 279 1 2 23 28Category 4 2,165 737 1,843 318 1 2 38 35
Erosion Risk Areas 41 17 27 3 0 0 1 0
Seal Level Rise 625 299 432 119 0 0 10 15
Coastal Sample – Flood Exposure
22 |

• Middlesex County: 42 recorded events over a 24 year period of record = Probability of 1.75 events in any given year. $643,980 in damages in same period. Annualized damages $26,833/yr.
• New London County: 100 recorded events over a 24 year period of record = Probability of 4.16 events in any given year. $7.6 million in damages in same period. Annualized damages $316,666/yr.
NCEI Losses and Probability by County
23 |

Municipality Flood
Chester $158,936
Clinton $1,326,118
Cromwell $0
Deep River $16,624
Durham $45,572
East Haddam $0
East Hampton $37,515
Essex $73,322
Haddam $0
Killingworth $168,219
Lyme $0
Middlefield $0
Middletown $0
Old Lyme $290,112
Old Saybrook $1,661,017
Portland $0
Westbrook $200,586
RiverCOG $3,978,021
Public Assistance Damages 1998-2019
24 |
Municipality Flood
Chester $7,568
Clinton $63,148
Cromwell $0
Deep River $792
Durham $2,170
East Haddam $0
East Hampton $1,786
Essex $3,492
Haddam $0
Killingworth $8,010
Lyme $0
Middlefield $0
Middletown $0
Old Lyme $13,815
Old Saybrook $79,096
Portland $0
Westbrook $9,552
RiverCOG $189,430
Total PA Claims 1998‐2019 Annualized PA Damages (21 Years)
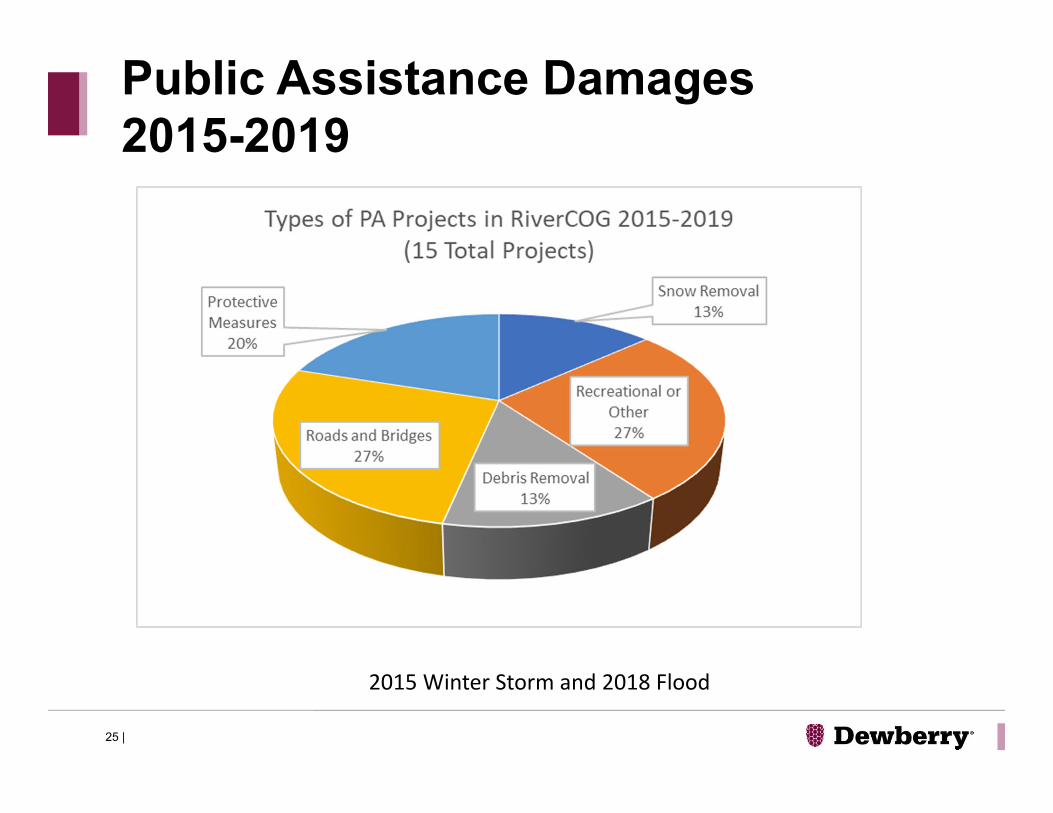
Public Assistance Damages 2015-2019
25 |
2015 Winter Storm and 2018 Flood

Public Assistance Damages 2015-2019
26|
2015 Winter Storm and 2018 Flood

Flood Insurance Claims Since 1978Municipality Polices In Force Insurance in Force Total Losses Paid Repetitive Loss BuildingsChester 57 17,081,400$ $308,521 4Clinton 642 161,795,500$ $7,796,473 52Cromwell 84 20,849,000$ $573,626 3Deep River 36 9,453,400$ $168,496 2Durham 11 2,716,400$ $24,125 1East Haddam 36 9,942,200$ $237,147 4East Hampton 17 4,628,000$ $51,594 1Essex 74 23,167,500$ $1,102,443 5Haddam 41 10,695,200$ $371,439 6Killingworth 20 6,142,700$ $34,173 0Lyme 34 9,291,000$ $459,560 4Middlefield 3 464,800$ $1,217 0Middletown 198 50,633,600$ $1,329,059 3Old Lyme 506 141,490,300$ $8,012,854 35Portland 41 10,055,800$ $1,052,236 6
Policy data as of 6/30/2019
27 |
Total claims = $21.5 million

Total Claims Paid
28 |

1
10
100
1,000
NFIP Policies in Force
NFIP Policies
29 |

$100,000
$1,000,000
$10,000,000
$100,000,000
$1,000,000,000
NFIP Insurance in Force
NFIP Insurance in Force
30 |
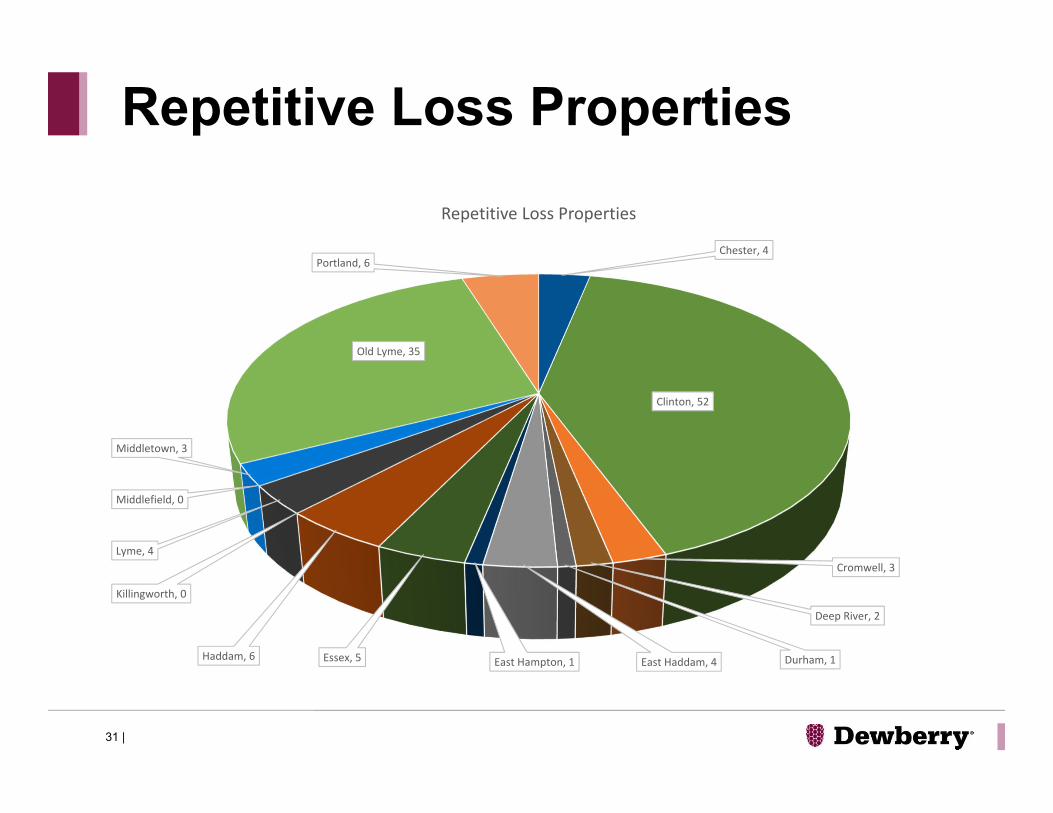
Chester, 4
Clinton, 52
Cromwell, 3
Deep River, 2
Durham, 1East Haddam, 4East Hampton, 1Essex, 5Haddam, 6
Killingworth, 0
Lyme, 4
Middlefield, 0
Middletown, 3
Old Lyme, 35
Portland, 6
Repetitive Loss Properties
Repetitive Loss Properties
31 |

Exposure to Dam Failure Inundation and 100-year Flood Event
32 |

Exposure to Category 4 Storm Surge
33 |

Hazus Primary and Secondary Losses: 100-Year Flood
34 |

Hazus Flood Loss Comparison
35 |

• Snow
• Ice
• Nor’easters
Winter Storms
36 |

Average Annual Snowfall
37 |

NCEI Recorded Events
38 |
• 126 recorded events in Middlesex County and 124 in New London County between 1996 and 2019
• Includes Blizzards, Ice Storms, Heavy Snow, High Wind and General Snow Events
• Annualized Events = Approximately 5.4/Yr.• Damages for Middlesex and New London Counties
are not available from NCEI

PA Damages (1998‐2019)
PA Annualized Damages (21
Years)Municipality Snow SnowChester $137,941 $6,569Clinton $217,260 $10,346Cromwell $510,869 $24,327Deep River $159,357 $7,588Durham $379,543 $18,073East Haddam $169,957 $8,093East Hampton $304,553 $14,503Essex $258,122 $12,292Haddam $307,643 $14,650Killingworth $324,995 $15,476Lyme $125,934 $5,997Middlefield $202,189 $9,628Middletown $1,733,246 $82,536Old Lyme $290,501 $13,833Old Saybrook $220,917 $10,520Portland $364,784 $17,371
Westbrook $102,610 $4,886RiverCOG $5,810,419 $276,687
FEMA Public Assistance for Winter Weather Events 1998-2019
39 |

Hurricane Winds – Hazus 100-Year Event Building and Economic Losses
40 |

Hazus Hurricane Wind Losses2020 Comparison
41 |

• Middlesex County and New London County show 3 events from 2008 to 2020.
• Damage data in NCEI was unreliable.
• Annualized events based on this data = 0.25
Hurricane NCEI Data
42 |

• Thunderstorms
• Hail
• Lightening
• Wind Events
Severe Weather Events
43 |

County Number of Events
Number of Injuries
Number of Deaths Property Damages Crop Damages
Chester 9 0 0 $10,500 $0Clinton 3 2 1 $0 $0Cromwell 5 1 0 $8,500 $0Deep River 7 0 0 $9,500 $0Durham 9 0 0 $32,000 $0
East Haddam 6 0 0 $13,000 $0East Hampton 15 0 0 $43,500 $0
Essex 8 0 0 $22,000 $0Haddam 12 0 0 $53,500 $0
Killingworth 7 0 0 $4,000 $0Lyme 7 0 0 $5,000 $0
Middlefield 3 0 0 $1,500 $0Middlesex County
48 1 1 $635,000 $0
Middletown 33 0 1 $46,000 $0Old Lyme 2 0 0 $7,500 $0Portland 9 0 0 $84,500 $0Total ** 4 3 $976,000 $0
NCEI Severe Weather Events and Damages: 1950 – March 2020
44 |
**Event totals were not included because NCEI events may be counted more than once if one storm event affects multiple communities. This duplication renders totaling by county inaccurate.

Community Annualized Events Annualized Damages
Chester 0.15 $175Clinton 0.05 $0Cromwell 0.08 $142Deep River 0.12 $158Durham 0.15 $533
East Haddam 0.10 $217East Hampton 0.25 $725
Essex 0.13 $367Haddam 0.20 $892
Killingworth 0.12 $67Lyme 0.12 $83
Middlefield 0.05 $25Middlesex County 0.80 $10,583
Middletown 0.55 $767Old Lyme 0.03 $125Portland 0.15 $1,408Total * $16,267
NCEI Severe Weather Annualized Events and Damages (70 Years)
45 |
**Event totals were not included because NCEI events may be counted more than once if one storm event affects multiple communities. This duplication renders totaling by county inaccurate.

FEMA PA Wind Damages 1998 - Present
Municipality WindChester $5,885Clinton $95,397Cromwell $3,590Deep River $9,412Durham $10,102East Haddam $16,346East Hampton $11,760Essex $11,611Haddam $12,222Killingworth $14,202Lyme $3,423Middlefield $4,974Middletown $43,672Old Lyme $16,181Old Saybrook $65,888Portland $5,929Westbrook $21,489RiverCOG $352,083
46 |
Municipality WindChester $123,580Clinton $2,003,338Cromwell $75,399Deep River $197,653Durham $212,149East Haddam $343,275East Hampton $246,950Essex $243,836Haddam $256,653Killingworth $298,238Lyme $71,874Middlefield $104,455Middletown $917,110Old Lyme $339,793Old Saybrook $1,383,658Portland $124,503Westbrook $451,276RiverCOG $7,393,741
Total Damages Annualized (21 Years)

Tornados 1950 – Present
47 |

Tornado Density
48 |

Tornado
49 |
Enhanced Fujita
ScaleDate Injuries Fatalities Town
EF 2 July 12, 1950 0 0 Portland
EF 3 August 21, 1951 8 0 East Hampton
EF 1 July 19, 1963 0 0 Middletown
EF 1 July 21, 1972 0 0 Middletown
EF 1 June 27 1974 0 0 Essex
EF 0 June 30, 1998 0 0 Killingworth
EF 1 June 30,1998 0 0 Chester
EF 1 June 30, 1998 0 0 Old Lyme
History in the Region, 1950‐2014Source: Tornado History Project

NCEI Tornado Data – 1950-Present
CountyNumber of Tornado Events Number of Injuries
Number of Deaths
Property Damages
Middlesex County 9 8 0 $2,463,628.80New London County 4 0 0 $0.00
Annualized Data
County Annualized EventsAnnualized Damages
Middlesex County 0.13 $36,229.84New London County 0.06 $0.00
50 |

Earthquake
• Used Hazus to model the same four scenarios in the 2019 CT State Natural Hazard Mitigation Plan.
• 1938• Annualized• Haddam• East Haddam• Portland • Stamford
51 |

Haddam Fault Scenario
2 |
Results will be shown by each scenario for each community, including physical and economic losses.

Drought
53 |

County Number
of Farms
% of Total Farms in State
Land in Farms
(acres)
Market Value of Products Sold
% of State Total
Middlesex 518 8.67% 24,070 $53,487,000 9.71%New London 949 15.88% 65,159 $118,331,000 21.49%
Drought
54 |
USDA Agricultural Statistics for Connecticut (2012)

• Six Occurrences of Drought
• Probability of Occurrence Annually = 0.27
• USDA Annualized Insured Crop Losses• Middlesex County = $1,069• New London County = $ 340,087
NCEI Drought Data 1996 - Present
55 |

Wildfire
2 |
The Fire TetrahedronImage Provided Wikimedia
Commons

Critical Facilities In Wildfire Zones
56 |
Facility All Critical Facilities
# within Intermix
# within Interface
Total Facilitie
s At Risk
Correctional Institutions 1 0 0 0
EMS 38 15 15 30Fire Stations 42 16 18 34Gas Station with Generator 8 6 2 8
Health Departments 10 2 7 9
Law Enforcement 18 4 9 13
Municipal Solid Waste 25 15 0 15
Storage Tank Farm 3 0 0 0
Total for RiverGOG 145 63 53 116

County Total Parcels Parcels Intersecting Intermix
Parcels Intersecting Interface Total Parcels At Risk
Chester 1,814 1,518 203 1,721 Clinton 6,961 2,753 2,602 5,355
Cromwell 6,108 505 1,035 1,540 Deep River 2,410 1,809 521 2,330
Durham 3,269 2,283 842 3,125 East Haddam 6,008 2,301 1,204 3,505 East Hampton 62,21 4,519 1,319 5,838
Essex 3,483 2,369 1,020 3,389 Haddam 4,362 108 343 451
Killingworth 2,859 2,678 46 2,724 Lyme 1,727 1,306 142 1,448
Middlefield 2,298 1,166 837 2,003 Middletown 13,486 2,888 5,814 8,702 Old Lyme 5,637 2,802 2,653 5,455 Portland 4,872 2,130 2,362 4,492
Total 65,294 31,135 20,943 52,078
Total Parcels in Intermix and Interface Zones
57 |

County Total Value Value Intersecting Intermix
Value Intersecting Interface Total Value At Risk
Chester $422,085,650 $358,113,810 $44,852,850 $402,966,660 Clinton $1,389,179,380 $617,873,460 $481,764,570 $1,099,638,030
Cromwell $1,293,626,844 $126,195,515 $221,771,598 $347,967,113 Deep River $603,294,610 $455,016,810 $107,706,970 $562,723,780
Durham $1,049,359,092 $744,552,564 $242,022,228 $986,574,792 East Haddam $707,783,110 $592,475,310 $72,667,800 $665,143,110 East Hampton $1,095,226,906 $810,512,449 $226,294,687 $1,036,807,136
Essex $956,570,700 $576,449,600 $354,726,000 $931,175,600Haddam $805,585,848 $712,528,258 $55,248,550 $767,776,808
Killingworth $682,345,090 $650,302,310 $10,771,010 $661,073,320 Lyme $623,325,590 $528,506,090 $34,088,100 $562,594,190
Middlefield $387,668,900 $196,760,000 $141,840,800 $338,600,800 Middletown $7,620,906,459 $714,084,545 $5,794,447,198 $6,508,531,743 Old Lyme $1,553,824,980 $853,813,410 $643,183,320 $1,496,996,730 Portland $1,298,645,220 $594,528,550 $618,619,750 $1,213,148,300
Total $20,489,428,379 $8,531,712,681 $9,050,005,431 $17,581,718,112
Total Exposure in Intermix and Interface Zones
58 |

• No wildfire incidents or damages are listed in NCEI.
• No FEMA PA damages are related to wildfire.
• Will need local incidents and damages to complete.
• State level data is available from DEEP and the NFS.
Wildfire Probability and Loss Estimation
59 |

• Extreme Temperatures
• Tree Damage
• Invasive Species
“Other Hazards”
60 |
Analysis is underway and will be primarily qualitative.
Analysis will focus on future steps to quantify the problem and strategies and actions to mitigate current hazard issues.

Review of Goals, Objectives, Strategies and Actions

Regional Goals and Objectives
Goal 1: Promote implementation of sound flood management and other natural hazard mitigation principals on a regional and local level.
• Objective for Goal 1: To promote the development, improvement and implementation of programs, policies, regulations and emergency services that result in the reduction of long‐term risks to life and property.
Note: Covers future development through policy, planning, regulation, emergency services, and environmental strategies.
PREVENTION
NATURAL RESOURCE PROTECTION
63 |

Regional Goals and Objectives
Goal 2: Implementation of effective natural hazard mitigation projects at the regional and local level regional and local level
• Objective for Goal 2: To enhance the ability of RiverCOG, other regional entities, and local communities to reduce or eliminate risks to life and property from natural hazards through cost‐effective hazard mitigation projects, including avoidance
Note: Covers infrastructure and building related projects –the existing built environment.
PROPERTY PROTECTION
STRUCTURAL PROJECTS
64 |

Regional Goals and Objectives
Goal 3: Increase research, planning and outreach activities for the mitigation of natural hazards on a regional and local level.
Objective for Goal 3: To increase general awareness of the region’s natural hazards and encourage State agencies, local communities, and the general public to be proactive in taking actions to reduce long‐term risk to life and property.
Note: Covers the people component of mitigation via outreach and education, and integration with other planning and continuous improvement through increase research.
PREVENTION
NATURAL RESOURCE PROTECTION
EMERGENCY SERVICES
PUBLIC EDUCATION
65 |

Review prior actions• “Ongoing” and “continue” are not allowed
anymore.• Consolidate things like culvert or outreach project
from many, to one overarching per category.New Mitigation Actions
• Should be achievable within five years (i.e. “design” rather than “construct”).
• Should include regional and state initiatives.
Update Mitigation Actions
66 |

Regional Strategies and Initiative
67 |
RiverCOG Regional Mitigation Strategies
Act
ivity
#
Goa
l/Str
ateg
y
Activity Description Lead Agency Est. Cost*
Potential Funding Sources
Timeframe for
Completion
Hazard(s) to be Addressed
Priority Level
Seve
re W
eath
er
Win
d \ T
orna
do
Extre
mem
e H
aet
and
Col
d
Win
ter S
torm
Floo
d
Tree
Dam
age
and
Inva
sive
s S
iW
ildla
nd F
ire
Dro
ught
Earth
quak
e
Clim
ate
Cha
nge
1
NFIP Community Rating System Support Encourage member municipalities to
participate in the National Flood Insurance Program’s Community Rating System by
hosting an information workshop.
RiverCOG X X
2
Hazard Mitigation Plan Updates Support member municipalities with
subsequent updates the regional natural hazard mitigation plan by tracking activities,
cataloguing updated hazard information, and seeking additional grant funding as needed.
RiverCOG X X X X X X X X X X
3 Implementation Support
Facilitate multi-jurisdictional collaboration by hosting annual mitigation meetings.
RiverCOG X X X X X X X X X X
4
Stormwater Management Support Encourage all municipalities in the region to adopt regulations that incorporate or refer to
recommended practices from the most current Connecticut Stormwater Quality Manual, Connecticut Guidelines for Erosion and
Sedimentation Control and, in particular, those that promote low impact development and green infrastructure techniques. This will
encourage development that is in harmony with natural drainage systems.
RiverCOG X X

Refer to Handout
Regional Strategies and Initiatives
68 |

Breakout Sessions

• Instructions for Breakout Sessions • Set up a meeting or call with your local core team.• Review regional strategies and note the ones you
would like to participate in.• Review your 2020-2025 Strategies Table and provide
concurrence or comments, subtractions, modifications and additions.
• Call back in to the original WebEx using the same instructions with any questions or comments if you have them.
• Meeting restarts at 3:00 for wrap up and next steps on the original WebEx link and phone line.
Local Strategies and Actions
70 |

• Return marked up Regional Strategy document and Local Strategy document to Scott and Dave at [email protected] and [email protected].
• Mitigation strategy ranking and evaluation• Completion of Annexes• Public and stakeholder review• Next meeting(s)• State and FEMA review submittals
Thank you!! Please Stay Safe!!
Next Steps
71 |