Embed Size (px)
Citation preview

N E W G R A D U AT E S TA R T I N G S A L A R I E S
2 0 1 9
S A M P L EA G L O B A L S U M M A R Y O F N E W G R A D U AT E PAY
M E R C E R TA L E N T A L L A C C E S S ®
SAMPLE
3 MERCER'S GLOBAL PUBLICATIONS
4 INTRODUCTION
4 Report Structure
5 SUMMARY OF KEY FINDINGS
7 Asia Pacific
8 Europe
10 Middle East & Africa
12 North America
14 ASIA PACIFIC
15 University Graduate Starting Salaries, 2018
19 EUROPE
20 University Graduate Starting Salaries, 2018
23 MIDDLE EAST & AFRICA
24 University Graduate Starting Salaries, 2018
26 NORTH AMERICA
27 University Graduate Starting Salaries, 2018
28 ABOUT THIS REPORT
29 Methodology
36 Glossary
38 ABOUT MERCER
TABLE OF CONTENTS
@2019 MERCER LLC. NEW GRADUATE STARTING SALARIES — SAMPLE2
SAMPLE

GLO
BAL
PUBL
ICAT
ION
S
Stay ahead of today’s tight deadlines and competitive race for labor with these resources. Covering local benefits, global compensation practices, and emerging HR policy trends, this portfolio contains all of the actionable data, insights, and guidance you need to steer your organization to success. Select a title to learn more about each of our industry-leading reports, or visit imercer.com/global for more information.
GET EVERY THING IN ONE PLACESubscribe to the Talent All Access® Portal for exclusive access to online tools and all of our publications, or schedule a demo with a Mercer representative.
ORDER ONLINE
* Exclusive to Talent All Access® subscribers** Not included in Talent All Access®
H E A LT H & B E N E F I T S
Car Benefit Policies Around the World
Global Parental Leave Global Parental Leave Industry Scorecard
LGBT Benefits Around the World*
Worldwide Benefit & Employment Guidelines
Vacation and Other Leave Policies Around the World
Vacation and Other Leave Industry Scorecard
Car Benefit Policies — Global Industry Findings
Severance Pay Policies Around the World
Severance Pay Policies Industry Scorecard
W O R K F O R C E & C A R E E R S
Global Compensation Planning
Global Compensation Planning 20 Year Look Back*
Global Pay Summary Incentives Around the World
H A N D B O O K S & G U I D E S
Compensation Handbook*
Global Mobility Handbook*
HR Guide to Doing Business*
HR Management Terms*
HR Atlas*
New Graduate Starting Salaries
Salary Movement Snapshot**
Workforce Turnover Around the World
Short-Term Incentives Around the World
Short-term Incentive Trends — A 10 Year Review*
SAMPLE
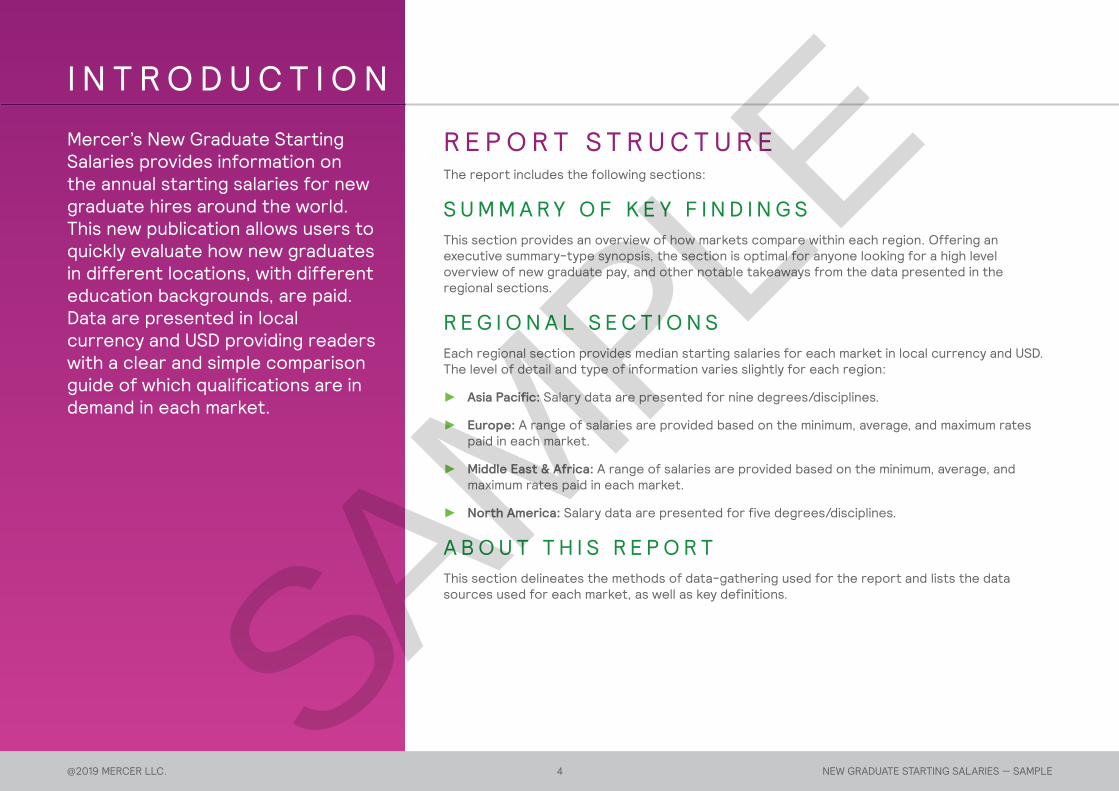
Mercer’s New Graduate Starting Salaries provides information on the annual starting salaries for new graduate hires around the world. This new publication allows users to quickly evaluate how new graduates in different locations, with different education backgrounds, are paid. Data are presented in local currency and USD providing readers with a clear and simple comparison guide of which qualifications are in demand in each market.
@2019 MERCER LLC. NEW GRADUATE STARTING SALARIES — SAMPLE4
I N T R O D U C T I O N
R E P O R T S T R U C T U R EThe report includes the following sections:
S U M M A R Y O F K E Y F I N D I N G SThis section provides an overview of how markets compare within each region. Offering an executive summary-type synopsis, the section is optimal for anyone looking for a high level overview of new graduate pay, and other notable takeaways from the data presented in the regional sections.
R E G I O N A L S E C T I O N SEach regional section provides median starting salaries for each market in local currency and USD. The level of detail and type of information varies slightly for each region:
► Asia Pacific: Salary data are presented for nine degrees/disciplines.
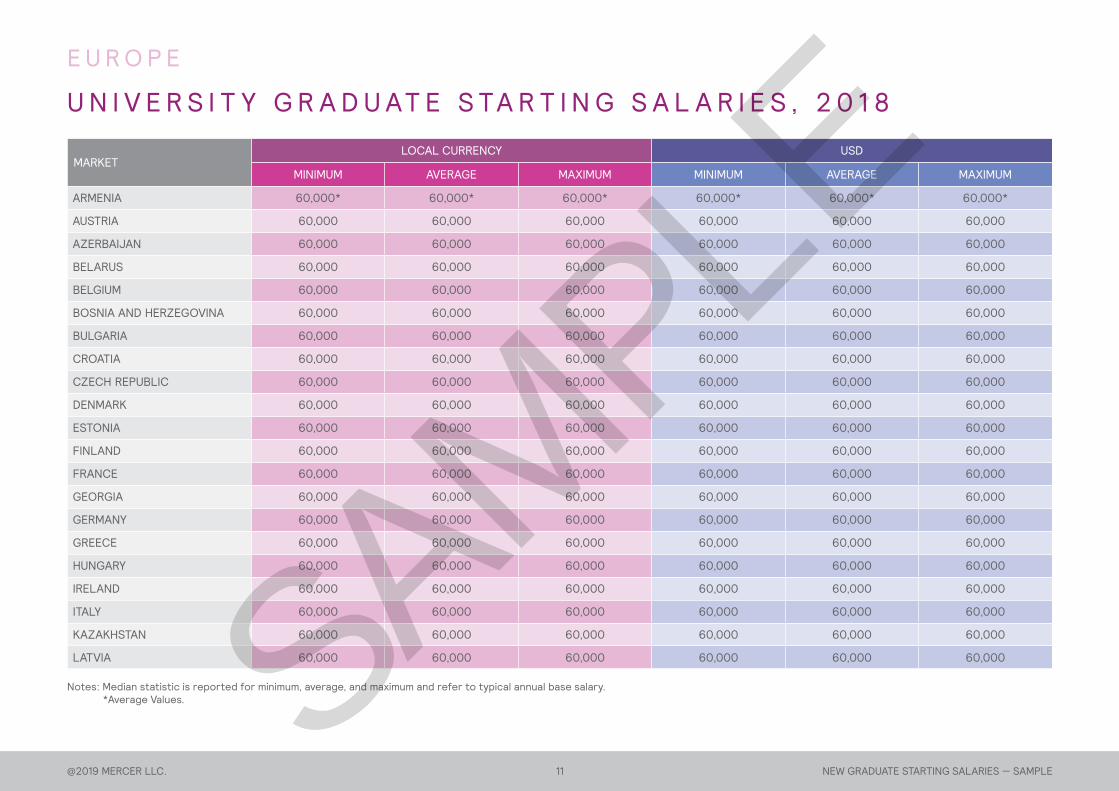
► Europe: A range of salaries are provided based on the minimum, average, and maximum rates paid in each market.
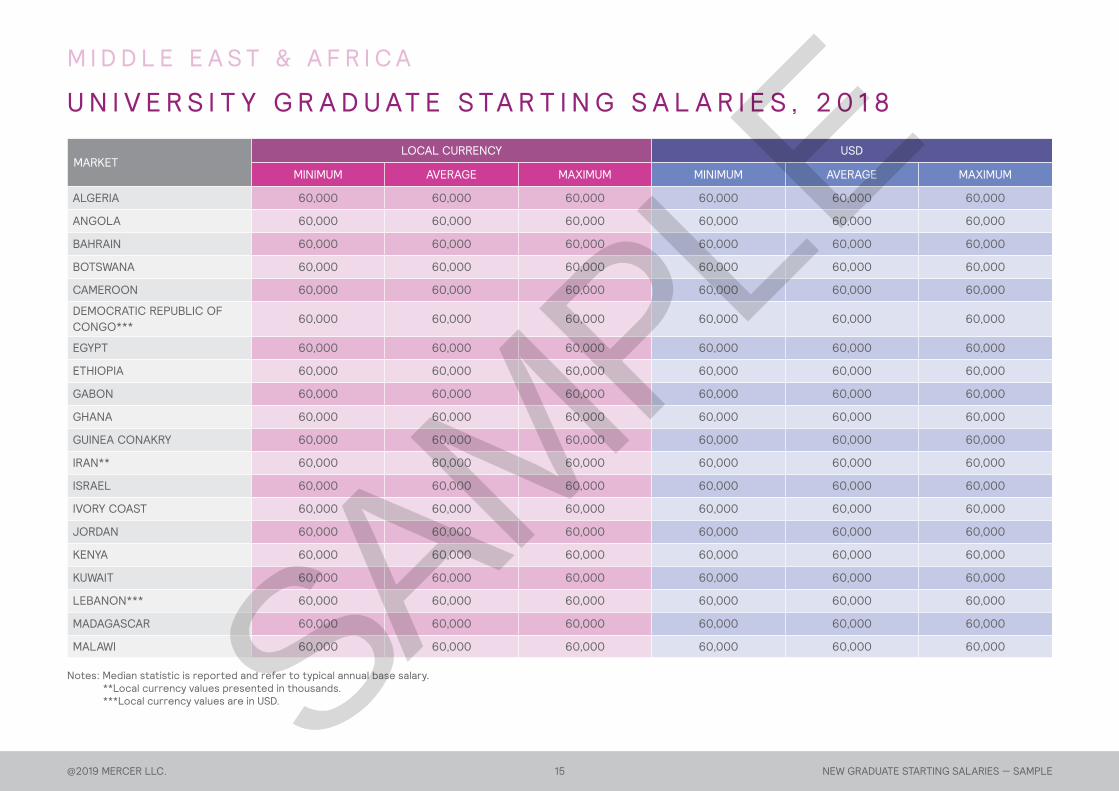
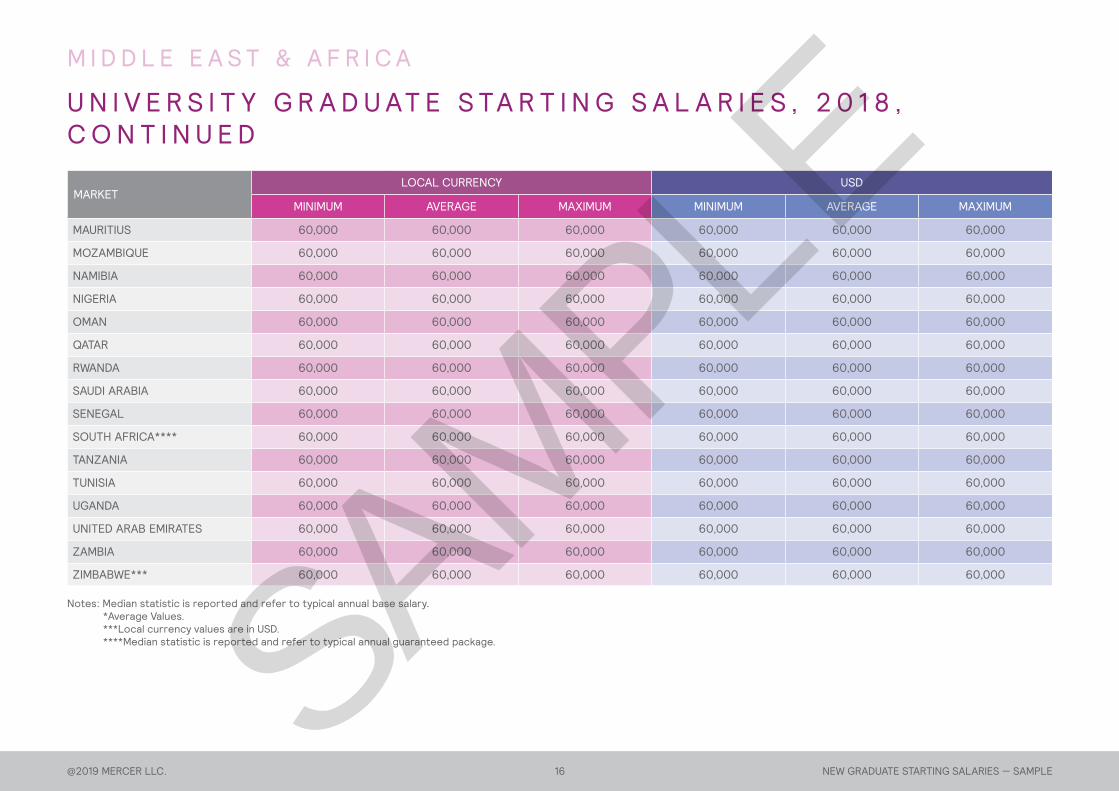
► Middle East & Africa: A range of salaries are provided based on the minimum, average, and maximum rates paid in each market.
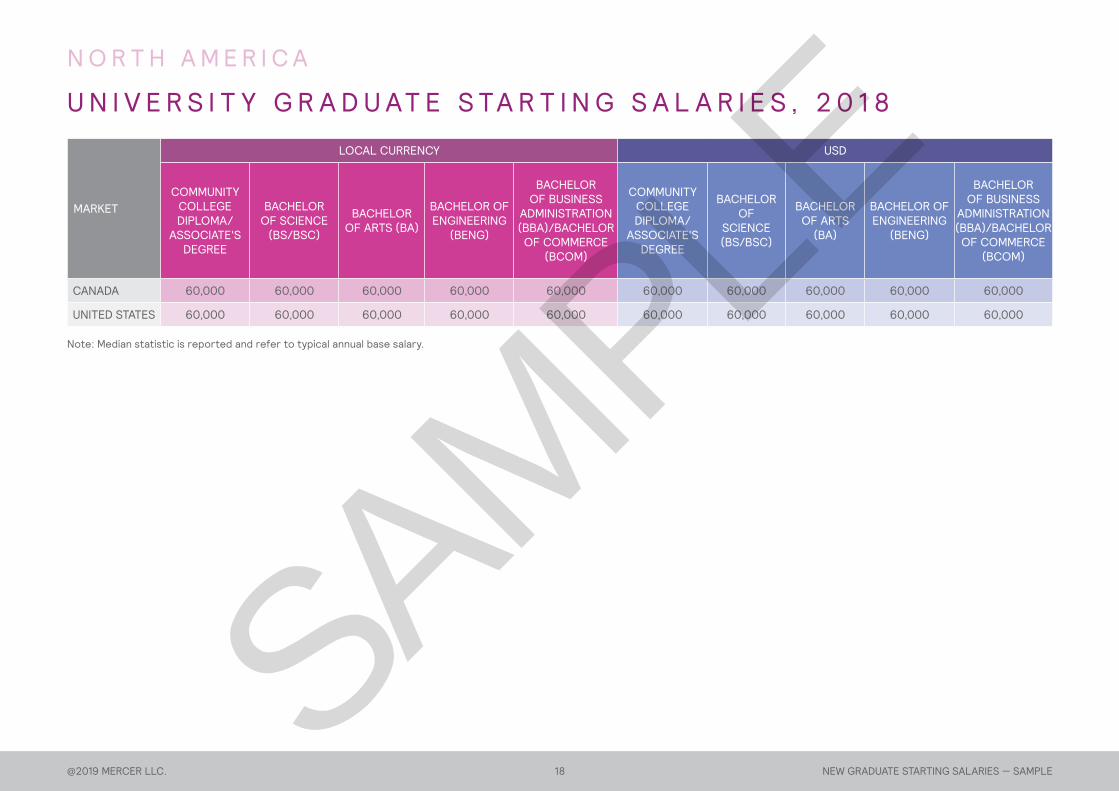
► North America: Salary data are presented for five degrees/disciplines.
A B O U T T H I S R E P O R TThis section delineates the methods of data-gathering used for the report and lists the data sources used for each market, as well as key definitions.
SAMPLE

A S I A PA C I F I C
SAMPLE
A S I A PA C I F I C
6@2019 MERCER LLC. NEW GRADUATE STARTING SALARIES — SAMPLE
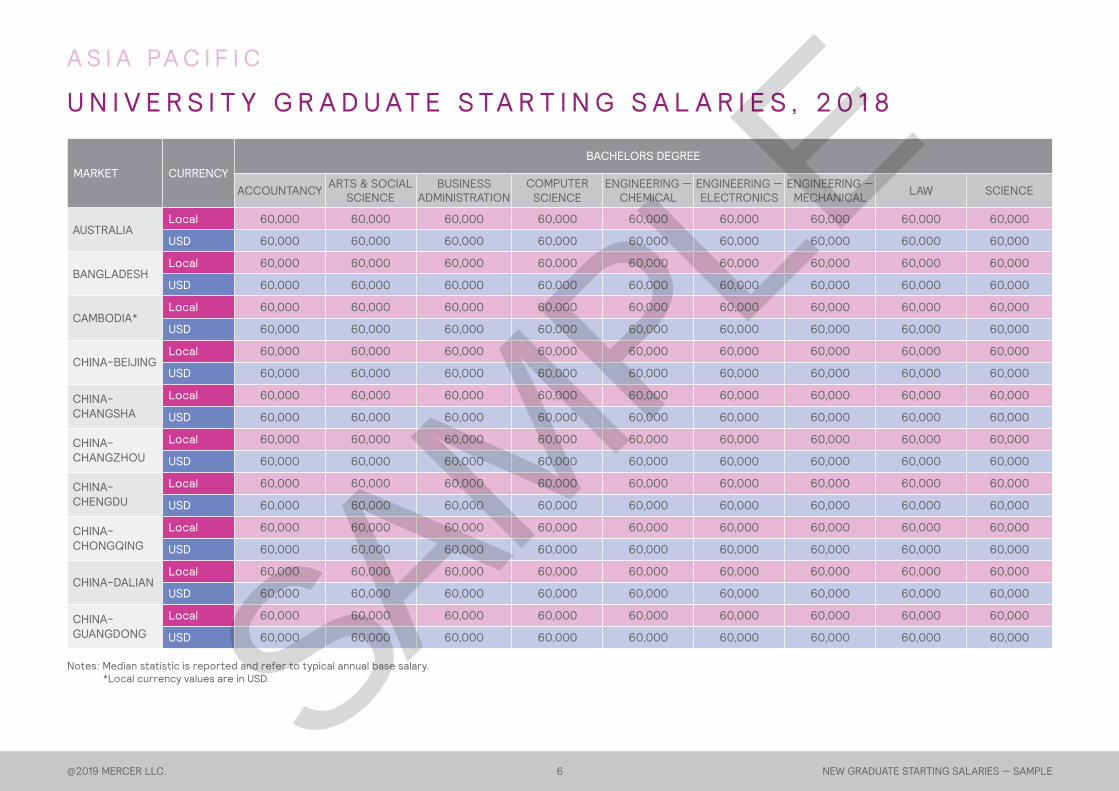
U N I V E R S I T Y G R A D U AT E S TA R T I N G S A L A R I E S , 2 0 1 8
MARKET CURRENCYBACHELORS DEGREE
ACCOUNTANCY ARTS & SOCIAL SCIENCE
BUSINESS ADMINISTRATION
COMPUTER SCIENCE
ENGINEERING — CHEMICAL
ENGINEERING — ELECTRONICS
ENGINEERING — MECHANICAL LAW SCIENCE
AUSTRALIALocal 60,000 60,000 60,000 60,000 60,000 60,000 60,000 60,000 60,000
USD 60,000 60,000 60,000 60,000 60,000 60,000 60,000 60,000 60,000
BANGLADESHLocal 60,000 60,000 60,000 60,000 60,000 60,000 60,000 60,000 60,000
USD 60,000 60,000 60,000 60,000 60,000 60,000 60,000 60,000 60,000
CAMBODIA*Local 60,000 60,000 60,000 60,000 60,000 60,000 60,000 60,000 60,000
USD 60,000 60,000 60,000 60,000 60,000 60,000 60,000 60,000 60,000
CHINA-BEIJINGLocal 60,000 60,000 60,000 60,000 60,000 60,000 60,000 60,000 60,000
USD 60,000 60,000 60,000 60,000 60,000 60,000 60,000 60,000 60,000
CHINA-CHANGSHA
Local 60,000 60,000 60,000 60,000 60,000 60,000 60,000 60,000 60,000
USD 60,000 60,000 60,000 60,000 60,000 60,000 60,000 60,000 60,000
CHINA-CHANGZHOU
Local 60,000 60,000 60,000 60,000 60,000 60,000 60,000 60,000 60,000
USD 60,000 60,000 60,000 60,000 60,000 60,000 60,000 60,000 60,000
CHINA-CHENGDU
Local 60,000 60,000 60,000 60,000 60,000 60,000 60,000 60,000 60,000
USD 60,000 60,000 60,000 60,000 60,000 60,000 60,000 60,000 60,000
CHINA-CHONGQING
Local 60,000 60,000 60,000 60,000 60,000 60,000 60,000 60,000 60,000
USD 60,000 60,000 60,000 60,000 60,000 60,000 60,000 60,000 60,000
CHINA-DALIANLocal 60,000 60,000 60,000 60,000 60,000 60,000 60,000 60,000 60,000
USD 60,000 60,000 60,000 60,000 60,000 60,000 60,000 60,000 60,000
CHINA-GUANGDONG
Local 60,000 60,000 60,000 60,000 60,000 60,000 60,000 60,000 60,000
USD 60,000 60,000 60,000 60,000 60,000 60,000 60,000 60,000 60,000
Notes: Median statistic is reported and refer to typical annual base salary.*Local currency values are in USD. SAMPLE
A S I A PA C I F I C
7@2019 MERCER LLC. NEW GRADUATE STARTING SALARIES — SAMPLE
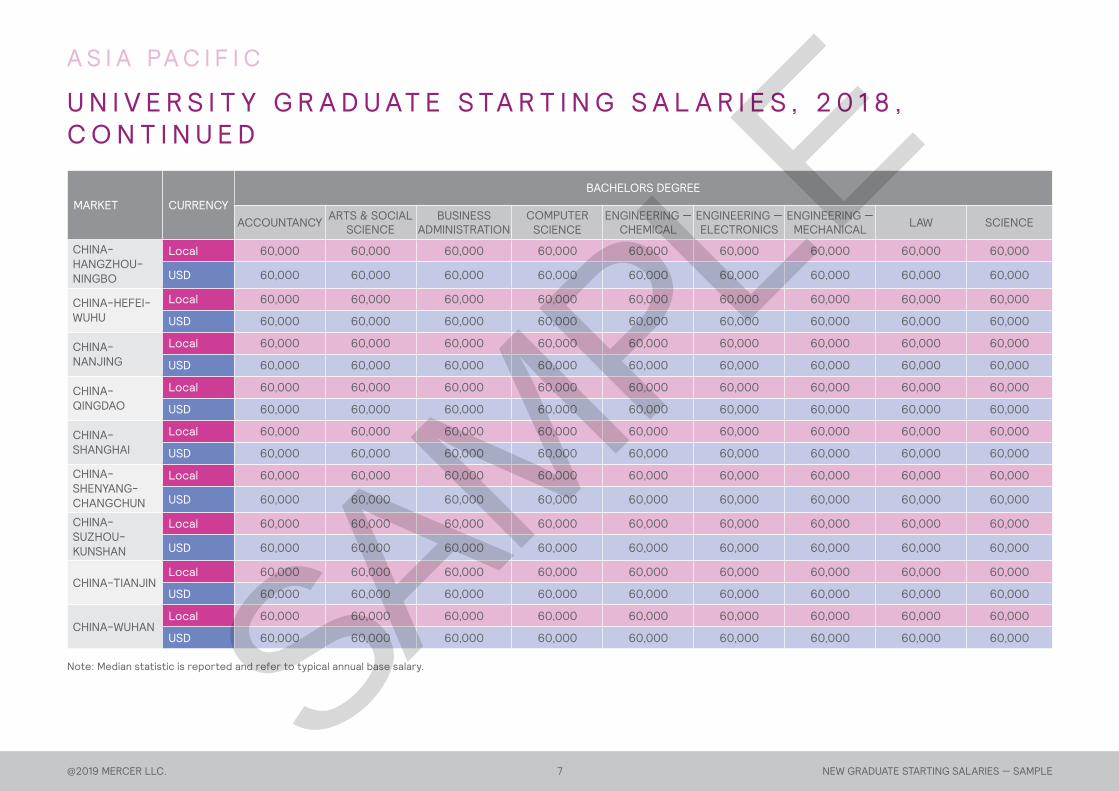
MARKET CURRENCYBACHELORS DEGREE
ACCOUNTANCY ARTS & SOCIAL SCIENCE
BUSINESS ADMINISTRATION
COMPUTER SCIENCE
ENGINEERING — CHEMICAL
ENGINEERING — ELECTRONICS
ENGINEERING — MECHANICAL LAW SCIENCE
CHINA-HANGZHOU-NINGBO
Local 60,000 60,000 60,000 60,000 60,000 60,000 60,000 60,000 60,000
USD 60,000 60,000 60,000 60,000 60,000 60,000 60,000 60,000 60,000
CHINA-HEFEI-WUHU
Local 60,000 60,000 60,000 60,000 60,000 60,000 60,000 60,000 60,000
USD 60,000 60,000 60,000 60,000 60,000 60,000 60,000 60,000 60,000
CHINA-NANJING
Local 60,000 60,000 60,000 60,000 60,000 60,000 60,000 60,000 60,000
USD 60,000 60,000 60,000 60,000 60,000 60,000 60,000 60,000 60,000
CHINA-QINGDAO
Local 60,000 60,000 60,000 60,000 60,000 60,000 60,000 60,000 60,000
USD 60,000 60,000 60,000 60,000 60,000 60,000 60,000 60,000 60,000
CHINA-SHANGHAI
Local 60,000 60,000 60,000 60,000 60,000 60,000 60,000 60,000 60,000
USD 60,000 60,000 60,000 60,000 60,000 60,000 60,000 60,000 60,000
CHINA-SHENYANG-CHANGCHUN
Local 60,000 60,000 60,000 60,000 60,000 60,000 60,000 60,000 60,000
USD 60,000 60,000 60,000 60,000 60,000 60,000 60,000 60,000 60,000
CHINA-SUZHOU-KUNSHAN
Local 60,000 60,000 60,000 60,000 60,000 60,000 60,000 60,000 60,000
USD 60,000 60,000 60,000 60,000 60,000 60,000 60,000 60,000 60,000
CHINA-TIANJINLocal 60,000 60,000 60,000 60,000 60,000 60,000 60,000 60,000 60,000
USD 60,000 60,000 60,000 60,000 60,000 60,000 60,000 60,000 60,000
CHINA-WUHANLocal 60,000 60,000 60,000 60,000 60,000 60,000 60,000 60,000 60,000
USD 60,000 60,000 60,000 60,000 60,000 60,000 60,000 60,000 60,000
U N I V E R S I T Y G R A D U AT E S TA R T I N G S A L A R I E S , 2 0 1 8 , C O N T I N U E D
Note: Median statistic is reported and refer to typical annual base salary.SAMPLE
A S I A PA C I F I C
8@2019 MERCER LLC. NEW GRADUATE STARTING SALARIES — SAMPLE
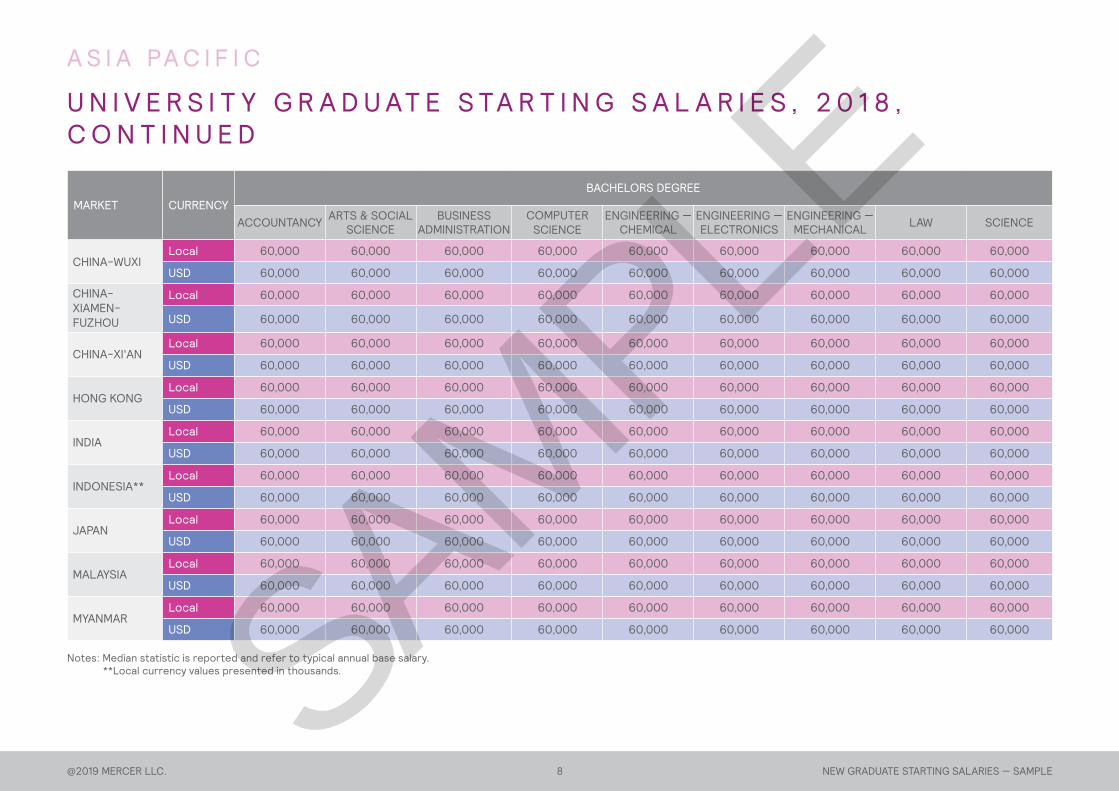
MARKET CURRENCYBACHELORS DEGREE
ACCOUNTANCY ARTS & SOCIAL SCIENCE
BUSINESS ADMINISTRATION
COMPUTER SCIENCE
ENGINEERING — CHEMICAL
ENGINEERING — ELECTRONICS
ENGINEERING — MECHANICAL LAW SCIENCE
CHINA-WUXILocal 60,000 60,000 60,000 60,000 60,000 60,000 60,000 60,000 60,000
USD 60,000 60,000 60,000 60,000 60,000 60,000 60,000 60,000 60,000
CHINA-XIAMEN-FUZHOU
Local 60,000 60,000 60,000 60,000 60,000 60,000 60,000 60,000 60,000
USD 60,000 60,000 60,000 60,000 60,000 60,000 60,000 60,000 60,000
CHINA-XI'ANLocal 60,000 60,000 60,000 60,000 60,000 60,000 60,000 60,000 60,000
USD 60,000 60,000 60,000 60,000 60,000 60,000 60,000 60,000 60,000
HONG KONGLocal 60,000 60,000 60,000 60,000 60,000 60,000 60,000 60,000 60,000
USD 60,000 60,000 60,000 60,000 60,000 60,000 60,000 60,000 60,000
INDIALocal 60,000 60,000 60,000 60,000 60,000 60,000 60,000 60,000 60,000
USD 60,000 60,000 60,000 60,000 60,000 60,000 60,000 60,000 60,000
INDONESIA**Local 60,000 60,000 60,000 60,000 60,000 60,000 60,000 60,000 60,000
USD 60,000 60,000 60,000 60,000 60,000 60,000 60,000 60,000 60,000
JAPANLocal 60,000 60,000 60,000 60,000 60,000 60,000 60,000 60,000 60,000
USD 60,000 60,000 60,000 60,000 60,000 60,000 60,000 60,000 60,000
MALAYSIALocal 60,000 60,000 60,000 60,000 60,000 60,000 60,000 60,000 60,000
USD 60,000 60,000 60,000 60,000 60,000 60,000 60,000 60,000 60,000
MYANMARLocal 60,000 60,000 60,000 60,000 60,000 60,000 60,000 60,000 60,000
USD 60,000 60,000 60,000 60,000 60,000 60,000 60,000 60,000 60,000
U N I V E R S I T Y G R A D U AT E S TA R T I N G S A L A R I E S , 2 0 1 8 , C O N T I N U E D
Notes: Median statistic is reported and refer to typical annual base salary.**Local currency values presented in thousands.SAMPLE
A S I A PA C I F I C
9@2019 MERCER LLC. NEW GRADUATE STARTING SALARIES — SAMPLE
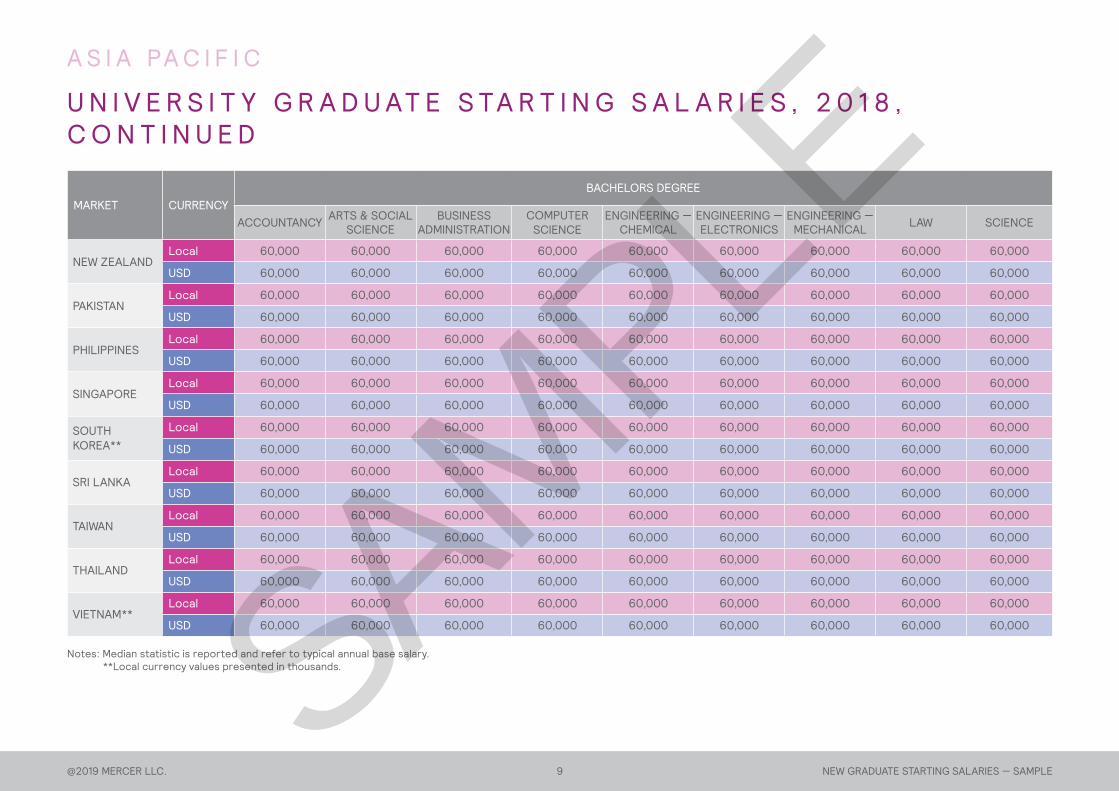
MARKET CURRENCYBACHELORS DEGREE
ACCOUNTANCY ARTS & SOCIAL SCIENCE
BUSINESS ADMINISTRATION
COMPUTER SCIENCE
ENGINEERING — CHEMICAL
ENGINEERING — ELECTRONICS
ENGINEERING — MECHANICAL LAW SCIENCE
NEW ZEALANDLocal 60,000 60,000 60,000 60,000 60,000 60,000 60,000 60,000 60,000
USD 60,000 60,000 60,000 60,000 60,000 60,000 60,000 60,000 60,000
PAKISTANLocal 60,000 60,000 60,000 60,000 60,000 60,000 60,000 60,000 60,000
USD 60,000 60,000 60,000 60,000 60,000 60,000 60,000 60,000 60,000
PHILIPPINESLocal 60,000 60,000 60,000 60,000 60,000 60,000 60,000 60,000 60,000
USD 60,000 60,000 60,000 60,000 60,000 60,000 60,000 60,000 60,000
SINGAPORELocal 60,000 60,000 60,000 60,000 60,000 60,000 60,000 60,000 60,000
USD 60,000 60,000 60,000 60,000 60,000 60,000 60,000 60,000 60,000
SOUTH KOREA**
Local 60,000 60,000 60,000 60,000 60,000 60,000 60,000 60,000 60,000
USD 60,000 60,000 60,000 60,000 60,000 60,000 60,000 60,000 60,000
SRI LANKALocal 60,000 60,000 60,000 60,000 60,000 60,000 60,000 60,000 60,000
USD 60,000 60,000 60,000 60,000 60,000 60,000 60,000 60,000 60,000
TAIWANLocal 60,000 60,000 60,000 60,000 60,000 60,000 60,000 60,000 60,000
USD 60,000 60,000 60,000 60,000 60,000 60,000 60,000 60,000 60,000
THAILANDLocal 60,000 60,000 60,000 60,000 60,000 60,000 60,000 60,000 60,000
USD 60,000 60,000 60,000 60,000 60,000 60,000 60,000 60,000 60,000
VIETNAM**Local 60,000 60,000 60,000 60,000 60,000 60,000 60,000 60,000 60,000
USD 60,000 60,000 60,000 60,000 60,000 60,000 60,000 60,000 60,000
U N I V E R S I T Y G R A D U AT E S TA R T I N G S A L A R I E S , 2 0 1 8 , C O N T I N U E D
Notes: Median statistic is reported and refer to typical annual base salary.**Local currency values presented in thousands.SAMPLE

E U R O P E
SAMPLE
E U R O P E
11@2019 MERCER LLC. NEW GRADUATE STARTING SALARIES — SAMPLE
MARKETLOCAL CURRENCY USD
MINIMUM AVERAGE MAXIMUM MINIMUM AVERAGE MAXIMUM
ARMENIA 60,000* 60,000* 60,000* 60,000* 60,000* 60,000*
AUSTRIA 60,000 60,000 60,000 60,000 60,000 60,000
AZERBAIJAN 60,000 60,000 60,000 60,000 60,000 60,000
BELARUS 60,000 60,000 60,000 60,000 60,000 60,000
BELGIUM 60,000 60,000 60,000 60,000 60,000 60,000
BOSNIA AND HERZEGOVINA 60,000 60,000 60,000 60,000 60,000 60,000
BULGARIA 60,000 60,000 60,000 60,000 60,000 60,000
CROATIA 60,000 60,000 60,000 60,000 60,000 60,000
CZECH REPUBLIC 60,000 60,000 60,000 60,000 60,000 60,000
DENMARK 60,000 60,000 60,000 60,000 60,000 60,000
ESTONIA 60,000 60,000 60,000 60,000 60,000 60,000
FINLAND 60,000 60,000 60,000 60,000 60,000 60,000
FRANCE 60,000 60,000 60,000 60,000 60,000 60,000
GEORGIA 60,000 60,000 60,000 60,000 60,000 60,000
GERMANY 60,000 60,000 60,000 60,000 60,000 60,000
GREECE 60,000 60,000 60,000 60,000 60,000 60,000
HUNGARY 60,000 60,000 60,000 60,000 60,000 60,000
IRELAND 60,000 60,000 60,000 60,000 60,000 60,000
ITALY 60,000 60,000 60,000 60,000 60,000 60,000
KAZAKHSTAN 60,000 60,000 60,000 60,000 60,000 60,000
LATVIA 60,000 60,000 60,000 60,000 60,000 60,000
U N I V E R S I T Y G R A D U AT E S TA R T I N G S A L A R I E S , 2 0 1 8
Notes: Median statistic is reported for minimum, average, and maximum and refer to typical annual base salary.*Average Values. SAMPLE
E U R O P E
12@2019 MERCER LLC. NEW GRADUATE STARTING SALARIES — SAMPLE
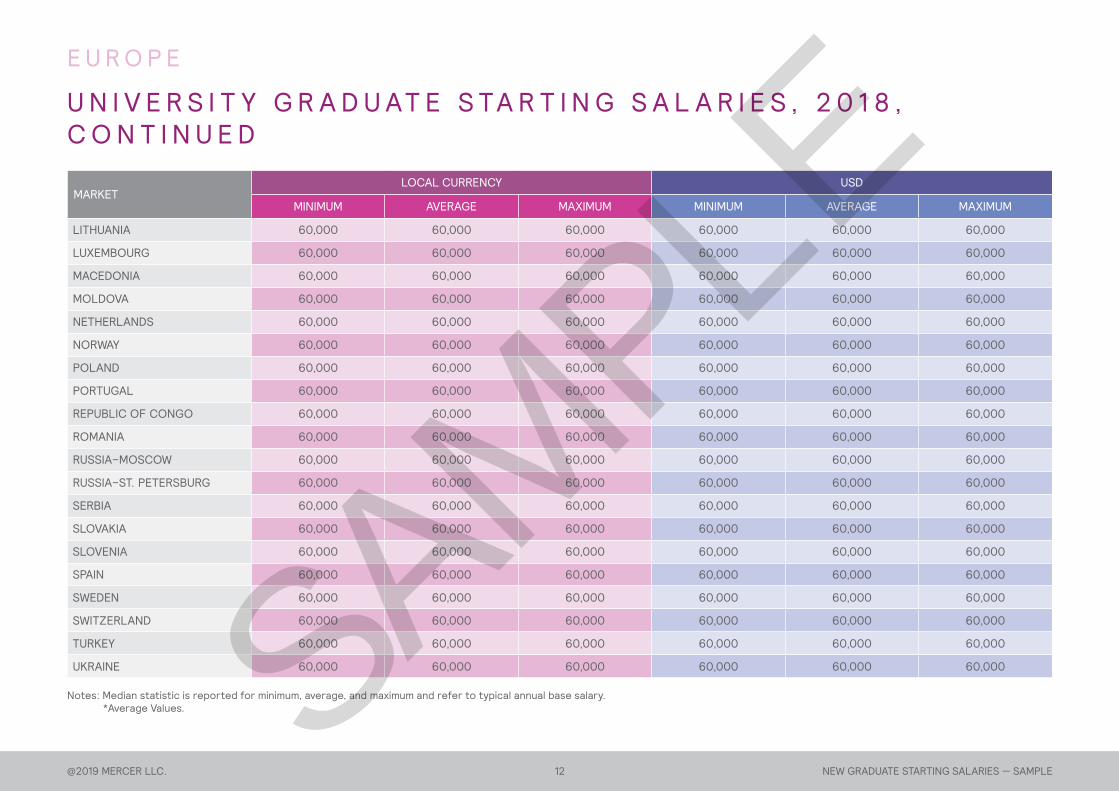
MARKETLOCAL CURRENCY USD
MINIMUM AVERAGE MAXIMUM MINIMUM AVERAGE MAXIMUM
LITHUANIA 60,000 60,000 60,000 60,000 60,000 60,000
LUXEMBOURG 60,000 60,000 60,000 60,000 60,000 60,000
MACEDONIA 60,000 60,000 60,000 60,000 60,000 60,000
MOLDOVA 60,000 60,000 60,000 60,000 60,000 60,000
NETHERLANDS 60,000 60,000 60,000 60,000 60,000 60,000
NORWAY 60,000 60,000 60,000 60,000 60,000 60,000
POLAND 60,000 60,000 60,000 60,000 60,000 60,000
PORTUGAL 60,000 60,000 60,000 60,000 60,000 60,000
REPUBLIC OF CONGO 60,000 60,000 60,000 60,000 60,000 60,000
ROMANIA 60,000 60,000 60,000 60,000 60,000 60,000
RUSSIA–MOSCOW 60,000 60,000 60,000 60,000 60,000 60,000
RUSSIA–ST. PETERSBURG 60,000 60,000 60,000 60,000 60,000 60,000
SERBIA 60,000 60,000 60,000 60,000 60,000 60,000
SLOVAKIA 60,000 60,000 60,000 60,000 60,000 60,000
SLOVENIA 60,000 60,000 60,000 60,000 60,000 60,000
SPAIN 60,000 60,000 60,000 60,000 60,000 60,000
SWEDEN 60,000 60,000 60,000 60,000 60,000 60,000
SWITZERLAND 60,000 60,000 60,000 60,000 60,000 60,000
TURKEY 60,000 60,000 60,000 60,000 60,000 60,000
UKRAINE 60,000 60,000 60,000 60,000 60,000 60,000
U N I V E R S I T Y G R A D U AT E S TA R T I N G S A L A R I E S , 2 0 1 8 , C O N T I N U E D
Notes: Median statistic is reported for minimum, average, and maximum and refer to typical annual base salary.*Average Values. SAMPLE
E U R O P E
13@2019 MERCER LLC. NEW GRADUATE STARTING SALARIES — SAMPLE
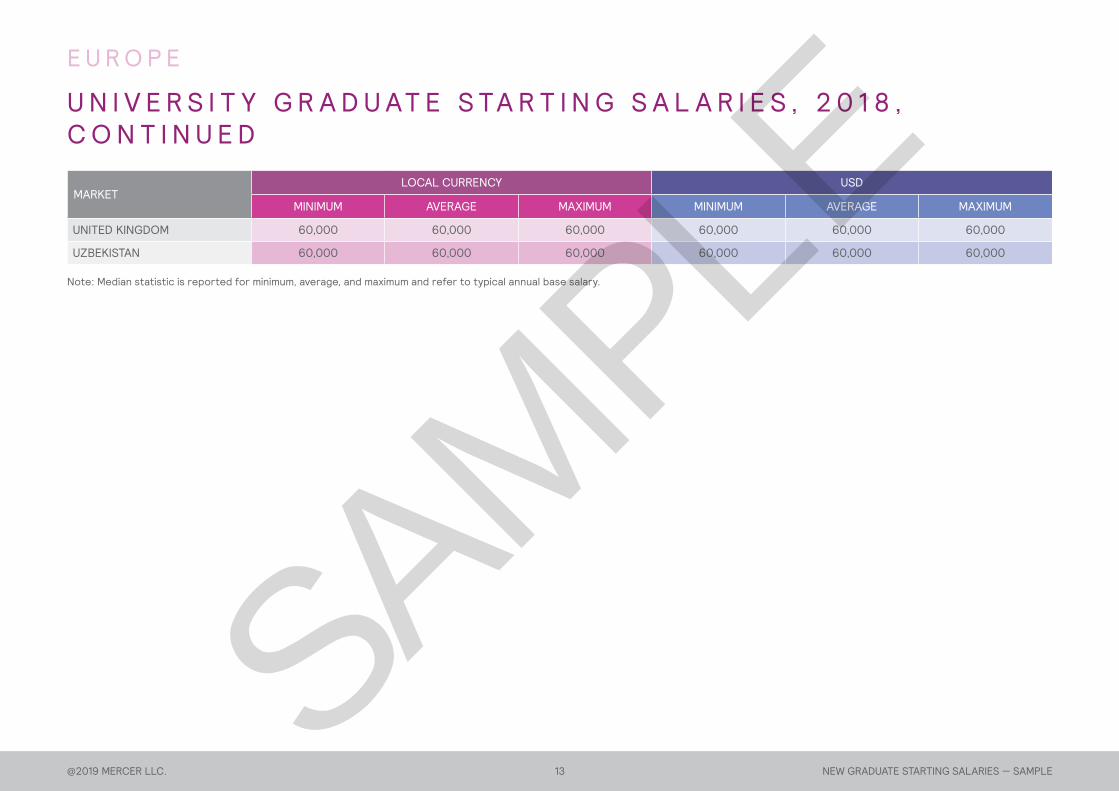
U N I V E R S I T Y G R A D U AT E S TA R T I N G S A L A R I E S , 2 0 1 8 , C O N T I N U E D
Note: Median statistic is reported for minimum, average, and maximum and refer to typical annual base salary.
MARKETLOCAL CURRENCY USD
MINIMUM AVERAGE MAXIMUM MINIMUM AVERAGE MAXIMUM
UNITED KINGDOM 60,000 60,000 60,000 60,000 60,000 60,000
UZBEKISTAN 60,000 60,000 60,000 60,000 60,000 60,000
SAMPLE

M I D D L E E A S T & A F R I C A
SAMPLE
@2019 MERCER LLC. NEW GRADUATE STARTING SALARIES — SAMPLE15
M I D D L E E A S T & A F R I C A
MARKETLOCAL CURRENCY USD
MINIMUM AVERAGE MAXIMUM MINIMUM AVERAGE MAXIMUM
ALGERIA 60,000 60,000 60,000 60,000 60,000 60,000
ANGOLA 60,000 60,000 60,000 60,000 60,000 60,000
BAHRAIN 60,000 60,000 60,000 60,000 60,000 60,000
BOTSWANA 60,000 60,000 60,000 60,000 60,000 60,000
CAMEROON 60,000 60,000 60,000 60,000 60,000 60,000
DEMOCRATIC REPUBLIC OF CONGO***
60,000 60,000 60,000 60,000 60,000 60,000
EGYPT 60,000 60,000 60,000 60,000 60,000 60,000
ETHIOPIA 60,000 60,000 60,000 60,000 60,000 60,000
GABON 60,000 60,000 60,000 60,000 60,000 60,000
GHANA 60,000 60,000 60,000 60,000 60,000 60,000
GUINEA CONAKRY 60,000 60,000 60,000 60,000 60,000 60,000
IRAN** 60,000 60,000 60,000 60,000 60,000 60,000
ISRAEL 60,000 60,000 60,000 60,000 60,000 60,000
IVORY COAST 60,000 60,000 60,000 60,000 60,000 60,000
JORDAN 60,000 60,000 60,000 60,000 60,000 60,000
KENYA 60,000 60,000 60,000 60,000 60,000 60,000
KUWAIT 60,000 60,000 60,000 60,000 60,000 60,000
LEBANON*** 60,000 60,000 60,000 60,000 60,000 60,000
MADAGASCAR 60,000 60,000 60,000 60,000 60,000 60,000
MALAWI 60,000 60,000 60,000 60,000 60,000 60,000
U N I V E R S I T Y G R A D U AT E S TA R T I N G S A L A R I E S , 2 0 1 8
Notes: Median statistic is reported and refer to typical annual base salary.**Local currency values presented in thousands. ***Local currency values are in USD. SAMPLE
@2019 MERCER LLC. NEW GRADUATE STARTING SALARIES — SAMPLE16
Notes: Median statistic is reported and refer to typical annual base salary.*Average Values. ***Local currency values are in USD. ****Median statistic is reported and refer to typical annual guaranteed package.
U N I V E R S I T Y G R A D U AT E S TA R T I N G S A L A R I E S , 2 0 1 8 , C O N T I N U E D
MARKETLOCAL CURRENCY USD
MINIMUM AVERAGE MAXIMUM MINIMUM AVERAGE MAXIMUM
MAURITIUS 60,000 60,000 60,000 60,000 60,000 60,000
MOZAMBIQUE 60,000 60,000 60,000 60,000 60,000 60,000
NAMIBIA 60,000 60,000 60,000 60,000 60,000 60,000
NIGERIA 60,000 60,000 60,000 60,000 60,000 60,000
OMAN 60,000 60,000 60,000 60,000 60,000 60,000
QATAR 60,000 60,000 60,000 60,000 60,000 60,000
RWANDA 60,000 60,000 60,000 60,000 60,000 60,000
SAUDI ARABIA 60,000 60,000 60,000 60,000 60,000 60,000
SENEGAL 60,000 60,000 60,000 60,000 60,000 60,000
SOUTH AFRICA**** 60,000 60,000 60,000 60,000 60,000 60,000
TANZANIA 60,000 60,000 60,000 60,000 60,000 60,000
TUNISIA 60,000 60,000 60,000 60,000 60,000 60,000
UGANDA 60,000 60,000 60,000 60,000 60,000 60,000
UNITED ARAB EMIRATES 60,000 60,000 60,000 60,000 60,000 60,000
ZAMBIA 60,000 60,000 60,000 60,000 60,000 60,000
ZIMBABWE*** 60,000 60,000 60,000 60,000 60,000 60,000
M I D D L E E A S T & A F R I C A
SAMPLE

N O R T H A M E R I C A
SAMPLE
@2019 MERCER LLC. NEW GRADUATE STARTING SALARIES — SAMPLE18
MARKET
LOCAL CURRENCY USD
COMMUNITY COLLEGE DIPLOMA/
ASSOCIATE'S DEGREE
BACHELOR OF SCIENCE
(BS/BSC)
BACHELOR OF ARTS (BA)
BACHELOR OF ENGINEERING
(BENG)
BACHELOR OF BUSINESS
ADMINISTRATION (BBA)/BACHELOR
OF COMMERCE (BCOM)
COMMUNITY COLLEGE DIPLOMA/
ASSOCIATE'S DEGREE
BACHELOR OF
SCIENCE (BS/BSC)
BACHELOR OF ARTS
(BA)
BACHELOR OF ENGINEERING
(BENG)
BACHELOR OF BUSINESS
ADMINISTRATION (BBA)/BACHELOR
OF COMMERCE (BCOM)
CANADA 60,000 60,000 60,000 60,000 60,000 60,000 60,000 60,000 60,000 60,000
UNITED STATES 60,000 60,000 60,000 60,000 60,000 60,000 60,000 60,000 60,000 60,000
U N I V E R S I T Y G R A D U AT E S TA R T I N G S A L A R I E S , 2 0 1 8
Note: Median statistic is reported and refer to typical annual base salary.
N O R T H A M E R I C A
SAMPLE

A B O U T T H I S R E P O R T
SAMPLE
MET
HO
DO
LOG
Y
@2019 MERCER LLC. NEW GRADUATE STARTING SALARIES — SAMPLE20
A B O U T T H I S R E P O R TThis section provides information on the methods of collecting, collating, and analyzing data for this publication. Readers will also find a glossary of key terms. Below is a list of data sources and currency conversion rates.
SAMPLE
Mercer delivers advice and technology-driven solutions that help organizations meet the health, wealth and career needs of a changing workforce. Mercer’s more than 23,000 employees are based in 44 countries and the firm operates in over 130 countries. Mercer is a wholly owned subsidiary of Marsh & McLennan Companies (NYSE: MMC), the leading global professional services firm in the areas of risk, strategy and people. With nearly 65,000 colleagues and annual revenue over $14 billion, Marsh & McLennan helps clients navigate an increasingly dynamic and complex environment. Marsh & McLennan Companies is also the parent company of Marsh, which advises individual and commercial clients of all sizes on insurance broking and innovative risk management solutions; Guy Carpenter, which develops advanced risk, reinsurance and capital strategies that help clients grow profitably and pursue emerging opportunities; and Oliver Wyman, which serves as a critical strategic, economic and brand advisor to private sector and governmental clients. For more information, visit www.mercer.com. Follow Mercer on Twitter @Mercer.
@2019 MERCER LLC. NEW GRADUATE STARTING SALARIES — SAMPLE21
A B O U T M E R C E R
SAMPLE
Copyright 2019 Mercer LLC. All rights reserved.
For further information, please contact your local Mercer office or visit our website at www.imercer.com
19-NGSS-SAMPLE
SAMPLE