Embed Size (px)
Citation preview

ProductBenchmarksReport
CREATED BY MIXPANEL
2019

CREATED BY MIXPANEL
2PRODUCT BENCHMARKS REPORT 2019
Introduction
Methodology
Reach
How many people have used your product recently?
Activation What percentage of new users have experienced your product’s value?
Active usage
Are people performing a key action?
Engagement
How engaged are your active users?
Retention
How many of your active users come back?
Conclusion
About Mixpanel
Appendix
3
5
6
10
13
15
19
22
23
24
Table of Contents
CREATED BY MIXPANEL
3PRODUCT BENCHMARKS REPORT 2019
Introduction
Over the past decade, customer data has become a rich source of insight that fuels disruption and innovation across all industries. User analytics software has given the power to anyone, not just data scientists, to get answers to more questions quickly—and at a lower cost. But how do you actually put this power to good use?
We’ve covered the first step—choosing the metrics
that matter to your business—in the Guide to Product
Metrics. In this report, we’ll draw from Mixpanel internal
data to break down key product benchmarks and trends,
uncover the difference between the average and best-
in-class products, and reveal the path to innovation and
competitive advantage.
In this report, you’ll find:
A comparison of how products perform
in five strategic areas: reach, activation,
active usage, engagement, and retention
A breakdown of product benchmarks by
industry: Finance, Media, eCommerce,
and SaaS (Software as a Service)
An analysis of product performance
across mobile apps, desktop, and
mobile web, highlighting trends and
opportunities by platform
CREATED BY MIXPANEL
PRODUCT BENCHMARKS REPORT 2019 4
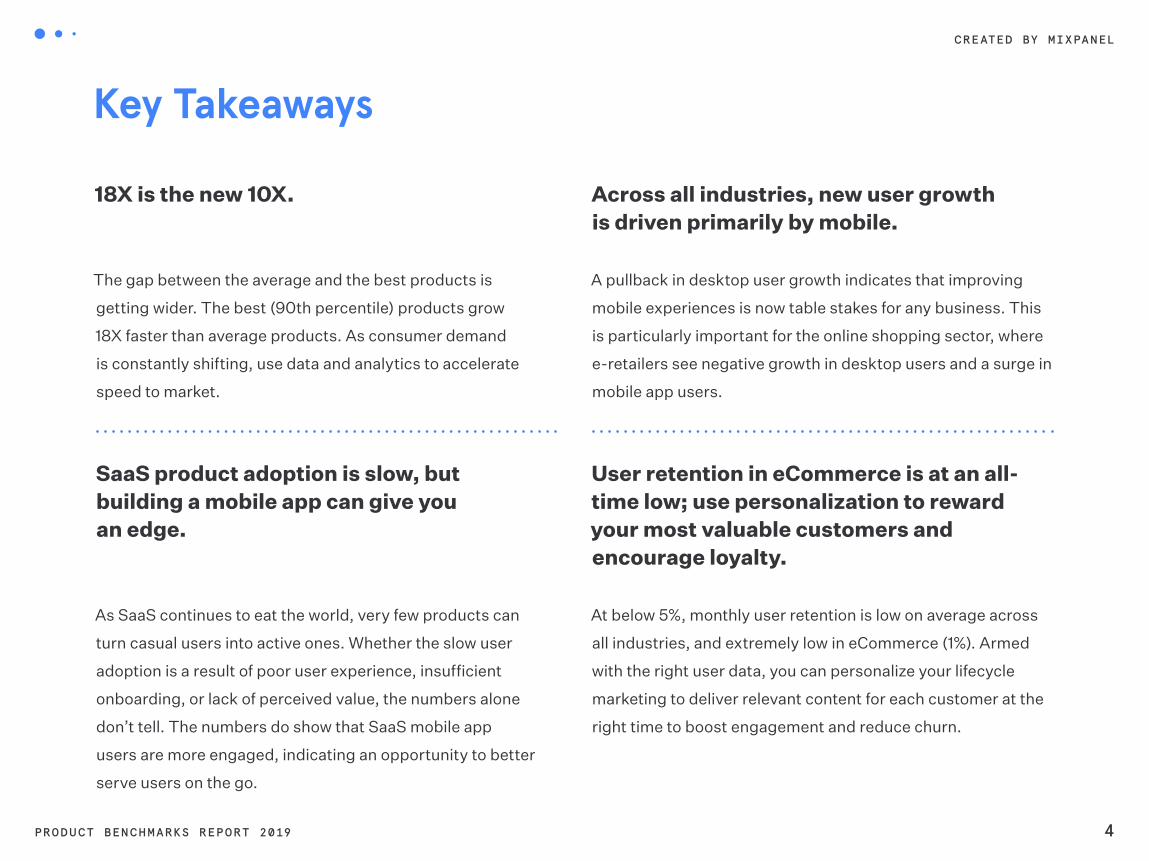
18X is the new 10X.
The gap between the average and the best products is
getting wider. The best (90th percentile) products grow
18X faster than average products. As consumer demand
is constantly shifting, use data and analytics to accelerate
speed to market.
SaaS product adoption is slow, but building a mobile app can give you an edge.
As SaaS continues to eat the world, very few products can
turn casual users into active ones. Whether the slow user
adoption is a result of poor user experience, insufficient
onboarding, or lack of perceived value, the numbers alone
don’t tell. The numbers do show that SaaS mobile app
users are more engaged, indicating an opportunity to better
serve users on the go.
Across all industries, new user growth is driven primarily by mobile.
A pullback in desktop user growth indicates that improving
mobile experiences is now table stakes for any business. This
is particularly important for the online shopping sector, where
e-retailers see negative growth in desktop users and a surge in
mobile app users.
User retention in eCommerce is at an all-time low; use personalization to reward your most valuable customers and encourage loyalty.
At below 5%, monthly user retention is low on average across
all industries, and extremely low in eCommerce (1%). Armed
with the right user data, you can personalize your lifecycle
marketing to deliver relevant content for each customer at the
right time to boost engagement and reduce churn.
Key Takeaways
CREATED BY MIXPANEL
5PRODUCT BENCHMARKS REPORT 2019
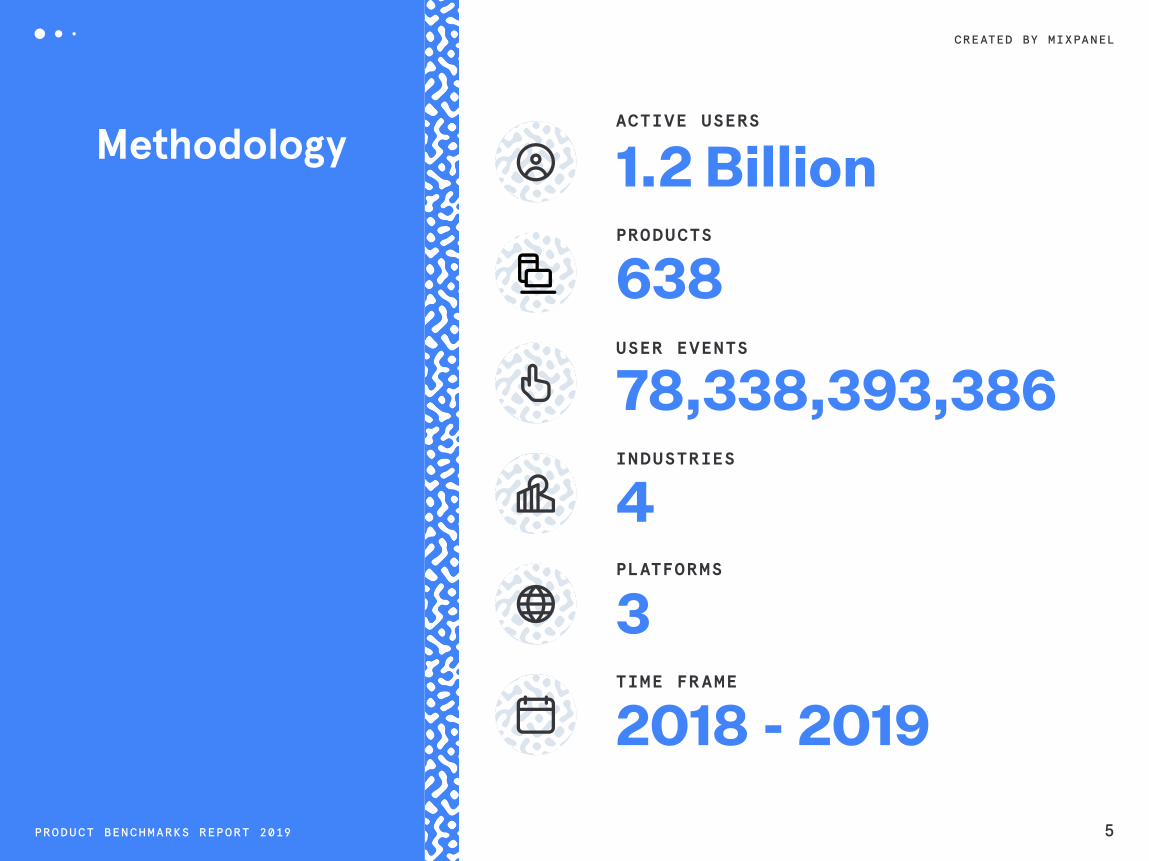
1.2 Billion
638
78,338,393,386
4
3
2018 - 2019
MethodologyACTIVE USERS
PRODUCTS
USER EVENTS
INDUSTRIES
PLATFORMS
TIME FRAME

PRODUCT BENCHMARKS REPORT 2019 6
How many people have used your product recently?
SECTION - 01
R E A C H
What is Reach?
The total number of users who performed any
action in a product (calculated monthly)
CREATED BY MIXPANEL
7PRODUCT BENCHMARKS REPORT 2019
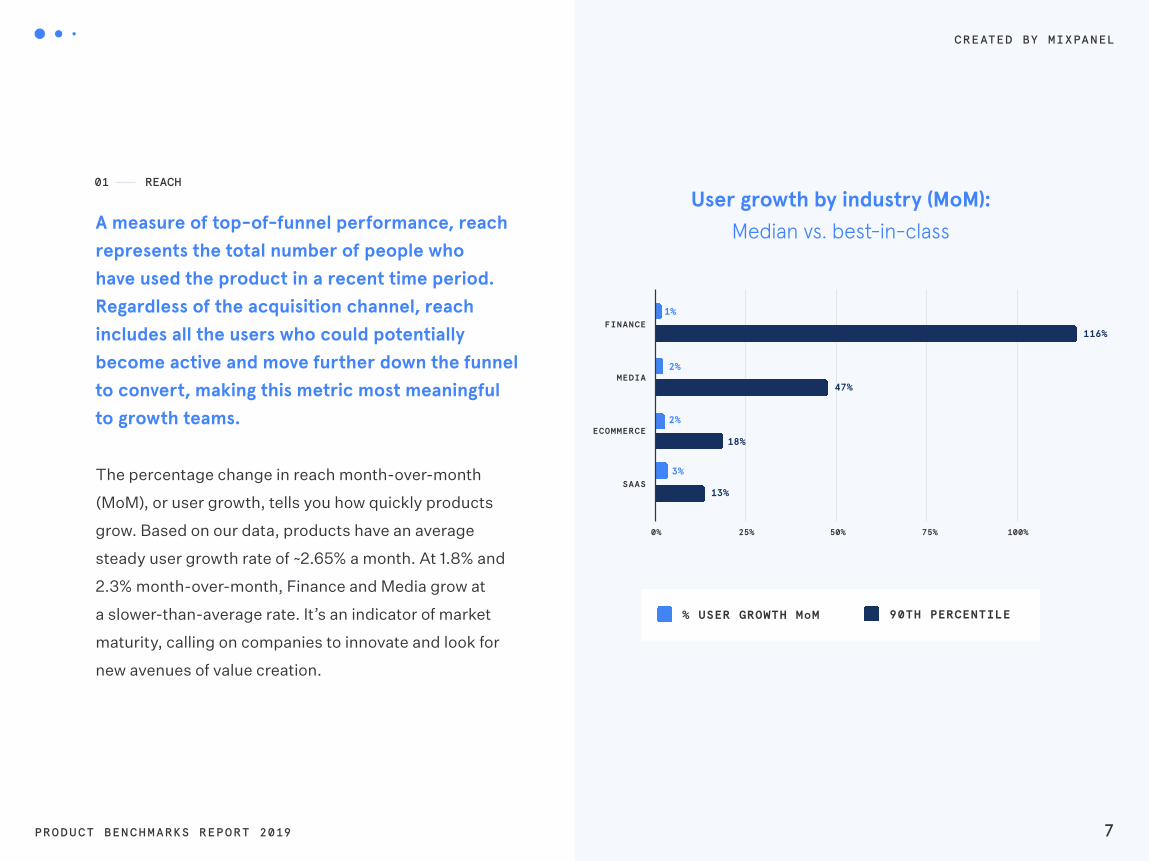
A measure of top-of-funnel performance, reach represents the total number of people who have used the product in a recent time period. Regardless of the acquisition channel, reach includes all the users who could potentially become active and move further down the funnel to convert, making this metric most meaningful to growth teams.
The percentage change in reach month-over-month
(MoM), or user growth, tells you how quickly products
grow. Based on our data, products have an average
steady user growth rate of ~2.65% a month. At 1.8% and
2.3% month-over-month, Finance and Media grow at
a slower-than-average rate. It’s an indicator of market
maturity, calling on companies to innovate and look for
new avenues of value creation.
User growth by industry (MoM): Median vs. best-in-class
1%
2%
2%
3%
116%
47%
18%
13%
FINANCE
MEDIA
ECOMMERCE
SAAS
0% 25% 50% 75% 100%
% USER GROWTH MoM 90TH PERCENTILE
1%
2%
2%
3%
116%
47%
18%
13%
FINANCE
MEDIA
ECOMMERCE
SAAS
0% 25% 50% 75% 100%
% USER GROWTH MoM 90TH PERCENTILE
1%
2%
2%
3%
116%
47%
18%
13%
FINANCE
MEDIA
ECOMMERCE
SAAS
0% 25% 50% 75% 100%
% USER GROWTH MoM 90TH PERCENTILE
01 REACH
CREATED BY MIXPANEL
8PRODUCT BENCHMARKS REPORT 2019
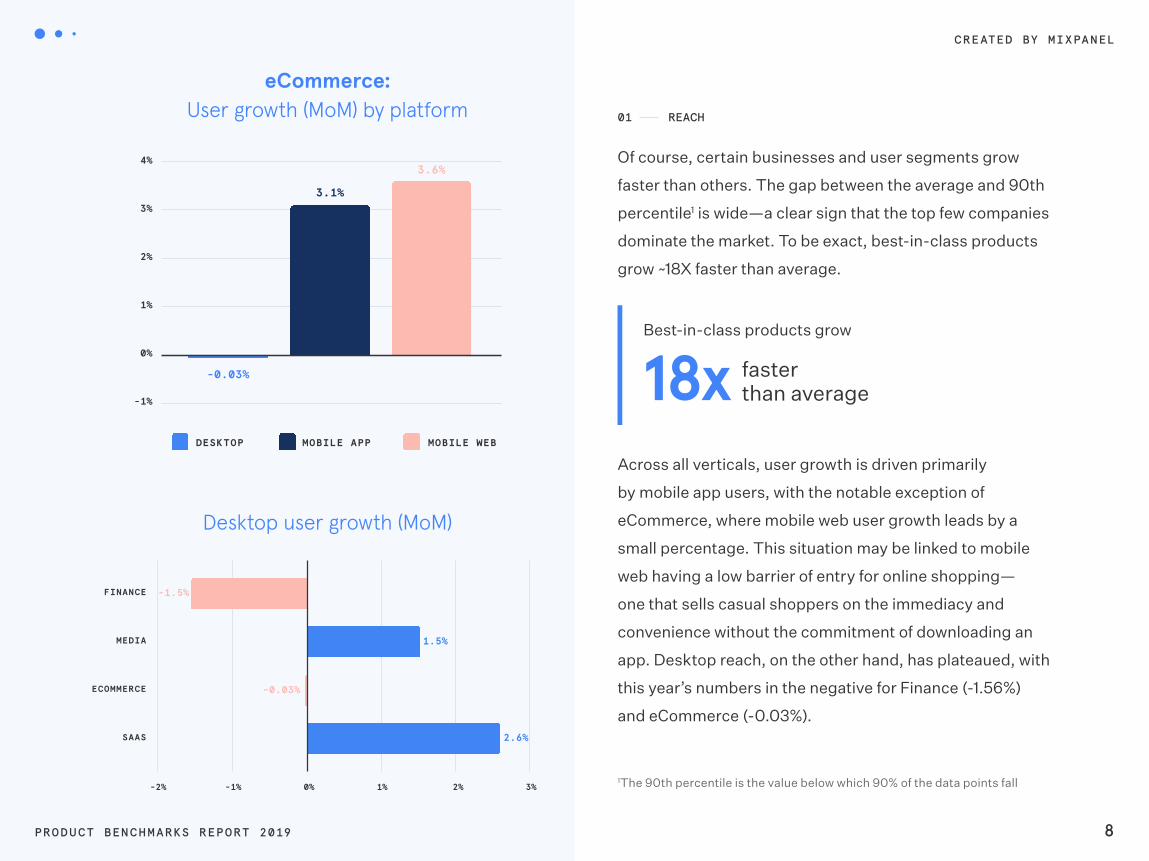
Of course, certain businesses and user segments grow
faster than others. The gap between the average and 90th
percentile1 is wide—a clear sign that the top few companies
dominate the market. To be exact, best-in-class products
grow ~18X faster than average.
Across all verticals, user growth is driven primarily
by mobile app users, with the notable exception of
eCommerce, where mobile web user growth leads by a
small percentage. This situation may be linked to mobile
web having a low barrier of entry for online shopping—
one that sells casual shoppers on the immediacy and
convenience without the commitment of downloading an
app. Desktop reach, on the other hand, has plateaued, with
this year’s numbers in the negative for Finance (-1.56%)
and eCommerce (-0.03%).
18x faster than average
Best-in-class products grow
eCommerce: User growth (MoM) by platform
-0.03%
3.1%
3.6%
-1%
0%
1%
2%
3%
4%
DESKTOP MOBILE APP MOBILE WEB
-1.5%
1.5%
-0.03%
2.6%
FINANCE
MEDIA
ECOMMERCE
SAAS
-2% -1% 0% 1% 2% 3%
Desktop user growth (MoM)
01 REACH
1The 90th percentile is the value below which 90% of the data points fall

CREATED BY MIXPANEL
9PRODUCT BENCHMARKS REPORT 2019
This shift in usage by platform is especially apparent
in SaaS, which has traditionally been desktop-first.
Compared to other verticals, SaaS products show the
biggest increase in reach for mobile app users. As more
people travel for work and stay connected after business
hours, SaaS mobile apps provide a convenient way for
people to keep working while on the go.
Predictably, mobile is the key driver of user growth
across industries. Granted, our data set doesn’t include
smart speakers and other IoT devices—the data point
that could potentially alter the magnitude (if not the
direction) of the mobile consumer shift.0.64%
3.6%
2.1%
0%
1%
2%
3%
4%
DESKTOP MOBILE APP MOBILE WEB
0.64%
3.6%
2.1%
0%
1%
2%
3%
4%
DESKTOP MOBILE APP MOBILE WEB
0.64%
3.6%
2.1%
0%
1%
2%
3%
4%
DESKTOP MOBILE APP MOBILE WEB
In 2019, SaaS products saw a 2X higher rate of growth in reach for mobile app
users compared to web users.
SaaSUser growth (MoM) by platform
All industriesUser growth (MoM) by platform
01 REACH
3%
6%
1%
0%
2%
4%
6%
DESKTOP MOBILE APP MOBILE WEB
PRODUCT BENCHMARKS REPORT 2019 10
What percentage of new users have experienced your product’s value?
SECTION - 02
A C T I V A T I O N
What is an Activation?
A measure of how many users get value from your product within
the first week: calculated as % new users (based on user creation
date) who performed a key action in the first 7 days

CREATED BY MIXPANEL
11PRODUCT BENCHMARKS REPORT 2019
Success!
Activation is the moment when a user first realizes the value of your product. Some call it an “aha moment” or “the eureka effect.” From a user’s perspective, it’s when they figure out how to benefit from your website or app; from a business’s perspective, it’s when the first conversion happens. From both sides, this moment is crucial to a product’s success.
Product managers and marketers work hard to get
users to this moment quickly, through onboarding,
personalization, and lifecycle marketing. Ideally, this “aha
moment” happens in the first week, laying the foundation
for higher engagement and lower customer churn.
This activation moment (or the first “key action”) is
different for every industry; it also depends on your
business goals. Media companies, for example, consider
“play/view media” meaningful, while eCommerce
businesses care about “add to cart.”
Industry
Media
Finance
eCommerce
Saas
Key Actions
Play media/view media
View ad
Pay
Subscribe
Transact/trade/transfer
Deposit
View balance
Create account
Add to cart
Check out
Subscribe
View report
Create account
Complete application
Download
Check out
02 ACTIVATION
CREATED BY MIXPANEL
12PRODUCT BENCHMARKS REPORT 2019
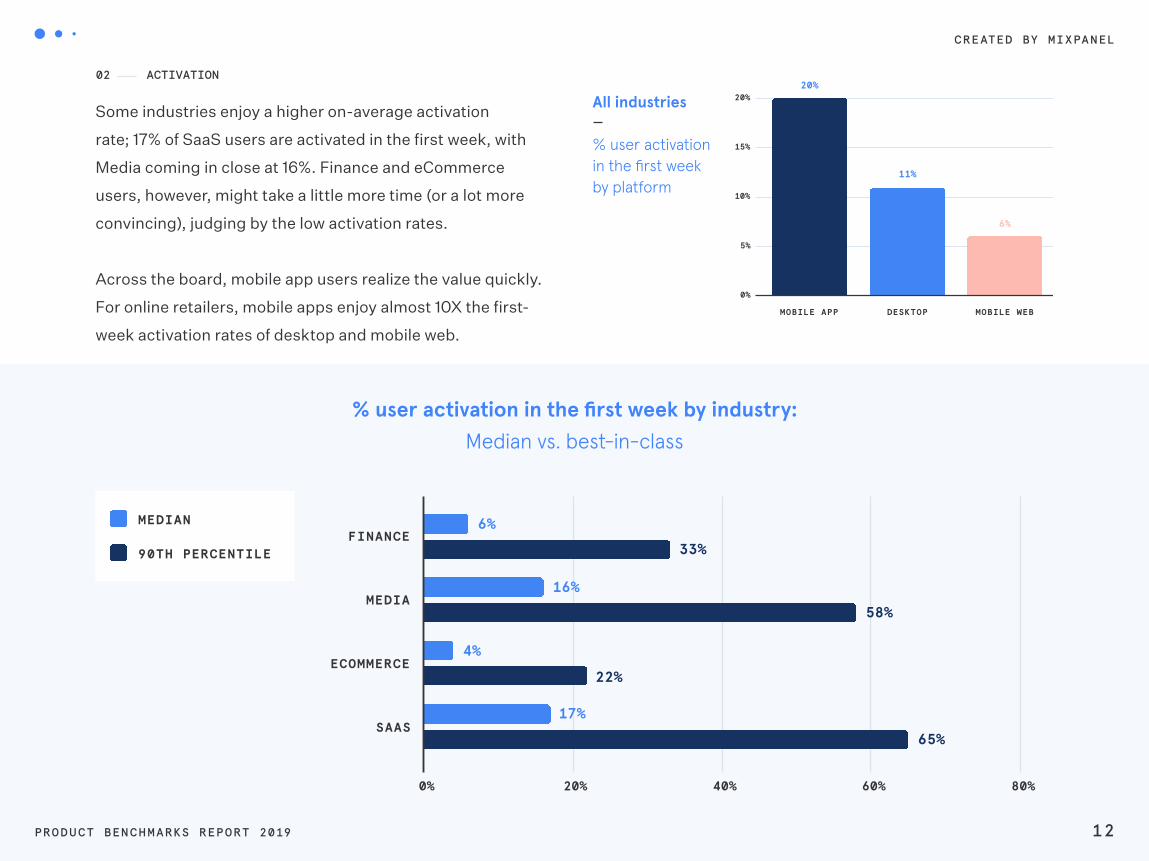
Some industries enjoy a higher on-average activation
rate; 17% of SaaS users are activated in the first week, with
Media coming in close at 16%. Finance and eCommerce
users, however, might take a little more time (or a lot more
convincing), judging by the low activation rates.
Across the board, mobile app users realize the value quickly.
For online retailers, mobile apps enjoy almost 10X the first-
week activation rates of desktop and mobile web.
6%
16%
4%
17%
33%
58%
22%
65%
FINANCE
MEDIA
ECOMMERCE
SAAS
0% 20% 40% 60% 80%
MEDIAN
90TH PERCENTILE
% user activation in the first week by industry:Median vs. best-in-class
20%
11%
6%
0%
5%
10%
15%
20%
MOBILE APP DESKTOP MOBILE WEB
02 ACTIVATION
All industries
% user activation in the first week by platform

PRODUCT BENCHMARKS REPORT 2019 13
Are people performing a key action in a specified period of time?
SECTION - 03
A C T I V E U S A G E
Daily active users: the number of people who
performed 1 or more key action in a day
Weekly active users: the number of people who
performed 1 or more key action in a week
CREATED BY MIXPANEL
14PRODUCT BENCHMARKS REPORT 2019
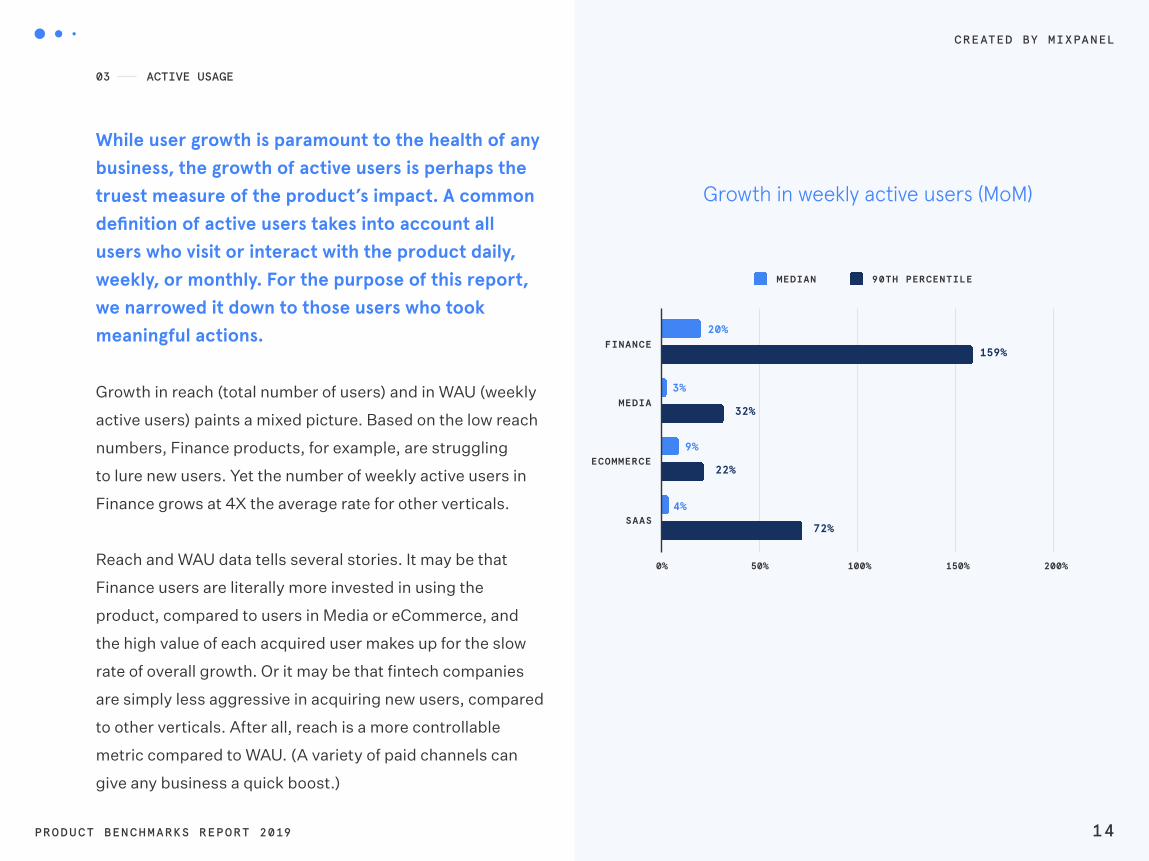
While user growth is paramount to the health of any business, the growth of active users is perhaps the truest measure of the product’s impact. A common definition of active users takes into account all users who visit or interact with the product daily, weekly, or monthly. For the purpose of this report, we narrowed it down to those users who took meaningful actions.
Growth in reach (total number of users) and in WAU (weekly
active users) paints a mixed picture. Based on the low reach
numbers, Finance products, for example, are struggling
to lure new users. Yet the number of weekly active users in
Finance grows at 4X the average rate for other verticals.
Reach and WAU data tells several stories. It may be that
Finance users are literally more invested in using the
product, compared to users in Media or eCommerce, and
the high value of each acquired user makes up for the slow
rate of overall growth. Or it may be that fintech companies
are simply less aggressive in acquiring new users, compared
to other verticals. After all, reach is a more controllable
metric compared to WAU. (A variety of paid channels can
give any business a quick boost.)
20%
3%
9%
4%
159%
32%
22%
72%
FINANCE
MEDIA
ECOMMERCE
SAAS
0% 50% 100% 150% 200%
MEDIAN 90TH PERCENTILE
03 ACTIVE USAGE
Growth in weekly active users (MoM)

PRODUCT BENCHMARKS REPORT 2019 15
How engaged are your active users?
SECTION - 04
E N G A G E M E N T
What is Engagement?
A measure of how frequently users interact with the
product while performing key actions: calculated
as total key actions in a week divided by WAU
CREATED BY MIXPANEL
16PRODUCT BENCHMARKS REPORT 2019
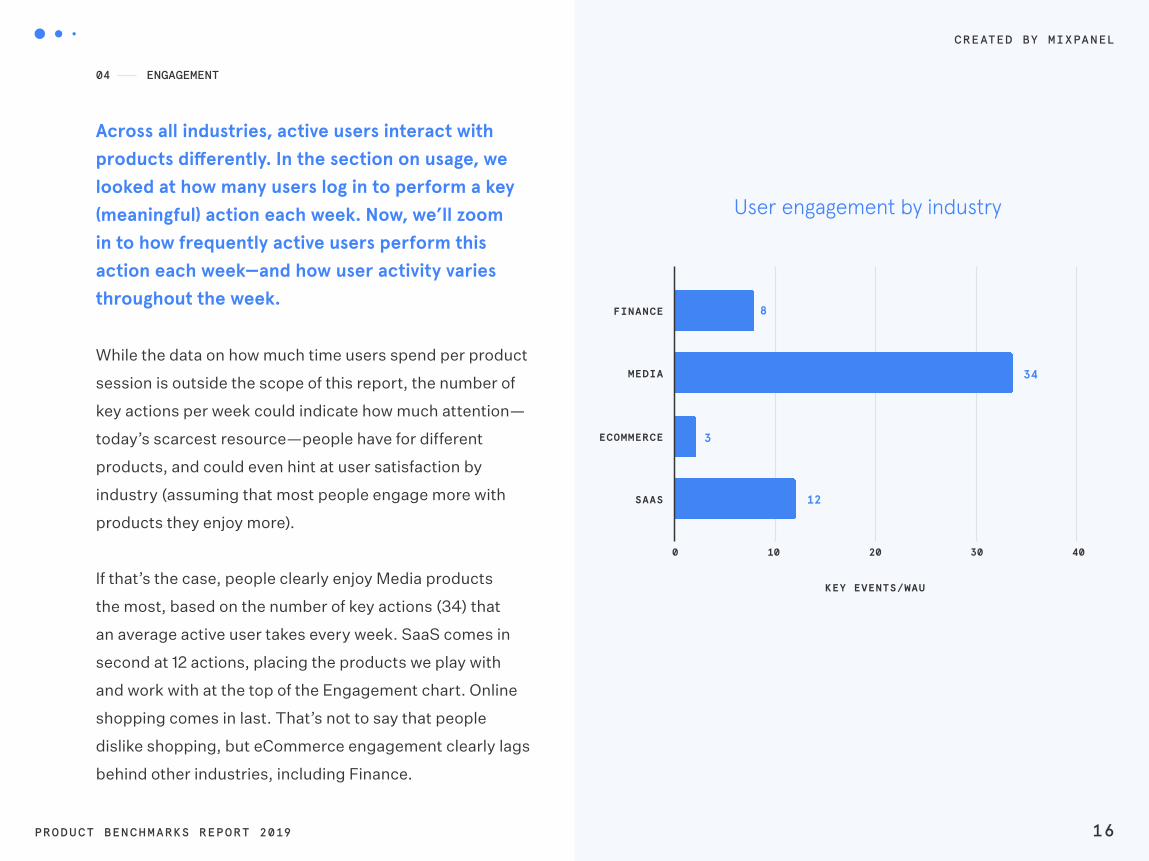
Across all industries, active users interact with products differently. In the section on usage, we looked at how many users log in to perform a key (meaningful) action each week. Now, we’ll zoom in to how frequently active users perform this action each week—and how user activity varies throughout the week.
While the data on how much time users spend per product
session is outside the scope of this report, the number of
key actions per week could indicate how much attention—
today’s scarcest resource—people have for different
products, and could even hint at user satisfaction by
industry (assuming that most people engage more with
products they enjoy more).
If that’s the case, people clearly enjoy Media products
the most, based on the number of key actions (34) that
an average active user takes every week. SaaS comes in
second at 12 actions, placing the products we play with
and work with at the top of the Engagement chart. Online
shopping comes in last. That’s not to say that people
dislike shopping, but eCommerce engagement clearly lags
behind other industries, including Finance.
8
34
3
12
KEY EVENTS/WAU
FINANCE
MEDIA
ECOMMERCE
SAAS
0 10 20 30 40
04 ENGAGEMENT
User engagement by industry

CREATED BY MIXPANEL
17PRODUCT BENCHMARKS REPORT 2019
When you know your baseline engagement and the industry
benchmark, you can begin experimenting to improve your
results. Most commonly, marketers engage users by sending
them emails or push notifications. User analytics can help you
find the right triggers, but you also want to consider timing.
The data below can point to the best (and the worst) days of
the week to reach out to users.
Weekly activity trends and the best days to engage
-6%
3%4%
2%
1% 0%
-4%
-6%
-4%
-2%
0%
2%
4%
SUNDAY MONDAY TUESDAY WEDNESDAY THURSDAY FRIDAY SATURDAY
04 ENGAGEMENT
User activity by day of the week (% change in DAU compared to weekly average)
CREATED BY MIXPANEL
18PRODUCT BENCHMARKS REPORT 2019
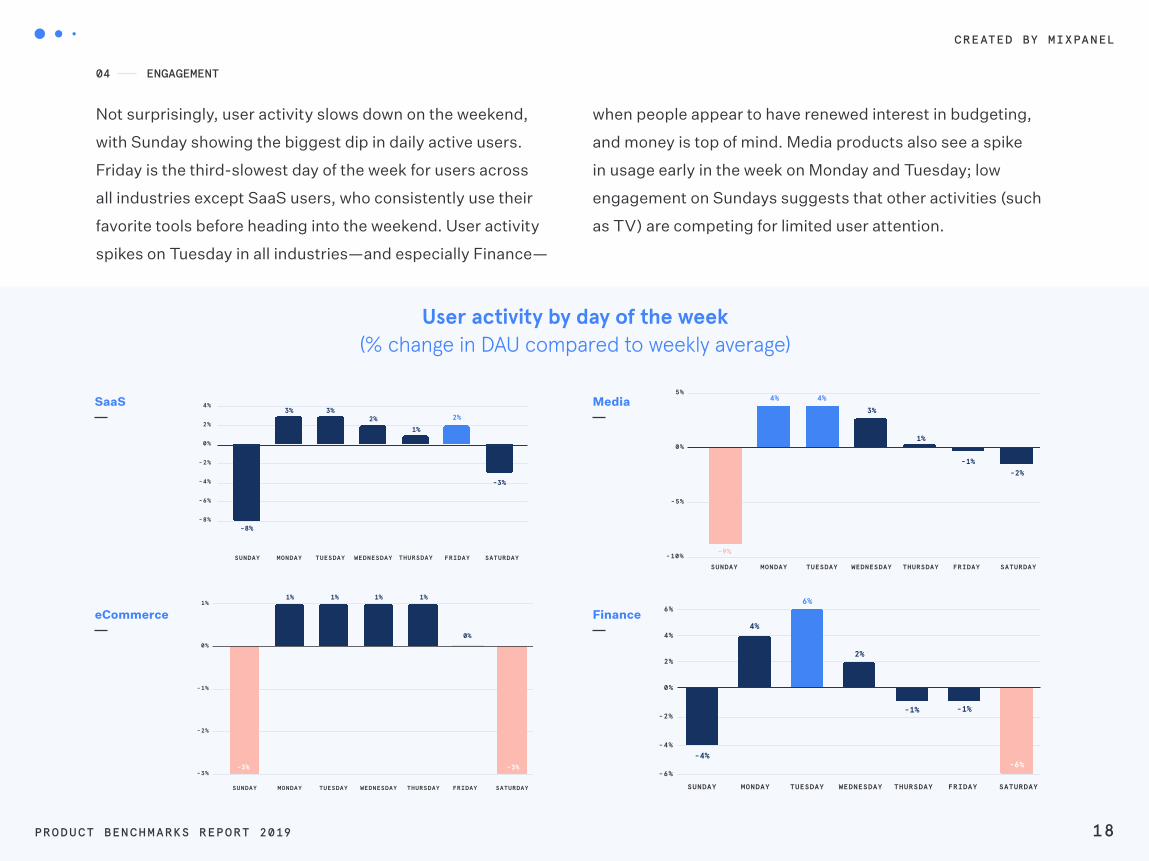
Not surprisingly, user activity slows down on the weekend,
with Sunday showing the biggest dip in daily active users.
Friday is the third-slowest day of the week for users across
all industries except SaaS users, who consistently use their
favorite tools before heading into the weekend. User activity
spikes on Tuesday in all industries—and especially Finance—
when people appear to have renewed interest in budgeting,
and money is top of mind. Media products also see a spike
in usage early in the week on Monday and Tuesday; low
engagement on Sundays suggests that other activities (such
as TV) are competing for limited user attention.
04 ENGAGEMENT
-4%
4%
6%
2%
-1% -1%
-6%-6%
-4%
-2%
0%
2%
4%
6%
SUNDAY MONDAY TUESDAY WEDNESDAY THURSDAY FRIDAY SATURDAY
-9%
4% 4%3%
1%
-1%-2%
-10%
-5%
0%
5%
SUNDAY MONDAY TUESDAY WEDNESDAY THURSDAY FRIDAY SATURDAY
-8%
3% 3%2%
1%2%
-3%
-8%
-6%
-4%
-2%
0%
2%
4%
SUNDAY MONDAY TUESDAY WEDNESDAY THURSDAY FRIDAY SATURDAY
-3%
1% 1% 1% 1%
0%
-3%-3%
-2%
-1%
0%
1%
SUNDAY MONDAY TUESDAY WEDNESDAY THURSDAY FRIDAY SATURDAY
FinanceeCommerce
MediaSaaS
User activity by day of the week (% change in DAU compared to weekly average)

PRODUCT BENCHMARKS REPORT 2019 19
How many of your active users come back?
SECTION - 05
R E T E N T I O N
What is Retention?
A measure showing whether users are coming back
to use the product: calculated over 7 and 30 days
CREATED BY MIXPANEL
20PRODUCT BENCHMARKS REPORT 2019
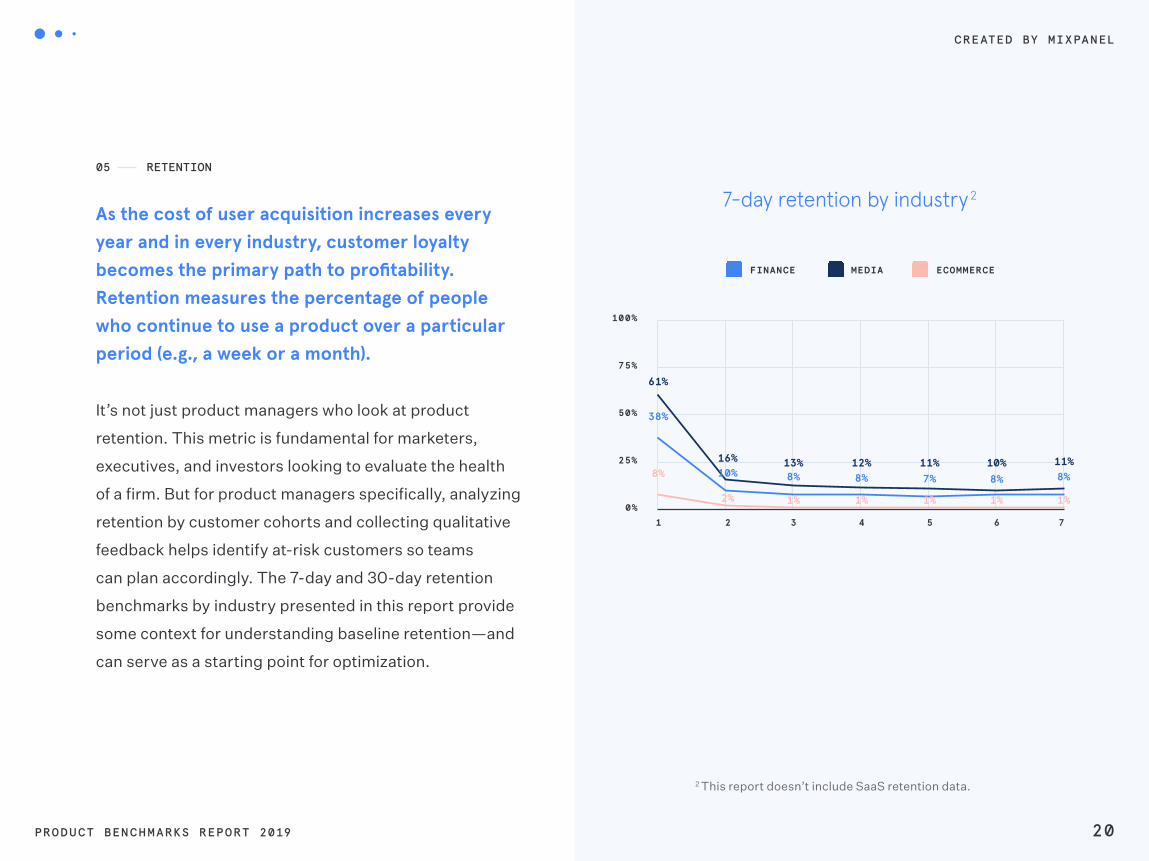
As the cost of user acquisition increases every year and in every industry, customer loyalty becomes the primary path to profitability. Retention measures the percentage of people who continue to use a product over a particular period (e.g., a week or a month).
It’s not just product managers who look at product
retention. This metric is fundamental for marketers,
executives, and investors looking to evaluate the health
of a firm. But for product managers specifically, analyzing
retention by customer cohorts and collecting qualitative
feedback helps identify at-risk customers so teams
can plan accordingly. The 7-day and 30-day retention
benchmarks by industry presented in this report provide
some context for understanding baseline retention—and
can serve as a starting point for optimization.
38%
10% 8% 8% 7% 8% 8%
61%
16% 13% 12% 11% 10% 11%8%
2% 1% 1% 1% 1% 1%0%
25%
50%
75%
100%
2 3 51 4 6 7
FINANCE MEDIA ECOMMERCE
2 This report doesn’t include SaaS retention data.
05 RETENTION
7-day retention by industry 2
CREATED BY MIXPANEL
21PRODUCT BENCHMARKS REPORT 2019
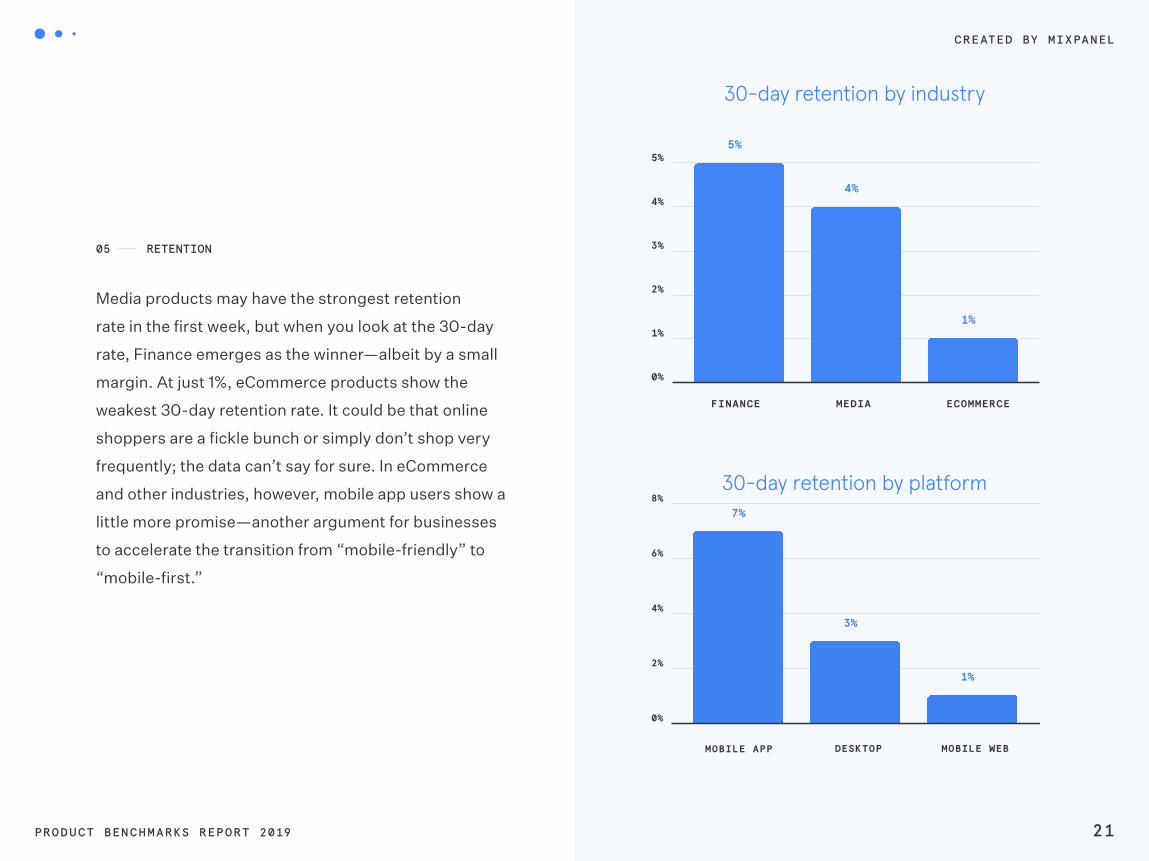
Media products may have the strongest retention
rate in the first week, but when you look at the 30-day
rate, Finance emerges as the winner—albeit by a small
margin. At just 1%, eCommerce products show the
weakest 30-day retention rate. It could be that online
shoppers are a fickle bunch or simply don’t shop very
frequently; the data can’t say for sure. In eCommerce
and other industries, however, mobile app users show a
little more promise—another argument for businesses
to accelerate the transition from “mobile-friendly” to
“mobile-first.”
05 RETENTION
5%
4%
1%
0%
1%
2%
3%
4%
5%
FINANCE MEDIA ECOMMERCE
5%
4%
1%
0%
1%
2%
3%
4%
5%
FINANCE MEDIA ECOMMERCE
7%
3%
1%
0%
2%
4%
6%
8%
MOBILE APP DESKTOP MOBILE WEB
30-day retention by industry
30-day retention by platform

CREATED BY MIXPANEL
22PRODUCT BENCHMARKS REPORT 2019
The competition is stiff as companies in Finance, Media,
eCommerce, and SaaS race to acquire, engage, and retain
users—a trend that naturally reflects slower on-average
rates of growth and weaker retention. A few companies
manage to break through; most do not. Yet the rewards can
be great for those companies that are up for the challenge:
the gap between the average and best-in-class products is
growing wider than ever before. Our reach data shows an 18X
difference between the median and 90th percentile rate of
growth in monthly active users.
Cross-platform analysis indicates that a strong mobile
strategy can give you an edge, especially in Finance,
which experienced a slight negative growth in desktop
users (-1.56%), and SaaS, where the numbers show higher
engagement rates for mobile app users. User activation is
impressively high on mobile apps in eCommerce, yet overall
retention rates (just 1%!) across platforms reveal massive
potential for improvement through personalized lifecycle
marketing on web and mobile channels. Understanding how
users engage throughout the week can guide you towards a
path of experimentation and incremental improvement.
Conclusion

CREATED BY MIXPANEL
23PRODUCT BENCHMARKS REPORT 2019
At Mixpanel, our mission is to increase the rate of
innovation. Not only as a company, but for the businesses
we serve. Through our analytics and engagement
product, companies can analyze how and why their users
engage, convert, and retain in real time across web,
mobile, and smart devices. Then they can use that data to
improve their business and products.
About Mixpanel
Mixpanel serves over 26,000 companies from different
industries around the world, including Samsung, Twitter,
and BMW. Headquartered in San Francisco, Mixpanel has
offices in New York, Seattle, Austin, London, Barcelona,
Paris, Amsterdam, and Singapore.
For more information, visit: www.mixpanel.com
Want more product insights delivered in your inbox every two weeks?
Subscribe at www.mixpanel.com/blog
CREATED BY MIXPANEL
24PRODUCT BENCHMARKS REPORT 2019
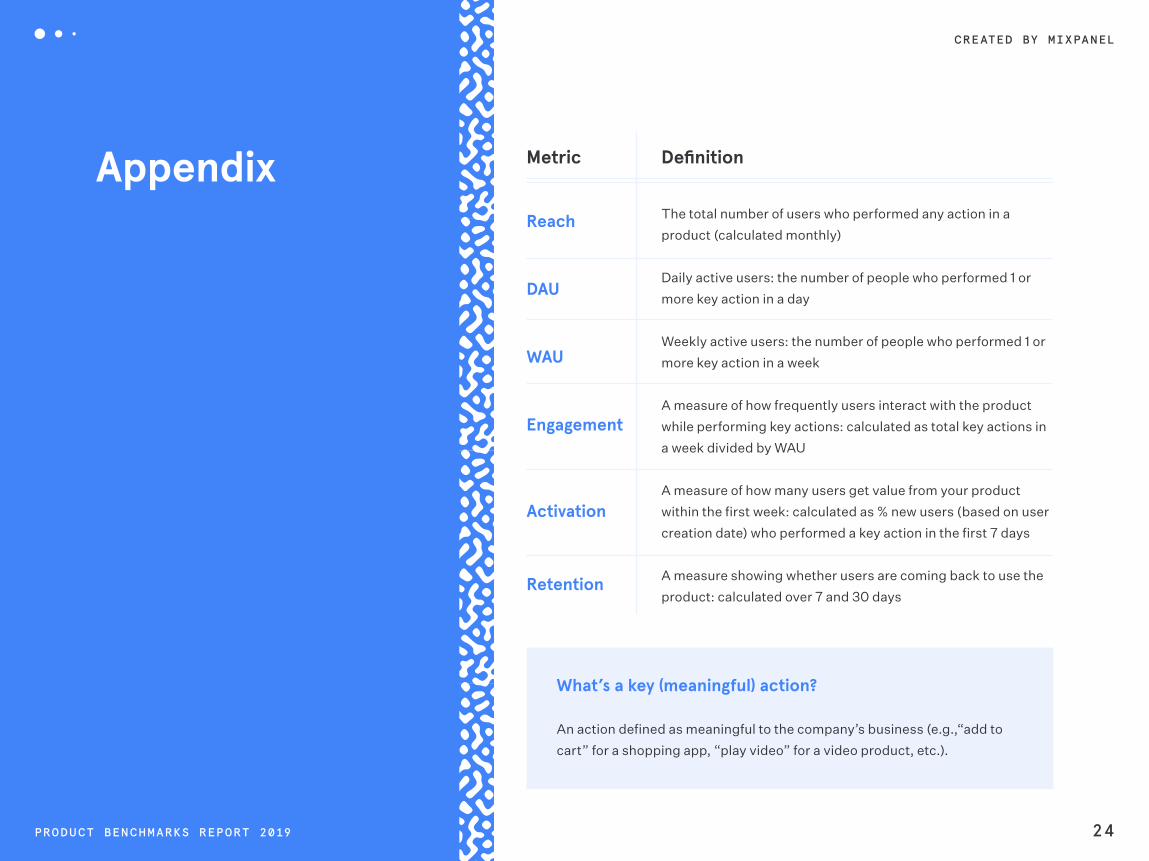
Appendix Metric
Reach
DAU
WAU
Engagement
Activation
Retention
The total number of users who performed any action in a
product (calculated monthly)
Daily active users: the number of people who performed 1 or
more key action in a day
Weekly active users: the number of people who performed 1 or
more key action in a week
A measure of how frequently users interact with the product
while performing key actions: calculated as total key actions in
a week divided by WAU
A measure of how many users get value from your product
within the first week: calculated as % new users (based on user
creation date) who performed a key action in the first 7 days
A measure showing whether users are coming back to use the
product: calculated over 7 and 30 days
Definition
What’s a key (meaningful) action?
An action defined as meaningful to the company’s business (e.g.,“add to
cart” for a shopping app, “play video” for a video product, etc.).

CREATED BY MIXPANEL
PRODUCT BENCHMARKS REPORT 2019 25
For more information, visit: www.mixpanel.com


![Benchmarks - June, 2013 | Benchmarks Onlineit.unt.edu/sites/default/files/benchmarks-06-2013.pdf · Benchmarks - June, 2013 | Benchmarks Online 4/26/16, 8:52:25 AM] Skip to content](https://img.pdfslide.net/doc/110x75/5f9d6dd4a6e586755376b37d/benchmarks-june-2013-benchmarks-benchmarks-june-2013-benchmarks-online.jpg)