Embed Size (px)
Citation preview

2019 RESULTS ORIENTED ACCOUNTABILITY ANNUAL PERFORMANCE REPORT
FISCAL YEAR 2018-19 OFFICE OF CHILD WELFARE
OCTOBER 2019
Chad Poppell Secretary
Ron DeSantis Governor

Office of Child Welfare Annual Performance Report 2018-19 ii
Department of Children and Families Service Structure Regions, Circuits, Counties, and CBC Lead Agencies

Office of Child Welfare Annual Performance Report 2018-19 iii
Table of Contents
Child Welfare in Florida ......................................................................7
Child Welfare Results-Oriented Accountability Program .....................9
Executive Summary .......................................................................... 10
Indicators Presented in this Report .................................................. 14
Demographic Context of the Child Welfare System ........................... 15
Growth in Child Population ............................................................................................................... 15
Children Living in Poverty .................................................................................................................. 16
Intake into the Child Welfare System ............................................... 17
Maltreatment Reporting .................................................................................................................... 17
Reporting Rate: Children Investigated Compared to the Population .............................................. 17
Florida Abuse Hotline ....................................................................... 19
Intake Screening Rates ....................................................................................................................... 19
Seasonality of Reporting .................................................................................................................... 20
Child Protective Investigations ......................................................... 21
Workload Indicators ........................................................................................................................... 21
Incoming, Active, and Backlog Investigations ................................................................................... 21
Maltreatment Investigations and Special Conditions Assessments................................................. 21
Average Investigative Response Time in Hours ................................................................................ 22
Percent of Alleged Victims Seen within 24 Hours ............................................................................. 23
Percent of Investigations Completed within 60 Days ....................................................................... 24
Safety Outcome Indicator: No Recurrence of Verified Maltreatment ............................................. 25
Safety Outcome Indicator: Non-Recurrence of Verified Maltreatment .......................................... 26
Investigative Decisions and Flow to Services ..................................... 27
Evidence of Maltreatment ................................................................................................................. 27
Verification Rates ............................................................................................................................... 27
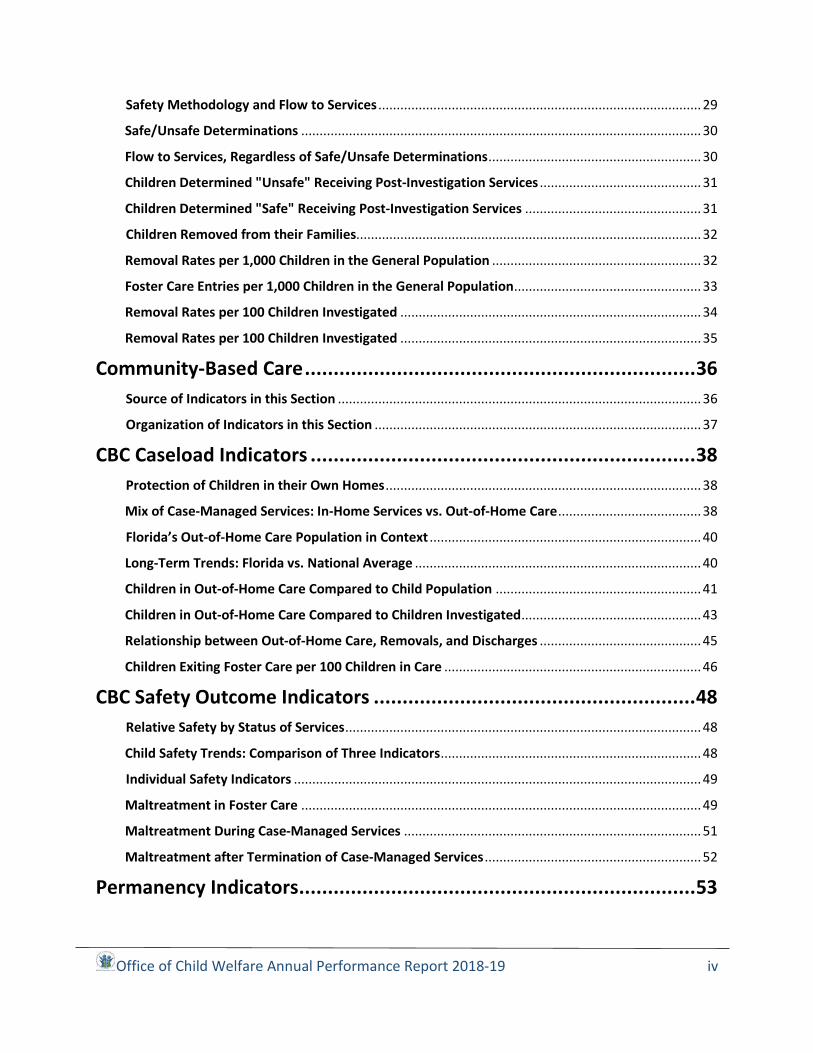
Office of Child Welfare Annual Performance Report 2018-19 iv
Safety Methodology and Flow to Services ........................................................................................ 29
Safe/Unsafe Determinations ............................................................................................................. 30
Flow to Services, Regardless of Safe/Unsafe Determinations .......................................................... 30
Children Determined "Unsafe" Receiving Post-Investigation Services ............................................ 31
Children Determined "Safe" Receiving Post-Investigation Services ................................................ 31
Children Removed from their Families.............................................................................................. 32
Removal Rates per 1,000 Children in the General Population ......................................................... 32
Foster Care Entries per 1,000 Children in the General Population ................................................... 33
Removal Rates per 100 Children Investigated .................................................................................. 34
Removal Rates per 100 Children Investigated .................................................................................. 35
Community-Based Care .................................................................... 36
Source of Indicators in this Section ................................................................................................... 36
Organization of Indicators in this Section ......................................................................................... 37
CBC Caseload Indicators ................................................................... 38
Protection of Children in their Own Homes ...................................................................................... 38
Mix of Case-Managed Services: In-Home Services vs. Out-of-Home Care ....................................... 38
Florida’s Out-of-Home Care Population in Context .......................................................................... 40
Long-Term Trends: Florida vs. National Average .............................................................................. 40
Children in Out-of-Home Care Compared to Child Population ........................................................ 41
Children in Out-of-Home Care Compared to Children Investigated ................................................. 43
Relationship between Out-of-Home Care, Removals, and Discharges ............................................ 45
Children Exiting Foster Care per 100 Children in Care ...................................................................... 46
CBC Safety Outcome Indicators ........................................................ 48
Relative Safety by Status of Services ................................................................................................. 48
Child Safety Trends: Comparison of Three Indicators ....................................................................... 48
Individual Safety Indicators ............................................................................................................... 49
Maltreatment in Foster Care ............................................................................................................. 49
Maltreatment During Case-Managed Services ................................................................................. 51
Maltreatment after Termination of Case-Managed Services ........................................................... 52
Permanency Indicators ..................................................................... 53

Office of Child Welfare Annual Performance Report 2018-19 v
Timely Achievement of Permanency ................................................................................................. 53
Permanency within 12 Months from Three Starting Points ............................................................. 53
Permanency in 12 Months for Children Entering Care ..................................................................... 54
Permanency in 12 Months for Children in Care 12-23 Months ........................................................ 56
Permanency in 12 Months for Children in Care 24+ Months............................................................ 58
Re-entry to Foster Care ...................................................................................................................... 60
Re-entry to Foster Care in 12 Months ............................................................................................... 60
Drivers of Timely Permanency .......................................................... 62
Caseworker Visits with Children in Care ........................................................................................... 62
Percentage of Children Receiving Monthly Caseworker Visits ......................................................... 62
Percentage of Monthly Visits that Occurred in the Home of the Child ............................................ 63
Children’s Legal Services Indicators ................................................................................................... 64
Reunification Goal after 15 Months & No Termination of Parental Rights Activity ........................ 64
Time from Removal Date to Disposition Order ................................................................................. 65
Well-Being of Children in Out-of-Home Care..................................... 66
Appropriate Placements for Children Removed from Families ........................................................ 66
Trends and Variations in Placement Types ....................................................................................... 66
Stable Placements that Maintain Connections ................................................................................. 67
Placement Stability ............................................................................................................................ 67
Percent of Siblings Placed Together .................................................................................................. 69
Proximity of Placement to Community of Removal ......................................................................... 70
Placement in Family Setting .............................................................................................................. 72
Percent of Children in Licensed Care Placed in Group Care .............................................................. 72
Children in Group Care by Age Group ............................................................................................... 73
Medical Services ................................................................................................................................. 75
Dental Services ................................................................................................................................... 76
Preparation for Independent Living as Adults .................................................................................. 77
Young Adults Aging Out Enrolled in Education Programs ................................................................ 77
Office of Child Welfare Annual Performance Report 2018-19 6
Abbreviations included in this Report
• Child and Family Services Review (CFSR) • Child Protective Investigator (CPI) • Family Support Services (FSS) • Federal Fiscal Year (FFY) • Florida Continuous Quality Improvement Reviews (FL CQI) • Florida Department of Children and Families (department) • Florida Institute for Child Welfare (FICW) • Foster Care (FC) • Foster Home (FH) • Lead Agency for Community-Based Care (CBC) • Office of Child Welfare (OCW) • Out-of-Home Care (OHC) • Quality Assurance (QA) • Quality Improvement (QI) • Rapid Safety Feedback Reviews (RSF) • Results-Oriented Accountability Program (ROA) • State Fiscal Year (SFY)

Office of Child Welfare Annual Performance Report 2018-19 7
Child Welfare in Florida Florida’s community-based child welfare system was created to prevent child abuse, neglect, and abandonment through a partnership between the Department of Children and Families (department), other state agencies, the courts, law enforcement agencies, service providers, and local communities. It is designed to provide equal protection to children through consistent intake decision-making regarding the children served and local systems of care to meet varying community needs, matching the needs of children and families to community resources, and allowing flexible development of evidence-based and promising approaches to the protection of children.
Intake for the community-based system of care is provided by the department and county sheriffs’ offices that conduct child protective investigations, which determine whether children and families should receive services and what kind of services:
• The Florida Abuse Hotline receives more than 260,000 child-related calls, web reports, and faxes annually and screens-in those which meet the requirements for investigation or assessment of special conditions with no alleged maltreatment.
• Child Protective Investigations are conducted by sheriffs’ offices in seven counties (Broward, Hillsborough, Manatee, Pasco, Pinellas, Seminole, and Walton Counties) and the department in the other 60 counties. Investigators determine the need for post-investigation services including protecting the child through removal and placement in out-of-home care (OHC), or through case-managed in-home services (by court order or non-judicially), or through informal voluntary family support services (FSS).
Office of Child Welfare Annual Performance Report 2018-19 8
Section 409.986(1), Florida Statutes, requires that post-investigation services be provided through contracting with Community-Based Care Lead Agencies (CBCs) and emphasizes that:
• Communities have responsibility for and participation in ensuring safety, permanence, and well-being for all children in the state.
• Outsourcing must be accompanied by comprehensive oversight of the programmatic, administrative, and fiscal operation of those entities. The appropriate care of children is ultimately the responsibility of the state and outsourcing such care does not relieve the state of its responsibility to ensure that appropriate care is provided.
Section 409.997, Florida Statutes, requires the department to develop and implement a comprehensive, results-oriented accountability program (ROA), which includes monitoring outcomes. Florida’s complex child welfare system has many entities sharing responsibility for child welfare outcomes. ROA includes data analysis, research review and evaluation, and an assessment of performance of individual entities and groups of entities working together to provide an integrated system of care. ROA incorporates a limited number of outcome measures using available data to quantify outcomes as children move through the system of care. Results are transparent for all parties in the child welfare system, policymakers, and the public. This report includes some of the ROA outcomes and other key outcome and process indicators.
Office of Child Welfare Annual Performance Report 2018-19 9
Child Welfare Results-Oriented Accountability Program The Child Welfare Results-Oriented Accountability Program was enacted by Chapter 2014-161, Laws of Florida, established in section 409.997, Florida Statutes, and is charged with the following primary purposes:
• Produce an assessment of individual entities’ performance, as well as the performance of groups of entities working together on a local, regional, and statewide basis to provide an integrated system of care.
• Monitor and measure the use of resources, the quality and amount of services provided, and child and family outcomes.
• Develop and maintain an inclusive, interactive, and evidence-supported program of quality improvement that is informed by data analysis and promotes individual skill building and organizational learning.
The ROA program includes the establishment of a technical advisory panel to advise the department on the implementation of the program. Members of the technical advisory panel include:
• A Florida Senate legislative liaison; • A Florida House of Representatives legislative liaison; • A representative of the Florida Institute for Child Welfare at Florida State University • Community-based care providers, including lead agency and community alliance
representatives; • Florida family representatives; • Contract provider representatives; and • Florida child advocate representatives.
A ROA Governance Committee was established in 2015. The Committee is chaired by the Secretary of the department. The focus of the Governance Committee is to set strategies for attaining the program’s goals and gives authority for the use of resources to implement defined strategies to achieve identified outcomes. Members of the governance committee include:
• A representative of the Florida Institute for Child Welfare at Florida State University; • Community-based care providers, including lead agency and community alliance
representatives; • Florida child advocate representatives; • Representatives from sheriff’s offices that conduct child protective investigation; • Office of State Courts Administrator representatives; • Florida family representatives; and • Contract provider representatives.
Statutory Requirements for the Annual Report Pursuant to section 409.997, Florida Statutes, the department shall submit an annual ROA performance report to the Governor, the President of the Senate, and the Speaker of the House of Representatives by October 1 of each year.

Office of Child Welfare Annual Performance Report 2018-19 10
Executive Summary The Results-Oriented Accountability Annual Report for state fiscal year (SFY) 2018-19 describes the current status of Florida’s community-based child welfare system. The report follows the flow of Florida’s child welfare system from the Florida Abuse Hotline (Hotline) to child protective investigations to case management. The report uses trend charts that show change over time and comparison charts that show Florida in relation to other states and each circuit or area in Florida in relation to other areas. The following bullet points and federal measures provide a summary of this data. Demographics: Florida’s child population increased by 4.44 percent from 4,023,512 in 2007, to 4,201,983 in
2017, compared to a 0.5 percent decrease in the United States’ child population during the same period.
Florida’s poverty rate of 21 percent for 2017 was 3.5 percent higher than the comparable national average of 17.5 percent. Statewide, Florida’s poverty rate has dropped since 2015 and rates vary when stratified by area (circuit/county).
Intake into the Child Welfare System: Florida’s child maltreatment reporting rate exceeds the national average and Florida is in
the top 10 states in the nation for reporting by calculating children investigated per 1,000 children in the general population. Statewide, reporting rates vary considerably by area with the highest rate area more than three times the size of the lowest rate area.
Reports to the Hotline follow a seasonal trend and, in 2016, the Hotline’s acceptance of allegations of child maltreatment was higher than the national average (and in the lowest quartile). However, the Hotline screen-in rate has been steadily decreasing.
Child Protective Investigators: Incoming and active investigative workload decreased during SFY 2018-19, as did
investigations that are open over 60 days. All three of these measures were at a three-year low as of the last day of the SFY. However, statewide performance in completing investigations within 60 days is still currently below the 99 percent standard, though 16 circuits and sheriffs’ offices completed over 98 percent of investigations within 60 days in SFY 2018-19, and eight circuits met the 99 percent standard target.
Florida has consistently maintained high timeliness in responding to alleged maltreatment within 24 hours compared to the national average. In 2017, Florida had the fastest response time of all states that reported.
There is variation among circuits and sheriff’s offices in making a safe/unsafe determination using the department’s safety practice guidelines, as well as in the proportion of families receiving services after the conclusion of an investigation, with the use of FSS having the highest variation. The majority (52.5 percent) of children determined “unsafe” were removed from their home and 41.7 percent received in-home services, totaling 94.2 percent of children determined to be unsafe receiving ongoing case management. Of children who were determined to be safe, 95.9 percent did not receive ongoing case management services and less than 1 percent received ongoing case management or were in OHC.

Office of Child Welfare Annual Performance Report 2018-19 11
Children Removal Rates: Removal rates per 1,000 children in the general population and per 100 children in
investigations are both calculated in this report. Florida’s entry rate into foster care per 1,000 children in the general population has been historically higher than the national average. Florida’s rates have been steadily increasing, ranging from 3.7 to 4.3 per 1,000 in the last four SFYs. There is a wide variation when comparing historical removal rates for circuits and sheriffs’ offices.
Florida’s removal rate per 100 alleged victims in closed investigations has been declining over the last five SFYs.
Community-Based Care: The gap between the number of children in OHC and the number of children protected in
their own homes continues to widen with stable OHC numbers and decreases in in-home services. There is high variation statewide in the mix of services provided and the relationship between the number of children being actively protected and the number of children in investigations. The number of children in OHC nationally has increased and stabilized since 2013 while Florida saw a sharp increase that was followed by a decrease within the most recent year of national data. Florida’s OHC rate per 1,000 children in 2017 (the most recent year available) was comparable to the national average. Several states had rates that were significantly higher than Florida’s.
Florida’s current stability in OHC numbers appear to be the result of decreasing discharge rates, rather than an increase in removal rates. Florida’s discharge rate in the last three SFYs declined sharply while in 2017 Florida was solidly above the national average and in the third quartile among ranked states.
Federal Measures: This report presents seven data indicators established by the United States Children’s Bureau (Children’s Bureau) for Round 3 of the Child and Family Services Reviews (CFSR-3) to support the three Adoption and Safe Families Act of 1997 (ASFA) goals and outcomes, as well as the nine outcomes established in section 409.986, Florida Statutes. Outcome 1: Reduce recurrence of child abuse and/or neglect. The most recent national data (2017) indicates that Florida’s observed performance of 94.4 percent with no recurrence of maltreatment within 12 months was better than the initial standard and national average of 90.9 percent. The performance has consistently been above the national standard since January 2015. The percent of children in investigations with at least one finding of verified maltreatment has been declining over the last five SFYs. As only verified maltreatment is included in the measurement of recurrence, the decline in the percent verified may have had a significant impact in lowering the rates of measured recurrence of maltreatment. Variation in verification rates statewide affects variation in measured recurrence of maltreatment. Outcome 2: Reduce the incidence of child abuse and/or neglect in foster care. National state level data for the rate of abuse per 100,000 bed days in OHC is not currently available beyond 2017. The 2017 data for the percentage of children not experiencing abuse in foster care indicates that Florida is among the best in the nation at 99.96 percent of children not experiencing abuse, abandonment, or neglect while in foster care. However, Florida’s SFY 2018-19 observed rate of

Office of Child Welfare Annual Performance Report 2018-19 12
8.90 failed to achieve the 8.50 or less national standard for the rate of children experiencing abuse, abandonment, or neglect per 100,000 days in OHC. It should be noted that Florida’s calculated rates are somewhat different from the rate appearing in the federal data profile used for CFSR-3, which uses Adoption and Foster Care Analysis and Reporting System (AFCARS) and National Child Abuse and Neglect Data (NCANDS) files submitted by states. Florida’s calculated rates are higher and have shown overall improvement in the last five years despite the observed increase in SFY 2018-19. The percent of children with no verified maltreatment during case-managed, in-home services improved to 95 percent. The percent of children with no verified maltreatment within six months after termination of case-managed services improved to 96.6 percent for the SFY 2017-18 cohort. Outcome 3: Increase permanency for children in foster care. The three indicators of timely permanency measure achievement of permanency within 12 months for three different cohorts of children, based on a certain period or date (<12 months, 12-23 months, and 24+ months). Florida’s performance on the less than 12-month permanency measure has steadily declined over the last five years and is no longer meeting the national standard. The two other permanency cohorts are still exceeding the corresponding national standards. Outcome 4: Reduce time in foster care to reunification without increasing reentry. National comparison data on the CFSR federal measure is older data and has been replaced in this report with a proxy measure of children re-entering foster care within 12 months of exiting care, regardless of their original length of stay in foster care. In this measure, Florida is slightly below the national average. More recent data shows that the state is not meeting the national target, despite increasing performance. Florida is consistently one of the top states for case management visits with children in care. Florida is also consistently in the ranks among the leading states when comparing the percentage of monthly visits that were made to the child’s home. Florida’s exemplary performance is consistent throughout the state. Florida’s indicator measures percent of visits completed within 30 days of the last visit and is consistently near 100 percent. Outcome 5: Reduce time in foster care to adoption. There is wide variation among Florida circuits on judicial handling time. Florida’s statewide average for children with a goal of reunification and no termination of parental rights activity after 15 months was 5.9 percent on June 30, 2019, with wide variation among circuits. The statewide median of timeliness of termination of parental rights, from petition to order, was 159 days in SFY 2018-19, with wide variation among the circuits. The statewide median for time from removal date to disposition order was 55 days in SFY 2018-19, with wide variation, compared to the statewide target of 90 days. Outcome 6: Increase placement stability. As OHC numbers have stabilized so too have the types of placements where children in the foster care reside. For example, approximately 56.5 percent of children placed in OHC reside in kinship placements. These placements tend to reduce trauma, help maintain familial connections, and reduce the cost of care. Until SFY 2016-17, statewide performance had been slightly better than the initial national standard of 4.12 placement moves per 100,000 days in foster care. Florida has failed to meet this measure the last three years.

Office of Child Welfare Annual Performance Report 2018-19 13
Statewide performance for the percent of siblings placed together has declined over the last five years and Florida is now below its own standard of 65%. Only seven of Florida’s 19 CBCs are at or above the 65 percent standard. Over the last five years there has been a slight reduction in the percent of children placed outside their removal circuit, county, and region. Children in licensed OHC placed outside of their removal county show wide variation across Florida circuits, with urban areas generally placing more children within their removal county, and circuits with larger rural areas placing more children outside their removal county. The percent of children placed outside of their removal circuit is lower than the percent of children placed out-of-county, as many children not placed in their home county are placed in a neighboring county within the same circuit. Outcome 7: Reduce placements of young children in group homes or institutions. The proportion of children of all ages in licensed care who are placed in group care averages 8.13 percent statewide. Overall, the percentage of very young children (ages 0-5 years) placed in group care is generally quite low (0.62 percent). The percentage of children in group care increases with age, with a statewide average of 8.03 percent of children ages 6-12 and 28.56 percent of children ages 13-17 placed in a group home environment as of June 30, 2019. Statewide performance on children in OHC who receive medical services has been stable for the last five years. All CBCs are currently above the 95 percent target on this indicator. Statewide performance on children in OHC who receive dental services has stabilized over the last five years at a level that is slightly below the department’s target of 95 percent. Ten areas are currently above the statewide target of 95 percent. All but two Florida areas are above the statewide target of 80 percent on young adults who age out of foster care and have completed or are enrolled in a secondary education, vocational training, or adult education program. Florida has exceeded the state target over the last five SFYs.

Office of Child Welfare Annual Performance Report 2018-19 14
Indicators Presented in this Report This report provides charts for a set of indicators describing the current status of Florida’s community-based child welfare system. The sequence follows the flow of Florida’s child welfare system from the Hotline to child protective investigations to case management. CBC indicators are structured around the three national goals of Safety, Permanency, and Well-Being.
This report uses trend and comparison charts. Trend charts show change over time. Comparison charts show Florida in relation to other states, and each area in Florida in relation to other areas. Such comparisons are included to provide appropriate context. For example, if Florida appears to be trending in the wrong direction on a given indicator, it is useful to see Florida’s performance in relation to the nation.
The indicators in this report show wide variation from state to state and community to community. Many of the measured differences between states reflect differences in laws and reporting systems, as well as differences in populations served. Variation within Florida may also be due in part to varying demographics of populations served and different levels of community resources to support children and families. The flexibility to meet varying community needs means that Florida’s varying systems of care will have different mixes of services, which may lead to varying levels of performance on outcome measures.
Caution should be used in comparing states, circuits, and CBCs. Comparisons may trigger celebration of high performance or signal a need for improvement. More often, recognition of differences will trigger questions about how Florida is different from other states and how communities within Florida are different from each other. Special Note Regarding Round 3 of the Child and Family Services Reviews (CFSR-3) Comparisons: The CFSR-3 data was last published in May 2015 covering April 2011 through March 2012. This report uses Florida’s most recent observed performance is used to compare Florida’s performance to that of other states. The reader should take careful note of the date information included at the top of each chart.
Office of Child Welfare Annual Performance Report 2018-19 15
Demographic Context of the Child Welfare System Wide variation on various indicators, including removals and discharges, service mix, and measured outcome performance, are present throughout this report. There are also some important context differences between communities, including wide variations in the proportion of children living in poverty and the public response to maltreatment measured through maltreatment reporting rates. Both indicators are included on the following pages.
Although additional indicators, such as teen births, employment, education, crime, etc., are not included in this report, such indicators can contribute toward a broader understanding of how such variations might affect community-level indicators in this report. Other variables to consider include:
• The allocation of resources to various components by CBCs, including the mix of case management, residential placement (e.g., foster family homes vs. group care), safety management, and other direct services.
• The availability of additional resources devoted to child welfare, such as those with Children’s Services Councils supported by local taxes.
• Indicators such as median income, the number of children compared to the general population, and income inequality.
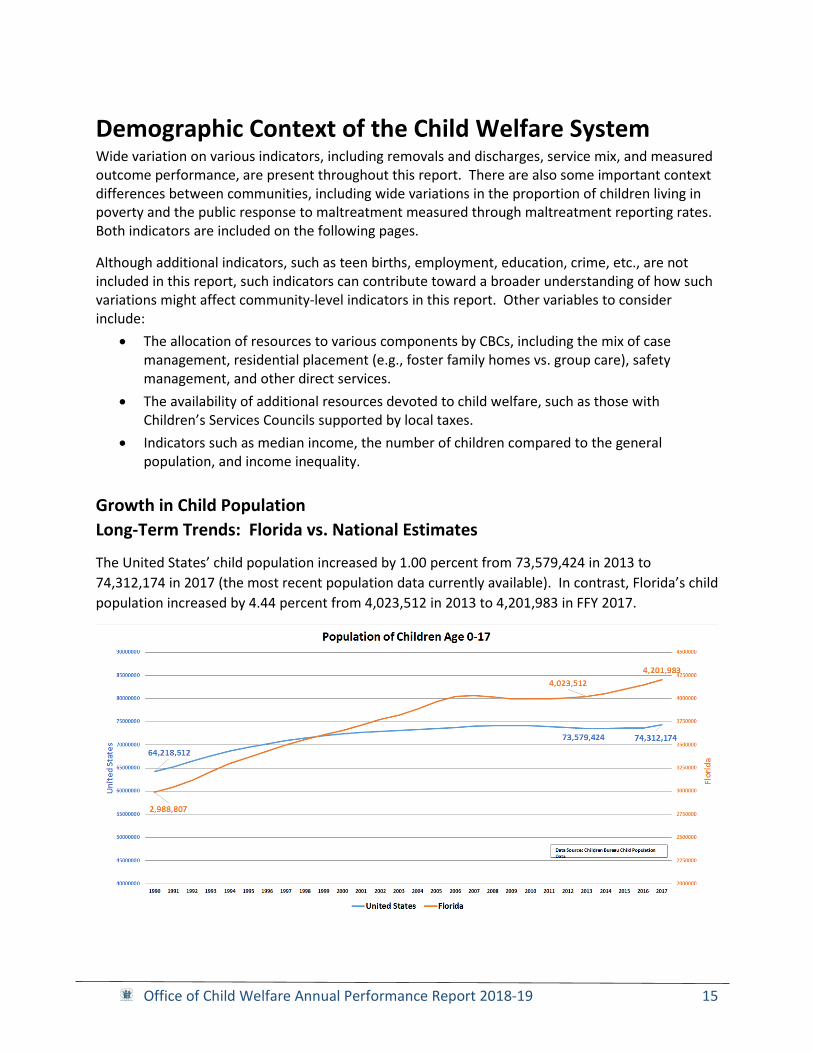
Growth in Child PopulationLong-Term Trends: Florida vs. National Estimates
The United States’ child population increased by 1.00 percent from 73,579,424 in 2013 to 74,312,174 in 2017 (the most recent population data currently available). In contrast, Florida’s child population increased by 4.44 percent from 4,023,512 in 2013 to 4,201,983 in FFY 2017.

Office of Child Welfare Annual Performance Report 2018-19 16
Children Living in Poverty
When comparing communities on various child welfare indicators, poverty is an important factor to consider, including its relationship to reporting rates and implications for service needs.
Florida Compared to Other States
Per child poverty data provided from the Children’s Bureau, Florida’s estimated child poverty rate of 20.3% in FFY 2017 placed Florida in the third quartile when comparing poverty rates of all states.
Circuit/CBC Comparisons Per child poverty data provided by the Robert Woods Johnson Foundation, Florida’s estimated poverty rate has dropped slightly since 2015 with higher percentages in Circuits 3, 8, and 10 (25 percent); and lower percentages in Circuits 7-St Johns County (9 percent) and 4-Clay County (13 percent).

Office of Child Welfare Annual Performance Report 2018-19 17
Intake into the Child Welfare System Maltreatment Reporting Reporting Rate: Children Investigated Compared to the Population In 1971, the Florida Legislature created the Hotline and child protective investigations in each of Florida’s 67 counties. Since that time, Florida has used this intake system as the “front door” of its child welfare system. According to a 2016 Florida study by the SAS Institute that followed a 2005 birth cohort for 10 years, approximately one in every five children born in Florida in 2005 were reported at least once to the child welfare system within 60 months from birth.
Long-Term Trends: Florida vs. National Average Florida’s investigation rate has been flat for over a decade, but far exceeds the national average.
Florida Compared to Other States Florida’s investigation rate was the seventh highest in the nation in FFY 2017.
Office of Child Welfare Annual Performance Report 2018-19 18
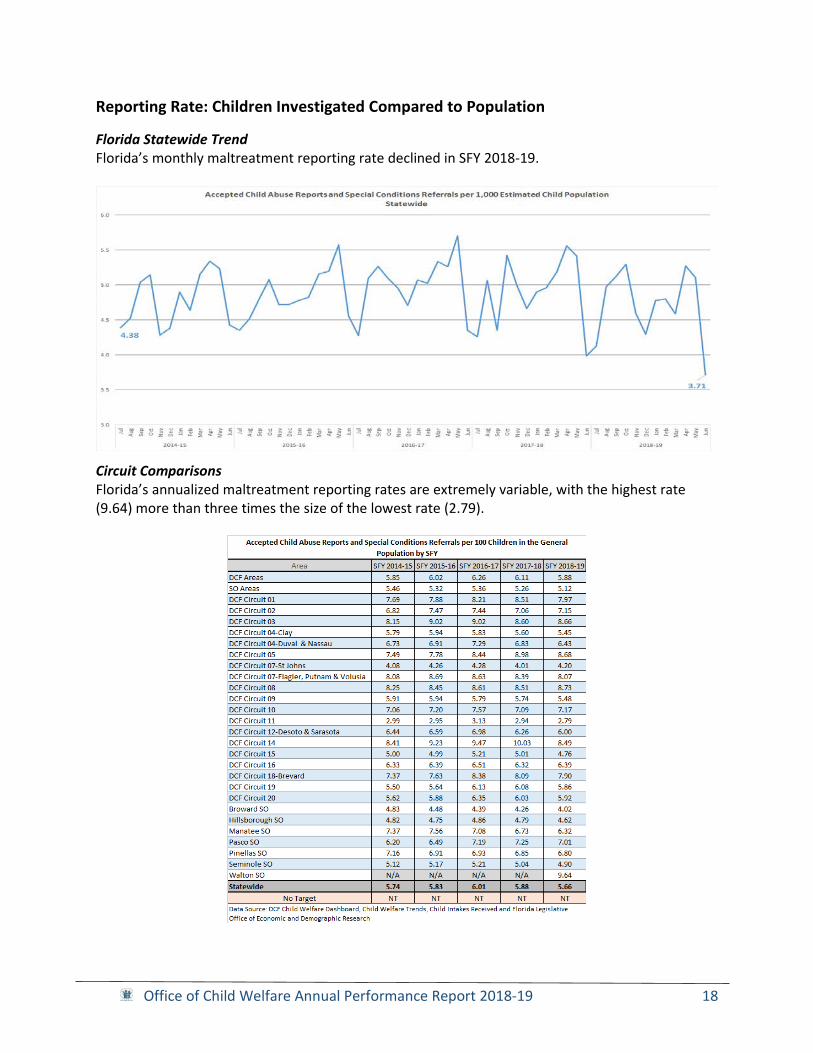
Reporting Rate: Children Investigated Compared to Population
Florida Statewide Trend Florida’s monthly maltreatment reporting rate declined in SFY 2018-19.
Circuit Comparisons Florida’s annualized maltreatment reporting rates are extremely variable, with the highest rate (9.64) more than three times the size of the lowest rate (2.79).

Office of Child Welfare Annual Performance Report 2018-19 19
Florida Abuse Hotline Intake Screening Rates The first decision point in Florida’s child welfare system is the decision as to whether a reporter’s allegation(s) of maltreatment meets the criteria to be accepted for investigation. Caution should be used in comparing states, due to varying laws, reporting mechanisms, and information systems, but Florida has traditionally had one of the highest screen-in rates.
Florida Compared to Other States The most recent national data for the percentage of reports screened-in is for FFY 2016. Florida’s rate was above the national average and in the highest quartile in FFY 2016. However, Florida’s screen-in rate has dropped significantly in the last two state fiscal years.

Office of Child Welfare Annual Performance Report 2018-19 20
Intake Screening Rates
Florida Trend Florida’s screen-in rate, which was above the national average in FFY 2016, has decreased in the three subsequent years.
Seasonality of Reporting
Florida Trend Reporting levels follow a fairly predictable seasonal pattern. Year-to-year fluctuations in the pattern may be due to wait times experienced by reporters to the Hotline that may result in multiple contacts.
Office of Child Welfare Annual Performance Report 2018-19 21
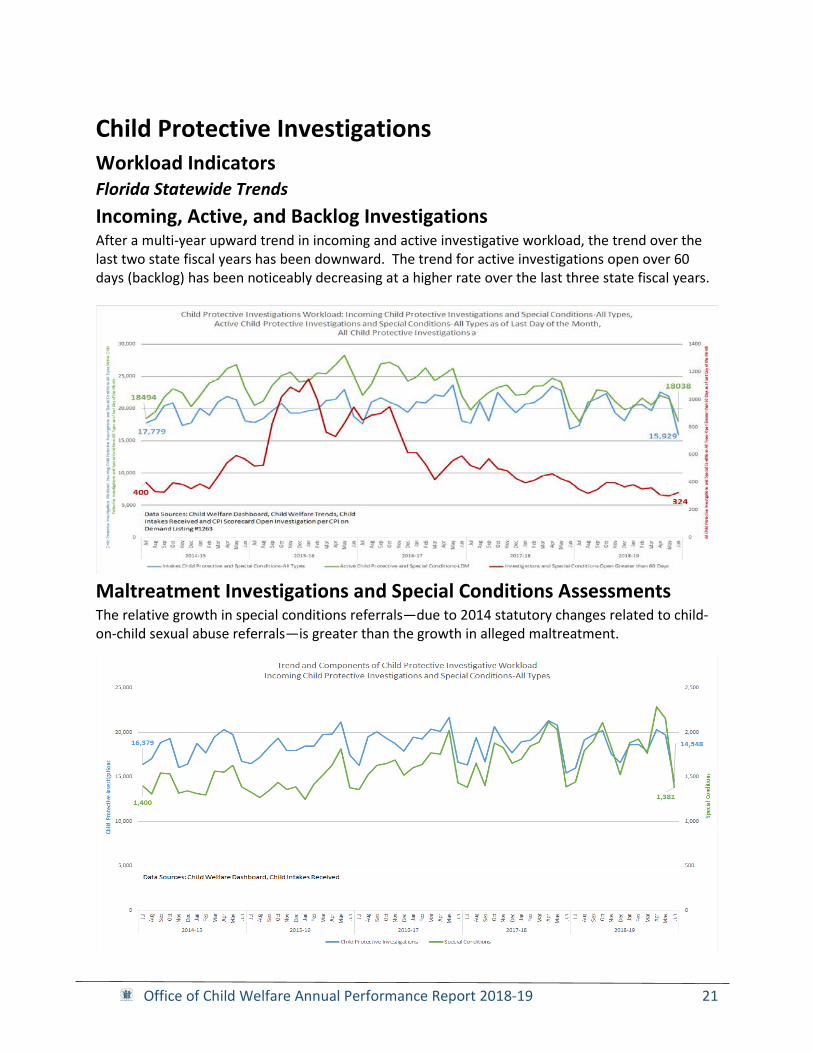
Child Protective Investigations Workload Indicators Florida Statewide Trends Incoming, Active, and Backlog Investigations After a multi-year upward trend in incoming and active investigative workload, the trend over the last two state fiscal years has been downward. The trend for active investigations open over 60 days (backlog) has been noticeably decreasing at a higher rate over the last three state fiscal years.
Maltreatment Investigations and Special Conditions Assessments The relative growth in special conditions referrals—due to 2014 statutory changes related to child-on-child sexual abuse referrals—is greater than the growth in alleged maltreatment.

Office of Child Welfare Annual Performance Report 2018-19 22
Average Investigative Response Time in Hours Timeliness in responding to alleged maltreatment is important. Florida law requires that some investigations be commenced immediately while others are to be commenced within 24 hours. These requirements have contributed to Florida having an extremely fast investigative response time when compared to the national average.
Trend: Florida vs. National Average Florida has maintained consistently high performance for this metric, including FFY 2011 through FFY 2017, the last year with available national data.
Florida Compared to Other States In FFY 2017, Florida had the fastest investigative response time of all reporting states.

Office of Child Welfare Annual Performance Report 2018-19 23
Percent of Alleged Victims Seen within 24 Hours In addition to initiating investigations in a timely manner, Florida also requires that investigators make timely face-to-face contact with each alleged victim.
Florida Statewide Trend Although Florida’s performance in timely investigative response has traditionally been high, performance has increased significantly over the last state fiscal year. This coincided with an adjustment of the target from 85 percent to 90 percent at the start of SFY 2018-19.
Circuit/Sheriff Comparisons Eighteen circuits and sheriffs’ offices were at or above the statewide target of 85 percent or higher of alleged victims seen within 24 hours in SFY 2018-19.

Office of Child Welfare Annual Performance Report 2018-19 24
Percent of Investigations Completed within 60 Days Florida has a statutory requirement to complete all but a few types of investigations (death, missing children, and those with a specified concurrent criminal investigation) within 60 days.
Florida Statewide Trend Statewide performance in completing investigations within 60 days has been increasingly steadily over the last three state fiscal years but is still below the 99 percent standard.
Circuit/Sheriff Comparisons There has been steady improvement within this metric and currently twenty-four circuits and sheriffs’ offices completed over 95 percent of investigations within 60 days in SFY 2018-19, and seven met the 99 percent target.

Office of Child Welfare Annual Performance Report 2018-19 25
Safety Outcome Indicator: No Recurrence of Verified Maltreatment The first safety outcome indicator in this report measures recurrence of maltreatment within 12 months of verified maltreatment, regardless of whether services were provided. This national data indicator for Round 3 of the Child and Family Services Reviews (CFSR-3), answers the question, “Of all children who were victims of a substantiated maltreatment report during a 12-month period, what percent were victims of another substantiated maltreatment report within 12 months?”
Denominator: Number of children with at least one substantiated or indicated maltreatment report in a 12-month period. Numerator: Number of children in the denominator that had another substantiated or indicated maltreatment report within 12 months of their initial report.
Florida Compared to Other States The national standards and calculations of state performance for CFSR-3 are being revised by the Children’s Bureau; however, national data is available for no recurrence of a verified finding within 12 months. This data indicates that Florida’s observed performance of 94.40 percent places the state in second quartile of ranked states.

Office of Child Welfare Annual Performance Report 2018-19 26
Safety Outcome Indicator: Non-Recurrence of Verified Maltreatment Florida Statewide Trend Florida presents performance on this indicator positively as “non-recurrence.” The percent has been trending upwards and began to exceed the initial standard in SFY 2014-15.
Circuit/Sheriff Comparisons There has been overall improvement across the state since SFY 2014-15, with 25 areas now exceeding the target.

Office of Child Welfare Annual Performance Report 2018-19 27
Investigative Decisions and Flow to Services Evidence of Maltreatment Chapter 39, Florida Statutes, requires that “Protective investigations shall . . . perform the following child protective investigation activities to determine child safety . . . Determine whether there is any indication that any child in the family or household has been abused, abandoned, or neglected; the nature and extent of present or prior injuries, abuse, or neglect; and any evidence thereof.”
Verification Rates While evidence of maltreatment is important, the decisions to provide post-investigation services should be based on safety determinations and service needs rather than simply verified evidence of maltreatment, regardless of danger to the child or the family’s need for services. Decision-making based on safety determinations are presented in the indicators in the next section.
Florida Statewide Trend The percent of children in investigations with at least one finding of "verified" maltreatment has been declining over the last seven SFYs. As only verified maltreatment is included in the measurement of recurrence, the decline in percent verified may have had a significant impact in lowering the rates of measured recurrence of maltreatment present in the last section.

Office of Child Welfare Annual Performance Report 2018-19 28
Circuit/Sheriff Comparisons The wide range of percentages in the figure below suggests that there is variation in local practice, rather than simply variation in evidence of maltreatment. Variation in verification rates affects variation in measured recurrence of maltreatment.

Office of Child Welfare Annual Performance Report 2018-19 29
Safety Methodology and Flow to Services Section 39.301, Florida Statutes, defines requirements for assessment of safety and development of safety plans.
Section 39.301 (9), Florida Statutes, states in part: “Protective investigations shall . . . perform the following child protective investigation activities to determine child safety . . . Complete assessment of immediate child safety for each child based on available records, interviews, and observations . . . Document the present and impending dangers to each child based on the identification of inadequate protective capacity through utilization of a standardized safety assessment instrument. If present or impending danger is identified, the child protective investigator must implement a safety plan or take the child into custody. If present danger is identified and the child is not removed, the child protective investigator shall create and implement a safety plan before leaving the home or the location where there is present danger. If impending danger is identified, the child protective investigator shall create and implement a safety plan as soon as necessary to protect the safety of the child. The child protective investigator may modify the safety plan if he or she identifies additional impending danger.”
“If the child protective investigator implements a safety plan, the plan must be specific, sufficient, feasible, and sustainable in response to the realities of the present or impending danger. A safety plan may be an in-home plan or an out-of-home plan, or a combination of both. A safety plan may include tasks or responsibilities for a parent, caregiver, or legal custodian. However, a safety plan may not rely on promissory commitments by the parent, caregiver, or legal custodian who is currently not able to protect the child or on services that are not available or will not result in the safety of the child. A safety plan may not be implemented if for any reason the parents, guardian, or legal custodian lacks the capacity or ability to comply with the plan. If the department is not able to develop a plan that is specific, sufficient, feasible, and sustainable, the department shall file a shelter petition.”
“The child protective investigator shall collaborate with the community-based care lead agency in the development of the safety plan as necessary to ensure that the safety plan is specific, sufficient, feasible, and sustainable. The child protective investigator shall identify services necessary for the successful implementation of the safety plan. The child protective investigator and the community-based care lead agency shall mobilize service resources to assist all parties in complying with the safety plan.”
Section 39.301 (14), Florida Statutes, states in part: “If the department or its agent determines that a child requires immediate or long-term protection through . . . services to stabilize the home environment . . . such services shall first be offered for voluntary acceptance unless . . . there are high-risk factors that may impact the ability of the parents or legal custodians to exercise judgment. Such factors may include the parents’ or legal custodians’ young age or history of substance abuse, mental illness, or domestic violence; or there is a high likelihood of lack of compliance with voluntary services, and such noncompliance would result in the child being unsafe.”
The department’s safety practice guides selection of appropriate post-investigative services, including removal and placement in OHC, case-managed in-home services, and FSS.

Office of Child Welfare Annual Performance Report 2018-19 30
Safe/Unsafe Determinations The statewide percent of children determined “unsafe” was 8.2 percent in the last quarter of SFY 2018-19. This was a decrease from 8.4 percent in SFY 2017-18. Variation is wide between circuits, but the range of this variation is less than it was in SFY 2017-18.
Flow to Services, Regardless of Safe/Unsafe Determinations There is wide variation among circuits and sheriffs’ offices in the proportion of families receiving services after the conclusion of an investigation, with the use of FSS having the highest variation.

Office of Child Welfare Annual Performance Report 2018-19 31
Children Determined "Unsafe" Receiving Post-Investigation Services Florida’s practice model requires that children who are determined to be unsafe receive ongoing case management. The majority (52.5 percent) of children determined unsafe were removed from their homes and a smaller group received services in-home (41.7 percent), totaling 94.2 percent of children determined to be unsafe receiving ongoing case management. This means there is a small portion of children determined to be unsafe who were not receiving ongoing case management services (5.5 percent). The data around these unsafe children who do not receive ongoing case management services is influenced by localized time lag in the entry and documentation of unsafe child services within FSFN and local practice related to the categorization of unsafe child services within FSFN that may result in the exclusion of the delivery of child services from these counts.
Children Determined "Safe" Receiving Post-Investigation Services The chart below presents the reverse, the number of children who have been determined to be safe and what, if any, services they are receiving after the conclusion of the investigation. The expectation would be that children who are found to be safe would not be receiving ongoing case management services. This was true for almost all children (95.9 percent); however, a small percent of children found to be safe are receiving FSS (2.8 percent), ongoing case management (0.8 percent), and specifically, a very small percent of children found to be safe were in OHC (0.5 percent).

Office of Child Welfare Annual Performance Report 2018-19 32
Children Removed from their Families In order to compare removals in different areas, removal rates per 1,000 children in the general population and per 100 children in investigations are calculated. The rate per 1,000 children in the general population indicator does not consider how many children were investigated with a chance of removal. The removal rate per 100 children in investigations indicator is limited to children with a chance of being removed, so it is more directly related to investigative decision-making.
Removal Rates per 1,000 Children in the General Population
Long-Term Trends: Florida vs. National Average
Note that Florida’s entry rate into foster care per 1,000 children in the general population has been higher than the national average, except for a period of convergence beginning in FFY 2008. Florida’s rate began to drop in FFY 2017 and was approaching the national average.
Florida Compared to Other States Florida’s rate in FFY 2017 was in the second quartile of ranked states and was comparable with the geographically similar states of Georgia, Alabama, South Carolina, and Mississippi.

Office of Child Welfare Annual Performance Report 2018-19 33
Foster Care Entries per 1,000 Children in the General Population
Florida Statewide Trend Entry rates per 1,000 children in the general population has decreased steadily over the last two SFYs. This has placed downward pressure on cumulative removals, which are currently at five-year lows.
Circuit/Sheriff Comparisons There is a wide variation when comparing historical removal rates for circuits and sheriffs’ offices. During SFY 2018-19, one area had removal rates of more than 9.0 per 1,000 child population and four areas had rates of less than 3.0 per 1,000 child population.

Office of Child Welfare Annual Performance Report 2018-19 34
Removal Rates per 100 Children Investigated
Long-Term Trends: Florida vs. National Average For the most recent year of data, children investigated include those who are the subject of at least one alleged maltreatment and/or alternative response report. Florida’s rate is historically much lower than the national rate, but both the state and national rate declined through FFY 2008 and plateaued for several years. Florida’s rate has increased over the last three years but remains much lower than the national rate.
Florida Compared to Other States For the most recent year of data, differences in state policies and practices—including variations in the legal definitions of maltreatment—affect rates, so interpretation of trends and state-by-state comparisons should be made with caution. Some differences in rates are related to differences in other indicators. For example, states with very low reporting rates (e.g. Pennsylvania) tend to have a relatively high removal rate; states with a very high reporting rate (e.g. Florida) tend to have a relatively low removal rate. Florida ranked twelfth in 2016 (the most recent year available) in children entering care per 100 children investigated.

Office of Child Welfare Annual Performance Report 2018-19 35
Removal Rates per 100 Children Investigated
Florida Statewide Trend There has been a steady decline in the removal rate per 100 children investigated in Florida since SFY 2015-16.
Circuit/Sheriff Comparisons Statewide the number of removals has increased, but trends in each area are different. In order to compare communities, the rate of removals per 100 children in investigations is used. Note the wide variation from a high of 7.97 to a low of 3.49 in the current SFY.

Office of Child Welfare Annual Performance Report 2018-19 36
Community-Based Care Source of Indicators in this Section The remaining outcome indicators in this report are based primarily on the seven federal outcomes related to the three goals of Safety, Permanency, and Well-Being established by ASFA and the nine outcomes established by Florida’s CBC statute language, which contain the requirements for ROA.
The Children’s Bureau established seven national outcomes: Outcome 1: Reduce recurrence of child abuse and/or neglect Outcome 2: Reduce the incidence of child abuse and/or neglect in foster care Outcome 3: Increase permanency for children in foster care Outcome 4: Reduce time in foster care to reunification without increasing reentry Outcome 5: Reduce time in foster care to adoption Outcome 6: Increase placement stability Outcome 7: Reduce placements of young children in group homes or institutions
Section 409.986, Florida Statutes, established the following nine outcomes “…to protect the best interest of children by achieving the following outcomes in conjunction with the community-based care lead agency, community-based subcontractors, and the community alliance:
(a) Children are first and foremost protected from abuse and neglect. (b) Children are safely maintained in their homes, if possible and appropriate. (c) Services are provided to protect children and prevent their removal from their home. (d) Children have permanency and stability in their living arrangements. (e) Family relationships and connections are preserved for children. (f) Families have enhanced capacity to provide for their children’s needs. (g) Children receive appropriate services to meet their educational needs. (h) Children receive services to meet their physical and mental health needs. (i) Children develop the capacity for independent living and competence as an adult.”
The Children’s Bureau established seven data indicators for CFSR-3 to support the three ASFA goals and outcomes. The national standards and calculations of state performance for CFSR-3 are being revised by the Children’s Bureau, but the initial standards and measured performance of Florida, other states, and areas within Florida are presented in this report as important indicators of safety and permanency. The Children’s Bureau measures both “observed” (actual) performance and “risk standardized” performance, which is adjusted according to the median age of children served and entry rates into foster care. Only observed performance is presented in this report.
CFSR Safety Outcome 1: Children Are, First and Foremost, Protected from Abuse and Neglect Maltreatment in Foster Care Recurrence of Maltreatment
CFSR Permanency Outcome 1: Children Have Permanency and Stability in Their Living Situations Permanency in 12 months for children entering foster care Permanency in 12 months for children in foster care 12 to 23 months Permanency in 12 months for children in foster care 24 months or more Re-entry to foster care in 12 months Placement stability

Office of Child Welfare Annual Performance Report 2018-19 37
Organization of Indicators in this Section The indicators in this section of the report are grouped into the following sections:
Caseload Indicators
Mix of Services: In-Home and Out-of-Home
Out-of-Home Care Population in Context: General Population and Children Investigated
Out-of-Home Care, Removals and Discharges
Safety Outcome Indicators
Maltreatment in Foster Care
Maltreatment during Services
Maltreatment after Termination of Services
Permanency Outcome Indicators
Permanency in 12 months for children entering foster care
Permanency in 12 months for children in foster care 12 to 23 months
Permanency in 12 months for children in foster care 24 months or more
Re-entry to foster care in 12 months
Drivers of Timely Permanency
Caseworker Visits
Children’s Legal Services
Well-Being of Children in Care
Trends in Placement Types
Maintaining Connections: Placement Stability
Maintaining Connections: Siblings
Maintaining Connections: Proximity of Placement

Office of Child Welfare Annual Performance Report 2018-19 38
CBC Caseload Indicators Protection of Children in their Own Homes Mix of Case-Managed Services: In-Home Services vs. Out-of-Home Care Two CBC outcomes required by law are “Children are safely maintained in their homes, if possible and appropriate” and “Services are provided to protect children and prevent their removal from their home,” so more unsafe children should be protected in their own homes.
Florida Statewide Trend Since SFY 2014 the number of children in OHC increased while the number of children protected in their own homes has declined. The gap between the two continues to widen, as in-home numbers have continued to trend downward over the last three years.

Office of Child Welfare Annual Performance Report 2018-19 39
Circuit/CBC Comparisons There is high variation in the service mix and the relationship between the rate at which children are being actively protected. One of the best indicators of need is investigative volume.
In-Home 2.5 2.4 2.2 2.1 2.3Out-of-Home 4.9 5.1 5.9 6.3 6.7In-Home 3.3 4.3 4.2 4.4 3.4Out-of-Home 6.1 6.9 7.1 6.4 5.9In-Home 2.5 3.1 3.0 2.8 2.2Out-of-Home 5.3 6.1 5.8 5.1 4.3In-Home 2.3 1.8 1.6 1.8 2.0Out-of-Home 4.2 4.2 3.8 3.8 3.8In-Home 2.7 2.9 3.6 3.7 4.2Out-of-Home 5.2 5.7 6.3 6.6 6.2In-Home 3.1 2.4 1.8 1.6 1.2Out-of-Home 3.9 3.4 3.2 3.2 2.8In-Home 4.4 3.1 3.1 3.1 2.9Out-of-Home 5.9 5.8 5.1 5.7 5.8In-Home 2.8 4.5 3.8 3.8 3.7Out-of-Home 5.7 8.2 8.9 8.4 9.2In-Home 2.7 2.7 2.7 3.1 2.7Out-of-Home 6.3 6.6 7.5 8.3 8.8In-Home 3.2 3.9 4.4 3.6 2.7Out-of-Home 5.8 6.3 7.2 7.5 7.6In-Home 1.9 2.2 2.2 1.8 1.7Out-of-Home 3.3 3.5 3.4 3.5 3.6In-Home 4.4 5.2 4.6 4.3 5.0Out-of-Home 7.5 7.6 8.5 8.3 9.0In-Home 1.1 1.5 1.4 1.5 2.4Out-of-Home 2.9 3.9 4.2 3.7 3.7In-Home 4.1 3.0 3.1 3.6 3.4Out-of-Home 3.4 3.7 3.7 3.7 3.7In-Home 2.5 2.9 3.5 3.1 3.5Out-of-Home 6.0 6.5 7.3 7.5 7.5In-Home 4.4 4.0 3.8 3.5 3.6Out-of-Home 5.3 6.9 7.8 8.2 8.6In-Home 2.5 3.4 2.4 1.9 2.9Out-of-Home 3.7 4.7 4.9 5.3 6.0In-Home 3.8 4.5 3.7 3.6 4.1Out-of-Home 6.1 7.3 7.9 7.7 7.1In-Home 2.3 2.3 2.8 3.1 3.0Out-of-Home 5.4 7.0 7.9 7.9 7.4In-Home 3.0 3.0 2.9 2.8 2.7Out-of-Home 4.9 5.4 5.6 5.7 5.6
2018-19 Avg
Data Source: Child Welfare Dashboard, Child Welfare Trends and Office of Economic and Demographic Research
Average Rate of Children In-Home and Out-of-Home Care per 1,000 Children in the Population No DCF Target
2015-16 Avg 2016-17 Avg 2017-18 Avg
Families First Network-Circuit 01
St Johns Family Integrity-Circuit 07 (St Johns County Only)
Family Support Services of North FL-Circuit 04 (Duval & Nassau Counties)
Heartland for Children-Circuit 10
Partnership for Strong Families-Circuits 03 & 08
CBC 2014-15 Avg
Embrace Families-Circuits 9 & 18 (Seminole County Only)
Citrus Health Network-Circuits 11 & 16
Communities Connected for Kids-Circuit 19
Community Partnership for Children-Circuit 07 (Flagler, Putnam and Volusia Counties Only)
Eckerd Community-Pasco and Pinellas-Circuit 06
Eckerd Community-Hillsborough-Circuit 13
Brevard Family Partnership-Circuit 18 (Brevard County Only)
ChildNet-Broward-Circuit 17
ChildNet-Palm Beach-Circuit 15
Children's Network of SW FL-Circuit 20
Sarasota Safe Children Coalition-Circuit 12
Statewide
Service Type
Kids Central, Inc.-Circuit 05
Kids First, Inc.-Circuit 4 (Clay County Only)
Big Bend CBC-Circuits 02 &14

Office of Child Welfare Annual Performance Report 2018-19 40
Florida’s Out-of-Home Care Population in Context Florida’s OHC population has grown since 2013. Changes in Florida parallel changes nationally. These charts show trends and the relative size of Florida’s OHC population to the general population of children and children in investigations, an indicator of need.
Long-Term Trends: Florida vs. National Average
Children in Out-of-Home Care Population Trend The number of children in OHC nationally dropped sharply from FFY 2000 to FFY 2010, but Florida’s decrease was sharper than the decrease for the nation as a whole. The numbers have been increasing since FFY 2013.
Children Removed/Foster Care Entries Trend Florida’s reduction in removals from FFY 2007 to FFY 2010 was much more dramatic than the gradual national reduction. After a few years of increased removals, Florida experienced a two-year reduction in removals between FFY 2016 and FFY 2017.

Office of Child Welfare Annual Performance Report 2018-19 41
Children in Out-of-Home Care Compared to Child Population Although states have differing populations (e.g., income and poverty) and maltreatment reporting requirements, comparing the OHC population to the general child population is one way to see the relative size of Florida’s OHC population.
Long-Term Trends: Florida vs. National Average In FFY 2000 through FFY 2006, Florida’s OHC rate per 1,000 children in the general population was above the national average. From FFY 2007 to FFY 2017, Florida has been at or below the national average.
Florida Compared to Other States
Florida’s was in the second quartile for the rate of children in OHC per 1,000 children in the general population in FFY 2017. Many states have rates that are nearly three times as high as Florida’s rate.

Office of Child Welfare Annual Performance Report 2018-19 42
Children in Out-of-Home Care Compared to Child Population
Florida Statewide Trend The number of children in OHC as a proportion of the overall child population increased significantly from SFY 2014-15 levels. Over the last three SFYs it has stabilized in the range of 5.5 to 5.6 per 1,000 children in the general population.
Circuit/CBC Comparisons Although the statewide rate of children in OHC for the last fiscal year was 5.5 per 1,000 children in the general population, there is wide variation across CBCs.

Office of Child Welfare Annual Performance Report 2018-19 43
Children in Out-of-Home Care Compared to Children Investigated Children removed and placed in OHC are not taken from the general population, but from those in investigations. The number of children investigated is a better indicator of need. However, the relative size of the OHC population is affected by permanency performance as much as removal rate.
Long-Term Trends: Florida vs. National Average The most recent data for this measure indicates that both Florida and national OHC rate per 100 children investigated has been increasing over the last three years, but Florida’s rate is still much lower than the national average.
Florida Compared to Other States The most recent data for this metric indicates that Florida’s OHC rate per 100 children investigated was one of the lowest in the nation in FFY 2016 (the most recent year available), due in part to Florida’s high reporting rate. Conversely, Pennsylvania’s low reporting (children investigated) rate impacts its high rate of children in foster care per 100 children investigated.
Office of Child Welfare Annual Performance Report 2018-19 44
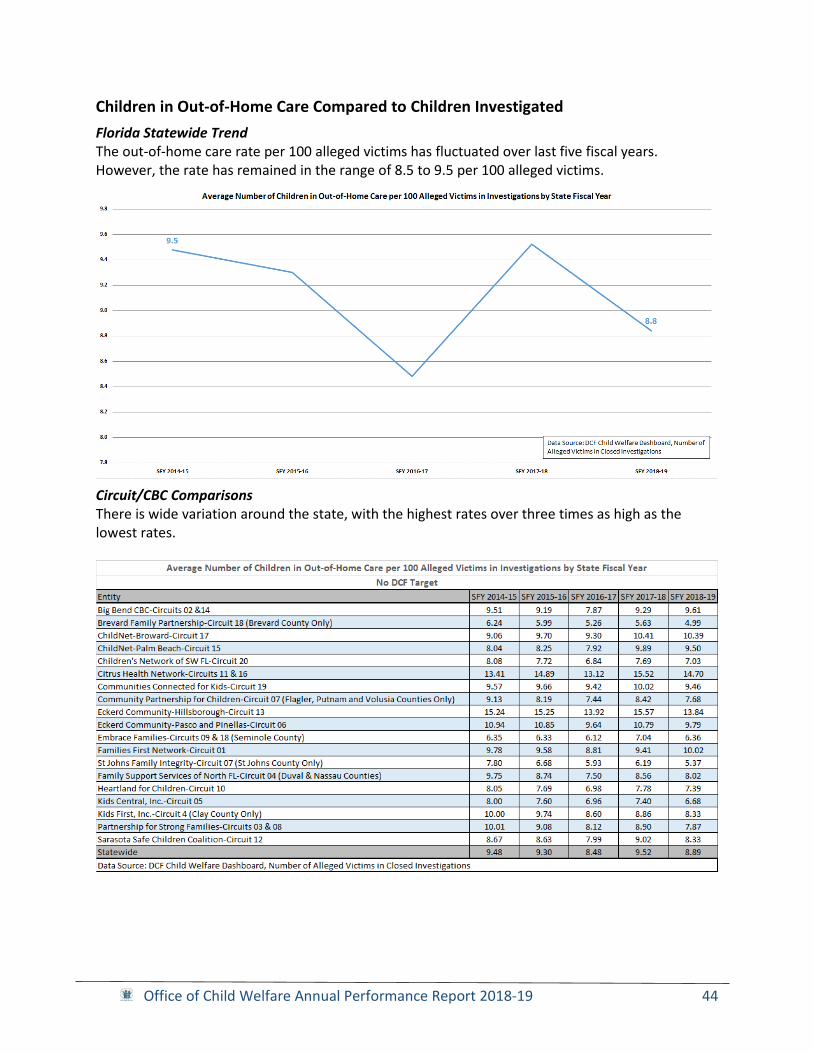
Children in Out-of-Home Care Compared to Children Investigated
Florida Statewide Trend The out-of-home care rate per 100 alleged victims has fluctuated over last five fiscal years. However, the rate has remained in the range of 8.5 to 9.5 per 100 alleged victims.
Circuit/CBC Comparisons There is wide variation around the state, with the highest rates over three times as high as the lowest rates.

Office of Child Welfare Annual Performance Report 2018-19 45
Relationship between Out-of-Home Care, Removals, and Discharges Changes in the children in OHC population -- up or down -- are driven by changes in removals/entries and discharges/exits. Note the gaps between the two lines:
• Removals (red) above discharges (green) result in OHC increase.
• Discharges (green) above removals (red) result in OHC decrease.
National Trend This chart shows that the national reduction in OHC from FFY 2007 through FFY 2011 was driven by a reduction in removals. The recent increase in OHC was driven by increases in removals with no increase in discharges.
Florida Statewide Trend Florida was similar to the national trend, but with steep reductions in removals and OHC in FFYs 2007-09. The simultaneous increase in removals and decrease in discharges in FFY 2014 has driven the OHC increase.

Office of Child Welfare Annual Performance Report 2018-19 46
Children Exiting Foster Care per 100 Children in Care In order to compare states and communities, discharges in a given period are compared to the number of children in OHC at the end of the period.
Long-Term Trends: Florida vs. National Average Using national data to compare total exits each FFY to children in care at the end of the FFY, Florida’s rate was just below the national average in FFY 2000 but has been consistently above the national average from FFY 2001 through FFY 2017.
Florida Compared to Other States The last available national data for FFY 2017, indicates that Florida’s exit rate of 64.8 per 100 children in out-of-home care is solidly in the third quartile of ranked states.
Office of Child Welfare Annual Performance Report 2018-19 47
Children Exiting Foster Care per 100 Children in Care
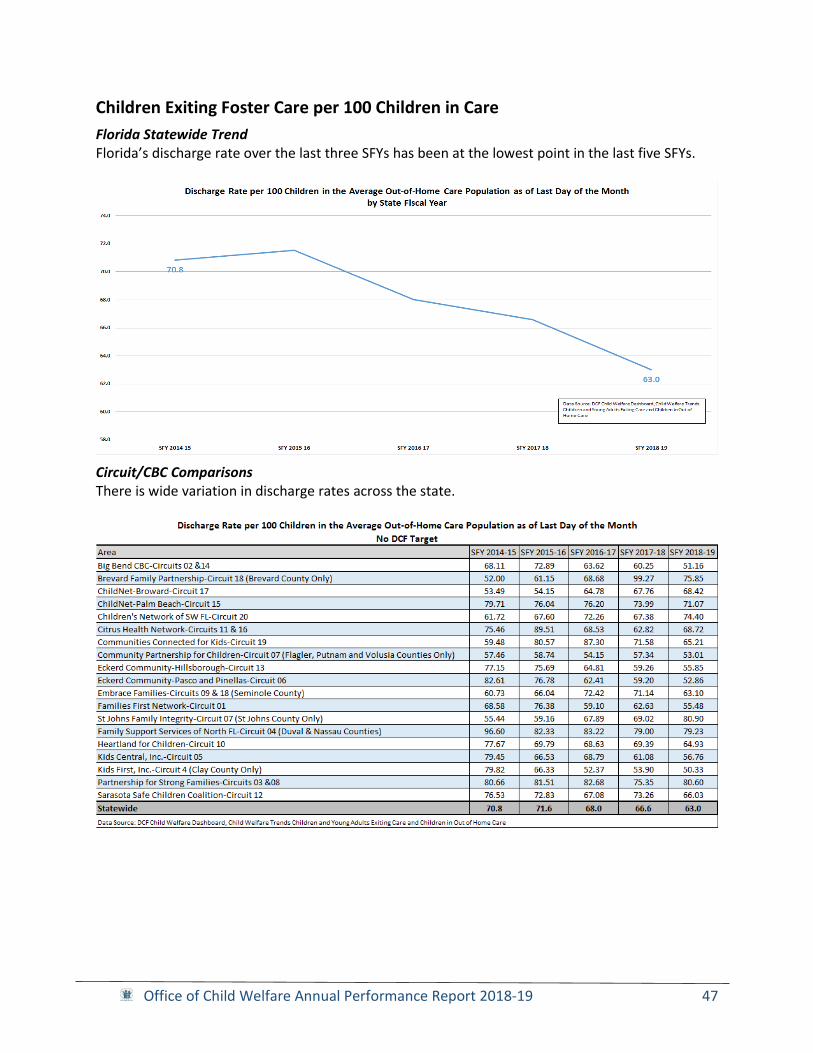
Florida Statewide Trend Florida’s discharge rate over the last three SFYs has been at the lowest point in the last five SFYs.
Circuit/CBC Comparisons There is wide variation in discharge rates across the state.

Office of Child Welfare Annual Performance Report 2018-19 48
CBC Safety Outcome Indicators Relative Safety by Status of Services Child Safety Trends: Comparison of Three Indicators Children continue to be safer while receiving services than after termination of services, as evidenced by the relative percentages of the two indicators on the following chart. The following trends are also shown:
• The percent of children with no verified maltreatment within six months after termination of case-managed in-home services for those closures in July-September 2018 was 96.2 percent.
• The percent of children with no verified maltreatment within six months of termination of Family Support Services for July-September 2018 closures was 93.7 percent.
Measuring safety performance requires follow-up periods for maltreatment after termination of services plus two months for completion of any subsequent investigations. This chart and others in this section include the most recent available quarters.

Office of Child Welfare Annual Performance Report 2018-19 49
Individual Safety Indicators Maltreatment in Foster Care Maltreatment in foster care is a rare event compared to the safety indicators in the last chart, so it is measured as a rate per 100,000 days in care in the federal CFSR-3. It answers the question, “Of all children in foster care during a 12-month period, what is the rate of victimization, per day of care?”
Denominator: Of children in care during a 12-month period, total number of days these children were in care as of the end of the 12-month period. Numerator: Of children in the denominator, total number of substantiated or indicated reports of maltreatment (by any perpetrator) during a foster care episode within the 12-month period.
Florida Compared to Other States The national standards and calculations of state performance for CFSR-3 are being revised by the Children’s Bureau; however, Florida’s observed (not risk standardized) rate of 9.02 for the period under review did not meet the initial standard. Nevertheless, as a percentage of children not abused in foster care, displayed below, Florida ranked fourth in the nation in FFY 2017.

Office of Child Welfare Annual Performance Report 2018-19 50
Maltreatment in Foster Care
The national standards and calculations of state performance for CFSR-3 are being revised by the Children’s Bureau. Florida’s calculated rates are somewhat different from the rate appearing in the federal data profile used for CFSR-3, which uses AFCARS and NCANDS files submitted by states. Florida’s rates are higher than on the previous page, but is useful for making internal comparisons and measuring progress.
Florida Statewide Trend Florida has shown overall improvement in the last six years with a decline in the last two state fiscal years. Maltreatment in OHC is a rare event compared to maltreatment during in-home services.
Circuit/CBC Comparisons There is wide variation around the state on this indicator. Some differences are likely due to differences in reporting maltreatment to the Hotline, differences in verification rates, and use of kinship care, the use of which is typically higher than licensed care.

Office of Child Welfare Annual Performance Report 2018-19 51
Maltreatment During Case-Managed Services Children receiving case-managed in-home services include:
• Children found to be unsafe and needing ongoing assessment, planning, services, and frequent case manager visits to ensure safety while preventing removal and placement.
• Children receiving post-placement supervision.
As this service is for unsafe children with potential for removal, it is not surprising that some may have verified maltreatment while receiving these services. As with other recurrence indicators, measurement is influenced by verification rates.
Florida Statewide Trend There is no standard for this indicator, but performance has been trending upward the last few years.
Circuit/CBC Comparisons Statewide, there is a narrow range when comparing children receiving in-home services by area.

Office of Child Welfare Annual Performance Report 2018-19 52
Maltreatment after Termination of Case-Managed Services Just as it is important to ensure safety of children receiving services, it is also important that supervision not be terminated prematurely, if the risk of subsequent maltreatment remains high.
Florida Statewide Trend Florida has shown steady progress on this indicator over the last five SFYs.
Circuit/CBC Comparisons The high rate of non-recurrence on this indicator connotes that children are generally safe after termination of services. Data for the entire fiscal year is used in the chart below.

Office of Child Welfare Annual Performance Report 2018-19 53
Permanency Indicators Timely Achievement of Permanency Permanency within 12 Months from Three Starting Points The federal CFSR-3 includes three indicators of timely permanency, plus a companion indicator of re-entry into care after discharge. Each of the three timely permanency indicators measures achievement of permanency within 12 months for a different cohort of children, based on a certain period or date.
• Entry Cohort. This indicator measures the proportion of children in a cohort of children who were removed and entered care in the same period and achieved permanency within 12 months of removal.
• In Care 12-23 Months Cohort. This indicator measures the proportion of children in a cohort of children who were in care 12-23 months on the same date and achieved permanency within 12 months of the reporting period.
• In Care 24+ Months Cohort. This indicator measures the proportion of children in a cohort of children who were in care 24 or more months on the same date and achieved permanency within 12 months of the reporting period.
The national standards and calculations of state performance for CFSR-3 are being revised by the Children’s Bureau. Performance on the entry cohort indicator has declined in the last few years, with Florida not meeting the permanency within 12 months standard in SFY 2017-18. Performance on the in-care 12-23 months indicator is consistently above the national standard but has trended lower over the last few years. Performance on the in-care 24+ months cohort has remained stable and constantly above the national standard.

Office of Child Welfare Annual Performance Report 2018-19 54
Permanency in 12 Months for Children Entering Care The first of the CFSR-3 permanency indicators answers the question, “Of all children who enter care in a 12-month period, what percent discharged to permanency within 12 months of entering care?”
Denominator: Number of children who enter care in a 12-month period. Numerator: Number of children in the denominator who discharged to permanency within 12 months of entering care.
Florida Compared to Other States Florida’s observed (not risk standardized) performance of 47.1 percent for children removed in April 2013 – March 2014 was above the initial national standard and was among the top states in the nation in the period used for CFSR-3. The figure below includes the most recent data available for this indicator.

Office of Child Welfare Annual Performance Report 2018-19 55
Permanency in 12 Months for Children Entering Care
Florida Statewide Trend Florida’s performance has been declining during the period used for CFSR-3 and dropped below the initial national standard of 40.5 percent in SFY 2017-18 for the children removed in SFY 2016-17.
Circuit/CBC Comparisons Florida’s statewide performance is currently below the CFSR-3 initial national standard, with more than half of the CBCs below the standard.

Office of Child Welfare Annual Performance Report 2018-19 56
Permanency in 12 Months for Children in Care 12-23 Months This permanency indicator answers the question, “Of all children in care on the first day of a 12-month period who had been in care (in that episode) between 12 and 23 months, what percent discharged to permanency within 12 months of the first day?”
Denominator: Number of children in care on the first day of a 12-month period, who had been in care (in that episode) between 12 and 23 months. Numerator: Number of children in the denominator who discharged to permanency within 12 months of the first day.
Florida Compared to Other States National standards and calculations of state performance for CFSR-3 are being revised; however, Florida’s observed (not risk standardized) performance in SFY 2015-16 was above the CFSR-3 initial standard and higher than most states in the nation in the comparison period. This is the most recent data available for this indicator.

Office of Child Welfare Annual Performance Report 2018-19 57
Permanency in 12 Months for Children in Care 12-23 Months
Florida Statewide Trend Florida’s performance has declined since the 2013 cohort used for the CFSR-3 but continues to exceed the national standard.
Circuit/CBC Comparisons There is high performance for this metric with all but one CBC exceeding the national standard.

Office of Child Welfare Annual Performance Report 2018-19 58
Permanency in 12 Months for Children in Care 24+ Months This permanency indicator answers the question, “Of all children in care on the first day of a 12-month period, who had been in care (in that episode) for 24 months or more, what percent discharged to permanency within 12 months of the first day?”
Denominator: Number of children in care on the first day of a 12-month period, who had been in care (in that episode) for 24 months or more. Numerator: Number of children in the denominator who discharged to permanency within 12 months of the first day.
Florida Compared to Other States The national standards and calculations of state performance for CFSR-3 are being revised; however, Florida’s observed (not risk standardized) performance in 2015-16 was above the CFSR-3 initial standard and higher than most states in the comparison period. This is the most recent data available for this indicator.

Office of Child Welfare Annual Performance Report 2018-19 59
Permanency in 12 Months for Children in Care 24+ Months
Florida Statewide Trend Florida’s performance has improved since the 2013 cohort used for CFSR-3 and is continually above the national standard.
Circuit/CBC Comparisons There is high performance throughout the state on this measure, with every CBC exceeding the national standard.

Office of Child Welfare Annual Performance Report 2018-19 60
Re-entry to Foster Care Areas with high performance on the entry cohort indicator tend to have high re-entry rates.
Re-entry to Foster Care in 12 Months In October 2016, the Children’s Bureau issued Technical Bulletin #9 (http://www.acf.hhs.gov/cb/resource/cfsr-technical-bulletin-9), which alerted states to the fact that there were technical errors in the syntax used to calculate the national and state performance data related to the percentage of children that re-entered foster care within twelve months of achieving permanency. State comparison data associated with the percentage of children that re-entered care within 12 months for all children entering for FFY 2017 is provided below as a surrogate measure for state to state comparison around the issue of foster care re-entry within 12 months.
Florida Compared to Other States Florida is firmly in the second quartile among ranked states for this measure.

Office of Child Welfare Annual Performance Report 2018-19 61
Re-entry to Foster Care in 12 Months
Florida Statewide Trend Although the national CFSR-3 indicator is the percent that re-entered care (initial standard 8.3 percent), Florida displays the indicator positively as the percent that did not re-enter care (initial standard 91.7 percent). Florida’s performance in the SFY 2015-16 entry cohort has continued to be below the initial standard but has improved each of the last five years.
Circuit/CBC Comparisons Unlike the timely permanency indicators, Florida’s low performance on this indicator is observed in most of the state.

Office of Child Welfare Annual Performance Report 2018-19 62
Drivers of Timely Permanency Caseworker Visits with Children in Care According to the Children’s Bureau, achieving permanency in a timely manner for children in foster care can be linked in part to the frequency and quality of caseworker visits with children. During the first and second rounds of the CFSR, an association was found between caseworker visits measures and positive outcomes for children in foster care. For example, frequent contact between the caseworker and the child was associated with better ratings on the CFSR Permanency Outcome 1: Children have permanency and stability in their living situations.
Title IV-B of the Social Security Act requires states to collect data on monthly caseworker visits for children in foster care. The caseworker visits data include the percentage of children visited each full month they were in care, as well as the proportion of those visits that occurred in the homes where the children were then living.
Percentage of Children Receiving Monthly Caseworker Visits This federal indicator answers the question, “Of the children in care, what percent received monthly caseworker visits?”
Denominator: The number of complete calendar months all children in the reporting population spent in care. This denominator, expressed in “visit months,” is aggregated over all children and refers to the number of months in which visits should have occurred. Numerator: The number of monthly caseworker visits made to the children in the reporting population, where if a child is visited more than once in a month, only one visit is counted.
Florida Compared to Other States Florida consistently performs well for case management visits with children. The chart below includes the most recent FFY data available for this indicator.

Office of Child Welfare Annual Performance Report 2018-19 63
Percentage of Monthly Visits that Occurred in the Home of the Child
This related federal indicator answers the question, “Of the children visited, what percent of the visits were in the home of the child?”
Denominator: The number of monthly caseworker visits made to children in the reporting population – the numerator of the last indicator. Numerator: The number of monthly visits made to children in the reporting population that occurred in the child’s home.
Florida Compared to Other States Florida is among the nationwide leaders when comparing the percentage of monthly visits that were made within the child’s home. Below includes the most recent FFY data available for this indicator.
Circuit/CBC Comparisons Florida’s exemplary performance is consistent throughout the state. Florida’s similar indicator measures percent of visits completed within 30 days of the last visit and hovers at or just slightly below the 99.5% target with the majority of CBCs exceeding the target.

Office of Child Welfare Annual Performance Report 2018-19 64
Children’s Legal Services Indicators Judicial handling time is key to timely permanency and there is wide variation among the circuits.
Reunification Goal after 15 Months & No Termination of Parental Rights Activity
Circuit Comparisons The statewide average was 5.9 percent on June 30, 2019, with wide variation among the circuits.
Timeliness of Termination of Parental Rights, from Petition to Order
Circuit Comparisons The statewide median was 159 days in SFY 2018-19, with wide variation among the circuits.

Office of Child Welfare Annual Performance Report 2018-19 65
Time from Removal Date to Disposition Order
Circuit Comparisons The statewide median was 55 days in SFY 2018-19, with wide variation, compared to a statewide target of less than 90 days.

Office of Child Welfare Annual Performance Report 2018-19 66
Well-Being of Children in Out-of-Home Care Appropriate Placements for Children Removed from Families Trends and Variations in Placement Types Federal law requires that a case plan be designed to achieve a safe placement in the least restrictive (most family-like) setting available and in close proximity to the home of the parent(s) when the goal is reunification. When children must be removed, priority is given to placement with kin, both relatives and unrelated persons, with significant relationship to the child before removal.
Florida Statewide Trend Since SFY 2016-17 OHC numbers and placement type usage has been fairly stable with the exceptions of increasing nonrelative care and family licensed care placements.
Circuit/CBC Comparisons Statewide, there is a wide range in use of kinship care, the benefits of which include reduced trauma, maintained familial connections, and reduced costs of care.

Office of Child Welfare Annual Performance Report 2018-19 67
Stable Placements that Maintain Connections Placement Stability In October 2016, the Children’s Bureau issued Technical Bulletin #9 (http://www.acf.hhs.gov/cb/resource/cfsr-technical-bulletin-9), which alerted states to the fact that there were technical errors in the syntax used to calculate the national and state performance data related to placement moves per 1,000 days in foster care. State comparison data associated with the percentage of children with two or fewer placement moves as of September 30, 2016 is provided below as a surrogate measure for state to state comparison around the issue of placement stability while in foster care. Florida Compared to Other States Placement stability as measured by the percentage of children in care with two or fewer placement moves indicates that Florida was firmly in the second quartile of ranked states for the most recent available FFY data.
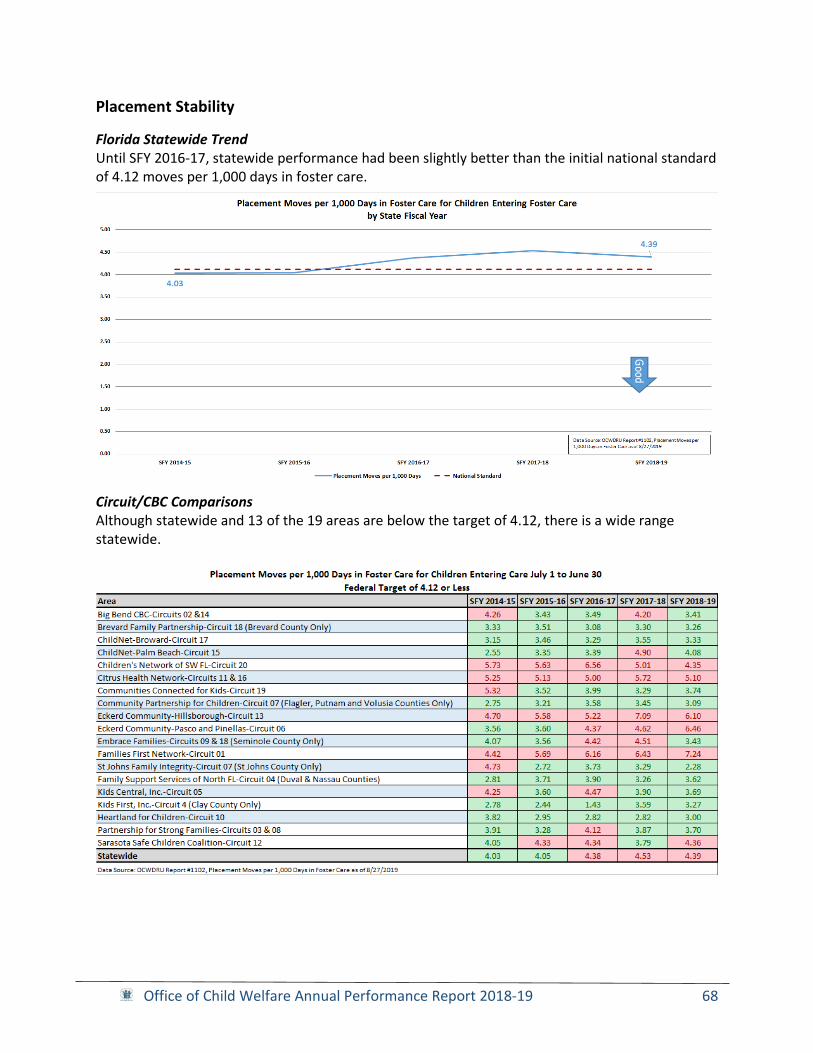
Office of Child Welfare Annual Performance Report 2018-19 68
Placement Stability
Florida Statewide Trend Until SFY 2016-17, statewide performance had been slightly better than the initial national standard of 4.12 moves per 1,000 days in foster care.
Circuit/CBC Comparisons Although statewide and 13 of the 19 areas are below the target of 4.12, there is a wide range statewide.

Office of Child Welfare Annual Performance Report 2018-19 69
Percent of Siblings Placed Together Our understanding of sibling relationships and the role they play in the lives of children in foster care has deepened over the past decade. Research has demonstrated that sibling relationships are important to children’s development and emotional well-being. Sibling relationships are now understood as playing a vital role in helping children achieve developmental milestones and in providing emotional support, companionship, and comfort in times of change. These relationships are crucial for children and youth in foster care as siblings often are the “family” that they can claim and that can provide them with a sense of identity and belonging.
Florida Statewide Trend Statewide performance for this measure has been slowly declining over the last five years and is now below Florida’s own standard of 65 percent.
Circuit/CBC Comparisons Only seven of the 19 CBCs are at or above the 65 percent standard.

Office of Child Welfare Annual Performance Report 2018-19 70
Proximity of Placement to Community of Removal Normalcy for foster children, maintenance of family connections, parent-child visitation, and school stability require that children be placed in proximity of the neighborhood or community of removal. Keeping the child in the same community from which the child was removed will also promote family reunification.
Title IV-E of the Social Security Act (42 U.S.C. 674) requires: “A plan for ensuring the educational stability of the child while in foster care, including . . . assurances that each placement of the child in foster care takes into account the appropriateness of the current educational setting and the proximity to the school in which the child is enrolled at the time of placement; and an assurance [of coordination with] local educational agencies . . . to ensure that the child remains in the school in which the child is enrolled at the time of each placement,” and that “each child has a case plan designed to achieve placement in a safe setting that is the least restrictive (most family like) and most appropriate setting available and in close proximity to the parents' home, consistent with the best interest and special needs of the child.”
Some states use Geographic Information Systems (GIS) to organize and analyze data in terms of geographic location. Most often a visual representation of the data is developed by plotting the data points on a map. For many foster care agencies nationwide, GIS is a powerful tool: it can help agency staff track the location of available foster homes, map the locations of schools and their catchment areas, and allow foster family recruiters to focus their efforts on the areas with the greatest need. Other states focus on recruiting and maintaining foster families within the school districts, with a focus on recruiting in the towns with the highest removal rates, reaching out to principals and administrators of schools to help raise awareness about the need for foster families.
Children in Licensed Out-of-Home Care Placed Outside Removal Circuit and County
Florida Statewide Trend In the last five years, there has been a slight reduction in the percent of children placed outside their removal county and circuit.

Office of Child Welfare Annual Performance Report 2018-19 71
Proximity of Placement to Community of Removal
Circuit/CBC Comparisons
Children in Licensed Out-of-Home Care Placed Outside Removal County There is wide variation across circuits, with urban areas generally placing more children within their removal county, and circuits with larger rural areas placing more children outside their removal county.
Children in Licensed Out-of-Home Care Placed Outside Removal Circuit The percent of children placed outside of their removal circuit is lower than the percent of children placed out-of-county, as many children who are not placed in their home county are placed in a neighboring county within the same circuit.

Office of Child Welfare Annual Performance Report 2018-19 72
Placement in Family Setting Federal law mandates that a case plan include a discussion of how the plan is designed to achieve a safe placement for the child in the least restrictive (most family-like) setting available.
Although there is an appropriate role for group care in the continuum of foster care settings, there is consensus across multiple stakeholders that most children and youth, but especially young children, are best served in a family setting. Stays in group care should be based on the specialized behavioral and mental health needs or clinical disabilities of the child. It should be used only for as long as is necessary to stabilize the child or youth so they can return to a family-like setting. One of the original seven ASFA outcomes was “Reduce placements of young children in group homes or institutions.”
A December 2014 report by the Office of Program Policy Analysis and Government Accountability described the process for determining placement in group care as follows. “Lead agencies must place all children in OHC in the most appropriate available setting after conducting an assessment using child-specific factors. Lead agencies must consider placement in residential group care if specific criteria are met—the child is 11 or older, has been in licensed family foster care for six months or longer and removed from family foster care more than once, and has serious behavioral problems or has been determined to be without the options of either family reunification or adoption. In addition, the assessment must consider information from several sources, including psychological evaluations, professionals with knowledge of the child, and the desires of the child concerning placement.”
Percent of Children in Licensed Care Placed in Group Care
Circuit/CBC Comparisons The proportion of children of all ages in licensed care who are placed in group care ranges from 2.31 percent to over 13.17 percent.

Office of Child Welfare Annual Performance Report 2018-19 73
Children in Group Care by Age Group Florida Statewide Trend The statewide number of children ages 6-12 in group care has increased since 2014 while the other groups have declined.
Circuit/CBC Comparisons
Children Ages 0-5 Years in Licensed Care Placed in Group Care One of the original seven ASFA outcomes was Outcome 7: “Reduce Placements of Young Children in Group Homes or Institutions.” Overall the percentage of very young children placed in group care is generally quite low, with 14 areas having less than 1 percent of children between the ages of 0-5 placed in group care.

Office of Child Welfare Annual Performance Report 2018-19 74
Children Ages 6-12 Years in Licensed Care Placed in Group Care The proportion of children ages 6 to 12 in licensed care who are placed in group care ranges from 1.89 percent to over 16.37 percent.
Children Ages 13-17 Years in Licensed Care Placed in Group Care The proportion of children ages 13 to 17 in licensed care who are placed in group care ranges from 8.20 percent to over 43.17 percent.

Office of Child Welfare Annual Performance Report 2018-19 75
Physical and Mental Health Needs One of Florida’s nine statutory CBC outcomes is “Children Receive Services to Meet their Physical and Mental Health Needs.” Considerable progress has been made in the last few years in providing regular medical and dental services.
Medical Services
Florida Statewide Trend Statewide performance has stabilized in the 97 to 98 percent range for this indicator over the last five years.
Circuit/CBC Comparisons All areas achieved at least 95 percent compliance for this indicator as of June 30, 2019.

Office of Child Welfare Annual Performance Report 2018-19 76
Dental Services Florida Statewide Trend Over the last five years statewide performance for this metric has stabilized in the 92 to 93 percent range, which does not meet the department’s target of 95 percent.
Circuit/CBC Comparisons Ten areas are above the statewide target of 95 percent, with another five areas currently above the 90 percent level on this indicator.

Office of Child Welfare Annual Performance Report 2018-19 77
Preparation for Independent Living as Adults Two of Florida’s nine statutory CBC outcomes are “Children Receive Appropriate Services to Meet their Educational Needs” and “Children Develop the Capacity for Independent Living and Competence as an Adult.”
Young Adults Aging Out Enrolled in Education Programs For children who don’t achieve permanency prior to reaching adulthood, it is crucial that they are prepared for life after foster care by the time they “age out” of care. While education is one indicator of preparation for adulthood, it does not control for any of the many variables that further influence this, including time in care and the child’s education level when entering care.
Circuit/CBC Comparisons All but two areas are above the statewide target of 80 percent.