Embed Size (px)
Citation preview

2019 RiverEyes Monitoring Report
Prepared for: US Bureau of Reclamation, Albuquerque Area Office 555 Broadway NE, Suite 100 Albuquerque, NM 87102
Prepared by: GeoSystems Analysis 3150 Carlisle Blvd. NE, Suite 203 Albuquerque, NM 87110 www.gsanalysis.com

2019 RiverEyes Monitoring Report
GeoSystems Analysis, Inc. ii
THIS PAGE INTENTIONALLY BLANK

2019 RiverEyes Monitoring Report
GeoSystems Analysis, Inc. iii
Document Control Summary Title: 2019 RiverEyes Monitoring Report
Client Company: U.S. Bureau of Reclamation
Client Contact: Dustin Armstrong and Carolyn Donnelly
Status: Final Report
Prime Contractor AJAC Enterprises
Sub-Contractor GeoSystems Analysis, Inc.
GeoSystems Analysis Job #:
1925
Author(s): Chad McKenna
Version Number: 2
Internal Reviewer and Editor
Todd Caplan
Notes: Third draft of this year’s report. Draft 1: for agency review, Draft 2: agency comments addressed, Draft 3: for print
Date: December 12, 2019
Checked By:
Distribution
(Number of Copies):
Client Other GSA Library
1 electronic
This document may contain confidential or privileged information and is intended for the sole use of the person(s) to whom it is addressed. GeoSystems Analysis, Inc., is not liable if this document is altered without its written consent. It may only be used for the purposes for which it was commissioned and in accordance with the terms of the contract.
2019 RiverEyes Monitoring Report
GeoSystems Analysis, Inc. iv
THIS PAGE INTENTIONALLY BLANK

2019 RiverEyes Monitoring Report
GeoSystems Analysis, Inc. v
2019 RiverEyes Monitoring Report
Citation
McKenna, C. 2019. 2019 RiverEyes Monitoring Report. Prepared for U.S. Bureau of Reclamation,
Albuquerque Area Office. Prepared by GeoSystems Analysis, Inc., under Sub-Contract with
AJAC Enterprises. Albuquerque, NM.
Name Affiliation Role
Chad McKenna GeoSystems Analysis, Inc. Ecologist, Data Manager, and Lead Author
Todd Caplan GeoSystems Analysis, Inc. Senior Ecologist, Report Review
Acknowledgments
Several individuals were key to the success of this project. Thank you especially to the dedicated field
crew --- Sarah Reuter, Gabriel Parrish, Marcus Silva, Daniel Dolce, and Kyle Gallant. Thanks to the
Reclamation water operations team --- Carolyn Donnelly, Ed Kandl, Dustin Armstrong, Rick Young, and
Raymond Abeyta for recommendations and insights into previous channel drying trends. Thanks to
Thomas Archdeacon from Fish and Wildlife Service for sharing project improvement ideas. Anthony
Orio, AJAC project foreman, managed the contracting effort. Middle Rio Grande Conservancy District
provided gate keys and access permission for lands under their jurisdiction.

2019 RiverEyes Monitoring Report
GeoSystems Analysis, Inc. vi
Table of Contents Document Control Summary ........................................................................................................ iii
EXECUTIVE SUMMARY .................................................................................................................. 1
INTRODUCTION ............................................................................................................................. 2
METHODS ...................................................................................................................................... 6
Daily Reconnaissance ................................................................................................................ 6
Discharge Measurements ......................................................................................................... 7
Daily Reports ............................................................................................................................. 8
Data Management .................................................................................................................... 8
Safety ........................................................................................................................................ 9
RESULTS ........................................................................................................................................ 9
Daily Reconnaissance ................................................................................................................ 9
DISCUSSION ................................................................................................................................ 11
REFERENCES ................................................................................................................................ 12
Tables Table 1. River segments affected by drying in each reach with important dates and maximum dried extent. ................................................................................................................................. 2 Table 2. Total number of river miles affected by drying in the Isleta and San Acacia Reaches (adapted and expanded from USFWS 2016) ................................................................................. 5 Table 3. Summary of RiverEyes channel drying observations in the San Acacia Reach during 2019. ........................................................................................................................................... 10
Figures Figure 1. Map showing the location of Isleta and San Acacia Reaches of the Middle Rio Grande plus other landmarks mentioned in this report. ........................................................................... 4 Figure 2. Sample RiverEyes field maps from the 2019 monitoring season. When accessed via the Avenza Maps app, current field location is clearly marked with a large blue dot and the interface allows for panning, zooming, etc. .................................................................................. 7
2019 RiverEyes Monitoring Report
GeoSystems Analysis, Inc. vii
Appendices Appendix A. Longitudinal Limits of Drying and Mean Daily Discharge as Reported by USGS for Various Gages in the Isleta and San Acacia Reaches (note that discharge data are provisional)
Appendix B. AJAC Job Safety Analysis Forms
Appendix C. 2019 Pumping Operations
Appendix D. 2019 RiverEyes Landmark River Miles
Appendix E. Detailed Observation Tables (2019 Raw Data)
2019 RiverEyes Monitoring Report
GeoSystems Analysis, Inc. 1
EXECUTIVE SUMMARY AJAC Enterprises (AJAC) was contracted by the U.S. Bureau of Reclamation (Reclamation) to conduct daily river monitoring and reporting during 2019 as part of a cooperative interagency effort to document channel drying in the Middle Rio Grande (MRG). The monitoring effort verifies important compliance elements within the 2016 Biological Opinion, as it relates to Reclamation, Bureau of Indian Affairs, and Non-Federal Water Management and Maintenance Activities on the Middle Rio Grande, specifically Reasonable and Prudent Measure 4, and Terms and Conditions 3.2, 9.1 and 9.2. When river discharges reached key thresholds that can trigger flow intermittency, field reconnaissance observations were relayed to an interagency water management team and, particularly when flow intermittency was detected; reported to the U.S. Fish and Wildlife Service (USFWS) to support endangered Rio Grande Silvery Minnow (Hybognathus amarus) rescue and relocation activities. GeoSystems Analysis, Inc. (GSA) was subcontracted by AJAC to assist with project reporting and provide training and technical support on the project.
The U.S. Geological Survey (USGS) maintains a network of streamflow monitoring stations throughout the MRG that publish real-time, provisional streamflow volumes to the internet (e.g. https://waterdata.usgs.gov/nm/nwis/current/?type=flow). Per the contractual agreement with Reclamation, field reconnaissance within specific high risk segments of the MRG is required when streamflow discharge is below 300 cubic feet per second (cfs) at USGS 08354900 Rio Grande Floodway at San Acacia, New Mexico (NM), or below 80 cfs at USGS 08331160 Rio Grande Near Bosque Farms, NM. During 2019, stream flows fell below this threshold in the San Acacia Reach beginning on August 24 and the monitoring team conducted regular field reconnaissance from August 26 through October 11. Flows never fell below the 80 cfs threshold at Bosque Farms, thus monitoring was never required or implemented in the Isleta Reach during 2019. Also under contract with Reclamation, AJAC pumped supplemental water into the Rio Grande mainstem near the Bosque del Apache Wildlife Refuge (BDA) south boundary from August 25, 2019 through October 5, 2019, except for a period between September 17, 2019 to September 23, 2019.
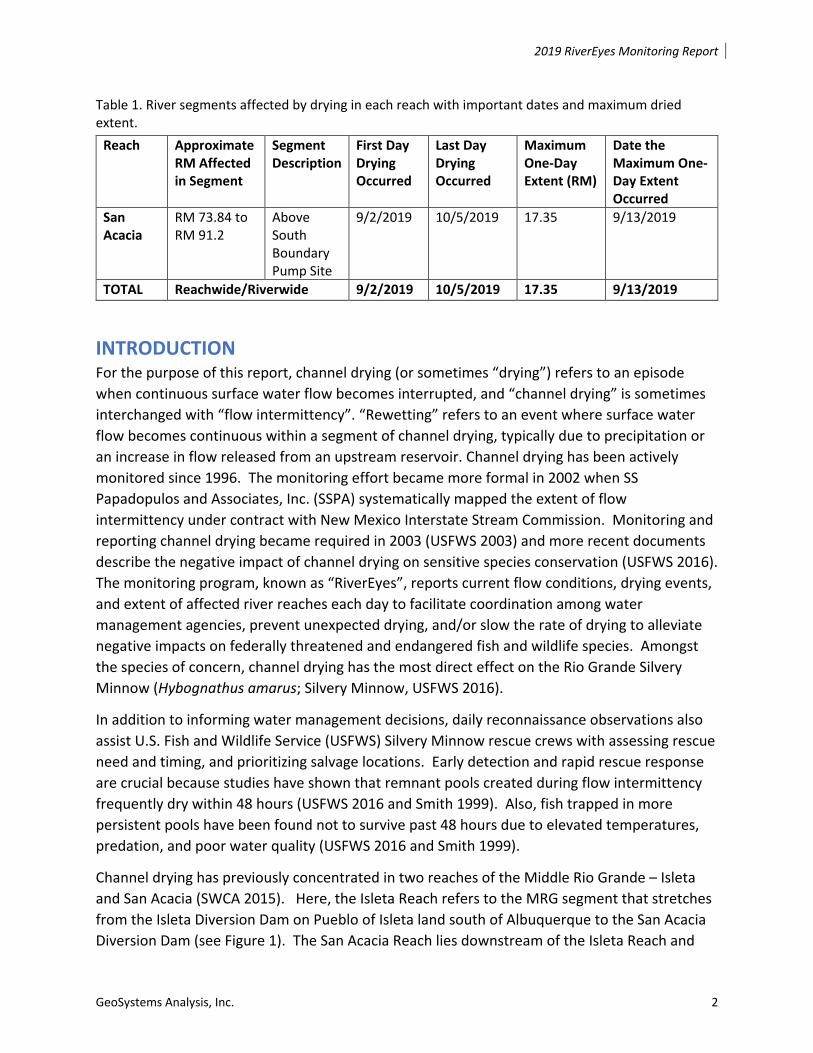
Channel intermittency also frequently affects the Isleta Reach, and occasionally additional segments of the San Acacia Reach during irrigation season (e.g. McKenna, 2018), however, flow interruption only occurred in one segment of the San Acacia Reach in 2019. Drying was first observed on September 2, 2019. A sediment plug that formed in the mainstem channel during high spring runoff flows, plus Reclamation’s pilot channel excavation project that rerouted streamflow around the sediment plug, created unique conditions during 2019. The last day that drying occurred was October 5, 2019. Table 1 summarizes relevant dates and the maximum extent dry. The total number of unique river miles (RM) affected by drying was 17.36 while the maximum one-day dried extent was slightly lower (17.35 RM). Field crews detected drying during 25 days of the monitoring season.
2019 RiverEyes Monitoring Report
GeoSystems Analysis, Inc. 2
Table 1. River segments affected by drying in each reach with important dates and maximum dried extent.
Reach Approximate RM Affected in Segment
Segment Description
First Day Drying Occurred
Last Day Drying Occurred
Maximum One-Day Extent (RM)
Date the Maximum One-Day Extent Occurred
San Acacia
RM 73.84 to RM 91.2
Above South Boundary Pump Site
9/2/2019 10/5/2019 17.35 9/13/2019
TOTAL Reachwide/Riverwide 9/2/2019 10/5/2019 17.35 9/13/2019
INTRODUCTION For the purpose of this report, channel drying (or sometimes “drying”) refers to an episode when continuous surface water flow becomes interrupted, and “channel drying” is sometimes interchanged with “flow intermittency”. “Rewetting” refers to an event where surface water flow becomes continuous within a segment of channel drying, typically due to precipitation or an increase in flow released from an upstream reservoir. Channel drying has been actively monitored since 1996. The monitoring effort became more formal in 2002 when SS Papadopulos and Associates, Inc. (SSPA) systematically mapped the extent of flow intermittency under contract with New Mexico Interstate Stream Commission. Monitoring and reporting channel drying became required in 2003 (USFWS 2003) and more recent documents describe the negative impact of channel drying on sensitive species conservation (USFWS 2016). The monitoring program, known as “RiverEyes”, reports current flow conditions, drying events, and extent of affected river reaches each day to facilitate coordination among water management agencies, prevent unexpected drying, and/or slow the rate of drying to alleviate negative impacts on federally threatened and endangered fish and wildlife species. Amongst the species of concern, channel drying has the most direct effect on the Rio Grande Silvery Minnow (Hybognathus amarus; Silvery Minnow, USFWS 2016).
In addition to informing water management decisions, daily reconnaissance observations also assist U.S. Fish and Wildlife Service (USFWS) Silvery Minnow rescue crews with assessing rescue need and timing, and prioritizing salvage locations. Early detection and rapid rescue response are crucial because studies have shown that remnant pools created during flow intermittency frequently dry within 48 hours (USFWS 2016 and Smith 1999). Also, fish trapped in more persistent pools have been found not to survive past 48 hours due to elevated temperatures, predation, and poor water quality (USFWS 2016 and Smith 1999).
Channel drying has previously concentrated in two reaches of the Middle Rio Grande – Isleta and San Acacia (SWCA 2015). Here, the Isleta Reach refers to the MRG segment that stretches from the Isleta Diversion Dam on Pueblo of Isleta land south of Albuquerque to the San Acacia Diversion Dam (see Figure 1). The San Acacia Reach lies downstream of the Isleta Reach and

2019 RiverEyes Monitoring Report
GeoSystems Analysis, Inc. 3
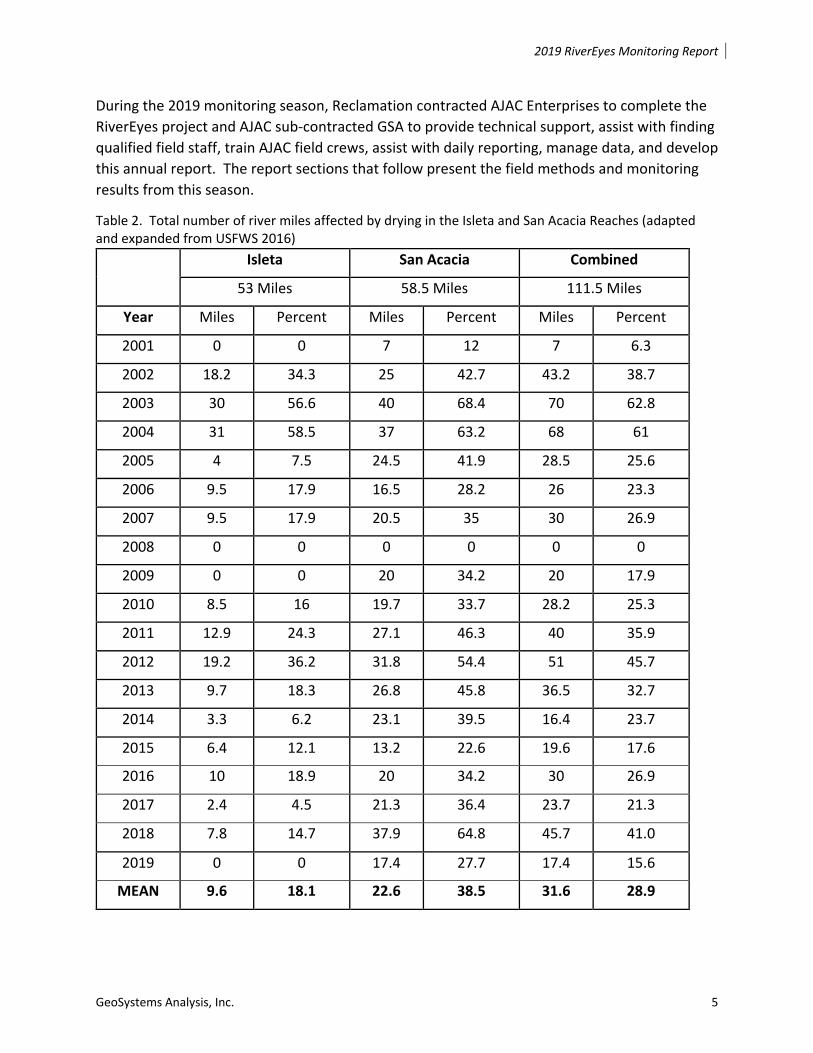
extends from the San Acacia Diversion Dam to Elephant Butte Reservoir. On average, drying is more frequent, extensive, and of longer duration in the San Acacia Reach than the Isleta Reach (Table 2).
Per USFWS 2016 and based on RiverEyes project data collected since then, an average of 32 miles of the Rio Grande has dried each year from 2001 to 2018. Based on previous RiverEyes project observations, approximate river mile (RM) segments with highest drying probability are as follows (per USFWS 2016 and various SWCA RiverEyes reports, e.g. SWCA 2015). Note that Appendix D includes a table showing specific RM locations for landmarks mentioned in this report and throughout the 2019 monitoring season.
Isleta Reach --- Two segments:
1. A section near Tomé, NM, approximately between the Los Chavez Wasteway and the Peralta Wasteway (approximately RM 150 to 155)
2. Downstream near the Abeytas Heading above U.S. Highway 60 Bridge in Bernardo, NM (approximately RM 127 to 132).
San Acacia Reach --- One segment from near Brown Arroyo (Socorro, NM) downstream to the pump site near the BDA south boundary (this segment extends from RM 74 to 105).

2019 RiverEyes Monitoring Report
GeoSystems Analysis, Inc. 4
Figure 1. Map showing the location of Isleta and San Acacia Reaches of the Middle Rio Grande plus other landmarks mentioned in this report.
2019 RiverEyes Monitoring Report
GeoSystems Analysis, Inc. 5
During the 2019 monitoring season, Reclamation contracted AJAC Enterprises to complete the RiverEyes project and AJAC sub-contracted GSA to provide technical support, assist with finding qualified field staff, train AJAC field crews, assist with daily reporting, manage data, and develop this annual report. The report sections that follow present the field methods and monitoring results from this season.
Table 2. Total number of river miles affected by drying in the Isleta and San Acacia Reaches (adapted and expanded from USFWS 2016)
Isleta San Acacia Combined
53 Miles 58.5 Miles 111.5 Miles
Year Miles Percent Miles Percent Miles Percent
2001 0 0 7 12 7 6.3
2002 18.2 34.3 25 42.7 43.2 38.7
2003 30 56.6 40 68.4 70 62.8
2004 31 58.5 37 63.2 68 61
2005 4 7.5 24.5 41.9 28.5 25.6
2006 9.5 17.9 16.5 28.2 26 23.3
2007 9.5 17.9 20.5 35 30 26.9
2008 0 0 0 0 0 0
2009 0 0 20 34.2 20 17.9
2010 8.5 16 19.7 33.7 28.2 25.3
2011 12.9 24.3 27.1 46.3 40 35.9
2012 19.2 36.2 31.8 54.4 51 45.7
2013 9.7 18.3 26.8 45.8 36.5 32.7
2014 3.3 6.2 23.1 39.5 16.4 23.7
2015 6.4 12.1 13.2 22.6 19.6 17.6
2016 10 18.9 20 34.2 30 26.9
2017 2.4 4.5 21.3 36.4 23.7 21.3
2018 7.8 14.7 37.9 64.8 45.7 41.0
2019 0 0 17.4 27.7 17.4 15.6
MEAN 9.6 18.1 22.6 38.5 31.6 28.9

2019 RiverEyes Monitoring Report
GeoSystems Analysis, Inc. 6
METHODS Daily Reconnaissance Daily reconnaissance and reporting of locations affected by channel drying was conducted by field crews when provisional real-time flow reported on the USGS streamflow website (https://waterdata.usgs.gov/nm/nwis/current/?type=flow) was below specific thresholds. Reconnaissance of the San Acacia Reach occurred whenever the San Acacia gage (Station 08354900) was below 300 cfs. Field staff also periodically checked flow conditions on days when the reported discharge exceeded that threshold if 1) requested by Reclamation, 2) drying had been detected during the previous couple days, 3) recent field observations suggested that channel intermittency was highly possible, or 4) gage readings on the USGS website were suspect. Per contractual requirements, field reconnaissance would have also been completed in the Isleta Reach whenever the USGS reported less than 80 cubic feet per second (cfs) at the Bosque Farms gage (Station 08331160), but flows remained above that threshold throughout the 2019 monitoring season.
Field crews drove the riverbed in the survey reaches with an all-terrain vehicle (ATV) when channel conditions allowed but mud, deep water, high flow velocity, obstructed riverbed access due to steep banks or dense vegetation, saturated floodplains, and/or quicksand often necessitated monitoring via foot. Reconnaissance began at daybreak, so observations could be relayed to agencies early enough (before 8 A.M. whenever possible) to inform water operational adjustments and daily fish rescue activities. If drying was detected, affected extents were communicated via text messages sent to Reclamation staff and the USFWS Fish Rescue Coordinator. A more comprehensive email summary was also transmitted on most days during the monitoring season.
To ensure safety, reporting accuracy, and consistency between field observers; field staff also regularly conveyed observations during internal team (AJAC/GSA) phone calls. A RiverEyes team member participated in regular water operations conference calls (generally Monday and Friday) to communicate the primary field observations from that morning, including dried extent, and listen to proposed water operational changes.
Field observations were documented on an iPad tablet connected to a Bluetooth Global Positioning System (GPS; Garmin Glo, consistently ~10-foot accuracy). Field proximity was determined to the nearest 0.01 river mile using a spatially referenced .pdf base map accessed via Avenza Maps (https://www.avenza.com/avenza-maps/). To enable placement to this precision, various utilities and addons to ESRI ArcMap were utilized to clean and re-segment the 2012 Reclamation RM Geographic Information System (GIS) file into half-mile, tenths, and hundredths of a mile symbols on the electronic field map (Figure 2).
River segments with a historically high drying probability were denoted on the electronic field map with a red-colored river centerline to assist field staff with targeting “hot spots” to check during low flow conditions. The map also displayed adjacent land ownership, irrigation

2019 RiverEyes Monitoring Report
GeoSystems Analysis, Inc. 7
infrastructure, landmarks, wasteways, interior drains, municipalities, arroyos, rangelines, roads, streamflow gages, important river access locations, etc. Locating nearby rangelines (Reclamation’s long-term hydrographic survey cross-sections) was especially important when surveying by foot because dense vegetation may have been recently cleared along the rangeline from the levee to river, which improved accessibility.
Field crews recorded daily field observations into a customized mobile application (app) specially developed for storing RiverEyes data. All field observations were registered with underlying GPS coordinates (automatically marked by the app), as well as the nearest 0.01 RM, which was keyed in by the field observer. If the riverbed was navigable, the crew sometimes drove the intermittent riverbed segment to check for presence of remnant pools, but determining the dry length was the main priority each day.
Figure 2. Sample RiverEyes field maps from the 2019 monitoring season. When accessed via the Avenza Maps app, current field location is clearly marked with a large blue dot and the interface allows for panning, zooming, etc.
Discharge Measurements The RiverEyes field crew quantified current river discharge (in cfs) using three methods with varying degrees of accuracy and precision: 1) metered discharge measurements, 2) ball and tape discharge measurements, and 3) visual estimates. Field crews were prepared to meter flow volume at wasteway outfalls, near USGS gages, and at other locations (per RiverEyes contract requirements) with a SONTEK FlowTracker 2, if requested by Reclamation. In 2019, however, metered discharge measurements were not requested.

2019 RiverEyes Monitoring Report
GeoSystems Analysis, Inc. 8
Field crews frequently measured flow using a measuring tape, depth rod, small floating ball (e.g. golf ball), and stopwatch (per EPA 1997). With this method, the observer measured the width of wetted flow perpendicular to the flow angle to the nearest foot. Depth was measured with to the nearest 0.1 foot at four locations selected across the wetted channel intended to constitute mean depth. These width and depth measurements were then multiplied together to calculate the approximate cross-section area. Flow velocity was measured by timing the number of seconds required for a golf ball to float down a 20-foot section of the channel. The RiverEyes field app calculated discharge by multiplying velocity by the cross-sectional area and a typical correction factor (0.9) that is used when measuring discharge with this method.
Ball and tape measurements were frequently used to help the field crew perform better visual estimates of flow. When visual flow estimates were recorded, no systematic measurements occurred. The field observer simply recorded their minimum and maximum flow estimate (in cfs) while the field app calculated and recorded the mean as the visual estimate.
Daily Reports Email and text summaries were regularly circulated between the contractors, Reclamation, and USFWS when low flow conditions warranted. The River Eyes team also reported current conditions during water operations conference calls. Daily email reports (submitted electronically with this report) focused on:
• the extent of drying as number of RMs and distance to major landmarks; • the RM change of drying or rewetting over the past 24 hours; • accessibility; • current river conditions; • visual flow estimates in “hot spots” or other locations that might be useful for predicting
flow trends or intermittency risk; • observations of disconnected lateral pools; • summarizing USGS reported flows at USGS gages over the past 24 hours; and, • 24-hour precipitation in the Rio Grande watershed (per Reclamation’s ET Toolbox,
https://www.usbr.gov/uc/albuq/water/ETtoolbox/rg/riog/rgindexnt.html) as it affects channel drying.
Data Management The mobile data form was developed specifically for this project in the Fulcrum app (www.fulcrumapp.com) and it contained various design elements to promote data quality and improve efficiency. The app was set up to store the extent of drying, visual estimates of flow, and general observations. Data format, visible data elements, relevant lists, and the overall app display change according to the type of observation being logged. Data were synched between monitoring staff in the field using a utility that automatically packages data across users and

2019 RiverEyes Monitoring Report
GeoSystems Analysis, Inc. 9
devices, and uploads data to the cloud so reconnaissance observations, monitoring locations, and photos are safely backed up and accessible for other field personnel and/or office staff, even in real-time.
The DVD that accompanies this report includes:
• Raw and post-processed 2019 data files as .xls, raw data as shp; • Spatially-referenced .pdf map files that can be used on tablets and/or smartphones to
determine the nearest 0.01 RM to your current location while conducting fieldwork; • RiverEyes landmarks (shp); • Daily email summaries (pdf); • Field photos; and • This report as .doc and .pdf.
Safety AJAC drafted a Job Hazard Analysis (JHA) for this project (see Appendix B). Field personnel certified that they reviewed the document and complied with the JHA requirements in practice each day. All staff who operated ATVs received a formal safety instruction and certification. Motor vehicle and ATV inspections were conducted at the start of each day. Field personnel communicated between themselves regularly and checked in with the safety officer and/or other AJAC/GSA staff via phone call or text message after daily monitoring responsibilities were finished. All safety guidelines were followed, and no injuries occurred on the project.
RESULTS Daily Reconnaissance Channel drying was only detected in the San Acacia Reach during the 2019 monitoring season. Drying began in the San Acacia Reach on September 2 and the last day of drying was October 5. Based on provisional data from the USGS, mean daily discharge at the San Acacia gage was 97 cfs on the first day that drying occurred in the San Acacia Reach. The total number of river intermittency days in the San Acacia Reach during 2019 was 25 (Table 3). The San Acacia Reach dried and reconnected twice in 2019. These two drying events were separated by a temporary flow spike resulting from a mid-September rainstorm. The longest consecutive drying event in the San Acacia Reach was 15 days (September 2 to September 16).; Refer to Figures in Appendix A for information on the extent and duration of each drying event). The greatest extent of drying occurred on September 13 when the dry length reached 17.35 RM.
During most irrigation seasons, supplemental pumping at the BDA south boundary (approximately RM 74) augments river flow and maintains continuous surface water flow downstream from that location. Water is pumped from the LFCC into a spur canal and routed directly into the Rio Grande mainstem channel to prevent drying. In 2019, pumping began on

2019 RiverEyes Monitoring Report
GeoSystems Analysis, Inc. 10
August 25 and ran continuously until September 17 when flows spiked after a rainstorm and Reclamation directed AJAC to stop pumping temporarily. The pumps were turned back on during the afternoon of September 23 and ran until October 5 when pumping ceased for the season following a rain event and a water management decision to begin moving water stored in upstream reservoirs down to Elephant Butte.
Table 3. Summary of RiverEyes channel drying observations in the San Acacia Reach during 2019.
San Acacia Reach
Month Total Number of Intermittent Days
Maximum Length (RM)
Mean Length (RM)
Sep 20 17.4 7.3 Oct 5 10.4 1.3 Grand Total 25 17.4 4.3
When channel drying expanded into new segments, remnant pools often formed in the thalweg, scour holes, and/or other depressional features. After a more prolonged period of dewatering (typically after a few days to a week), remnant pools dried, creating an entirely dry riverbed. The presence, size, and location of remnant pools were sometimes (though inconsistently) recorded and often communicated to the managing agencies via daily emails; however, RM locations where remnant pools entirely dried were not systematically differentiated from segments where remnant pools persisted during fieldwork. Summary emails and raw data provided electronically with this report include crew observations related to the distribution and size of remnant pools observed during 2019. Note that these data are not intended to represent a complete log of remnant pools in the channel during the season. Raw monitoring data are included in Appendix E.
2019 RiverEyes Monitoring Report
GeoSystems Analysis, Inc. 11
DISCUSSION The Rio Grande watershed had above average snowpack during the winter 2018-2019, and spring runoff produced sustained, high volume flows. The 2019 snow-water equivalent in the upper watershed was comparable to the wettest years on recent record (1992, 1995, and 2005; Reclamation 2019). Mean daily discharge at the USGS Albuquerque gage was consistently above 2,000 cfs from March 29, 2019, through July 16, 2019, and peaked at 5,470 cfs on June 18, 2019. The San Acacia gage (08354900) also recorded above average discharge, which peaked at 4,400 cfs on June 19, 2019.
Continuous flow was maintained through the Isleta Reach during 2019, and this was the first year that no channel drying occurred since 2009. Although channel drying did occur in the San Acacia Reach, the onset was later and the duration and extent of drying was shorter in 2019 than previous years, particularly compared to 2018. In 2019, the San Acacia Reach initially dried on September 2 compared with April 1 during 2018, and a total of 17.4 and 37.9 RM dried in 2019 versus 2018, respectively.
Channel and flow conditions in the San Acacia Reach were influenced by two significant factors during 2019: sediment plug formation and the channel realignment project at BDA. The sediment plug formed between RM 81 to RM 79.7 near the upstream end of the channel realignment pilot channel. By August, the plug had forced all flows from the mainstem channel onto the east and west floodplain. This resulted in dry channel segments until flows returned from the floodplain to the channel at various locations. Flow drained back to the mainstem channel from the eastside floodplain via drainage features at RM 79.15 and RM 76.17, and from the west floodplain at a low water crossing recently created in the San Pasqual Burn (RM 74.7) as well as at the south boundary pump channel. Drainage from the west floodplain ceased by late August and standing water remained on large portions of the west floodplain for nearly a month. Floodplain drainage features continued to return water to the mainstem channel from the east side through mid-September.
Reclamation began excavating a pilot channel to convey flows around the sediment plug in early September 2019. The pilot channel footprint extended from approximately RM 81.3 to RM 79.5. Heavy rainstorms on October 4, 2019 reconnected flow in the San Acacia Reach on the morning of October 6, 2019. RiverEyes crews confirmed that the pilot channel was conveying water through its entire length and flows were able to reenter the mainstem channel from the pilot channel outlet and via the RM 79.15 and RM 76.17 floodplain drainage features. Since the pilot channel could pass flows around the plug, water management agencies decided during an October 7, 2019, water operations conference call to begin moving water from upstream reservoirs to Elephant Butte. The RiverEyes monitoring team continued to confirm flow continuity until October 11, 2019, when the monitoring season ended.
2019 RiverEyes Monitoring Report
GeoSystems Analysis, Inc. 12
REFERENCES McKenna, C. 2018. 2018 RiverEyes Monitoring Report. Report developed by GeoSystems Analysis under sub-contract with AJAC Enterprises. Parties contracted by U.S. Bureau of Reclamation Albuquerque Area Office, Albuquerque, New Mexico. 14 pages.
U.S. Bureau of Reclamation (Reclamation). 2019. 2019 Annual Operating Plan. Albuquerque Area Office, Albuquerque, New Mexico. Reviewed as a PowerPoint presentation. 45 pages.
Smith, J.R. 1999. Summary of Rio Grande Investigations for FY1997. Draft. U.S. Fish and Wildlife Service Report Submitted to the U.S. Bureau of Reclamation, Albuquerque, New Mexico.
SS Papadopulos and Associates, Inc. (SSPA). 2004. ESRI geodatabase containing RiverEyes project observations between 2002 and 2004.
SWCA Environmental Consultants (SWCA). 2015. RiverEyes Observations in the Middle Rio Grande for the 2015 Irrigation Season.
U.S. Environmental Protection Agency (EPA). 1997. Volunteer Stream Monitoring: A Methods Manual. EPA document EPA 841-B-97-003.
U.S. Fish and Wildlife Service (USFWS). 1994. Endangered and threatened wildlife and plants; Final rule to list the Rio Grande Silvery Minnow as an endangered species. Federal Register 59:36,988–37,001.
USFWS. 2003. Biological and conference opinions on the effects of actions associated with the Programmatic Biological Assessment of Bureau of Reclamation’s Water and River Maintenance Operations, Army Corps of Engineers Flood Control Operation, and Related Non-Federal Actions on the Middle Rio Grande, New Mexico. Consultation No. 2-22-03-F-0129. New Mexico Ecological Services Field Office, Albuquerque, New Mexico.
USFWS. 2016. Final Biological and Conference Opinion for Bureau of Reclamation, Bureau of Indian Affairs, and Non-Federal Water Management and Maintenance Activities on the Middle Rio Grande. Consultation Number 02ENNM00-2013-F-0033. New Mexico Ecological Services Field Office, Albuquerque, New Mexico.