Embed Size (px)
Citation preview
2019 Sustainability Report EOG Resources
com
mitm
ent t
osu
stai
nabi
lity

| 1
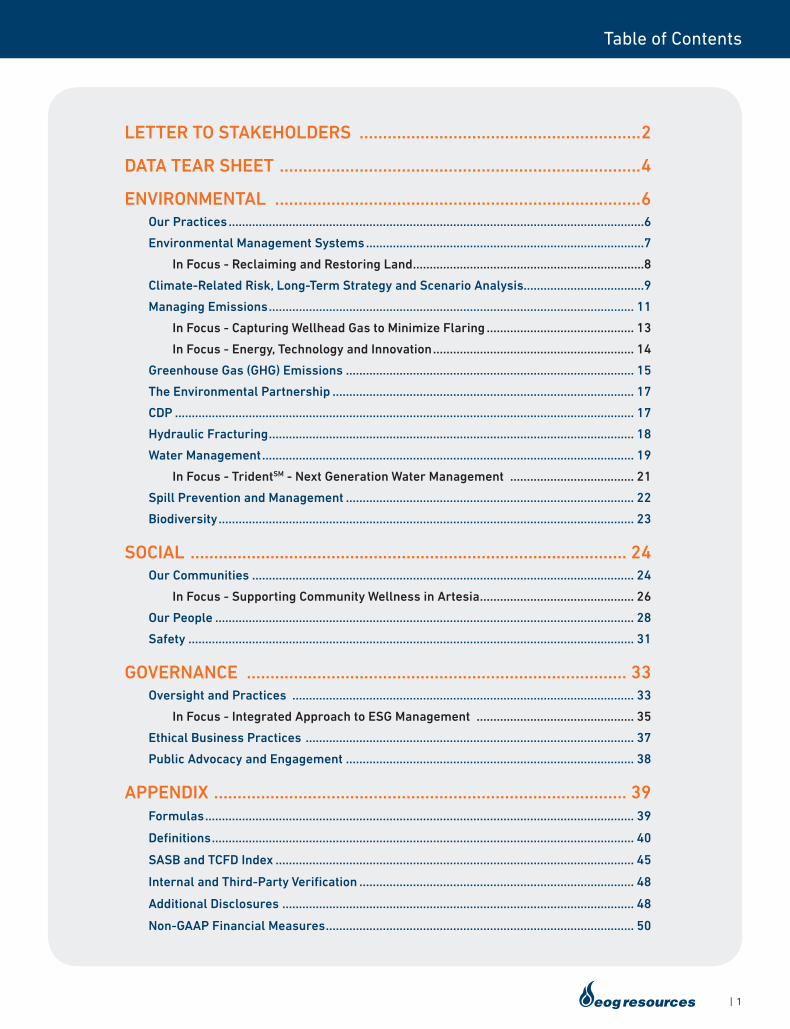
Table of Contents
LETTER TO STAKEHOLDERS ............................................................2
DATA TEAR SHEET .............................................................................4
ENVIRONMENTAL ..............................................................................6Our Practices ............................................................................................................................6
Environmental Management Systems ...................................................................................7
In Focus - Reclaiming and Restoring Land .....................................................................8
Climate-Related Risk, Long-Term Strategy and Scenario Analysis....................................9
Managing Emissions ............................................................................................................. 11
In Focus - Capturing Wellhead Gas to Minimize Flaring ............................................ 13
In Focus - Energy, Technology and Innovation ............................................................ 14
Greenhouse Gas (GHG) Emissions ...................................................................................... 15
The Environmental Partnership .......................................................................................... 17
CDP ......................................................................................................................................... 17
Hydraulic Fracturing ............................................................................................................. 18
Water Management ............................................................................................................... 19
In Focus - TridentSM - Next Generation Water Management ..................................... 21
Spill Prevention and Management ...................................................................................... 22
Biodiversity ............................................................................................................................ 23
SOCIAL ............................................................................................. 24Our Communities .................................................................................................................. 24
In Focus - Supporting Community Wellness in Artesia .............................................. 26
Our People ............................................................................................................................. 28
Safety ..................................................................................................................................... 31
GOVERNANCE ................................................................................. 33Oversight and Practices ...................................................................................................... 33
In Focus - Integrated Approach to ESG Management ............................................... 35
Ethical Business Practices .................................................................................................. 37
Public Advocacy and Engagement ...................................................................................... 38
APPENDIX ........................................................................................ 39Formulas ................................................................................................................................ 39
Definitions .............................................................................................................................. 40
SASB and TCFD Index ........................................................................................................... 45
Internal and Third-Party Verification .................................................................................. 48
Additional Disclosures ......................................................................................................... 48
Non-GAAP Financial Measures ............................................................................................ 50
2 |
Dear Stakeholder,
EOG is a resilient company with a commitment to being an innovative leader in sustainability. As we respond to the historic oil price collapse caused by the COVID-19 pandemic, we believe we will demonstrate just how resilient, innovative and committed to sustainability we are. Like every other downturn, we are confident EOG will emerge a stronger global competitor, uniquely positioned with our sustainable business model that will continue to create value for our shareholders.
What drives our confidence is the EOG culture – our number one competitive advantage. Core to our culture is a collaborative work environment where employees’ ideas are valued and shared across the company. Our focus during the pandemic has been to preserve that aspect of our culture by ensuring employees remained connected to each other while working from home. We worked quickly to provide structure, support and resources to maintain EOG’s sense of community and collaboration within and between our local operating areas and corporate-wide teams.
We had a head start. For more than a decade, we have built a vast information technology infrastructure to capture and control our data from creation in the field to delivery to the end user. We designed proprietary end-user applications, built in-house, that prioritize usability and transparency. Over the last several years, our end-user applications have become increasingly mobile and real-time, enabling remote work for functions employees had historically performed in the office.
Beyond the pandemic, 2020 has also challenged us to evaluate and further our commitment to fostering diversity and inclusiveness. We have long valued diversity of thought and background to drive collaborative, cross-functional teamwork. In the spirit of continuous improvement that
Letter to Stakeholders
defines how EOG operates, we know we can do even better. EOG will seek to bolster our collaborative work environment by fostering more inclusiveness and diversity in our workforce. As an initial step, we are establishing a working group to engage employees at the grass-roots level to generate ideas. We are also taking a fresh look at our college recruiting program to ensure that we partner with universities and programs to produce the most talented and diverse pool of candidates. We will look for opportunities to expand our support of STEM education overall and to programs that target under-served communities similar to our current work with the IPAA/PESA Energy Education Foundation and the work-study program with Cristo Rey Jesuit college preparatory school. Over time, we are confident that these efforts will help improve on what we believe is already the best culture in the business.
I am incredibly proud of our employees’ focus on execution this year during an unprecedented level of uncertainty. However, I don’t want it to overshadow the great work accomplished last year. In 2019, we once again improved our ESG performance:
• GHG Emissions Intensity Rate – We reduced our GHG intensity rate 16 percent.
• Emissions Efficiency – We reduced our emissions intensity rates across all significant GHG sources - combustion, flaring and pneumatics.
• Water Intensity Rate and Fresh Water Use – We decreased our water intensity rate and, more importantly, decreased our fresh water use by nearly 30 percent.
• Methane Emissions Intensity Rate – Our ongoing program to retrofit or remove pneumatics continues to significantly reduce methane emissions. These efforts resulted in another year-over-year reduction in our methane emissions intensity rate, achieving our 2019 qualitative reduction target.
• Safety – We decreased our total recordable incident rate by almost 30 percent and our total lost time incident rate by 24 percent.
• ESG Tied to Executive Compensation – We added the reduction of our GHG and methane emissions intensity rates to the operational performance goals that determine our executives’ annual bonuses. For 2020, we have established a separately weighted, ESG-specific performance goal that includes the reduction of our GHG, methane and flaring emissions intensity rates, recordable incident rate and oil spill rates.
“What drives our confidence
is the EOG culture - our number one competitive advantage.”
| 3
Looking forward, we expanded our efforts to be a leader in returns-focused GHG reduction by establishing the EOG Sustainable Power Group to drive a new strategic initiative to identify and implement low-emissions electricity generation to power our field-level operations. The Sustainable Power Group will bring forward new ideas quickly and cost effectively in support of a goal to reduce our carbon footprint with favorable economics. We are excited to learn more from the group’s first pilot project – an eight-megawatt solar and natural gas hybrid electric power station which was initiated in 2019 and became operational in the third quarter 2020.
EOG has a long history of adapting to changing industry conditions and using technology to improve the company. We are confident that our sustainable power initiative will be another area in which EOG will lead the way in finding better methods to generate power, while reducing our impact on the environment and generating a healthy rate of return.
In addition to our ESG performance improvements last year, I also want to highlight a number of expanded ESG commitments and disclosures new to this report which were developed based on our discussions with stakeholders:
• Quantitative Methane Emissions Target – We established a longer-term, quantitative methane reduction target. Our goal is to reduce our methane emissions percentage to 0.06 by 2025.
• Quantitative GHG Emissions Target – We further expanded our commitment to reducing emissions by also establishing a target to reduce our GHG emissions intensity rate to 13.5 by 2025.
• Water Sources Disclosure – We expanded our water use disclosures by categorizing our intensity rates into fresh, non-fresh and reuse going back to 2017, to provide stakeholders a more complete picture of our water management practices.
• Community Safety and Security – We enhanced our disclosures on our community safety and security initiatives, including our efforts to raise awareness and conduct training regarding the prevention of human trafficking.
• New Topics – We added and expanded discussions on a number of new topics, including flaring, biodiversity and land reclamation, as well as our director skills and experience matrix.
• SASB and TCFD – We provided a reference index of our SASB and TCFD-related disclosures.
Finally, our employees who live and work in our operating areas continued to develop innovative ways to engage with local organizations on charitable and environmental projects. We donated money and time to help build a new aquatic center in Artesia, New Mexico. In Wyoming, we partnered with University of Wyoming students to plant nearly 2,000 sagebrush seedlings to accelerate the restoration of native grasslands. In addition, we converted a reclaimed wellsite in New Mexico’s Permian Basin to a campsite, providing easy road access to two national parks. This is just a sample of the In Focus highlights in this year’s report.
Looking ahead, we believe oil and gas will be critical to the future of global energy supply. Responsible oil and gas production can and should be part of the long-term solution to address emissions while also providing reliable, affordable energy to a growing global population. Our employees have embraced the company’s emissions reduction efforts and I’m excited to see how EOG’s culture of innovation and technology will continue to drive creative solutions. Our goal is to be part of the long-term global energy solution while generating strong returns for our shareholders.
Sincerely,
William R. Thomas
CHAIRMAN OF THE BOARD AND CHIEF EXECUTIVE OFFICER SEPTEMBER 2020
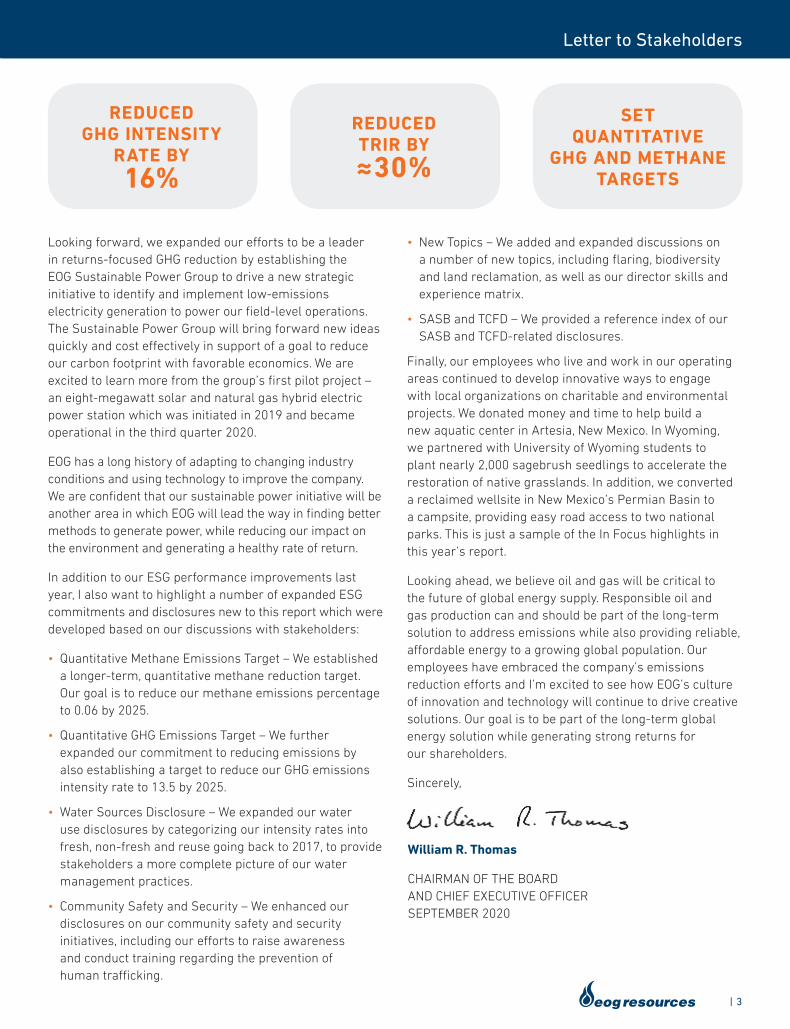
REDUCED GHG INTENSITY
RATE BY16%
REDUCED TRIR BY≈30%
SET QUANTITATIVE
GHG AND METHANE TARGETS
Letter to Stakeholders
4 |
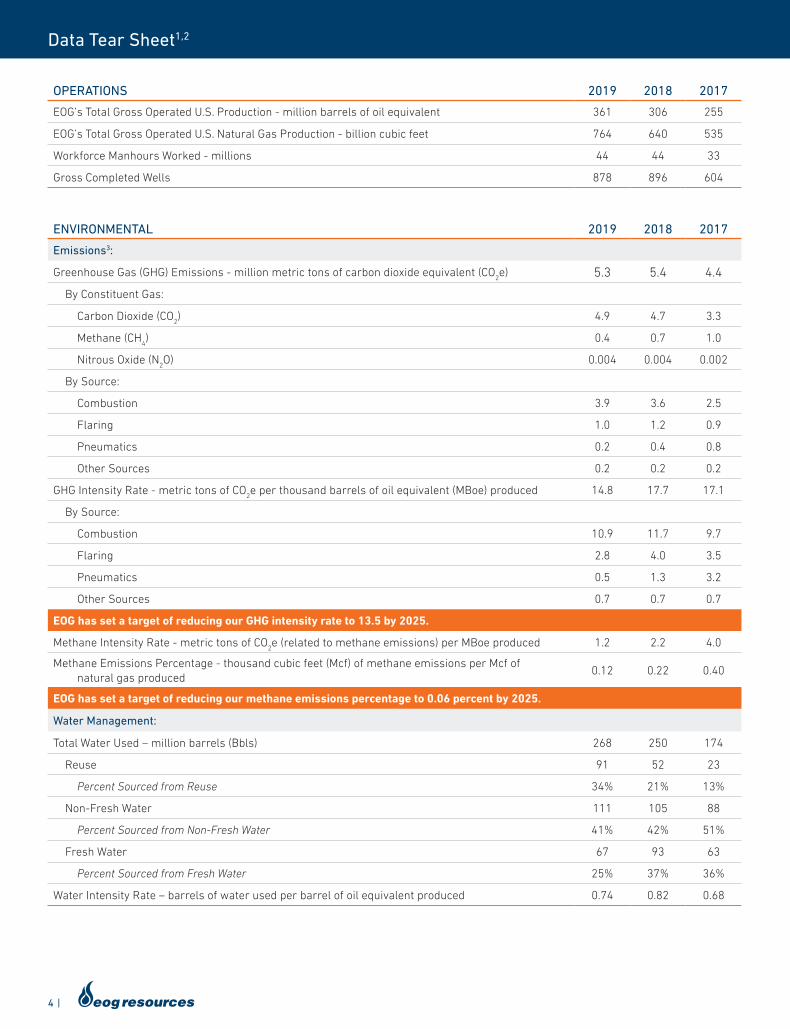
OPERATIONS 2019 2018 2017
EOG’s Total Gross Operated U.S. Production - million barrels of oil equivalent 361 306 255
EOG’s Total Gross Operated U.S. Natural Gas Production - billion cubic feet 764 640 535
Workforce Manhours Worked - millions 44 44 33
Gross Completed Wells 878 896 604
Data Tear Sheet1,2
ENVIRONMENTAL 2019 2018 2017
Emissions3:
Greenhouse Gas (GHG) Emissions - million metric tons of carbon dioxide equivalent (CO2e) 5.3 5.4 4.4
By Constituent Gas:
Carbon Dioxide (CO2) 4.9 4.7 3.3
Methane (CH4) 0.4 0.7 1.0
Nitrous Oxide (N2O) 0.004 0.004 0.002
By Source:
Combustion 3.9 3.6 2.5
Flaring 1.0 1.2 0.9
Pneumatics 0.2 0.4 0.8
Other Sources 0.2 0.2 0.2
GHG Intensity Rate - metric tons of CO2e per thousand barrels of oil equivalent (MBoe) produced 14.8 17.7 17.1
By Source:
Combustion 10.9 11.7 9.7
Flaring 2.8 4.0 3.5
Pneumatics 0.5 1.3 3.2
Other Sources 0.7 0.7 0.7
EOG has set a target of reducing our GHG intensity rate to 13.5 by 2025.
Methane Intensity Rate - metric tons of CO2e (related to methane emissions) per MBoe produced 1.2 2.2 4.0
Methane Emissions Percentage - thousand cubic feet (Mcf) of methane emissions per Mcf of natural gas produced
0.12 0.22 0.40
EOG has set a target of reducing our methane emissions percentage to 0.06 percent by 2025.
Water Management:
Total Water Used – million barrels (Bbls) 268 250 174
Reuse 91 52 23
Percent Sourced from Reuse 34% 21% 13%
Non-Fresh Water 111 105 88
Percent Sourced from Non-Fresh Water 41% 42% 51%
Fresh Water 67 93 63
Percent Sourced from Fresh Water 25% 37% 36%
Water Intensity Rate – barrels of water used per barrel of oil equivalent produced 0.74 0.82 0.68
| 5
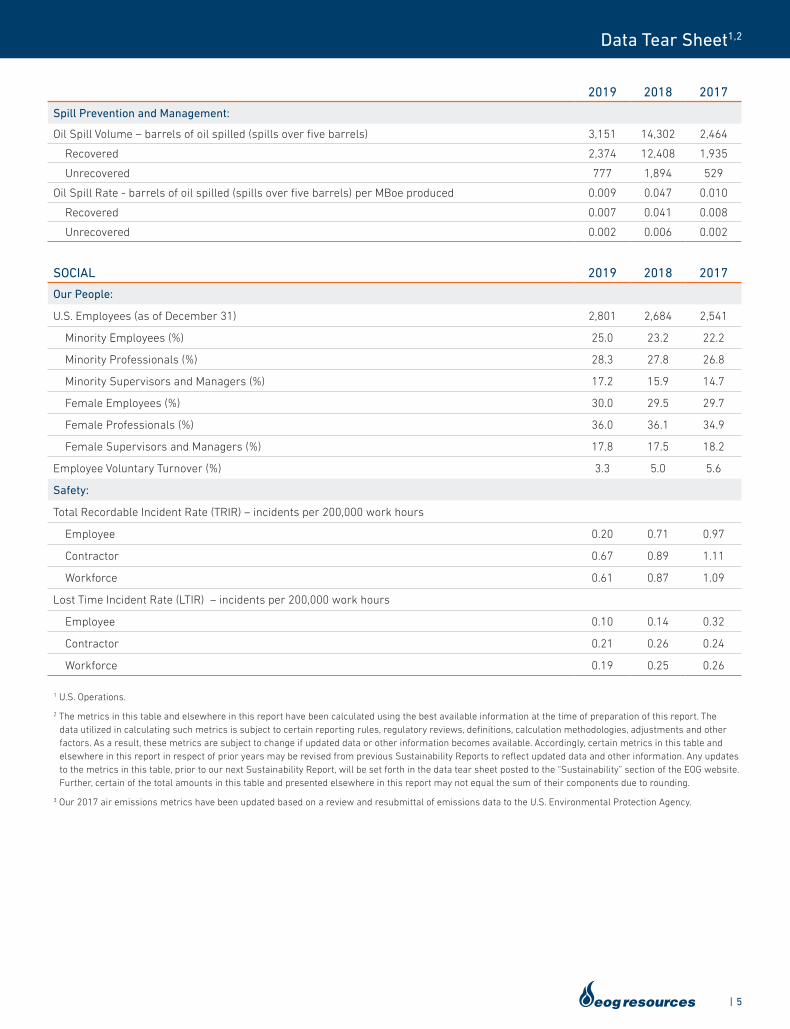
2019 2018 2017
Spill Prevention and Management:
Oil Spill Volume – barrels of oil spilled (spills over five barrels) 3,151 14,302 2,464
Recovered 2,374 12,408 1,935
Unrecovered 777 1,894 529
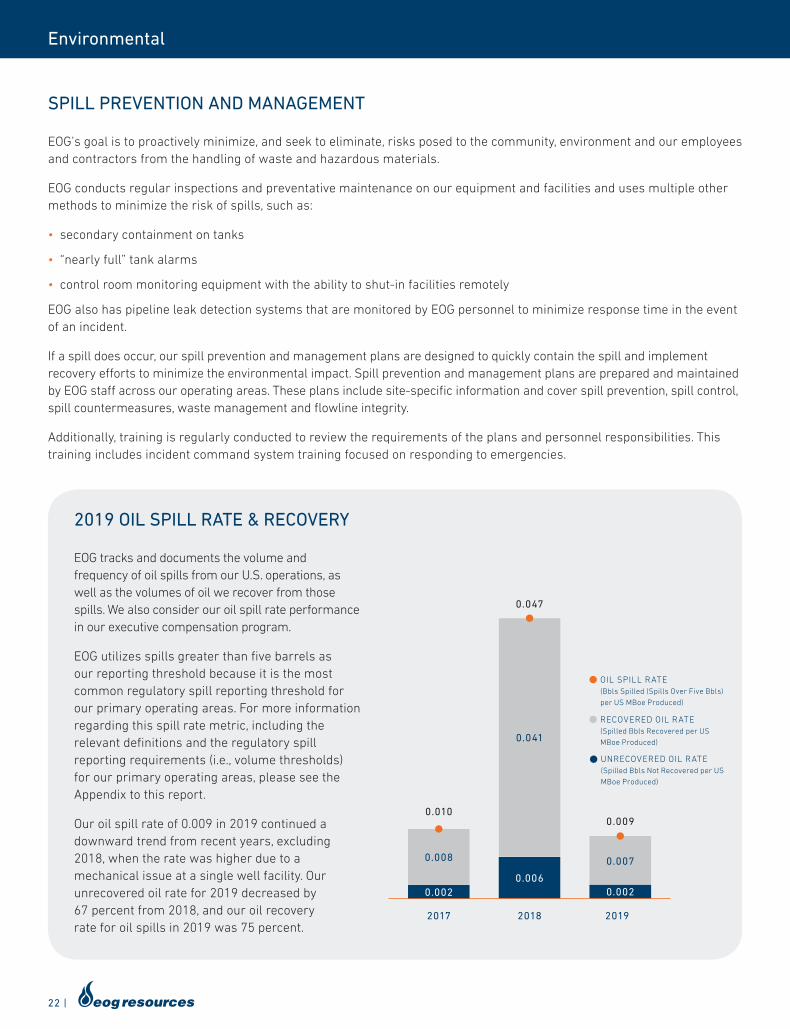
Oil Spill Rate - barrels of oil spilled (spills over five barrels) per MBoe produced 0.009 0.047 0.010
Recovered 0.007 0.041 0.008
Unrecovered 0.002 0.006 0.002
SOCIAL 2019 2018 2017
Our People:
U.S. Employees (as of December 31) 2,801 2,684 2,541
Minority Employees (%) 25.0 23.2 22.2
Minority Professionals (%) 28.3 27.8 26.8
Minority Supervisors and Managers (%) 17.2 15.9 14.7
Female Employees (%) 30.0 29.5 29.7
Female Professionals (%) 36.0 36.1 34.9
Female Supervisors and Managers (%) 17.8 17.5 18.2
Employee Voluntary Turnover (%) 3.3 5.0 5.6
Safety:
Total Recordable Incident Rate (TRIR) – incidents per 200,000 work hours
Employee 0.20 0.71 0.97
Contractor 0.67 0.89 1.11
Workforce 0.61 0.87 1.09
Lost Time Incident Rate (LTIR) – incidents per 200,000 work hours
Employee 0.10 0.14 0.32
Contractor 0.21 0.26 0.24
Workforce 0.19 0.25 0.26
1 U.S. Operations.
2 The metrics in this table and elsewhere in this report have been calculated using the best available information at the time of preparation of this report. The data utilized in calculating such metrics is subject to certain reporting rules, regulatory reviews, definitions, calculation methodologies, adjustments and other factors. As a result, these metrics are subject to change if updated data or other information becomes available. Accordingly, certain metrics in this table and elsewhere in this report in respect of prior years may be revised from previous Sustainability Reports to reflect updated data and other information. Any updates to the metrics in this table, prior to our next Sustainability Report, will be set forth in the data tear sheet posted to the “Sustainability” section of the EOG website. Further, certain of the total amounts in this table and presented elsewhere in this report may not equal the sum of their components due to rounding.
3 Our 2017 air emissions metrics have been updated based on a review and resubmittal of emissions data to the U.S. Environmental Protection Agency.
Data Tear Sheet1,2
6 |
Environmental
OUR PRACTICES
EOG Resources’ leadership in environmental stewardship can be largely attributed to the same decentralized structure that drives our leadership in the exploration and development of unconventional oil and gas plays.
No two unconventional oil and gas plays are alike. Each is unique and therefore requires unique techniques and technology to develop. EOG’s decentralized structure fosters play-specific innovation to optimally develop and maximize the value of any given play. Each of our operating area offices is continually testing various technologies and innovations that are most suitable for its operating area’s unique geology and surface area environment. In many cases, technology can be transferred and shared across the company.
The same is true for our efforts to minimize our environmental footprint, improve the energy efficiency of our field operations, reduce overall fuel usage and drive down emissions. We essentially have independent teams in each of our operating areas all testing, innovating and eventually sharing the best environmental stewardship innovations, approaches and technologies.
We are committed to protecting the environment throughout our exploration and development operations – from our initial exploration efforts, through the life of a well’s production, to our reclamation and restoration of a well site. The following are just a few of the efforts EOG undertakes:
Completions
• Reducing fresh water usage by: - Increasing recycling and reuse of produced water
from our oil and gas wells - Prioritizing the use of non-fresh water sources
• Using electric completion spreads to reduce diesel fuel combustion emissions
• Minimizing the use of chemical additives through innovative completion technologies
• Utilizing “green completions,” which are reduced emissions completion systems
Infrastructure and Land Use
• Installing water pipeline infrastructure to reduce the number of trucks needed, road congestion and truck emissions
• Installing natural gas gathering infrastructure early in the development of a play to reduce flaring and vented emissions, including the installation of 100 miles of natural gas gathering lines in 2019
Drilling
• Limiting our overall surface footprint by: - Using directional and horizontal drilling technologies - Drilling multiple wells from a single well pad - Reducing drilling days
• Limiting disposal of drilling fluids through reuse and recycling
Production and Facilities
• Recycling produced water for reuse in operations
• Real-time, remote facility monitoring using Supervisory Control and Data Acquisition (SCADA) systems
• Reducing or eliminating emissions by: - Capturing emissions and reducing flaring using vapor
recovery units that direct tank vapors into a natural gas sales line
- Having removed or retrofitted all high-bleed pneumatic controllers used in our operations
- Converting pneumatic pumps to electric or solar power
- Installing instrument air systems on facility controllers and pumps
- Identifying, repairing and monitoring fugitive emissions at EOG facilities through a company-wide leak detection and repair (LDAR) program
• Designing and implementing improved spill containment infrastructure for our facilities
• Reducing our emissions and surface footprint through centralized production and compression facilities
• Building out oil gathering systems and pipelines to reduce truck traffic and emissions
• Establishing multiple takeaway options for our production and optimizing takeaway capabilities with “real time” control of the flow of natural gas
• Downsizing drilling sites for production operations
• Minimizing our surface footprint by re-vegetating unused acreage during reclamation and restoration of a well site
| 7
Environmental
Other Energy Efficiency and Conservation Measures
• Designing and utilizing multi-well pads, thus removing the need for multiple separators, tanks and flares and reducing trucking
• Using electric pumps and compressors
• Houston offices are in a building with Leadership in Energy and Environmental Design (LEED) “Green Building” certification
Planning for Weather Events and Related Physical Risks
As part of the evaluation and planning of our operations, EOG considers how to mitigate relevant physical risks from weather changes and extreme weather events, such as floods, hurricanes and intense heat and cold.
We operate a diversified portfolio of assets across multiple regions that each have unique environmental and weather-related considerations. Our decentralized structure enables us to apply our localized knowledge so that we are prepared for the weather-related physical risks specific to each of our operating areas. For instance, in areas prone to flooding, we have built drainage systems and protective structures to help prevent flooding of our facilities. Companywide, including in areas prone to water scarcity, EOG is focused on reducing the use of fresh water. In areas prone to extreme heat, we take measures to protect the health and safety of our employees and contractors, including using cooling trailers.
EOG also operates three central control rooms in North America, initially built to manage our operations in our three largest plays, the Eagle Ford, the Permian Basin and the Bakken. In the event of severe weather, EOG has plans in place to utilitze one of our central control rooms for an impacted operating area and to remotely monitor production and infrastructure and, if needed, safely shut down operations.
ENVIRONMENTAL MANAGEMENT SYSTEMS
At EOG, we are guided by the fundamental elements of our Safety & Environmental Policy, which commits to safeguarding people and the environment by making environmental performance the responsibility of every EOG employee.
• Environmental protection – We are committed to reducing the impact of our operations on the environment.
• Compliance – Our policy is to comply with all applicable environmental laws and regulations and to apply responsible standards where such laws or regulations do not exist.
• Continuous improvement – We strive to continuously improve our safety and environmental performance and enhance our processes.
Our company-wide environmental management systems (EMS) are key to integrating our proactive approach to environmental stewardship into our planning, development and decision-making. Our EMS provide a framework to manage our environmental processes and performance. Our EMS also provide transparency and help us identify and manage environmental risks, leverage opportunities and drive continuous improvement.
Environmental Management Applications – As part of our EMS, we use a combination of internal and third-party systems to organize large quantities of data into a database structure so it can easily be reviewed, used, monitored and maintained in our day-to-day operations. In addition, data in our EMS is used to track regulatory monitoring and reporting schedules, environmental incidents and process changes that are being implemented.
Performance Goals – Our EMS also support our efforts to set environmental goals, review progress and track our performance. We set environmental goals on an annual basis and the data from our EMS allows management to assess performance in a systematic way. EOG’s environmental performance is considered in evaluating employee performance and compensation throughout the organization, including executive compensation.
Management Oversight – EOG’s Safety and Environmental Leadership Council, an internal leadership team consisting of senior management and legal and safety and environmental personnel, reviews EOG’s performance and oversees development of strategies to improve our processes. This review system further serves to identify trends to develop the overall safety and environmental strategy for our organization. See “Role of Management in Assessing and Managing ESG Matters” on page 36 for further discussion.
8 |
Environmental
Training – Regular environmental training is critical to consistent performance. We provide initial, periodic and refresher environmental training for employees, contractors and other personnel who work at EOG’s facilities, including:
• Environmental stewardship training
• Optical gas imaging (OGI) training for EOG’s LDAR program
• Audio, visual and olfactory (AVO) training to proactively identify and manage emissions on a regular basis
• Spill prevention control and countermeasure training
Contractor and Vendor Management – We work closely with our contractors and vendors to review performance, audit compliance, and track our environmental goals.
IN FOCUS
RECLAIMING AND RESTORING LAND
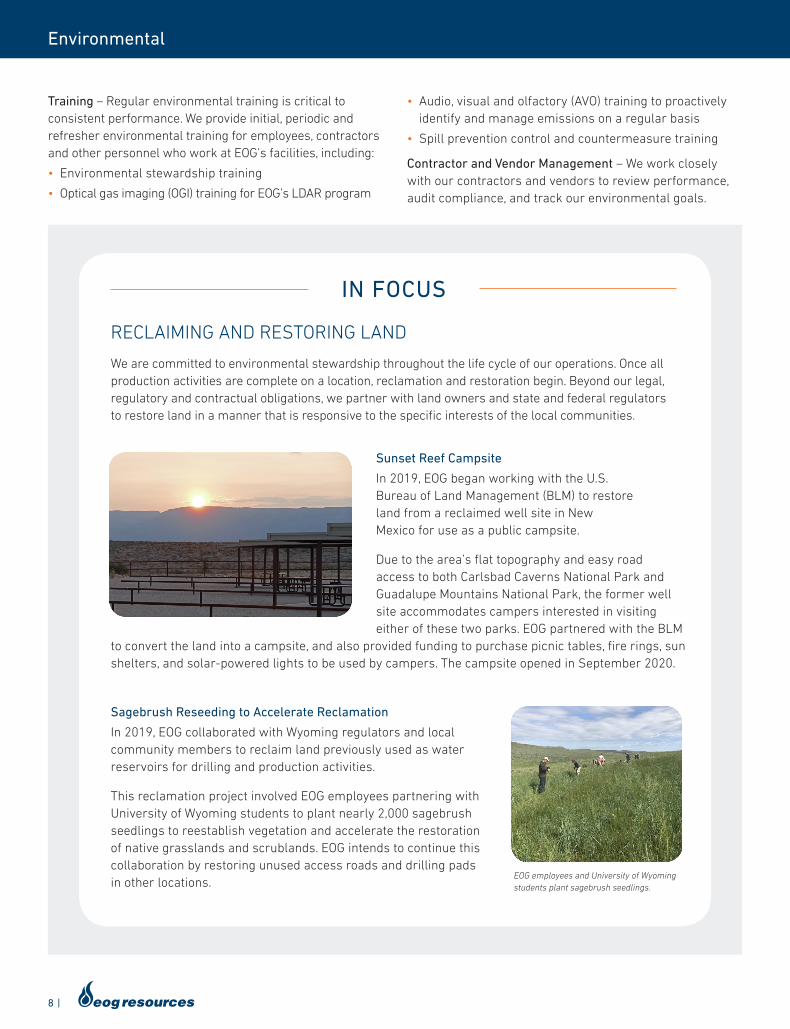
We are committed to environmental stewardship throughout the life cycle of our operations. Once all production activities are complete on a location, reclamation and restoration begin. Beyond our legal, regulatory and contractual obligations, we partner with land owners and state and federal regulators to restore land in a manner that is responsive to the specific interests of the local communities.
EOG employees and University of Wyoming students plant sagebrush seedlings.
Sagebrush Reseeding to Accelerate Reclamation
In 2019, EOG collaborated with Wyoming regulators and local community members to reclaim land previously used as water reservoirs for drilling and production activities.
This reclamation project involved EOG employees partnering with University of Wyoming students to plant nearly 2,000 sagebrush seedlings to reestablish vegetation and accelerate the restoration of native grasslands and scrublands. EOG intends to continue this collaboration by restoring unused access roads and drilling pads in other locations.
Sunset Reef Campsite
In 2019, EOG began working with the U.S. Bureau of Land Management (BLM) to restore land from a reclaimed well site in New Mexico for use as a public campsite.
Due to the area’s flat topography and easy road access to both Carlsbad Caverns National Park and Guadalupe Mountains National Park, the former well site accommodates campers interested in visiting either of these two parks. EOG partnered with the BLM
to convert the land into a campsite, and also provided funding to purchase picnic tables, fire rings, sun shelters, and solar-powered lights to be used by campers. The campsite opened in September 2020.
| 9
Environmental
Global supply and demand for crude oil and natural gas may be affected by changes in carbon-related regulations and policy initiatives, the availability of alternative energy sources, and consumer behavior.
The International Energy Agency’s (IEA) 2019 World Energy Outlook (WEO) attempts to model these factors to provide estimates of future supply, demand and prices for oil and natural gas under three scenarios. The Sustainable Development Scenario is based on the main energy- related components of the United Nations' Sustainable Development Goals, including the Paris Agreement’s goal of limiting the increase in global average temperatures to well below 2 degrees Celsius above pre-industrial levels. Under this scenario, which is the 2019 WEO’s most carbon-constrained scenario, demand for oil and natural gas is projected to decrease by 2040, however oil and gas remain a key part of meeting future energy demand during the same time period.
There is not just one approach to meeting future energy demand within the constraints of a 2 degree scenario. Uncertainty about specific climate-related efforts, including the timing and scale of those efforts, makes predicting the impact on future supply, demand and commodity prices a challenge. However, exposure to commodity prices determined by supply and demand factors that are outside our control, such as the business cycle and complex geopolitical relationships, is a risk we are long-accustomed to managing as an oil and gas company.
We believe the best strategy to remain profitable in a commodity business exposed to volatile prices and the risks that drive price volatility, is to be a returns-focused, low-cost producer, supported by a conservative financial structure. Therefore, we allocate capital based on our “premium well” strategy, described in more detail below, then evaluate our plans under various commodity price scenarios. We also manage regulatory, legal and reputational risks by, among other things, developing and investing in technologies that reduce both costs and emissions, setting targets for emissions reductions and actively managing our portfolio of diverse oil and gas assets to provide future investment-optionality.
TCFD and SASB
We recognize the increasing interest of shareholders and other stakeholders in the potential impacts of climate change on EOG’s operations and how we are assessing and managing that risk. In response, we continue to engage with shareholders and other stakeholders on these matters and have integrated certain recommended disclosure components from the Task Force on Climate-related Financial Disclosures (TCFD) into our annual sustainability reporting. In addition, we have further expanded our reporting this year by consulting the Sustainability Accounting Standard Board’s (SASB)standards for oil and gas exploration and production companies. Please refer to the SASB and TCFD Index beginning on page 45 for a map to our TCFD- and SASB-related disclosures.
CLIMATE-RELATED RISK, LONG-TERM STRATEGY AND SCENARIO ANALYSIS
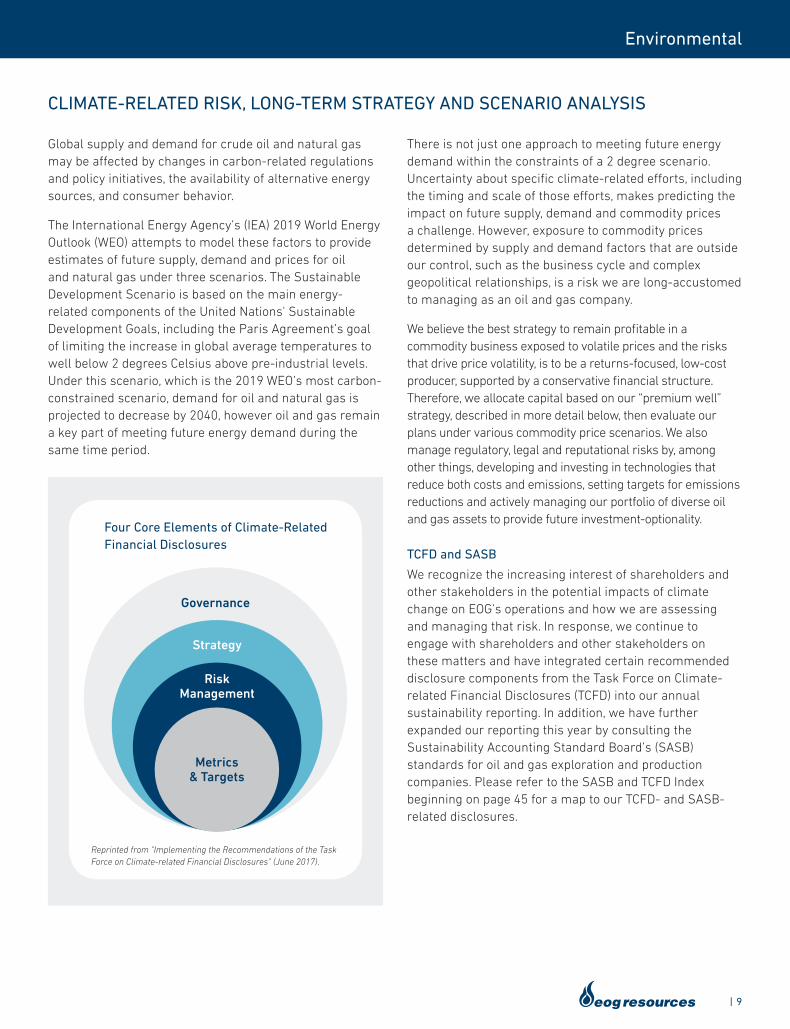
Four Core Elements of Climate-Related Financial Disclosures
Reprinted from "Implementing the Recommendations of the Task Force on Climate-related Financial Disclosures" (June 2017).
Governance
Strategy
Risk Management
Metrics & Targets
10 |
Environmental
Resilience of Long-Term “Premium Well” Strategy
EOG is a rate-of-return focused company at every level of the organization and has been since our founding. During the last downturn of 2015 and 2016, we were faced with the possibility of an extended period of low oil prices. In response, we implemented a rigorous new investment hurdle rate that we named the “premium well” investment standard. A premium well delivers a minimum of 30 percent direct after-tax rate of return using a commodity price deck of $40 per barrel of oil and $2.50 per thousand cubic feet (Mcf) of natural gas. A minimum return of 30 percent on a direct basis would translate to a healthy, all-in return that includes indirect costs such as overhead.
In the three years that followed, 2017 through 2019, EOG reinvested slightly less than 80 percent of our discretionary cash flow, generated an average 14 percent return on capital employed, increased the dividend 72 percent to $1.15 per share, generated $4.6 billion of free cash flow, reduced our net debt by $2.2 billion and increased proved reserves 55 percent (See “Appendix—Non-GAAP Financial Measures” beginning on page 50 for reconciliation schedules and related discussion). Our performance under the premium well standard was as good or better than our performance in the three years prior to the downturn (2012-2014) when oil prices averaged $95 per barrel. Such is the power of premium.
Furthermore, we have replaced our premium locations at least two times faster than our pace of drilling since establishing the hurdle rate in 2016. As of year-end 2019, we had identified 10,500 premium well locations, more than three times as many locations as when we started.
EOG’s unique premium well strategy positions the company to be one of the lowest-cost oil and natural gas producers worldwide, capable of earning competitive returns throughout commodity price cycles.
Scenario Analysis
Complex macro-economic factors, including changes in carbon-related regulations and policy initiatives, the availability of alternative energy sources, and consumer behavior may affect global supply, demand and pricing for crude oil and natural gas.
Our long-term strategic planning process includes analysis of these and other market forces that present risks and opportunities to our business plans and strategy. As part of this analysis, we assess risks and opportunities related to
global climate change policy by evaluating the resilience of our portfolio under a carbon-constrained scenario.
To evaluate the resilience of our portfolio, we referenced the 2019 WEO, and specifically the Sustainable Development Scenario described above, which is widely used to assess portfolio resilience within the oil and natural gas industry. We started with a reference case model running to 2040 that consisted of our premium well inventory of 10,500 locations. For conservatism, we did not assume any additions to our current premium inventory; rather, we assumed development of our non-premium inventory for the remainder of the model’s time frame, year 2035 to year 2040. Other assumptions and optimization criteria used to develop our reference case model included the following:
• A commodity price outlook determined by the IEA Sustainable Development Scenario, which averaged $61 Brent per barrel of oil ($56 WTI equivalent per barrel of oil) and $3.25 per million Btu of natural gas over the life of the scenario.
• Carbon pricing costs defined by the Sustainable Development Scenario for carbon dioxide taxes in the U.S. of $100 per metric ton beginning in 2030 and growing to $140 per metric ton by 2040. The reference case model also assumed EOG’s current GHG emissions intensity metrics. These assumptions resulted in additional costs of approximately $1.50 per barrel of oil equivalent in 2030, growing to $2.10 per barrel of oil equivalent by 2040.
• Realistic production and dividend growth, and an internal requirement to generate free cash flow every year.
Evaluating our reference case model under the 2019 WEO's Sustainable Development Scenario assumptions resulted in significant positive net present value of future cash flows using a 10 percent discount rate (NPV10).
In addition, the reference case model was further stress tested using a flat commodity price of $50 per barrel of oil and $2.75 per Mcf of natural gas. Using the same carbon pricing costs, production growth and dividend growth assumptions, the more conservative commodity price scenario still yielded significant free cash flow and generated positive NPV10. EOG’s premium well strategy, disciplined capital allocation and distinctive culture is driving long-term, sustainable shareholder and stakeholder value. The analysis confirmed the resiliency of EOG’s current well inventory and our sustainable business model against various changes in commodity pricing and market demands, including those related to global climate change.
| 11
Environmental
MANAGING EMISSIONS
Methane and Greenhouse Gas Reduction Targets and Environmental Metrics
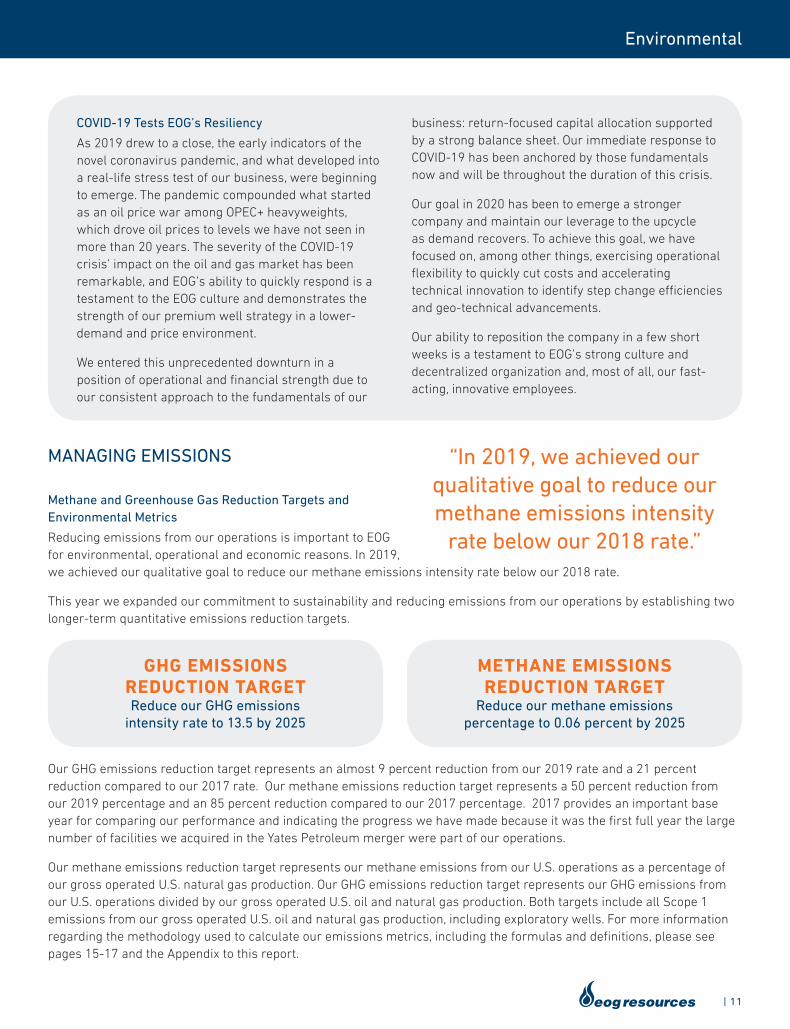
Reducing emissions from our operations is important to EOG for environmental, operational and economic reasons. In 2019, we achieved our qualitative goal to reduce our methane emissions intensity rate below our 2018 rate.
This year we expanded our commitment to sustainability and reducing emissions from our operations by establishing two longer-term quantitative emissions reduction targets.
Our GHG emissions reduction target represents an almost 9 percent reduction from our 2019 rate and a 21 percent reduction compared to our 2017 rate. Our methane emissions reduction target represents a 50 percent reduction from our 2019 percentage and an 85 percent reduction compared to our 2017 percentage. 2017 provides an important base year for comparing our performance and indicating the progress we have made because it was the first full year the large number of facilities we acquired in the Yates Petroleum merger were part of our operations.
Our methane emissions reduction target represents our methane emissions from our U.S. operations as a percentage of our gross operated U.S. natural gas production. Our GHG emissions reduction target represents our GHG emissions from our U.S. operations divided by our gross operated U.S. oil and natural gas production. Both targets include all Scope 1 emissions from our gross operated U.S. oil and natural gas production, including exploratory wells. For more information regarding the methodology used to calculate our emissions metrics, including the formulas and definitions, please see pages 15-17 and the Appendix to this report.
COVID-19 Tests EOG’s Resiliency
As 2019 drew to a close, the early indicators of the novel coronavirus pandemic, and what developed into a real-life stress test of our business, were beginning to emerge. The pandemic compounded what started as an oil price war among OPEC+ heavyweights, which drove oil prices to levels we have not seen in more than 20 years. The severity of the COVID-19 crisis’ impact on the oil and gas market has been remarkable, and EOG’s ability to quickly respond is a testament to the EOG culture and demonstrates the strength of our premium well strategy in a lower-demand and price environment.
We entered this unprecedented downturn in a position of operational and financial strength due to our consistent approach to the fundamentals of our
business: return-focused capital allocation supported by a strong balance sheet. Our immediate response to COVID-19 has been anchored by those fundamentals now and will be throughout the duration of this crisis.
Our goal in 2020 has been to emerge a stronger company and maintain our leverage to the upcycle as demand recovers. To achieve this goal, we have focused on, among other things, exercising operational flexibility to quickly cut costs and accelerating technical innovation to identify step change efficiencies and geo-technical advancements.
Our ability to reposition the company in a few short weeks is a testament to EOG’s strong culture and decentralized organization and, most of all, our fast-acting, innovative employees.
“In 2019, we achieved our qualitative goal to reduce our methane emissions intensity
rate below our 2018 rate.”
METHANE EMISSIONS REDUCTION TARGET
Reduce our methane emissions percentage to 0.06 percent by 2025
GHG EMISSIONS REDUCTION TARGET Reduce our GHG emissions
intensity rate to 13.5 by 2025
12 |
Environmental
Setting these targets encourages innovation in our practices and application of technology to increase efficiency and reduce emissions. Our practices and processes to pursue these targets and the quantitative metrics we use to measure our progress are described in this report, which allow our shareholders and other stakeholders to gauge our year-over-year performance and also benchmark our environmental performance against that of our peer companies.
Our progress toward achieving these goals will be regularly reviewed by executive management and our Board of Directors, and we intend to report our progress toward each of the targets annually.
Operating Practices
As discussed in the “Our Practices” section above, EOG’s normal operating practices are designed to minimize emissions. To reduce or eliminate flaring, we install natural gas gathering pipelines early in the life of a play and contract sufficient pipeline takeaway capacity to provide flow assurance. The use of multi-well pads and green completions also reduce overall emissions. Other equipment we use to minimize the emissions from our operations include low-bleed controllers, instrument air systems, compressors equipped with emissions control technology, and electric and solar-powered pumps.
Our facilities are also designed to minimize emissions and maximize the recovery of vapors and our facilities are periodically reviewed to optimize equipment. Where operationally appropriate, we install specialized control equipment, such as vapor recovery units and towers, vapor balance systems, high-efficiency combustion devices, and multi stage separators. In certain operating areas, we install electricity infrastructure to permit the use of electric-powered (versus fuel-powered) equipment. In addition, we use the latest technology, such as OGI, to identify and manage emissions.
Flaring Reduction Initiatives
Minimizing flaring is a priority for EOG. Infrastructure planning and takeaway optionality are two of the most important tools we use to reduce flaring. We have also developed innovative solutions in-house to further reduce flaring and we implement targeted initiatives to reduce or eliminate flaring throughout our operations:
• We anticipate and develop gathering and takeaway infrastructure needs to transport our production when formulating our development plans for a play not only to minimize flaring, but also to lower costs and maximize efficiencies.
• We install natural gas gathering infrastructure early in the development of a play so that gas associated with the production of oil can be gathered, processed and sold, including the installation of 100 miles of natural gas gathering lines in 2019.
• Our marketing group secures the ability to sell to multiple markets, to provide takeaway options for our gas production and mitigate the effects of downstream market interruptions.
• Control centers in our busiest divisions are built to control the flow of our natural gas in real time and are instrumental in avoiding interruptions and executing our takeaway plans.
• When new wells are completed, we capture natural gas produced rather than flaring such natural gas, a procedure known as “green completions.”
• We capture oil tank gas vapors with vapor recovery units and towers and vapor balance systems. In addition, beginning in 2019, to further capture tank gas vapors and reduce the need for flaring, we implemented technology designed to exclude or remove oxygen from tank gas vapors. Tank gas vapors are liquids-rich and therefore highly valuable, but tank gas vapors with oxygen will corrode pipelines, so they cannot be sold and may need to be flared.
• To minimize flaring at our facilities caused by downstream market interruptions, we recently conducted a pilot test of closed-loop gas capture, an automated process developed in-house to re-route natural gas back into existing wells when a downstream interruption occurs. Results of this pilot test were successful and indicate that our closed-loop gas process has the potential to both reduce flaring and return a majority of the captured gas from the well back to production.
Pneumatic Controller Program
High-bleed pneumatic controllers were identified as the largest contributor of methane emissions in EOG’s operations. In 2019, EOG completed a program implemented in 2017 to retrofit or remove all of our high-bleed pneumatic controllers.
“In 2019, EOG completed a program implemented in 2017 to retrofit or remove all of our
high-bleed pneumatic controllers.”
| 13
Environmental
IN FOCUS
CAPTURING WELLHEAD GAS TO MINIMIZE FLARING
What is a wellhead and what is wellhead gas?
A wellhead is an assembly of steel valves and pipe that sits on top of the well to safely control well pressure. The wellhead also connects the well with surface pipelines and facilities so that oil and natural gas can be produced.
Every oil and gas reservoir will typically have a mix of both oil and natural gas at different ratios. When drilling for oil, it is common to also produce “associated” natural gas that is often called wellhead gas.
We view wellhead gas from our oil wells as a valuable commodity rather than a byproduct of oil production. Our focus is to maximize our economic return through responsible management of wellhead gas.
Why is wellhead gas sometimes flared?
In the early stages of development of an oil field, it may not be feasible to attach gas gathering and processing infrastructure to an initial or exploratory well. The productivity, economic feasibility and gas quality of the well must first be determined. Without infrastructure to gather and process the wellhead gas, it is commonly flared. Other conditions that result in wellhead gas flaring include undersized pipelines to natural gas processing facilities, downstream market interruptions and lack of natural gas capture during completions operations for new wells.
How does EOG minimize flaring of wellhead gas?
EOG minimizes wellhead gas flaring by effective planning and infrastructure investment early in the lifecycle of our oil fields. When new wells are completed, we utilize green completions to capture natural gas rather than flaring the natural gas. We also install company-owned and operated natural gas gathering infrastructure early in the exploration and development process so our gas can be gathered and sent to market. Further, investment in gas processing and compression stations allows our marketing team to establish multiple gas takeaway options to minimize impacts from downstream market interruptions due to shutdowns of facilities and pipelines for maintenance and repair. We also have control centers in our busiest divisions that are designed to manage the flow of our natural gas in real time so we can avoid flaring.
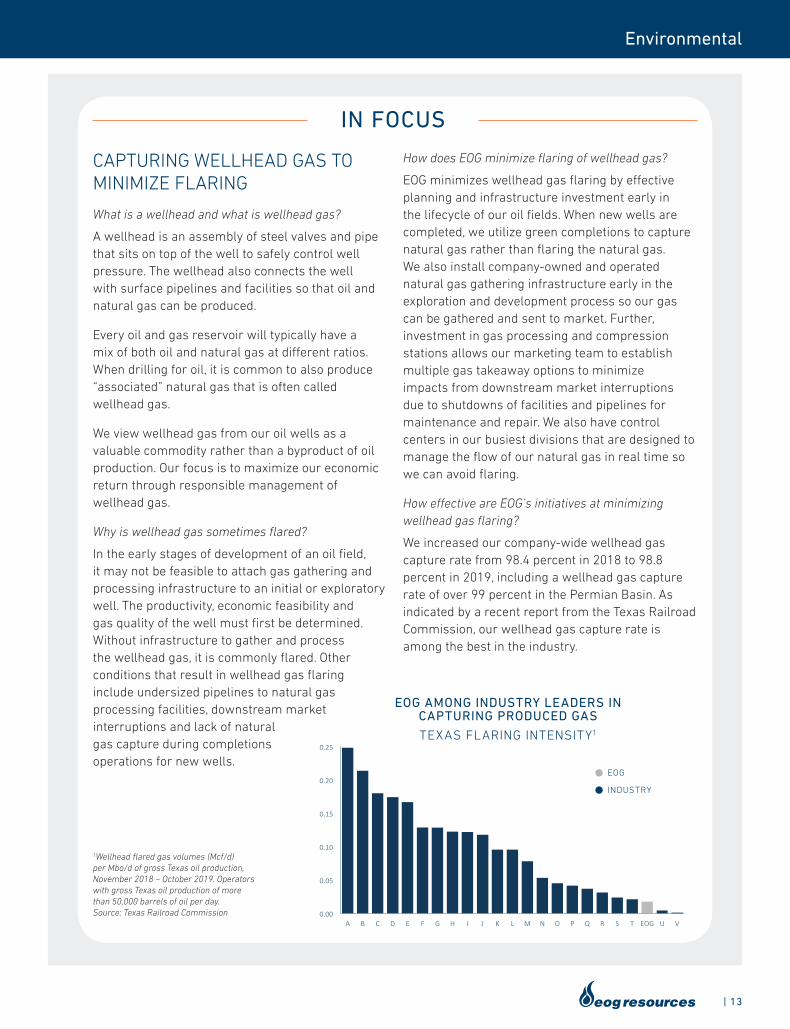
How effective are EOG’s initiatives at minimizing wellhead gas flaring?
We increased our company-wide wellhead gas capture rate from 98.4 percent in 2018 to 98.8 percent in 2019, including a wellhead gas capture rate of over 99 percent in the Permian Basin. As indicated by a recent report from the Texas Railroad Commission, our wellhead gas capture rate is among the best in the industry.
EOG AMONG INDUSTRY LEADERS IN CAPTURING PRODUCED GAS
TEXAS FLARING INTENSITY1
INDUSTRY
0.00
0.05
0.10
0.15
0.20
0.25
A B C D E F G H I J K L M N O P Q R S T EOG U V
EOG
1Wellhead flared gas volumes (Mcf/d) per Mbo/d of gross Texas oil production, November 2018 – October 2019. Operators with gross Texas oil production of more than 50,000 barrels of oil per day. Source: Texas Railroad Commission
14 |
Environmental
IN FOCUS
ENERGY, TECHNOLOGY AND INNOVATION
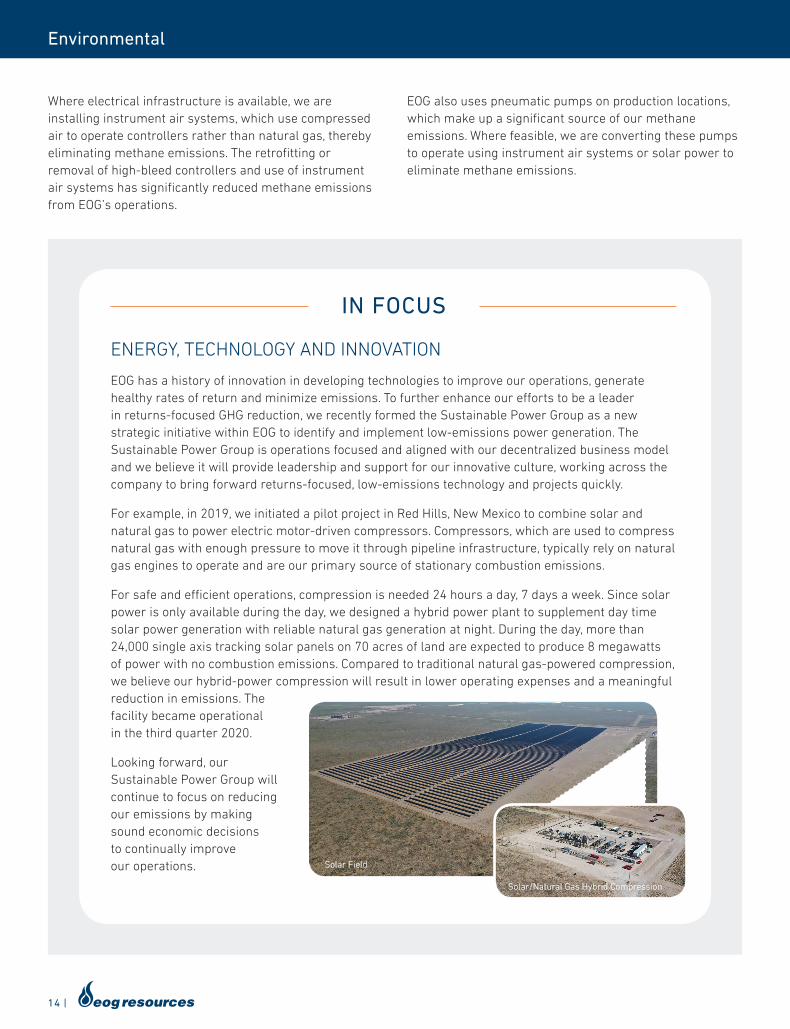
EOG has a history of innovation in developing technologies to improve our operations, generate healthy rates of return and minimize emissions. To further enhance our efforts to be a leader in returns-focused GHG reduction, we recently formed the Sustainable Power Group as a new strategic initiative within EOG to identify and implement low-emissions power generation. The Sustainable Power Group is operations focused and aligned with our decentralized business model and we believe it will provide leadership and support for our innovative culture, working across the company to bring forward returns-focused, low-emissions technology and projects quickly.
For example, in 2019, we initiated a pilot project in Red Hills, New Mexico to combine solar and natural gas to power electric motor-driven compressors. Compressors, which are used to compress natural gas with enough pressure to move it through pipeline infrastructure, typically rely on natural gas engines to operate and are our primary source of stationary combustion emissions.
For safe and efficient operations, compression is needed 24 hours a day, 7 days a week. Since solar power is only available during the day, we designed a hybrid power plant to supplement day time solar power generation with reliable natural gas generation at night. During the day, more than 24,000 single axis tracking solar panels on 70 acres of land are expected to produce 8 megawatts of power with no combustion emissions. Compared to traditional natural gas-powered compression, we believe our hybrid-power compression will result in lower operating expenses and a meaningful reduction in emissions. The facility became operational in the third quarter 2020.
Looking forward, our Sustainable Power Group will continue to focus on reducing our emissions by making sound economic decisions to continually improve our operations.
Where electrical infrastructure is available, we are installing instrument air systems, which use compressed air to operate controllers rather than natural gas, thereby eliminating methane emissions. The retrofitting or removal of high-bleed controllers and use of instrument air systems has significantly reduced methane emissions from EOG’s operations.
EOG also uses pneumatic pumps on production locations, which make up a significant source of our methane emissions. Where feasible, we are converting these pumps to operate using instrument air systems or solar power to eliminate methane emissions.
Solar Field
Solar/Natural Gas Hybrid Compression
| 15
Environmental
Leak Detection and Repair Program
In 2019, EOG continued to build upon the success of our voluntary, company-wide leak detection and repair program by conducting LDAR inspections across the company, which consisted of OGI inspections and/or AVO inspections. While certain EOG production locations are subject to LDAR programs mandated by state and/or federal regulations, our voluntary program goes further and provides operational procedures for detecting and repairing emissions leaks at facilities not covered by state or federal requirements.
Additionally, EOG utilizes our own information technology system applications to capture LDAR data electronically, including a mobile application to capture data directly from our field locations. These applications improve the accuracy of our data, identify trends, eliminate paper processes and allow timely repairs throughout our LDAR program.
EOG’s program consists of:
• Monitoring components – We monitor emissions from components such as connectors, pressure relief valves, controllers and tank thief hatches
• Monitoring-frequency guidelines – These guidelines take into account activity levels at our facilities and other factors that may affect emissions
• Identification and repair of leaks – We have protocols for the identification and timely repair of detected leaks and the re-inspection of repaired components at specified time periods
• OGI technology – A substantial part of the monitoring under our LDAR program is conducted through the use of infrared cameras and other thermal imaging technology
• AVO inspections – We also utilize audio, visual and olfactory inspections to identify and manage emissions as part of field and facility visits
• Documentation, review and retention – Our LDAR program includes requirements with respect to record maintenance and retention
Our LDAR program, which is reviewed on an annual basis, has been instrumental in minimizing fugitive emissions at EOG facilities. In 2019, our fugitive emissions remained more than 70 percent lower than they were in 2016, primarily because of the implementation and increased capabilities of our LDAR program.
GREENHOUSE GAS (GHG) EMISSIONS
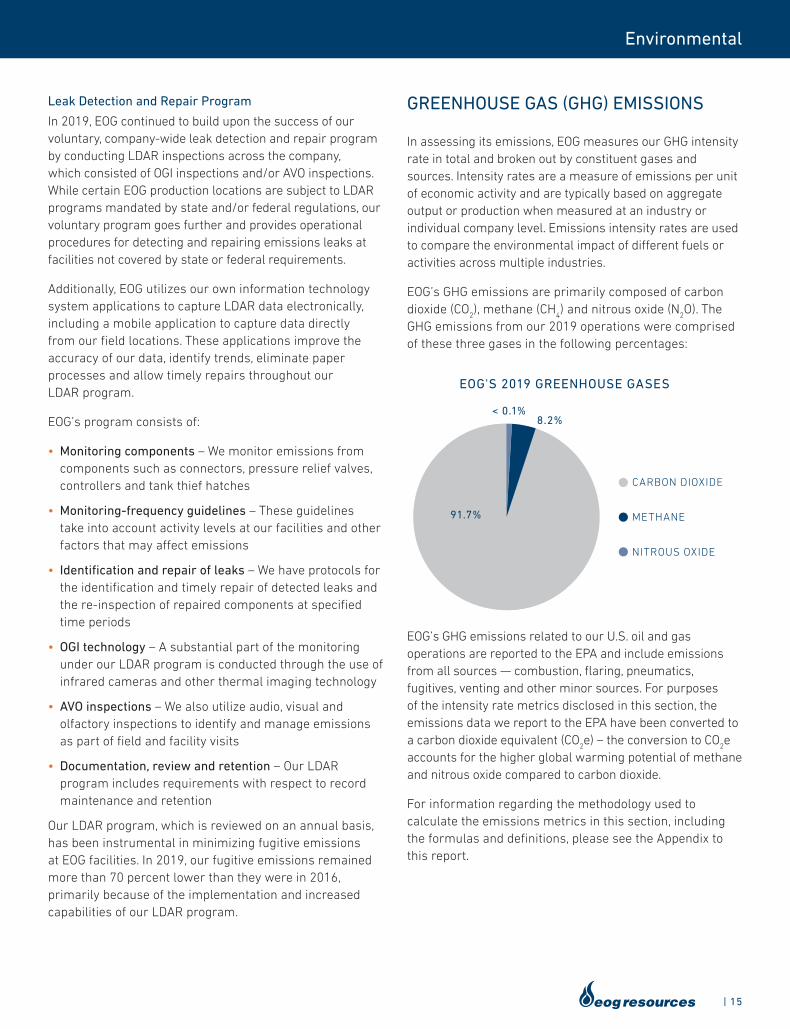
In assessing its emissions, EOG measures our GHG intensity rate in total and broken out by constituent gases and sources. Intensity rates are a measure of emissions per unit of economic activity and are typically based on aggregate output or production when measured at an industry or individual company level. Emissions intensity rates are used to compare the environmental impact of different fuels or activities across multiple industries.
EOG’s GHG emissions are primarily composed of carbon dioxide (CO
2), methane (CH
4) and nitrous oxide (N
2O). The
GHG emissions from our 2019 operations were comprised of these three gases in the following percentages:
EOG’s GHG emissions related to our U.S. oil and gas operations are reported to the EPA and include emissions from all sources — combustion, flaring, pneumatics, fugitives, venting and other minor sources. For purposes of the intensity rate metrics disclosed in this section, the emissions data we report to the EPA have been converted to a carbon dioxide equivalent (CO
2e) – the conversion to CO
2e
accounts for the higher global warming potential of methane and nitrous oxide compared to carbon dioxide.
For information regarding the methodology used to calculate the emissions metrics in this section, including the formulas and definitions, please see the Appendix to this report.
CARBON DIOXIDE
NITROUS OXIDE
METHANE
8.2%
91.7%
< 0.1%
EOG'S 2019 GREENHOUSE GASES
16 |
Environmental
GHG Emissions, Sources and Year-Over-Year Variances
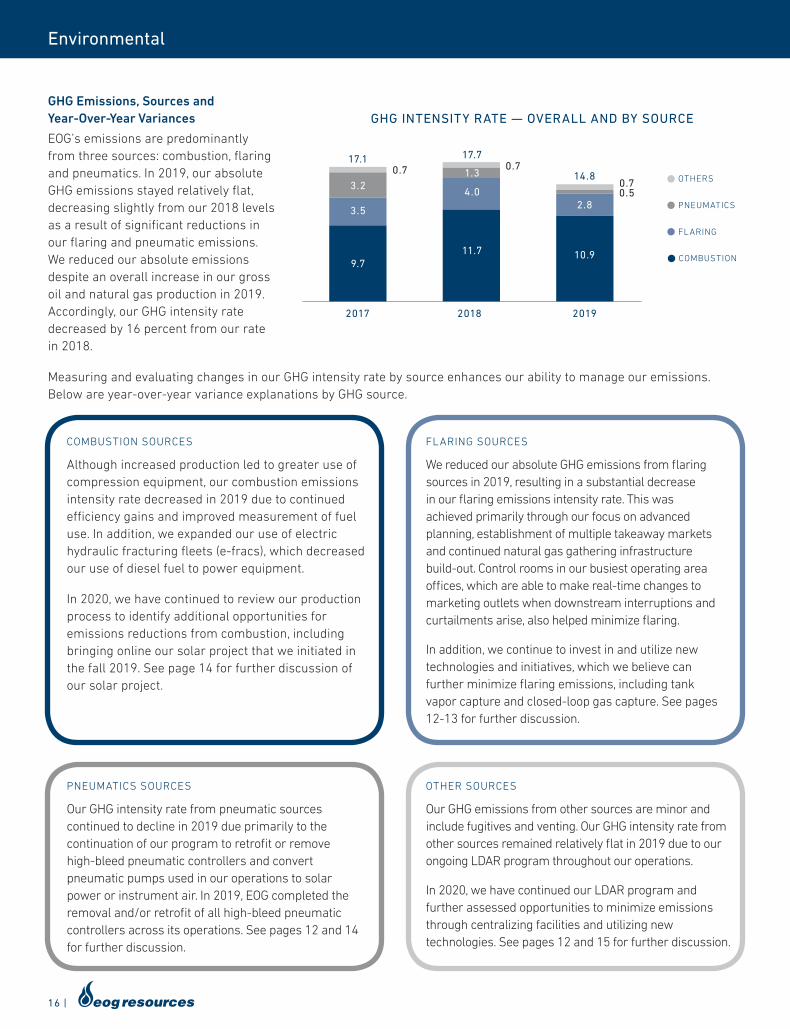
EOG’s emissions are predominantly from three sources: combustion, flaring and pneumatics. In 2019, our absolute GHG emissions stayed relatively flat, decreasing slightly from our 2018 levels as a result of significant reductions in our flaring and pneumatic emissions. We reduced our absolute emissions despite an overall increase in our gross oil and natural gas production in 2019. Accordingly, our GHG intensity rate decreased by 16 percent from our rate in 2018.
GHG INTENSITY RATE — OVERALL AND BY SOURCE
OTHERS
FLARING
PNEUMATICS
COMBUSTION
2017 2018 2019
9.7
3.5
3.2
17.10.7
11.7
4.0
1.3
17.70.7
10.9
2.8
14.80.70.5
Measuring and evaluating changes in our GHG intensity rate by source enhances our ability to manage our emissions. Below are year-over-year variance explanations by GHG source.
FLARING SOURCES
We reduced our absolute GHG emissions from flaring sources in 2019, resulting in a substantial decrease in our flaring emissions intensity rate. This was achieved primarily through our focus on advanced planning, establishment of multiple takeaway markets and continued natural gas gathering infrastructure build-out. Control rooms in our busiest operating area offices, which are able to make real-time changes to marketing outlets when downstream interruptions and curtailments arise, also helped minimize flaring.
In addition, we continue to invest in and utilize new technologies and initiatives, which we believe can further minimize flaring emissions, including tank vapor capture and closed-loop gas capture. See pages 12-13 for further discussion.
PNEUMATICS SOURCES
Our GHG intensity rate from pneumatic sources continued to decline in 2019 due primarily to the continuation of our program to retrofit or remove high-bleed pneumatic controllers and convert pneumatic pumps used in our operations to solar power or instrument air. In 2019, EOG completed the removal and/or retrofit of all high-bleed pneumatic controllers across its operations. See pages 12 and 14 for further discussion.
OTHER SOURCES
Our GHG emissions from other sources are minor and include fugitives and venting. Our GHG intensity rate from other sources remained relatively flat in 2019 due to our ongoing LDAR program throughout our operations.
In 2020, we have continued our LDAR program and further assessed opportunities to minimize emissions through centralizing facilities and utilizing new technologies. See pages 12 and 15 for further discussion.
COMBUSTION SOURCES
Although increased production led to greater use of compression equipment, our combustion emissions intensity rate decreased in 2019 due to continued efficiency gains and improved measurement of fuel use. In addition, we expanded our use of electric hydraulic fracturing fleets (e-fracs), which decreased our use of diesel fuel to power equipment. In 2020, we have continued to review our production process to identify additional opportunities for emissions reductions from combustion, including bringing online our solar project that we initiated in the fall 2019. See page 14 for further discussion of our solar project.
| 17
Environmental
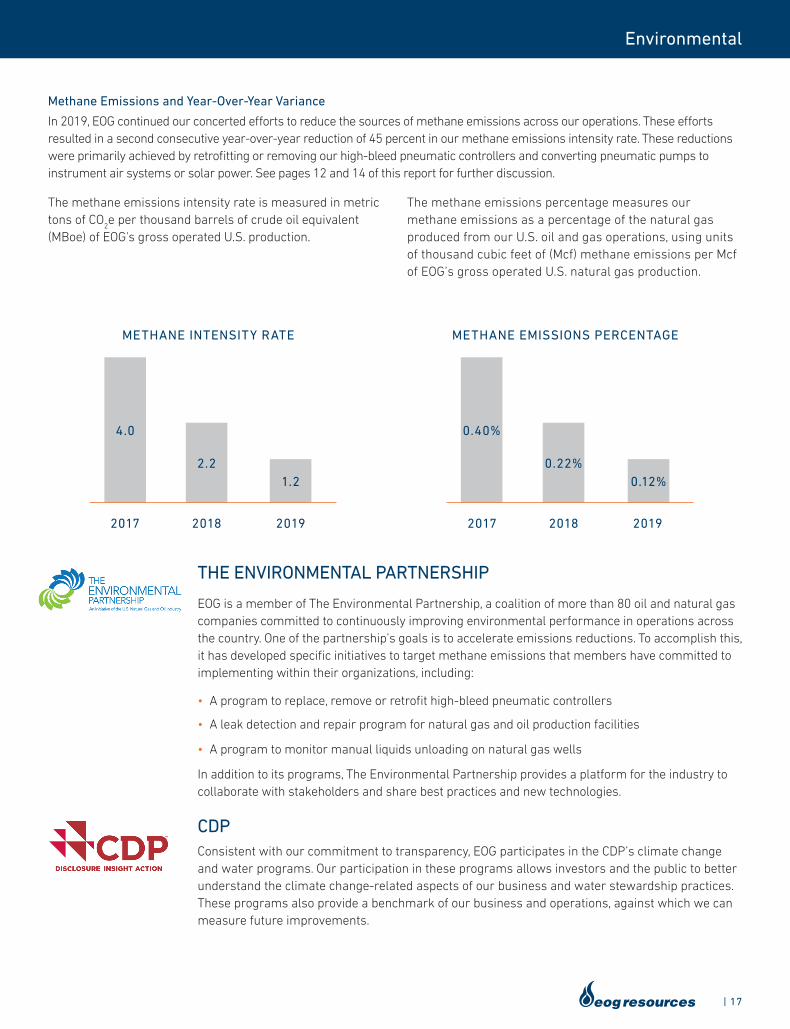
Methane Emissions and Year-Over-Year Variance
In 2019, EOG continued our concerted efforts to reduce the sources of methane emissions across our operations. These efforts resulted in a second consecutive year-over-year reduction of 45 percent in our methane emissions intensity rate. These reductions were primarily achieved by retrofitting or removing our high-bleed pneumatic controllers and converting pneumatic pumps to instrument air systems or solar power. See pages 12 and 14 of this report for further discussion.
The methane emissions intensity rate is measured in metric tons of CO
2e per thousand barrels of crude oil equivalent
(MBoe) of EOG's gross operated U.S. production.
The methane emissions percentage measures our methane emissions as a percentage of the natural gas produced from our U.S. oil and gas operations, using units of thousand cubic feet of (Mcf) methane emissions per Mcf of EOG’s gross operated U.S. natural gas production.
METHANE INTENSITY RATE
2017 2018 2019
1.22.2
4.0
METHANE EMISSIONS PERCENTAGE
2017 2018 2019
0.12%0.22%
0.40%
THE ENVIRONMENTAL PARTNERSHIP
EOG is a member of The Environmental Partnership, a coalition of more than 80 oil and natural gas companies committed to continuously improving environmental performance in operations across the country. One of the partnership’s goals is to accelerate emissions reductions. To accomplish this, it has developed specific initiatives to target methane emissions that members have committed to implementing within their organizations, including:
• A program to replace, remove or retrofit high-bleed pneumatic controllers
• A leak detection and repair program for natural gas and oil production facilities
• A program to monitor manual liquids unloading on natural gas wells
In addition to its programs, The Environmental Partnership provides a platform for the industry to collaborate with stakeholders and share best practices and new technologies.
CDPConsistent with our commitment to transparency, EOG participates in the CDP’s climate change and water programs. Our participation in these programs allows investors and the public to better understand the climate change-related aspects of our business and water stewardship practices. These programs also provide a benchmark of our business and operations, against which we can measure future improvements.
18 |
Environmental
HYDRAULIC FRACTURING
Hydraulic fracturing is part of a well's "completion" process, in which pressurized fluid is pumped into underground formations to create tiny fractures or spaces that allow crude oil and natural gas to flow more easily from the reservoir into the well so that it can be brought to the surface. It enables EOG to produce crude oil and natural gas from formations that would otherwise not be recovered.
Hydraulic fracturing technology has been safely used by the oil and gas industry for decades. More than one million wells have been hydraulically fractured and the technique is constantly being refined to improve the stimulation of a well and maximize reserve recovery.
Studies conducted by respected regulators and authorities — including the EPA, the Ground Water Protection Council, and the Interstate Oil and Gas Compact Commission — have verified that hydraulic fracturing is safe and non-threatening to human health and poses little or no risk to underground sources of drinking water.
EOG takes numerous steps to conduct our hydraulic fracturing operations safely and responsibly, including:
Baseline Groundwater Testing
A key component of EOG’s water management practices is the performance of baseline water sampling prior to drilling a well in a new area. When testing in areas where regulatory requirements have not been established, we use an internal sampling program based on best practices developed by state and local authorities. Samples are sent to certified third-party laboratories for independent testing.
Wellbore Integrity
Prior to drilling any well, EOG also performs site-specific analysis to determine the design and techniques that will be implemented to maintain the integrity of the wellbore throughout the geologic formations the well will intersect.
To maintain wellbore integrity, we use cement isolation of casing string, which are lengths of steel pipe. Other standard practices include surface casing tests and annular pressure monitoring.
• Surface casing is the primary steel pipe to be set in the vertical wellbore. This section of casing can run several thousand feet deep and performs many functions including the protection of shallow water aquifers, if present. The integrity of the surface casing is tested prior to flowing the well as a further measure of protection.
• Annular pressure is the pressure that exists in the space between the well casing and internal production tubing. To protect wellbore casing, we establish a maximum allowable annular pressure for each well we operate and monitor this pressure through the life of the well.
We actively work with industry groups to ensure that state regulations for wellbore integrity remain up-to-date and incorporate evolving technology and best practices.
Minimizing Chemical Additives
While chemical additives used in hydraulic fracturing fluid are typically less than one percent of the fluids used, one of EOG’s ongoing goals is to further minimize the amount of chemicals used to complete our wells.
Transparency
EOG publicly discloses the fracturing fluids used for 100 percent of our well completions on the industry website FracFocus.org (hosted by the Ground Water Protection Council and the Interstate Oil and Gas Compact Commission).
| 19
Environmental
WATER MANAGEMENT
Responsibly managing the water used, produced, treated, stored and disposed of during our operations in a cost-effective and environmentally sustainable manner is essential to EOG’s success.
Every oil and gas producing region has unique risks and opportunities regarding water, from identifying sources and reuse options to determining the best methods for water transportation and disposal. We address these risks and opportunities in a number of ways:
• We use an integrated, cross-functional approach, evaluating the full life cycle of water used in our operations, from acquisition through transportation, storage, production, treatment, reuse and disposal.
• We engage with stakeholders in the communities where we operate to better understand the unique characteristics of the region and to discuss and collaborate on our water management plans.
• We conduct a comprehensive evaluation of available sources of water in each of our operating areas, including water reuse and conservation options that are available to be implemented in the area.
• We leverage our strategic water resources team to accelerate the implementation of best practices throughout the company.
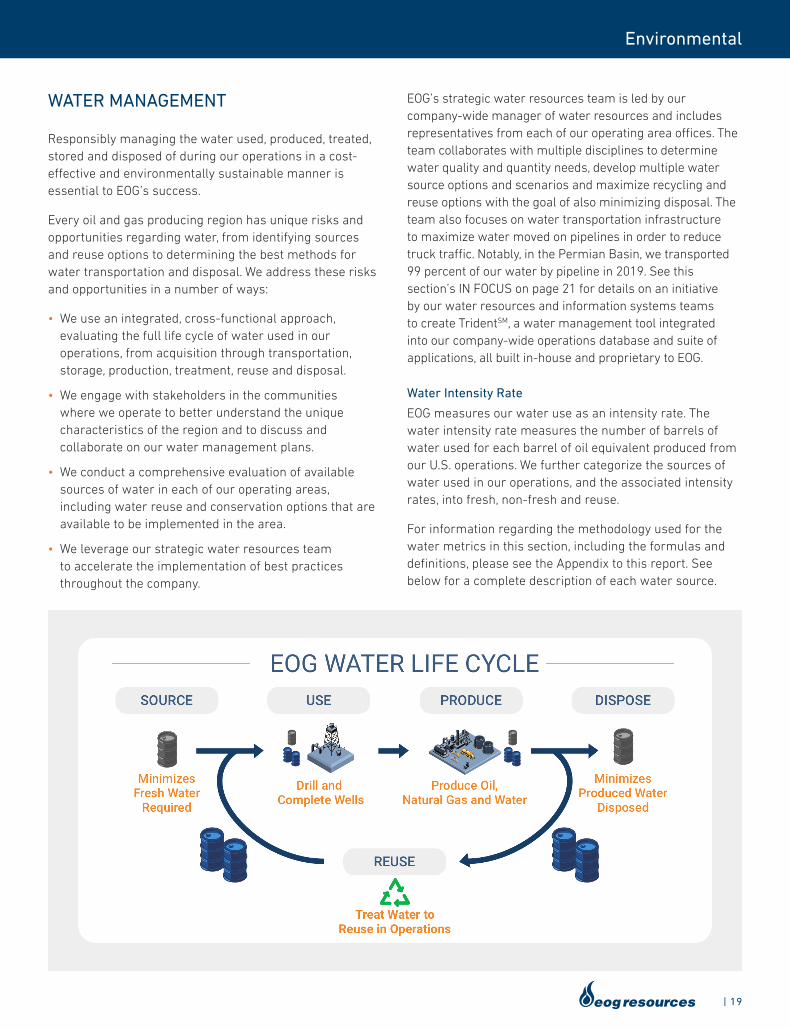
EOG’s strategic water resources team is led by our company-wide manager of water resources and includes representatives from each of our operating area offices. The team collaborates with multiple disciplines to determine water quality and quantity needs, develop multiple water source options and scenarios and maximize recycling and reuse options with the goal of also minimizing disposal. The team also focuses on water transportation infrastructure to maximize water moved on pipelines in order to reduce truck traffic. Notably, in the Permian Basin, we transported 99 percent of our water by pipeline in 2019. See this section’s IN FOCUS on page 21 for details on an initiative by our water resources and information systems teams to create TridentSM, a water management tool integrated into our company-wide operations database and suite of applications, all built in-house and proprietary to EOG.
Water Intensity Rate
EOG measures our water use as an intensity rate. The water intensity rate measures the number of barrels of water used for each barrel of oil equivalent produced from our U.S. operations. We further categorize the sources of water used in our operations, and the associated intensity rates, into fresh, non-fresh and reuse.
For information regarding the methodology used for the water metrics in this section, including the formulas and definitions, please see the Appendix to this report. See below for a complete description of each water source.
20 |
Environmental
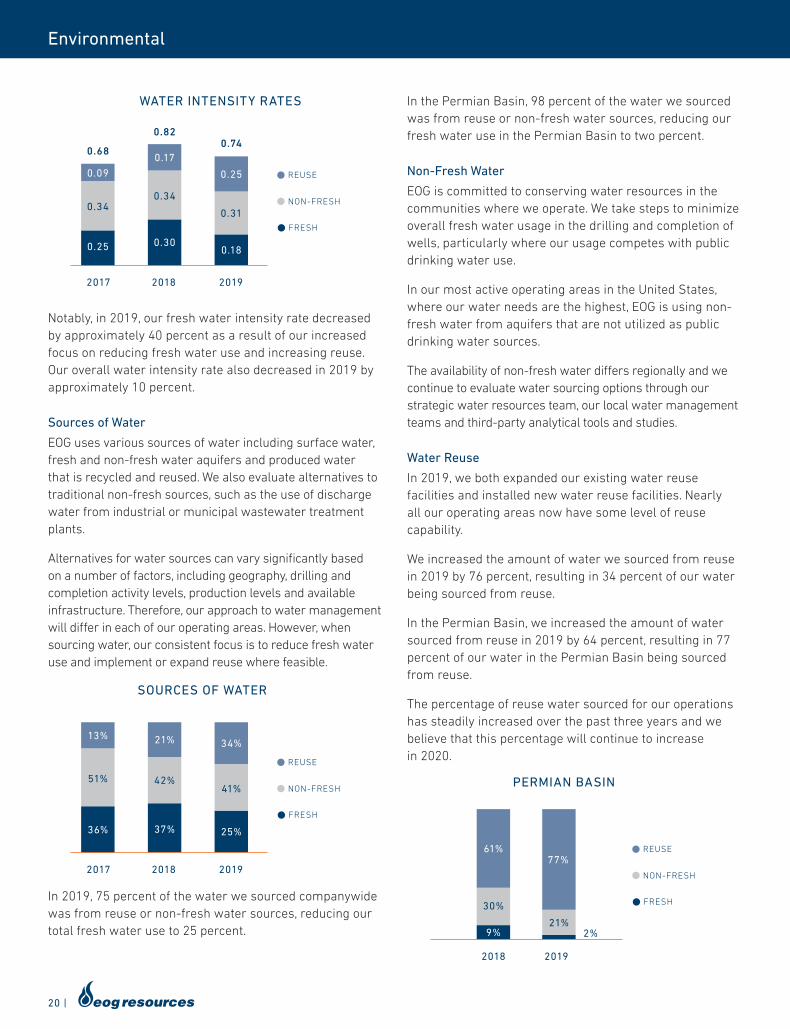
In the Permian Basin, 98 percent of the water we sourced was from reuse or non-fresh water sources, reducing our fresh water use in the Permian Basin to two percent.
Non-Fresh Water
EOG is committed to conserving water resources in the communities where we operate. We take steps to minimize overall fresh water usage in the drilling and completion of wells, particularly where our usage competes with public drinking water use.
In our most active operating areas in the United States, where our water needs are the highest, EOG is using non-fresh water from aquifers that are not utilized as public drinking water sources.
The availability of non-fresh water differs regionally and we continue to evaluate water sourcing options through our strategic water resources team, our local water management teams and third-party analytical tools and studies.
Water Reuse
In 2019, we both expanded our existing water reuse facilities and installed new water reuse facilities. Nearly all our operating areas now have some level of reuse capability.
We increased the amount of water we sourced from reuse in 2019 by 76 percent, resulting in 34 percent of our water being sourced from reuse.
In the Permian Basin, we increased the amount of water sourced from reuse in 2019 by 64 percent, resulting in 77 percent of our water in the Permian Basin being sourced from reuse.
The percentage of reuse water sourced for our operations has steadily increased over the past three years and we believe that this percentage will continue to increase in 2020.
Notably, in 2019, our fresh water intensity rate decreased by approximately 40 percent as a result of our increased focus on reducing fresh water use and increasing reuse. Our overall water intensity rate also decreased in 2019 by approximately 10 percent.
Sources of Water
EOG uses various sources of water including surface water, fresh and non-fresh water aquifers and produced water that is recycled and reused. We also evaluate alternatives to traditional non-fresh sources, such as the use of discharge water from industrial or municipal wastewater treatment plants.
Alternatives for water sources can vary significantly based on a number of factors, including geography, drilling and completion activity levels, production levels and available infrastructure. Therefore, our approach to water management will differ in each of our operating areas. However, when sourcing water, our consistent focus is to reduce fresh water use and implement or expand reuse where feasible.
In 2019, 75 percent of the water we sourced companywide was from reuse or non-fresh water sources, reducing our total fresh water use to 25 percent.
WATER INTENSITY RATES
NON-FRESH
REUSE
FRESH
2017 2018 2019
0.25
0.34
0.09
0.68
0.820.74
0.30
0.34
0.17
0.18
0.31
0.25
PERMIAN BASIN
NON-FRESH
REUSE
FRESH
2018 2019
9%
30%
61%
2%21%
77%
SOURCES OF WATER
NON-FRESH
REUSE
FRESH
2017 2018 2019
36%
51%
13%
37%
42%
21%
25%
41%
34%
| 21
Environmental
IN FOCUS
TRIDENTSM – NEXT GENERATION WATER MANAGEMENT
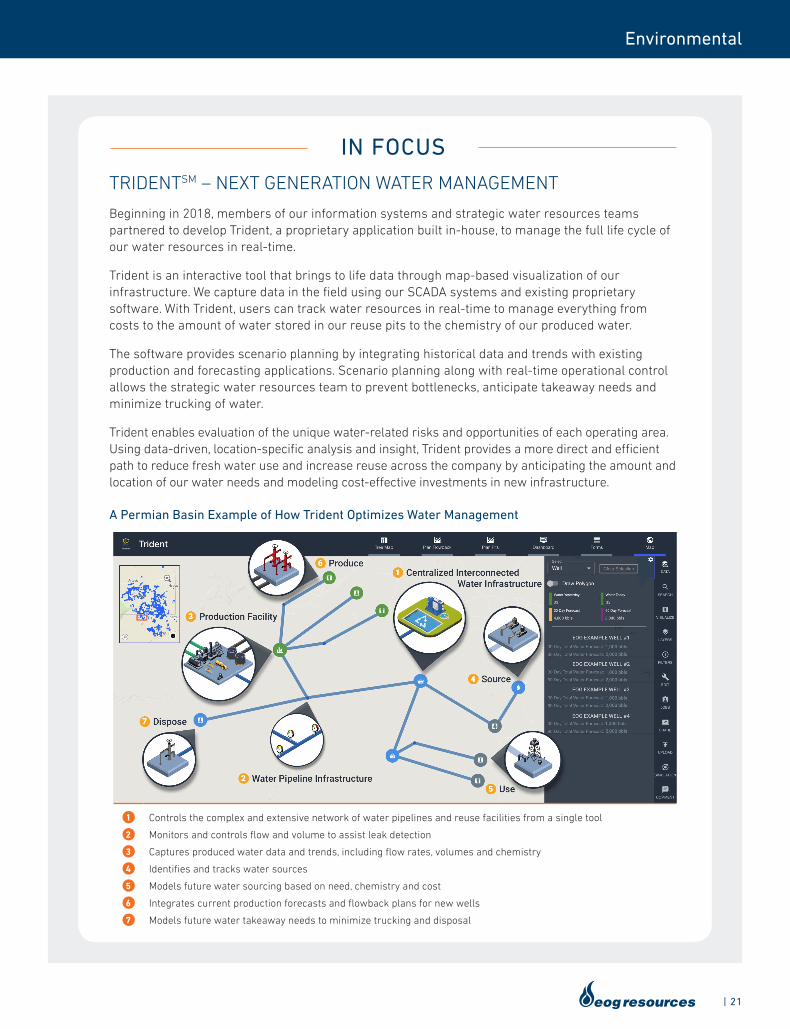
Beginning in 2018, members of our information systems and strategic water resources teams partnered to develop Trident, a proprietary application built in-house, to manage the full life cycle of our water resources in real-time.
Trident is an interactive tool that brings to life data through map-based visualization of our infrastructure. We capture data in the field using our SCADA systems and existing proprietary software. With Trident, users can track water resources in real-time to manage everything from costs to the amount of water stored in our reuse pits to the chemistry of our produced water.
The software provides scenario planning by integrating historical data and trends with existing production and forecasting applications. Scenario planning along with real-time operational control allows the strategic water resources team to prevent bottlenecks, anticipate takeaway needs and minimize trucking of water.
Trident enables evaluation of the unique water-related risks and opportunities of each operating area. Using data-driven, location-specific analysis and insight, Trident provides a more direct and efficient path to reduce fresh water use and increase reuse across the company by anticipating the amount and location of our water needs and modeling cost-effective investments in new infrastructure.
A Permian Basin Example of How Trident Optimizes Water Management
1 Controls the complex and extensive network of water pipelines and reuse facilities from a single tool
2 Monitors and controls flow and volume to assist leak detection
3 Captures produced water data and trends, including flow rates, volumes and chemistry
4 Identifies and tracks water sources
5 Models future water sourcing based on need, chemistry and cost
6 Integrates current production forecasts and flowback plans for new wells
7 Models future water takeaway needs to minimize trucking and disposal
22 |
Environmental
SPILL PREVENTION AND MANAGEMENT
EOG’s goal is to proactively minimize, and seek to eliminate, risks posed to the community, environment and our employees and contractors from the handling of waste and hazardous materials.
EOG conducts regular inspections and preventative maintenance on our equipment and facilities and uses multiple other methods to minimize the risk of spills, such as:
• secondary containment on tanks
• “nearly full” tank alarms
• control room monitoring equipment with the ability to shut-in facilities remotely
EOG also has pipeline leak detection systems that are monitored by EOG personnel to minimize response time in the event of an incident.
If a spill does occur, our spill prevention and management plans are designed to quickly contain the spill and implement recovery efforts to minimize the environmental impact. Spill prevention and management plans are prepared and maintained by EOG staff across our operating areas. These plans include site-specific information and cover spill prevention, spill control, spill countermeasures, waste management and flowline integrity.
Additionally, training is regularly conducted to review the requirements of the plans and personnel responsibilities. This training includes incident command system training focused on responding to emergencies.
2019 OIL SPILL RATE & RECOVERY
EOG tracks and documents the volume and frequency of oil spills from our U.S. operations, as well as the volumes of oil we recover from those spills. We also consider our oil spill rate performance in our executive compensation program.
EOG utilizes spills greater than five barrels as our reporting threshold because it is the most common regulatory spill reporting threshold for our primary operating areas. For more information regarding this spill rate metric, including the relevant definitions and the regulatory spill reporting requirements (i.e., volume thresholds) for our primary operating areas, please see the Appendix to this report.
Our oil spill rate of 0.009 in 2019 continued a downward trend from recent years, excluding 2018, when the rate was higher due to a mechanical issue at a single well facility. Our unrecovered oil rate for 2019 decreased by 67 percent from 2018, and our oil recovery rate for oil spills in 2019 was 75 percent.
RECOVERED OIL RATE(Spilled Bbls Recovered per US MBoe Produced)
OIL SPILL RATE(Bbls Spilled (Spills Over Five Bbls) per US MBoe Produced)
UNRECOVERED OIL RATE(Spilled Bbls Not Recovered per US MBoe Produced)
2018 2019
0.006
0.041
0.002
0.008
2017
0.002
0.007
0.0100.009
0.047
| 23
Environmental
BIODIVERSITY
EOG is committed to conserving biodiversity by integrating habitat and wildlife conservation in the planning and management of our exploration and production activities. We proactively work with stakeholders in our communities to collaborate on conservation initiatives and focus on the unique biodiversity features specific to each operating area. In addition, by downsizing and centralizing our drilling and production facilities, and using directional and horizontal drilling technology with longer laterals, we are able to reduce our overall surface footprint. For discussion of our land reclamation and restoration efforts, see the IN FOCUS “Reclaiming and Restoring Land” on page 8.
Supporting Raptor Populations in the Wyoming Powder River Basin
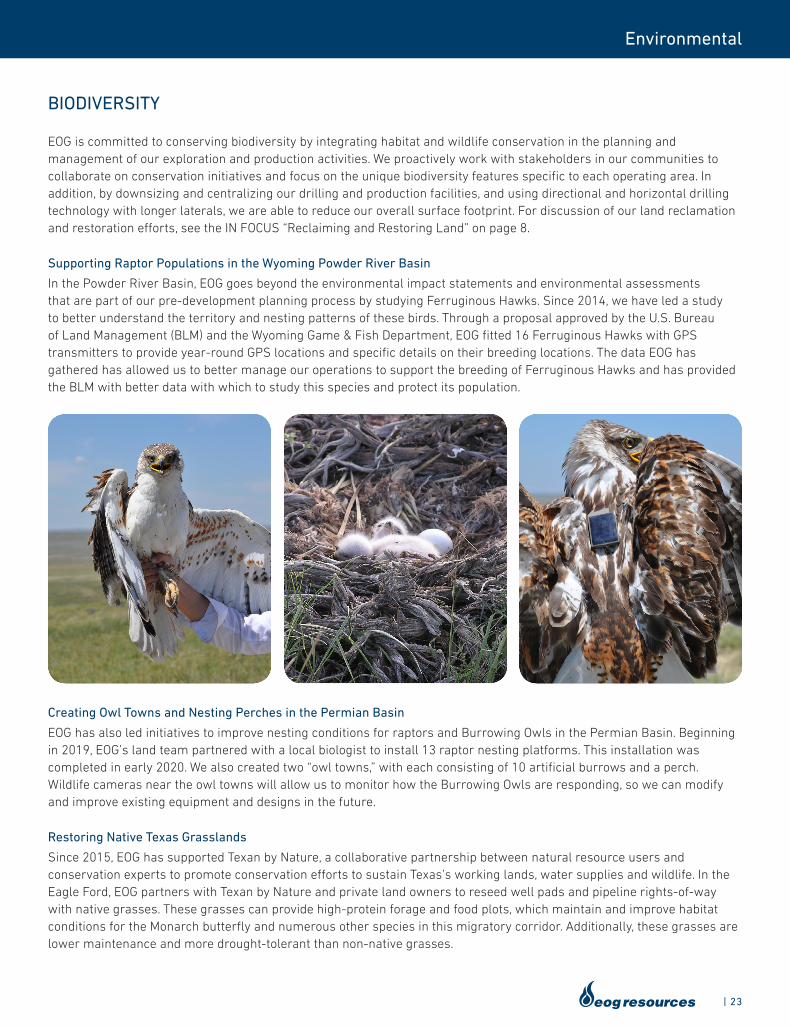
In the Powder River Basin, EOG goes beyond the environmental impact statements and environmental assessments that are part of our pre-development planning process by studying Ferruginous Hawks. Since 2014, we have led a study to better understand the territory and nesting patterns of these birds. Through a proposal approved by the U.S. Bureau of Land Management (BLM) and the Wyoming Game & Fish Department, EOG fitted 16 Ferruginous Hawks with GPS transmitters to provide year-round GPS locations and specific details on their breeding locations. The data EOG has gathered has allowed us to better manage our operations to support the breeding of Ferruginous Hawks and has provided the BLM with better data with which to study this species and protect its population.
Creating Owl Towns and Nesting Perches in the Permian Basin
EOG has also led initiatives to improve nesting conditions for raptors and Burrowing Owls in the Permian Basin. Beginning in 2019, EOG’s land team partnered with a local biologist to install 13 raptor nesting platforms. This installation was completed in early 2020. We also created two “owl towns,” with each consisting of 10 artificial burrows and a perch. Wildlife cameras near the owl towns will allow us to monitor how the Burrowing Owls are responding, so we can modify and improve existing equipment and designs in the future.
Restoring Native Texas Grasslands
Since 2015, EOG has supported Texan by Nature, a collaborative partnership between natural resource users and conservation experts to promote conservation efforts to sustain Texas’s working lands, water supplies and wildlife. In the Eagle Ford, EOG partners with Texan by Nature and private land owners to reseed well pads and pipeline rights-of-way with native grasses. These grasses can provide high-protein forage and food plots, which maintain and improve habitat conditions for the Monarch butterfly and numerous other species in this migratory corridor. Additionally, these grasses are lower maintenance and more drought-tolerant than non-native grasses.
24 |
Social
OUR COMMUNITIES
Community engagement is important to EOG. We are a decentralized company, so a large number of our employees and their families are members of the local communities in the areas where we operate. In addition, our employees regularly interact with property owners where we operate. We also proactively engage with others in the communities, including civic leaders, elected officials, first responders, non-profits and local community groups.
Respect for Cultures, Traditions and Indigenous Peoples
EOG strives to respect human rights and native lands as well as to honor the traditions and the cultural, social and religious beliefs of others. Our culture is based upon core values that reflect our expectations that conduct and behavior should exhibit and model respect for human rights. One of the guideposts for our culture is our Code of Business Conduct and Ethics for Directors, Officers and Employees and Code of Business Conduct and Ethics for Vendors and Contractors, which set out key tenets of behavior, including promoting honesty, integrity, fair dealing, mutual respect and conducting our business with high ethical and environmental standards. In addition, obeying the law, both in letter and in spirit, including laws with respect to human rights, such as laws prohibiting discrimination in the workplace, is part of the foundation of the ethical standards by which we conduct business and by which we expect our vendors and contractors to conduct business.
Our Codes of Business Conduct and Ethics provide guidance on human rights issues such as non-discrimination, anti-harassment, workplace safety and equal employment opportunities. Actual or suspected misconduct, including human rights violations, can be anonymously and confidentially reported to our 24-hour Compliance and Ethics Hotline. See “Ethical Business Practices” beginning on page 37 for further discussion of our Codes of Business Conduct and Ethics and Compliance and Ethics Hotline.
While EOG does not have a large presence on Native American lands, we do have active operations at the Fort Berthold Reservation in North Dakota and at the Uintah and Ouray Reservation in Utah. EOG values our operations on the Native American lands in North Dakota and Utah, and partners with local Native American tribes. Various tribal members are employees of EOG, and we utilize Native American service providers in our operations.
In addition, as part of our commitment to respect native heritage resources, we proactively engage federal, state and local land management agencies in multiple jurisdictions to create cooperative cultural review and assessment protocols. Our goal in these efforts is to address site-specific concerns based on stakeholder input, local knowledge and cultural preservation best practices.
Engaging in Our Communities: Building and Preserving Our Relationships
EOG employees appreciate how important it is to develop and maintain mutually beneficial relationships in the communities where we live and work. We are proud to give back to these communities in many ways.
The largest and most direct way is by providing diverse career opportunities, a large percentage of which EOG fills with local candidates. For example, while our international footprint is small, approximately 97 percent of our employees in Trinidad are local nationals.
EOG also provides significant local and state tax revenue through our operations. Communities benefit from safer roads, high-quality schools, first-rate healthcare and a trained work force. EOG supports numerous efforts to help improve these aspects of the lives of citizens in the communities where we live and work.
We believe our decentralized structure allows us to develop and maintain close working relationships with local stakeholders and to effectively engage on a regular basis in ways that are responsive to their specific needs. In particular, our land personnel in each of our operating areas work closely with surface and mineral owners to communicate plans and address questions and concerns. In addition, EOG’s land administration call center is dedicated to addressing questions from interest owners, including inquiries related to land and royalty ownership.
Community Safety and Security
EOG recognizes the importance of helping make the communities in which we live and work more safe and secure.
Human Trafficking
EOG has taken steps to raise awareness and conduct training regarding the prevention of human trafficking. EOG is a corporate sponsor of Truckers Against Trafficking, a non-profit organization that was formed to educate, equip, empower and
| 25
Social
mobilize members of the trucking, bus and energy industries to combat human trafficking. Identifying potential human trafficking is discussed in EOG safety meetings for employees and contractors, including the review of human trafficking prevention training materials created specifically for energy companies by Truckers Against Trafficking.
EOG is also an active member in industry groups working to raise awareness of, and prevent, human trafficking. As a member of the Oil & Gas Trafficking Awareness Group, EOG meets with other oil and gas companies to discuss the role companies can play in these efforts. In addition, an EOG representative serves on the Board of Directors of the Energy Security Council, an organization that brings together members of the energy industry and law enforcement to collaborate and share best practices on different issues, including human trafficking.
Road Safety
EOG is committed to keeping the roads in and around our communities safe.
• Awareness – Our Safe Practices Manual provided to EOG employees and contractors contains vehicle safety guidance.
• Training – Safe driving practices are a common focus in our field safety meetings and we also offer specific hands-on, decision-based driving training.
• GPS Monitoring – EOG vehicles are equipped with GPS-based vehicle monitoring systems that provide data for driver feedback that increases driver awareness and allows for focused driver skills training.
• Route Planning – In our operating areas, we thoughtfully plan our travel logistics and, where possible, we route truck traffic onto secondary roads and time our activities outside of local high-traffic times.
Partnering with First Responders
EOG regularly meets with first responders in our communities to discuss the scope of EOG’s operations and to collaborate on emergency preparedness. In addition, we have donated equipment to, and funded equipment and training for, local fire and police departments.
Permian Strategic Partnership
EOG is a founding member of the Permian Strategic Partnership (PSP). The PSP, which was formed by oil and gas companies operating in the Permian Basin region,
collaborates with citizens, community organizations, private foundations, civic leaders and elected officials to develop solutions to strengthen local communities in West Texas and Southeast New Mexico.
The PSP is focused on improving the quality of life of those who live in the Permian Basin region, through long-term projects that result in better roads, quality schools, affordable housing, improved health care and a well-educated and trained work force.
In 2019, the PSP committed funds to support the following projects:
• Establish 14 public charter schools in the Midland and Odessa, Texas, school districts. The first school opened in August 2020.
• Construct and develop a new career technical education high school in Hobbs, New Mexico, to serve a growing number of students and better prepare them for technical jobs available across the Permian Basin region.
• Expand a Texas Tech University Health Sciences Center program that trains medical residents to work in underserved areas of Texas and New Mexico.
• Provide professional grant writing services to local governments, school districts and non-profits in Lea and Eddy Counties, New Mexico, to strengthen their ability to successfully compete for state, federal and private grant programs.
• Provide discounts on 200 apartment rentals for new or current public school teachers in the Midland and Odessa, Texas school districts for the 2019-2020 school year.
The PSP also supported advocacy efforts in Texas, New Mexico and Washington, D.C., focused on additional state and federal investment in road infrastructure, which resulted in nearly $1 billion in funding for road improvements throughout the Permian Basin region.
EOG will continue to collaborate with the PSP to identify opportunities to address the quality of life in the Permian Basin region, and will commit its people, expertise, resources and leadership to develop solutions in local partnership with civic leaders, elected officials and the local communities.
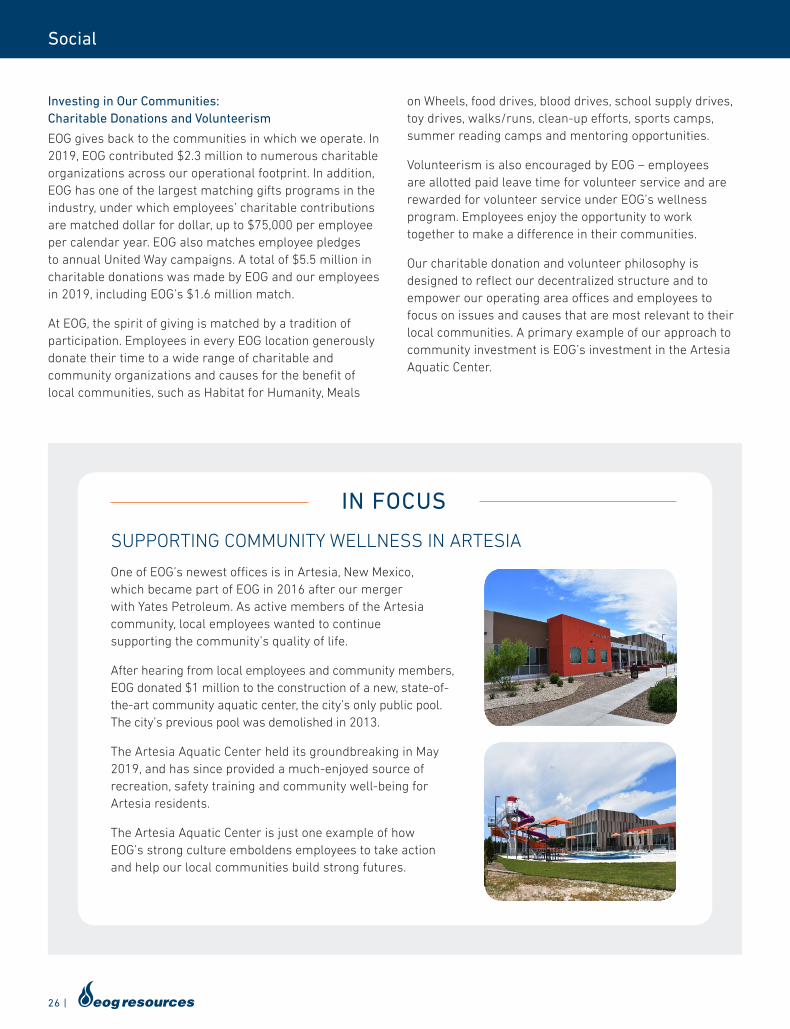
26 |
Social
Investing in Our Communities: Charitable Donations and Volunteerism
EOG gives back to the communities in which we operate. In 2019, EOG contributed $2.3 million to numerous charitable organizations across our operational footprint. In addition, EOG has one of the largest matching gifts programs in the industry, under which employees’ charitable contributions are matched dollar for dollar, up to $75,000 per employee per calendar year. EOG also matches employee pledges to annual United Way campaigns. A total of $5.5 million in charitable donations was made by EOG and our employees in 2019, including EOG’s $1.6 million match.
At EOG, the spirit of giving is matched by a tradition of participation. Employees in every EOG location generously donate their time to a wide range of charitable and community organizations and causes for the benefit of local communities, such as Habitat for Humanity, Meals
on Wheels, food drives, blood drives, school supply drives, toy drives, walks/runs, clean-up efforts, sports camps, summer reading camps and mentoring opportunities.
Volunteerism is also encouraged by EOG – employees are allotted paid leave time for volunteer service and are rewarded for volunteer service under EOG’s wellness program. Employees enjoy the opportunity to work together to make a difference in their communities.
Our charitable donation and volunteer philosophy is designed to reflect our decentralized structure and to empower our operating area offices and employees to focus on issues and causes that are most relevant to their local communities. A primary example of our approach to community investment is EOG’s investment in the Artesia Aquatic Center.
IN FOCUS
SUPPORTING COMMUNITY WELLNESS IN ARTESIA
One of EOG’s newest offices is in Artesia, New Mexico, which became part of EOG in 2016 after our merger with Yates Petroleum. As active members of the Artesia community, local employees wanted to continue supporting the community’s quality of life.
After hearing from local employees and community members, EOG donated $1 million to the construction of a new, state-of-the-art community aquatic center, the city’s only public pool. The city’s previous pool was demolished in 2013.
The Artesia Aquatic Center held its groundbreaking in May 2019, and has since provided a much-enjoyed source of recreation, safety training and community well-being for Artesia residents.
The Artesia Aquatic Center is just one example of how EOG’s strong culture emboldens employees to take action and help our local communities build strong futures.
| 27
Social
Our other community investments primarily center on health, STEM education and community vitality and quality of life.
Health
EOG employees are passionate about helping to find solutions to health challenges that can affect those in our families and communities, including:
• Sponsoring Bike MS teams in Houston, San Antonio and Midland. EOG hit a milestone in 2019 with lifetime fundraising efforts for Bike MS surpassing $3 million, including over $400,000 raised in 2019. Since 2000, over 1,100 EOG Bike MS team members have come together to support Bike MS in moving closer to a world free of multiple sclerosis.
• Providing financial support to the Carl McCain Memorial Foundation to help individuals and families who have worked in the energy industry cover expenses when they are financially burdened by medical expenses.
• Partnering with Pink the Basin, a nonprofit organization that seeks to raise awareness about breast cancer and increase access to mammograms in the Permian Basin region.
STEM Education
Science, technology, engineering and mathematics (STEM) education helps students become technologically literate so they can understand and solve modern, complex challenges, including those related to energy. EOG supports future innovators and leaders in the energy industry by contributing to STEM programs, including:
• Partnering with the University of Texas to support its Center for Petroleum and Geosystems Engineering Workforce Initiative Program and its Friends of Computer Science Program.
• Supporting and partnering with the IPAA/PESA Energy Education Center by funding scholarships for graduates of the five engineering, geoscience and leadership academies at high schools in the Houston and Fort Worth school districts, providing interview coaching to academy alumni and sponsoring the IPAA Education Foundation Exploring Energy High School Conference.
• Providing financial support for Rice University School House Mania, where 3,500 students participated in STEM activities led by the Rice University School Mathematics Project prior to a Rice University men’s basketball game.
Community Vitality and Quality of Life
EOG also engages in projects and programs to help improve quality of life and community vitality in the communities where we live and work, including:
• Working with Habitat for Humanity for the past three years to build homes in metro Denver, where housing is a key need in the community. In 2019, 90 percent of our Denver employees made financial contributions to Habitat for Humanity and our Denver employees also volunteered their time to build homes.
• Sponsoring students from Cristo Rey Jesuit college preparatory school in Houston through a unique corporate work-study program, which allows students of limited economic resources to gain work experience and earn up to 50 percent of the cost of their education.
• Partnering with the Barbara Bush Houston Literacy Foundation to help Houstonians achieve individual, family and community success through the power of literacy.
• Providing financial support to New Hope Housing in Houston to help provide shelter and other support services so that homeless adults can reenter the workforce.
• Supporting organizations focused on initiatives to help women and children, including the Women’s Resource of Greater Houston, Casa de Esperanza, the Children’s Fund and Texas Center for the Missing.
In response to the COVID-19 pandemic, EOG committed numerous resources to help meet the sudden needs of the local communities where we live and work. We donated more than 3,400 masks, as well as shoe coverings, hand sanitizer and safety glasses to health care workers across our operating areas. We also contributed financially to a local brewery to make hand sanitizer for first responders in North Dakota. In addition, EOG and our employees have committed more than $820,000 toward local food banks as part of a 2-for-1 company-matching program. Throughout the year, we will continue to evaluate the needs of our communities and provide support wherever possible.
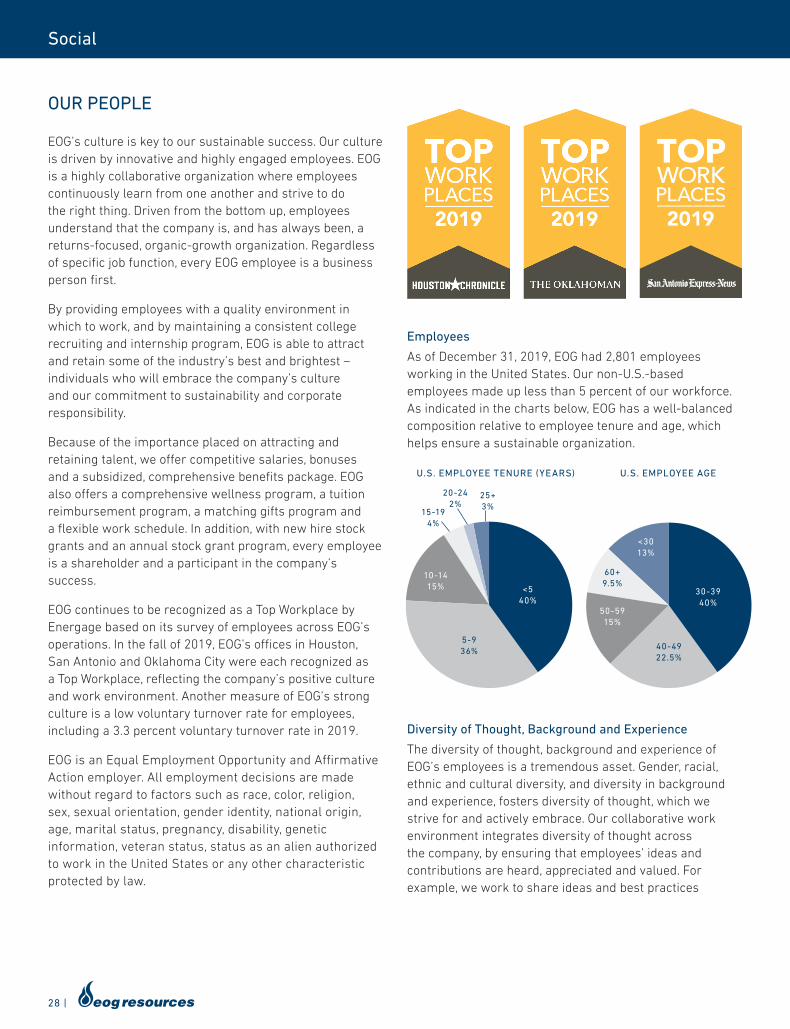
28 |
Social
OUR PEOPLE
EOG’s culture is key to our sustainable success. Our culture is driven by innovative and highly engaged employees. EOG is a highly collaborative organization where employees continuously learn from one another and strive to do the right thing. Driven from the bottom up, employees understand that the company is, and has always been, a returns-focused, organic-growth organization. Regardless of specific job function, every EOG employee is a business person first.
By providing employees with a quality environment in which to work, and by maintaining a consistent college recruiting and internship program, EOG is able to attract and retain some of the industry’s best and brightest – individuals who will embrace the company’s culture and our commitment to sustainability and corporate responsibility.
Because of the importance placed on attracting and retaining talent, we offer competitive salaries, bonuses and a subsidized, comprehensive benefits package. EOG also offers a comprehensive wellness program, a tuition reimbursement program, a matching gifts program and a flexible work schedule. In addition, with new hire stock grants and an annual stock grant program, every employee is a shareholder and a participant in the company’s success.
EOG continues to be recognized as a Top Workplace by Energage based on its survey of employees across EOG’s operations. In the fall of 2019, EOG’s offices in Houston, San Antonio and Oklahoma City were each recognized as a Top Workplace, reflecting the company’s positive culture and work environment. Another measure of EOG’s strong culture is a low voluntary turnover rate for employees, including a 3.3 percent voluntary turnover rate in 2019.
EOG is an Equal Employment Opportunity and Affirmative Action employer. All employment decisions are made without regard to factors such as race, color, religion, sex, sexual orientation, gender identity, national origin, age, marital status, pregnancy, disability, genetic information, veteran status, status as an alien authorized to work in the United States or any other characteristic protected by law.
Employees
As of December 31, 2019, EOG had 2,801 employees working in the United States. Our non-U.S.-based employees made up less than 5 percent of our workforce. As indicated in the charts below, EOG has a well-balanced composition relative to employee tenure and age, which helps ensure a sustainable organization.
Diversity of Thought, Background and Experience
The diversity of thought, background and experience of EOG’s employees is a tremendous asset. Gender, racial, ethnic and cultural diversity, and diversity in background and experience, fosters diversity of thought, which we strive for and actively embrace. Our collaborative work environment integrates diversity of thought across the company, by ensuring that employees’ ideas and contributions are heard, appreciated and valued. For example, we work to share ideas and best practices
U.S. EMPLOYEE TENURE (YEARS)
<540%
5-936%
10-1415%
15-194%
20-242%
25+3%
U.S. EMPLOYEE AGE
30-3940%
40-4922.5%
50-5915%
60+9.5%
<3013%
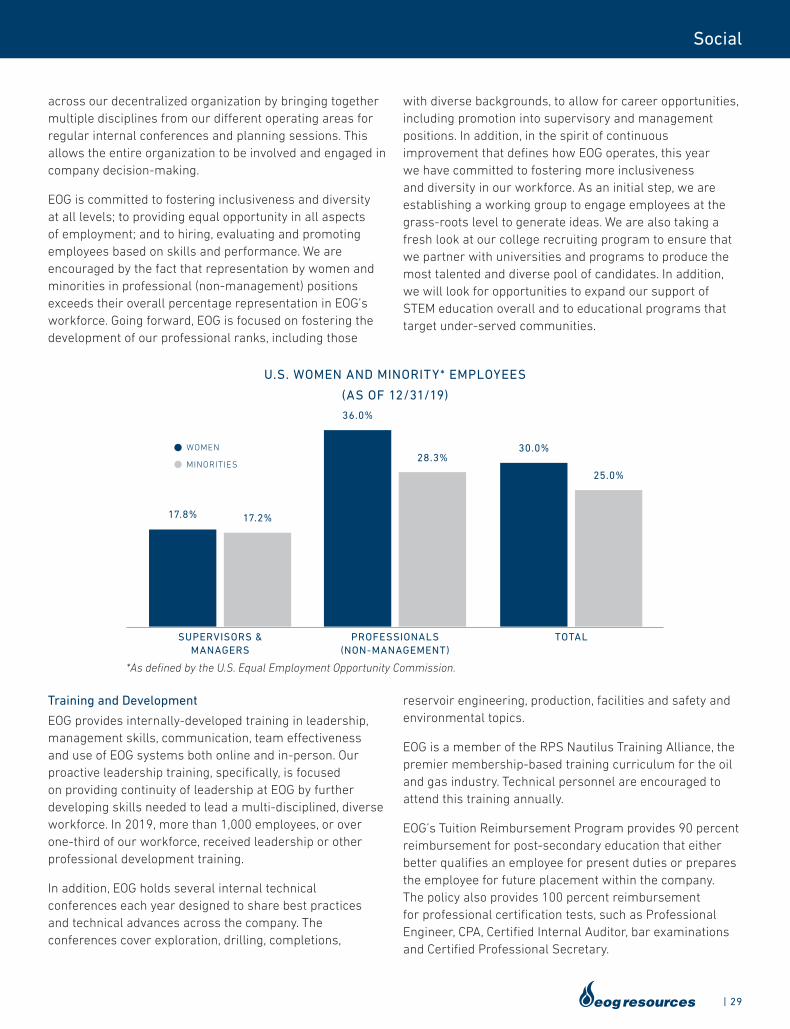
| 29
Social
across our decentralized organization by bringing together multiple disciplines from our different operating areas for regular internal conferences and planning sessions. This allows the entire organization to be involved and engaged in company decision-making.
EOG is committed to fostering inclusiveness and diversity at all levels; to providing equal opportunity in all aspects of employment; and to hiring, evaluating and promoting employees based on skills and performance. We are encouraged by the fact that representation by women and minorities in professional (non-management) positions exceeds their overall percentage representation in EOG’s workforce. Going forward, EOG is focused on fostering the development of our professional ranks, including those
with diverse backgrounds, to allow for career opportunities, including promotion into supervisory and management positions. In addition, in the spirit of continuous improvement that defines how EOG operates, this year we have committed to fostering more inclusiveness and diversity in our workforce. As an initial step, we are establishing a working group to engage employees at the grass-roots level to generate ideas. We are also taking a fresh look at our college recruiting program to ensure that we partner with universities and programs to produce the most talented and diverse pool of candidates. In addition, we will look for opportunities to expand our support of STEM education overall and to educational programs that target under-served communities.
Training and Development
EOG provides internally-developed training in leadership, management skills, communication, team effectiveness and use of EOG systems both online and in-person. Our proactive leadership training, specifically, is focused on providing continuity of leadership at EOG by further developing skills needed to lead a multi-disciplined, diverse workforce. In 2019, more than 1,000 employees, or over one-third of our workforce, received leadership or other professional development training.
In addition, EOG holds several internal technical conferences each year designed to share best practices and technical advances across the company. The conferences cover exploration, drilling, completions,
reservoir engineering, production, facilities and safety and environmental topics.
EOG is a member of the RPS Nautilus Training Alliance, the premier membership-based training curriculum for the oil and gas industry. Technical personnel are encouraged to attend this training annually.
EOG’s Tuition Reimbursement Program provides 90 percent reimbursement for post-secondary education that either better qualifies an employee for present duties or prepares the employee for future placement within the company. The policy also provides 100 percent reimbursement for professional certification tests, such as Professional Engineer, CPA, Certified Internal Auditor, bar examinations and Certified Professional Secretary.
SUPERVISORS &MANAGERS
17.8% 17.2%
36.0%
28.3%30.0%
25.0%
U.S. WOMEN AND MINORITY* EMPLOYEES
(AS OF 12/31/19)
PROFESSIONALS(NON-MANAGEMENT)
TOTAL
MINORITIES
WOMEN
*As defined by the U.S. Equal Employment Opportunity Commission.
30 |
Social
Wellness
We are committed to the health and wellness of our employees. Wellness at EOG encompasses more than just physical health – it includes financial health, social health, community engagement and sense of purpose. It is important to us that our programs and benefits help our employees find success both at work and at home. In 2019, we made several enhancements to our benefits program focused on this holistic approach to employee wellness, including providing paid family care leave, volunteer pay and adoption assistance and increasing paid days off for illness or injury.
Through our Energize You wellness program, employees have the opportunity to earn points that can be used, among other things, to receive cash benefits or to purchase merchandise from an online store. Employees earn points by tracking daily activities such as steps, calorie intake and sleep, participating in health coaching, volunteering in the community, attending safety meetings, making charitable donations, donating blood, taking part in team challenges and more.
EOG also holds annual health fairs in each of our office locations to encourage awareness, education and prevention, and has over 120 active Wellness Ambassadors across the company who volunteer to plan wellness-themed activities in their respective locations. Each location is also allocated funds, based on headcount, which our ambassadors may use for planning onsite wellness-themed events such as Lunch & Learns, or for subsidizing the cost of employee participation in offsite wellness events, such as 5K or 10K runs.
BEYOND THE WORKPLACE, BENEFITS FOR OUR EMPLOYEES INCLUDE:
Paid Family Care Leave
Four weeks of paid time off for the birth, adoption or foster care of a child, or serious health condition of an employee’s spouse, child or parent. This leave is in addition to paid leave available to mothers following the birth of a child.
Paid Leave for Illness or Injury
56 hours of paid time for an employee’s or eligible family member’s illness or injury and routine and preventative medical, dental and vision appointments, in addition to generous short-term disability benefits.
Adoption Assistance
$5,000 in reimbursement to help offset costs associated with adoption.
Employee Assistance Program
A comprehensive, confidential support program to provide employees and their dependents with counseling services to support mental well-being.
Volunteer Pay
Eight hours for a company-sponsored event or any volunteer activity for which hours are documented.
Flexible Work Hours
Early Friday schedules allow most employees a reduced workday on Friday.
In response to the COVID-19 pandemic, we have focused on keeping our employees and their families safe, including by providing technology and support to work from home. Key to effectively making this transition were the ability of our employees to access our proprietary in-house applications from their phones, tablets and home and office computers and our proactive, company-wide integration of an online collaborative work platform and video conferencing prior to the onset of the pandemic. With these tools, our employees not only can work safely and productively from the office or at home, but also remain engaged and connected across the company. In addition, in our offices and at our work sites, we have instituted social distancing practices and protocols and are providing masks, hand sanitizer and additional cleaning.
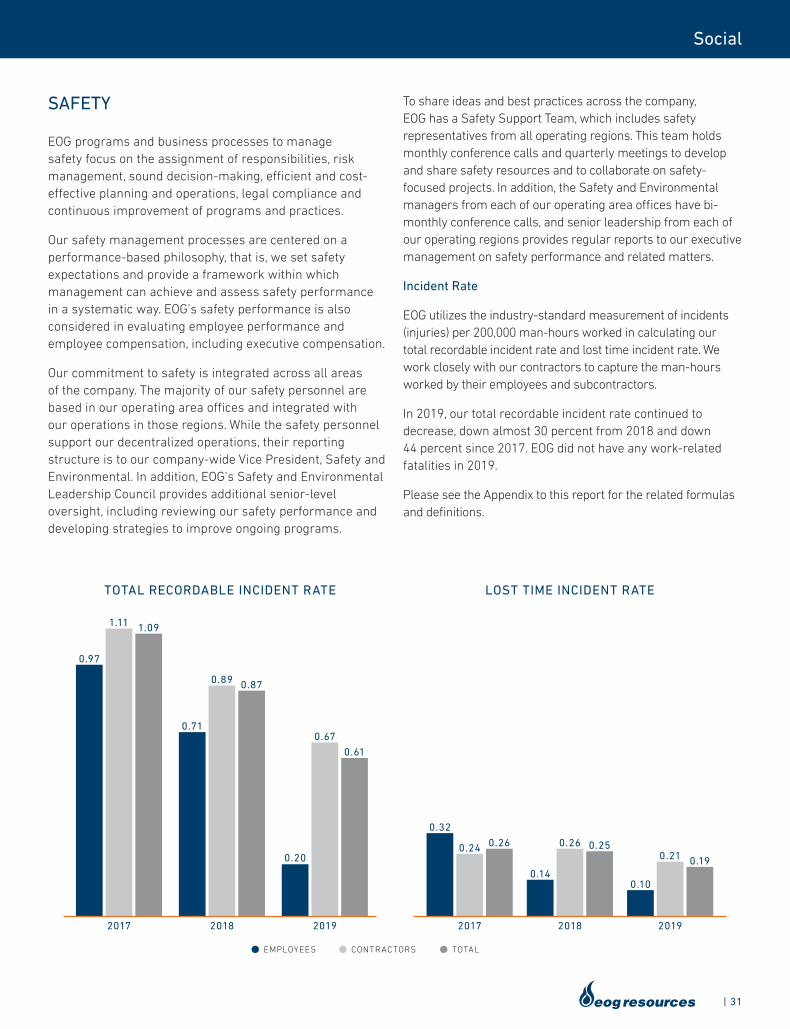
| 31
Social
SAFETY
EOG programs and business processes to manage safety focus on the assignment of responsibilities, risk management, sound decision-making, efficient and cost-effective planning and operations, legal compliance and continuous improvement of programs and practices.
Our safety management processes are centered on a performance-based philosophy, that is, we set safety expectations and provide a framework within which management can achieve and assess safety performance in a systematic way. EOG’s safety performance is also considered in evaluating employee performance and employee compensation, including executive compensation.
Our commitment to safety is integrated across all areas of the company. The majority of our safety personnel are based in our operating area offices and integrated with our operations in those regions. While the safety personnel support our decentralized operations, their reporting structure is to our company-wide Vice President, Safety and Environmental. In addition, EOG’s Safety and Environmental Leadership Council provides additional senior-level oversight, including reviewing our safety performance and developing strategies to improve ongoing programs.
To share ideas and best practices across the company, EOG has a Safety Support Team, which includes safety representatives from all operating regions. This team holds monthly conference calls and quarterly meetings to develop and share safety resources and to collaborate on safety-focused projects. In addition, the Safety and Environmental managers from each of our operating area offices have bi-monthly conference calls, and senior leadership from each of our operating regions provides regular reports to our executive management on safety performance and related matters.
Incident Rate
EOG utilizes the industry-standard measurement of incidents (injuries) per 200,000 man-hours worked in calculating our total recordable incident rate and lost time incident rate. We work closely with our contractors to capture the man-hours worked by their employees and subcontractors.
In 2019, our total recordable incident rate continued to decrease, down almost 30 percent from 2018 and down 44 percent since 2017. EOG did not have any work-related fatalities in 2019.
Please see the Appendix to this report for the related formulas and definitions.
TOTAL RECORDABLE INCIDENT RATE LOST TIME INCIDENT RATE
0.97
1.11 1.09
0.71
0.89 0.87
0.20
0.67
0.61
0.32
0.24 0.26
0.14
0.26 0.25
0.10
0.21 0.19
2017 2018 2019 2017 2018 2019
EMPLOYEES CONTRACTORS TOTAL
32 |
Social
Preparedness and Training
At EOG, knowing what to do and how to do it is critical to strong, consistent performance. That is why we provide initial, periodic and refresher safety training to employees, contractors, visitors and other personnel who may work at or visit EOG’s facilities. These training programs address operating procedures, safe work practices, emergency and incident response procedures and more. Examples include:
• A Safe Practices Manual is provided to employees and contractors and is available online for easy reference.
• A location-specific Emergency Information Guide is available to all employees and contractors in that location.
• Basic, mandatory safety training courses and a number of additional safety and operational courses are available online to all EOG employees and to the contractors who work at EOG’s facilities.
• EOG provides team building training on safety matters for contract crews across our operations. A leadership training program for EOG supervisors, as well as consultants and contractor supervisors, provides in-depth application of safety procedures, with a focus on how accidents can be prevented.
• EOG works with local first responders and regulatory agencies.
• Control centers operated 24 hours a day in our San Antonio, Midland and Denver offices.
To promote strong and consistent safety performance, EOG also screens the safety practices and performance of our contractors. In addition, we monitor contractor performance and the safety programs contractors have in place while working for EOG.
Emergency Response
Each of EOG’s operating areas develops and maintains a written plan that provides a framework for rapid and effective response to emergency situations to protect local communities, our employees and contractors and the environment. These plans support, and are components of, EOG’s corporate Crisis Management Plan, which details our overall corporate response should an emergency occur.
Each emergency response plan includes a tiered response level for activation of the plan based on the type of incident and the response required. Training regarding the plan is provided to relevant field and office personnel, including contractors. These plans are periodically reviewed and updated, and periodic drills, including incident command system training and table top drills, are conducted so that EOG personnel are prepared to respond appropriately to incidents that might occur.

| 33
Governance
OVERSIGHT AND PRACTICES
EOG’s strong corporate governance practices enhance board and management accountability to our shareholders and other stakeholders and enhance our risk oversight and management efforts.
Board of Directors
Currently, our Board of Directors (Board) is comprised of seven non-employee, independent directors and our Chief Executive Officer, who serves as the Chairman of the Board. As announced on September 23, 2020, Mike Kerr will join our Board as a non-employee, independent director effective October 5, 2020.
All directors are elected annually under a majority vote standard, which provides our stockholders with a meaningful voice in the annual director election process. Our Board committees – the Audit Committee, the Compensation Committee and the Nominating, Governance and Sustainability Committee – are each solely composed of independent directors.
The independent directors regularly meet in executive sessions, led by the independent presiding director who is elected annually by the independent directors of our Board. The independent presiding director plays a valuable role in the overall leadership of the Board and serves as a liaison between the Chairman of the Board and our other executive officers and the independent directors.
EOG BOARD
OF DIRECTORS
JANET CLARK
DIRECTOR SINCE 2014 AUDIT COMMITTEE CHAIR
CHARLIE CRISP
DIRECTOR SINCE 2002
BOB DANIELS
DIRECTOR SINCE 2017 COMPENSATION
COMMITTEE CHAIR
JIM DAY
DIRECTOR SINCE 2008
CRIS GAUT
DIRECTOR SINCE 2017
DON TEXTOR
DIRECTOR SINCE 2001 2019 PRESIDING DIRECTOR
BILL THOMAS
DIRECTOR SINCE 2013 CHAIRMAN OF THE BOARD
JULIE ROBERTSON
DIRECTOR SINCE 2019 NOMINATING, GOVERNANCE
AND SUSTAINABILITY COMMITTEE CHAIR
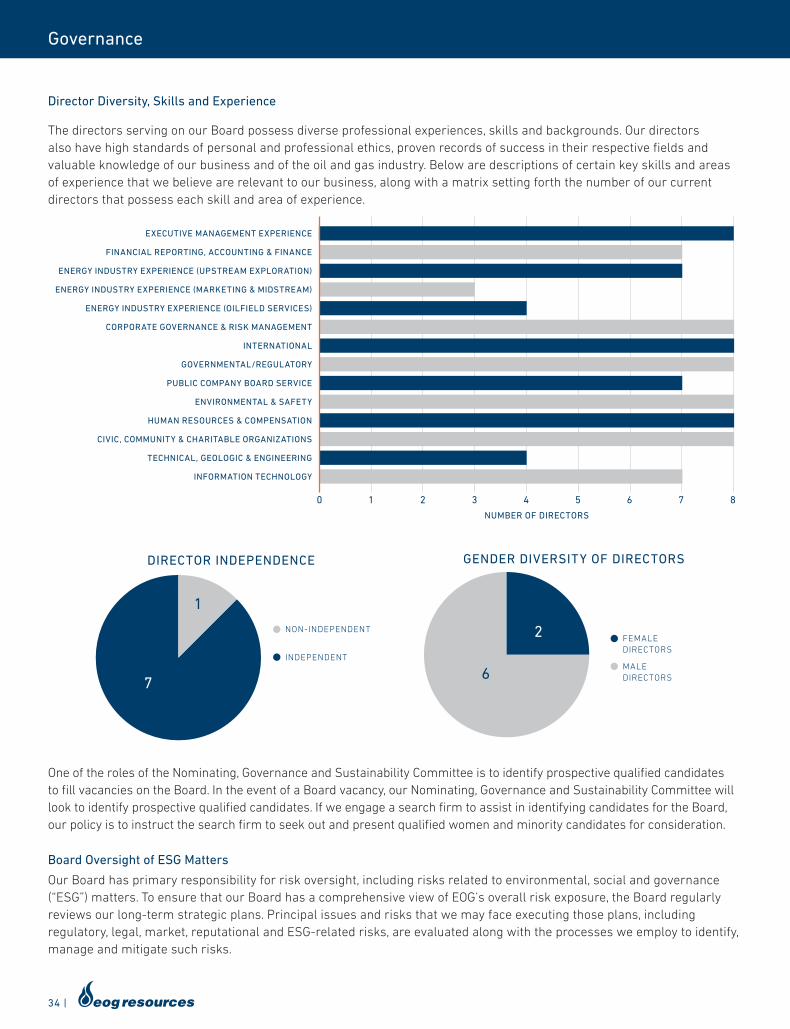
34 |
Governance
Director Diversity, Skills and Experience
The directors serving on our Board possess diverse professional experiences, skills and backgrounds. Our directors also have high standards of personal and professional ethics, proven records of success in their respective fields and valuable knowledge of our business and of the oil and gas industry. Below are descriptions of certain key skills and areas of experience that we believe are relevant to our business, along with a matrix setting forth the number of our current directors that possess each skill and area of experience.
DIRECTOR INDEPENDENCE
7
1
INDEPENDENT
NON-INDEPENDENT
GENDER DIVERSITY OF DIRECTORS
6
2
MALEDIRECTORS
FEMALEDIRECTORS
One of the roles of the Nominating, Governance and Sustainability Committee is to identify prospective qualified candidates to fill vacancies on the Board. In the event of a Board vacancy, our Nominating, Governance and Sustainability Committee will look to identify prospective qualified candidates. If we engage a search firm to assist in identifying candidates for the Board, our policy is to instruct the search firm to seek out and present qualified women and minority candidates for consideration.
Board Oversight of ESG Matters
Our Board has primary responsibility for risk oversight, including risks related to environmental, social and governance (“ESG”) matters. To ensure that our Board has a comprehensive view of EOG’s overall risk exposure, the Board regularly reviews our long-term strategic plans. Principal issues and risks that we may face executing those plans, including regulatory, legal, market, reputational and ESG-related risks, are evaluated along with the processes we employ to identify, manage and mitigate such risks.
EXECUTIVE MANAGEMENT EXPERIENCE
FINANCIAL REPORTING, ACCOUNTING & FINANCE
ENERGY INDUSTRY EXPERIENCE (UPSTREAM EXPLORATION)
ENERGY INDUSTRY EXPERIENCE (MARKETING & MIDSTREAM)
ENERGY INDUSTRY EXPERIENCE (OILFIELD SERVICES)
CORPORATE GOVERNANCE & RISK MANAGEMENT
INTERNATIONAL
GOVERNMENTAL/REGULATORY
PUBLIC COMPANY BOARD SERVICE
ENVIRONMENTAL & SAFETY
HUMAN RESOURCES & COMPENSATION
CIVIC, COMMUNITY & CHARITABLE ORGANIZATIONS
TECHNICAL, GEOLOGIC & ENGINEERING
INFORMATION TECHNOLOGY
1 2 3 40 5 6 7 8
NUMBER OF DIRECTORS
| 35
Governance
The Nominating, Governance and Sustainability Committee has primary responsibility for oversight and guidance of ESG-related matters. As part of this responsibility, the Nominating, Governance and Sustainability Committee reviews potential ESG-related impacts to the company and makes recommendations to the Board, our Audit and Compensation Committees and our management, as appropriate.
While all of our current directors have experience with environmental and safety matters, to assist the Board with their risk oversight function, members of our senior management present and discuss emerging ESG-related
risks and other matters – including risks associated with climate change – with the Board throughout the year. Further discussion regarding our senior management’s role in ESG management is below.
In addition, at least once per year, members of senior management report to our Board on EOG’s safety and environmental performance and peer benchmarking, in addition to reviewing trends and other industry information.
Also, as part of its risk oversight responsibility, our Board, together with the Compensation Committee, oversees matters relating to our human capital management.
IN FOCUS
INTEGRATED APPROACH TO ESG MANAGEMENT
ESG management is integrated into EOG’s culture throughout our organization. Our employees improve the company’s ESG performance in the same way and at the same time they create value across all our operations – from the bottom up, across our decentralized organization, in which multi-disciplinary teams use data to innovate new and creative technology solutions to ESG risks and opportunities.
• Transparent, Real-Time Data: EOG’s Information Systems team has developed over 100 desktop and mobile applications in-house. These applications provide real-time data capture, including real-time reporting of water reuse and flaring metrics, and mobility of data access, which drives transparency throughout the organization and allows for better, faster, well-informed decisions.
• Decentralized, Multi-Disciplinary Teams: The majority of EOG’s Safety and Environmental (S&E) staff are based in our operating area offices and are integrated with EOG’s operations in order to effectively manage day-to-day safety and environmental matters. Our S&E professionals collaborate with our engineers, technicians and geologists to develop and implement ESG-related approaches that take into account the unique operating conditions of each region.
• Centralized Oversight: While our S&E team supports our operations, they report directly to our company-wide Vice President, Safety and Environmental. In addition, each operating area office reports to our executive management on environmental and safety matters and performance throughout the year. This enables us to develop both local and overall company focus areas and initiatives that are developed and communicated by both our operations and S&E teams.
• Innovative, Fit-for-Purpose Solutions: The combination of real-time data and multi-disciplinary team collaboration drives innovation and creative solutions. An example of this is the development of our sophisticated water management infrastructure system, which resulted from our strategic water resources team working with our production, drilling and completions engineers. Our Information Systems team was also central in this success by developing our TridentSM application to help manage our water resources in real time across our complex infrastructure system. See page 21 for further discussion of our Trident application.
36 |
Governance
Our Board and Compensation Committee receive regular reports from, and have regular discussions with, our Chief Human Resources Officer and other members of our senior management on human capital management topics, including employee recruiting, compensation, retention and training and the composition and diversity of EOG’s workforce. Our Chief Human Resources Officer and other members of senior management also review human capital management peer benchmarking data and trends with the Board and Compensation Committee.
Role of Management in Assessing and Managing ESG Matters
Our senior management team works with personnel across the company to assess and manage risks related to ESG matters. Ideas for improvement are generated by multi-disciplinary teams at every level of the organization, with our Chief Operating Officer (COO) providing overall leadership for management of these matters. As part of our integrated approach to management of these matters, our Director of Sustainability, who reports to our COO, our Vice President, Safety and Environmental and our Manager of Sustainable Power regularly brief senior management on these matters.
In addition, our environmental-related efforts and performance, including management of environmental risks related to climate change, are managed and measured by the S&E function within EOG. Our S&E group works collaboratively with our operations group on initiatives related to our technologies and practices to manage ESG matters and with other departments with respect to environmental policy and regulatory matters.
The S&E function’s senior leadership is centralized at EOG’s Houston headquarters and includes our Vice President, Safety and Environmental, our Water Resources Manager, our Manager of Environmental and our Director of Safety. Field-level management of the S&E function is performed by S&E personnel that work in our operating area offices and live in the local communities.
To facilitate a consistent team effort in assessing and managing ESG risks across the company, EOG has established the following groups:
• The S&E Leadership Council – An internal, multi-disciplinary leadership team comprised of senior management and representatives from our S&E and legal functions.
• The S&E Leadership Team – Membership is comprised of the S&E leaders across all of our operating area offices
and S&E personnel at our Houston headquarters.
These groups have specific roles in assessing and managing ESG risks for EOG:
• Strategic Goals – The S&E Leadership Team, in consultation with the S&E Leadership Council and executive management, is responsible for setting our safety and environmental strategic goals.
• Policies – The S&E Leadership Team regularly meets throughout the year to discuss our safety and environmental policies, best practices and related risks, to provide consistency across the company.
• Performance – The S&E Leadership Team also periodically updates our executive management regarding our progress towards our safety and environmental strategic goals and any related risks.
EOG has also implemented a number of practical mechanisms as part of our efforts to identify, assess and manage ESG matters and facilitate continuous improvement and consistency throughout our decentralized operations:
• Regular reports to our executive management from senior leadership in each of our operating regions on their region’s safety and environmental performance and related matters
• In-person S&E conferences attended by the S&E teams from each operating region and senior executives
• Leadership meetings and conferences among EOG’s S&E personnel, for the sharing of information, best practices and goals
• Regular S&E training, available to employees, contractors and vendors
• Discussion of ESG matters at EOG’s in-house technical conferences, to increase engagement by our drilling, completion, production and facilities operations personnel
• Environmental staff dedicated to GHG emissions data collection and analysis
Executive Compensation
EOG’s executive compensation program is designed to attract and retain a highly qualified and motivated management team and reward individual executive officers for their contributions to the achievement of our key short-term and long-term goals. EOG’s executive officers are eligible to receive annual bonuses based on the achievement of operational, financial, and strategic
| 37
Governance
goals established by the Compensation Committee of the Board. The Committee believes that setting specific performance goals helps establish important benchmarks and communicates EOG’s top priorities to our executive officers and employees.
Our ESG-related performance goals have historically included improving our strong S&E record, including reducing our recordable incident and oil spill rates. In 2019, the Compensation Committee expanded the ESG-related performance goals to include the reduction of EOG’s GHG emissions intensity rate and methane emissions intensity rate, in each case for 2019 compared to 2018.
Based on its review of our compensation program and shareholder feedback, the Compensation Committee has established a separately weighted ESG-related goal for our 2020 performance – specifically, the reduction of our GHG, methane and flaring emissions intensity rates, recordable incident rate and oil spill rates for 2020 below 2019 levels.
ETHICAL BUSINESS PRACTICES
EOG is committed to conducting our business in accordance with the highest ethical standards and in compliance with the laws of all countries where we operate and to ensuring that all employees and business partners are treated fairly and with respect.
To reinforce this commitment, EOG maintains a Compliance Program. The program includes strong non-retaliation provisions intended to ensure that EOG’s business is conducted with high ethical standards and in compliance with the letter and spirit of the law. The program includes review and enforcement of EOG’s Codes of Business Conduct and Ethics and other policies related to legal compliance and ethics, in addition to employee communications, education, training and compliance monitoring, including the investigation and resolution of complaints and inquiries.
The Audit Committee of the Board oversees EOG’s Compliance Program and we have a standing Compliance Committee that is responsible for implementing EOG’s Compliance Program and providing regular reports to the Audit Committee. The standing members of the Compliance Committee are our General Counsel, Chief Financial Officer, Chief Human Resources Officer and Vice President, Internal Audit.
Codes of Business Conduct and Ethics
EOG’s Codes of Business Conduct and Ethics detail our expectations with respect to business conduct as well as our legal and ethical responsibilities and standards for our officers, directors and employees as well as our contractors and vendors.
• Directors, Officers and Employees – EOG’s Code of Business Conduct and Ethics for Directors, Officers and Employees includes sections on workplace safety, security, protection of the environment and fair treatment and mutual respect of workers. In addition to the requirements in this policy statement, specific objectives and activities are spelled out in EOG’s Safety and Environmental Policy. All employees are required to acknowledge receipt of EOG’s Code of Business Conduct and Ethics for Directors, Officers and Employees when hired.
• Contractors and Vendors – Our contractors and vendors must agree to abide by EOG’s Code of Business Conduct and Ethics for Vendors and Contractors. The policy obligates our contractors and vendors to provide their services in compliance with applicable laws and regulations, including those relating to environmental, health and safety matters.
In addition, we maintain a Code of Ethics for Senior Financial Officers, to which our Chief Executive Officer, Chief Financial Officer, Chief Accounting Officer and controllers are subject. These codes can be found in the “Board of Directors” section of the “Company” page of our corporate website at www.eogresources.com.
EOG also requires our directors, officers, employees, contractors and vendors to comply with related policies, including policies related to anti-corruption compliance. Our Codes of Business Conduct and Ethics and the related policies are reviewed annually, including with our Audit Committee, and updated as necessary or appropriate.
Training and Reporting Mechanisms
To promote our commitment to ethical business practices, EOG maintains an active global compliance training program. Training is provided to employees upon joining the company and then periodically thereafter.
EOG also encourages employees, contractors and business partners to report any violations of the Codes of Business Conduct and Ethics or other conduct relating to EOG’s business that they suspect may be unethical or in violation of applicable laws and regulations.
38 |
Governance
EOG provides several confidential options for reporting actual and suspected misconduct, including speaking with a supervisor or contact at EOG, an EOG human resources representative or a member of EOG’s Legal Department or Compliance Committee. In addition, employees, contractors, suppliers, business partners (including joint venture partners), shareholders and other external stakeholders may report actual or suspected misconduct anonymously through EOG’s confidential 24-hour Compliance and Ethics Hotline or by submitting a confidential report online.
EOG’s hotline and online reporting system are hosted by a third party to maintain anonymity. The hotline and online reporting system are available worldwide and information on how to access both resources is publicly available in the “Board of Directors” section of the “Company” page of EOG’s corporate website at www.eogresources.com. All complaints received are immediately forwarded to the Chief Compliance Officer and the Audit Committee receives regular reports regarding matters reported through the hotline or online reporting system.
EOG’s third-party hotline and online reporting system include the ability to arrange a callback time to hear the status of EOG’s response to a report and to answer any follow-up questions anonymously. EOG does not tolerate retaliation for raising an ethical or legal concern or asking questions in good faith.
PUBLIC ADVOCACY AND ENGAGEMENT
EOG does not contribute corporate funds to any federal, state or local political candidate, party, organization or campaign. In addition, EOG does not sponsor or administer a political action committee.
We respect and support the right of our directors, officers and employees to support political parties and candidates with their personal time and money. However, use of EOG company resources for such purposes, including employee time, company funds and company supplies, is prohibited without the express approval of EOG’s Chief Executive Officer.
EOG engages with regulators and elected officials to educate them on issues affecting our company and industry, changing technologies and best practices. In addition, EOG employees are active participants in industry coalitions and working groups, including those focused on safety, water reuse and reducing emissions, to share information and promote best practices.
EOG pays membership dues to certain trade associations and benefits from the time these trade associations spend engaged in efforts to educate lawmakers and voters on issues relevant to the oil and gas industry. While we strive to promote policies and practices that we support through our membership and participation in trade associations, trade associations represent their collective membership, not individual member companies, and may take positions on a wide variety of matters which are not necessarily supported by EOG.
Our Government Relations group reviews and oversees our participation in trade associations and, at least once a year, the Board’s Nominating, Governance and Sustainability Committee reviews EOG’s contributions to trade associations, including any amounts related to political activities and lobbying expenses.
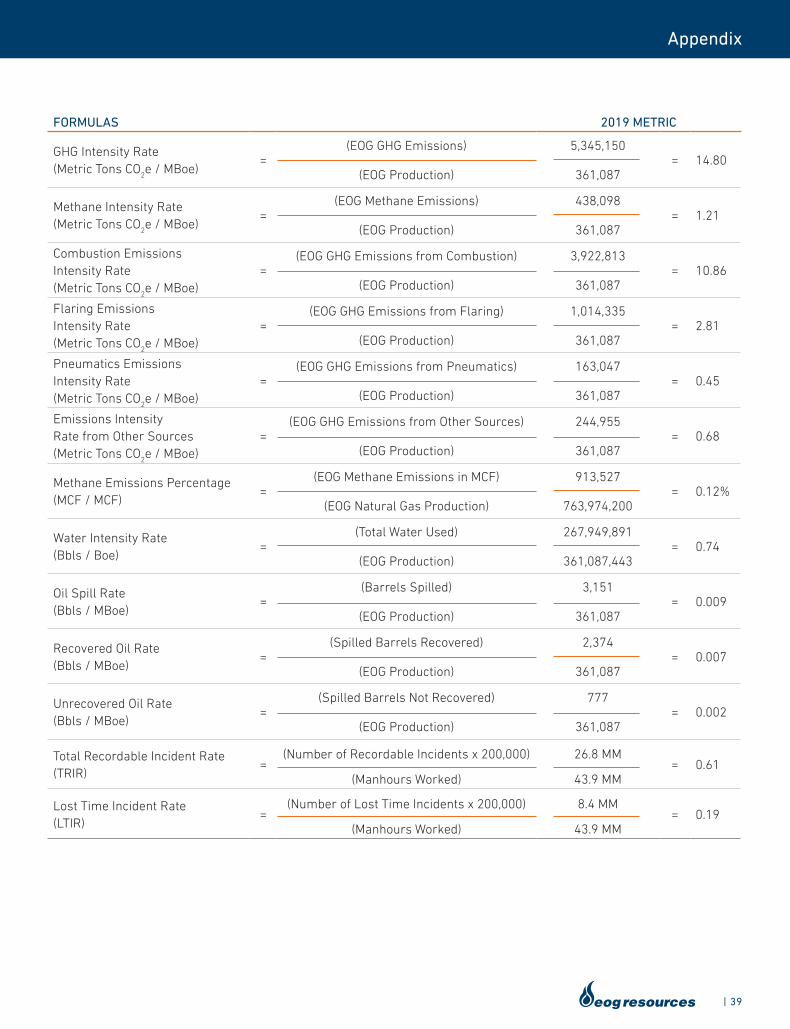
| 39
Appendix
FORMULAS 2019 METRIC
GHG Intensity Rate (Metric Tons CO
2e / MBoe)
=(EOG GHG Emissions)
(EOG Production)
5,345,150
361,087= 14.80
Methane Intensity Rate (Metric Tons CO
2e / MBoe)
=(EOG Methane Emissions)
(EOG Production)
438,098
361,087= 1.21
Combustion Emissions Intensity Rate (Metric Tons CO
2e / MBoe)
=(EOG GHG Emissions from Combustion)
(EOG Production)
3,922,813
361,087= 10.86
Flaring Emissions Intensity Rate (Metric Tons CO
2e / MBoe)
=(EOG GHG Emissions from Flaring)
(EOG Production)
1,014,335
361,087= 2.81
Pneumatics Emissions Intensity Rate (Metric Tons CO
2e / MBoe)
=(EOG GHG Emissions from Pneumatics)
(EOG Production)
163,047
361,087= 0.45
Emissions Intensity Rate from Other Sources (Metric Tons CO
2e / MBoe)
=(EOG GHG Emissions from Other Sources)
(EOG Production)
244,955
361,087= 0.68
Methane Emissions Percentage (MCF / MCF)
=(EOG Methane Emissions in MCF)
(EOG Natural Gas Production)
913,527
763,974,200= 0.12%
Water Intensity Rate (Bbls / Boe)
=(Total Water Used)
(EOG Production)
267,949,891
361,087,443= 0.74
Oil Spill Rate (Bbls / MBoe)
=(Barrels Spilled)
(EOG Production)
3,151
361,087= 0.009
Recovered Oil Rate (Bbls / MBoe)
=(Spilled Barrels Recovered)
(EOG Production)
2,374
361,087= 0.007
Unrecovered Oil Rate (Bbls / MBoe)
=(Spilled Barrels Not Recovered)
(EOG Production)
777
361,087= 0.002
Total Recordable Incident Rate (TRIR)
=(Number of Recordable Incidents x 200,000)
(Manhours Worked)
26.8 MM
43.9 MM= 0.61
Lost Time Incident Rate (LTIR)
=(Number of Lost Time Incidents x 200,000)
(Manhours Worked)
8.4 MM
43.9 MM= 0.19
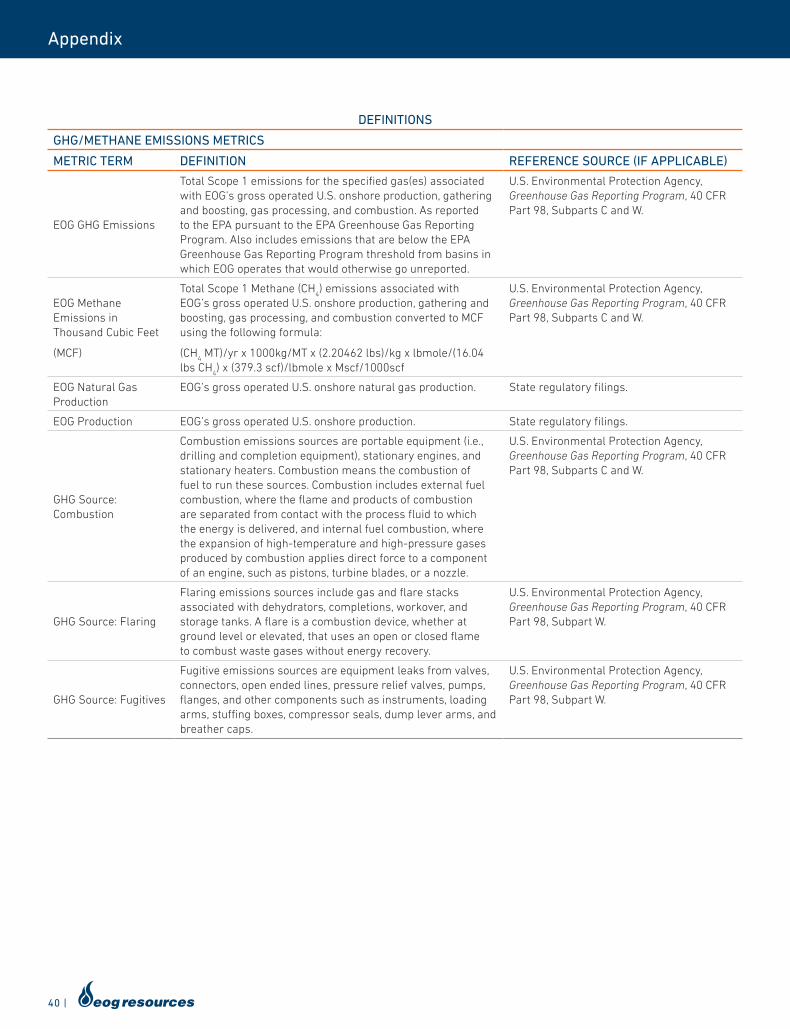
40 |
Appendix
DEFINITIONS
GHG/METHANE EMISSIONS METRICS
METRIC TERM DEFINITION REFERENCE SOURCE (IF APPLICABLE)
EOG GHG Emissions
Total Scope 1 emissions for the specified gas(es) associated with EOG’s gross operated U.S. onshore production, gathering and boosting, gas processing, and combustion. As reported to the EPA pursuant to the EPA Greenhouse Gas Reporting Program. Also includes emissions that are below the EPA Greenhouse Gas Reporting Program threshold from basins in which EOG operates that would otherwise go unreported.
U.S. Environmental Protection Agency, Greenhouse Gas Reporting Program, 40 CFR Part 98, Subparts C and W.
EOG Methane Emissions in Thousand Cubic Feet
(MCF)
Total Scope 1 Methane (CH4) emissions associated with
EOG’s gross operated U.S. onshore production, gathering and boosting, gas processing, and combustion converted to MCF using the following formula:
(CH4 MT)/yr x 1000kg/MT x (2.20462 lbs)/kg x lbmole/(16.04
lbs CH4) x (379.3 scf)/lbmole x Mscf/1000scf
U.S. Environmental Protection Agency, Greenhouse Gas Reporting Program, 40 CFR Part 98, Subparts C and W.
EOG Natural Gas Production
EOG’s gross operated U.S. onshore natural gas production. State regulatory filings.
EOG Production EOG’s gross operated U.S. onshore production. State regulatory filings.
GHG Source: Combustion
Combustion emissions sources are portable equipment (i.e., drilling and completion equipment), stationary engines, and stationary heaters. Combustion means the combustion of fuel to run these sources. Combustion includes external fuel combustion, where the flame and products of combustion are separated from contact with the process fluid to which the energy is delivered, and internal fuel combustion, where the expansion of high-temperature and high-pressure gases produced by combustion applies direct force to a component of an engine, such as pistons, turbine blades, or a nozzle.
U.S. Environmental Protection Agency, Greenhouse Gas Reporting Program, 40 CFR Part 98, Subparts C and W.
GHG Source: Flaring
Flaring emissions sources include gas and flare stacks associated with dehydrators, completions, workover, and storage tanks. A flare is a combustion device, whether at ground level or elevated, that uses an open or closed flame to combust waste gases without energy recovery.
U.S. Environmental Protection Agency, Greenhouse Gas Reporting Program, 40 CFR Part 98, Subpart W.
GHG Source: Fugitives
Fugitive emissions sources are equipment leaks from valves, connectors, open ended lines, pressure relief valves, pumps, flanges, and other components such as instruments, loading arms, stuffing boxes, compressor seals, dump lever arms, and breather caps.
U.S. Environmental Protection Agency, Greenhouse Gas Reporting Program, 40 CFR Part 98, Subpart W.
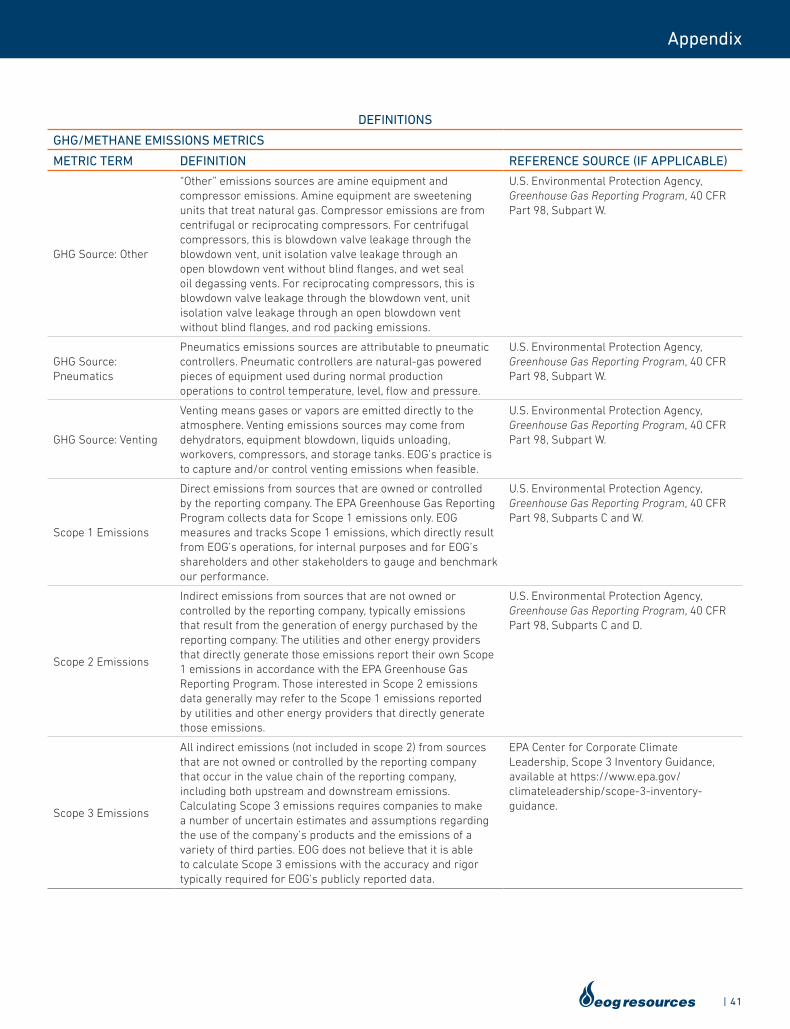
| 41
Appendix
DEFINITIONS
GHG/METHANE EMISSIONS METRICS
METRIC TERM DEFINITION REFERENCE SOURCE (IF APPLICABLE)
GHG Source: Other
“Other” emissions sources are amine equipment and compressor emissions. Amine equipment are sweetening units that treat natural gas. Compressor emissions are from centrifugal or reciprocating compressors. For centrifugal compressors, this is blowdown valve leakage through the blowdown vent, unit isolation valve leakage through an open blowdown vent without blind flanges, and wet seal oil degassing vents. For reciprocating compressors, this is blowdown valve leakage through the blowdown vent, unit isolation valve leakage through an open blowdown vent without blind flanges, and rod packing emissions.
U.S. Environmental Protection Agency, Greenhouse Gas Reporting Program, 40 CFR Part 98, Subpart W.
GHG Source: Pneumatics
Pneumatics emissions sources are attributable to pneumatic controllers. Pneumatic controllers are natural-gas powered pieces of equipment used during normal production operations to control temperature, level, flow and pressure.
U.S. Environmental Protection Agency, Greenhouse Gas Reporting Program, 40 CFR Part 98, Subpart W.
GHG Source: Venting
Venting means gases or vapors are emitted directly to the atmosphere. Venting emissions sources may come from dehydrators, equipment blowdown, liquids unloading, workovers, compressors, and storage tanks. EOG’s practice is to capture and/or control venting emissions when feasible.
U.S. Environmental Protection Agency, Greenhouse Gas Reporting Program, 40 CFR Part 98, Subpart W.
Scope 1 Emissions
Direct emissions from sources that are owned or controlled by the reporting company. The EPA Greenhouse Gas Reporting Program collects data for Scope 1 emissions only. EOG measures and tracks Scope 1 emissions, which directly result from EOG’s operations, for internal purposes and for EOG’s shareholders and other stakeholders to gauge and benchmark our performance.
U.S. Environmental Protection Agency, Greenhouse Gas Reporting Program, 40 CFR Part 98, Subparts C and W.
Scope 2 Emissions
Indirect emissions from sources that are not owned or controlled by the reporting company, typically emissions that result from the generation of energy purchased by the reporting company. The utilities and other energy providers that directly generate those emissions report their own Scope 1 emissions in accordance with the EPA Greenhouse Gas Reporting Program. Those interested in Scope 2 emissions data generally may refer to the Scope 1 emissions reported by utilities and other energy providers that directly generate those emissions.
U.S. Environmental Protection Agency, Greenhouse Gas Reporting Program, 40 CFR Part 98, Subparts C and D.
Scope 3 Emissions
All indirect emissions (not included in scope 2) from sources that are not owned or controlled by the reporting company that occur in the value chain of the reporting company, including both upstream and downstream emissions. Calculating Scope 3 emissions requires companies to make a number of uncertain estimates and assumptions regarding the use of the company’s products and the emissions of a variety of third parties. EOG does not believe that it is able to calculate Scope 3 emissions with the accuracy and rigor typically required for EOG’s publicly reported data.
EPA Center for Corporate Climate Leadership, Scope 3 Inventory Guidance, available at https://www.epa.gov/climateleadership/scope-3-inventory-guidance.
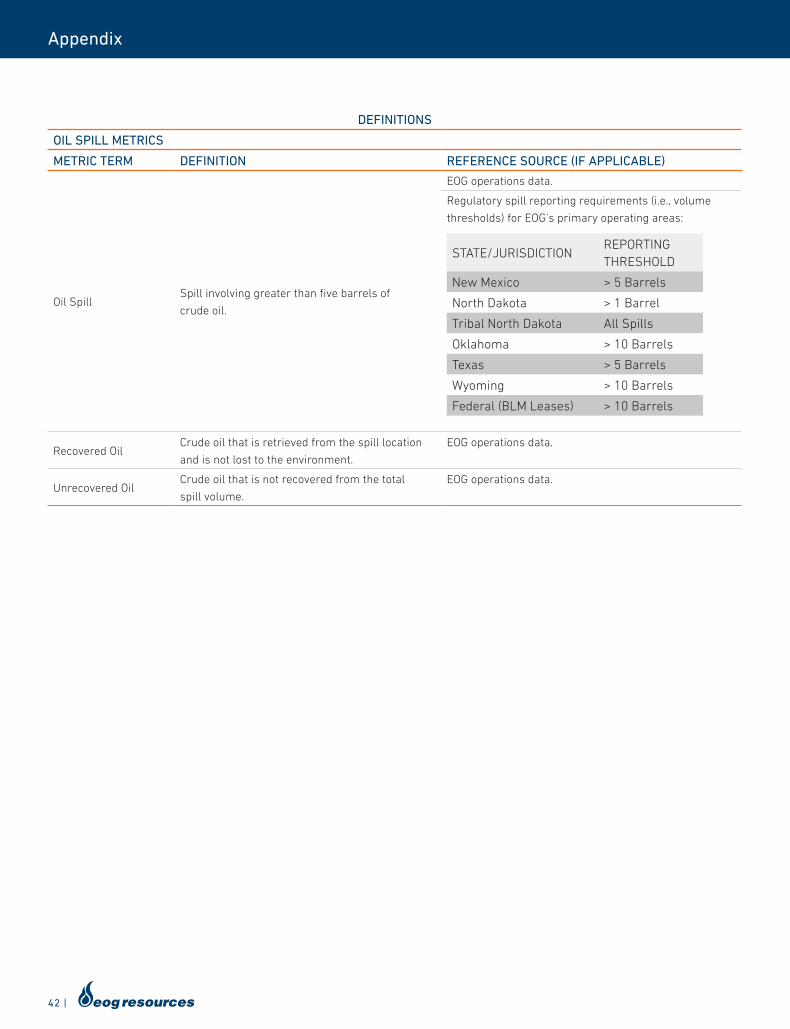
42 |
Appendix
DEFINITIONS
OIL SPILL METRICS
METRIC TERM DEFINITION REFERENCE SOURCE (IF APPLICABLE)
Oil SpillSpill involving greater than five barrels of
crude oil.
EOG operations data.
Regulatory spill reporting requirements (i.e., volume
thresholds) for EOG’s primary operating areas:
STATE/JURISDICTIONREPORTING THRESHOLD
New Mexico > 5 Barrels
North Dakota > 1 Barrel
Tribal North Dakota All Spills
Oklahoma > 10 Barrels
Texas > 5 Barrels
Wyoming > 10 Barrels
Federal (BLM Leases) > 10 Barrels
Recovered OilCrude oil that is retrieved from the spill location
and is not lost to the environment.
EOG operations data.
Unrecovered OilCrude oil that is not recovered from the total
spill volume.
EOG operations data.
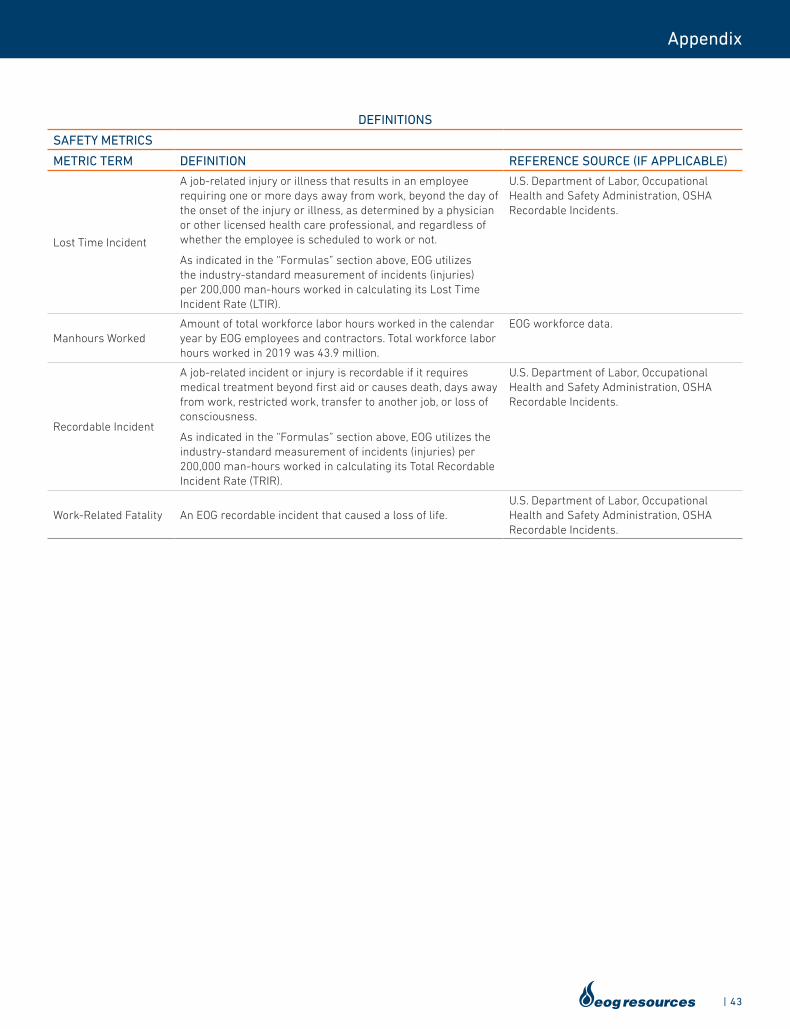
| 43
Appendix
DEFINITIONS
SAFETY METRICS
METRIC TERM DEFINITION REFERENCE SOURCE (IF APPLICABLE)
Lost Time Incident
A job-related injury or illness that results in an employee requiring one or more days away from work, beyond the day of the onset of the injury or illness, as determined by a physician or other licensed health care professional, and regardless of whether the employee is scheduled to work or not.
As indicated in the “Formulas” section above, EOG utilizes the industry-standard measurement of incidents (injuries) per 200,000 man-hours worked in calculating its Lost Time Incident Rate (LTIR).
U.S. Department of Labor, Occupational Health and Safety Administration, OSHA Recordable Incidents.
Manhours WorkedAmount of total workforce labor hours worked in the calendar year by EOG employees and contractors. Total workforce labor hours worked in 2019 was 43.9 million.
EOG workforce data.
Recordable Incident
A job-related incident or injury is recordable if it requires medical treatment beyond first aid or causes death, days away from work, restricted work, transfer to another job, or loss of consciousness.
As indicated in the “Formulas” section above, EOG utilizes the industry-standard measurement of incidents (injuries) per 200,000 man-hours worked in calculating its Total Recordable Incident Rate (TRIR).
U.S. Department of Labor, Occupational Health and Safety Administration, OSHA Recordable Incidents.
Work-Related Fatality An EOG recordable incident that caused a loss of life. U.S. Department of Labor, Occupational Health and Safety Administration, OSHA Recordable Incidents.
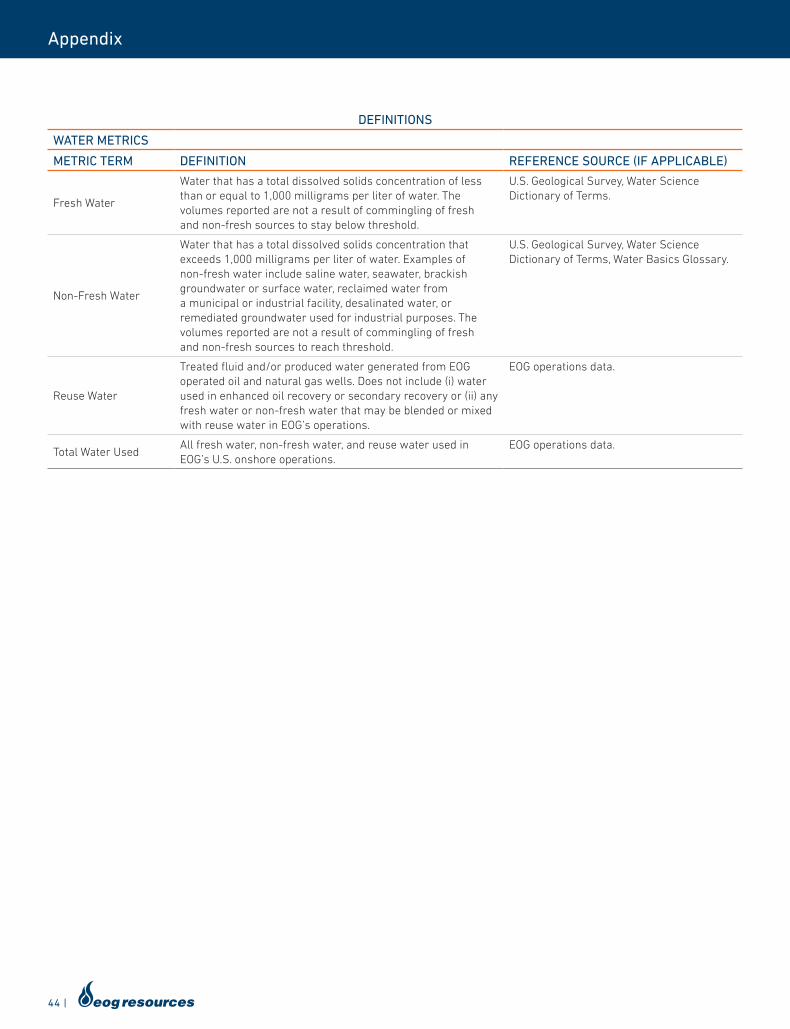
44 |
Appendix
DEFINITIONS
WATER METRICS
METRIC TERM DEFINITION REFERENCE SOURCE (IF APPLICABLE)
Fresh Water
Water that has a total dissolved solids concentration of less than or equal to 1,000 milligrams per liter of water. The volumes reported are not a result of commingling of fresh and non-fresh sources to stay below threshold.
U.S. Geological Survey, Water Science Dictionary of Terms.
Non-Fresh Water
Water that has a total dissolved solids concentration that exceeds 1,000 milligrams per liter of water. Examples of non-fresh water include saline water, seawater, brackish groundwater or surface water, reclaimed water from a municipal or industrial facility, desalinated water, or remediated groundwater used for industrial purposes. The volumes reported are not a result of commingling of fresh and non-fresh sources to reach threshold.
U.S. Geological Survey, Water Science Dictionary of Terms, Water Basics Glossary.
Reuse Water
Treated fluid and/or produced water generated from EOG operated oil and natural gas wells. Does not include (i) water used in enhanced oil recovery or secondary recovery or (ii) any fresh water or non-fresh water that may be blended or mixed with reuse water in EOG’s operations.
EOG operations data.
Total Water UsedAll fresh water, non-fresh water, and reuse water used in EOG’s U.S. onshore operations.
EOG operations data.
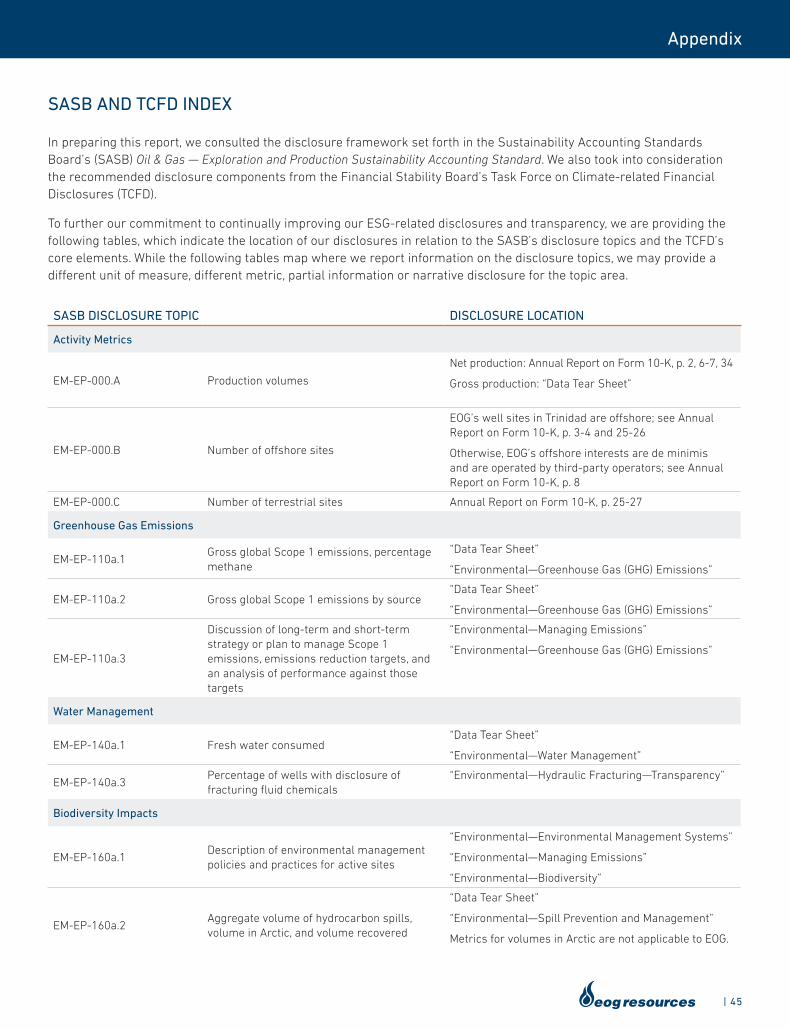
| 45
Appendix
SASB AND TCFD INDEX
In preparing this report, we consulted the disclosure framework set forth in the Sustainability Accounting Standards Board’s (SASB) Oil & Gas — Exploration and Production Sustainability Accounting Standard. We also took into consideration the recommended disclosure components from the Financial Stability Board’s Task Force on Climate-related Financial Disclosures (TCFD).
To further our commitment to continually improving our ESG-related disclosures and transparency, we are providing the following tables, which indicate the location of our disclosures in relation to the SASB’s disclosure topics and the TCFD’s core elements. While the following tables map where we report information on the disclosure topics, we may provide a different unit of measure, different metric, partial information or narrative disclosure for the topic area.
SASB DISCLOSURE TOPIC DISCLOSURE LOCATION
Activity Metrics
EM-EP-000.A Production volumes
Net production: Annual Report on Form 10-K, p. 2, 6-7, 34
Gross production: “Data Tear Sheet”
EM-EP-000.B Number of offshore sites
EOG’s well sites in Trinidad are offshore; see Annual Report on Form 10-K, p. 3-4 and 25-26
Otherwise, EOG’s offshore interests are de minimis and are operated by third-party operators; see Annual Report on Form 10-K, p. 8
EM-EP-000.C Number of terrestrial sites Annual Report on Form 10-K, p. 25-27
Greenhouse Gas Emissions
EM-EP-110a.1Gross global Scope 1 emissions, percentage methane
“Data Tear Sheet”
“Environmental—Greenhouse Gas (GHG) Emissions”
EM-EP-110a.2 Gross global Scope 1 emissions by source“Data Tear Sheet”
“Environmental—Greenhouse Gas (GHG) Emissions”
EM-EP-110a.3
Discussion of long-term and short-term strategy or plan to manage Scope 1 emissions, emissions reduction targets, and an analysis of performance against those targets
“Environmental—Managing Emissions”
“Environmental—Greenhouse Gas (GHG) Emissions”
Water Management
EM-EP-140a.1 Fresh water consumed“Data Tear Sheet”
“Environmental—Water Management”
EM-EP-140a.3Percentage of wells with disclosure of fracturing fluid chemicals
“Environmental—Hydraulic Fracturing—Transparency”
Biodiversity Impacts
EM-EP-160a.1Description of environmental management policies and practices for active sites
“Environmental—Environmental Management Systems”
“Environmental—Managing Emissions”
“Environmental—Biodiversity”
EM-EP-160a.2Aggregate volume of hydrocarbon spills, volume in Arctic, and volume recovered
“Data Tear Sheet”
“Environmental—Spill Prevention and Management”
Metrics for volumes in Arctic are not applicable to EOG.
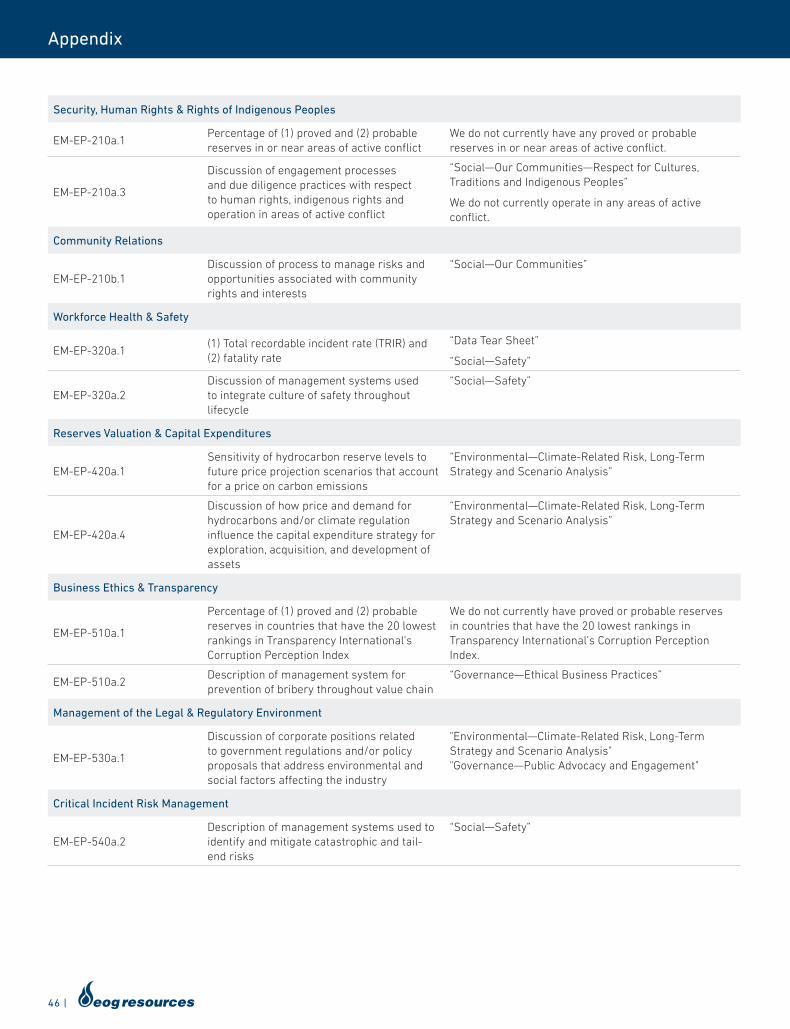
46 |
Appendix
Security, Human Rights & Rights of Indigenous Peoples
EM-EP-210a.1Percentage of (1) proved and (2) probable reserves in or near areas of active conflict
We do not currently have any proved or probable reserves in or near areas of active conflict.
EM-EP-210a.3
Discussion of engagement processes and due diligence practices with respect to human rights, indigenous rights and operation in areas of active conflict
“Social—Our Communities—Respect for Cultures, Traditions and Indigenous Peoples”
We do not currently operate in any areas of active conflict.
Community Relations
EM-EP-210b.1Discussion of process to manage risks and opportunities associated with community rights and interests
“Social—Our Communities”
Workforce Health & Safety
EM-EP-320a.1(1) Total recordable incident rate (TRIR) and (2) fatality rate
“Data Tear Sheet”
“Social—Safety”
EM-EP-320a.2Discussion of management systems used to integrate culture of safety throughout lifecycle
“Social—Safety”
Reserves Valuation & Capital Expenditures
EM-EP-420a.1Sensitivity of hydrocarbon reserve levels to future price projection scenarios that account for a price on carbon emissions
“Environmental—Climate-Related Risk, Long-Term Strategy and Scenario Analysis”
EM-EP-420a.4
Discussion of how price and demand for hydrocarbons and/or climate regulation influence the capital expenditure strategy for exploration, acquisition, and development of assets
“Environmental—Climate-Related Risk, Long-Term Strategy and Scenario Analysis”
Business Ethics & Transparency
EM-EP-510a.1
Percentage of (1) proved and (2) probable reserves in countries that have the 20 lowest rankings in Transparency International’s Corruption Perception Index
We do not currently have proved or probable reserves in countries that have the 20 lowest rankings in Transparency International’s Corruption Perception Index.
EM-EP-510a.2Description of management system for prevention of bribery throughout value chain
“Governance—Ethical Business Practices”
Management of the Legal & Regulatory Environment
EM-EP-530a.1
Discussion of corporate positions related to government regulations and/or policy proposals that address environmental and social factors affecting the industry
"Environmental—Climate-Related Risk, Long-Term Strategy and Scenario Analysis" "Governance—Public Advocacy and Engagement"
Critical Incident Risk Management
EM-EP-540a.2Description of management systems used to identify and mitigate catastrophic and tail-end risks
“Social—Safety”
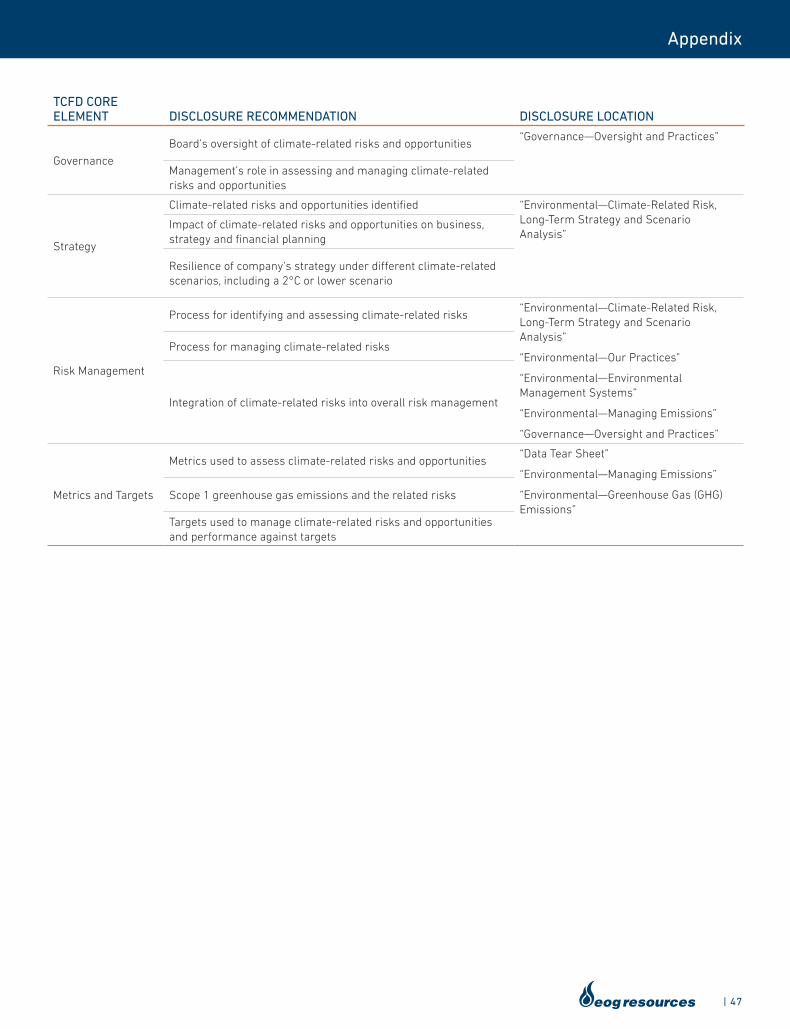
| 47
Appendix
TCFD CORE ELEMENT DISCLOSURE RECOMMENDATION DISCLOSURE LOCATION
Governance
Board’s oversight of climate-related risks and opportunities“Governance—Oversight and Practices”
Management’s role in assessing and managing climate-related risks and opportunities
Strategy
Climate-related risks and opportunities identified “Environmental—Climate-Related Risk, Long-Term Strategy and Scenario Analysis”
Impact of climate-related risks and opportunities on business, strategy and financial planning
Resilience of company’s strategy under different climate-related scenarios, including a 2°C or lower scenario
Risk Management
Process for identifying and assessing climate-related risks“Environmental—Climate-Related Risk, Long-Term Strategy and Scenario Analysis”
“Environmental—Our Practices"
“Environmental—Environmental Management Systems”
“Environmental—Managing Emissions”
“Governance—Oversight and Practices”
Process for managing climate-related risks
Integration of climate-related risks into overall risk management
Metrics and Targets
Metrics used to assess climate-related risks and opportunities “Data Tear Sheet”
“Environmental—Managing Emissions”
“Environmental—Greenhouse Gas (GHG) Emissions”
Scope 1 greenhouse gas emissions and the related risks
Targets used to manage climate-related risks and opportunities and performance against targets
48 |
Appendix
INTERNAL AND THIRD-PARTY VERIFICATION
EOG’s sustainability reporting involves various internal subject matter experts who were called upon to provide verified information for each of the topics included in this report. Members of EOG’s internal audit team also participated in the verification and review of the data included in this report. Further, EOG obtained independent third-party verification that its Scope 1 greenhouse gas emissions submitted to the EPA for 2019 (as referenced in this report) are in conformance with the EPA’s Mandatory Greenhouse Gas Reporting Rule (40 CFR Part 98, subparts C and W). This verification was performed by an internationally recognized certification body according to the ISO 14064 - 3:2006 – Greenhouse Gases Part 3: Specification with Guidance for the Validation and Verification of Greenhouse Gas assertions.
Prior to publication, this 2019 Sustainability Report was also reviewed by EOG’s executive officers and the members of the Nominating, Governance and Sustainability Committee of EOG’s Board of Directors.
ADDITIONAL DISCLOSURES
About EOG
EOG Resources, Inc. (NYSE: EOG) is one of the largest crude oil and natural gas exploration and production companies in the United States with proved reserves in the United States, Trinidad and China. For further information regarding EOG and our operations, please see our information filed with and/or furnished to the United States Securities and Exchange Commission (SEC) from time to time and our corporate website at www.eogresources.com.
Forward-Looking Statements
This report includes certain “forward-looking statements” within the meaning of Section 27A of the Securities Act of 1933, as amended, and Section 21E of the Securities Exchange Act of 1934, as amended, including statements regarding EOG’s expectations with respect to our current and future operations, performance and business strategy and statements regarding EOG’s practices, programs, policies, initiatives, plans, goals and targets with respect to environmental, social and governance matters. Although EOG believes the expectations reflected in our forward-looking statements are reasonable and are based on reasonable assumptions, no assurance can be given that such assumptions are accurate or that any of such expectations will be achieved (in full or at all) or will prove to have been correct. EOG’s forward-looking statements speak only as of the date made, and EOG undertakes no obligation, other than as required by applicable law, to update or revise our forward-looking statements, whether as a result of new information, subsequent events, anticipated or unanticipated circumstances or otherwise. Important factors that could cause EOG’s actual results to differ materially from the expectations reflected in EOG’s forward-looking statements are enumerated in the section entitled “Information Regarding Forward-Looking Statements” on pages 49 and 50 of EOG’s Annual Report on Form 10-K for the fiscal year ended December 31, 2019 filed with the SEC and any updates to those factors set forth in EOG's subsequent Quarterly Reports on Form 10-Q. Also, see the section entitled “Risk Factors” on pages 13 through 23 of EOG’s Annual Report on Form 10-K for the fiscal year ended December 31, 2019, on page 37 of EOG’s Quarterly Report on Form 10-Q for the quarterly period ended March 31, 2020, and on page 45 of EOG's Quarterly Report on Form 10-Q for the quarterly period ended June 30, 2020, for a discussion of certain risk factors that affect or may affect EOG’s business, operations and performance, and any updates to those factors set forth in EOG's subsequent filiings with the SEC.
| 49
Appendix
Third-Party Scenarios
The scenario discussed in this report from the IEA World Energy Outlook 2019 is based on the IEA’s Sustainable Development Scenario. In its World Energy Outlook 2019, the IEA also presents a Current Policies Scenario and a Stated Policies Scenario. The Stated Policies Scenario is the IEA’s central scenario and it incorporates existing policy frameworks affecting energy markets and specific policy initiatives that have been announced. IEA’s projected energy demand is highest under the Current Policies Scenario, which provides a baseline picture assuming that governments do not make any changes to their existing policies and measures. IEA’s projected energy demand is lowest under the Sustainable Development Scenario, which is based on the main energy-related components of the United Nation’s Sustainable Development Goals, including the Paris Agreement’s goal of limiting the increase in global average temperatures to well below 2 degrees Celsius above pre-industrial levels. The IEA does not endorse any particular scenario, nor does EOG, and the use or inclusion herein of a third-party scenario reflects the modeling assumptions and outputs of the respective authors and is not an endorsement by EOG of its likelihood or probability.
Metrics Reporting
The metrics contained in this report have been calculated using the best available information at the time of preparation of this report. The data utilized in calculating such metrics is subject to certain reporting rules, regulatory reviews, definitions, calculation methodologies, adjustments and other factors. As a result, these metrics are subject to change if updated data or other information becomes available. Accordingly, certain metrics in respect of prior years contained in this report may be revised from previous Sustainability Reports to reflect updated data and other information. Any updates to the metrics in the Data Tear Sheet in this report, prior to our next Sustainability Report, will be set forth in the data tear sheet posted to the “Sustainability” section of the EOG website. Further, certain of the total amounts presented in this report may not equal the sum of their components due to rounding.
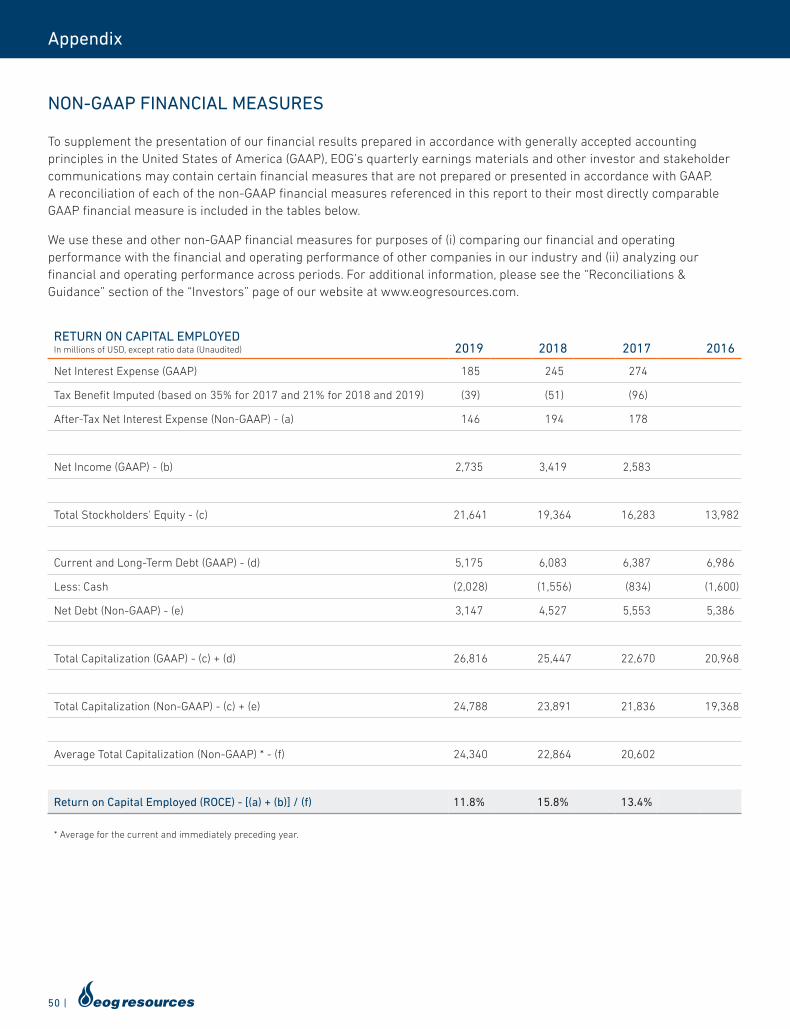
50 |
Appendix
NON-GAAP FINANCIAL MEASURES
To supplement the presentation of our financial results prepared in accordance with generally accepted accounting principles in the United States of America (GAAP), EOG’s quarterly earnings materials and other investor and stakeholder communications may contain certain financial measures that are not prepared or presented in accordance with GAAP. A reconciliation of each of the non-GAAP financial measures referenced in this report to their most directly comparable GAAP financial measure is included in the tables below.
We use these and other non-GAAP financial measures for purposes of (i) comparing our financial and operating performance with the financial and operating performance of other companies in our industry and (ii) analyzing our financial and operating performance across periods. For additional information, please see the “Reconciliations & Guidance” section of the “Investors” page of our website at www.eogresources.com.
RETURN ON CAPITAL EMPLOYED In millions of USD, except ratio data (Unaudited) 2019 2018 2017 2016
Net Interest Expense (GAAP) 185 245 274
Tax Benefit Imputed (based on 35% for 2017 and 21% for 2018 and 2019) (39) (51) (96)
After-Tax Net Interest Expense (Non-GAAP) - (a) 146 194 178
Net Income (GAAP) - (b) 2,735 3,419 2,583
Total Stockholders' Equity - (c) 21,641 19,364 16,283 13,982
Current and Long-Term Debt (GAAP) - (d) 5,175 6,083 6,387 6,986
Less: Cash (2,028) (1,556) (834) (1,600)
Net Debt (Non-GAAP) - (e) 3,147 4,527 5,553 5,386
Total Capitalization (GAAP) - (c) + (d) 26,816 25,447 22,670 20,968
Total Capitalization (Non-GAAP) - (c) + (e) 24,788 23,891 21,836 19,368
Average Total Capitalization (Non-GAAP) * - (f) 24,340 22,864 20,602
Return on Capital Employed (ROCE) - [(a) + (b)] / (f) 11.8% 15.8% 13.4%
* Average for the current and immediately preceding year.
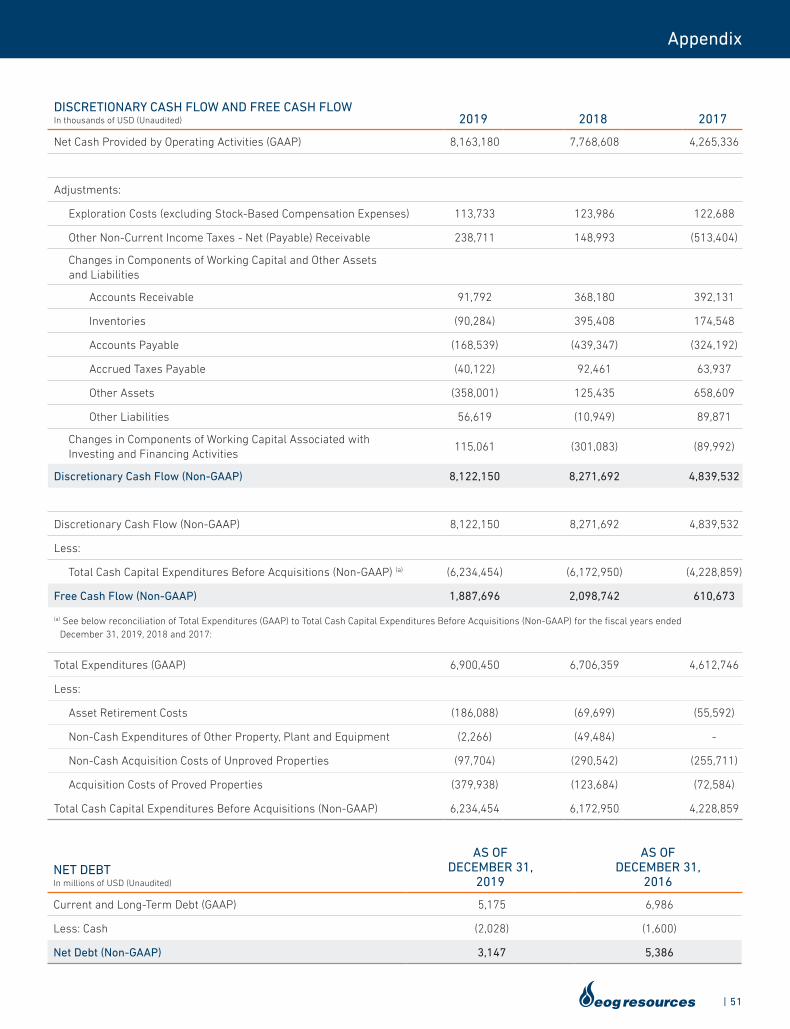
| 51
Appendix
DISCRETIONARY CASH FLOW AND FREE CASH FLOW In thousands of USD (Unaudited) 2019 2018 2017
Net Cash Provided by Operating Activities (GAAP) 8,163,180 7,768,608 4,265,336
Adjustments:
Exploration Costs (excluding Stock-Based Compensation Expenses) 113,733 123,986 122,688
Other Non-Current Income Taxes - Net (Payable) Receivable 238,711 148,993 (513,404)
Changes in Components of Working Capital and Other Assets and Liabilities
Accounts Receivable 91,792 368,180 392,131
Inventories (90,284) 395,408 174,548
Accounts Payable (168,539) (439,347) (324,192)
Accrued Taxes Payable (40,122) 92,461 63,937
Other Assets (358,001) 125,435 658,609
Other Liabilities 56,619 (10,949) 89,871
Changes in Components of Working Capital Associated with Investing and Financing Activities
115,061 (301,083) (89,992)
Discretionary Cash Flow (Non-GAAP) 8,122,150 8,271,692 4,839,532
Discretionary Cash Flow (Non-GAAP) 8,122,150 8,271,692 4,839,532
Less:
Total Cash Capital Expenditures Before Acquisitions (Non-GAAP) (a) (6,234,454) (6,172,950) (4,228,859)
Free Cash Flow (Non-GAAP) 1,887,696 2,098,742 610,673
Total Expenditures (GAAP) 6,900,450 6,706,359 4,612,746
Less:
Asset Retirement Costs (186,088) (69,699) (55,592)
Non-Cash Expenditures of Other Property, Plant and Equipment (2,266) (49,484) -
Non-Cash Acquisition Costs of Unproved Properties (97,704) (290,542) (255,711)
Acquisition Costs of Proved Properties (379,938) (123,684) (72,584)
Total Cash Capital Expenditures Before Acquisitions (Non-GAAP) 6,234,454 6,172,950 4,228,859
(a) See below reconciliation of Total Expenditures (GAAP) to Total Cash Capital Expenditures Before Acquisitions (Non-GAAP) for the fiscal years ended December 31, 2019, 2018 and 2017:
NET DEBT In millions of USD (Unaudited)
AS OF DECEMBER 31,
2019
AS OF DECEMBER 31,
2016
Current and Long-Term Debt (GAAP) 5,175 6,986
Less: Cash (2,028) (1,600)
Net Debt (Non-GAAP) 3,147 5,386

1111 Bagby, Sky Lobby 2Houston, TX 77002www.eogresources.com