Embed Size (px)
Citation preview

1
AngioDynamics Third Quarter 2019 Earnings Presentation
April 2, 2019

2
Forward-Looking StatementsNotice Regarding Forward-LookingStatementsThis presentation contains forward-looking statements within the meaning of the Private Securities Litigation Reform Act of 1995. All statements regarding AngioDynamics’ expected future financial position, results of operations, cash flows, business strategy, budgets, projected costs, capital expenditures, products, competitive positions, growth opportunities, plans and objectives of management for future operations, as well as statements that include the words such as “expects,” “reaffirms,” “intends,” “anticipates,” “plans,” “believes,” “seeks,” “estimates,” “optimistic,” or variations of such words and similar expressions, are forward-looking statements. These forward-looking statements are not guarantees of future performance and are subject to risks and uncertainties. Investors are cautioned that actual events or results may differ from AngioDynamics’ expectations. Factors that may affect the actual results achieved by AngioDynamics include, without limitation, the ability of AngioDynamics to develop its existing and new products, technological advances and patents attained by competitors, infringement of AngioDynamics’ technology or assertions that AngioDynamics’ technology infringes the technology of third parties, the ability of AngioDynamics to effectively compete against competitors that have substantially greater resources, future actions by the FDA or other regulatory agencies, domestic and foreign health care reforms and government regulations, results of pending or future clinical trials, overall economic conditions, the results of on-going litigation, challenges with respect to third-party distributors or joint venture partners or collaborators, the results of sales efforts, the effects of product recalls and product liability claims, changes in key personnel, the ability of AngioDynamics to execute on strategic initiatives, the effects of economic, credit and capital market conditions, general market conditions, market acceptance, foreign currency exchange rate fluctuations, the effects on pricing from group purchasing organizations and competition, the ability of AngioDynamics to integrate acquired businesses, as well as the risk factors listed from time to time in AngioDynamics’ SEC filings, including but not limited to its Annual Report on Form 10-K for the year ended May 31, 2018. AngioDynamics does not assume any obligation to publicly update or revise any forward-looking statements for any reason.
In the United States, the NanoKnife System has received a 510(k) clearance by the Food and Drug Administration for use in the surgical ablation of soft tissue, and is similarly approved for commercialization in Canada, the European Union and Australia. The NanoKnife System has not been cleared for the treatment or therapy of a specific disease or condition.
Notice Regarding Non-GAAP Financial MeasuresManagement uses non-GAAP measures to establish operational goals, and believes that non-GAAP measures may assist investors in analyzing the underlying trends in AngioDynamics’ business over time. Investors should consider these non-GAAP measures in addition to, not as a substitute for or as superior to, financial reporting measures prepared in accordance with GAAP. In this news release, AngioDynamics has reported adjusted EBITDAS (income before interest, taxes, depreciation and amortization and stock-based compensation); adjusted net income; adjusted earnings per share and free cash flow. Management uses these measures in its internal analysis and review of operational performance. Management believes that these measures provide investors with useful information in comparing AngioDynamics’ performance over different periods. By using these non-GAAP measures, management believes that investors get a better picture of the performance of AngioDynamics’ underlying business. Management encourages investors to review AngioDynamics’ financial results prepared in accordance with GAAP to understand AngioDynamics’ performance taking into account all relevant factors, including those that may only occur from time to time but have a material impact on AngioDynamics’ financialresults. Please see the tables that follow for a reconciliation of non-GAAP measures to measures prepared in accordance with GAAP.
3
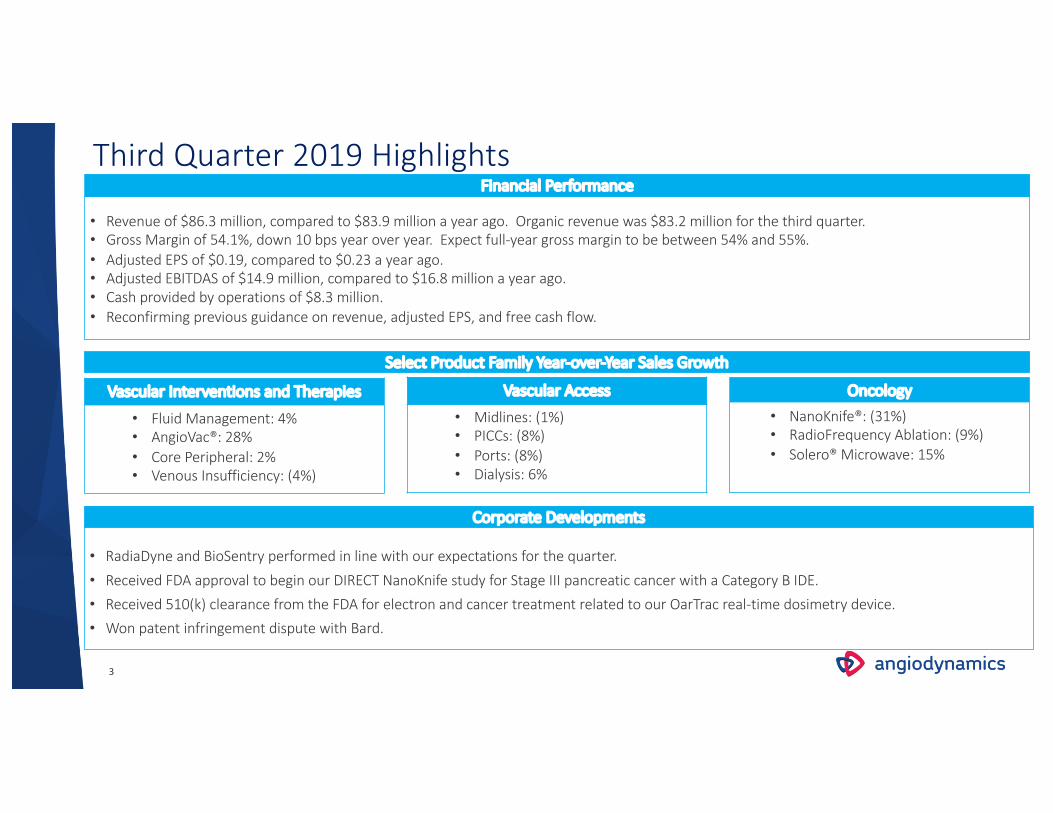
Third Quarter 2019 HighlightsFinancial Performance
• Revenue of $86.3 million, compared to $83.9 million a year ago. Organic revenue was $83.2 million for the third quarter.• Gross Margin of 54.1%, down 10 bps year over year. Expect full-year gross margin to be between 54% and 55%.• Adjusted EPS of $0.19, compared to $0.23 a year ago.• Adjusted EBITDAS of $14.9 million, compared to $16.8 million a year ago.• Cash provided by operations of $8.3 million.• Reconfirming previous guidance on revenue, adjusted EPS, and free cash flow.
Corporate Developments
• RadiaDyne and BioSentry performed in line with our expectations for the quarter.
• Received FDA approval to begin our DIRECT NanoKnife study for Stage III pancreatic cancer with a Category B IDE.
• Received 510(k) clearance from the FDA for electron and cancer treatment related to our OarTrac real-time dosimetry device.
• Won patent infringement dispute with Bard.
Vascular Interventions and Therapies
• Fluid Management: 4%• AngioVac®: 28% • Core Peripheral: 2%• Venous Insufficiency: (4%)
Vascular Access
• Midlines: (1%)• PICCs: (8%)• Ports: (8%)• Dialysis: 6%
Oncology
• NanoKnife®: (31%)• RadioFrequency Ablation: (9%)• Solero® Microwave: 15%
Select Product Family Year-over-Year Sales Growth

4
Third Quarter and Year-to-Date FY 2019 Results (unaudited)
$ in thousands (except per share data)FY2019
Q3 Results
FY2018
Q3 Results Change
FY2019 YTD
Results
FY2018 YTD
Results Change
Revenue
- Vascular Interventions and Therapies
- Vascular Access
- Oncology
- United States
- International
$86,341
50,115
22,348
13,878
68,331
18,010
$83,851
48,517
23,279
12,055
65,787
18,064
3.0%
3.3%
(4.0%)
15.1%
3.9%
(0.3%)
$263,184
152,603
69,861
40,720
207,898
55,286
$255,968
149,751
69,091
37,126
203,020
52,948
2.8%
1.9%
1.1%
9.7%
2.4%
4.4%
Net Income
Adjusted Net Income
$796
$7,377
$14,019
$8,652
$2,467
$21,979
$14,233
$19,927
GAAP Earnings Per Share
Non-GAAP Adjusted EPS
$0.02
$0.19
$0.37
$0.23
$0.06
$0.57
$0.38
$0.53
Gross Margin 54.1% 54.2% 53.3% 50.6%
Adjusted EBITDAS $14,925 $16,834 $43,864 $41,451
Free Cash Flow $7,455 $3,890 $10,125 $15,869
Cash $41,704 $74,096* $41,704 $74,096*
Debt $133,750 $92,500* $133,750 $92,500*
* Balances reflect amounts at 5/31/2018

5
GAAP to Non-GAAP Reconciliation

6
Reconciliation of GAAP to Non-GAAP Net Income and EPS
Amounts in thousands
(1) Includes costs related to merger and acquisition activities, restructurings, and unusual items, including asset impairments and write-offs, certain litigation, and other items.
(2) Adjustment to reflect the income tax provision on a non-GAAP basis has been calculated assuming no valuation allowance on the Company’s U.S. deferred tax assets and an effective tax rate of 23% for February 28, 2019. For February 28, 2018, the effective tax rate i) has been calculated using a blended rate of 30.62% for the year ended May 31, 2018 due to the enactment of the Tax Cuts and Jobs Act (the “Act”) that reduced the federal corporate tax rate to 21%; ii) excludes the benefit recorded in Q3 fiscal 2018 resulting from remeasurement of the Company’s deferred tax assets from the Act; iii) tax effects the non-GAAP adjustment shown above and iv) assumes the Company does not have a valuation allowance on its U.S deferred tax assets.
Three months ended Nine months ended
February 28, February 28, February 28, February 28, 2019 2018 2019 2018
(unaudited) (unaudited) Net Income $ 796 $ 14,019 $ 2,467 $ 14,233
Amortization of intangibles 5,342 4,191 14,646 12,433
Change in fair value of contingent consideration 609 31 865 218
Acquisition, restructuring and other items, net (1) 2,550 4,177 9,700 11,932 Tax effect of non-GAAP items (2) (1,920 ) (13,766 ) (5,699 ) (18,889 )
Adjusted net income $ 7,377 $ 8,652 $ 21,979 $ 19,927
Three months ended Nine months ended
February 28, February 28, February 28, February 28, 2019 2018 2019 2018
(unaudited) (unaudited) Diluted earnings per share $ 0.02 $ 0.37 $ 0.06 $ 0.38
Amortization of intangibles 0.14 0.11 0.38 0.33
Change in fair value of contingent consideration 0.02 0.00 0.02 0.01
Acquisition, restructuring and other items, net (1) 0.07 0.11 0.25 0.32
Tax effect of non-GAAP items (2) (0.06 ) (0.36 ) (0.14 ) (0.51 )
Adjusted diluted earnings per share $ 0.19 $ 0.23 $ 0.57 $ 0.53
Adjusted diluted sharecount 38,338 37,442 38,350 37,358

7
Reconciliation of Net Income to EBITDAS to Adjusted EBITDAS
Amounts in thousands
Three months ended Nine months ended
February 28, February 28, February 28, February 28,
2019 2018 2019 2018
(unaudited) (unaudited)
Net Income $ 796 $ 14,019 $ 2,467 $ 14,233
Income tax expense (benefit) 283 (9,948 ) 866 (10,095 )
Interest expense, net 1,442 740 3,689 2,223
Depreciation and amortization 6,867 5,718 19,158 17,395
Stock based compensation 2,378 2,058 7,119 5,821
EBITDAS $ 11,766 $ 12,587 $ 33,299 $ 29,577
Change in fair value of contingent consideration $ 609 $ 31 $ 865 $ 218
Acquisition, restructuring and other items, net (1) 2,550 4,216 9,700 11,656
Adjusted EBITDAS $ 14,925 $ 16,834 $ 43,864 $ 41,451
Per diluted share:
EBITDA $ 0.31 $ 0.34 $ 0.87 $ 0.79
Adjusted EBITDAS $ 0.39 $ 0.45 $ 1.14 $ 1.11
(1) Includes costs related to merger and acquisition activities, restructurings, and unusual items, including asset impairments and write-offs, certain litigation, and other items.

8
Growth throughFocus Execution Accountability


![“Nichigetsu-sama” [Soliluna], un cuento de Ango Sakaguchi ...Junto a Osamu Dazai, Sakunosuke Oda y otros, Ango Sakaguchi fue catalogado por la crítica como parte de la Burai-ha,](https://img.pdfslide.net/doc/110x75/60d927d281c5dc6bf87a1280/aoenichigetsu-samaa-soliluna-un-cuento-de-ango-sakaguchi-junto-a-osamu.jpg)