Embed Size (px)
Citation preview

2019年2月期
(財)財務会計基準機構
株式会社ローソンLawson, Inc.
Copyright © 2018 Lawson, Inc. All Rights Reserved.
第1四半期決算補足資料 東証第1部:コード 2651The First Section of the TSE, Code No. 2651
July 11, 2018
対象期間:2018年3月~2018年5月 http://www.lawson.co.jp/
Summary of financial results for the fiscal year ending February 28, 2019This covers the period from March 1, 2018 to May 31, 2018.
■連結業績Consolidated operating results
01 主な業績と予想Results and forecasts for major financial indicators
02 連結損益計算書Consolidated statement of income
販売費及び一般管理費の主な明細Selling, general and administrative expenses
03 投融資の状況Capital expenditure
のれんの状況Goodwill
04 連結貸借対照表Consolidated balance sheet
06 連結キャッシュ・フロー計算書Consolidated statement of cash flows
08 主な関係会社の状況Main subsidiaries and equity method affiliates
11 セグメント利益Segment profit
■単体業績Non-consolidated operating results
12 主な業績と予想Results and forecasts for major financial indicators
13 損益計算書Non-consolidated statement of income
販売費及び一般管理費の主な明細Selling, general and administrative expenses
14 投融資の状況Capital expenditure
15 貸借対照表Non-consolidated balance sheet
■店舗の状況Number of stores
17 国内コンビニエンスストアの店舗数の推移Number of convenience stores in Japan
18 国内コンビニエンスストア店舗数Number of convenience stores in Japan by store type
19 都道府県別店舗分布状況Number of convenience stores by region and prefecture
21 海外コンビニエンスストア店舗数Number of convenience stores abroad
22 その他セグメントの運営する店舗数Number of stores of other segments
■売上及び商品の状況(国内コンビニエンスストア)Sales and products (Convenience stores in Japan)
23 既存店売上高前年比及び既存店総荒利益高前年比Net sales and gross profit of existing stores
平均日販Average daily sales per store
全店客数及び客単価Average number of customers and average spending per customer (All stores)
全店商品別販売構成の推移及び総荒利益率の状況Sales and gross profit margin by merchandise category at store level (All stores)
24 国内コンビニエンスストア事業 グループ全店売上高Total sales of convenience store business in Japan
見通しに関する注意事項本資料では、ローソンおよび関係会社の将来についての計画や戦略、業績に関する予想および見通しの記述が含まれています。これらの記述は過去の事実ではなく、当社が現時点で把握可能な情報から判断した仮定および所信に基づく見込みです。また、経済動向、コンビニエンスストア業界における競争の激化、個人消費、市場需要、税制や諸制度などに関わるリスクや不確実性を際限なく含んでいます。それゆえ実際の業績は当社の見込みとは異なる可能性のあることをご承知おきください。
Cautionary StatementThis material may contain forward-looking statements and forecasts regarding the future plans, strategies and performances of Lawsonand its subsidiaries. These statements and forecasts are not historical fact. They are expectations based on assumptions and beliefsderived from information currently available to the Company and are subject to risks and uncertainties including, but not limited to,economic trends, heightened competition in the domestic convenience store sector, personal consumption, market demand, the tax systemand other legislation. As such, actual results may differ materially from those projected.
宝印刷株式会社 2018年07月11日 13時19分 $FOLDER; 1ページ (Tess 1.50(64) 20161024_02)

連結業績 Consolidated operating results
Copyright © 2018 Lawson, Inc. All Rights Reserved. 1
■主な業績と予想 Results and forecasts for major financial indicators
2017年度/FY2017 2018年度/FY2018
第1四半期/1Q
2017.3.1 - 2017.5.31
通期/Full year
2017.3.1 - 2018.2.28
第1四半期/1Q
2018.3.1 - 2018.5.31
通期計画/Full year (Forecast)
2018.3.1 - 2019.2.28
金額/Amount 前年比/YoY 金額/Amount 前年比/YoY 金額/Amount 前年比/YoY 金額/Amount 前年比/YoY
チェーン全店売上高 (百万円)*1
Net sales of convenience stores (millions of yen)553,676 106.5% 2,283,621 105.8% 591,009 106.7% 2,480,000 108.6%
加盟店売上高 (百万円)
Net sales of franchised stores (millions of yen) 506,676 106.1% 2,087,246 106.0% 536,636 105.9% - -
直営店売上高 (百万円)
Net sales of company-operated stores (millions of yen) 47,000 110.7% 196,375 104.4% 54,372 115.7% - -
営業総収入 (百万円)
Gross operating revenue (millions of yen) *2 159,216 106.9% 657,324 104.1% 170,516 107.1% 732,000 111.4%
営業総利益 (百万円)
Operating gross profit (millions of yen) 115,160 105.5% 475,950 104.1% 120,981 105.1% - -
(対チェーン全店売上高比)(Operating gross profit on Net sales of convenience stores) 20.8% 20.8% 20.5% -
販売費及び一般管理費 (百万円)
Selling, general and administrative expenses (millions of yen) 98,908 107.9% 410,129 107.0% 108,304 109.5% - -
(対チェーン全店売上高比)
(Selling, general and administrative expenses on Netsales of convenience stores)
17.9% 18.0% 18.3% -
営業利益 (百万円) Operating income (millions of yen) 16,252 93.1% 65,820 89.2% 12,677 78.0% 60,000 91.2%
(対チェーン全店売上高比)(Operating income on Net sales of convenience stores) 2.9% 2.9% 2.1% -
経常利益 (百万円) Ordinary income (millions of yen) 15,982 95.8% 65,141 89.2% 12,063 75.5% 57,000 87.5%
親会社株主に帰属する四半期(当期)純利益 (百万円)
Profit attributable to owners of parent (millions of yen) 9,597 108.8% 26,828 73.7% 6,169 64.3% 28,000 104.4%
1株当たり四半期(当期)純利益 (円)
Profit per share (yen) 95.96 268.16 61.65 279.83 *3
純資産 (百万円) Net assets (millions of yen) 275,067 281,446 274,910 -
総資産 (百万円) Total assets (millions of yen) 910,121 900,256 956,709 -
1株当たり純資産 (円) Net assets per share (yen) 2,688.69 2,755.06 2,690.88 -
総資産四半期(当期)純利益率 ROA 1.1% 3.0% 0.7% -
自己資本四半期(当期)純利益率 ROE 3.5% 9.7% 2.3% -
流動比率 Current ratio 69.8% 61.1% 62.5% -
固定比率 Fixed ratio 232.3% 242.5% 253.5% -
自己資本比率 Shareholders' equity ratio 29.5% 30.6% 28.1% -
(注)
*1 チェーン全店売上高は、(株)ローソン単体および連結子会社を対象とし、国内コンビニエンスストア事業、海外事業および成城石井事業の店舗売上高等の合計を記載しています。なお、成城石井事業については直営の成城石井店舗のみを集計しております。
*2 営業総収入は直営店売上高、加盟店からの収入等の合計です。*3 計画の1株当たり当期純利益に関しては、2018年5月31日現在の期末発行済株式数を用いて算出しております。
Notes:
*1 The net sales of convenience stores include Lawson, Inc. and its consolidated subsidiaries.Therefore, it is a sum of total sales of domestic convenience stores business, overseas business and Seijo Ishii business.In addition, for Seijo Ishii business, it is a total of its company-operated stores.
*2 The gross operating revenue is a sum of total sales of company-operated stores, income from franchised stores and others.*3 Forecasted profit per share is calculated based on the number of outstanding shares as of May 31, 2018.
宝印刷株式会社 2018年07月11日 13時19分 $FOLDER; 2ページ (Tess 1.50(64) 20161024_02)

連結業績 Consolidated operating results
Copyright © 2018 Lawson, Inc. All Rights Reserved. 2
■連結損益計算書 Consolidated statement of income
2017年度第1四半期累計期間 2018年度第1四半期累計期間 前年増減
2017.3.1 - 2017.5.31 2018.3.1 - 2018.5.31 Increase (Decrease)
百万円/Millions of yen 前年比/YoY 百万円/Millions of yen 前年比/YoY 百万円/Millions of yen
A.営業総収入 Gross operating revenue B+E 159,216 106.9% 170,516 107.1% 11,299
B.売上高 Net sales * 64,384 110.8% 71,998 111.8% 7,614
C.売上原価 Cost of sales 44,055 110.8% 49,534 112.4% 5,478
D.売上総利益 Gross profit B-C 20,328 110.7% 22,463 110.5% 2,135
E.営業収入 Operating revenues F+G 94,832 104.5% 98,517 103.9% 3,685
F.加盟店からの収入 Income from franchised stores 70,509 105.4% 73,829 104.7% 3,319
G.その他の営業収入 Other operating revenue 24,322 101.7% 24,688 101.5% 365
H.営業総利益 Operating gross profit A-C=D+E 115,160 105.5% 120,981 105.1% 5,820
I.販売費及び一般管理費 Selling, general and administrative expenses 98,908 107.9% 108,304 109.5% 9,395
J.営業利益 Operating income H-I 16,252 93.1% 12,677 78.0% — 3,574
営業外収益 Non-operating income 735 81.2% 907 123.3% 171
営業外費用 Non-operating expenses 1,005 59.8% 1,521 151.2% 515
経常利益 Ordinary income 15,982 95.8% 12,063 75.5% — 3,918
特別利益 Extraordinary income 302 — — — — 302
特別損失 Extraordinary losses 1,088 94.6% 1,369 125.7% 280
税金等調整前四半期純利益 Profit before income taxes 15,196 97.9% 10,694 70.4% — 4,501
法人税、住民税及び事業税 Income taxes - current 3,317 109.1% 3,705 111.7% 388
法人税等調整額 Income taxes - deferred 2,066 59.6% 807 39.1% — 1,258
四半期純利益 Profit 9,812 108.8% 6,181 63.0% — 3,630
非支配株主に帰属する四半期純利益Profit attributable to non-controlling interests 214 109.5% 12 5.6% — 202
親会社株主に帰属する四半期純利益Profit attributable to owners of parent 9,597 108.8% 6,169 64.3% — 3,428
(注)
* 「売上高」は、直営店売上高、Eコマース売上高、卸売事業売上高等の合計です。
Note:
* Net sales of company-operated stores, e-commerce business, wholesale business and others.
■販売費及び一般管理費の主な明細 Selling, general and administrative expenses
2017年度第1四半期累計期間 2018年度第1四半期累計期間 前年増減
2017.3.1 - 2017.5.31 2018.3.1 - 2018.5.31 Increase (Decrease)
百万円/Millions of yen 前年比/YoY 百万円/Millions of yen 前年比/YoY 百万円/Millions of yen
地代家賃 Rents 30,183 108.0% 32,675 108.3% 2,492
人件費 Personnel expenses 19,683 111.3% 20,921 106.3% 1,237
有形固定資産減価償却費 Depreciation of property and store equipment 11,138 103.6% 12,590 113.0% 1,451
広告宣伝費 Advertising expenses 6,924 101.5% 6,521 94.2% — 403
販売手数料 Sales commission 8,631 127.6% 10,339 119.8% 1,708
その他 Other 22,346 102.8% 25,255 113.0% 2,909
合計 Total 98,908 107.9% 108,304 109.5% 9,395
宝印刷株式会社 2018年07月11日 13時19分 $FOLDER; 3ページ (Tess 1.50(64) 20161024_02)

連結業績 Consolidated operating results
Copyright © 2018 Lawson, Inc. All Rights Reserved. 3
■投融資の状況 Capital expenditure
2017年度第1四半期累計期間 2018年度第1四半期累計期間 前年増減 2018年度計画
2017.3.1 - 2017.5.31 2018.3.1 - 2018.5.31 Increase (Decrease) Forecasts / 2018.3.1 - 2019.2.28
百万円/Millions of yen 百万円/Millions of yen 百万円/Millions of yen 百万円/Millions of yen
新店投資 New store investments 7,468 10,031 2,562 56,000
既存店投資Existing store investments 608 4,432 3,824 9,500
システム関連投資IT - related investments 4,369 5,543 1,174 20,000
その他 Other 3,956 331 — 3,624 5,500
投資小計 Subtotal 16,402 20,339 3,936 91,000
出資・融資Investments and advances — 512 164 677 4,000
リース Leases * 10,130 12,668 2,538 80,000
合計 Total 26,020 33,172 7,151 175,000
有形固定資産減価償却費Depreciation of property and storeequipment
11,165 12,617 1,451 56,400
無形固定資産償却費Amortization of intangible assets 2,536 3,092 556 15,000
減価償却費合計Total depreciation and amortization 13,701 15,709 2,007 71,400
(注)
* リース債務の返済による支出は、2017年度第1四半期累計期間は8,024百万円、2018年度第1四半期累計期間は9,738百万円です。
Note:
* The amount of repayments of lease obligations (consolidated) is 8,024 millions of yen in the first quarter of fiscal year 2017 and 9,738 millions of yen in the firstquarter of fiscal year 2018.
■のれんの状況 Goodwill
2017年度第1四半期累計期間 2018年度第1四半期累計期間 前年増減
2017.3.1 - 2017.5.31 2018.3.1 - 2018.5.31 Increase (Decrease)
百万円/Millions of yen 前年比/YoY 百万円/Millions of yen 前年比/YoY 百万円/Millions of yen
のれん償却額Amortization of goodwill
国内コンビニエンスストア事業Domestic convenience store business 340 218.9% 614 180.4% 273
成城石井事業Seijo Ishii business 359 100.0% 359 100.0% —
エンタテインメント関連事業Entertainment-related business 125 100.0% 125 100.0% —
その他 Other business 14 57.7% 15 102.3% 0
合計 Total 840 126.2% 1,114 132.6% 274
2017年度(2018年2月28日現在)
2018年度第1四半期(2018年5月31日現在)
2017年度末からの増減
FY2017 (As of 2018.2.28) FY2018 (As of 2018.5.31) Increase (Decrease) from 2018.2.28
百万円/Millions of yen 前年比/YoY 百万円/Millions of yen 前年比/YoY 百万円/Millions of yen
当期末残高Balance of goodwill at end of period
国内コンビニエンスストア事業Domestic convenience store business 15,159 134.5% 18,231 120.3% 3,072
成城石井事業Seijo Ishii business 23,833 94.3% 23,473 98.5% — 359
エンタテインメント関連事業Entertainment-related business 8,188 94.2% 8,063 98.5% — 125
その他 Other business 765 94.3% 730 95.3% — 35
合計 Total 47,947 104.1% 50,498 105.3% 2,551
宝印刷株式会社 2018年07月11日 13時19分 $FOLDER; 4ページ (Tess 1.50(64) 20161024_02)

連結業績 Consolidated operating results
Copyright © 2018 Lawson, Inc. All Rights Reserved. 4
■連結貸借対照表 Consolidated balance sheet
2017年度(2018年2月28日現在)
2018年度第1四半期(2018年5月31日現在)
2017年度末からの増減
FY2017 (As of 2018.2.28) FY2018 (As of 2018.5.31) Increase (Decrease) from 2018.2.28
[資産の部 Assets] 百万円/Millions of yen 百万円/Millions of yen 百万円/Millions of yen
流動資産 Current assets 231,860 274,261 42,401
現金及び預金 Cash and deposits 30,124 56,221 26,096
加盟店貸勘定 Accounts receivable - due from franchised stores 46,599 44,391 — 2,208
リース債権 Lease receivables 16,426 19,848 3,422
商品 Merchandise 18,913 20,673 1,759
未収入金 Accounts receivable - other 82,633 96,054 13,421
繰延税金資産 Deferred tax assets 3,411 2,719 — 691
その他 Other 33,779 34,408 628
貸倒引当金 Allowance for doubtful accounts — 28 — 55 — 26
固定資産 Non-current assets 668,395 682,448 14,052
有形固定資産 Property and store equipment 349,935 355,401 5,466
・建物及び構築物 Buildings and structures 197,979 201,284 3,305
・工具、器具及び備品 Tools, furniture and fixtures 16,355 16,052 — 303
・リース資産 Leased assets 123,940 125,715 1,775
・その他 Other 11,660 12,349 688
無形固定資産 Intangible assets 100,197 105,994 5,796
・ソフトウエア Software 41,602 45,004 3,402
・のれん Goodwill 47,947 50,498 2,551
・商標権 Trademark right 10,074 9,924 — 150
・その他 Other 573 566 — 6
投資その他の資産 Investments and other assets 218,262 221,052 2,789
・長期貸付金 Long-term loans receivable 47,425 47,694 269
・差入保証金 Guarantee deposits 100,686 101,494 808
・繰延税金資産 Deferred tax assets 24,406 25,787 1,381
・その他 Other 46,840 47,122 282
・貸倒引当金 Allowance for doubtful accounts — 1,095 — 1,046 48
資産合計 Total assets 900,256 956,709 56,453
有形固定資産の減価償却累計額Accumulated depreciation of property and store equipment 317,966 325,236 7,270
宝印刷株式会社 2018年07月11日 13時19分 $FOLDER; 5ページ (Tess 1.50(64) 20161024_02)

連結業績 Consolidated operating results
Copyright © 2018 Lawson, Inc. All Rights Reserved. 5
■連結貸借対照表 Consolidated balance sheet
2017年度(2018年2月28日現在)
2018年度第1四半期(2018年5月31日現在)
2017年度末からの増減
FY2017 (As of 2018.2.28) FY2018 (As of 2018.5.31) Increase (Decrease) from 2018.2.28
[負債の部 Liabilities] 百万円/Millions of yen 百万円/Millions of yen 百万円/Millions of yen
流動負債 Current liabilities 379,222 438,821 59,598
買掛金 Accounts payable - trade 118,174 133,818 15,643
短期借入金 Short-term loans payable 36,340 3,019 — 33,321
1年内返済予定の長期借入金Current portion of long-term loans payable 575 948 373
リース債務 Lease obligations 33,063 34,096 1,033
未払金 Accounts payable - other 60,741 67,410 6,669
未払法人税等 Income taxes payable 6,880 2,228 — 4,651
預り金 Deposits received 109,629 183,029 73,400
賞与引当金 Provision for bonuses 3,767 2,905 — 861
その他 Other 10,051 11,364 1,313
固定負債 Non-current liabilities 239,587 242,977 3,390
長期借入金 Long-term loans payable 55,469 55,096 — 373
リース債務 Lease obligations 113,617 116,571 2,953
繰延税金負債 Deferred tax liabilities 2,616 3,099 482
役員退職慰労引当金Provision for retirement benefits to executive officers and audit andsupervisory board members
271 287 15
退職給付に係る負債 Net defined benefit liability 13,781 14,104 322
資産除去債務 Asset retirement obligations 29,062 29,811 748
その他 Other 24,767 24,007 — 760
負債合計 Total liabilities 618,809 681,798 62,989
[純資産の部 Net assets]
株主資本 Shareholders' equity 270,280 263,705 — 6,574
資本金 Capital stock 58,506 58,506 —
資本剰余金 Capital surplus 46,689 46,693 3
利益剰余金 Retained earnings 166,124 159,537 — 6,587
自己株式 Treasury shares — 1,040 — 1,031 9
その他の包括利益累計額Accumulated other comprehensive income 5,377 5,537 159
その他有価証券評価差額金Valuation difference on available-for-sale securities 2,084 2,363 278
土地再評価差額金 Revaluation reserve for land — 575 — 575 —
為替換算調整勘定 Foreign currency translation adjustments 4,595 4,443 — 151
退職給付に係る調整累計額Remeasurements of defined benefit plans — 726 — 694 32
新株予約権 Subscription rights to shares 195 148 — 46
非支配株主持分 Non-controlling interests 5,593 5,518 — 74
純資産合計 Net assets 281,446 274,910 — 6,535
負債純資産合計 Liabilities and net assets 900,256 956,709 56,453
宝印刷株式会社 2018年07月11日 13時19分 $FOLDER; 6ページ (Tess 1.50(64) 20161024_02)
連結業績 Consolidated operating results
Copyright © 2018 Lawson, Inc. All Rights Reserved. 6
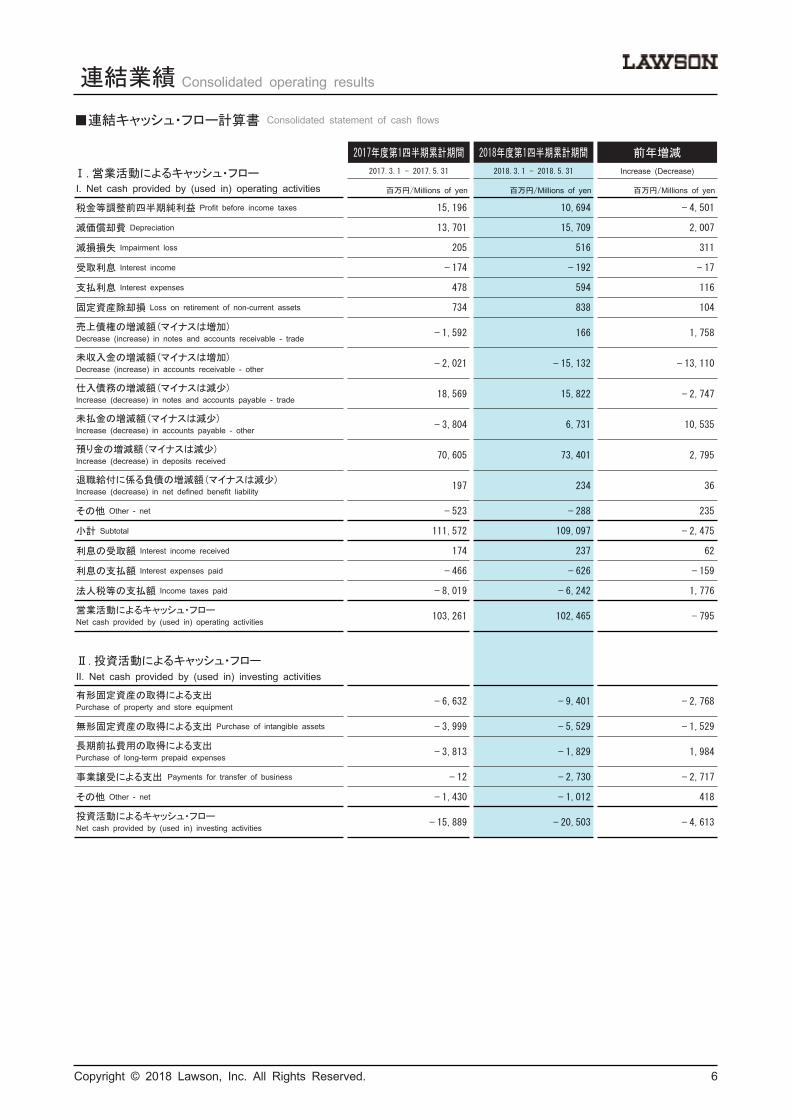
■連結キャッシュ・フロー計算書 Consolidated statement of cash flows
2017年度第1四半期累計期間 2018年度第1四半期累計期間 前年増減
Ⅰ.営業活動によるキャッシュ・フロー 2017.3.1 - 2017.5.31 2018.3.1 - 2018.5.31 Increase (Decrease)
I. Net cash provided by (used in) operating activities 百万円/Millions of yen 百万円/Millions of yen 百万円/Millions of yen
税金等調整前四半期純利益 Profit before income taxes 15,196 10,694 — 4,501
減価償却費 Depreciation 13,701 15,709 2,007
減損損失 Impairment loss 205 516 311
受取利息 Interest income — 174 — 192 — 17
支払利息 Interest expenses 478 594 116
固定資産除却損 Loss on retirement of non-current assets 734 838 104
売上債権の増減額(マイナスは増加)Decrease (increase) in notes and accounts receivable - trade — 1,592 166 1,758
未収入金の増減額(マイナスは増加)Decrease (increase) in accounts receivable - other — 2,021 — 15,132 — 13,110
仕入債務の増減額(マイナスは減少)Increase (decrease) in notes and accounts payable - trade 18,569 15,822 — 2,747
未払金の増減額(マイナスは減少)Increase (decrease) in accounts payable - other — 3,804 6,731 10,535
預り金の増減額(マイナスは減少)Increase (decrease) in deposits received 70,605 73,401 2,795
退職給付に係る負債の増減額(マイナスは減少)Increase (decrease) in net defined benefit liability 197 234 36
その他 Other - net — 523 — 288 235
小計 Subtotal 111,572 109,097 — 2,475
利息の受取額 Interest income received 174 237 62
利息の支払額 Interest expenses paid — 466 — 626 — 159
法人税等の支払額 Income taxes paid — 8,019 — 6,242 1,776
営業活動によるキャッシュ・フローNet cash provided by (used in) operating activities 103,261 102,465 — 795
Ⅱ.投資活動によるキャッシュ・フロー
II. Net cash provided by (used in) investing activities
有形固定資産の取得による支出Purchase of property and store equipment — 6,632 — 9,401 — 2,768
無形固定資産の取得による支出 Purchase of intangible assets — 3,999 — 5,529 — 1,529
長期前払費用の取得による支出Purchase of long-term prepaid expenses — 3,813 — 1,829 1,984
事業譲受による支出 Payments for transfer of business — 12 — 2,730 — 2,717
その他 Other - net — 1,430 — 1,012 418
投資活動によるキャッシュ・フローNet cash provided by (used in) investing activities — 15,889 — 20,503 — 4,613
宝印刷株式会社 2018年07月11日 13時19分 $FOLDER; 7ページ (Tess 1.50(64) 20161024_02)

連結業績 Consolidated operating results
Copyright © 2018 Lawson, Inc. All Rights Reserved. 7
■連結キャッシュ・フロー計算書 Consolidated statement of cash flows
2017年度第1四半期累計期間 2018年度第1四半期累計期間 前年増減
Ⅲ.財務活動によるキャッシュ・フロー 2017.3.1 - 2017.5.31 2018.3.1 - 2018.5.31 Increase (Decrease)
III. Net cash provided by (used in) financing activities 百万円/Millions of yen 百万円/Millions of yen 百万円/Millions of yen
短期借入金の純増減額(マイナスは減少)Net increase (decrease) in short-term loans payable — 29,750 — 33,321 — 3,571
リース債務の返済による支出 Repayments of lease obligations — 8,024 — 9,738 — 1,714
配当金の支払額 Cash dividends paid — 12,501 — 12,757 — 255
連結の範囲の変更を伴わない子会社株式の取得による支出Payments from changes in ownership interests in subsidiaries thatdo not result in change in scope of consolidation
— 7,757 — 7,757
その他 Other - net — 7 — 24 — 16
財務活動によるキャッシュ・フローNet cash provided by (used in) financing activities — 58,040 — 55,841 2,199
Ⅳ.現金及び現金同等物に係る換算差額IV. Effect of exchange rate change on cash and cash
equivalents— 126 — 34 91
Ⅴ.現金及び現金同等物の増減額(マイナスは減少)V. Net increase (decrease) in cash and cash equivalents
29,204 26,086 — 3,118
Ⅵ.現金及び現金同等物の期首残高VI. Cash and cash equivalents at beginning of period
67,692 30,120 — 37,571
Ⅶ.連結の範囲の変更に伴う現金及び現金同等物の増減額(マイナスは減少)
VII. Increase (decrease) in cash and cash equivalentsresulting from change of scope of consolidation
765 10 — 755
Ⅷ.現金及び現金同等物の四半期末残高VIII. Cash and cash equivalents at end of period
97,661 56,217 — 41,444
宝印刷株式会社 2018年07月11日 13時19分 $FOLDER; 8ページ (Tess 1.50(64) 20161024_02)

連結業績 Consolidated operating results
Copyright © 2018 Lawson, Inc. All Rights Reserved. 8
■主な関係会社の状況 Main subsidiaries and equity method affiliates
1.連結子会社 (株)ローソン山陰 (株)ローソンアーバンワークス*2
1. Consolidated subsidiaries Lawson Sanin, Inc. Lawson urbanworks, Inc.
設立日 Date of establishment 2016年9月 2016.9 2017年11月 2017.11
決算月 Fiscal year end 2月 February 2月 February
グループ出資比率 Share of group companies *1 70.0% 100.0%
事業内容 Business activities 山陰地方におけるコンビニエンスストア事業Lawson's chain-store development and operation in Sanin area
「ローソン」の店舗運営Store operation business of LAWSON stores
他出資者 Other shareholders 株式会社ポプラ POPLAR Co.,Ltd. 30.0% -
2017.3-2017.5 2018.3-2018.5 2017.3-2018.2 2017.3-2017.5 2018.3-2018.5 2017.3-2018.2
百万円/Millions of yen 百万円/Millions of yen
チェーン全店売上高 Total net sales 12,640 12,268 50,229 — 4,206 —
営業総収入 Gross operating revenue 2,002 1,886 7,876 — 4,282 —
営業利益 Operating income 190 101 582 — 124 —
経常利益 Ordinary income 190 103 596 — 130 —
当期純利益 Profit 86 34 254 — 84 —
(株)ローソンストア100*3 (株)SCILawson Store100, Inc. SCI, Inc.
設立日 Date of establishment 2013年11月 2013.11 2012年7月 2012.7
決算月 Fiscal year end 2月 February 2月 February
グループ出資比率 Share of group companies *1 100.0% 100.0%
事業内容 Business activities「ローソンストア100」の店舗運営及び指導並びに商品関連事業
Store operation and merchandising function of LAWSON STORE100
SCM機能子会社
Serving supply chain management of convenience store businesses
他出資者 Other shareholders - -
2017.3-2017.5 2018.3-2018.5 2017.3-2018.2 2017.3-2017.5 2018.3-2018.5 2017.3-2018.2
百万円/Millions of yen 百万円/Millions of yen
チェーン全店売上高 Total net sales 10,268 9,734 40,580 — — —
営業総収入 Gross operating revenue 11,366 10,884 44,942 67,572 74,256 283,884
営業利益 Operating income — 60 — 71 — 325 501 629 2,385
経常利益 Ordinary income — 60 — 70 — 328 502 630 2,392
当期純利益 Profit — 64 — 105 — 381 327 410 1,558
(株)成城石井 *4
SEIJO ISHII CO., LTD.
設立日 Date of establishment 1927年2月 1927.2
決算月 Fiscal year end 2月 February
グループ出資比率 Share of group companies *1 100.0%
事業内容 Business activities
食品総合小売業、輸入、卸売、食品製造及び飲食店の事業
Food retailing, import, wholesale, food manufactureand restaurant operations business
他出資者 Other shareholders -
2017.3-2017.5 2018.3-2018.5 2017.3-2018.2
百万円/Millions of yen
チェーン全店売上高 Total net sales 18,254 19,649 75,469
営業総収入 Gross operating revenue 19,699 21,515 81,957
営業利益 Operating income 1,962 2,063 7,611
経常利益 Ordinary income 1,954 2,048 7,598
当期純利益 Profit 1,096 1,168 4,339
(注)*1 グループ出資比率には、(株)ローソンからの出資のほか、グループ企業等からの出資を含みます。
*2 (株)ローソンアーバンワークスは、2018年3月より当社の連結子会社となっております。
*3 ローソンストア100事業全体の営業利益(社内管理ベース)は、2018年度第1四半期累計で — 102百万円となっております。これは、(株)ローソンストア100の営業利益に、(株)ローソンの担当事業本部による社内管理上の営業利益を合算して算出したものです。
*4 設立日については、創業時点を記載しております。
Notes:*1 Share of group companies includes investments from group companies besides investments from Lawson, Inc.*2 Lawson urbanworks, Inc. has become a consolidated subsidiary of Lawson, Inc. since March 2018.
*3 According to our internal calculation, the combined operating income of LAWSON STORE100 business has made a total of (102) million yen in the first quarter offiscal year 2018. This total was calculated by adding the operating income of Lawson Store100, Inc. together with the operating income of Lawson, Inc.'s LAWSONSTORE100 business division.
*4 It states the date of foundation.
宝印刷株式会社 2018年07月11日 13時19分 $FOLDER; 9ページ (Tess 1.50(64) 20161024_02)

連結業績 Consolidated operating results
Copyright © 2018 Lawson, Inc. All Rights Reserved. 9
■主な関係会社の状況 Main subsidiaries and equity method affiliates
(株)ローソンHMVエンタテイメント*2 ユナイテッド・シネマ(株)Lawson HMV Entertainment, Inc. United Cinemas Co., Ltd.
設立日 Date of establishment 1992年7月 1992.7 1999年10月 1999.10
決算月 Fiscal year end 2月 February 2月 February
グループ出資比率 Share of group companies *1 100.0% 100.0%
事業内容 Business activities
チケット販売・情報提供サービス業、音楽・映像ソフトの販売
Ticket sales, e-commerce, advertising salesand other marketing activities
映画館の運営及び関連事業
Operation of movie theaters and related business
他出資者 Other shareholders - -
2017.3-2017.5 2018.3-2018.5 2017.3-2018.2 2017.3-2017.5 2018.3-2018.5 2017.3-2018.2
百万円/Millions of yen 百万円/Millions of yen
営業総収入 Gross operating revenue 12,341 13,339 53,261 6,786 6,017 22,243
営業利益 Operating income 245 439 1,851 1,205 844 2,512
経常利益 Ordinary income 246 440 1,831 1,210 836 2,515
当期純利益 Profit 190 353 1,524 801 567 1,694
上海羅森便利有限公司 *3 重慶羅森便利店有限公司Shanghai Lawson, Inc. Chongqing Lawson, Inc.
設立日 Date of establishment 1996年2月 1996.2 2010年4月 2010.4
決算月 Fiscal year end 12月 December 12月 December
グループ出資比率 Share of group companies *1 100.0% 100.0%
事業内容 Business activities
中国上海市及びその周辺におけるコンビニエンスストア事業
Lawson's chain-store development and operationin Shanghai and surrounding area, China
中国重慶市におけるコンビニエンスストア事業
Lawson's chain-store development and operationin Chongqing, China
他出資者 Other shareholders - -
2017.1-2017.3 2018.1-2018.3 2017.1-2017.12 2017.1-2017.3 2018.1-2018.3 2017.1-2017.12
百万円/Millions of yen 百万円/Millions of yen
チェーン全店売上高 Total net sales 5,242 7,093 27,755 993 1,232 4,705
営業総収入 Gross operating revenue 3,273 4,501 19,905 747 848 3,225
営業利益 Operating income — 769 — 834 — 567 — 99 — 80 — 306
経常利益 Ordinary income — 778 — 797 — 653 — 104 — 79 — 324
当期純利益 Profit — 793 — 801 — 1,025 — 108 — 94 — 413
大連羅森便利店有限公司 羅森(北京)有限公司 *4
Dalian Lawson, Inc. Beijing Lawson, Inc.
設立日 Date of establishment 2011年9月 2011.9 2013年5月 2013.5
決算月 Fiscal year end 12月 December 12月 December
グループ出資比率 Share of group companies *1 98.3% 100.0%
事業内容 Business activities 中国大連市におけるコンビニエンスストア事業Lawson's chain-store development and operation in Dalian, China
中国北京市におけるコンビニエンスストア事業Lawson's chain-store development and operation in Beijing, China
他出資者 Other shareholders 亜恵美食有限公司 Acasia Foods Co.,LTD. 1.7% -
2017.1-2017.3 2018.1-2018.3 2017.1-2017.12 2017.1-2017.3 2018.1-2018.3 2017.1-2017.12
百万円/Millions of yen 百万円/Millions of yen
チェーン全店売上高 Total net sales 718 1,044 3,995 556 880 3,246
営業総収入 Gross operating revenue 485 545 2,371 563 746 3,106
営業利益 Operating income — 28 — 16 4 — 197 — 158 — 635
経常利益 Ordinary income — 31 — 15 — 5 — 194 — 184 — 641
当期純利益 Profit — 31 — 22 — 28 — 195 — 216 — 687
(注)
*1 グループ出資比率には、(株)ローソンからの出資のほか、グループ企業等からの出資を含みます。
*2 (株)ローソンHMVエンタテイメントは、2018年6月より商号を(株)ローソンエンタテインメントに変更しております。
*3 上表中の決算数値は、上海羅森便利有限公司に、中国上海市及びその周辺地域の上海楽松商貿有限公司、上海恭匯貿易有限公司、浙江羅森百貨有限公司3社の経営成績を合算しております。なお、上海羅森便利有限公司は、2017年2月より商号を上海華聯羅森有限公司から変更しております。
*4 羅森(北京)有限公司の上表中の決算数値は、羅森(北京)有限公司に、北京羅松商貿有限公司の経営成績を合算しております。
Notes:*1 Share of group companies includes investments from group companies besides investments from Lawson, Inc.*2 Lawson HMV Entertainment, Inc. has changed its name to Lawson Entertainment, Inc. since June 2018.*3 The operating result of Shanghai Lawson, Inc. includes a sum of operating results of 3 companies (Shanghai Le Song Trading Co., Ltd., Shang Hai Gong Hui
Trading Co., Ltd. and Zhejiang Lawson, Inc. located in Shanghai and surrounding area). Furthermore, Shanghai Hualian Lawson, Inc. has changed its name toShanghai Lawson, Inc. since February 2017.
*4 The operating result of Beijing Lawson, Inc. includes the operating result of BEIJING LUOSONG Co., Ltd.
宝印刷株式会社 2018年07月11日 13時19分 $FOLDER; 10ページ (Tess 1.50(64) 20161024_02)
連結業績 Consolidated operating results
Copyright © 2018 Lawson, Inc. All Rights Reserved. 10
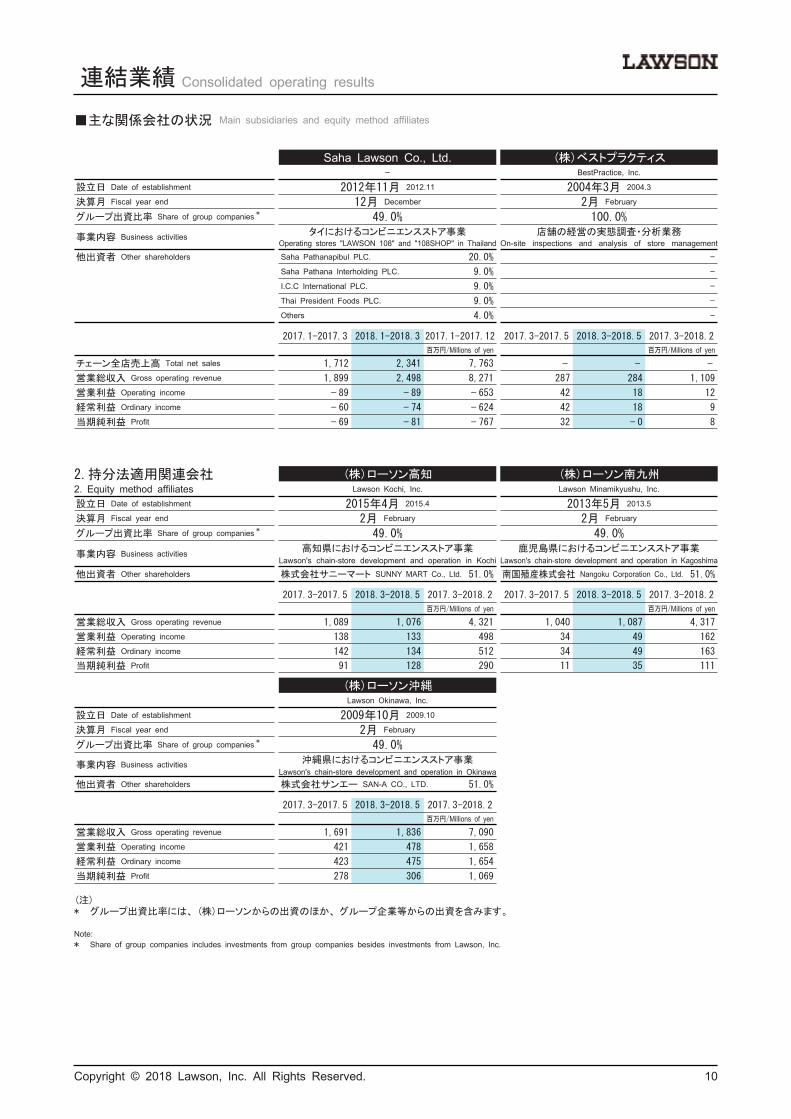
■主な関係会社の状況 Main subsidiaries and equity method affiliates
Saha Lawson Co., Ltd. (株)ベストプラクティス- BestPractice, Inc.
設立日 Date of establishment 2012年11月 2012.11 2004年3月 2004.3
決算月 Fiscal year end 12月 December 2月 February
グループ出資比率 Share of group companies * 49.0% 100.0%
事業内容 Business activities タイにおけるコンビニエンスストア事業Operating stores "LAWSON 108" and "108SHOP" in Thailand
店舗の経営の実態調査・分析業務On-site inspections and analysis of store management
他出資者 Other shareholders Saha Pathanapibul PLC. 20.0% -
Saha Pathana Interholding PLC. 9.0% -
I.C.C International PLC. 9.0% -
Thai President Foods PLC. 9.0% -
Others 4.0% -
2017.1-2017.3 2018.1-2018.3 2017.1-2017.12 2017.3-2017.5 2018.3-2018.5 2017.3-2018.2
百万円/Millions of yen 百万円/Millions of yen
チェーン全店売上高 Total net sales 1,712 2,341 7,763 — — —
営業総収入 Gross operating revenue 1,899 2,498 8,271 287 284 1,109
営業利益 Operating income — 89 — 89 — 653 42 18 12
経常利益 Ordinary income — 60 — 74 — 624 42 18 9
当期純利益 Profit — 69 — 81 — 767 32 — 0 8
2.持分法適用関連会社 (株)ローソン高知 (株)ローソン南九州2. Equity method affiliates Lawson Kochi, Inc. Lawson Minamikyushu, Inc.
設立日 Date of establishment 2015年4月 2015.4 2013年5月 2013.5
決算月 Fiscal year end 2月 February 2月 February
グループ出資比率 Share of group companies * 49.0% 49.0%
事業内容 Business activities 高知県におけるコンビニエンスストア事業Lawson's chain-store development and operation in Kochi
鹿児島県におけるコンビニエンスストア事業Lawson's chain-store development and operation in Kagoshima
他出資者 Other shareholders 株式会社サニーマート SUNNY MART Co., Ltd. 51.0% 南国殖産株式会社 Nangoku Corporation Co., Ltd. 51.0%
2017.3-2017.5 2018.3-2018.5 2017.3-2018.2 2017.3-2017.5 2018.3-2018.5 2017.3-2018.2
百万円/Millions of yen 百万円/Millions of yen
営業総収入 Gross operating revenue 1,089 1,076 4,321 1,040 1,087 4,317
営業利益 Operating income 138 133 498 34 49 162
経常利益 Ordinary income 142 134 512 34 49 163
当期純利益 Profit 91 128 290 11 35 111
(株)ローソン沖縄Lawson Okinawa, Inc.
設立日 Date of establishment 2009年10月 2009.10
決算月 Fiscal year end 2月 February
グループ出資比率 Share of group companies * 49.0%
事業内容 Business activities 沖縄県におけるコンビニエンスストア事業Lawson's chain-store development and operation in Okinawa
他出資者 Other shareholders 株式会社サンエー SAN-A CO., LTD. 51.0%
2017.3-2017.5 2018.3-2018.5 2017.3-2018.2
百万円/Millions of yen
営業総収入 Gross operating revenue 1,691 1,836 7,090
営業利益 Operating income 421 478 1,658
経常利益 Ordinary income 423 475 1,654
当期純利益 Profit 278 306 1,069
(注)* グループ出資比率には、(株)ローソンからの出資のほか、グループ企業等からの出資を含みます。
Note:* Share of group companies includes investments from group companies besides investments from Lawson, Inc.
宝印刷株式会社 2018年07月11日 13時19分 $FOLDER; 11ページ (Tess 1.50(64) 20161024_02)

連結業績 Consolidated operating results
Copyright © 2018 Lawson, Inc. All Rights Reserved. 11
■セグメント利益 Segment profit
2017年度第1四半期累計期間 2018年度第1四半期累計期間 前年増減
2017.3.1 - 2017.5.31 2018.3.1 - 2018.5.31 Increase (Decrease)
百万円/Millions of yen 前年比/YoY 百万円/Millions of yen 前年比/YoY 百万円/Millions of yen
セグメント利益 Segment profit
国内コンビニエンスストア事業Domestic convenience store business 13,092 90.6% 10,172 77.7% -2,919
成城石井事業Seijo Ishii business 1,773 107.0% 1,874 105.7% 100
エンタテインメント関連事業Entertainment-related business 1,316 139.7% 1,149 87.3% -167
金融関連事業Financial services business 1,322 86.6% 808 61.1% -514
その他 Other business -1,255 111.1% -1,327 105.7% -71
合計 Total 16,250 93.1% 12,677 78.0% -3,572
宝印刷株式会社 2018年07月11日 13時19分 $FOLDER; 12ページ (Tess 1.50(64) 20161024_02)

単体業績 Non-consolidated operating results
Copyright © 2018 Lawson, Inc. All Rights Reserved. 12
■主な業績と予想 Results and forecasts for major financial indicators
2017年度/FY2017 2018年度/FY2018
第1四半期/1Q
2017.3.1 - 2017.5.31
通期/Full year
2017.3.1 - 2018.2.28
第1四半期/1Q
2018.3.1 - 2018.5.31
通期計画/Full year (Forecast)
2018.3.1 - 2019.2.28
金額/Amount 前年比/YoY 金額/Amount 前年比/YoY 金額/Amount 前年比/YoY 金額/Amount 前年比/YoY
チェーン全店売上高 (百万円)
Net sales of all convenience stores (millions of yen) 513,558 103.6% 2,110,454 104.1% 546,498 106.4% 2,290,000 108.5%
加盟店売上高 (百万円)
Net sales of franchised stores (millions of yen) 501,367 103.1% 2,060,690 103.7% 533,728 106.5% - -
直営店売上高 (百万円)
Net sales of company-operated stores (millions of yen) 12,190 129.7% 49,764 121.6% 12,770 104.8% - -
営業総収入 (百万円)
Gross operating revenue (millions of yen) *1 90,718 104.5% 372,891 104.7% 94,269 103.9% 401,000 107.5%
営業総利益 (百万円)
Operating gross profit (millions of yen) 81,613 102.2% 335,792 103.1% 84,853 104.0% - -
(対チェーン全店売上高比)(Operating gross profit on Net sales of all convenience stores) 15.9% 15.9% 15.5% -
販売費及び一般管理費 (百万円)
Selling, general and administrative expenses (millions of yen) 69,021 104.5% 284,771 106.1% 75,514 109.4% - -
(対チェーン全店売上高比)
(Selling, general and administrative expenses on Netsales of all convenience stores)
13.4% 13.5% 13.8% -
営業利益 (百万円) Operating income (millions of yen) 12,591 91.6% 51,021 88.9% 9,339 74.2% 44,500 87.2%
(対チェーン全店売上高比)(Operating income on Net sales of all convenience stores) 2.5% 2.4% 1.7% -
経常利益 (百万円) Ordinary income (millions of yen) 12,676 93.3% 50,508 89.5% 17,168 135.4% 60,000 118.8%
四半期(当期)純利益 (百万円) Profit (millions of yen) 8,560 112.3% 19,417 101.7% 13,282 155.2% 38,000 195.7%
1株当たり四半期(当期)純利益 (円)
Profit per share (yen) 85.59 194.09 132.74 379.78 *2
純資産 (百万円) Net assets (millions of yen) 233,647 233,489 234,260 -
総資産 (百万円) Total assets (millions of yen) 812,662 798,603 835,339 -
1株当たり純資産 (円) Net assets per share (yen) 2,332.11 2,331.65 2,339.76 -
総資産四半期(当期)純利益率 ROA 1.1% 2.5% 1.6% -
自己資本四半期(当期)純利益率 ROE 3.6% 8.3% 5.7% -
流動比率 Current ratio 56.9% 47.2% 50.3% -
固定比率 Fixed ratio 257.3% 271.9% 274.8% -
自己資本比率 Shareholders' equity ratio 28.7% 29.2% 28.0% -
(注)
*1 営業総収入は直営店売上高、加盟店からの収入等の合計です。
*2 計画の1株当たり当期純利益に関しては、2018年5月31日現在の期末発行済株式数を用いて算出しております。
Notes:
*1 The gross operating revenue is a sum of total sales of company-operated stores, income from franchised stores and others.*2 Forecasted profit per share is calculated based on the number of outstanding shares as of May 31, 2018.
宝印刷株式会社 2018年07月11日 13時19分 $FOLDER; 13ページ (Tess 1.50(64) 20161024_02)

単体業績 Non-consolidated operating results
Copyright © 2018 Lawson, Inc. All Rights Reserved. 13
■損益計算書 Non-consolidated statement of income
2017年度第1四半期累計期間 2018年度第1四半期累計期間 前年増減
2017.3.1 - 2017.5.31 2018.3.1 - 2018.5.31 Increase (Decrease)
百万円/Millions of yen 前年比/YoY 百万円/Millions of yen 前年比/YoY 百万円/Millions of yen
A.営業総収入 Gross operating revenue B+E 90,718 104.5% 94,269 103.9% 3,551
B.売上高 Net sales * 12,506 128.1% 12,970 103.7% 464
C.売上原価 Cost of sales 9,104 130.6% 9,416 103.4% 311
D.売上総利益 Gross profit B-C 3,401 121.7% 3,554 104.5% 152
E.営業収入 Operating revenue F+G 78,211 101.5% 81,299 103.9% 3,087
F.加盟店からの収入 Income from franchised stores 68,951 102.5% 72,081 104.5% 3,130
G.その他の営業収入 Other operating revenue 9,259 94.7% 9,217 99.5% — 42
H.営業総利益 Operating gross profit A-C=D+E 81,613 102.2% 84,853 104.0% 3,239
I.販売費及び一般管理費 Selling, general and administrative expenses 69,021 104.5% 75,514 109.4% 6,492
J.営業利益 Operating income H-I 12,591 91.6% 9,339 74.2% — 3,252
営業外収益 Non-operating income 994 84.6% 9,112 916.2% 8,117
営業外費用 Non-operating expenses 909 68.4% 1,282 141.1% 373
経常利益 Ordinary income 12,676 93.3% 17,168 135.4% 4,491
特別利益 Extraordinary income 302 - — — — 302
特別損失 Extraordinary losses 1,057 102.6% 1,316 124.4% 258
税引前四半期純利益 Profit before income taxes 11,921 94.9% 15,851 133.0% 3,930
法人税、住民税及び事業税 Income taxes - current 2,182 101.3% 2,534 116.1% 351
法人税等調整額 Income taxes - deferred 1,178 42.4% 35 3.0% — 1,143
四半期純利益 Profit 8,560 112.3% 13,282 155.2% 4,721
(注)
* 「売上高」は、直営店売上高及びEコマース売上高の合計です。
Note:
* Net sales of company-operated stores and e-commerce business.
■販売費及び一般管理費の主な明細 Selling, general and administrative expenses *
2017年度第1四半期累計期間 2018年度第1四半期累計期間 前年増減
2017.3.1 - 2017.5.31 2018.3.1 - 2018.5.31 Increase (Decrease)
百万円/Millions of yen 前年比/YoY 百万円/Millions of yen 前年比/YoY 百万円/Millions of yen
地代家賃 Rents 25,961 106.1% 27,797 107.1% 1,836
人件費 Personnel expenses 11,330 110.7% 11,466 101.2% 135
有形固定資産減価償却費 Depreciation of property and store equipment 9,528 99.5% 10,798 113.3% 1,269
広告宣伝費 Advertising expenses 2,996 100.4% 3,523 117.6% 527
販売手数料 Sales commission 4,106 118.3% 5,328 129.7% 1,221
その他 Other 15,097 98.5% 16,599 109.9% 1,501
合計 Total 69,021 104.5% 75,514 109.4% 6,492
(注)
* ITコスト(社内管理ベース)は、2018年度第1四半期累計で17億円になります。なお、ITコストは「有形固定資産減価償却費」及び「その他」に計上しています。
Note:
* According to our internal calculation, IT - related expenses for the first quarter of fiscal 2018 stood at 17 billions of yen. These IT - related expenses are recordedunder “ Depreciation of property and store equipment” and “ Other.”
宝印刷株式会社 2018年07月11日 13時19分 $FOLDER; 14ページ (Tess 1.50(64) 20161024_02)

単体業績 Non-consolidated operating results
Copyright © 2018 Lawson, Inc. All Rights Reserved. 14
■投融資の状況 Capital expenditure
2017年度第1四半期累計期間 2018年度第1四半期累計期間 前年増減 2018年度計画
2017.3.1 - 2017.5.31 2018.3.1 - 2018.5.31 Increase (Decrease) Forecasts / 2018.3.1 - 2019.2.28
百万円/Millions of yen 百万円/Millions of yen 百万円/Millions of yen 百万円/Millions of yen
新店投資 New store investments 6,672 9,195 2,523 49,000
既存店投資Existing store investments 412 4,179 3,767 8,000
システム関連投資IT - related investments 3,905 2,505 — 1,399 12,000
その他 Other 3,743 143 — 3,599 5,000
投資小計 Subtotal 14,733 16,024 1,291 74,000
出資・融資Investments and advances 5,429 1,872 — 3,556 — 7,000
リース Leases * 8,811 10,630 1,819 71,000
合計 Total 28,973 28,528 — 445 138,000
有形固定資産減価償却費Depreciation of property and storeequipment
9,528 10,798 1,269 47,600
無形固定資産償却費Amortization of intangible assets 1,214 1,833 619 8,500
減価償却費合計Total depreciation and amortization 10,742 12,632 1,889 56,100
(注)
* リース債務の返済による支出は、2017年度第1四半期累計期間は6,963百万円、2018年度第1四半期累計期間は8,143百万円です。
Note:
* The amount of repayments of lease obligations is 6,963 millions of yen in the first quarter of fiscal year 2017 and 8,143 millions of yen in the first quarter of fiscal year2018.
宝印刷株式会社 2018年07月11日 13時19分 $FOLDER; 15ページ (Tess 1.50(64) 20161024_02)
単体業績 Non-consolidated operating results
Copyright © 2018 Lawson, Inc. All Rights Reserved. 15
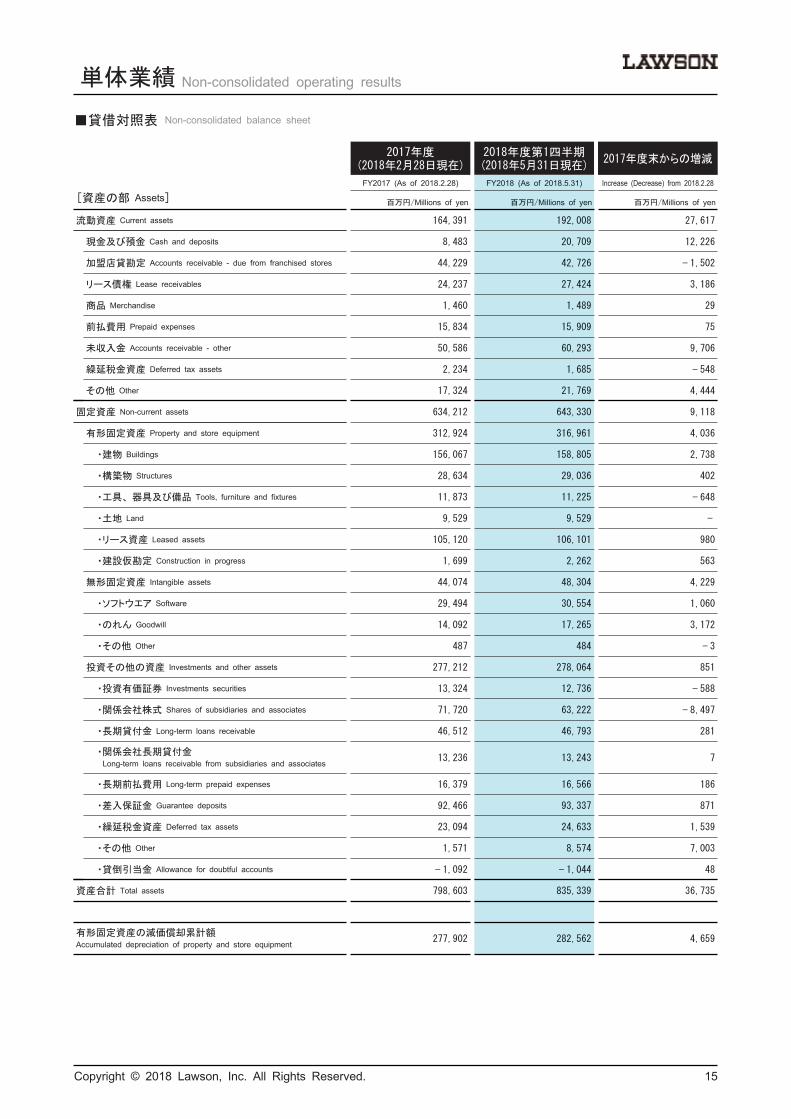
■貸借対照表 Non-consolidated balance sheet
2017年度(2018年2月28日現在)
2018年度第1四半期(2018年5月31日現在)
2017年度末からの増減
FY2017 (As of 2018.2.28) FY2018 (As of 2018.5.31) Increase (Decrease) from 2018.2.28
[資産の部 Assets] 百万円/Millions of yen 百万円/Millions of yen 百万円/Millions of yen
流動資産 Current assets 164,391 192,008 27,617
現金及び預金 Cash and deposits 8,483 20,709 12,226
加盟店貸勘定 Accounts receivable - due from franchised stores 44,229 42,726 — 1,502
リース債権 Lease receivables 24,237 27,424 3,186
商品 Merchandise 1,460 1,489 29
前払費用 Prepaid expenses 15,834 15,909 75
未収入金 Accounts receivable - other 50,586 60,293 9,706
繰延税金資産 Deferred tax assets 2,234 1,685 — 548
その他 Other 17,324 21,769 4,444
固定資産 Non-current assets 634,212 643,330 9,118
有形固定資産 Property and store equipment 312,924 316,961 4,036
・建物 Buildings 156,067 158,805 2,738
・構築物 Structures 28,634 29,036 402
・工具、器具及び備品 Tools, furniture and fixtures 11,873 11,225 — 648
・土地 Land 9,529 9,529 —
・リース資産 Leased assets 105,120 106,101 980
・建設仮勘定 Construction in progress 1,699 2,262 563
無形固定資産 Intangible assets 44,074 48,304 4,229
・ソフトウエア Software 29,494 30,554 1,060
・のれん Goodwill 14,092 17,265 3,172
・その他 Other 487 484 — 3
投資その他の資産 Investments and other assets 277,212 278,064 851
・投資有価証券 Investments securities 13,324 12,736 — 588
・関係会社株式 Shares of subsidiaries and associates 71,720 63,222 — 8,497
・長期貸付金 Long-term loans receivable 46,512 46,793 281
・関係会社長期貸付金Long-term loans receivable from subsidiaries and associates 13,236 13,243 7
・長期前払費用 Long-term prepaid expenses 16,379 16,566 186
・差入保証金 Guarantee deposits 92,466 93,337 871
・繰延税金資産 Deferred tax assets 23,094 24,633 1,539
・その他 Other 1,571 8,574 7,003
・貸倒引当金 Allowance for doubtful accounts — 1,092 — 1,044 48
資産合計 Total assets 798,603 835,339 36,735
有形固定資産の減価償却累計額Accumulated depreciation of property and store equipment 277,902 282,562 4,659
宝印刷株式会社 2018年07月11日 13時19分 $FOLDER; 16ページ (Tess 1.50(64) 20161024_02)

単体業績 Non-consolidated operating results
Copyright © 2018 Lawson, Inc. All Rights Reserved. 16
■貸借対照表 Non-consolidated balance sheet
2017年度(2018年2月28日現在)
2018年度第1四半期(2018年5月31日現在)
2017年度末からの増減
FY2017 (As of 2018.2.28) FY2018 (As of 2018.5.31) Increase (Decrease) from 2018.2.28
[負債の部 Liabilities] 百万円/Millions of yen 百万円/Millions of yen 百万円/Millions of yen
流動負債 Current liabilities 348,392 381,848 33,456
買掛金 Accounts payable - trade 106,137 119,863 13,726
短期借入金 Short-term loans payable 35,000 — — 35,000
関係会社短期借入金Short-term loans payable to subsidiaries and associates 51,620 37,220 — 14,400
リース債務 Lease obligations 29,488 30,376 888
未払金 Accounts payable - other 21,756 22,694 937
未払法人税等 Income taxes payable 3,817 1,036 — 2,781
未払費用 Accrued expenses 2,191 2,395 203
預り金 Deposits received 91,891 161,380 69,488
賞与引当金 Provision for bonuses 2,704 1,534 — 1,170
その他 Other 3,784 5,348 1,563
固定負債 Non-current liabilities 216,722 219,230 2,507
長期借入金 Long-term loans payable 50,000 50,000 —
リース債務 Lease obligations 104,638 107,129 2,490
退職給付引当金 Provision for retirement benefits 10,913 11,136 223
役員退職慰労引当金Provision for retirement benefits to executive officers 176 188 11
資産除去債務 Asset retirement obligations 25,689 26,389 700
その他 Other 25,304 24,386 — 918
負債合計 Total liabilities 565,114 601,079 35,964
[純資産の部 Net assets]
株主資本 Shareholders' equity 231,785 232,324 538
資本金 Capital stock 58,506 58,506 —
資本剰余金 Capital surplus 47,757 47,760 3
・資本準備金 Legal capital surplus 47,696 47,696 —
・その他資本剰余金 Other capital surplus 60 64 3
利益剰余金 Retained earnings 126,563 127,088 525
・利益準備金 Legal retained earnings 727 727 —
・別途積立金 General reserve 50,000 50,000 —
・繰越利益剰余金 Retained earnings brought forward 75,835 76,360 525
自己株式 Treasury shares — 1,040 — 1,031 9
評価・換算差額等 Valuation and translation adjustments 1,508 1,787 278
その他有価証券評価差額金Valuation difference on available-for-sale securities 2,083 2,362 278
土地再評価差額金 Revaluation reserve for land — 575 — 575 —
新株予約権 Subscription rights to shares 195 148 — 46
純資産合計 Net assets 233,489 234,260 771
負債純資産合計 Liabilities and net assets 798,603 835,339 36,735
宝印刷株式会社 2018年07月11日 13時19分 $FOLDER; 17ページ (Tess 1.50(64) 20161024_02)

店舗の状況 Number of stores
Copyright © 2018 Lawson, Inc. All Rights Reserved. 17
■国内コンビニエンスストアの店舗数の推移 Number of convenience stores in Japan*
2017年度1Q/FY2017 2018年度1Q/FY2018 2018年度計画/FY2018 (Forecast)2017.3.1 - 2017.5.31 2018.3.1 - 2018.5.31 2018.3.1 - 2019.2.28
単体 Non-consolidated 「ローソン」「ナチュラルローソン」のみ 「ローソン」「ナチュラルローソン」のみ 「ローソン」「ナチュラルローソン」のみ
開店 Opening (店/Store) 153 152 285 280 1,150 1,100
閉店 Closure (店/Store) 78 72 66 61 370 350
うち置換(-) Re-location (-) 19 19 8 8 — —
純増 Net Increase (店/Store) 75 80 219 219 780 750
総店舗数 Total number of stores 12,363 11,570 13,364 12,559 13,925 13,090
グループ会社 Group company
開店 Opening (店/Store) 5 8 50
閉店 Closure (店/Store) 1 5 30
純増 Net Increase (店/Store) 4 3 20
総店舗数 Total number of stores 827 850 867
グループ計 Total
開店 Opening (店/Store) 158 293 1,200
閉店 Closure (店/Store) 79 71 400
純増 Net Increase (店/Store) 79 222 800
総店舗数 Total number of stores 13,190 14,214 14,792
(注)
* 当社グループの運営するコンビニエンスストアの店舗数であり、(株)ローソン山陰、(株)ローソン高知、(株)ローソン南九州、(株)ローソン沖縄の運
営する店舗数を含みます。
Note:
* The number of stores is a total number of stores operated by the Lawson group including the number of stores operated by Lawson Sanin, Inc., Lawson Kochi, Inc.,Lawson Minamikyushu, Inc. and Lawson Okinawa, Inc.
宝印刷株式会社 2018年07月11日 13時19分 $FOLDER; 18ページ (Tess 1.50(64) 20161024_02)

店舗の状況 Number of stores
Copyright © 2018 Lawson, Inc. All Rights Reserved. 18
■国内コンビニエンスストア店舗数 Number of convenience stores in Japan by store type
2017年5月 2018年2月 2018年5月 期中増減店舗数
May, 2017 February, 2018 May, 2018 Net increase (Decrease)
店/Store 構成比/Share 店/Store 構成比/Share 店/Store 構成比/Share 店/Store
株式会社ローソン Lawson, Inc.
直営店 Company-operated stores
ローソン LAWSON 276 2.1% 284 2.0% 289 2.0% 5
ナチュラルローソン NATURAL LAWSON 30 0.2% 28 0.2% 27 0.2% — 1
加盟店 Franchised stores
Bタイプ Type B 1,310 9.9% 1,616 11.5% 1,739 12.2% 123
Gタイプ Type G 1,646 12.5% 1,582 11.3% 1,553 10.9% — 29
Cタイプ Type C 8,194 62.1% 8,715 62.3% 8,837 62.2% 122
ナチュラルローソン NATURAL LAWSON 114 0.9% 115 0.8% 114 0.8% — 1
ローソンストア100 LAWSON STORE100 793 6.0% 805 5.8% 805 5.7% —
小計 Subtotal 12,363 93.7% 13,145 93.9% 13,364 94.0% 219
株式会社ローソン山陰 Lawson Sanin, Inc.
直営店 Company-operated stores 5 0.0% 5 0.0% 4 0.0% — 1
加盟店 Franchised stores 283 2.1% 285 2.0% 287 2.0% 2
小計 Subtotal 288 2.2% 290 2.1% 291 2.0% 1
株式会社ローソン高知 Lawson Kochi, Inc.
直営店 Company-operated stores 4 0.0% 3 0.0% 4 0.0% 1
加盟店 Franchised stores 131 1.0% 136 1.0% 135 0.9% — 1
小計 Subtotal 135 1.0% 139 1.0% 139 1.0% —
株式会社ローソン南九州 Lawson Minamikyushu, Inc.
直営店 Company-operated stores 2 0.0% 2 0.0% 2 0.0% —
加盟店 Franchised stores 190 1.4% 192 1.4% 193 1.4% 1
小計 Subtotal 192 1.5% 194 1.4% 195 1.4% 1
株式会社ローソン沖縄 Lawson Okinawa, Inc.
直営店 Company-operated stores 3 0.0% 3 0.0% 3 0.0% —
加盟店 Franchised stores 209 1.6% 221 1.6% 222 1.6% 1
小計 Subtotal 212 1.6% 224 1.6% 225 1.6% 1
国内コンビニエンスストアグループ店舗数計Total number of convenience stores in Japan
13,190 100.0% 13,992 100.0% 14,214 100.0% 222
宝印刷株式会社 2018年07月11日 13時19分 $FOLDER; 19ページ (Tess 1.50(64) 20161024_02)

店舗の状況 Number of stores
Copyright © 2018 Lawson, Inc. All Rights Reserved. 19
■都道府県別店舗分布状況 Number of convenience stores by region and prefecture
2018年2月 2018年5月 期中増減店舗数
February, 2018 May, 2018 Net increase (Decrease)
ローソン* ローソンストア100 計 ローソン* ローソンストア100 計 ローソン* ローソンストア100 計
LAWSON LAWSON STORE100 Total LAWSON LAWSON STORE100 Total LAWSON LAWSON STORE100 Total
店/Store 店/Store 店/Store 店/Store 店/Store 店/Store 店/Store 店/Store 店/Store
北海道 Hokkaido 北海道 Hokkaido 654 — 654 657 — 657 3 — 3
東北 Tohoku 青森 Aomori 246 — 246 251 — 251 5 — 5
秋田 Akita 190 — 190 192 — 192 2 — 2
岩手 Iwate 172 — 172 172 — 172 — — —
宮城 Miyagi 240 — 240 244 — 244 4 — 4
山形 Yamagata 108 — 108 107 — 107 — 1 — — 1
福島 Fukushima 142 — 142 147 — 147 5 — 5
小計 Subtotal 1,098 — 1,098 1,113 — 1,113 15 — 15
関東 Kanto 栃木 Tochigi 196 — 196 195 — 195 — 1 — — 1
群馬 Gunma 122 — 122 121 — 121 — 1 — — 1
埼玉 Saitama 628 46 674 635 46 681 7 — 7
千葉 Chiba 560 50 610 562 50 612 2 — 2
茨城 Ibaraki 206 4 210 208 4 212 2 — 2
東京 Tokyo 1,402 285 1,687 1,436 284 1,720 34 — 1 33
神奈川 Kanagawa 923 138 1,061 961 139 1,100 38 1 39
小計 Subtotal 4,037 523 4,560 4,118 523 4,641 81 — 81
甲信越 Koshinetsu 新潟 Niigata 159 — 159 228 — 228 69 — 69
山梨 Yamanashi 128 — 128 128 — 128 — — —
長野 Nagano 176 — 176 176 — 176 — — —
小計 Subtotal 463 — 463 532 — 532 69 — 69
北陸 Hokuriku 石川 Ishikawa 103 — 103 104 — 104 1 — 1
富山 Toyama 190 — 190 192 — 192 2 — 2
福井 Fukui 114 — 114 114 — 114 — — —
小計 Subtotal 407 — 407 410 — 410 3 — 3
東海 Tokai 静岡 Shizuoka 268 — 268 272 — 272 4 — 4
愛知 Aichi 585 98 683 595 98 693 10 — 10
岐阜 Gifu 170 6 176 169 6 175 — 1 — — 1
三重 Mie 139 — 139 139 — 139 — — —
小計 Subtotal 1,162 104 1,266 1,175 104 1,279 13 — 13
(注)
* ローソンの店舗数には、「ローソン」「ナチュラルローソン」を含みます。
Note:
* The number of stores of LAWSON includes LAWSON and NATURAL LAWSON.
宝印刷株式会社 2018年07月11日 13時19分 $FOLDER; 20ページ (Tess 1.50(64) 20161024_02)

店舗の状況 Number of stores
Copyright © 2018 Lawson, Inc. All Rights Reserved. 20
■都道府県別店舗分布状況 Number of convenience stores by region and prefecture
2018年2月 2018年5月 期中増減店舗数
February, 2018 May, 2018 Net increase (Decrease)
ローソン* ローソンストア100 計 ローソン* ローソンストア100 計 ローソン* ローソンストア100 計
LAWSON LAWSON STORE100 Total LAWSON LAWSON STORE100 Total LAWSON LAWSON STORE100 Total
店/Store 店/Store 店/Store 店/Store 店/Store 店/Store 店/Store 店/Store 店/Store
近畿 Kinki 京都 Kyoto 309 29 338 309 30 339 — 1 1
滋賀 Shiga 157 — 157 157 — 157 — — —
奈良 Nara 138 — 138 138 — 138 — — —
和歌山 Wakayama 145 — 145 149 — 149 4 — 4
大阪 Osaka 1,012 116 1,128 1,020 115 1,135 8 — 1 7
兵庫 Hyogo 644 33 677 646 33 679 2 — 2
小計 Subtotal 2,405 178 2,583 2,419 178 2,597 14 — 14
中国 Chugoku 岡山 Okayama 188 — 188 192 — 192 4 — 4
広島 Hiroshima 211 — 211 216 — 216 5 — 5
山口 Yamaguchi 118 — 118 118 — 118 — — —
鳥取 Tottori 143 — 143 144 — 144 1 — 1
島根 Shimane 146 — 146 146 — 146 — — —
小計 Subtotal 806 — 806 816 — 816 10 — 10
四国 Shikoku 香川 Kagawa 134 — 134 134 — 134 — — —
愛媛 Ehime 219 — 219 220 — 220 1 — 1
徳島 Tokushima 134 — 134 136 — 136 2 — 2
高知 Kochi 139 — 139 139 — 139 — — —
小計 Subtotal 626 — 626 629 — 629 3 — 3
九州 Kyushu 福岡 Fukuoka 493 — 493 499 — 499 6 — 6
佐賀 Saga 72 — 72 72 — 72 — — —
長崎 Nagasaki 105 — 105 107 — 107 2 — 2
大分 Oita 182 — 182 184 — 184 2 — 2
熊本 Kumamoto 153 — 153 152 — 152 — 1 — — 1
宮崎 Miyazaki 106 — 106 106 — 106 — — —
鹿児島 Kagoshima 194 — 194 195 — 195 1 — 1
小計 Subtotal 1,305 — 1,305 1,315 — 1,315 10 — 10
沖縄 Okinawa 沖縄 Okinawa 224 — 224 225 — 225 1 — 1
国内コンビニエンスストアグループ店舗数計Total number of convenience stores in Japan 13,187 805 13,992 13,409 805 14,214 222 — 222
(注)
* ローソンの店舗数には、「ローソン」「ナチュラルローソン」を含みます。
Note:
* The number of stores of LAWSON includes LAWSON and NATURAL LAWSON.
宝印刷株式会社 2018年07月11日 13時19分 $FOLDER; 21ページ (Tess 1.50(64) 20161024_02)

店舗の状況 Number of stores
Copyright © 2018 Lawson, Inc. All Rights Reserved. 21
■海外コンビニエンスストア店舗数 Number of convenience stores abroad
2017年5月 2018年2月 2018年5月 期中増減店舗数
May, 2017 February, 2018 May, 2018 Net increase (Decrease)
店/Store 店/Store 店/Store 店/Store
中国 上海市及びその周辺地域China Shanghai and surrounding area 702 865 983 118
中国 重慶市China Chongqing 144 165 173 8
中国 大連市China Dalian 87 122 129 7
中国 北京市China Beijing 58 73 79 6
中国 武漢市China Wuhan 102 198 216 18
タイThailand 89 101 104 3
インドネシアIndonesia 35 37 37 —
フィリピンPhilippines 30 33 34 1
米国 ハワイ州United States of America Hawaii 2 2 2 —
宝印刷株式会社 2018年07月11日 13時19分 $FOLDER; 22ページ (Tess 1.50(64) 20161024_02)

店舗の状況 Number of stores
Copyright © 2018 Lawson, Inc. All Rights Reserved. 22
■その他セグメントの運営する店舗数 Number of stores of other segments
2017年5月 2018年2月 2018年5月 期中増減店舗数
May, 2017 February, 2018 May, 2018 Net increase (Decrease)
店/Store 店/Store 店/Store 店/Store
株式会社成城石井 *1
SEIJO ISHII CO., LTD.135 140 141 1
株式会社ローソンHMVエンタテイメント *2
Lawson HMV Entertainment, Inc.55 54 56 2
ユナイテッド・シネマ株式会社 *3
United Cinemas Co., Ltd.39 40 40 —
(注)
*1 (株)成城石井については、直営の成城石井店舗のみを記載しております。
*2 (株)ローソンHMVエンタテイメントは、2018年6月より商号を(株)ローソンエンタテインメントに変更しております。
*3 ユナイテッド・シネマ(株)については、劇場数を記載しております。
Notes:
*1 For SEIJO ISHII CO., LTD., it states number of its company-operated stores only.*2 Lawson HMV Entertainment, Inc. has changed its name to Lawson Entertainment, Inc. since June 2018.
*3 For United Cinemas Co., Ltd., it states number of theaters.
宝印刷株式会社 2018年07月11日 13時19分 $FOLDER; 23ページ (Tess 1.50(64) 20161024_02)

売上及び商品の状況(国内コンビニエンスストア) Sales and products (Convenience stores in Japan)*1
Copyright © 2018 Lawson, Inc. All Rights Reserved. 23
■既存店売上高前年比及び既存店総荒利益高前年比 Net sales and gross profit of existing stores
2017年度/FY2017 2018年度/FY2018
第1四半期累計期間/1Q 通期/Full year 第1四半期累計期間/1Q通期計画/Full
year (Forecast)
前年比/YoY 前年比/YoY 前年比/YoY 前年比/YoY
売上高 Net sales 101.5% 99.9% 97.4% 101.0%
客数 Number of customers 99.0% 99.0% 97.9% —
客単価 Spending per customer 100.6% 100.8% 99.5% —
売上高(チケット等除く)Net sales (excluding sales of tickets, etc.) — — 99.4% —
総荒利益高 Gross profit 101.4% 99.6% 97.3% 101.3%
売上高(ローソンストア100含む)Net sales (including LAWSON STORE100) 101.3% 99.8% 97.5%
■平均日販 Average daily sales per store
2017年度/FY2017 2018年度/FY2018
第1四半期累計期間/1Q 通期/Full year 第1四半期累計期間/1Q
千円/Thousands of yen 千円/Thousands of yen 千円/Thousands of yen
全店 All stores 534 536 517
新店 New stores 503 491 541
■全店客数及び客単価 Average number of customers and average spending per customer (All stores)
2017年度/FY2017 2018年度/FY2018
第1四半期累計期間/1Q 通期/Full year 第1四半期累計期間/1Q
人、円/Person, Yen 人、円/Person, Yen 人、円/Person, Yen
客数 Number of customers 794 792 774
客単価 Spending per customer 672 676 668
■全店商品別販売構成の推移及び総荒利益率の状況 Sales and gross profit margin by merchandise category at store level (All stores)
2017年度/FY2017 2018年度/FY2018
第1四半期累計期間/1Q 通期/Full year 第1四半期累計期間/1Q通期計画/Full
year (Forecast)
十億円Billions of yen
構成比Share
総荒利益率Gross Profit Margin
十億円Billions of yen
構成比Share
総荒利益率Gross Profit Margin
十億円Billions of yen
構成比Share
総荒利益率Gross Profit Margin
総荒利益率Gross Profit Margin
ファストフード Fast foods 115.8 24.1% 38.3% 484.9 24.5% 38.3% 124.7 24.3% 38.3% —
日配食品 Daily delivered foods 64.8 13.5% 33.8% 268.0 13.5% 33.9% 70.5 13.7% 33.7% —
加工食品 Processed foods 256.2 53.3% 24.1% 1,043.0 52.7% 24.0% 272.0 53.0% 24.0% —
うち、タバコ Cigarettes 121.5 25.3% 10.8% 498.6 25.2% 10.8% 129.8 25.3% 10.8% —
非食品 Non-food products *2 43.4 9.1% 51.0% 182.9 9.3% 50.1% 46.2 9.0% 51.3% —
合計 Total 480.4 100.0% 31.3% 1,979.0 100.0% 31.3% 513.6 100.0% 31.3% 31.4%
分類 Category
ファストフード Fast foods 米飯・麺・調理パン(サンドイッチ等)・デリカ・ファストフード等Rice, noodles, bread, delicatessen items, over-the-counter fast foods, etc.
日配食品 Daily delivered foods ベーカリー・デザート・アイスクリーム・生鮮食品等Bakery items, desserts, ice creams, perishable foods (vegetable, fruits and meat), etc.
加工食品 Processed foods 飲料・酒類・タバコ・加工食品・菓子等 Soft drinks, alcoholic drinks, cigarettes, processed foods, confectioneries, etc.
非食品 Non-food products 日用品・本・雑誌等 Daily necessities, books, magazines, etc.
(注)
*1 売上高(ローソンストア100含む)を除く上記の数値は、(株)ローソンが運営する「ローソン」「ナチュラルローソン」の合計です。なお、本頁の各数値には、エリアフランチャイズ各社(株)ローソン山陰、(株)ローソン高知、(株)ローソン南九州、(株)ローソン沖縄の数値は含んでおりません。
*2 非食品の総荒利益率は、手数料収入を含め算出しております。 Notes:
*1 These figures except for Net sales (including LAWSON STORE100) are sums of total LAWSON and NATURAL LAWSON operated by Lawson, Inc. Furthermore,results of area franchise companies (Lawson Sanin, Inc., Lawson Kochi, Inc., Lawson Minamikyushu, Inc. and Lawson Okinawa, Inc.) are not included in this page.
*2 Gross profit of non-food products includes service commissions.
宝印刷株式会社 2018年07月11日 13時19分 $FOLDER; 24ページ (Tess 1.50(64) 20161024_02)

売上及び商品の状況(国内コンビニエンスストア) Sales and products (Convenience stores in Japan)
Copyright © 2018 Lawson, Inc. All Rights Reserved. 24
■国内コンビニエンスストア事業 グループ全店売上高 Total sales of convenience store business in Japan
2017年度/FY2017 2018年度/FY2018
第1四半期累計期間/1Q 通期/Full year 第1四半期累計期間/1Q
百万円/Millions of yen 前年比/YoY 百万円/Millions of yen 前年比/YoY 百万円/Millions of yen 前年比/YoY
単体 Non-consolidated 513,558 103.6% 2,110,454 104.1% 546,498 106.4%
グループ会社 Group company *1 36,014 165.3% 147,075 137.6% 36,998 102.7%
チケット等取扱高 Tickets etc. *2 85,993 112.8% 339,583 105.9% 79,510 92.5%
合計 Total 635,565 107.0% 2,597,114 105.8% 663,007 104.3%
(注)
*1 グループ会社は、(株)ローソン山陰、(株)ローソン高知、(株)ローソン南九州、(株)ローソン沖縄の運営する店舗の売上高を合計しております。
*2 チケット等取扱高は、当社グループの運営する国内のコンビニエンスストア事業全て(単体及びグループ会社を含む)の取扱高を合計しております。
Notes:
*1 For group company, it is a total sales of stores oprerated by Lawson Sanin, Inc., Lawson Kochi, Inc., Lawson Minamikyushu, Inc. and Lawson Okinawa, Inc.*2 For tickets and others gross sale, it is a total gross sales of convenience store business in Japan (including non-consolidated and group company) operated by
Lawson group.
宝印刷株式会社 2018年07月11日 13時19分 $FOLDER; 25ページ (Tess 1.50(64) 20161024_02)