Embed Size (px)
Citation preview

ngssuper.com.au1300 133 177
CREATING BRIGHTER FUTURES
ANNUAL REPORT2019/20

2 NGS SUPER | CREATING BRIGHTER FUTURES
Ann
ual R
epor
t 20
20
Contents
FUND SNAPSHOT AS AT 30 JUNE 2020 .................................................................. 3
CEO AND CHAIR 2020 UPDATE ............................................................................4-5
INVESTMENT UPDATE ...........................................................................................6-7
HOW WE MANAGE YOUR MONEY .......................................................................8-9
YOUR NGS SUPER INVESTMENT OPTIONS ......................................................10-16
INVESTMENT MANAGER ALLOCATION ............................................................17-18
NGS SUPER TRUSTEE BOARD ................................................................................ 19
ABRIDGED FINANCIAL STATEMENTS ...............................................................20-23
THINGS YOU NEED TO KNOW .........................................................................24-25
CONTACT DETAILS ................................................................................................. 28
In addition to this Annual Report, NGS Super publishes Supplementary Annual Reports for its defined benefit sub-plans including the Catholic Church Staff Superannuation Plan (CCSSP) South Australia, Cuesuper Superannuation Defined Benefit Plan (Cue Super), and Penleigh and Essendon Grammar School (PEGS) Superannuation Plan. These Supplementary Annual Reports should be read in conjunction with this Annual Report and are available via ngssuper.com.au/annualreport
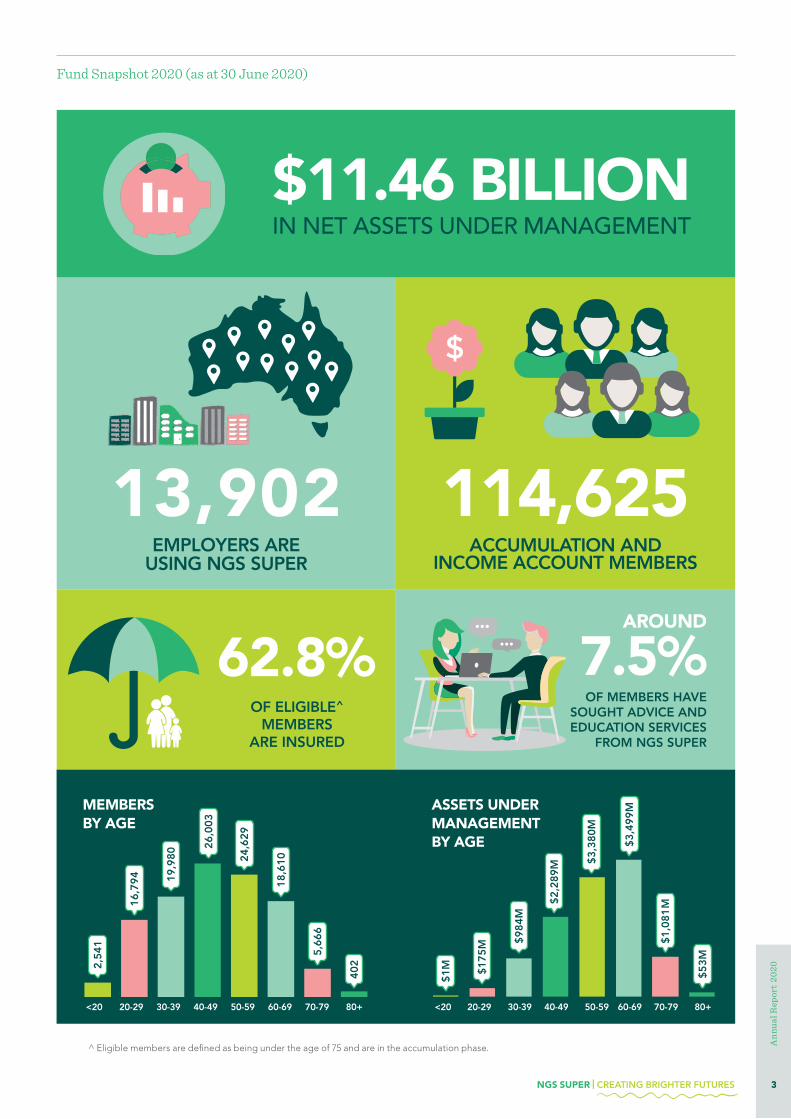
Fund Snapshot 2020 (as at 30 June 2020)
13,902 EMPLOYERS ARE
USING NGS SUPER
114,625ACCUMULATION AND
INCOME ACCOUNT MEMBERS
62.8%AROUND
7.5%OF MEMBERS HAVE
SOUGHT ADVICE AND EDUCATION SERVICES
FROM NGS SUPER
$11.46 BILLIONIN NET ASSETS UNDER MANAGEMENT
^ Eligible members are defined as being under the age of 75 and are in the accumulation phase.
OF ELIGIBLE^
MEMBERS ARE INSURED
MEMBERS BY AGE
ASSETS UNDER MANAGEMENT BY AGE
<20 20-29 30-39 40-49 50-59 60-69 70-79
2,54
1
16,7
94 19,9
80
26,0
03
24,6
29
18,6
10
5,66
6
402
80+ <20 20-29 30-39 40-49 50-59 60-69 70-79 80+
$1M $1
75M $9
84M
$2,2
89M $3
,380
M
$3,4
99M
$1,0
81 M
$53M
NGS SUPER | CREATING BRIGHTER FUTURES 3
Ann
ual R
epor
t 20
20
CEO AND CHAIR UPDATEIt’s fair to say that we’re unlikely to see another year like the 12 months just gone. The effects of the COVID-19 pandemic have been — and continue to be — far-reaching, for individuals, communities, businesses and governments.
As a super fund, we’ve been in the thick of it. Our priorities are always to manage our members’ savings, and to communicate to let you know what is happening. This past year, that’s been more important than ever.
Like some of our members, NGS staff have been working remotely since late March, as have most of our service providers. It’s a testament to everyone that we have been able to maintain our operations and level of service, never losing sight of our main purpose.
The annual return for the Diversified (MySuper) option was –0.60%1 for accumulation and transition to retirement members, and –0.71%1 for members in the retirement phase. While it may seem strange to talk about negative returns as a great result, this is actually a significant achievement given the unusual economic environment — and it’s also very competitive in the market. Superannuation is a long-term investment, and long-term returns on our portfolio remain strong.
If we described 2018/19 as an ‘interesting’ year for investment markets, it’s hard to find the right words to describe 2019/20. While the global political issues that had markets on high alert last year — US-China tensions, conflict in Hong Kong and Brexit — have continued to play a role, the global economic impact of COVID-19 has been the prime driver of market movements.
INVESTMENTS TEAM
The challenges facing our investments team this year have been, to use a word that we’ve heard too much recently, unprecedented. In last year’s annual report we mentioned that the team had reduced share market exposure across the portfolio — as it turns out, this restructuring was instrumental in allowing us to achieve the returns we did.
NGS has a strong risk management culture and any investment decisions are run through a rigorous process to understand the downside risk and therefore weighting within the portfolio. The portfolio was more defensively positioned leading into the downturn in early 2020, as the team recognised that risks were mounting across global economies as share market prices remained high and economic growth was moderate with weak indicators of improvement.
As markets fell throughout the first quarter of 2020, the portfolio remained invested and took profits from those areas that outperformed and reinvested in those areas with the most potential for excess returns during an economic recovery.
REGULATORY CHANGE
An unforeseen responsibility for us as a Fund was the superannuation impact of the federal government’s COVID-19 stimulus package, which included:
▪ the extension of the early release of super provisions to those affected by COVID-19 and
▪ the reduction of minimum drawdown limits for income account members for the 2019/20 and 2020/21 financial years.
As we alluded to in last year’s annual report, there was more work around the Protecting Your Super and Putting Members’ Interests First legislation this past financial year. In summary:
▪ inactive Accumulation account members with insurance cover were required to opt in to keep their cover or risk it being cancelled at 1 April 2020
▪ there were changes in the provision of Default Cover to new Accumulation account members from 1 April 2020.
CEO and Chair 2020 update
1 Past performance is not a reliable indicator of future performance.
Highlights from the 2019/20 financial year
4 NGS SUPER | CREATING BRIGHTER FUTURES
Ann
ual R
epor
t 20
20

LOOKING FORWARD
By the time you read this, you will have heard about our upcoming merger with Australian Catholic Super, one of the good things to come out of difficult year. Bringing together two like-minded funds and combining the strengths of both is a key step in ensuring that we continue to provide the best retirement outcomes for our members.
What the extraordinary challenges of 2020 have highlighted for us is the importance of our role in managing the retirement savings of our members. We understand that in times of financial uncertainty, our members look to us for information and reassurance, and we have worked hard to provide this.
“Our commitment to you is one thing that remains unchanged, and we look forward to continuing to do our best for you, whatever the next year brings.”
ENVIRONMENTAL, SOCIAL AND CORPORATE GOVERNANCE (ESG)
It was another busy year of ESG work for the Fund. Key achievements for the year were:
▪ mapping our investments to the United Nations Sustainable Development Goals (UN SDGs), including the work that was required to develop that methodology
▪ measuring the carbon intensity for the Australian equities and international equities portfolios
▪ appointing an international equities engagement partner to strengthen and expand our engagement reach to international equities
▪ determining our methodology and approach for assessment of Modern Slavery in all of the Fund’s supply chains (not just investments).
Reflecting our ongoing commitment to ESG, the Fund now has a dedicated position of Senior Manager, ESG and Responsible Investment. Appropriately, this role has been filled by Skye King, who won the ACSI Michael O’Sullivan ESG Rising Star Award in May in recognition of her contribution and leadership in the ESG space.
The Fund has been working towards our first report for the Task Force on Climate-Related Financial Disclosures, which we expect to submit before the end of 2020.
The Fund is now proudly certified as carbon neutral and tobacco-free.
In November 2019 we launched a new Fund Sustainability page on our website, where we share all of our policy documents, certification and initiatives, as well as articles and updates for members.
CEO and Chair 2020 update
Dick ShearmanChair, Trustee Board
Laura WrightCEO, NGS Super
KEY MILESTONES
▪ We were honoured to win the Chant West Best Fund Insurance Award for the third consecutive year (and the fourth time), a great acknowledgement of the work we continue to do to offer our members best-in-class insurance.
▪ We introduced the retirement bonus payment for members transferring to an income account.
▪ Gloria Taylor retired on 23 June 2020, after 18 years as Member Director and Peter Fogarty retired as Deputy Chair, Employer Director (31 December 1995 to 30 July 2019). We thank them both for their service.
▪ Our CRM team were able to pivot from in-person member meetings to phone/video — and in the last quarter (1 April to 30 June 2020), individual member meetings were up almost 30%.
▪ Our call centre staff all moved to working from home in March/April and managed this significant transition seamlessly.
▪ Our marketing automation platform was launched in September 2019, allowing NGS campaigns to be segmented, personalised and triggered automatically. The onboarding program targeting new members (approximately 7,500 annually) through the marketing automation platform has achieved strong results.
▪ The People and Culture team introduced a Competency Framework to enhance our staff’s career development and have provided invaluable support for the safety, health and wellbeing of all staff during the pandemic.
NGS SUPER | CREATING BRIGHTER FUTURES 5
Ann
ual R
epor
t 20
20
INVESTMENT UPDATE
Investment update
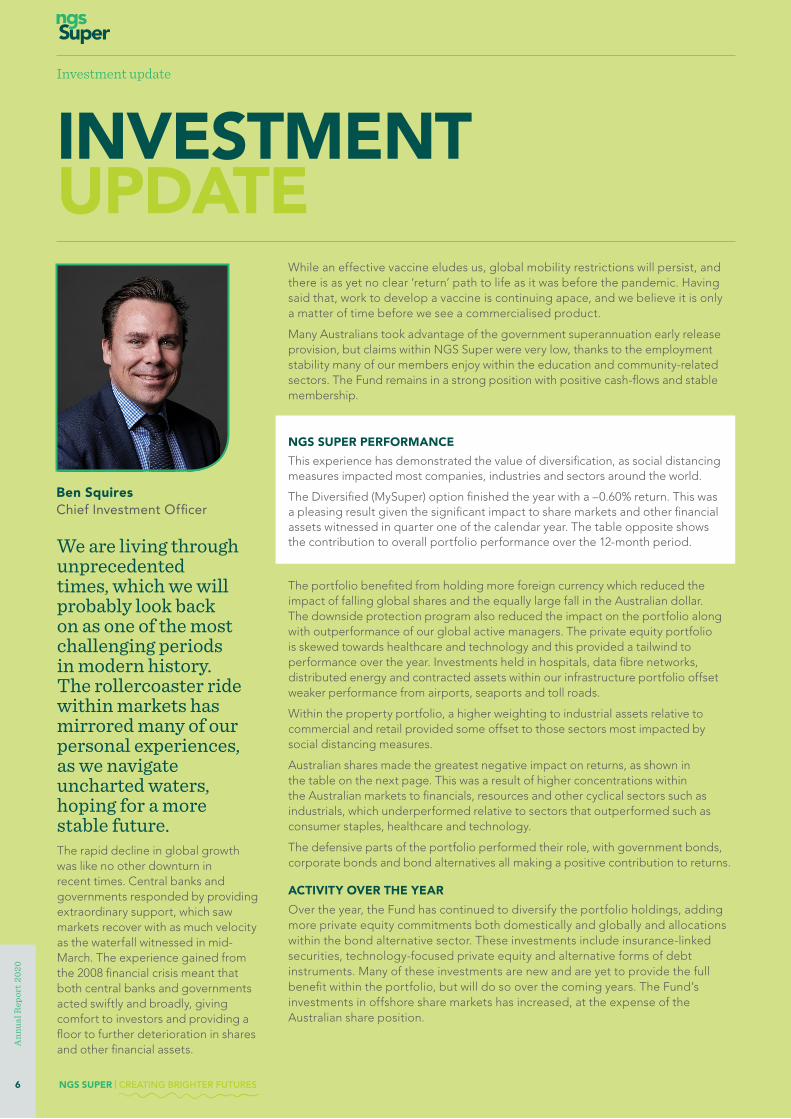
We are living through unprecedented times, which we will probably look back on as one of the most challenging periods in modern history. The rollercoaster ride within markets has mirrored many of our personal experiences, as we navigate uncharted waters, hoping for a more stable future.The rapid decline in global growth was like no other downturn in recent times. Central banks and governments responded by providing extraordinary support, which saw markets recover with as much velocity as the waterfall witnessed in mid-March. The experience gained from the 2008 financial crisis meant that both central banks and governments acted swiftly and broadly, giving comfort to investors and providing a floor to further deterioration in shares and other financial assets.
While an effective vaccine eludes us, global mobility restrictions will persist, and there is as yet no clear ‘return’ path to life as it was before the pandemic. Having said that, work to develop a vaccine is continuing apace, and we believe it is only a matter of time before we see a commercialised product.
Many Australians took advantage of the government superannuation early release provision, but claims within NGS Super were very low, thanks to the employment stability many of our members enjoy within the education and community-related sectors. The Fund remains in a strong position with positive cash-flows and stable membership.
NGS SUPER PERFORMANCE
This experience has demonstrated the value of diversification, as social distancing measures impacted most companies, industries and sectors around the world.
The Diversified (MySuper) option finished the year with a –0.60% return. This was a pleasing result given the significant impact to share markets and other financial assets witnessed in quarter one of the calendar year. The table opposite shows the contribution to overall portfolio performance over the 12-month period.
The portfolio benefited from holding more foreign currency which reduced the impact of falling global shares and the equally large fall in the Australian dollar. The downside protection program also reduced the impact on the portfolio along with outperformance of our global active managers. The private equity portfolio is skewed towards healthcare and technology and this provided a tailwind to performance over the year. Investments held in hospitals, data fibre networks, distributed energy and contracted assets within our infrastructure portfolio offset weaker performance from airports, seaports and toll roads.
Within the property portfolio, a higher weighting to industrial assets relative to commercial and retail provided some offset to those sectors most impacted by social distancing measures.
Australian shares made the greatest negative impact on returns, as shown in the table on the next page. This was a result of higher concentrations within the Australian markets to financials, resources and other cyclical sectors such as industrials, which underperformed relative to sectors that outperformed such as consumer staples, healthcare and technology.
The defensive parts of the portfolio performed their role, with government bonds, corporate bonds and bond alternatives all making a positive contribution to returns.
ACTIVITY OVER THE YEAR
Over the year, the Fund has continued to diversify the portfolio holdings, adding more private equity commitments both domestically and globally and allocations within the bond alternative sector. These investments include insurance-linked securities, technology-focused private equity and alternative forms of debt instruments. Many of these investments are new and are yet to provide the full benefit within the portfolio, but will do so over the coming years. The Fund’s investments in offshore share markets has increased, at the expense of the Australian share position.
Ben SquiresChief Investment Officer
6 NGS SUPER | CREATING BRIGHTER FUTURES
Ann
ual R
epor
t 20
20

FYTD Average Active Weight
Contribution to Return
Page 1 Information Classification: Limited Access
Investment update
Deflationary risk will ensure that interest rates remain low for the foreseeable future, and money supply will continue to remain high around the world, as governments attempt to stimulate growth. The deflationary pressures include high levels of public debt, ageing populations, lower levels of productivity and geopolitical tensions. The hope is that some level of inflation occurs over the medium term, but it is not expected to be outside the target level set by central banks, which would give rise to higher interest rates.
Those companies that have continued to actively invest in Research and Development will be better positioned going forward, particularly if growth is moderate to low over the medium term. The low growth environment will result in higher prices for risky assets such as shares. Those secular trends including demographics, climate change, technological advancements in automation and artificial intelligence and rising wealth in emerging economies will continue and this will provide both risks and opportunities to generate returns across the investment options.
The pursuit of investments in areas that have strong tailwinds continues to be a focus, and this has not been interrupted by the events of 2020 — rather, they have reinforced the benefits of including such investments in the portfolio.
The Fund has also completed work in relation to sustainability and specifically climate change risk. We have appointed a dedicated manager to lead this effort and commissioned several research projects. The Fund has actively engaged with other like-minded investors to promote positive change and has also voted in favour of several shareholder resolutions in relation to climate change.
THE FUTURE
The experiences of 2020 will have both temporary and permanent effects on consumer behaviour into the future — there will be winners and losers within the economy. At a local level, it is likely that immigration, which has been one of the major contributors to growth over the last two decades, will be affected over the short term. In addition, remote working, mobility and the cadence and use of our time will impact consumption patterns and trends. To compensate for lower immigration-led growth, productivity will need to improve to fill this void — something that has been difficult to achieve with the structural elements in our economy. Many of the Asian regions still enjoy a demographic tailwind, so growth will likely revert to trend. Globalisation has likely peaked, and this may result in companies reassessing the resilience of supply chains and the need to localise manufacturing.
Excess capacity within the economy will provide a tailwind to growth over the short term as more people re-join the workforce. Pent-up demand along with higher saving rates will be positive for risk assets as people start to increase their mobility and spending within the economy.
Diversified (MySuper) option – 1-year contribution to return#
# Some additional exposures, such as currencies, derivatives and taxes, contributed to the returns. These represented less than –0.14% contribution to the Diversified (MySuper) option return.
Government bonds
Corporate bonds
Cash and term
deposits
Bond alternatives
Property Growth alternatives
Australian shares
Overlays and tax
Total option return
International shares
Infrastructure
FYTD Average Active Weight
Contribution to Return
Page 1 Information Classification: Limited Access
NGS SUPER | CREATING BRIGHTER FUTURES 7
Ann
ual R
epor
t 20
20
HOW WE MANAGE YOUR MONEYInvestment earnings were allocated to your account based on changes to the NGS Super unit prices, which were calculated weekly and can be accessed via ngssuper.com.au/investments
A custodian holds and safeguards the Fund’s investments, and monitors changes in their value (as required by regulation).
Each week, the custodian calculates the Fund’s unit prices, which reflect changes to the underlying investments for each option.
It then provides the unit prices to your account administrator, who multiplies the number of units in your account by the current unit price to update your account balance.
In other words, investment market movements and valuations are translated to your account balance.
The investment returns given in this report are the return (after investment management fees, asset fees and taxes) you would have received if you had invested in a particular option for the full 12 months to 30 June 2020. The return on any contributions you made during the year would be equal to the change in the unit price only between the time the contributions went into your account and the end of the financial year.
If you changed investment options during the year, your investment returns would differ from the returns shown in this Annual Report because they would be based on the changes in the unit prices of each option for the period you were invested.
How we manage your money
YOUR NGS SUPER ACCUMULATION ACCOUNT
All the contributions you or your employer make, as well as any amounts you transfer from another super fund, are placed into your Accumulation account.
The money in your account is then invested according to the investment option(s) you’ve chosen. Each time we receive a contribution, we allocate units to your account at the current unit price, so your account balance increases or decreases according to the combined performance of the underlying assets.
We deduct government taxes and member fees from your account, as well as insurance premiums if you have insurance cover.
EARNINGS ON INVESTMENT OPTIONS
An NGS Income account provides the benefit of tax-free investment earnings (as it is in the retirement phase4), while the NGS Accumulation account and NGS Transition to Retirement (TTR) account both have earnings taxed at up to 15%. As a result, the investment returns (shown on pages 11 to 16) for the NGS Income account will differ from the NGS Accumulation and TTR account returns.
Where investment returns are positive, earnings on the NGS Income account will generally be higher than earnings on the equivalent investment option for the NGS Accumulation account and TTR account, as no tax is deducted from the gross earnings on the NGS Income account.
4 A transfer balance cap (currently $1.6m) applies on the amount of super you can transfer into the retirement (pension) phase. This applies as a total across all your super accounts and not per fund.
We changed from weekly unit pricing to daily unit pricing on 23 November 2020. Further details are available on our website at ngssuper.com.au/articles/news/daily-unit-pricing
8 NGS SUPER | CREATING BRIGHTER FUTURES
Ann
ual R
epor
t 20
20

Investment option – Accumulation and Transition to Retirement accounts
Investment fees Indirect costs Property operating
costs (not included
in total)
Borrowing costs
(not included in total)
Management fees
Performance fees
Total investment
fees5
Total indirect costs5
Diversified (MySuper) 0.56% 0.06% 0.62% 0.15% 0.12% 0.03%
High Growth 0.55% 0.07% 0.62% 0.18% 0.07% 0.02%
Balanced 0.46% 0.05% 0.51% 0.12% 0.14% 0.03%
Defensive 0.44% 0.04% 0.48% 0.11% 0.21% 0.05%
Socially Responsible Diversified 0.67% 0.04% 0.71% 0.19% 0.11% 0.03%
Indexed Growth 0.06% 0.00% 0.06% 0.03% 0.00% 0.00%
Shares Plus 0.56% 0.03% 0.59% 0.21% 0.00% 0.00%
Australian Shares 0.49% 0.06% 0.55% 0.27% 0.00% 0.00%
International Shares 0.59% 0.00% 0.59% 0.15% 0.00% 0.00%
Infrastructure 0.35% 0.22% 0.57% 0.10% 0.00% 0.01%
Property 0.55% 0.01% 0.56% 0.12% 1.15% 0.25%
Diversified Bonds 0.34% 0.00% 0.34% 0.09% 0.00% 0.00%
Cash and Term Deposits 0.05% 0.00% 0.05% 0.00% 0.00% 0.00%
PRE
-MIX
ED
SE
CTO
R-SP
ECIF
IC
Investment option – Income account
Investment fees Indirect costs Property operating
costs (not included
in total)
Borrowing costs
(not included in total)
Management fees
Performance fees
Total investment
fees5
Total indirect costs5
Moderate Growth 0.51% 0.04% 0.55% 0.12% 0.12% 0.03%
Diversified 0.57% 0.04% 0.61% 0.13% 0.12% 0.03%
High Growth 0.57% 0.05% 0.62% 0.15% 0.07% 0.02%
Balanced 0.46% 0.04% 0.50% 0.11% 0.14% 0.03%
Defensive 0.45% 0.04% 0.49% 0.10% 0.21% 0.05%
Socially Responsible Diversified 0.59% 0.04% 0.63% 0.19% 0.11% 0.03%
Indexed Growth 0.06% 0.00% 0.06% 0.03% 0.00% 0.00%
Retire Plus 0.52% 0.07% 0.59% 0.12% 0.29% 0.07%
Shares Plus 0.58% 0.00% 0.58% 0.16% 0.00% 0.00%
Australian Shares 0.54% 0.00% 0.54% 0.16% 0.00% 0.00%
International Shares 0.59% 0.00% 0.59% 0.15% 0.00% 0.00%
Infrastructure 0.42% 0.22% 0.64% 0.10% 0.00% 0.01%
Property 0.55% 0.01% 0.56% 0.12% 1.15% 0.25%
Diversified Bonds 0.36% 0.00% 0.36% 0.09% 0.00% 0.00%
Cash and Term Deposits 0.05% 0.00% 0.05% 0.00% 0.00% 0.00%
PRE
-MIX
ED
SE
CTO
R-SP
ECIF
IC
How we invest your money
FEES AND COSTS
Indirect costs and investment fees are deducted from investment earnings before the unit price is determined. They are not a direct charge to your account.
The investment fees and indirect costs listed below represent the actual costs for 2019/20 for each investment option.
Information on fees and costs can be found in our fact sheet Fees, costs and tax available on our website at ngssuper.com.au/PDS
5 There may be a slight variance in the totals due to rounding.
NGS SUPER | CREATING BRIGHTER FUTURES 9
Ann
ual R
epor
t 20
20

PR
E-M
IXE
D O
PTIO
NS
10 NGS SUPER | CREATING BRIGHTER FUTURES
Ann
ual R
epor
t 20
20
INVESTMENT OPTIONS
PR
E-M
IXE
D O
PTIO
NS
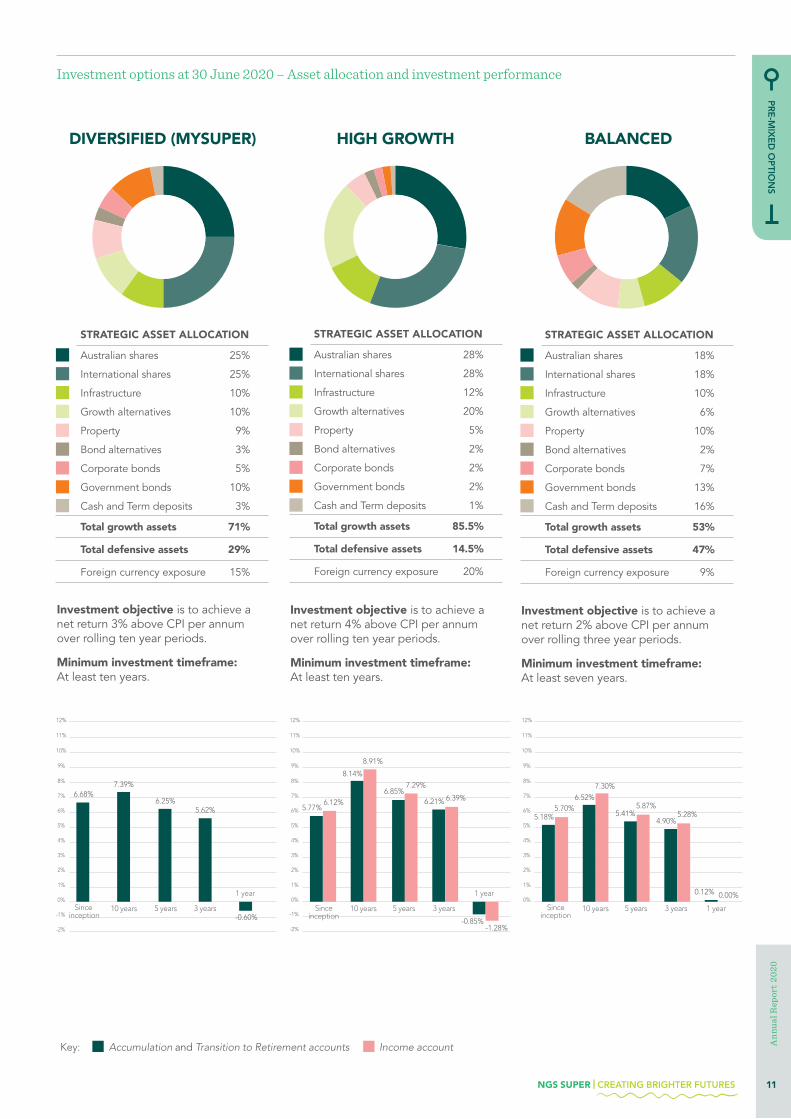
STRATEGIC ASSET ALLOCATION
Australian shares 25%
International shares 25%
Infrastructure 10%
Growth alternatives 10%
Property 9%
Bond alternatives 3%
Corporate bonds 5%
Government bonds 10%
Cash and Term deposits 3%
Total growth assets 71%
Total defensive assets 29%
Foreign currency exposure 15%
STRATEGIC ASSET ALLOCATION
Australian shares 28%
International shares 28%
Infrastructure 12%
Growth alternatives 20%
Property 5%
Bond alternatives 2%
Corporate bonds 2%
Government bonds 2%
Cash and Term deposits 1%
Total growth assets 85.5%
Total defensive assets 14.5%
Foreign currency exposure 20%
STRATEGIC ASSET ALLOCATION
Australian shares 18%
International shares 18%
Infrastructure 10%
Growth alternatives 6%
Property 10%
Bond alternatives 2%
Corporate bonds 7%
Government bonds 13%
Cash and Term deposits 16%
Total growth assets 53%
Total defensive assets 47%
Foreign currency exposure 9%
Investment objective is to achieve a net return 3% above CPI per annum over rolling ten year periods.
Minimum investment timeframe: At least ten years.
Investment objective is to achieve a net return 4% above CPI per annum over rolling ten year periods.
Minimum investment timeframe: At least ten years.
HIGH GROWTH
Investment objective is to achieve a net return 2% above CPI per annum over rolling three year periods.
Minimum investment timeframe: At least seven years.
BALANCEDDIVERSIFIED (MYSUPER)
12%
11%
0%
1%
2%
3%
4%
5%
6%
7%
8%
9%
10%
10 years Since 5 years 3 years 1 year
5.18%5.70%
4.90%5.28%
Accumulation account (since July 2007) and Transition to Retirement account
Income account
5.41% 5.87%
0.00%
6.52%7.30%
inception
0.12%
(since Aug 2007)
12%
11%
0%
1%
2%
3%
4%
5%
6%
7%
8%
9%
10%
-2%
-1%10 years Since 5 years 3 years
1 year
6.68%7.39%
6.25%5.62%
Income account Accumulation account (since Oct 1999) and Transition to Retirement account (not applicable)
inception -0.60%
12%
11%
0%
1%
2%
3%
4%
5%
6%
7%
8%
9%
10%
-2%
-1%
Accumulation account (since July 2007) and Transition to Retirement account
Income account (since Aug 2007)
10 years Since 5 years 3 years
1 year
5.77%6.12% 6.21% 6.39%
6.85% 7.29%
-1.28%
8.14%
8.91%
inception-0.85%
Investment options at 30 June 2020 – Asset allocation and investment performance
Accumulation and Transition to Retirement accounts Income accountKey:
NGS SUPER | CREATING BRIGHTER FUTURES 11
Ann
ual R
epor
t 20
20
PR
E-M
IXE
D O
PTIO
NS
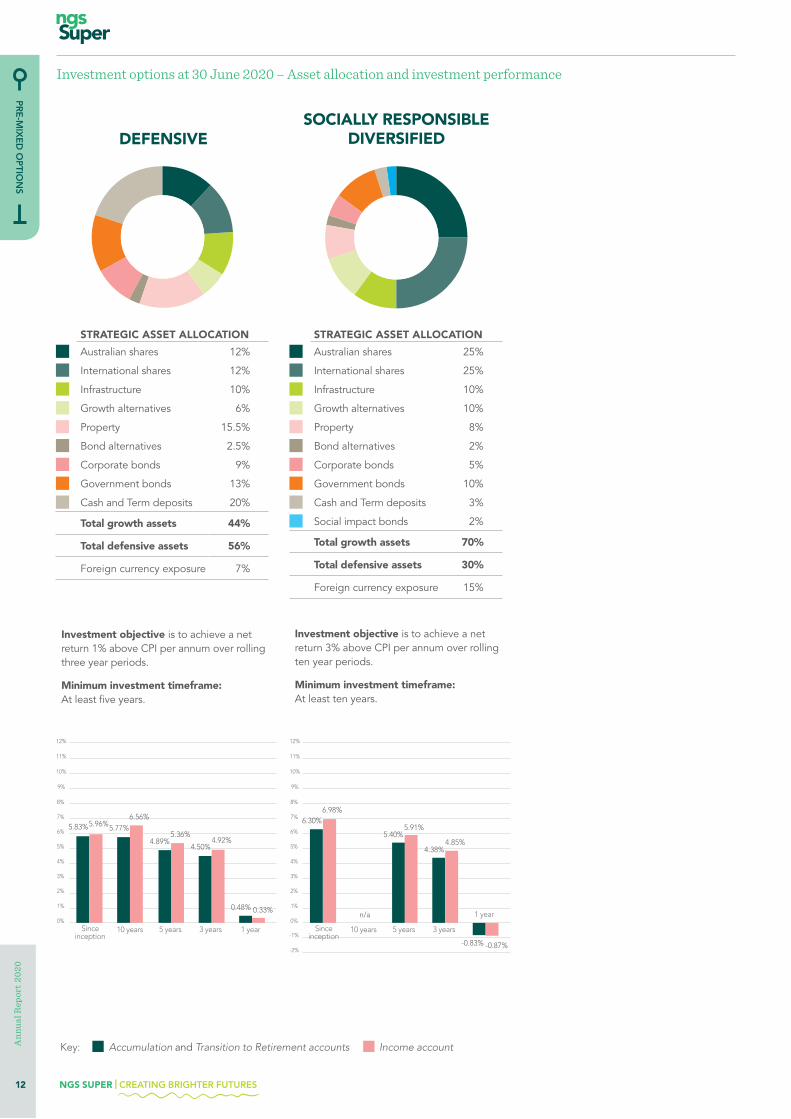
STRATEGIC ASSET ALLOCATION
Australian shares 12%
International shares 12%
Infrastructure 10%
Growth alternatives 6%
Property 15.5%
Bond alternatives 2.5%
Corporate bonds 9%
Government bonds 13%
Cash and Term deposits 20%
Total growth assets 44%
Total defensive assets 56%
Foreign currency exposure 7%
STRATEGIC ASSET ALLOCATION
Australian shares 25%
International shares 25%
Infrastructure 10%
Growth alternatives 10%
Property 8%
Bond alternatives 2%
Corporate bonds 5%
Government bonds 10%
Cash and Term deposits 3%
Social impact bonds 2%
Total growth assets 70%
Total defensive assets 30%
Foreign currency exposure 15%
DEFENSIVE
Investment objective is to achieve a net return 1% above CPI per annum over rolling three year periods.
Minimum investment timeframe: At least five years.
Investment objective is to achieve a net return 3% above CPI per annum over rolling ten year periods.
Minimum investment timeframe: At least ten years.
SOCIALLY RESPONSIBLE DIVERSIFIED
12%
11%
0%
1%
2%
3%
4%
5%
6%
7%
8%
9%
10%
10 years Since 5 years 3 years 1 year
5.83%5.96%
4.50%4.92%
Accumulation account (since Feb 2003) and Transition to Retirement account
Income account
4.89% 5.36%
0.33%
5.77%6.56%
inception
0.48%
(since Nov 2001)
12%
11%
0%
1%
2%
3%
4%
5%
6%
7%
8%
9%
10%
1 year
10 years Since 5 years 3 years
6.30%6.98%
4.38%4.85%
Accumulation account (since Nov 2013) and Transition to Retirement account
Income account
5.40% 5.91%
n/a
inception
(since Nov 2013)
-2%
-1%
-0.87%-0.83%
Investment options at 30 June 2020 – Asset allocation and investment performance
Accumulation and Transition to Retirement accounts Income accountKey:
12 NGS SUPER | CREATING BRIGHTER FUTURES
Ann
ual R
epor
t 20
20
PR
E-M
IXE
D O
PTIO
NS
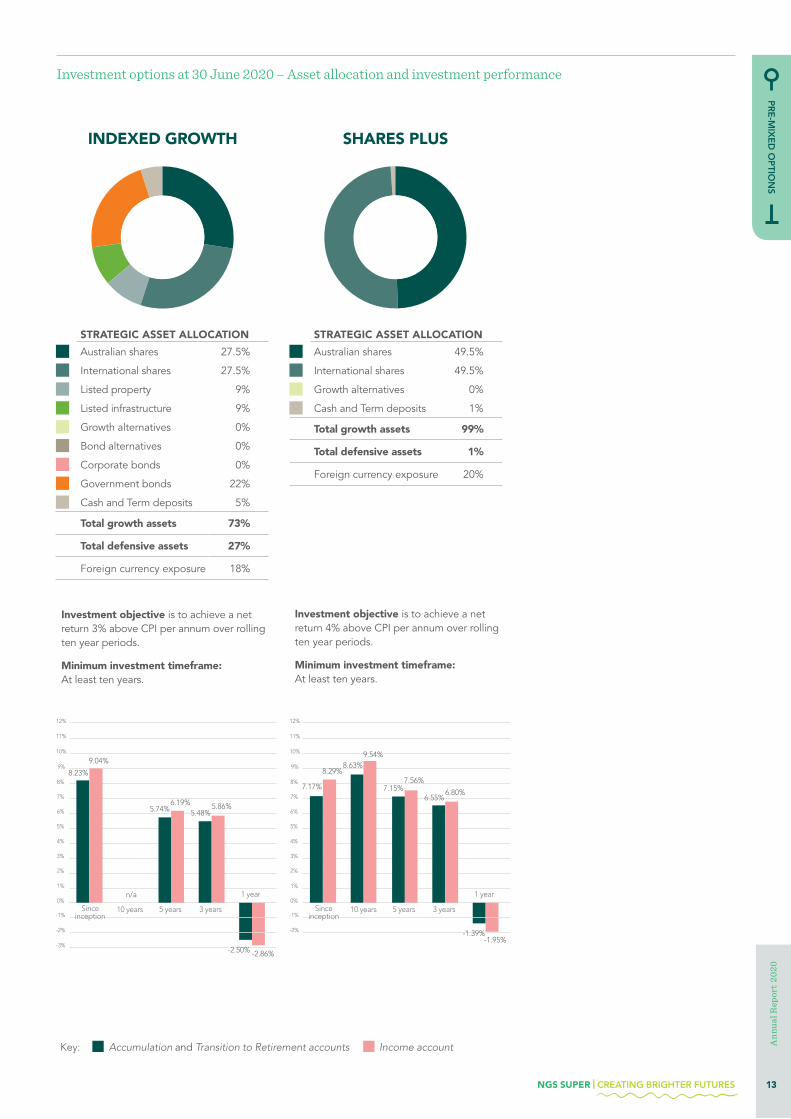
STRATEGIC ASSET ALLOCATION
Australian shares 27.5%
International shares 27.5%
Listed property 9%
Listed infrastructure 9%
Growth alternatives 0%
Bond alternatives 0%
Corporate bonds 0%
Government bonds 22%
Cash and Term deposits 5%
Total growth assets 73%
Total defensive assets 27%
Foreign currency exposure 18%
STRATEGIC ASSET ALLOCATION
Australian shares 49.5%
International shares 49.5%
Growth alternatives 0%
Cash and Term deposits 1%
Total growth assets 99%
Total defensive assets 1%
Foreign currency exposure 20%
Investment objective is to achieve a net return 3% above CPI per annum over rolling ten year periods.
Minimum investment timeframe: At least ten years.
Investment objective is to achieve a net return 4% above CPI per annum over rolling ten year periods.
Minimum investment timeframe: At least ten years.
12%
11%
0%
1%
2%
3%
4%
5%
6%
7%
8%
9%
10%
1 year
10 years Since 5 years 3 years
8.23%
9.04%
5.48%5.86%
Accumulation account (since Sept 2011) and Transition to Retirement account
Income account
5.74% 6.19%
n/a
inception
(since Sept 2011)
-2%
-1%
-2.86%-3%
-2.50%
12%
11%
0%
1%
2%
3%
4%
5%
6%
7%
8%
9%
10%
1 year
10 years Since 5 years 3 years
7.17%
8.29%
6.55%6.80%
Accumulation account (since Oct 1999) and Transition to Retirement account
Income account
7.15% 7.56%
inception
(since Sept 2004)
-2%
-1%
-1.95%-1.39%
8.63%9.54%
Investment options at 30 June 2020 – Asset allocation and investment performance
SHARES PLUSINDEXED GROWTH
Accumulation and Transition to Retirement accounts Income accountKey:
NGS SUPER | CREATING BRIGHTER FUTURES 13
Ann
ual R
epor
t 20
20
PR
E-M
IXE
D O
PTIO
NS
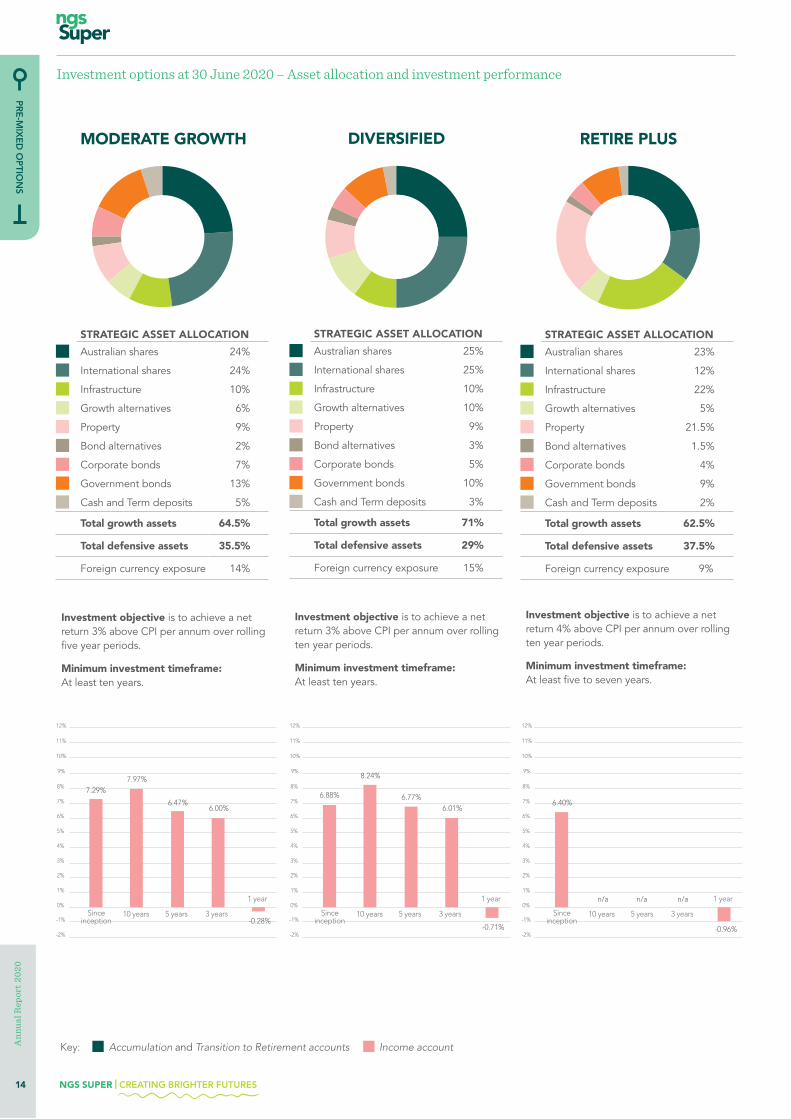
STRATEGIC ASSET ALLOCATION
Australian shares 24%
International shares 24%
Infrastructure 10%
Growth alternatives 6%
Property 9%
Bond alternatives 2%
Corporate bonds 7%
Government bonds 13%
Cash and Term deposits 5%
Total growth assets 64.5%
Total defensive assets 35.5%
Foreign currency exposure 14%
STRATEGIC ASSET ALLOCATION
Australian shares 25%
International shares 25%
Infrastructure 10%
Growth alternatives 10%
Property 9%
Bond alternatives 3%
Corporate bonds 5%
Government bonds 10%
Cash and Term deposits 3%
Total growth assets 71%
Total defensive assets 29%
Foreign currency exposure 15%
STRATEGIC ASSET ALLOCATION
Australian shares 23%
International shares 12%
Infrastructure 22%
Growth alternatives 5%
Property 21.5%
Bond alternatives 1.5%
Corporate bonds 4%
Government bonds 9%
Cash and Term deposits 2%
Total growth assets 62.5%
Total defensive assets 37.5%
Foreign currency exposure 9%
Investment objective is to achieve a net return 3% above CPI per annum over rolling five year periods.
Minimum investment timeframe: At least ten years.
Investment objective is to achieve a net return 3% above CPI per annum over rolling ten year periods.
Minimum investment timeframe: At least ten years.
DIVERSIFIED
Investment objective is to achieve a net return 4% above CPI per annum over rolling ten year periods.
Minimum investment timeframe: At least five to seven years.
RETIRE PLUS
12%
11%
0%
1%
2%
3%
4%
5%
6%
7%
8%
9%
10%
1 year
10 years Since 5 years 3 years
6.40%
Accumulation account and Transition to Retirement account (not applicable)
Income account
n/a
inception
(since Aug 2017)
-2%
-1%
-0.96%
n/a n/a
12%
11%
0%
1%
2%
3%
4%
5%
6%
7%
8%
9%
10%
1 year
10 years Since 5 years 3 years
7.29%
Accumulation account and Transition to Retirement account (not applicable)
Income account
inception
(since Jan 2010)
-2%
-1% -0.28%
7.97%
6.47%6.00%
12%
11%
0%
1%
2%
3%
4%
5%
6%
7%
8%
9%
10%
1 year
10 years Since 5 years 3 years
6.88%
Accumulation account and Transition to Retirement account (not applicable)
Income account
inception
(since Nov 2001)
-2%
-1%-0.71%
8.24%
6.77%6.01%
MODERATE GROWTH
Investment options at 30 June 2020 – Asset allocation and investment performance
Accumulation and Transition to Retirement accounts Income accountKey:
14 NGS SUPER | CREATING BRIGHTER FUTURES
Ann
ual R
epor
t 20
20
SEC
TOR
-SPE
CIFIC
OP
TION
S
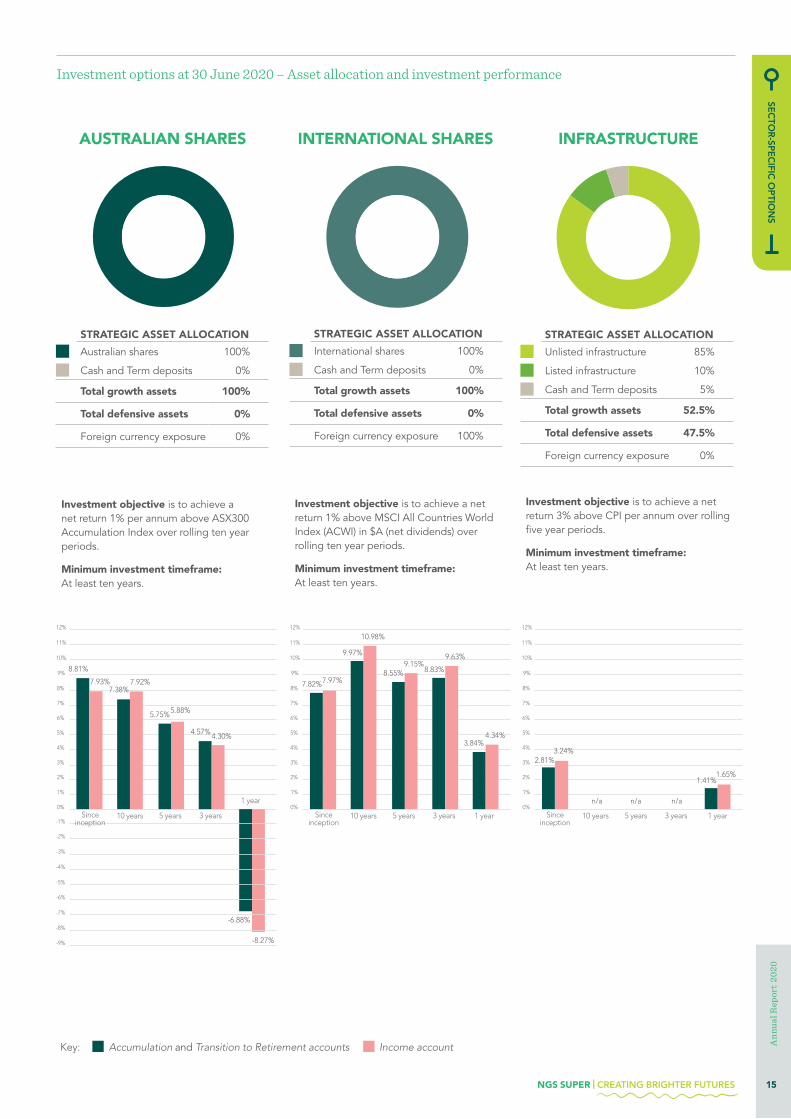
STRATEGIC ASSET ALLOCATION
Australian shares 100%
Cash and Term deposits 0%
Total growth assets 100%
Total defensive assets 0%
Foreign currency exposure 0%
STRATEGIC ASSET ALLOCATION
International shares 100%
Cash and Term deposits 0%
Total growth assets 100%
Total defensive assets 0%
Foreign currency exposure 100%
STRATEGIC ASSET ALLOCATION
Unlisted infrastructure 85%
Listed infrastructure 10%
Cash and Term deposits 5%
Total growth assets 52.5%
Total defensive assets 47.5%
Foreign currency exposure 0%
Investment objective is to achieve a net return 1% per annum above ASX300 Accumulation Index over rolling ten year periods.
Minimum investment timeframe: At least ten years.
Investment objective is to achieve a net return 1% above MSCI All Countries World Index (ACWI) in $A (net dividends) over rolling ten year periods.
Minimum investment timeframe: At least ten years.
Investment objective is to achieve a net return 3% above CPI per annum over rolling five year periods.
Minimum investment timeframe: At least ten years.
12%
11%
0%
1%
2%
3%
4%
5%
6%
7%
8%
9%
10%
1 year10 years Since 5 years 3 years
3.24%
Accumulation account and Transition to Retirement account (not applicable)
Income account
n/a
inception
(since May 2019)
1.65%
n/a n/a
2.81%
1.41%
12%
11%
0%
1%
2%
3%
4%
5%
6%
7%
8%
9%
10%
1 year
10 years Since 5 years 3 years
8.81%
7.93%
4.57% 4.30%
Accumulation account (since Feb 2003) and Transition to Retirement account
Income account
5.75% 5.88%
inception
(since Sept 2004)
-2%
-1%
-8.27%
-3%
-6.88%
-4%
-6%
-5%
-7%
-8%
-9%
7.38% 7.92%
12%
11%
0%
1%
2%
3%
4%
5%
6%
7%
8%
9%
10%
10 years Since 5 years 3 years 1 year
7.82%7.97%8.83%
9.63%
Accumulation account (since March 2003) and Transition to Retirement account
Income account
8.55% 9.15%
4.34%
9.97%
10.98%
inception
3.84%
(since Sept 2004)
Investment options at 30 June 2020 – Asset allocation and investment performance
INTERNATIONAL SHARES INFRASTRUCTUREAUSTRALIAN SHARES
Accumulation and Transition to Retirement accounts Income accountKey:
NGS SUPER | CREATING BRIGHTER FUTURES 15
Ann
ual R
epor
t 20
20
SEC
TOR
-SPE
CIFIC
OP
TION
S
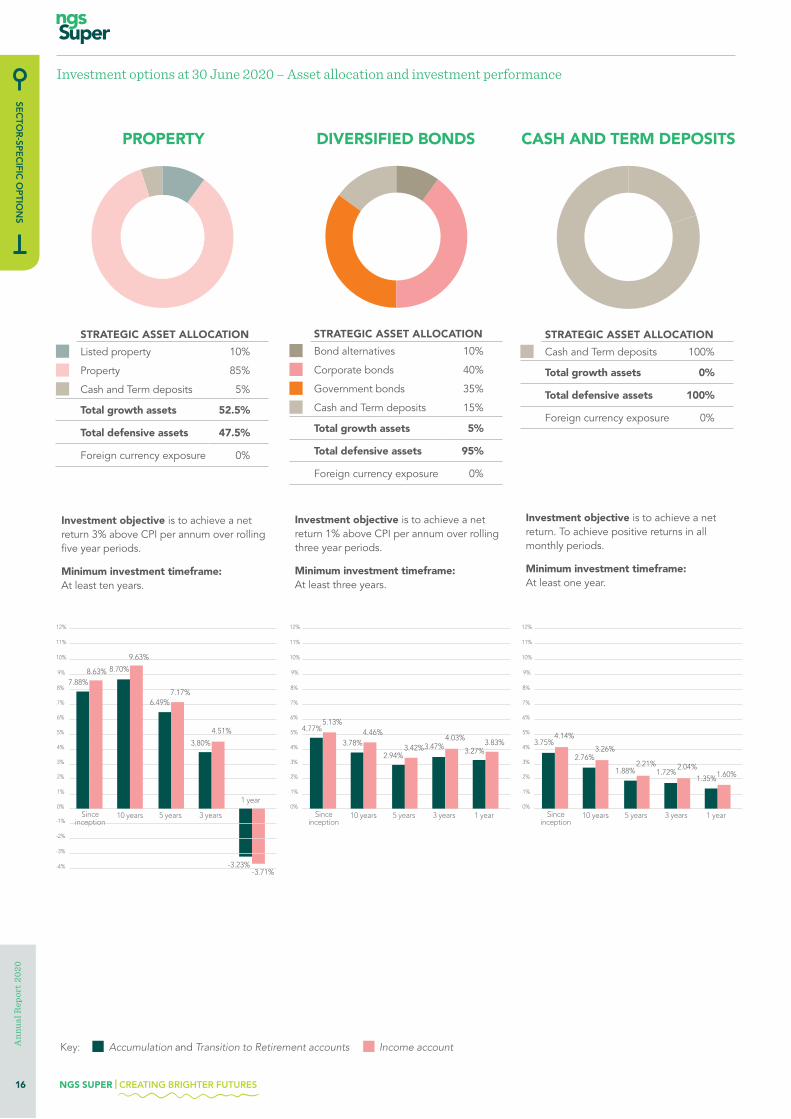
STRATEGIC ASSET ALLOCATION
Listed property 10%
Property 85%
Cash and Term deposits 5%
Total growth assets 52.5%
Total defensive assets 47.5%
Foreign currency exposure 0%
STRATEGIC ASSET ALLOCATION
Bond alternatives 10%
Corporate bonds 40%
Government bonds 35%
Cash and Term deposits 15%
Total growth assets 5%
Total defensive assets 95%
Foreign currency exposure 0%
STRATEGIC ASSET ALLOCATION
Cash and Term deposits 100%
Total growth assets 0%
Total defensive assets 100%
Foreign currency exposure 0%
Investment objective is to achieve a net return 3% above CPI per annum over rolling five year periods.
Minimum investment timeframe: At least ten years.
Investment objective is to achieve a net return 1% above CPI per annum over rolling three year periods.
Minimum investment timeframe: At least three years.
DIVERSIFIED BONDS
Investment objective is to achieve a net return. To achieve positive returns in all monthly periods.
Minimum investment timeframe: At least one year.
CASH AND TERM DEPOSITS
12%
11%
0%
1%
2%
3%
4%
5%
6%
7%
8%
9%
10%
10 years Since 5 years 3 years 1 year
3.75%4.14%
1.72%2.04%
Accumulation account (since Oct 1999) and Transition to Retirement account
Income account
1.88% 2.21%
1.60%
2.76%3.26%
inception
1.35%
(since July 2004)
12%
11%
0%
1%
2%
3%
4%
5%
6%
7%
8%
9%
10%
1 year
-4%
10 years Since 5 years 3 years
7.88%8.63%
3.80%
4.51%
Accumulation account (since Sept 2002) and Transition to Retirement account
Income account
6.49% 7.17%
inception
(since Dec 2002)
-2%
-1%
-3.71%
-3%
-3.23%
8.70%
9.63%
12%
11%
0%
1%
2%
3%
4%
5%
6%
7%
8%
9%
10%
10 years Since 5 years 3 years 1 year
4.77%5.13%
3.47%4.03%
Accumulation account (since Oct 1999) and Transition to Retirement account
Income account
2.94% 3.42%
3.83%3.78%4.46%
inception
3.27%
(since May 2004)
PROPERTY
Investment options at 30 June 2020 – Asset allocation and investment performance
Accumulation and Transition to Retirement accounts Income accountKey:
16 NGS SUPER | CREATING BRIGHTER FUTURES
Ann
ual R
epor
t 20
20
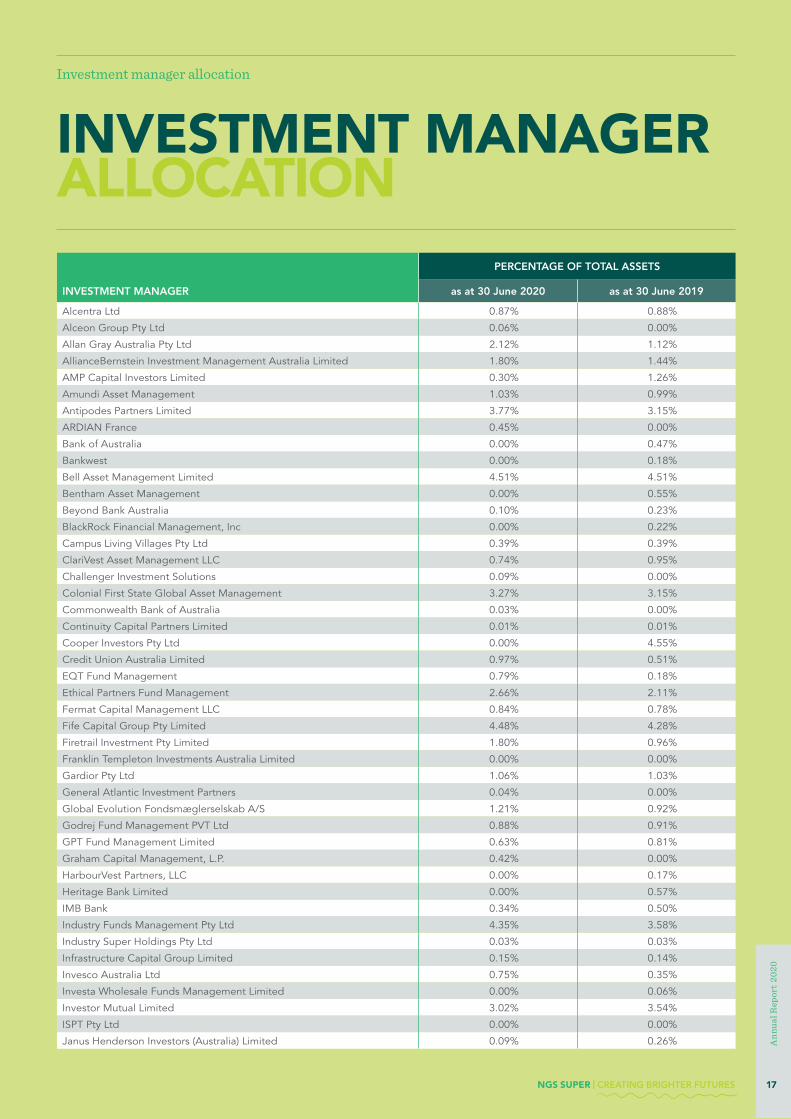
Investment manager allocation
INVESTMENT MANAGER ALLOCATION
PERCENTAGE OF TOTAL ASSETS
INVESTMENT MANAGER as at 30 June 2020 as at 30 June 2019
Alcentra Ltd 0.87% 0.88%
Alceon Group Pty Ltd 0.06% 0.00%
Allan Gray Australia Pty Ltd 2.12% 1.12%
AllianceBernstein Investment Management Australia Limited 1.80% 1.44%
AMP Capital Investors Limited 0.30% 1.26%
Amundi Asset Management 1.03% 0.99%
Antipodes Partners Limited 3.77% 3.15%
ARDIAN France 0.45% 0.00%
Bank of Australia 0.00% 0.47%
Bankwest 0.00% 0.18%
Bell Asset Management Limited 4.51% 4.51%
Bentham Asset Management 0.00% 0.55%
Beyond Bank Australia 0.10% 0.23%
BlackRock Financial Management, Inc 0.00% 0.22%
Campus Living Villages Pty Ltd 0.39% 0.39%
ClariVest Asset Management LLC 0.74% 0.95%
Challenger Investment Solutions 0.09% 0.00%
Colonial First State Global Asset Management 3.27% 3.15%
Commonwealth Bank of Australia 0.03% 0.00%
Continuity Capital Partners Limited 0.01% 0.01%
Cooper Investors Pty Ltd 0.00% 4.55%
Credit Union Australia Limited 0.97% 0.51%
EQT Fund Management 0.79% 0.18%
Ethical Partners Fund Management 2.66% 2.11%
Fermat Capital Management LLC 0.84% 0.78%
Fife Capital Group Pty Limited 4.48% 4.28%
Firetrail Investment Pty Limited 1.80% 0.96%
Franklin Templeton Investments Australia Limited 0.00% 0.00%
Gardior Pty Ltd 1.06% 1.03%
General Atlantic Investment Partners 0.04% 0.00%
Global Evolution Fondsmæglerselskab A/S 1.21% 0.92%
Godrej Fund Management PVT Ltd 0.88% 0.91%
GPT Fund Management Limited 0.63% 0.81%
Graham Capital Management, L.P. 0.42% 0.00%
HarbourVest Partners, LLC 0.00% 0.17%
Heritage Bank Limited 0.00% 0.57%
IMB Bank 0.34% 0.50%
Industry Funds Management Pty Ltd 4.35% 3.58%
Industry Super Holdings Pty Ltd 0.03% 0.03%
Infrastructure Capital Group Limited 0.15% 0.14%
Invesco Australia Ltd 0.75% 0.35%
Investa Wholesale Funds Management Limited 0.00% 0.06%
Investor Mutual Limited 3.02% 3.54%
ISPT Pty Ltd 0.00% 0.00%
Janus Henderson Investors (Australia) Limited 0.09% 0.26%
NGS SUPER | CREATING BRIGHTER FUTURES 17
Ann
ual R
epor
t 20
20
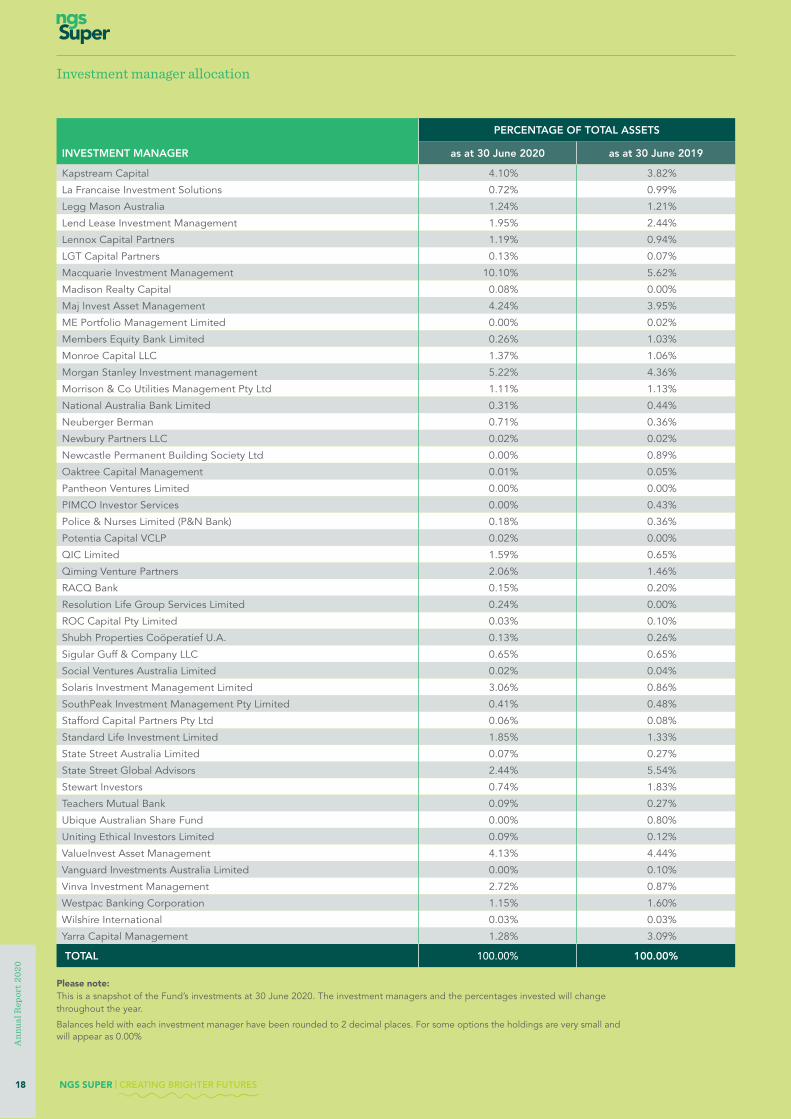
Investment manager allocation
PERCENTAGE OF TOTAL ASSETS
INVESTMENT MANAGER as at 30 June 2020 as at 30 June 2019
Kapstream Capital 4.10% 3.82%
La Francaise Investment Solutions 0.72% 0.99%
Legg Mason Australia 1.24% 1.21%
Lend Lease Investment Management 1.95% 2.44%
Lennox Capital Partners 1.19% 0.94%
LGT Capital Partners 0.13% 0.07%
Macquarie Investment Management 10.10% 5.62%
Madison Realty Capital 0.08% 0.00%
Maj Invest Asset Management 4.24% 3.95%
ME Portfolio Management Limited 0.00% 0.02%
Members Equity Bank Limited 0.26% 1.03%
Monroe Capital LLC 1.37% 1.06%
Morgan Stanley Investment management 5.22% 4.36%
Morrison & Co Utilities Management Pty Ltd 1.11% 1.13%
National Australia Bank Limited 0.31% 0.44%
Neuberger Berman 0.71% 0.36%
Newbury Partners LLC 0.02% 0.02%
Newcastle Permanent Building Society Ltd 0.00% 0.89%
Oaktree Capital Management 0.01% 0.05%
Pantheon Ventures Limited 0.00% 0.00%
PIMCO Investor Services 0.00% 0.43%
Police & Nurses Limited (P&N Bank) 0.18% 0.36%
Potentia Capital VCLP 0.02% 0.00%
QIC Limited 1.59% 0.65%
Qiming Venture Partners 2.06% 1.46%
RACQ Bank 0.15% 0.20%
Resolution Life Group Services Limited 0.24% 0.00%
ROC Capital Pty Limited 0.03% 0.10%
Shubh Properties Coöperatief U.A. 0.13% 0.26%
Sigular Guff & Company LLC 0.65% 0.65%
Social Ventures Australia Limited 0.02% 0.04%
Solaris Investment Management Limited 3.06% 0.86%
SouthPeak Investment Management Pty Limited 0.41% 0.48%
Stafford Capital Partners Pty Ltd 0.06% 0.08%
Standard Life Investment Limited 1.85% 1.33%
State Street Australia Limited 0.07% 0.27%
State Street Global Advisors 2.44% 5.54%
Stewart Investors 0.74% 1.83%
Teachers Mutual Bank 0.09% 0.27%
Ubique Australian Share Fund 0.00% 0.80%
Uniting Ethical Investors Limited 0.09% 0.12%
ValueInvest Asset Management 4.13% 4.44%
Vanguard Investments Australia Limited 0.00% 0.10%
Vinva Investment Management 2.72% 0.87%
Westpac Banking Corporation 1.15% 1.60%
Wilshire International 0.03% 0.03%
Yarra Capital Management 1.28% 3.09%
TOTAL 100.00% 100.00%
Please note:This is a snapshot of the Fund’s investments at 30 June 2020. The investment managers and the percentages invested will change throughout the year.
Balances held with each investment manager have been rounded to 2 decimal places. For some options the holdings are very small and will appear as 0.00%
18 NGS SUPER | CREATING BRIGHTER FUTURES
Ann
ual R
epor
t 20
20
Member Representatives
Employer Representatives
Wendy Wills Appointed by the
AIS SA
Peter Fogarty4 Appointed by the
Roman Catholic Province of Sydney
Georgina Smith Appointed by the
SA Commission for Catholic Schools
Patrick Ponting Appointed by ACSEA
David Buley Appointed by the
AIS NSW
Michelene Collopy3 Appointed by the Roman
Catholic Province of Sydney
Kathy Dickson Appointed by the
AIS NSW
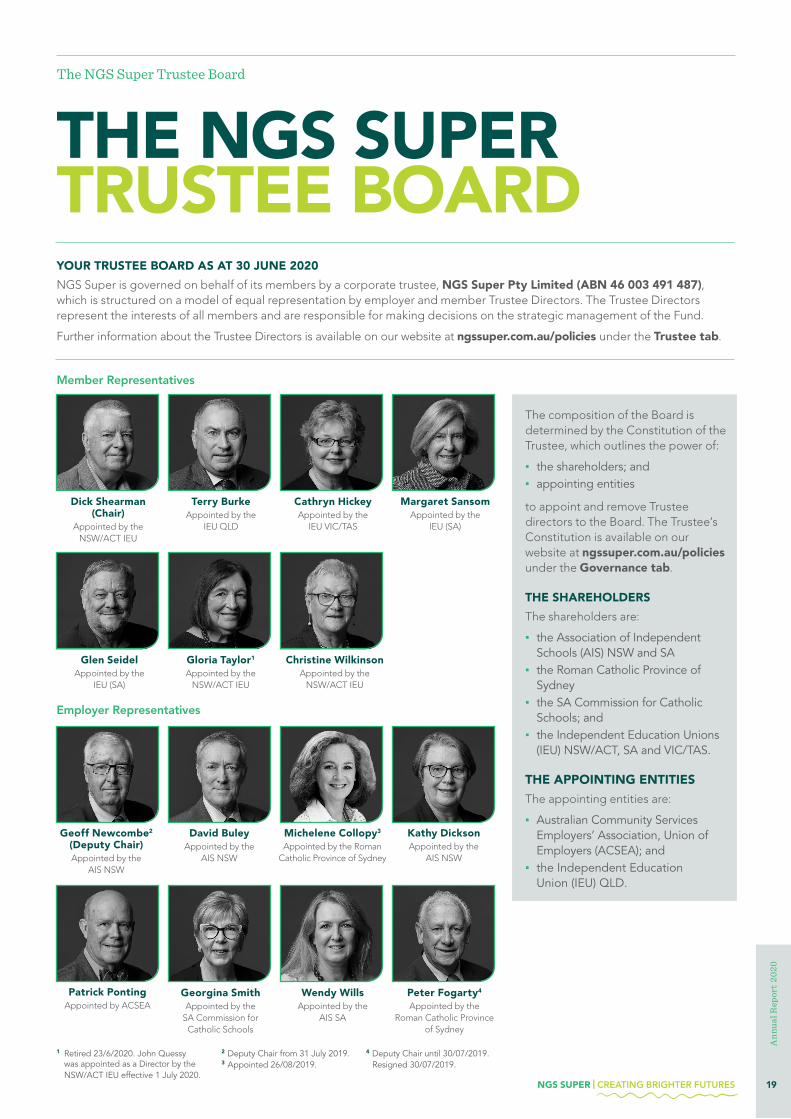
THE NGS SUPER TRUSTEE BOARD
The composition of the Board is determined by the Constitution of the Trustee, which outlines the power of:
▪ the shareholders; and ▪ appointing entities
to appoint and remove Trustee directors to the Board. The Trustee’s Constitution is available on our website at ngssuper.com.au/policies under the Governance tab.
THE SHAREHOLDERS
The shareholders are:
▪ the Association of Independent Schools (AIS) NSW and SA
▪ the Roman Catholic Province of Sydney
▪ the SA Commission for Catholic Schools; and
▪ the Independent Education Unions (IEU) NSW/ACT, SA and VIC/TAS.
THE APPOINTING ENTITIES
The appointing entities are:
▪ Australian Community Services Employers’ Association, Union of Employers (ACSEA); and
▪ the Independent Education Union (IEU) QLD.
The NGS Super Trustee Board
Glen Seidel Appointed by the
IEU (SA)
Dick Shearman (Chair)
Appointed by the NSW/ACT IEU
Terry Burke Appointed by the
IEU QLD
Cathryn Hickey Appointed by the
IEU VIC/TAS
Margaret Sansom Appointed by the
IEU (SA)
Gloria Taylor1 Appointed by the
NSW/ACT IEU
Christine Wilkinson Appointed by the
NSW/ACT IEU
YOUR TRUSTEE BOARD AS AT 30 JUNE 2020
NGS Super is governed on behalf of its members by a corporate trustee, NGS Super Pty Limited (ABN 46 003 491 487), which is structured on a model of equal representation by employer and member Trustee Directors. The Trustee Directors represent the interests of all members and are responsible for making decisions on the strategic management of the Fund.
Further information about the Trustee Directors is available on our website at ngssuper.com.au/policies under the Trustee tab.
1 Retired 23/6/2020. John Quessy was appointed as a Director by the NSW/ACT IEU effective 1 July 2020.
2 Deputy Chair from 31 July 2019. 3 Appointed 26/08/2019.
4 Deputy Chair until 30/07/2019. Resigned 30/07/2019.
Geoff Newcombe2 (Deputy Chair) Appointed by the
AIS NSW
NGS SUPER | CREATING BRIGHTER FUTURES 19
Ann
ual R
epor
t 20
20

Abridged financial statements as at 30 June 2020
ABRIDGED FINANCIAL STATEMENTS 2020
The above information has been extracted from audited financial statements. A copy of the full audited financial statements may be obtained from the Trustee Office.
STATEMENT OF FINANCIAL POSITION
30/06/2020 30/06/2019$’000 $’000
ASSETS
Cash and cash equivalents 12,430 23,585
Receivables 59,713 108,878
Investments 11,562,844 11,521,471
Other Assets 4,933 1,216
TOTAL ASSETS 11,639,920 11,655,150
LIABILITIES
Creditors and accruals 65,590 65,144
Current tax liabilities 28,988 18,742
Deferred tax liabilities 83,349 145,598
TOTAL LIABILITIES 177,927 229,484
NET ASSETS AVAILABLE FOR MEMBER BENEFITS 11,461,993 11,425,666
MEMBER BENEFITS
Defined contribution member liabilities 11,285,144 11,243,356
Defined benefit member liabilities 77,525 82,804
TOTAL MEMBER BENEFITS 11,362,669 11,326,160
NET ASSETS 99,324 99,506
EQUITY
Trustee operating reserve 33,042 29,969
Operational risk reserve 32,559 30,434
Defined Benefit surplus 11,634 15,513
Unallocated surplus 22,089 23,590
TOTAL EQUITY 99,324 99,506
20 NGS SUPER | CREATING BRIGHTER FUTURES
Ann
ual R
epor
t 20
20

Abridged financial statements as at 30 June 2020
The above information has been extracted from audited financial statements. A copy of the full audited financial statements may be obtained from the Trustee Office.
INCOME STATEMENT
30/06/2020 30/06/2019$’000 $’000
REVENUE FROM SUPERANNUATION ACTIVITIES
Interest 255 540
Investment income 454,562 416,939
Net gains/(losses) on assets measured at fair value (522,658) 338,686
Sundry income 1,720 1,720
TOTAL SUPERANNUATION ACTIVITIES REVENUE (66,121) 757,885
EXPENSES
Direct investment expenses (40,289) (30,365)
Indirect investment expenses (12,505) (9,680)
Administration expenses (19,811) (22,499)
Other expenses (1,223) (1,285)
TOTAL EXPENSES (73,828) (63,829)
RESULTS FROM SUPERANNUATION ACTIVITIES
BEFORE INCOME TAX (139,949) 694,056
Income tax expense/(benefit) (46,004) 28,056
RESULTS FROM SUPERANNUATION ACTIVITIES AFTER INCOME TAX (93,945) 666,000
ALLOCATION TO MEMBER BENEFITS
Net benefits allocated to defined contribution (DC) member accounts 52,345 (666,636)
Net benefits allocated to defined benefit (DB) member liabilities 6,127 (14,599)
TOTAL ALLOCATION TO MEMBER BENEFITS 58,472 (681,235)
NET OPERATING RESULT (35,473) (15,235)
NGS SUPER | CREATING BRIGHTER FUTURES 21
Ann
ual R
epor
t 20
20
Abridged financial statements as at 30 June 2020
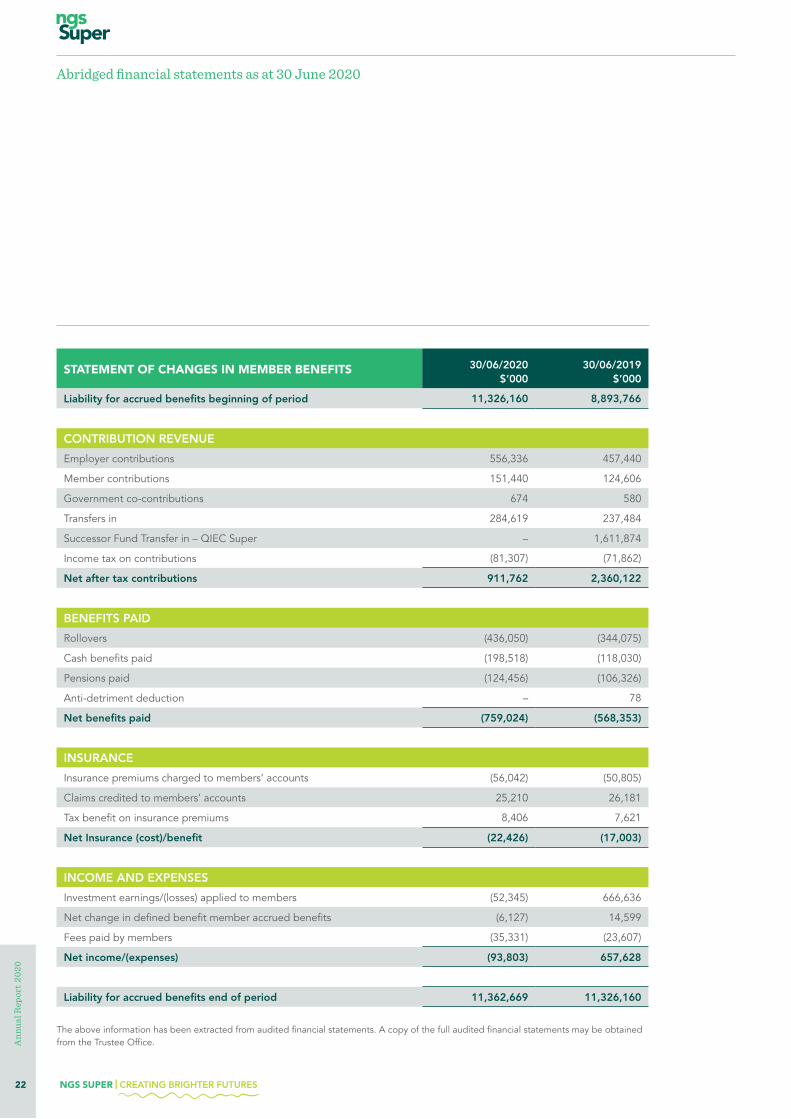
The above information has been extracted from audited financial statements. A copy of the full audited financial statements may be obtained from the Trustee Office.
STATEMENT OF CHANGES IN MEMBER BENEFITS
30/06/2020 30/06/2019$’000 $’000
Liability for accrued benefits beginning of period 11,326,160 8,893,766
CONTRIBUTION REVENUE
Employer contributions 556,336 457,440
Member contributions 151,440 124,606
Government co-contributions 674 580
Transfers in 284,619 237,484
Successor Fund Transfer in – QIEC Super – 1,611,874
Income tax on contributions (81,307) (71,862)
Net after tax contributions 911,762 2,360,122
BENEFITS PAID
Rollovers (436,050) (344,075)
Cash benefits paid (198,518) (118,030)
Pensions paid (124,456) (106,326)
Anti-detriment deduction – 78
Net benefits paid (759,024) (568,353)
INSURANCE
Insurance premiums charged to members’ accounts (56,042) (50,805)
Claims credited to members’ accounts 25,210 26,181
Tax benefit on insurance premiums 8,406 7,621
Net Insurance (cost)/benefit (22,426) (17,003)
INCOME AND EXPENSES
Investment earnings/(losses) applied to members (52,345) 666,636
Net change in defined benefit member accrued benefits (6,127) 14,599
Fees paid by members (35,331) (23,607)
Net income/(expenses) (93,803) 657,628
Liability for accrued benefits end of period 11,362,669 11,326,160
22 NGS SUPER | CREATING BRIGHTER FUTURES
Ann
ual R
epor
t 20
20
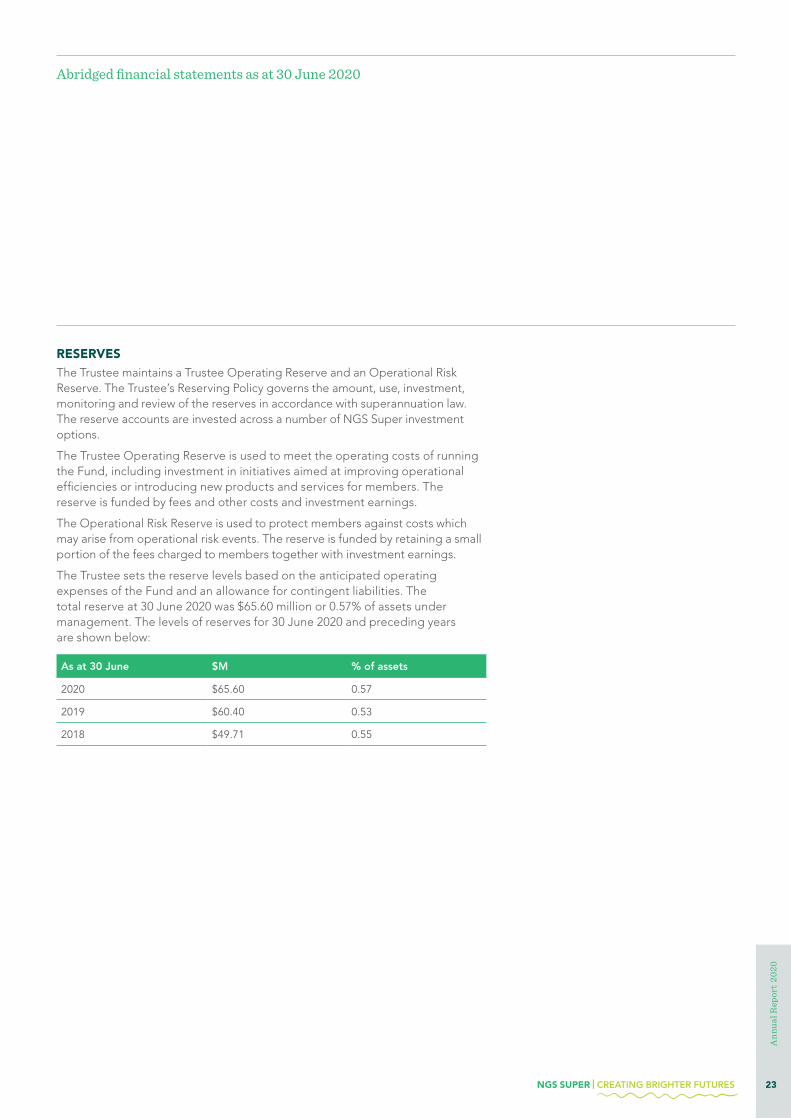
RESERVESThe Trustee maintains a Trustee Operating Reserve and an Operational Risk Reserve. The Trustee’s Reserving Policy governs the amount, use, investment, monitoring and review of the reserves in accordance with superannuation law. The reserve accounts are invested across a number of NGS Super investment options.
The Trustee Operating Reserve is used to meet the operating costs of running the Fund, including investment in initiatives aimed at improving operational efficiencies or introducing new products and services for members. The reserve is funded by fees and other costs and investment earnings.
The Operational Risk Reserve is used to protect members against costs which may arise from operational risk events. The reserve is funded by retaining a small portion of the fees charged to members together with investment earnings.
The Trustee sets the reserve levels based on the anticipated operating expenses of the Fund and an allowance for contingent liabilities. The total reserve at 30 June 2020 was $65.60 million or 0.57% of assets under management. The levels of reserves for 30 June 2020 and preceding years are shown below:
As at 30 June $M % of assets
2020 $65.60 0.57
2019 $60.40 0.53
2018 $49.71 0.55
Abridged financial statements as at 30 June 2020
NGS SUPER | CREATING BRIGHTER FUTURES 23
Ann
ual R
epor
t 20
20
Things you need to know
THINGS YOU NEED TO KNOWPROVIDING FEEDBACK OR MAKING A COMPLAINT
If you are dissatisfied with us, we would like you to let us know as soon as possible so that we can work to resolve your enquiry or complaint quickly. Contact us on 1300 133 177 or online at ngssuper.com.au/contact-us. You can also request a copy of our complaints process.
If we have not responded to your complaint within the timeframe prescribed in our complaints process or you are not satisfied with our decision, you may be able to take the matter to the Australian Financial Complaints Authority (AFCA) at afca.org.au or on 1800 931 678.
Internal complaints contact External complaints contact
NGS Super Complaints Officer
Mail: PO Box 21236 World Square NSW 2002
Phone: 1300 133 177 8am – 8pm (AEST/AEDT) weekdays
Overseas: +61 3 8687 1818
Online: ngssuper.com.au/contact-us
Australian Financial Complaints Authority (AFCA)
Mail: GPO Box 3 Melbourne VIC 3001
Phone: 1800 931 678 (free call)
Email: [email protected]
Online: afca.org.au
Time limits may apply to complain to AFCA and so you should act promptly or otherwise consult the AFCA website to find out if or when the time limit relevant to your circumstances expires.
A copy of NGS Super’s Complaint and dispute resolution process is available at ngssuper.com.au/complaints or by contacting us on 1300 133 177 or by emailing [email protected]
ELIGIBLE ROLLOVER FUND (ERF)
AUSfund is an ERF into which lost members or members with small inactive accounts could be transferred. Circumstances where your benefit may be transferred to AUSfund include where you receive a Tax File Number refund on exit.
If your account is transferred to AUSfund, you’ll no longer be a member of NGS Super and any insurance cover you had with us will cease. Different fees and costs will also apply to your AUSfund account.
AUSfund contact details
Mail: AUSfund Locked Bag 5132 Parramatta NSW 2124
Phone: 1300 361 798
Email: [email protected]
Online: ausfund.net.au
24 NGS SUPER | CREATING BRIGHTER FUTURES
Ann
ual R
epor
t 20
20
Things you need to know
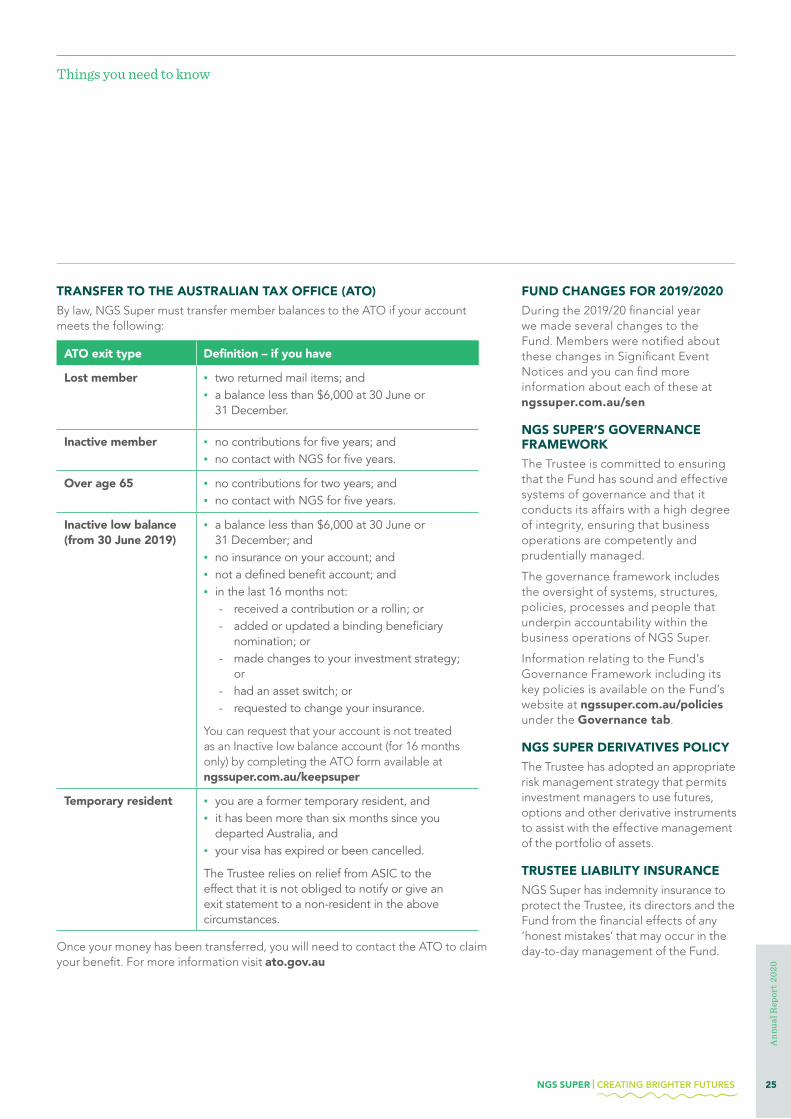
FUND CHANGES FOR 2019/2020
During the 2019/20 financial year we made several changes to the Fund. Members were notified about these changes in Significant Event Notices and you can find more information about each of these at ngssuper.com.au/sen
NGS SUPER’S GOVERNANCE FRAMEWORK
The Trustee is committed to ensuring that the Fund has sound and effective systems of governance and that it conducts its affairs with a high degree of integrity, ensuring that business operations are competently and prudentially managed.
The governance framework includes the oversight of systems, structures, policies, processes and people that underpin accountability within the business operations of NGS Super.
Information relating to the Fund’s Governance Framework including its key policies is available on the Fund’s website at ngssuper.com.au/policies under the Governance tab.
NGS SUPER DERIVATIVES POLICY
The Trustee has adopted an appropriate risk management strategy that permits investment managers to use futures, options and other derivative instruments to assist with the effective management of the portfolio of assets.
TRUSTEE LIABILITY INSURANCE
NGS Super has indemnity insurance to protect the Trustee, its directors and the Fund from the financial effects of any ‘honest mistakes’ that may occur in the day-to-day management of the Fund.
TRANSFER TO THE AUSTRALIAN TAX OFFICE (ATO)
By law, NGS Super must transfer member balances to the ATO if your account meets the following:
ATO exit type Definition – if you have
Lost member ▪ two returned mail items; and ▪ a balance less than $6,000 at 30 June or
31 December.
Inactive member ▪ no contributions for five years; and ▪ no contact with NGS for five years.
Over age 65 ▪ no contributions for two years; and ▪ no contact with NGS for five years.
Inactive low balance (from 30 June 2019)
▪ a balance less than $6,000 at 30 June or 31 December; and
▪ no insurance on your account; and ▪ not a defined benefit account; and ▪ in the last 16 months not:
- received a contribution or a rollin; or - added or updated a binding beneficiary
nomination; or - made changes to your investment strategy;
or - had an asset switch; or - requested to change your insurance.
You can request that your account is not treated as an Inactive low balance account (for 16 months only) by completing the ATO form available at ngssuper.com.au/keepsuper
Temporary resident ▪ you are a former temporary resident, and ▪ it has been more than six months since you
departed Australia, and ▪ your visa has expired or been cancelled.
The Trustee relies on relief from ASIC to the effect that it is not obliged to notify or give an exit statement to a non-resident in the above circumstances.
Once your money has been transferred, you will need to contact the ATO to claim your benefit. For more information visit ato.gov.au
NGS SUPER | CREATING BRIGHTER FUTURES 25
Ann
ual R
epor
t 20
20

26 NGS SUPER | CREATING BRIGHTER FUTURES
Ann
ual R
epor
t 20
20
NGS SUPER TRUSTEE OFFICE (NSW)
Level 4, 14 Martin Place Sydney NSW 2000
Postal address: PO Box 21236 World Square NSW 2002
QUEENSLAND OFFICE
Level 6, 157 Ann Street Brisbane QLD 4000
SOUTH AUSTRALIA OFFICE
Level 1, 431-439 King William Street Adelaide SA 5000
VICTORIA OFFICE
Level 5, 737 Burwood Road Hawthorn VIC 3122
OUR OFFICES
IMPORTANT INFORMATIONThe information provided in this document is general information only and does not take into account your objectives, financial situation or needs. Before making a financial decision, please assess the appropriateness of the information to your individual circumstances and consider seeking professional advice. Past performance is not a reliable indicator of future performance.
NGS Financial Planning Pty Ltd, ABN 89 134 620 518, is a corporate authorised representative #394909 of Guideway Financial Services Pty Ltd, ABN 46 156 498 538, AFSL #420367 and offers financial planning services on behalf of NGS Super ABN 73 549 180 515.
Issued by NGS Super Pty Limited ABN 46 003 491 487 AFSL No 233 154 the trustee of NGS Super ABN 73 549 180 515.
Our Offices

CONTACT US
You can contact us at: ngssuper.com.au/contact-us call us on 1300 133 177 between 8.00am and 8.00pm (AEST or AEDT), Monday to Friday.
Phone number for callers outside Australia +61 3 8687 1818
Fax: (03) 9245 5827
Postal address: GPO Box 4303 MELBOURNE VIC 3001
NGS FINANCIAL PLANNING
To make an appointment phone our Helpline on 1300 133 177 or complete the Financial planning enquiry form on our website at ngssuper.com.au/financial-planning
CONTACT DETAILS
NGS SUPER CREATING BRIGHTER FUTURES
The rating is issued by SuperRatings Pty Ltd ABN 95 100 192 283 AFSL 311880 (SuperRatings). Ratings are general advice only and have been prepared without taking account of your objectives, financial situation or needs. Consider your personal circumstances, read the product disclosure statement and seek independent financial advice before investing. The rating is not a recommendation to purchase, sell or hold any product. Past performance information is not indicative of future performance. Ratings are subject to change without notice and SuperRatings assumes no obligation to update. SuperRatings uses objective criteria and receives a fee for publishing awards. Visit superratings.com.au for ratings information and to access the full report. © 2020 SuperRatings. All rights reserved.
For further information about the methodology used by Chant West, see chantwest.com.auChant West has given its consent to the inclusion in this Annual Report of the references to Chant West and the inclusion of the logos and ratings provided by Chant West in the form and context in which they are included.
AWARDS
4487
(082
0)ngssuper.com.au1300 133 177Issued by NGS Super Pty Limited ABN 46 003 491 487 AFSL No 233 154 the trustee of NGS Super ABN 73 549 180 515.