Embed Size (px)
Citation preview

ARPA-E FLEXIBLE ADVANCED NUCLEAR STUDY:
OVERVIEW AND RESULTSPrepared by LucidCatalyst
January 2020

• What kind of power plant will be needed in the future and why?
• How do we create value for those future customers?
• Is flexibility valuable? How valuable?
• What can advanced reactors cost in these future markets?
• How could this guide your product development?
1
The questions that motivated the study
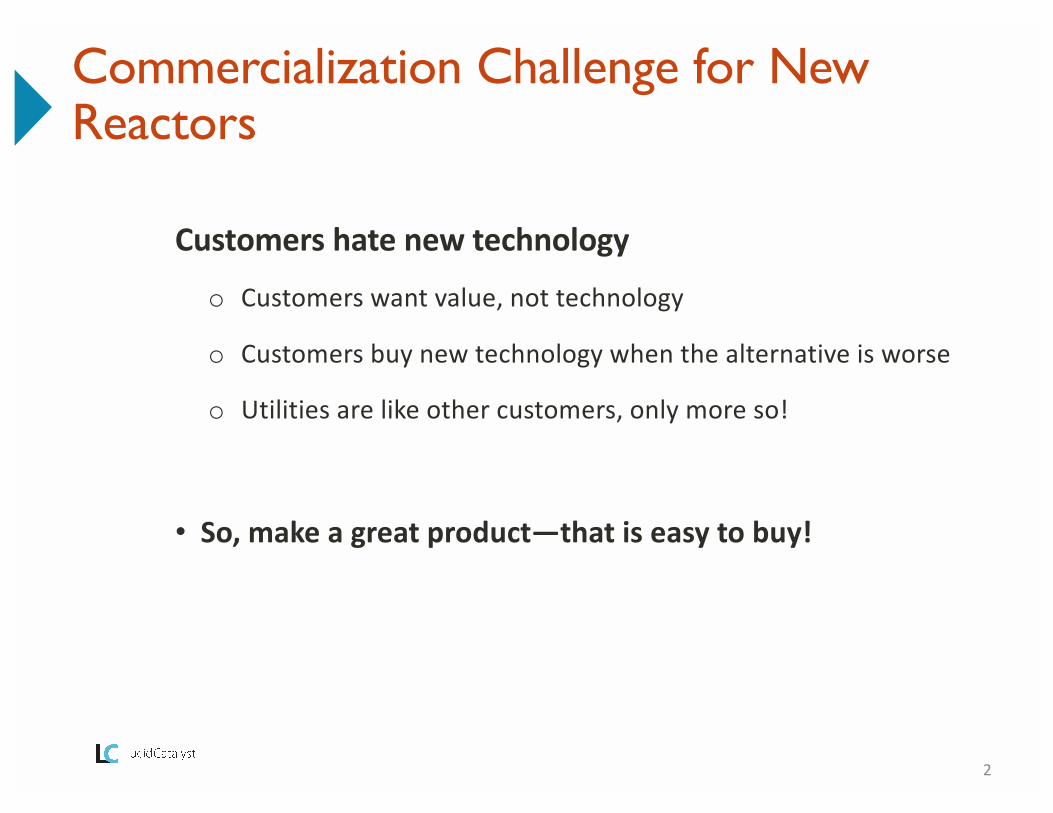
Customers hate new technology
o Customers want value, not technology
o Customers buy new technology when the alternative is worse
o Utilities are like other customers, only more so!
• So, make a great product—that is easy to buy!
2
Commercialization Challenge for New Reactors

• With a clear understanding of the customer’s requirements
o Make sure you know who the real competition is
o May include providing something that they didn’t know they needed
o Or meeting their needs in a new way that they didn’t anticipate
• Design to Cost
o Flow down cost targets to all subsystems
o Understand the full costs, and how design decisions drive costs later in the production/delivery/operational phases
o Iterate when cost targets are missed
o When iterating, make sure that the functions that are driving cost are needed/valuable/worth it
3
How can we develop low-cost, high performance products?

• Technology agnostic study
• Policy agnostic
• Investigated requirements for a generic advanced reactor
• Key questions for future market conditions-2034
o What is the maximum allowable CapEx?
o What is the value of integrated thermal storage?
o Are there significant differences between key markets?
o How do OpEx and fuel costs affect allowable capital cost?
4
Letting the market define the requirements
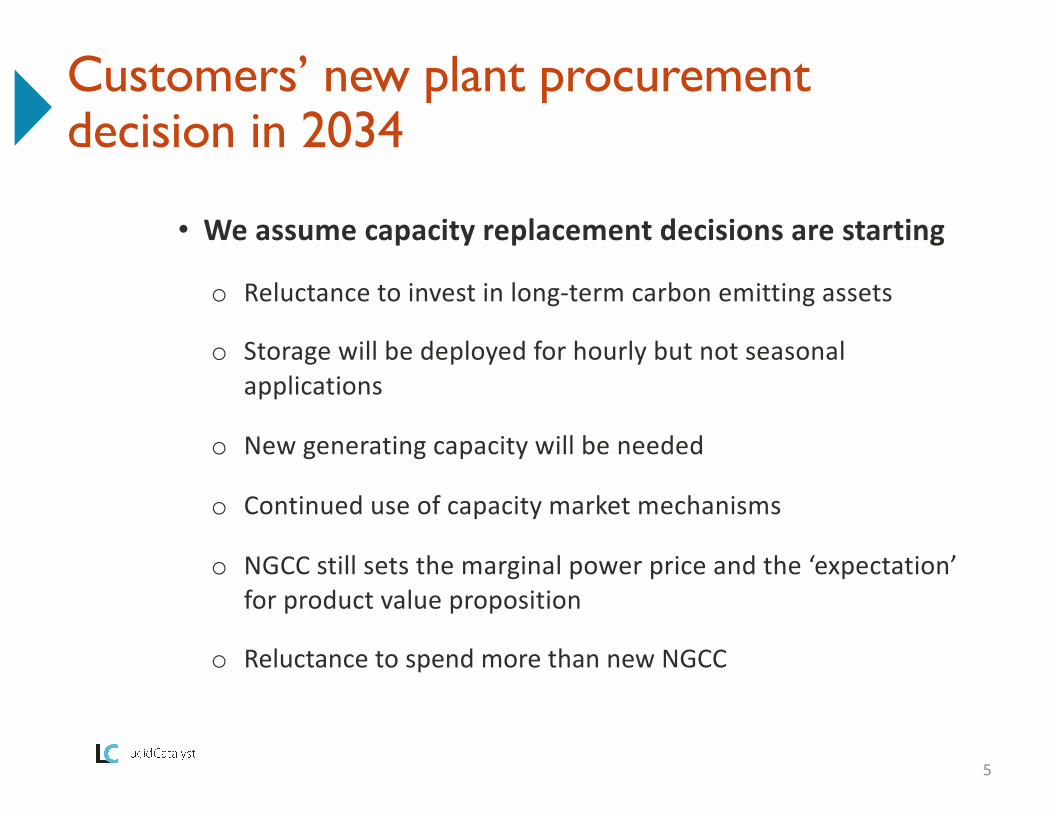
• We assume capacity replacement decisions are starting
o Reluctance to invest in long-term carbon emitting assets
o Storage will be deployed for hourly but not seasonal applications
o New generating capacity will be needed
o Continued use of capacity market mechanisms
o NGCC still sets the marginal power price and the ‘expectation’ for product value proposition
o Reluctance to spend more than new NGCC
5
Customers’ new plant procurement decision in 2034

• Why 2034?o Halfway to 2050
o Advanced reactors will be ready
o Most NGCC plants will be nearing retirement age
• Likely 2034 market characteristicso Low natural gas prices
o Low cost renewables
o No major subsidies (ITC, PTC, etc.)
o Significant/increasing need for flexible, dispatchable resources
o Economic headwinds for non-flexible baseload generation
o Coal retirements, older NGCC plants, and relatively low power prices
6
We modelled four ISO’s in 2034

• “Baseline” Renewable vs. High Renewable grid mixo First market entrant (1st plant)
o Projects with co-located thermal storage
o Alt Scenario #1: $50/tonne CO2 Price
o Alt Scenario #2: High penetration scenario (Fleet)
o Alt Scenario #3: Higher baseline OpEx
7
Scenarios for each ISO
8
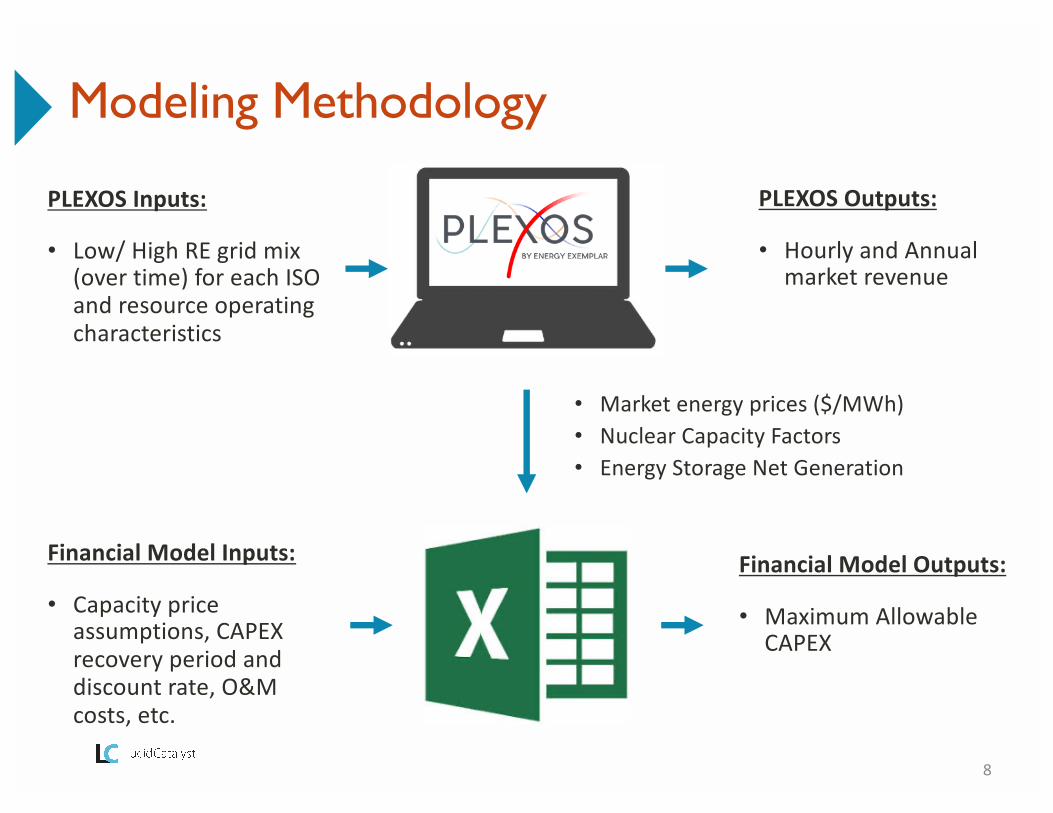
Modeling Methodology
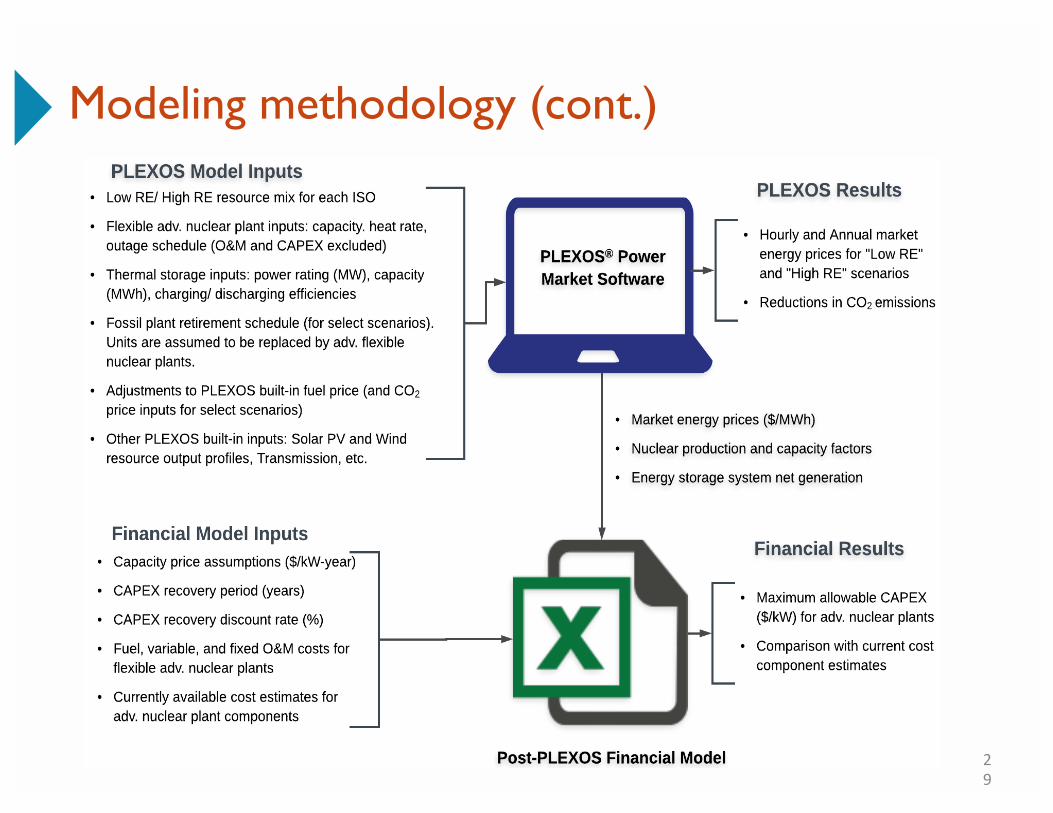
PLEXOS Inputs:
• Low/ High RE grid mix (over time) for each ISO and resource operating characteristics
Financial Model Inputs:
• Capacity price assumptions, CAPEX recovery period and discount rate, O&M costs, etc.
PLEXOS Outputs:
• Hourly and Annual market revenue
Financial Model Outputs:
• Maximum Allowable CAPEX
• Market energy prices ($/MWh)• Nuclear Capacity Factors• Energy Storage Net Generation

• 500MWe advanced reactor
• Produces heat at 600-700°C
• 40% thermal efficiency
• Max. Potential Capacity Factor: 92%
• Ramp Rate: 5% of max capacity/min (25MW/min)
• Minimum stable factor: 0%
9
The generic flexible nuclear plant

• 500 MW rated output (same as adv. nuclear plant)
• 12 hours of output @ 500 MW (6,000 MWh)
• 90%+ roundtrip net efficiency (mechanical losses, not thermal)
• Outlet temperature: 600-700°C
• Max. state of charge: 100%
• Min. state of charge: 0%
10
Idealized thermal energy storage (technology agnostic)
11
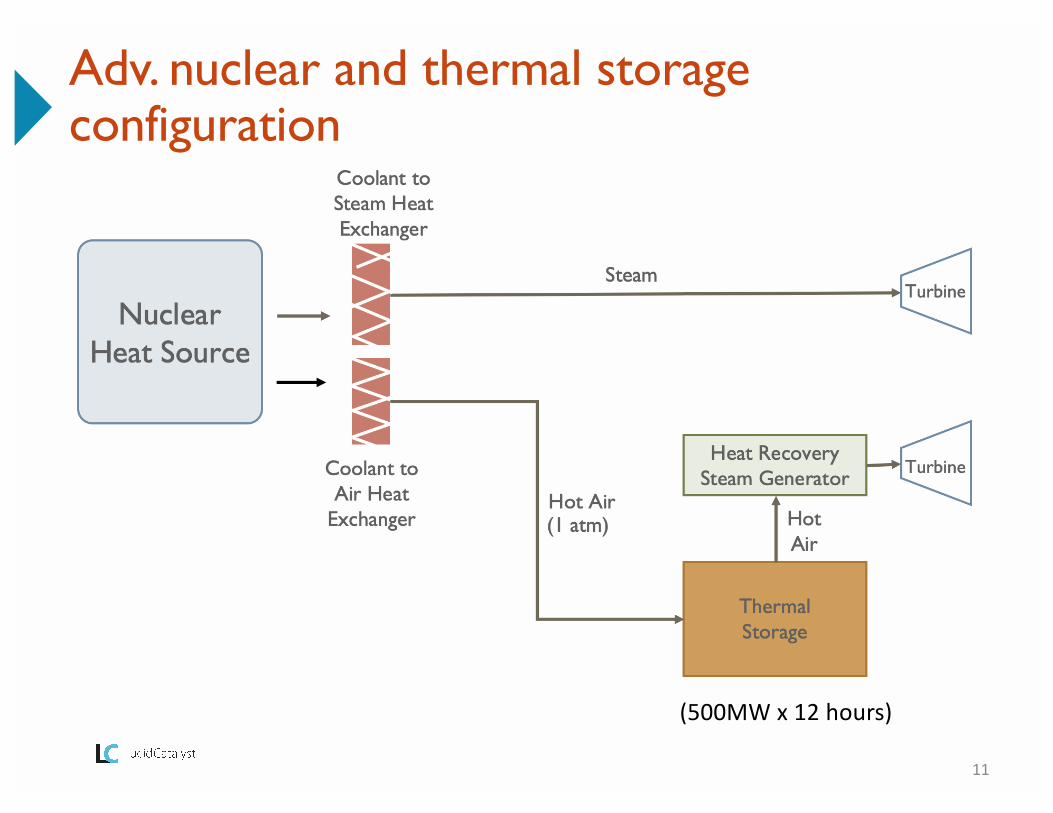
Adv. nuclear and thermal storage configuration
(500MW x 12 hours)

12
Non-nuclear estimate ~$750/kW (w/o ESS)
(500MW x 12 hours)

13
ESS estimate <1,000/kW, $100/kWh
(500MW x 12 hours)

14
Results: allowable CapEx is scenario-specific
Low RE High RE
W/out ESS W/ ESS W/out ESS W/ ESS
ISO-NELow capacity price case: $2,289 $2,962 $1,965 $2,788
Mid capacity price case: $2,566 $3,515 $2,242 $3,341
High capacity price case: $2,843 $4,068 $2,519 $3,894
PJMLow capacity price case: $2,358 $2,988 $2,186 $3,038
Mid capacity price case: $2,634 $3,541 $2,462 $3,591
High capacity price case: $2,911 $4,095 $2,739 $4,144
MISOLow capacity price case: $2,244 $2,857 $2,000 $2,654
Mid capacity price case: $2,521 $3,410 $2,276 $3,207
High capacity price case: $2,797 $3,963 $2,553 $3,760
CAISOLow capacity price case: $2,187 $3,397 $1,968 $3,306
Mid capacity price case: $2,464 $3,950 $2,244 $3,859
High capacity price case: $2,740 $4,503 $2,521 $4,412

• Companies must aim for <$3,000/kW for their adv. nuclear plants
Results: Implications
15
• Thermal storage enables higher allowable CAPEX; it doubles capacity payments
• But a portion will be necessary to pay for the storage system.
• Capacity price is critically importanto A “mid” capacity price of $75/kW-year allows for:
• ~$2,500/kW CAPEX without storage• ~$3,500/kW CAPEX with storage
• If on the margin, fuel price and OpEx will be very important

16
Example: Results for ISO-NE (w/ thermal storage)
0
5,000
10,000
15,000
20,000
25,000
30,000
35,000
40,000
45,000
50,000
2018 2034Baseline
2034Adv
Nuclear
MW
Installed Capacity
Bio/Other
Wind
Solar
Hydro
Adv nucwith ESExistingnuclearOil
-17,216
-20,000
0
20,000
40,000
60,000
80,000
100,000
120,000
140,000
GW
h
Imports/ExportsBio/Other
Wind
Solar
Hydro
Adv nucwith ES
2018 2034 Baseline
2034 Adv
Nuclear
• Overall generation increases in the Advanced Nuclear scenario enabling clean energy exports.
Generation and Imports/Exports

17
Flexible advanced nuclear, when coupled with storage, can provide the same grid flexibility as CCGTs
Dispatch in mid July (during seasonal solar peak)
05,000
10,00015,00020,00025,000
MW
05,000
10,00015,00020,00025,000
MW
1 Plant(500 MW average 1GW peak)
10 Plants(5,000 MW average10GW Peak)

• As expected, establishing a CO2 price dramatically improves the maximum allowable CAPEX requirements:
18
Alt Scenario #1: CO2 Price
CO2 Price ($/tonne)
Change to Max. Allowable CAPEX (+/-)
Without Thermal ESS With Thermal ESS
$25 + $947/kW + $993/kW
$50 + $1,889/kW + $2,005/kW
$75 + $2,814/kW + $3,017/kW
ISO: PJMLoad Zone: PEPCOScenario: High RE

• Supply 2/3 of firm generation in PJM with flexible nuclear plants (and co-located thermal storage) dropped the maximum allowable CAPEX by ~$500/kW (from the 1st plant to last plant).
19
Alt Scenario #2: Effect of large fleet
020,00040,00060,00080,000
100,000120,000140,000160,000180,000
July 16 July 17 July 18 July 19 July 20 July 21 July 22
MW
Existing nuclear Bio/Other HydroWind Solar Adv nuc + ESCoal Natural gas Oil
Total cost of serving PJM’s load decreases slightly.
Average annual energy prices dropped by $4.36/MWh
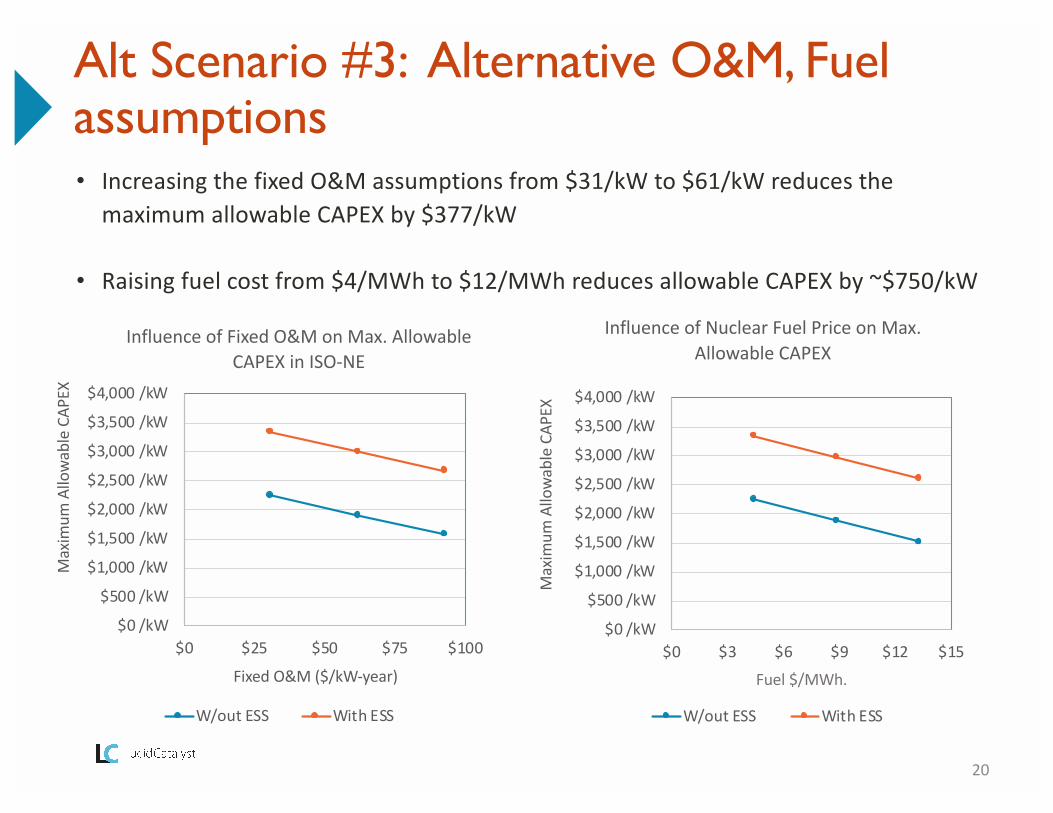
• Increasing the fixed O&M assumptions from $31/kW to $61/kW reduces the maximum allowable CAPEX by $377/kW
• Raising fuel cost from $4/MWh to $12/MWh reduces allowable CAPEX by ~$750/kW
20
Alt Scenario #3: Alternative O&M, Fuel assumptions
$0 /kW
$500 /kW
$1,000 /kW
$1,500 /kW
$2,000 /kW
$2,500 /kW
$3,000 /kW
$3,500 /kW
$4,000 /kW
$0 $25 $50 $75 $100
Max
imum
Allo
wab
le C
APEX
Fixed O&M ($/kW-year)
Influence of Fixed O&M on Max. Allowable CAPEX in ISO-NE
W/out ESS With ESS
$0 /kW
$500 /kW
$1,000 /kW
$1,500 /kW
$2,000 /kW
$2,500 /kW
$3,000 /kW
$3,500 /kW
$4,000 /kW
$0 $3 $6 $9 $12 $15
Max
imum
Allo
wab
le C
APEX
Fixed O&M ($/kW-year)
Influence of Nuclear Fuel Price on Max. Allowable CAPEX
W/out ESS With ESS
Fuel $/MWh.

• Across ISOs modeled, co-locating storage makes economic sense, on average, for less than $1,126/kW
• Lowest CAPEX Threshold (Low RE - MISO): $613/kW
• Highest CAPEX Threshold (High RE - CAISO): $1,891/kW
• Without storage, a plant’s CF suffers in high VRE zones• In the High RE scenario, capacity factors for nuclear plants in
southern California drop to 67%.
• These plants are being designed to operate for a minimum of 40 years à it is worth considering what market conditions (particularly VRE penetration) will exist beyond 2034
21
Value of thermal storage

• Having a highly-rampable reactor (without storage) may be good for the grid but it does not necessarily benefit a plant’s bottom line
o No value for flexibility
o Nuclear plants inherently want to run at their maximum rated output
o Making flexibility economic will require either thermal energy storage, or major market reforms
o Thermal storage is beneficial for the plant owner at a cost of less than $1,126/kW
o DTs need to be designing for low CapEx against a validated cost model
o CapEx goal should be <$3,000
22
Conclusions (1 of 2)
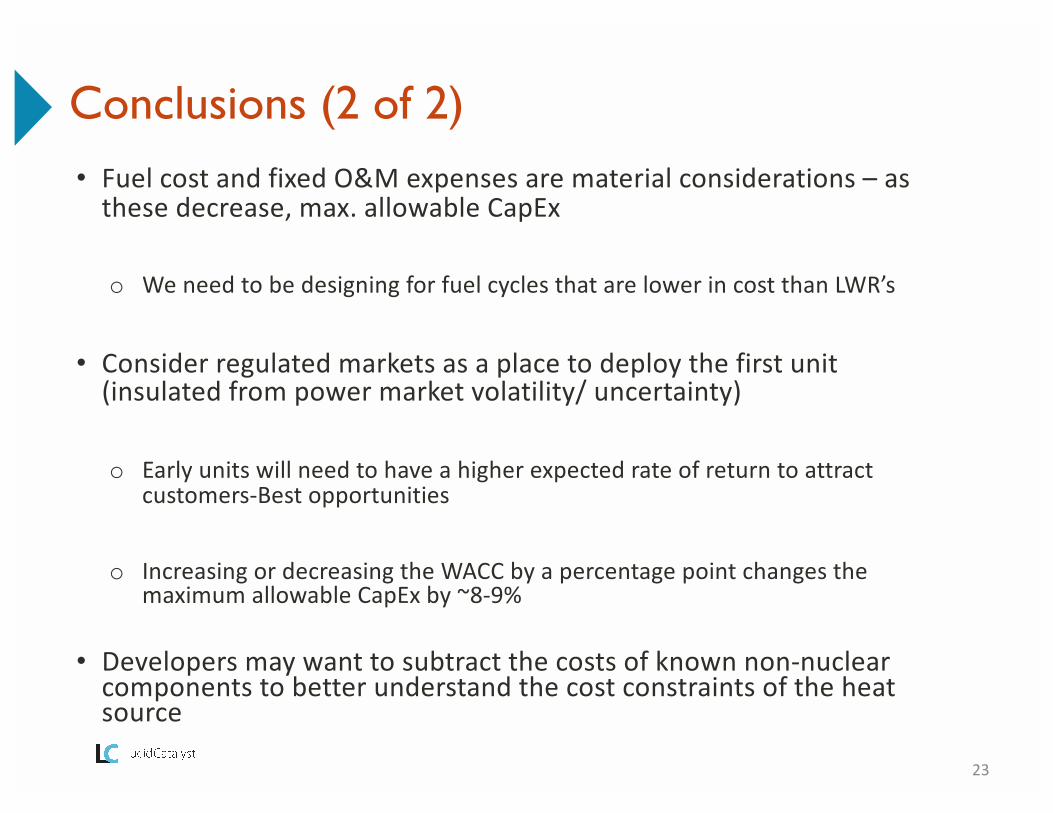
• Fuel cost and fixed O&M expenses are material considerations – as these decrease, max. allowable CapEx
o We need to be designing for fuel cycles that are lower in cost than LWR’s
• Consider regulated markets as a place to deploy the first unit (insulated from power market volatility/ uncertainty)
o Early units will need to have a higher expected rate of return to attract customers-Best opportunities
o Increasing or decreasing the WACC by a percentage point changes the maximum allowable CapEx by ~8-9%
• Developers may want to subtract the costs of known non-nuclear components to better understand the cost constraints of the heat source
23
Conclusions (2 of 2)

• We now have clear cost and performance targets for Design Teams
• Grid operators do not know that these products are coming
• These products are not being modeled into future energy systems
Benefits of this study
24

Appendix Slides
25
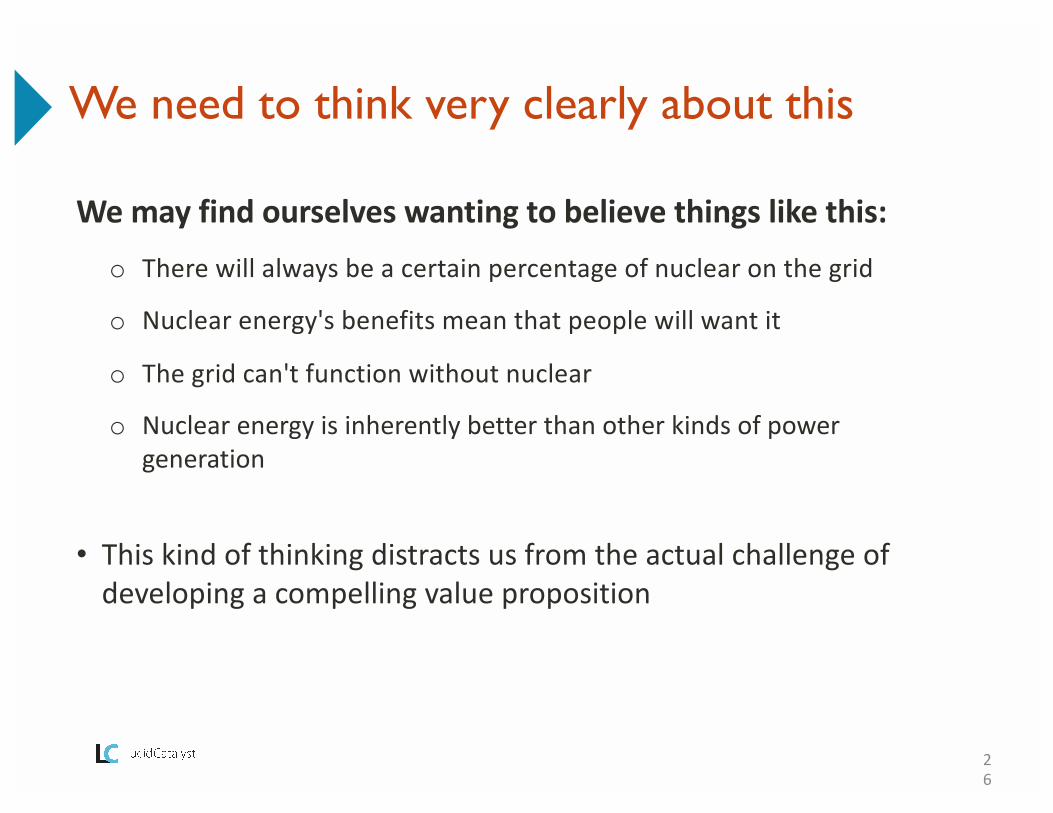
We may find ourselves wanting to believe things like this:o There will always be a certain percentage of nuclear on the grid
o Nuclear energy's benefits mean that people will want it
o The grid can't function without nuclear
o Nuclear energy is inherently better than other kinds of power generation
• This kind of thinking distracts us from the actual challenge of developing a compelling value proposition
26
We need to think very clearly about this
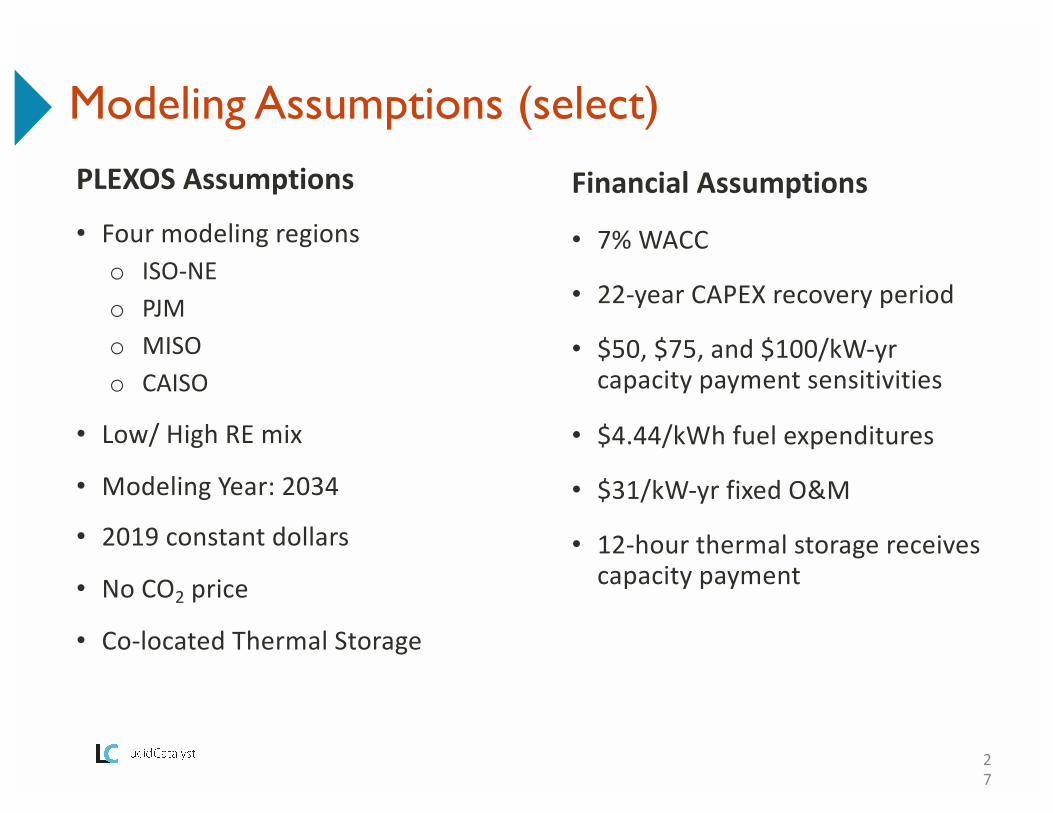
PLEXOS Assumptions
• Four modeling regionso ISO-NEo PJMo MISOo CAISO
• Low/ High RE mix
• Modeling Year: 2034
• 2019 constant dollars
• No CO2 price
• Co-located Thermal Storage
27
Modeling Assumptions (select)
Financial Assumptions
• 7% WACC
• 22-year CAPEX recovery period
• $50, $75, and $100/kW-yrcapacity payment sensitivities
• $4.44/kWh fuel expenditures
• $31/kW-yr fixed O&M
• 12-hour thermal storage receives capacity payment

• New market mechanisms to reward flexibility are too nascent
• Operating reserve markets will likely expand but more participants will keep prices (revenue) stable
• Energy and Capacity payments = primary revenue sources
28
Expected Future Revenue Sources
29
Modeling methodology (cont.)
30
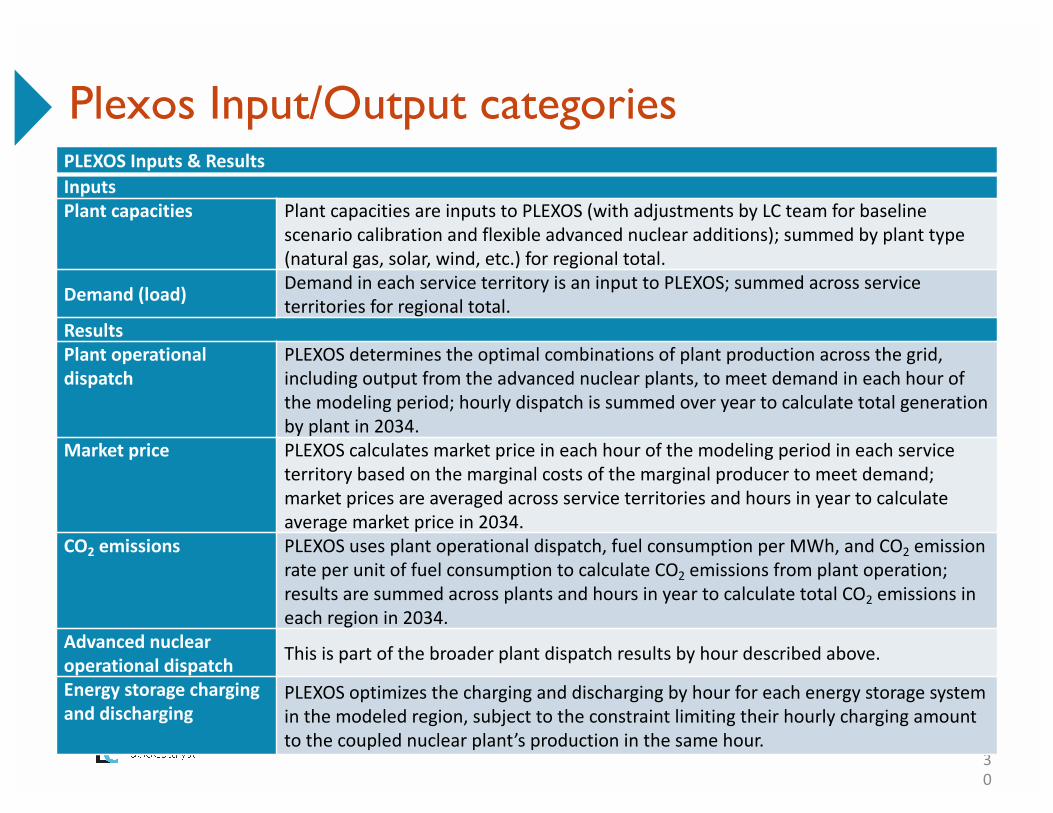
Plexos Input/Output categoriesPLEXOS Inputs & ResultsInputsPlant capacities Plant capacities are inputs to PLEXOS (with adjustments by LC team for baseline
scenario calibration and flexible advanced nuclear additions); summed by plant type (natural gas, solar, wind, etc.) for regional total.
Demand (load) Demand in each service territory is an input to PLEXOS; summed across service territories for regional total.
ResultsPlant operational dispatch
PLEXOS determines the optimal combinations of plant production across the grid, including output from the advanced nuclear plants, to meet demand in each hour of the modeling period; hourly dispatch is summed over year to calculate total generation by plant in 2034.
Market price PLEXOS calculates market price in each hour of the modeling period in each service territory based on the marginal costs of the marginal producer to meet demand; market prices are averaged across service territories and hours in year to calculate average market price in 2034.
CO2 emissions PLEXOS uses plant operational dispatch, fuel consumption per MWh, and CO2 emission rate per unit of fuel consumption to calculate CO2 emissions from plant operation; results are summed across plants and hours in year to calculate total CO2 emissions in each region in 2034.
Advanced nuclear operational dispatch This is part of the broader plant dispatch results by hour described above.
Energy storage charging and discharging
PLEXOS optimizes the charging and discharging by hour for each energy storage system in the modeled region, subject to the constraint limiting their hourly charging amount to the coupled nuclear plant’s production in the same hour.

31
Results
Low RE High RE
W/out ESS W/ ESS W/out ESS W/ ESS
ISO-NELow capacity price case: $2,289 $2,962 $1,965 $2,788
Mid capacity price case: $2,566 $3,515 $2,242 $3,341
High capacity price case: $2,843 $4,068 $2,519 $3,894
PJMLow capacity price case: $2,358 $2,988 $2,186 $3,038
Mid capacity price case: $2,634 $3,541 $2,462 $3,591
High capacity price case: $2,911 $4,095 $2,739 $4,144
MISOLow capacity price case: $2,244 $2,857 $2,000 $2,654
Mid capacity price case: $2,521 $3,410 $2,276 $3,207
High capacity price case: $2,797 $3,963 $2,553 $3,760
CAISOLow capacity price case: $2,187 $3,397 $1,968 $3,306
Mid capacity price case: $2,464 $3,950 $2,244 $3,859
High capacity price case: $2,740 $4,503 $2,521 $4,412
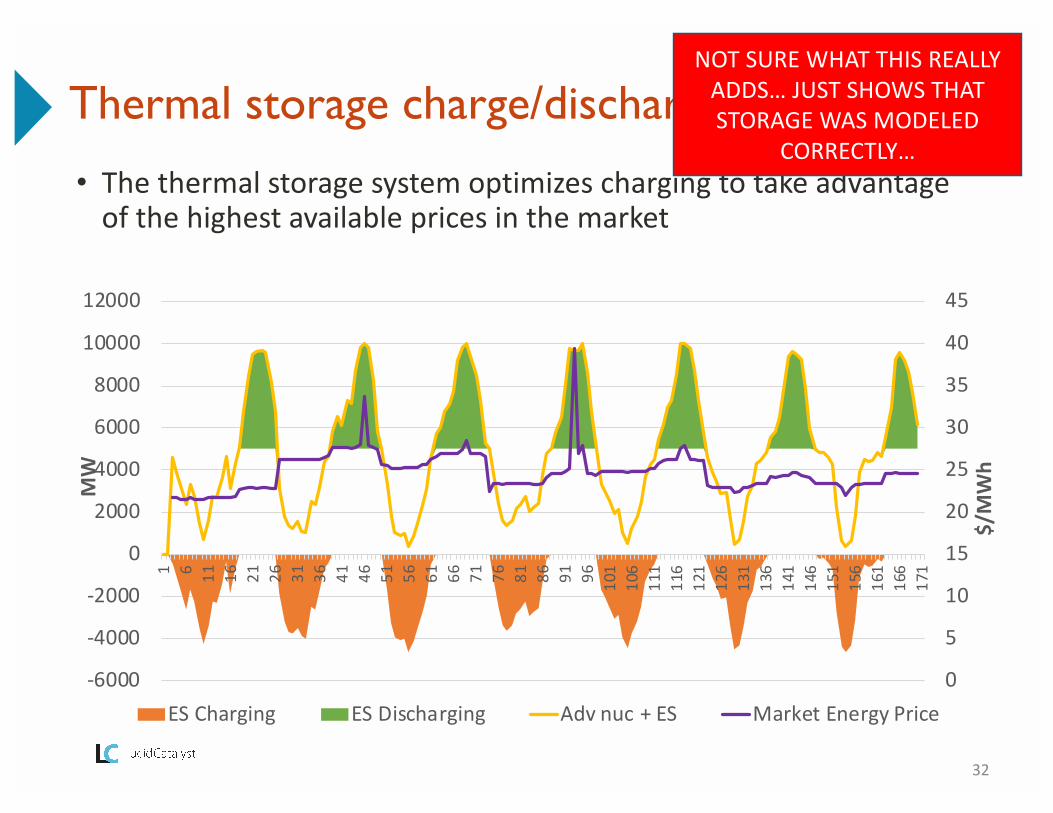
• The thermal storage system optimizes charging to take advantage of the highest available prices in the market
32
Thermal storage charge/discharge cycle
0
5
10
15
20
25
30
35
40
45
-6000
-4000
-2000
0
2000
4000
6000
8000
10000
12000
1 6 11 16 21 26 31 36 41 46 51 56 61 66 71 76 81 86 91 96 101
106
111
116
121
126
131
136
141
146
151
156
161
166
171
$/MWh
MW
ES Charging ES Discharging Adv nuc + ES Market Energy Price
NOT SURE WHAT THIS REALLY ADDS… JUST SHOWS THAT STORAGE WAS MODELED
CORRECTLY…

33
Frequency of Different Discharge Durations
0%2%4%6%8%
10%12%14%16%18%20%
1 2 3 4 5 6 7 8 9 10 11 12
Perc
enta
ge
of D
isch
arg
e E
vent
s
Length of Discharge (Hours)

34
Report Advisors
Advisors Deliverable
Steve Brick Senior Fellow at The Chicago Council on Global Affairs
Jesse Jenkins Assistant Professor, Princeton University
Dave RogersFormer Head of the Energy Practice at Latham & Watkins; Lecturer at Stanford Law School and Graduate School of Business
Charles Forsberg
Principal Research ScientistExecutive Director, MIT Nuclear Fuel Cycle ProjectDirector and PI, Fluoride Salt-Cooled High-Temperature Reactor ProjectUniversity Lead, Idaho National Laboratory Hybrid Energy Systems
Bruce Phillips Director, The NorthBridge Group
David MohlerCEO, Energy Options Network; Former CTO and SVP at Duke Energy; Former Deputy Assistant Secretary, Office of Clean Coal and Carbon Management
Abram KleinManaging Partner at Appian Way Energy Partners; Former Managing Director & Head of Trading, Edison Mission Marketing & Trading

625 Massachusetts Ave. Suite 118Cambridge MA, 02139
USA
[London Office Address]Cambridge MA, 02139
United Kingdom
LUCIDCATALYST