Embed Size (px)
Citation preview

Office of Strategy and Data • 710 James Robertson Parkway • Nashville, TN 37243 Tel: 615-761-6623 • tn.gov/education
2020-21 Accountability Protocol Released Jul. 27, 2021

Page 2 of 71
Table of Contents Section 1: Document Intent and Overview ............................................................................................................................. 7
1.0 Overview of Changes for 2020-21 School Year ............................................................................................................. 7
1.0.1 Defining “Hold Harmless” for 2021 ........................................................................................................................ 7
1.0.1.1 Letter Grades will be Issued for Schools not Held Harmless .......................................................................... 7
1.0.2 Effects of Hold Harmless on Accountability Designations ..................................................................................... 8
Figure 1: Hold Harmless on Accountability Designations ....................................................................................... 8
1.0.2.1 Specific Provisions of Meeting 80% Participation ........................................................................................... 9
Table 1: Districts and Public Charter Schools Meeting 80% Participation Requirement of PC 2 ........................... 9
1.0.3 80% TCAP Participation Hold Harmless Requirement ........................................................................................... 9
1.0.3.1 Tests included in the 80% TCAP Participation Requirement for 2021 .......................................................... 10
Table 2: Tests Included in the 80% Participation Requirement ............................................................................ 10
1.0.3.1.1 Fall EOC Participation Rates ................................................................................................................... 11
1.0.3.2 Students included in the 80% TCAP Participation Requirement .................................................................. 11
1.0.3.3 Schools and Districts included in the 80% TCAP Participation Requirement ............................................... 11
1.0.3.4 Waivers from the 80% TCAP Participation Requirement.............................................................................. 11
1.0.3.5 Participation Rate Calculation ....................................................................................................................... 11
1.0.4 Public Chapter 2 and Priority Exit ........................................................................................................................ 12
1.0.5 Guide to 2021-Specific Changes and Updates ..................................................................................................... 12
1.1 Overview of the School and District Systems ............................................................................................................. 12
1.1.1 School System Overview ...................................................................................................................................... 13
Figure 2. School Accountability Weights ............................................................................................................... 13
1.1.2 District System Overview ..................................................................................................................................... 14
Figure 3. District Accountability Weights .............................................................................................................. 14
1.2 School and District Ratings .......................................................................................................................................... 15
1.2.1 School Letter Grade System Notes ...................................................................................................................... 15
Table 3: School Grading Options for 2020-21 ....................................................................................................... 15
1.2.2 District Designations ............................................................................................................................................ 15
1.2.3 Comparisons of School and District Accountability ............................................................................................. 16
1.2.3.1 Comparison of Indicators .............................................................................................................................. 16
Table 5: Comparison of District and School Accountability Indicators ................................................................. 16
1.2.3.2 Comparison of Student Groups Used in Indicator Calculations .................................................................... 17

Page 3 of 71
Table 6: Comparison of Student Groups Used in Indicator Calculations .............................................................. 17
Section 2: Data Types and Preparations ............................................................................................................................... 18
2.1 Data Types ................................................................................................................................................................... 18
2.1.1 Types of Test Data ................................................................................................................................................ 18
2.1.1.1 Tennessee Comprehensive Assessment Program ........................................................................................ 18
2.1.1.2 TCAP-Alternate Assessment .......................................................................................................................... 19
2.1.1.3 The ACT and SAT ........................................................................................................................................... 19
2.1.1.4 English Language Proficiency Assessment .................................................................................................... 19
2.1.1.5 Early Postsecondary Examination Data ........................................................................................................ 19
2.1.2 Types of Non-Test Data ........................................................................................................................................ 20
2.1.2.1 Absenteeism.................................................................................................................................................. 20
2.1.2.2 Graduation Rates .......................................................................................................................................... 20
2.1.2.3 Early Postsecondary Enrollment Data ........................................................................................................... 20
2.1.2.4 Industry Credential (IC) Data ......................................................................................................................... 20
2.2 Historically Underserved Student Groups .................................................................................................................. 20
2.2.1 Included Student Groups ..................................................................................................................................... 20
Figure 4: Hierarchy for Determining Reported Race/Ethnicity ............................................................................. 21
2.2.2 Super Subgroup .................................................................................................................................................... 22
2.3 Data Definitions .......................................................................................................................................................... 22
2.3.1 Enrolled, Tested, and Valid Tests Definitions ....................................................................................................... 22
2.3.2 Enrollment and Testing Scenarios ........................................................................................................................ 23
2.3.2.1 Assessment Enrollment and Testing Scenarios ............................................................................................. 23
Table 7: Enrollment and Testing Scenarios ........................................................................................................... 24
2.4 Data Preparations ....................................................................................................................................................... 25
2.4.1 Testing Status and Reports of Irregularity (RI) ..................................................................................................... 25
Table 8: Testing Status and Reports of Irregularity .............................................................................................. 25
2.4.1.2 Excluded, Missing, and Duplicated TCAP Data .............................................................................................. 25
2.4.1.3 Student Group Data Corrections ................................................................................................................... 27
Table 9: Modified Testing Subjects for Missing Grades or Below Grade 9 ........................................................... 27
2.4.1.4 Modifying Success Rates via ACT .................................................................................................................. 28
Table 10: ACT to TCAP Performance level Conversion ......................................................................................... 28
2.4.2 TCAP-Alternate Assessment Data Preparations .................................................................................................. 28
2.4.3 ACT and SAT Data Preparations ........................................................................................................................... 29
2.4.3.1 Cohort Data Preparations ............................................................................................................................. 29
Page 4 of 71
2.4.3.2 State Testing Day Data Preparations ............................................................................................................ 29
2.4.4 Ready Graduate Data Preparations ..................................................................................................................... 30
2.4.4.1 Enrollment and Examination Verification ..................................................................................................... 30
Table 11: First School Years of Available EPSO Data Sources ............................................................................... 30
2.4.4.2 Enrollment and Examination Verification ..................................................................................................... 30
2.4.4.3 Specific Exam Requirements ......................................................................................................................... 31
2.4.4.4 Specific Course Enrollment Requirements ................................................................................................... 31
2.4.4.5 Resolving Duplicated Ready Graduate Data ................................................................................................. 31
2.4.5 ELPA Data Preparations ....................................................................................................................................... 32
2.4.6 TVAAS Data Preparations ..................................................................................................................................... 32
2.4.7 Graduation Data Preparations ............................................................................................................................. 32
2.4.8 Attendance Data Preparations ............................................................................................................................. 33
2.4.8.1 Absences ....................................................................................................................................................... 33
2.4.8.2 Instructional Days ......................................................................................................................................... 33
2.4.9 School Directory Data Preparations ..................................................................................................................... 33
Section 3: Calculation Procedures ........................................................................................................................................ 35
3.1 Participation Rates ...................................................................................................................................................... 35
3.2 Performance Level Percentages.................................................................................................................................. 35
3.3 One-Year and Three-Year Success Rates .................................................................................................................... 36
Table 12: Subjects Included in Success Rates ....................................................................................................... 36
3.4 Graduation Rates ........................................................................................................................................................ 37
3.5 Ready Graduate Indicator ........................................................................................................................................... 37
3.6 Chronically Out of School ............................................................................................................................................ 37
3.7 Annual Measurable Objective (AMO) Targets ............................................................................................................ 38
Table 13: 2020-21 “Prior year” performance data used to establish AMOs by indicator .................................... 38
Table 14: AMOs Available by Indicator ................................................................................................................. 38
3.8 Confidence Intervals ................................................................................................................................................... 39
3.9 Rounding Procedures .................................................................................................................................................. 40
Section 4: School Accountability ........................................................................................................................................... 41
4.1 Background and Designations ..................................................................................................................................... 41
4.2 School Pools and Eligibility .......................................................................................................................................... 41
4.3 Student Groups and Pathways .................................................................................................................................... 42
Table 15: Indicator Averages................................................................................................................................. 42
4.4 Indicators and Weighting ............................................................................................................................................ 43
Page 5 of 71
Table 16: Indicators and Weighting ...................................................................................................................... 43
4.4.1 Achievement ........................................................................................................................................................ 44
Table 17: Achievement Score Calculations ........................................................................................................... 44
4.4.2 Growth ................................................................................................................................................................. 45
Table 18: Growth Score Calculations .................................................................................................................... 45
4.4.3 Chronically Out of School ..................................................................................................................................... 45
Table 19: Chronic Absenteeism Calculations ........................................................................................................ 45
4.4.4 Graduation Rate ................................................................................................................................................... 46
Table 20: Graduation Rate Calculations ................................................................................................................ 46
4.4.5 Ready Graduate ................................................................................................................................................... 46
Table 21: Ready Graduate Calculation .................................................................................................................. 47
4.4.6 English Language Proficiency Assessment ........................................................................................................... 47
Table 22: ELPA Growth Standards ........................................................................................................................ 47
Figure 5: WIDA Growth Standard Example ........................................................................................................... 48
Table 23: Percent of Students Meeting Growth Standards .................................................................................. 49
4.5 Priority School Identification....................................................................................................................................... 49
4.5.1 Priority Exit Criteria .............................................................................................................................................. 51
4.6 Focus School Identification ......................................................................................................................................... 51
4.6.1 Targeted Support and Improvement ................................................................................................................... 52
4.6.2 Additional Targeted Support and Improvement .................................................................................................. 52
4.6.3 Focus Exit Criteria ................................................................................................................................................. 53
4.7 Reward School Identification ...................................................................................................................................... 53
Section 5: District Accountability .......................................................................................................................................... 54
5.1 Indicators and Designations ........................................................................................................................................ 54
5.2 Historically Underserved Student Groups and Minimum Required Counts ............................................................... 54
5.3 Indicators and Calculation Procedures ....................................................................................................................... 55
5.3.1 Calculation Procedures ........................................................................................................................................ 55
Table 24: District Performance Goals and Definitions .......................................................................................... 56
5.3.1.1 Step 1: All Students Status ............................................................................................................................ 56
Table 25: All Student Status Calculation ............................................................................................................... 56
5.3.1.2 Step 2: Student Group Average .................................................................................................................... 57
Table 26: Student Group Average Calculation ...................................................................................................... 57
5.3.1.3 Step 3: Student Group Status........................................................................................................................ 57
Table 27: Student Group Status Calculation ......................................................................................................... 57

Page 6 of 71
5.3.1.4 Step 4: Final District Determination .............................................................................................................. 57
Table 28: Final District Determination Calculation ............................................................................................... 57
5.3.2 Grade Band Success Rate Indicators .................................................................................................................... 58
Table 29: Grade Band Success Rate Calculation ................................................................................................... 58
5.3.3 Chronically Out of School Indicator ..................................................................................................................... 59
Table 30: Chronically out of School Indicator Calculation .................................................................................... 59
5.3.4 Graduation Rate Indicator ................................................................................................................................... 59
Table 31: Graduation Rate Indicator Calculation .................................................................................................. 60
5.3.5 English Language Proficiency Assessment Indicator ............................................................................................ 61
Table 32: English Language Proficiency Assessment Indicator Calculation .......................................................... 61
Section 6: Files Delivered to Districts .................................................................................................................................... 62
6.1 Assessment Data Files ................................................................................................................................................. 63
6.2 Accountability Files ..................................................................................................................................................... 63
6.3 Final Determination Heat Map Files ........................................................................................................................... 63
6.4 Student-Level Achievement Files ................................................................................................................................ 64
6.5 English Language Proficiency Assessment Files .......................................................................................................... 64
6.6 TVAAS Files .................................................................................................................................................................. 64
6.7 Ready Graduate Files .................................................................................................................................................. 64
6.8 AMO Files .................................................................................................................................................................... 64
6.9 Chronically Out of School Files .................................................................................................................................... 64
Appendix A: List of Acronyms .............................................................................................................................................. 65
Appendix B: Data Sources .................................................................................................................................................... 66
Appendix C: Accountability Files Purpose and Structure ...................................................................................................... 68
Appendix D: Confidence Interval Calculations ...................................................................................................................... 70
Appendix E: Percentile Rank Calculations ............................................................................................................................. 71
E.1: Rankings ..................................................................................................................................................................... 71
E.2: Student Rankings ....................................................................................................................................................... 71

Page 7 of 71
Section 1: Document Intent and Overview The 2020-21 Accountability Protocol is the technical manual that outlines how the Tennessee Department of Education (the department) and State Board of Education (SBOE) will fulfill the federal and state requirements to meaningfully differentiate schools and districts based on student outcomes from the 2020-21 school year. Appendix A includes a table of terms and acronyms found throughout this document. The release of this protocol was much later than the department had prepared for, as any changes to our system needed to be approved by the United States Department of Education (US DOE). US DOE approved Tennessee’s Addendum to the ESSA Consolidated State Plan due to COVID 19 National Emergency in June 2021.
1.0 Overview of Changes for 2020-21 School Year For consistency, the accountability system and accompanying manual are similar to past protocols. Updates were made to reflect changes from Public Chapter 2 of the First Extraordinary Session of the 112th General Assembly, or PC 2, which amended laws regarding school and district accountability which offer the opportunity to remove negative consequences associated with accountability this year.
1.0.1 Defining “Hold Harmless” for 2021 While PC 2 does not use the phrase “hold harmless,” this protocol will refer to schools and districts being “held harmless” from the accountability provisions specified in PC 2 when they meet the Tennessee Comprehensive Assessment Program (TCAP) “eighty-percent-participation requirement” detailed in PC 2. “Held harmless” refers to schools and school districts for whom the data from the 2020-21 school year cannot be used to assign letter grades or any other summative ratings in the 2021 state report card, to identify a school as a priority school, nor to assign a school to the Achievement School District (ASD). The purpose of the 80% participation requirement is to prioritize measuring where students are after two unusual school years; maintaining the same calculation, which includes each of a student’s tests, aligns to that purpose.
1.0.1.1 Letter Grades will be Issued for Schools not Held Harmless The department planned to provide letter grades for schools in 2017 after the submission of the state’s approved ESSA Plan. Since then, specific laws and contexts created statewide exceptions for letter grade dissemination. The laws and contexts that allowed for statewide exceptions to letter grade dissemination in 2018, 2019, and 2020 are no longer applicable to schools this year and are not included as part of PC 2. Letter grades will be issued in the manner they were originally intended under the submission of the state’s approved ESSA plan for any school who is not held harmless. Similarly, district designations will be issued for districts not held harmless.

Page 8 of 71
1.0.2 Effects of Hold Harmless on Accountability Designations PC 2 does not change any part of the accountability system. It acts a gate which determines if the accountability system will produce ratings for a school or local education agency (LEA), as modeled in the chart below. Figure 1: Hold Harmless on Accountability Designations
Page 9 of 71
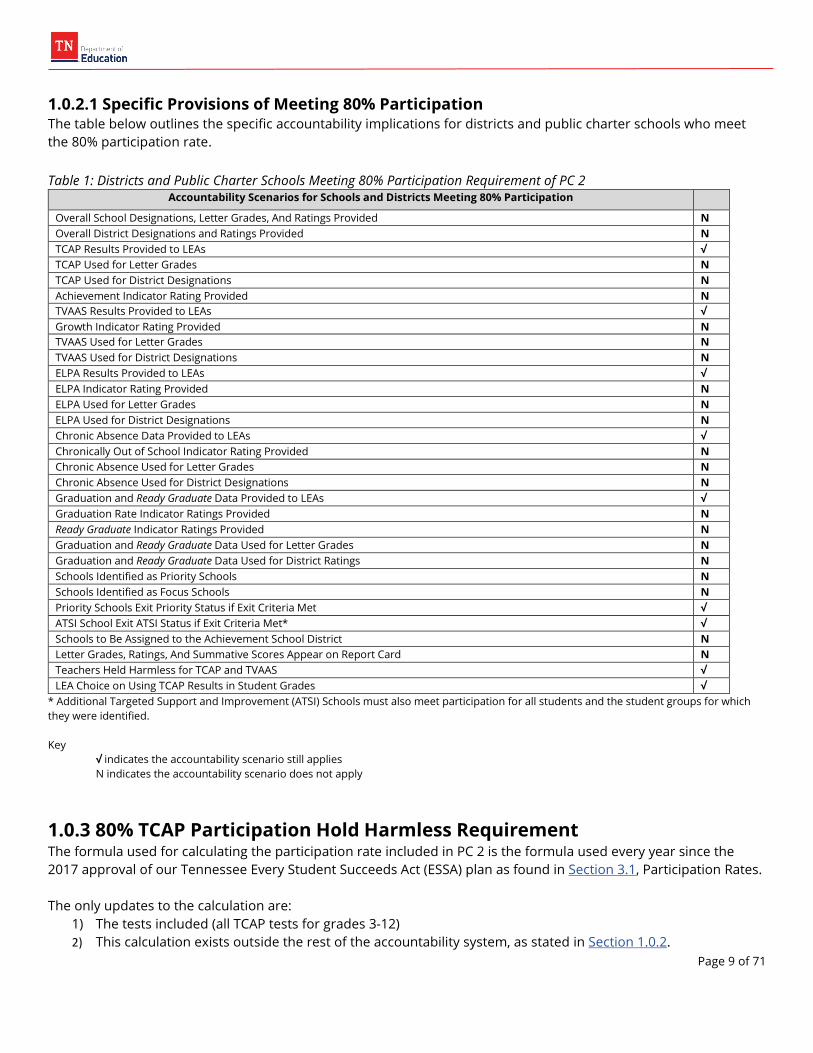
1.0.2.1 Specific Provisions of Meeting 80% Participation The table below outlines the specific accountability implications for districts and public charter schools who meet the 80% participation rate. Table 1: Districts and Public Charter Schools Meeting 80% Participation Requirement of PC 2
Accountability Scenarios for Schools and Districts Meeting 80% Participation
Overall School Designations, Letter Grades, And Ratings Provided N Overall District Designations and Ratings Provided N TCAP Results Provided to LEAs √ TCAP Used for Letter Grades N TCAP Used for District Designations N Achievement Indicator Rating Provided N TVAAS Results Provided to LEAs √ Growth Indicator Rating Provided N TVAAS Used for Letter Grades N TVAAS Used for District Designations N ELPA Results Provided to LEAs √ ELPA Indicator Rating Provided N ELPA Used for Letter Grades N ELPA Used for District Designations N Chronic Absence Data Provided to LEAs √ Chronically Out of School Indicator Rating Provided N Chronic Absence Used for Letter Grades N Chronic Absence Used for District Designations N Graduation and Ready Graduate Data Provided to LEAs √ Graduation Rate Indicator Ratings Provided N Ready Graduate Indicator Ratings Provided N Graduation and Ready Graduate Data Used for Letter Grades N Graduation and Ready Graduate Data Used for District Ratings N Schools Identified as Priority Schools N Schools Identified as Focus Schools N Priority Schools Exit Priority Status if Exit Criteria Met √ ATSI School Exit ATSI Status if Exit Criteria Met* √ Schools to Be Assigned to the Achievement School District N Letter Grades, Ratings, And Summative Scores Appear on Report Card N Teachers Held Harmless for TCAP and TVAAS √ LEA Choice on Using TCAP Results in Student Grades √
* Additional Targeted Support and Improvement (ATSI) Schools must also meet participation for all students and the student groups for which they were identified. Key
√ indicates the accountability scenario still applies N indicates the accountability scenario does not apply
1.0.3 80% TCAP Participation Hold Harmless Requirement The formula used for calculating the participation rate included in PC 2 is the formula used every year since the 2017 approval of our Tennessee Every Student Succeeds Act (ESSA) plan as found in Section 3.1, Participation Rates. The only updates to the calculation are:
1) The tests included (all TCAP tests for grades 3-12) 2) This calculation exists outside the rest of the accountability system, as stated in Section 1.0.2.

Page 10 of 71
Individual student group participation rates will not be used with the TCAP 80% participation requirement, unless required for ATSI exit. WIDA ACCESS tests, which are used for assessing English language proficient for English Learners (ELs), for students enrolled in grades 3-12 will be included with the rest of the TCAP tests to arrive at an overall participation rate. Under Tennessee’s ESSA plan and in subsequent sections of this protocol, WIDA assessments and their calculations are found separate from the rest of the TCAP tests. For the purposes of determining the eligibility for the participation rate requirement, all TCAP tests will be included together to generate an overall participation rate. The participation rate of this section will be reported publicly.
1.0.3.1 Tests included in the 80% TCAP Participation Requirement for 2021 The table below lists the tests that will be used in the 80% participation rate calculation. Table 2: Tests Included in the 80% Participation Requirement
Key √ indicates this test will be counted toward the 80% participation rate N indicates this test will not be counted toward the 80% participation rate
Tests included in the 80% Participation Requirement TCAP ELA (ENGLISH LANGUAGE ARTS) GRADES 3-8 √ TCAP MATH GRADES 3-8 √ TCAP SCIENCE GRADES 3-8 √ TCAP SOCIAL STUDIES GRADES 6-8 √ TCAP ELA EOC √ TCAP MATH EOC √ TCAP SCIENCE EOC √ TCAP SOCIAL STUDIES EOC √ TCAP ALT SCIENCE GRADES 3-8 AND EOC √ TCAP ALT SOCIAL STUDIES GRADES 6-8 √ MSAA MATH √ MSAA ELA √ WIDA ACCESS GRADES 3-12 √ WIDA ACCESS ALT GRADES 3-12 √ WIDA ACCESS GRADES K-2 N WIDA ACCESS ALT GRADES K-2 N ACT N SAT (SCHOLASTIC APTITUDE TEST) N NAEP (NATIONAL ASSESSMENT OF EDUCATIONAL PROGRESS) N SDC (STATEWIDE DUAL CREDIT) N AP (ADVANCED PLACEMENT) N IB (INTERNATIONAL BACCALAUREATE) N
CLEP (COLLEGE LEVEL EXAMINATION PROGRAM) N CIE (CAMBRIDGE INTERNATIONAL EXAMINATIONS) N TCAP GRADE 2 ELA N TCAP GRADE 2 MATH N TCAP ALT GRADE 2 ELA N TCAP ALT GRADE 2 MATH N

Page 11 of 71
1.0.3.1.1 Fall EOC Participation Rates Fall EOC assessments administered in December 2020 and January 2021 will be included in the overall TCAP participation rate to be held harmless. However, schools or districts whose participation rates meet the 80% participation with spring-only may use that as justification if requesting a waiver from the commissioner.
1.0.3.2 Students included in the 80% TCAP Participation Requirement As with participation rate calculations in previous years, for the 80% participation hold harmless requirement, each student record will be included. If a student has multiple enrollment records corresponding to multiple TCAP assessments, each of those enrollments would be included for that student. For all schools and districts (except ATSI schools), there will be only one calculation using all students; individual student group participation rates will not be used with the 80% participation requirement, unless required for ATSI exit.
1.0.3.3 Schools and Districts included in the 80% TCAP Participation Requirement All schools and districts with students participating in the TCAP assessments administered in the Spring of 2021 are included. As illustrated in Section 1.0.2 , the TCAP participation rate of a public charter school will be included in the participation rate of their authorizing district. However, public charter schools with TCAP participation rates greater than 80% can qualify independently for provisions offered to districts. Traditional public schools are only held harmless if their district is held harmless, per PC 2. However, the 80% TCAP participation requirement will be calculated for all schools and their groups of students for guiding accountability calculations.
1.0.3.4 Waivers from the 80% TCAP Participation Requirement Districts and public charter schools that do not meet the 80% participation requirement had the option of applying for a commissioner waiver of this requirement in order to be held harmless. Waiver information can be found on the department’s Special Session webpage. The process for such waivers is separate from the Accountability Protocol, and, per state law, all waivers are approved by the commissioner. Rationale and evidence was required upon submission of a participation waiver. In addition to the additional evidence noted above, all waiver requests must be accompanied by substantive evidence of (1) meaningful engagement with families, (2) clear effort (with multiple attempts) to provide a testing opportunity for students, and (3) strong communication that reflects significant flexibility afforded to the student for testing times and locations.
1.0.3.5 Participation Rate Calculation The formula used for calculating the participation rate included in PC 2 will be the formula used every year since the 2017 approval of our Tennessee ESSA plan. It compares the counts of tested student records to enrollment records, as found below: • Tested counts include the number of tested records. • Enrolled counts include the number of tested and non-tested records.
This formula is used every time participation rates are calculated in the accountability model, and the tests and students included change each time it is used. For the 80% participation requirement, all student records for all TCAP tests will be included.

Page 12 of 71
1.0.4 Public Chapter 2 and Priority Exit PC 2 also allows for schools currently identified as Priority, Comprehensive Support and Improvement (CSI), or Additional Targeted Support and Improvement to have the designation removed upon meeting priority exit criteria if they meet the 80% TCAP participation requirements. To exit Priority/CSI status, a school must satisfy the Priority exit criteria and requirements to be held harmless. More information on Priority school exit can be found in Section 4.5.1 of this document. ATSI is another federal designation which differs from CSI schools in that the ATSI designation is tied to specific groups of students. For a school to exit ATSI status, it must satisfy the exit criteria in the state’s approved ESSA plan and 80% participation requirements for the school and for each group of students identified for the ATSI designation. More information on ATSI exit can be found in Section 4.6.3.
1.0.5 Guide to 2021-Specific Changes and Updates Since this protocol is similar to prior years, any sections with updates reflective of 2020-21 changes will have callout boxes like the one to the right or flags like the one below.
Hold Harmless Flag: In this document, sections where hold harmless will be applicable and instances that will be impacted by this new hold harmless law will be bolded in boxes like this for ease of use and visibility.
1.1 Overview of the School and District Systems The department makes accountability determinations both at the school and district levels. The two frameworks are outlined and described in this and subsequent sections. All accountability files and procedures go through an appeals process. For details regarding the appeals timelines, requirements, and outcomes, reference appeals guidance via the Tennessee Department of Education website. Direct any questions to [email protected]. The Tennessee school and district accountability systems include multiple indicators reflecting both student performance and improvement while evaluating both all students and historically underserved student populations as required in ESSA and approved by the US DOE. The graphics in Figure 2 highlight the indicators for each system and their corresponding weights. Specific definitions and business rules are outlined in subsequent sections.
Notes Specific to 2021 Accountability
Throughout this accountability protocol, callout boxes such as this will highlight clarifications and commentary specific for the 2021 school year.

Page 13 of 71
Hold Harmless 2021: The accountability systems for schools summarized in this section will not apply to schools and districts that meet the 80% TCAP participation requirement this year.
1.1.1 School System Overview School accountability consists of the following in Figure 21: Figure 2. School Accountability Weights
1 Schools not meeting minimum number counts will have indicator weights redistributed proportionally to the Achievement and Growth indicators.

Page 14 of 71
1.1.2 District System Overview
Hold Harmless 2021: The accountability systems for districts summarized in this section will not apply to districts that meet the 80% TCAP participation requirement this year.
District accountability evaluates six indicators weighted equally2 and averaged together through multiple pathways (see Figure 3). Details describing the calculation procedures and applied business rules can be found in Section 5. Figure 3. District Accountability Weights
2 Districts that do not meet minimum number counts will not be evaluated for those specific indicators. Indicator weights will be redistributed equally across all remaining indicators.

Page 15 of 71
1.2 School and District Ratings
Hold Harmless 2021: The letter grades and ratings for districts and schools summarized in this section will not apply to schools and districts that are held harmless this year.
1.2.1 School Letter Grade System Notes Schools receive an overall A-F rating, as well as an A-F rating for each indicator. Schools eligible for accountability will receive an A-D rating that represents their final average of each appropriately weighted indicator and student group. Schools receiving a rating of F are schools that were identified as Priority schools and have not met the Priority Exit Criteria outlined in Section 4.5.1. Additionally, all schools meeting number counts as described below and having an instructional status other than Alternative, Adult or Career and Technical Education (CTE) are eligible for accountability3. The following table outlines school grading options for 2020-21. Table 3: School Grading Options for 2020-21
A-D Rating F Rating Not Rated (2021) • Schools meet number counts (e.g.,
TCAP n=30; ELPA n=10) • Meet school type requirements (e.g.,
not private schools) • Eligible to be named Reward school or
Focus school • Eligible for federal designation of TSI
and ATSI
• Identified as Priority in 2018 • Have not exited Priority status since
identified as such • Identified every three years* • Beginning in 2022, CSI and Priority
statuses will be equivalent. *Because of accountability waivers and COVID-19 school closures, these will be identified in 2022, not 2021.
• Eligible to be named Reward school or Focus school
• Eligible to exit Priority Status •
1.2.2 District Designations Districts can be designated as one of the following:
• Exemplary • Advancing • Satisfactory • Marginal • In Need of Improvement
Districts identified as In Need of Improvement are those with a final score in the bottom five percent of districts statewide, even if their accountability score qualifies them for another named designation. For more details about district accountability, see Section 5. Additionally, districts will be evaluated on the indicators for which they meet requirements. Therefore, each indicator is equally weighted and calculation procedures reflect an average of indicators.
3 Schools must have both current and previous year data to determine pathways. For more information, see Section 4 .

Page 16 of 71
1.2.3 Comparisons of School and District Accountability 1.2.3.1 Comparison of Indicators The comparison below highlights the differences between the accountability indicators for the district and school systems. Table 5: Comparison of District and School Accountability Indicators
Indicators (for both districts and schools) Schools Districts
Achievement (all qualifying grades): “On track” or “Mastered” rates Best of
Achievement (grades 3-5): “On track” or “Mastered” rates Best of
Achievement (grades 6-8): “On track” or “Mastered” rates Best of
Achievement (grades 9-12): “On track” or “Mastered” rates Best of
Growth (all qualifying grades): TVAAS score Abs
Growth (grades 3-5): TVAAS score Abs
Growth (grades 6-8): TVAAS score Abs
Growth (grades 9-12): TVAAS score Abs
Chronic Absenteeism Rate Best of Best of
Reduction of Chronic Absenteeism Rate (previously chronically absent students) Rel
ELPA: % of ELs meeting growth targets on WIDA ACCESS Abs Best of
Annual improvement in transitional EL proficiency on TCAP ELA Rel
Graduation Rate (high school only) Best of Best of
Ready Graduate Rate (high school only) Best of
Annual change in Ready Graduate Rate Rel
Standard Used to Measure Success on Each Indicator
• Abs: Comparison to a rubric • AMO: Comparison to prior year
• Rel: Relative comparison to other schools/districts • Best of: Best of either Abs or AMO
Page 17 of 71
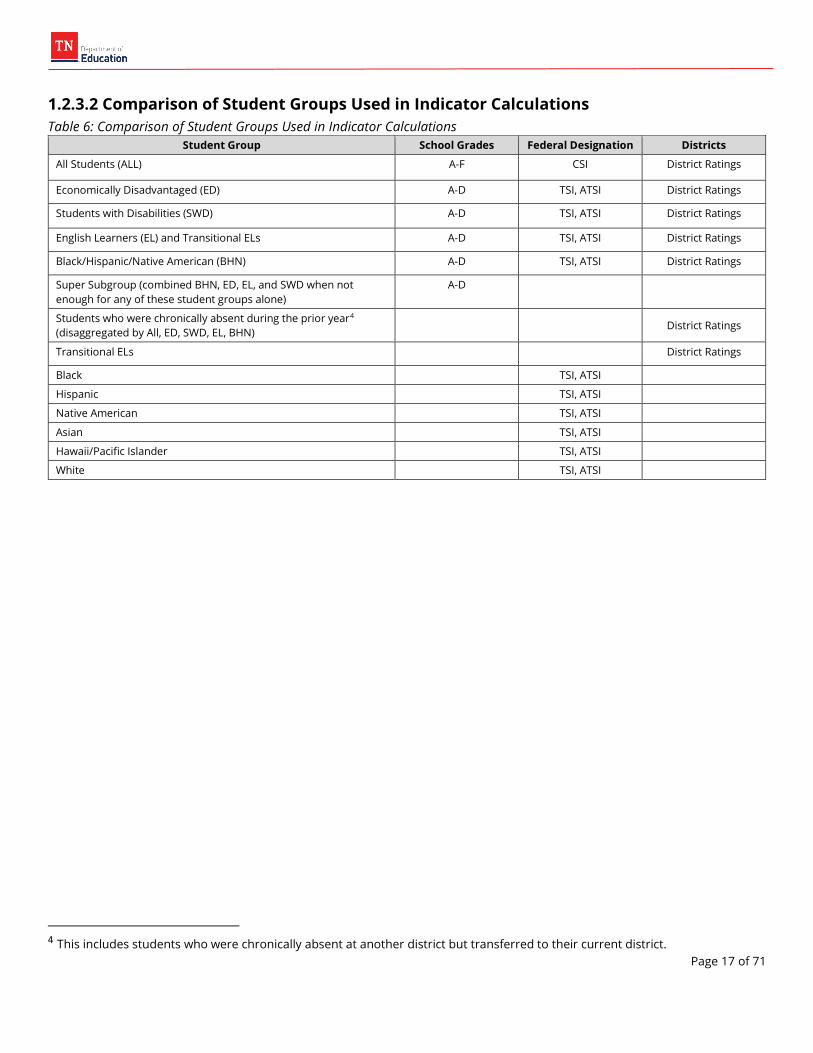
1.2.3.2 Comparison of Student Groups Used in Indicator Calculations Table 6: Comparison of Student Groups Used in Indicator Calculations
Student Group School Grades Federal Designation Districts
All Students (ALL) A-F CSI District Ratings
Economically Disadvantaged (ED) A-D TSI, ATSI District Ratings
Students with Disabilities (SWD) A-D TSI, ATSI District Ratings
English Learners (EL) and Transitional ELs A-D TSI, ATSI District Ratings
Black/Hispanic/Native American (BHN) A-D TSI, ATSI District Ratings
Super Subgroup (combined BHN, ED, EL, and SWD when not enough for any of these student groups alone)
A-D
Students who were chronically absent during the prior year4 (disaggregated by All, ED, SWD, EL, BHN)
District Ratings
Transitional ELs District Ratings
Black TSI, ATSI
Hispanic TSI, ATSI
Native American TSI, ATSI
Asian TSI, ATSI
Hawaii/Pacific Islander TSI, ATSI
White TSI, ATSI
4 This includes students who were chronically absent at another district but transferred to their current district.

Page 18 of 71
Section 2: Data Types and Preparations 2.1 Data Types 2.1.1 Types of Test Data 2.1.1.1 Tennessee Comprehensive Assessment Program The Tennessee Comprehensive Assessment Program (TCAP) is the umbrella program of state assessments required by federal law, state statute, or state board rule which are administered by the state. These include students in grades 3-8 and for students enrolled in end-of-course (EOC) tested subjects. The TCAP Alternate Assessments are designed for students with significant cognitive disabilities. For the subjects of math and ELA, the corresponding Multi-State Alternate Assessment (MSAA) exam is used as the TCAP Alternate Assessments. Students in grades 3-8 take the TCAP achievement tests each spring.
• TCAP records in grades 3-8 with subjects of math and ELA are included in performance calculations. Science and Social Studies are included in participation for the 2021
• If a student takes both TCAP grade-level exams and EOC exams for the same subject, the TCAP grade-level record is dropped from accountability calculations and replaced with the EOC record. Consult Section 2.4.1 for more detailed information on data preparations.
EOC testing records include students in grades 6-12 who test in any of the following subjects during either the fall or spring test administration:
• Algebra I • Algebra II • Geometry • Integrated Math I • Integrated Math II • Integrated Math III • English I • English II
Middle school students who take an EOC exam in the courses below are included in the middle school counts that correspond to that subject:
• Middle school Algebra I, Algebra II, Geometry, Integrated Math I, Integrated Math II, and Integrated Math III records count as Math for accountability calculations.5
• Middle school English I and English II records count as ELA for accountability calculations.
5 Success rates are defined as the total number of valid tests with a performance level of on track or mastered out of the total number of valid tests for the subjects in a given grade band. Consult Section 3.3 for more information.
Using Previous Years’ Data
In most years, we have used the previous year’s data as well as the current year’s data to calculate certain measures (e.g. in 2019, we used 2018’s data as well for one and three-year success rates). This year, since we do not have assessment data from the 2019-20 school year, we will be using 2020-21 assessment data with the “previous year” referring to 2018-19 assessment data.
Page 19 of 71
2.1.1.2 TCAP-Alternate Assessment The TCAP-Alternate Assessment is designed for students with significant cognitive disabilities and is based on alternative content standards. A student’s participation in the alternate assessment is based on the decision of his or her Individualized Education Plan (IEP) team and must be documented in the IEP.
• Students who take TCAP-Alternate Assessments are included in accountability calculations. • All students who take TCAP-Alternate Assessments are considered
students with disabilities. • TCAP-Alternate Assessment math records in grades 9 or above are
included as Algebra I or Integrated Math I records, depending on the district’s curriculum sequence (i.e., whether the district has more Algebra or Integrated Math records).
• TCAP-Alternate Assessment ELA records in grades 9 or above are included as English II records.
2.1.1.3 The ACT and SAT ACT and SAT results offer students information about their preparation for postsecondary opportunities and the workforce through an assessment of career and college readiness. These data are used in the Ready Graduate indicator. For ACT and SAT composite scores, a student’s highest score from a single administration will be used.6 The department does not use “super scores.” ACT and SAT data lag by one year (i.e., 2021 accountability determinations use ACT or SAT data for the graduating class of 2020).7 Also note that SAT scores earned on national administrations will not automatically be included in accountability unless the student has also taken the SAT on an in-school administration. Scores for national administrations of the SAT and ACT that are not automatically included are eligible for inclusion by appeal.8
2.1.1.4 English Language Proficiency Assessment All English learners take the WIDA ACCESS 2.0 exam, which assesses student progress toward English proficiency. Students with significant cognitive disabilities take the WIDA Alternate ACCESS.9
2.1.1.5 Early Postsecondary Examination Data Early postsecondary examination data assesses student performance on college-level coursework and/or career readiness. These data are lagged by one year (i.e., 2021 accountability will reflect data for students who graduated in the 2020 cohort).
6 A student’s highest ACT composite score includes all records in the three years including and up to June of the student’s self-reported graduation year. 7 For the subject replacement, as detailed in Section 2.4.1.4, current year ACT or SAT testing data will be used from the state testing day. 8 More information regarding ACT appeals can be accessed through the Accountability application. 9 Previously, the department did not include WIDA Alternative ACCESS data because of small numbers of students and the resulting difficulty of computing expected growth.
ACT/SAT Participation
ACT student participation is not included in the 80% TCAP participation calculation to be held harmless. ACT participation will only be used for accountability purposes pursuant to standard practice with Tennessee’s ESSA plan if a school district or public charter school is not held harmless.

Page 20 of 71
2.1.2 Types of Non-Test Data 2.1.2.1 Absenteeism Absenteeism data come from extract 049 in the Education Information System (EIS). Students with primary enrollments in grades K-12 and attendance codes of A, U, X, or T are considered absent for accountability purposes. Consult the EIS Extract Layouts and Appendix F of the EIS Appendices for more information regarding attendance codes. These data are pulled from EIS at the completion of the school year.
2.1.2.2 Graduation Rates Final graduation rate data come from the state’s graduation cohort application. Students count in the cohort based on the first year in which they enrolled in grade 9. Students count as graduates if they are included in the cohort and earn an on-time regular diploma.10 The data from the cohort application reflect EIS data with school and district edits that the department approves. For more information, consult the 2021 Graduation Cohort Protocol. Graduation data also lag by one year (i.e., 2021 accountability will reflect data for the cohort of students who were expected to graduate in 2020).
2.1.2.3 Early Postsecondary Enrollment Data Early postsecondary course enrollment information comes from the course codes and flags submitted to EIS via extract 030. AP, CIE, DE, and IB courses are all denoted with specific course codes. SDC courses must be indicated with both the appropriate course code and course flag. Local Dual Credit (LDC) courses are denoted with the course flag only. Courses marked with the LDC flag that have a course code that corresponds to another early postsecondary opportunity (EPSO) course type (e.g., an AP course marked with the LDC flag) will be considered as the EPSO type that corresponds to the course code rather than the LDC flag.
2.1.2.4 Industry Credential (IC) Data Only industry credentials that are on the department’s promoted list as of students’ cohort graduation year are considered for the Ready Graduate indicator. Students must obtain the industry credential (either by earning the required exam score or by completing the licensure requirements) for the credential to count toward the Ready Graduate indicator. Industry credentials that have expired will count toward students’ total number of EPSOs completed.
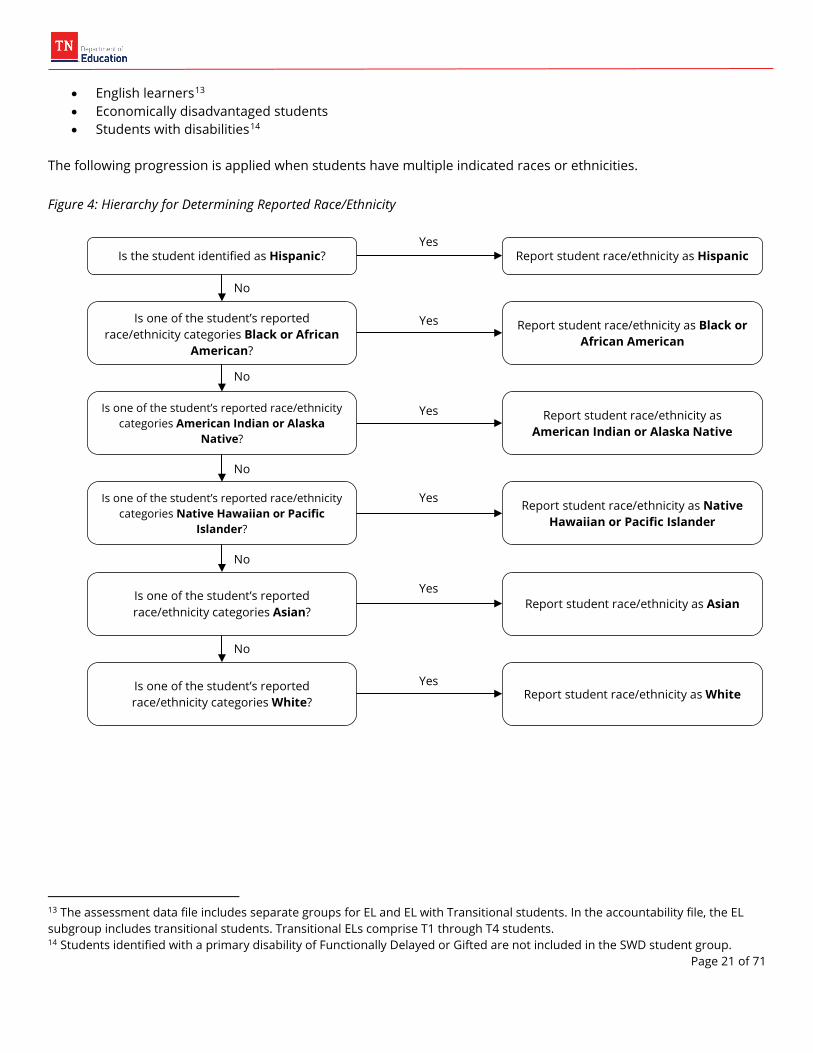
2.2 Historically Underserved Student Groups 2.2.1 Included Student Groups All students are included in the All Students group. Students are assigned11 to the following historically underserved student groups12 as applicable:
• Black, Hispanic, and Native American students
10 The department considers graduates “on-time” if they earn regular diplomas within four years plus a summer after first entering grade 9. 11 This document will use the terms “historically underserved student groups” and “student groups” interchangeably. 12 Students with a test record but no corresponding demographic information in EIS will count in the All Students group but not in any historically underserved student group.
Page 21 of 71
• English learners13 • Economically disadvantaged students • Students with disabilities14
The following progression is applied when students have multiple indicated races or ethnicities. Figure 4: Hierarchy for Determining Reported Race/Ethnicity
13 The assessment data file includes separate groups for EL and EL with Transitional students. In the accountability file, the EL subgroup includes transitional students. Transitional ELs comprise T1 through T4 students. 14 Students identified with a primary disability of Functionally Delayed or Gifted are not included in the SWD student group.
Is one of the student’s reported race/ethnicity categories White?
Report student race/ethnicity as White
Is the student identified as Hispanic? Report student race/ethnicity as Hispanic Yes
Is one of the student’s reported race/ethnicity categories Black or African
American?
Is one of the student’s reported race/ethnicity categories American Indian or Alaska
Native?
Is one of the student’s report
No
ed race/ethnicity categories Native Hawaiian or Pacific
Islander?
Is one of the student’s reported race/ethnicity categories Asian?
No
No
No
No
Report student race/ethnicity as Black or African American
Report student race/ethnicity as American Indian or Alaska Native
Report student race/ethnicity as Native Hawaiian or Pacific Islander
Report student race/ethnicity as Asian
Yes
Yes
Yes
Yes
Yes

Page 22 of 71
2.2.2 Super Subgroup The Super Subgroup15 consists of all students identified with one or more of the historically underserved student groups mentioned in Section 2.2, counting each student only once regardless of how many student groups they identify with. For example, a student who is classified both as EL and as SWD counts once in the Super Subgroup. The same would be true of a student identified with only one of the historically underserved student groups, as in the case of student whose race/ethnicity is listed as Black, Hispanic, or Native American.
2.3 Data Definitions 2.3.1 Enrolled, Tested, and Valid Tests Definitions Counts of enrolled and tested students are primarily used for determining eligibility and participation rates.16
• Enrolled counts include the number of tested and non-tested records. • Tested counts include the number of tested records. • Valid test counts include tested records with a valid performance level.17
All counts are calculated after excluded and duplicated records have been resolved. See Section 2.4.1.2 for more details. Records that are marked as enrolled but not tested18 will still count against participation rates. That is, these records will be reflected in the data as follows:
• For calculating the percent of students tested: o The record will count in the numerator (number tested) as a 0, and o The record will count in the denominator (number of enrolled students) as a 1.
• For calculating the percent of students scoring on track or mastered: o The record will not be included and will not change performance level calculations.
Records that are marked as enrolled and tested but do not have a performance level will be reflected in the data as follows:
• For calculating the percent of students tested: o The record will count in the numerator (number tested) as a 1, and o The record will count in the denominator (number of enrolled students) as a 1.
• For calculating the percent of students scoring on track or mastered: o The record will not be included and will not change performance level calculations.
15 Super Subgroup is used for school accountability calculations only. 16See Section 3.1 for more information regarding participation rates. 17 Valid ACT or SAT tests are those taken with no accommodations or approved ACT accommodations that produce a valid, college-reportable composite score. For the purposes of the Ready Graduate indicator, the department will use the number of students included in the cohort to determine eligibility. The chronically out of school indicator will consider the number of students enrolled for 50 percent of the year or more to determine eligibility. 18 Examples of when this situation might arise are detailed in the testing flag hierarchy in Section 2.4.4.1.

Page 23 of 71
2.3.2 Enrollment and Testing Scenarios 2.3.2.1 Assessment Enrollment and Testing Scenarios Student assessment participation rates include those who are expected to test at a school or district during the testing window. For achievement and growth metrics, student test records are included for the school or district in which they were enrolled for at least 50% of the instructional days. The calculation for 50 percent enrollment is measured by the number of days a student has been enrolled out of the total number of instructional days. The total number of days in the school year is pulled from EIS on the final day of the testing window. This pull applies to all assessment data, including demographic data.19 Any student who is not enrolled in a school or district for at least 50 percent of the instructional days will not count in success rate calculations but will count toward participation rates.20
Students who were enrolled less than 50 percent of the year in the school or district in which they tested and were enrolled at least 50 percent in another Tennessee school or district will have their test score reassigned for success rate calculations to the school and/or district in which they were enrolled for at least 50 percent of the year21. The department will use enrollment to reassign scores in this instance. The following table details how records are included in calculations for test participation rates and school-, district-, and state-level accountability determinations.
19 Demographic data that are incorrect as of the end of the testing window will remain incorrect in the final accountability data. Students whose demographic data differ across multiple school enrollments (e.g., a student is marked as homeless in one school/district but not another, will take the demographic data of the enrollment that matches the school and district in which they tested. 20 Students who are enrolled for less than 50 percent of the year will count toward state-level accountability calculations and will count for ACT/SAT and Ready Graduate performance depending on the cohort in which they appear. They will also be included in TVAAS calculations if they meet the criteria described in the TVAAS technical manual. See this resource for more information. 21 For instances where a student is enrolled exactly 50 percent in two schools or districts the following will be applied: the Chronic Absenteeism indicator will include the student in both schools and/or districts, where the Achievement indicator will include the record in the school or district where the student tested.
Enrollment and COVID
The instructional model experienced by a student (e.g. learning remotely, hybrid, in-person, etc.) is not considered when determining inclusion in enrollment.

Page 24 of 71
Table 7: Enrollment and Testing Scenarios
Enrollment Scenario Testing Scenario Counts in
Participation Rate22
Counts in School/District-Level
Performance
Counts in State-Level
Performance Student was not enrolled for at least 50 percent of the school year in any school or district
Student was present and tested Yes No Yes
Student was enrolled for at least 50 percent of the school year in a school and/or district
Student was present and tested in the same school/district in which s/he was enrolled for at least 50 percent of the year
Yes Yes Yes
Student was present and tested in a different school/district in which s/he was enrolled for at least 50 percent of the year
Yes Yes23 Yes
22 A student who was present and tested will count for a district’s participation rate (that is, as a 1 in both the numerator and denominator) whereas a student who was absent will count against a district’s participation rate (that is, as a 0 in the numerator and a 1 in the denominator). 23 The student counts for the school and/or district in which s/he was enrolled at least half the year rather than the school and/or district in which s/he tested.

Page 25 of 71
2.4 Data Preparations The department prepares the raw data used for accountability as described below.
2.4.1 Testing Status and Reports of Irregularity (RI) The department uses the test statuses (i.e., testing flags) below to exclude data from accountability calculations. See Section 2.4.1.2 for other general exclusions. Table 8: Testing Status and Reports of Irregularity
Test Status
Test Status Description Performance Level Is the record considered enrolled?
Is the record considered tested?
0 Not applicable (i.e., student tested) As reported Yes Yes 1 Absent Null Yes No 2 Not enrolled Null No No 3 Not scheduled Null No No 4 Medically exempt24 Null Yes Yes 5 Residential facility Null Yes Yes
6 Student tested on alternative
assessment As reported in alternative
assessment testing file Yes
Based on data in the alternate testing file
7 Student did not submit test online Null Yes Yes Any “student not tested” status other than 0 will override any Reports of Irregularity (RI) status that exists in terms of whether the record is considered enrolled and tested. The RI status codes are:
• 0: No RI status (i.e., student tested, received score, and is reported normally) • 1: Adult potential breach of security • 2: Student security breach • 3: Irregular administration (e.g., wrong accommodations, calculator use) • 4: Student tested incorrect grade or subject • 5: Student did not participate (student refused to test) • 6: Failed attemptedness
Records with an RI status other than 0 count as neither enrolled nor tested and will be invalidated and excluded from all accountability calculations.25 Records with RI status codes of 0 are considered enrolled and tested.
2.4.1.2 Excluded, Missing, and Duplicated TCAP Data Below are the department’s guidelines for excluding data from accountability calculations:
• Records are considered homebound if they are flagged as both homeschooled and homebound. • Homebound records are excluded from school-level files. These records are included at the state and
district levels. • Homeschooled records (school number of 981) are excluded. • Juvenile Detention Center records (school number of 999) are excluded. • Individualized Education Account (IEA) records (with a school number of 982) are excluded.
24 Districts must complete required medically exempt documentation process found in the Assessment Logistics LiveBinder. The department excludes these records only for those students coded appropriately, as described in Section 2.4.4.1. 25 Note that all records tested will receive a raw score and score report from the testing vendor, but those records marked with an RI code other than 0 will not be included in accountability calculations.

Page 26 of 71
• Records with a district number greater than or equal to 990 (private or parochial testing records) are excluded.
• Records associated with adult high schools are excluded.26 • Records associated with CTE schools are excluded, as the data should be remanded to the student’s base
school. • Records associated with alternative schools are excluded, as the data should be remanded to the student’s
sending school. • Records associated with a residential facility flag are excluded. • Records with grades of 13 are excluded. • Records with a subject of math are excluded if the student has other records with a valid performance level
and a subject of Algebra I, Algebra II, Geometry, Integrated Math I, Integrated Math II, or Integrated Math III. • Records with a subject of ELA are excluded if the student has other records with a valid performance level
and a subject of English I or English II. Below are the department’s guidelines for handling missing data:
• Records with missing race/ethnicity values are counted in the All Students group and not in any additional historically underserved student group(s).
• Records with missing school numbers are included in the district and state levels if the record has a valid district number.27
• Records with missing district numbers are included in the state level.28 • Records with missing grades for EOC subjects will be included in both the assessment files and
accountability files. • Records with missing EL status count as not EL unless they appear in an English language proficiency
assessment file. • Records with missing special education status count as not SWD unless they appear in an alternative testing
file. • Records with missing economically disadvantaged status count as not ED. • Records with missing 50 percent enrollment status count as having been enrolled for at least 50 percent of
the year. Below are the department’s guidelines for handling duplicate TCAP records:29
• The hierarchy below indicates which testing record is included if a student has multiple testing records for two different test types for the same subject area, both with non-missing performance levels.30
o TCAP-Alternate Assessment o TCAP EOC o TCAP Achievement31
26 Consult Section 2.4.9 for more information on adult high schools. 27 If the school number is missing in the file (but the district number is valid), the department checks if the school name is also missing. If the school name is not missing, the department associates the record with the appropriate school number depending on the school name (and assuming there are not duplicate school names). 28 If the district number is missing, the department checks if the district name is also missing. 29 If a student has multiple records with discrepant demographic or test administration data (e.g., a student with two different district numbers or who is marked as economically disadvantaged in one record but not another), the department uses the data associated with the record that is kept according to the business rules for removing duplicate data. 30 If students have records for multiple test types, the first record from the hierarchy with a non-missing performance level is included. 31 If students have two achievement records in the same content area in two different tested grades, the record with the absent flag is dropped and the non-absent record is retained.
Page 27 of 71
For example, the English II TCAP-Alternate Assessment record is used when a student has both a valid TCAP EOC record and a valid TCAP-Alternative Assessment record for English II, assuming both records have non-missing performance levels.
Alternatively, the TCAP EOC record is used when a student has both a TCAP EOC record and a TCAP-Alternate Assessment record if the performance level for the TCAP-Alternate Assessment is missing and the performance level for the TCAP EOC is not missing.
• The record with the highest performance level is included if there are multiple records for the same student, original subject, and test type.
• The record with the highest scale score is included if there are multiple records for the same student, original subject, test type, and performance level.
• The record with the most recent test date is included if there are multiple records for the same student, original subject, test type, performance level, and scale score.
• The record with a non-missing value for race/ethnicity is included if there are multiple records for the same student, original subject, test type, performance level, scale score, and test date.
• The record with a non-missing value for grade is included if there are multiple records for the same student, original subject, test type, performance level, scale score, test date, and race/ethnicity.
• If there are still duplicate records after the department applies the steps above, those duplicate records are all included.
2.4.1.3 Student Group Data Corrections The department updates student group information and testing data only in the cases described below.
• Students will be assigned to the SWD student group if they took the TCAP-Alternate Assessment.32 • Students will be assigned to the English Learner (EL) student group if they took the WIDA ACCESS
assessment or the WIDA ACCESS alternate assessment. • Students with records on the WIDA ACCESS assessment who are not initially included as EL in other data
files will be changed and included as EL. • Recently arrived EL students who have been enrolled in a U.S. school for less than 731 days will be
considered tested, and their performance level will be modified to null for accountability files. o Recently arrived EL students who have been enrolled in a U.S. school for less than 731 days will be
considered not tested for all subjects with missing performance levels. o Recently arrived EL students who have been enrolled in a U.S. school for less than 731 days with
valid performance levels will be considered tested in those subjects but will have their performance level modified to null in all subject areas for achievement indicator purposes.
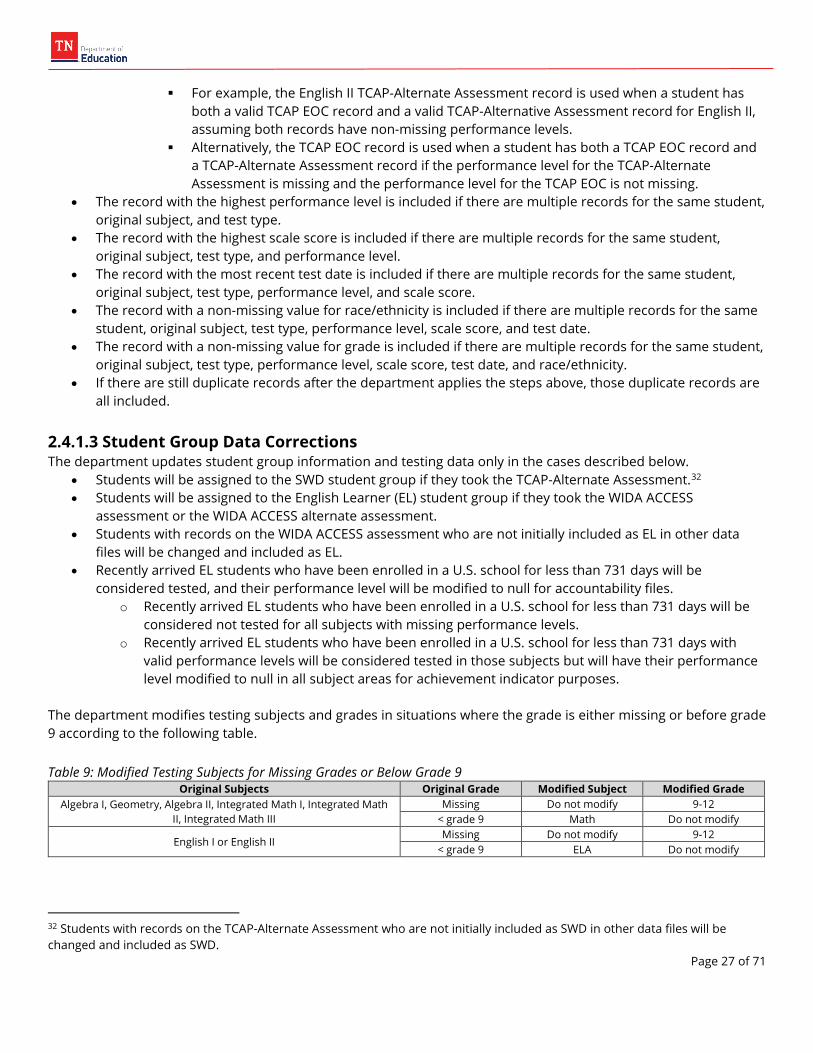
The department modifies testing subjects and grades in situations where the grade is either missing or before grade 9 according to the following table. Table 9: Modified Testing Subjects for Missing Grades or Below Grade 9
Original Subjects Original Grade Modified Subject Modified Grade Algebra I, Geometry, Algebra II, Integrated Math I, Integrated Math
II, Integrated Math III Missing Do not modify 9-12
< grade 9 Math Do not modify
English I or English II Missing Do not modify 9-12
< grade 9 ELA Do not modify
32 Students with records on the TCAP-Alternate Assessment who are not initially included as SWD in other data files will be changed and included as SWD.
Page 28 of 71
2.4.1.4 Modifying Success Rates via ACT The department modifies performance levels in the following instances when preparing accountability indicator calculations:
• Modify the performance level to null if the test record has a testing status other than 0.
• Modify the performance level to null if the record is marked as absent. The record will count as not tested.
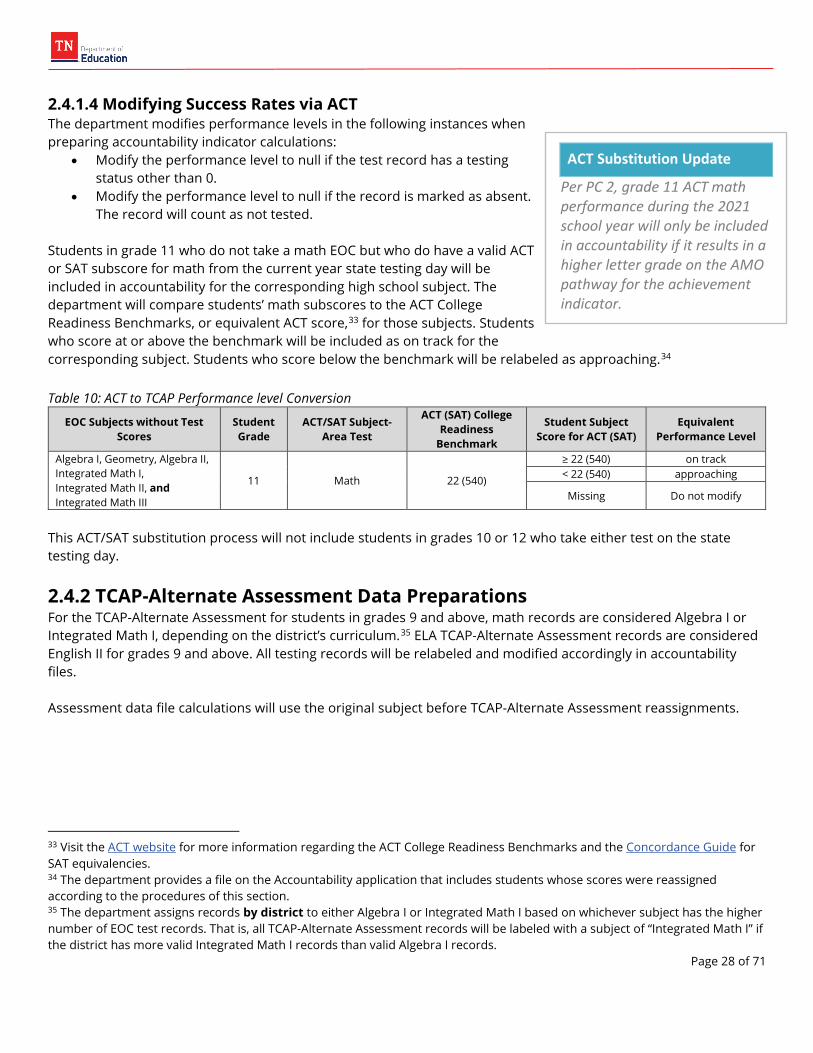
Students in grade 11 who do not take a math EOC but who do have a valid ACT or SAT subscore for math from the current year state testing day will be included in accountability for the corresponding high school subject. The department will compare students’ math subscores to the ACT College Readiness Benchmarks, or equivalent ACT score,33 for those subjects. Students who score at or above the benchmark will be included as on track for the corresponding subject. Students who score below the benchmark will be relabeled as approaching.34 Table 10: ACT to TCAP Performance level Conversion
EOC Subjects without Test Scores
Student Grade
ACT/SAT Subject-Area Test
ACT (SAT) College Readiness
Benchmark
Student Subject Score for ACT (SAT)
Equivalent Performance Level
Algebra I, Geometry, Algebra II, Integrated Math I, Integrated Math II, and Integrated Math III
11 Math 22 (540)
≥ 22 (540) on track < 22 (540) approaching
Missing Do not modify
This ACT/SAT substitution process will not include students in grades 10 or 12 who take either test on the state testing day.
2.4.2 TCAP-Alternate Assessment Data Preparations For the TCAP-Alternate Assessment for students in grades 9 and above, math records are considered Algebra I or Integrated Math I, depending on the district’s curriculum.35 ELA TCAP-Alternate Assessment records are considered English II for grades 9 and above. All testing records will be relabeled and modified accordingly in accountability files. Assessment data file calculations will use the original subject before TCAP-Alternate Assessment reassignments.
33 Visit the ACT website for more information regarding the ACT College Readiness Benchmarks and the Concordance Guide for SAT equivalencies. 34 The department provides a file on the Accountability application that includes students whose scores were reassigned according to the procedures of this section. 35 The department assigns records by district to either Algebra I or Integrated Math I based on whichever subject has the higher number of EOC test records. That is, all TCAP-Alternate Assessment records will be labeled with a subject of “Integrated Math I” if the district has more valid Integrated Math I records than valid Algebra I records.
ACT Substitution Update
Per PC 2, grade 11 ACT math performance during the 2021 school year will only be included in accountability if it results in a higher letter grade on the AMO pathway for the achievement indicator.

Page 29 of 71
2.4.3 ACT and SAT Data Preparations ACT and SAT data represent students’ highest scores obtained within the three years36 up to and including June of their self-reported graduation year.37 ACT and SAT data used in the Ready Graduate indicator lag by one year (i.e., 2021 accountability determinations use ACT and SAT data for the graduating cohort of 2020) except for the use of junior day test data, as described in the section below. The department does not recognize super scores for these data.
2.4.3.1 Cohort Data Preparations Below are the guidelines the department uses to prepare ACT and SAT data that include the highest available score for graduates in the graduating cohort.
• The department includes only those students who are on-time regular education diploma recipients in the prior year’s graduating cohort.
• Records containing students’ highest composite scores among the cohort file are provided by ACT. This highest composite file includes the ACT retake file, and the two most recent state spring test day files.
o The department reconciles instances in which students have multiple records, either from a single file or across multiple of the files above, as follows:
The record with the highest composite score is included if there are multiple records for the same student that have different composite scores.
The record with the highest math subscore is included if there are multiple records for the same student that have the same composite score.
The record with the highest reading38 subscore is included if there are multiple records for the same student that have the same composite and math scores.
The record with the highest English subscore is included if there are multiple records for the same student that have the same composite, math, and reading scores.
The record with the highest science subscore is included if there are multiple records for the same student that have the same composite, math, reading, and English scores.
The most recent test record is included if there are multiple records for the same student that have the same composite, math, reading, English, and science scores.
2.4.3.2 State Testing Day Data Preparations Below are the guidelines the department uses to prepare ACT data from the current year’s state spring test day. The department includes only those students who have a test record from the ACT or SAT junior test day administration and do not have an EOC test record for any high school math subject.39 These business rules apply
36 ACT and SAT data are aggregated by the department for the three most recent school years and are matched to their cohort. SAT files are single-year files, which requires the three most-recent years’ files to be appended together. 37 There may be scores earned within this timeframe that may not be included (e.g., tests taken in another state or records that do not include a state student ID in any of the files described above). 38 For SAT, the department considers the critical reading score as the reading subscore. 39 High school math consists of Algebra I, Geometry, Algebra II, Integrated Math I, Integrated Math II, and Integrated Math III.
ACT Data Updates
1. For junior day test data, per PC 2, grade 11 ACT math performance during the 2021 school year will only be included if it results in a higher letter grade on the AMO pathway for this indicator. 2. PC 2 only provides participation guidance for TCAP assessments administered during the 2020-21 school year. The 2020 graduating class used in the Ready Graduate indicator still had the expectation of 95% ACT requirement. This cohort would have participated in junior day testing during the spring of 2019.
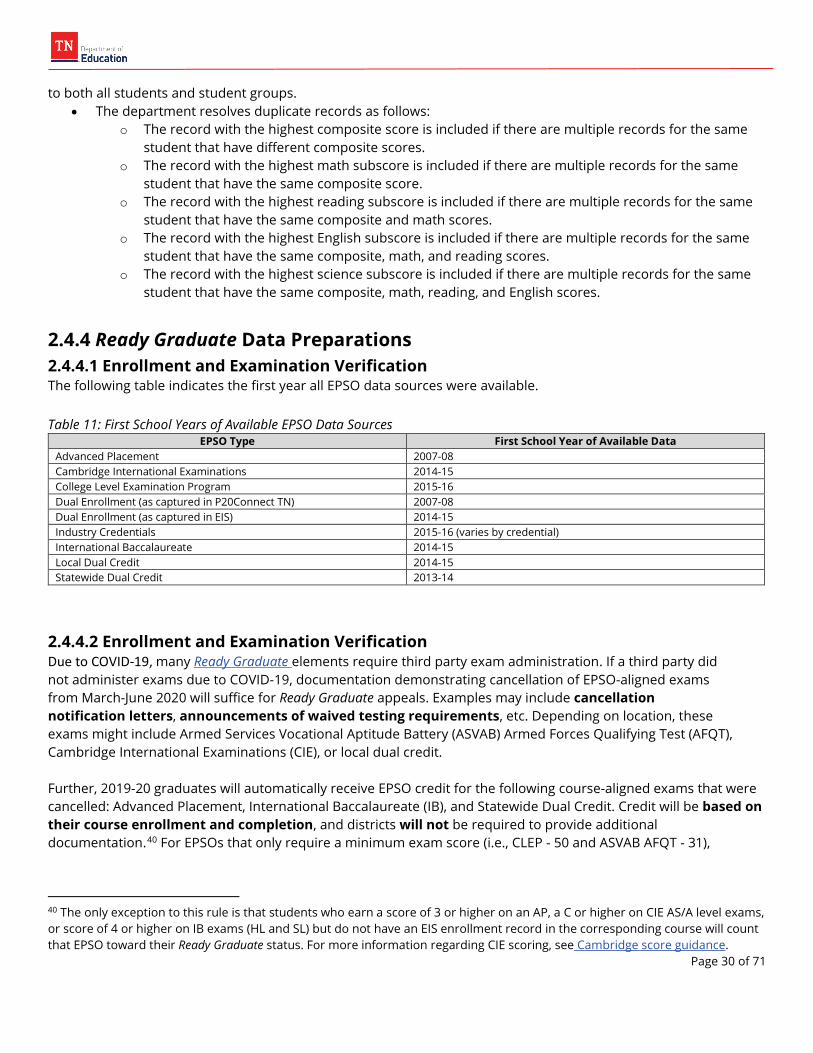
Page 30 of 71
to both all students and student groups. • The department resolves duplicate records as follows:
o The record with the highest composite score is included if there are multiple records for the same student that have different composite scores.
o The record with the highest math subscore is included if there are multiple records for the same student that have the same composite score.
o The record with the highest reading subscore is included if there are multiple records for the same student that have the same composite and math scores.
o The record with the highest English subscore is included if there are multiple records for the same student that have the same composite, math, and reading scores.
o The record with the highest science subscore is included if there are multiple records for the same student that have the same composite, math, reading, and English scores.
2.4.4 Ready Graduate Data Preparations 2.4.4.1 Enrollment and Examination Verification The following table indicates the first year all EPSO data sources were available. Table 11: First School Years of Available EPSO Data Sources
EPSO Type First School Year of Available Data Advanced Placement 2007-08 Cambridge International Examinations 2014-15 College Level Examination Program 2015-16 Dual Enrollment (as captured in P20Connect TN) 2007-08 Dual Enrollment (as captured in EIS) 2014-15 Industry Credentials 2015-16 (varies by credential) International Baccalaureate 2014-15 Local Dual Credit 2014-15 Statewide Dual Credit 2013-14
2.4.4.2 Enrollment and Examination Verification Due to COVID-19, many Ready Graduate elements require third party exam administration. If a third party did not administer exams due to COVID-19, documentation demonstrating cancellation of EPSO-aligned exams from March-June 2020 will suffice for Ready Graduate appeals. Examples may include cancellation notification letters, announcements of waived testing requirements, etc. Depending on location, these exams might include Armed Services Vocational Aptitude Battery (ASVAB) Armed Forces Qualifying Test (AFQT), Cambridge International Examinations (CIE), or local dual credit. Further, 2019-20 graduates will automatically receive EPSO credit for the following course-aligned exams that were cancelled: Advanced Placement, International Baccalaureate (IB), and Statewide Dual Credit. Credit will be based on their course enrollment and completion, and districts will not be required to provide additional documentation.40 For EPSOs that only require a minimum exam score (i.e., CLEP - 50 and ASVAB AFQT - 31),
40 The only exception to this rule is that students who earn a score of 3 or higher on an AP, a C or higher on CIE AS/A level exams, or score of 4 or higher on IB exams (HL and SL) but do not have an EIS enrollment record in the corresponding course will count that EPSO toward their Ready Graduate status. For more information regarding CIE scoring, see Cambridge score guidance.
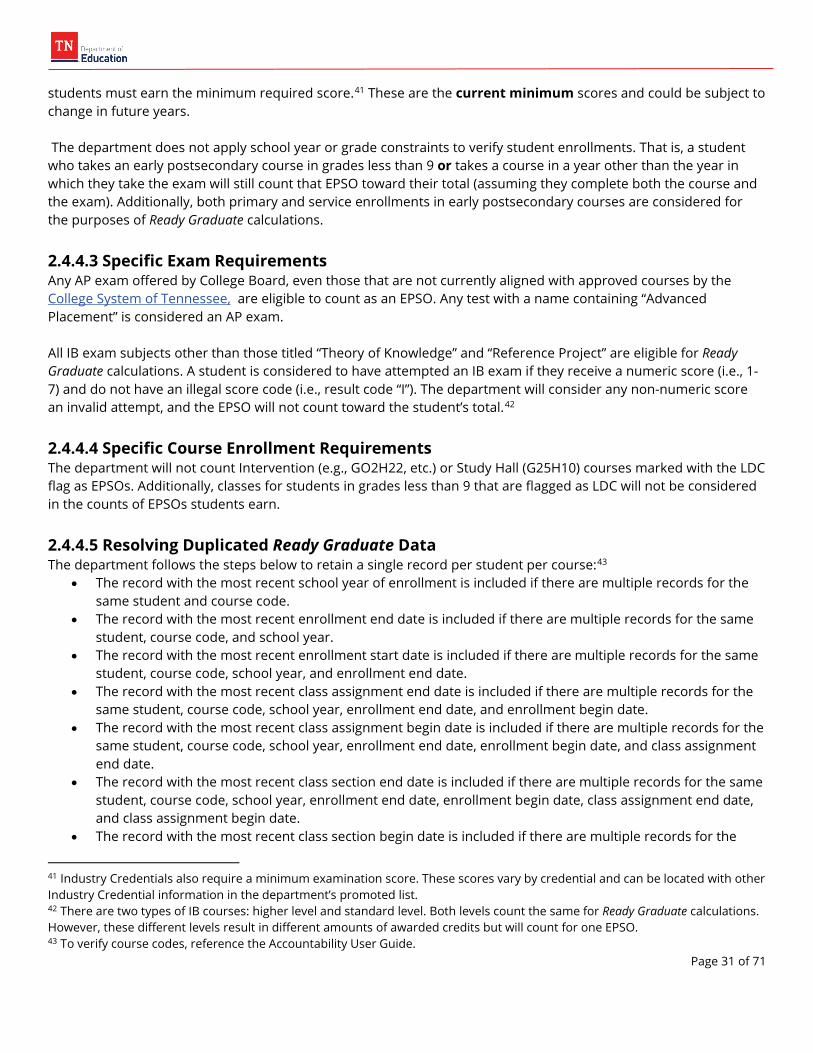
Page 31 of 71
students must earn the minimum required score.41 These are the current minimum scores and could be subject to change in future years. The department does not apply school year or grade constraints to verify student enrollments. That is, a student who takes an early postsecondary course in grades less than 9 or takes a course in a year other than the year in which they take the exam will still count that EPSO toward their total (assuming they complete both the course and the exam). Additionally, both primary and service enrollments in early postsecondary courses are considered for the purposes of Ready Graduate calculations.
2.4.4.3 Specific Exam Requirements Any AP exam offered by College Board, even those that are not currently aligned with approved courses by the College System of Tennessee, are eligible to count as an EPSO. Any test with a name containing “Advanced Placement” is considered an AP exam. All IB exam subjects other than those titled “Theory of Knowledge” and “Reference Project” are eligible for Ready Graduate calculations. A student is considered to have attempted an IB exam if they receive a numeric score (i.e., 1-7) and do not have an illegal score code (i.e., result code “I”). The department will consider any non-numeric score an invalid attempt, and the EPSO will not count toward the student’s total.42
2.4.4.4 Specific Course Enrollment Requirements The department will not count Intervention (e.g., GO2H22, etc.) or Study Hall (G25H10) courses marked with the LDC flag as EPSOs. Additionally, classes for students in grades less than 9 that are flagged as LDC will not be considered in the counts of EPSOs students earn.
2.4.4.5 Resolving Duplicated Ready Graduate Data The department follows the steps below to retain a single record per student per course:43
• The record with the most recent school year of enrollment is included if there are multiple records for the same student and course code.
• The record with the most recent enrollment end date is included if there are multiple records for the same student, course code, and school year.
• The record with the most recent enrollment start date is included if there are multiple records for the same student, course code, school year, and enrollment end date.
• The record with the most recent class assignment end date is included if there are multiple records for the same student, course code, school year, enrollment end date, and enrollment begin date.
• The record with the most recent class assignment begin date is included if there are multiple records for the same student, course code, school year, enrollment end date, enrollment begin date, and class assignment end date.
• The record with the most recent class section end date is included if there are multiple records for the same student, course code, school year, enrollment end date, enrollment begin date, class assignment end date, and class assignment begin date.
• The record with the most recent class section begin date is included if there are multiple records for the
41 Industry Credentials also require a minimum examination score. These scores vary by credential and can be located with other Industry Credential information in the department’s promoted list. 42 There are two types of IB courses: higher level and standard level. Both levels count the same for Ready Graduate calculations. However, these different levels result in different amounts of awarded credits but will count for one EPSO. 43 To verify course codes, reference the Accountability User Guide.
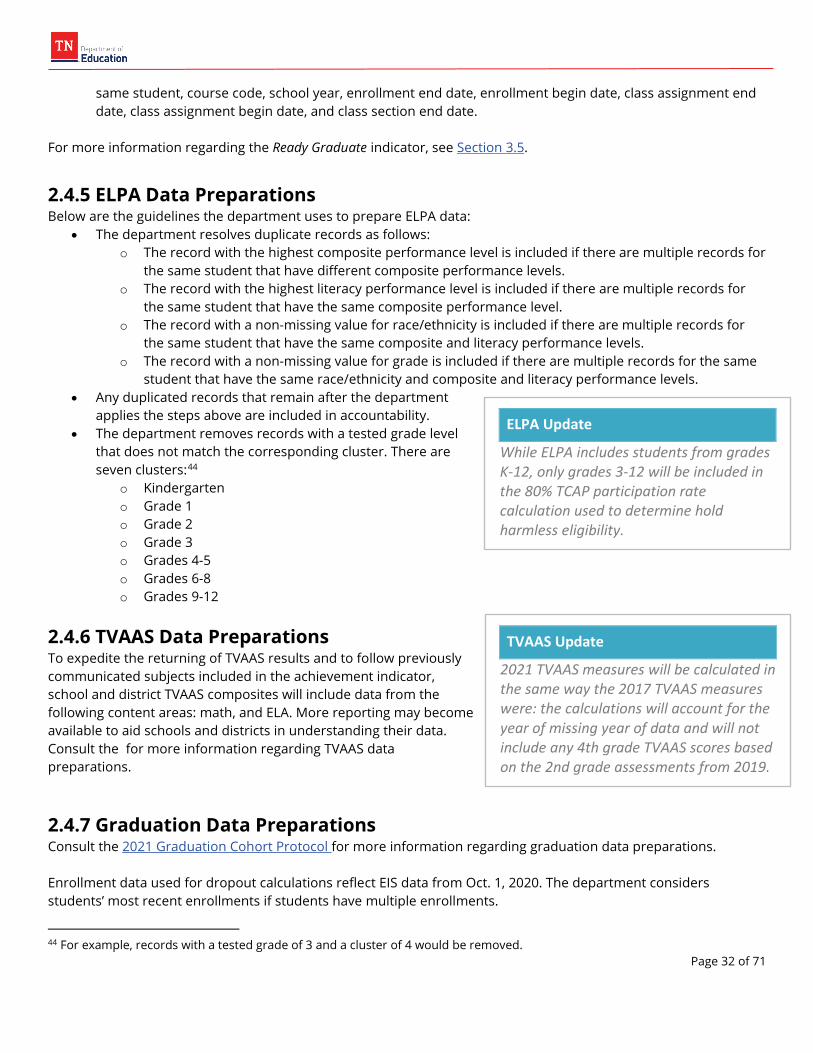
Page 32 of 71
same student, course code, school year, enrollment end date, enrollment begin date, class assignment end date, class assignment begin date, and class section end date.
For more information regarding the Ready Graduate indicator, see Section 3.5.
2.4.5 ELPA Data Preparations Below are the guidelines the department uses to prepare ELPA data:
• The department resolves duplicate records as follows: o The record with the highest composite performance level is included if there are multiple records for
the same student that have different composite performance levels. o The record with the highest literacy performance level is included if there are multiple records for
the same student that have the same composite performance level. o The record with a non-missing value for race/ethnicity is included if there are multiple records for
the same student that have the same composite and literacy performance levels. o The record with a non-missing value for grade is included if there are multiple records for the same
student that have the same race/ethnicity and composite and literacy performance levels. • Any duplicated records that remain after the department
applies the steps above are included in accountability. • The department removes records with a tested grade level
that does not match the corresponding cluster. There are seven clusters:44
o Kindergarten o Grade 1 o Grade 2 o Grade 3 o Grades 4-5 o Grades 6-8 o Grades 9-12
2.4.6 TVAAS Data Preparations To expedite the returning of TVAAS results and to follow previously communicated subjects included in the achievement indicator, school and district TVAAS composites will include data from the following content areas: math, and ELA. More reporting may become available to aid schools and districts in understanding their data. Consult the for more information regarding TVAAS data preparations.
2.4.7 Graduation Data Preparations Consult the 2021 Graduation Cohort Protocol for more information regarding graduation data preparations. Enrollment data used for dropout calculations reflect EIS data from Oct. 1, 2020. The department considers students’ most recent enrollments if students have multiple enrollments.
44 For example, records with a tested grade of 3 and a cluster of 4 would be removed.
TVAAS Update
2021 TVAAS measures will be calculated in the same way the 2017 TVAAS measures were: the calculations will account for the year of missing year of data and will not include any 4th grade TVAAS scores based on the 2nd grade assessments from 2019.
ELPA Update
While ELPA includes students from grades K-12, only grades 3-12 will be included in the 80% TCAP participation rate calculation used to determine hold harmless eligibility.

Page 33 of 71
2.4.8 Attendance Data Preparations Attendance data are used to compute the percent of students who are chronically out of school. This requires a count of absences and a count of instructional days enrolled for all students, which are prepared as follows: Students who are enrolled in two schools or districts for exactly 50 percent of the school year will count for both schools and both districts for accountability purposes. Attendance data only reflect schools and districts in which students are primarily enrolled (i.e., type of service of “P”).
2.4.8.1 Absences The total number of absences includes all instructional days students were enrolled for a given school or district in which extract 049 submissions list attendance codes of A, U, X, or T. Consult the EIS Extracts Layout and Appendix F of the EIS Appendices for more information regarding these extracts. Districts are responsible for submitting and verifying correct absentee codes in accordance with state attendance policies.
2.4.8.2 Instructional Days The total number of instructional days counts all days students were enrolled in a school or district that were classified as instructional days.45 More specifically, instructional days are those with extract 11 submissions that contain a value of “I” for School Day Type and do not have a value of Event Type of either “SI” or “MI.” Consult the EIS Extracts Layout and Appendix A of the EIS Appendices for more information regarding these extracts.
2.4.9 School Directory Data Preparations Below are the guidelines the department uses to prepare School Directory (SDE) data to identify different types of schools.
• The department identifies new schools as those that have: o School type 0, 2, or 346 o A begin date between May 31, 2020 and Aug. 31, 202047 o No end date
• The department identifies closed schools as those that have: o School type 0, 2, or 3 o An end date between May 31, 2020 and Aug. 31, 2020
• The department identifies CTE schools as those that have: o School type 0, 2, or 3 o Instructional type 6 o Active status o No end date
45 Stockpiled days are not considered in the total of instructional days. As such, some schools and districts may have denominators of 167 instructional days. 46 School types 0, 2, and 3 refer to public, state special, and charter schools, respectively. 47 The only exception to these dates would be for schools that have been previously approved by TDOE to open midyear. This approval must be submitted to [email protected] for review prior to June 1 of the school year to open.
Attendance and Absence Clarification
The way students receive instruction during the 2020-2021 school year does not affect their enrollment or attendance. As with previous years, students who are enrolled for at least 50% of the year in a school or district will be included in attendance measures.

Page 34 of 71
• The department identifies alternative schools as those that have: o School type 0, 2, or 3 o Instructional type 8 o Active status o No end date
• The department identifies adult schools as those that have: o School type 0, 2, or 3 o Instructional type 9 o Active status o No end date
• The department identifies special education schools as those that have: o School type 0, 2, or 3 o Instructional type 7 o Active status o No end date

Page 35 of 71
Section 3: Calculation Procedures 3.1 Participation Rates The formula used for calculating the participation rate included in PC 2 will be the formula used every year since the 2017 approval of our Tennessee ESSA plan. It compares the counts of tested student records to enrollment records, as found below. · Tested counts include the number of tested records. · Enrolled counts include the number of tested and non-tested records.
This formula is used every time participation rates are calculated in the accountability model, and the tests and students included change each time it is used. For the 80% participation requirement, all student records for all TCAP tests will be included. For other parts of this protocol, participation rates are calculated for any student group in the current year across all grades48. Participation rates are calculated after all data transformations have been completed. That is, numbers of tested and enrolled students are used to calculate participation rates once all testing records have been modified, amended, and excluded in accordance with Section 2.4.
3.2 Performance Level Percentages The percentage of students at a given performance level is equal to the number of valid tests at that performance level divided by the number of valid tests at all performance levels.49
Percent mastered50 =# mastered# valid tests
∗ 100
Percent on track =# on track
# valid tests∗ 100
Percent approaching =# approaching
# valid tests∗ 100
The percent of students scoring on track or mastered is calculated by dividing the number of on track and mastered records by the total number of valid tests.51
Percent on track or mastered =# on track + # mastered
# valid tests∗ 100
48 ACT and SAT participation rates must meet 30 students for any student group in the given cohort. 49 Records with missing or null performance levels are not included in these counts. 50 EOC performance levels for math and ELA subjects are used throughout this document. 51 As per ESSA § 1111(c)(4)(E), if the number of valid tests represents less than the minimum participation rate (95% generally, 80% for 2021), then the denominator becomes the number of expected valid tests at the minimum participation rate.

Page 36 of 71
Percent below is calculated during the rounding process to ensure that all percentages sum to 100. Values are rounded to the tenths place only after all calculations and comparisons have been performed.
Percent below = 100 − (percent mastered + percent on track + percent approaching)
3.3 One-Year and Three-Year Success Rates Success rates represent the total number of valid tests with a performance level of on track or mastered divided by the total number of valid tests for the subjects in each grade band. Content areas are only included in success rates for all students or any student group if there are 30 valid tests in that content area52 and year for the given student group. For example, if the All Students group had only 29 valid tests in math in 2019 and 32 valid tests in math in 2021, the 2019 math tests would be excluded from the three-year success rate for all students. Three-year success rates are used when determining Priority/CSI identification, which is detailed in Section 4.5. Only math and ELA subjects are included in success rates, as detailed below. The table below indicates which subjects are included in success rates in a given school year. All success rates are rounded to one decimal place. Table 12: Subjects Included in Success Rates
School Year Subjects Included in Success Rates Notes
2020-21 English Language Arts and Math
Social Studies: Operational, but no baseline data *Standards setting will be completed in July
Science: Test data lacking in grades 3-5 *Standards setting will be completed in July
2021-22 English Language Arts, Math, Science, and Social
Studies Growth for all subjects will be available.
The formula below illustrates how one-year success rates are calculated.53 Success rates for both the K-8 and high school (HS) pools54 include both EOC and achievement subjects because schools are assigned to a pool based on the number of students in the graduation cohort. Consequently, some schools may serve high school students though they are assigned to the K8 pool55.
Success rate =# on track or mastered (math + ELA + HS math56 + HS ELA57)
# valid tests (math + ELA + HS math + HS ELA)
52 High school eligibility will be based on the content areas of HS math (Algebra I, Algebra II, Geometry, Integrated Math I, II, and III) and HS ELA (English I and English II). 53 As per ESSA § 1111(c)(4)(E), if the number of valid tests represents less than the minimum participation rate (95% generally, 80% for 2021), then the denominator becomes the number of expected valid tests at the minimum participation rate. 54 To locate more information regarding school pools, reference Section 4.2 . 55 ACT substitution records for high school math only will be included in these success rates. 56 High school math consists of all records across all of the following subjects: Algebra I, Algebra II, Geometry, Integrated Math I, Integrated Math II, and Integrated Math III. 57 High school ELA consists of English I and English II

Page 37 of 71
The following formula illustrates how three-year success rates are calculated58 for grades 3-8 and for high school subjects.
Success rate =# on track or mastered (math + ELA + HS math + HS ELA + ACT59)
# valid tests (math + ELA + HS math + HS ELA + ACT)
3.4 Graduation Rates The graduation rate60 is equal to the number of graduates with an on-time regular diploma, divided by the total number of students in the graduation cohort, rounded to one decimal place. This is calculated at the school, district, and state levels using the graduation files from the Cohort application. Some districts and certain schools may not have a graduation rate; for example, they may not meet the minimum required count of 30 students in the graduation cohort therefore placing them in the K-8 pool. Students count in the district and school in which they were most recently enrolled.
3.5 Ready Graduate Indicator The Ready Graduate indicator measures the percent of students who earn regular high school diploma and meet milestones that are aligned to increase the probability for postsecondary success. For students to be considered Ready Graduates, they must meet at least one of the following criteria (a student can only count once):
• Score of 21 or higher on ACT (or 1060 or higher on the SAT); or • Complete 4 early postsecondary opportunities (EPSOs); or • Complete 2 EPSOs and earn an industry credential; or • Complete 2 EPSOs and earn a score of military readiness on ASVAB AFQT.
The Ready Graduate indicator is calculated by dividing the number of on-time graduates from the cohort who meet one of the above criteria by the number of students in that cohort. Students count in the same school and district as they do for graduation cohort purposes. The percent of Ready Graduates in a school or district is rounded to one decimal place. Consult the guidance documents on the Cohort application for more information. The department counts EPSOs that students earn in districts other than the one in which the student counts for accountability purposes. Unless otherwise noted, the department considers all available years of data when counting the number of EPSOs students earn.
# of graduates meeting 𝑅𝑅𝑅𝑅𝑅𝑅𝑅𝑅𝑅𝑅 𝐺𝐺𝐺𝐺𝑅𝑅𝑅𝑅𝐺𝐺𝑅𝑅𝐺𝐺𝑅𝑅 criteria# in the graduation cohort
For guidance regarding the Ready Graduate indicator, access the Ready Graduate Indicator User Guide, FAQ, and Appeals Guidance.
3.6 Chronically Out of School Chronic absenteeism is defined as a student who is absent for 10 percent or more of the instructional days for which they are enrolled in a Tennessee public school or district. The department considers students with a value of
58 As per ESSA § 1111(c)(4)(E), if the number of valid tests represents less than the minimum participation rate (95% generally, 80% for 2021 accountability), then the part of the denominator for that particular year becomes the number of expected valid tests at the minimum participation rate. 59 In addition to the components of one-year success rates, three-year success rates include the number of students scoring 21 or higher on the ACT in the numerator and the number of on-time regular graduates in the denominator. 60 Graduation rates for the current accountability year are based on the previous year’s results.

Page 38 of 71
X, T, U, or A in the attendance field of EIS extract 049. A student is chronically absent if their absentee rate is 10 percent or higher. The chronic absenteeism rate is rounded to one decimal place.
Absentee rate = # of absences (X + T + U + A)
# of instructional days enrolled61
The calculation below defines the chronic absenteeism rate for a school, district, or the state.
Percent chronically out of school =# of chronically absent students
# students enrolled ∗ 100
District- and school-level calculations will include only students who are enrolled for at least 50 percent of the instructional days of the year in the district or school, respectively.
3.7 Annual Measurable Objective (AMO) Targets The department is unable to establish new performance targets for certain indicators without data from 2019-20. Therefore, the State Board of Education reapproved targets provided to schools and LEAs for the 2019-20 school year for the following indicators:
• Achievement (TCAP) • Chronic Absenteeism • ELPA via WIDA ACCESS 2.0
These targets were originally approved by SBE in Fall 2019 and were reapproved in Fall 2020. This process will only apply to school year 2020-21. The State Board of Education also approved new AMO targets for two indicators — Ready Graduate and Graduation Rate. The data utilized to establish each AMO target are found in the table below. Table 13: 2020-21 “Prior year” performance data used to establish AMOs by indicator
Indicator 2019-20 Data Used 2018-19 Data Used
Achievement
Chronic Absenteeism
English Language Proficiency Assessment
Graduation Rate Ready Graduate
Table 14: AMOs Available by Indicator
Indicator District School
Achievement
Chronic Absenteeism English Language Proficiency Assessment
Graduation Rate
Ready Graduate
61 Stockpiled days are not included in the denominator.
AMO Update
AMOs for Achievement, Chronic Absenteeism, and ELPA were set using 2019 data. Graduation Rate and Ready Graduate indicator AMOs were set using 2020 data.
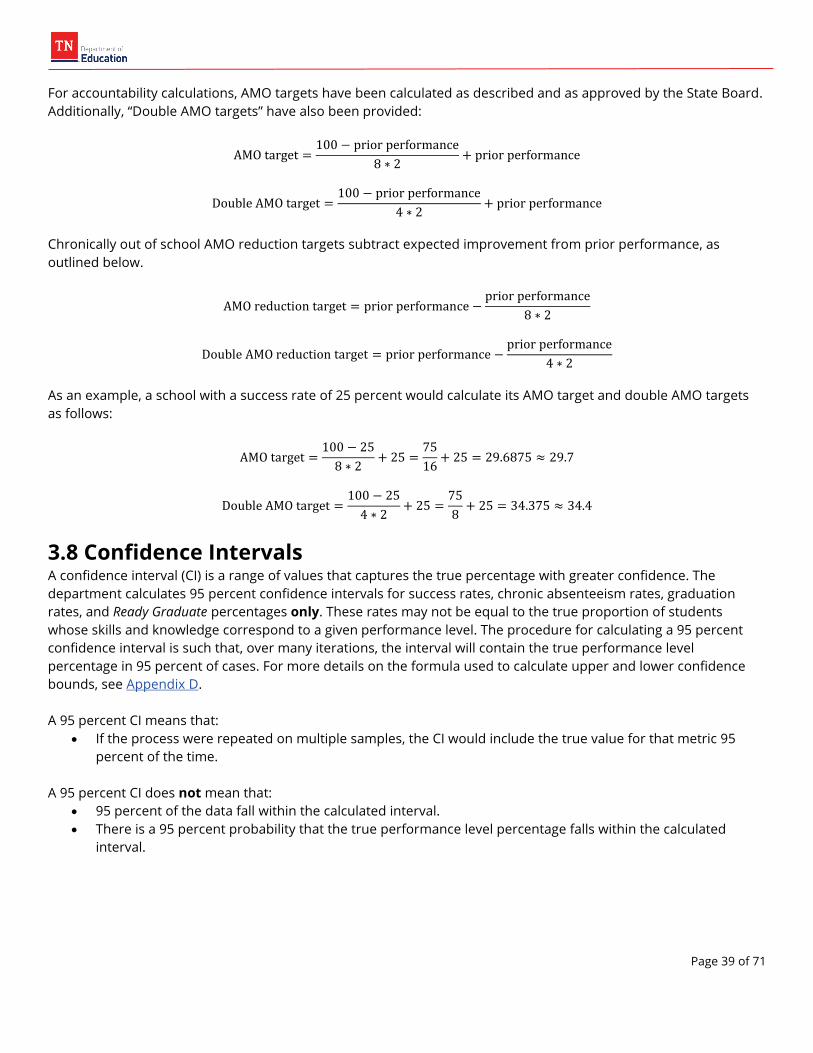
Page 39 of 71
For accountability calculations, AMO targets have been calculated as described and as approved by the State Board. Additionally, “Double AMO targets” have also been provided:
AMO target =100 − prior performance
8 ∗ 2+ prior performance
Double AMO target =100 − prior performance
4 ∗ 2+ prior performance
Chronically out of school AMO reduction targets subtract expected improvement from prior performance, as outlined below.
AMO reduction target = prior performance −prior performance
8 ∗ 2
Double AMO reduction target = prior performance −prior performance
4 ∗ 2
As an example, a school with a success rate of 25 percent would calculate its AMO target and double AMO targets as follows:
AMO target =100 − 25
8 ∗ 2+ 25 =
7516
+ 25 = 29.6875 ≈ 29.7
Double AMO target =100 − 25
4 ∗ 2+ 25 =
758
+ 25 = 34.375 ≈ 34.4
3.8 Confidence Intervals A confidence interval (CI) is a range of values that captures the true percentage with greater confidence. The department calculates 95 percent confidence intervals for success rates, chronic absenteeism rates, graduation rates, and Ready Graduate percentages only. These rates may not be equal to the true proportion of students whose skills and knowledge correspond to a given performance level. The procedure for calculating a 95 percent confidence interval is such that, over many iterations, the interval will contain the true performance level percentage in 95 percent of cases. For more details on the formula used to calculate upper and lower confidence bounds, see Appendix D. A 95 percent CI means that:
• If the process were repeated on multiple samples, the CI would include the true value for that metric 95 percent of the time.
A 95 percent CI does not mean that:
• 95 percent of the data fall within the calculated interval. • There is a 95 percent probability that the true performance level percentage falls within the calculated
interval.

Page 40 of 71
3.9 Rounding Procedures Unless otherwise noted, all calculations are rounded to one decimal place at the end of all calculation steps. For example, overall school accountability scores are rounded to the tenths place only when creating the final average62. All values leading into the final score are neither rounded nor truncated.
62 For example, a final accountability score of 2.04 will round to 2.0 while a final accountability score of 2.05 will round to 2.1.
Page 41 of 71
Section 4: School Accountability 4.1 Background and Designations
Hold Harmless Flag: In the 2020-21 school year, schools that are held harmless will not receive any indicator scores or letter grades. For schools
held harmless, only the underlying metrics will be reported similarly to how they were reported during 2019 when letter grades were not issued.
This section details the procedures involved in calculating school accountability designations. The department identifies Priority schools63 at least every three years and all other schools annually. A Priority school may exit Priority status each year between identification cycles if these schools make significant progress.64 Reward schools65 are those schools that earn an overall weighted average of 3.1 or higher and are not identified as Focus schools.
4.2 School Pools and Eligibility Schools are included in one of two pools based on graduation cohorts.
• K-8 pool: Schools with fewer than 30 students in the prior year’s graduating cohort and 30 or more students with valid tests in a single subject66. Subjects would include grades 3-8 math, grades 3-8 ELA, HS math, and HS English.
• HS pool:67 Schools with 30 or more students in the prior year graduating cohort.
Schools with only graduation or ACT data in the current year are included in the overall pool of schools but are not eligible to earn designations. Schools that are closed are included in the overall pool of schools but are not eligible to earn designations since they are not eligible to receive interventions. Schools with only one year of data are included in the overall pool of schools but are not eligible to earn designations since they do not have data to evaluate improvement. Special education schools are included in the overall pool of schools but are not eligible for Priority Status.
63 Priority schools are sometimes referred to as “schools identified for comprehensive support and improvement.” When Priority schools are identified, they also receive an overall grade of “F”. 64 See Section 4.5.1 for more information regarding Priority exit criteria. 65 Reward schools receive an overall grade of “A”. 66 Subjects would include: 3-8 math, 3-8 ELA, HS math, HS English. 67 Schools that serve grade 12 but do not meet the minimum student count will be considered in the K-8 pool for accountability purposes.
“F” Eligibility
According to the approved state ESSA Plan, a “D” is the lowest grade possible for a non-Priority school. Only schools that are currently designated as Priority Schools are eligible for an “F” for 2021 accountability. CSI schools that are not also Priority schools are not eligible to receive an “F” due to T.C.A. §49-1-602(a)(4), which states that 2018 assessment data cannot be used to assign a letter grade.

Page 42 of 71
The following schools and school types are ineligible to earn school accountability designations for the data remanding from these schools to the student’s sending school:
• CTE • Adult high schools • Alternative schools
4.3 Student Groups and Pathways School accountability calculations include students in applicable historically underserved student groups to ensure all Tennessee students achieve high levels of success. The All Students group includes all students. If applicable, students are also included in the following student groups:
• Black, Hispanic, and Native American students • Economically Disadvantaged students • English Learners • Students with Disabilities
The department will consider Super Subgroup performance for schools that do not have sufficient numbers of students for any individual student group listed above but do have sufficient numbers of students in the Super Subgroup. Each overall student group indicator represents the average performance of each eligible student group for that indicator. In other words, a school that is only eligible for the BHN and ED student groups will receive a student group indicator score that reflects the even weight of the performance of these two student groups. Each overall average is rounded to one decimal place. Final indicator averages weight all students and subgroup indicator averages at 60 percent and 40 percent, respectively. Final indicator averages are rounded to one decimal place. Consider the example of the high school grades below. Table 15: Indicator Averages
Indicator All Students (60%) Historically Underserved
Student Groups (40%) Overall
Score/Grade Score/Grade Achievement (30%) 3 B 3 B B (3.0)
Growth (25%) 4 A 2 C A (3.2) Ready Graduate (20%) 1 D 3 B C (1.8)
Graduation Rate (5%) 2 C 2 C C (2.0) Chronically Out of School (10%) 3 B 3 B B (3.0)
English Language Proficiency (10%) 3 B 3 B B (3.0)
Overall School Grade (100%) B (2.8)

Page 43 of 71
Final grades weight all students and subgroup grades at 60 percent and 40 percent, respectively. Final grades are rounded to the one decimal place. Schools receive final grades68 based on the points scale below69:
• A: 3.1–4.0 • B: 2.1–3.0 • C: 1.1–2.0 • D: 0.0–1.0
4.4 Indicators and Weighting The following table details the indicators included in school accountability. The weights will be used to compute a weighted average for Reward school identification and other federal identifications as described in Section 4.6. Table 16: Indicators and Weighting
Indicator Definition Measure for All Students and Student Groups Weight Achievement
Progress toward on track or mastered
Absolute performance or AMO targets (set to increase the percent of students scoring on track or mastered)
K-8: 45% HS: 30%
Growth
Progress toward approaching, on track, or mastered
TVAAS (student-level growth measure across achievement continuum)
K-8: 35% HS: 25%
Ready Graduate Percent of students who graduate and meet Ready Graduate criteria70
Absolute performance or AMO targets (set to increase the percent of Ready Graduates)
K-8: NA HS: 20%
Graduation Rate Percent of students in the graduation cohort that graduate on time with a
regular diploma
Absolute performance or AMO targets (set to increase the graduation rate)
K-8: NA HS: 5%
Chronically Out of School
Chronic absenteeism, including out-of-school suspension
Absolute performance or AMO targets (set to decrease the percent of chronically absent students)
K-8: 10% HS: 10%
English Language Proficiency Assessment71
Performance on WIDA ACCESS The percent of students meeting growth standards K-8: 10% HS: 10%72
Student groups with at least 30 valid records are included in accountability calculations, with the exception of the ELPA indicator, which uses a minimum n-size of 10 valid records and the Growth indicator (TVAAS) which student counts vary by model73. The Super Subgroup74 will be used when schools are ineligible for all indicators for each of the four student groups listed above, assuming the school has enough valid records for the Super Subgroup for at least one indicator. Schools only receive scores for indicators in which they have sufficient data for all pathways. For example, a high school with at least 30 students in the graduation cohort that has a graduation rate but lacks AMO targets would not receive a score for the graduation rate indicator. The 10 percent weight for the ELPA indicator is redistributed evenly between the achievement and growth
68 Schools receiving a school grade of “F” will be those who are designated as Priority. See Section 4.5 for more information regarding Priority School Identification. 69 Schools receiving a Focus designation will be limited to a letter grade of “B-“or lesser values, including those schools with scores greater than 3.1. See Section 4.6 for more information. 70 For more information regarding Ready Graduate criteria, reference Section 3.5. 71 The ELPA indicator uses a minimum n-size of 10 valid tests whereas all other indicators require a minimum n-size of 30. 72 The 10 percent weight is redistributed to the achievement and growth indicators equally for schools in either school pool who do not meet the minimum n-size for the ELPA indicator. 73 Reference the TVAAS technical manual for additional business rules used in the growth metric. 74 See Section 2.2.2 for more information on the Super Subgroup.
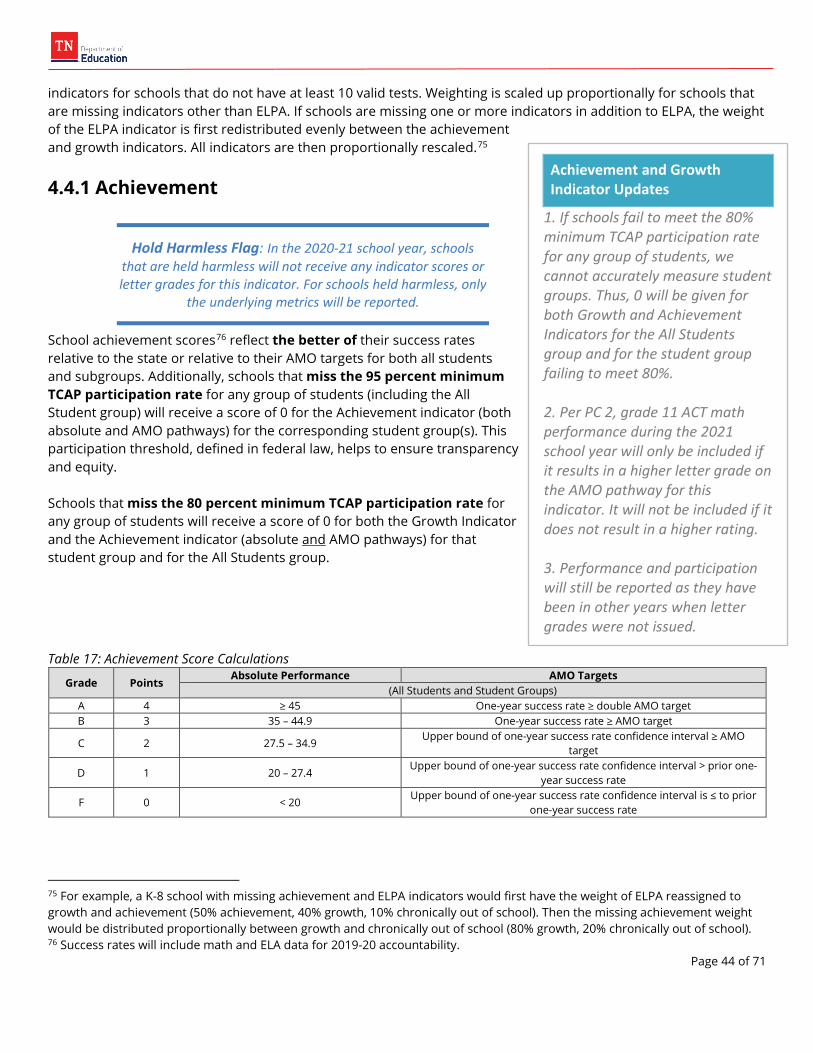
Page 44 of 71
indicators for schools that do not have at least 10 valid tests. Weighting is scaled up proportionally for schools that are missing indicators other than ELPA. If schools are missing one or more indicators in addition to ELPA, the weight of the ELPA indicator is first redistributed evenly between the achievement and growth indicators. All indicators are then proportionally rescaled.75
4.4.1 Achievement
Hold Harmless Flag: In the 2020-21 school year, schools that are held harmless will not receive any indicator scores or letter grades for this indicator. For schools held harmless, only
the underlying metrics will be reported.
School achievement scores76 reflect the better of their success rates relative to the state or relative to their AMO targets for both all students and subgroups. Additionally, schools that miss the 95 percent minimum TCAP participation rate for any group of students (including the All Student group) will receive a score of 0 for the Achievement indicator (both absolute and AMO pathways) for the corresponding student group(s). This participation threshold, defined in federal law, helps to ensure transparency and equity. Schools that miss the 80 percent minimum TCAP participation rate for any group of students will receive a score of 0 for both the Growth Indicator and the Achievement indicator (absolute and AMO pathways) for that student group and for the All Students group. Table 17: Achievement Score Calculations
Grade Points Absolute Performance AMO Targets
(All Students and Student Groups) A 4 ≥ 45 One-year success rate ≥ double AMO target B 3 35 – 44.9 One-year success rate ≥ AMO target
C 2 27.5 – 34.9 Upper bound of one-year success rate confidence interval ≥ AMO
target
D 1 20 – 27.4 Upper bound of one-year success rate confidence interval > prior one-
year success rate
F 0 < 20 Upper bound of one-year success rate confidence interval is ≤ to prior
one-year success rate
75 For example, a K-8 school with missing achievement and ELPA indicators would first have the weight of ELPA reassigned to growth and achievement (50% achievement, 40% growth, 10% chronically out of school). Then the missing achievement weight would be distributed proportionally between growth and chronically out of school (80% growth, 20% chronically out of school). 76 Success rates will include math and ELA data for 2019-20 accountability.
Achievement and Growth Indicator Updates
1. If schools fail to meet the 80% minimum TCAP participation rate for any group of students, we cannot accurately measure student groups. Thus, 0 will be given for both Growth and Achievement Indicators for the All Students group and for the student group failing to meet 80%. 2. Per PC 2, grade 11 ACT math performance during the 2021 school year will only be included if it results in a higher letter grade on the AMO pathway for this indicator. It will not be included if it does not result in a higher rating. 3. Performance and participation will still be reported as they have been in other years when letter grades were not issued.

Page 45 of 71
4.4.2 Growth
Hold Harmless Flag: In the 2020-21 school year, schools that are held harmless will not receive any indicator points or letter grades for this indicator.
School growth scores reflect composite77 TVAAS levels for both all students and student groups. Table 18: Growth Score Calculations
Grade Points TVAAS Composite
(All Students and Student Groups) A 4 Level 5 B 3 Level 4 C 2 Level 3 D 1 Level 2 F 0 Level 1
4.4.3 Chronically Out of School
Hold Harmless Flag: Schools and districts held harmless will not receive a rating for this indicator. For schools held harmless, only the underlying metrics
will be reported as they were in other hold harmless years.
Chronic absenteeism calculations include only students who are enrolled for at least 50 percent of the instructional days in the school year78. The percent of chronically out of school students is calculated by dividing the number of students who are chronically absent by the number of students enrolled. Schools receive points for the chronically out of school indicator according to the following scale. Table 19: Chronic Absenteeism Calculations
Grade Points K-8 Absolute Performance
HS Absolute Performance
AMO Targets
(All Students and Student Groups)
A 4 ≤ 6 ≤ 10 Percent of chronically absent students ≤ double AMO
target B 3 6.1 – 9 10.1 – 14 Percent of chronically absent students ≤ AMO target
C 2 9.1 – 13 14.1 – 20 Lower bound of confidence interval of percent of
chronically absent students ≤ AMO target
D 1 13.1 – 20 20.1 – 30 Lower bound of confidence interval of percent of
chronically absent students < prior year percent of chronically absent students
F 0 > 20 > 30 Lower bound of confidence interval of percent of
chronically absent students ≥ prior year percent of chronically absent students
77 For 2019-20 accountability, school TVAAS composites will include the subjects of math and ELA only. TVAAS composites will include the better score between composites that include grade 3 and those that do not. 78 For more information regarding chronic absenteeism calculations, reference Section 6.

Page 46 of 71
4.4.4 Graduation Rate
Hold Harmless Flag: Schools and districts held harmless will not receive a rating for this indicator for 2021 accountability. For schools held harmless, only the underlying metrics will be reported as they were in other hold harmless years.
Graduation rates reflect the percent of students in each cohort who graduate with a regular diploma within four years and a summer of starting grade 9. Only schools in the high school pool receive points for the graduation rate indicator according to the following scale. Table 20: Graduation Rate Calculations
Grade Points Absolute Performance AMO Targets
(All Students and Student Groups) A 4 ≥ 95 Graduation rate ≥ double AMO target B 3 90 – 94.9 Graduation rate ≥ AMO target C 2 80 – 89.9 Upper bound of confidence interval of graduation rate ≥ AMO target
D 1 67 – 79.9 Upper bound of confidence interval of graduation rate > prior
graduation rate
F 0 < 67 Upper bound of confidence interval of graduation rate is ≤ prior year
graduation rate
4.4.5 Ready Graduate
The Ready Graduate indicator is calculated by dividing the number of on-time graduates from the cohort who meet at least one of the Ready Graduate criteria by the number of students in that cohort. Only schools in the high school pool receive points for the Ready Graduate indicator according to the following scale.
Hold Harmless Flag: Schools and districts held harmless will not receive a rating for this indicator for 2021 accountability. For schools held harmless, only the underlying metrics will be reported as they were in other hold harmless years.
Ready Grad Clarification
PC 2 only provides participation guidance for TCAP assessments administered during the 2020-21 school year. The 2020 graduating class used in the Ready Graduate indicator still had the expectation of 95% ACT/SAT requirement. These students would have participated in junior day testing during the spring of 2019.

Page 47 of 71
Table 21: Ready Graduate Calculation
Grade Points Absolute Performance AMO Targets
(All Students and Student Groups) A 4 ≥ 40 Percent of Ready Graduates ≥ double AMO target B 3 30 – 39.9 Percent of Ready Graduates ≥ AMO target
C 2 25 – 29.9 Upper bound of percent of Ready Graduates confidence interval ≥ AMO
target
D 1 16 – 24.9 Upper bound of percent of Ready Graduates > prior percent of Ready
Graduates
F 0 < 16 Upper bound of percent of Ready Graduates is ≤ prior percent of Ready
Graduates
Additionally, schools that miss the 95 percent minimum participation rate for ACT/SAT will receive a score of 0 for both pathways of the Ready Graduate indicator for the student group(s) for which the schools tested less than 95 percent of graduates.
4.4.6 English Language Proficiency Assessment
Hold Harmless Flag: Schools and districts held harmless will not receive a rating for this indicator. For schools held harmless, only the underlying metrics will be reported as they were in other hold harmless years.
WIDA tests for students enrolled in grades 3-12 will be included with the rest of the TCAP tests to arrive at an overall participation rate. Under Tennessee’s ESSA plan, WIDA assessments and their calculations are found separate from the rest of the TCAP tests. For the purposes of determining the eligibility for the participation rate requirement, all TCAP tests will be included together to generate an overall participation rate. Schools are eligible for the ELPA indicator if at least 10 students have valid composite performance levels in both the current and prior year(s). The ELPA indicator reflects the percent of students meeting the growth standard. Imputed scores from 2020 cannot be used. Growth standards are differentiated based on students’ prior-year composite performance according to the table below.79 Table 22: ELPA Growth Standards
Prior Year Score Range Growth Standard 1.0–1.4 1.3 1.5–1.9 0.7 2.0–2.4 0.8 2.5–2.9 0.7 3.0–3.4 0.4 3.5–3.9 0.5 4.0–4.4 0.4 4.5-4.9 0.2
79 These growth standards represent the 60th percentile of growth performance for each given score band from prior data.
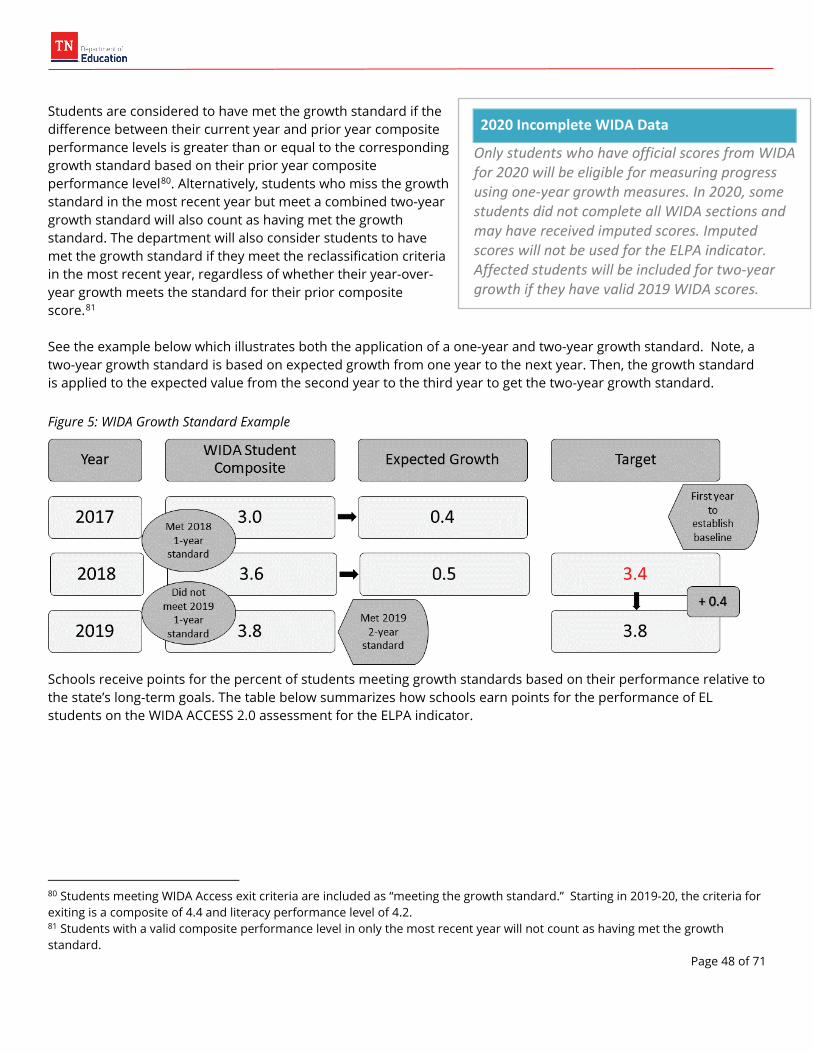
Page 48 of 71
Students are considered to have met the growth standard if the difference between their current year and prior year composite performance levels is greater than or equal to the corresponding growth standard based on their prior year composite performance level80. Alternatively, students who miss the growth standard in the most recent year but meet a combined two-year growth standard will also count as having met the growth standard. The department will also consider students to have met the growth standard if they meet the reclassification criteria in the most recent year, regardless of whether their year-over-year growth meets the standard for their prior composite score.81 See the example below which illustrates both the application of a one-year and two-year growth standard. Note, a two-year growth standard is based on expected growth from one year to the next year. Then, the growth standard is applied to the expected value from the second year to the third year to get the two-year growth standard. Figure 5: WIDA Growth Standard Example
Schools receive points for the percent of students meeting growth standards based on their performance relative to the state’s long-term goals. The table below summarizes how schools earn points for the performance of EL students on the WIDA ACCESS 2.0 assessment for the ELPA indicator.
80 Students meeting WIDA Access exit criteria are included as “meeting the growth standard.” Starting in 2019-20, the criteria for exiting is a composite of 4.4 and literacy performance level of 4.2. 81 Students with a valid composite performance level in only the most recent year will not count as having met the growth standard.
2020 Incomplete WIDA Data
Only students who have official scores from WIDA for 2020 will be eligible for measuring progress using one-year growth measures. In 2020, some students did not complete all WIDA sections and may have received imputed scores. Imputed scores will not be used for the ELPA indicator. Affected students will be included for two-year growth if they have valid 2019 WIDA scores.

Page 49 of 71
Table 23: Percent of Students Meeting Growth Standards
Grade Points Percent of Students Meeting Growth Standards
(All Students and Student Groups) A 4 ≥ 60 B 3 50 – 59.9 C 2 40 – 49.9 D 1 25 – 39.9 F 0 < 25
4.5 Priority School Identification
Hold Harmless Flag: In the 2020-21 school year, schools that are held harmless cannot be identified as new Priority schools.
Priority schools are identified at least every three years and have the opportunity to exit each year according to the criteria listed in the following section. Priority and CSI schools were last identified at the end of 2017-18 based on 2015-1682, 2016-17, and 2017-1883 data. In this previous identification cycle, schools earned Priority designations if their one- or two-year success rates—for the K-8 and high school pools,84 respectively—were in the bottom five percent statewide and the schools did not have TVAAS composites85 of 4 or 5 in both 2016-17 and 2017-1886 for all subjects. These success rates included 2015-16 and 2016-17 data for schools in the HS pool and 2016-17 data only for schools in the K-8 pool. Schools with graduation rates less than 67 percent were also designated as Priority schools. According to the approved Tennessee ESSA plan, all lists of Priority schools will include three years of assessment data. Thus, after the 2020-21 school year, the department will identify Priority and CSI schools as the lowest-performing five percent of schools in terms of three-year success rates87 in each school pool. Furthermore, any school with a graduation rate less than 67 percent will earn Priority status.88 Schools in the bottom five percent that earn a score of A or B for the All Students group on all other indicators89 for which they are eligible based on the absolute performance pathway will not be identified as Priority schools.
82 2015-16 data were only included for high schools due to the suspension of testing in grades 3-8 in 2015-16. 83 2017-18 data were included in CSI identification and were only used in Priority identification if they removed a school from the bottom 5 percent of its pool. 84 Schools in the high school pool have 30 or more students in their graduation cohort in both the current and prior accountability year. All other schools are considered in the K-8 pool. 85 These one-year TVAAS composites include only accountability subjects and do not include ACT value-added data. 86 ESSA required the department to include 2017-18 data to identify the bottom 5 percent of schools for CSI. For more information regarding CSI and ATSI identifications, access the Accountability User Guide. 87 Based on data availability, the next priority school identification may use only the one-year success rates. If three-year success rates were to be used, they would include data from 2016-2017 (for schools held harmless), 2018-19, 2020-21 (for schools not held harmless), and 2021-2022. In addition, TVAAS composites will be reviewed for suitability for these identifications. 88 Based on a lagged, one-year graduation rate for all students in schools with at least 30 students in the graduation cohort in that year (i.e., the 2020-21 Priority list will include schools with all students graduation rates from 2020 of less than 67 percent, assuming those schools have less than 30 students in the cohort). 89 Except the Achievement indicator, which is included by way of success rates.

Page 50 of 71
Additionally, ESSA requires that schools90 that remain identified for Targeted Support (Focus schools) for the same subgroup(s) for multiple years become Priority schools. More specifically, schools that are identified for ATSI in two consecutive cycles will become Priority schools. For example, schools that are identified during the 2020-21 and again in the 2023-24 ATSI identification cycles will earn Priority status, which will take effect during the 2024-25 school year. Focus schools that are identified for multiple student groups must exit Focus status for each identified group at least once within the three-year cycle to avoid Priority identification.
90 Defined as TSI and ATSI schools in Tennessee’s approved ESSA plan. For more information regarding Focus school identifications, reference Section 4.6.

Page 51 of 71
4.5.1 Priority Exit Criteria
Hold Harmless Flag: Priority schools that meet the 80% participation requirement to be held harmless can have the priority designation removed upon meeting priority exit criteria detailed in the state’s accountability model.
To exit Priority/CSI status, a school must satisfy the Priority exit criteria and requirements to be held harmless. To exit priority status, a school must meet one of the following:
• The school’s one-year success rate for the All Students group exceeds the 10th percentile in the state in both of the two most recent years with success rate data;
• The school’s one-year success rate for the All Students group exceeds the 15th percentile in the state in the most recent year;
• The school earns a TVAAS level of 4 or 5 in all accountability subjects/content area composites (Literacy/Numeracy) for both of the two most recent years with TVAAS data;
• If it was identified for graduating less than 67 percent of its students, the school can exit by graduating at least 67 percent of its students in both of the two most recent years;
• If it was identified for consistently underperforming student groups (i.e., Focus), the school can exit by meeting or exceeding success rate AMO targets for each student group for which the school was identified.91 A school identified for multiple subgroups may exit for individual subgroups by meeting AMO targets for that given group. A school need not meet AMO targets for all subgroups in all years to exit. However, a school must meet targets for all identified subgroups in at least one of the years between identification.
Additionally, schools may exit Priority status every three years by not appearing on the subsequent Priority list.
4.6 Focus School Identification
Focus schools have one or more significantly and/or consistently underperforming subgroup(s). The final grades of Focus schools will be indicated with a minus sign (e.g., a school with an overall grade of C that is identified as a Focus school will have a reported grade of C-).92 Schools receiving a Focus designation may not earn a letter grade higher
91 The department does not use confidence intervals when determining whether Priority schools that are identified for consistently underperforming subgroups have met AMO targets. 92 With the exception of schools that earn a grade of D. These will not be labeled with a minus sign.
Hold Harmless Flag: Schools meeting the held harmless criteria cannot be identified as Focus schools and will not have letter grades assigned.
Comparative Ratings
For relative metrics, such as those used in identifying the 10th percentile, performance rates for all schools and districts will be calculated for exiting purposes, regardless of whether they are held harmless.
Page 52 of 71
than a “B-“. This includes schools with overall accountability scores greater than 3.1. Focus school identification includes two categories of federal school designations: Targeted Support and Improvement (TSI) and Additional Targeted Support and Improvement. Both groups of schools are considered Focus schools. Focus schools that earn a designation based on the same historically underserved student group(s) for three consecutive identification cycles will earn a Priority designation starting in 2020-21. Federal law requires the department to identify TSI and ATSI schools for three of the four accountability student groups93 and for six individual racial and ethnic groups.94 Additionally, the combined student group of Black/Hispanic/Native American students is also used for identification, in accordance with Tennessee’s approved ESSA plan. These schools are identified based on different timelines and methodologies, as outlined below.
4.6.1 Targeted Support and Improvement The department identifies TSI schools each year. Schools are eligible95 for TSI identification if they have one or more student groups whose overall accountability score includes data from all indicators.96 Schools whose overall accountability scores for a given student group are in the bottom five percent for that student group will be identified as TSI schools. For example, a school in which ED students perform in the bottom five percent of all eligible ED student groups will be identified as TSI for its ED student group.
4.6.2 Additional Targeted Support and Improvement The department identifies ATSI schools every three years. ESSA defines ATSI schools as those in which “any subgroup of students, on its own, would lead to identification” as a Priority school.97 Only schools identified as TSI based on the most recent TSI list will be eligible for ATSI identification.98 TSI schools whose student group success rates99 are less than or equal to the maximum success rate of any Priority school in their pool100 will be identified as ATSI if they do not also have a score of A or B for each indicator for which that student group is eligible.
93 Accountability subgroups include Economically Disadvantaged students, English Learners, and Students with Disabilities. Black/Hispanic/Native American students are required as part of Tennessee’s approved ESSA plan. 94 These individual racial and ethnic groups are Hispanic/Latino, Black or African American, American Indian or Alaska Native, Native Hawaiian or Pacific Islander, Asian, and White. 95 A school that is identified for Comprehensive Support and Improvement may not also be identified as Targeted Support and Improvement 96 Schools must be eligible for all indicators in their pool other than ELPA (and Graduation Rate and Ready Graduate for K-8 schools) to be eligible for TSI identification. 97 See ESEA of 1965 §1111 (d)(2)(C). 98 The department will calculate the TSI list before determining the ATSI school list. For example, the TSI list generated at the end of the 2019-20 school year, which will be based on 2019-20 data, will determine which schools are eligible for ATSI identification in 2020-21. 99 These success rates will include the same subjects and multiple years of data that are included in the Priority school success rates to which they are compared, with the exception of the 2019-20 identification, which will use data from the 2017-18, 2018-19, and 2019-20 school years. In addition, three-year TVAAS composites will be utilized for these identifications. 100 Based on the Priority list identified that same year. For the 2019-20 school year, the department will use the success rates from the 2017-18 identification because the department will not newly identify Priority schools in the 2019-20 school year.

Page 53 of 71
4.6.3 Focus Exit Criteria
Hold Harmless Flag: ATSI schools meeting the exit criteria and the 80% TCAP participation requirements for the school and for each group of students identified for the ATSI designation are eligible for ATSI Exit.
TSI schools are identified annually and may only exit if they are not identified as TSI schools in the following year. If no new TSI school list is generated for a given year, schools will retain the TSI designation from the previous year until a new TSI list is generated.101 ATSI schools that meet the minimum required number of students in the year of identification but not in subsequent years will retain their ATSI status. Such schools will automatically exit during the next identification cycle if they still do not meet required minimum student counts. Schools that continue to meet the minimum required number of students in the next identification cycle will be eligible for ATSI identification and exit. Schools may exit ATSI status annually by meeting one of the following exit criteria:
• The school’s one-year success rate for each student group for which it was identified exceeds the 10th percentile in the state for each student group in both of the two most recent years;
• The school’s one-year success rate for each student group for which it was identified exceeds the 15th percentile in the state for each student group in the most recent year;
• The school earns a TVAAS level of 4 or 5 in all accountability subjects/content area composites (Literacy/Numeracy) for both of the two most recent years for each student group for which it was identified; or
• If it was identified for graduating less than 67 percent of its students, the school can exit by graduating at least 67 percent of its students for each subgroup for which it was identified in both of the two most recent years.
ATSI is another federal designation which differs from CSI schools in that the ATSI designation is tied to specific groups of students. For a school to exit ATSI status, it must satisfy the exit criteria in the state’s approved ESSA plan and 80% participation requirements for the school and for each group of students identified for the ATSI designation. Federal designations are contingent upon the approval of the state’s ESSA state plan waiver.
4.7 Reward School Identification Schools earn Reward status based on the most recent year of data102. Schools earn Reward status if they earn an overall weighted average of 3.1 or higher and are not identified as Priority or Focus schools.
101 For the 2020-2021 school year, as with the 2019-2020 school year, if no new TSI list of schools is generated, TSI schools will retain their TSI status from 2019. 102 The Graduation Rate and Ready Graduate indicators are lagged measures by one year; therefore, the most recent year of data for these two indicators will be used in the subsequent year.
Reward Schools
Schools that are held harmless can still earn the status of reward schools, even if they do not have a letter grade assigned.
Comparative Focus Exit Criteria
For relative metrics, such as those used in identifying the 10th percentile, performance rates for all schools and districts will be calculated for exiting purposes, regardless of whether they are held harmless. For each student group identified for Focus Schools, this comparison will be across all schools for that same student group.

Page 54 of 71
Section 5: District Accountability
Hold Harmless Flag: Districts that are held harmless will not have any ratings, scores, or designations for the 2020-21 school year. For all others, the full district accountability system of this section applies. For districts held harmless, only the underlying metrics will be reported as they have been in other hold harmless years.
5.1 Indicators and Designations The following indicators103 are included in district accountability:
• Grades 3–5 success rate • Grades 6–8 success rate • Grades 9–12 success rate • Grades K–12 chronically out of school • Grades K–12 English Language Proficiency Assessment (ELPA) • Graduation rate
District performance across these indicators earns one of five possible determinations:
• Exemplary • Advancing • Satisfactory • Marginal • In need of improvement
5.2 Historically Underserved Student Groups and Minimum Required Counts Students are included in applicable student groups to ensure all Tennessee students achieve high levels of success. All students are included in the All Students group. If applicable, students are also included in the following historically underserved student groups:
• Super Subgroup104 • Black, Hispanic, and Native American students • Economically Disadvantaged students • English Learners105 • Students with Disabilities
103 For the success rate indicators, the subjects will include math and ELA data for 2019-20 accountability. 104 The Super Subgroup includes all records that identify at least one of the historically underserved student groups listed. Consult Section 2.3.2 for more information. 105 English Learners include Transition 1-4 students.
Page 55 of 71
Student groups are included in accountability calculations for the success rate indicator if there are at least 30 valid tests in a given content area in the current and prior year.106 Student groups are included in accountability calculations for the ELPA indicator if there are at least 30 students with valid composite and literacy performance levels in the current and prior year. Student groups with at least 30 students in grades K through 12 who are enrolled for at least 50 percent of instructional days are included for the chronically out of school indicator. Student groups with at least 30 students in the graduation cohort are included for the graduation rate indicator. Districts will only receive scores for the indicators for which they have sufficient data for both the AMO and absolute performance pathways.107 Records with a blank or unknown race/ethnicity will be assigned to the All Students group, even if, for example, the student is Black, Hispanic, or Native American and would otherwise be assigned to the BHN student group. The same is true for records that do not accurately reflect students’ status as ED students, EL, and SWD. This highlights the importance of ensuring accurate student data at the district and school levels before the final day of the testing window.
5.3 Indicators and Calculation Procedures 5.3.1 Calculation Procedures
Hold Harmless Flag: Districts that are held harmless will not have any ratings, scores, or designations for these indicators for the 2020-21 school year. For all others, the full district accountability system of this section applies. For districts held harmless, only the underlying metrics will be reported as they have been in other hold harmless years.
Districts are evaluated on 6 indicators: • 3-5 Success Rate • 6-8 Success Rate • 9-12 success Rate • Chronically Out of School • Graduation Rate • English Language Proficiency Assessment
Districts earn between 0 and 4 points for each goal and indicator for which they are eligible108. District performance goals and definitions are outlined below:
106 Valid tests are those test records for which a performance level can be assigned. 107 Districts may receive scores for indicators in which they do not have sufficient data for a value-added score so long as they have sufficient data for both the AMO and absolute performance pathways. 108 All indicators are weighted evenly. Meaning, if a district served only K-8 students, their determination will be based off 5 indicators averaged together.

Page 56 of 71
Table 24: District Performance Goals and Definitions District Performance Goal Definition
Absolute Performance Percent of students that meet the defined criteria (i.e., the percent of students who graduate) AMO Target Yearly targets for improving performance based on prior year results Value-Added Value a district adds and how that compares to the performance of other districts in the state
Overall indicator scores average the number of points a district receives for the value-added performance goal averaged with the best of their absolute performance and AMO targets. For example, a district with an AMO pathway score of 2, an absolute performance pathway score of 3, and a value-added pathway score of 4 will receive a final score of 3.5 which reflects the best of absolute and AMO performance (3) averaged with the value-added score (4). This process is conducted for the All Students group first, then repeated for each historically underserved student group. Final indicator averages weight all students and subgroup indicator averages at 60 percent and 40 percent, respectively. Final indicator averages are rounded to one decimal place. For each step identified with a status (all students, student groups, and final district), determination scales will follow as such:
• Scores greater than or equal to 3.1 will be labeled exemplary109. • Scores greater than or equal to 2.1 but less than 3.1 will be labeled advancing. • Scores greater than or equal to 1.1 but less than 2.1 will be labeled satisfactory. • Scores less than 1.1 will be labeled marginal.
Consider the example of the district in Table 24.
5.3.1.1 Step 1: All Students Status Average the value-added score with the higher of the Absolute proficiency and the AMO. Then average all overall scores. Table 25: All Student Status Calculation
Indicator Absolute Proficiency AMO Targets Value-Added Overall Score 3-5 Success Rate 2 1 2 2 6-8 Success Rate 0 2 0 1
9-12 Success Rate 3 1 3 3
Chronically Out of School 1 2 0 1 Graduation Rate 2 4 2 3
English Language Proficiency 3 4 4 4 All Students Status 2.33
Advancing
109 Districts in which all schools are identified as Reward, may also be labeled as Exemplary in the event that the district’s overall score is not greater than or equal to 3.1.

Page 57 of 71
5.3.1.2 Step 2: Student Group Average Average the value-added score with the higher of the Absolute proficiency and the AMO. Then average all overall scores for each of the 4 historically underserved student groups. Table 26: Student Group Average Calculation
Indicator Absolute Proficiency AMO Targets Value-Added Overall Score 3-5 Success Rate 1 1 4 2.5 6-8 Success Rate 3 1 2 2.5
9-12 Success Rate 2 0 2 2
Chronically Out of School 3 1 0 1.5 Graduation Rate 4 1 1 2.5
English Language Proficiency 1 2 3 2.5 BHN Average 2.25
5.3.1.3 Step 3: Student Group Status Average the overall scores and each student group average to calculate the student group status. Missing values for the English learners column indicate that the district in the example above does not have at least 30 EL students for any indicator. Table 27: Student Group Status Calculation
Indicator BHN ED EL SWD 3-5 Success Rate 2.5 1 1 6-8 Success Rate 2.5 3.5 1.5
9-12 Success Rate 2 1 0
Chronically Out of School 1.5 2 1.5 Graduation Rate 2.5 2 1.5
English Language Proficiency 2.5 2.5 1.5 Student Group Average 2.25 2 1.17
Student Group Status 1.81
Satisfactory
5.3.1.4 Step 4: Final District Determination Final determinations weight all students and subgroup grades at 60 percent and 40 percent, respectively. Final determinations are rounded to the one decimal place. Table 28: Final District Determination Calculation
Status Average Determination Overall Average Final Determination All Students (60%) 2.33 Advancing
2.12 Advancing Student Groups (40%) 1.81 Satisfactory
Districts earn final accountability determinations based on the following scale.
• Districts with an overall score greater than or equal to 3.1 will be labeled exemplary110. • Districts with an overall score greater than or equal to 2.1 but less than 3.1 will be labeled advancing. • Districts with an overall score greater than or equal to 1.1 but less than 2.1 will be labeled satisfactory. • Districts with an overall score less than 1.1 will be labeled marginal.
110 Districts in which all schools are identified as Reward, may also be labeled as Exemplary in the event that the district’s overall score is not greater than or equal to 3.1.
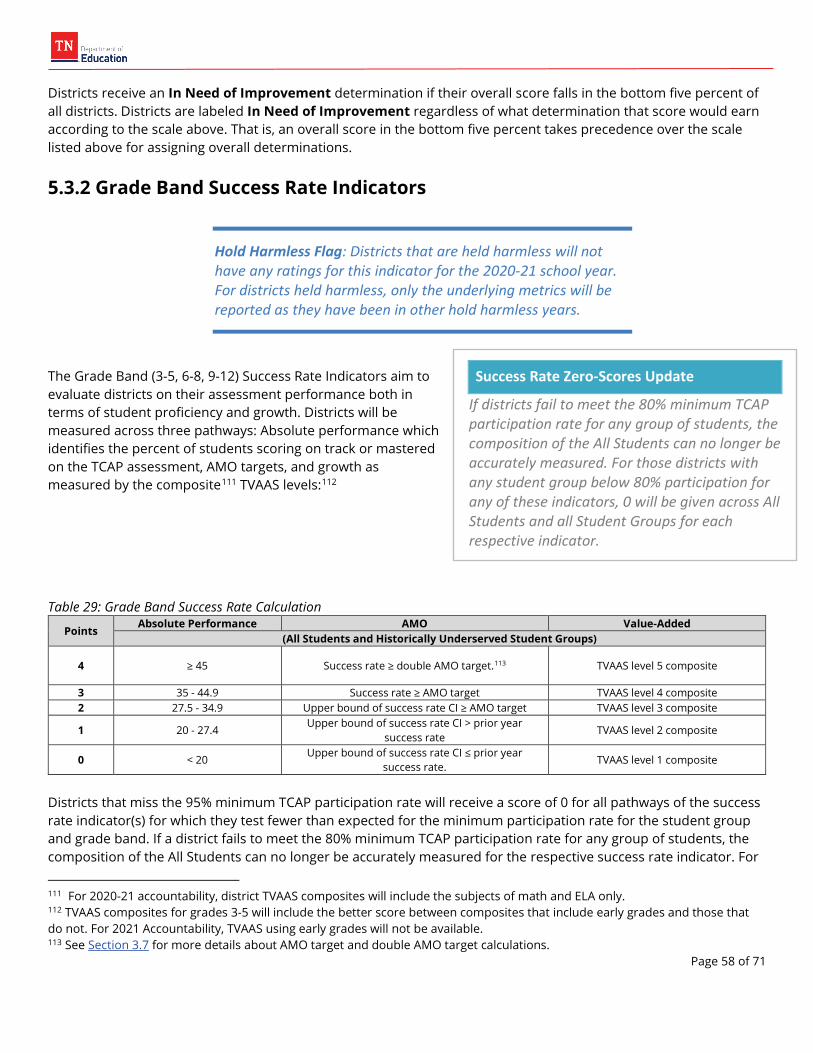
Page 58 of 71
Districts receive an In Need of Improvement determination if their overall score falls in the bottom five percent of all districts. Districts are labeled In Need of Improvement regardless of what determination that score would earn according to the scale above. That is, an overall score in the bottom five percent takes precedence over the scale listed above for assigning overall determinations.
5.3.2 Grade Band Success Rate Indicators
Hold Harmless Flag: Districts that are held harmless will not have any ratings for this indicator for the 2020-21 school year. For districts held harmless, only the underlying metrics will be reported as they have been in other hold harmless years.
The Grade Band (3-5, 6-8, 9-12) Success Rate Indicators aim to evaluate districts on their assessment performance both in terms of student proficiency and growth. Districts will be measured across three pathways: Absolute performance which identifies the percent of students scoring on track or mastered on the TCAP assessment, AMO targets, and growth as measured by the composite111 TVAAS levels:112 Table 29: Grade Band Success Rate Calculation
Points Absolute Performance AMO Value-Added
(All Students and Historically Underserved Student Groups)
4 ≥ 45 Success rate ≥ double AMO target.113 TVAAS level 5 composite
3 35 - 44.9 Success rate ≥ AMO target TVAAS level 4 composite 2 27.5 - 34.9 Upper bound of success rate CI ≥ AMO target TVAAS level 3 composite
1 20 - 27.4 Upper bound of success rate CI > prior year
success rate TVAAS level 2 composite
0 < 20 Upper bound of success rate CI ≤ prior year
success rate. TVAAS level 1 composite
Districts that miss the 95% minimum TCAP participation rate will receive a score of 0 for all pathways of the success rate indicator(s) for which they test fewer than expected for the minimum participation rate for the student group and grade band. If a district fails to meet the 80% minimum TCAP participation rate for any group of students, the composition of the All Students can no longer be accurately measured for the respective success rate indicator. For
111 For 2020-21 accountability, district TVAAS composites will include the subjects of math and ELA only. 112 TVAAS composites for grades 3-5 will include the better score between composites that include early grades and those that do not. For 2021 Accountability, TVAAS using early grades will not be available. 113 See Section 3.7 for more details about AMO target and double AMO target calculations.
Success Rate Zero-Scores Update
If districts fail to meet the 80% minimum TCAP participation rate for any group of students, the composition of the All Students can no longer be accurately measured. For those districts with any student group below 80% participation for any of these indicators, 0 will be given across All Students and all Student Groups for each respective indicator.

Page 59 of 71
those districts with any student group below 80% participation for any of these indicators, 0 will be given across All Students and all Student Groups for each respective indicator.
5.3.3 Chronically Out of School Indicator
Hold Harmless Flag: Districts that are held harmless will not have any ratings for this indicator for the 2020-21 school year. For districts held harmless, only the underlying metrics will be reported as they have been in other hold harmless years.
The Chronically Out of School indicator observes students in grades K-12 identified as chronically absent, as defined in Section 3.6 both in terms of current rate and improvement. Districts will be measured across three pathways: absolute performance, which will represent the percent of students who are chronically absent, AMO targets, and the value-added measure. This calculates the percent of students who were chronically absent in the prior year and are not chronically absent in the current year as compared to statewide performance. Table 30: Chronically out of School Indicator Calculation
Points Absolute Performance AMO Value-Added
(All Students and Historically Underserved Student Groups)
4 ≤ 8 Absenteeism rate ≤ double AMO target Top quintile of statewide performance
3 8 - 11.5 Absenteeism rate ≤ AMO target Fourth quintile of statewide
performance 2 11.6 - 16.5 Lower bound of absenteeism CI ≤ AMO target Third quintile of statewide performance
1 16.6 - 25 Lower bound of absenteeism CI < Prior year
absenteeism rate Second quintile of statewide
performance
0 > 25 Lower bound of absenteeism CI ≥ prior year
absenteeism rate Bottom quintile of statewide
performance
5.3.4 Graduation Rate Indicator
Hold Harmless Flag: Districts that are held harmless will not have any ratings for this indicator for the 2020-21 school year. For districts held harmless, only the underlying metrics will be reported as they have been in other hold harmless years.
The Graduation Rate indicator aims to evaluate districts on postsecondary readiness both through graduation rate and Ready Graduate criteria. Districts will be measured across three pathways: absolute performance, which will represent the percent of graduates, graduation rate AMO targets, and the
Comparative Ratings
For relative metrics, such as those used in identifying the quintiles, performance rates for all schools and districts will be calculated, regardless of whether they are held harmless.
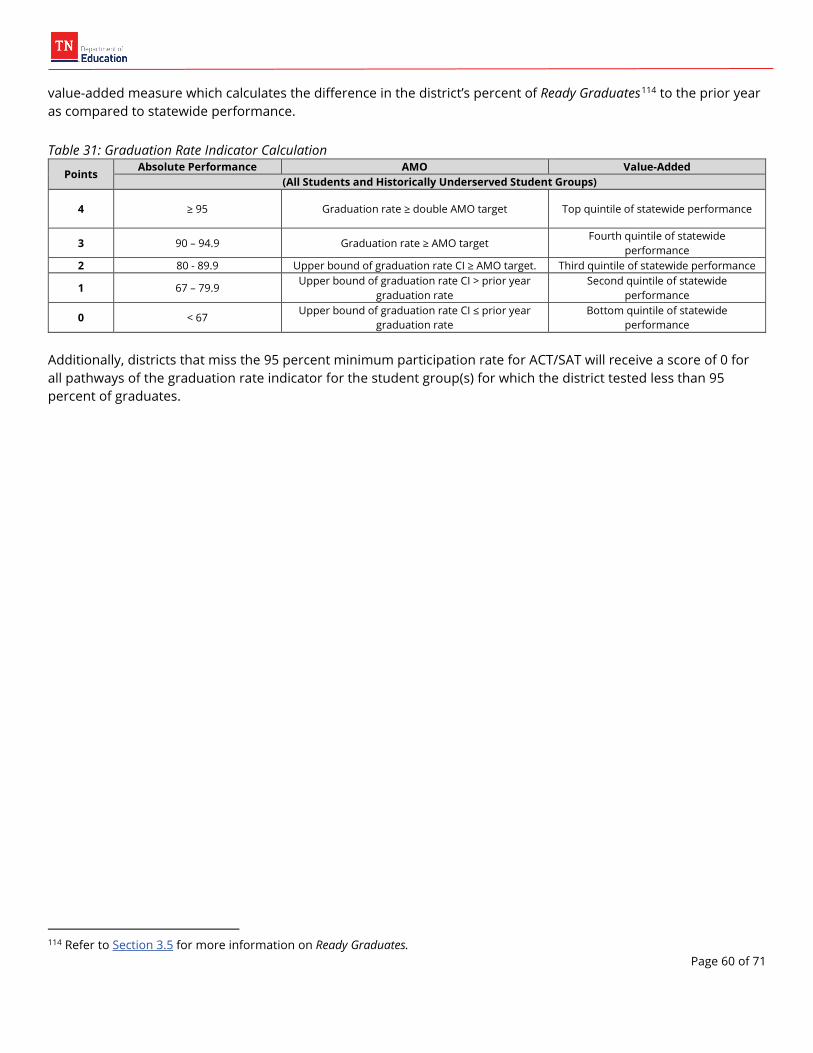
Page 60 of 71
value-added measure which calculates the difference in the district’s percent of Ready Graduates114 to the prior year as compared to statewide performance. Table 31: Graduation Rate Indicator Calculation
Points Absolute Performance AMO Value-Added
(All Students and Historically Underserved Student Groups)
4 ≥ 95 Graduation rate ≥ double AMO target Top quintile of statewide performance
3 90 – 94.9 Graduation rate ≥ AMO target Fourth quintile of statewide
performance 2 80 - 89.9 Upper bound of graduation rate CI ≥ AMO target. Third quintile of statewide performance
1 67 – 79.9 Upper bound of graduation rate CI > prior year
graduation rate Second quintile of statewide
performance
0 < 67 Upper bound of graduation rate CI ≤ prior year
graduation rate Bottom quintile of statewide
performance
Additionally, districts that miss the 95 percent minimum participation rate for ACT/SAT will receive a score of 0 for all pathways of the graduation rate indicator for the student group(s) for which the district tested less than 95 percent of graduates.
114 Refer to Section 3.5 for more information on Ready Graduates.
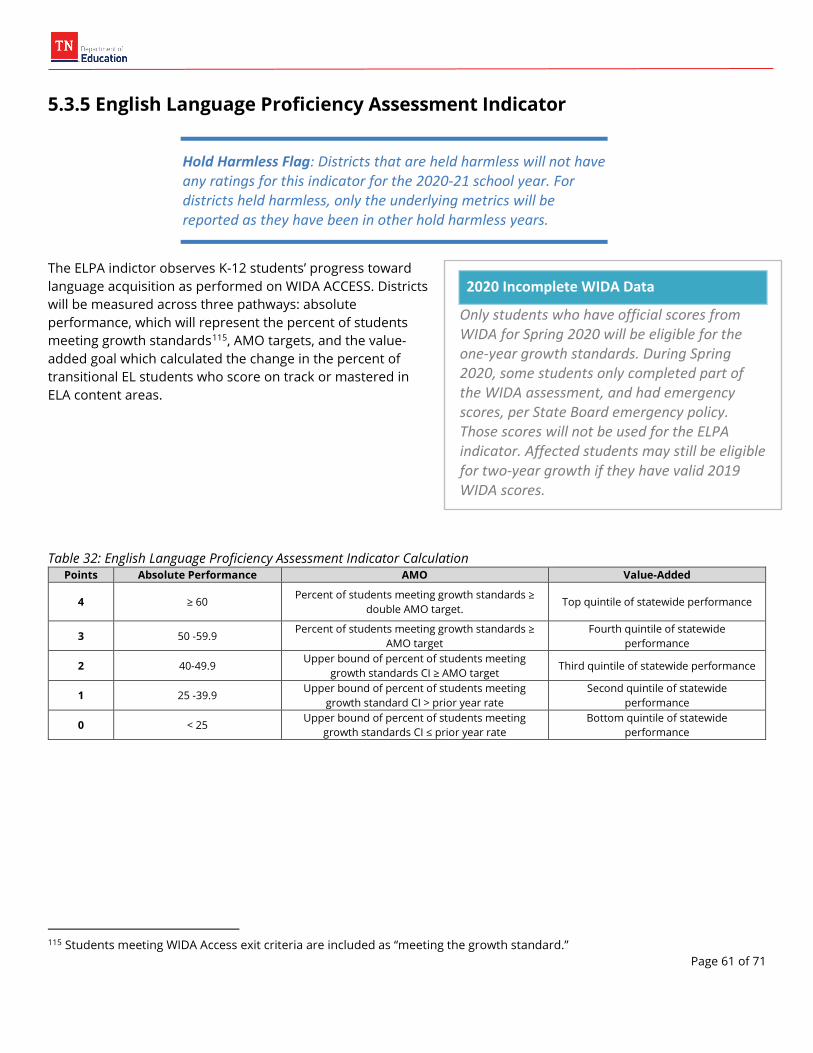
Page 61 of 71
5.3.5 English Language Proficiency Assessment Indicator
2020 Incomplete WIDA Data
Only students who have official scores from WIDA for Spring 2020 will be eligible for the one-year growth standards. During Spring 2020, some students only completed part of the WIDA assessment, and had emergency scores, per State Board emergency policy. Those scores will not be used for the ELPA indicator. Affected students may still be eligible for two-year growth if they have valid 2019 WIDA scores.
Hold Harmless Flag: Districts that are held harmless will not have any ratings for this indicator for the 2020-21 school year. For districts held harmless, only the underlying metrics will be reported as they have been in other hold harmless years.
The ELPA indictor observes K-12 students’ progress toward language acquisition as performed on WIDA ACCESS. Districts will be measured across three pathways: absolute performance, which will represent the percent of students meeting growth standards115, AMO targets, and the value-added goal which calculated the change in the percent of transitional EL students who score on track or mastered in ELA content areas. Table 32: English Language Proficiency Assessment Indicator Calculation
Points Absolute Performance AMO Value-Added
4 ≥ 60 Percent of students meeting growth standards ≥
double AMO target. Top quintile of statewide performance
3 50 -59.9 Percent of students meeting growth standards ≥
AMO target Fourth quintile of statewide
performance
2 40-49.9 Upper bound of percent of students meeting
growth standards CI ≥ AMO target Third quintile of statewide performance
1 25 -39.9 Upper bound of percent of students meeting
growth standard CI > prior year rate Second quintile of statewide
performance
0 < 25 Upper bound of percent of students meeting
growth standards CI ≤ prior year rate Bottom quintile of statewide
performance
115 Students meeting WIDA Access exit criteria are included as “meeting the growth standard.”

Page 62 of 71
Section 6: Files Delivered to Districts Districts can access the files described in this section from the Accountability application once accountability determinations are complete. These files include:
• TVAAS Files o TVAAS District Evaluation Composites o TVAAS School Evaluation Composites o TVAAS Teacher Evaluation Composites o TVAAS District Subject-Level Data o TVAAS School Subject-Level Data o TVAAS Teacher Subject-Level Data o TVAAS Student-Level Growth
• Student-Level Files o Student-Level Achievement File o ACT/SAT Spring Test Day Substitution Student-Level File (as applicable)
• District Accountability Files o District Assessment Data File o District Accountability Data File o District Heat Map File
• School Accountability Files o School Assessment Data File o School Accountability Data File o School Accountability List File o School Heat Maps File
• English Language Proficiency Assessment Files o ACCESS District-Level File o ACCESS School-Level File o ACCESS Student-Level File
• College Entrance Exams Files o ACT/SAT Graduate Highest Score District-Level File o ACT/SAT Graduate Highest Score School-Level File o ACT/SAT Graduate Highest Score Student-Level File o ACT Retake District-Level File o ACT Retake School-Level File o ACT Retake Student-Level File
• AMO Files o District-Level AMO Targets o School-Level AMO Targets
• Chronic Absenteeism Files o Chronic Absenteeism District-Level File o Chronic Absenteeism School-Level File o Chronic Absenteeism Student-Level File
• Ready Graduate Files o Ready Graduate District-Level File o Ready Graduate School-Level File o Ready Graduate Student-Level File
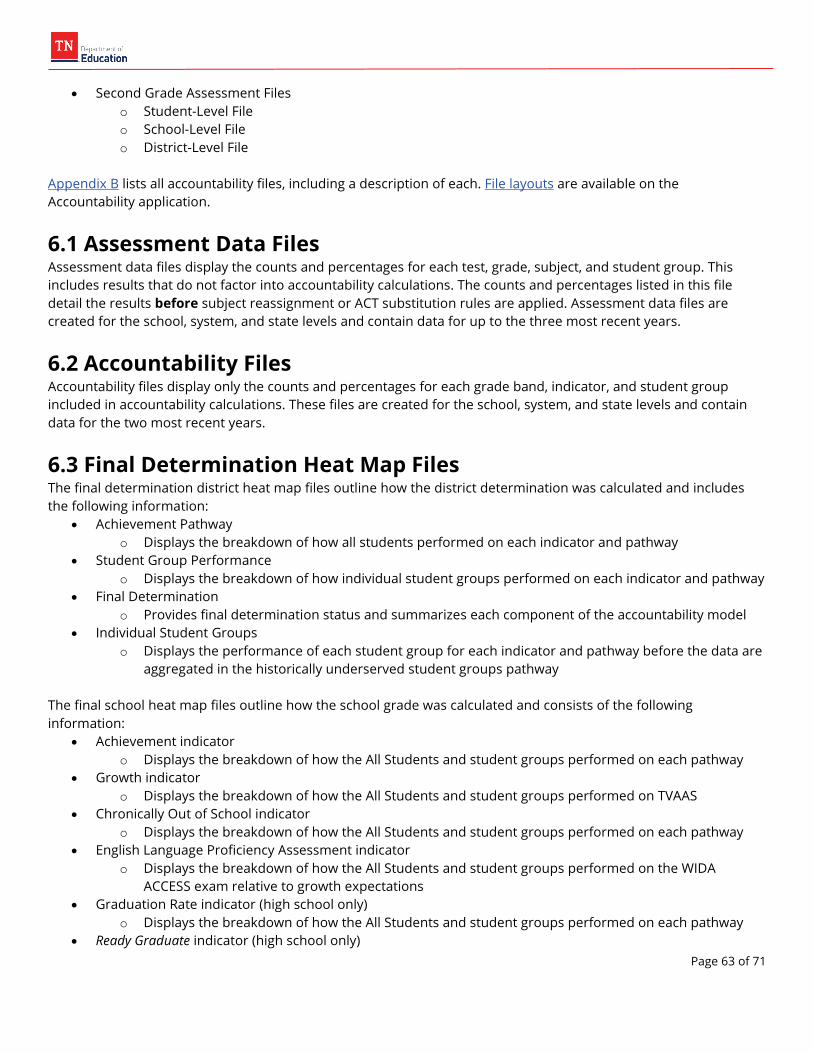
Page 63 of 71
• Second Grade Assessment Files o Student-Level File o School-Level File o District-Level File
Appendix B lists all accountability files, including a description of each. File layouts are available on the Accountability application.
6.1 Assessment Data Files Assessment data files display the counts and percentages for each test, grade, subject, and student group. This includes results that do not factor into accountability calculations. The counts and percentages listed in this file detail the results before subject reassignment or ACT substitution rules are applied. Assessment data files are created for the school, system, and state levels and contain data for up to the three most recent years.
6.2 Accountability Files Accountability files display only the counts and percentages for each grade band, indicator, and student group included in accountability calculations. These files are created for the school, system, and state levels and contain data for the two most recent years.
6.3 Final Determination Heat Map Files The final determination district heat map files outline how the district determination was calculated and includes the following information:
• Achievement Pathway o Displays the breakdown of how all students performed on each indicator and pathway
• Student Group Performance o Displays the breakdown of how individual student groups performed on each indicator and pathway
• Final Determination o Provides final determination status and summarizes each component of the accountability model
• Individual Student Groups o Displays the performance of each student group for each indicator and pathway before the data are
aggregated in the historically underserved student groups pathway The final school heat map files outline how the school grade was calculated and consists of the following information:
• Achievement indicator o Displays the breakdown of how the All Students and student groups performed on each pathway
• Growth indicator o Displays the breakdown of how the All Students and student groups performed on TVAAS
• Chronically Out of School indicator o Displays the breakdown of how the All Students and student groups performed on each pathway
• English Language Proficiency Assessment indicator o Displays the breakdown of how the All Students and student groups performed on the WIDA
ACCESS exam relative to growth expectations • Graduation Rate indicator (high school only)
o Displays the breakdown of how the All Students and student groups performed on each pathway • Ready Graduate indicator (high school only)

Page 64 of 71
o Displays the breakdown of how the All Students and student groups performed on each pathway • Final determination
o Provides final grade and summarizes each component of the accountability model
6.4 Student-Level Achievement Files Student-level files contain the scores that are used in accountability determinations for all students, including scores from the alternate assessment. The student-level files also outline which records changed due to accountability procedures, such as students whose scores were reassigned using the ACT/SAT sub-score substitution rules.116
6.5 English Language Proficiency Assessment Files English Language Proficiency Assessment (ELPA) files detail the performance and progress of English learners on the WIDA ACCESS exam.
6.6 TVAAS Files TVAAS files list composite and subject-level performance at the district, school, and teacher levels and a student-level growth file.
6.7 Ready Graduate Files Ready Graduate files display the counts and percentages of students who count in accountability calculations as meeting college and career readiness.
6.8 AMO Files AMO files outline district- and school-level performance targets.
6.9 Chronically Out of School Files Chronically out of school files display counts and percentages of students who count in accountability calculations as chronically out of school. The student-level file includes absenteeism rates for all students, regardless of whether they are included in accountability.
116 See Section 2.4.1.4 for more details.

Page 65 of 71
Appendix A: List of Acronyms Term Definition AMOs Annual Measurable Objectives ASD Achievement School District AP Advanced Placement
ASVAB AFQT Armed Services Vocational Aptitude Battery (ASVAB) Armed Forces Qualifying Test (AFQT) ATSI Additional Targeted Support and Improvement BHN Black, Hispanic, Native American Student Group CIE Cambridge International Examinations
CLEP College Level Examination Program CSI Comprehensive Support and Improvement CTE Career Technical Education Schools DE Dual Enrollment ED Economically Disadvantaged Student Group EIS Education Information System EL English Learner Student Group
ELA English Language Arts ELPA English Language Proficiency Assessment EOC End Of Course
EPSO Early Postsecondary Opportunity ESSA Every Student Succeeds Act (Most Recent Reauthorization of The Elementary and Secondary Education Act)
FD Functionally Delayed FTTT First Time Test Taker
IC Industry Credential IB International Baccalaureate
LDC Local Dual Credit LEP Limited English Proficiency LTEL Long-Term English Learner RAEL Recently Arrived English Learner
RI Reports of Irregularity SAT Scholastic Aptitude Test SDC Statewide Dual Credit SIS Student Information System
SWD Students with Disabilities Student Group TCAP Tennessee Comprehensive Assessment Program TSI Target Support and Improvement
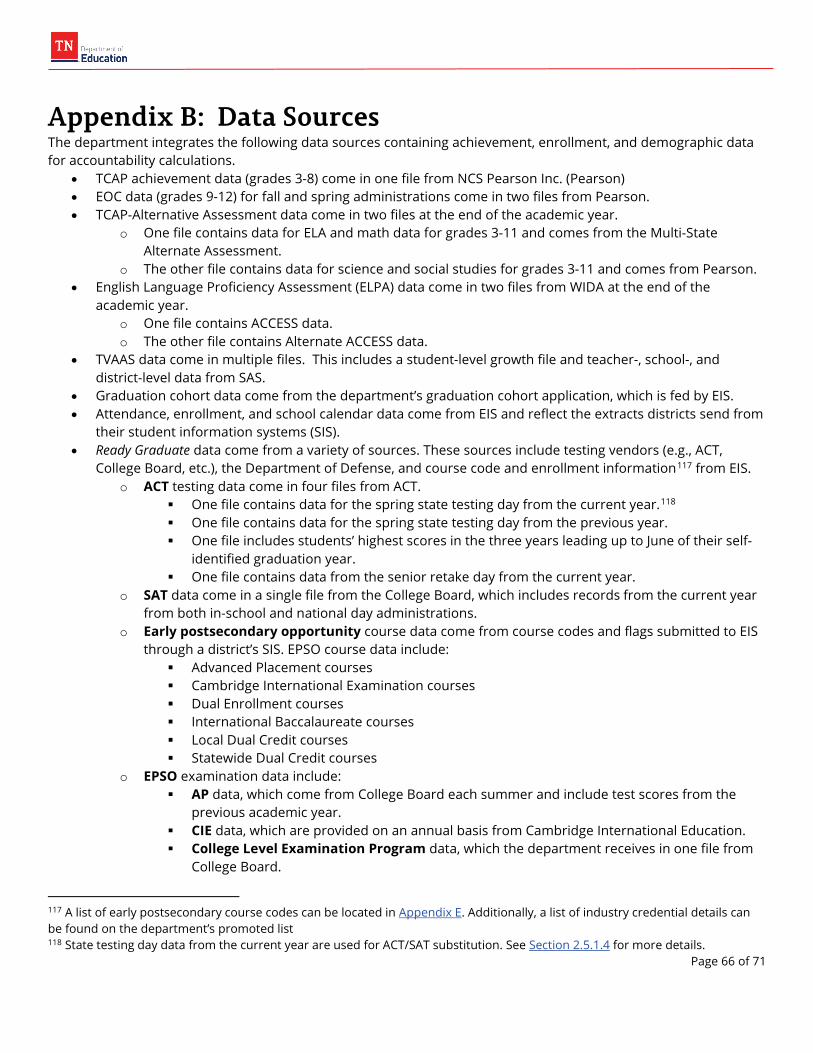
Page 66 of 71
Appendix B: Data Sources The department integrates the following data sources containing achievement, enrollment, and demographic data for accountability calculations.
• TCAP achievement data (grades 3-8) come in one file from NCS Pearson Inc. (Pearson) • EOC data (grades 9-12) for fall and spring administrations come in two files from Pearson. • TCAP-Alternative Assessment data come in two files at the end of the academic year.
o One file contains data for ELA and math data for grades 3-11 and comes from the Multi-State Alternate Assessment.
o The other file contains data for science and social studies for grades 3-11 and comes from Pearson. • English Language Proficiency Assessment (ELPA) data come in two files from WIDA at the end of the
academic year. o One file contains ACCESS data. o The other file contains Alternate ACCESS data.
• TVAAS data come in multiple files. This includes a student-level growth file and teacher-, school-, and district-level data from SAS.
• Graduation cohort data come from the department’s graduation cohort application, which is fed by EIS. • Attendance, enrollment, and school calendar data come from EIS and reflect the extracts districts send from
their student information systems (SIS). • Ready Graduate data come from a variety of sources. These sources include testing vendors (e.g., ACT,
College Board, etc.), the Department of Defense, and course code and enrollment information117 from EIS. o ACT testing data come in four files from ACT.
One file contains data for the spring state testing day from the current year.118 One file contains data for the spring state testing day from the previous year. One file includes students’ highest scores in the three years leading up to June of their self-
identified graduation year. One file contains data from the senior retake day from the current year.
o SAT data come in a single file from the College Board, which includes records from the current year from both in-school and national day administrations.
o Early postsecondary opportunity course data come from course codes and flags submitted to EIS through a district’s SIS. EPSO course data include:
Advanced Placement courses Cambridge International Examination courses Dual Enrollment courses International Baccalaureate courses Local Dual Credit courses Statewide Dual Credit courses
o EPSO examination data include: AP data, which come from College Board each summer and include test scores from the
previous academic year. CIE data, which are provided on an annual basis from Cambridge International Education. College Level Examination Program data, which the department receives in one file from
College Board.
117 A list of early postsecondary course codes can be located in Appendix E. Additionally, a list of industry credential details can be found on the department’s promoted list 118 State testing day data from the current year are used for ACT/SAT substitution. See Section 2.5.1.4 for more details.

Page 67 of 71
International Baccalaureate data, which come from an annual list of students who attempt either IB assessments or earn an IB diploma as part of the International Baccalaureate program.
Statewide Dual Credit assessment data, which come from the Early Postsecondary data system (EPS) and reflect the results of the Online Challenge Exam.
Industry Credential data, which come from various vendors. Consult the Tennessee Promoted Industry Credential Report for more information on IC data sources.
• A file listing the following types of schools comes from School Directory.119 o New schools o Closed schools o Career and technical education (CTE) schools o Alternative schools o Adult schools o Special education schools
These files contain all records included in accountability calculations. These files may contain other data not used in accountability.
119 Records from alternative schools will be remanded back to the most recent traditional school in which the student was enrolled if that school is in the same district as the alternative school at which the student tested. Students will be considered enrolled for 50 percent of the year if the number of instructional days for which they are enrolled across both the traditional and alternative school is at least half the greater number of instructional days between the traditional or alternative school. The department will also contact districts if no prior enrollment in a traditional school can be found.

Page 68 of 71
Appendix C: Accountability Files Purpose and Structure This appendix outlines the purpose and structure of all accountability files. Files 3 through 6 are all stored in separate worksheets of the final determination files. Consult the File Layout document on the Accountability application for more information.
Category File Name Description
2020-21 TVAAS Files
TVAAS District Evaluation Composites
This file includes district TVAAS composites by test type.
TVAAS School Evaluation Composites
This file includes school TVAAS composites by test type.
TVAAS Teacher Evaluation Composites
This file includes teacher TVAAS composites (both single- and multi-year) by test type.
TVAAS District Subject-Level Data
This file includes district growth measures, indices, and levels for individual grades and subjects.
TVAAS School Subject-Level Data
This file includes school growth measures, indices, and levels for individual grades and subjects.
TVAAS Teacher Subject-Level Data
This file includes teacher growth measures, indices, and levels for individual grades and subjects.
TVAAS Student-Level File This file includes student predicted and actual scores by indicator for understanding individual student growth.
2020-21 Student Level Files Student-Level File This file displays all TCAP testing data included in accountability, including alternate assessment data.
2020-21 District Files
District Assessment Data File This file displays data at the test/subject/grade/student group levels for all tested grades and subjects for the past three years, if available.
District Accountability File This file displays the aggregated data included in district accountability.
District Heat Map File This file contains the details of each component included to calculate districts’ final determinations.
2020-21 School Files
School Assessment File This file displays data at the subject/grade/student group levels for all tested grades and subjects for the past three years, if available.
School Accountability File This file displays the aggregated data included in school accountability. School Accountability File This file displays school pool and eligibility information.
School Heat Map File This file contains the details of each indicator included to calculate a school’s final grade.
2020-21 English Language Proficiency Assessment Files
ACCESS District-Level File This file displays the percent of students exiting and the percent of students meeting growth standards.
ACCESS School-Level File This file displays the percent of students exiting and the percent of students meeting growth standards.
ACCESS Student-Level File This file displays scale scores and performance levels for each domain and overall.
2020-21 ACT Files
ACT District-Level File This file contains average composite and subscore information for the highest scores graduates earned, as well as the percent of students meeting readiness benchmarks.
ACT School-Level File This file contains average composite and subscore information for the highest scores graduates earned, as well as the percent of students meeting readiness benchmarks.
ACT Student-Level File This file contains composite and subscore information for the highest scores graduates earned.
ACT Retake District-Level File This file contains average composite and subscore information for the scores students earned, as well as the percent of students meeting readiness benchmarks for the fall retake opportunity.
ACT Retake School-Level File This file contains average composite and subscore information for the scores students earned, as well as the percent of students meeting readiness benchmarks for the fall retake opportunity.
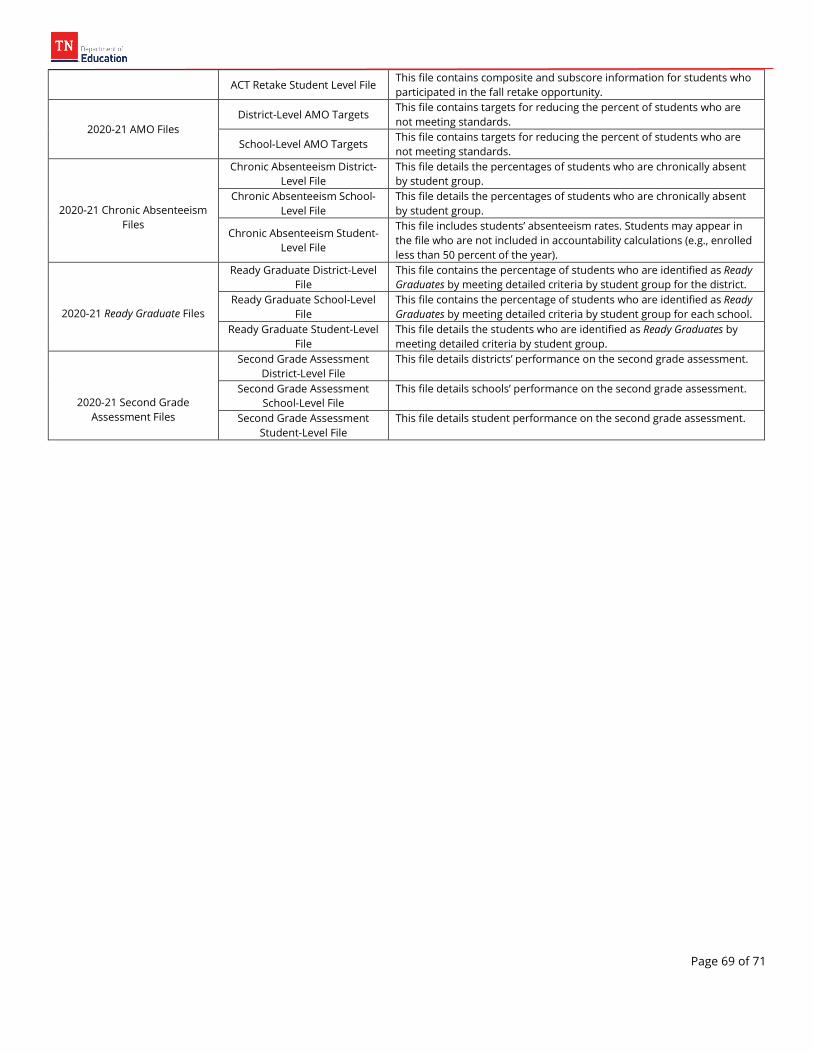
Page 69 of 71
ACT Retake Student Level File This file contains composite and subscore information for students who participated in the fall retake opportunity.
2020-21 AMO Files District-Level AMO Targets
This file contains targets for reducing the percent of students who are not meeting standards.
School-Level AMO Targets This file contains targets for reducing the percent of students who are not meeting standards.
2020-21 Chronic Absenteeism Files
Chronic Absenteeism District-Level File
This file details the percentages of students who are chronically absent by student group.
Chronic Absenteeism School-Level File
This file details the percentages of students who are chronically absent by student group.
Chronic Absenteeism Student-Level File
This file includes students’ absenteeism rates. Students may appear in the file who are not included in accountability calculations (e.g., enrolled less than 50 percent of the year).
2020-21 Ready Graduate Files
Ready Graduate District-Level File
This file contains the percentage of students who are identified as Ready Graduates by meeting detailed criteria by student group for the district.
Ready Graduate School-Level File
This file contains the percentage of students who are identified as Ready Graduates by meeting detailed criteria by student group for each school.
Ready Graduate Student-Level File
This file details the students who are identified as Ready Graduates by meeting detailed criteria by student group.
2020-21 Second Grade Assessment Files
Second Grade Assessment District-Level File
This file details districts’ performance on the second grade assessment.
Second Grade Assessment School-Level File
This file details schools’ performance on the second grade assessment.
Second Grade Assessment Student-Level File
This file details student performance on the second grade assessment.

Page 70 of 71
Appendix D: Confidence Interval Calculations The equation below is used to calculate confidence intervals (CIs) for each student group and subject.
ci95 = round
⎝
⎜⎛
100
⎝
⎛ nn + Z952
�p + �Z952
2n� ± Z95�
p(1 − p)n
+Z952
4n2�
⎠
⎞
⎠
⎟⎞
In the equation above, n represents the number of students with a valid test, Z95 = 1.96 from a standard normal distribution to have a 95 percent confidence interval, and p is the percentage of on track or mastered (or below) students.

Page 71 of 71
Appendix E: Percentile Rank Calculations Percentile rankings identify the school or student ranking, as defined below. Rankings identify the placement of a district, school, or student’s performance relative to other districts, schools, or students. See below for specific details pertaining to these calculation procedures.
E.1: Rankings A percentile rank is defined as the percentage of schools or districts with an equal or lesser score for the same year/student group/grade pool (as applicable). Listed below are the steps used to calculate a percentile rank:
1. Determine the number of eligible schools/districts according to the eligibility criteria listed in this protocol. 2. Reverse rank schools/districts so that schools with lower scores have a higher rank value120. 3. Divide each school’s/district’s rank by the number of eligible schools/districts. The percentile rank is
calculated using the following formula:
Percentile Rank = school rank
# of eligible schools∗ 100
In the event of a tie, the following business rule is applied: Schools get the best possible rank amongst schools. For example:
School Score Rank A 100 1 B 98 2 C 98 2 D 92 4
E.2: Student Rankings Student percentile rankings reported in the Student-level Assessment file will follow the calculation procedures outlined by SAS in the TVAAS technical document.
120 This step only applies to Priority and ATSI designations.