Embed Size (px)
Citation preview

2019-20 School Accountability Report Card for Beacon Park School Page 1 of 12
Beacon Park School
School Accountability Report Card
Reported Using Data from the 2019-2020 School Year
Published During 2020-2021
By February 1 of each year, every school in California is required by state law to publish a School Accountability Report Card (SARC). The SARC contains information about the condition and performance of each California public school. Under the Local Control Funding Formula (LCFF) all local educational agencies (LEAs) are required to prepare a Local Control and Accountability Plan (LCAP), which describes how they intend to meet annual school-specific goals for all pupils, with specific activities to address state and local priorities. Additionally, data reported in an LCAP is to be consistent with data reported in the SARC.
• For more information about SARC requirements and access to prior year reports, see the California Department of Education (CDE) SARC web page at https://www.cde.ca.gov/ta/ac/sa/.
• For more information about the LCFF or the LCAP, see the CDE LCFF webpage at https://www.cde.ca.gov/fg/aa/lc/.
• For additional information about the school, parents/guardians and community members should contact the school principal or the district office.
DataQuest DataQuest is an online data tool located on the CDE DataQuest web page at https://dq.cde.ca.gov/dataquest/ that contains additional information about this school and comparisons of the school to the district and the county. Specifically, DataQuest is a dynamic system that provides reports for accountability (e.g., test data, enrollment, high school graduates, dropouts, course enrollments, staffing, and data regarding English learners). California School Dashboard The California School Dashboard (Dashboard) https://www.caschooldashboard.org/ reflects California’s new accountability and continuous improvement system and provides information about how LEAs and schools are meeting the needs of California’s diverse student population. The Dashboard contains reports that display the performance of LEAs, schools, and student groups on a set of state and local measures to assist in identifying strengths, challenges, and areas in need of improvement.

2019-20 School Accountability Report Card for Beacon Park School Page 2 of 12
About This School
School Contact Information (School Year 2020-2021)
Entity Contact Information
School Name Beacon Park School
Street 200 Cultivate
City, State, Zip Irvine, CA 92618
Phone Number 949-936-8400
Principal Bob Curley
Email Address [email protected]
Website www.iusd.org/bp
County-District-School (CDS) Code 30-73650-0133389
District Contact Information (School Year 2020-2021)
Entity Contact Information
District Name Irvine Unified School District
Phone Number 949-936-5000
Superintendent Terry Walker
Email Address [email protected]
Website www.iusd.org
School Description and Mission Statement (School Year 2020-2021)
Beacon Park is a collaborative, compassionate, innovative, and visionary community where we encourage intellectual risk-taking in a safe, nurturing environment. At Beacon Park, we empower students with a core-set of values; create a culture of innovation; and personalize each learning environment with meaningful integration of technology which meets the unique needs of all learners. Beacon Park School will prepare the students to think critically and creatively and to be problem solvers and well-rounded lifelong learners. We incorporate meaningful integration of technology into instruction and learning, this has served us well as our district has moved to Distance Learning this year. We have open communication between staff, students, and our community. We foster a school culture in which students and staff can take intellectual risks, incorporating a variety of teaching strategies. Our goal is to prepare and empower all students with a core-set of values, character traits, and rigorous skills to meet the challenges of their future. Our students are active users of technology. They apply their learning to real-world issues. They take intellectual risks. Students experience a personalized learning environment to promote social engagement, problem-solving, and creativity inside the classroom and around our school.

2019-20 School Accountability Report Card for Beacon Park School Page 3 of 12
Student Enrollment by Grade Level (School Year 2019-2020)
Grade Level Number of Students
Kindergarten 93
Grade 1 113
Grade 2 114
Grade 3 105
Grade 4 106
Grade 5 104
Grade 6 83
Grade 7 100
Grade 8 141
Total Enrollment 959
Student Enrollment by Student Group (School Year 2019-2020)
Student Group Percent of Total Enrollment
Black or African American 2
Asian 57.1
Filipino 3.6
Hispanic or Latino 8.1
White 20.2
Two or More Races 7.9
Socioeconomically Disadvantaged 11.9
English Learners 20.6
Students with Disabilities 4.4
Homeless
A. Conditions of Learning
State Priority: Basic The SARC provides the following information relevant to the State priority: Basic (Priority 1):
• Degree to which teachers are appropriately assigned and fully credentialed in the subject area and for the pupils they are teaching;
• Pupils have access to standards-aligned instructional materials; and • School facilities are maintained in good repair
Teacher Credentials
Teachers School
2018-19 School
2019-20 School
2020-21 District 2020-21
With Full Credential 39.60 29 37 1663.99
Without Full Credential 0 0 0 0
Teaching Outside Subject Area of Competence (with full credential) 2.50 3.60 2.60 80.58

2019-20 School Accountability Report Card for Beacon Park School Page 4 of 12
Teacher Misassignments and Vacant Teacher Positions
Indicator 2018-19 2019-20 2020-21
Misassignments of Teachers of English Learners 0 0 0
Total Teacher Misassignments* 0 0 0
Vacant Teacher Positions 0 0 0 Note: “Misassignments” refers to the number of positions filled by teachers who lack legal authorization to teach that grade level, subject area, student group, etc. *Total Teacher Misassignments includes the number of Misassignments of Teachers of English Learners.
Quality, Currency, Availability of Textbooks and Other Instructional Materials (School Year 2020-2021) Year and month in which data were collected: October 2020
Subject Textbooks and Other Instructional
Materials/year of Adoption
From Most Recent
Adoption?
Percent Students Lacking Own
Assigned Copy
Reading/Language Arts All students are provided an individual textbook or instructional material as determined by textbook software in October, 2020. All core textbooks and instructional materials are state-adopted.
Yes 0%
Mathematics All students are provided an individual textbook or instructional material as determined by textbook software in October, 2020. All core textbooks and instructional materials are state-adopted.
Yes 0%
Science All students are provided an individual textbook or instructional material as determined by textbook software in October, 2020. All core textbooks and instructional materials are state-adopted.
Yes 0%
History-Social Science All students are provided an individual textbook or instructional material as determined by textbook software in October, 2020. All core textbooks and instructional materials are state-adopted.
Yes 0%
Foreign Language All students enrolled in a Foreign Language class is provided an individual textbook or instructional material. All textbooks purchased are board approved.
Yes 0%
Health All students are provided an individual textbook or instructional material as determined by textbook software in October, 2020. All core textbooks and instructional materials are state-adopted.
Yes 0%
Visual and Performing Arts All students are provided an individual textbook and/or instructional material.
Yes 0%
Note: Cells with N/A values do not require data.

2019-20 School Accountability Report Card for Beacon Park School Page 5 of 12
School Facility Conditions and Planned Improvements
The Beacon Park campus is designed to allow for flexible use of facilities and classrooms and meet multiple instructional needs and activities. Since our facilities are only five years old, there is no plan for facility improvements. Likewise they are in good repair and the custodian staff works diligently to keep the campus clean and safe for our students.
School Facility Good Repair Status Using the most recently collected FIT data (or equivalent), provide the following:
• Determination of repair status for systems listed • Description of any needed maintenance to ensure good repair • The year and month in which the data were collected • The rate for each system inspected • The overall rating
Year and month of the most recent FIT report: 12/7/2020
System Inspected Rating Repair Needed and Action Taken or Planned
Systems: Gas Leaks, Mechanical/HVAC, Sewer
XGood
Interior: Interior Surfaces XGood
STAFF LOUNGE: 4. WATER STAIN CEILING TILES
Cleanliness: Overall Cleanliness, Pest/ Vermin Infestation
XGood
Electrical: Electrical XGood
Restrooms/Fountains: Restrooms, Sinks/ Fountains
XGood
Safety: Fire Safety, Hazardous Materials
XGood
P 27: 11. PAINT IS CHIPPING ON RAILING P 28: 11. PAINT IS CHIPPING ON RAILING P 29: 11. PAINT IS CHIPPING ON EAVE
Structural: Structural Damage, Roofs
XGood
External: Playground/School Grounds, Windows/ Doors/Gates/Fences
XGood
Overall Rating XExemplary

2019-20 School Accountability Report Card for Beacon Park School Page 6 of 12
B. Pupil Outcomes
State Priority: Pupil Achievement The SARC provides the following information relevant to the State priority: Pupil Achievement (Priority 4): • Statewide assessments (i.e., California Assessment of Student Performance and Progress [CAASPP] System, which
includes the Smarter Balanced Summative Assessments for students in the general education population and the California Alternate Assessments [CAAs] for English language arts/literacy [ELA] and mathematics given in grades three through eight and grade eleven. Only eligible students may participate in the administration of the CAAs. CAAs items are aligned with alternate achievement standards, which are linked with the Common Core State Standards [CCSS] for students with the most significant cognitive disabilities); and
• The percentage of students who have successfully completed courses that satisfy the requirements for entrance to the University of California and the California State University, or career technical education sequences or programs of study.
CAASPP Test Results in ELA and Mathematics for All Students Grades Three through Eight and Grade Eleven Percentage of Students Meeting or Exceeding the State Standard
Subject School
2018-19 School
2019-20 District 2018-19
District 2019-20
State 2018-19
State 2019-20
English Language Arts/Literacy (grades 3-8 and 11)
76 N/A 78 N/A 50 N/A
Mathematics (grades 3-8 and 11)
76 N/A 74 N/A 39 N/A
Note: Cells with N/A values do not require data. Note: The 2019-2020 data are not available. Due to the COVID-19 pandemic, Executive Order N-30-20 was issued which waived the requirement for statewide testing for the 2019-2020 school year. Note: Percentages are not calculated when the number of students tested is ten or less, either because the number of students in this category is too small for statistical accuracy or to protect student privacy. Note: ELA and mathematics test results include the Smarter Balanced Summative Assessment and the CAA. The “Percent Met or Exceeded” is calculated by taking the total number of students who met or exceeded the standard on the Smarter Balanced Summative Assessment plus the total number of students who met the standard (i.e., achieved Level 3-Alternate) on the CAAs divided by the total number of students who participated in both assessments.
CAASPP Test Results in ELA by Student Group Grades Three through Eight and Grade Eleven (School Year 2019-2020)
Student Group Total
Enrollment Number Tested
Percent Tested
Percent Not
Tested
Percent Met or
Exceeded
All Students N/A N/A N/A N/A N/A
Male N/A N/A N/A N/A N/A
Female N/A N/A N/A N/A N/A
Black or African American N/A N/A N/A N/A N/A
American Indian or Alaska Native N/A N/A N/A N/A N/A
Asian N/A N/A N/A N/A N/A
Filipino N/A N/A N/A N/A N/A
Hispanic or Latino N/A N/A N/A N/A N/A
Native Hawaiian or Pacific Islander N/A N/A N/A N/A N/A
White N/A N/A N/A N/A N/A

2019-20 School Accountability Report Card for Beacon Park School Page 7 of 12
Student Group Total
Enrollment Number Tested
Percent Tested
Percent Not
Tested
Percent Met or
Exceeded
Two or More Races N/A N/A N/A N/A N/A
Socioeconomically Disadvantaged N/A N/A N/A N/A N/A
English Learners N/A N/A N/A N/A N/A
Students with Disabilities N/A N/A N/A N/A N/A
Students Receiving Migrant Education Services N/A N/A N/A N/A N/A
Foster Youth N/A N/A N/A N/A N/A
Homeless N/A N/A N/A N/A N/A
Note: Cells with N/A values do not require data. Note: The 2019-2020 data are not available. Due to the COVID-19 pandemic, Executive Order N-30-20 was issued which waived the requirement for statewide testing for the 2019-2020 school year.
CAASPP Test Results in Mathematics by Student Group Grades Three through Eight and Grade Eleven (School Year 2019-2020)
Student Group Total
Enrollment Number Tested
Percent Tested
Percent Not
Tested
Percent Met or
Exceeded
All Students N/A N/A N/A N/A N/A
Male N/A N/A N/A N/A N/A
Female N/A N/A N/A N/A N/A
Black or African American N/A N/A N/A N/A N/A
American Indian or Alaska Native N/A N/A N/A N/A N/A
Asian N/A N/A N/A N/A N/A
Filipino N/A N/A N/A N/A N/A
Hispanic or Latino N/A N/A N/A N/A N/A
Native Hawaiian or Pacific Islander N/A N/A N/A N/A N/A
White N/A N/A N/A N/A N/A
Two or More Races N/A N/A N/A N/A N/A
Socioeconomically Disadvantaged N/A N/A N/A N/A N/A
English Learners N/A N/A N/A N/A N/A
Students with Disabilities N/A N/A N/A N/A N/A
Students Receiving Migrant Education Services N/A N/A N/A N/A N/A
Foster Youth N/A N/A N/A N/A N/A
Homeless N/A N/A N/A N/A N/A
Note: Cells with N/A values do not require data. Note: The 2019-2020 data are not available. Due to the COVID-19 pandemic, Executive Order N-30-20 was issued which waived the requirement for statewide testing for the 2019-2020 school year.

2019-20 School Accountability Report Card for Beacon Park School Page 8 of 12
CAASPP Test Results in Science for All Students Grades Five, Eight, and High School Percentage of Students Meeting or Exceeding the State Standard
Subject School
2018-19 School
2019-20 District 2018-19
District 2019-20
State 2018-19
State 2019-20
Science (grades 5, 8 and high school) 61 N/A 64 N/A 30 N/A Note: Cells with N/A values do not require data. Note: The 2019-2020 data are not available. Due to the COVID-19 pandemic, Executive Order N-30-20 was issued which waived the requirement for statewide testing for the 2019-2020 school year. Note: The new California Science Test (CAST) was first administered operationally in the 2018-2019 school year.
State Priority: Other Pupil Outcomes The SARC provides the following information relevant to the State priority: Other Pupil Outcomes (Priority 8): • Pupil outcomes in the subject areas of physical education.
California Physical Fitness Test Results (School Year 2019-2020)
Grade Level Percentage of Students
Meeting Four of Six Fitness Standards
Percentage of Students Meeting Five of Six Fitness Standards
Percentage of Students Meeting Six of Six Fitness Standards
5 N/A N/A N/A
7 N/A N/A N/A
9 N/A N/A N/A Note: Cells with N/A values do not require data. Note: The 2019–2020 data are not available. Due to the COVID-19 pandemic, Executive Order N-56-20 was issued which waived the requirement to administer the physical fitness performance test for the 2019–2020 school year.
C. Engagement
State Priority: Parental Involvement The SARC provides the following information relevant to the State priority: Parental Involvement (Priority 3): • Efforts the school district makes to seek parent input in making decisions for the school district and each school site
Opportunities for Parental Involvement (School Year 2020-2021)
Parents at Beacon Park are invited to be involved in a variety of ways. While on-site volunteers are not able to be on campus this year due to COVID-19 Protocols, we encourage parents to be involved in many of our parent liaison groups. Parents are encouraged to be a part of our Parent-Teacher Association (on the Executive Board or as a committee member), in our School Site Council (advisory board to the principal), and on our English Language Advisory Committee (ELAC) for parents of children who speak another language at home other than English.

2019-20 School Accountability Report Card for Beacon Park School Page 9 of 12
State Priority: School Climate The SARC provides the following information relevant to the State priority: School Climate (Priority 6): • Pupil suspension rates; • Pupil expulsion rates; and • Other local measures on the sense of safety.
Suspensions and Expulsions (data collected between July through June, each full school year respectively)
Rate School
2017-18 School
2018-19 District 2017-18
District 2018-19
State 2017-18
State 2018-19
Suspensions 0.4 1.2 1.2 1.0 3.5 3.5
Expulsions 0.0 0.0 0.0 0.0 0.1 0.1
Suspensions and Expulsions for School Year 2019-2020 Only (data collected between July through February, partial school year due to the COVID-19 pandemic)
Rate School
2019-20 District 2019-20
State 2019-20
Suspensions 2 277
Expulsions 0 5 Note: The 2019-2020 suspensions and expulsions rate data are not comparable to prior year data because the 2019-2020 school year is a partial school year due to the COVID-19 crisis. As such, it would be inappropriate to make any comparisons in rates of suspensions and expulsions in the 2019-2020 school year compared to prior years.
School Safety Plan (School Year 2020-2021)
Beacon Park is in its fifth year, serving students in grades K-8. It is located in the community of the Great Park Neighborhood. Throughout each year, we work to improve and enhance our comprehensive safety plan. Our plan is evaluated yearly and amended, as needed, by the School Site Council and by the leaders of the Safe School Plan committee. Key elements of the plan include: 1. Assessing the current status of school crime committed on the school campus and at school-related functions, 2a. Child Abuse Reporting Procedures, 2b. Disaster Procedures-Routine and Emergency, 2c. Policies for Suspension, Expulsion and Mandatory Expulsion, 2d. Procedures for Notification of Staff Regarding Dangerous Students, 2e. Policies on Sexual Harassment, 2f. Policy Relating to School Dress Code (especially gang-related apparel), 2g. Procedures for Safe Ingress and Egress of Pupils, Parents, and School Employees To and From School, 2h. Procedures that Create a Safe and Orderly Environment Conducive to Learning at School, 2i. Rules and Procedures on School Discipline. In addition, monthly fire/evacuation drills, two simulation earthquake drills, and two shelter in place drills are scheduled and implemented throughout the school year to assess our level of preparedness. We purchase and replenish our emergency supplies annually with the help of the PTA and parent donations to ensure that all students and adults on campus will be cared for in case of any disaster. These emergency supplies (food, water, blankets, first aide, and all other emergency equipment) are kept in our emergency storage shed for immediate access if needed. Staff has also participated in CPR and First Aid Training (ie: "Stop the Bleed") provided through the district. We have updated our plan accordingly and continue to do so after each drill to ensure a fine tuned response system.

2019-20 School Accountability Report Card for Beacon Park School Page 10 of 12
D. Other SARC Information
The information in this section is required to be in the SARC but is not included in the state priorities for LCFF.
Average Class Size and Class Size Distribution (Elementary)
Grade Level
2017-18 Average
Class Size
2017-18 # of
Classes* Size 1-20
2017-18 # of
Classes* Size
21-32
2017-18 # of
Classes* Size 33+
2018-19 Average
Class Size
2018-19 # of
Classes* Size 1-20
2018-19 # of
Classes* Size
21-32
2018-19 # of
Classes* Size 33+
2019-20 Average
Class Size
2019-20 # of
Classes* Size 1-20
2019-20 # of
Classes* Size
21-32
2019-20 # of
Classes* Size 33+
K
27 5 23 4 2 23 2
1
29 4 27 4 28 4
2
29 4 27 4 29 4
3
28 4 27 4 26 4
4
30 3 31 3 33 1 5 1
5
28 3 32 1 2 27 1 6
6
29 11 2 33 1 8 8 27 2 15 1
Other**
31 1 *Number of classes indicates how many classes fall into each size category (a range of total students per class). ** “Other” category is for multi-grade level classes.
Ratio of Pupils to Academic Counselor (School Year 2019-2020)
Title Ratio
Academic Counselors* 1198.8 *One full time equivalent (FTE) equals one staff member working full time; one FTE could also represent two staff members who each work 50 percent of full time.
Student Support Services Staff (School Year 2019-2020)
Title Number of FTE*
Assigned to School
Counselor (Academic, Social/Behavioral or Career Development) 0.8
Library Media Teacher (Librarian) 0.3
Library Media Services Staff (Paraprofessional)
Psychologist
Social Worker
Nurse
Speech/Language/Hearing Specialist 0.9
Resource Specialist (non-teaching)
Other 1.5 *One Full Time Equivalent (FTE) equals one staff member working full time; one FTE could also represent two staff members who each work 50 percent of full time.

2019-20 School Accountability Report Card for Beacon Park School Page 11 of 12
Expenditures Per Pupil and School Site Teacher Salaries (Fiscal Year 2018-2019)
Level Total
Expenditures Per Pupil
Expenditures Per Pupil
(Restricted)
Expenditures Per Pupil
(Unrestricted)
Average Teacher Salary
School Site $7,807 $302 $7,504 $82,242
District N/A N/A $5,857 $84,323
Percent Difference - School Site and District N/A N/A 24.7 -2.5
State N/A N/A $7,750 $83,052
Percent Difference - School Site and State N/A N/A -3.2 -1.0 Note: Cells with N/A values do not require data.
Types of Services Funded (Fiscal Year 2019-2020)
The Local Control Funding Formula has replaced California’s previous method of allocating funds to school districts. In place of more than 40 specific funding categories, the new model has established three sources of state funding with increased local discretion to determine how best to spend those funds in the service of students. All districts receive a BASE of per-student funding that varies slightly depending on grade level. All districts also receive SUPPLEMENTAL funding. IUSD has used BASE and SUPPLEMENTAL funding to support the following programs: Site Programs and Services: 1) Support professional learning and teacher coaching through induction program, content TOSAs and teacher mentor program , 2) provide summer school and summer athletic programs, 3) Allocating site funding and staffing to support student achievement through support of Professional Learning Communities (PLC) and site PLC coaches, 4) Elementary P.E. paraprofessionals, 5) Support for English language learners, 6) Elementary science, music, and art programs, 7) Purchase textbooks and instructional materials, 8) Develop a technology rich learning environment including; Technology matching programs, Technology Maintenance fund and site technology support staff, 9) Maintain previously implemented class-size reduction, 10) Additional secondary sections to reduce class size, 11) Middle school zero period program, 12) Maintain positive behavioral intervention and support program, 13) Maintain site staffing with full-time assistant principals, 14) 450:1 counseling ratio, support for large elementary schools and elementary classroom aides, 15) Support interventions and supplemental programs impacting English learners, low income and foster youth, 16) Continue to build Career-Technical Education pathways and blended 0n-line learning opportunities for students, 17) Develop mental health and wellness programs and hire district and site based staff including support for the Irvine Family Resource Center. Finally, CONCENTRATION grant funding equal to 50 percent of the base is provided to districts in which English-learners, low-income students and foster youth exceed 55 percent of the total enrollment. Irvine Unified School District is not eligible for concentration funding because its enrollment does not exceed the 55 percent threshold.
2019-20 School Accountability Report Card for Beacon Park School Page 12 of 12
Teacher and Administrative Salaries (Fiscal Year 2018-2019)
Category District Amount
State Average For Districts
In Same Category
Beginning Teacher Salary $49,234 $50,029
Mid-Range Teacher Salary $87,931 $77,680
Highest Teacher Salary $113,662 $102,143
Average Principal Salary (Elementary) $138,075 $128,526
Average Principal Salary (Middle) $150,886 $133,574
Average Principal Salary (High) $171,949 $147,006
Superintendent Salary $330,377 $284,736
Percent of Budget for Teacher Salaries 33.0 33.0
Percent of Budget for Administrative Salaries 5.0 5.0 For detailed information on salaries, see the CDE Certificated Salaries & Benefits web page at https://www.cde.ca.gov/ds/fd/cs/.
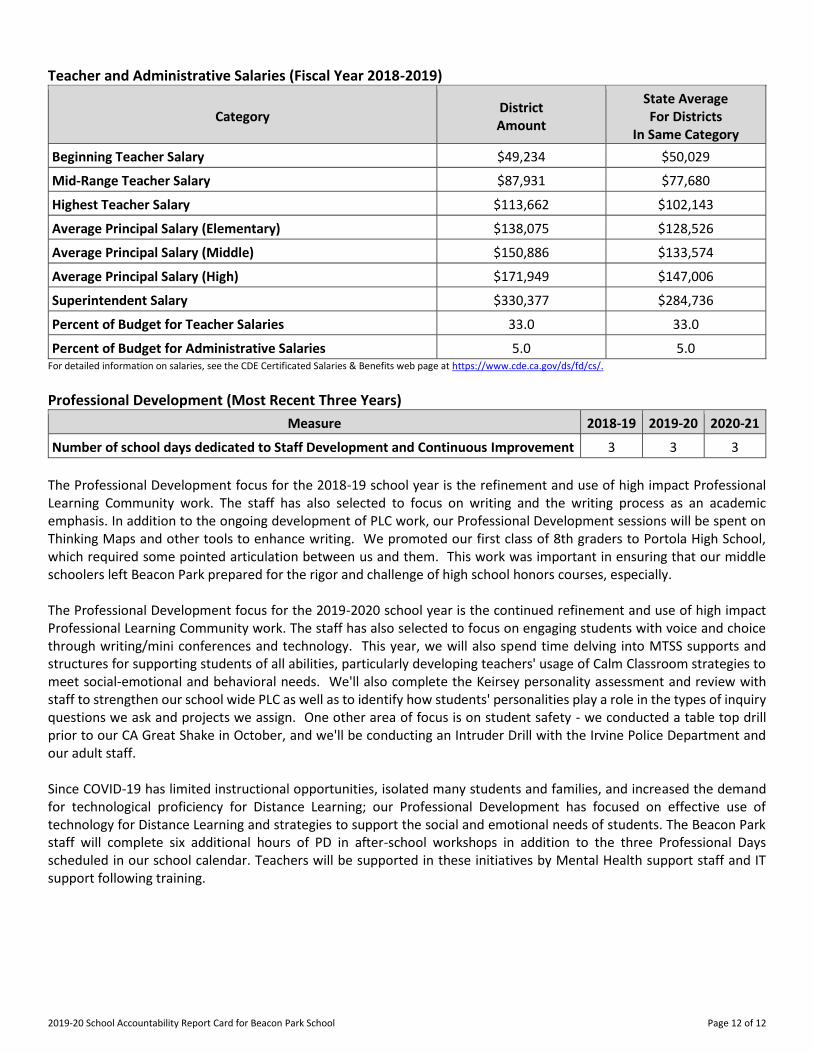
Professional Development (Most Recent Three Years)
Measure 2018-19 2019-20 2020-21
Number of school days dedicated to Staff Development and Continuous Improvement 3 3 3
The Professional Development focus for the 2018-19 school year is the refinement and use of high impact Professional Learning Community work. The staff has also selected to focus on writing and the writing process as an academic emphasis. In addition to the ongoing development of PLC work, our Professional Development sessions will be spent on Thinking Maps and other tools to enhance writing. We promoted our first class of 8th graders to Portola High School, which required some pointed articulation between us and them. This work was important in ensuring that our middle schoolers left Beacon Park prepared for the rigor and challenge of high school honors courses, especially. The Professional Development focus for the 2019-2020 school year is the continued refinement and use of high impact Professional Learning Community work. The staff has also selected to focus on engaging students with voice and choice through writing/mini conferences and technology. This year, we will also spend time delving into MTSS supports and structures for supporting students of all abilities, particularly developing teachers' usage of Calm Classroom strategies to meet social-emotional and behavioral needs. We'll also complete the Keirsey personality assessment and review with staff to strengthen our school wide PLC as well as to identify how students' personalities play a role in the types of inquiry questions we ask and projects we assign. One other area of focus is on student safety - we conducted a table top drill prior to our CA Great Shake in October, and we'll be conducting an Intruder Drill with the Irvine Police Department and our adult staff. Since COVID-19 has limited instructional opportunities, isolated many students and families, and increased the demand for technological proficiency for Distance Learning; our Professional Development has focused on effective use of technology for Distance Learning and strategies to support the social and emotional needs of students. The Beacon Park staff will complete six additional hours of PD in after-school workshops in addition to the three Professional Days scheduled in our school calendar. Teachers will be supported in these initiatives by Mental Health support staff and IT support following training.