Embed Size (px)
Citation preview

2020 2nd Quarter Investor Deck
August 6, 2020
2© 2020 Navient Solutions, LLC. All rights reserved.
Forward-Looking Statements; Non-GAAP Financial
MeasuresThe following information is current as of June 30, 2020 (unless otherwise noted) and should be read in connection with Navient Corporation’s “Navient” Annual Report on Form 10-K for the year ended December 31, 2019 (the “2019 Form 10-K”), filed by Navient with the Securities and Exchange Commission (the “SEC”) on February 27, 2020 and subsequent reports filed by Navient with the SEC. Definitions for capitalized terms in this presentation not defined herein can be found in the 2019 Form 10-K. This presentation contains “forward-looking statements”, within the meaning of the federal securities laws, about our business, and other information that is based on management’s current expectations as of the date of this presentation. Statements that are not historical facts, including statements about the company’s beliefs, opinions or expectations and statements that assume or are dependent upon future events, are forward-looking statements and often contain words such as “expect,” “anticipate,” “intend,” “plan,” “believe,” “seek,” “see,” “will,” “would,” “may,” “could,” “should,” “goal,” or “target.” Forward-looking statements are subject to risks, uncertainties, assumptions and other factors that may cause actual results to be materially different from those reflected in such forward-looking statements.
For Navient, these factors include, among others, the risks and uncertainties associated with:• the severity, magnitude and duration of the COVID-19 pandemic, including changes in the macroeconomic environment, restrictions on business, individual or travel activities intended to slow the spread of the pandemic and volatility in market conditions resulting from the pandemic including interest rates, the value of equities and other financial assets;• the risks and uncertainties associated with increases in financing costs;• unanticipated increases in costs associated with compliance with federal, state or local laws and regulations;• changes in the demand for asset management and business processing solutions or other changes in marketplaces in which we compete (including increased competition);• changes in accounting standards including but not limited to changes pertaining to loan loss reserves and estimates or other accounting standards that may impact our operations;• adverse outcomes in any significant litigation to which the company is a party;• credit risk associated with the company’s underwriting standards or exposure to third parties, including counterparties to hedging transactions; and• changes in the terms of education loans and the educational credit marketplace (including changes resulting from the CARES Act or other new laws and the implementation of existing laws).
The company could also be affected by, among other things:• unanticipated repayment trends on loans including prepayments or deferrals in our securitization trusts that could accelerate or delay repayment of the bonds;• reductions to our credit ratings, the credit ratings of asset-backed securitizations we sponsor or the credit ratings of the United States of America;• failures of our operating systems or infrastructure or those of third-party vendors;• risks related to cybersecurity including the potential disruption of our systems or those of our third-party vendors or customers or potential disclosure of confidential customer information;• damage to our reputation resulting from cyber-breaches, litigation, the politicization of student loan servicing or other actions or factors;• failure to successfully implement cost-cutting initiatives and adverse effects of such initiatives on our business;• failure to adequately integrate acquisitions or realize anticipated benefits from acquisitions including delays or errors in converting portfolio acquisitions to our servicing platform;• changes in law and regulations whether new laws or regulations or new interpretations of existing laws and regulations applicable to any of our businesses or activities or those of our vendors, suppliers or customers;• changes in the general interest rate environment, including the availability of any relevant money-market index rate, including LIBOR, or the relationship between the relevant money-market index rate and the rate at which our assets are priced;• our ability to successfully effectuate any acquisitions and other strategic initiatives;• activities by shareholder activists, including a proxy contest or any unsolicited takeover proposal;• changes in general economic conditions; and• the other factors that are described in the “Risk Factors” section of the 2019 Form 10-K and in our other reports filed with the Securities and Exchange Commission.
The preparation of the company’s consolidated financial statements also requires management to make certain estimates and assumptions including estimates and assumptions about future events. These estimates or assumptions may prove to be incorrect and actual results could differ materially. All forward-looking statements contained in this release are qualified by these cautionary statements and are made only as of the date of this release. The company does not undertake any obligation to update or revise these forward-looking statements except as required by law.
Navient reports financial results on a GAAP basis and also provides certain non-GAAP performance measures, including Core Earnings, Tangible Net Asset Ratio, and various other non-GAAP financial measures derived from Core Earnings. When compared to GAAP results, Core Earnings exclude the impact of: (1) mark-to-market gains/losses on derivatives; and (2) goodwill and acquired intangible asset amortization and impairment. Navient provides Core Earnings measures because this is what management uses when making management decisions regarding Navient’s performance and the allocation of corporate resources. Navient Core Earnings are not defined terms within GAAP and may not be comparable to similarly titled measures reported by other companies. For additional information, see Core Earnings in Navient’s second-quarter earnings release and pages 49 - 51 of this presentation for a further discussion and a complete reconciliation between GAAP net income and Core Earnings.

3© 2020 Navient Solutions, LLC. All rights reserved.
We are the leader in education loan management and business processing solutions
for education, healthcare and government clients at the federal, state and local levels
We help our clients and millions of Americans achieve financial success through our services and
support, leveraging our 45+ years of data, analytics and processing experience and excellence
Scaled, efficient industry-leading servicing platform
- Navient-serviced borrowers are 37% less likely to default
Executing our long-term value-creation strategy and utilizing our core strengths
- Stable cash flow generation from our legacy portfolio of government-guaranteed Education Loans
- Originating attractive, high credit quality Education Loans utilizing our scale and expertise
- Generating fee income by providing processing services that leverage our existing infrastructure
Disciplined expense management
- Consistent cost efficiency and continuous expense rationalization
Prudent capital allocation
- Maintaining dividend and returning excess capital to shareholders
Continuously evaluating alternatives to optimize capital structure and efficiency
Focused on delivering best-in-class service to our clients and maximizing long-term shareholder value
4© 2020 Navient Solutions, LLC. All rights reserved.
We Leverage Our Core Servicing Expertise in
Education Finance and Business Processing
Consumer Lending Segment Business Processing Segment
Own and Service
Education Loans
Originate and Refinance
Education Loans
Provide Processing Services for
Healthcare & Government Clients
Federal Education Loans
Segment
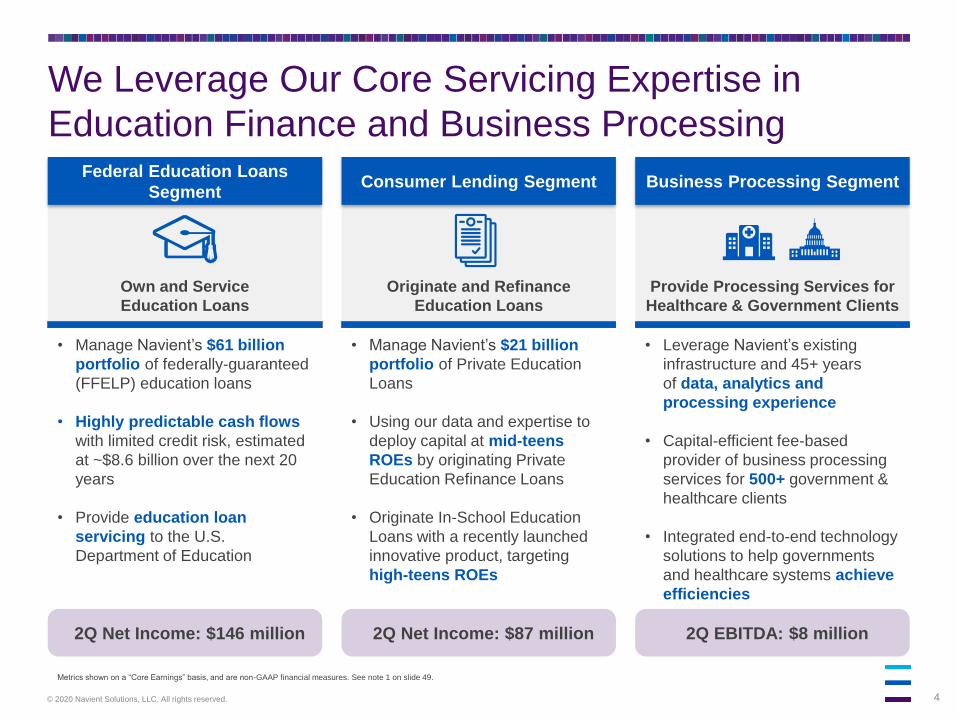
2Q Net Income: $146 million 2Q Net Income: $87 million 2Q EBITDA: $8 million
• Manage Navient’s $61 billion
portfolio of federally-guaranteed
(FFELP) education loans
• Highly predictable cash flows
with limited credit risk, estimated
at ~$8.6 billion over the next 20
years
• Provide education loan
servicing to the U.S.
Department of Education
• Manage Navient’s $21 billion
portfolio of Private Education
Loans
• Using our data and expertise to
deploy capital at mid-teens
ROEs by originating Private
Education Refinance Loans
• Originate In-School Education
Loans with a recently launched
innovative product, targeting
high-teens ROEs
Metrics shown on a “Core Earnings” basis, and are non-GAAP financial measures. See note 1 on slide 49.
• Leverage Navient’s existing
infrastructure and 45+ years
of data, analytics and
processing experience
• Capital-efficient fee-based
provider of business processing
services for 500+ government &
healthcare clients
• Integrated end-to-end technology
solutions to help governments
and healthcare systems achieve
efficiencies
5© 2020 Navient Solutions, LLC. All rights reserved.
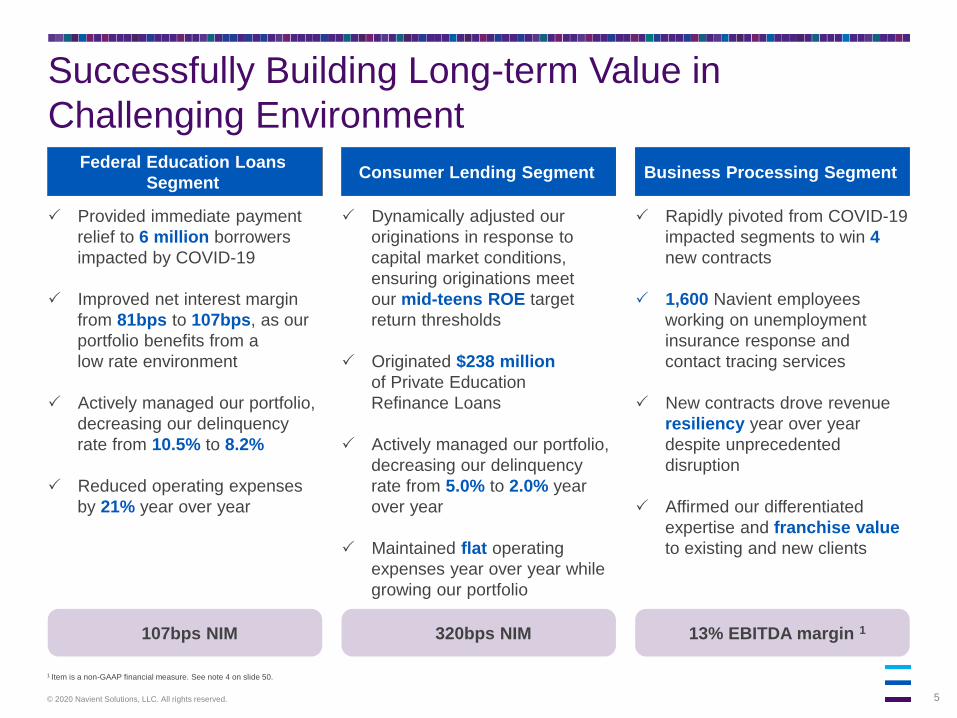
Federal Education Loans
SegmentConsumer Lending Segment Business Processing Segment
Provided immediate payment
relief to 6 million borrowers
impacted by COVID-19
Improved net interest margin
from 81bps to 107bps, as our
portfolio benefits from a
low rate environment
Actively managed our portfolio,
decreasing our delinquency
rate from 10.5% to 8.2%
Reduced operating expenses
by 21% year over year
Dynamically adjusted our
originations in response to
capital market conditions,
ensuring originations meet
our mid-teens ROE target
return thresholds
Originated $238 million
of Private Education
Refinance Loans
Actively managed our portfolio,
decreasing our delinquency
rate from 5.0% to 2.0% year
over year
Maintained flat operating
expenses year over year while
growing our portfolio
Rapidly pivoted from COVID-19
impacted segments to win 4
new contracts
1,600 Navient employees
working on unemployment
insurance response and
contact tracing services
New contracts drove revenue
resiliency year over year
despite unprecedented
disruption
Affirmed our differentiated
expertise and franchise value
to existing and new clients
107bps NIM 320bps NIM 13% EBITDA margin 1
1 Item is a non-GAAP financial measure. See note 4 on slide 50.
Successfully Building Long-term Value in
Challenging Environment
6© 2020 Navient Solutions, LLC. All rights reserved.
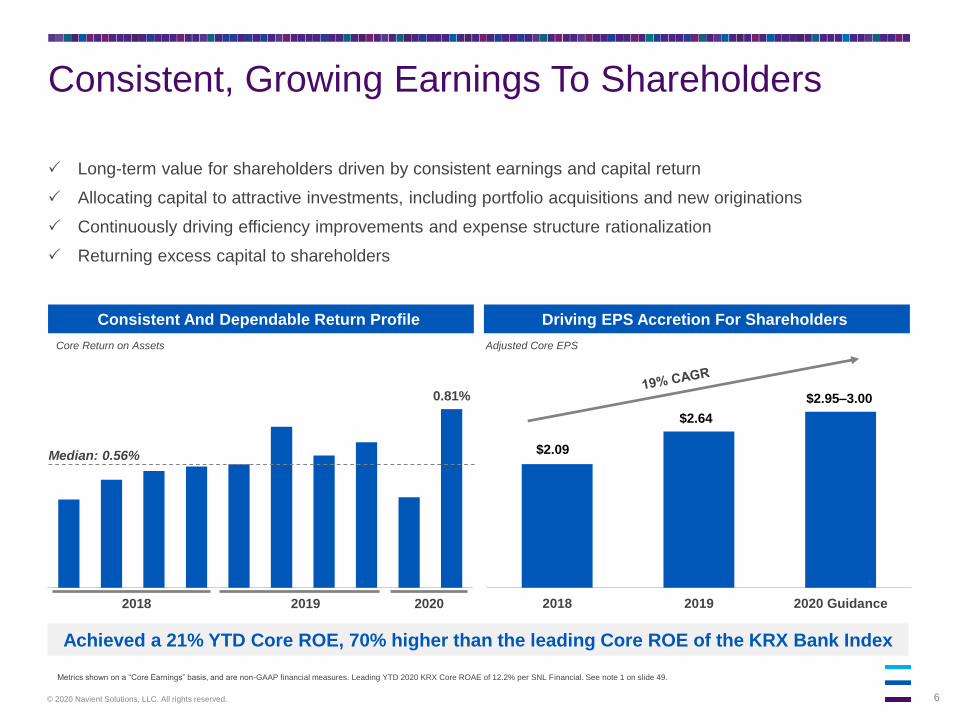
Consistent, Growing Earnings To Shareholders
$2.09
$2.64
$2.95–3.00
2018 2019 2020 Guidance
Consistent And Dependable Return Profile Driving EPS Accretion For Shareholders
Metrics shown on a “Core Earnings” basis, and are non-GAAP financial measures. Leading YTD 2020 KRX Core ROAE of 12.2% per SNL Financial. See note 1 on slide 49.
0.81%
1Q18 2Q18 3Q18 4Q18 1Q19 2Q19 3Q19 4Q19 1Q20 2Q202018 2019 2020
Adjusted Core EPS Core Return on Assets
Long-term value for shareholders driven by consistent earnings and capital return
Allocating capital to attractive investments, including portfolio acquisitions and new originations
Continuously driving efficiency improvements and expense structure rationalization
Returning excess capital to shareholders
Achieved a 21% YTD Core ROE, 70% higher than the leading Core ROE of the KRX Bank Index
Median: 0.56%
7© 2020 Navient Solutions, LLC. All rights reserved.
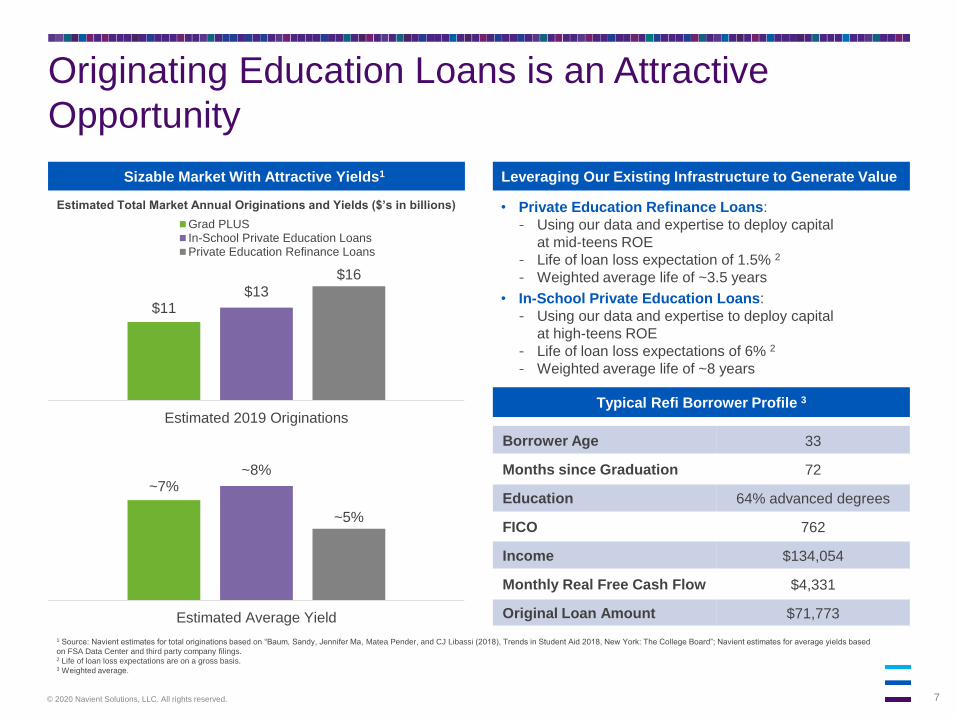
Originating Education Loans is an Attractive
Opportunity
• Private Education Refinance Loans:
- Using our data and expertise to deploy capital
at mid-teens ROE
- Life of loan loss expectation of 1.5% 2
- Weighted average life of ~3.5 years
Leveraging Our Existing Infrastructure to Generate Value
• In-School Private Education Loans:
- Using our data and expertise to deploy capital
at high-teens ROE
- Life of loan loss expectations of 6% 2
- Weighted average life of ~8 years
1 Source: Navient estimates for total originations based on “Baum, Sandy, Jennifer Ma, Matea Pender, and CJ Libassi (2018), Trends in Student Aid 2018, New York: The College Board”; Navient estimates for average yields based
on FSA Data Center and third party company filings.2 Life of loan loss expectations are on a gross basis.3 Weighted average.
Sizable Market With Attractive Yields1
Typical Refi Borrower Profile 3
Borrower Age 33
Months since Graduation 72
Education 64% advanced degrees
FICO 762
Income $134,054
Monthly Real Free Cash Flow $4,331
Original Loan Amount $71,773
Estimated Total Market Annual Originations and Yields ($’s in billions)
$11$13
$16
Estimated 2019 Originations
Grad PLUSIn-School Private Education LoansPrivate Education Refinance Loans
~7%~8%
~5%
Estimated Average Yield

8© 2020 Navient Solutions, LLC. All rights reserved.
Navient Is Focused On Cost Efficiency
$229
$211
Q2 19 Q2 20
“Adjusted” and “Comparable” expenses are non-GAAP financial measures. By using these measures, management can make better short-term and long-term decisions related to expense management and allocation.
Industry-Leading Efficiency Continuously Rationalizing Our Expense Base
Cost Structure Initiatives Have Significantly Reduced Gross ExpensesStable Efficiency Ratio Despite An Amortizing Legacy Portfolio
47% 49% 48%
2018 2019 Q2 20 YTD
Maintaining a consistent efficiency ratio while
managing an amortizing portfolio
Continue to drive strong margins through our
capital-efficient fee businesses, efficiently utilizing
our scaled infrastructure
Focus on reducing expenses across all of our
businesses, including third party efficiency studies
Unlocked significant efficiency by migrating to a
variable cost structure via a sale of our servicing
tech infrastructure to First Data in 2018
Efficiency Ratio
$95
$87
$84
2018 2019 Q2 20 YTD
Total Gross Loans ($ billions) Comparable Core Earnings Total Expenses ($ in millions)
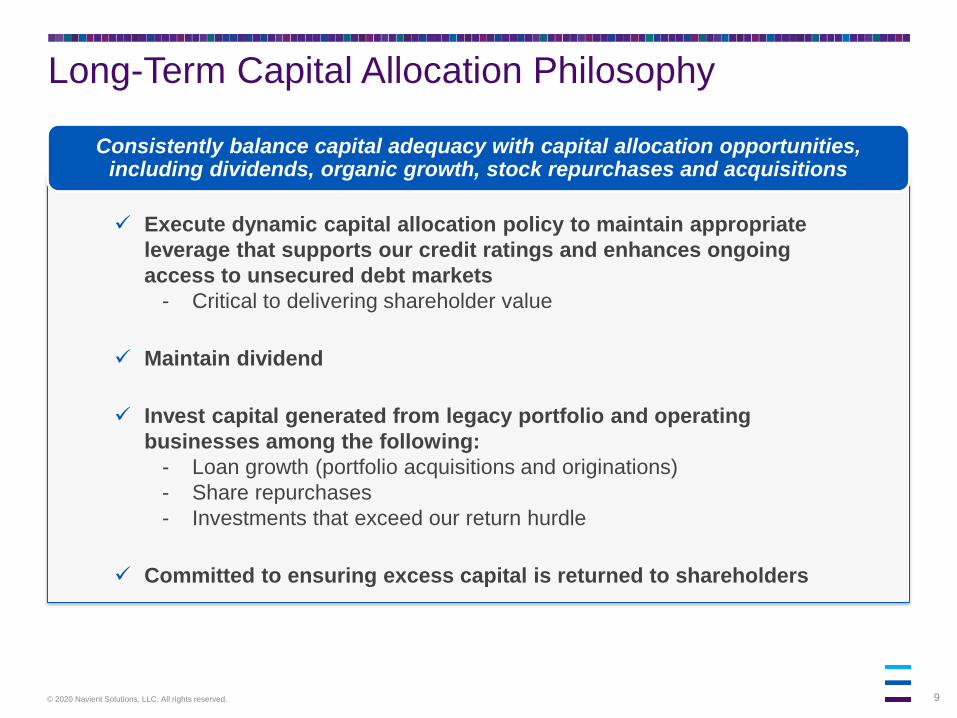
9© 2020 Navient Solutions, LLC. All rights reserved.
✓ Execute dynamic capital allocation policy to maintain appropriate
leverage that supports our credit ratings and enhances ongoing
access to unsecured debt markets
- Critical to delivering shareholder value
✓ Maintain dividend
✓ Invest capital generated from legacy portfolio and operating
businesses among the following:
- Loan growth (portfolio acquisitions and originations)
- Share repurchases
- Investments that exceed our return hurdle
✓ Committed to ensuring excess capital is returned to shareholders
Consistently balance capital adequacy with capital allocation opportunities, including dividends, organic growth, stock repurchases and acquisitions
Long-Term Capital Allocation Philosophy

10© 2020 Navient Solutions, LLC. All rights reserved.
Consistently Executing On Our Capital Philosophy
High-return profile loan portfolio acquisitions, and tuck-
in acquisitions that accelerate capital-lite fee generation
Accretive share repurchases, with total remaining share
repurchase authority of $665 million
All data as of 6/30/2020; Payout ratio shown on the basis of Core Earnings, a non-GAAP financial measure.1 Separation values are as reported 6/30/2014.
Consistent quarterly distributions since separation
Highly attractive return profile and leverages our data
and expertise
Originated
$10+ billion of
Education Refi Loans
Paid $1.2 billion
in dividends
Repurchased
$3.5 billion of
Navient shares
Acquired $39 billion
of Education Loans
Optimizing capital structure and return profile, and ensuring
ongoing access to unsecured debt markets
Reduced unsecured
debt by $7.7 billion
Since 2014 Separation 1
125%+ Total Payout Ratio Since Separation
Reduce unsecured
debt
Dividends
Loan originations
Loan portfolios and corporate acquisitions
Share repurchases
11© 2020 Navient Solutions, LLC. All rights reserved.
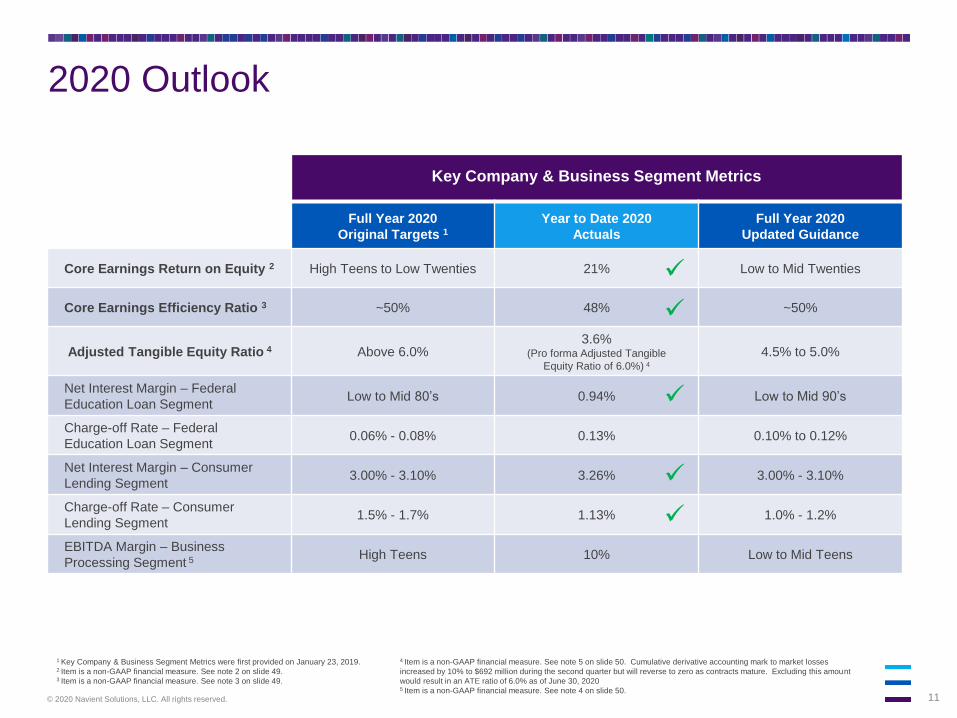
2020 Outlook
Key Company & Business Segment Metrics
Full Year 2020
Original Targets 1Year to Date 2020
Actuals
Full Year 2020
Updated Guidance
Core Earnings Return on Equity 2 High Teens to Low Twenties 21% Low to Mid Twenties
Core Earnings Efficiency Ratio 3 ~50% 48% ~50%
Adjusted Tangible Equity Ratio 4 Above 6.0%3.6%
(Pro forma Adjusted Tangible
Equity Ratio of 6.0%) 4
4.5% to 5.0%
Net Interest Margin – Federal
Education Loan SegmentLow to Mid 80’s 0.94% Low to Mid 90’s
Charge-off Rate – Federal
Education Loan Segment0.06% - 0.08% 0.13% 0.10% to 0.12%
Net Interest Margin – Consumer
Lending Segment3.00% - 3.10% 3.26% 3.00% - 3.10%
Charge-off Rate – Consumer
Lending Segment1.5% - 1.7% 1.13% 1.0% - 1.2%
EBITDA Margin – Business
Processing Segment 5 High Teens 10% Low to Mid Teens
1 Key Company & Business Segment Metrics were first provided on January 23, 2019.2 Item is a non-GAAP financial measure. See note 2 on slide 49.3 Item is a non-GAAP financial measure. See note 3 on slide 49.
4 Item is a non-GAAP financial measure. See note 5 on slide 50. Cumulative derivative accounting mark to market losses
increased by 10% to $692 million during the second quarter but will reverse to zero as contracts mature. Excluding this amount
would result in an ATE ratio of 6.0% as of June 30, 20205 Item is a non-GAAP financial measure. See note 4 on slide 50.
✓
✓
✓
✓
✓
12© 2020 Navient Solutions, LLC. All rights reserved.
Funding &
Liquidity
13© 2020 Navient Solutions, LLC. All rights reserved.
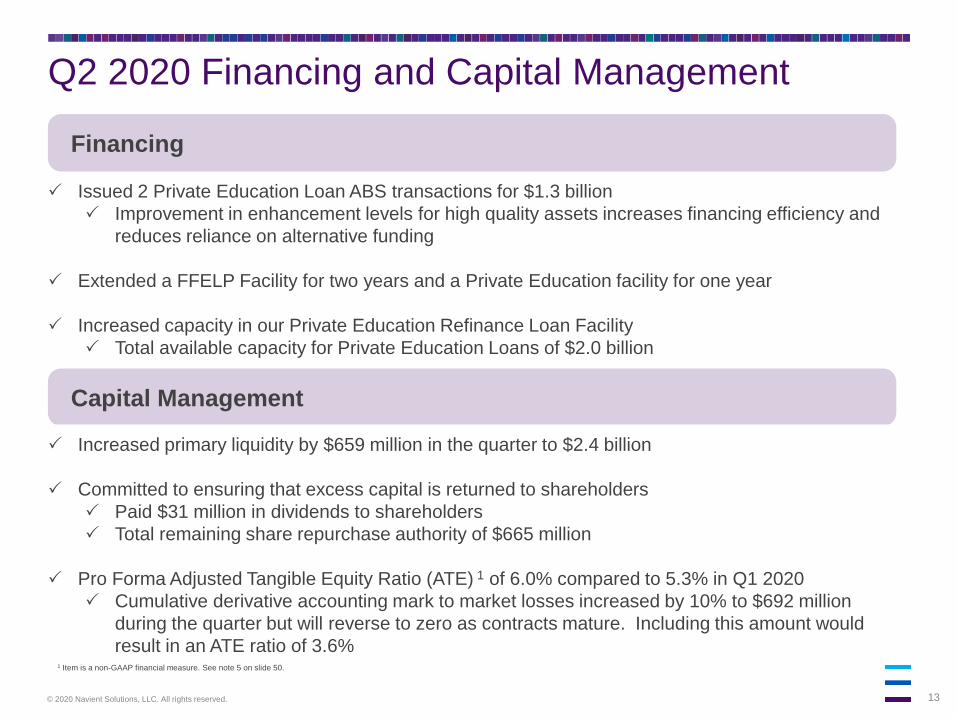
Q2 2020 Financing and Capital Management
Issued 2 Private Education Loan ABS transactions for $1.3 billion
Improvement in enhancement levels for high quality assets increases financing efficiency and
reduces reliance on alternative funding
Extended a FFELP Facility for two years and a Private Education facility for one year
Increased capacity in our Private Education Refinance Loan Facility
Total available capacity for Private Education Loans of $2.0 billion
Capital Management
Financing
Increased primary liquidity by $659 million in the quarter to $2.4 billion
Committed to ensuring that excess capital is returned to shareholders
Paid $31 million in dividends to shareholders
Total remaining share repurchase authority of $665 million
Pro Forma Adjusted Tangible Equity Ratio (ATE) 1 of 6.0% compared to 5.3% in Q1 2020
Cumulative derivative accounting mark to market losses increased by 10% to $692 million
during the quarter but will reverse to zero as contracts mature. Including this amount would
result in an ATE ratio of 3.6%1 Item is a non-GAAP financial measure. See note 5 on slide 50.
14© 2020 Navient Solutions, LLC. All rights reserved.
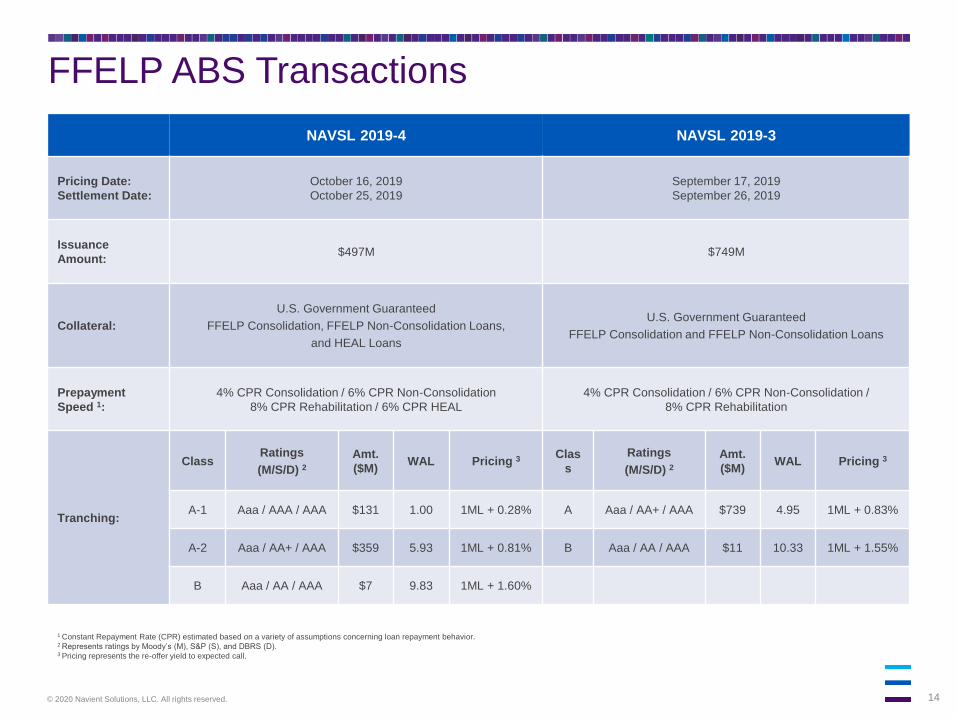
FFELP ABS Transactions
NAVSL 2019-4 NAVSL 2019-3
Pricing Date:
Settlement Date:
October 16, 2019
October 25, 2019
September 17, 2019
September 26, 2019
Issuance
Amount:$497M $749M
Collateral:
U.S. Government Guaranteed
FFELP Consolidation, FFELP Non-Consolidation Loans,
and HEAL Loans
U.S. Government Guaranteed
FFELP Consolidation and FFELP Non-Consolidation Loans
Prepayment
Speed 1:
4% CPR Consolidation / 6% CPR Non-Consolidation
8% CPR Rehabilitation / 6% CPR HEAL
4% CPR Consolidation / 6% CPR Non-Consolidation /
8% CPR Rehabilitation
Tranching:
ClassRatings
(M/S/D) 2Amt.
($M)WAL Pricing 3
Clas
s
Ratings
(M/S/D) 2Amt.
($M)WAL Pricing 3
A-1 Aaa / AAA / AAA $131 1.00 1ML + 0.28% A Aaa / AA+ / AAA $739 4.95 1ML + 0.83%
A-2 Aaa / AA+ / AAA $359 5.93 1ML + 0.81% B Aaa / AA / AAA $11 10.33 1ML + 1.55%
B Aaa / AA / AAA $7 9.83 1ML + 1.60%
1 Constant Repayment Rate (CPR) estimated based on a variety of assumptions concerning loan repayment behavior. 2 Represents ratings by Moody’s (M), S&P (S), and DBRS (D).3 Pricing represents the re-offer yield to expected call.
15© 2020 Navient Solutions, LLC. All rights reserved.
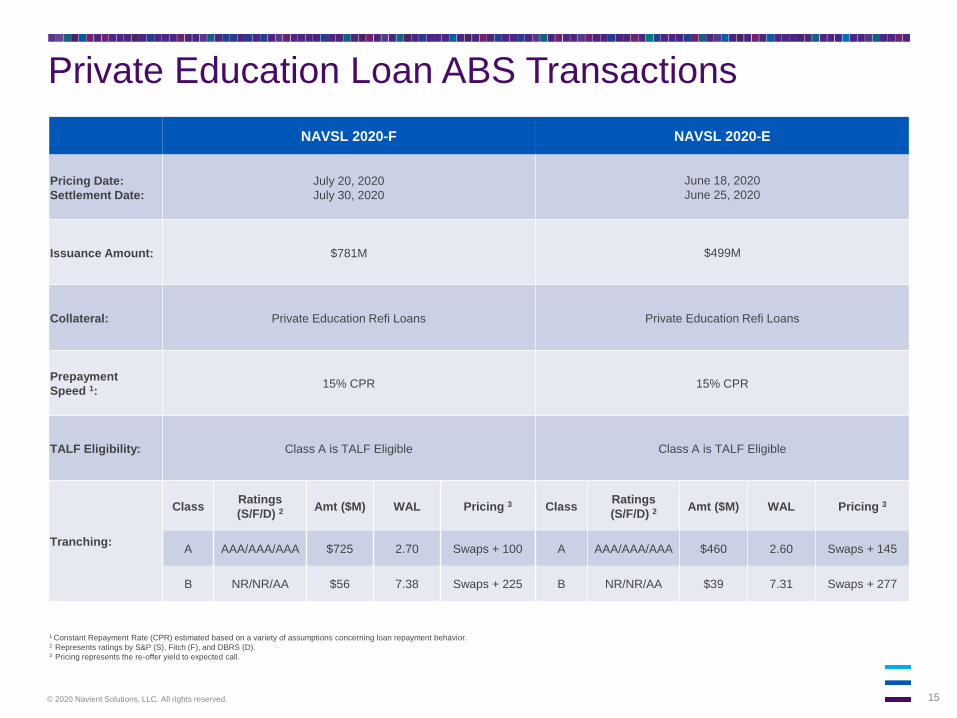
Private Education Loan ABS Transactions
1 Constant Repayment Rate (CPR) estimated based on a variety of assumptions concerning loan repayment behavior. 2 Represents ratings by S&P (S), Fitch (F), and DBRS (D).3 Pricing represents the re-offer yield to expected call.
NAVSL 2020-F NAVSL 2020-E
Pricing Date:
Settlement Date:
July 20, 2020
July 30, 2020
June 18, 2020
June 25, 2020
Issuance Amount: $781M $499M
Collateral: Private Education Refi Loans Private Education Refi Loans
Prepayment
Speed 1:15% CPR 15% CPR
TALF Eligibility: Class A is TALF Eligible Class A is TALF Eligible
Tranching:
ClassRatings
(S/F/D) 2Amt ($M) WAL Pricing 3 Class
Ratings
(S/F/D) 2Amt ($M) WAL Pricing 3
A AAA/AAA/AAA $725 2.70 Swaps + 100 A AAA/AAA/AAA $460 2.60 Swaps + 145
B NR/NR/AA $56 7.38 Swaps + 225 B NR/NR/AA $39 7.31 Swaps + 277

16© 2020 Navient Solutions, LLC. All rights reserved.
Optimized Capital Structure
• Important to maintain our credit ratings which
support ongoing access to the unsecured debt
markets
- We pursue opportunities to repurchase debt in
the open market
- Well positioned to capitalize on improving new
issuance markets
• 84% of our education loan portfolio is funded to
term
- Q2 2020 issuance of $1.3 billion of Private
Education Loan ABS compared to $1.2 billion in
Q2 2019
• Returned $397 million to shareholders through
dividends and share repurchases YTD 2020
Long-Term Conservative Funding Approach Managing Unsecured Debt Maturities
$8.5 $8.9$7.6 $7.1 $7.0
$5.4 $5.1
$4.0
$2.4 $2.5
12/31/16 12/31/17 12/31/18 12/31/19 06/30/20
(par value, $ in billions)
Maturities within 5 years Maturities beyond 5 years
17© 2020 Navient Solutions, LLC. All rights reserved.
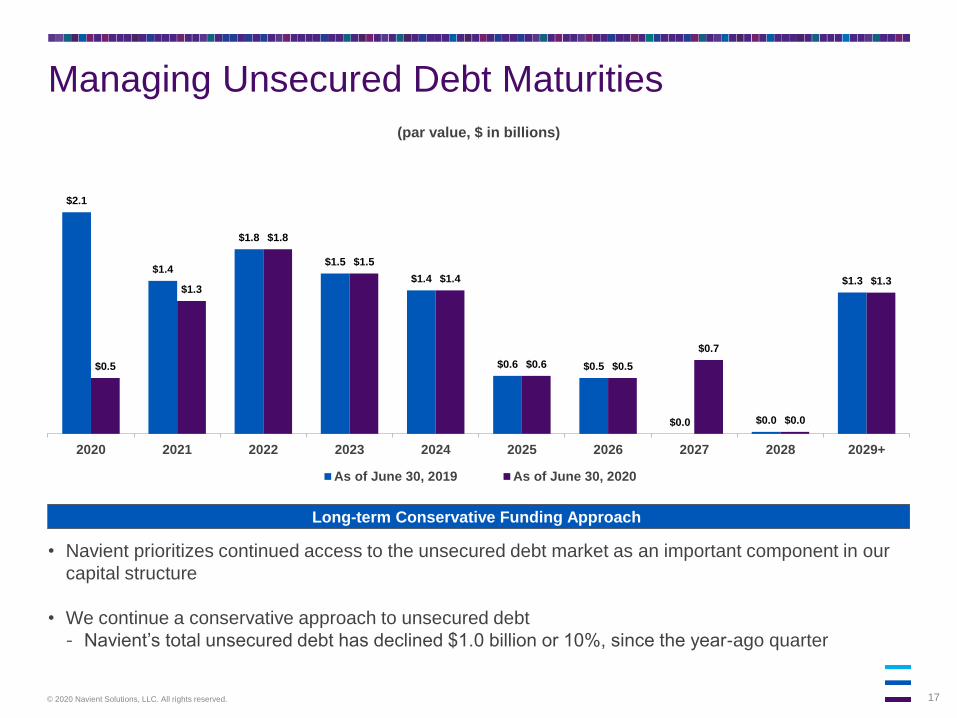
Managing Unsecured Debt Maturities
• Navient prioritizes continued access to the unsecured debt market as an important component in our
capital structure
• We continue a conservative approach to unsecured debt
- Navient’s total unsecured debt has declined $1.0 billion or 10%, since the year-ago quarter
$2.1
$1.4
$1.8
$1.5
$1.4
$0.6 $0.5
$0.0 $0.0
$1.3
$0.5
$1.3
$1.8
$1.5
$1.4
$0.6 $0.5
$0.7
$0.0
$1.3
2020 2021 2022 2023 2024 2025 2026 2027 2028 2029+
(par value, $ in billions)
As of June 30, 2019 As of June 30, 2020
Long-term Conservative Funding Approach
18© 2020 Navient Solutions, LLC. All rights reserved.
Education Loan Portfolio Generates Significant
Cash FlowsProjected Life of Loan Cash Flows over ~20 Years Optimizing Cash Flows
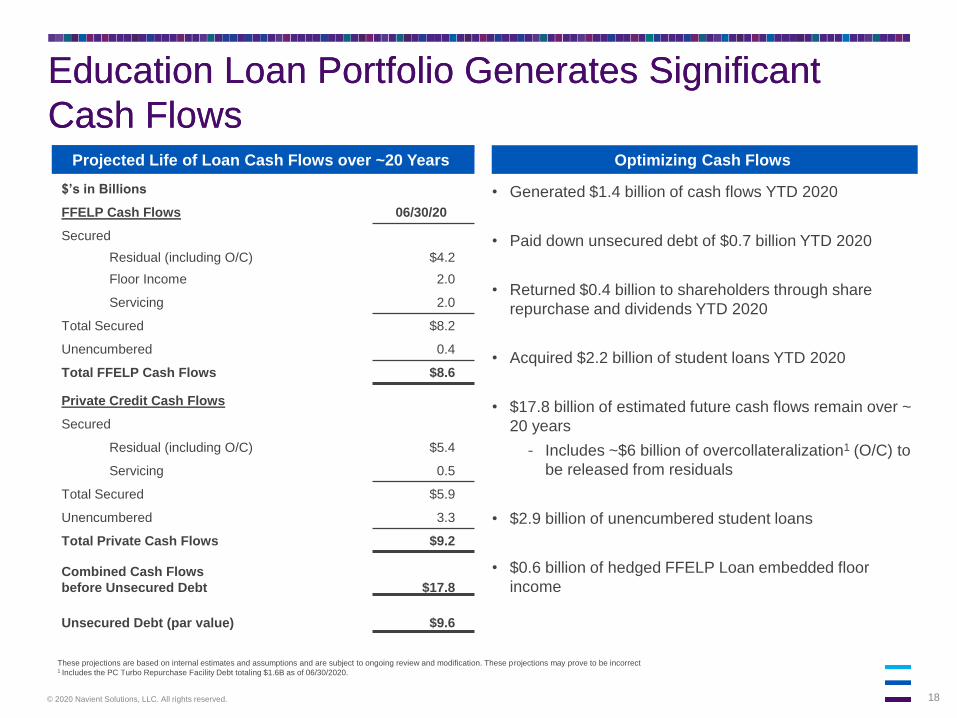
Education Loan Portfolio Generates Significant
Cash Flows
• Generated $1.4 billion of cash flows YTD 2020
• Paid down unsecured debt of $0.7 billion YTD 2020
• Returned $0.4 billion to shareholders through share
repurchase and dividends YTD 2020
• Acquired $2.2 billion of student loans YTD 2020
• $17.8 billion of estimated future cash flows remain over ~
20 years
- Includes ~$6 billion of overcollateralization1 (O/C) to
be released from residuals
• $2.9 billion of unencumbered student loans
• $0.6 billion of hedged FFELP Loan embedded floor
income
Projected Life of Loan Cash Flows over ~20 Years
$’s in Billions
FFELP Cash Flows 06/30/20
Secured
Residual (including O/C) $4.2
Floor Income 2.0
Servicing 2.0
Total Secured $8.2
Unencumbered 0.4
Total FFELP Cash Flows $8.6
Private Credit Cash Flows
Secured
Residual (including O/C) $5.4
Servicing 0.5
Total Secured $5.9
Unencumbered 3.3
Total Private Cash Flows $9.2
Combined Cash Flows
before Unsecured Debt $17.8
Unsecured Debt (par value) $9.6
These projections are based on internal estimates and assumptions and are subject to ongoing review and modification. These projections may prove to be incorrect1 Includes the PC Turbo Repurchase Facility Debt totaling $1.6B as of 06/30/2020.

19© 2020 Navient Solutions, LLC. All rights reserved.
Education Loan Portfolio Generates Meaningful
Cash Flows Over the Next Five Years
$0.5
$1.2
$1.0 $1.0
$0.9
$0.0
$0.2
$0.4
$0.6
$0.8
$1.0
$1.2
$1.4
2020Remaining
2021 2022 2023 2024
($’s
in
Billio
ns)
Cash Flows assuming call option can be exercised at 10%
• The Private Education Loan portfolio is projected to generate $4.6 billion in cash
flows through 2024 excluding operating expenses, taxes and unsecured debt
principal and interest payments
• Future loan originations are not included
• Unencumbered loans of $2.7 billion are not securitized to term
• Includes the repayment of debt related to asset-backed securitization repurchase
facilities when the call option is exercised
Projected Annual FFELP Loan Cash FlowsProjected Annual Private Education Loan Cash Flows
$0.7
$1.2
$1.0$0.9 $0.9
$0.0
$0.2
$0.4
$0.6
$0.8
$1.0
$1.2
$1.4
$1.6
2020Remaining
2021 2022 2023 2024
($’s
in
Billio
ns)
Cash Flows assuming trusts run to maturity
Private Education Loan Portfolio Assumptions
• The FFELP loan portfolio is projected to generate $4.7 billion in cash flows through
2024 excluding operating expenses, taxes and unsecured debt principal and interest
payments
• Unencumbered loans of $0.3 billion are not securitized to term
• Includes projected floor income
FFELP Loan Portfolio Assumptions
These projections are based on internal estimates and assumptions and are subject to ongoing review and modification. These projections may prove to be incorrect.
20© 2020 Navient Solutions, LLC. All rights reserved.
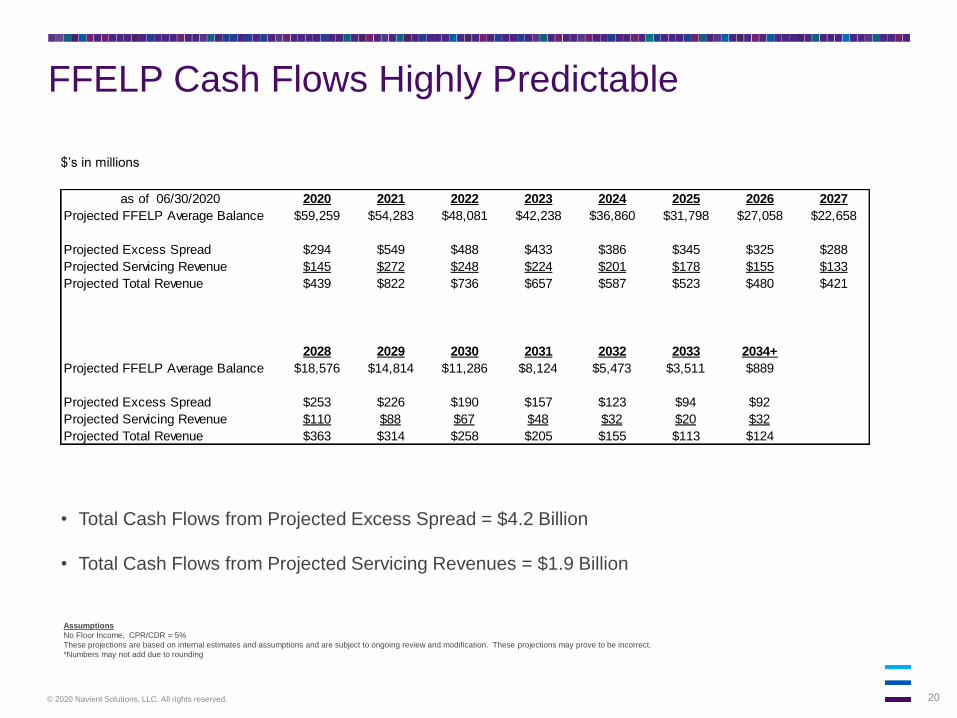
$’s in millions
Assumptions
No Floor Income, CPR/CDR = 5%
These projections are based on internal estimates and assumptions and are subject to ongoing review and modification. These projections may prove to be incorrect.
*Numbers may not add due to rounding
• Total Cash Flows from Projected Excess Spread = $4.2 Billion
• Total Cash Flows from Projected Servicing Revenues = $1.9 Billion
as of 06/30/2020 2020 2021 2022 2023 2024 2025 2026 2027
Projected FFELP Average Balance $59,259 $54,283 $48,081 $42,238 $36,860 $31,798 $27,058 $22,658
Projected Excess Spread $294 $549 $488 $433 $386 $345 $325 $288
Projected Servicing Revenue $145 $272 $248 $224 $201 $178 $155 $133
Projected Total Revenue $439 $822 $736 $657 $587 $523 $480 $421
2028 2029 2030 2031 2032 2033 2034+
Projected FFELP Average Balance $18,576 $14,814 $11,286 $8,124 $5,473 $3,511 $889
Projected Excess Spread $253 $226 $190 $157 $123 $94 $92
Projected Servicing Revenue $110 $88 $67 $48 $32 $20 $32
Projected Total Revenue $363 $314 $258 $205 $155 $113 $124
FFELP Cash Flows Highly Predictable
21© 2020 Navient Solutions, LLC. All rights reserved.
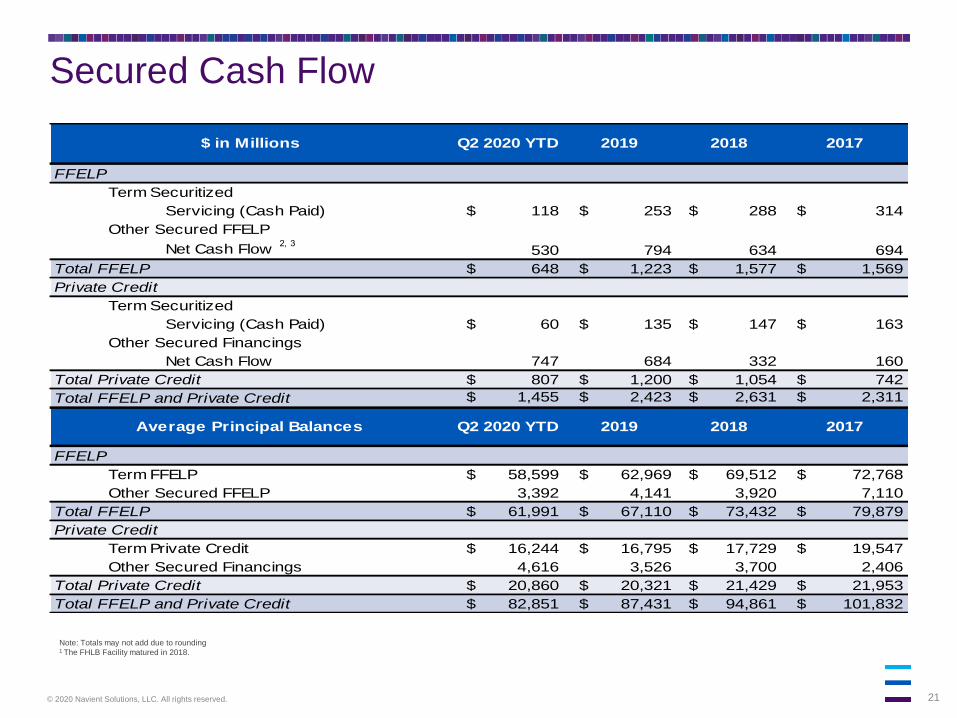
Secured Cash Flow
Note: Totals may not add due to rounding1 The FHLB Facility matured in 2018.
Servicing (Cash Paid) $ 118 $ 253 $ 288 $ 314
Net Cash Flow 2, 3
530 794 634 694
$ 648 $ 1,223 $ 1,577 $ 1,569
Servicing (Cash Paid) $ 60 $ 135 $ 147 $ 163
Net Cash Flow 747 684 332 160
$ 807 $ 1,200 $ 1,054 $ 742
$ 1,455 $ 2,423 $ 2,631 $ 2,311
$ 58,599 $ 62,969 $ 69,512 $ 72,768
3,392 4,141 3,920 7,110
$ 61,991 $ 67,110 $ 73,432 $ 79,879
$ 16,244 $ 16,795 $ 17,729 $ 19,547
4,616 3,526 3,700 2,406
$ 20,860 $ 20,321 $ 21,429 $ 21,953
$ 82,851 $ 87,431 $ 94,861 $ 101,832
FFELP
FFELP
Term Securitized
Other Secured FFELP
Total FFELP
Private Credit
Term Securitized
Other Secured Financings
Total Private Credit
Total FFELP and Private Credit
Average Principal Balances
Q2 2020 YTD
Total Private Credit
Total FFELP and Private Credit
Term FFELP
Other Secured FFELP
Total FFELP
Private Credit
Term Private Credit
Other Secured Financings
$ in Millions 2019 2018 2017
Q2 2020 YTD 2019 2018 2017
22© 2020 Navient Solutions, LLC. All rights reserved.
FFELP ABS

23© 2020 Navient Solutions, LLC. All rights reserved.
FFELP ABS Issuance Characteristics
• Issue size of $500M+
• Senior and subordinate notes
• Amortizing tranches with 1 to 12(+) year
average lives
• Floating rate securities
• Compliant with U.S. risk retention
regulations
• Navient Solutions, LLC is master servicer
FFELP ABS Transaction Features Collateral Characteristics
1 Principal and accrued interest on underlying FFELP loan collateral carry insurance or guarantee of 97%-100% dependent on origination year and on meeting the servicing requirements of the U.S. Department of Education.
• Guarantee of underlying collateral
insulates bondholders from most risk of
loss of principal 1
• Typically non-dischargeable in bankruptcy
24© 2020 Navient Solutions, LLC. All rights reserved.
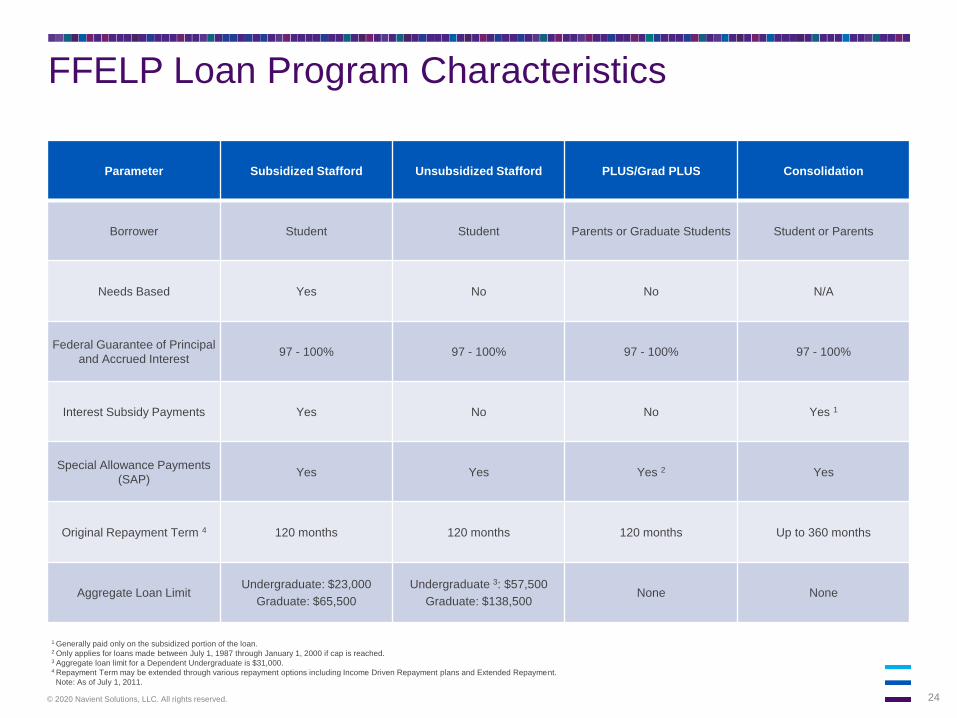
FFELP Loan Program Characteristics
1 Generally paid only on the subsidized portion of the loan.2 Only applies for loans made between July 1, 1987 through January 1, 2000 if cap is reached.3 Aggregate loan limit for a Dependent Undergraduate is $31,000.4 Repayment Term may be extended through various repayment options including Income Driven Repayment plans and Extended Repayment.
Note: As of July 1, 2011.
Parameter Subsidized Stafford Unsubsidized Stafford PLUS/Grad PLUS Consolidation
Borrower Student Student Parents or Graduate Students Student or Parents
Needs Based Yes No No N/A
Federal Guarantee of Principal
and Accrued Interest97 - 100% 97 - 100% 97 - 100% 97 - 100%
Interest Subsidy Payments Yes No No Yes 1
Special Allowance Payments
(SAP)Yes Yes Yes 2 Yes
Original Repayment Term 4 120 months 120 months 120 months Up to 360 months
Aggregate Loan LimitUndergraduate: $23,000
Graduate: $65,500
Undergraduate 3: $57,500
Graduate: $138,500None None
25© 2020 Navient Solutions, LLC. All rights reserved.
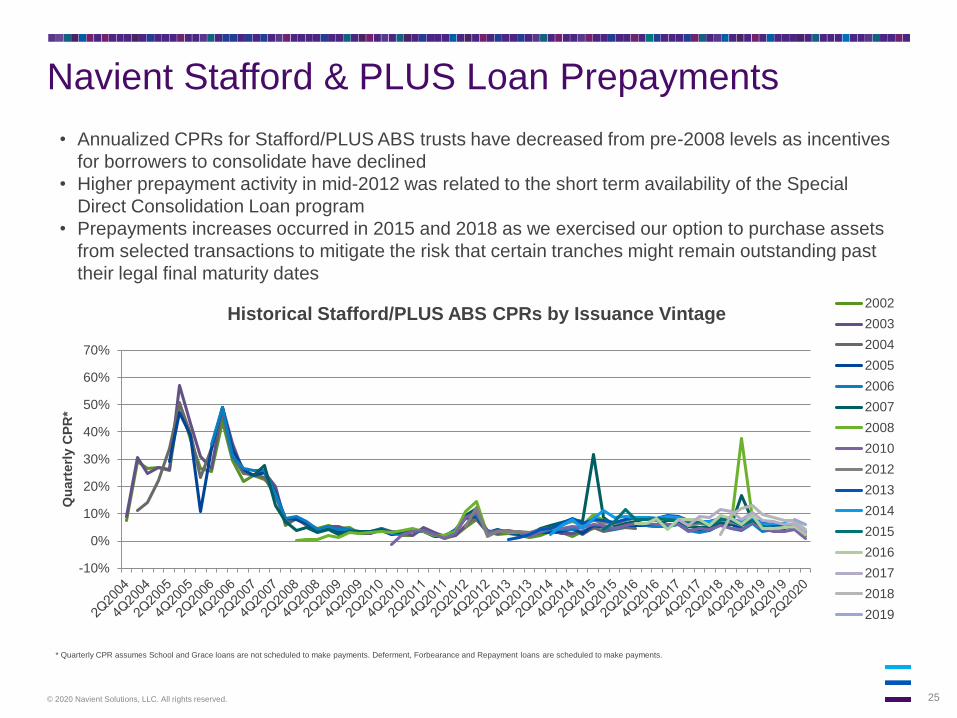
Navient Stafford & PLUS Loan Prepayments
• Annualized CPRs for Stafford/PLUS ABS trusts have decreased from pre-2008 levels as incentives
for borrowers to consolidate have declined
• Higher prepayment activity in mid-2012 was related to the short term availability of the Special
Direct Consolidation Loan program
• Prepayments increases occurred in 2015 and 2018 as we exercised our option to purchase assets
from selected transactions to mitigate the risk that certain tranches might remain outstanding past
their legal final maturity dates
-10%
0%
10%
20%
30%
40%
50%
60%
70%
Qu
art
erl
y C
PR
*
Historical Stafford/PLUS ABS CPRs by Issuance Vintage2002
2003
2004
2005
2006
2007
2008
2010
2012
2013
2014
2015
2016
2017
2018
2019
* Quarterly CPR assumes School and Grace loans are not scheduled to make payments. Deferment, Forbearance and Repayment loans are scheduled to make payments.

26© 2020 Navient Solutions, LLC. All rights reserved.
Navient Consolidation Loan Prepayments
• CPRs for Consolidation ABS trusts declined significantly following legislation effective in
2006 that prevented in-school and re-consolidation of borrowers’ loans
• Higher prepayment activity in mid 2012 was related to the short term availability of the
Special Direct Consolidation Loan program
-5%
0%
5%
10%
15%
20%
25%
Qu
art
erl
y C
PR
*
Historical Consolidation ABS CPRs by Issuance Vintage
2002
2003
2004
2005
2006
2007
2009
2011
2012
2014
* Quarterly CPR assumes School and Grace loans are not scheduled to make payments. Deferment, Forbearance and Repayment loans are scheduled to make payments.
27© 2020 Navient Solutions, LLC. All rights reserved.
Private Education
Loan ABS

28© 2020 Navient Solutions, LLC. All rights reserved.
Private Education Loan ABS Transaction Features Collateral Characteristics
• Issue size of $500M+
• Senior and subordinate notes
• Amortizing tranches with 1 to 10 year
average lives
• Fixed rate and floating rate securities
• Compliant with U.S. risk retention and,
depending on the transaction, with
European risk retention
• Navient Solutions, LLC is master servicer
• Collateralized by loans made to students
and parents to fund college tuition, room
and board
- Seasoned assets benefiting from
proven payment history
- Refi assets with strong credit factors
including high FICO scores, income,
and ability to pay
• Underwritten using a combination of
FICO, custom scorecard & judgmental
criteria with risk based pricing, debt-to-
income, household income, and free cash
flow, as applicable
Private Education Loan ABS Issuance
Characteristics
29© 2020 Navient Solutions, LLC. All rights reserved.
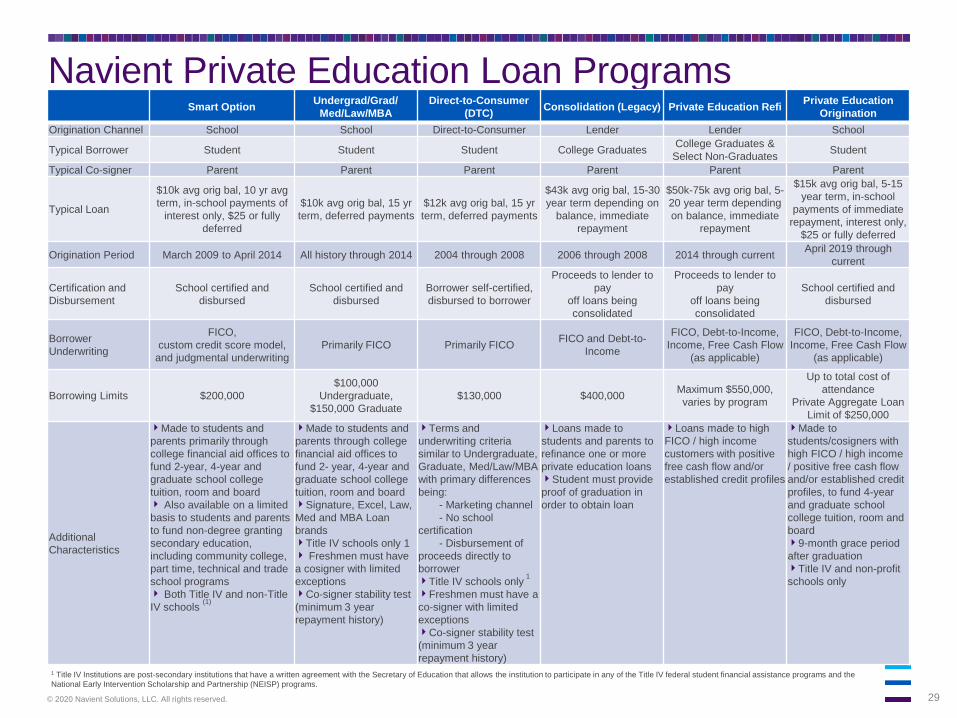
1 Title IV Institutions are post-secondary institutions that have a written agreement with the Secretary of Education that allows the institution to participate in any of the Title IV federal student financial assistance programs and the
National Early Intervention Scholarship and Partnership (NEISP) programs.
Navient Private Education Loan Programs Smart Option
Undergrad/Grad/
Med/Law/MBA
Direct-to-Consumer
(DTC)Consolidation (Legacy) Private Education Refi
Private Education
Origination
Origination Channel School School Direct-to-Consumer Lender Lender School
Typical Borrower Student Student Student College GraduatesCollege Graduates &
Select Non-GraduatesStudent
Typical Co-signer Parent Parent Parent Parent Parent Parent
Typical Loan
$10k avg orig bal, 10 yr avg
term, in-school payments of
interest only, $25 or fully
deferred
$10k avg orig bal, 15 yr
term, deferred payments
$12k avg orig bal, 15 yr
term, deferred payments
$43k avg orig bal, 15-30
year term depending on
balance, immediate
repayment
$50k-75k avg orig bal, 5-
20 year term depending
on balance, immediate
repayment
$15k avg orig bal, 5-15
year term, in-school
payments of immediate
repayment, interest only,
$25 or fully deferred
Origination Period March 2009 to April 2014 All history through 2014 2004 through 2008 2006 through 2008 2014 through currentApril 2019 through
current
Certification and
Disbursement
School certified and
disbursed
School certified and
disbursed
Borrower self-certified,
disbursed to borrower
Proceeds to lender to
pay
off loans being
consolidated
Proceeds to lender to
pay
off loans being
consolidated
School certified and
disbursed
Borrower
Underwriting
FICO,
custom credit score model,
and judgmental underwriting
Primarily FICO Primarily FICOFICO and Debt-to-
Income
FICO, Debt-to-Income,
Income, Free Cash Flow
(as applicable)
FICO, Debt-to-Income,
Income, Free Cash Flow
(as applicable)
Borrowing Limits $200,000
$100,000
Undergraduate,
$150,000 Graduate
$130,000 $400,000Maximum $550,000,
varies by program
Up to total cost of
attendance
Private Aggregate Loan
Limit of $250,000
Additional
Characteristics
Made to students and
parents primarily through
college financial aid offices to
fund 2-year, 4-year and
graduate school college
tuition, room and board Also available on a limited
basis to students and parents
to fund non-degree granting
secondary education,
including community college,
part time, technical and trade
school programs Both Title IV and non-Title
IV schools (1)
Made to students and
parents through college
financial aid offices to
fund 2- year, 4-year and
graduate school college
tuition, room and boardSignature, Excel, Law,
Med and MBA Loan
brandsTitle IV schools only 1 Freshmen must have
a cosigner with limited
exceptionsCo-signer stability test
(minimum 3 year
repayment history)
Terms and
underwriting criteria
similar to Undergraduate,
Graduate, Med/Law/MBA
with primary differences
being:
- Marketing channel
- No school
certification
- Disbursement of
proceeds directly to
borrowerTitle IV schools only
1
Freshmen must have a
co-signer with limited
exceptionsCo-signer stability test
(minimum 3 year
repayment history)
Loans made to
students and parents to
refinance one or more
private education loansStudent must provide
proof of graduation in
order to obtain loan
Loans made to high
FICO / high income
customers with positive
free cash flow and/or
established credit profiles
Made to
students/cosigners with
high FICO / high income
/ positive free cash flow
and/or established credit
profiles, to fund 4-year
and graduate school
college tuition, room and
board9-month grace period
after graduationTitle IV and non-profit
schools only
30© 2020 Navient Solutions, LLC. All rights reserved.
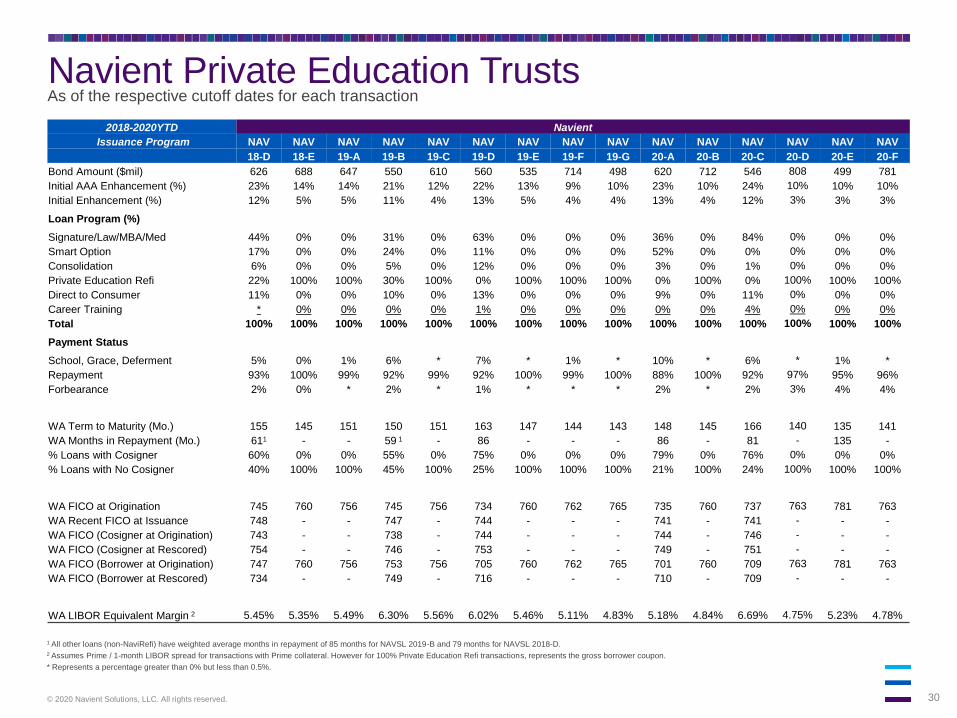
Navient Private Education Trusts
1 All other loans (non-NaviRefi) have weighted average months in repayment of 85 months for NAVSL 2019-B and 79 months for NAVSL 2018-D. 2 Assumes Prime / 1-month LIBOR spread for transactions with Prime collateral. However for 100% Private Education Refi transactions, represents the gross borrower coupon.
* Represents a percentage greater than 0% but less than 0.5%.
As of the respective cutoff dates for each transaction
2018-2020YTD Navient
Issuance Program NAV NAV NAV NAV NAV NAV NAV NAV NAV NAV NAV NAV NAV NAV NAV
18-D 18-E 19-A 19-B 19-C 19-D 19-E 19-F 19-G 20-A 20-B 20-C 20-D 20-E 20-F
Bond Amount ($mil) 626 688 647 550 610 560 535 714 498 620 712 546 808 499 781
Initial AAA Enhancement (%) 23% 14% 14% 21% 12% 22% 13% 9% 10% 23% 10% 24% 10% 10% 10%
Initial Enhancement (%) 12% 5% 5% 11% 4% 13% 5% 4% 4% 13% 4% 12% 3% 3% 3%
Loan Program (%)
Signature/Law/MBA/Med 44% 0% 0% 31% 0% 63% 0% 0% 0% 36% 0% 84% 0% 0% 0%
Smart Option 17% 0% 0% 24% 0% 11% 0% 0% 0% 52% 0% 0% 0% 0% 0%
Consolidation 6% 0% 0% 5% 0% 12% 0% 0% 0% 3% 0% 1% 0% 0% 0%
Private Education Refi 22% 100% 100% 30% 100% 0% 100% 100% 100% 0% 100% 0% 100% 100% 100%
Direct to Consumer 11% 0% 0% 10% 0% 13% 0% 0% 0% 9% 0% 11% 0% 0% 0%
Career Training * 0% 0% 0% 0% 1% 0% 0% 0% 0% 0% 4% 0% 0% 0%
Total 100% 100% 100% 100% 100% 100% 100% 100% 100% 100% 100% 100% 100% 100% 100%
Payment Status
School, Grace, Deferment 5% 0% 1% 6% * 7% * 1% * 10% * 6% * 1% *
Repayment 93% 100% 99% 92% 99% 92% 100% 99% 100% 88% 100% 92% 97% 95% 96%
Forbearance 2% 0% * 2% * 1% * * * 2% * 2% 3% 4% 4%
WA Term to Maturity (Mo.) 155 145 151 150 151 163 147 144 143 148 145 166 140 135 141
WA Months in Repayment (Mo.) 611 - - 59 1 - 86 - - - 86 - 81 - 135 -
% Loans with Cosigner 60% 0% 0% 55% 0% 75% 0% 0% 0% 79% 0% 76% 0% 0% 0%
% Loans with No Cosigner 40% 100% 100% 45% 100% 25% 100% 100% 100% 21% 100% 24% 100% 100% 100%
WA FICO at Origination 745 760 756 745 756 734 760 762 765 735 760 737 763 781 763
WA Recent FICO at Issuance 748 - - 747 - 744 - - - 741 - 741 - - -
WA FICO (Cosigner at Origination) 743 - - 738 - 744 - - - 744 - 746 - - -
WA FICO (Cosigner at Rescored) 754 - - 746 - 753 - - - 749 - 751 - - -
WA FICO (Borrower at Origination) 747 760 756 753 756 705 760 762 765 701 760 709 763 781 763
WA FICO (Borrower at Rescored) 734 - - 749 - 716 - - - 710 - 709 - - -
WA LIBOR Equivalent Margin 2 5.45% 5.35% 5.49% 6.30% 5.56% 6.02% 5.46% 5.11% 4.83% 5.18% 4.84% 6.69% 4.75% 5.23% 4.78%
31© 2020 Navient Solutions, LLC. All rights reserved.
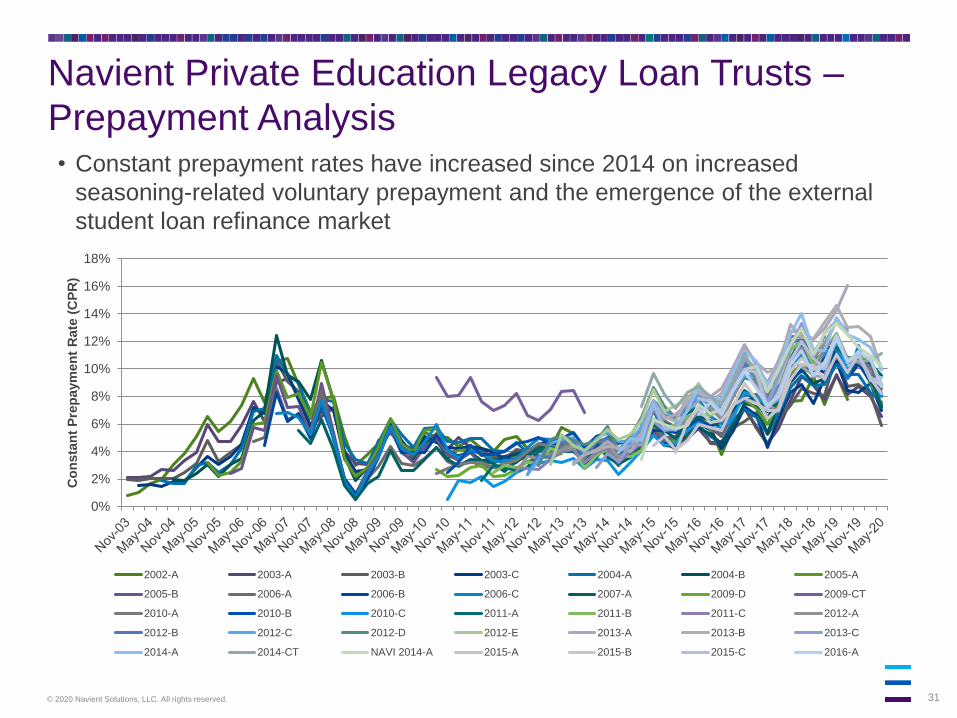
Navient Private Education Legacy Loan Trusts –
Prepayment Analysis• Constant prepayment rates have increased since 2014 on increased
seasoning-related voluntary prepayment and the emergence of the external
student loan refinance market
0%
2%
4%
6%
8%
10%
12%
14%
16%
18%
Co
nsta
nt
Pre
paym
en
t R
ate
(C
PR
)
2002-A 2003-A 2003-B 2003-C 2004-A 2004-B 2005-A
2005-B 2006-A 2006-B 2006-C 2007-A 2009-D 2009-CT
2010-A 2010-B 2010-C 2011-A 2011-B 2011-C 2012-A
2012-B 2012-C 2012-D 2012-E 2013-A 2013-B 2013-C
2014-A 2014-CT NAVI 2014-A 2015-A 2015-B 2015-C 2016-A

32© 2020 Navient Solutions, LLC. All rights reserved.
Higher Education
Industry
33© 2020 Navient Solutions, LLC. All rights reserved.
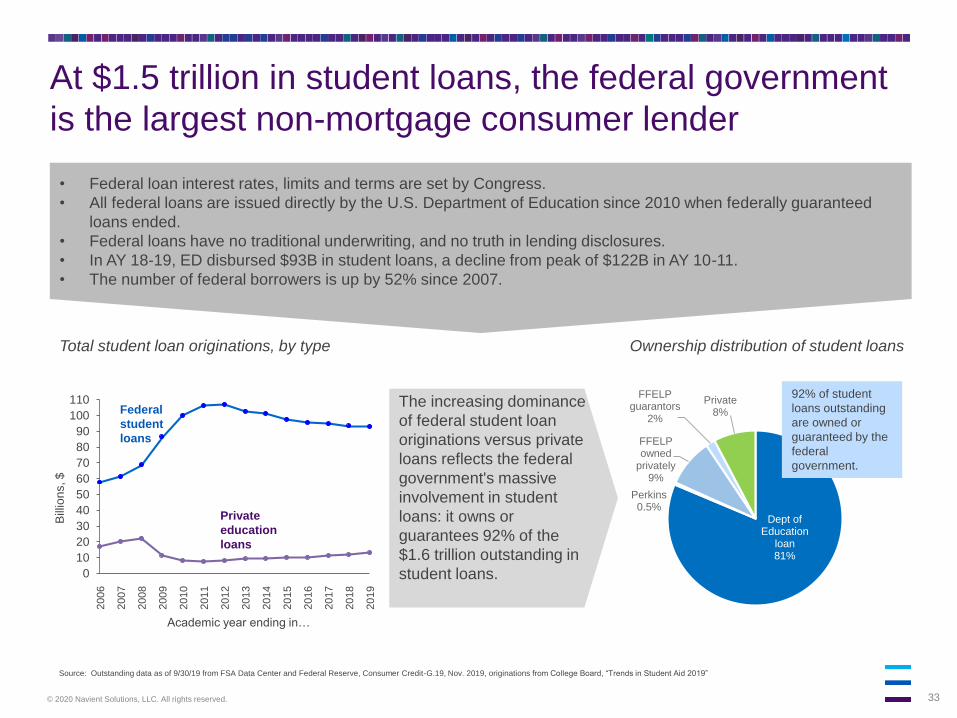
At $1.5 trillion in student loans, the federal government
is the largest non-mortgage consumer lender
Source: Outstanding data as of 9/30/19 from FSA Data Center and Federal Reserve, Consumer Credit-G.19, Nov. 2019, originations from College Board, “Trends in Student Aid 2019”
0
10
20
30
40
50
60
70
80
90
100
110
Academic year ending in…
Bill
ion
s, $
Dept of Education
loan81%
Perkins0.5%
FFELP owned
privately9%
FFELP guarantors
2%
Private8%
2006
2007
2008
2009
2010
2011
2012
2013
2014
2015
2016
2017
2018
2019
Federal
student
loans
Private
education
loans
92% of student
loans outstanding
are owned or
guaranteed by the
federal
government.
• Federal loan interest rates, limits and terms are set by Congress.
• All federal loans are issued directly by the U.S. Department of Education since 2010 when federally guaranteed
loans ended.
• Federal loans have no traditional underwriting, and no truth in lending disclosures.
• In AY 18-19, ED disbursed $93B in student loans, a decline from peak of $122B in AY 10-11.
• The number of federal borrowers is up by 52% since 2007.
Ownership distribution of student loansTotal student loan originations, by type
The increasing dominance
of federal student loan
originations versus private
loans reflects the federal
government's massive
involvement in student
loans: it owns or
guarantees 92% of the
$1.6 trillion outstanding in
student loans.
34© 2020 Navient Solutions, LLC. All rights reserved.
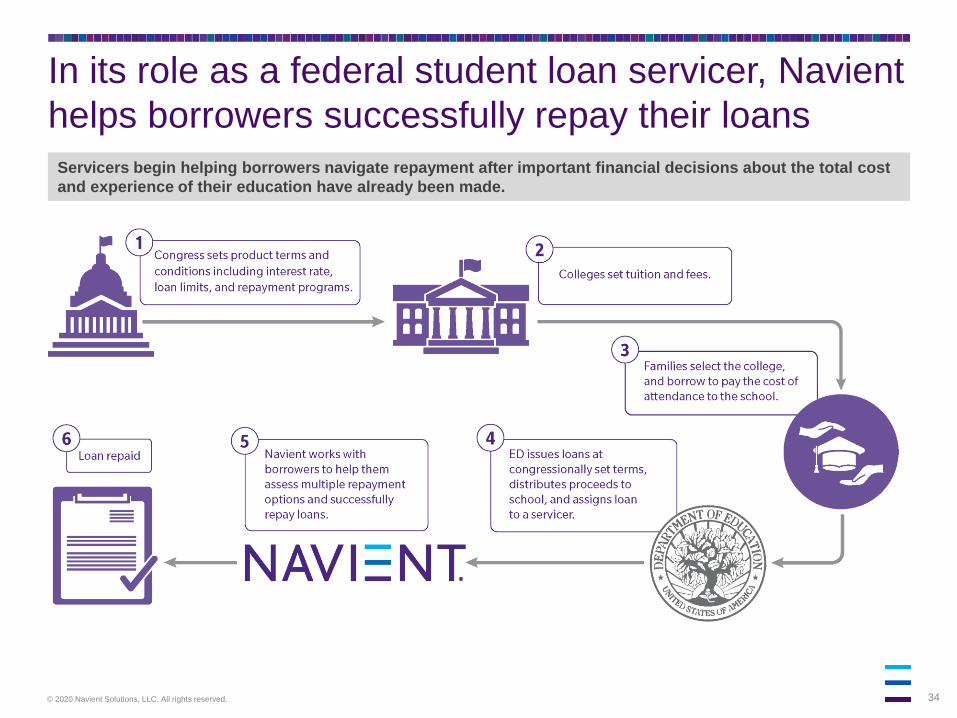
In its role as a federal student loan servicer, Navient
helps borrowers successfully repay their loans
Servicers begin helping borrowers navigate repayment after important financial decisions about the total cost
and experience of their education have already been made.
35© 2020 Navient Solutions, LLC. All rights reserved.
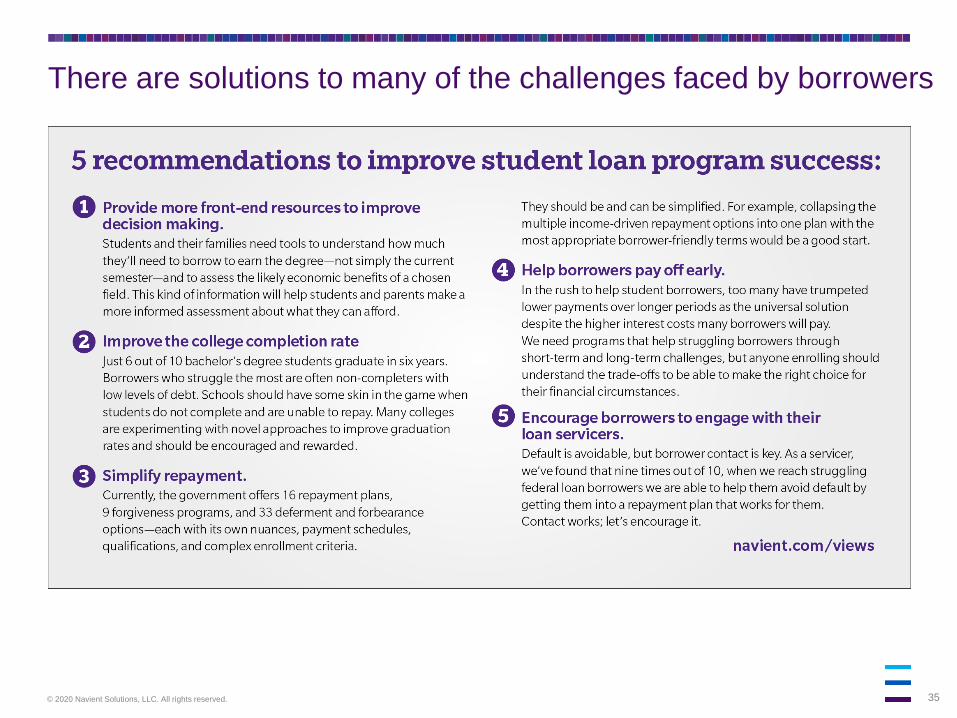
There are solutions to many of the challenges faced by borrowers
36© 2020 Navient Solutions, LLC. All rights reserved.
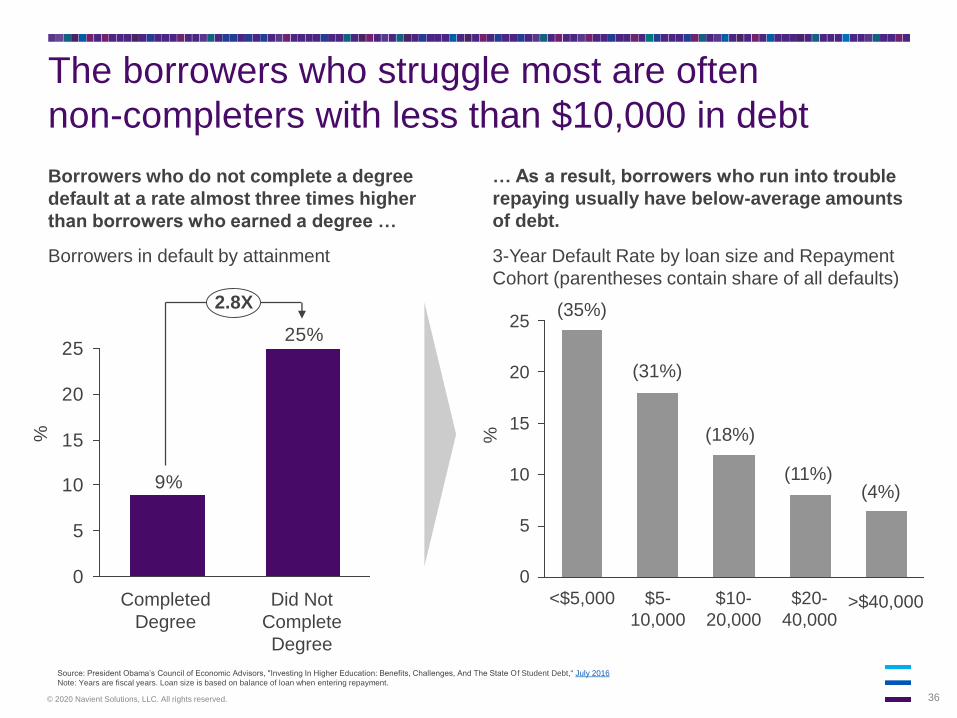
The borrowers who struggle most are often
non-completers with less than $10,000 in debt
Source: President Obama’s Council of Economic Advisors, "Investing In Higher Education: Benefits, Challenges, And The State Of Student Debt," July 2016
Note: Years are fiscal years. Loan size is based on balance of loan when entering repayment.
Borrowers in default by attainment
Borrowers who do not complete a degree
default at a rate almost three times higher
than borrowers who earned a degree …
… As a result, borrowers who run into trouble
repaying usually have below-average amounts
of debt.
3-Year Default Rate by loan size and Repayment
Cohort (parentheses contain share of all defaults)
25%
9%
0
5
10
15
20
25
Completed
Degree
2.8X
Did Not
Complete
Degree
25
20
15
10
5
0
<$5,000 $20-
40,000
$10-
20,000
$5-
10,000
(35%)
(31%)
(18%)
(11%)(4%)
%
>$40,000
%
37© 2020 Navient Solutions, LLC. All rights reserved.
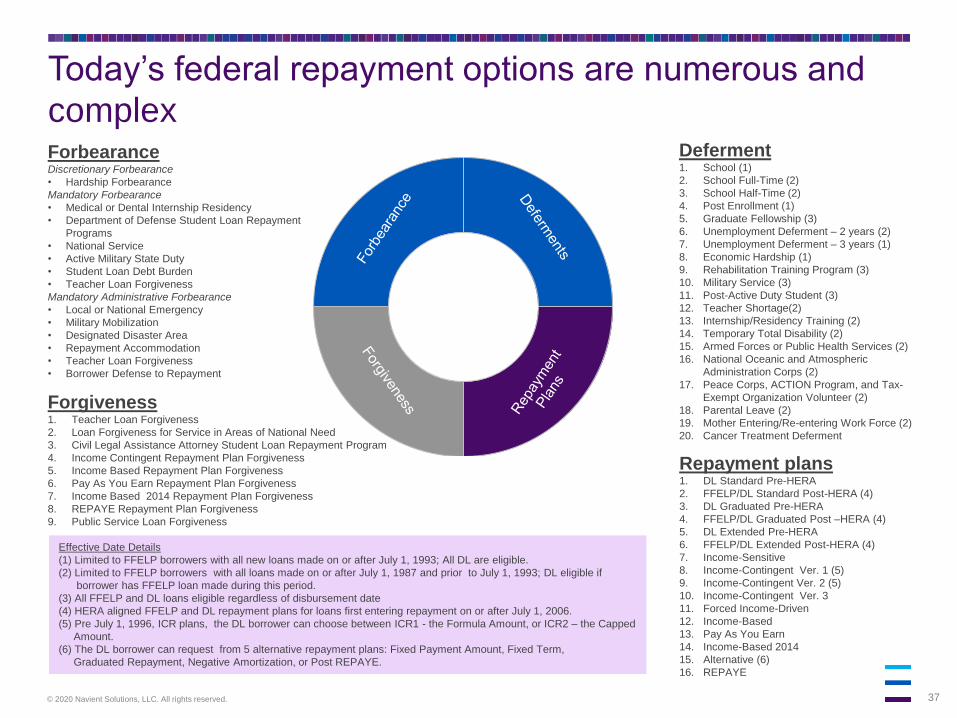
Today’s federal repayment options are numerous and
complexForbearanceDiscretionary Forbearance
• Hardship Forbearance
Mandatory Forbearance
• Medical or Dental Internship Residency
• Department of Defense Student Loan Repayment
Programs
• National Service
• Active Military State Duty
• Student Loan Debt Burden
• Teacher Loan Forgiveness
Mandatory Administrative Forbearance
• Local or National Emergency
• Military Mobilization
• Designated Disaster Area
• Repayment Accommodation
• Teacher Loan Forgiveness
• Borrower Defense to Repayment
Deferment1. School (1)
2. School Full-Time (2)
3. School Half-Time (2)
4. Post Enrollment (1)
5. Graduate Fellowship (3)
6. Unemployment Deferment – 2 years (2)
7. Unemployment Deferment – 3 years (1)
8. Economic Hardship (1)
9. Rehabilitation Training Program (3)
10. Military Service (3)
11. Post-Active Duty Student (3)
12. Teacher Shortage(2)
13. Internship/Residency Training (2)
14. Temporary Total Disability (2)
15. Armed Forces or Public Health Services (2)
16. National Oceanic and Atmospheric
Administration Corps (2)
17. Peace Corps, ACTION Program, and Tax-
Exempt Organization Volunteer (2)
18. Parental Leave (2)
19. Mother Entering/Re-entering Work Force (2)
20. Cancer Treatment Deferment
Forgiveness1. Teacher Loan Forgiveness
2. Loan Forgiveness for Service in Areas of National Need
3. Civil Legal Assistance Attorney Student Loan Repayment Program
4. Income Contingent Repayment Plan Forgiveness
5. Income Based Repayment Plan Forgiveness
6. Pay As You Earn Repayment Plan Forgiveness
7. Income Based 2014 Repayment Plan Forgiveness
8. REPAYE Repayment Plan Forgiveness
9. Public Service Loan Forgiveness
Repayment plans1. DL Standard Pre-HERA
2. FFELP/DL Standard Post-HERA (4)
3. DL Graduated Pre-HERA
4. FFELP/DL Graduated Post –HERA (4)
5. DL Extended Pre-HERA
6. FFELP/DL Extended Post-HERA (4)
7. Income-Sensitive
8. Income-Contingent Ver. 1 (5)
9. Income-Contingent Ver. 2 (5)
10. Income-Contingent Ver. 3
11. Forced Income-Driven
12. Income-Based
13. Pay As You Earn
14. Income-Based 2014
15. Alternative (6)
16. REPAYE
Effective Date Details
(1) Limited to FFELP borrowers with all new loans made on or after July 1, 1993; All DL are eligible.
(2) Limited to FFELP borrowers with all loans made on or after July 1, 1987 and prior to July 1, 1993; DL eligible if
borrower has FFELP loan made during this period.
(3) All FFELP and DL loans eligible regardless of disbursement date
(4) HERA aligned FFELP and DL repayment plans for loans first entering repayment on or after July 1, 2006.
(5) Pre July 1, 1996, ICR plans, the DL borrower can choose between ICR1 - the Formula Amount, or ICR2 – the Capped
Amount.
(6) The DL borrower can request from 5 alternative repayment plans: Fixed Payment Amount, Fixed Term,
Graduated Repayment, Negative Amortization, or Post REPAYE.
38© 2020 Navient Solutions, LLC. All rights reserved.
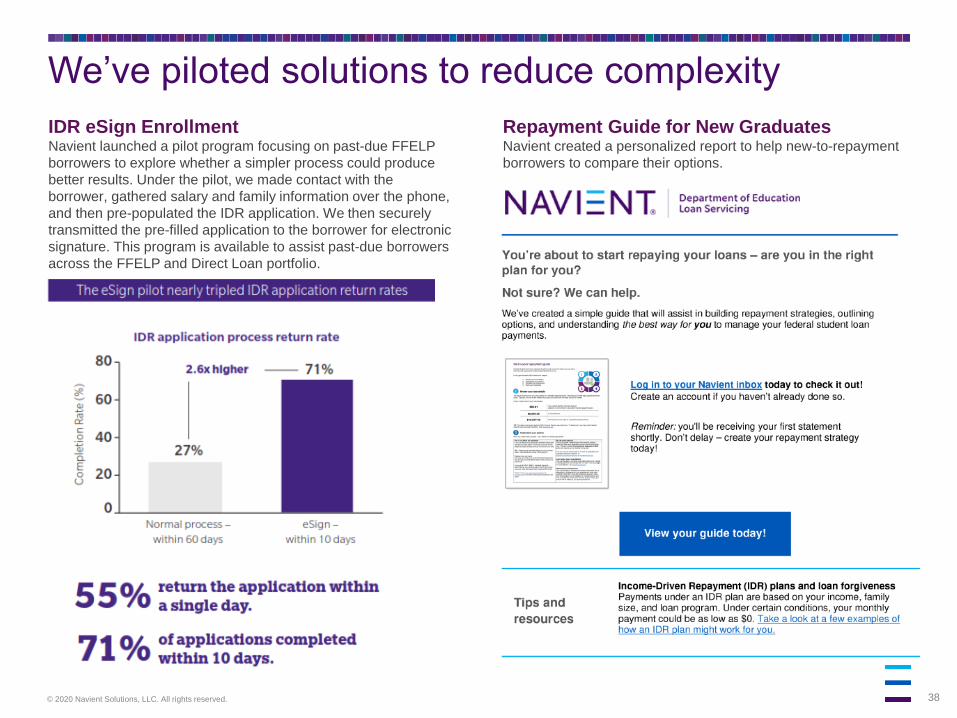
We’ve piloted solutions to reduce complexity
IDR eSign EnrollmentNavient launched a pilot program focusing on past-due FFELP
borrowers to explore whether a simpler process could produce
better results. Under the pilot, we made contact with the
borrower, gathered salary and family information over the phone,
and then pre-populated the IDR application. We then securely
transmitted the pre-filled application to the borrower for electronic
signature. This program is available to assist past-due borrowers
across the FFELP and Direct Loan portfolio.
Repayment Guide for New GraduatesNavient created a personalized report to help new-to-repayment
borrowers to compare their options.
39© 2020 Navient Solutions, LLC. All rights reserved.
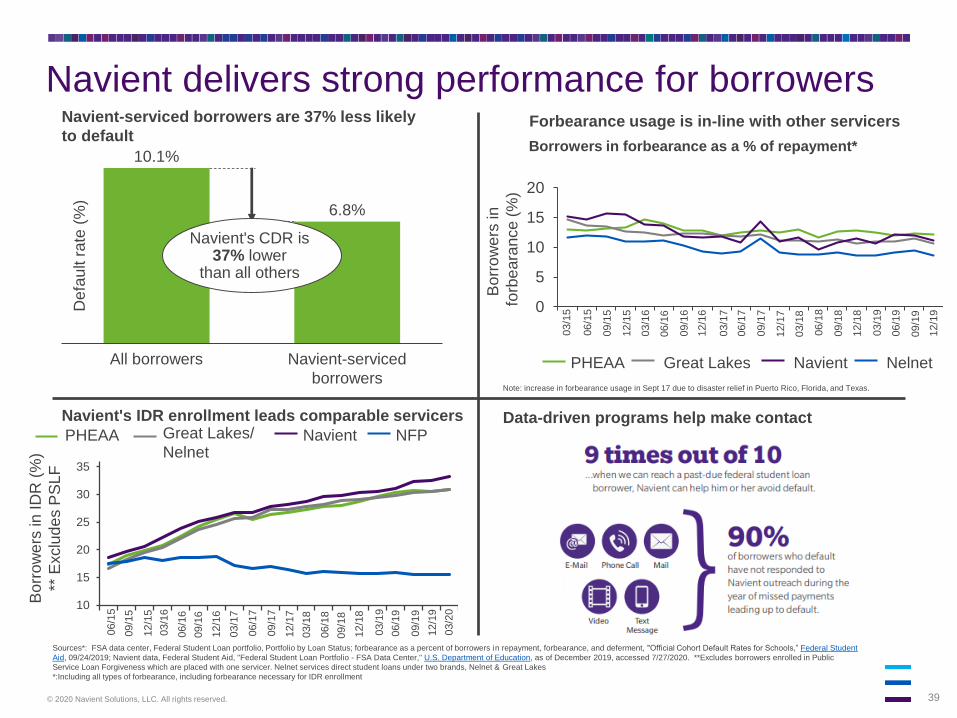
Navient delivers strong performance for borrowersD
efa
ult r
ate
(%)
All borrowers Navient-serviced
borrowers
10.1%
6.8%
Navient's CDR is 37% lower
than all others
Navient-serviced borrowers are 37% less likely
to defaultForbearance usage is in-line with other servicers
Sources*: FSA data center, Federal Student Loan portfolio, Portfolio by Loan Status; forbearance as a percent of borrowers in repayment, forbearance, and deferment, "Official Cohort Default Rates for Schools,” Federal Student
Aid, 09/24/2019; Navient data, Federal Student Aid, "Federal Student Loan Portfolio - FSA Data Center," U.S. Department of Education, as of December 2019, accessed 7/27/2020. **Excludes borrowers enrolled in Public
Service Loan Forgiveness which are placed with one servicer. Nelnet services direct student loans under two brands, Nelnet & Great Lakes
*:Including all types of forbearance, including forbearance necessary for IDR enrollment
Navient's IDR enrollment leads comparable servicers Data-driven programs help make contact
Note: increase in forbearance usage in Sept 17 due to disaster relief in Puerto Rico, Florida, and Texas.
Borrowers in forbearance as a % of repayment*
Bo
rro
we
rs in
forb
eara
nce (
%)
PHEAA NavientGreat Lakes Nelnet
PHEAA NavientGreat Lakes/
NelnetNFP
09/1
6
03/2
0
12/1
7
03/1
7
06/1
5
09/1
5
12/1
5
03/1
6
06/1
6
12/1
6
06/1
7
09/1
7
03/1
8
06/1
8
09/1
8
12/1
8
03/1
9
06/1
9
Bo
rro
we
rs in ID
R (
%)
** E
xclu
de
s P
SL
F
09/1
9
12/1
9
10
15
20
25
30
35
0
5
10
15
20
09/1
6
03/1
5
12/1
7
03/1
7
06/1
5
09/1
5
12/1
5
03/1
6
06/1
6
12/1
6
06/1
7
09/1
7
03/1
8
06/1
8
09/1
8
12/1
8
03/1
9
06/1
9
09/1
9
12/1
9
40© 2020 Navient Solutions, LLC. All rights reserved.
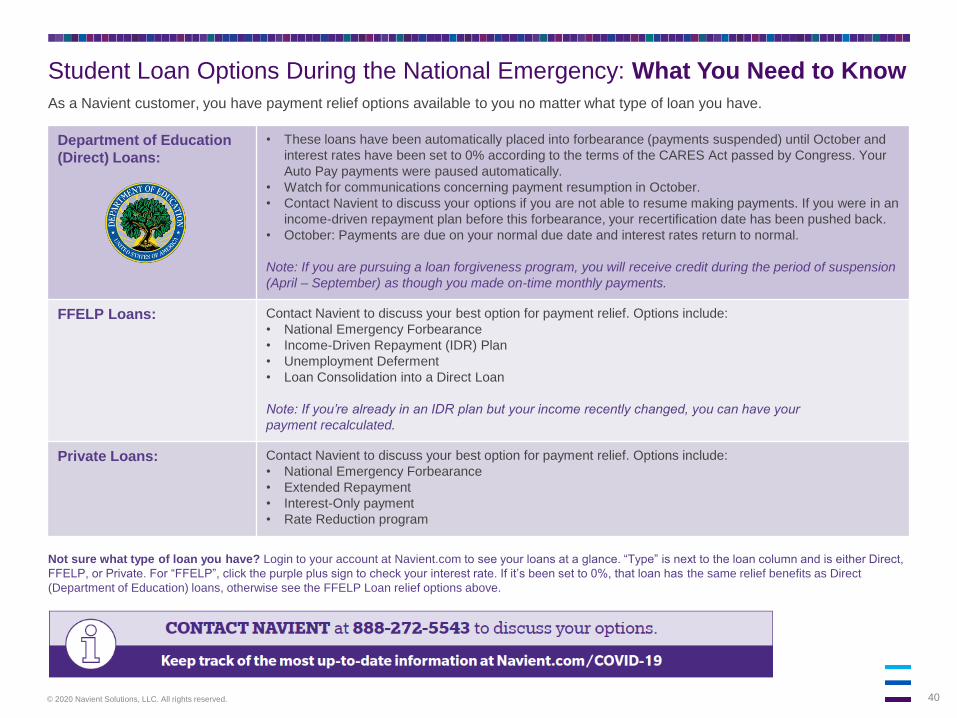
Student Loan Options During the National Emergency: What You Need to Know
Department of Education
(Direct) Loans:
• These loans have been automatically placed into forbearance (payments suspended) until October and
interest rates have been set to 0% according to the terms of the CARES Act passed by Congress. Your
Auto Pay payments were paused automatically.
• Watch for communications concerning payment resumption in October.
• Contact Navient to discuss your options if you are not able to resume making payments. If you were in an
income-driven repayment plan before this forbearance, your recertification date has been pushed back.
• October: Payments are due on your normal due date and interest rates return to normal.
Note: If you are pursuing a loan forgiveness program, you will receive credit during the period of suspension
(April – September) as though you made on-time monthly payments.
FFELP Loans: Contact Navient to discuss your best option for payment relief. Options include:
• National Emergency Forbearance
• Income-Driven Repayment (IDR) Plan
• Unemployment Deferment
• Loan Consolidation into a Direct Loan
Note: If you’re already in an IDR plan but your income recently changed, you can have your
payment recalculated.
Private Loans: Contact Navient to discuss your best option for payment relief. Options include:
• National Emergency Forbearance
• Extended Repayment
• Interest-Only payment
• Rate Reduction program
As a Navient customer, you have payment relief options available to you no matter what type of loan you have.
Not sure what type of loan you have? Login to your account at Navient.com to see your loans at a glance. “Type” is next to the loan column and is either Direct,
FFELP, or Private. For “FFELP”, click the purple plus sign to check your interest rate. If it’s been set to 0%, that loan has the same relief benefits as Direct
(Department of Education) loans, otherwise see the FFELP Loan relief options above.
41© 2020 Navient Solutions, LLC. All rights reserved.
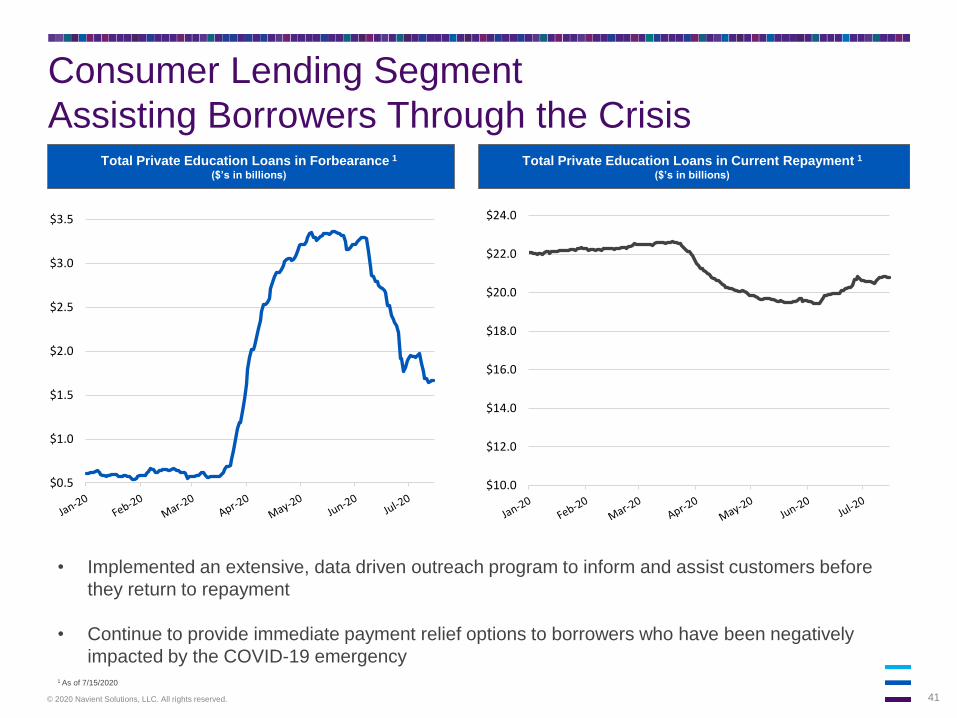
Consumer Lending Segment
Assisting Borrowers Through the Crisis
• Implemented an extensive, data driven outreach program to inform and assist customers before
they return to repayment
• Continue to provide immediate payment relief options to borrowers who have been negatively
impacted by the COVID-19 emergency
$0.5
$1.0
$1.5
$2.0
$2.5
$3.0
$3.5
$10.0
$12.0
$14.0
$16.0
$18.0
$20.0
$22.0
$24.0
Total Private Education Loans in Forbearance 1
($’s in billions)
Total Private Education Loans in Current Repayment 1
($’s in billions)
1 As of 7/15/2020
42© 2020 Navient Solutions, LLC. All rights reserved.
Navient
Corporation
Appendix

43© 2020 Navient Solutions, LLC. All rights reserved.
Notable Items Impacting Total Expenses Compared to Prior Periods
($ In millions) Q2 20 Q2 19 Q2 20 YTD Q2 19 YTD
Reported Core Earnings Expenses $214 $242 $469 $499
Year over Year Change in Reported Core Earnings Expenses (12%) (6%)
Restructuring & Reorganization Expenses $1 $1 $6 $2
Regulatory-Related Expenses ($2) $1 $5 $8
Adjusted Core Earnings Expenses 1 $215 $240 $458 $489
Year over Year Change in Adjusted Core Earnings Expenses (11%) (6%)
Transition Services Agreement $4 $5 $7 $12
Costs Associated with Proxy Contest Matters - $6 - $9
Comparable Core Earnings Total Expenses 1 $211 $229 $451 $468
Year over Year Change in Comparable Core Earnings Total Expenses (8%) (4%)
1 “Adjusted” and “Comparable” expenses are non-GAAP financial measures. By using these measures, management can make better short-term and long-term decisions related to expense management and allocation.
Navient Is Focused On Expense Efficiency
44© 2020 Navient Solutions, LLC. All rights reserved.
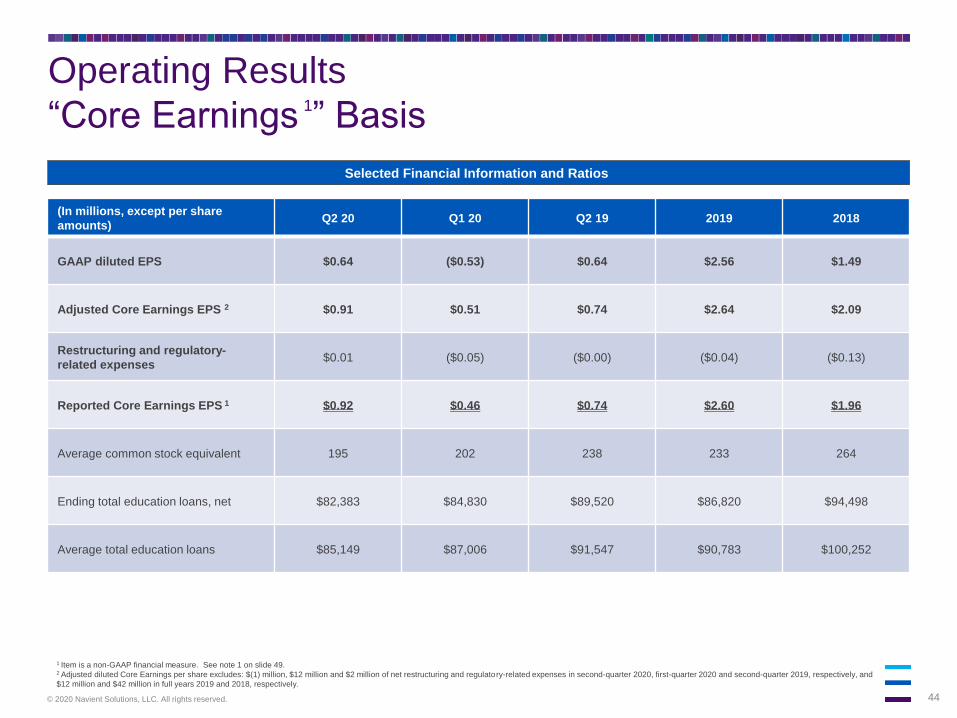
Operating Results
“Core Earnings 1” Basis
Selected Financial Information and Ratios
(In millions, except per share
amounts)Q2 20 Q1 20 Q2 19 2019 2018
GAAP diluted EPS $0.64 ($0.53) $0.64 $2.56 $1.49
Adjusted Core Earnings EPS 2 $0.91 $0.51 $0.74 $2.64 $2.09
Restructuring and regulatory-
related expenses$0.01 ($0.05) ($0.00) ($0.04) ($0.13)
Reported Core Earnings EPS 1 $0.92 $0.46 $0.74 $2.60 $1.96
Average common stock equivalent 195 202 238 233 264
Ending total education loans, net $82,383 $84,830 $89,520 $86,820 $94,498
Average total education loans $85,149 $87,006 $91,547 $90,783 $100,252
1 Item is a non-GAAP financial measure. See note 1 on slide 49.2 Adjusted diluted Core Earnings per share excludes: $(1) million, $12 million and $2 million of net restructuring and regulatory-related expenses in second-quarter 2020, first-quarter 2020 and second-quarter 2019, respectively, and
$12 million and $42 million in full years 2019 and 2018, respectively.
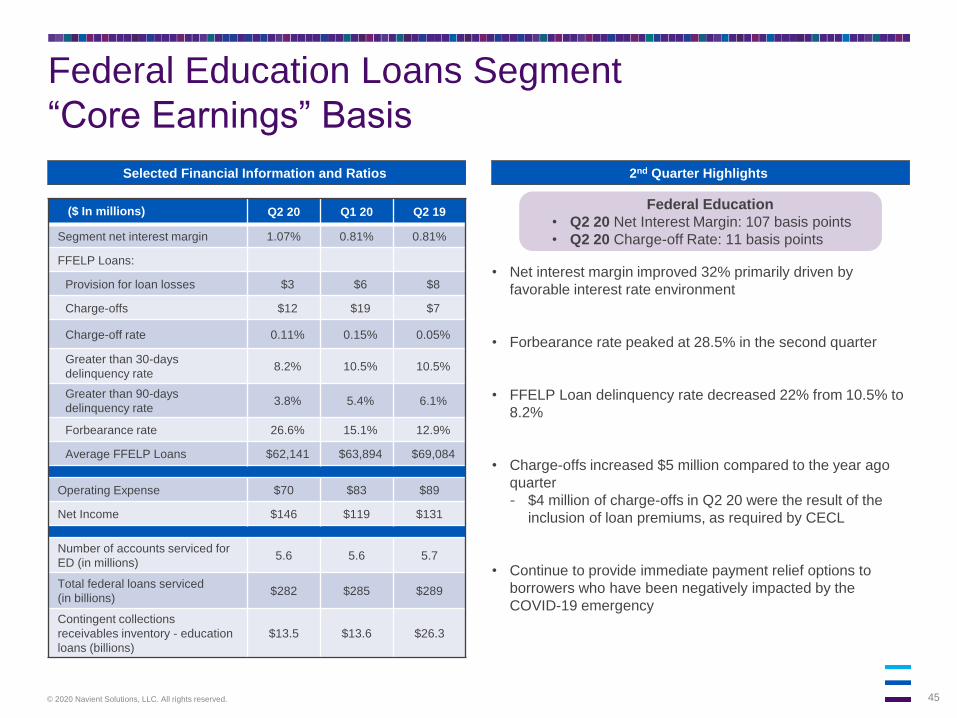
45© 2020 Navient Solutions, LLC. All rights reserved.
• Net interest margin improved 32% primarily driven by
favorable interest rate environment
• Forbearance rate peaked at 28.5% in the second quarter
• FFELP Loan delinquency rate decreased 22% from 10.5% to
8.2%
• Charge-offs increased $5 million compared to the year ago
quarter
- $4 million of charge-offs in Q2 20 were the result of the
inclusion of loan premiums, as required by CECL
• Continue to provide immediate payment relief options to
borrowers who have been negatively impacted by the
COVID-19 emergency
Selected Financial Information and Ratios 2nd Quarter Highlights
Federal Education Loans Segment
“Core Earnings” Basis
($ In millions) Q2 20 Q1 20 Q2 19
Segment net interest margin 1.07% 0.81% 0.81%
FFELP Loans:
Provision for loan losses $3 $6 $8
Charge-offs $12 $19 $7
Charge-off rate 0.11% 0.15% 0.05%
Greater than 30-days
delinquency rate8.2% 10.5% 10.5%
Greater than 90-days
delinquency rate3.8% 5.4% 6.1%
Forbearance rate 26.6% 15.1% 12.9%
Average FFELP Loans $62,141 $63,894 $69,084
Operating Expense $70 $83 $89
Net Income $146 $119 $131
Number of accounts serviced for
ED (in millions)5.6 5.6 5.7
Total federal loans serviced
(in billions)$282 $285 $289
Contingent collections
receivables inventory - education
loans (billions)
$13.5 $13.6 $26.3
Federal Education
• Q2 20 Net Interest Margin: 107 basis points
• Q2 20 Charge-off Rate: 11 basis points
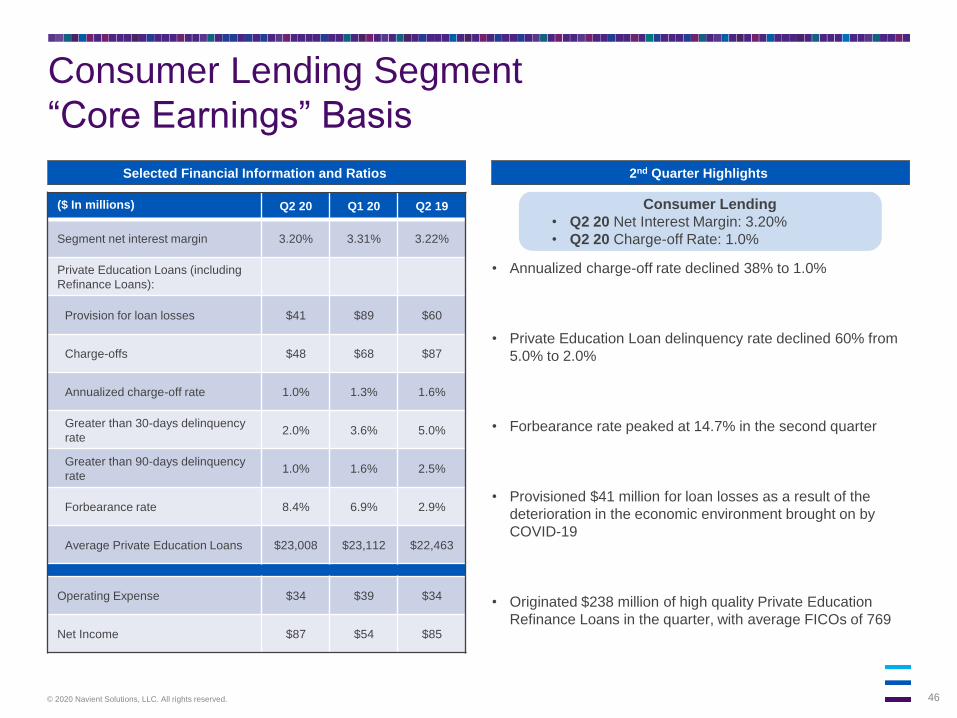
46© 2020 Navient Solutions, LLC. All rights reserved.
Consumer Lending Segment
“Core Earnings” Basis
($ In millions) Q2 20 Q1 20 Q2 19
Segment net interest margin 3.20% 3.31% 3.22%
Private Education Loans (including
Refinance Loans):
Provision for loan losses $41 $89 $60
Charge-offs $48 $68 $87
Annualized charge-off rate 1.0% 1.3% 1.6%
Greater than 30-days delinquency
rate2.0% 3.6% 5.0%
Greater than 90-days delinquency
rate1.0% 1.6% 2.5%
Forbearance rate 8.4% 6.9% 2.9%
Average Private Education Loans $23,008 $23,112 $22,463
Operating Expense $34 $39 $34
Net Income $87 $54 $85
• Annualized charge-off rate declined 38% to 1.0%
• Private Education Loan delinquency rate declined 60% from
5.0% to 2.0%
• Forbearance rate peaked at 14.7% in the second quarter
• Provisioned $41 million for loan losses as a result of the
deterioration in the economic environment brought on by
COVID-19
• Originated $238 million of high quality Private Education
Refinance Loans in the quarter, with average FICOs of 769
Consumer Lending
• Q2 20 Net Interest Margin: 3.20%
• Q2 20 Charge-off Rate: 1.0%
Selected Financial Information and Ratios 2nd Quarter Highlights

47© 2020 Navient Solutions, LLC. All rights reserved.
Business Processing Segment
“Core Earnings” Basis
Selected Financial Information and Ratios 2nd Quarter Highlights
• New Government Services contracts to support states in
providing unemployment benefits offset by temporary
stoppages of certain collection and processing activity along
with lower volume in the transportation related businesses
- Drawing on its deep, at-scale experience supporting
federal, state, and local governments, Navient has
supported several states in their management of
the substantial increase in unemployment insurance
applications.
- In these successful projects—many brought up within a
couple days—Navient has demonstrated its capabilities to
understand, communicate, deploy and manage complex,
high-volume eligibility programs.
• New Healthcare RCM Services contracts providing contact
tracing services offset by lower hospital inventory placements
- Beginning as a targeted outbound call center, the project
has rapidly expanded to support state-wide inbound call
center and back office processing
($ In millions) Q2 20 Q1 20 Q2 19
Government Services $43 $33 $40
Healthcare RCM Services $21 $24 $25
Total Business Processing
Revenue$64 $57 $65
Operating Expenses $57 $54 $56
EBITDA 1 $8 $4 $11
EBITDA Margin 1 13% 7% 17%
Net Income $6 $2 $7
Contingent collections receivables
inventory (billions)$14.5 $15.1 $15.0
1 Item is a non-GAAP financial measure. See note 4 on slide 50.
Business Processing
• Q2 20 EBITDA Margin 1: 13%
48© 2020 Navient Solutions, LLC. All rights reserved.
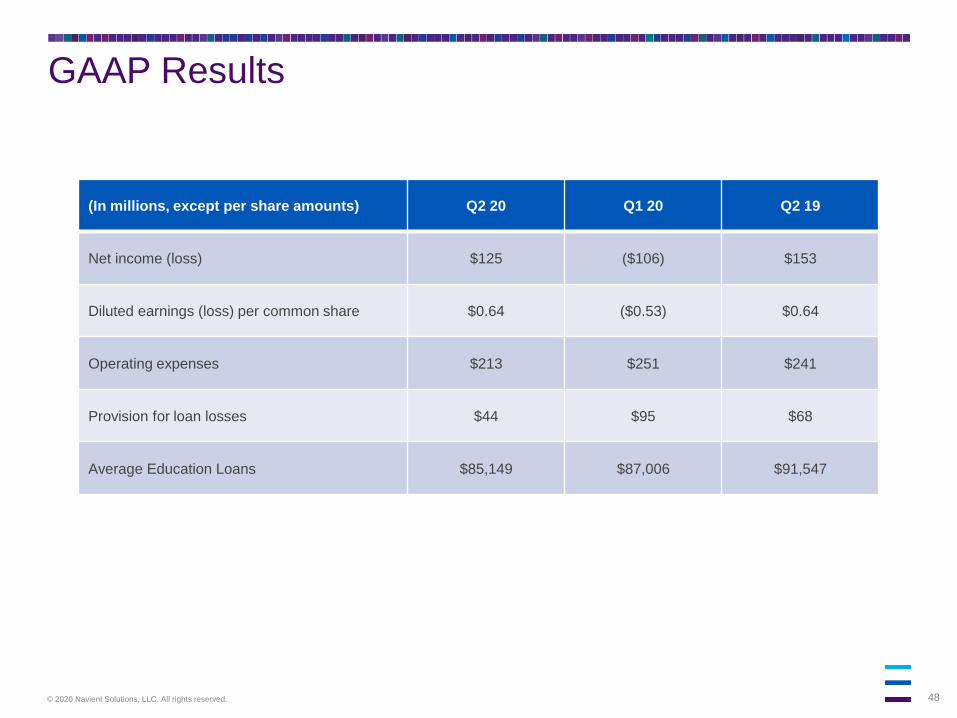
GAAP Results
(In millions, except per share amounts) Q2 20 Q1 20 Q2 19
Net income (loss) $125 ($106) $153
Diluted earnings (loss) per common share $0.64 ($0.53) $0.64
Operating expenses $213 $251 $241
Provision for loan losses $44 $95 $68
Average Education Loans $85,149 $87,006 $91,547

49© 2020 Navient Solutions, LLC. All rights reserved.
Notes on Non-GAAP Financial Measures(Dollars in Millions)
In addition to financial results reported on a GAAP basis, Navient also provides certain performance measures which are non-GAAP financial measures. The following non-GAAP
financial measures are presented within this Presentation:
1. Core Earnings – The difference between the company’s Core Earnings and its GAAP results is that Core Earnings excludes the impacts of: (1) mark-to-market
gains/losses on derivatives and (2) goodwill and acquired intangible asset amortization and impairment. Management uses Core Earnings in making decisions regarding
the company’s performance and the allocation of corporate resources and, as a result, our segment results are presented using Core Earnings. In addition, Navient’s
equity investors, credit rating agencies and debt capital investors use these Core Earnings measures to monitor the company’s business performance. For further detail
and reconciliation, see page 51 of this presentation and pages 14 – 18 of Navient’s second-quarter earnings release.
2. Core Earnings Return on Equity (CEROE) – Core Earnings Return on Equity is calculated as Core Net income, excluding restructuring and regulatory-related expenses,
divided by the quarterly average of GAAP equity for the trailing four quarters. This measure allows management, as well as investors and analysts, to measure the
company’s use of its equity. The calculation for Q2 2020 is as follows:
3. Core Earnings Efficiency Ratio – The Core Earnings Efficiency Ratio measures the company’s Core Earnings Expenses, excluding restructuring and regulatory-related
expenses, relative to its Adjusted Core Earnings Revenue. This ratio can be calculated by dividing Core Earnings Expenses, excluding restructuring and regulatory-
related expenses, by Adjusted Core Earnings Revenue. Adjusted Core Earnings Revenue is derived by adding provision for loan losses, and excluding gains or loss on
debt repurchases, to Total Core Earnings Revenue. This is a useful measure to management as we plan and forecast, as it removes variables that cannot be easily
predicted in advance. By using this measure, management can make better short-term and long-term decisions related to expense management and allocation. The
calculation for Q2 2020 is as follows:
Adjusted Core Earnings Net income
Average Equity
Adjusted Core Earnings Expense
Adjusted Core Earnings Revenue
$178 (1)
($3,240 + 3,336 + 2,035 + $2,115) / 4= = 27% (2)
=$215 (1)
$492 = 44%
1 Excludes $(1) million of net restructuring and regulatory-related expenses in second-quarter 2020.2 Return on Equity has been annualized.
Q2 2020 =
Q2 2020 =
50© 2020 Navient Solutions, LLC. All rights reserved.
Notes on Non-GAAP Financial Measures(Dollars in Millions)
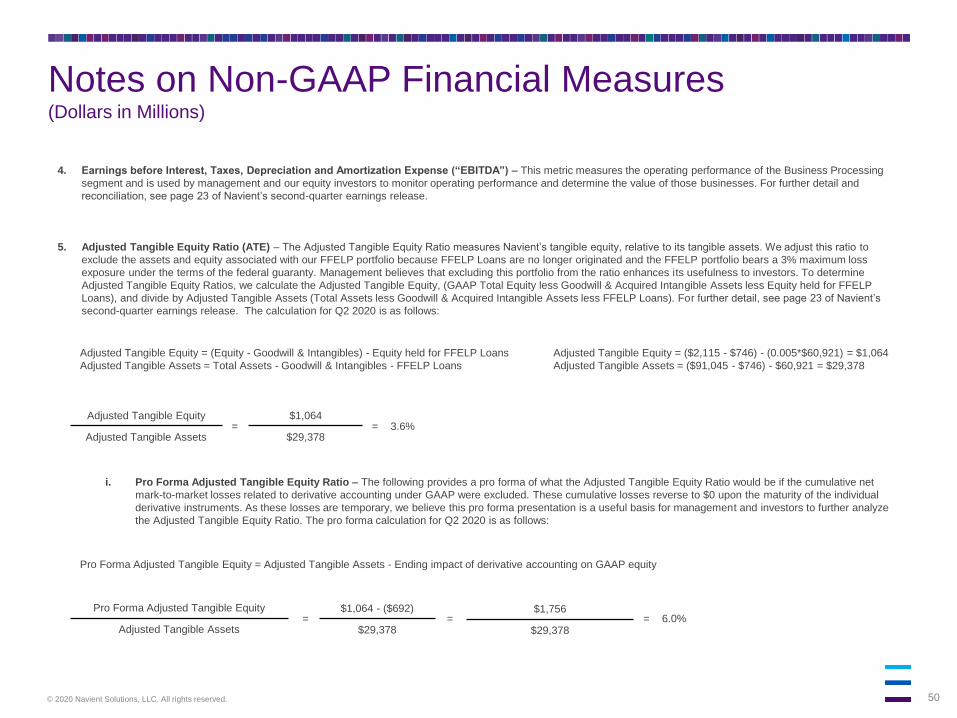
4. Earnings before Interest, Taxes, Depreciation and Amortization Expense (“EBITDA”) – This metric measures the operating performance of the Business Processing
segment and is used by management and our equity investors to monitor operating performance and determine the value of those businesses. For further detail and
reconciliation, see page 23 of Navient’s second-quarter earnings release.
5. Adjusted Tangible Equity Ratio (ATE) – The Adjusted Tangible Equity Ratio measures Navient’s tangible equity, relative to its tangible assets. We adjust this ratio to
exclude the assets and equity associated with our FFELP portfolio because FFELP Loans are no longer originated and the FFELP portfolio bears a 3% maximum loss
exposure under the terms of the federal guaranty. Management believes that excluding this portfolio from the ratio enhances its usefulness to investors. To determine
Adjusted Tangible Equity Ratios, we calculate the Adjusted Tangible Equity, (GAAP Total Equity less Goodwill & Acquired Intangible Assets less Equity held for FFELP
Loans), and divide by Adjusted Tangible Assets (Total Assets less Goodwill & Acquired Intangible Assets less FFELP Loans). For further detail, see page 23 of Navient’s
second-quarter earnings release. The calculation for Q2 2020 is as follows:
Adjusted Tangible Equity
Adjusted Tangible Assets
Adjusted Tangible Equity = (Equity - Goodwill & Intangibles) - Equity held for FFELP Loans
Adjusted Tangible Assets = Total Assets - Goodwill & Intangibles - FFELP Loans
=
Adjusted Tangible Equity = ($2,115 - $746) - (0.005*$60,921) = $1,064
Adjusted Tangible Assets = ($91,045 - $746) - $60,921 = $29,378
$1,064
$29,3783.6%=
i. Pro Forma Adjusted Tangible Equity Ratio – The following provides a pro forma of what the Adjusted Tangible Equity Ratio would be if the cumulative net
mark-to-market losses related to derivative accounting under GAAP were excluded. These cumulative losses reverse to $0 upon the maturity of the individual
derivative instruments. As these losses are temporary, we believe this pro forma presentation is a useful basis for management and investors to further analyze
the Adjusted Tangible Equity Ratio. The pro forma calculation for Q2 2020 is as follows:
Pro Forma Adjusted Tangible Equity
Adjusted Tangible Assets=
$1,064 - ($692)
$29,3786.0%=
Pro Forma Adjusted Tangible Equity = Adjusted Tangible Assets - Ending impact of derivative accounting on GAAP equity
$1,756
$29,378=
51© 2020 Navient Solutions, LLC. All rights reserved.
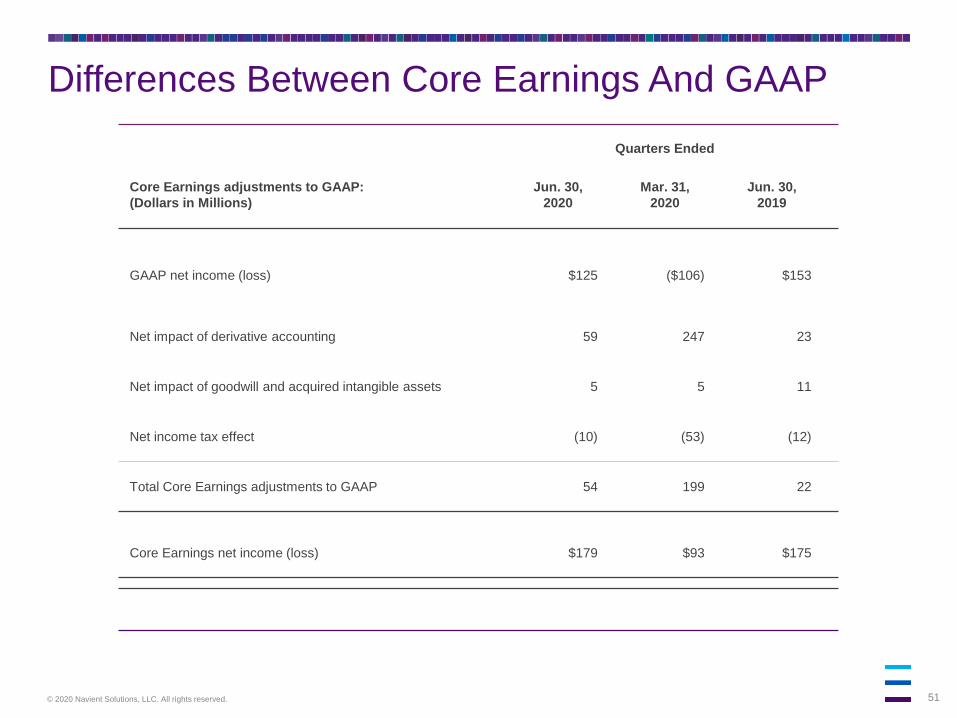
Differences Between Core Earnings And GAAP
Quarters Ended
Core Earnings adjustments to GAAP:
(Dollars in Millions)
Jun. 30,
2020
Mar. 31,
2020
Jun. 30,
2019
GAAP net income (loss) $125 ($106) $153
Net impact of derivative accounting 59 247 23
Net impact of goodwill and acquired intangible assets 5 5 11
Net income tax effect (10) (53) (12)
Total Core Earnings adjustments to GAAP 54 199 22
Core Earnings net income (loss) $179 $93 $175
52© 2020 Navient Solutions, LLC. All rights reserved.
Investor Relations Website
• NAVI / SLM student loan trust data (Debt/asset backed securities – NAVI / SLM Student Loan Trusts)
- Static pool information – detailed portfolio stratifications by trust as of the cutoff date
- Accrued interest factors
- Quarterly distribution factors
- Historical trust performance – monthly charge-off, delinquency, loan status, CPR, etc. by trust
- Since issued CPR – monthly CPR data by trust since issuance
• NAVI / SLM student loan performance by trust – Issue details
- Current and historical monthly distribution reports
- Distribution factors
- Current rates
- Prospectus for public transactions and Rule 144A transactions are available through underwriters
• Additional information (Webcasts and presentations)
- Archived and historical webcasts, transcripts and investor presentations
www.navient.com/investorswww.navient.com/abs