Embed Size (px)
Citation preview
2020 ACCOUNTABILITY PLAN
UNIVERSITY OF WEST FLORIDA Draft April 23, 2020 for BOT Approval
Revised by Board of Governors Staff July 6, 2020

2020 ACCOUNTABILITY PLAN UNIVERSITY OF WEST FLORIDA
April 23, 2020 BOT Approved
2
Table of Contents
INTRODUCTION ................................................................................................. 3 STRATEGY ......................................................................................................... 4
Mission Statement ............................................................................................ 4 Statement of Strategy ...................................................................................... 4 Strengths, Opportunities & Challenges ............................................................ 5 Key Initiatives & Investments ........................................................................... 5 Graduation Rate Improvement Plan Update .................................................... 6 Key Achievements for Last Year ...................................................................... 7
PERFORMANCE-BASED FUNDING METRICS ................................................ 8 KEY PERFORMANCE INDICATORS ............................................................... 10
Teaching & Learning ...................................................................................... 10 Scholarship, Research & Innovation Metrics ................................................. 13 Institution Specific Goals ................................................................................ 15
ENROLLMENT PLANNING .............................................................................. 16 ACADEMIC PROGRAM COORDINATION ...................................................... 18 DEFINITIONS .................................................................................................... 19

2020 ACCOUNTABILITY PLAN UNIVERSITY OF WEST FLORIDA
April 23, 2020 BOT Approved
3
INTRODUCTION
The Accountability Plan is an annual report that is closely aligned with the Board of Governors’ 2025 System Strategic Plan. This report enhances the System’s commitment to accountability and strategic planning by fostering greater coordination between institutional administrators, University Boards of Trustees and the Board of Governors regarding each institution’s direction and priorities as well as performance expectations and outcomes on institutional and System-wide goals.
Once an Accountability Plan is approved by each institution’s respective Boards of Trustees, the Board of Governors will review and consider the plan for approval, excluding those sections of the Plan that require additional regulatory or procedural approval pursuant to law or Board regulations.

2020 ACCOUNTABILITY PLAN UNIVERSITY OF WEST FLORIDA
April 23, 2020 BOT Approved
4
STRATEGY Mission Statement Do not change the sizes of the narrative sections – although you can adjust the mission statement
size if you need more room for the statement of strategy as long as both sections are contained to the same single page. The University of West Florida’s Mission is to:
● Provide high-quality undergraduate and graduate education, ● Conduct teaching and research that services the body of knowledge, and ● Contribute to the needs of professions and society.
Statement of Strategy UWF will continue to fulfill its mission by employing the following strategies: 1. Build programs of distinction that enhance UWF's reputation for educational innovation and excellence. Develop and retain a culture that supports research and creativity. Augment and invest in academic and research programs that meet professional, personal, scholastic and workforce needs. Optimize and refine internal and external support to promote teaching and learning activities, research, service, strategic innovation and other scholarly endeavors that serve the greater good and the SUS Strategic Plan. 2. Provide high-quality learning and high-impact practices that inspire students to become enlightened, engaged global citizens and successful professionals. UWF will align resources to deliver exceptional support services and learning opportunities that will ensure students have access, continuity and success while earning degrees. 3. Strengthen and expand partnerships that multiply UWF's impact and visibility in the community as an educational, cultural and economic center. Enhance the region's education, economy, culture, health and well-being through endeavors beyond campus borders while attracting residents and visitors to campus. Inspire partnerships that open pathways to employment for UWF students and graduates. 4. Attract, retain and develop high-quality and diverse faculty and staff. Recognize, reward and celebrate faculty and staff for their contributions to student development, scholarly or professional achievements and community partnerships. 5. Promote UWF's properties as desirable destinations for educational, cultural, professional and personal activities. Invest in and steward UWF's natural, technical, intellectual and physical capital and infrastructure.

2020 ACCOUNTABILITY PLAN UNIVERSITY OF WEST FLORIDA
April 23, 2020 BOT Approved
5
STRATEGY (cont.) Strengths, Opportunities & Challenges UWF fulfills its institutional mission by building on the following strengths and opportunities: Robust and comprehensive academic programming is available to UWF students. The majority of our undergraduate courses are taught by full-time faculty and we judiciously employ adjuncts in fields where applied knowledge will benefit students. UWF values accessibility for students. We were early adopters of online delivery and more than 40% of our offerings now are online. Our UWF Emerald Coast location provides seamless educational opportunities. We are constantly refining financial aid strategies, communication and packaging to ensure students with limited resources can attend and graduate on time. The diversity of our student body and our region has given UWF opportunities to demonstrate its excellence. In 2019, UWF won the Higher Education Excellence in Diversity Award from Insight to Diversity Magazine for the fourth time. Community partners and regional resources offer opportunities to enhance the cultural and economic landscape of Northwest Florida. Through the UWF Historic Trust, we engage students and faculty in preserving and sharing the rich history of our area. Our military presence creates a substantial economic impact in Northwest Florida. UWF is consistently recognized as military-friendly by various publications. Key challenges include low regional salaries compared to the rest of Florida, which may discourage graduates from staying in the community. As the campus matures beyond the 50-year mark, critical deferred maintenance issues on the Pensacola campus pose a serious threat to UWF’s ability to fulfill its mission.
Three Key Initiatives & Investments 1. ACCESS: UWF is dedicated to providing students access to high quality education regardless of their financial situation. We believe in removing barriers to help students maintain satisfactory academic progress and complete their degrees on time. Online programming provides access for students needing flexibility in course scheduling. Currently more than 40 percent of our undergraduate courses and 80 percent of graduate courses are offered online. More than 70 percent of UWF students receive financial assistance. We have expanded our work study program. We also revised our scholarships to offer additional funding to incoming students. We continue to focus on reducing the cost of textbooks for our students. We have expanded our programs in Fort Walton Beach. 2. PROGRAMS OF EXCELLENCE: UWF is building signature programming by leveraging regional resources, including cybersecurity, Sea3D Laboratory, supply chain logistics, veteran support and Ph.D. in Intelligent Systems and Robotics. UWF hosted the NSA’s Executive Leadership Forum, attracting the nation’s top cybersecurity leaders. We are supporting safer schools by linking UWF’s expertise in behavioral science and a new 300-degree virtual simulator. UWF is positioned to provide training to School Resource Officers and Threat Assessment Teams. 3. STUDENT ACHIEVEMENT: UWF remains laser focused on our students’ success as they matriculate through the university and move into their careers. We are strengthening programming in four strategic areas: advising, high impact programming, career enhancement and student support. A university-wide steering committee focuses on increasing student access to high-impact learning opportunities and establishing hallmark student learning outcomes and activities.

2020 ACCOUNTABILITY PLAN UNIVERSITY OF WEST FLORIDA
April 23, 2020 BOT Approved
6
STRATEGY (cont.) Graduation Rate Improvement Plan Update In order to increase the four-year graduation rate and reach the Florida State University System’s goals, UWF remains focused on increasing the percentage of baccalaureate-seeking, resident undergraduates enrolled in 15 or more credit hours. We have continued to focus our outreach efforts towards first-year students through the UWF First Year Advising Center. We continue to promote UWF’s “30 to Finish Campaign” and for the 2018-2019 academic year we increased the percentage of students who enrolled in 30 hours of coursework between fall and summer. The percentage of students who enrolled for 30 hours or more increased for each of the cohorts from fall 2018 to spring 2019. During fall 2018, 32.88% of the 2018 cohort attempted 15 credit hours, compared to 30% from the prior year, and 37.44% percent did so during spring 2019. This is a considerable shift from previous years where 24 credits a year was the standard for most students. For the 2019 cohort 35.70% of students enrolled in more than 15 hours in the fall 2019 and 37.57% did so in the spring 2020 semester. These trends suggest that we have an even greater opportunity to expand and promote UWF’s “30 to Finish Campaign” through active advising and outreach efforts. Other strategies focused on increasing the percentage of students enrolled in 15 or more credit hours include the implementation of our revised Undergraduate Progress to Degree Policy, continued development of the Degree in Three Program, enhanced credit hour alert notifications for summer and fall 2019 registration, continued focus on completion grant programs and development of summer enrollment mini grants awards. The credit hour alert notification now involves academic advisors who assist students with developing a schedule that meets the student’s needs and keeps them on track to complete 30 hours per academic year. The Degree in Three Program has experienced increased participation as we have promoted the program more and conducted targeted outreach to our students, including those who are in dual-enrollment programs. In 2018-19 we doubled the funding available for the mini grants available to our students. We have also added a Senior Countdown program which provides students timely communication through their four years at UWF, offering priority registration and a Senior Graduation Grant during the student’s last semester. This program is going strong and reached 825 students. We also launched our Artificial Intelligence Chat Bot named "Argie" in March 2020. The chat bot will enhance current communication to students in two ways. First, our proactive outreach will notify students of important dates and deadlines (when registration opens, last day to add/drop, financial aid deadlines, etc.) and will also enhance current communication for credit hour alert, Degree in Three eligibility and Senior Countdown eligibility. Additionally, Argie will give students 24/7 access to ask questions and receive answers. UWF is dedicated to providing students access to educational opportunities regardless of their financial situation and believes in removing financial barriers to help students stay on track. The primary purpose of our financial aid program is to provide support to students, help them maintain satisfactory academic process and enable them to complete their degree on time and on budget. Our top priority is to assist students with financial need.

2020 ACCOUNTABILITY PLAN UNIVERSITY OF WEST FLORIDA
April 23, 2020 BOT Approved
7
Key Achievements for Last Year (Student, Faculty, Program, Institutional) STUDENT ACHIEVEMENTS
1. A group of six UWF supply chain logistics students placed second at Operation Stimulus, the longest running national supply chain and logistics student case competition in North America.
2. UWF welcomed four National Merit Finalists: James Henderson, Mason Hutchinson, Fiama Mastrangelo and Joshua Wood in Fall 2018.
3. Three UWF student-athletes received national academic accolades. Softball student-athlete Rhiannon Sassman was named a 2019 Google Cloud Academic All-American by the College Sports Information Directors of America, and the Golf Coaches Association of America named student-athletes Christian Bosso and Jacob Huizinga as Srixon/Cleveland Golf All-America Scholars.
4. The UWF robotics team finished second out of 41 teams in the annual Institute of Electrical and Electronics Engineers SoutheastCon hardware competition.
FACULTY ACHIEVEMENTS
1. UWF President Martha D. Saunders was honored with 2019 National Association of Colleges and Employers Career Services Champion Award.
2. President Emeritus Dr. Judith Bense was named the 2019 recipient of the Evelyn Fortune Bartlett Award, the most prestigious award presented by the Florida Trust for Historic Preservation.
3. Three Usha Kundu, MD College of Health faculty members, Dr. James Arruda, Dr. Crystal Bennett and Dr. Youngil Lee uncovered new information on the early detection and treatment of Alzheimer’s patients. Former Florida Gov. Rick Scott and the Florida Department of Health awarded UWF more than $94,000 in grant funds for Bennett’s adaptive dance Alzheimer’s research.
4. Hal Marcus College of Science and Engineering assistant professor Dr. Brad Regez developed ArgoTots, an Enterprise program for mechanical engineering students, which provides modified vehicles to young children who experience limited mobility.
PROGRAM ACHIEVEMENTS
1. UWF became the first university in Florida to offer a bachelor’s degree in cybersecurity designated by the NSA and U.S. Department of Homeland Security as a National Center of Academic Excellence in Cyber Defense.
2. UWF partnered with IHMC to develop a doctoral program in intelligent systems and robotics—the first of its kind in Florida and one of only a few in the nation.
3. UWF established the Argo Athletic Band, which features students from various majors throughout the entire campus.
INSTITUTIONAL ACHIEVEMENTS
1. INSIGHT into Diversity Magazine honored UWF with the Higher Education Excellence in Diversity award.
2. UWF partnered with the NSA and U.S. Department of Homeland Security to host the Cybersecurity Centers of Academic Excellence Executive Leadership Forum.
3. UWF earned the third-highest score in the system with 86 points out of 100 in the Board of Governors’ performance-based funding model results from the 2017-18 academic year, the highest number of points the University has received.
2020 ACCOUNTABILITY PLAN UNIVERSITY OF WEST FLORIDA
April 23, 2020 BOT Approved
8
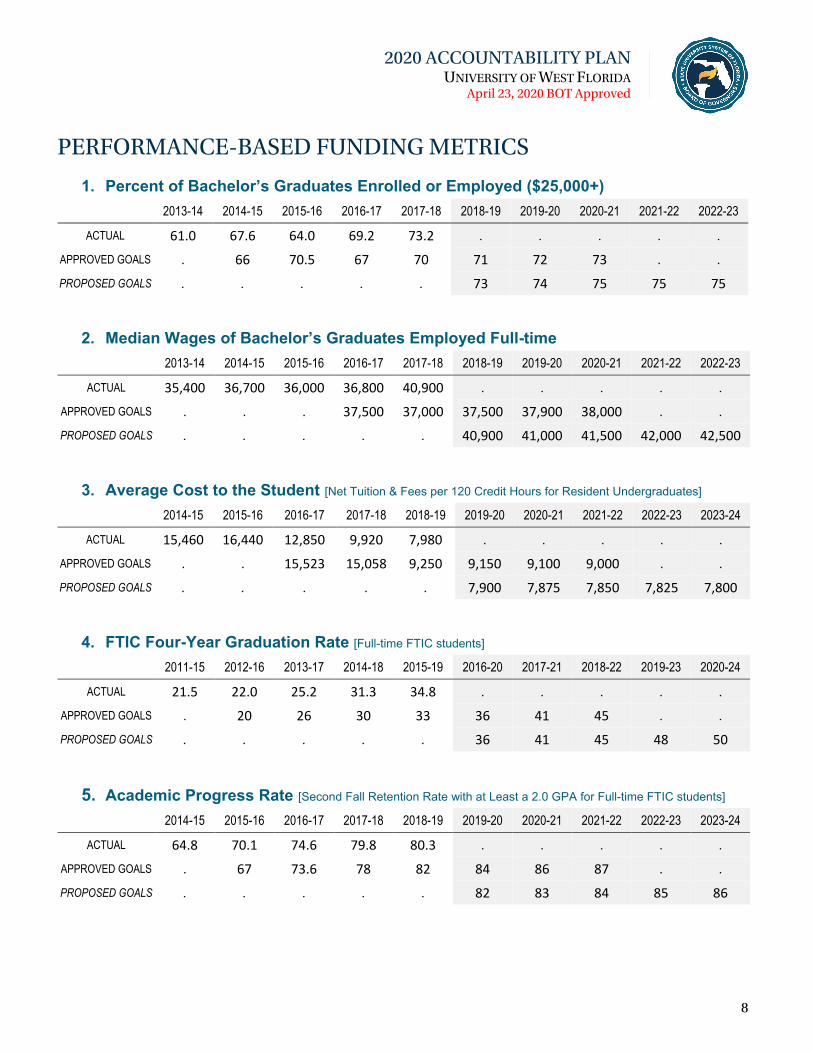
PERFORMANCE-BASED FUNDING METRICS
1. Percent of Bachelor’s Graduates Enrolled or Employed ($25,000+) 2013-14 2014-15 2015-16 2016-17 2017-18 2018-19 2019-20 2020-21 2021-22 2022-23
ACTUAL 61.0 67.6 64.0 69.2 73.2 . . . . .
APPROVED GOALS . 66 70.5 67 70 71 72 73 . .
PROPOSED GOALS . . . . . 73 74 75 75 75
2. Median Wages of Bachelor’s Graduates Employed Full-time 2013-14 2014-15 2015-16 2016-17 2017-18 2018-19 2019-20 2020-21 2021-22 2022-23
ACTUAL 35,400 36,700 36,000 36,800 40,900 . . . . . APPROVED GOALS . . . 37,500 37,000 37,500 37,900 38,000 . . PROPOSED GOALS . . . . . 40,900 41,000 41,500 42,000 42,500
3. Average Cost to the Student [Net Tuition & Fees per 120 Credit Hours for Resident Undergraduates] 2014-15 2015-16 2016-17 2017-18 2018-19 2019-20 2020-21 2021-22 2022-23 2023-24
ACTUAL 15,460 16,440 12,850 9,920 7,980 . . . . .
APPROVED GOALS . . 15,523 15,058 9,250 9,150 9,100 9,000 . .
PROPOSED GOALS . . . . . 7,900 7,875 7,850 7,825 7,800
4. FTIC Four-Year Graduation Rate [Full-time FTIC students] 2011-15 2012-16 2013-17 2014-18 2015-19 2016-20 2017-21 2018-22 2019-23 2020-24
ACTUAL 21.5 22.0 25.2 31.3 34.8 . . . . .
APPROVED GOALS . 20 26 30 33 36 41 45 . .
PROPOSED GOALS . . . . . 36 41 45 48 50
5. Academic Progress Rate [Second Fall Retention Rate with at Least a 2.0 GPA for Full-time FTIC students] 2014-15 2015-16 2016-17 2017-18 2018-19 2019-20 2020-21 2021-22 2022-23 2023-24
ACTUAL 64.8 70.1 74.6 79.8 80.3 . . . . .
APPROVED GOALS . 67 73.6 78 82 84 86 87 . .
PROPOSED GOALS . . . . . 82 83 84 85 86

2020 ACCOUNTABILITY PLAN UNIVERSITY OF WEST FLORIDA
April 23, 2020 BOT Approved
9
PERFORMANCE-BASED FUNDING METRICS (cont.)
6. Percentage of Bachelor’s Degrees Awarded within Programs of Strategic Emphasis 2014-15 2015-16 2016-17 2017-18 2018-19 2019-20 2020-21 2021-22 2022-23 2023-24
ACTUAL 51.1 49.5 52.0 54.3 58.8 . . . . .
APPROVED GOALS . 51 51.6 53.5 57 58 58 59 . .
PROPOSED GOALS . . . . . 58 58 59 60 60
7. University Access Rate [Percent of Undergraduates with a Pell grant] FALL
2014 FALL 2015
FALL 2016
FALL 2017
FALL 2018
FALL 2019
FALL 2020
FALL 2021
FALL 2022
FALL 2023
ACTUAL 41.6 40.4 39.2 39.6 38.6 . . . . . APPROVED GOALS . 41 41 38 39 40 42 42 . .
PROPOSED GOALS . . . . . 35 36 36 36 36
8. Percentage of Graduate Degrees Awarded within Programs of Strategic Emphasis 2014-15 2015-16 2016-17 2017-18 2018-19 2019-20 2020-21 2021-22 2022-23 2023-24
ACTUAL 38.8 44.0 51.1 53.1 57.4 . . . . . APPROVED GOALS . 43.8 45.5 52.5 55 55 56 56 . . PROPOSED GOALS . . . . . 58 58 59 60 60
9. BOG Choice: Percent of Baccalaureate Degrees Awarded Without Excess Hours 2014-15 2015-16 2016-17 2017-18 2018-19 2019-20 2020-21 2021-22 2022-23 2023-24
ACTUAL 75.8 80.5 80.2 81.1 82.9 . . . . . APPROVED GOALS . 80 80 80.2 81 81 82 82 . . PROPOSED GOALS . . . . . 82 82 82 83 83
10. BOT Choice: Percent of Baccalaureate Graduates Completing 2+ Types of High Impact Practices 2014-15 2015-16 2016-17 2017-18 2018-19 2019-20 2020-21 2021-22 2022-23 2023-24
ACTUAL . 22.1 31.2 34.8 38.2 . . . . .
APPROVED GOALS . . . 33 39 43 47 50 . .
PROPOSED GOALS . . . . . 43 47 50 54 59

2020 ACCOUNTABILITY PLAN UNIVERSITY OF WEST FLORIDA
April 23, 2020 BOT Approved
10
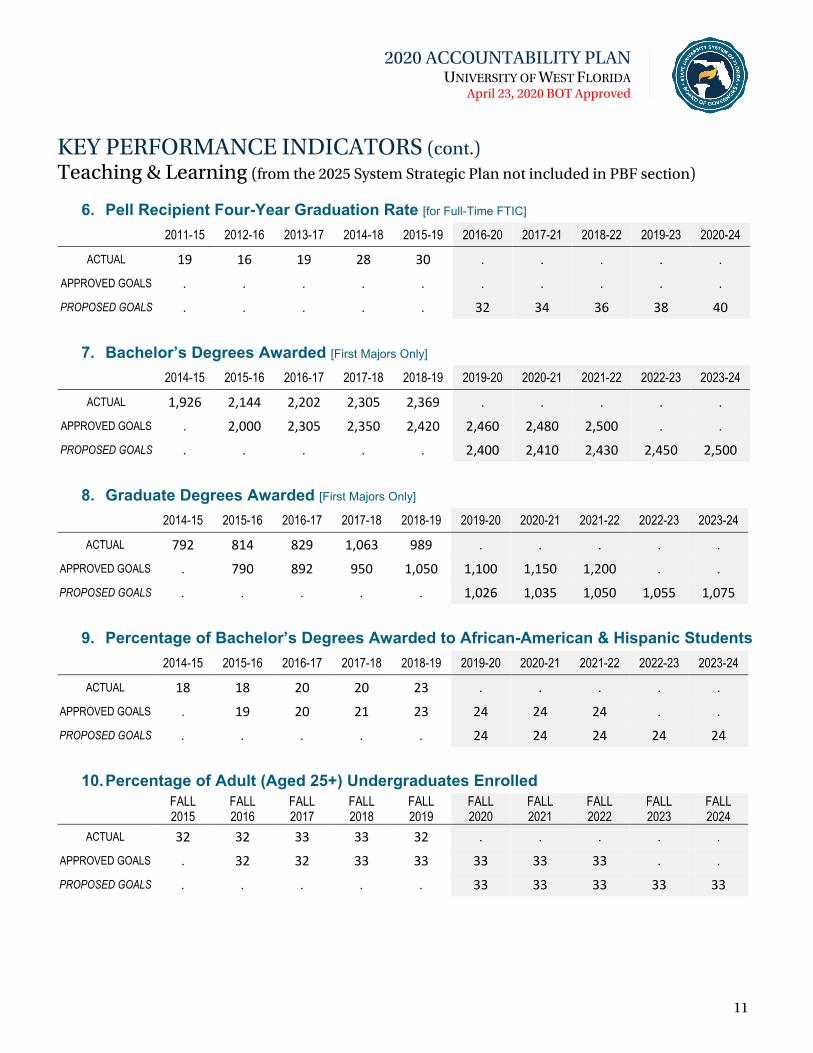
KEY PERFORMANCE INDICATORS Teaching & Learning (from the 2025 System Strategic Plan not included in PBF section)
1. Public University National Ranking [Number of Top50 Rankings based on BOG’s official list of publications] 2016 2017 2018 2019 2020 2021 2022 2023 2024 2025
ACTUAL 0 0 0 0 0 . . . . .
APPROVED GOALS . . . . 1 1 2 2 . .
PROPOSED GOALS . . . . . 0 0 0 0 0
2. Freshmen in Top 10% of High School Class FALL
2015 FALL 2016
FALL 2017
FALL 2018
FALL 2019
FALL 2020
FALL 2021
FALL 2022
FALL 2023
FALL 2024
ACTUAL 14 12 15 15 12 . . . . . APPROVED GOALS . 14 13 15 15 16 16 16 . . PROPOSED GOALS . . . . . 16 16 16 16 16
3. Time to Degree for FTICs in 120hr programs 2014-15 2015-16 2016-17 2017-18 2018-19 2019-20 2020-21 2021-22 2022-23 2023-24
ACTUAL 4.5 4.6 4.5 4.5 4.4 . . . . .
APPROVED GOALS . 4.6 4.6 4.5 4.4 4.3 4.1 4.0 . .
PROPOSED GOALS . . . . . 4.3 4.1 4.0 4.0 4.0
4. Six-Year FTIC Graduation Rates [Full-& Part-time students] 2009-15 2010-16 2011-17 2012-18 2013-19 2014-20 2015-21 2016-22 2017-23 2018-24
ACTUAL 47 48 42 43 46 . . . . .
APPROVED GOALS . 51 43.4 44 47 49 51 51 . .
PROPOSED GOALS . . . . . 49 51 51 52 52
5. FCS AA Transfer Three-Year Graduation Rate (Florida College System w/ Associate in Arts) 2012-15 2013-16 2014-17 2015-18 2016-19 2017-20 2018-21 2019-22 2020-23 2021-24
ACTUAL 49 52 52 52 49 . . . . . APPROVED GOALS . . . . . . . . . . PROPOSED GOALS . . . . . 51 52 53 53 53
2020 ACCOUNTABILITY PLAN UNIVERSITY OF WEST FLORIDA
April 23, 2020 BOT Approved
11
KEY PERFORMANCE INDICATORS (cont.) Teaching & Learning (from the 2025 System Strategic Plan not included in PBF section)
6. Pell Recipient Four-Year Graduation Rate [for Full-Time FTIC] 2011-15 2012-16 2013-17 2014-18 2015-19 2016-20 2017-21 2018-22 2019-23 2020-24
ACTUAL 19 16 19 28 30 . . . . . APPROVED GOALS . . . . . . . . . . PROPOSED GOALS . . . . . 32 34 36 38 40
7. Bachelor’s Degrees Awarded [First Majors Only]
2014-15 2015-16 2016-17 2017-18 2018-19 2019-20 2020-21 2021-22 2022-23 2023-24
ACTUAL 1,926 2,144 2,202 2,305 2,369 . . . . . APPROVED GOALS . 2,000 2,305 2,350 2,420 2,460 2,480 2,500 . . PROPOSED GOALS . . . . . 2,400 2,410 2,430 2,450 2,500
8. Graduate Degrees Awarded [First Majors Only] 2014-15 2015-16 2016-17 2017-18 2018-19 2019-20 2020-21 2021-22 2022-23 2023-24
ACTUAL 792 814 829 1,063 989 . . . . . APPROVED GOALS . 790 892 950 1,050 1,100 1,150 1,200 . . PROPOSED GOALS . . . . . 1,026 1,035 1,050 1,055 1,075
9. Percentage of Bachelor’s Degrees Awarded to African-American & Hispanic Students 2014-15 2015-16 2016-17 2017-18 2018-19 2019-20 2020-21 2021-22 2022-23 2023-24
ACTUAL 18 18 20 20 23 . . . . . APPROVED GOALS . 19 20 21 23 24 24 24 . . PROPOSED GOALS . . . . . 24 24 24 24 24
10. Percentage of Adult (Aged 25+) Undergraduates Enrolled FALL
2015 FALL 2016
FALL 2017
FALL 2018
FALL 2019
FALL 2020
FALL 2021
FALL 2022
FALL 2023
FALL 2024
ACTUAL 32 32 33 33 32 . . . . . APPROVED GOALS . 32 32 33 33 33 33 33 . . PROPOSED GOALS . . . . . 33 33 33 33 33

2020 ACCOUNTABILITY PLAN UNIVERSITY OF WEST FLORIDA
April 23, 2020 BOT Approved
12
KEY PERFORMANCE INDICATORS (cont.) Teaching & Learning (from the 2025 System Strategic Plan not included in PBF section)
11. Percent of Undergraduate FTE in Online Courses 2014-15 2015-16 2016-17 2017-18 2018-19 2019-20 2020-21 2021-22 2022-23 2023-24
ACTUAL 29 30 33 35 36 . . . . .
APPROVED GOALS . 30 33 34 35 36 36 36 . .
PROPOSED GOALS . . . . . 37 38 38 38 38
12. Percent of Bachelor’s Degrees in STEM & Health 2014-15 2015-16 2016-17 2017-18 2018-19 2019-20 2020-21 2021-22 2022-23 2023-24
ACTUAL 38 40 41 45 52 . . . . .
APPROVED GOALS . 39 40 41 50 50 51 52 . .
PROPOSED GOALS . . . . . 52 53 54 54 55
13. Percent of Graduate Degrees in STEM & Health 2014-15 2015-16 2016-17 2017-18 2018-19 2019-20 2020-21 2021-22 2022-23 2023-24
ACTUAL 21 19 22 24 26 . . . . .
APPROVED GOALS . 21 23 24 25 26 26 26 . .
PROPOSED GOALS . . . . . 26 26 27 27 27
14. Professional Licensure & Certification Exam First-time Pass Rates CALENDAR YEAR 2015 2016 2017 2018 2019 2020 2021 2022 2023 2024
NURSING 94 86 99 98 91 99 100 100 100 100
US Average 87 88 90 92 91 . . . . .
Exam Scores Relative to Benchmarks
2015 2016 2017 2018 2019 2020 2021 2022 2023 2024
ABOVE OR TIED 1 0 1 1 1 . . . . .
TOTAL 1 1 1 1 1 1 1 1 1 1

2020 ACCOUNTABILITY PLAN UNIVERSITY OF WEST FLORIDA
April 23, 2020 BOT Approved
13
KEY PERFORMANCE INDICATORS (cont.) Scholarship, Research & Innovation Metrics
15. National Academy Memberships 2016 2017 2018 2019 2020 2021 2022 2023 2024 2025
ACTUAL 0 0 0 0 0 . . . . .
APPROVED GOALS . 0 0 0 0 0 0 0 . .
PROPOSED GOALS . . . . . 0 0 0 0 0
16. Faculty Awards FALL
2013 FALL 2014
FALL 2015
FALL 2016
FALL 2017
FALL 2018
FALL 2019
FALL 2020
FALL 2021
FALL 2022
ACTUAL 0 0 0 0 0 . . . . .
APPROVED GOALS . 0 0 0 0 0 0 0 . .
PROPOSED GOALS . . . . . 0 0 0 0 0
17. Total Research Expenditures ($M) 2014-15 2015-16 2016-17 2017-18 2018-19 2019-20 2020-21 2021-22 2022-23 2023-24
ACTUAL 31 41 35 41 42 . . . . .
APPROVED GOALS . . 39 37 42 44 46 48 . .
PROPOSED GOALS . . . . . 44 46 48 50 52
18. Research Expenditures from External Sources ($M) 2014-15 2015-16 2016-17 2017-18 2018-19 2019-20 2020-21 2021-22 2022-23 2023-24
ACTUAL 14 12 12 10 13 . . . . .
APPROVED GOALS . . . . . . . . . .
PROPOSED GOALS . . . . . 15 15 16 17 18

2020 ACCOUNTABILITY PLAN UNIVERSITY OF WEST FLORIDA
April 23, 2020 BOT Approved
14
KEY PERFORMANCE INDICATORS (cont.) Scholarship, Research & Innovation Metrics
19. Utility Patents Awarded 2015 2016 2017 2018 2019 2020 2021 2022 2023 2024
ACTUAL 1 1 0 0 0 . . . . .
APPROVED GOALS . . 1 0 0 0 0 0 . .
PROPOSED GOALS . . . . . 0 0 0 0 0
20. Number of Licenses/Options Executed Annually 2013-14 2014-15 2015-16 2016-17 2017-18 2018-19 2019-20 2020-21 2021-22 2022-23
ACTUAL 2 0 0 0 0 . . . . .
APPROVED GOALS . 0 0 0 0 0 0 0 . .
PROPOSED GOALS . . . . . 0 0 0 0 0
21. Number of Start-up Companies Created 2013-14 2014-15 2015-16 2016-17 2017-18 2018-19 2019-20 2020-21 2021-22 2022-23
ACTUAL 0 0 0 0 0 . . . . .
APPROVED GOALS . 0 0 0 0 0 0 0 . .
PROPOSED GOALS . . . . . 0 0 0 0 0

2020 ACCOUNTABILITY PLAN UNIVERSITY OF WEST FLORIDA
April 23, 2020 BOT Approved
15
KEY PERFORMANCE INDICATORS (cont.) Institution Specific Goals To further distinguish the university’s distinctive mission, the university may choose to provide additional metric goals that are based on the university’s own strategic plan.
Percentage Fall Undergraduate Enrolled with Military Affiliation FALL
2015 FALL 2016
FALL 2017
FALL 2018
FALL 2019
FALL 2020
FALL 2021
FALL 2022
FALL 2023
FALL 2024
ACTUAL 9 24 15 17 18 . . . . . APPROVED GOALS . . . . . . . . . . PROPOSED GOALS . . . . . 19 19 20 20 20

2020 ACCOUNTABILITY PLAN UNIVERSITY OF WEST FLORIDA
April 23, 2020 BOT Approved
16
ENROLLMENT PLANNING
Fall Headcount Enrollment by Student Level [all degree-seeking students, all campuses] UNDERGRADUATE 2015 2016 2017 2018 2019 2020 2021 2022 2023 2024
ACTUAL 9,787 9,644 9,549 9,355 9,192 . . . . .
APPROVED GOALS . . 9,638 9,524 9,473 9,741 10,093 10,509 . .
PROPOSED GOALS . . . . . 9,233 9,293 9,365 9,446 9,532
GRADUATE 2015 2016 2017 2018 2019 2020 2021 2022 2023 2024 ACTUAL 2,277 2,608 2,781 2,824 2,826 . . . . .
APPROVED GOALS . . 2,787 2,840 3,065 3,259 3,386 3,579 . .
PROPOSED GOALS . . . . . 2,888 2,944 2,997 3,052 3,105
Fall Headcount Enrollment by Student Type [all degree-seeking students, all campuses] UNDERGRADUATE 2015 2016 2017 2018 2019 2020 2021 2022 2023 2024
FTIC: New 1,356 1,302 1,094 1,109 1,197 1,245 1,245 1,245 1,245 1,245
FTIC: Returning 3,511 3,390 3,354 3,164 3,053 3,002 3,000 3,000 3,001 3,004
Transfer: FCS w/ AA 1,951 1,879 1,807 1,812 1,804 1,758 1,746 1,753 1,770 1,793
Transfer: Other 2,590 2,662 2,935 2,885 2,795 2,889 2,961 3,024 3,083 3,139
Post-Baccalaureates 379 411 359 385 343 339 341 343 347 351
Subtotal 9,787 9,644 9,549 9,355 9,192 9,233 9,293 9,365 9,446 9,532
GRADUATE 2015 2016 2017 2018 2019 2020 2021 2022 2023 2024 Master’s 2,026 2,290 2,437 2,498 2,514 2,580 2,639 2,694 2,749 2,802
Research Doctoral 251 318 344 326 312 308 305 303 303 303
Professional Doctoral 0 0 0 0 0 0 0 0 0 0
Subtotal 2,277 2,608 2,781 2,824 2,826 2,888 2,944 2,997 3,052 3,105
TOTAL 12,064 12,252 12,330 12,179 12,018 12,121 12,237 12,362 12,498 12,637 Note: This table reports the number of students enrolled by student type categories. These headcounts only include those seeking a degree – unclassified students (e.g. dual enrolled) are not included. The student type for undergraduates is based on the ‘Type of Student at Most Recent Admission’. The First Time in College (FTIC) student was admitted in the same fall term or in the preceding summer term – this includes those who were re-admitted as FTICs.

2020 ACCOUNTABILITY PLAN UNIVERSITY OF WEST FLORIDA
April 23, 2020 BOT Approved
17
ENROLLMENT PLANNING (cont.)
Percent of Baccalaureate-Seeking Resident Undergraduates Earning 15+ Credits [Fall term] 2015 2016 2017 2018 2019 2020 2021 2022 2023 2024
ACTUAL 12 13 15 16 17 . . . . .
APPROVED GOALS . . . . 17 17 18 19 . .
PROPOSED GOALS . . . . . 17 18 19 19 20
Full-Time Equivalent (FTE) Enrollment by Course Level 2014-15 2015-16 2016-17 2017-18 2018-19 2019-20 2020-21 2021-22 2022-23 2023-24
LOWER 3,436 3,384 3,235 3,122 2,968 2,876 2,882 2,881 2,864 2,848
UPPER 5,080 5,144 5,262 5,385 5,477 5,393 5,405 5,470 5,560 5,653
GRAD 1 1,539 1,501 1,672 1,737 1,699 1,752 1,870 1,904 1,944 1,983
GRAD 2 95 147 196 202 177 162 163 166 163 161
TOTAL 10,150 10,176 10,365 10,446 10,320 10,183 10,320 10,421 10,531 10,645
Note: Full-time Equivalent (FTE) student is a measure of all instructional activity (regardless of fundability) that is based on the number of credit hours for all students during an academic (summer, fall, spring) year. FTE is based on the standard national definition, which divides undergraduate credit hours by 30 and graduate credit hours by 24. Pursuant to section 1013.31, Florida Statutes, Board facilities staff use this data as a key factor in the calculation of facility space needs for university educational plant surveys.
Percent FTE Enrollment by Method of Instruction 2014-15 2015-16 2016-17 2017-18 2018-19 2019-20 2020-21 2021-22 2022-23 2023-24
UNDERGRADUATE All Distance (100%) . 29 32 35 35 37 38 38 38 38
Primarily Dist. (80-99%) . 1 1 1 1 1 1 1 1 1
Hybrid (50-79%) . 3 3 3 4 4 2 1 1 1
Classroom (0-49%) . 67 64 62 60 58 59 60 60 61
GRADUATE All Distance (100%) . 75 81 81 82 83 85 85 86 86
Primarily Dist. (80-99%) . 0 0 0 0 <1 <1 <1 <1 <1
Hybrid (50-79%) . 2 2 1 1 1 1 1 1 <1
Classroom (0-49%) . 23 18 18 17 15 14 14 14 14

2020 ACCOUNTABILITY PLAN UNIVERSITY OF WEST FLORIDA
April 23, 2020 BOT Approved
18
ACADEMIC PROGRAM COORDINATION
New Programs for Consideration by Institution in AY 2020-21 The SUS Council of Academic Vice Presidents Academic Program Coordination Work Group will review these programs as part of their on-going coordination efforts. The programs listed below are based on the 2019 Accountability Plan list for programs under consideration for 2020-21.
PROGRAM TITLES CIP CODE AREA OF
STRATEGIC EMPHASIS
OTHER INST W/ SAME
PROGRAM
OFFERED VIA DISTANCE
LEARNING IN SYSTEM
PROJECTED ENROLLMENT IN
5TH YEAR
PROPOSED DATE OF
SUBMISSION TO UBOT
UNDERGRADUATE
Public Health 51.2201 Health FGCU,
FSU, UF, USF
Yes 144 Fall 2020
MASTER’S, SPECIALIST AND OTHER ADVANCED MASTER’S PROGRAMS
International Affairs 45.0901 Global FIU, FSU, UF, UNF Yes 20 Spring
2020 DOCTORAL PROGRAMS Not Applicable
New Programs for Consideration by Institution in AY 2021-22 These programs will be used in the 2021 Accountability Plan list for programs under consideration for 2021-22.
PROGRAM TITLES CIP CODE AREA OF
STRATEGIC EMPHASIS
OTHER INST W/ SAME
PROGRAM
OFFERED VIA DISTANCE
LEARNING IN SYSTEM
PROJECTED ENROLLMENT IN
5TH YEAR
PROPOSED DATE OF
SUBMISSION TO UBOT
UNDERGRADUATE Human Resource Mgt 52.1001 GAP FIU No 100 TBD Information Security Mgt 52.1299 None No 100 TBD
Civil Engineering 14.0801 STEM
FAMU, FAU, FGCU, FIU, FSU, UCF, UF, UNF,
USF
No 40 TBD
Materials Science 40.1001 STEM None No 50 TBD Aviation Science 49.0101 None No 50 TBD Aviation – ATP 49.0102 None No 50 TBD MASTER’S, SPECIALIST AND OTHER ADVANCED MASTER’S PROGRAMS Human Resource Mgt 52.1001 GAP FIU No 40 TBD Aviation Science 49.0101 None No 40 TBD DOCTORAL PROGRAMS
Nursing Practice 51.3818 Health FAU, FGCU,
FIU, FSU, UCF, UF, UNF, USF
No 30 TBD

2020 ACCOUNTABILITY PLAN UNIVERSITY OF WEST FLORIDA
April 23, 2020 BOT Approved
19
DEFINITIONS Performance Based Funding (PBF) PBF-1. Percent of Bachelor's Graduates Enrolled or Employed ($25,000+) One Year After Graduation: This metric is based on the percentage of a graduating class of bachelor’s degree recipients who are enrolled or employed (earning at least $25,000) somewhere in the United States. Students who do not have valid social security numbers and are not found enrolled are excluded. This data now includes: non-Florida data from 44 states and districts, including the District of Columbia and Puerto Rico; and military enlistment as reported by the institutions. Sources: State University Database System (SUDS), Florida Department of Economic Opportunity (DEO) analysis of Wage Record Interchange System (WRIS2), and National Student Clearinghouse (NSC). PBF-2. Median Wages of Bachelor’s Graduates Employed Full-time One Year After Graduation This metric is based on annualized Unemployment Insurance (UI) wage data from the fourth fiscal quarter after graduation for bachelor’s recipients. This data does not include individuals who are self-employed, employed by the military, those without a valid social security number, or making less than minimum wage. This data now includes non-Florida data from 44 states and districts, including the District of Columbia and Puerto Rico. State University Database System (SUDS), Florida Department of Economic Opportunity (DEO) analysis of Wage Record Interchange System (WRIS2). PBF-3. Cost to the Student Net Tuition & Fees for Resident Undergraduates per 120 Credit Hours This metric compares the average sticker price and the average gift aid amount. The sticker price includes: (1) tuition and fees for resident undergraduates; (2) books and supplies (we use a proxy as calculated by the College Board); and (3) the average number of credit hours attempted by students who were admitted as an FTIC student who graduated with a bachelor’s degree from a program that requires only 120 credit hours. The gift aid amount includes: (1) financial aid (grants, scholarships, waivers and third-party payments) provided to resident undergraduate students during the most recent academic year; (2) the total number of credit hours for those resident undergraduates. The average gift aid award per credit hour was multiplied by 120 and compared to the sticker price. Source: State University Database System (SUDS), the Legislature’s annual General Appropriations Act, and university required fees. PBF-4. Four Year FTIC Graduation Rate This metric is based on the percentage of first-time-in-college (FTIC) students who started in the Fall (or summer continuing to Fall) term and were enrolled full-time in their first semester and had graduated from the same institution by the summer term of their fourth year. FTIC includes ‘early admit’ students who were admitted as a degree-seeking student prior to high school graduation. Students who were enrolled in advanced graduate programs during their 4th year were excluded. Source: State University Database System (SUDS). PBF-5. Academic Progress Rate [2nd Year Retention with 2.0 GPA or Above] This metric is based on the percentage of first-time-in-college (FTIC) students who started in the fall (or summer continuing to fall) term and were enrolled full-time in their first semester and were still enrolled in the same institution during the next fall term with a grade point average (GPA) of at least 2.0 at the end of their first year (fall, spring, summer). Source: State University Database System (SUDS).

2020 ACCOUNTABILITY PLAN UNIVERSITY OF WEST FLORIDA
April 23, 2020 BOT Approved
20
DEFINITIONS (cont.) PBF-6. Bachelor's Degrees within Programs of Strategic Emphasis This metric is based on the number of baccalaureate degrees awarded within the programs designated by the Board of Governors as ‘Programs of Strategic Emphasis’. A student who has multiple majors in the subset of targeted Classification of Instruction Program codes will be counted twice (i.e., double-majors are included). Source: State University Database System (SUDS). PBF-7. University Access Rate Percent of Undergraduates with a Pell-grant This metric is based on the number of undergraduates, enrolled during the fall term, who received a Pell-grant during the fall term. Students who were not eligible for Pell-grants (e.g., Unclassified, non-resident aliens, post-baccs) were excluded from the denominator for this metric. Source: State University Database System (SUDS). PBF-8a. Graduate Degrees within Programs of Strategic Emphasis This metric is based on the number of graduate degrees awarded within the programs designated by the Board of Governors as ‘Programs of Strategic Emphasis’. A student who has multiple majors in the subset of targeted Classification of Instruction Program codes will be counted twice (i.e., double-majors are included). Source: State University Database System (SUDS). PBF-8b. Freshmen in Top 10% of High School Class (Applies only to NCF) Percent of all degree-seeking, first-time, first-year (freshman) students who had high school class rank within the top 10% of their graduating high school class. Source: New College of Florida as reported to the Common Data Set. PBF-9. Percent of Bachelor's Degrees Without Excess Hours This metric is based on the percentage of baccalaureate degrees awarded within 110% of the credit hours required for a degree based on the Board of Governors Academic Program Inventory. This metric excludes the following types of student credits: accelerated mechanisms; remedial coursework; non-native credit hours that are not used toward the degree; non-native credit hours from failed, incomplete, withdrawn, or repeated courses; credit hours from internship programs; credit hours up to 10 foreign language credit hours; and credit hours earned in military science courses that are part of the Reserve Officers’ Training Corps (ROTC) program. Starting in 2018-19, the calculation for this metric included a new type of statutory exclusion of up to 12 credit hours for students who graduated in four years or less. Source: State University Database System (SUDS). Note: This metric does not report the number of students who paid the “Excess Hour Surcharge” (1009.286, FS). PBF-10.FAMU: Number of Bachelor’s Degrees Awarded to Transfers with AA Degrees from FCS: This is a count of first-major baccalaureate degrees awarded to students who entered as FCS AA Transfers. First Majors include the most common scenario of one student earning one degree in one Classification of Instructional Programs (CIP) code. A student who earns two baccalaureate degrees under two different degree CIPs is counted twice. Source: State University Database System (SUDS).

2020 ACCOUNTABILITY PLAN UNIVERSITY OF WEST FLORIDA
April 23, 2020 BOT Approved
21
DEFINITIONS (cont.) PBF-10.FAU: Total Research Expenditures ($M): Total expenditures (in millions of dollars) for all research activities (including non-science and engineering activities). Source: As reported by each institution to the National Science Foundation annual survey of Higher Education Research and Development (HERD) based on the NSF rules and definitions. PBF-10.FGCU: Number of Bachelor’s Degrees Awarded to Hispanic & African-Americans: Race/Ethnicity data is self-reported by students. Non-Hispanic Black and Hispanic do not include students classified as Non-Resident Alien or students with a missing race code. Degree data is based on first-major counts only – second majors are not included. PBF-10.FIU: Number of Post-Doctoral Appointees: The number of Postdoctoral Appointees awarded annually. This data is based on National Science Foundation/National Institutes of Health Survey of Graduate Students and Postdoctorates in Science and Engineering (GSS). PBF-10.FPOLY: Percent of Bachelor’s Graduates with 2+ Workforce Experiences: The percentage of Bachelor’s recipients who completed at least two workforce experiences. Workforce experiences includes: External Internships, Industry-sponsored Capstone Projects, and Undergraduate Research (students on a funded research grant), and certifications. It is a requirement for all majors to conduct an external internship prior to graduation. PBF-10.FSU: Percent of Bachelor’s Graduates who took an Entrepreneurship Class: The percentage of Bachelor’s recipients who enrolled in one or more graded Entrepreneurship courses before graduating. PBF-10.NCF: Percent of FTIC Graduates Completing 3+ HIP’s: The percentage of graduating seniors who started as FTIC students and who completed three or more high-impact practices as defined by the National Survey of Student Engagement (NSSE) and the Association of American Colleges & Universities. High-impact practices include: (1) capstone project or thesis, (2) internships, (3) study abroad, (4) writing-intensive courses, (5) living-learning communities, (6) undergraduate research, (7) first-year experience, (8) learning communities, (9) service learning, (10) collaborative projects. Multiple activities within the same category only count once (e.g., a student completing three internships has completed one high-impact-practice). PBF#10.UCF: Percent of Bachelor’s Degrees Awarded to African American and Hispanic Students: Percentage of Degrees is based on the number of baccalaureate degrees awarded to non-Hispanic Black and Hispanic students divided by the total degrees awarded - excluding those awarded to non-resident aliens and unreported. Source: State University Database System (SUDS). PBF-10.UF: 6-Year Graduation Rates (FT only): The First-time-in-college (FTIC) cohort is defined as undergraduates entering in fall term (or summer continuing to fall) with fewer than 12 hours earned since high school graduation. The rate is the percentage of the initial cohort that has either graduated from the same institution by the summer term of their sixth academic year. Only full-time students are included in this calculation. FTIC includes ‘early admits’ students who were admitted as a degree-seeking student prior to high school graduation. Source: State University Database System (SUDS).

2020 ACCOUNTABILITY PLAN UNIVERSITY OF WEST FLORIDA
April 23, 2020 BOT Approved
22
DEFINITIONS (cont.) PBF-10.UNF: Percent of Undergraduate FTE in Online Courses: Full-time Equivalent (FTE) student is a measure of instructional activity that is based on the number of credit hours that students enroll. FTE is based on the US definition, which divides undergraduate credit hours by 30. Distance Learning is a course in which at least 80 percent of the direct instruction of the course is delivered using some form of technology when the student and instructor are separated by time or space, or both (per 1009.24(17), F.S.). Source: State University Database System (SUDS). PBF-10.USF: 6-Year Graduation Rates (FT/PT): The First-time-in-college (FTIC) cohort is defined as undergraduates entering in fall term (or summer continuing to fall) with fewer than 12 hours earned since high school graduation. The rate is the percentage of the initial cohort that has either graduated from the same institution by the summer term of their sixth academic year. Both full-time and part-time students are used in the calculation. FTIC includes ‘early admits’ students who were admitted as a degree-seeking student prior to high school graduation. Source: State University Database System (SUDS). PBF-10.UWF: Percent of Baccalaureate Graduates Completing 2+ Types of High-Impact Practices: The percentage of graduating seniors completing two or more high-impact practices as defined by the Association of American Colleges & Universities. High-impact practices include: (1) First Year Seminar & Experiences, (2) Common Intellectual Experience, (3) Writing-Intensive Courses, (4) Collab Assignments & Projects, (5) Diversity/Global Learning, (6) ePortfolios, (7) Service Learning, Community-Based Learning, (8) Internships, (9) Capstone Courses & Projects. Multiple activities within the same category only count once (e.g., a student completing three internships has completed one high-impact-practice).
Preeminence Research University (PRE) PRE-A: Average GPA & Average SAT: An average weighted grade point average of 4.0 or higher and an average SAT score of 1200 or higher for fall semester incoming freshmen, as reported annually in the admissions data that universities submit to the Board of Governors. This data includes registered FTIC (student type='B','E') with an admission action of admitted or provisionally admitted ('A','P','X'). Source: State University Database System (SUDS). PRE-B: National University Rankings: A top-50 ranking on at least two well-known and highly respected national public university rankings, reflecting national preeminence, using most recent rankings, includes: Princeton Review, Fiske Guide, QS World University Ranking, Times Higher Education World University Ranking, Academic Ranking of World University, US News and World Report National University, US News and World Report National Public University, US News and World Report Liberal Arts Colleges, Forbes, Kiplinger, Washington Monthly Liberal Arts Colleges, Washington Monthly National University, and Center for Measuring University Performance. PRE-C: Freshmen Retention Rate: Freshman Retention Rate (Full-time, FTIC) cohorts are based on first-year undergraduate students who enter the institution in the Fall term (or Summer term and continue into the Fall term). Percent retained is based on those who are enrolled during the second fall term. Source: State University Database System (SUDS) and data submitted by the institutions to Integrated Postsecondary Education Data System (IPEDS).
2020 ACCOUNTABILITY PLAN UNIVERSITY OF WEST FLORIDA
April 23, 2020 BOT Approved
23
DEFINITIONS (cont.) PRE-D: 4-year Graduation Rate: This metric is based on the percentage of first-time-in-college (FTIC) students who started in the Fall (or summer continuing to Fall) term and were enrolled full-time in their first semester and had graduated from the same institution by the summer term of their fourth year. FTIC includes ‘early admit’ students who were admitted as a degree-seeking student prior to high school graduation. Students who were enrolled in advanced graduate programs during their 4th year were excluded. Source: State University Database System (SUDS) and data submitted by the institutions to Integrated Postsecondary Education Data System (IPEDS). PRE-E: National Academy Memberships: National Academy Memberships held by faculty as reported by the Center for Measuring University Performance in the Top American Research Universities (TARU) annual report or the official membership directories maintained by each national academy. PRE-F: Total Science & Engineering Research Expenditures: Research Expenditures within Science & Engineering disciplines. Source: As reported by each institution to the National Science Foundation annual survey of Higher Education Research and Development (HERD) based on the NSF rules and definitions. PRE-G: Science & Engineering Research Expenditures in Non-Health Sciences: Research expenditures within Science & Engineering in non-medical sciences. Source: As reported by each institution to the National Science Foundation annual survey of Higher Education Research and Development (HERD) based on the NSF rules and definitions. PRE-H: National Ranking in Research Expenditures: The NSF identifies eight broad disciplines within Science & Engineering (Computer Science, Engineering, Environmental Science, Life Science, Mathematical Sciences, Physical Sciences, Psychology, Social Sciences). The rankings by discipline are determined by BOG staff using the NSF online database. PRE-I: Patents Awarded: Total utility patents awarded by the United States Patent and Trademark Office (USPTO) for the most recent three calendar year period. Based on legislative staff guidance, Board staff query the USPTO database with a query that only counts utility patents: "(AN/"University Name" AND ISD/yyyymmdd->yyyymmdd AND APT/1)". PRE-J: Doctoral Degrees Awarded Annually: Includes Doctoral research degrees and professional doctoral degrees awarded in medical and health care disciplines. Source: State University Database System (SUDS). PRE-K: Number of Post-Doctoral Appointees: The number of Postdoctoral Appointees awarded annually. This data is based on National Science Foundation/National Institutes of Health Survey of Graduate Students and Postdoctorates in Science and Engineering (GSS). PRE-L: Endowment Size ($M): This data comes from the National Association of College and University Business Officers (NACUBO) and Commonfund Institute's annual report of Market Value of Endowment Assets.
Key Performance Indicators (KPI) KPI-1: Public University National Ranking: A top-50 ranking on at least two well-known and highly respected national public university rankings, reflecting national preeminence, using most recent rankings, includes: Princeton Review, Fiske Guide, QS World University Ranking, Times Higher Education World University Ranking, Academic Ranking of World University, US News and World Report National University, US News and World Report National Public University, US News and World Report Liberal Arts Colleges, Forbes, Kiplinger, Washington Monthly Liberal Arts Colleges, Washington Monthly National University, and Center for Measuring University Performance.

2020 ACCOUNTABILITY PLAN UNIVERSITY OF WEST FLORIDA
April 23, 2020 BOT Approved
24
DEFINITIONS (cont.) KPI-2: Freshmen in Top 10% of High School Class: Percent of all degree-seeking, first-time, first-year (freshman) students who had high school class rank within the top 10% of their graduating high school class. Source: As reported by the university to the Common Data Set. KPI-3: Time to Degree for FTICs in 120hr programs: This metric is the number of years between the start date (using the student entry date) and the end date (using the last month in the term degree was granted) for a graduating class of first-time, single-major baccalaureates in 120 credit hour programs within a (Summer, Fall, Spring) year. Source: State University Database System (SUDS). KPI-4: Six-Year FTIC Graduation Rates [full-& part-time students]: The First-time-in-college (FTIC) cohort is defined as undergraduates entering in fall term (or summer continuing to fall) with fewer than 12 hours earned since high school graduation. The rate is the percentage of the initial cohort that has either graduated from the same institution by the summer term of their sixth academic year. Both full-time and part-time students are used in the calculation. FTIC includes ‘early admits’ students who were admitted as a degree-seeking student prior to high school graduation. Source: State University Database System (SUDS). KPI-5: FCS AA Transfer Three-Year Graduation Rate [full-& part-time students]: This transfer cohort is defined as undergraduates entering in fall term (or summer continuing to fall) from the Florida College System with an Associate in Arts (AA) degree. The rate is the percentage of the initial cohort that has either graduated from the same institution by the summer term of their third academic year. Both full-time and part-time students are used in the calculation. Students who were flagged as enrolled in advanced graduate programs that would not earn a bachelor’s degree were not excluded. Source: State University Database System (SUDS). KPI-6: Pell Recipient Four-Year Graduation Rate [for Full-Time FTIC]: This metric is based on the percentage of first-time-in-college (FTIC) students who started in the Fall (or summer continuing to Fall) term and were enrolled full-time in their first semester and who received a Pell-grant during their first year and who graduated from the same institution by the summer term of their fourth year. FTIC includes ‘early admit’ students who were admitted as a degree-seeking student prior to high school graduation. Students who were flagged as enrolled in advanced graduate programs that would not earn a bachelor’s degree were excluded. Source: State University Database System (SUDS). KPI-7: Bachelor’s Degrees Awarded & KPI-8: Graduate Degrees Awarded: This is a count of first-major baccalaureate and graduate degrees awarded. First Majors include the most common scenario of one student earning one degree in one Classification of Instructional Programs (CIP) code. In cases where a student earns a baccalaureate degree under two different degree CIPs, a distinction is made between “dual degrees” and “dual majors.” Also included in first majors are “dual degrees” which are counted as separate degrees (e.g., counted twice). In these cases, both degree CIPs receive a “degree fraction” of 1.0. The calculation of degree fractions is made according to each institution’s criteria. Source: State University Database System (SUDS). KPI-9: Bachelor’s Degrees Awarded to African-American & Hispanic Students: Race/Ethnicity data is self-reported by students. Non-Hispanic Black and Hispanic do not include students classified as Non-Resident Alien or students with a missing race code. Degree data is based on first-major counts only – second majors are not included. Percentage of Degrees is based on the number of baccalaureate degrees awarded to non-Hispanic Black and Hispanic students divided by the total degrees awarded - excluding those awarded to non-resident aliens and unreported. Source: State University Database System (SUDS).

2020 ACCOUNTABILITY PLAN UNIVERSITY OF WEST FLORIDA
April 23, 2020 BOT Approved
25
DEFINITIONS (cont.) KPI-10: Percentage of Adult (Aged 25+) Undergraduates Enrolled: This metric is based on the age of the student at the time of their Fall term enrollment - not their age upon entry. As a proxy, age is based on birth year not birth date. Note: Unclassified students with a HS diploma (or GED) and above are included in this calculation. Source: State University Database System (SUDS). KPI-11: Percent of Undergraduate FTE in Online Courses: Full-time Equivalent (FTE) student is a measure of instructional activity that is based on the number of credit hours that students enroll. FTE is based on the US definition, which divides undergraduate credit hours by 30. Distance Learning is a course in which at least 80 percent of the direct instruction of the course is delivered using some form of technology when the student and instructor are separated by time or space, or both (per 1009.24(17), F.S.). Source: State University Database System (SUDS). KPI-12: Percent of Bachelor’s Degrees in STEM & Health & KPI-13: Percent of Graduate Degrees in STEM & Health: The percentage of baccalaureate degrees that are classified as STEM or Health disciplines by the Board of Governors in the Academic Program Inventory. These counts include second majors. Second Majors include all dual/second majors (e.g., degree CIP receive a degree fraction that is less than 1). The calculation of degree fractions is made according to each institution’s criteria. The calculation for the number of second majors rounds each degree CIP’s fraction of a degree up to 1 and then sums the total. Second Majors are typically used when providing degree information by discipline/CIP, to better convey the number of graduates who have specific skill sets associated with each discipline. Source: State University Database System (SUDS). KPI-14: Licensure & Certification Exam Pass Rates: The average pass rates as a percentage of all first-time examinees for Nursing, Law, Medicine (3 subtests), Veterinary, Pharmacy, Dental (2 subtests), Physical Therapy, and Occupational Therapy, when applicable. The average pass rate for the nation or state is also provided as a contextual benchmark. The Board’s 2025 System Strategic Plan calls for all institutions to be above or tied with the exam’s respective benchmark. The State benchmark for the Florida Bar Exam excludes non-Florida institutions. The national benchmark for the USMLE exams are based on rates for MD degrees from US institutions. KPI-15: National Academy Memberships: National Academy Memberships held by faculty as reported by the Center for Measuring University Performance in the Top American Research Universities (TARU) annual report or the official membership directories maintained by each national academy. KPI-16: Faculty Awards: Awards include: American Council of Learned Societies (ACLS) Fellows, Beckman Young Investigators, Burroughs Welcome Fund Career Awards, Cottrell Scholars, Fulbright American Scholars, Getty Scholars in Residence, Guggenheim Fellows, Howard Hughes Medical Institute Investigators, Lasker Medical Research Awards, MacArthur Foundation Fellows, Andrew W. Mellon Foundation Distinguished Achievement Awards, National Endowment for the Humanities (NEH) Fellows, National Humanities Center Fellows, National Institutes of Health (NIH) MERIT, National Medal of Science and National Medal of Technology, NSF CAREER awards (excluding those who are also PECASE winners), Newberry Library Long-term Fellows, Pew Scholars in Biomedicine, Presidential Early Career Awards for Scientists and Engineers (PECASE), Robert Wood Johnson Policy Fellows, Searle Scholars, Sloan Research Fellows, Woodrow Wilson Fellows.

2020 ACCOUNTABILITY PLAN UNIVERSITY OF WEST FLORIDA
April 23, 2020 BOT Approved
26
DEFINITIONS (cont.) KPI-17: Total Research Expenditures: Total expenditures (in millions of dollars) for all research activities (including non-science and engineering activities). Source: As reported by each institution to the National Science Foundation annual survey of Higher Education Research and Development (HERD) based on the NSF rules and definitions. KPI-18: Research Expenditures Funded from External Sources: This metric reports the amount of research expenditures that was funded from federal, private industry and other (non-state and non-institutional) sources. Source: As reported by each institution to the National Science Foundation annual survey of Higher Education Research and Development (HERD) based on the NSF rules and definitions. KPI-19: Utility Patents Awarded [from the USPTO]: The number of utility patents awarded by the United States Patent and Trademark Office (USPTO) by Calendar year – does not include design, plant or other types. KPI-20: Number of Licenses/Options Executed Annually: Licenses/options executed in the fiscal year for all technologies – as reported by universities on the Association of University Technology Managers Annual (AUTM) annual Licensing Survey. KPI-21: Number of Start-up Companies Created: The number of start-up companies that were dependent upon the licensing of University technology for initiation – as reported by universities on the Association of University Technology Managers Annual (AUTM) annual Licensing Survey.
Enrollment Planning (ENRL) ENRL-1: Fall Headcount Enrollment by Student Level and Student Type: This table reports the number of students enrolled by student type categories. These headcounts only include those students who were seeking a degree – unclassified students (eg, dual enrolled) are not included. The student type for undergraduates is based on the ‘Type of Student at Most Recent Admission’. The First Time in College (FTIC) student was admitted in the same fall term or in the preceding summer term – this includes those who were re-admitted as FTICs. ENRL-2: Percent of Resident Baccalaureate-Seeking Resident Undergraduates Earning 15+ Credits: This table reports the percent of baccalaureate-seeking resident undergraduates who earned fifteen or more credit hours during the fall term as reported on the Term Credit Hours Earned element (#01089). This includes the pass/fail courses in which the student earned a passing grade and excludes audited courses. ENRL-3 Full-Time Equivalent Enrollment by Course Level: This table reports Full-time Equivalent (FTE) enrollment which is a measure of all instructional activity (regardless of fundability) that is based on the number of credit hours that students enroll. This FTE calculation is based on the standard national definition, which divides undergraduate credit hours by 30 and graduate credit hours by 24. Pursuant to section 1013.31, Florida Statutes, Board facilities staff use this data as a key factor in the calculation of facility space needs for institution educational plant surveys. ENRL-4: Percent FTE Enrollment by Method of Instruction: This table reports the percentages of FTE enrollment that is classified as Distance Learning for all students at all campuses regardless of funding source. Distance Learning is a course in which at least 80 percent of the direct instruction of the course is delivered using some form of technology when the student and instructor are separated by time or space, or both (per 1009.24(17), F.S.).