Embed Size (px)
Citation preview
Parkland Crop Diversification Foundation
2020 ANNUAL REPORT
Table of Contents
Introduction .................................................................................................................................................. 1
PCDF Board of Directors ............................................................................................................................... 1
Partners ......................................................................................................................................................... 2
Meteorological Data ..................................................................................................................................... 2
Extension Activities ....................................................................................................................................... 2
Online videos (https://mbdiversificationcentres.ca/videos/) ...................................................................... 3
PCDF Field Trials ............................................................................................................................................ 4
Canola Disease Surveys ................................................................................................................................. 7
Barley Trials ................................................................................................................................................... 8
SVPG 2-Row Barley Variety Trial ............................................................................................................... 9
Corn Trials ................................................................................................................................................... 11
Agriculture Agri-Food Canada Corn Variety Evaluation .......................................................................... 12
Agriculture Agri-Food Canada Corn Nursery .......................................................................................... 13
Cover Cropping Trials .................................................................................................................................. 14
The Effect of Grazing and Non-grazing of Annual Green Manures on Following Crops (Year 2) ........... 15
Cover Crop Species Evaluation................................................................................................................ 19
Flax Trials..................................................................................................................................................... 23
CDC Linseed Flax Coop Variety Evaluation.............................................................................................. 24
Flax Herbicide Evaluation ........................................................................................................................ 26
FHB Risk Model University of Manitoba – Barley, Durum, Spring Wheat, Winter Wheat ..................... 36
Hemp Trials ................................................................................................................................................. 38
National Hemp Variety Field Trials ............................................................ Error! Bookmark not defined.
EnterraFrass Canada Hemp ..................................................................................................................... 44
Montra Crop Science Hemp .................................................................................................................... 47
Intercropping Trials ..................................................................................................................................... 50
Intercropping: Barley-Cover Crop (Year 1).............................................................................................. 51
Intercropping: Canola-Cover Crop (Year 1) ............................................................................................. 54
Intercropping: Oat-Cover Crop (Year 1) .................................................................................................. 57
Intercropping: Spring Wheat-Clover (Year 1) ......................................................................................... 60
Intercropping: Wheat-Chicory (Pilot Year) ............................................................................................. 63
Intercropping: Wheat-Lupin ................................................................................................................... 66
Intercropping: Wheat-Phacelia ............................................................................................................... 70
Intercropping: Hemp-Cereal Silage ......................................................................................................... 74
Intercropping: Pea-Cereal Silage ............................................................................................................. 78
Multi-Crop Intercrop trial (Pea-Oat-Canola-Wheat-Flax-Mustard) ........................................................ 82
Faba-Flax, Faba-Buckwheat, Faba-Oat and Oat-Pea Intercropping dynamics ....................................... 89
Organic Trials .............................................................................................................................................. 98
Organic Oats Variety Evaluation ............................................................................................................. 99
Organic Oats Participatory Plant Breeding ........................................................................................... 101
Organic Wheat Participatory Plant Breeding ........................................................................................ 103
Pulse Trials ................................................................................................................................................ 105
Soybean – (Year 3 of a 6-Year Crop Rotation) .......................................................................................... 106
Yellow Pea Response to Preceding Crop, Residue Management, and P Fertilizer Placement
(Establishment Year) ............................................................................................................................. 109
Agriculture and Agri-Food Canada Conventional Soy Protein Variety Evaluation ................................ 112
Saskatchewan Pulse Growers Soy Variety Trial .................................................................................... 114
Wheat Trials .............................................................................................................................................. 116
Parkland Coop Wheat Variety Evaluation ............................................................................................. 117
SVPG Wheat Variety Evaluation 1 (CWRS) ............................................................................................ 119
and Evaluation 2 (HY) ............................................................................................................................ 119
Ducks Unlimited Canada: Winter wheat fertility program to maximize yield potential of new winter
wheat varieties ...................................................................................................................................... 122
Horticulture Trials ..................................................................................................................................... 128
Fruit Demonstration.............................................................................................................................. 129
Hopyard Variety Evaluation .................................................................................................................. 131
Parkland Crop Diversification Foundation Annual Report 2020 1
Introduction
The Parkland Crop Diversification Foundation (PCDF) is located in Roblin, in the Parkland region of
Manitoba and has a close liaison with Manitoba Agriculture and Resource Development (ARD). PCDF
works alongside three other Diversification Centres in the province: Manitoba Horticulture Productivity
Enhancement Centre (MHPEC) in Carberry, Prairies East Sustainability Agricultural Initiative (PESAI) in
Arborg, and Westman Agricultural Diversification Organization (WADO) in Melita.
The Parkland Crop Diversification Foundation owes its success to excellent cooperation with ARD, the
PCDF board of directors, producers, industry and cooperating research institutions.
The 2020 season was full of hard work and dedication from the staff to execute all the research activities
that came with an ambitious project list. A thank you goes out to James Frey and all the staff: Jessica
Frey, Brooklyn Bartel and Mackenzie Kozak.
Funding is essential for the Parkland Crop Diversification Foundation’s everyday activities to occur. This
year PCDF received core funding and support from the Canadian Agricultural Partnership (CAP) and
Agriculture Sustainability Initiative (ASI) programs, as well as from trial cooperators, producers, and
members of the local community. PCDF is always open to project ideas and learning about the
production concerns of local producers, so please feel free to contact us with any project proposals. For
project submissions or additional information, please refer to the Contact info supplied on this website.
Parkland Crop Diversification Foundation (PCDF)
Box 970, Roblin, MB R0L 1P0
E-mail: [email protected]
Website: www.diversificationcentres.ca
Phone: (204) 937-6473
PCDF Board of Directors
Executive Robert Misko Chair Roblin Mark Laycock Vice-Chair Russell Laurie Radford Secretary San Clara Cynthia Nerbas Treasurer Russell Members Jeremy Andres Roblin Doug Cranwell Roblin Rod Fisher Dauphin Dale Gryba Gilbert Plains Boris Michaleski Dauphin John Sandborn Benito Erin Jackson Inglis Guy Hammond Roblin Miles Williamson Roblin Vern Zatwarnicki Gilbert Plains
Parkland Crop Diversification Foundation Annual Report 2020 2
Partners
Meteorological Data
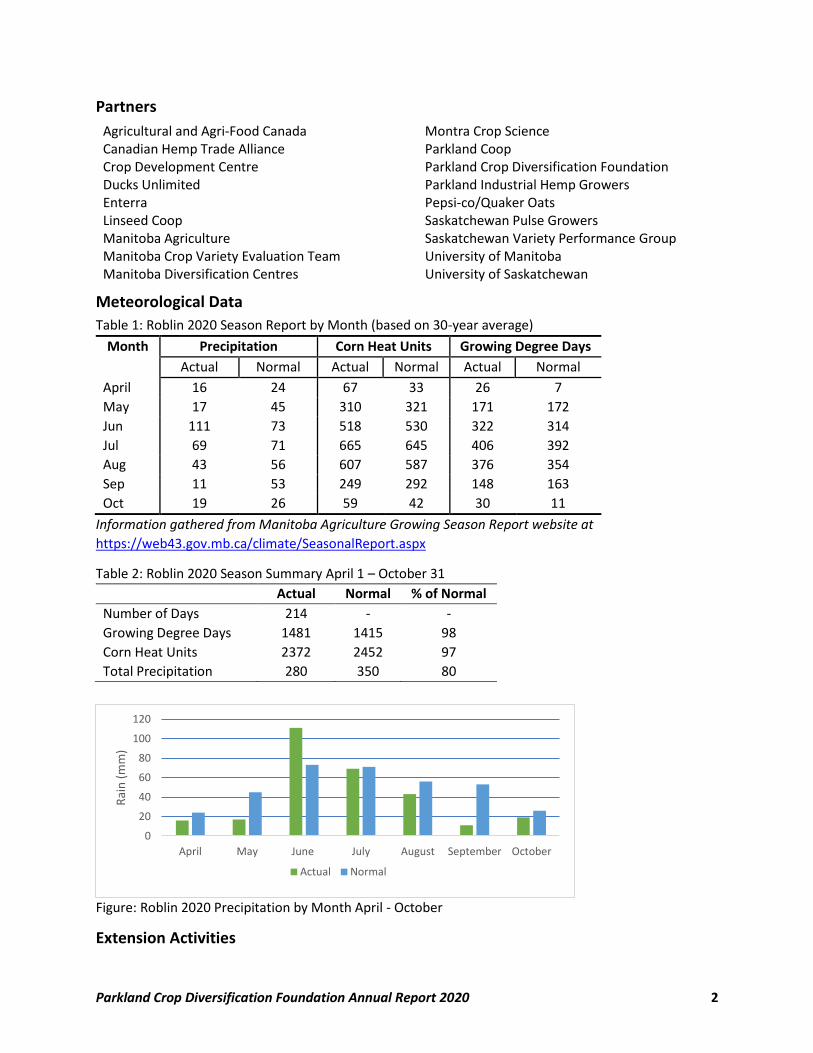
Table 1: Roblin 2020 Season Report by Month (based on 30-year average)
Month Precipitation Corn Heat Units Growing Degree Days
Actual Normal Actual Normal Actual Normal
April 16 24 67 33 26 7
May 17 45 310 321 171 172
Jun 111 73 518 530 322 314
Jul 69 71 665 645 406 392
Aug 43 56 607 587 376 354
Sep 11 53 249 292 148 163
Oct 19 26 59 42 30 11
Information gathered from Manitoba Agriculture Growing Season Report website at
https://web43.gov.mb.ca/climate/SeasonalReport.aspx
Table 2: Roblin 2020 Season Summary April 1 – October 31
Actual Normal % of Normal
Number of Days 214 - -
Growing Degree Days 1481 1415 98
Corn Heat Units 2372 2452 97
Total Precipitation 280 350 80
Figure: Roblin 2020 Precipitation by Month April - October
Extension Activities
0
20
40
60
80
100
120
April May June July August September October
Rai
n (
mm
)
Actual Normal
Agricultural and Agri-Food Canada Montra Crop Science Canadian Hemp Trade Alliance Parkland Coop Crop Development Centre Ducks Unlimited
Parkland Crop Diversification Foundation Parkland Industrial Hemp Growers
Enterra Pepsi-co/Quaker Oats Linseed Coop Saskatchewan Pulse Growers Manitoba Agriculture Saskatchewan Variety Performance Group Manitoba Crop Variety Evaluation Team University of Manitoba Manitoba Diversification Centres University of Saskatchewan
Parkland Crop Diversification Foundation Annual Report 2020 3
The Manitoba Diversification Centres participated in Ag Days at the Keystone Centre in Brandon
Table 1: PCDF 2020 Extension Activities
Name Medium Date Location
Ag Days Booth January Brandon
Ag in the Classroom School presentations March Swan River, Benito
Extension Videos Online video N/A PCDF plots
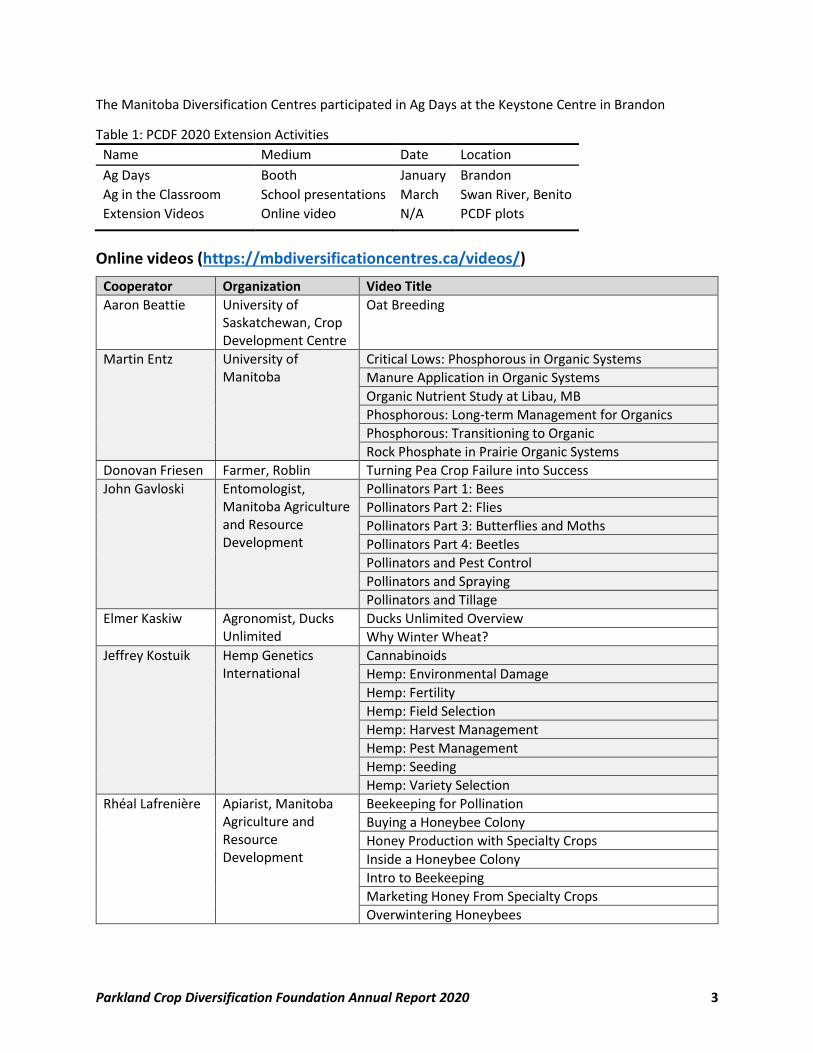
Online videos (https://mbdiversificationcentres.ca/videos/)
Cooperator Organization Video Title
Aaron Beattie University of Saskatchewan, Crop Development Centre
Oat Breeding
Martin Entz University of Manitoba
Critical Lows: Phosphorous in Organic Systems
Manure Application in Organic Systems
Organic Nutrient Study at Libau, MB
Phosphorous: Long-term Management for Organics
Phosphorous: Transitioning to Organic
Rock Phosphate in Prairie Organic Systems
Donovan Friesen Farmer, Roblin Turning Pea Crop Failure into Success
John Gavloski Entomologist, Manitoba Agriculture and Resource Development
Pollinators Part 1: Bees
Pollinators Part 2: Flies
Pollinators Part 3: Butterflies and Moths
Pollinators Part 4: Beetles
Pollinators and Pest Control
Pollinators and Spraying
Pollinators and Tillage
Elmer Kaskiw Agronomist, Ducks Unlimited
Ducks Unlimited Overview
Why Winter Wheat?
Jeffrey Kostuik Hemp Genetics International
Cannabinoids
Hemp: Environmental Damage
Hemp: Fertility
Hemp: Field Selection
Hemp: Harvest Management
Hemp: Pest Management
Hemp: Seeding
Hemp: Variety Selection
Rhéal Lafrenière Apiarist, Manitoba Agriculture and Resource Development
Beekeeping for Pollination
Buying a Honeybee Colony
Honey Production with Specialty Crops
Inside a Honeybee Colony
Intro to Beekeeping
Marketing Honey From Specialty Crops
Overwintering Honeybees
Parkland Crop Diversification Foundation Annual Report 2020 4
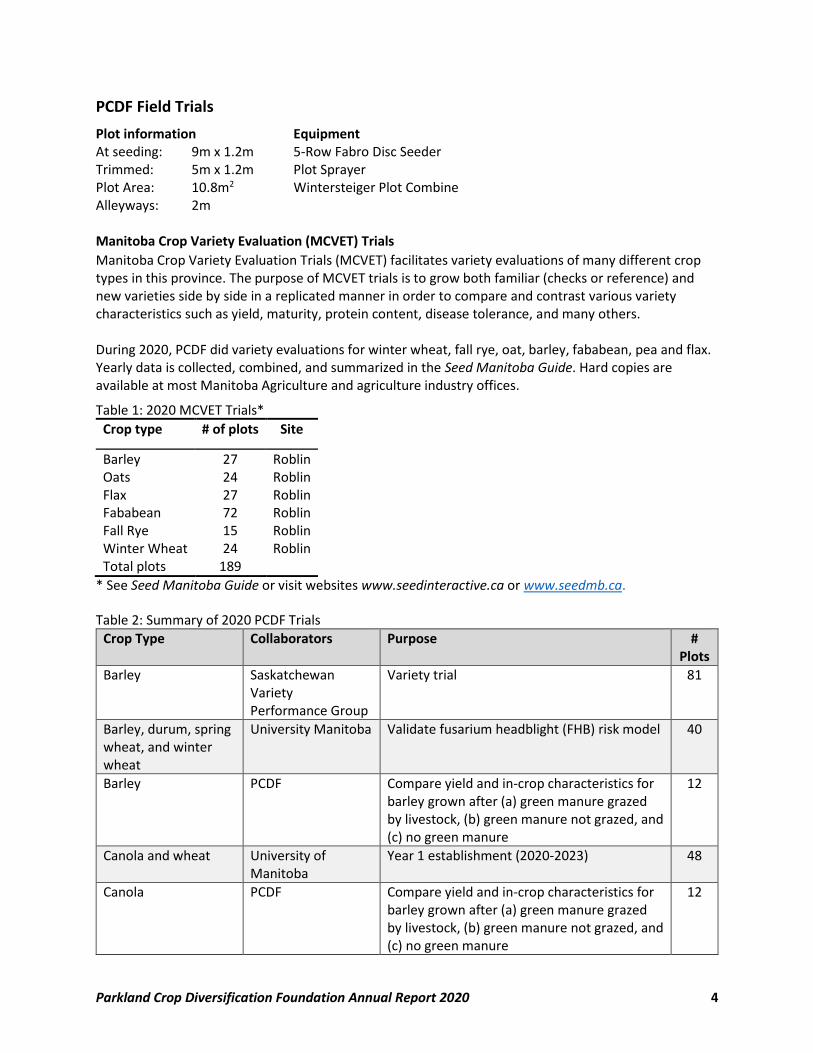
PCDF Field Trials
Plot information Equipment At seeding: 9m x 1.2m 5-Row Fabro Disc Seeder Trimmed: 5m x 1.2m Plot Sprayer Plot Area: 10.8m2 Wintersteiger Plot Combine Alleyways: 2m Manitoba Crop Variety Evaluation (MCVET) Trials
Manitoba Crop Variety Evaluation Trials (MCVET) facilitates variety evaluations of many different crop types in this province. The purpose of MCVET trials is to grow both familiar (checks or reference) and new varieties side by side in a replicated manner in order to compare and contrast various variety characteristics such as yield, maturity, protein content, disease tolerance, and many others. During 2020, PCDF did variety evaluations for winter wheat, fall rye, oat, barley, fababean, pea and flax. Yearly data is collected, combined, and summarized in the Seed Manitoba Guide. Hard copies are available at most Manitoba Agriculture and agriculture industry offices.
Table 1: 2020 MCVET Trials*
Crop type # of plots Site
Barley 27 Roblin Oats 24 Roblin Flax 27 Roblin Fababean 72 Roblin Fall Rye 15 Roblin Winter Wheat 24 Roblin Total plots 189
* See Seed Manitoba Guide or visit websites www.seedinteractive.ca or www.seedmb.ca. Table 2: Summary of 2020 PCDF Trials
Crop Type Collaborators Purpose # Plots
Barley Saskatchewan Variety Performance Group
Variety trial 81
Barley, durum, spring wheat, and winter wheat
University Manitoba Validate fusarium headblight (FHB) risk model 40
Barley PCDF Compare yield and in-crop characteristics for barley grown after (a) green manure grazed by livestock, (b) green manure not grazed, and (c) no green manure
12
Canola and wheat University of Manitoba
Year 1 establishment (2020-2023) 48
Canola PCDF Compare yield and in-crop characteristics for barley grown after (a) green manure grazed by livestock, (b) green manure not grazed, and (c) no green manure
12
Parkland Crop Diversification Foundation Annual Report 2020 5
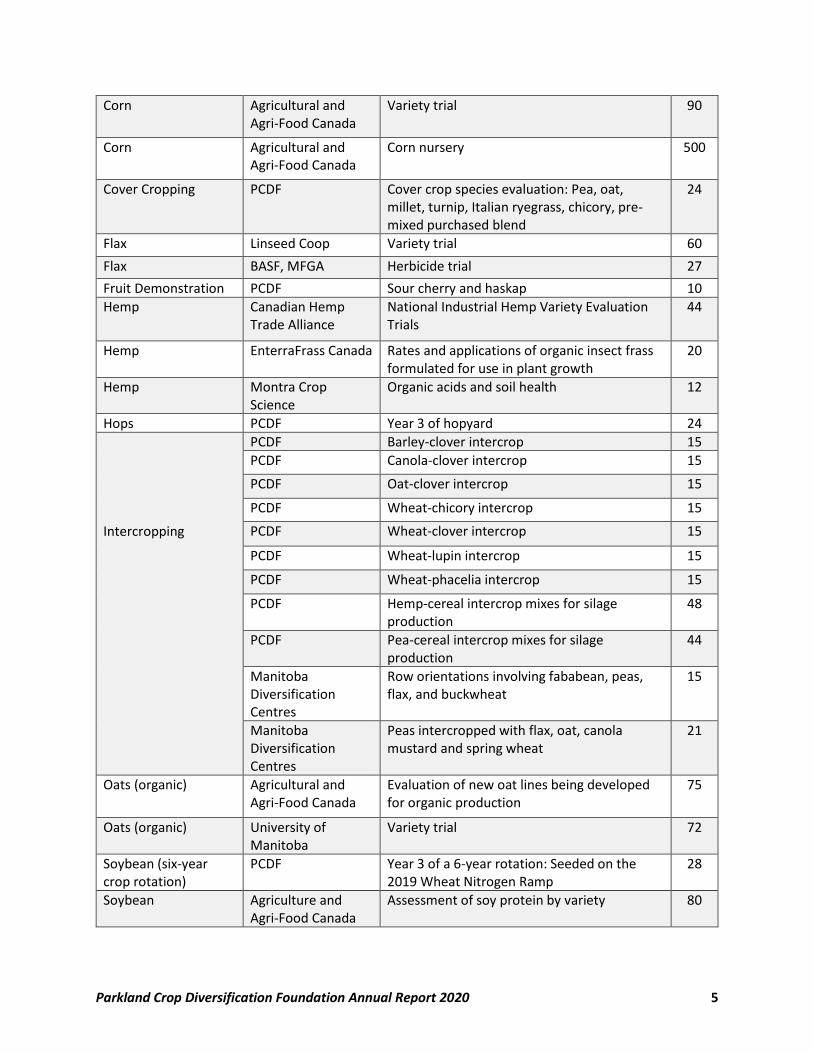
Corn Agricultural and Agri-Food Canada
Variety trial 90
Corn Agricultural and Agri-Food Canada
Corn nursery 500
Cover Cropping PCDF Cover crop species evaluation: Pea, oat, millet, turnip, Italian ryegrass, chicory, pre-mixed purchased blend
24
Flax Linseed Coop Variety trial 60
Flax BASF, MFGA Herbicide trial 27
Fruit Demonstration PCDF Sour cherry and haskap 10
Hemp Canadian Hemp Trade Alliance
National Industrial Hemp Variety Evaluation Trials
44
Hemp EnterraFrass Canada Rates and applications of organic insect frass formulated for use in plant growth
20
Hemp Montra Crop Science
Organic acids and soil health 12
Hops PCDF Year 3 of hopyard 24
Intercropping
PCDF Barley-clover intercrop 15
PCDF Canola-clover intercrop 15
PCDF Oat-clover intercrop 15
PCDF Wheat-chicory intercrop 15
PCDF Wheat-clover intercrop 15
PCDF Wheat-lupin intercrop 15
PCDF Wheat-phacelia intercrop 15
PCDF Hemp-cereal intercrop mixes for silage production
48
PCDF Pea-cereal intercrop mixes for silage production
44
Manitoba Diversification Centres
Row orientations involving fababean, peas, flax, and buckwheat
15
Manitoba Diversification Centres
Peas intercropped with flax, oat, canola mustard and spring wheat
21
Oats (organic) Agricultural and Agri-Food Canada
Evaluation of new oat lines being developed for organic production
75
Oats (organic) University of Manitoba
Variety trial 72
Soybean (six-year crop rotation)
PCDF Year 3 of a 6-year rotation: Seeded on the 2019 Wheat Nitrogen Ramp
28
Soybean Agriculture and Agri-Food Canada
Assessment of soy protein by variety 80
Parkland Crop Diversification Foundation Annual Report 2020 6
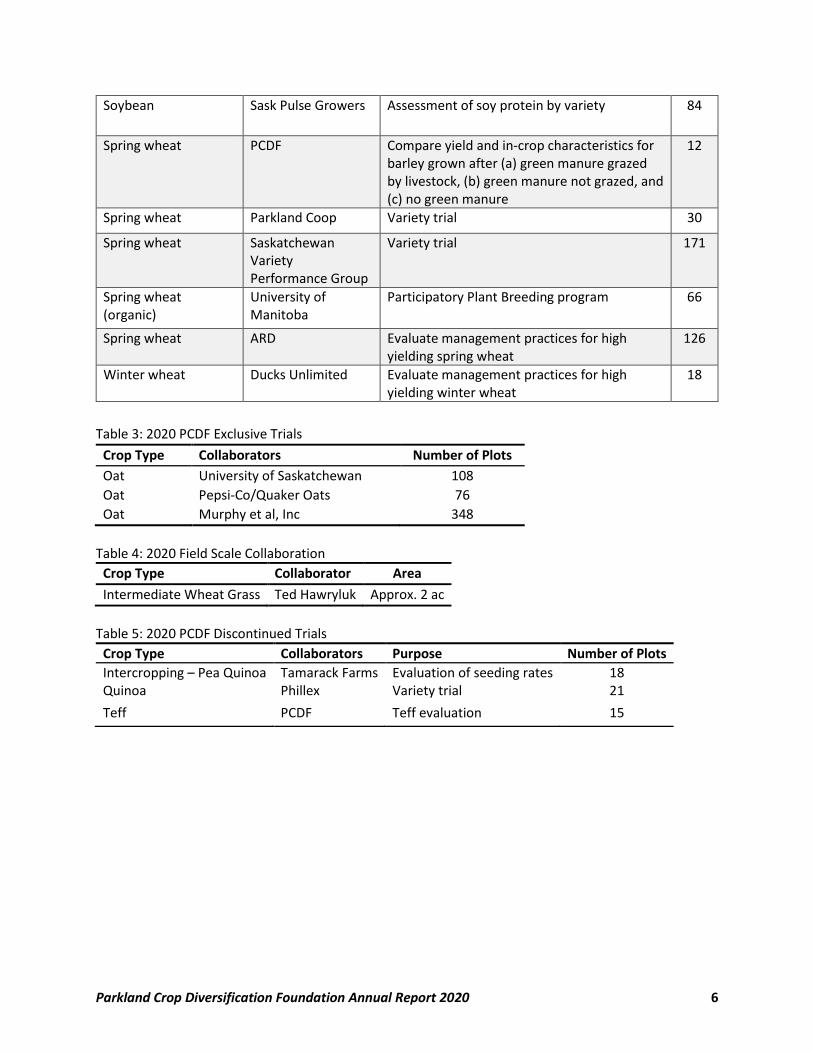
Soybean Sask Pulse Growers Assessment of soy protein by variety 84
Spring wheat PCDF Compare yield and in-crop characteristics for barley grown after (a) green manure grazed by livestock, (b) green manure not grazed, and (c) no green manure
12
Spring wheat Parkland Coop Variety trial 30
Spring wheat Saskatchewan Variety Performance Group
Variety trial 171
Spring wheat (organic)
University of Manitoba
Participatory Plant Breeding program 66
Spring wheat ARD Evaluate management practices for high yielding spring wheat
126
Winter wheat Ducks Unlimited Evaluate management practices for high yielding winter wheat
18
Table 3: 2020 PCDF Exclusive Trials
Crop Type Collaborators Number of Plots
Oat University of Saskatchewan 108
Oat Pepsi-Co/Quaker Oats 76
Oat Murphy et al, Inc 348
Table 4: 2020 Field Scale Collaboration
Crop Type Collaborator Area
Intermediate Wheat Grass Ted Hawryluk Approx. 2 ac
Table 5: 2020 PCDF Discontinued Trials
Crop Type Collaborators Purpose Number of Plots
Intercropping – Pea Quinoa Tamarack Farms Evaluation of seeding rates 18 Quinoa Phillex Variety trial 21
Teff PCDF Teff evaluation 15
Parkland Crop Diversification Foundation Annual Report 2020 7
Canola Disease Surveys
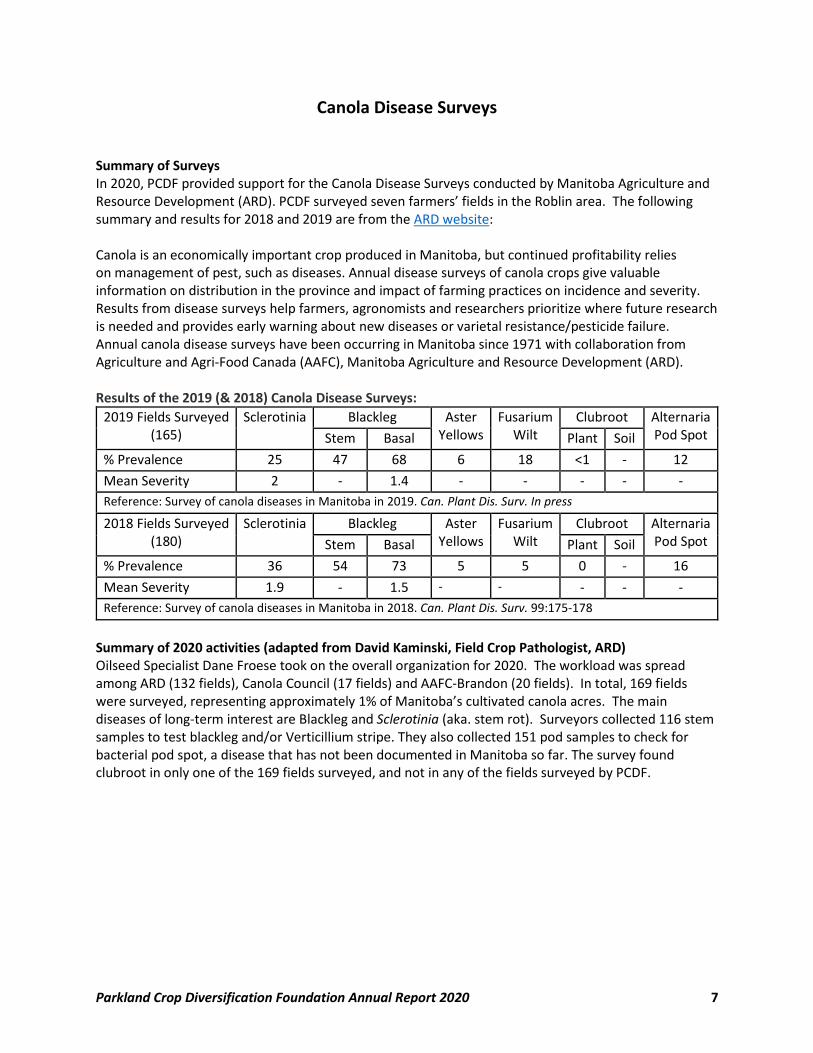
Summary of Surveys In 2020, PCDF provided support for the Canola Disease Surveys conducted by Manitoba Agriculture and Resource Development (ARD). PCDF surveyed seven farmers’ fields in the Roblin area. The following summary and results for 2018 and 2019 are from the ARD website: Canola is an economically important crop produced in Manitoba, but continued profitability relies on management of pest, such as diseases. Annual disease surveys of canola crops give valuable information on distribution in the province and impact of farming practices on incidence and severity. Results from disease surveys help farmers, agronomists and researchers prioritize where future research is needed and provides early warning about new diseases or varietal resistance/pesticide failure. Annual canola disease surveys have been occurring in Manitoba since 1971 with collaboration from Agriculture and Agri-Food Canada (AAFC), Manitoba Agriculture and Resource Development (ARD). Results of the 2019 (& 2018) Canola Disease Surveys:
2019 Fields Surveyed (165)
Sclerotinia Blackleg Aster Yellows
Fusarium Wilt
Clubroot Alternaria Pod Spot Stem Basal Plant Soil
% Prevalence 25 47 68 6 18 <1 - 12
Mean Severity 2 - 1.4 - - - - -
Reference: Survey of canola diseases in Manitoba in 2019. Can. Plant Dis. Surv. In press
2018 Fields Surveyed (180)
Sclerotinia Blackleg Aster Yellows
Fusarium Wilt
Clubroot Alternaria Pod Spot Stem Basal Plant Soil
% Prevalence 36 54 73 5 5 0 - 16
Mean Severity 1.9 - 1.5 - - - - -
Reference: Survey of canola diseases in Manitoba in 2018. Can. Plant Dis. Surv. 99:175-178
Summary of 2020 activities (adapted from David Kaminski, Field Crop Pathologist, ARD) Oilseed Specialist Dane Froese took on the overall organization for 2020. The workload was spread among ARD (132 fields), Canola Council (17 fields) and AAFC-Brandon (20 fields). In total, 169 fields were surveyed, representing approximately 1% of Manitoba’s cultivated canola acres. The main diseases of long-term interest are Blackleg and Sclerotinia (aka. stem rot). Surveyors collected 116 stem samples to test blackleg and/or Verticillium stripe. They also collected 151 pod samples to check for bacterial pod spot, a disease that has not been documented in Manitoba so far. The survey found clubroot in only one of the 169 fields surveyed, and not in any of the fields surveyed by PCDF.
Parkland Crop Diversification Foundation Annual Report 2020 8
Barley Trials
Parkland Crop Diversification Foundation Annual Report 2020 9
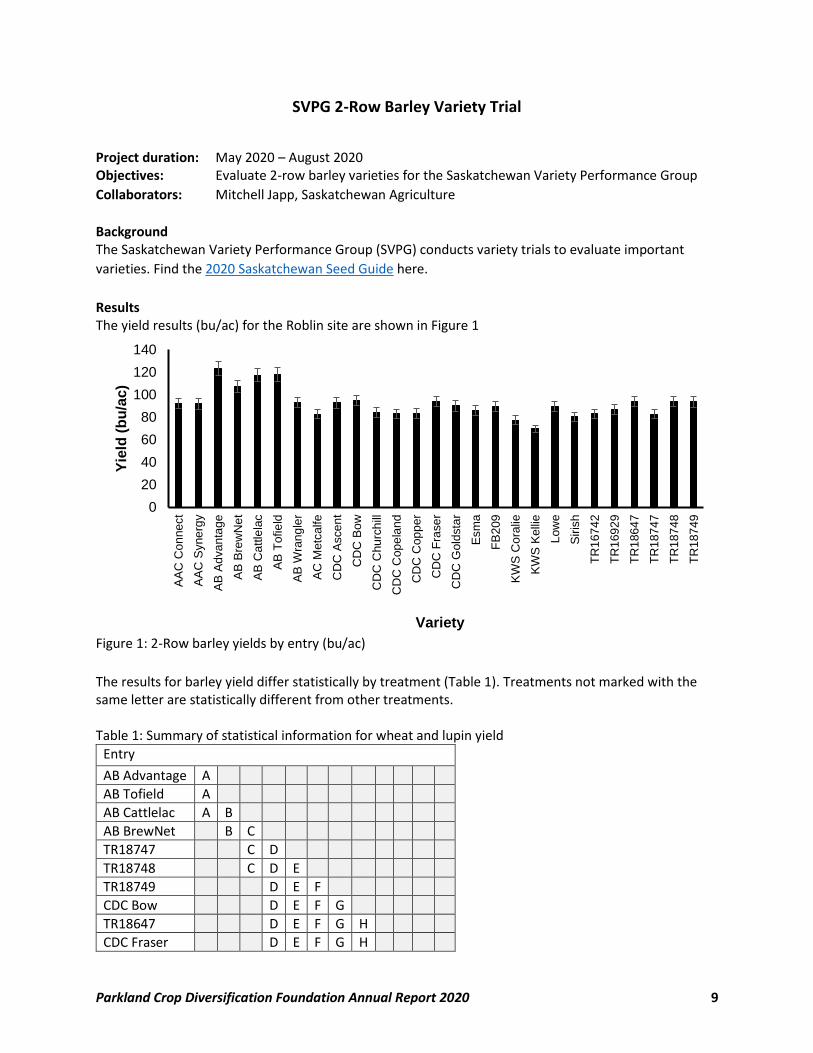
SVPG 2-Row Barley Variety Trial
Project duration: May 2020 – August 2020 Objectives: Evaluate 2-row barley varieties for the Saskatchewan Variety Performance Group
Collaborators: Mitchell Japp, Saskatchewan Agriculture
Background The Saskatchewan Variety Performance Group (SVPG) conducts variety trials to evaluate important
varieties. Find the 2020 Saskatchewan Seed Guide here.
Results The yield results (bu/ac) for the Roblin site are shown in Figure 1
Figure 1: 2-Row barley yields by entry (bu/ac)
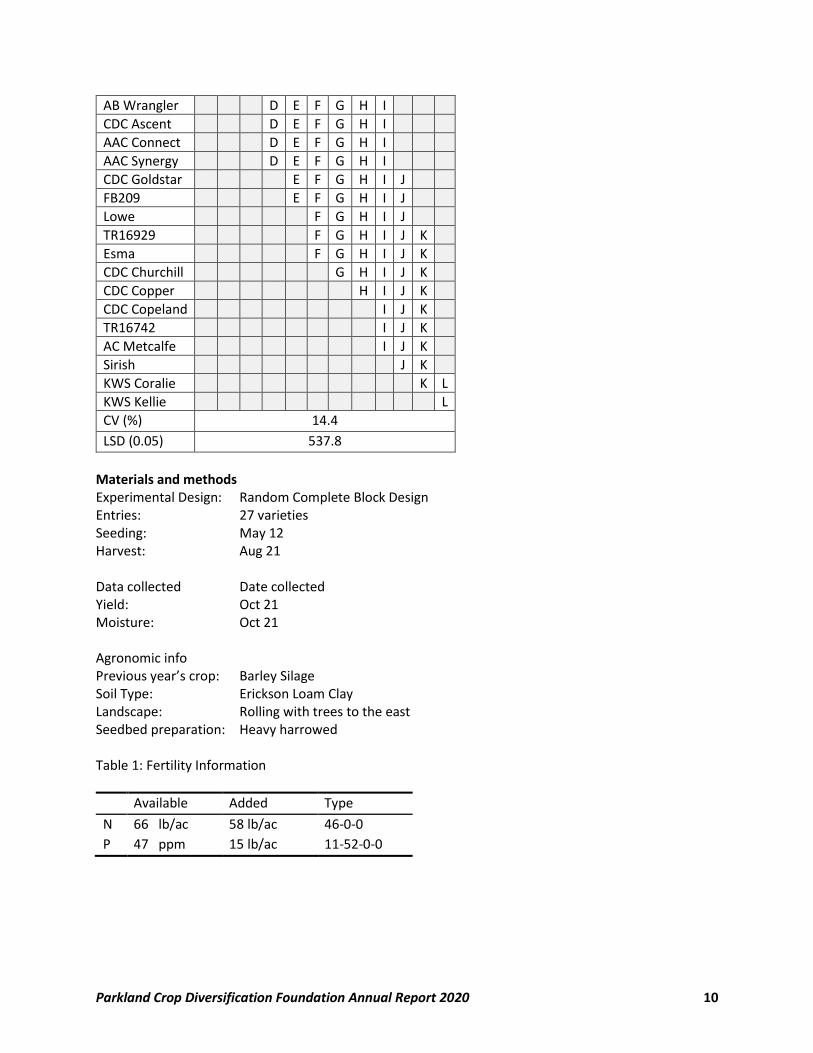
The results for barley yield differ statistically by treatment (Table 1). Treatments not marked with the same letter are statistically different from other treatments. Table 1: Summary of statistical information for wheat and lupin yield
Entry
AB Advantage A
AB Tofield A
AB Cattlelac A B
AB BrewNet B C
TR18747 C D
TR18748 C D E
TR18749 D E F
CDC Bow D E F G
TR18647 D E F G H
CDC Fraser D E F G H
0
20
40
60
80
100
120
140
AA
C C
on
ne
ct
AA
C S
yne
rgy
AB
Ad
va
nta
ge
AB
Bre
wN
et
AB
Ca
ttle
lac
AB
Tofie
ld
AB
Wra
ng
ler
AC
Metc
alfe
CD
C A
sce
nt
CD
C B
ow
CD
C C
hu
rch
ill
CD
C C
op
ela
nd
CD
C C
op
per
CD
C F
rase
r
CD
C G
old
sta
r
Esm
a
FB
209
KW
S C
ora
lie
KW
S K
elli
e
Low
e
Sir
ish
TR
167
42
TR
169
29
TR
186
47
TR
187
47
TR
187
48
TR
187
49
Yie
ld (
bu
/ac)
Variety
Parkland Crop Diversification Foundation Annual Report 2020 10
AB Wrangler D E F G H I
CDC Ascent D E F G H I
AAC Connect D E F G H I
AAC Synergy D E F G H I
CDC Goldstar E F G H I J
FB209 E F G H I J
Lowe F G H I J
TR16929 F G H I J K
Esma F G H I J K
CDC Churchill G H I J K
CDC Copper H I J K
CDC Copeland I J K
TR16742 I J K
AC Metcalfe I J K
Sirish J K
KWS Coralie K L
KWS Kellie L
CV (%) 14.4
LSD (0.05) 537.8
Materials and methods Experimental Design: Random Complete Block Design Entries: 27 varieties Seeding: May 12 Harvest: Aug 21 Data collected Date collected Yield: Oct 21 Moisture: Oct 21 Agronomic info Previous year’s crop: Barley Silage Soil Type: Erickson Loam Clay Landscape: Rolling with trees to the east Seedbed preparation: Heavy harrowed Table 1: Fertility Information
Available Added Type
N 66 lb/ac 58 lb/ac 46-0-0
P 47 ppm 15 lb/ac 11-52-0-0
Parkland Crop Diversification Foundation Annual Report 2020 11
Corn Trials
Parkland Crop Diversification Foundation Annual Report 2020 12
Agriculture Agri-Food Canada Corn Variety Evaluation
Project duration: May 2020 – November 2020 Objectives: To develop and release early maturing cold tolerant corn inbreds with emphasis on
the 1800-2000 CHU market.
Collaborators: Lana Reid PhD – AAFC Research Scientist Ottawa Research and Development Centre
Manitoba Corn Growers Association
Background and findings The objective will be achieved using conventional corn breeding methodology enhanced by double
haploid inbred production and specialized screening techniques for cold tolerance and disease
resistance. The trial is being conducted at sites across five Canadian provinces. The anticipated impact
of developing earlier maturing, cold tolerant corn will expand the acreage of corn production in Canada.
This project is part of a long-term, multi-site study led by Lana Reid. Lana Reid and team will make
research findings available at the conclusion of the project.
Materials and methods Experimental Design: Random Complete Block Design Entries: 30 varieties Seeding: May 20 Harvest: Oct 14 Data collected Date collected Yield: Oct 27 Moisture: Oct 27 Agronomic info Previous year’s crop: Barley Silage Soil Type: Erickson Loam Clay Landscape: Rolling with trees to the east Seedbed preparation: Direct-seed Table 1: Fertility Information
Available Added Type
N 71 lb/ac 121 lb/ac 46-0-0
P 50 ppm 15 lb/ac 11-52-0-0
K 556 ppm N/A N/A
Table 2: Pesticide Application
Crop stage Date Product Rate
Pre-emerge May 26 Heat 28 g/ac
Round-up 645 ml/ac
In crop Jul 27 Sortan IS 30 g/ac
Parkland Crop Diversification Foundation Annual Report 2020 13
Agriculture Agri-Food Canada Corn Nursery
Project duration: May 2020 – October 2020 Objectives: To develop and release early maturing cold tolerant corn inbreds with emphasis on
the 1800-2000 CHU market.
Collaborators: Lana Reid PhD – AAFC Research Scientist Ottawa Research and Development Centre
Manitoba Corn Growers
Background and project findings The objective will be achieved using conventional corn breeding methodology enhanced by double
haploid inbred production and specialized screening techniques for cold tolerance and disease
resistance. The trial is being conducted at sites across five Canadian provinces. The anticipated impact
of developing earlier maturing, cold tolerant corn will expand the acreage of corn production in Canada.
This project is part of a long-term, multi-site study led by Lana Reid. Lana Reid and team will make
research findings available at the conclusion of the project.
Materials and methods Experimental Design: 500 row observation nursery Entries: 500 Seeding: May 20 Harvest: Oct 14 Data collected Date collected Tasseling Date: Jul 23 – Aug 18 Silking Date: Jul 21 – Aug 22 Ear Formation: Aug 4 – Aug 26 Agronomic info Previous year’s crop: Barley Silage Soil Type: Erickson Loam Clay Landscape: Rolling with trees to the east Seedbed preparation: Direct-seed
Table 1: Fertility Information
Available Added Type
N 71 lb/ac 121 lb/ac 46-0-0
P 50 ppm 15 lb/ac 11-52-0-0
K 556 ppm none N/A
Table 2: Pesticide Application
Crop stage Date Product Rate
Pre-emerge May 26 Heat 28 g/ac
Round-up 645 ml/ac
In crop Jul 27 Sortan IS 30 g/ac
Parkland Crop Diversification Foundation Annual Report 2020 14
Cover Cropping Trials
Parkland Crop Diversification Foundation Annual Report 2020 15
The Effect of Grazing and Non-grazing of Annual Green Manures on Following Crops
(Year 2)
Project duration: May 2019 – October 2020 Objectives: To evaluate the use of an annual green manure crop for grazing by livestock and to
provide fertility for the following crop (2019); and to evaluate the performance of three annual field crops after a green manure crop, with and without grazing (2020).
Collaborators: PCDF Background
The use of green manure crops to provide nitrogen is well-understood in organic agriculture. One of the
barriers to adoption of green manures is that there is no “harvestable” product and no income from that
year. Research conducted by the Natural Systems Agriculture laboratory at the University of Manitoba
has demonstrated that grazing the green manure by livestock can kill the crop, providing an alternative
to terminating the crop with tillage. Further, grazing results in large amounts of available N in the soil.
Follow-up research by the Natural Systems Agriculture laboratory demonstrated that there was no
significant difference in the year-2 crop yield for grazed and ungrazed treatments. The results for that
research suggest that there is no yield decrease associated with grazing a green manure.
Results 2019
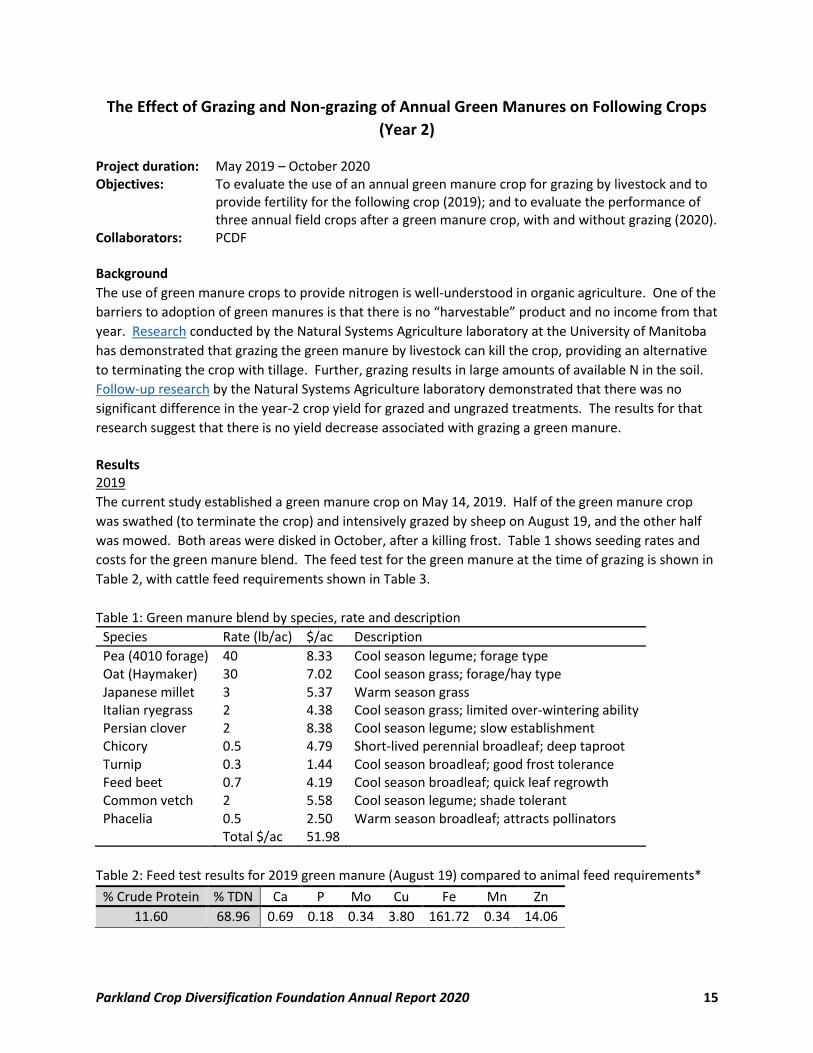
The current study established a green manure crop on May 14, 2019. Half of the green manure crop
was swathed (to terminate the crop) and intensively grazed by sheep on August 19, and the other half
was mowed. Both areas were disked in October, after a killing frost. Table 1 shows seeding rates and
costs for the green manure blend. The feed test for the green manure at the time of grazing is shown in
Table 2, with cattle feed requirements shown in Table 3.
Table 1: Green manure blend by species, rate and description
Species Rate (lb/ac) $/ac Description
Pea (4010 forage) 40 8.33 Cool season legume; forage type Oat (Haymaker) 30 7.02 Cool season grass; forage/hay type Japanese millet 3 5.37 Warm season grass Italian ryegrass 2 4.38 Cool season grass; limited over-wintering ability Persian clover 2 8.38 Cool season legume; slow establishment Chicory 0.5 4.79 Short-lived perennial broadleaf; deep taproot Turnip 0.3 1.44 Cool season broadleaf; good frost tolerance Feed beet 0.7 4.19 Cool season broadleaf; quick leaf regrowth Common vetch 2 5.58 Cool season legume; shade tolerant Phacelia 0.5 2.50 Warm season broadleaf; attracts pollinators Total $/ac 51.98
Table 2: Feed test results for 2019 green manure (August 19) compared to animal feed requirements*
% Crude Protein % TDN Ca P Mo Cu Fe Mn Zn
11.60 68.96 0.69 0.18 0.34 3.80 161.72 0.34 14.06
Parkland Crop Diversification Foundation Annual Report 2020 16
Figure 1: (a) green manure before grazing; (b) sheep on swathed green manure.
Table 3: Cattle feed requirements*
% Crude Protein % TDN
8.21 58.86
Mature cows
Mid gestation 7 50-53
Late gestation 9 58
Lactating 11-12 60-65
Replacement heifers 8-10 60-65
Breeding bulls 7-8 48-50
Yearling bulls 7-8 55-60
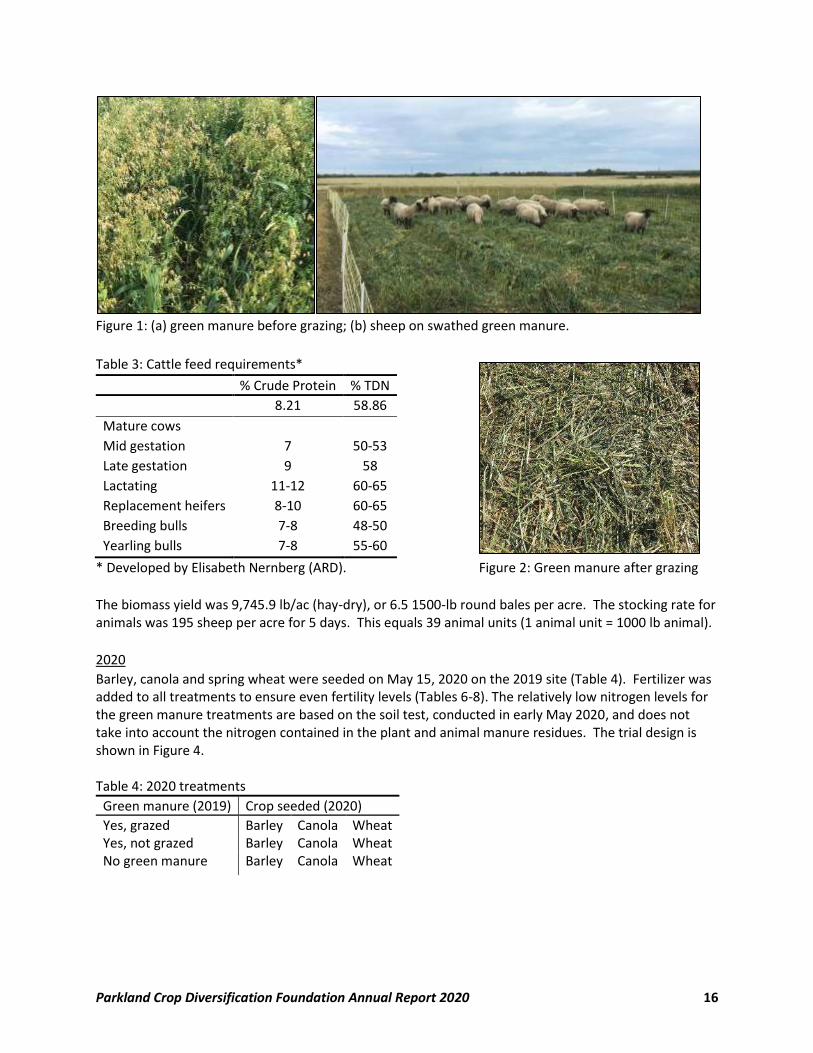
* Developed by Elisabeth Nernberg (ARD). Figure 2: Green manure after grazing
The biomass yield was 9,745.9 lb/ac (hay-dry), or 6.5 1500-lb round bales per acre. The stocking rate for animals was 195 sheep per acre for 5 days. This equals 39 animal units (1 animal unit = 1000 lb animal).
2020
Barley, canola and spring wheat were seeded on May 15, 2020 on the 2019 site (Table 4). Fertilizer was added to all treatments to ensure even fertility levels (Tables 6-8). The relatively low nitrogen levels for the green manure treatments are based on the soil test, conducted in early May 2020, and does not take into account the nitrogen contained in the plant and animal manure residues. The trial design is shown in Figure 4. Table 4: 2020 treatments
Green manure (2019) Crop seeded (2020)
Yes, grazed Barley Canola Wheat Yes, not grazed Barley Canola Wheat No green manure Barley Canola Wheat
Parkland Crop Diversification Foundation Annual Report 2020 17
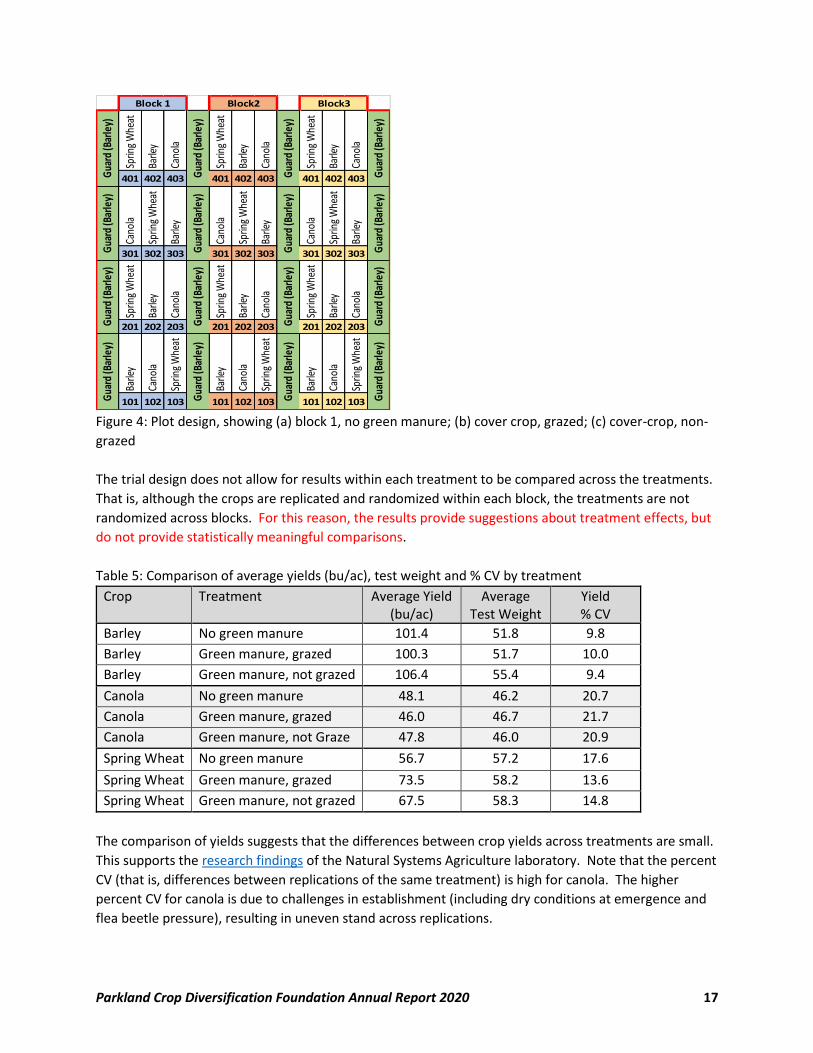
Figure 4: Plot design, showing (a) block 1, no green manure; (b) cover crop, grazed; (c) cover-crop, non-
grazed
The trial design does not allow for results within each treatment to be compared across the treatments.
That is, although the crops are replicated and randomized within each block, the treatments are not
randomized across blocks. For this reason, the results provide suggestions about treatment effects, but
do not provide statistically meaningful comparisons.
Table 5: Comparison of average yields (bu/ac), test weight and % CV by treatment
Crop Treatment Average Yield (bu/ac)
Average Test Weight
Yield % CV
Barley No green manure 101.4 51.8 9.8
Barley Green manure, grazed 100.3 51.7 10.0
Barley Green manure, not grazed 106.4 55.4 9.4
Canola No green manure 48.1 46.2 20.7
Canola Green manure, grazed 46.0 46.7 21.7
Canola Green manure, not Graze 47.8 46.0 20.9
Spring Wheat No green manure 56.7 57.2 17.6
Spring Wheat Green manure, grazed 73.5 58.2 13.6
Spring Wheat Green manure, not grazed 67.5 58.3 14.8
The comparison of yields suggests that the differences between crop yields across treatments are small.
This supports the research findings of the Natural Systems Agriculture laboratory. Note that the percent
CV (that is, differences between replications of the same treatment) is high for canola. The higher
percent CV for canola is due to challenges in establishment (including dry conditions at emergence and
flea beetle pressure), resulting in uneven stand across replications.
Sprin
g W
heat
Barle
y
Cano
la
Sprin
g W
heat
Barle
y
Cano
la
Sprin
g W
heat
Barle
y
Cano
la
401 402 403 401 402 403 401 402 403
Cano
la
Sprin
g W
heat
Barle
y
Cano
la
Sprin
g W
heat
Barle
y
Cano
la
Sprin
g W
heat
Barle
y
301 302 303 301 302 303 301 302 303
Sprin
g W
heat
Barle
y
Cano
la
Sprin
g W
heat
Barle
y
Cano
la
Sprin
g W
heat
Barle
y
Cano
la
201 202 203 201 202 203 201 202 203
Barle
y
Cano
la
Sprin
g W
heat
Barle
y
Cano
la
Sprin
g W
heat
Barle
y
Cano
la
Sprin
g W
heat
101 102 103 101 102 103 101 102 103
Block3Block 1G
uard
(Bar
ley)
Gua
rd (B
arle
y)
Gua
rd (B
arle
y)
Gua
rd (B
arle
y)
Gua
rd (B
arle
y)
Gua
rd (B
arle
y)
Gua
rd (B
arle
y)G
uard
(Bar
ley)
Gua
rd (B
arle
y)
Gua
rd (B
arle
y)
Gua
rd (B
arle
y)
Gua
rd (B
arle
y)
Block2G
uard
(Bar
ley)
Gua
rd (B
arle
y)
Gua
rd (B
arle
y)
Gua
rd (B
arle
y)
Parkland Crop Diversification Foundation Annual Report 2020 18
Observations
The cost of the seed blend for forage is high relative to simpler cereal-only annual forages, such as
barley planted for green feed (estimated at $16.88/ac in the MB Agriculture Cost of Production).
However, some green manure species can provide extended in-season grazing, reducing pressure on
perennial pastures. Strategic inclusion of these species in a green manure mix can improve its
application to grazing. Other management options for green manures and livestock include swath or
bale grazing, which can extend grazing into the winter months, reducing feeding and yardage costs. In
future years, other benefits to soil characteristics, moisture infiltration and retention, and crop
performance may be observed.
Materials and methods Experimental Design: Random Complete Block Design (3 separate, non-comparable blocks) Entries: 3 crops, 4 replications per block Seeding: May 15 Harvest: Sep 11 Data collected Date collected Yield: Sep 11 Moisture: Sep 11 Previous year’s crop: Cover crop blend Soil Type: Erickson Loam Clay Landscape: Rolling with trees to the east Seedbed preparation: Heavy harrowed Table 6: Fertility Information, No Cover Crop
Available Barley Added Canola Added Wheat Added Type
N 42 lb/ac 82 lb/ac 112 lb/ac 147 lb/ac 46-0-0
P 23 ppm 15 lb/ac 10 lb/ac 15 lb/ac 11-52-0-0
K 249 ppm - - - N/A
S 38 lb/ac - - - N/A
Table 7: Fertility Information Cover Crop, Grazed
Available Barley Added Canola Added Wheat Added Type
N 60 lb/ac 64 lb/ac 94 lb/ac 129 lb/ac 46-0-0
P 18 ppm 15 lb/ac 15 lb/ac 18 lb/ac 11-56-0-0
K 257 ppm - - - N/A
S 34 lb/ac - - - N/A
Table 8: Fertility Information Cover Crop, Non-Grazed
Available Barley Added Canola Added Wheat Added Type
N 79 lb/ac 45 lb/ac 75 lb/ac 110 lb/ac 46-0-0
P 22 ppm 15 lb/ac 10 lb/ac 15 lb/ac 11-52-0-0
K 257 ppm - - - N/A
S 18 lb/ac - - - N/A
Parkland Crop Diversification Foundation Annual Report 2020 19
Cover Crop Species Evaluation
Project duration: May 2020 – August 2020 Objectives: To identify the biomass and nutritional contributions of cover crop species to a pea-
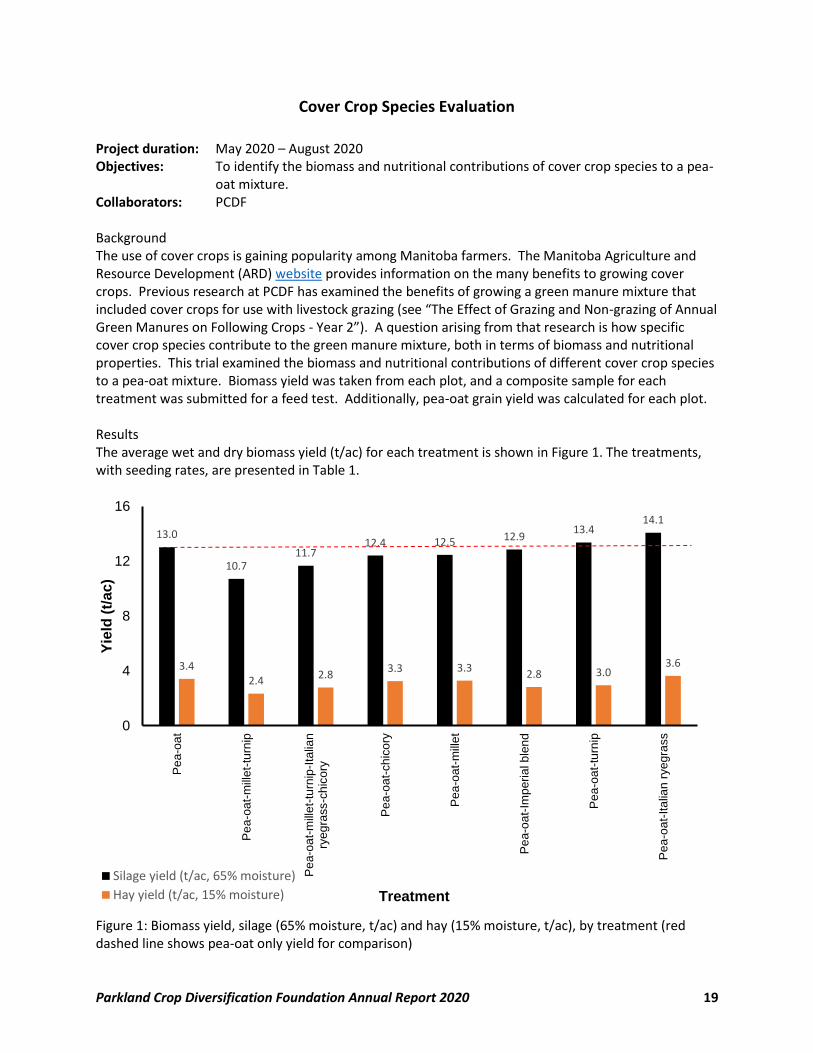
oat mixture. Collaborators: PCDF Background The use of cover crops is gaining popularity among Manitoba farmers. The Manitoba Agriculture and Resource Development (ARD) website provides information on the many benefits to growing cover crops. Previous research at PCDF has examined the benefits of growing a green manure mixture that included cover crops for use with livestock grazing (see “The Effect of Grazing and Non-grazing of Annual Green Manures on Following Crops - Year 2”). A question arising from that research is how specific cover crop species contribute to the green manure mixture, both in terms of biomass and nutritional properties. This trial examined the biomass and nutritional contributions of different cover crop species to a pea-oat mixture. Biomass yield was taken from each plot, and a composite sample for each treatment was submitted for a feed test. Additionally, pea-oat grain yield was calculated for each plot. Results The average wet and dry biomass yield (t/ac) for each treatment is shown in Figure 1. The treatments, with seeding rates, are presented in Table 1.
Figure 1: Biomass yield, silage (65% moisture, t/ac) and hay (15% moisture, t/ac), by treatment (red dashed line shows pea-oat only yield for comparison)
13.0
10.711.7
12.4 12.5 12.913.4
14.1
3.42.4
2.83.3 3.3
2.8 3.03.6
0
4
8
12
16
Pe
a-o
at
Pe
a-o
at-
mill
et-
turn
ip
Pe
a-o
at-
mill
et-
turn
ip-I
talia
nry
eg
rass-c
hic
ory
Pe
a-o
at-
ch
ico
ry
Pe
a-o
at-
mill
et
Pe
a-o
at-
Imp
eri
al b
len
d
Pe
a-o
at-
turn
ip
Pe
a-o
at-
Ita
lian
rye
gra
ss
Yie
ld (
t/a
c)
Treatment
Silage yield (t/ac, 65% moisture)
Hay yield (t/ac, 15% moisture)
Parkland Crop Diversification Foundation Annual Report 2020 20
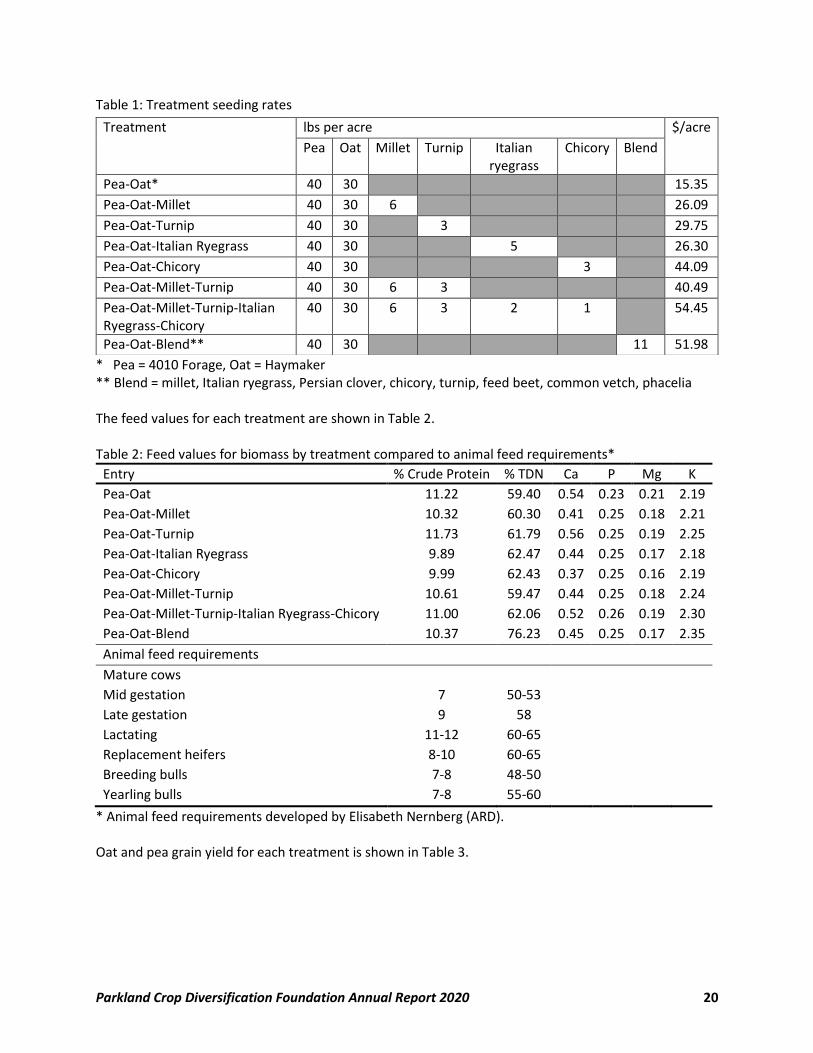
Table 1: Treatment seeding rates
* Pea = 4010 Forage, Oat = Haymaker ** Blend = millet, Italian ryegrass, Persian clover, chicory, turnip, feed beet, common vetch, phacelia The feed values for each treatment are shown in Table 2. Table 2: Feed values for biomass by treatment compared to animal feed requirements*
Entry % Crude Protein % TDN Ca P Mg K
Pea-Oat 11.22 59.40 0.54 0.23 0.21 2.19
Pea-Oat-Millet 10.32 60.30 0.41 0.25 0.18 2.21
Pea-Oat-Turnip 11.73 61.79 0.56 0.25 0.19 2.25
Pea-Oat-Italian Ryegrass 9.89 62.47 0.44 0.25 0.17 2.18
Pea-Oat-Chicory 9.99 62.43 0.37 0.25 0.16 2.19
Pea-Oat-Millet-Turnip 10.61 59.47 0.44 0.25 0.18 2.24
Pea-Oat-Millet-Turnip-Italian Ryegrass-Chicory 11.00 62.06 0.52 0.26 0.19 2.30
Pea-Oat-Blend 10.37 76.23 0.45 0.25 0.17 2.35
Animal feed requirements
Mature cows
Mid gestation 7 50-53
Late gestation 9 58
Lactating 11-12 60-65
Replacement heifers 8-10 60-65
Breeding bulls 7-8 48-50
Yearling bulls 7-8 55-60
* Animal feed requirements developed by Elisabeth Nernberg (ARD). Oat and pea grain yield for each treatment is shown in Table 3.
Treatment lbs per acre $/acre
Pea Oat Millet Turnip Italian ryegrass
Chicory Blend
Pea-Oat* 40 30
15.35
Pea-Oat-Millet 40 30 6
26.09
Pea-Oat-Turnip 40 30
3
29.75
Pea-Oat-Italian Ryegrass 40 30
5
26.30
Pea-Oat-Chicory 40 30
3
44.09
Pea-Oat-Millet-Turnip 40 30 6 3
40.49
Pea-Oat-Millet-Turnip-Italian Ryegrass-Chicory
40 30 6 3 2 1
54.45
Pea-Oat-Blend** 40 30
11 51.98
Parkland Crop Diversification Foundation Annual Report 2020 21
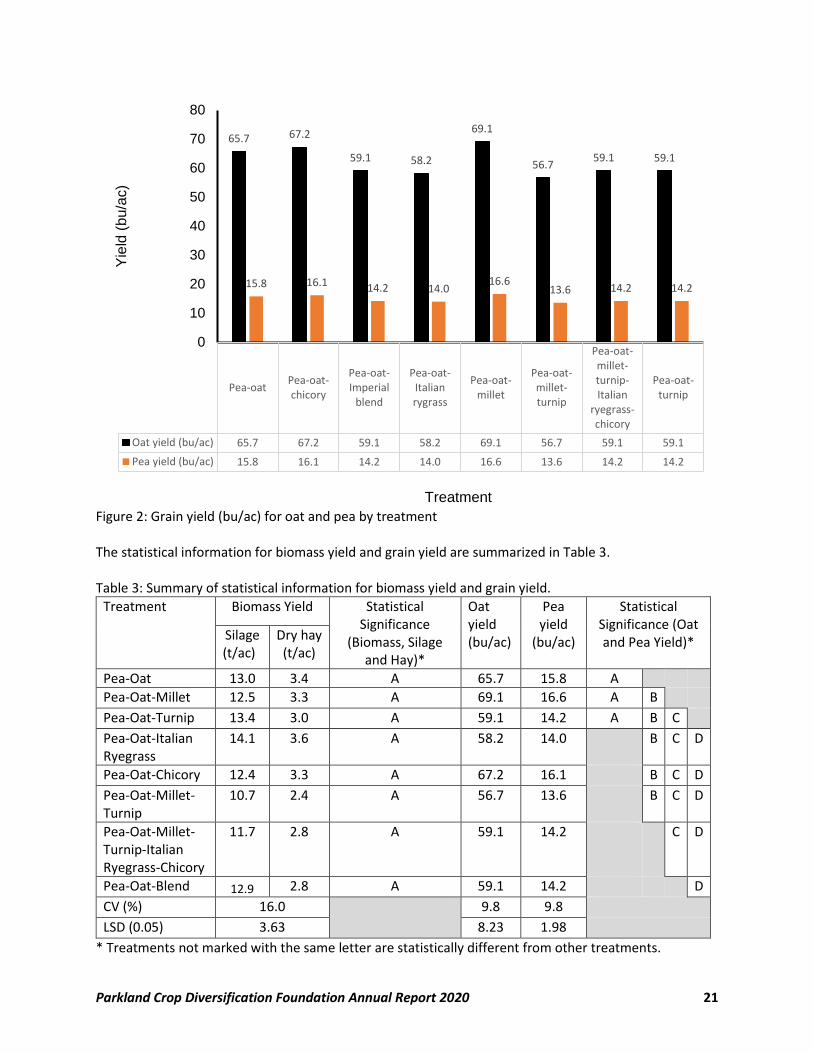
Figure 2: Grain yield (bu/ac) for oat and pea by treatment The statistical information for biomass yield and grain yield are summarized in Table 3. Table 3: Summary of statistical information for biomass yield and grain yield.
Treatment Biomass Yield Statistical Significance
(Biomass, Silage and Hay)*
Oat yield (bu/ac)
Pea yield
(bu/ac)
Statistical Significance (Oat and Pea Yield)* Silage
(t/ac) Dry hay (t/ac)
Pea-Oat 13.0 3.4 A 65.7 15.8 A
Pea-Oat-Millet 12.5 3.3 A 69.1 16.6 A B
Pea-Oat-Turnip 13.4 3.0 A 59.1 14.2 A B C
Pea-Oat-Italian Ryegrass
14.1 3.6 A 58.2 14.0 B C D
Pea-Oat-Chicory 12.4 3.3 A 67.2 16.1 B C D
Pea-Oat-Millet-Turnip
10.7 2.4 A 56.7 13.6 B C D
Pea-Oat-Millet-Turnip-Italian Ryegrass-Chicory
11.7 2.8 A 59.1 14.2 C D
Pea-Oat-Blend 12.9 2.8 A 59.1 14.2 D
CV (%) 16.0 9.8 9.8
LSD (0.05) 3.63 8.23 1.98
* Treatments not marked with the same letter are statistically different from other treatments.
Pea-oatPea-oat-chicory
Pea-oat-Imperial
blend
Pea-oat-Italianrygrass
Pea-oat-millet
Pea-oat-millet-turnip
Pea-oat-millet-turnip-Italian
ryegrass-chicory
Pea-oat-turnip
Oat yield (bu/ac) 65.7 67.2 59.1 58.2 69.1 56.7 59.1 59.1
Pea yield (bu/ac) 15.8 16.1 14.2 14.0 16.6 13.6 14.2 14.2
65.7 67.2
59.1 58.2
69.1
56.759.1 59.1
15.8 16.1 14.2 14.016.6
13.6 14.2 14.2
0
10
20
30
40
50
60
70
80Y
ield
(b
u/a
c)
Treatment
Parkland Crop Diversification Foundation Annual Report 2020 22
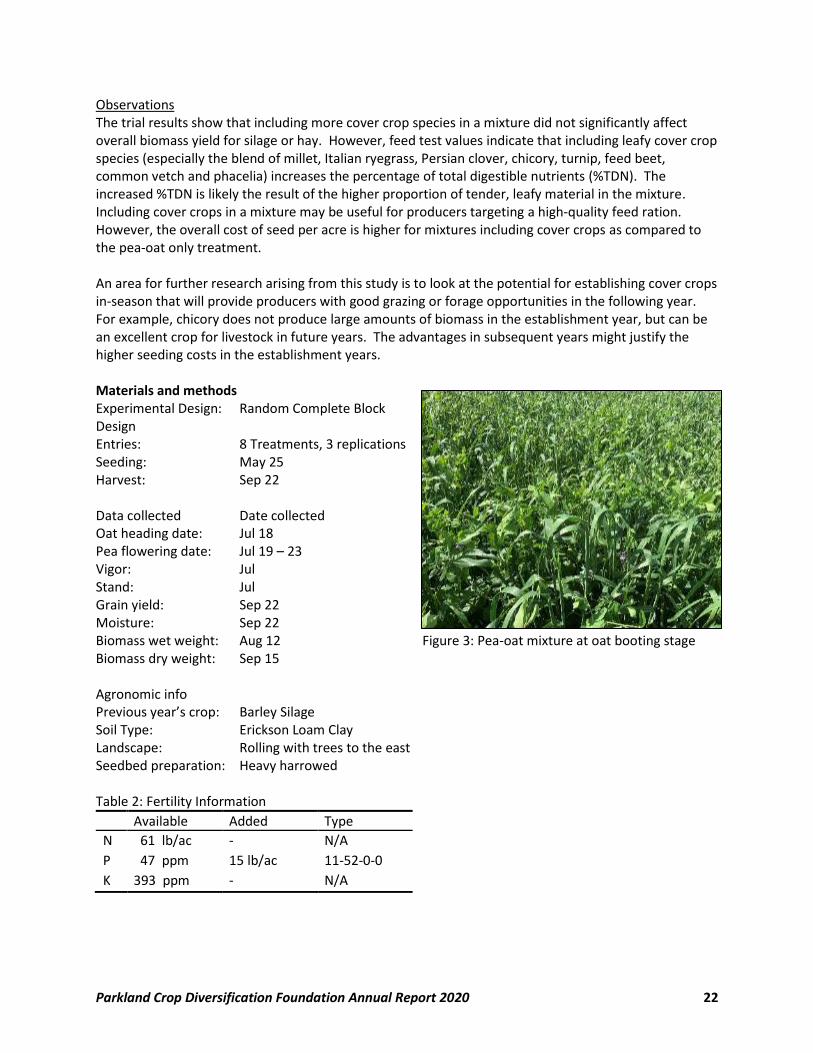
Observations The trial results show that including more cover crop species in a mixture did not significantly affect overall biomass yield for silage or hay. However, feed test values indicate that including leafy cover crop species (especially the blend of millet, Italian ryegrass, Persian clover, chicory, turnip, feed beet, common vetch and phacelia) increases the percentage of total digestible nutrients (%TDN). The increased %TDN is likely the result of the higher proportion of tender, leafy material in the mixture. Including cover crops in a mixture may be useful for producers targeting a high-quality feed ration. However, the overall cost of seed per acre is higher for mixtures including cover crops as compared to the pea-oat only treatment. An area for further research arising from this study is to look at the potential for establishing cover crops in-season that will provide producers with good grazing or forage opportunities in the following year. For example, chicory does not produce large amounts of biomass in the establishment year, but can be an excellent crop for livestock in future years. The advantages in subsequent years might justify the higher seeding costs in the establishment years. Materials and methods Experimental Design: Random Complete Block Design Entries: 8 Treatments, 3 replications Seeding: May 25 Harvest: Sep 22 Data collected Date collected Oat heading date: Jul 18 Pea flowering date: Jul 19 – 23 Vigor: Jul Stand: Jul Grain yield: Sep 22 Moisture: Sep 22 Biomass wet weight: Aug 12 Figure 3: Pea-oat mixture at oat booting stage Biomass dry weight: Sep 15 Agronomic info Previous year’s crop: Barley Silage Soil Type: Erickson Loam Clay Landscape: Rolling with trees to the east Seedbed preparation: Heavy harrowed Table 2: Fertility Information
Available Added Type
N 61 lb/ac - N/A
P 47 ppm 15 lb/ac 11-52-0-0
K 393 ppm - N/A
Parkland Crop Diversification Foundation Annual Report 2020 23
Flax Trials
Parkland Crop Diversification Foundation Annual Report 2020 24
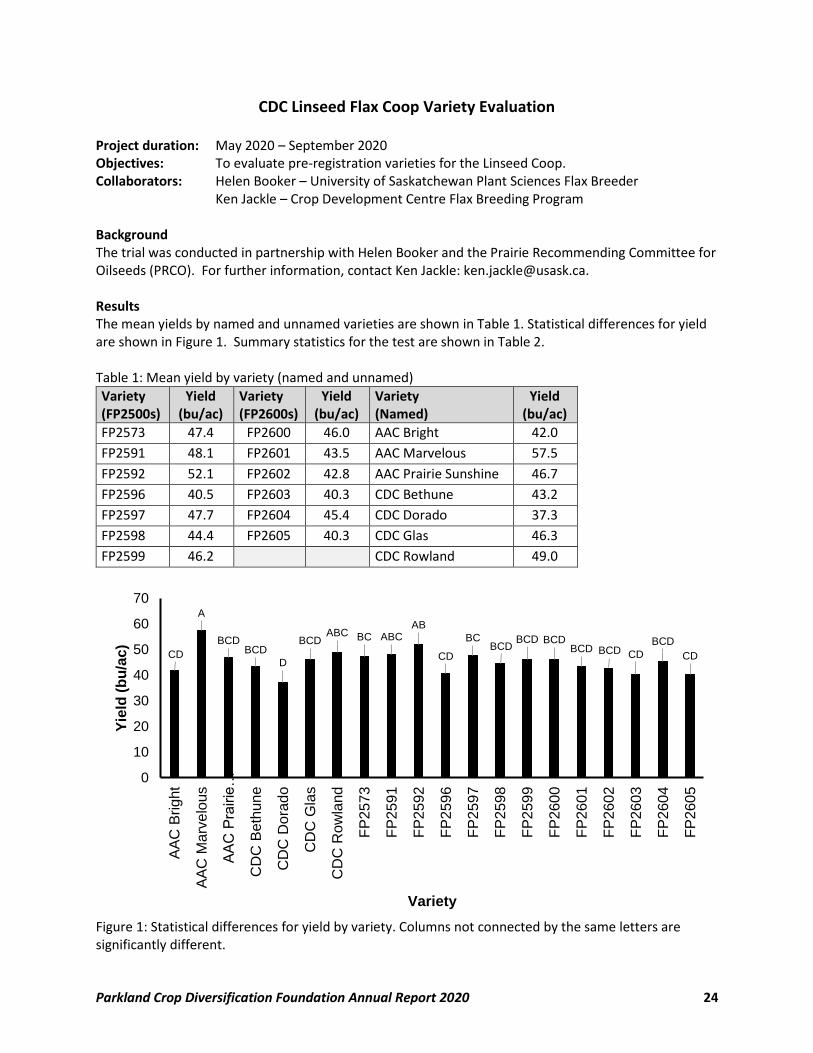
CDC Linseed Flax Coop Variety Evaluation Project duration: May 2020 – September 2020 Objectives: To evaluate pre-registration varieties for the Linseed Coop. Collaborators: Helen Booker – University of Saskatchewan Plant Sciences Flax Breeder Ken Jackle – Crop Development Centre Flax Breeding Program Background The trial was conducted in partnership with Helen Booker and the Prairie Recommending Committee for Oilseeds (PRCO). For further information, contact Ken Jackle: [email protected]. Results The mean yields by named and unnamed varieties are shown in Table 1. Statistical differences for yield are shown in Figure 1. Summary statistics for the test are shown in Table 2. Table 1: Mean yield by variety (named and unnamed)
Variety (FP2500s)
Yield (bu/ac)
Variety (FP2600s)
Yield (bu/ac)
Variety (Named)
Yield (bu/ac)
FP2573 47.4 FP2600 46.0 AAC Bright 42.0
FP2591 48.1 FP2601 43.5 AAC Marvelous 57.5
FP2592 52.1 FP2602 42.8 AAC Prairie Sunshine 46.7
FP2596 40.5 FP2603 40.3 CDC Bethune 43.2
FP2597 47.7 FP2604 45.4 CDC Dorado 37.3
FP2598 44.4 FP2605 40.3 CDC Glas 46.3
FP2599 46.2 CDC Rowland 49.0
Figure 1: Statistical differences for yield by variety. Columns not connected by the same letters are significantly different.
CD
A
BCDBCD
D
BCDABC BC ABC
AB
CD
BCBCD
BCD BCDBCD BCD CD
BCD
CD
0
10
20
30
40
50
60
70
AA
C B
rig
ht
AA
C M
arv
elo
us
AA
C P
rairie
…
CD
C B
eth
une
CD
C D
ora
do
CD
C G
las
CD
C R
ow
land
FP
257
3
FP
259
1
FP
259
2
FP
259
6
FP
259
7
FP
259
8
FP
259
9
FP
260
0
FP
260
1
FP
260
2
FP
260
3
FP
260
4
FP
2605
Yie
ld (
bu
/ac)
Variety
Parkland Crop Diversification Foundation Annual Report 2020 25
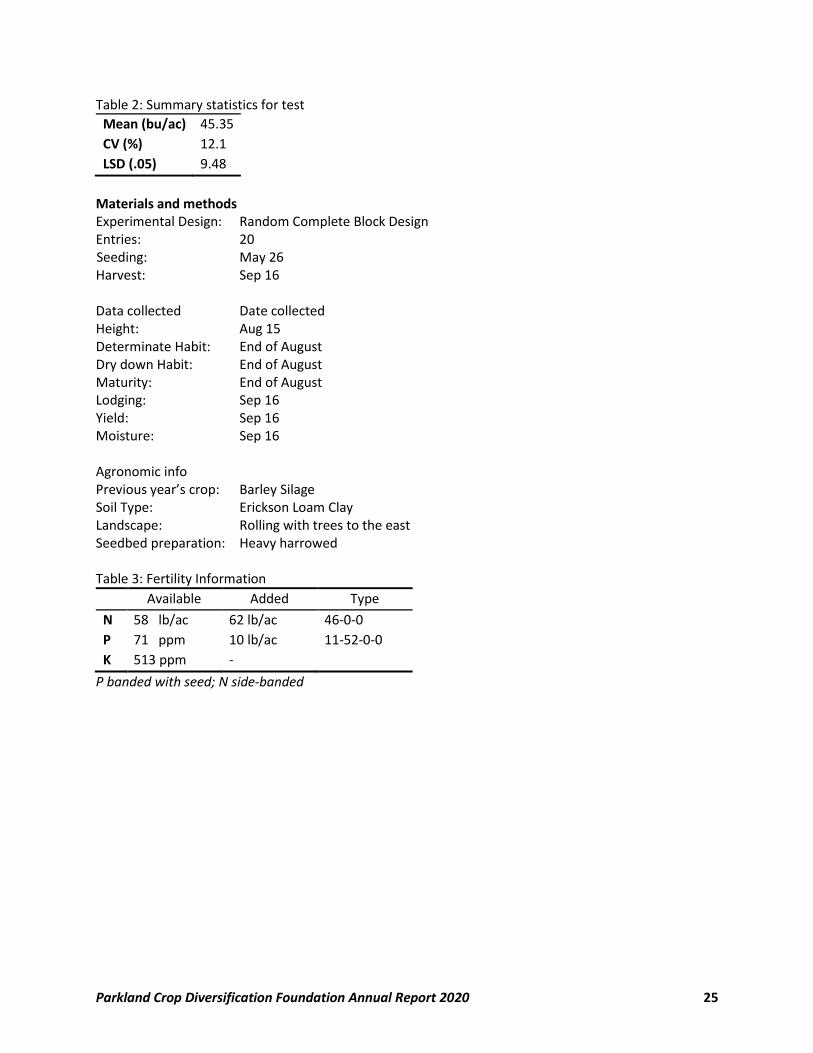
Table 2: Summary statistics for test
Mean (bu/ac) 45.35
CV (%) 12.1
LSD (.05) 9.48
Materials and methods Experimental Design: Random Complete Block Design Entries: 20
Seeding: May 26 Harvest: Sep 16 Data collected Date collected Height: Aug 15 Determinate Habit: End of August Dry down Habit: End of August Maturity: End of August Lodging: Sep 16 Yield: Sep 16 Moisture: Sep 16 Agronomic info Previous year’s crop: Barley Silage Soil Type: Erickson Loam Clay Landscape: Rolling with trees to the east Seedbed preparation: Heavy harrowed Table 3: Fertility Information
Available Added Type
N 58 lb/ac 62 lb/ac 46-0-0
P 71 ppm 10 lb/ac 11-52-0-0
K 513 ppm -
P banded with seed; N side-banded
Parkland Crop Diversification Foundation Annual Report 2020 26
Flax Herbicide Evaluation (Adapted from a report by Justice Zhanda, WADO)
Project duration: May 2020 - Sept 2020 Objectives: To compare the efficacy of Authority (standard treatment) to Armezon
(experimental treatment) for crop and weed efficacy, and to observe any safety
concerns with herbicide combinations.
Collaborators: Jeannette Gaultier BASF Eric Fridfinnson MFGA Scott Chalmers, WADO Nirmal Hari, PESAI Background Flax (Linum usitatissimum) is an important crop known for its value in food and fibre industrial markets
around the world. However, flax has a low competitive ability with weeds compared to other crops is
recommended to be grown on relatively weed free fields. Various weed management strategies that
include; competitive varieties, early seeding, increased seeding rates and the use of pre and post
emergence herbicides can help to effectively control weeds and reduce yield loss than employing one
control factor alone (Kurtenbach et al., 2019). Preemergence weed control is crucial in flax to reduce
yield loss since flax is a weak competitor with weeds (Berglund and Zollinger, 2007). Post emergence
weed control, if done soon after weed emergence to small weeds and flax seedlings, usually results in
better control and allow more time for flax recovery from possible herbicide injury than when herbicides
are applied to larger weeds and flax later on in the growing season. There is currently a challenge in
herbicide options for flax as a result of herbicide resistance. Furthermore, concerns for herbicide injury
on flax with the use of different herbicide combinations need to be examined. There is need to
investigate possible alternative options, combinations and timing of application for control of both
broad leaf weeds and grasses. Armezon® herbicide, which is classified as Group 27, is an effective tank-
mix option that is currently registered as a post emergence herbicide for control tough broad leaf weeds
and grasses in corn and has potential for use in flax for control of Group 1 resistant grasses due to its
suppression effect on grasses (Table 1). Currently, the herbicide is not registered for use in flax but
extensive field trials can provide for a pathway to registration and this will benefit flax producers.
Therefore, this study seeks to evaluate several herbicides including Authority, Mextrol, Koril, Select and
experimental Armezon used alone or tank mixed with compatible herbicides in flax in order to
effectively control resistant weeds and reduce yield losses as a result. The study also seeks to evaluate
any safety concerns with the use of different herbicide mixes in flax.
Parkland Crop Diversification Foundation Annual Report 2020 27
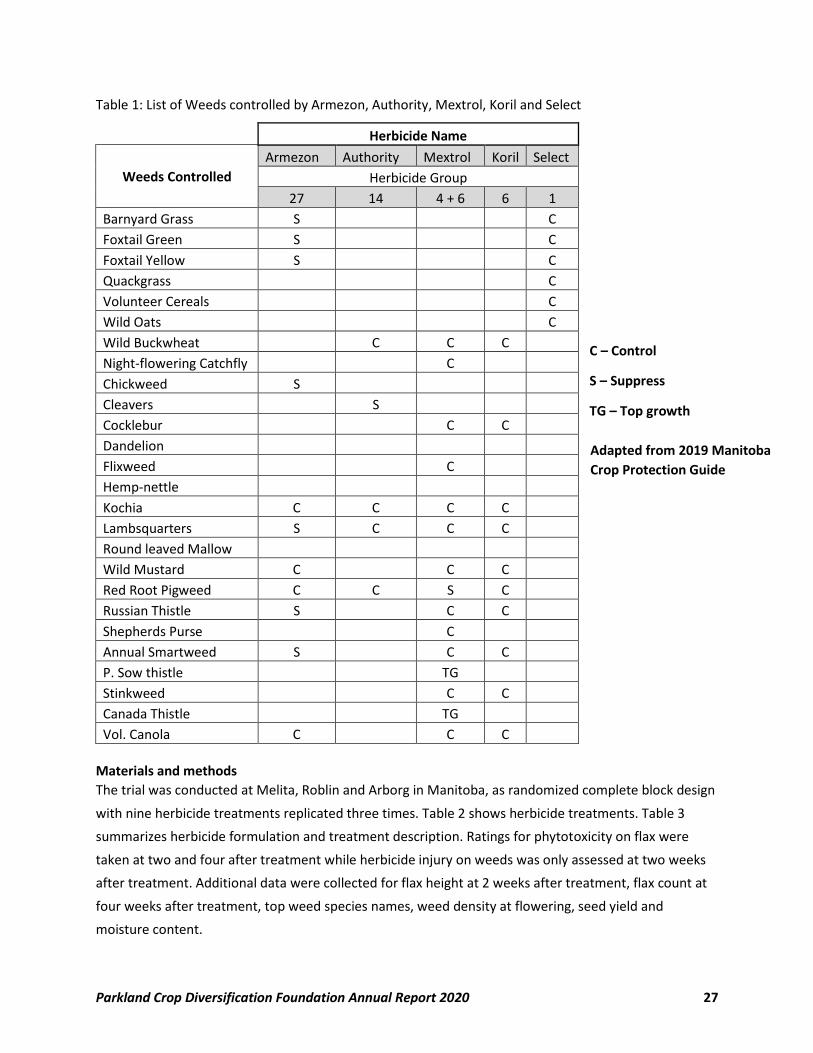
Table 1: List of Weeds controlled by Armezon, Authority, Mextrol, Koril and Select
Herbicide Name
Weeds Controlled
Armezon Authority Mextrol Koril Select
Herbicide Group
27 14 4 + 6 6 1
Barnyard Grass S C
Foxtail Green S C
Foxtail Yellow S C
Quackgrass C
Volunteer Cereals C
Wild Oats C
Wild Buckwheat C C C
Night-flowering Catchfly C
Chickweed S
Cleavers S
Cocklebur C C
Dandelion
Flixweed C
Hemp-nettle
Kochia C C C C
Lambsquarters S C C C
Round leaved Mallow
Wild Mustard C C C
Red Root Pigweed C C S C
Russian Thistle S C C
Shepherds Purse C
Annual Smartweed S C C
P. Sow thistle TG
Stinkweed C C
Canada Thistle TG
Vol. Canola C C C
Materials and methods
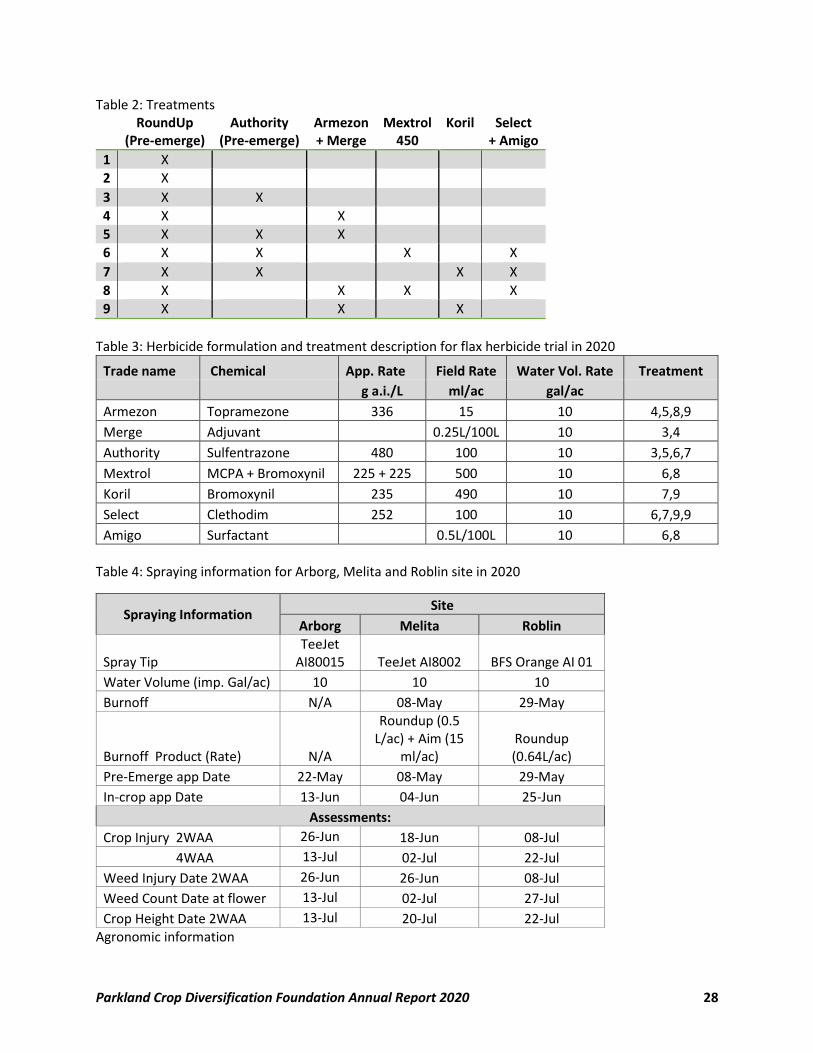
The trial was conducted at Melita, Roblin and Arborg in Manitoba, as randomized complete block design
with nine herbicide treatments replicated three times. Table 2 shows herbicide treatments. Table 3
summarizes herbicide formulation and treatment description. Ratings for phytotoxicity on flax were
taken at two and four after treatment while herbicide injury on weeds was only assessed at two weeks
after treatment. Additional data were collected for flax height at 2 weeks after treatment, flax count at
four weeks after treatment, top weed species names, weed density at flowering, seed yield and
moisture content.
C – Control
S – Suppress
TG – Top growth
Adapted from 2019 Manitoba
Crop Protection Guide
Parkland Crop Diversification Foundation Annual Report 2020 28
Table 2: Treatments RoundUp
(Pre-emerge) Authority
(Pre-emerge) Armezon + Merge
Mextrol 450
Koril Select + Amigo
1 X 2 X
3 X X
4 X X
5 X X X 6 X X X X
7 X X X X
8 X X X X 9 X X X
Table 3: Herbicide formulation and treatment description for flax herbicide trial in 2020
Trade name Chemical App. Rate Field Rate Water Vol. Rate Treatment
g a.i./L ml/ac gal/ac
Armezon Topramezone 336 15 10 4,5,8,9
Merge Adjuvant 0.25L/100L 10 3,4
Authority Sulfentrazone 480 100 10 3,5,6,7
Mextrol MCPA + Bromoxynil 225 + 225 500 10 6,8
Koril Bromoxynil 235 490 10 7,9
Select Clethodim 252 100 10 6,7,9,9
Amigo Surfactant 0.5L/100L 10 6,8
Table 4: Spraying information for Arborg, Melita and Roblin site in 2020
Spraying Information Site
Arborg Melita Roblin
Spray Tip TeeJet
AI80015 TeeJet AI8002 BFS Orange AI 01
Water Volume (imp. Gal/ac) 10 10 10
Burnoff N/A 08-May 29-May
Burnoff Product (Rate) N/A
Roundup (0.5 L/ac) + Aim (15
ml/ac) Roundup (0.64L/ac)
Pre-Emerge app Date 22-May 08-May 29-May
In-crop app Date 13-Jun 04-Jun 25-Jun
Assessments:
Crop Injury 2WAA 26-Jun 18-Jun 08-Jul
4WAA 13-Jul 02-Jul 22-Jul
Weed Injury Date 2WAA 26-Jun 26-Jun 08-Jul
Weed Count Date at flower 13-Jul 02-Jul 27-Jul
Crop Height Date 2WAA 13-Jul 20-Jul 22-Jul Agronomic information
Parkland Crop Diversification Foundation Annual Report 2020 29
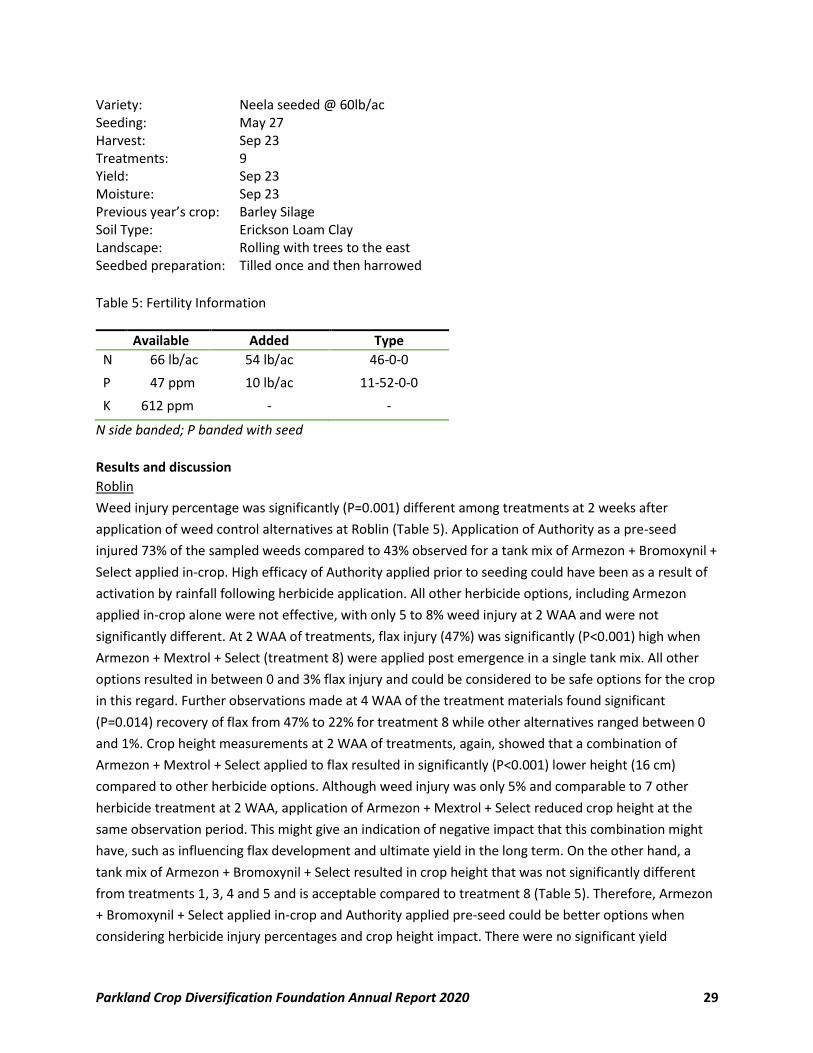
Variety: Neela seeded @ 60lb/ac Seeding: May 27 Harvest: Sep 23 Treatments: 9 Yield: Sep 23 Moisture: Sep 23 Previous year’s crop: Barley Silage Soil Type: Erickson Loam Clay Landscape: Rolling with trees to the east Seedbed preparation: Tilled once and then harrowed
Table 5: Fertility Information
Available Added Type
N 66 lb/ac 54 lb/ac 46-0-0
P 47 ppm 10 lb/ac 11-52-0-0
K 612 ppm - -
N side banded; P banded with seed
Results and discussion
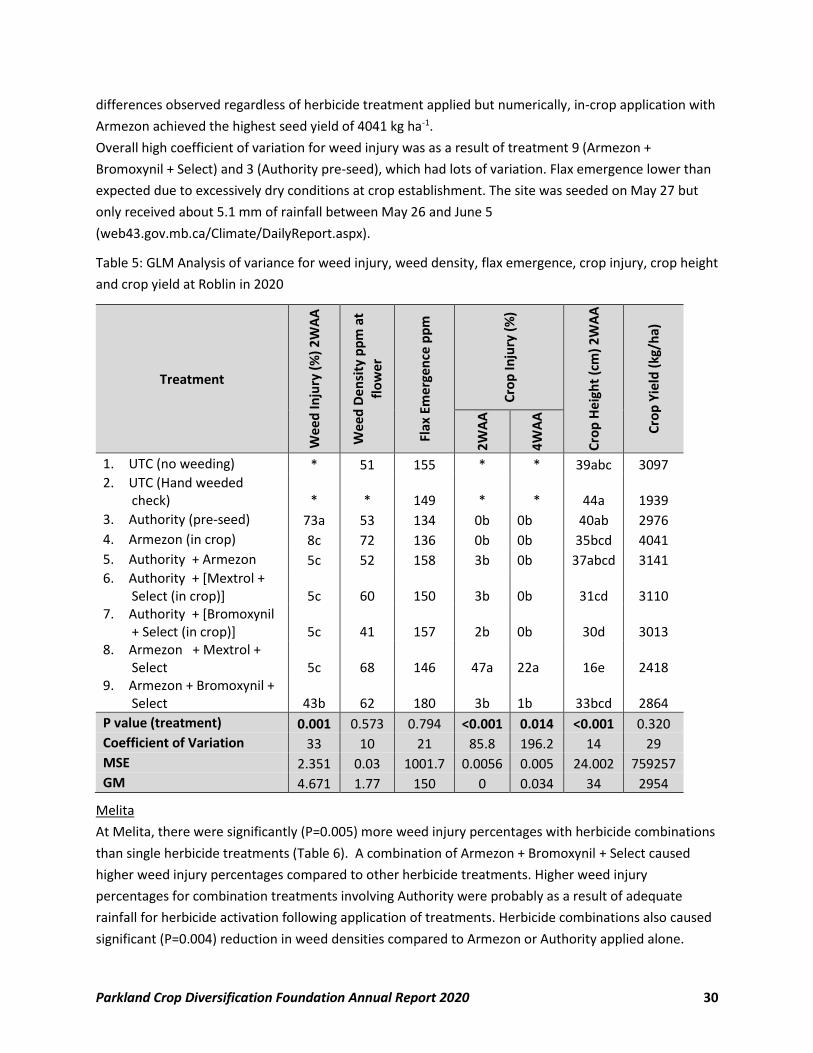
Roblin
Weed injury percentage was significantly (P=0.001) different among treatments at 2 weeks after
application of weed control alternatives at Roblin (Table 5). Application of Authority as a pre-seed
injured 73% of the sampled weeds compared to 43% observed for a tank mix of Armezon + Bromoxynil +
Select applied in-crop. High efficacy of Authority applied prior to seeding could have been as a result of
activation by rainfall following herbicide application. All other herbicide options, including Armezon
applied in-crop alone were not effective, with only 5 to 8% weed injury at 2 WAA and were not
significantly different. At 2 WAA of treatments, flax injury (47%) was significantly (P<0.001) high when
Armezon + Mextrol + Select (treatment 8) were applied post emergence in a single tank mix. All other
options resulted in between 0 and 3% flax injury and could be considered to be safe options for the crop
in this regard. Further observations made at 4 WAA of the treatment materials found significant
(P=0.014) recovery of flax from 47% to 22% for treatment 8 while other alternatives ranged between 0
and 1%. Crop height measurements at 2 WAA of treatments, again, showed that a combination of
Armezon + Mextrol + Select applied to flax resulted in significantly (P<0.001) lower height (16 cm)
compared to other herbicide options. Although weed injury was only 5% and comparable to 7 other
herbicide treatment at 2 WAA, application of Armezon + Mextrol + Select reduced crop height at the
same observation period. This might give an indication of negative impact that this combination might
have, such as influencing flax development and ultimate yield in the long term. On the other hand, a
tank mix of Armezon + Bromoxynil + Select resulted in crop height that was not significantly different
from treatments 1, 3, 4 and 5 and is acceptable compared to treatment 8 (Table 5). Therefore, Armezon
+ Bromoxynil + Select applied in-crop and Authority applied pre-seed could be better options when
considering herbicide injury percentages and crop height impact. There were no significant yield
Parkland Crop Diversification Foundation Annual Report 2020 30
differences observed regardless of herbicide treatment applied but numerically, in-crop application with
Armezon achieved the highest seed yield of 4041 kg ha-1.
Overall high coefficient of variation for weed injury was as a result of treatment 9 (Armezon +
Bromoxynil + Select) and 3 (Authority pre-seed), which had lots of variation. Flax emergence lower than
expected due to excessively dry conditions at crop establishment. The site was seeded on May 27 but
only received about 5.1 mm of rainfall between May 26 and June 5
(web43.gov.mb.ca/Climate/DailyReport.aspx).
Table 5: GLM Analysis of variance for weed injury, weed density, flax emergence, crop injury, crop height
and crop yield at Roblin in 2020
Treatment
We
ed
Inju
ry (
%)
2W
AA
We
ed
De
nsi
ty p
pm
at
flo
wer
Flax
Em
erg
ence
pp
m
Cro
p In
jury
(%
)
Cro
p H
eig
ht
(cm
) 2
WA
A
Cro
p Y
ield
(kg
/ha)
2W
AA
4W
AA
1. UTC (no weeding) * 51 155 * * 39abc 3097 2. UTC (Hand weeded
check) * * 149 * * 44a 1939
3. Authority (pre-seed) 73a 53 134 0b 0b 40ab 2976
4. Armezon (in crop) 8c 72 136 0b 0b 35bcd 4041
5. Authority + Armezon 5c 52 158 3b 0b 37abcd 3141 6. Authority + [Mextrol +
Select (in crop)] 5c 60 150 3b 0b 31cd 3110 7. Authority + [Bromoxynil
+ Select (in crop)] 5c 41 157 2b 0b 30d 3013 8. Armezon + Mextrol +
Select 5c 68 146 47a 22a 16e 2418 9. Armezon + Bromoxynil +
Select 43b 62 180 3b 1b 33bcd 2864
P value (treatment) 0.001 0.573 0.794 <0.001 0.014 <0.001 0.320
Coefficient of Variation 33 10 21 85.8 196.2 14 29
MSE 2.351 0.03 1001.7 0.0056 0.005 24.002 759257
GM 4.671 1.77 150 0 0.034 34 2954
Melita
At Melita, there were significantly (P=0.005) more weed injury percentages with herbicide combinations
than single herbicide treatments (Table 6). A combination of Armezon + Bromoxynil + Select caused
higher weed injury percentages compared to other herbicide treatments. Higher weed injury
percentages for combination treatments involving Authority were probably as a result of adequate
rainfall for herbicide activation following application of treatments. Herbicide combinations also caused
significant (P=0.004) reduction in weed densities compared to Armezon or Authority applied alone.
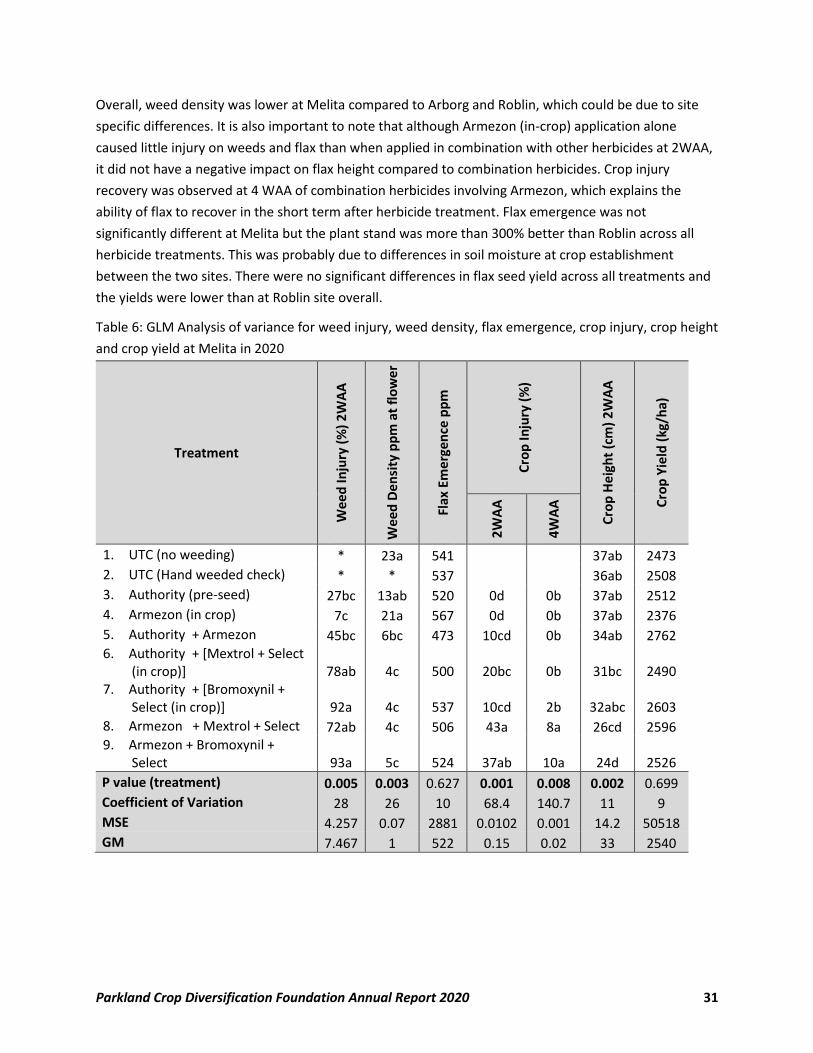
Parkland Crop Diversification Foundation Annual Report 2020 31
Overall, weed density was lower at Melita compared to Arborg and Roblin, which could be due to site
specific differences. It is also important to note that although Armezon (in-crop) application alone
caused little injury on weeds and flax than when applied in combination with other herbicides at 2WAA,
it did not have a negative impact on flax height compared to combination herbicides. Crop injury
recovery was observed at 4 WAA of combination herbicides involving Armezon, which explains the
ability of flax to recover in the short term after herbicide treatment. Flax emergence was not
significantly different at Melita but the plant stand was more than 300% better than Roblin across all
herbicide treatments. This was probably due to differences in soil moisture at crop establishment
between the two sites. There were no significant differences in flax seed yield across all treatments and
the yields were lower than at Roblin site overall.
Table 6: GLM Analysis of variance for weed injury, weed density, flax emergence, crop injury, crop height
and crop yield at Melita in 2020
Treatment
We
ed
Inju
ry (
%)
2W
AA
We
ed
De
nsi
ty p
pm
at
flo
wer
Flax
Em
erg
en
ce p
pm
Cro
p In
jury
(%
)
Cro
p H
eig
ht
(cm
) 2
WA
A
Cro
p Y
ield
(kg
/ha)
2W
AA
4W
AA
1. UTC (no weeding) * 23a 541 37ab 2473
2. UTC (Hand weeded check) * * 537 36ab 2508
3. Authority (pre-seed) 27bc 13ab 520 0d 0b 37ab 2512
4. Armezon (in crop) 7c 21a 567 0d 0b 37ab 2376
5. Authority + Armezon 45bc 6bc 473 10cd 0b 34ab 2762 6. Authority + [Mextrol + Select
(in crop)] 78ab 4c 500 20bc 0b 31bc 2490 7. Authority + [Bromoxynil +
Select (in crop)] 92a 4c 537 10cd 2b 32abc 2603
8. Armezon + Mextrol + Select 72ab 4c 506 43a 8a 26cd 2596 9. Armezon + Bromoxynil +
Select 93a 5c 524 37ab 10a 24d 2526
P value (treatment) 0.005 0.003 0.627 0.001 0.008 0.002 0.699
Coefficient of Variation 28 26 10 68.4 140.7 11 9
MSE 4.257 0.07 2881 0.0102 0.001 14.2 50518
GM 7.467 1 522 0.15 0.02 33 2540
Parkland Crop Diversification Foundation Annual Report 2020 32
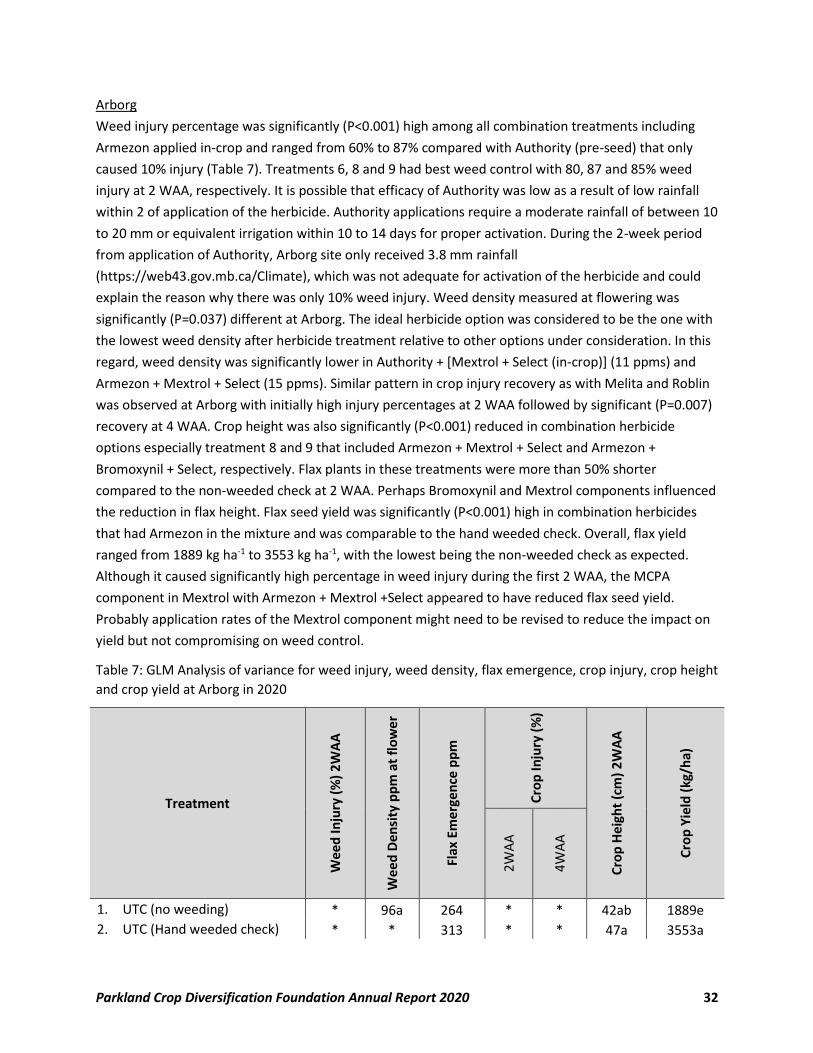
Arborg
Weed injury percentage was significantly (P<0.001) high among all combination treatments including
Armezon applied in-crop and ranged from 60% to 87% compared with Authority (pre-seed) that only
caused 10% injury (Table 7). Treatments 6, 8 and 9 had best weed control with 80, 87 and 85% weed
injury at 2 WAA, respectively. It is possible that efficacy of Authority was low as a result of low rainfall
within 2 of application of the herbicide. Authority applications require a moderate rainfall of between 10
to 20 mm or equivalent irrigation within 10 to 14 days for proper activation. During the 2-week period
from application of Authority, Arborg site only received 3.8 mm rainfall
(https://web43.gov.mb.ca/Climate), which was not adequate for activation of the herbicide and could
explain the reason why there was only 10% weed injury. Weed density measured at flowering was
significantly (P=0.037) different at Arborg. The ideal herbicide option was considered to be the one with
the lowest weed density after herbicide treatment relative to other options under consideration. In this
regard, weed density was significantly lower in Authority + [Mextrol + Select (in-crop)] (11 ppms) and
Armezon + Mextrol + Select (15 ppms). Similar pattern in crop injury recovery as with Melita and Roblin
was observed at Arborg with initially high injury percentages at 2 WAA followed by significant (P=0.007)
recovery at 4 WAA. Crop height was also significantly (P<0.001) reduced in combination herbicide
options especially treatment 8 and 9 that included Armezon + Mextrol + Select and Armezon +
Bromoxynil + Select, respectively. Flax plants in these treatments were more than 50% shorter
compared to the non-weeded check at 2 WAA. Perhaps Bromoxynil and Mextrol components influenced
the reduction in flax height. Flax seed yield was significantly (P<0.001) high in combination herbicides
that had Armezon in the mixture and was comparable to the hand weeded check. Overall, flax yield
ranged from 1889 kg ha-1 to 3553 kg ha-1, with the lowest being the non-weeded check as expected.
Although it caused significantly high percentage in weed injury during the first 2 WAA, the MCPA
component in Mextrol with Armezon + Mextrol +Select appeared to have reduced flax seed yield.
Probably application rates of the Mextrol component might need to be revised to reduce the impact on
yield but not compromising on weed control.
Table 7: GLM Analysis of variance for weed injury, weed density, flax emergence, crop injury, crop height
and crop yield at Arborg in 2020
Treatment
Wee
d In
jury
(%
) 2
WA
A
Wee
d D
en
sity
pp
m a
t fl
ow
er
Flax
Em
erge
nce
pp
m
Cro
p In
jury
(%
)
Cro
p H
eig
ht
(cm
) 2
WA
A
Cro
p Y
ield
(kg
/ha)
2W
AA
4W
AA
1. UTC (no weeding) * 96a 264 * * 42ab 1889e
2. UTC (Hand weeded check) * * 313 * * 47a 3553a
Parkland Crop Diversification Foundation Annual Report 2020 33
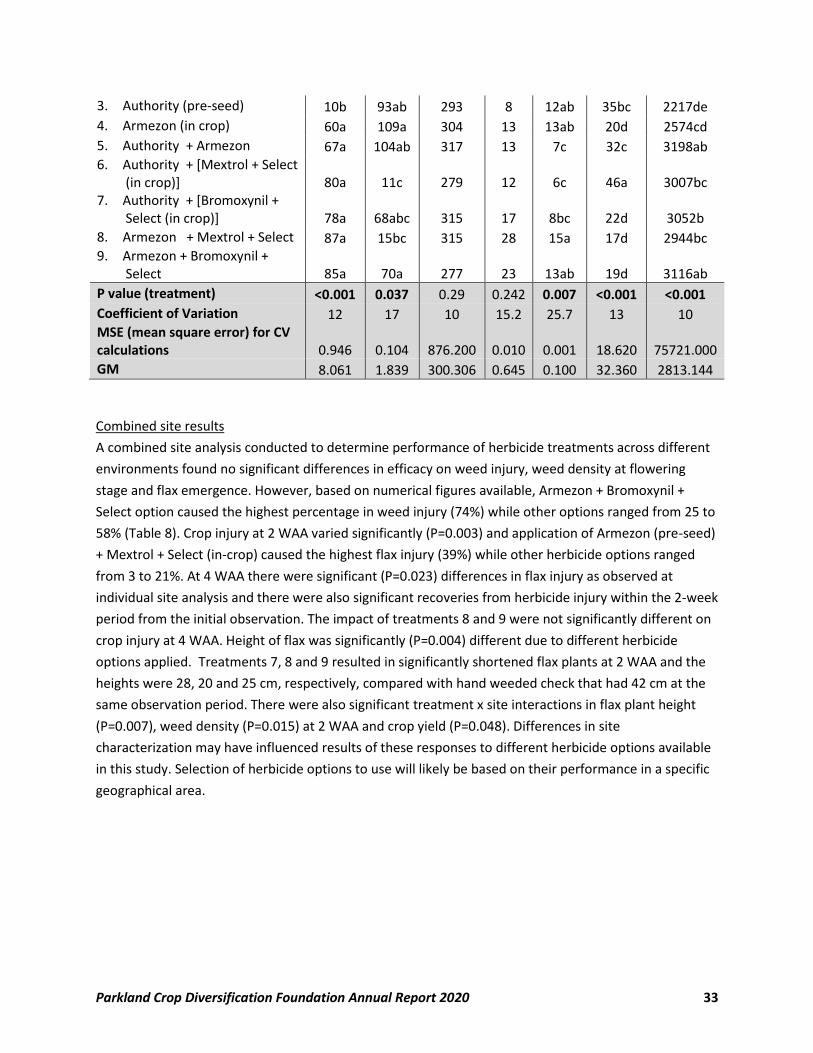
3. Authority (pre-seed) 10b 93ab 293 8 12ab 35bc 2217de
4. Armezon (in crop) 60a 109a 304 13 13ab 20d 2574cd
5. Authority + Armezon 67a 104ab 317 13 7c 32c 3198ab 6. Authority + [Mextrol + Select
(in crop)] 80a 11c 279 12 6c 46a 3007bc 7. Authority + [Bromoxynil +
Select (in crop)] 78a 68abc 315 17 8bc 22d 3052b
8. Armezon + Mextrol + Select 87a 15bc 315 28 15a 17d 2944bc 9. Armezon + Bromoxynil +
Select 85a 70a 277 23 13ab 19d 3116ab
P value (treatment) <0.001 0.037 0.29 0.242 0.007 <0.001 <0.001
Coefficient of Variation 12 17 10 15.2 25.7 13 10 MSE (mean square error) for CV calculations 0.946 0.104 876.200 0.010 0.001 18.620 75721.000
GM 8.061 1.839 300.306 0.645 0.100 32.360 2813.144
Combined site results
A combined site analysis conducted to determine performance of herbicide treatments across different
environments found no significant differences in efficacy on weed injury, weed density at flowering
stage and flax emergence. However, based on numerical figures available, Armezon + Bromoxynil +
Select option caused the highest percentage in weed injury (74%) while other options ranged from 25 to
58% (Table 8). Crop injury at 2 WAA varied significantly (P=0.003) and application of Armezon (pre-seed)
+ Mextrol + Select (in-crop) caused the highest flax injury (39%) while other herbicide options ranged
from 3 to 21%. At 4 WAA there were significant (P=0.023) differences in flax injury as observed at
individual site analysis and there were also significant recoveries from herbicide injury within the 2-week
period from the initial observation. The impact of treatments 8 and 9 were not significantly different on
crop injury at 4 WAA. Height of flax was significantly (P=0.004) different due to different herbicide
options applied. Treatments 7, 8 and 9 resulted in significantly shortened flax plants at 2 WAA and the
heights were 28, 20 and 25 cm, respectively, compared with hand weeded check that had 42 cm at the
same observation period. There were also significant treatment x site interactions in flax plant height
(P=0.007), weed density (P=0.015) at 2 WAA and crop yield (P=0.048). Differences in site
characterization may have influenced results of these responses to different herbicide options available
in this study. Selection of herbicide options to use will likely be based on their performance in a specific
geographical area.
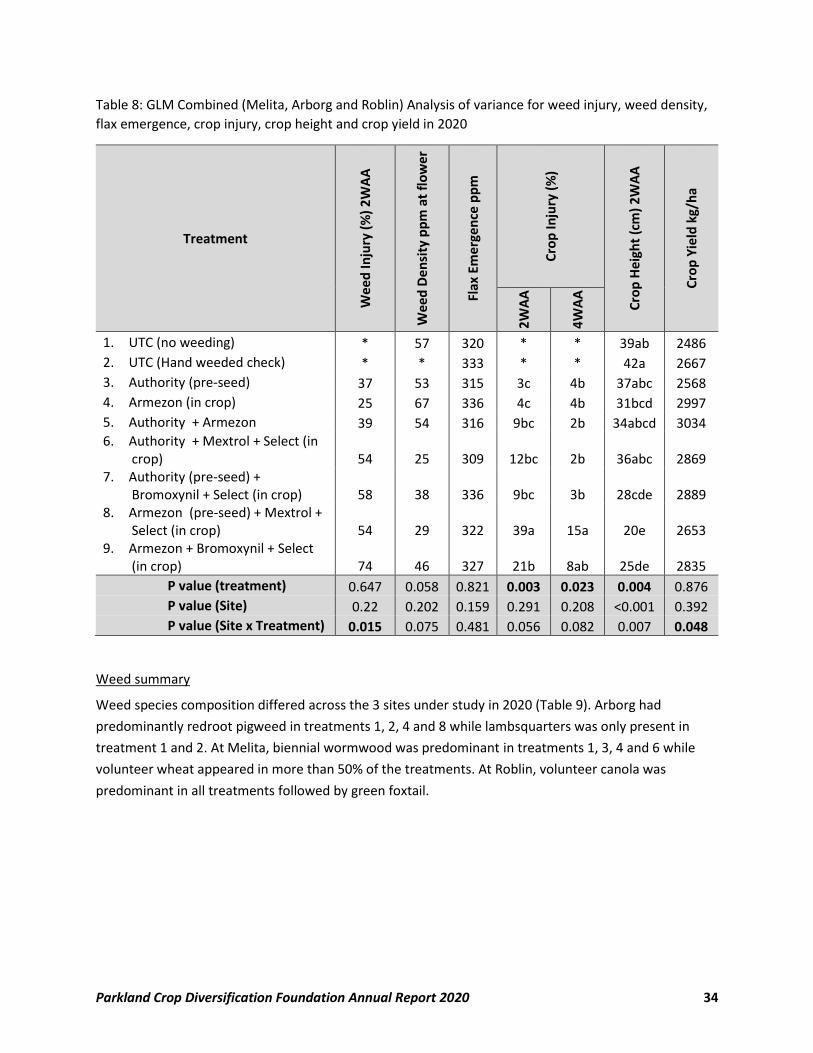
Parkland Crop Diversification Foundation Annual Report 2020 34
Table 8: GLM Combined (Melita, Arborg and Roblin) Analysis of variance for weed injury, weed density,
flax emergence, crop injury, crop height and crop yield in 2020
Treatment
Wee
d In
jury
(%
) 2
WA
A
Wee
d D
en
sity
pp
m a
t fl
ow
er
Flax
Em
erge
nce
pp
m
Cro
p In
jury
(%
)
Cro
p H
eig
ht
(cm
) 2
WA
A
Cro
p Y
ield
kg/
ha
2W
AA
4W
AA
1. UTC (no weeding) * 57 320 * * 39ab 2486
2. UTC (Hand weeded check) * * 333 * * 42a 2667
3. Authority (pre-seed) 37 53 315 3c 4b 37abc 2568
4. Armezon (in crop) 25 67 336 4c 4b 31bcd 2997
5. Authority + Armezon 39 54 316 9bc 2b 34abcd 3034 6. Authority + Mextrol + Select (in
crop) 54 25 309 12bc 2b 36abc 2869 7. Authority (pre-seed) +
Bromoxynil + Select (in crop) 58 38 336 9bc 3b 28cde 2889 8. Armezon (pre-seed) + Mextrol +
Select (in crop) 54 29 322 39a 15a 20e 2653 9. Armezon + Bromoxynil + Select
(in crop) 74 46 327 21b 8ab 25de 2835
P value (treatment) 0.647 0.058 0.821 0.003 0.023 0.004 0.876
P value (Site) 0.22 0.202 0.159 0.291 0.208 <0.001 0.392
P value (Site x Treatment) 0.015 0.075 0.481 0.056 0.082 0.007 0.048
Weed summary
Weed species composition differed across the 3 sites under study in 2020 (Table 9). Arborg had
predominantly redroot pigweed in treatments 1, 2, 4 and 8 while lambsquarters was only present in
treatment 1 and 2. At Melita, biennial wormwood was predominant in treatments 1, 3, 4 and 6 while
volunteer wheat appeared in more than 50% of the treatments. At Roblin, volunteer canola was
predominant in all treatments followed by green foxtail.
Parkland Crop Diversification Foundation Annual Report 2020 35
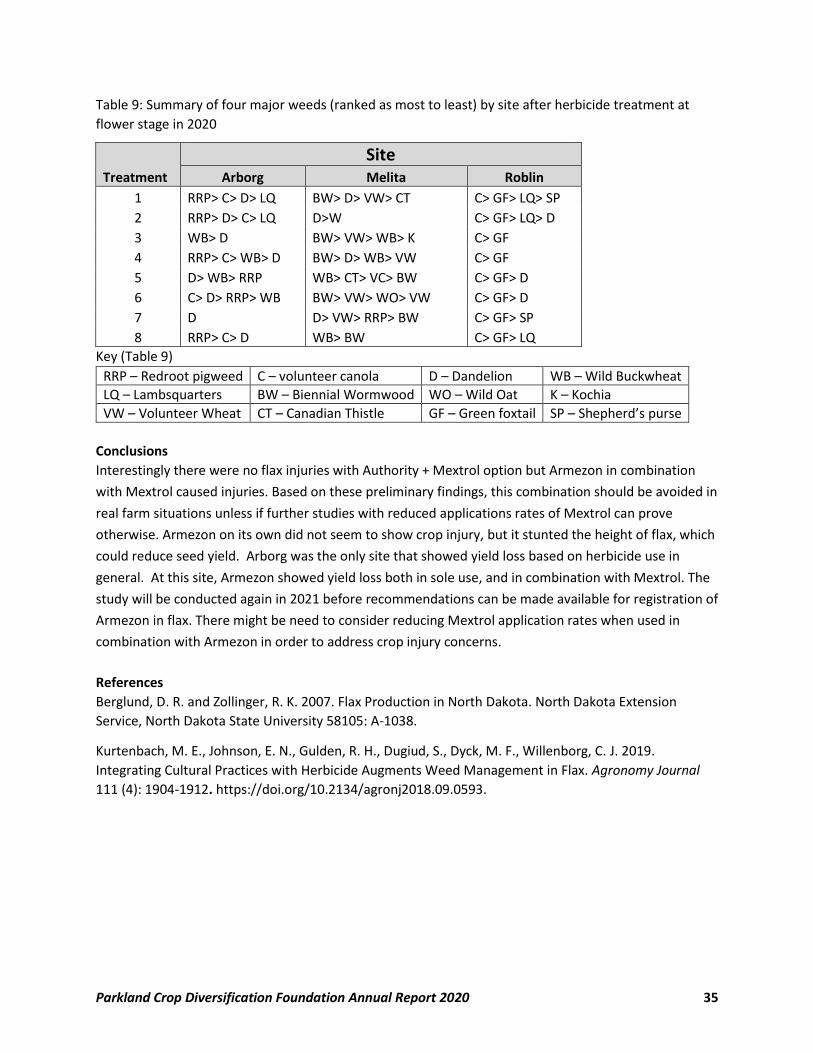
Table 9: Summary of four major weeds (ranked as most to least) by site after herbicide treatment at
flower stage in 2020
Treatment
Site Arborg Melita Roblin
1 RRP> C> D> LQ BW> D> VW> CT C> GF> LQ> SP
2 RRP> D> C> LQ D>W C> GF> LQ> D
3 WB> D BW> VW> WB> K C> GF
4 RRP> C> WB> D BW> D> WB> VW C> GF
5 D> WB> RRP WB> CT> VC> BW C> GF> D
6 C> D> RRP> WB BW> VW> WO> VW C> GF> D
7 D D> VW> RRP> BW C> GF> SP
8 RRP> C> D WB> BW C> GF> LQ
Key (Table 9)
RRP – Redroot pigweed C – volunteer canola D – Dandelion WB – Wild Buckwheat
LQ – Lambsquarters BW – Biennial Wormwood WO – Wild Oat K – Kochia
VW – Volunteer Wheat CT – Canadian Thistle GF – Green foxtail SP – Shepherd’s purse
Conclusions Interestingly there were no flax injuries with Authority + Mextrol option but Armezon in combination
with Mextrol caused injuries. Based on these preliminary findings, this combination should be avoided in
real farm situations unless if further studies with reduced applications rates of Mextrol can prove
otherwise. Armezon on its own did not seem to show crop injury, but it stunted the height of flax, which
could reduce seed yield. Arborg was the only site that showed yield loss based on herbicide use in
general. At this site, Armezon showed yield loss both in sole use, and in combination with Mextrol. The
study will be conducted again in 2021 before recommendations can be made available for registration of
Armezon in flax. There might be need to consider reducing Mextrol application rates when used in
combination with Armezon in order to address crop injury concerns.
References
Berglund, D. R. and Zollinger, R. K. 2007. Flax Production in North Dakota. North Dakota Extension
Service, North Dakota State University 58105: A-1038.
Kurtenbach, M. E., Johnson, E. N., Gulden, R. H., Dugiud, S., Dyck, M. F., Willenborg, C. J. 2019.
Integrating Cultural Practices with Herbicide Augments Weed Management in Flax. Agronomy Journal
111 (4): 1904-1912. https://doi.org/10.2134/agronj2018.09.0593.
Parkland Crop Diversification Foundation Annual Report 2020 36
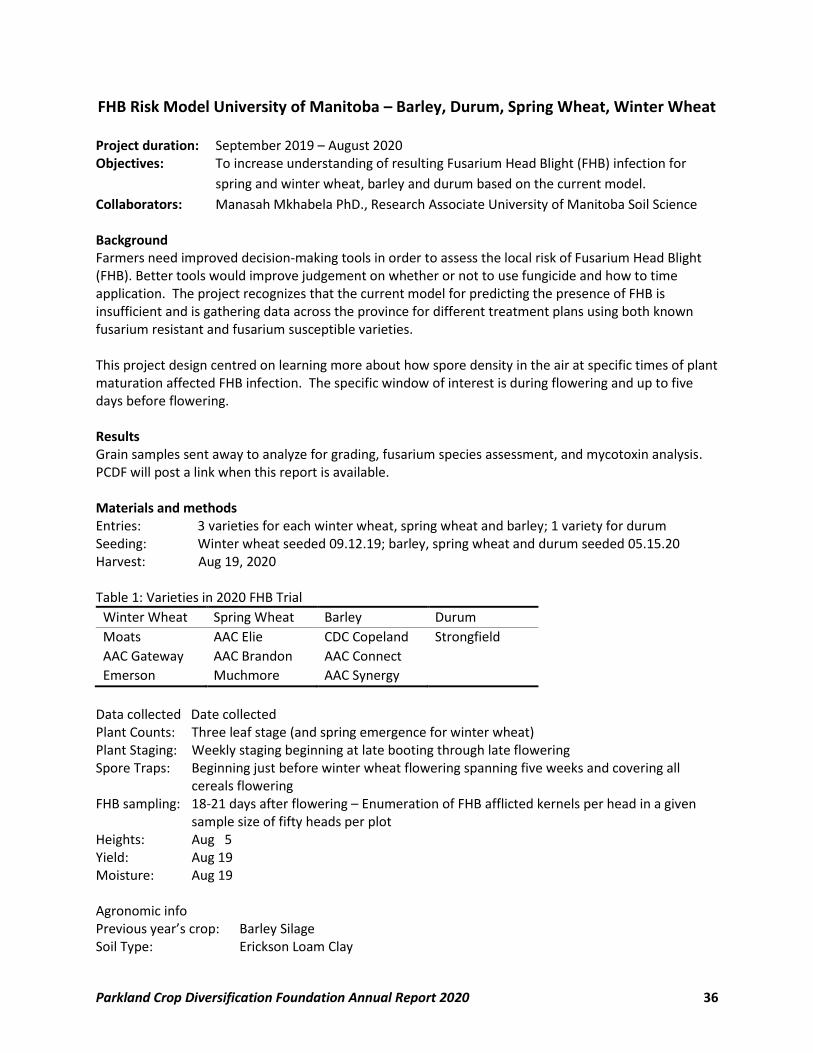
FHB Risk Model University of Manitoba – Barley, Durum, Spring Wheat, Winter Wheat Project duration: September 2019 – August 2020 Objectives: To increase understanding of resulting Fusarium Head Blight (FHB) infection for
spring and winter wheat, barley and durum based on the current model.
Collaborators: Manasah Mkhabela PhD., Research Associate University of Manitoba Soil Science Background Farmers need improved decision-making tools in order to assess the local risk of Fusarium Head Blight (FHB). Better tools would improve judgement on whether or not to use fungicide and how to time application. The project recognizes that the current model for predicting the presence of FHB is insufficient and is gathering data across the province for different treatment plans using both known fusarium resistant and fusarium susceptible varieties. This project design centred on learning more about how spore density in the air at specific times of plant maturation affected FHB infection. The specific window of interest is during flowering and up to five days before flowering. Results Grain samples sent away to analyze for grading, fusarium species assessment, and mycotoxin analysis. PCDF will post a link when this report is available. Materials and methods Entries: 3 varieties for each winter wheat, spring wheat and barley; 1 variety for durum Seeding: Winter wheat seeded 09.12.19; barley, spring wheat and durum seeded 05.15.20 Harvest: Aug 19, 2020 Table 1: Varieties in 2020 FHB Trial
Winter Wheat Spring Wheat Barley Durum
Moats AAC Elie CDC Copeland Strongfield
AAC Gateway AAC Brandon AAC Connect
Emerson Muchmore AAC Synergy
Data collected Date collected Plant Counts: Three leaf stage (and spring emergence for winter wheat) Plant Staging: Weekly staging beginning at late booting through late flowering Spore Traps: Beginning just before winter wheat flowering spanning five weeks and covering all
cereals flowering FHB sampling: 18-21 days after flowering – Enumeration of FHB afflicted kernels per head in a given
sample size of fifty heads per plot Heights: Aug 5 Yield: Aug 19 Moisture: Aug 19 Agronomic info Previous year’s crop: Barley Silage Soil Type: Erickson Loam Clay
Parkland Crop Diversification Foundation Annual Report 2020 37
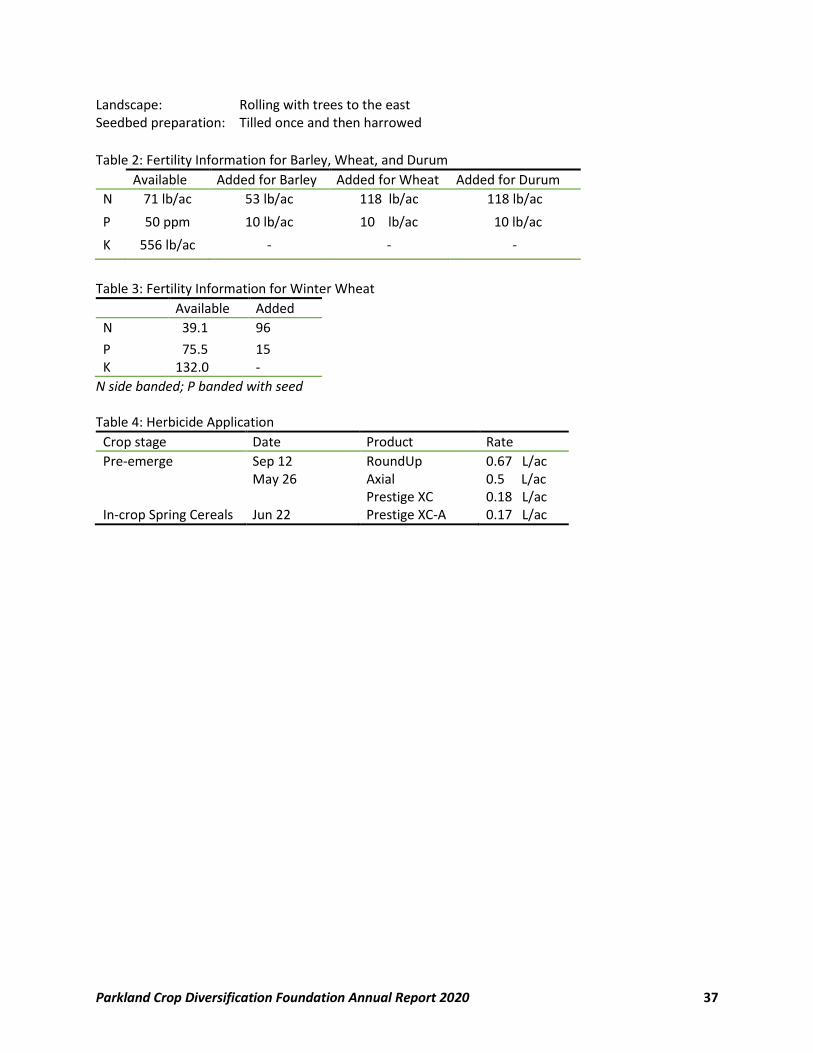
Landscape: Rolling with trees to the east Seedbed preparation: Tilled once and then harrowed
Table 2: Fertility Information for Barley, Wheat, and Durum
Available Added for Barley Added for Wheat Added for Durum
N 71 lb/ac 53 lb/ac 118 lb/ac 118 lb/ac
P 50 ppm 10 lb/ac 10 lb/ac 10 lb/ac
K 556 lb/ac - - -
Table 3: Fertility Information for Winter Wheat
Available Added
N 39.1 96
P 75.5 15 K 132.0 -
N side banded; P banded with seed Table 4: Herbicide Application
Crop stage Date Product Rate
Pre-emerge Sep 12 RoundUp 0.67 L/ac
May 26 Axial Prestige XC
0.5 L/ac 0.18 L/ac
In-crop Spring Cereals Jun 22 Prestige XC-A 0.17 L/ac
Parkland Crop Diversification Foundation Annual Report 2020 38
Hemp Trials
Parkland Crop Diversification Foundation Annual Report 2020 39
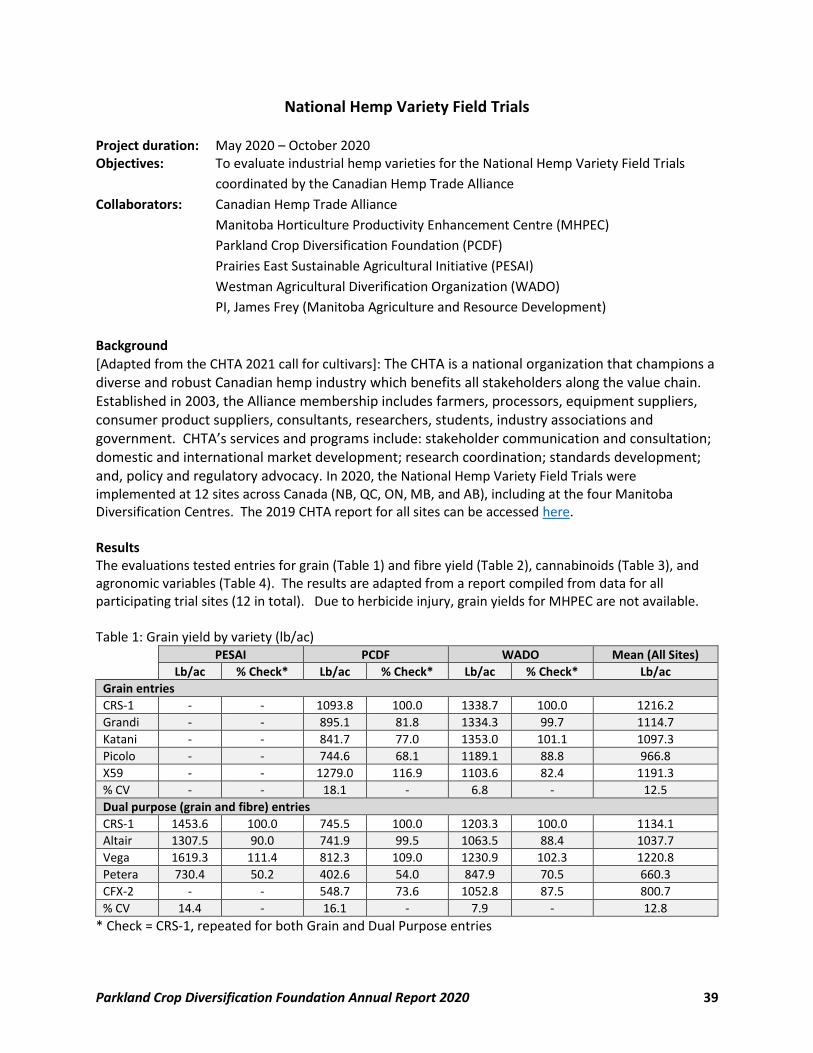
National Hemp Variety Field Trials Project duration: May 2020 – October 2020 Objectives: To evaluate industrial hemp varieties for the National Hemp Variety Field Trials
coordinated by the Canadian Hemp Trade Alliance
Collaborators: Canadian Hemp Trade Alliance
Manitoba Horticulture Productivity Enhancement Centre (MHPEC)
Parkland Crop Diversification Foundation (PCDF)
Prairies East Sustainable Agricultural Initiative (PESAI)
Westman Agricultural Diverification Organization (WADO)
PI, James Frey (Manitoba Agriculture and Resource Development)
Background
[Adapted from the CHTA 2021 call for cultivars]: The CHTA is a national organization that champions a diverse and robust Canadian hemp industry which benefits all stakeholders along the value chain. Established in 2003, the Alliance membership includes farmers, processors, equipment suppliers, consumer product suppliers, consultants, researchers, students, industry associations and government. CHTA’s services and programs include: stakeholder communication and consultation; domestic and international market development; research coordination; standards development; and, policy and regulatory advocacy. In 2020, the National Hemp Variety Field Trials were implemented at 12 sites across Canada (NB, QC, ON, MB, and AB), including at the four Manitoba Diversification Centres. The 2019 CHTA report for all sites can be accessed here. Results The evaluations tested entries for grain (Table 1) and fibre yield (Table 2), cannabinoids (Table 3), and agronomic variables (Table 4). The results are adapted from a report compiled from data for all participating trial sites (12 in total). Due to herbicide injury, grain yields for MHPEC are not available. Table 1: Grain yield by variety (lb/ac)
PESAI PCDF WADO Mean (All Sites)
Lb/ac % Check* Lb/ac % Check* Lb/ac % Check* Lb/ac
Grain entries
CRS-1 - - 1093.8 100.0 1338.7 100.0 1216.2
Grandi - - 895.1 81.8 1334.3 99.7 1114.7
Katani - - 841.7 77.0 1353.0 101.1 1097.3
Picolo - - 744.6 68.1 1189.1 88.8 966.8
X59 - - 1279.0 116.9 1103.6 82.4 1191.3
% CV - - 18.1 - 6.8 - 12.5
Dual purpose (grain and fibre) entries
CRS-1 1453.6 100.0 745.5 100.0 1203.3 100.0 1134.1
Altair 1307.5 90.0 741.9 99.5 1063.5 88.4 1037.7
Vega 1619.3 111.4 812.3 109.0 1230.9 102.3 1220.8
Petera 730.4 50.2 402.6 54.0 847.9 70.5 660.3
CFX-2 - - 548.7 73.6 1052.8 87.5 800.7
% CV 14.4 - 16.1 - 7.9 - 12.8
* Check = CRS-1, repeated for both Grain and Dual Purpose entries
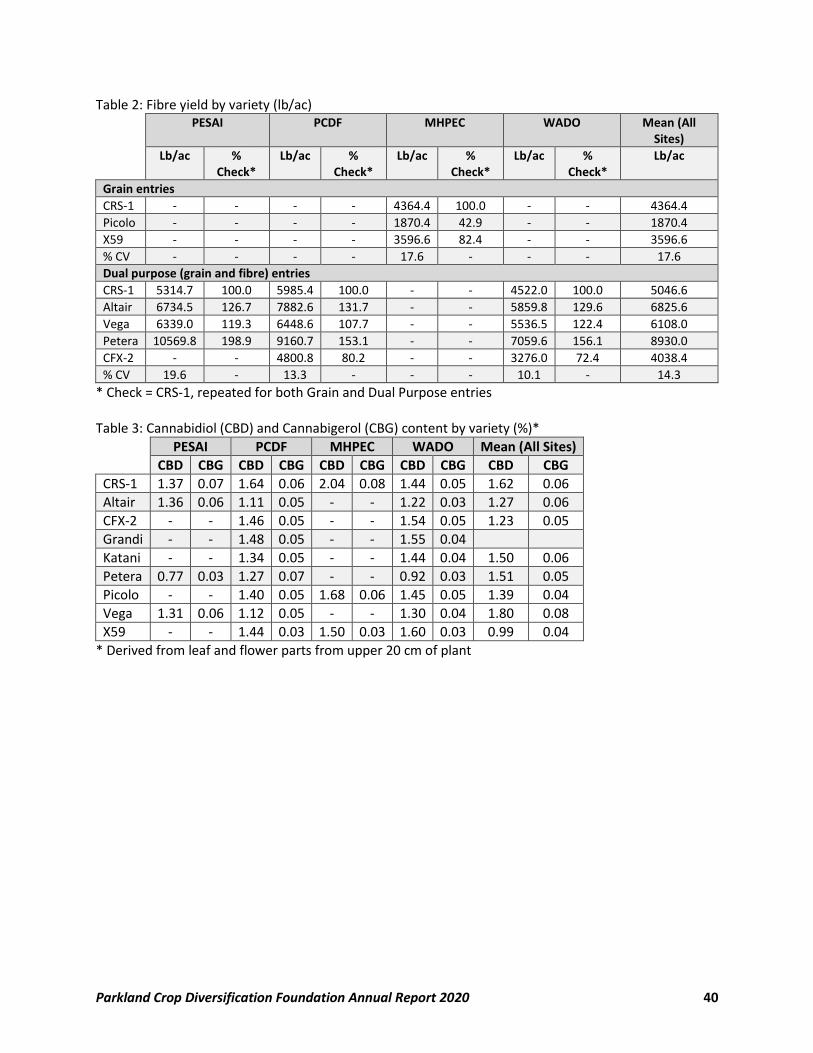
Parkland Crop Diversification Foundation Annual Report 2020 40
Table 2: Fibre yield by variety (lb/ac) PESAI PCDF MHPEC WADO Mean (All
Sites)
Lb/ac % Check*
Lb/ac % Check*
Lb/ac % Check*
Lb/ac % Check*
Lb/ac
Grain entries
CRS-1 - - - - 4364.4 100.0 - - 4364.4
Picolo - - - - 1870.4 42.9 - - 1870.4
X59 - - - - 3596.6 82.4 - - 3596.6
% CV - - - - 17.6 - - - 17.6
Dual purpose (grain and fibre) entries
CRS-1 5314.7 100.0 5985.4 100.0 - - 4522.0 100.0 5046.6
Altair 6734.5 126.7 7882.6 131.7 - - 5859.8 129.6 6825.6
Vega 6339.0 119.3 6448.6 107.7 - - 5536.5 122.4 6108.0
Petera 10569.8 198.9 9160.7 153.1 - - 7059.6 156.1 8930.0
CFX-2 - - 4800.8 80.2 - - 3276.0 72.4 4038.4
% CV 19.6 - 13.3 - - - 10.1 - 14.3
* Check = CRS-1, repeated for both Grain and Dual Purpose entries Table 3: Cannabidiol (CBD) and Cannabigerol (CBG) content by variety (%)*
PESAI PCDF MHPEC WADO Mean (All Sites)
CBD CBG CBD CBG CBD CBG CBD CBG CBD CBG
CRS-1 1.37 0.07 1.64 0.06 2.04 0.08 1.44 0.05 1.62 0.06
Altair 1.36 0.06 1.11 0.05 - - 1.22 0.03 1.27 0.06
CFX-2 - - 1.46 0.05 - - 1.54 0.05 1.23 0.05
Grandi - - 1.48 0.05 - - 1.55 0.04
Katani - - 1.34 0.05 - - 1.44 0.04 1.50 0.06
Petera 0.77 0.03 1.27 0.07 - - 0.92 0.03 1.51 0.05
Picolo - - 1.40 0.05 1.68 0.06 1.45 0.05 1.39 0.04
Vega 1.31 0.06 1.12 0.05 - - 1.30 0.04 1.80 0.08
X59 - - 1.44 0.03 1.50 0.03 1.60 0.03 0.99 0.04
* Derived from leaf and flower parts from upper 20 cm of plant
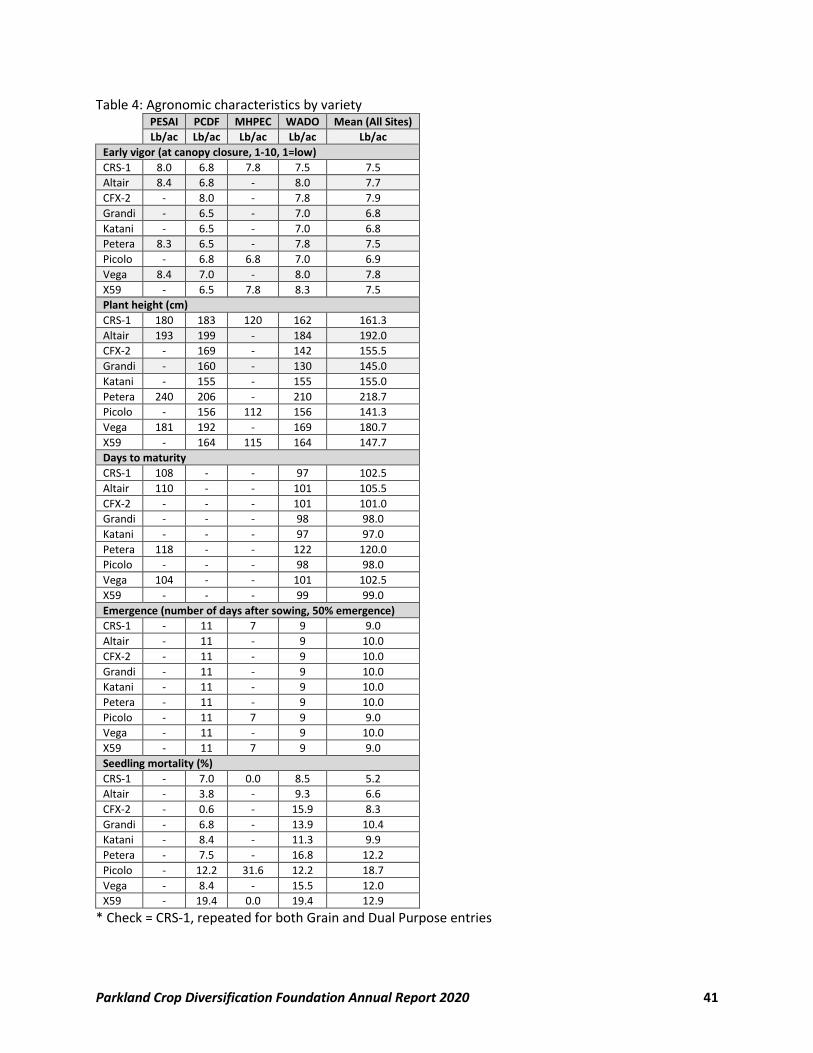
Parkland Crop Diversification Foundation Annual Report 2020 41
Table 4: Agronomic characteristics by variety PESAI PCDF MHPEC WADO Mean (All Sites)
Lb/ac Lb/ac Lb/ac Lb/ac Lb/ac
Early vigor (at canopy closure, 1-10, 1=low)
CRS-1 8.0 6.8 7.8 7.5 7.5
Altair 8.4 6.8 - 8.0 7.7
CFX-2 - 8.0 - 7.8 7.9
Grandi - 6.5 - 7.0 6.8
Katani - 6.5 - 7.0 6.8
Petera 8.3 6.5 - 7.8 7.5
Picolo - 6.8 6.8 7.0 6.9
Vega 8.4 7.0 - 8.0 7.8
X59 - 6.5 7.8 8.3 7.5
Plant height (cm)
CRS-1 180 183 120 162 161.3
Altair 193 199 - 184 192.0
CFX-2 - 169 - 142 155.5
Grandi - 160 - 130 145.0
Katani - 155 - 155 155.0
Petera 240 206 - 210 218.7
Picolo - 156 112 156 141.3
Vega 181 192 - 169 180.7
X59 - 164 115 164 147.7
Days to maturity
CRS-1 108 - - 97 102.5
Altair 110 - - 101 105.5
CFX-2 - - - 101 101.0
Grandi - - - 98 98.0
Katani - - - 97 97.0
Petera 118 - - 122 120.0
Picolo - - - 98 98.0
Vega 104 - - 101 102.5
X59 - - - 99 99.0
Emergence (number of days after sowing, 50% emergence)
CRS-1 - 11 7 9 9.0
Altair - 11 - 9 10.0
CFX-2 - 11 - 9 10.0
Grandi - 11 - 9 10.0
Katani - 11 - 9 10.0
Petera - 11 - 9 10.0
Picolo - 11 7 9 9.0
Vega - 11 - 9 10.0
X59 - 11 7 9 9.0
Seedling mortality (%)
CRS-1 - 7.0 0.0 8.5 5.2
Altair - 3.8 - 9.3 6.6
CFX-2 - 0.6 - 15.9 8.3
Grandi - 6.8 - 13.9 10.4
Katani - 8.4 - 11.3 9.9
Petera - 7.5 - 16.8 12.2
Picolo - 12.2 31.6 12.2 18.7
Vega - 8.4 - 15.5 12.0
X59 - 19.4 0.0 19.4 12.9
* Check = CRS-1, repeated for both Grain and Dual Purpose entries
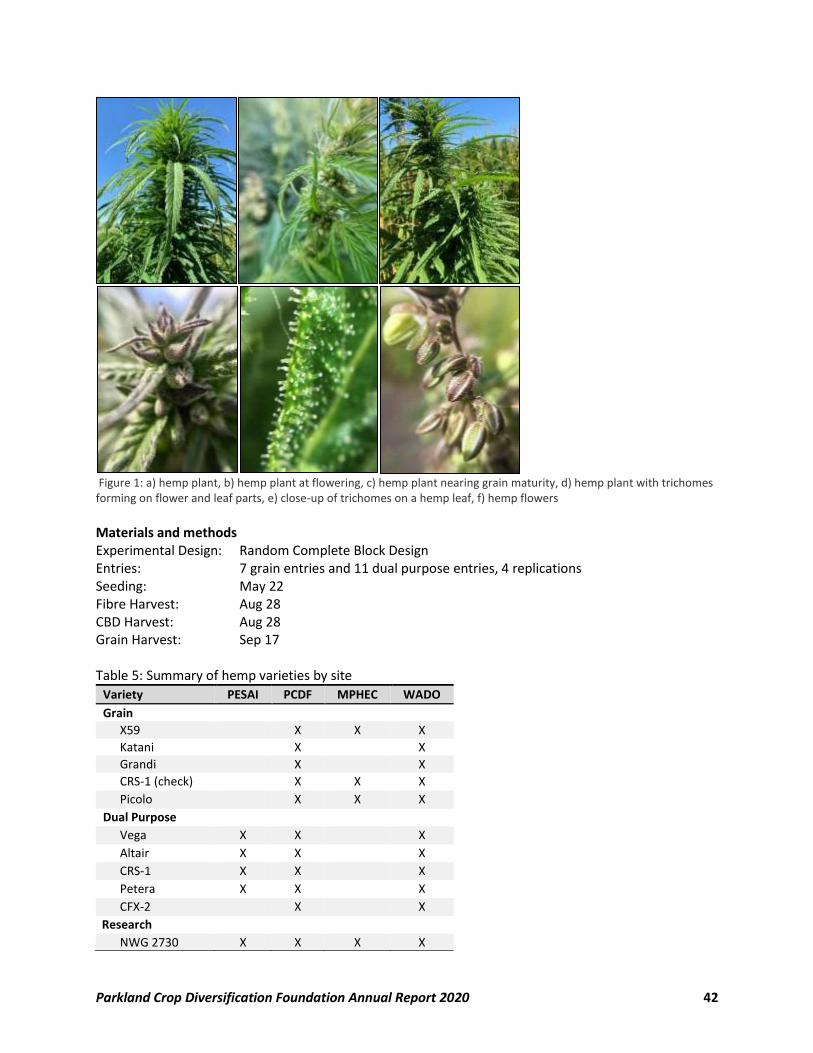
Parkland Crop Diversification Foundation Annual Report 2020 42
Figure 1: a) hemp plant, b) hemp plant at flowering, c) hemp plant nearing grain maturity, d) hemp plant with trichomes forming on flower and leaf parts, e) close-up of trichomes on a hemp leaf, f) hemp flowers
Materials and methods Experimental Design: Random Complete Block Design Entries: 7 grain entries and 11 dual purpose entries, 4 replications Seeding: May 22 Fibre Harvest: Aug 28 CBD Harvest: Aug 28 Grain Harvest: Sep 17 Table 5: Summary of hemp varieties by site
Variety PESAI PCDF MPHEC WADO
Grain
X59 X X X
Katani X X
Grandi X X
CRS-1 (check) X X X
Picolo X X X
Dual Purpose
Vega X X X
Altair X X X
CRS-1 X X X
Petera X X X
CFX-2 X X
Research
NWG 2730 X X X X
Parkland Crop Diversification Foundation Annual Report 2020 43
Table 6: Data collected
Emergence date Stem elongation plant counts
Grain yield Fibre wet yield
Lodging
Mortality plant counts
Height Grain moisture
Fibre dry yield
Cannabinoid content
Agronomic info (Roblin) Previous year’s crop: Barley Silage Soil Type: Erickson Loam Clay Landscape: Rolling with trees to the east Seedbed preparation: Heavy harrowed
Table 7: Fertility Information (Roblin)
Available Added Type
N 63 lb/ac 57 lb/ac 46-0-0
P 62 ppm 20 lb/ac 11-52-0-0
K 698 ppm
Table 8: Herbicide Application (Roblin)
Crop stage Date Product Rate
Pre-emerge May 22 Roundup 0.64 L/ac No in-crop
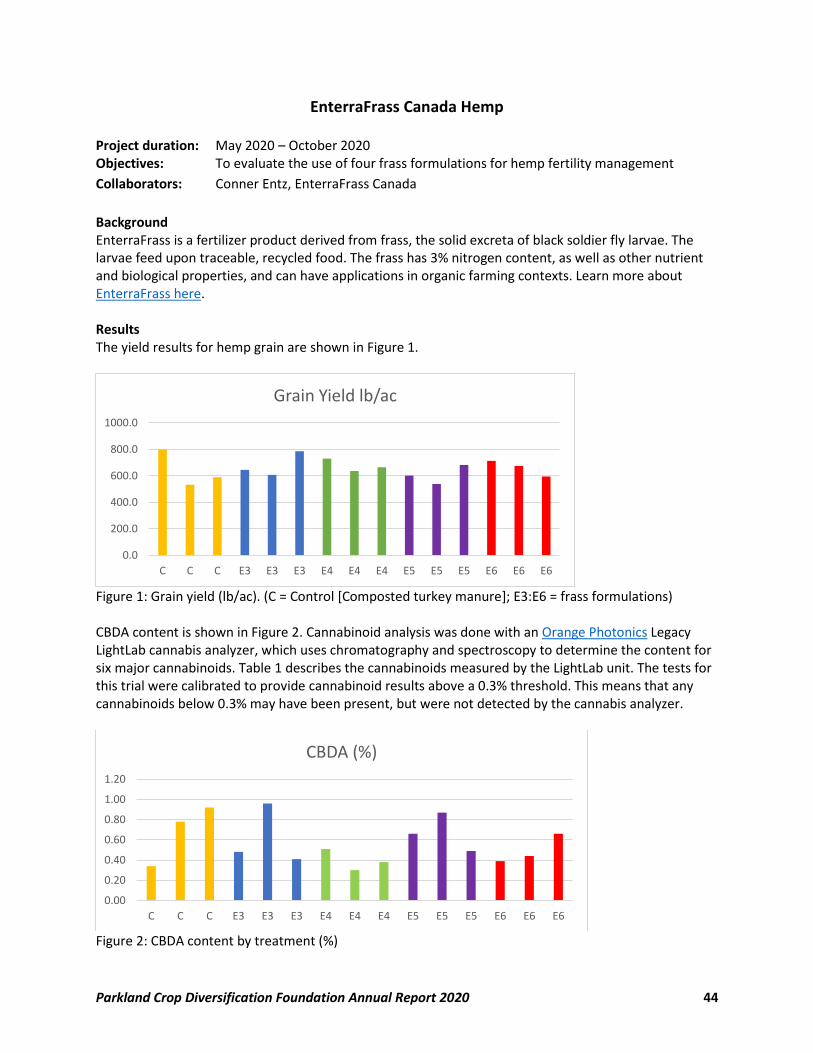
Parkland Crop Diversification Foundation Annual Report 2020 44
EnterraFrass Canada Hemp Project duration: May 2020 – October 2020 Objectives: To evaluate the use of four frass formulations for hemp fertility management
Collaborators: Conner Entz, EnterraFrass Canada
Background EnterraFrass is a fertilizer product derived from frass, the solid excreta of black soldier fly larvae. The larvae feed upon traceable, recycled food. The frass has 3% nitrogen content, as well as other nutrient and biological properties, and can have applications in organic farming contexts. Learn more about EnterraFrass here. Results The yield results for hemp grain are shown in Figure 1.
Figure 1: Grain yield (lb/ac). (C = Control [Composted turkey manure]; E3:E6 = frass formulations) CBDA content is shown in Figure 2. Cannabinoid analysis was done with an Orange Photonics Legacy LightLab cannabis analyzer, which uses chromatography and spectroscopy to determine the content for six major cannabinoids. Table 1 describes the cannabinoids measured by the LightLab unit. The tests for this trial were calibrated to provide cannabinoid results above a 0.3% threshold. This means that any cannabinoids below 0.3% may have been present, but were not detected by the cannabis analyzer.
Figure 2: CBDA content by treatment (%)
0.0
200.0
400.0
600.0
800.0
1000.0
C C C E3 E3 E3 E4 E4 E4 E5 E5 E5 E6 E6 E6
Grain Yield lb/ac
0.00
0.20
0.40
0.60
0.80
1.00
1.20
C C C E3 E3 E3 E4 E4 E4 E5 E5 E5 E6 E6 E6
CBDA (%)
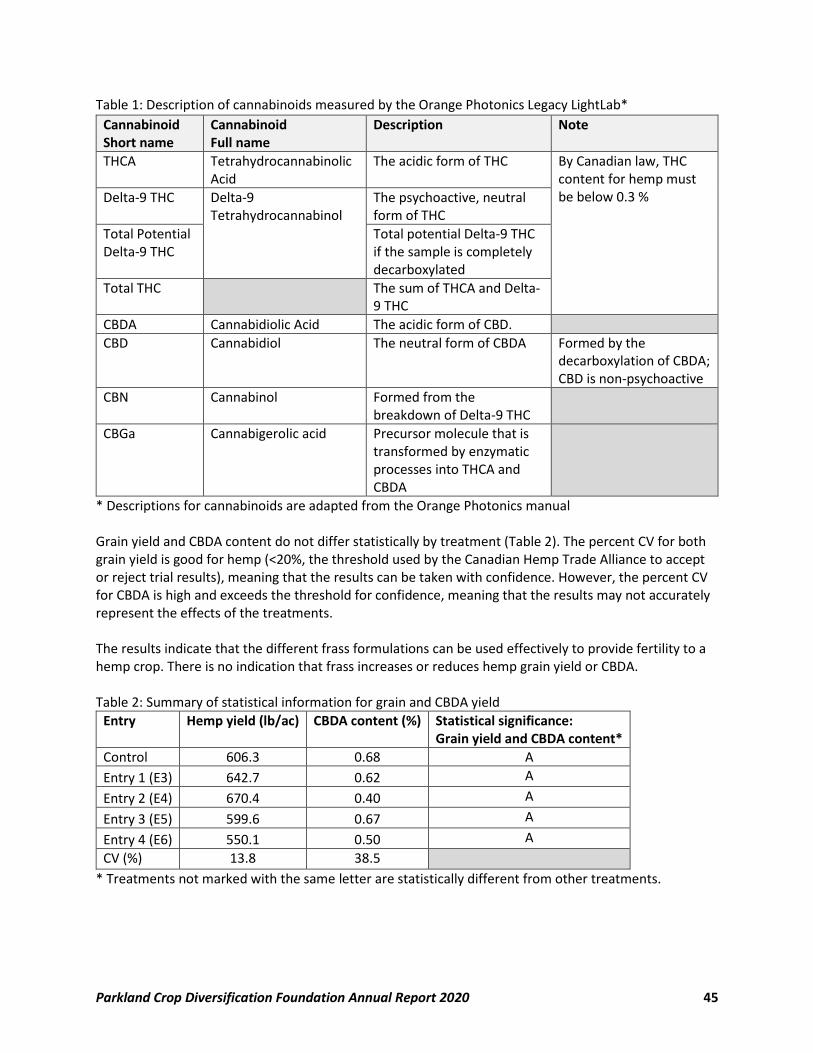
Parkland Crop Diversification Foundation Annual Report 2020 45
Table 1: Description of cannabinoids measured by the Orange Photonics Legacy LightLab*
Cannabinoid Short name
Cannabinoid Full name
Description Note
THCA Tetrahydrocannabinolic Acid
The acidic form of THC By Canadian law, THC content for hemp must be below 0.3 % Delta-9 THC Delta-9
Tetrahydrocannabinol The psychoactive, neutral form of THC
Total Potential Delta-9 THC
Total potential Delta-9 THC if the sample is completely decarboxylated
Total THC The sum of THCA and Delta-9 THC
CBDA Cannabidiolic Acid The acidic form of CBD.
CBD Cannabidiol The neutral form of CBDA Formed by the decarboxylation of CBDA; CBD is non-psychoactive
CBN Cannabinol Formed from the breakdown of Delta-9 THC
CBGa Cannabigerolic acid Precursor molecule that is transformed by enzymatic processes into THCA and CBDA
* Descriptions for cannabinoids are adapted from the Orange Photonics manual Grain yield and CBDA content do not differ statistically by treatment (Table 2). The percent CV for both grain yield is good for hemp (<20%, the threshold used by the Canadian Hemp Trade Alliance to accept or reject trial results), meaning that the results can be taken with confidence. However, the percent CV for CBDA is high and exceeds the threshold for confidence, meaning that the results may not accurately represent the effects of the treatments. The results indicate that the different frass formulations can be used effectively to provide fertility to a hemp crop. There is no indication that frass increases or reduces hemp grain yield or CBDA. Table 2: Summary of statistical information for grain and CBDA yield
Entry Hemp yield (lb/ac) CBDA content (%) Statistical significance: Grain yield and CBDA content*
Control 606.3 0.68 A
Entry 1 (E3) 642.7 0.62 A
Entry 2 (E4) 670.4 0.40 A
Entry 3 (E5) 599.6 0.67 A
Entry 4 (E6) 550.1 0.50 A
CV (%) 13.8 38.5
* Treatments not marked with the same letter are statistically different from other treatments.
Parkland Crop Diversification Foundation Annual Report 2020 46
Materials & Methods Experimental Design: Random Complete Block Design Variety: CRS-1 Entries: 5 treatments x 3 replications Seeding: Jun 24 Harvest: Sep 17 Control fertility: 6% composted turkey manure pellets Frass entries: 3% frass pellets Data collected Date collected Emergence: Jul 1 Plant Counts: Jul 1 Vigor: Aug 5 Disease: Aug 5 CBD Sampling: Aug 28 Yield: Oct 1 Moisture: Dec 1 Agronomic info Previous year’s crop: Barley Silage Soil Type: Erickson Loam Clay Landscape: Rolling with trees to the east Seedbed preparation: Heavy harrowed
Table 3: Fertility Information
Available Added Type
N 63 lb/ac 57 lb/ac 46-0-0
P 62 ppm 20 lb/ac 11-52-0-0
K 698 ppm
Table 4: Herbicide Application
Crop stage Date Product Rate
Pre-emerge Jun 24 RoundUp 0.64 L/ac In-crop Jul 10 Bromoxynil 0.4 L/ac Centurion 0.15 L/ac
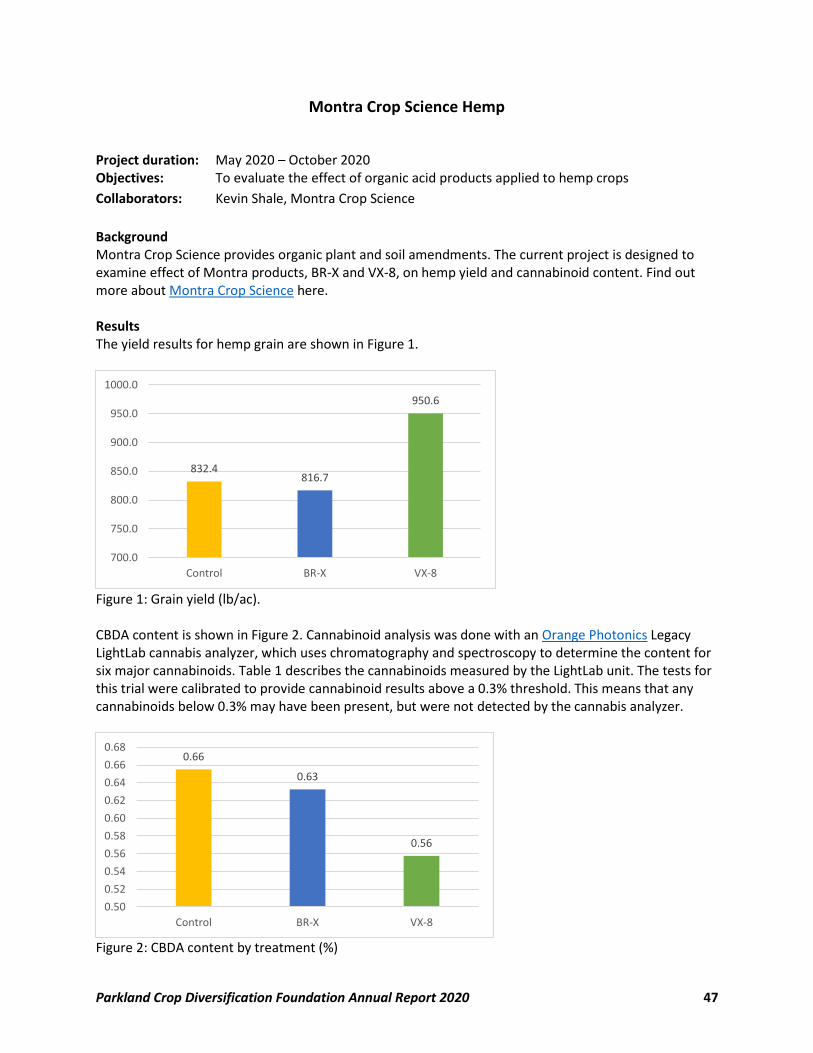
Parkland Crop Diversification Foundation Annual Report 2020 47
Montra Crop Science Hemp
Project duration: May 2020 – October 2020 Objectives: To evaluate the effect of organic acid products applied to hemp crops
Collaborators: Kevin Shale, Montra Crop Science
Background Montra Crop Science provides organic plant and soil amendments. The current project is designed to examine effect of Montra products, BR-X and VX-8, on hemp yield and cannabinoid content. Find out more about Montra Crop Science here. Results The yield results for hemp grain are shown in Figure 1.
Figure 1: Grain yield (lb/ac). CBDA content is shown in Figure 2. Cannabinoid analysis was done with an Orange Photonics Legacy LightLab cannabis analyzer, which uses chromatography and spectroscopy to determine the content for six major cannabinoids. Table 1 describes the cannabinoids measured by the LightLab unit. The tests for this trial were calibrated to provide cannabinoid results above a 0.3% threshold. This means that any cannabinoids below 0.3% may have been present, but were not detected by the cannabis analyzer.
Figure 2: CBDA content by treatment (%)
832.4816.7
950.6
700.0
750.0
800.0
850.0
900.0
950.0
1000.0
Control BR-X VX-8
0.66
0.63
0.56
0.50
0.52
0.54
0.56
0.58
0.60
0.62
0.64
0.66
0.68
Control BR-X VX-8
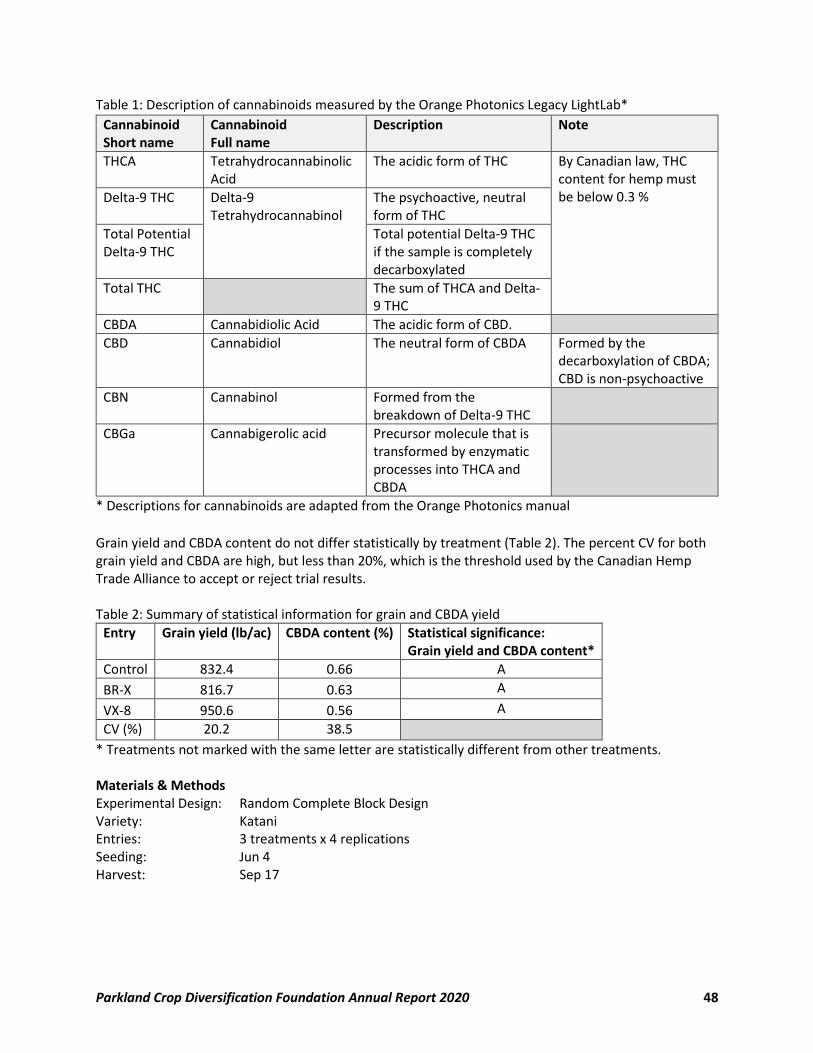
Parkland Crop Diversification Foundation Annual Report 2020 48
Table 1: Description of cannabinoids measured by the Orange Photonics Legacy LightLab*
Cannabinoid Short name
Cannabinoid Full name
Description Note
THCA Tetrahydrocannabinolic Acid
The acidic form of THC By Canadian law, THC content for hemp must be below 0.3 % Delta-9 THC Delta-9
Tetrahydrocannabinol The psychoactive, neutral form of THC
Total Potential Delta-9 THC
Total potential Delta-9 THC if the sample is completely decarboxylated
Total THC The sum of THCA and Delta-9 THC
CBDA Cannabidiolic Acid The acidic form of CBD.
CBD Cannabidiol The neutral form of CBDA Formed by the decarboxylation of CBDA; CBD is non-psychoactive
CBN Cannabinol Formed from the breakdown of Delta-9 THC
CBGa Cannabigerolic acid Precursor molecule that is transformed by enzymatic processes into THCA and CBDA
* Descriptions for cannabinoids are adapted from the Orange Photonics manual
Grain yield and CBDA content do not differ statistically by treatment (Table 2). The percent CV for both grain yield and CBDA are high, but less than 20%, which is the threshold used by the Canadian Hemp Trade Alliance to accept or reject trial results. Table 2: Summary of statistical information for grain and CBDA yield
Entry Grain yield (lb/ac) CBDA content (%) Statistical significance: Grain yield and CBDA content*
Control 832.4 0.66 A
BR-X 816.7 0.63 A
VX-8 950.6 0.56 A
CV (%) 20.2 38.5
* Treatments not marked with the same letter are statistically different from other treatments. Materials & Methods Experimental Design: Random Complete Block Design Variety: Katani Entries: 3 treatments x 4 replications Seeding: Jun 4 Harvest: Sep 17
Parkland Crop Diversification Foundation Annual Report 2020 49
Table 3: Treatments
Treatment At seeding At Herbicide Application
1 Control No product
2 Montra BR-X (wet)
Soil-applied at 2 L/ac
Montra MX-3
Foliar applied
3 Montra VX-8 (dry)
Soil-applied at 13.2 lb/ac
Montra MX-3
Foliar applied
Data collected Date collected Emergence: Jun 11-12 Plant Counts: Jul 1 Vigor: Aug 5 Disease: Aug 5 CBD Sampling: Aug 28 Yield: Oct 1 Moisture: Dec 1 Agronomic info Previous year’s crop: Barley Silage Soil Type: Erickson Loam Clay Landscape: Rolling with trees to the east Seedbed preparation: Heavy harrowed
Table 4: Fertility Information
Available Added Type
N 58 lb/ac 131 lb/ac* 46-0-0
P 71 ppm 15 lb/ac** 11-52-0-0
K 513 ppm
* Side-banded ** In-row Table 5: Herbicide Application
Crop stage Date Product Rate
Pre-emerge Jun 8 RoundUp 0.64 L/ac In-crop Jun 24 Brotex 0.40 L/ac Centurion 0.15 L/ac Decis 0.15 L/ac Montra MX-3 1.00 L/ac
Parkland Crop Diversification Foundation Annual Report 2020 50
Intercropping Trials
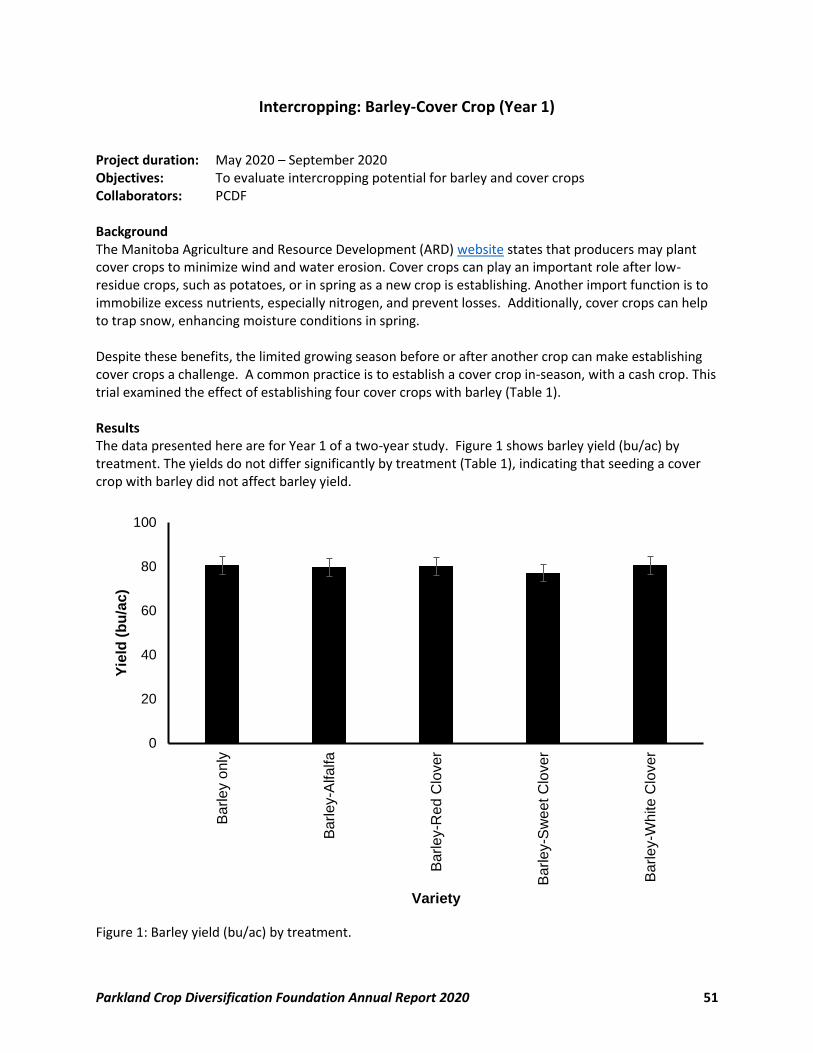
Parkland Crop Diversification Foundation Annual Report 2020 51
Intercropping: Barley-Cover Crop (Year 1)
Project duration: May 2020 – September 2020 Objectives: To evaluate intercropping potential for barley and cover crops Collaborators: PCDF Background The Manitoba Agriculture and Resource Development (ARD) website states that producers may plant cover crops to minimize wind and water erosion. Cover crops can play an important role after low-residue crops, such as potatoes, or in spring as a new crop is establishing. Another import function is to immobilize excess nutrients, especially nitrogen, and prevent losses. Additionally, cover crops can help to trap snow, enhancing moisture conditions in spring. Despite these benefits, the limited growing season before or after another crop can make establishing cover crops a challenge. A common practice is to establish a cover crop in-season, with a cash crop. This trial examined the effect of establishing four cover crops with barley (Table 1). Results The data presented here are for Year 1 of a two-year study. Figure 1 shows barley yield (bu/ac) by treatment. The yields do not differ significantly by treatment (Table 1), indicating that seeding a cover crop with barley did not affect barley yield.
Figure 1: Barley yield (bu/ac) by treatment.
0
20
40
60
80
100
Ba
rley o
nly
Ba
rley-A
lfa
lfa
Ba
rley-R
ed C
lover
Ba
rley-S
we
et C
lover
Ba
rley-W
hite
Clo
ver
Yie
ld (
bu
/ac)
Variety
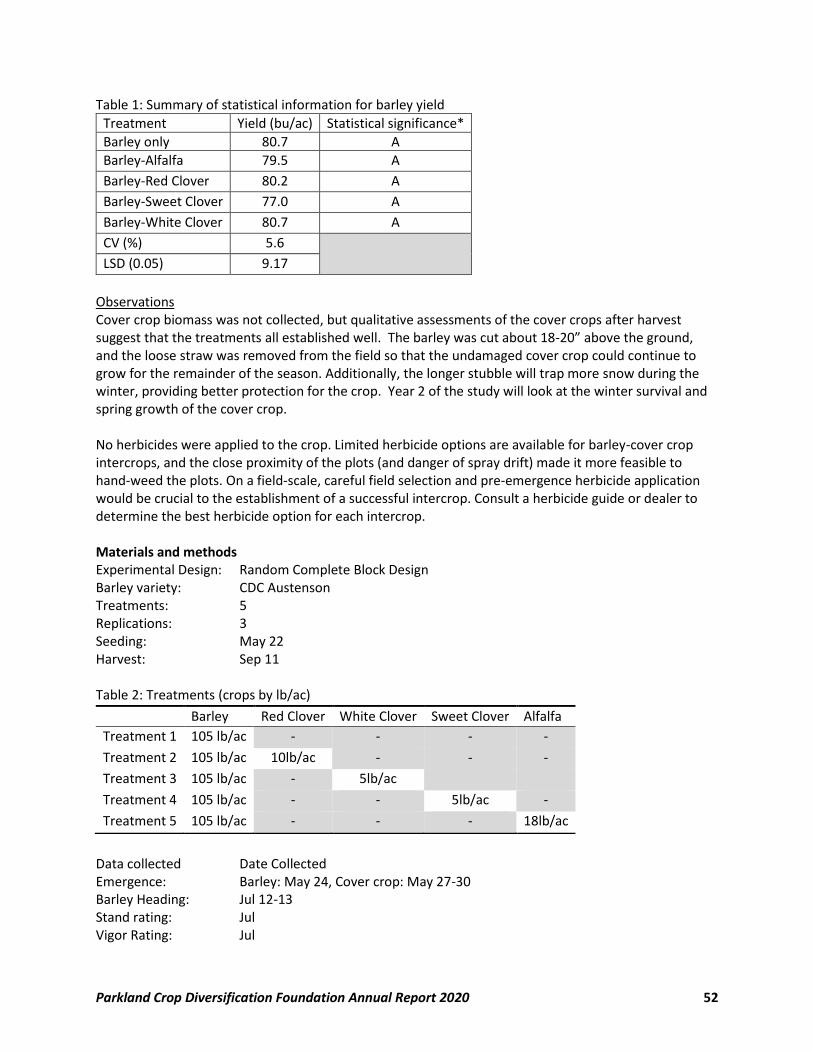
Parkland Crop Diversification Foundation Annual Report 2020 52
Table 1: Summary of statistical information for barley yield
Treatment Yield (bu/ac) Statistical significance*
Barley only 80.7 A
Barley-Alfalfa 79.5 A
Barley-Red Clover 80.2 A
Barley-Sweet Clover 77.0 A
Barley-White Clover 80.7 A
CV (%) 5.6
LSD (0.05) 9.17
Observations Cover crop biomass was not collected, but qualitative assessments of the cover crops after harvest suggest that the treatments all established well. The barley was cut about 18-20” above the ground, and the loose straw was removed from the field so that the undamaged cover crop could continue to grow for the remainder of the season. Additionally, the longer stubble will trap more snow during the winter, providing better protection for the crop. Year 2 of the study will look at the winter survival and spring growth of the cover crop. No herbicides were applied to the crop. Limited herbicide options are available for barley-cover crop intercrops, and the close proximity of the plots (and danger of spray drift) made it more feasible to hand-weed the plots. On a field-scale, careful field selection and pre-emergence herbicide application would be crucial to the establishment of a successful intercrop. Consult a herbicide guide or dealer to determine the best herbicide option for each intercrop. Materials and methods Experimental Design: Random Complete Block Design Barley variety: CDC Austenson Treatments: 5 Replications: 3 Seeding: May 22 Harvest: Sep 11 Table 2: Treatments (crops by lb/ac)
Data collected Date Collected Emergence: Barley: May 24, Cover crop: May 27-30 Barley Heading: Jul 12-13 Stand rating: Jul Vigor Rating: Jul
Barley Red Clover White Clover Sweet Clover Alfalfa
Treatment 1 105 lb/ac - - - -
Treatment 2 105 lb/ac 10lb/ac - - -
Treatment 3 105 lb/ac - 5lb/ac
Treatment 4 105 lb/ac - - 5lb/ac -
Treatment 5 105 lb/ac - - - 18lb/ac
Parkland Crop Diversification Foundation Annual Report 2020 53
Yield: Sep 11 Moisture: Sep 11 Agronomic info Previous year’s crop: Barley Silage Soil Type: Erickson Loam Clay Landscape: Rolling with trees to the east Seedbed preparation: Heavy harrowed Table 3: Fertility Information
Available Added Type
N 61 lb/ac 63 lb/ac 46-0-0
P 47 ppm 15 lb/ac 11-52-0-0
K 393ppm -
Cover crops inoculated; no herbicide applied
(hand weeded)
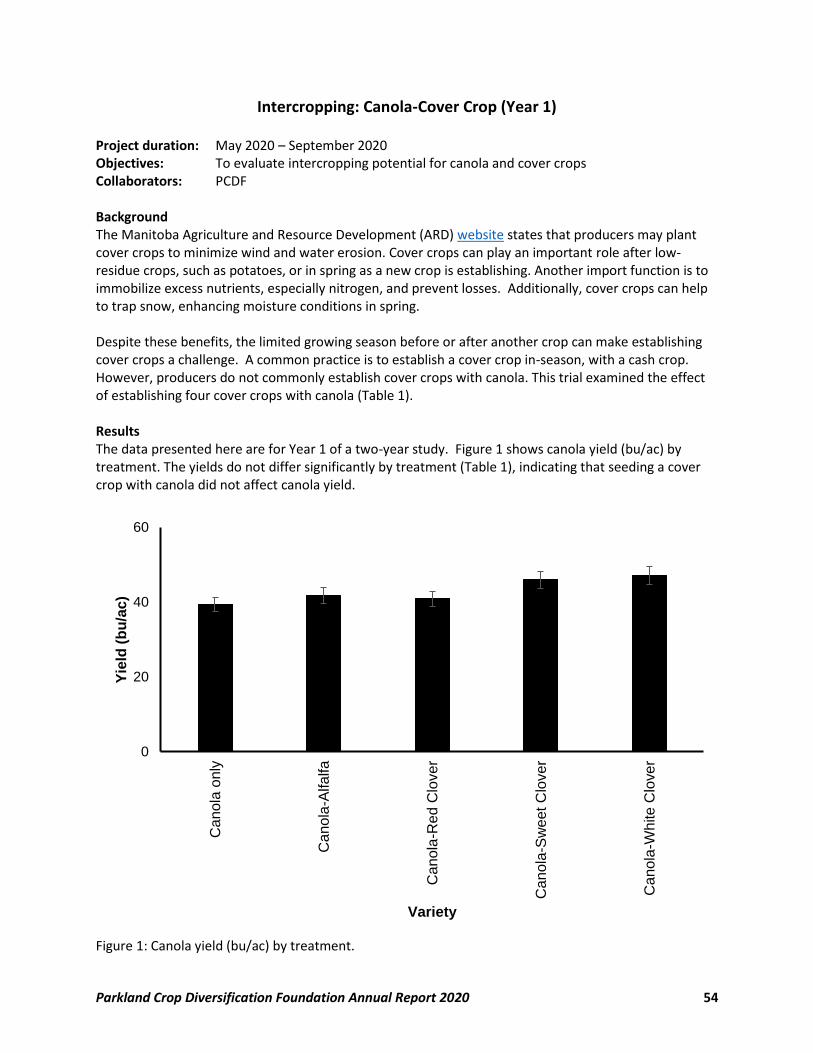
Parkland Crop Diversification Foundation Annual Report 2020 54
Intercropping: Canola-Cover Crop (Year 1) Project duration: May 2020 – September 2020 Objectives: To evaluate intercropping potential for canola and cover crops Collaborators: PCDF Background The Manitoba Agriculture and Resource Development (ARD) website states that producers may plant cover crops to minimize wind and water erosion. Cover crops can play an important role after low-residue crops, such as potatoes, or in spring as a new crop is establishing. Another import function is to immobilize excess nutrients, especially nitrogen, and prevent losses. Additionally, cover crops can help to trap snow, enhancing moisture conditions in spring. Despite these benefits, the limited growing season before or after another crop can make establishing cover crops a challenge. A common practice is to establish a cover crop in-season, with a cash crop. However, producers do not commonly establish cover crops with canola. This trial examined the effect of establishing four cover crops with canola (Table 1). Results The data presented here are for Year 1 of a two-year study. Figure 1 shows canola yield (bu/ac) by treatment. The yields do not differ significantly by treatment (Table 1), indicating that seeding a cover crop with canola did not affect canola yield.
Figure 1: Canola yield (bu/ac) by treatment.
0
20
40
60
Ca
no
la o
nly
Ca
no
la-A
lfa
lfa
Ca
no
la-R
ed C
lover
Ca
no
la-S
we
et C
lover
Ca
no
la-W
hite
Clo
ve
r
Yie
ld (
bu
/ac)
Variety
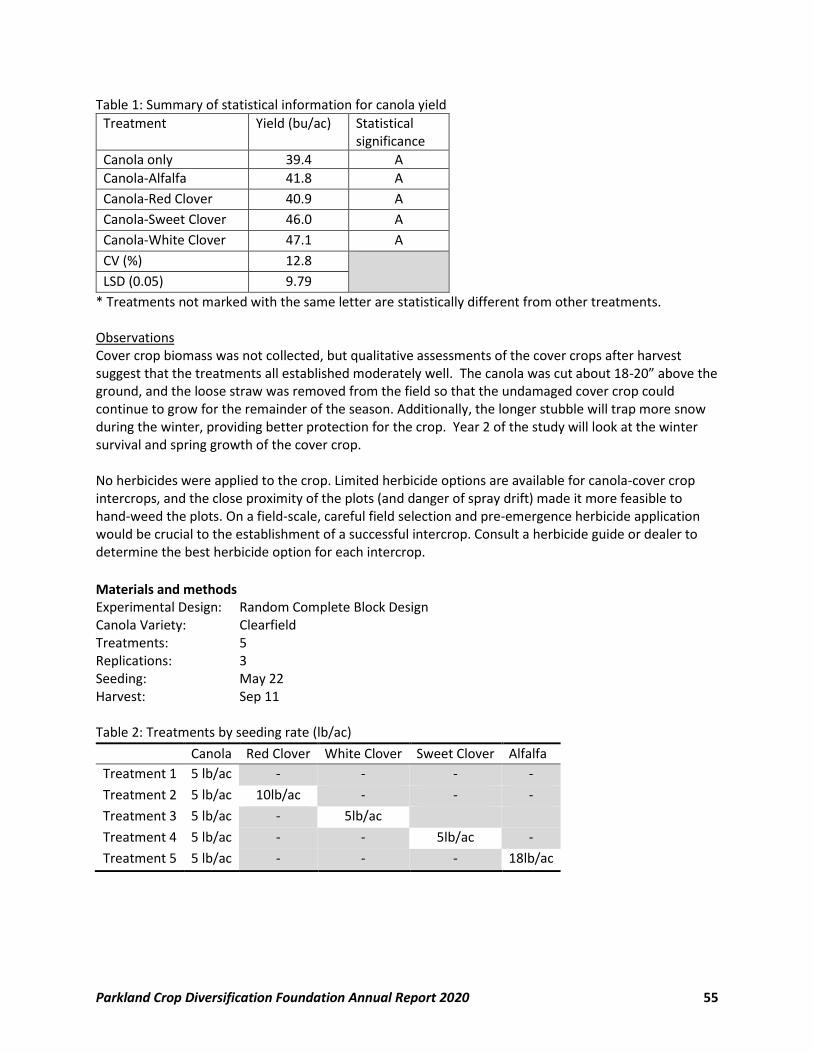
Parkland Crop Diversification Foundation Annual Report 2020 55
Table 1: Summary of statistical information for canola yield
Treatment Yield (bu/ac) Statistical significance
Canola only 39.4 A
Canola-Alfalfa 41.8 A
Canola-Red Clover 40.9 A
Canola-Sweet Clover 46.0 A
Canola-White Clover 47.1 A
CV (%) 12.8
LSD (0.05) 9.79
* Treatments not marked with the same letter are statistically different from other treatments. Observations Cover crop biomass was not collected, but qualitative assessments of the cover crops after harvest suggest that the treatments all established moderately well. The canola was cut about 18-20” above the ground, and the loose straw was removed from the field so that the undamaged cover crop could continue to grow for the remainder of the season. Additionally, the longer stubble will trap more snow during the winter, providing better protection for the crop. Year 2 of the study will look at the winter survival and spring growth of the cover crop. No herbicides were applied to the crop. Limited herbicide options are available for canola-cover crop intercrops, and the close proximity of the plots (and danger of spray drift) made it more feasible to hand-weed the plots. On a field-scale, careful field selection and pre-emergence herbicide application would be crucial to the establishment of a successful intercrop. Consult a herbicide guide or dealer to determine the best herbicide option for each intercrop.
Materials and methods Experimental Design: Random Complete Block Design Canola Variety: Clearfield Treatments: 5 Replications: 3 Seeding: May 22 Harvest: Sep 11 Table 2: Treatments by seeding rate (lb/ac)
Canola Red Clover White Clover Sweet Clover Alfalfa
Treatment 1 5 lb/ac - - - -
Treatment 2 5 lb/ac 10lb/ac - - -
Treatment 3 5 lb/ac - 5lb/ac
Treatment 4 5 lb/ac - - 5lb/ac -
Treatment 5 5 lb/ac - - - 18lb/ac
Parkland Crop Diversification Foundation Annual Report 2020 56
Data collected Date Collected Emergence: Canola: May 24-25, Clover: May 28-30 Canola Flowering: Jul 4-6 Stand rating: Jul Vigor Rating: Jul Yield: Sep 11 Moisture: Sep 11
Agronomic info Previous year’s crop: Barley Silage Soil Type: Erickson Loam Clay Landscape: Rolling with trees to the east Seedbed preparation: Heavy harrowed Table 3: Fertility Information
Available Added Type
N 61 lb/ac 93 lb/ac 46-0-0
P 47 ppm 10 lb/ac 11-52-0-0
K 393ppm -
Cover crops inoculated; no herbicide applied
(hand weeded)
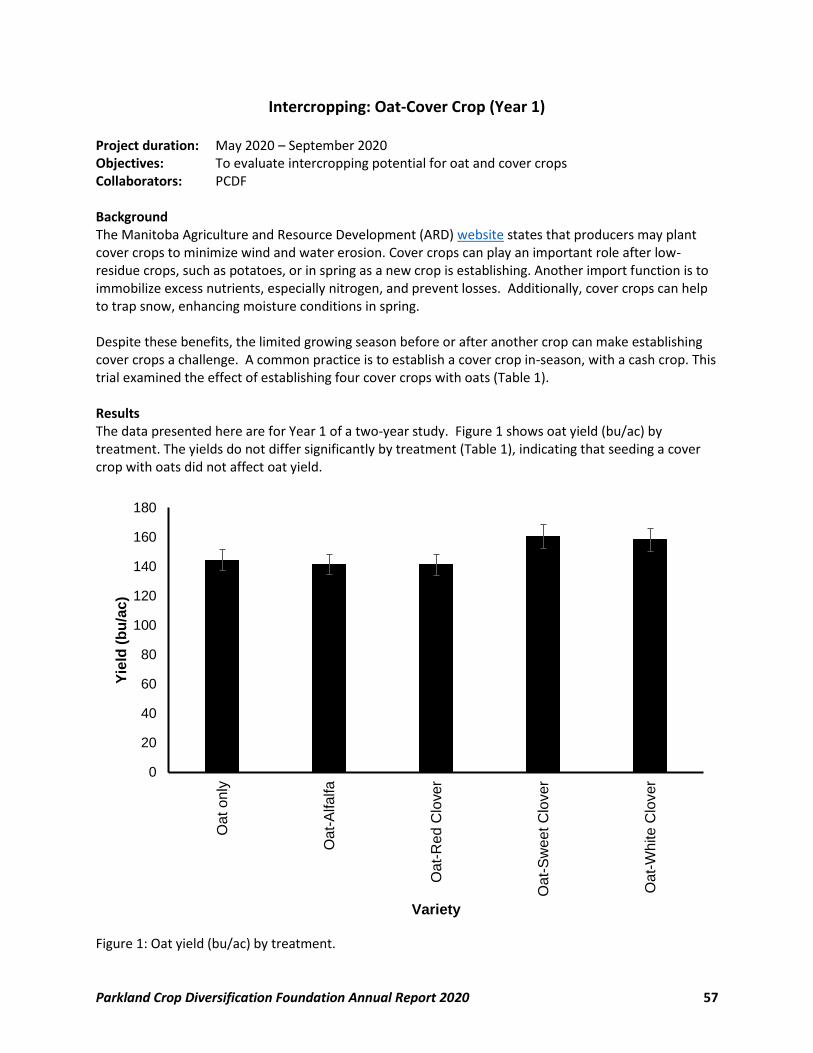
Parkland Crop Diversification Foundation Annual Report 2020 57
Intercropping: Oat-Cover Crop (Year 1) Project duration: May 2020 – September 2020 Objectives: To evaluate intercropping potential for oat and cover crops Collaborators: PCDF Background The Manitoba Agriculture and Resource Development (ARD) website states that producers may plant cover crops to minimize wind and water erosion. Cover crops can play an important role after low-residue crops, such as potatoes, or in spring as a new crop is establishing. Another import function is to immobilize excess nutrients, especially nitrogen, and prevent losses. Additionally, cover crops can help to trap snow, enhancing moisture conditions in spring. Despite these benefits, the limited growing season before or after another crop can make establishing cover crops a challenge. A common practice is to establish a cover crop in-season, with a cash crop. This trial examined the effect of establishing four cover crops with oats (Table 1). Results The data presented here are for Year 1 of a two-year study. Figure 1 shows oat yield (bu/ac) by treatment. The yields do not differ significantly by treatment (Table 1), indicating that seeding a cover crop with oats did not affect oat yield.
Figure 1: Oat yield (bu/ac) by treatment.
0
20
40
60
80
100
120
140
160
180
Oa
t o
nly
Oa
t-A
lfa
lfa
Oa
t-R
ed C
love
r
Oa
t-S
we
et C
lover
Oa
t-W
hite
Clo
ver
Yie
ld (
bu
/ac)
Variety
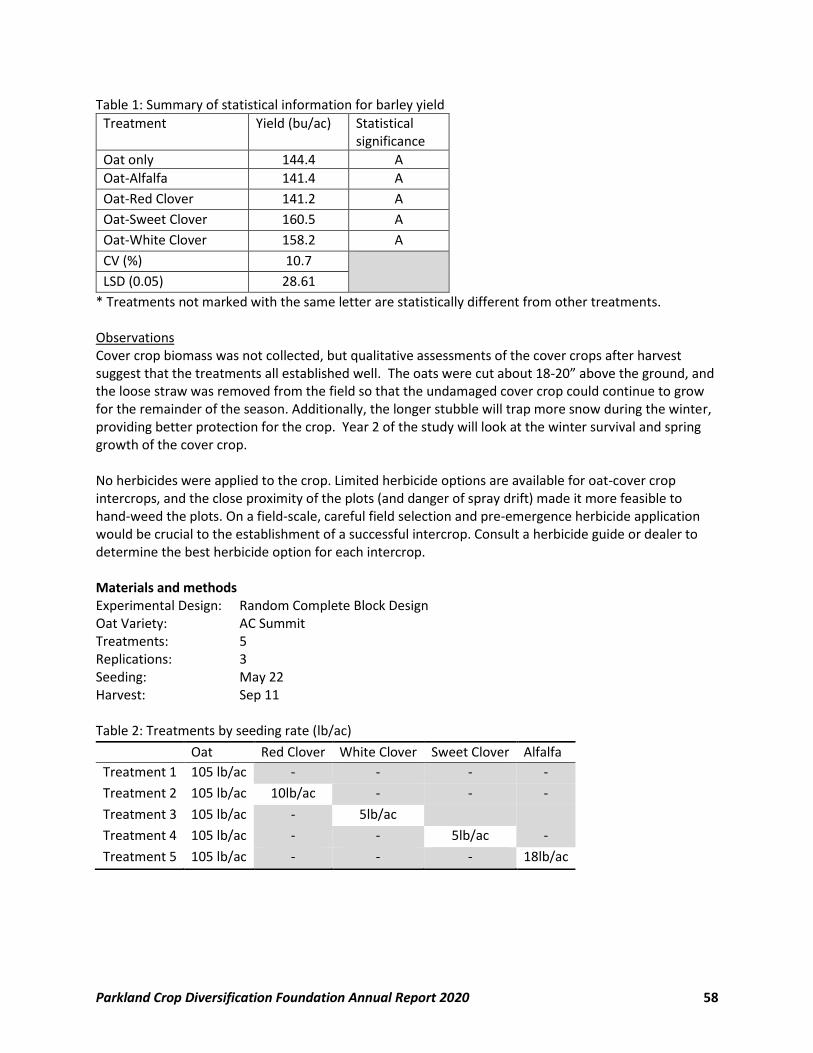
Parkland Crop Diversification Foundation Annual Report 2020 58
Table 1: Summary of statistical information for barley yield
Treatment Yield (bu/ac) Statistical significance
Oat only 144.4 A
Oat-Alfalfa 141.4 A
Oat-Red Clover 141.2 A
Oat-Sweet Clover 160.5 A
Oat-White Clover 158.2 A
CV (%) 10.7
LSD (0.05) 28.61
* Treatments not marked with the same letter are statistically different from other treatments. Observations Cover crop biomass was not collected, but qualitative assessments of the cover crops after harvest suggest that the treatments all established well. The oats were cut about 18-20” above the ground, and the loose straw was removed from the field so that the undamaged cover crop could continue to grow for the remainder of the season. Additionally, the longer stubble will trap more snow during the winter, providing better protection for the crop. Year 2 of the study will look at the winter survival and spring growth of the cover crop. No herbicides were applied to the crop. Limited herbicide options are available for oat-cover crop intercrops, and the close proximity of the plots (and danger of spray drift) made it more feasible to hand-weed the plots. On a field-scale, careful field selection and pre-emergence herbicide application would be crucial to the establishment of a successful intercrop. Consult a herbicide guide or dealer to determine the best herbicide option for each intercrop. Materials and methods Experimental Design: Random Complete Block Design Oat Variety: AC Summit Treatments: 5 Replications: 3 Seeding: May 22 Harvest: Sep 11 Table 2: Treatments by seeding rate (lb/ac)
Oat Red Clover White Clover Sweet Clover Alfalfa
Treatment 1 105 lb/ac - - - -
Treatment 2 105 lb/ac 10lb/ac - - -
Treatment 3 105 lb/ac - 5lb/ac
Treatment 4 105 lb/ac - - 5lb/ac -
Treatment 5 105 lb/ac - - - 18lb/ac
Parkland Crop Diversification Foundation Annual Report 2020 59
Data collected Date Collected Emergence: Oat: May 24-25, Clover: May 27-30 Stand rating: Jul Vigor Rating: Jul Yield: Sep 11 Moisture: Sep 11
Agronomic info Previous year’s crop: Barley Silage Soil Type: Erickson Loam Clay Landscape: Rolling with trees to the east Seedbed preparation: Heavy harrowed Table 3: Fertility Information
Available Added Type
N 61 lb/ac 59 lb/ac 46-0-0
P 47 ppm 10 lb/ac 11-52-0-0
K 393ppm
Cover crops inoculated; no herbicide applied
(hand weeded)
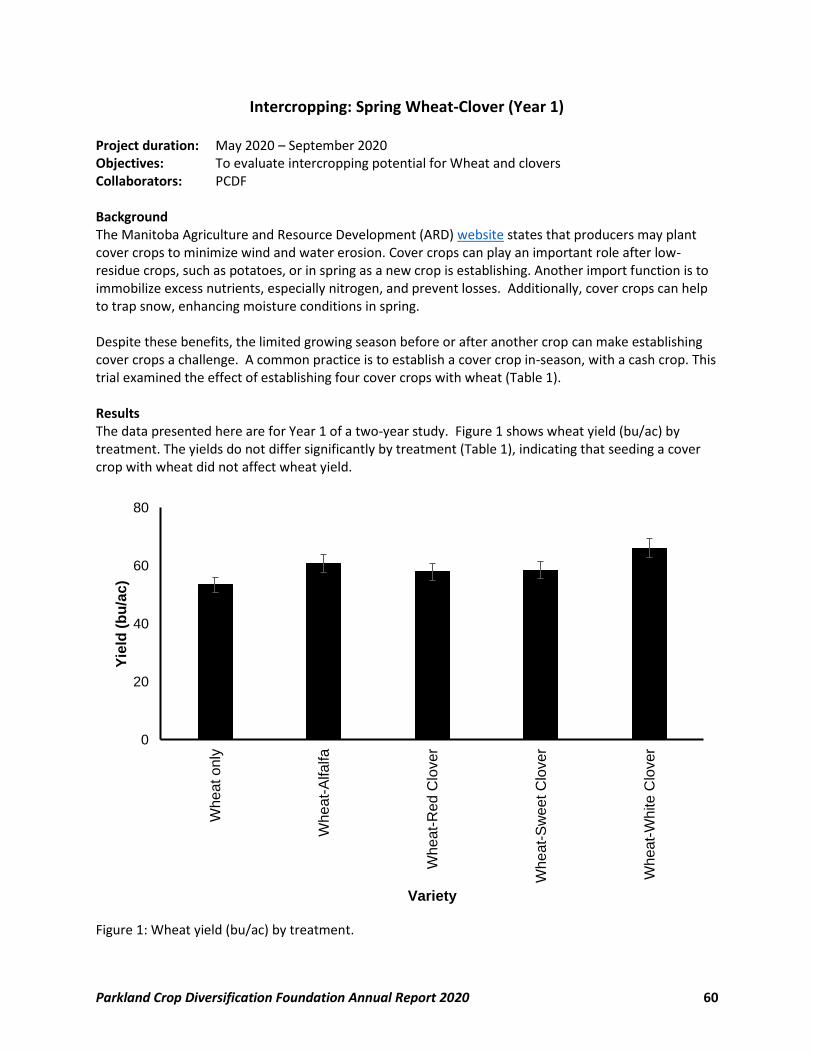
Parkland Crop Diversification Foundation Annual Report 2020 60
Intercropping: Spring Wheat-Clover (Year 1) Project duration: May 2020 – September 2020 Objectives: To evaluate intercropping potential for Wheat and clovers Collaborators: PCDF Background The Manitoba Agriculture and Resource Development (ARD) website states that producers may plant cover crops to minimize wind and water erosion. Cover crops can play an important role after low-residue crops, such as potatoes, or in spring as a new crop is establishing. Another import function is to immobilize excess nutrients, especially nitrogen, and prevent losses. Additionally, cover crops can help to trap snow, enhancing moisture conditions in spring. Despite these benefits, the limited growing season before or after another crop can make establishing cover crops a challenge. A common practice is to establish a cover crop in-season, with a cash crop. This trial examined the effect of establishing four cover crops with wheat (Table 1). Results The data presented here are for Year 1 of a two-year study. Figure 1 shows wheat yield (bu/ac) by treatment. The yields do not differ significantly by treatment (Table 1), indicating that seeding a cover crop with wheat did not affect wheat yield.
Figure 1: Wheat yield (bu/ac) by treatment.
0
20
40
60
80
Wh
eat o
nly
Wh
eat-
Alfa
lfa
Wh
eat-
Re
d C
lover
Wh
eat-
Sw
eet C
lover
Wh
eat-
Wh
ite
Clo
ver
Yie
ld (
bu
/ac)
Variety
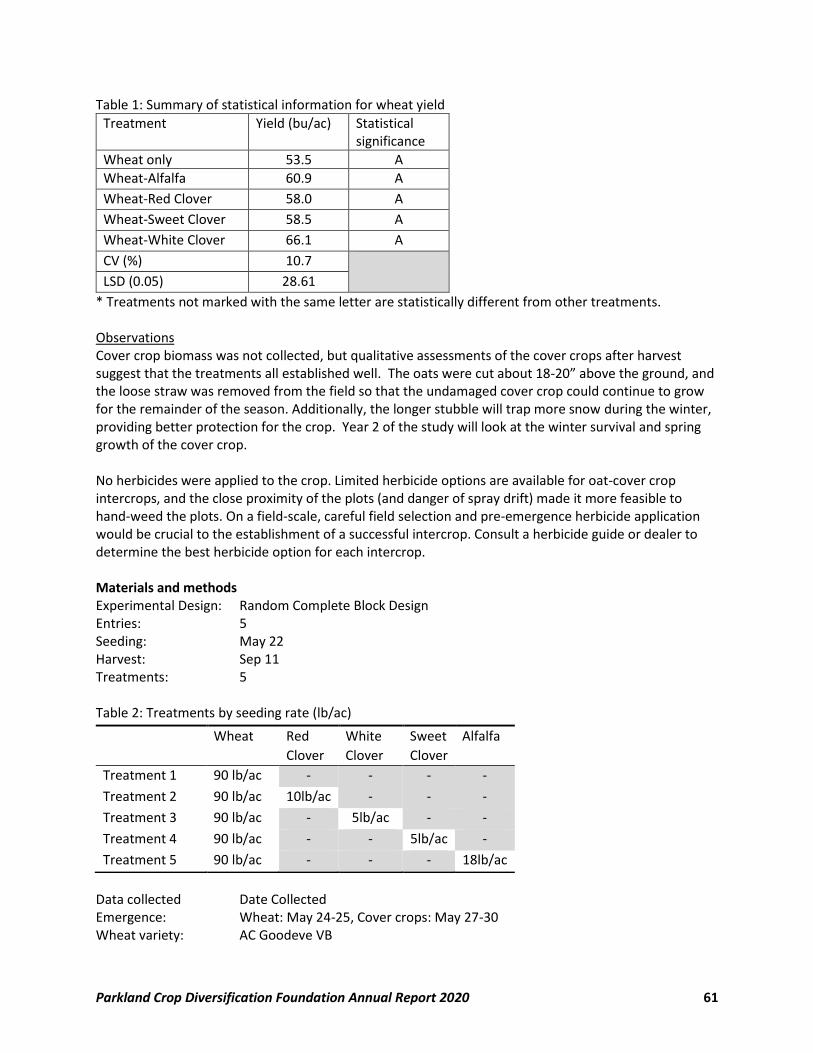
Parkland Crop Diversification Foundation Annual Report 2020 61
Table 1: Summary of statistical information for wheat yield
Treatment Yield (bu/ac) Statistical significance
Wheat only 53.5 A
Wheat-Alfalfa 60.9 A
Wheat-Red Clover 58.0 A
Wheat-Sweet Clover 58.5 A
Wheat-White Clover 66.1 A
CV (%) 10.7
LSD (0.05) 28.61
* Treatments not marked with the same letter are statistically different from other treatments. Observations Cover crop biomass was not collected, but qualitative assessments of the cover crops after harvest suggest that the treatments all established well. The oats were cut about 18-20” above the ground, and the loose straw was removed from the field so that the undamaged cover crop could continue to grow for the remainder of the season. Additionally, the longer stubble will trap more snow during the winter, providing better protection for the crop. Year 2 of the study will look at the winter survival and spring growth of the cover crop. No herbicides were applied to the crop. Limited herbicide options are available for oat-cover crop intercrops, and the close proximity of the plots (and danger of spray drift) made it more feasible to hand-weed the plots. On a field-scale, careful field selection and pre-emergence herbicide application would be crucial to the establishment of a successful intercrop. Consult a herbicide guide or dealer to determine the best herbicide option for each intercrop. Materials and methods Experimental Design: Random Complete Block Design Entries: 5 Seeding: May 22 Harvest: Sep 11 Treatments: 5 Table 2: Treatments by seeding rate (lb/ac)
Data collected Date Collected Emergence: Wheat: May 24-25, Cover crops: May 27-30 Wheat variety: AC Goodeve VB
Wheat Red
Clover
White
Clover
Sweet
Clover
Alfalfa
Treatment 1 90 lb/ac - - - -
Treatment 2 90 lb/ac 10lb/ac - - -
Treatment 3 90 lb/ac - 5lb/ac - -
Treatment 4 90 lb/ac - - 5lb/ac -
Treatment 5 90 lb/ac - - - 18lb/ac
Parkland Crop Diversification Foundation Annual Report 2020 62
Wheat Heading: Jul 5-8 Stand rating: Jul Vigor Rating: Jul Yield: Sep 11 Moisture: Sep 11 Agronomic info Previous year’s crop: Barley Silage Soil Type: Erickson Loam Clay Landscape: Rolling with trees to the east Seedbed preparation: Heavy harrowed Table 3: Fertility Information
Available Added Type
N 61 lb/ac 128 lb/ac 46-0-0
P 47 ppm 10 lb/ac 11-52-0-0
K 393ppm
Cover crops inoculated; no herbicide applied
(hand weeded)
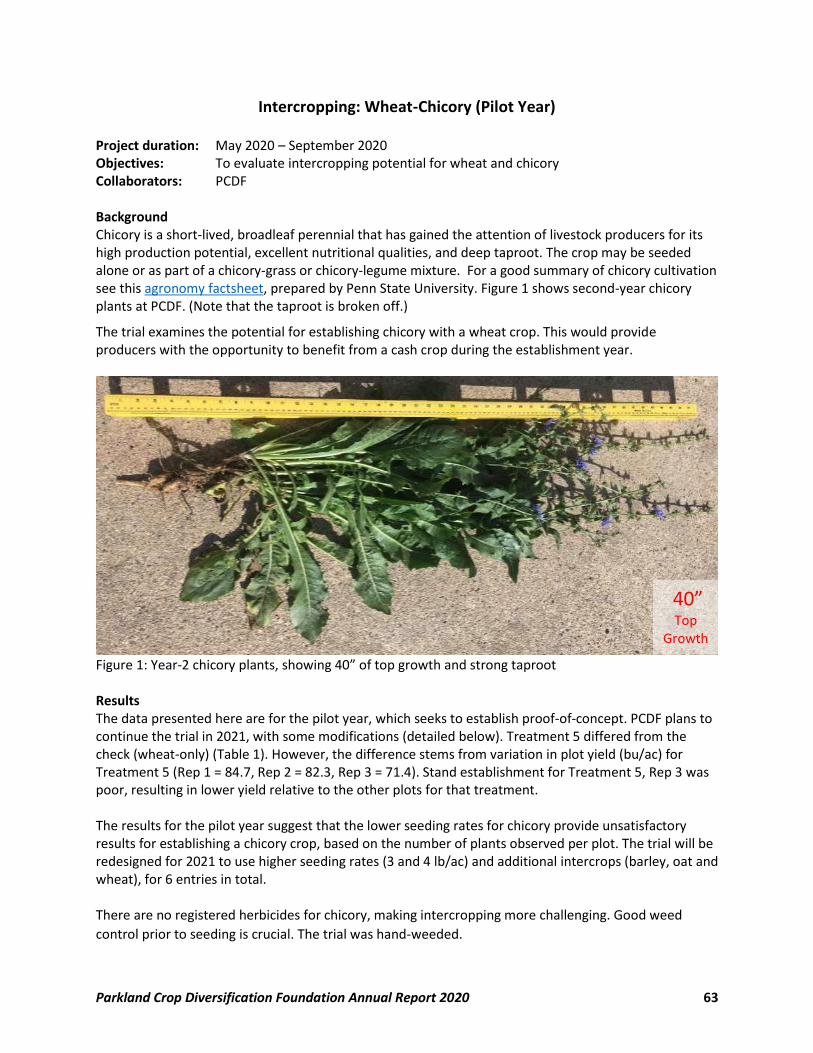
Parkland Crop Diversification Foundation Annual Report 2020 63
Intercropping: Wheat-Chicory (Pilot Year) Project duration: May 2020 – September 2020 Objectives: To evaluate intercropping potential for wheat and chicory Collaborators: PCDF Background Chicory is a short-lived, broadleaf perennial that has gained the attention of livestock producers for its high production potential, excellent nutritional qualities, and deep taproot. The crop may be seeded alone or as part of a chicory-grass or chicory-legume mixture. For a good summary of chicory cultivation see this agronomy factsheet, prepared by Penn State University. Figure 1 shows second-year chicory plants at PCDF. (Note that the taproot is broken off.)
The trial examines the potential for establishing chicory with a wheat crop. This would provide producers with the opportunity to benefit from a cash crop during the establishment year.
Figure 1: Year-2 chicory plants, showing 40” of top growth and strong taproot Results The data presented here are for the pilot year, which seeks to establish proof-of-concept. PCDF plans to continue the trial in 2021, with some modifications (detailed below). Treatment 5 differed from the check (wheat-only) (Table 1). However, the difference stems from variation in plot yield (bu/ac) for Treatment 5 (Rep 1 = 84.7, Rep 2 = 82.3, Rep 3 = 71.4). Stand establishment for Treatment 5, Rep 3 was poor, resulting in lower yield relative to the other plots for that treatment. The results for the pilot year suggest that the lower seeding rates for chicory provide unsatisfactory results for establishing a chicory crop, based on the number of plants observed per plot. The trial will be redesigned for 2021 to use higher seeding rates (3 and 4 lb/ac) and additional intercrops (barley, oat and wheat), for 6 entries in total. There are no registered herbicides for chicory, making intercropping more challenging. Good weed
control prior to seeding is crucial. The trial was hand-weeded.
40” Top
Growth
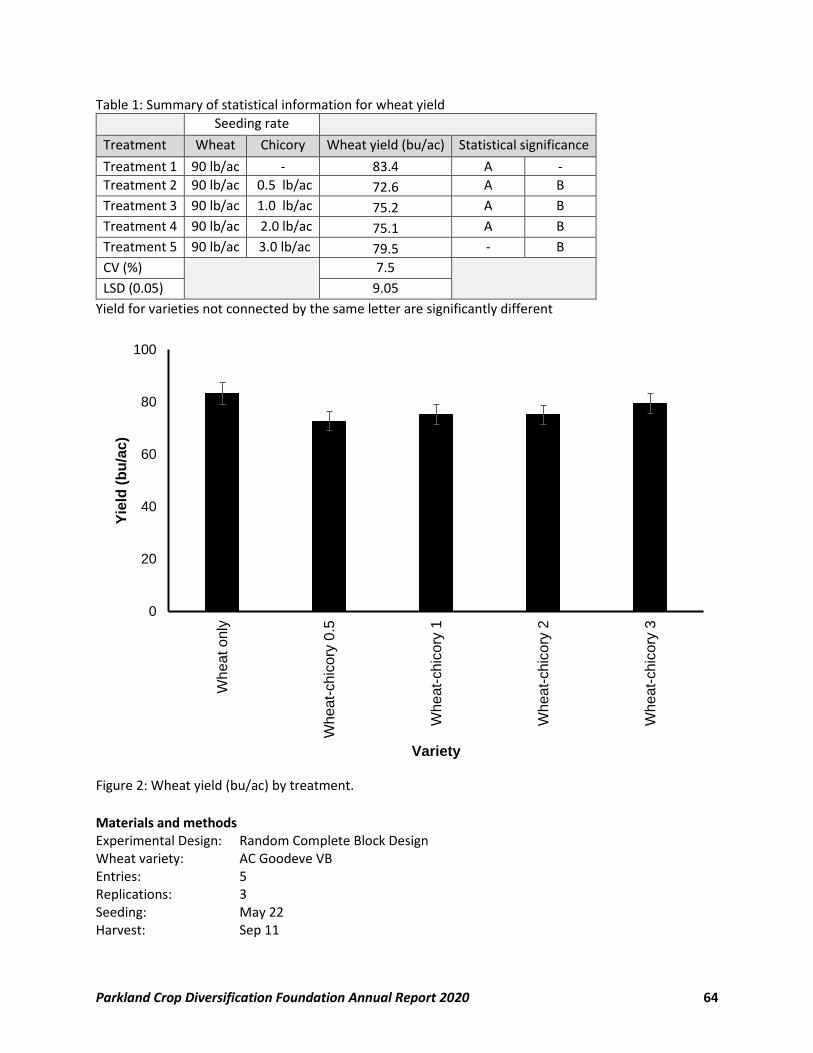
Parkland Crop Diversification Foundation Annual Report 2020 64
Table 1: Summary of statistical information for wheat yield Seeding rate
Treatment Wheat Chicory Wheat yield (bu/ac) Statistical significance
Treatment 1 90 lb/ac - 83.4 A -
Treatment 2 90 lb/ac 0.5 lb/ac 72.6 A B
Treatment 3 90 lb/ac 1.0 lb/ac 75.2 A B
Treatment 4 90 lb/ac 2.0 lb/ac 75.1 A B
Treatment 5 90 lb/ac 3.0 lb/ac 79.5 - B
CV (%) 7.5
LSD (0.05) 9.05
Yield for varieties not connected by the same letter are significantly different
Figure 2: Wheat yield (bu/ac) by treatment.
Materials and methods Experimental Design: Random Complete Block Design Wheat variety: AC Goodeve VB Entries: 5 Replications: 3 Seeding: May 22 Harvest: Sep 11
0
20
40
60
80
100
Wh
eat o
nly
Wh
eat-
ch
ico
ry 0
.5
Wh
eat-
ch
ico
ry 1
Wh
eat-
ch
ico
ry 2
Wh
eat-
ch
ico
ry 3
Yie
ld (
bu
/ac)
Variety
Parkland Crop Diversification Foundation Annual Report 2020 65
Data collected Date Collected Emergence: Oat: May 24-25, Clover: May 27-30 Wheat Heading: Jul 5-8 Stand rating: Jul Vigor Rating: Jul Yield: Sep 11 Moisture: Sep 11
Agronomic info Previous year’s crop: Barley Silage Soil Type: Erickson Loam Clay Landscape: Rolling with trees to the east Seedbed preparation: Heavy harrowed Table 3: Fertility Information
No herbicide applied (hand weeded)
Available Added Type
N 61 lb/ac 128 lb/ac 46-0-0
P 47 ppm 10 lb/ac 11-52-0-0
K
393ppm
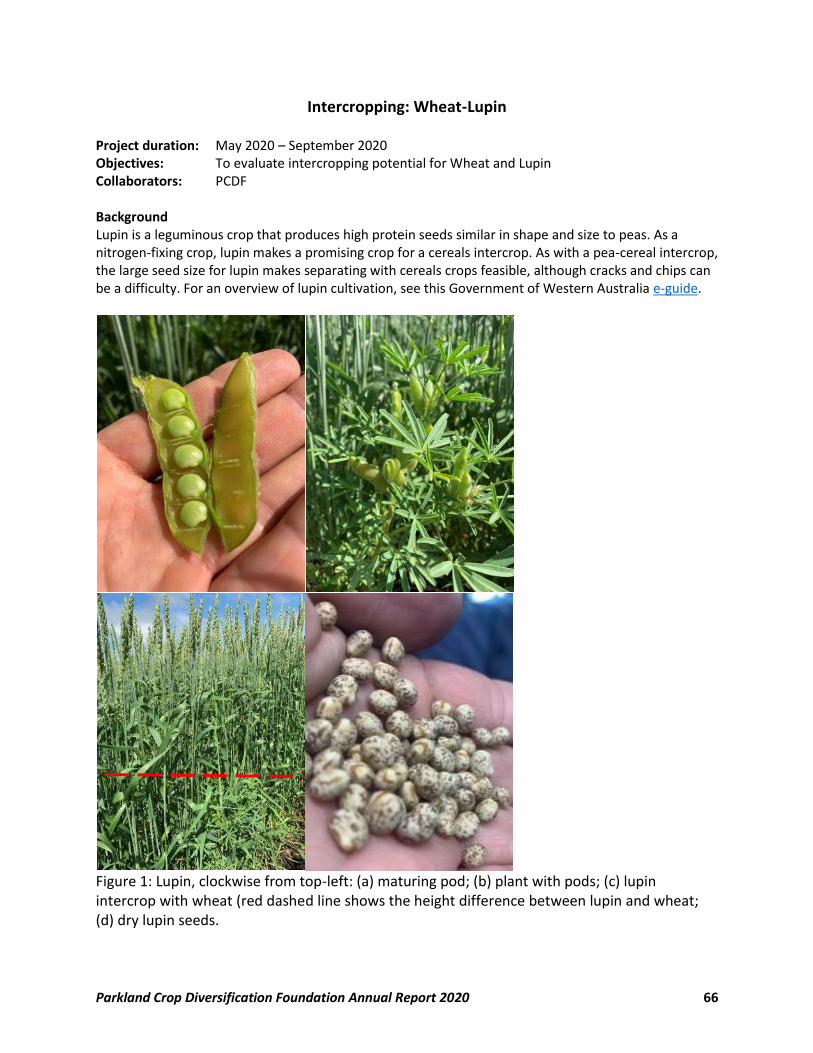
Parkland Crop Diversification Foundation Annual Report 2020 66
Intercropping: Wheat-Lupin Project duration: May 2020 – September 2020 Objectives: To evaluate intercropping potential for Wheat and Lupin Collaborators: PCDF Background Lupin is a leguminous crop that produces high protein seeds similar in shape and size to peas. As a nitrogen-fixing crop, lupin makes a promising crop for a cereals intercrop. As with a pea-cereal intercrop, the large seed size for lupin makes separating with cereals crops feasible, although cracks and chips can be a difficulty. For an overview of lupin cultivation, see this Government of Western Australia e-guide.
Figure 1: Lupin, clockwise from top-left: (a) maturing pod; (b) plant with pods; (c) lupin intercrop with wheat (red dashed line shows the height difference between lupin and wheat; (d) dry lupin seeds.
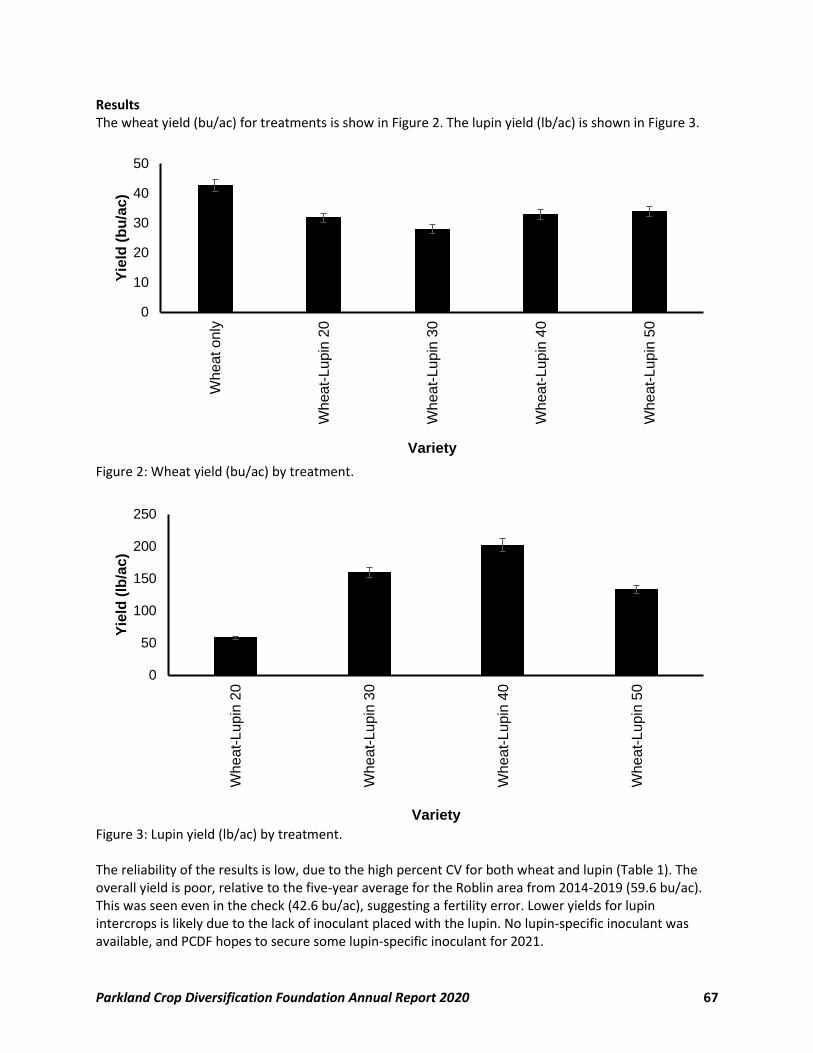
Parkland Crop Diversification Foundation Annual Report 2020 67
Results The wheat yield (bu/ac) for treatments is show in Figure 2. The lupin yield (lb/ac) is shown in Figure 3.
Figure 2: Wheat yield (bu/ac) by treatment.
Figure 3: Lupin yield (lb/ac) by treatment. The reliability of the results is low, due to the high percent CV for both wheat and lupin (Table 1). The overall yield is poor, relative to the five-year average for the Roblin area from 2014-2019 (59.6 bu/ac). This was seen even in the check (42.6 bu/ac), suggesting a fertility error. Lower yields for lupin intercrops is likely due to the lack of inoculant placed with the lupin. No lupin-specific inoculant was available, and PCDF hopes to secure some lupin-specific inoculant for 2021.
0
10
20
30
40
50
Wh
eat o
nly
Wh
eat-
Lup
in 2
0
Wh
eat-
Lup
in 3
0
Wh
eat-
Lup
in 4
0
Wh
eat-
Lup
in 5
0
Yie
ld (
bu
/ac)
Variety
0
50
100
150
200
250
Wh
eat-
Lup
in 2
0
Wh
eat-
Lup
in 3
0
Wh
eat-
Lup
in 4
0
Wh
eat-
Lup
in 5
0
Yie
ld (
lb/a
c)
Variety
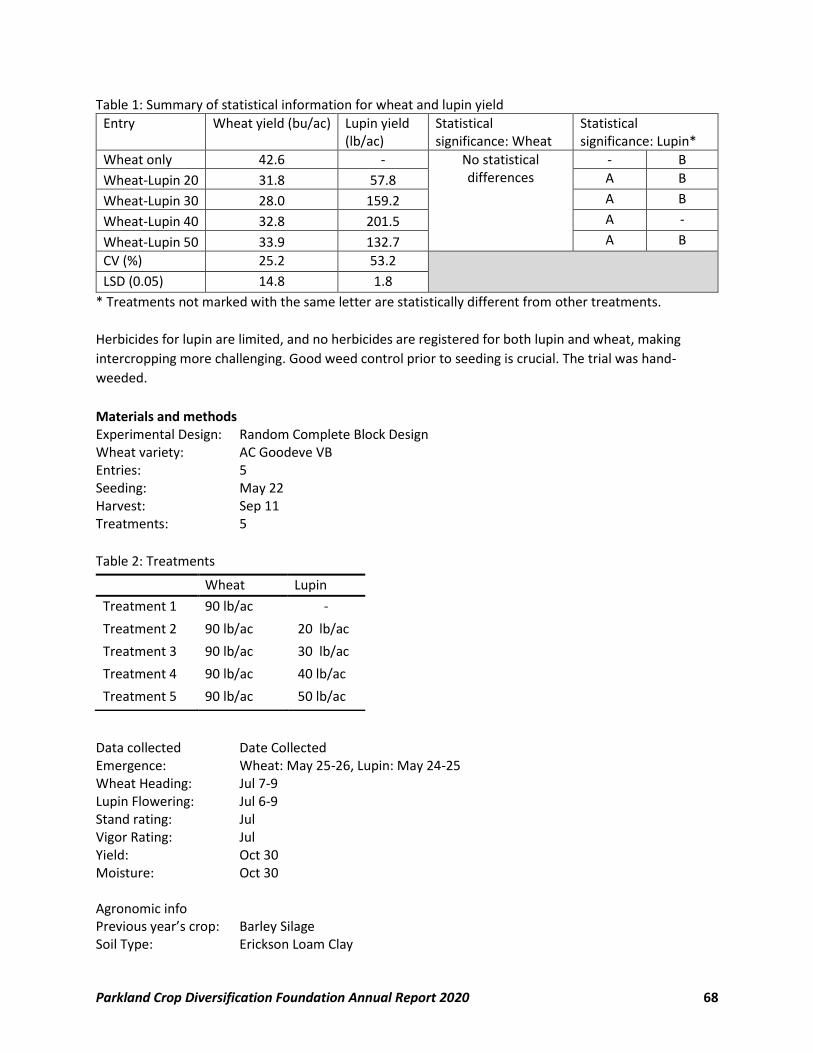
Parkland Crop Diversification Foundation Annual Report 2020 68
Table 1: Summary of statistical information for wheat and lupin yield
Entry Wheat yield (bu/ac) Lupin yield (lb/ac)
Statistical significance: Wheat
Statistical significance: Lupin*
Wheat only 42.6 - No statistical differences
- B
Wheat-Lupin 20 31.8 57.8 A B
Wheat-Lupin 30 28.0 159.2 A B
Wheat-Lupin 40 32.8 201.5 A -
Wheat-Lupin 50 33.9 132.7 A B
CV (%) 25.2 53.2
LSD (0.05) 14.8 1.8
* Treatments not marked with the same letter are statistically different from other treatments.
Herbicides for lupin are limited, and no herbicides are registered for both lupin and wheat, making
intercropping more challenging. Good weed control prior to seeding is crucial. The trial was hand-
weeded.
Materials and methods Experimental Design: Random Complete Block Design Wheat variety: AC Goodeve VB Entries: 5 Seeding: May 22 Harvest: Sep 11 Treatments: 5
Table 2: Treatments
Data collected Date Collected Emergence: Wheat: May 25-26, Lupin: May 24-25 Wheat Heading: Jul 7-9 Lupin Flowering: Jul 6-9 Stand rating: Jul Vigor Rating: Jul Yield: Oct 30 Moisture: Oct 30 Agronomic info Previous year’s crop: Barley Silage Soil Type: Erickson Loam Clay
Wheat Lupin
Treatment 1 90 lb/ac -
Treatment 2 90 lb/ac 20 lb/ac
Treatment 3 90 lb/ac 30 lb/ac
Treatment 4 90 lb/ac 40 lb/ac
Treatment 5 90 lb/ac 50 lb/ac
Parkland Crop Diversification Foundation Annual Report 2020 69
Landscape: Rolling with trees to the east Seedbed preparation: Heavy harrowed Table 3: Fertility Information
Available Added Type
N 61 lb/ac 128 lb/ac 46-0-0
P 47 ppm 10 lb/ac 11-52-0-0
K 393ppm
Inoculant added; no herbicide applied
(hand weeded)
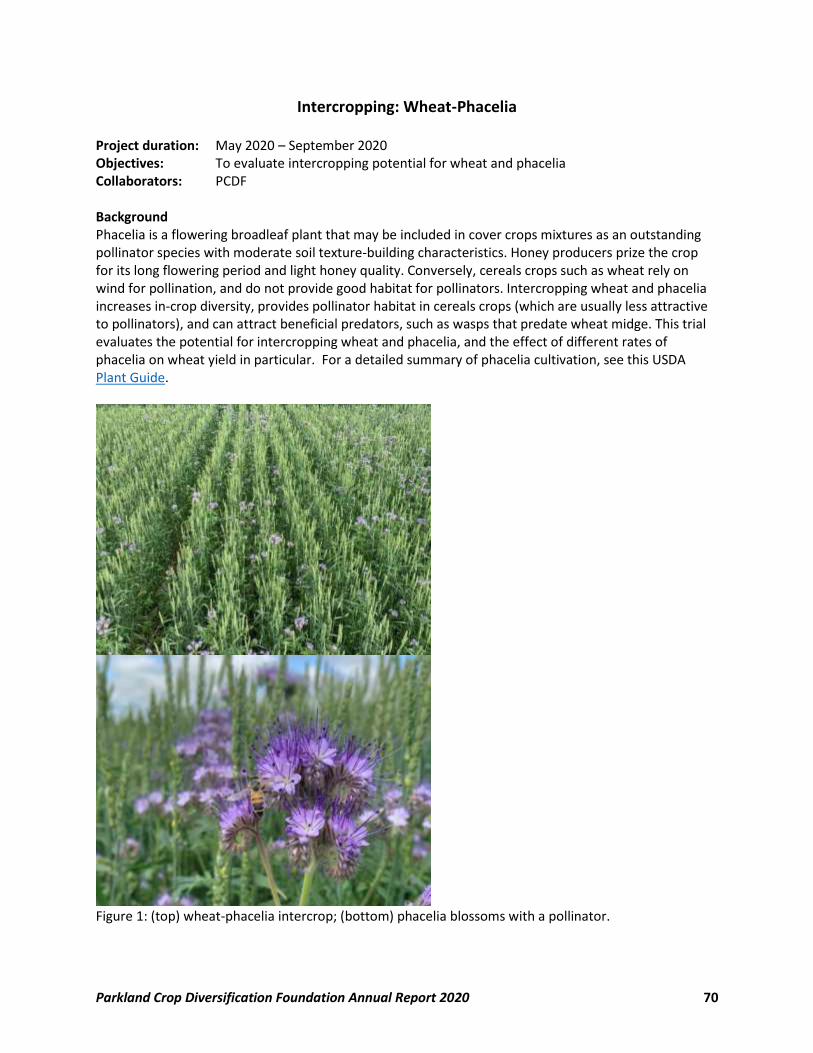
Parkland Crop Diversification Foundation Annual Report 2020 70
Intercropping: Wheat-Phacelia Project duration: May 2020 – September 2020 Objectives: To evaluate intercropping potential for wheat and phacelia Collaborators: PCDF Background Phacelia is a flowering broadleaf plant that may be included in cover crops mixtures as an outstanding pollinator species with moderate soil texture-building characteristics. Honey producers prize the crop for its long flowering period and light honey quality. Conversely, cereals crops such as wheat rely on wind for pollination, and do not provide good habitat for pollinators. Intercropping wheat and phacelia increases in-crop diversity, provides pollinator habitat in cereals crops (which are usually less attractive to pollinators), and can attract beneficial predators, such as wasps that predate wheat midge. This trial evaluates the potential for intercropping wheat and phacelia, and the effect of different rates of phacelia on wheat yield in particular. For a detailed summary of phacelia cultivation, see this USDA Plant Guide.
Figure 1: (top) wheat-phacelia intercrop; (bottom) phacelia blossoms with a pollinator.
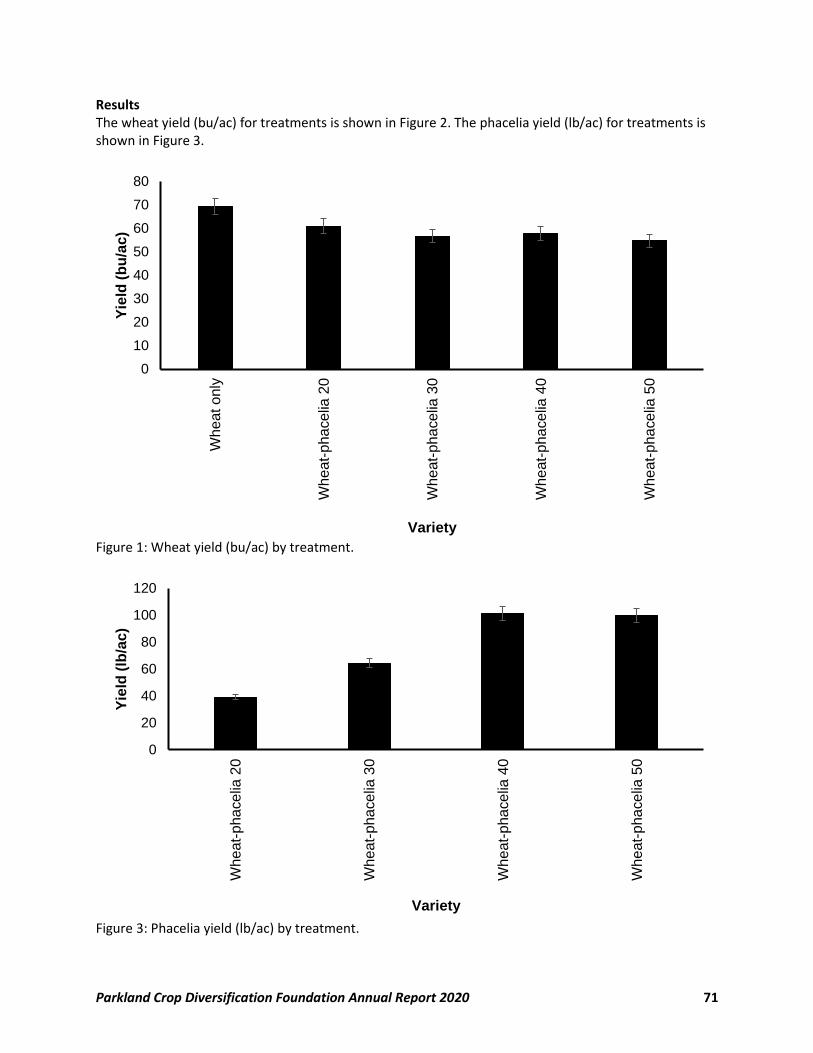
Parkland Crop Diversification Foundation Annual Report 2020 71
Results The wheat yield (bu/ac) for treatments is shown in Figure 2. The phacelia yield (lb/ac) for treatments is shown in Figure 3.
Figure 1: Wheat yield (bu/ac) by treatment.
Figure 3: Phacelia yield (lb/ac) by treatment.
0
10
20
30
40
50
60
70
80
Wh
eat o
nly
Wh
eat-
pha
ce
lia 2
0
Wh
eat-
pha
ce
lia 3
0
Wh
eat-
pha
ce
lia 4
0
Wh
eat-
pha
ce
lia 5
0
Yie
ld (
bu
/ac)
Variety
0
20
40
60
80
100
120
Wh
eat-
pha
ce
lia 2
0
Wh
eat-
pha
ce
lia 3
0
Wh
eat-
pha
ce
lia 4
0
Wh
eat-
pha
ce
lia 5
0
Yie
ld (
lb/a
c)
Variety
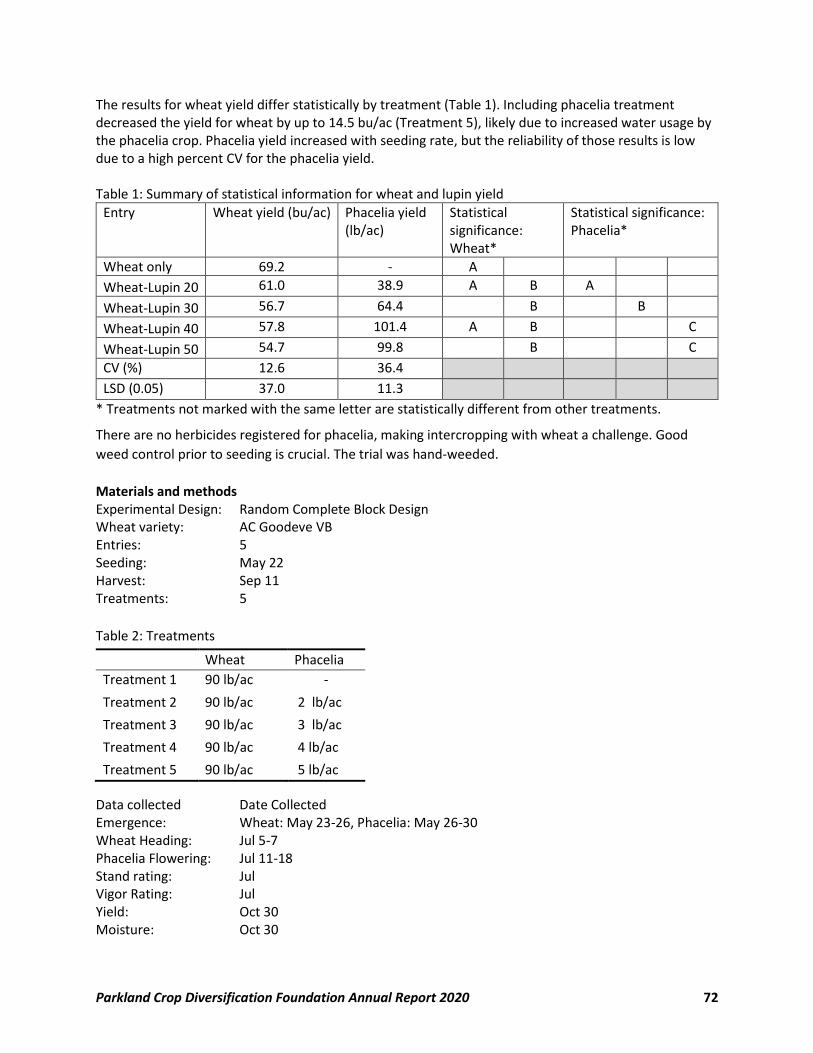
Parkland Crop Diversification Foundation Annual Report 2020 72
The results for wheat yield differ statistically by treatment (Table 1). Including phacelia treatment decreased the yield for wheat by up to 14.5 bu/ac (Treatment 5), likely due to increased water usage by the phacelia crop. Phacelia yield increased with seeding rate, but the reliability of those results is low due to a high percent CV for the phacelia yield. Table 1: Summary of statistical information for wheat and lupin yield
Entry Wheat yield (bu/ac) Phacelia yield (lb/ac)
Statistical significance: Wheat*
Statistical significance: Phacelia*
Wheat only 69.2 - A
Wheat-Lupin 20 61.0 38.9 A B A
Wheat-Lupin 30 56.7 64.4 B B
Wheat-Lupin 40 57.8 101.4 A B C
Wheat-Lupin 50 54.7 99.8 B C
CV (%) 12.6 36.4
LSD (0.05) 37.0 11.3
* Treatments not marked with the same letter are statistically different from other treatments.
There are no herbicides registered for phacelia, making intercropping with wheat a challenge. Good
weed control prior to seeding is crucial. The trial was hand-weeded.
Materials and methods Experimental Design: Random Complete Block Design Wheat variety: AC Goodeve VB Entries: 5 Seeding: May 22 Harvest: Sep 11 Treatments: 5
Table 2: Treatments
Data collected Date Collected Emergence: Wheat: May 23-26, Phacelia: May 26-30 Wheat Heading: Jul 5-7 Phacelia Flowering: Jul 11-18 Stand rating: Jul Vigor Rating: Jul Yield: Oct 30 Moisture: Oct 30
Wheat Phacelia
Treatment 1 90 lb/ac -
Treatment 2 90 lb/ac 2 lb/ac
Treatment 3 90 lb/ac 3 lb/ac
Treatment 4 90 lb/ac 4 lb/ac
Treatment 5 90 lb/ac 5 lb/ac
Parkland Crop Diversification Foundation Annual Report 2020 73
Agronomic info Previous year’s crop: Barley Silage Soil Type: Erickson Loam Clay Landscape: Rolling with trees to the east Seedbed preparation: Heavy harrowed Table 3: Fertility Information
No herbicide applied (hand weeded)
Available Added Type
N 61 lb/ac 128 lb/ac 46-0-0
P 47 ppm 10 lb/ac 11-52-0-0
K 393ppm
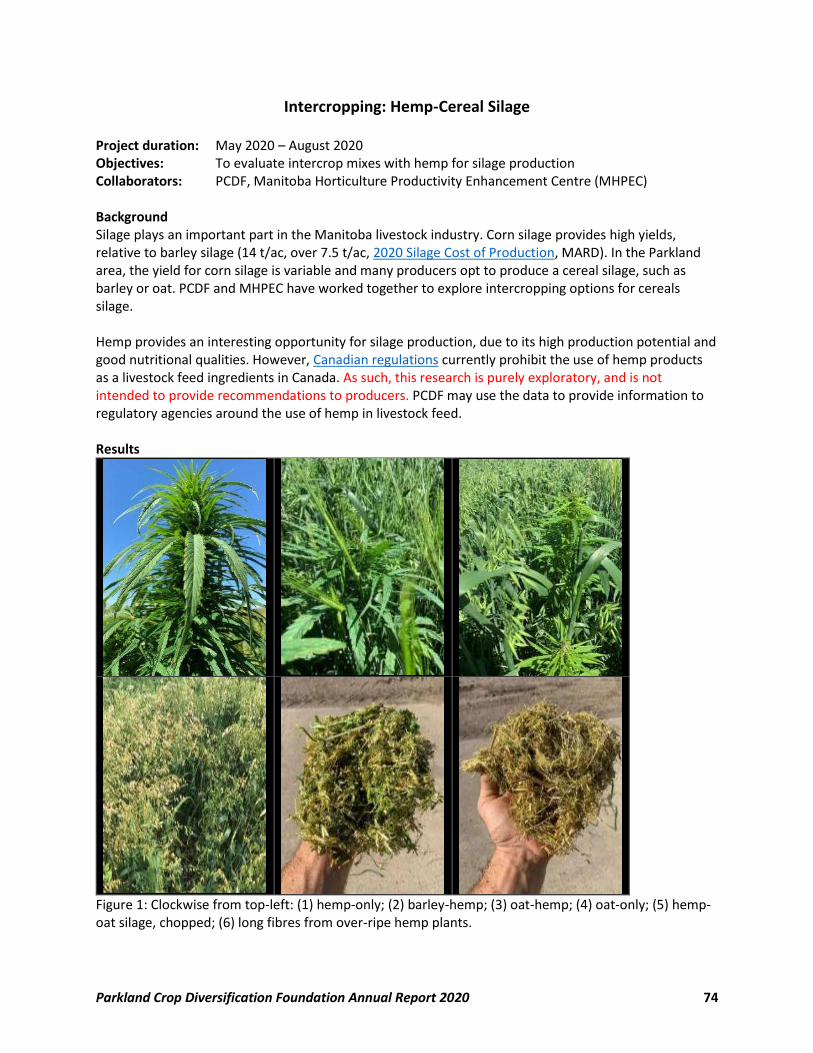
Parkland Crop Diversification Foundation Annual Report 2020 74
Intercropping: Hemp-Cereal Silage Project duration: May 2020 – August 2020 Objectives: To evaluate intercrop mixes with hemp for silage production Collaborators: PCDF, Manitoba Horticulture Productivity Enhancement Centre (MHPEC) Background Silage plays an important part in the Manitoba livestock industry. Corn silage provides high yields, relative to barley silage (14 t/ac, over 7.5 t/ac, 2020 Silage Cost of Production, MARD). In the Parkland area, the yield for corn silage is variable and many producers opt to produce a cereal silage, such as barley or oat. PCDF and MHPEC have worked together to explore intercropping options for cereals silage. Hemp provides an interesting opportunity for silage production, due to its high production potential and good nutritional qualities. However, Canadian regulations currently prohibit the use of hemp products as a livestock feed ingredients in Canada. As such, this research is purely exploratory, and is not intended to provide recommendations to producers. PCDF may use the data to provide information to regulatory agencies around the use of hemp in livestock feed. Results
Figure 1: Clockwise from top-left: (1) hemp-only; (2) barley-hemp; (3) oat-hemp; (4) oat-only; (5) hemp-oat silage, chopped; (6) long fibres from over-ripe hemp plants.
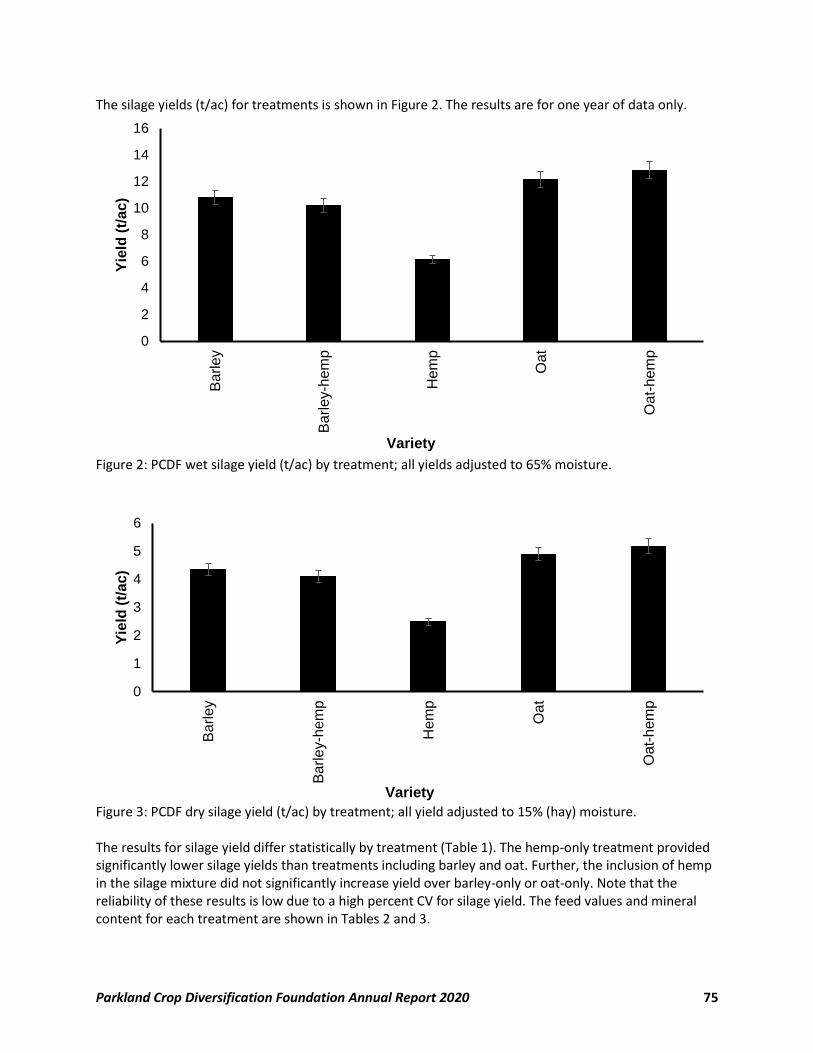
Parkland Crop Diversification Foundation Annual Report 2020 75
The silage yields (t/ac) for treatments is shown in Figure 2. The results are for one year of data only.
Figure 2: PCDF wet silage yield (t/ac) by treatment; all yields adjusted to 65% moisture.
Figure 3: PCDF dry silage yield (t/ac) by treatment; all yield adjusted to 15% (hay) moisture. The results for silage yield differ statistically by treatment (Table 1). The hemp-only treatment provided significantly lower silage yields than treatments including barley and oat. Further, the inclusion of hemp in the silage mixture did not significantly increase yield over barley-only or oat-only. Note that the reliability of these results is low due to a high percent CV for silage yield. The feed values and mineral content for each treatment are shown in Tables 2 and 3.
0
2
4
6
8
10
12
14
16
Ba
rley
Ba
rley-h
em
p
He
mp
Oa
t
Oa
t-h
em
p
Yie
ld (
t/a
c)
Variety
0
1
2
3
4
5
6
Ba
rley
Ba
rley-h
em
p
He
mp
Oa
t
Oat-
hem
p
Yie
ld (
t/a
c)
Variety
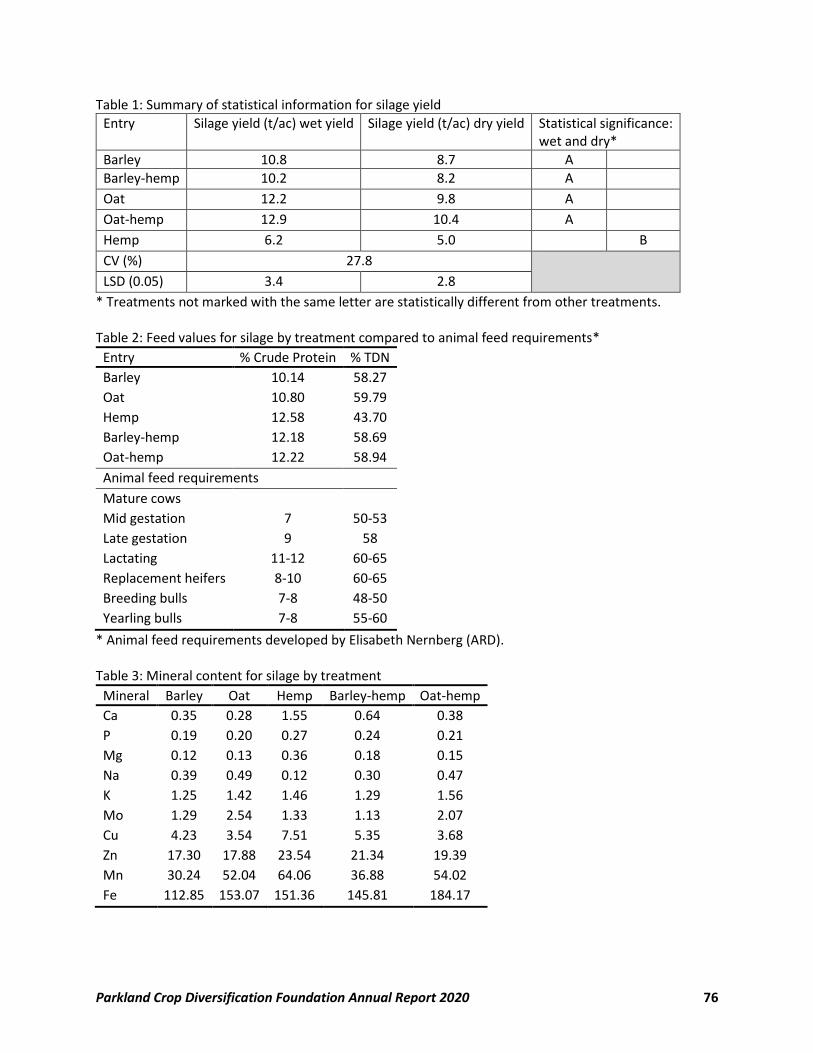
Parkland Crop Diversification Foundation Annual Report 2020 76
Table 1: Summary of statistical information for silage yield
Entry Silage yield (t/ac) wet yield Silage yield (t/ac) dry yield Statistical significance: wet and dry*
Barley 10.8 8.7 A
Barley-hemp 10.2 8.2 A
Oat 12.2 9.8 A
Oat-hemp 12.9 10.4 A
Hemp 6.2 5.0 B
CV (%) 27.8
LSD (0.05) 3.4 2.8
* Treatments not marked with the same letter are statistically different from other treatments. Table 2: Feed values for silage by treatment compared to animal feed requirements*
Entry % Crude Protein % TDN
Barley 10.14 58.27
Oat 10.80 59.79
Hemp 12.58 43.70
Barley-hemp 12.18 58.69
Oat-hemp 12.22 58.94
Animal feed requirements
Mature cows
Mid gestation 7 50-53
Late gestation 9 58
Lactating 11-12 60-65
Replacement heifers 8-10 60-65
Breeding bulls 7-8 48-50
Yearling bulls 7-8 55-60
* Animal feed requirements developed by Elisabeth Nernberg (ARD). Table 3: Mineral content for silage by treatment
Mineral Barley Oat Hemp Barley-hemp Oat-hemp
Ca 0.35 0.28 1.55 0.64 0.38
P 0.19 0.20 0.27 0.24 0.21
Mg 0.12 0.13 0.36 0.18 0.15
Na 0.39 0.49 0.12 0.30 0.47
K 1.25 1.42 1.46 1.29 1.56
Mo 1.29 2.54 1.33 1.13 2.07
Cu 4.23 3.54 7.51 5.35 3.68
Zn 17.30 17.88 23.54 21.34 19.39
Mn 30.24 52.04 64.06 36.88 54.02
Fe 112.85 153.07 151.36 145.81 184.17
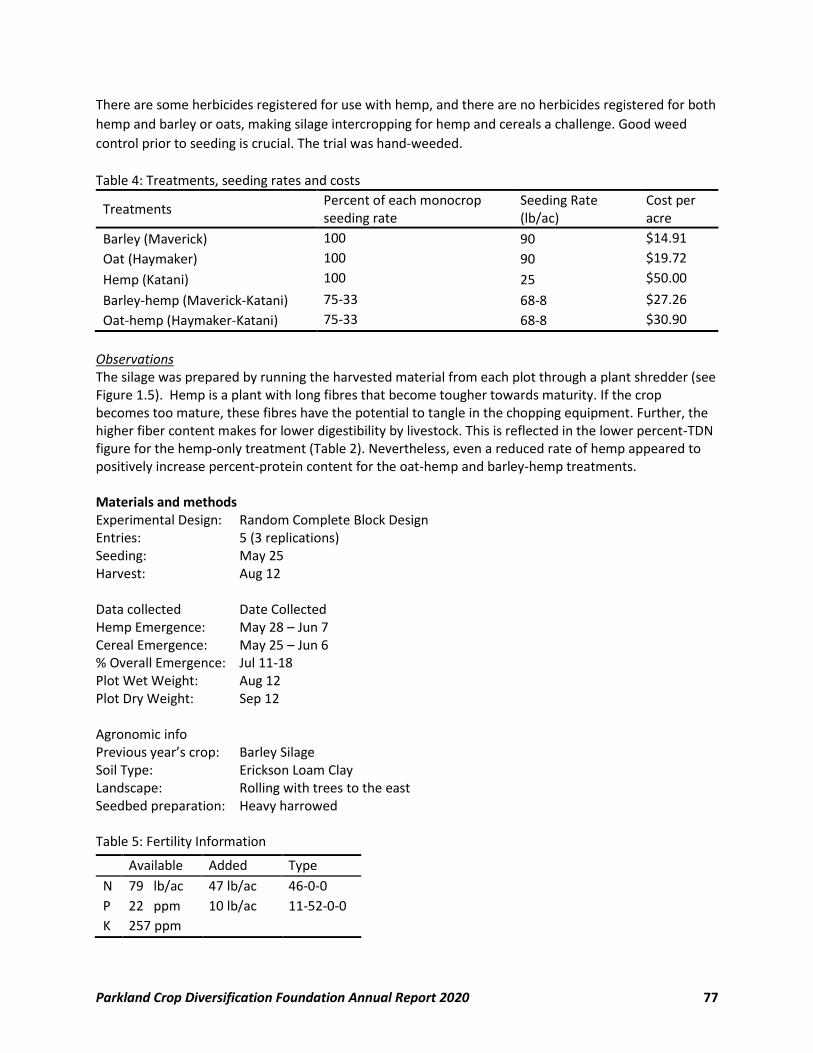
Parkland Crop Diversification Foundation Annual Report 2020 77
There are some herbicides registered for use with hemp, and there are no herbicides registered for both
hemp and barley or oats, making silage intercropping for hemp and cereals a challenge. Good weed
control prior to seeding is crucial. The trial was hand-weeded.
Table 4: Treatments, seeding rates and costs
Treatments Percent of each monocrop seeding rate
Seeding Rate (lb/ac)
Cost per acre
Barley (Maverick) 100 90 $14.91
Oat (Haymaker) 100 90 $19.72
Hemp (Katani) 100 25 $50.00
Barley-hemp (Maverick-Katani) 75-33 68-8 $27.26
Oat-hemp (Haymaker-Katani) 75-33 68-8 $30.90
Observations The silage was prepared by running the harvested material from each plot through a plant shredder (see Figure 1.5). Hemp is a plant with long fibres that become tougher towards maturity. If the crop becomes too mature, these fibres have the potential to tangle in the chopping equipment. Further, the higher fiber content makes for lower digestibility by livestock. This is reflected in the lower percent-TDN figure for the hemp-only treatment (Table 2). Nevertheless, even a reduced rate of hemp appeared to positively increase percent-protein content for the oat-hemp and barley-hemp treatments. Materials and methods Experimental Design: Random Complete Block Design Entries: 5 (3 replications) Seeding: May 25 Harvest: Aug 12 Data collected Date Collected Hemp Emergence: May 28 – Jun 7 Cereal Emergence: May 25 – Jun 6 % Overall Emergence: Jul 11-18 Plot Wet Weight: Aug 12 Plot Dry Weight: Sep 12 Agronomic info Previous year’s crop: Barley Silage Soil Type: Erickson Loam Clay Landscape: Rolling with trees to the east Seedbed preparation: Heavy harrowed Table 5: Fertility Information
Available Added Type
N 79 lb/ac 47 lb/ac 46-0-0
P 22 ppm 10 lb/ac 11-52-0-0
K 257 ppm
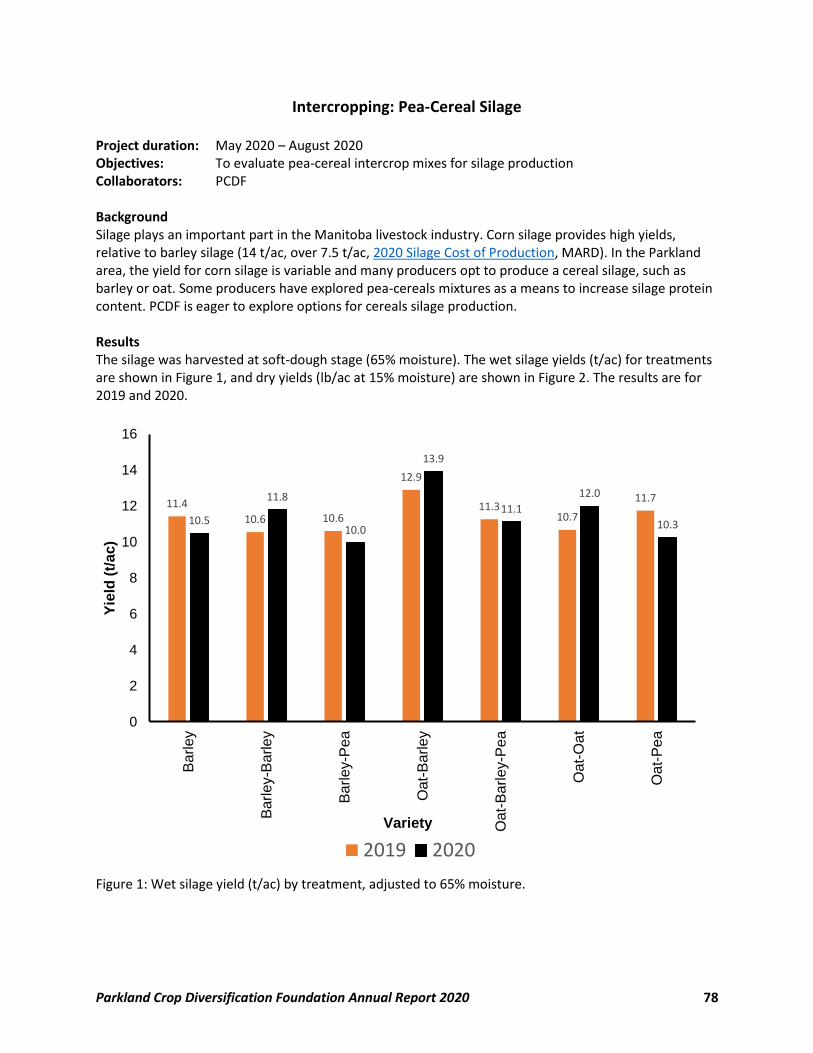
Parkland Crop Diversification Foundation Annual Report 2020 78
Intercropping: Pea-Cereal Silage Project duration: May 2020 – August 2020 Objectives: To evaluate pea-cereal intercrop mixes for silage production Collaborators: PCDF Background Silage plays an important part in the Manitoba livestock industry. Corn silage provides high yields, relative to barley silage (14 t/ac, over 7.5 t/ac, 2020 Silage Cost of Production, MARD). In the Parkland area, the yield for corn silage is variable and many producers opt to produce a cereal silage, such as barley or oat. Some producers have explored pea-cereals mixtures as a means to increase silage protein content. PCDF is eager to explore options for cereals silage production. Results The silage was harvested at soft-dough stage (65% moisture). The wet silage yields (t/ac) for treatments are shown in Figure 1, and dry yields (lb/ac at 15% moisture) are shown in Figure 2. The results are for 2019 and 2020.
Figure 1: Wet silage yield (t/ac) by treatment, adjusted to 65% moisture.
11.4
10.6 10.6
12.9
11.310.7
11.7
10.5
11.8
10.0
13.9
11.1
12.0
10.3
0
2
4
6
8
10
12
14
16
Ba
rley
Ba
rley-B
arle
y
Ba
rley-P
ea
Oa
t-B
arley
Oa
t-B
arley-P
ea
Oa
t-O
at
Oa
t-P
ea
Yie
ld (
t/a
c)
Variety
2019 2020
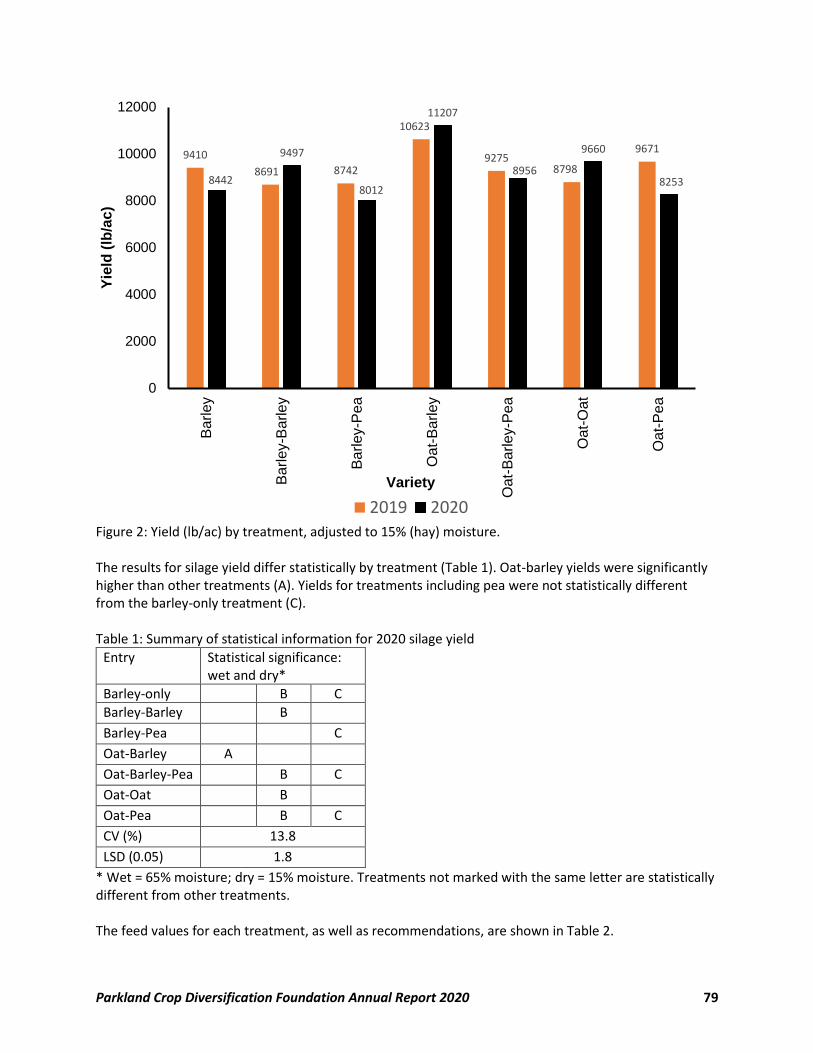
Parkland Crop Diversification Foundation Annual Report 2020 79
Figure 2: Yield (lb/ac) by treatment, adjusted to 15% (hay) moisture. The results for silage yield differ statistically by treatment (Table 1). Oat-barley yields were significantly higher than other treatments (A). Yields for treatments including pea were not statistically different from the barley-only treatment (C). Table 1: Summary of statistical information for 2020 silage yield
Entry Statistical significance: wet and dry*
Barley-only B C
Barley-Barley B
Barley-Pea C
Oat-Barley A
Oat-Barley-Pea B C
Oat-Oat B
Oat-Pea B C
CV (%) 13.8
LSD (0.05) 1.8
* Wet = 65% moisture; dry = 15% moisture. Treatments not marked with the same letter are statistically different from other treatments. The feed values for each treatment, as well as recommendations, are shown in Table 2.
9410
8691 8742
10623
92758798
9671
8442
9497
8012
11207
8956
9660
8253
0
2000
4000
6000
8000
10000
12000
Ba
rley
Ba
rley-B
arle
y
Ba
rley-P
ea
Oa
t-B
arley
Oa
t-B
arley-P
ea
Oa
t-O
at
Oa
t-P
ea
Yie
ld (
lb/a
c)
Variety
2019 2020
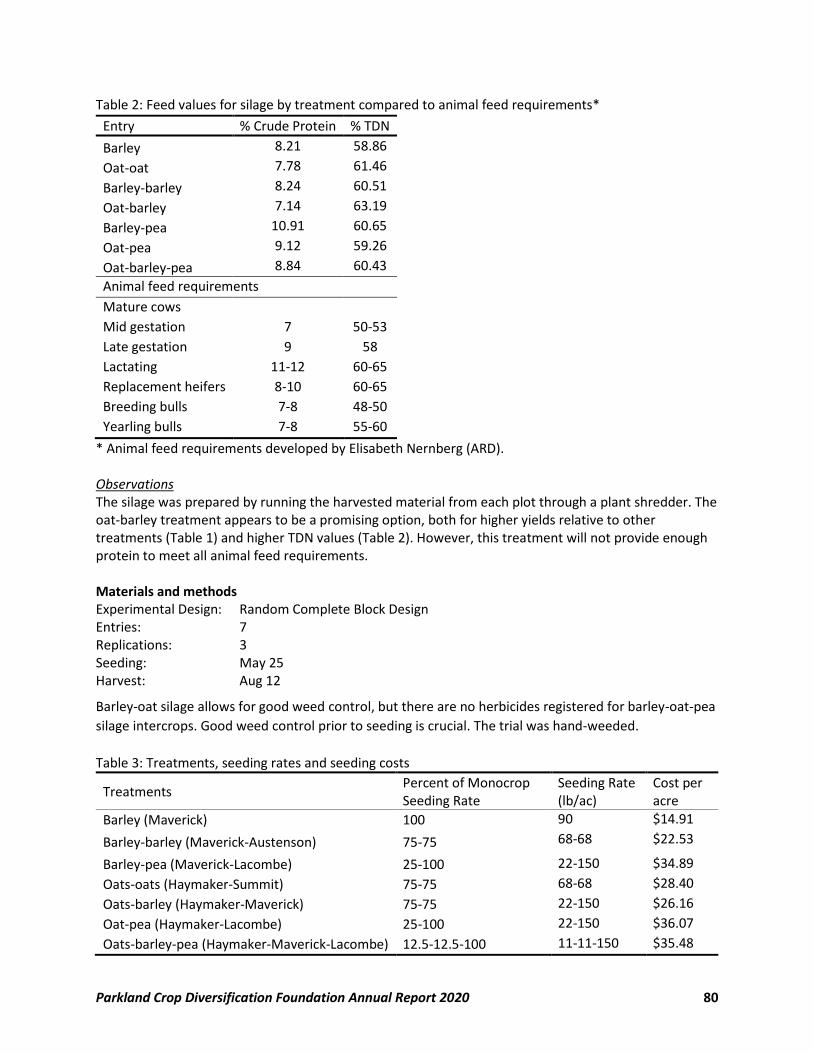
Parkland Crop Diversification Foundation Annual Report 2020 80
Table 2: Feed values for silage by treatment compared to animal feed requirements*
Entry % Crude Protein % TDN
Barley 8.21 58.86
Oat-oat 7.78 61.46
Barley-barley 8.24 60.51
Oat-barley 7.14 63.19
Barley-pea 10.91 60.65
Oat-pea 9.12 59.26
Oat-barley-pea 8.84 60.43
Animal feed requirements
Mature cows
Mid gestation 7 50-53
Late gestation 9 58
Lactating 11-12 60-65
Replacement heifers 8-10 60-65
Breeding bulls 7-8 48-50
Yearling bulls 7-8 55-60
* Animal feed requirements developed by Elisabeth Nernberg (ARD). Observations The silage was prepared by running the harvested material from each plot through a plant shredder. The oat-barley treatment appears to be a promising option, both for higher yields relative to other treatments (Table 1) and higher TDN values (Table 2). However, this treatment will not provide enough protein to meet all animal feed requirements. Materials and methods Experimental Design: Random Complete Block Design Entries: 7 Replications: 3 Seeding: May 25 Harvest: Aug 12
Barley-oat silage allows for good weed control, but there are no herbicides registered for barley-oat-pea
silage intercrops. Good weed control prior to seeding is crucial. The trial was hand-weeded.
Table 3: Treatments, seeding rates and seeding costs
Treatments Percent of Monocrop Seeding Rate
Seeding Rate (lb/ac)
Cost per acre
Barley (Maverick) 100 90 $14.91
Barley-barley (Maverick-Austenson) 75-75 68-68 $22.53
Barley-pea (Maverick-Lacombe) 25-100 22-150 $34.89
Oats-oats (Haymaker-Summit) 75-75 68-68 $28.40
Oats-barley (Haymaker-Maverick) 75-75 22-150 $26.16
Oat-pea (Haymaker-Lacombe) 25-100 22-150 $36.07
Oats-barley-pea (Haymaker-Maverick-Lacombe) 12.5-12.5-100 11-11-150 $35.48
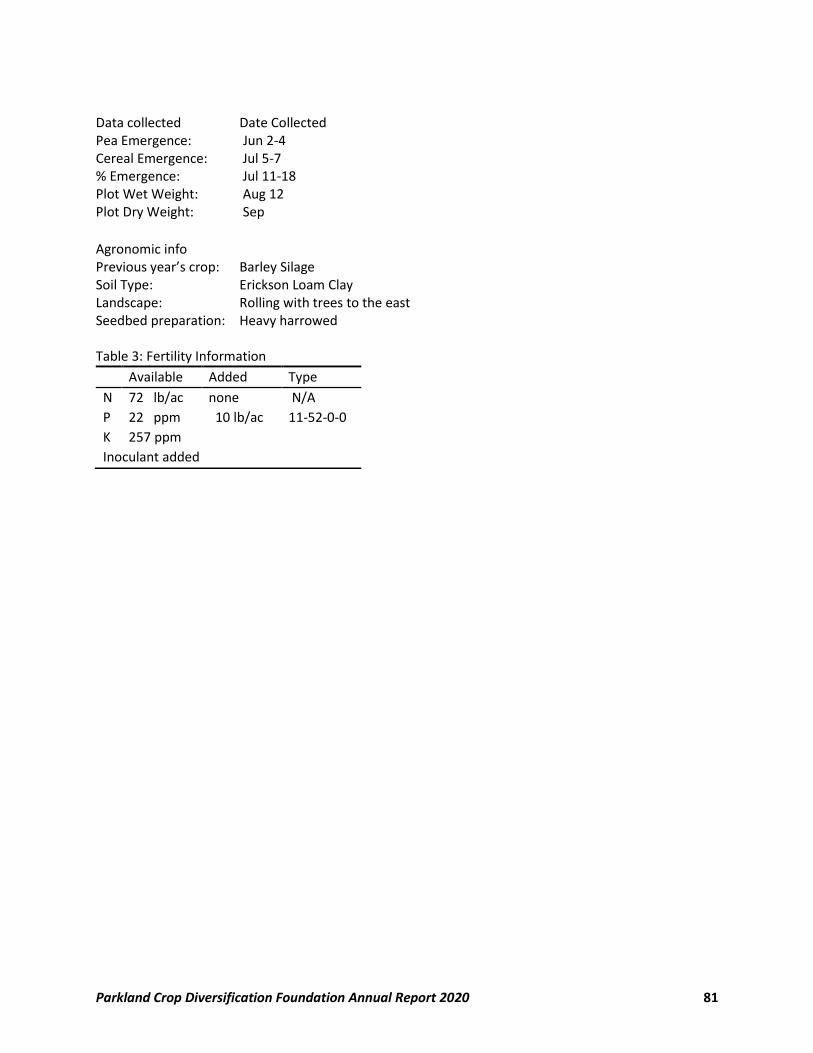
Parkland Crop Diversification Foundation Annual Report 2020 81
Data collected Date Collected Pea Emergence: Jun 2-4 Cereal Emergence: Jul 5-7 % Emergence: Jul 11-18 Plot Wet Weight: Aug 12 Plot Dry Weight: Sep
Agronomic info Previous year’s crop: Barley Silage Soil Type: Erickson Loam Clay Landscape: Rolling with trees to the east Seedbed preparation: Heavy harrowed Table 3: Fertility Information
Available Added Type
N 72 lb/ac none N/A
P 22 ppm 10 lb/ac 11-52-0-0
K 257 ppm
Inoculant added
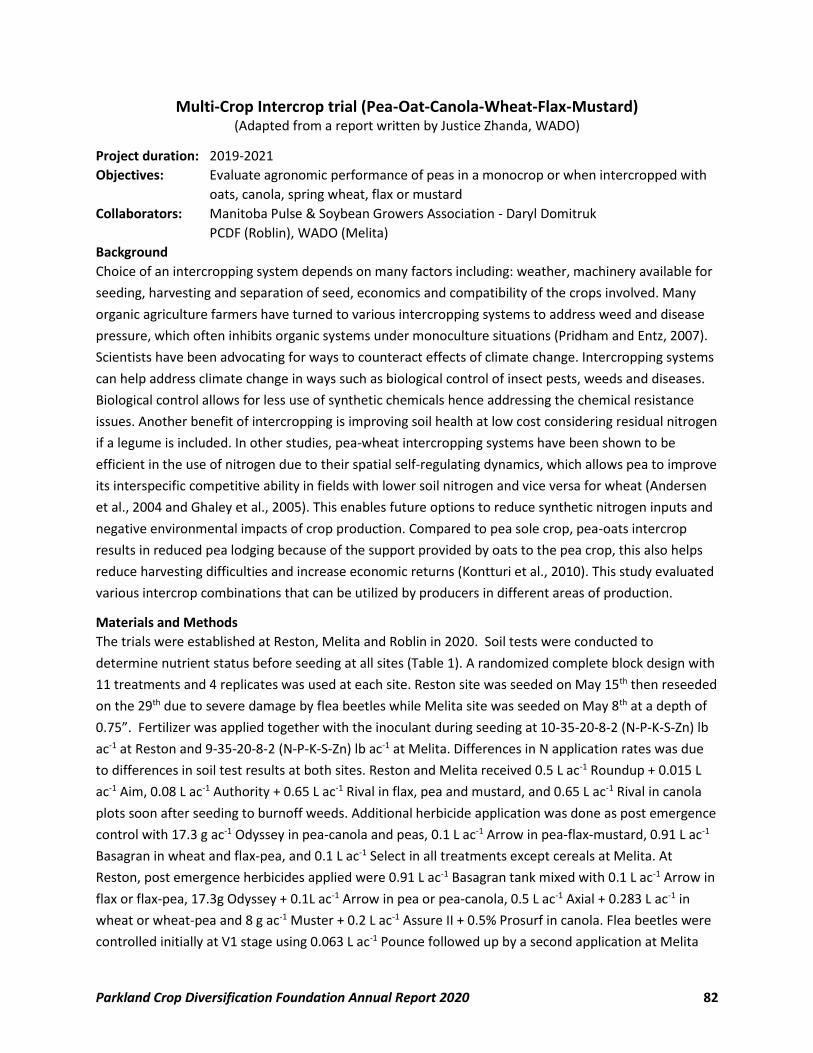
Parkland Crop Diversification Foundation Annual Report 2020 82
Multi-Crop Intercrop trial (Pea-Oat-Canola-Wheat-Flax-Mustard) (Adapted from a report written by Justice Zhanda, WADO)
Project duration: 2019-2021
Objectives: Evaluate agronomic performance of peas in a monocrop or when intercropped with
oats, canola, spring wheat, flax or mustard
Collaborators: Manitoba Pulse & Soybean Growers Association - Daryl Domitruk
PCDF (Roblin), WADO (Melita)
Background
Choice of an intercropping system depends on many factors including: weather, machinery available for
seeding, harvesting and separation of seed, economics and compatibility of the crops involved. Many
organic agriculture farmers have turned to various intercropping systems to address weed and disease
pressure, which often inhibits organic systems under monoculture situations (Pridham and Entz, 2007).
Scientists have been advocating for ways to counteract effects of climate change. Intercropping systems
can help address climate change in ways such as biological control of insect pests, weeds and diseases.
Biological control allows for less use of synthetic chemicals hence addressing the chemical resistance
issues. Another benefit of intercropping is improving soil health at low cost considering residual nitrogen
if a legume is included. In other studies, pea-wheat intercropping systems have been shown to be
efficient in the use of nitrogen due to their spatial self-regulating dynamics, which allows pea to improve
its interspecific competitive ability in fields with lower soil nitrogen and vice versa for wheat (Andersen
et al., 2004 and Ghaley et al., 2005). This enables future options to reduce synthetic nitrogen inputs and
negative environmental impacts of crop production. Compared to pea sole crop, pea-oats intercrop
results in reduced pea lodging because of the support provided by oats to the pea crop, this also helps
reduce harvesting difficulties and increase economic returns (Kontturi et al., 2010). This study evaluated
various intercrop combinations that can be utilized by producers in different areas of production.
Materials and Methods
The trials were established at Reston, Melita and Roblin in 2020. Soil tests were conducted to
determine nutrient status before seeding at all sites (Table 1). A randomized complete block design with
11 treatments and 4 replicates was used at each site. Reston site was seeded on May 15th then reseeded
on the 29th due to severe damage by flea beetles while Melita site was seeded on May 8th at a depth of
0.75”. Fertilizer was applied together with the inoculant during seeding at 10-35-20-8-2 (N-P-K-S-Zn) lb
ac-1 at Reston and 9-35-20-8-2 (N-P-K-S-Zn) lb ac-1 at Melita. Differences in N application rates was due
to differences in soil test results at both sites. Reston and Melita received 0.5 L ac-1 Roundup + 0.015 L
ac-1 Aim, 0.08 L ac-1 Authority + 0.65 L ac-1 Rival in flax, pea and mustard, and 0.65 L ac-1 Rival in canola
plots soon after seeding to burnoff weeds. Additional herbicide application was done as post emergence
control with 17.3 g ac-1 Odyssey in pea-canola and peas, 0.1 L ac-1 Arrow in pea-flax-mustard, 0.91 L ac-1
Basagran in wheat and flax-pea, and 0.1 L ac-1 Select in all treatments except cereals at Melita. At
Reston, post emergence herbicides applied were 0.91 L ac-1 Basagran tank mixed with 0.1 L ac-1 Arrow in
flax or flax-pea, 17.3g Odyssey + 0.1L ac-1 Arrow in pea or pea-canola, 0.5 L ac-1 Axial + 0.283 L ac-1 in
wheat or wheat-pea and 8 g ac-1 Muster + 0.2 L ac-1 Assure II + 0.5% Prosurf in canola. Flea beetles were
controlled initially at V1 stage using 0.063 L ac-1 Pounce followed up by a second application at Melita
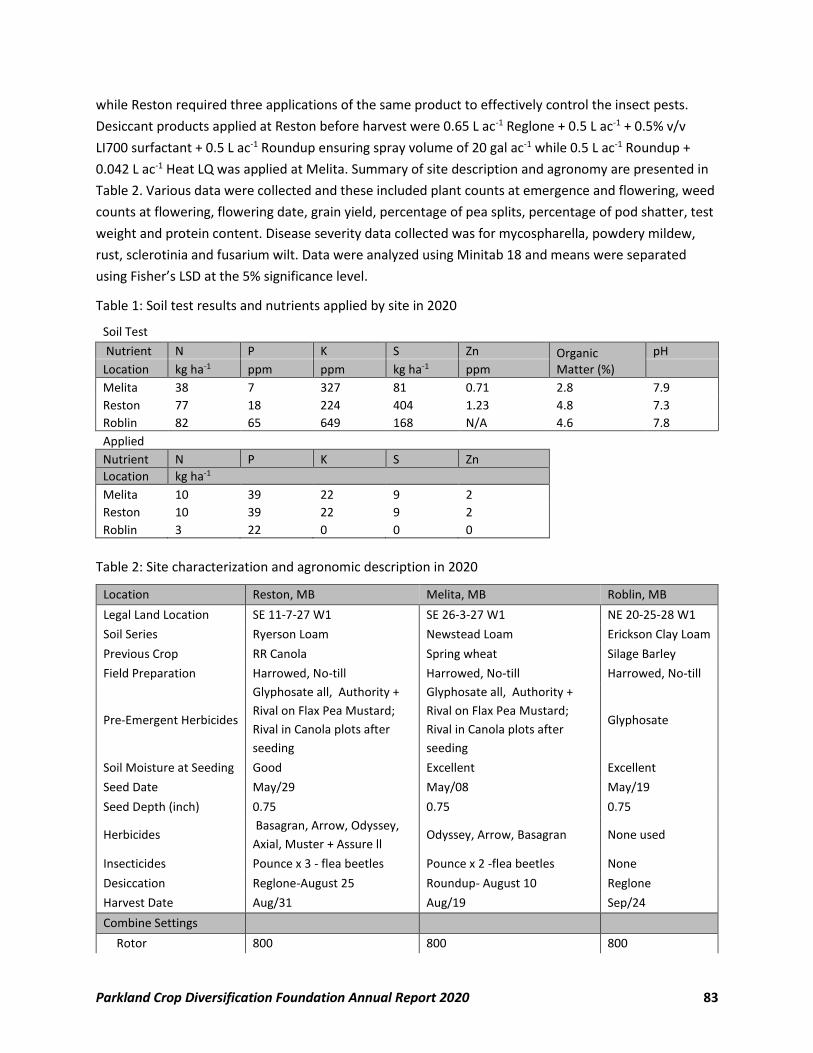
Parkland Crop Diversification Foundation Annual Report 2020 83
while Reston required three applications of the same product to effectively control the insect pests.
Desiccant products applied at Reston before harvest were 0.65 L ac-1 Reglone + 0.5 L ac-1 + 0.5% v/v
LI700 surfactant + 0.5 L ac-1 Roundup ensuring spray volume of 20 gal ac-1 while 0.5 L ac-1 Roundup +
0.042 L ac-1 Heat LQ was applied at Melita. Summary of site description and agronomy are presented in
Table 2. Various data were collected and these included plant counts at emergence and flowering, weed
counts at flowering, flowering date, grain yield, percentage of pea splits, percentage of pod shatter, test
weight and protein content. Disease severity data collected was for mycospharella, powdery mildew,
rust, sclerotinia and fusarium wilt. Data were analyzed using Minitab 18 and means were separated
using Fisher’s LSD at the 5% significance level.
Table 1: Soil test results and nutrients applied by site in 2020
Soil Test
Nutrient N P K S Zn Organic Matter (%)
pH
Location kg ha-1 ppm ppm kg ha-1 ppm Melita 38 7 327 81 0.71 2.8 7.9
Reston 77 18 224 404 1.23 4.8 7.3
Roblin 82 65 649 168 N/A 4.6 7.8
Applied
Nutrient N P K S Zn
Location kg ha-1
Melita 10 39 22 9 2
Reston 10 39 22 9 2
Roblin 3 22 0 0 0
Table 2: Site characterization and agronomic description in 2020
Location Reston, MB Melita, MB Roblin, MB
Legal Land Location SE 11-7-27 W1 SE 26-3-27 W1 NE 20-25-28 W1
Soil Series Ryerson Loam Newstead Loam Erickson Clay Loam
Previous Crop RR Canola Spring wheat Silage Barley
Field Preparation Harrowed, No-till Harrowed, No-till Harrowed, No-till
Pre-Emergent Herbicides
Glyphosate all, Authority +
Rival on Flax Pea Mustard;
Rival in Canola plots after
seeding
Glyphosate all, Authority +
Rival on Flax Pea Mustard;
Rival in Canola plots after
seeding
Glyphosate
Soil Moisture at Seeding Good Excellent Excellent
Seed Date May/29 May/08 May/19
Seed Depth (inch) 0.75 0.75 0.75
Herbicides Basagran, Arrow, Odyssey,
Axial, Muster + Assure ll Odyssey, Arrow, Basagran None used
Insecticides Pounce x 3 - flea beetles Pounce x 2 -flea beetles None
Desiccation Reglone-August 25 Roundup- August 10 Reglone
Harvest Date Aug/31 Aug/19 Sep/24
Combine Settings
Rotor 800 800 800
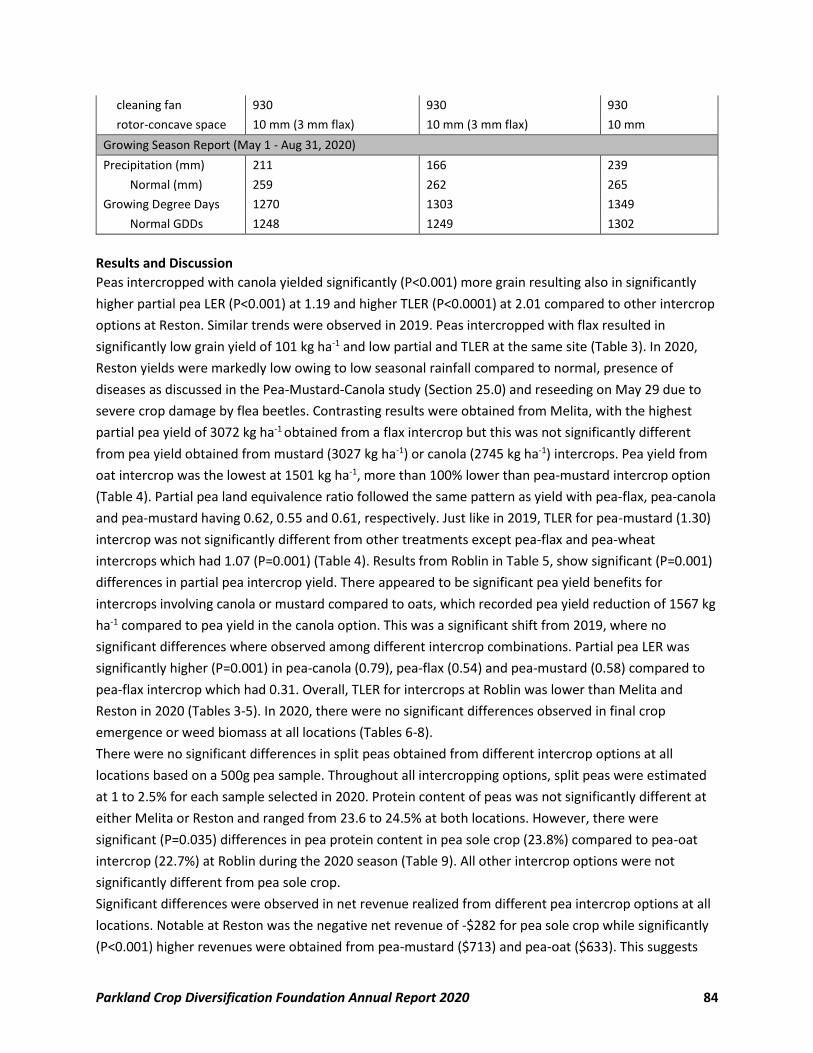
Parkland Crop Diversification Foundation Annual Report 2020 84
cleaning fan 930 930 930
rotor-concave space 10 mm (3 mm flax) 10 mm (3 mm flax) 10 mm
Growing Season Report (May 1 - Aug 31, 2020)
Precipitation (mm) 211 166 239
Normal (mm) 259 262 265
Growing Degree Days 1270 1303 1349
Normal GDDs 1248 1249 1302
Results and Discussion
Peas intercropped with canola yielded significantly (P<0.001) more grain resulting also in significantly
higher partial pea LER (P<0.001) at 1.19 and higher TLER (P<0.0001) at 2.01 compared to other intercrop
options at Reston. Similar trends were observed in 2019. Peas intercropped with flax resulted in
significantly low grain yield of 101 kg ha-1 and low partial and TLER at the same site (Table 3). In 2020,
Reston yields were markedly low owing to low seasonal rainfall compared to normal, presence of
diseases as discussed in the Pea-Mustard-Canola study (Section 25.0) and reseeding on May 29 due to
severe crop damage by flea beetles. Contrasting results were obtained from Melita, with the highest
partial pea yield of 3072 kg ha-1 obtained from a flax intercrop but this was not significantly different
from pea yield obtained from mustard (3027 kg ha-1) or canola (2745 kg ha-1) intercrops. Pea yield from
oat intercrop was the lowest at 1501 kg ha-1, more than 100% lower than pea-mustard intercrop option
(Table 4). Partial pea land equivalence ratio followed the same pattern as yield with pea-flax, pea-canola
and pea-mustard having 0.62, 0.55 and 0.61, respectively. Just like in 2019, TLER for pea-mustard (1.30)
intercrop was not significantly different from other treatments except pea-flax and pea-wheat
intercrops which had 1.07 (P=0.001) (Table 4). Results from Roblin in Table 5, show significant (P=0.001)
differences in partial pea intercrop yield. There appeared to be significant pea yield benefits for
intercrops involving canola or mustard compared to oats, which recorded pea yield reduction of 1567 kg
ha-1 compared to pea yield in the canola option. This was a significant shift from 2019, where no
significant differences where observed among different intercrop combinations. Partial pea LER was
significantly higher (P=0.001) in pea-canola (0.79), pea-flax (0.54) and pea-mustard (0.58) compared to
pea-flax intercrop which had 0.31. Overall, TLER for intercrops at Roblin was lower than Melita and
Reston in 2020 (Tables 3-5). In 2020, there were no significant differences observed in final crop
emergence or weed biomass at all locations (Tables 6-8).
There were no significant differences in split peas obtained from different intercrop options at all
locations based on a 500g pea sample. Throughout all intercropping options, split peas were estimated
at 1 to 2.5% for each sample selected in 2020. Protein content of peas was not significantly different at
either Melita or Reston and ranged from 23.6 to 24.5% at both locations. However, there were
significant (P=0.035) differences in pea protein content in pea sole crop (23.8%) compared to pea-oat
intercrop (22.7%) at Roblin during the 2020 season (Table 9). All other intercrop options were not
significantly different from pea sole crop.
Significant differences were observed in net revenue realized from different pea intercrop options at all
locations. Notable at Reston was the negative net revenue of -$282 for pea sole crop while significantly
(P<0.001) higher revenues were obtained from pea-mustard ($713) and pea-oat ($633). This suggests
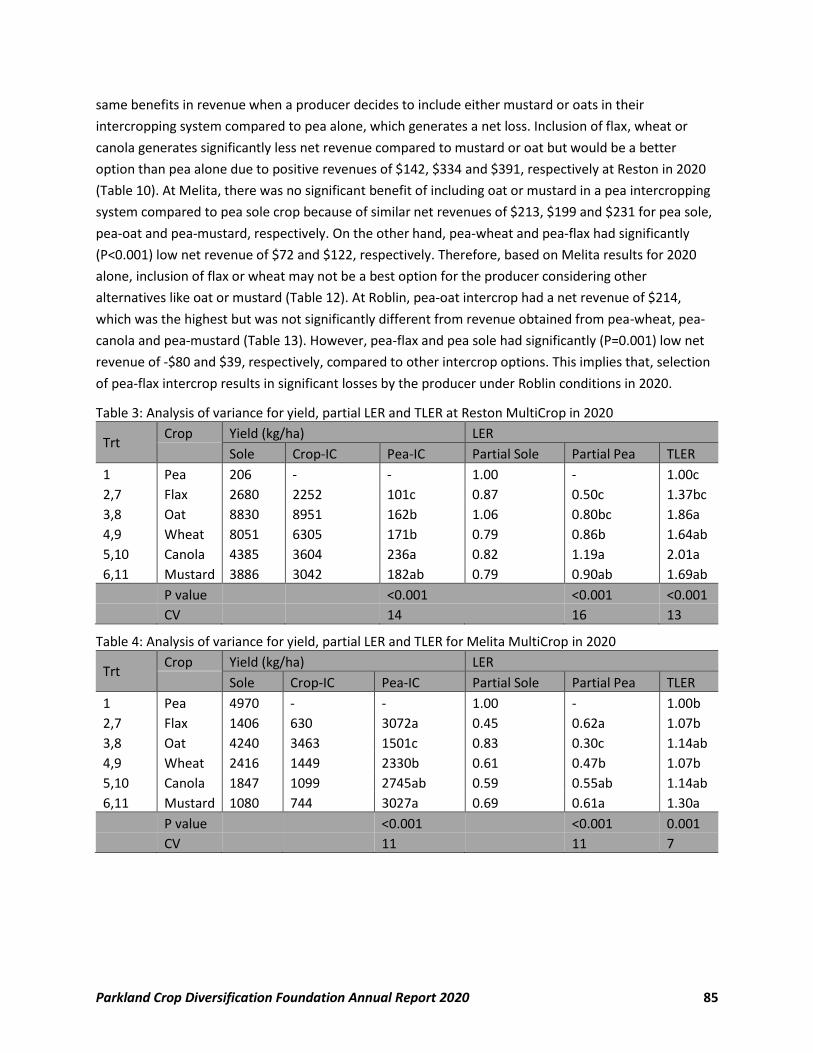
Parkland Crop Diversification Foundation Annual Report 2020 85
same benefits in revenue when a producer decides to include either mustard or oats in their
intercropping system compared to pea alone, which generates a net loss. Inclusion of flax, wheat or
canola generates significantly less net revenue compared to mustard or oat but would be a better
option than pea alone due to positive revenues of $142, $334 and $391, respectively at Reston in 2020
(Table 10). At Melita, there was no significant benefit of including oat or mustard in a pea intercropping
system compared to pea sole crop because of similar net revenues of $213, $199 and $231 for pea sole,
pea-oat and pea-mustard, respectively. On the other hand, pea-wheat and pea-flax had significantly
(P<0.001) low net revenue of $72 and $122, respectively. Therefore, based on Melita results for 2020
alone, inclusion of flax or wheat may not be a best option for the producer considering other
alternatives like oat or mustard (Table 12). At Roblin, pea-oat intercrop had a net revenue of $214,
which was the highest but was not significantly different from revenue obtained from pea-wheat, pea-
canola and pea-mustard (Table 13). However, pea-flax and pea sole had significantly (P=0.001) low net
revenue of -$80 and $39, respectively, compared to other intercrop options. This implies that, selection
of pea-flax intercrop results in significant losses by the producer under Roblin conditions in 2020.
Table 3: Analysis of variance for yield, partial LER and TLER at Reston MultiCrop in 2020
Trt Crop Yield (kg/ha) LER
Sole Crop-IC Pea-IC Partial Sole Partial Pea TLER
1 Pea 206 - - 1.00 - 1.00c
2,7 Flax 2680 2252 101c 0.87 0.50c 1.37bc
3,8 Oat 8830 8951 162b 1.06 0.80bc 1.86a
4,9 Wheat 8051 6305 171b 0.79 0.86b 1.64ab
5,10 Canola 4385 3604 236a 0.82 1.19a 2.01a
6,11 Mustard 3886 3042 182ab 0.79 0.90ab 1.69ab
P value <0.001 <0.001 <0.001
CV 14 16 13
Table 4: Analysis of variance for yield, partial LER and TLER for Melita MultiCrop in 2020
Trt Crop Yield (kg/ha) LER
Sole Crop-IC Pea-IC Partial Sole Partial Pea TLER
1 Pea 4970 - - 1.00 - 1.00b
2,7 Flax 1406 630 3072a 0.45 0.62a 1.07b
3,8 Oat 4240 3463 1501c 0.83 0.30c 1.14ab
4,9 Wheat 2416 1449 2330b 0.61 0.47b 1.07b
5,10 Canola 1847 1099 2745ab 0.59 0.55ab 1.14ab
6,11 Mustard 1080 744 3027a 0.69 0.61a 1.30a
P value <0.001 <0.001 0.001
CV 11 11 7
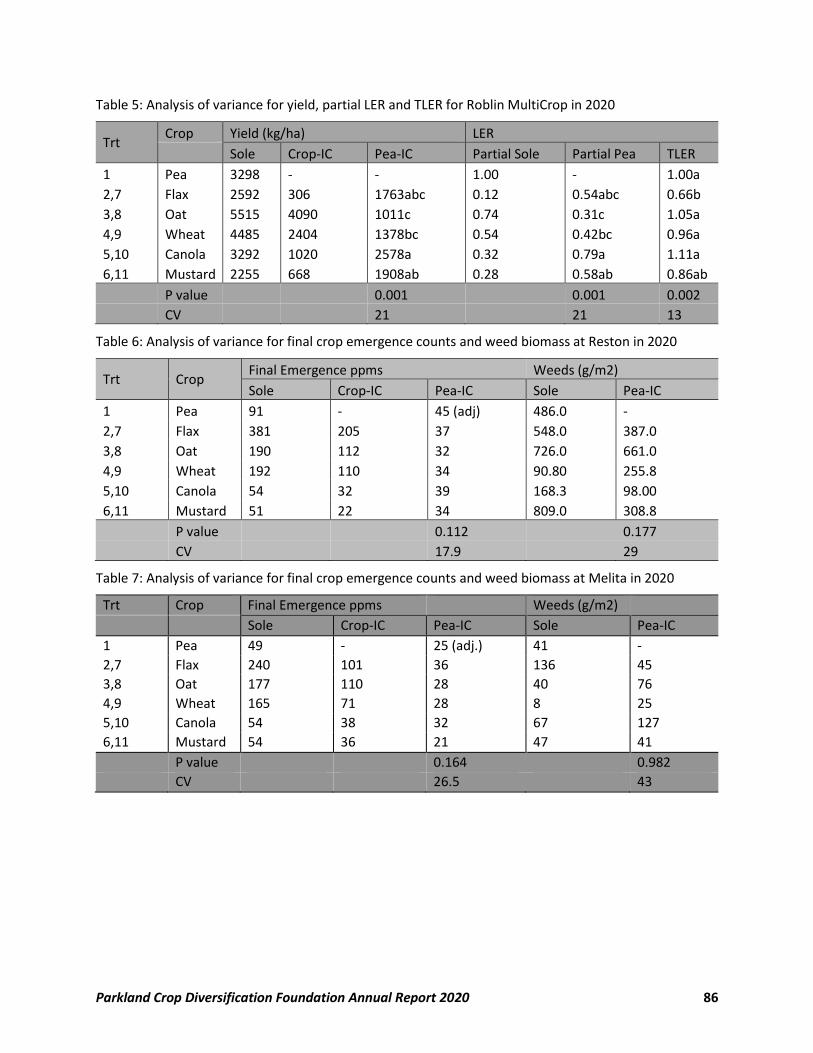
Parkland Crop Diversification Foundation Annual Report 2020 86
Table 5: Analysis of variance for yield, partial LER and TLER for Roblin MultiCrop in 2020
Trt Crop Yield (kg/ha) LER
Sole Crop-IC Pea-IC Partial Sole Partial Pea TLER
1 Pea 3298 - - 1.00 - 1.00a
2,7 Flax 2592 306 1763abc 0.12 0.54abc 0.66b
3,8 Oat 5515 4090 1011c 0.74 0.31c 1.05a
4,9 Wheat 4485 2404 1378bc 0.54 0.42bc 0.96a
5,10 Canola 3292 1020 2578a 0.32 0.79a 1.11a
6,11 Mustard 2255 668 1908ab 0.28 0.58ab 0.86ab
P value 0.001 0.001 0.002
CV 21 21 13
Table 6: Analysis of variance for final crop emergence counts and weed biomass at Reston in 2020
Trt Crop Final Emergence ppms Weeds (g/m2)
Sole Crop-IC Pea-IC Sole Pea-IC
1 Pea 91 - 45 (adj) 486.0 -
2,7 Flax 381 205 37 548.0 387.0
3,8 Oat 190 112 32 726.0 661.0
4,9 Wheat 192 110 34 90.80 255.8
5,10 Canola 54 32 39 168.3 98.00
6,11 Mustard 51 22 34 809.0 308.8
P value 0.112 0.177
CV 17.9 29
Table 7: Analysis of variance for final crop emergence counts and weed biomass at Melita in 2020
Trt Crop Final Emergence ppms Weeds (g/m2)
Sole Crop-IC Pea-IC Sole Pea-IC
1 Pea 49 - 25 (adj.) 41 -
2,7 Flax 240 101 36 136 45
3,8 Oat 177 110 28 40 76
4,9 Wheat 165 71 28 8 25
5,10 Canola 54 38 32 67 127
6,11 Mustard 54 36 21 47 41
P value 0.164 0.982
CV 26.5 43
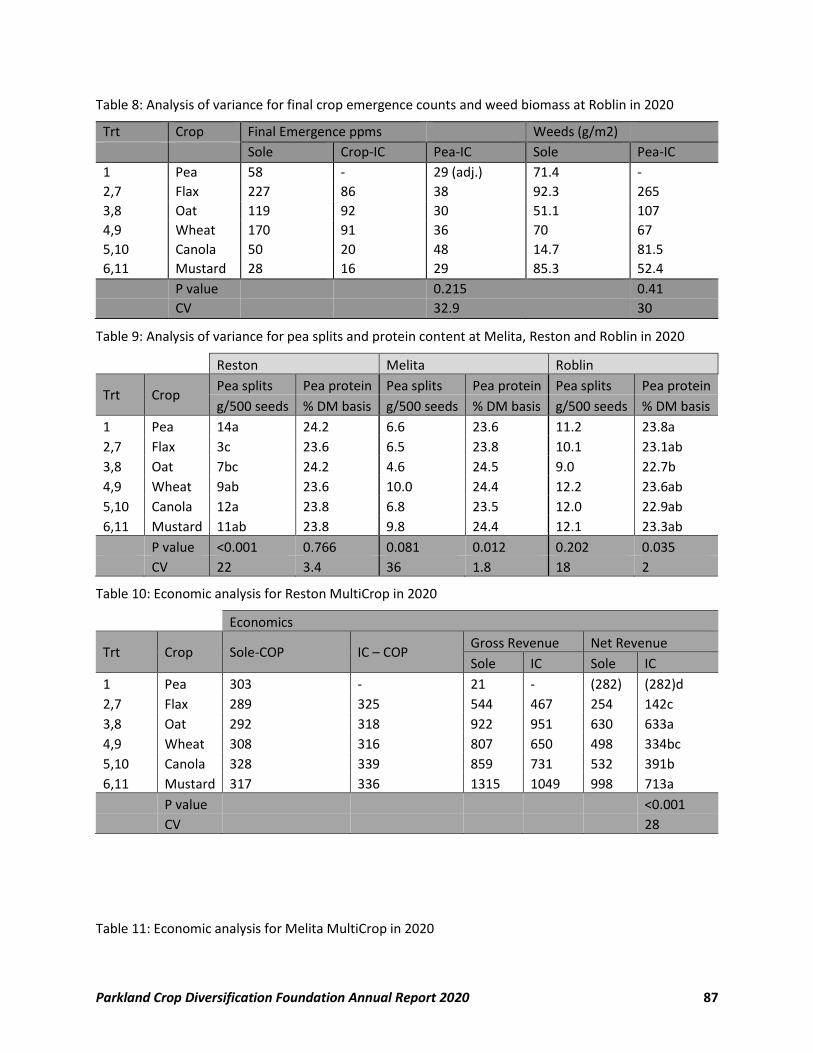
Parkland Crop Diversification Foundation Annual Report 2020 87
Table 8: Analysis of variance for final crop emergence counts and weed biomass at Roblin in 2020
Trt Crop Final Emergence ppms Weeds (g/m2)
Sole Crop-IC Pea-IC Sole Pea-IC
1 Pea 58 - 29 (adj.) 71.4 -
2,7 Flax 227 86 38 92.3 265
3,8 Oat 119 92 30 51.1 107
4,9 Wheat 170 91 36 70 67
5,10 Canola 50 20 48 14.7 81.5
6,11 Mustard 28 16 29 85.3 52.4
P value 0.215 0.41
CV 32.9 30
Table 9: Analysis of variance for pea splits and protein content at Melita, Reston and Roblin in 2020
Reston Melita Roblin
Trt Crop Pea splits Pea protein Pea splits Pea protein Pea splits Pea protein
g/500 seeds % DM basis g/500 seeds % DM basis g/500 seeds % DM basis
1 Pea 14a 24.2 6.6 23.6 11.2 23.8a
2,7 Flax 3c 23.6 6.5 23.8 10.1 23.1ab
3,8 Oat 7bc 24.2 4.6 24.5 9.0 22.7b
4,9 Wheat 9ab 23.6 10.0 24.4 12.2 23.6ab
5,10 Canola 12a 23.8 6.8 23.5 12.0 22.9ab
6,11 Mustard 11ab 23.8 9.8 24.4 12.1 23.3ab
P value <0.001 0.766 0.081 0.012 0.202 0.035
CV 22 3.4 36 1.8 18 2
Table 10: Economic analysis for Reston MultiCrop in 2020
Economics
Trt Crop Sole-COP IC – COP Gross Revenue Net Revenue
Sole IC Sole IC
1 Pea 303 - 21 - (282) (282)d
2,7 Flax 289 325 544 467 254 142c
3,8 Oat 292 318 922 951 630 633a
4,9 Wheat 308 316 807 650 498 334bc
5,10 Canola 328 339 859 731 532 391b
6,11 Mustard 317 336 1315 1049 998 713a
P value <0.001
CV 28
Table 11: Economic analysis for Melita MultiCrop in 2020
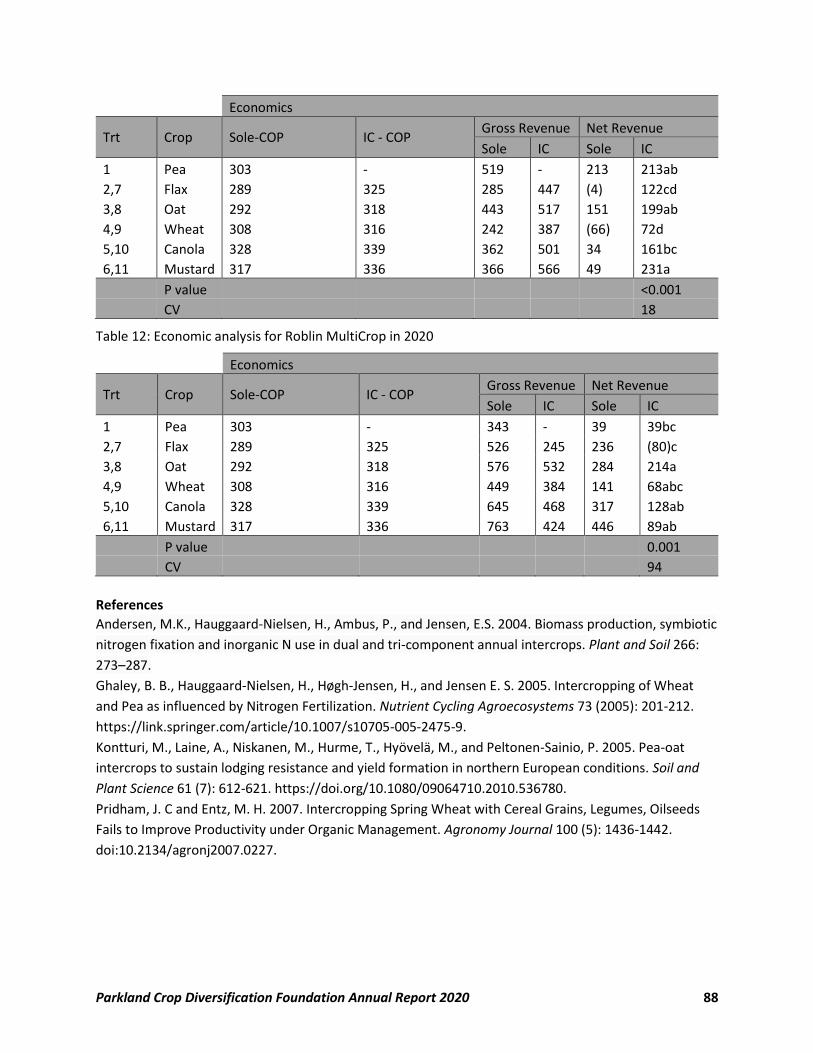
Parkland Crop Diversification Foundation Annual Report 2020 88
Economics
Trt Crop Sole-COP IC - COP Gross Revenue Net Revenue
Sole IC Sole IC
1 Pea 303 - 519 - 213 213ab
2,7 Flax 289 325 285 447 (4) 122cd
3,8 Oat 292 318 443 517 151 199ab
4,9 Wheat 308 316 242 387 (66) 72d
5,10 Canola 328 339 362 501 34 161bc
6,11 Mustard 317 336 366 566 49 231a
P value <0.001
CV 18
Table 12: Economic analysis for Roblin MultiCrop in 2020
Economics
Trt Crop Sole-COP IC - COP Gross Revenue Net Revenue
Sole IC Sole IC
1 Pea 303 - 343 - 39 39bc
2,7 Flax 289 325 526 245 236 (80)c
3,8 Oat 292 318 576 532 284 214a
4,9 Wheat 308 316 449 384 141 68abc
5,10 Canola 328 339 645 468 317 128ab
6,11 Mustard 317 336 763 424 446 89ab
P value 0.001
CV 94
References
Andersen, M.K., Hauggaard-Nielsen, H., Ambus, P., and Jensen, E.S. 2004. Biomass production, symbiotic
nitrogen fixation and inorganic N use in dual and tri-component annual intercrops. Plant and Soil 266:
273–287.
Ghaley, B. B., Hauggaard-Nielsen, H., Høgh-Jensen, H., and Jensen E. S. 2005. Intercropping of Wheat
and Pea as influenced by Nitrogen Fertilization. Nutrient Cycling Agroecosystems 73 (2005): 201-212.
https://link.springer.com/article/10.1007/s10705-005-2475-9.
Kontturi, M., Laine, A., Niskanen, M., Hurme, T., Hyövelä, M., and Peltonen-Sainio, P. 2005. Pea-oat
intercrops to sustain lodging resistance and yield formation in northern European conditions. Soil and
Plant Science 61 (7): 612-621. https://doi.org/10.1080/09064710.2010.536780.
Pridham, J. C and Entz, M. H. 2007. Intercropping Spring Wheat with Cereal Grains, Legumes, Oilseeds
Fails to Improve Productivity under Organic Management. Agronomy Journal 100 (5): 1436-1442.
doi:10.2134/agronj2007.0227.
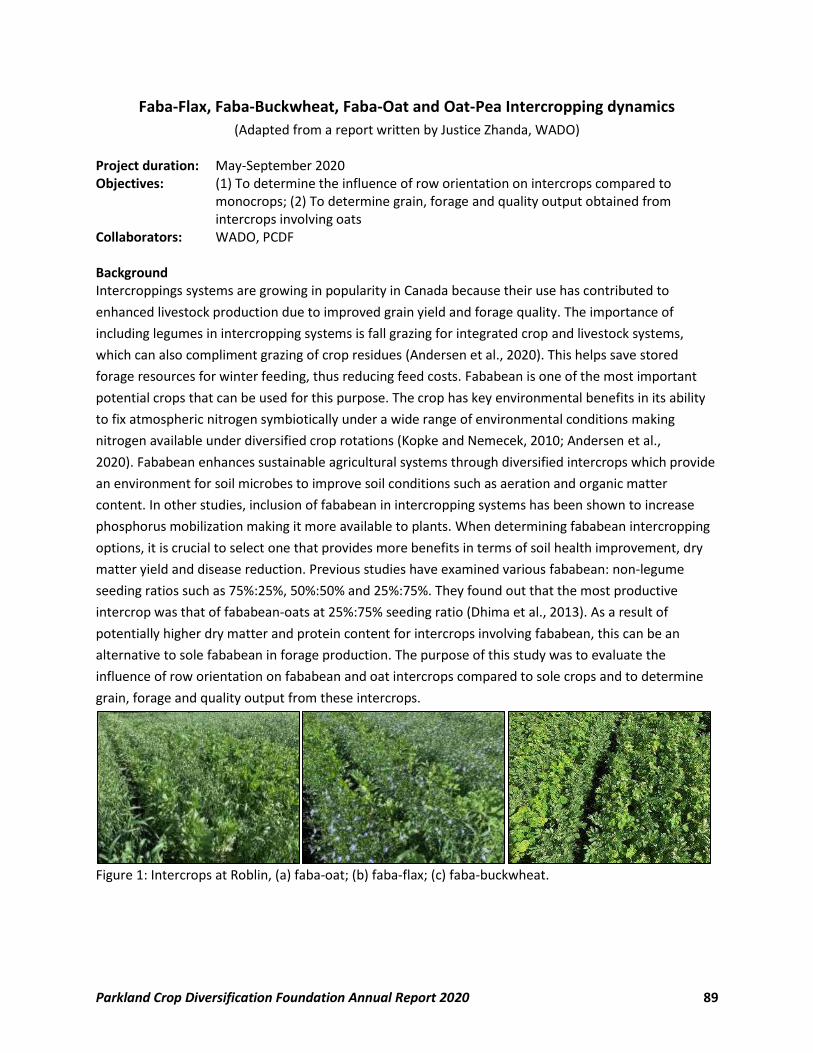
Parkland Crop Diversification Foundation Annual Report 2020 89
Faba-Flax, Faba-Buckwheat, Faba-Oat and Oat-Pea Intercropping dynamics
(Adapted from a report written by Justice Zhanda, WADO) Project duration: May-September 2020 Objectives: (1) To determine the influence of row orientation on intercrops compared to
monocrops; (2) To determine grain, forage and quality output obtained from intercrops involving oats
Collaborators: WADO, PCDF Background Intercroppings systems are growing in popularity in Canada because their use has contributed to
enhanced livestock production due to improved grain yield and forage quality. The importance of
including legumes in intercropping systems is fall grazing for integrated crop and livestock systems,
which can also compliment grazing of crop residues (Andersen et al., 2020). This helps save stored
forage resources for winter feeding, thus reducing feed costs. Fababean is one of the most important
potential crops that can be used for this purpose. The crop has key environmental benefits in its ability
to fix atmospheric nitrogen symbiotically under a wide range of environmental conditions making
nitrogen available under diversified crop rotations (Kopke and Nemecek, 2010; Andersen et al.,
2020). Fababean enhances sustainable agricultural systems through diversified intercrops which provide
an environment for soil microbes to improve soil conditions such as aeration and organic matter
content. In other studies, inclusion of fababean in intercropping systems has been shown to increase
phosphorus mobilization making it more available to plants. When determining fababean intercropping
options, it is crucial to select one that provides more benefits in terms of soil health improvement, dry
matter yield and disease reduction. Previous studies have examined various fababean: non-legume
seeding ratios such as 75%:25%, 50%:50% and 25%:75%. They found out that the most productive
intercrop was that of fababean-oats at 25%:75% seeding ratio (Dhima et al., 2013). As a result of
potentially higher dry matter and protein content for intercrops involving fababean, this can be an
alternative to sole fababean in forage production. The purpose of this study was to evaluate the
influence of row orientation on fababean and oat intercrops compared to sole crops and to determine
grain, forage and quality output from these intercrops.
Figure 1: Intercrops at Roblin, (a) faba-oat; (b) faba-flax; (c) faba-buckwheat.
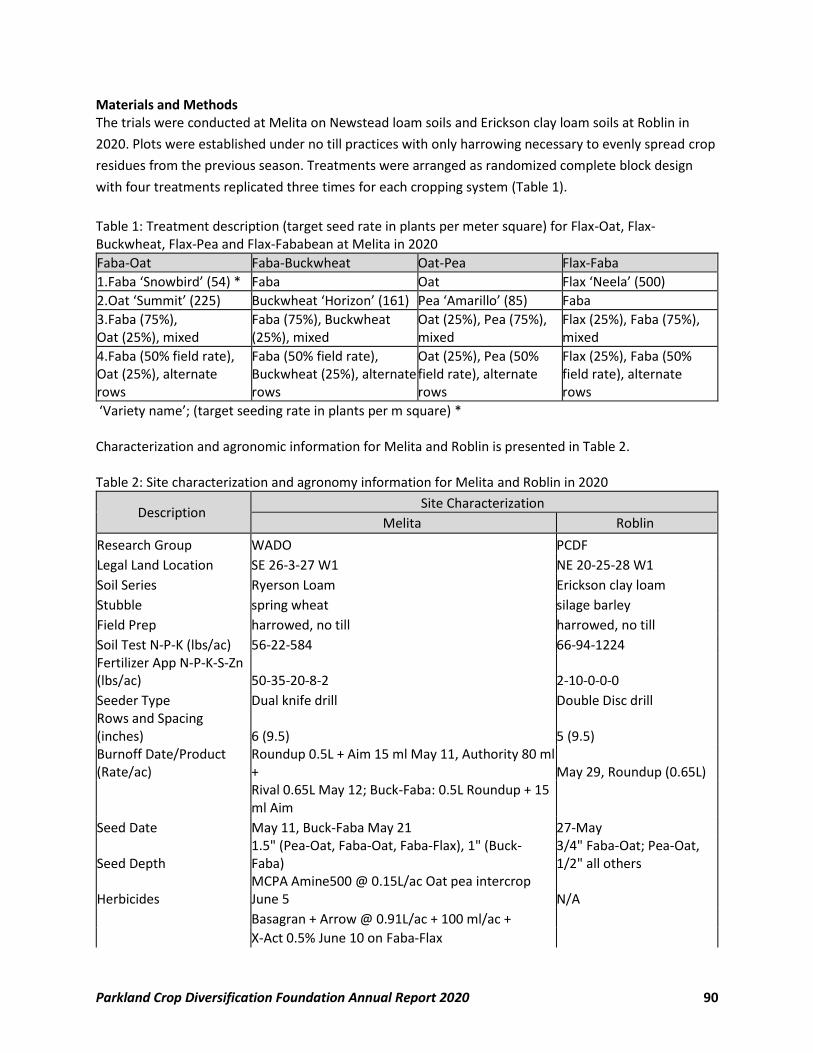
Parkland Crop Diversification Foundation Annual Report 2020 90
Materials and Methods The trials were conducted at Melita on Newstead loam soils and Erickson clay loam soils at Roblin in
2020. Plots were established under no till practices with only harrowing necessary to evenly spread crop
residues from the previous season. Treatments were arranged as randomized complete block design
with four treatments replicated three times for each cropping system (Table 1).
Table 1: Treatment description (target seed rate in plants per meter square) for Flax-Oat, Flax-Buckwheat, Flax-Pea and Flax-Fababean at Melita in 2020
Faba-Oat Faba-Buckwheat Oat-Pea Flax-Faba
1.Faba ‘Snowbird’ (54) * Faba Oat Flax ‘Neela’ (500)
2.Oat ‘Summit’ (225) Buckwheat ‘Horizon’ (161) Pea ‘Amarillo’ (85) Faba
3.Faba (75%), Oat (25%), mixed
Faba (75%), Buckwheat (25%), mixed
Oat (25%), Pea (75%), mixed
Flax (25%), Faba (75%), mixed
4.Faba (50% field rate), Oat (25%), alternate rows
Faba (50% field rate), Buckwheat (25%), alternate rows
Oat (25%), Pea (50% field rate), alternate rows
Flax (25%), Faba (50% field rate), alternate rows
‘Variety name’; (target seeding rate in plants per m square) * Characterization and agronomic information for Melita and Roblin is presented in Table 2. Table 2: Site characterization and agronomy information for Melita and Roblin in 2020
Description Site Characterization
Melita Roblin
Research Group WADO PCDF
Legal Land Location SE 26-3-27 W1 NE 20-25-28 W1
Soil Series Ryerson Loam Erickson clay loam
Stubble spring wheat silage barley
Field Prep harrowed, no till harrowed, no till
Soil Test N-P-K (lbs/ac) 56-22-584 66-94-1224 Fertilizer App N-P-K-S-Zn (lbs/ac) 50-35-20-8-2 2-10-0-0-0
Seeder Type Dual knife drill Double Disc drill Rows and Spacing (inches) 6 (9.5) 5 (9.5) Burnoff Date/Product (Rate/ac)
Roundup 0.5L + Aim 15 ml May 11, Authority 80 ml + May 29, Roundup (0.65L)
Rival 0.65L May 12; Buck-Faba: 0.5L Roundup + 15 ml Aim
Seed Date May 11, Buck-Faba May 21 27-May
Seed Depth 1.5" (Pea-Oat, Faba-Oat, Faba-Flax), 1" (Buck-Faba)
3/4" Faba-Oat; Pea-Oat, 1/2" all others
Herbicides MCPA Amine500 @ 0.15L/ac Oat pea intercrop June 5 N/A
Basagran + Arrow @ 0.91L/ac + 100 ml/ac +
X-Act 0.5% June 10 on Faba-Flax
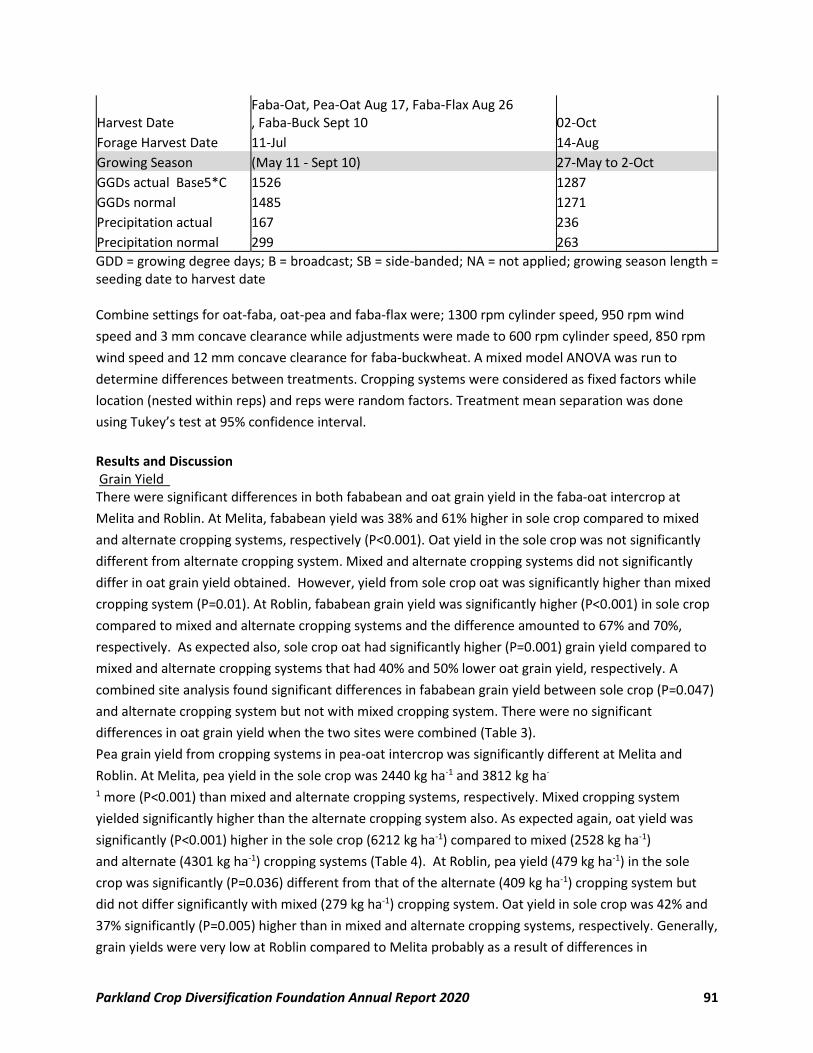
Parkland Crop Diversification Foundation Annual Report 2020 91
Harvest Date Faba-Oat, Pea-Oat Aug 17, Faba-Flax Aug 26 , Faba-Buck Sept 10 02-Oct
Forage Harvest Date 11-Jul 14-Aug
Growing Season (May 11 - Sept 10) 27-May to 2-Oct
GGDs actual Base5*C 1526 1287
GGDs normal 1485 1271
Precipitation actual 167 236
Precipitation normal 299 263
GDD = growing degree days; B = broadcast; SB = side-banded; NA = not applied; growing season length = seeding date to harvest date Combine settings for oat-faba, oat-pea and faba-flax were; 1300 rpm cylinder speed, 950 rpm wind
speed and 3 mm concave clearance while adjustments were made to 600 rpm cylinder speed, 850 rpm
wind speed and 12 mm concave clearance for faba-buckwheat. A mixed model ANOVA was run to
determine differences between treatments. Cropping systems were considered as fixed factors while
location (nested within reps) and reps were random factors. Treatment mean separation was done
using Tukey’s test at 95% confidence interval.
Results and Discussion Grain Yield There were significant differences in both fababean and oat grain yield in the faba-oat intercrop at
Melita and Roblin. At Melita, fababean yield was 38% and 61% higher in sole crop compared to mixed
and alternate cropping systems, respectively (P<0.001). Oat yield in the sole crop was not significantly
different from alternate cropping system. Mixed and alternate cropping systems did not significantly
differ in oat grain yield obtained. However, yield from sole crop oat was significantly higher than mixed
cropping system (P=0.01). At Roblin, fababean grain yield was significantly higher (P<0.001) in sole crop
compared to mixed and alternate cropping systems and the difference amounted to 67% and 70%,
respectively. As expected also, sole crop oat had significantly higher (P=0.001) grain yield compared to
mixed and alternate cropping systems that had 40% and 50% lower oat grain yield, respectively. A
combined site analysis found significant differences in fababean grain yield between sole crop (P=0.047)
and alternate cropping system but not with mixed cropping system. There were no significant
differences in oat grain yield when the two sites were combined (Table 3).
Pea grain yield from cropping systems in pea-oat intercrop was significantly different at Melita and
Roblin. At Melita, pea yield in the sole crop was 2440 kg ha-1 and 3812 kg ha-
1 more (P<0.001) than mixed and alternate cropping systems, respectively. Mixed cropping system
yielded significantly higher than the alternate cropping system also. As expected again, oat yield was
significantly (P<0.001) higher in the sole crop (6212 kg ha-1) compared to mixed (2528 kg ha-1)
and alternate (4301 kg ha-1) cropping systems (Table 4). At Roblin, pea yield (479 kg ha-1) in the sole
crop was significantly (P=0.036) different from that of the alternate (409 kg ha-1) cropping system but
did not differ significantly with mixed (279 kg ha-1) cropping system. Oat yield in sole crop was 42% and
37% significantly (P=0.005) higher than in mixed and alternate cropping systems, respectively. Generally,
grain yields were very low at Roblin compared to Melita probably as a result of differences in
Parkland Crop Diversification Foundation Annual Report 2020 92
agroecological regions. Fababean grain yield from cropping systems in faba-buckwheat intercrop
was significantly (P=0.009) different at Melita. Fababean grain yield obtained from alternate cropping
system was the lowest (2237 kg ha-1) while mixed and sole crop yielded 36% and 42% more,
respectively. Buckwheat yield in sole crop was significantly (P<0.001) higher than mixed and alternate
cropping systems that had 7- and 4-times lower grain yield, respectively. At Roblin, fababean grain yield
in sole crop was significantly (P=0.001) more than in mixed and alternate cropping systems by 44% and
59%, respectively. Buckwheat yield was significantly (P=0.005) more by about 50% compared with mixed
and alternate cropping systems. There were no significant differences in grain yield between mixed and
alternate cropping systems at both sites. A combined analysis of the sites did not find significant
differences in grain yield, at least in the current season but there is a possibility that with additional site
years of data, differences in yield can be observed (Table 5).
There were significant differences in grain yield from faba-flax intercrop at Melita and Roblin (Table 6).
At Melita, fababean grain yield was significantly (P=0.002) lower than sole and mixed cropping systems
by more than 1300 kg ha-1. Flax grain yield was statistically the same between mixed and alternate
cropping systems but was significantly (P<0.001) higher by 10 and 4 times, respectively, in flax sole
crop. At Roblin, fababean grain yield was significantly (P=0.039) lower in the alternate cropping system
compared to the sole crop by about 1500 kg ha-1 while there were no significant differences between
sole crop and mixed cropping system. Flax yield was significantly (P<0.001) higher in sole crop than
mixed and alternate cropping systems. There were no significant differences in grain yield between
mixed and alternate cropping systems. Flax grain yield averaged over Roblin and Melita was significantly
(P=0.014) higher in sole crop (2710 kg ha-1) compared to mixed (744 kg ha-1) and alternate (827kg ha-
1) cropping systems (Table 6).
Dry forage yield Faba-Oat intercrop did not significantly influence dry forage yield at Melita but the yield ranged from
6699 kg ha-1 to 10149 kg ha-1 in 2020. However, at Roblin, dry forage yield was
significantly (P=0.002) different between sole crop oat and sole fababean only. Yield from sole crop
oat (12680 kg ha-1) was not significantly different from mixed (10793 kg ha-1) and alternate (8720 kg ha-
1) cropping systems. There were no significant differences in dry forage yield when the 2 sites were
combined (Table 3).
Similar to faba-oat intercrop, there were no significant differences in dry forage yield observed in all cropping systems under pea-oat intercrop at Melita. Dry forage yields ranged from 9014 kg ha-1 to 10510 kg ha-1. At Roblin, there were also no significant differences in dry forage yield and the ranges were 9260 kg ha-1 to 10553 kg ha-1 (Table 4). Land equivalence ratio At Melita, faba-oat intercrop LER for fababean and oat were significantly (P<0.001 and P=0.003) lower in
mixed and alternate cropping systems compared to sole crops that had LER of 1. However, total LER
was significantly (P=0.005) higher in mixed (LER=1.09) and alternate (LER=1.11) intercrops signaling a
significant benefit of intercropping versus sole cropping (Table 3). At Roblin, LER was significantly
lower (P<0.001) when faba and oat were analyzed separately. Total LER for both crops was also below 1,
meaning there was no advantage of intercropping over sole cropping at Reston in 2020. When both sites
Parkland Crop Diversification Foundation Annual Report 2020 93
were considered, sole crop prevailed compared to intercrop as the LER for the later were less than 1 for
intercrops.
Pea and oat LER were significantly (P<0.001) low when crops were analyzed separately at Melita. Pea
performed better in mixed compared to alternate intercropping system while the performance was vice
versa for oat. Total LER suggested that there was a significant (P=0.004) benefit of pea-oat intercrop
when an alternate cropping system (LER=1.13) is adopted compared to mixed (LER=1.05) or sole
cropping system (LER=1) (Table 4). At Roblin, while partial LERs were significantly lower than 1 for oat or
pea, total LER suggested a significant (P=0.039) benefit of intercropping pea with oats using either mixed
(LER=1.40) or alternate (LER=1.19) cropping systems. A combined site analysis showed significant
differences in partial LERs but there was no benefit in adopting any of the intercropping systems over
sole crops and both mixed and alternate cropping systems did not have an advantage over the other.
Land equivalent ratio for sole (LER=1) fababean and mixed (LER=0.9) cropping systems was significantly
(P=0.01) higher than alternate cropping system (LER=0.59) at Melita. Mixed cropping option had an
advantage over alternate cropping system. Buckwheat LER was significantly (P<0.001) lower for mixed
(LER=0.14) and alternate (LER=0.25) cropping systems compared to the sole crop (LER=1) (Table 5). The
TLER was not significantly different, hence, similar benefits could be obtained from adopting either
cropping systems. At Roblin, LER for fababean sole crop was significantly (P=0.001) higher than mixed
and alternate cropping systems that had values less than 1. Buckwheat LER for the sole crop was also
significantly (P=0.03) higher than the other two cropping systems (Table 5). Similar to results from
Melita, there were no benefits of adopting either intercropping systems over sole crops at Roblin in
2020. However, a combined analysis of the two sites showed mixed (TLER=1.06) cropping system to be a
significantly (P=0.005) better option than alternate (TLER=0.87) cropping system.
Land equivalent ratio for sole (LER=1) fababean and mixed (LER=1.04) cropping systems was
significantly (P=0.002) higher than alternate (LER=0.73) cropping system for faba-flax intercrop at Melita
(Table 6). Flax LER was significantly (P<0.001) lower for mixed and alternate cropping systems compared
to sole crop. The TLER for mixed (TLER=1.13) cropping system was significantly (P=0.024) higher than
alternate (TLER=0.98) cropping system. In this case, mixed cropping system would be a better option
than alternating rows of flax and fababean. At Roblin, alternate cropping system had significantly
(P=0.025) lower LER (0.73) compared to fababean sole crop. Flax LER in mixed and alternate cropping
systems was also significantly (P<0.001) lower than flax sole crop. Neither cropping systems proved to
be better options over sole crops at Roblin in 2020.
Protein content and seed weight Oat protein ranged from 9.93% to 11.2% for faba-oat intercrop at Melita but there were no significant
differences between cropping systems. However, at Roblin, alternate (11.08%) cropping system had
significantly (P=0.034) higher protein content than sole (10.03%) crop oat. There were no significant
differences between mixed and alternate cropping systems, and between mixed and sole crop (Table
7). Oat seed weight based on a 500 seed count was significantly (P=0.042) different at Melita. Oat seed
in sole crop weighed 38.23 g per 500 seed count, while seed in mixed and alternate cropping systems
weighed 33.84 g and 35.62 g per 500 seed count, respectively. Fababean seed weight was also
measured for 500 seed count and there were significant (P=0.031) differences in seed weight at
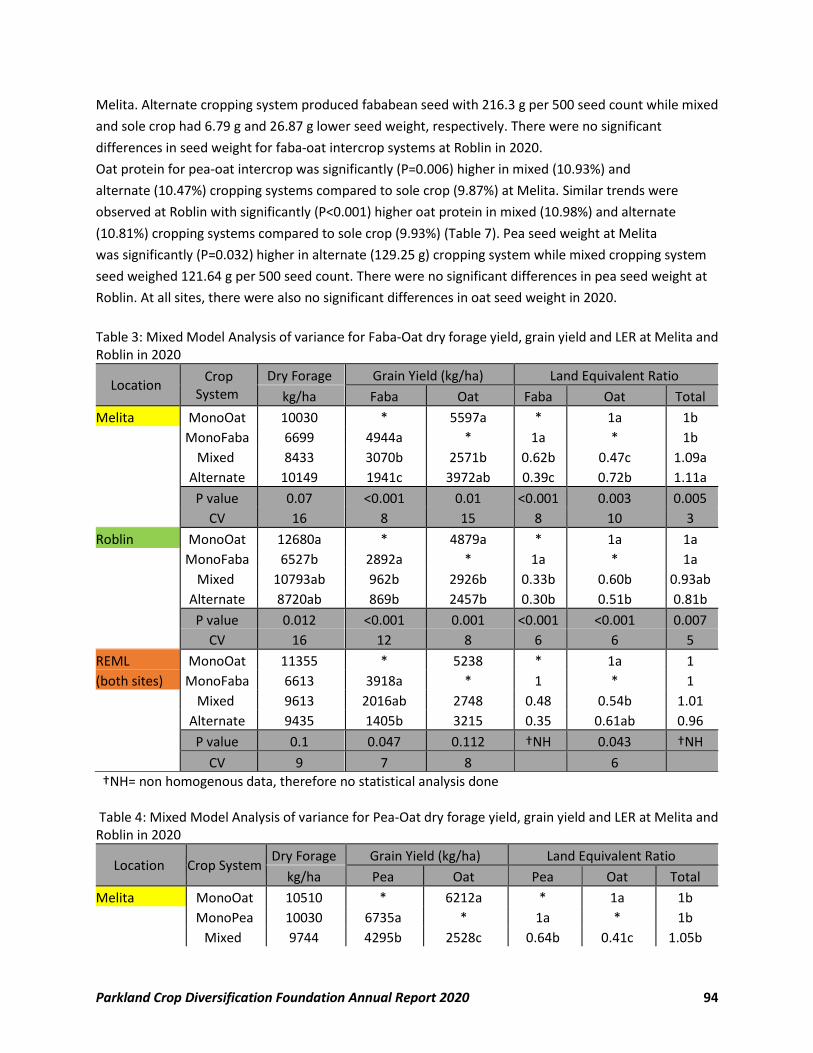
Parkland Crop Diversification Foundation Annual Report 2020 94
Melita. Alternate cropping system produced fababean seed with 216.3 g per 500 seed count while mixed
and sole crop had 6.79 g and 26.87 g lower seed weight, respectively. There were no significant
differences in seed weight for faba-oat intercrop systems at Roblin in 2020.
Oat protein for pea-oat intercrop was significantly (P=0.006) higher in mixed (10.93%) and
alternate (10.47%) cropping systems compared to sole crop (9.87%) at Melita. Similar trends were
observed at Roblin with significantly (P<0.001) higher oat protein in mixed (10.98%) and alternate
(10.81%) cropping systems compared to sole crop (9.93%) (Table 7). Pea seed weight at Melita
was significantly (P=0.032) higher in alternate (129.25 g) cropping system while mixed cropping system
seed weighed 121.64 g per 500 seed count. There were no significant differences in pea seed weight at
Roblin. At all sites, there were also no significant differences in oat seed weight in 2020.
Table 3: Mixed Model Analysis of variance for Faba-Oat dry forage yield, grain yield and LER at Melita and Roblin in 2020
Location Crop
System Dry Forage Grain Yield (kg/ha) Land Equivalent Ratio
kg/ha Faba Oat Faba Oat Total
Melita MonoOat 10030 * 5597a * 1a 1b
MonoFaba 6699 4944a * 1a * 1b
Mixed 8433 3070b 2571b 0.62b 0.47c 1.09a
Alternate 10149 1941c 3972ab 0.39c 0.72b 1.11a
P value 0.07 <0.001 0.01 <0.001 0.003 0.005
CV 16 8 15 8 10 3
Roblin MonoOat 12680a * 4879a * 1a 1a
MonoFaba 6527b 2892a * 1a * 1a
Mixed 10793ab 962b 2926b 0.33b 0.60b 0.93ab
Alternate 8720ab 869b 2457b 0.30b 0.51b 0.81b
P value 0.012 <0.001 0.001 <0.001 <0.001 0.007
CV 16 12 8 6 6 5
REML MonoOat 11355 * 5238 * 1a 1
(both sites) MonoFaba 6613 3918a * 1 * 1
Mixed 9613 2016ab 2748 0.48 0.54b 1.01
Alternate 9435 1405b 3215 0.35 0.61ab 0.96
P value 0.1 0.047 0.112 †NH 0.043 †NH
CV 9 7 8 6
†NH= non homogenous data, therefore no statistical analysis done Table 4: Mixed Model Analysis of variance for Pea-Oat dry forage yield, grain yield and LER at Melita and Roblin in 2020
Location Crop System Dry Forage Grain Yield (kg/ha) Land Equivalent Ratio
kg/ha Pea Oat Pea Oat Total
Melita MonoOat 10510 * 6212a * 1a 1b
MonoPea 10030 6735a * 1a * 1b
Mixed 9744 4295b 2528c 0.64b 0.41c 1.05b
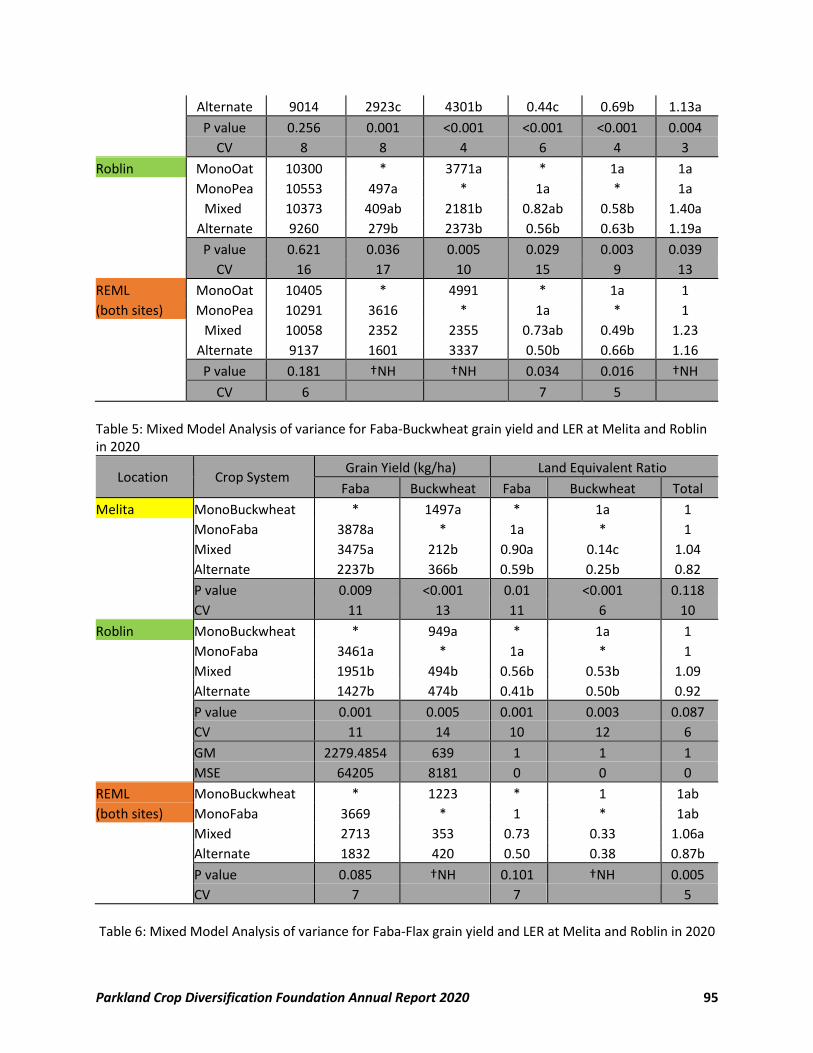
Parkland Crop Diversification Foundation Annual Report 2020 95
Alternate 9014 2923c 4301b 0.44c 0.69b 1.13a
P value 0.256 0.001 <0.001 <0.001 <0.001 0.004
CV 8 8 4 6 4 3
Roblin MonoOat 10300 * 3771a * 1a 1a
MonoPea 10553 497a * 1a * 1a
Mixed 10373 409ab 2181b 0.82ab 0.58b 1.40a
Alternate 9260 279b 2373b 0.56b 0.63b 1.19a
P value 0.621 0.036 0.005 0.029 0.003 0.039
CV 16 17 10 15 9 13
REML MonoOat 10405 * 4991 * 1a 1
(both sites) MonoPea 10291 3616 * 1a * 1
Mixed 10058 2352 2355 0.73ab 0.49b 1.23
Alternate 9137 1601 3337 0.50b 0.66b 1.16
P value 0.181 †NH †NH 0.034 0.016 †NH
CV 6 7 5
Table 5: Mixed Model Analysis of variance for Faba-Buckwheat grain yield and LER at Melita and Roblin in 2020
Location Crop System Grain Yield (kg/ha) Land Equivalent Ratio
Faba Buckwheat Faba Buckwheat Total
Melita MonoBuckwheat * 1497a * 1a 1
MonoFaba 3878a * 1a * 1
Mixed 3475a 212b 0.90a 0.14c 1.04
Alternate 2237b 366b 0.59b 0.25b 0.82
P value 0.009 <0.001 0.01 <0.001 0.118
CV 11 13 11 6 10
Roblin MonoBuckwheat * 949a * 1a 1
MonoFaba 3461a * 1a * 1
Mixed 1951b 494b 0.56b 0.53b 1.09
Alternate 1427b 474b 0.41b 0.50b 0.92
P value 0.001 0.005 0.001 0.003 0.087
CV 11 14 10 12 6
GM 2279.4854 639 1 1 1
MSE 64205 8181 0 0 0
REML MonoBuckwheat * 1223 * 1 1ab
(both sites) MonoFaba 3669 * 1 * 1ab
Mixed 2713 353 0.73 0.33 1.06a
Alternate 1832 420 0.50 0.38 0.87b
P value 0.085 †NH 0.101 †NH 0.005
CV 7 7 5
Table 6: Mixed Model Analysis of variance for Faba-Flax grain yield and LER at Melita and Roblin in 2020
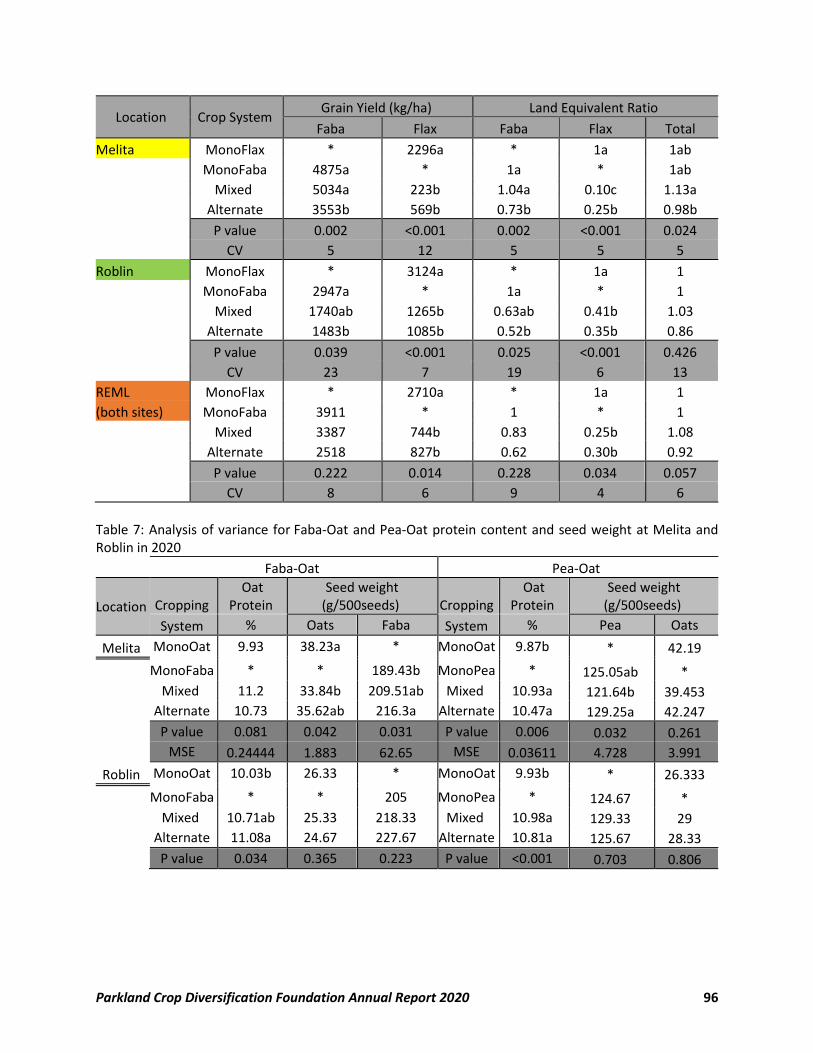
Parkland Crop Diversification Foundation Annual Report 2020 96
Location Crop System Grain Yield (kg/ha) Land Equivalent Ratio
Faba Flax Faba Flax Total
Melita MonoFlax * 2296a * 1a 1ab
MonoFaba 4875a * 1a * 1ab
Mixed 5034a 223b 1.04a 0.10c 1.13a
Alternate 3553b 569b 0.73b 0.25b 0.98b
P value 0.002 <0.001 0.002 <0.001 0.024
CV 5 12 5 5 5
Roblin MonoFlax * 3124a * 1a 1
MonoFaba 2947a * 1a * 1
Mixed 1740ab 1265b 0.63ab 0.41b 1.03
Alternate 1483b 1085b 0.52b 0.35b 0.86
P value 0.039 <0.001 0.025 <0.001 0.426
CV 23 7 19 6 13
REML MonoFlax * 2710a * 1a 1
(both sites) MonoFaba 3911 * 1 * 1
Mixed 3387 744b 0.83 0.25b 1.08
Alternate 2518 827b 0.62 0.30b 0.92
P value 0.222 0.014 0.228 0.034 0.057
CV 8 6 9 4 6
Table 7: Analysis of variance for Faba-Oat and Pea-Oat protein content and seed weight at Melita and Roblin in 2020
Faba-Oat Pea-Oat
Location Cropping Oat
Protein Seed weight
(g/500seeds) Cropping Oat
Protein Seed weight
(g/500seeds)
System % Oats Faba System % Pea Oats
Melita MonoOat 9.93 38.23a * MonoOat 9.87b * 42.19
MonoFaba * * 189.43b MonoPea * 125.05ab *
Mixed 11.2 33.84b 209.51ab Mixed 10.93a 121.64b 39.453
Alternate 10.73 35.62ab 216.3a Alternate 10.47a 129.25a 42.247
P value 0.081 0.042 0.031 P value 0.006 0.032 0.261
MSE 0.24444 1.883 62.65 MSE 0.03611 4.728 3.991
Roblin MonoOat 10.03b 26.33 * MonoOat 9.93b * 26.333
MonoFaba * * 205 MonoPea * 124.67 *
Mixed 10.71ab 25.33 218.33 Mixed 10.98a 129.33 29
Alternate 11.08a 24.67 227.67 Alternate 10.81a 125.67 28.33
P value 0.034 0.365 0.223 P value <0.001 0.703 0.806

Parkland Crop Diversification Foundation Annual Report 2020 97
Conclusions Protein content was significantly high in intercrops compared to sole crops. Seed weight also increased in
alternate compared to mixed cropping system as observed in pea-oat and faba-oat intercrops. Land
equivalent ratio increased in alternate and mixed cropping system compared to sole crops meaning that
there were benefits in intercropping than sole cropping. This was especially observed in faba-buckwheat,
pea-oat and faba-oat when individual sites were analyzed. Grain yield from mixed cropping system
matched that of sole crop in some cases, indicating a potential for another option that farmers can choose
from if their objectives include crop diversification. Forage yield was also promising and such cropping
systems as the ones in this study could be useful for farmers who are integrate with livestock
production. Results from this study are from 2 site-years and additional site-years of data are required to
validate these findings and come up with recommendations that farmers can use in their respective areas
of production.
References Dhima, K. V., Vasilakoglou, I. B., Keco, R., Xh., Dima, A. K., Paschalidis, K., A., Gatsis, T. D. 2013. Forage yield and competitive indices of fababean intercropped with oats. Grass and Forage Science 69 (2) 376-383. https://doi.org/10.1111/gfs.12084 Kopke, U., and Nemecek, T. 2010. Ecological services of fababean. Field Crop Research 115 (3): 217-233 https://doi.org/10.1016/j.fcr.2009.10.012 Andersen, B. J., Samarappuli, D. P., Wick, A., Berti, M. T. 2020. Fababean and Pea Can Provide Late Fall Forage Grazing without Affecting Maize Yield the Following Season. Agronomy 2020, 10(1), 80; https://doi.org/10.3390/agronomy10010080
Parkland Crop Diversification Foundation Annual Report 2020 98
Organic Trials
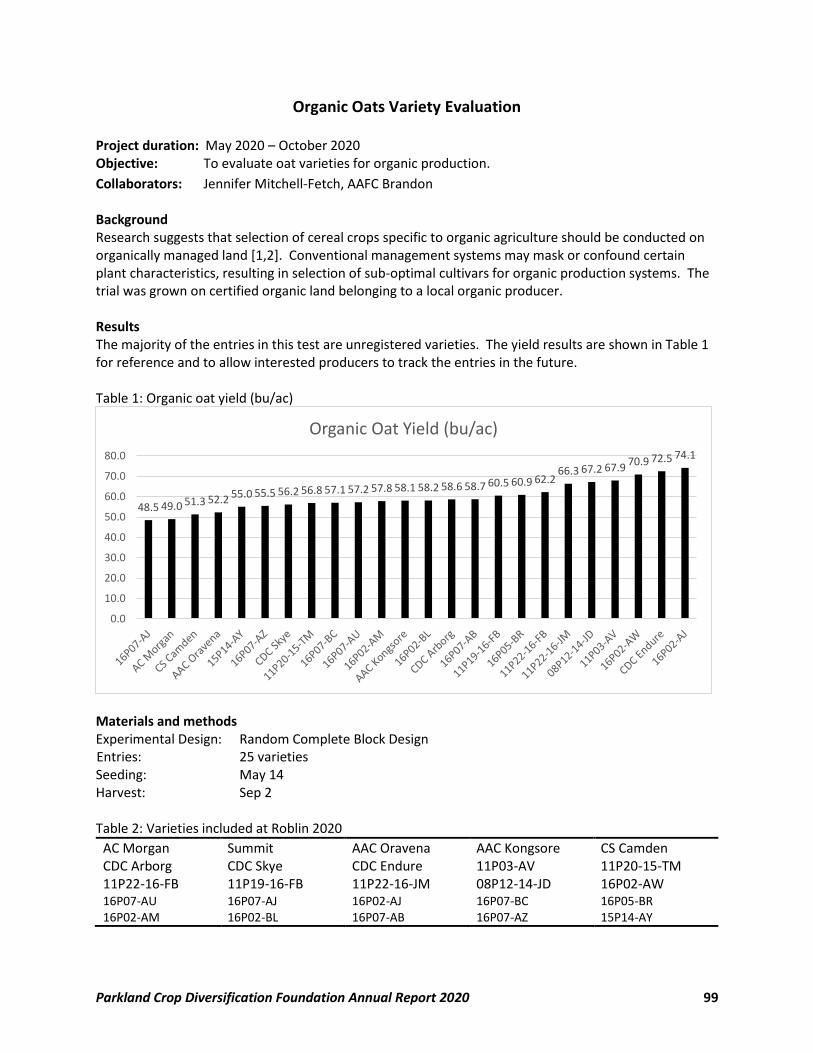
Parkland Crop Diversification Foundation Annual Report 2020 99
Organic Oats Variety Evaluation Project duration: May 2020 – October 2020 Objective: To evaluate oat varieties for organic production.
Collaborators: Jennifer Mitchell-Fetch, AAFC Brandon Background Research suggests that selection of cereal crops specific to organic agriculture should be conducted on organically managed land [1,2]. Conventional management systems may mask or confound certain plant characteristics, resulting in selection of sub-optimal cultivars for organic production systems. The trial was grown on certified organic land belonging to a local organic producer. Results The majority of the entries in this test are unregistered varieties. The yield results are shown in Table 1 for reference and to allow interested producers to track the entries in the future. Table 1: Organic oat yield (bu/ac)
Materials and methods Experimental Design: Random Complete Block Design
Entries: 25 varieties Seeding: May 14 Harvest: Sep 2 Table 2: Varieties included at Roblin 2020
AC Morgan Summit AAC Oravena AAC Kongsore CS Camden
CDC Arborg CDC Skye CDC Endure 11P03-AV 11P20-15-TM 11P22-16-FB 11P19-16-FB 11P22-16-JM 08P12-14-JD 16P02-AW 16P07-AU 16P07-AJ 16P02-AJ 16P07-BC 16P05-BR 16P02-AM 16P02-BL 16P07-AB 16P07-AZ 15P14-AY
48.5 49.0 51.3 52.2 55.0 55.5 56.2 56.8 57.1 57.2 57.8 58.1 58.2 58.6 58.7 60.5 60.9 62.266.3 67.2 67.9
70.9 72.5 74.1
0.0
10.0
20.0
30.0
40.0
50.0
60.0
70.0
80.0
Organic Oat Yield (bu/ac)
Parkland Crop Diversification Foundation Annual Report 2020 100
Data collected Date collected Maturity: Aug 15-17 Height: Aug 14 Lodging: Sep 2 Yield: Sep 2 Moisture: Sep 2 Agronomic info Previous year’s crop: Organic wheat Soil Type: Erickson Clay Loam Landscape: Rolling with trees to the south Seedbed preparation: Cultivated and harrowed Table 3: Spring 2020 Soil Test
Available
N 73 lb/ac
P 5 ppm
K 168 ppm
References [1] Reid, T., Yang, R.-C., Salmon, D. and Spaner, D. (2009). Should spring wheat breeding for organically managed systems be conducted on organically managed land? Euphytica 169:239-252. [2] Dalhousie University, Organic Agriculture Centre of Canada. The crafting of organic oats. https://www.dal.ca/faculty/agriculture/oacc/en-home/about/about-oacc/documents/newpaper-articles/newsarticles-2012/newsarticles-2012-fetch.html
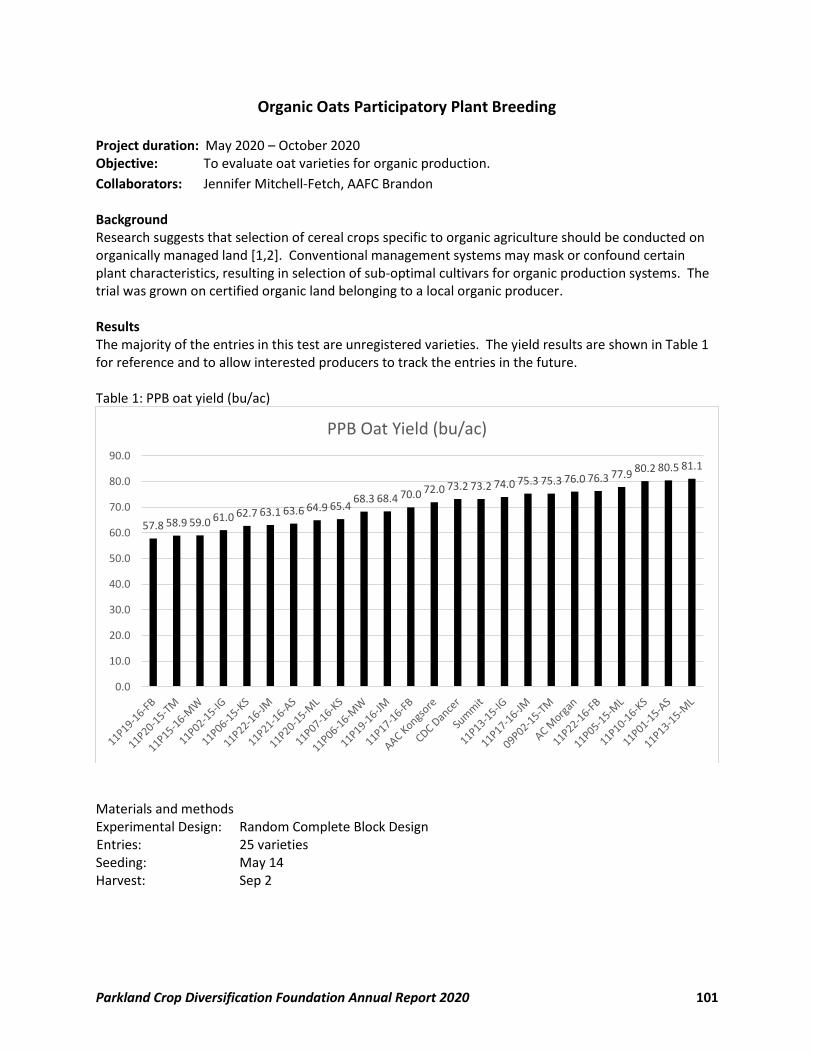
Parkland Crop Diversification Foundation Annual Report 2020 101
Organic Oats Participatory Plant Breeding Project duration: May 2020 – October 2020 Objective: To evaluate oat varieties for organic production.
Collaborators: Jennifer Mitchell-Fetch, AAFC Brandon Background Research suggests that selection of cereal crops specific to organic agriculture should be conducted on organically managed land [1,2]. Conventional management systems may mask or confound certain plant characteristics, resulting in selection of sub-optimal cultivars for organic production systems. The trial was grown on certified organic land belonging to a local organic producer. Results The majority of the entries in this test are unregistered varieties. The yield results are shown in Table 1 for reference and to allow interested producers to track the entries in the future. Table 1: PPB oat yield (bu/ac)
Materials and methods Experimental Design: Random Complete Block Design
Entries: 25 varieties Seeding: May 14 Harvest: Sep 2
57.8 58.9 59.0 61.0 62.7 63.1 63.6 64.9 65.468.3 68.4 70.0 72.0 73.2 73.2 74.0 75.3 75.3 76.0 76.3 77.9 80.2 80.5 81.1
0.0
10.0
20.0
30.0
40.0
50.0
60.0
70.0
80.0
90.0
PPB Oat Yield (bu/ac)
Parkland Crop Diversification Foundation Annual Report 2020 102
Table 2: Varieties included at Roblin 2020
11P01-15-AS 11P13-15-IG 11P15-16-MW 11P19-16-FB AC Morgan
11P21-16-AS 11P02-15-IG 11P06-15-KS 11P17-16-FB CDC Dancer 11P05-15-ML 11P20-15-TM 11P10-16-KS 11P22-16-JM Summit 11P13-15-ML 09P02-15-TM 11P07-16-KS 11P19-16-JM AAC Kongsore
11P20-15-ML 11P06-16-MW 11P22-16-FB 11P17-16-JM
Data collected Date collected Weekly Maturity: Aug 5-29 Height: Aug 14 Lodging: Sep 2 Yield: Sep 2 Moisture: Sep 2 Agronomic info Previous year’s crop: Organic wheat Soil Type: Erickson Clay Loam Landscape: Rolling with trees to the south Seedbed preparation: Cultivated and harrowed Table 3: Spring 2020 Soil Test
Available
N 73 lb/ac
P 5 ppm
K 168 ppm
(Organic trial: no fertilizer or herbicide applied)
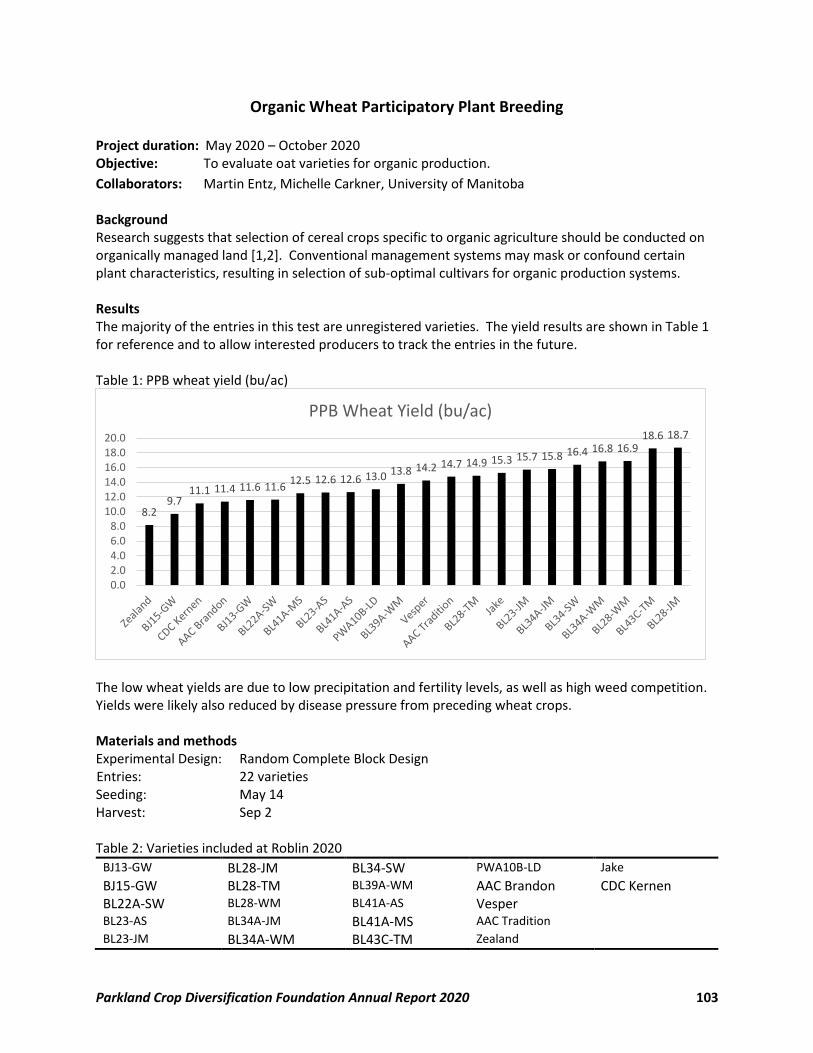
Parkland Crop Diversification Foundation Annual Report 2020 103
Organic Wheat Participatory Plant Breeding Project duration: May 2020 – October 2020 Objective: To evaluate oat varieties for organic production.
Collaborators: Martin Entz, Michelle Carkner, University of Manitoba Background Research suggests that selection of cereal crops specific to organic agriculture should be conducted on organically managed land [1,2]. Conventional management systems may mask or confound certain plant characteristics, resulting in selection of sub-optimal cultivars for organic production systems. Results The majority of the entries in this test are unregistered varieties. The yield results are shown in Table 1 for reference and to allow interested producers to track the entries in the future. Table 1: PPB wheat yield (bu/ac)
The low wheat yields are due to low precipitation and fertility levels, as well as high weed competition. Yields were likely also reduced by disease pressure from preceding wheat crops. Materials and methods Experimental Design: Random Complete Block Design
Entries: 22 varieties Seeding: May 14 Harvest: Sep 2 Table 2: Varieties included at Roblin 2020
BJ13-GW BL28-JM BL34-SW PWA10B-LD Jake
BJ15-GW BL28-TM BL39A-WM AAC Brandon CDC Kernen BL22A-SW BL28-WM BL41A-AS Vesper BL23-AS BL34A-JM BL41A-MS AAC Tradition
BL23-JM BL34A-WM BL43C-TM Zealand
8.29.7
11.1 11.4 11.6 11.612.5 12.6 12.6 13.0 13.8 14.2 14.7 14.9 15.3 15.7 15.8 16.4 16.8 16.9
18.6 18.7
0.02.04.06.08.0
10.012.014.016.018.020.0
PPB Wheat Yield (bu/ac)

Parkland Crop Diversification Foundation Annual Report 2020 104
Data collected Date collected Weekly Maturity: Aug 5-29 Height: Aug 14 Lodging: Sep 2 Yield: Sep 2 Moisture: Sep 2 Additional plant sample collection, including leaf, root and soil core from the same plant, from a total of 50 plants, was completed at wheat heading and sent to a Toronto PhD Student for analysis. These samples measured both leaf functional traits (leaf area, specific leaf area, and leaf nitrogen), and root traits (root diameter, root mass, and root nitrogen) for three of the wheat varieties. Agronomic info Previous year’s crop: Organic wheat Soil Type: Erickson Clay Loam Landscape: Rolling with trees to the south Seedbed preparation: Cultivated and harrowed Table 3: Spring 2020 Soil Test
Available
N 73 lb/ac
P 5 ppm
K 168 ppm
(Organic trial: no fertilizer or herbicide applied)
Parkland Crop Diversification Foundation Annual Report 2020 105
Pulse Trials
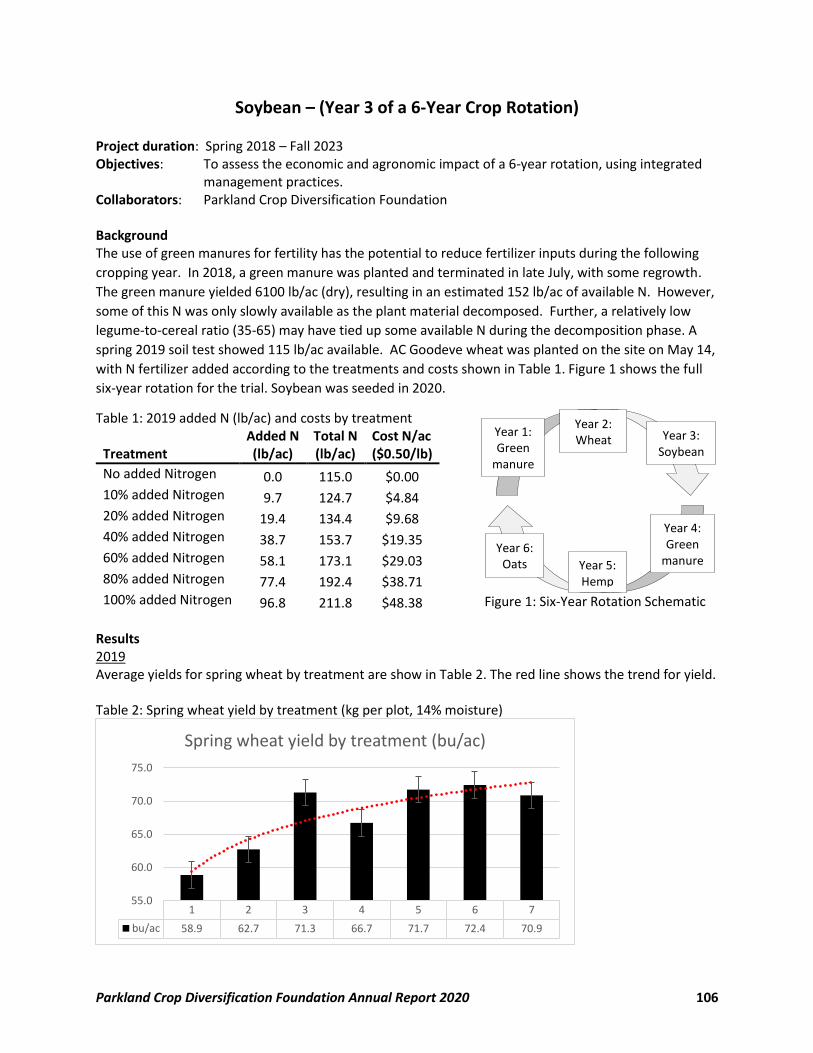
Parkland Crop Diversification Foundation Annual Report 2020 106
Soybean – (Year 3 of a 6-Year Crop Rotation)
Project duration: Spring 2018 – Fall 2023 Objectives: To assess the economic and agronomic impact of a 6-year rotation, using integrated
management practices. Collaborators: Parkland Crop Diversification Foundation Background The use of green manures for fertility has the potential to reduce fertilizer inputs during the following
cropping year. In 2018, a green manure was planted and terminated in late July, with some regrowth.
The green manure yielded 6100 lb/ac (dry), resulting in an estimated 152 lb/ac of available N. However,
some of this N was only slowly available as the plant material decomposed. Further, a relatively low
legume-to-cereal ratio (35-65) may have tied up some available N during the decomposition phase. A
spring 2019 soil test showed 115 lb/ac available. AC Goodeve wheat was planted on the site on May 14,
with N fertilizer added according to the treatments and costs shown in Table 1. Figure 1 shows the full
six-year rotation for the trial. Soybean was seeded in 2020.
Table 1: 2019 added N (lb/ac) and costs by treatment
Treatment Added N (lb/ac)
Total N (lb/ac)
Cost N/ac ($0.50/lb)
No added Nitrogen 0.0 115.0 $0.00 10% added Nitrogen 9.7 124.7 $4.84 20% added Nitrogen 19.4 134.4 $9.68 40% added Nitrogen 38.7 153.7 $19.35 60% added Nitrogen 58.1 173.1 $29.03 80% added Nitrogen 77.4 192.4 $38.71 100% added Nitrogen 96.8 211.8 $48.38
Results 2019 Average yields for spring wheat by treatment are show in Table 2. The red line shows the trend for yield. Table 2: Spring wheat yield by treatment (kg per plot, 14% moisture)
1 2 3 4 5 6 7
bu/ac 58.9 62.7 71.3 66.7 71.7 72.4 70.9
55.0
60.0
65.0
70.0
75.0
Spring wheat yield by treatment (bu/ac)
Figure 1: Six-Year Rotation Schematic
Year 4: Green
manure Year 5: Hemp
Year 6: Oats
Year 1: Green
manure
Year 2: Wheat Year 3:
Soybean
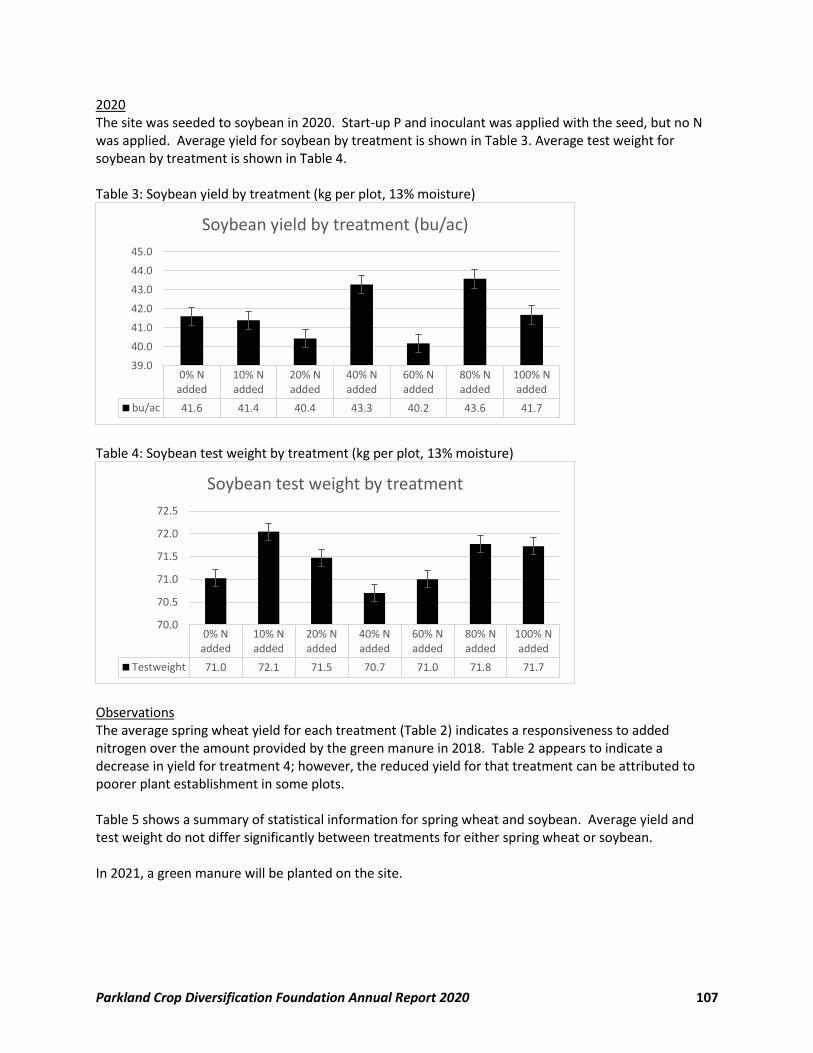
Parkland Crop Diversification Foundation Annual Report 2020 107
2020 The site was seeded to soybean in 2020. Start-up P and inoculant was applied with the seed, but no N was applied. Average yield for soybean by treatment is shown in Table 3. Average test weight for soybean by treatment is shown in Table 4. Table 3: Soybean yield by treatment (kg per plot, 13% moisture)
Table 4: Soybean test weight by treatment (kg per plot, 13% moisture)
Observations The average spring wheat yield for each treatment (Table 2) indicates a responsiveness to added nitrogen over the amount provided by the green manure in 2018. Table 2 appears to indicate a decrease in yield for treatment 4; however, the reduced yield for that treatment can be attributed to poorer plant establishment in some plots. Table 5 shows a summary of statistical information for spring wheat and soybean. Average yield and test weight do not differ significantly between treatments for either spring wheat or soybean. In 2021, a green manure will be planted on the site.
0% Nadded
10% Nadded
20% Nadded
40% Nadded
60% Nadded
80% Nadded
100% Nadded
bu/ac 41.6 41.4 40.4 43.3 40.2 43.6 41.7
39.0
40.0
41.0
42.0
43.0
44.0
45.0
Soybean yield by treatment (bu/ac)
0% Nadded
10% Nadded
20% Nadded
40% Nadded
60% Nadded
80% Nadded
100% Nadded
Testweight 71.0 72.1 71.5 70.7 71.0 71.8 71.7
70.0
70.5
71.0
71.5
72.0
72.5
Soybean test weight by treatment
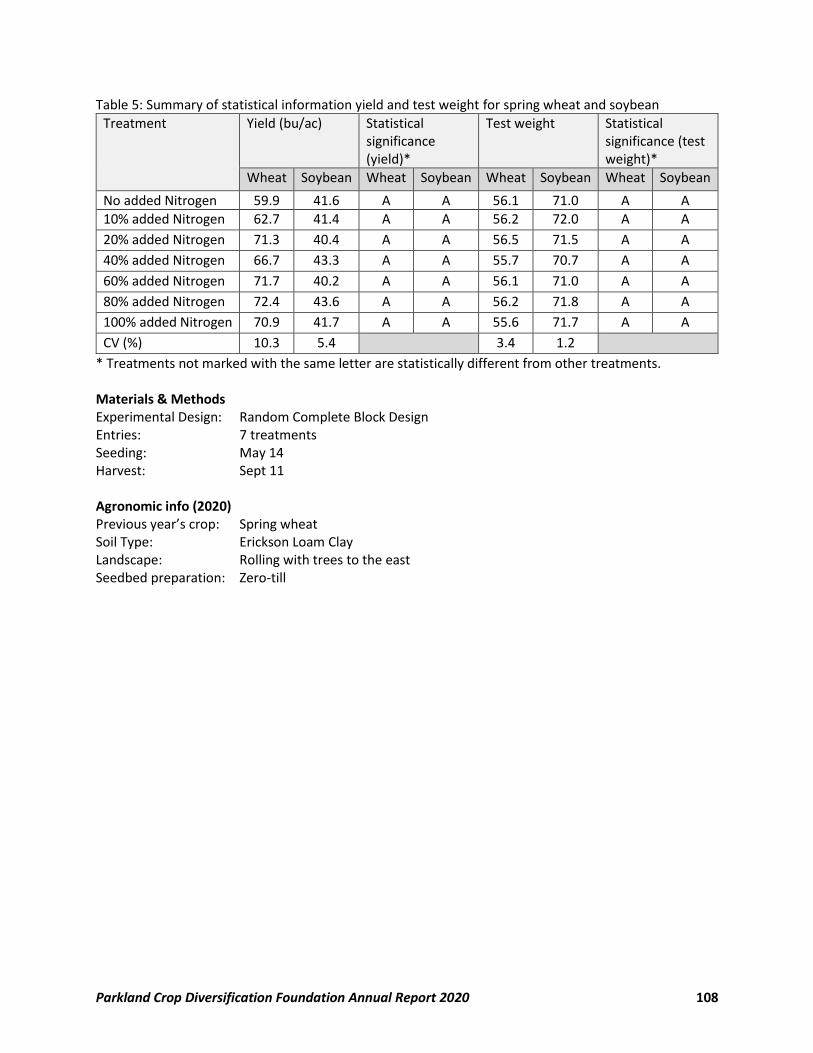
Parkland Crop Diversification Foundation Annual Report 2020 108
Table 5: Summary of statistical information yield and test weight for spring wheat and soybean
Treatment Yield (bu/ac) Statistical significance (yield)*
Test weight Statistical significance (test weight)*
Wheat Soybean Wheat Soybean Wheat Soybean Wheat Soybean
No added Nitrogen 59.9 41.6 A A 56.1 71.0 A A
10% added Nitrogen 62.7 41.4 A A 56.2 72.0 A A
20% added Nitrogen 71.3 40.4 A A 56.5 71.5 A A
40% added Nitrogen 66.7 43.3 A A 55.7 70.7 A A
60% added Nitrogen 71.7 40.2 A A 56.1 71.0 A A
80% added Nitrogen 72.4 43.6 A A 56.2 71.8 A A
100% added Nitrogen 70.9 41.7 A A 55.6 71.7 A A
CV (%) 10.3 5.4 3.4 1.2
* Treatments not marked with the same letter are statistically different from other treatments. Materials & Methods Experimental Design: Random Complete Block Design Entries: 7 treatments Seeding: May 14 Harvest: Sept 11 Agronomic info (2020) Previous year’s crop: Spring wheat Soil Type: Erickson Loam Clay Landscape: Rolling with trees to the east Seedbed preparation: Zero-till
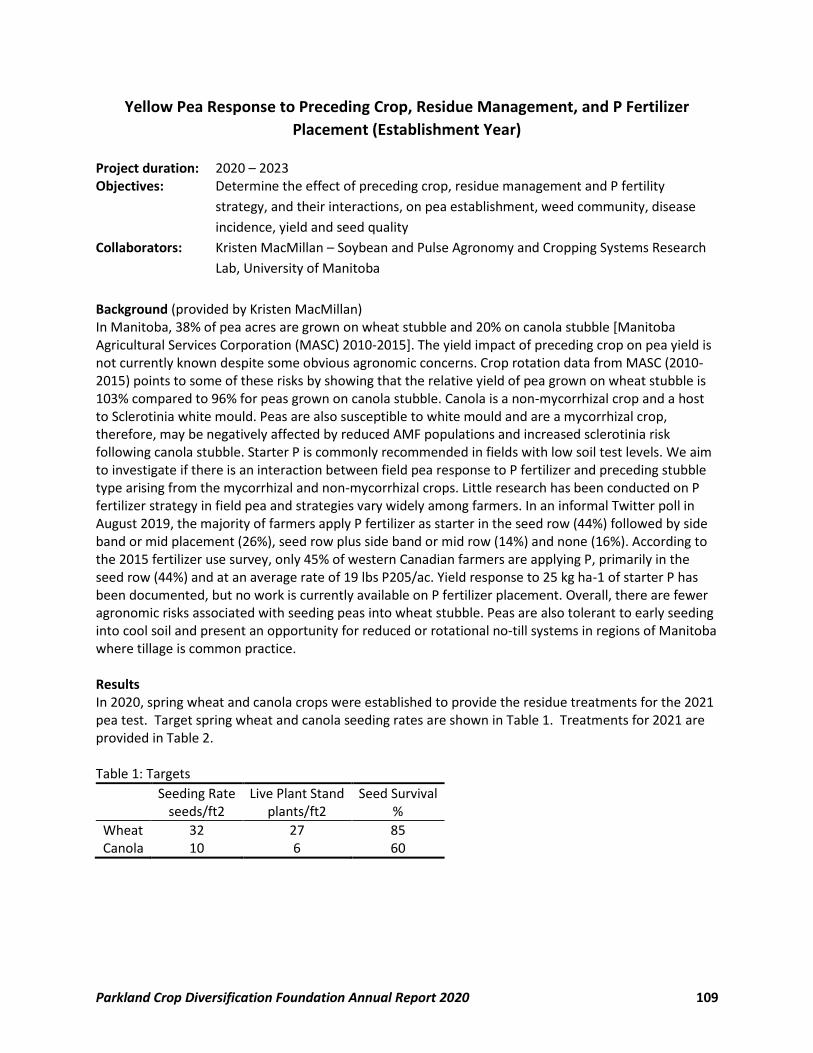
Parkland Crop Diversification Foundation Annual Report 2020 109
Yellow Pea Response to Preceding Crop, Residue Management, and P Fertilizer
Placement (Establishment Year) Project duration: 2020 – 2023 Objectives: Determine the effect of preceding crop, residue management and P fertility
strategy, and their interactions, on pea establishment, weed community, disease
incidence, yield and seed quality
Collaborators: Kristen MacMillan – Soybean and Pulse Agronomy and Cropping Systems Research
Lab, University of Manitoba
Background (provided by Kristen MacMillan) In Manitoba, 38% of pea acres are grown on wheat stubble and 20% on canola stubble [Manitoba Agricultural Services Corporation (MASC) 2010-2015]. The yield impact of preceding crop on pea yield is not currently known despite some obvious agronomic concerns. Crop rotation data from MASC (2010-2015) points to some of these risks by showing that the relative yield of pea grown on wheat stubble is 103% compared to 96% for peas grown on canola stubble. Canola is a non-mycorrhizal crop and a host to Sclerotinia white mould. Peas are also susceptible to white mould and are a mycorrhizal crop, therefore, may be negatively affected by reduced AMF populations and increased sclerotinia risk following canola stubble. Starter P is commonly recommended in fields with low soil test levels. We aim to investigate if there is an interaction between field pea response to P fertilizer and preceding stubble type arising from the mycorrhizal and non-mycorrhizal crops. Little research has been conducted on P fertilizer strategy in field pea and strategies vary widely among farmers. In an informal Twitter poll in August 2019, the majority of farmers apply P fertilizer as starter in the seed row (44%) followed by side band or mid placement (26%), seed row plus side band or mid row (14%) and none (16%). According to the 2015 fertilizer use survey, only 45% of western Canadian farmers are applying P, primarily in the seed row (44%) and at an average rate of 19 lbs P205/ac. Yield response to 25 kg ha-1 of starter P has been documented, but no work is currently available on P fertilizer placement. Overall, there are fewer agronomic risks associated with seeding peas into wheat stubble. Peas are also tolerant to early seeding into cool soil and present an opportunity for reduced or rotational no-till systems in regions of Manitoba where tillage is common practice. Results In 2020, spring wheat and canola crops were established to provide the residue treatments for the 2021 pea test. Target spring wheat and canola seeding rates are shown in Table 1. Treatments for 2021 are provided in Table 2.
Table 1: Targets
Seeding Rate seeds/ft2
Live Plant Stand plants/ft2
Seed Survival %
Wheat 32 27 85 Canola 10 6 60
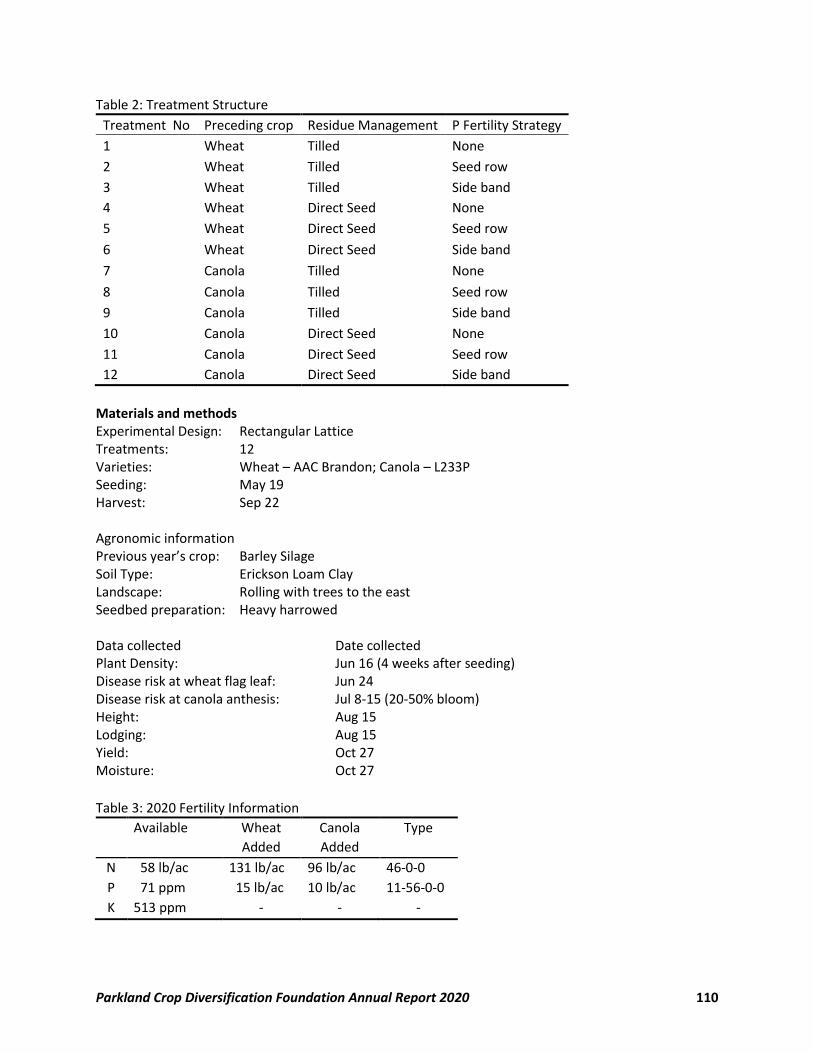
Parkland Crop Diversification Foundation Annual Report 2020 110
Table 2: Treatment Structure
Treatment No Preceding crop Residue Management P Fertility Strategy
1 Wheat Tilled None
2 Wheat Tilled Seed row
3 Wheat Tilled Side band
4 Wheat Direct Seed None
5 Wheat Direct Seed Seed row
6 Wheat Direct Seed Side band
7 Canola Tilled None
8 Canola Tilled Seed row
9 Canola Tilled Side band
10 Canola Direct Seed None
11 Canola Direct Seed Seed row
12 Canola Direct Seed Side band
Materials and methods Experimental Design: Rectangular Lattice Treatments: 12 Varieties: Wheat – AAC Brandon; Canola – L233P Seeding: May 19 Harvest: Sep 22 Agronomic information Previous year’s crop: Barley Silage Soil Type: Erickson Loam Clay Landscape: Rolling with trees to the east Seedbed preparation: Heavy harrowed Data collected Date collected Plant Density: Jun 16 (4 weeks after seeding) Disease risk at wheat flag leaf: Jun 24 Disease risk at canola anthesis: Jul 8-15 (20-50% bloom) Height: Aug 15 Lodging: Aug 15 Yield: Oct 27 Moisture: Oct 27
Table 3: 2020 Fertility Information
Available Wheat
Added
Canola
Added
Type
N 58 lb/ac 131 lb/ac 96 lb/ac 46-0-0
P 71 ppm 15 lb/ac 10 lb/ac 11-56-0-0
K 513 ppm - - -
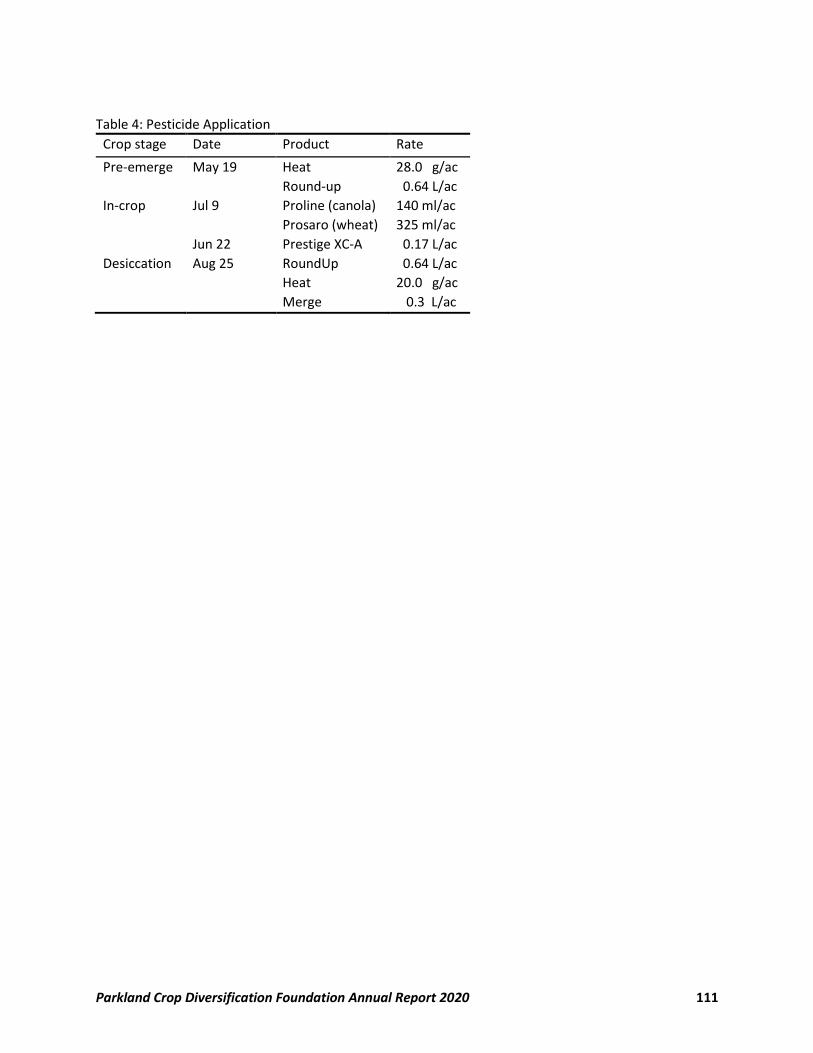
Parkland Crop Diversification Foundation Annual Report 2020 111
Table 4: Pesticide Application
Crop stage Date Product Rate
Pre-emerge May 19 Heat 28.0 g/ac
Round-up 0.64 L/ac
In-crop Jul 9 Proline (canola) 140 ml/ac
Prosaro (wheat) 325 ml/ac
Jun 22 Prestige XC-A 0.17 L/ac
Desiccation Aug 25 RoundUp 0.64 L/ac
Heat 20.0 g/ac
Merge 0.3 L/ac
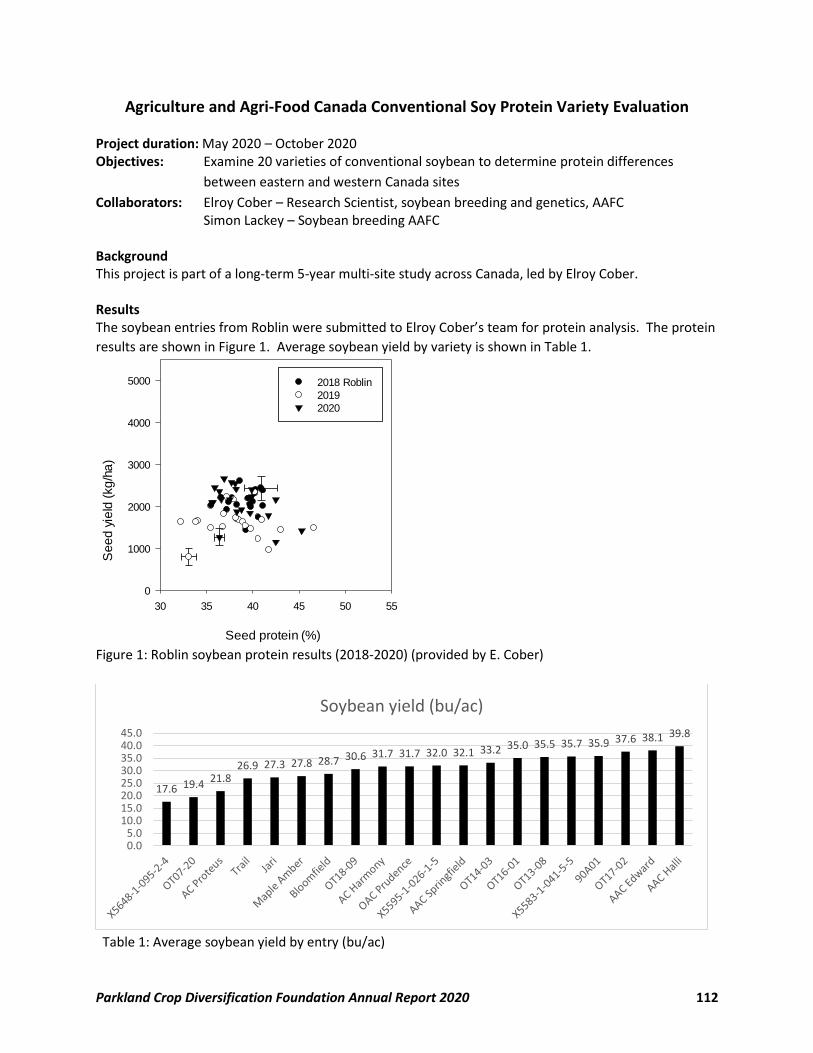
Parkland Crop Diversification Foundation Annual Report 2020 112
Agriculture and Agri-Food Canada Conventional Soy Protein Variety Evaluation
Project duration: May 2020 – October 2020 Objectives: Examine 20 varieties of conventional soybean to determine protein differences
between eastern and western Canada sites
Collaborators: Elroy Cober – Research Scientist, soybean breeding and genetics, AAFC Simon Lackey – Soybean breeding AAFC
Background This project is part of a long-term 5-year multi-site study across Canada, led by Elroy Cober. Results The soybean entries from Roblin were submitted to Elroy Cober’s team for protein analysis. The protein
results are shown in Figure 1. Average soybean yield by variety is shown in Table 1.
30 35 40 45 50 55
Se
ed
yie
ld (
kg
/ha
)
0
1000
2000
3000
4000
5000 2018 Melita
2019
2020
30 35 40 45 50 55
0
1000
2000
3000
4000
5000 2018 Roblin
2019
2020
Seed protein (%)
30 35 40 45 50 55
0
1000
2000
3000
4000
5000 2019 Redvers
2020
Seed protein (%)
30 35 40 45 50 55
Se
ed
yie
ld (
kg
/ha
)
0
1000
2000
3000
4000
50002018 Saskatoon
2019
2020
30 35 40 45 50 55
Se
ed
yie
ld (
kg
/ha
)
0
1000
2000
3000
4000
5000 2018 Melita
2019
2020
30 35 40 45 50 55
0
1000
2000
3000
4000
5000 2018 Roblin
2019
2020
Seed protein (%)
30 35 40 45 50 55
0
1000
2000
3000
4000
5000 2019 Redvers
2020
Seed protein (%)
30 35 40 45 50 55
Se
ed
yie
ld (
kg
/ha
)
0
1000
2000
3000
4000
50002018 Saskatoon
2019
2020
Figure 1: Roblin soybean protein results (2018-2020) (provided by E. Cober)
Table 1: Average soybean yield by entry (bu/ac)
17.6 19.421.8
26.9 27.3 27.8 28.7 30.6 31.7 31.7 32.0 32.1 33.2 35.0 35.5 35.7 35.9 37.6 38.1 39.8
0.05.0
10.015.020.025.030.035.040.045.0
Soybean yield (bu/ac)
Parkland Crop Diversification Foundation Annual Report 2020 113
Materials and methods Experimental Design: Rectangular lattice Entries: 20 entries; 4 replications Seeding: May 21 Harvest: Oct 6 Table 2: Varieties included in trial
90A01 OT14-03 AAC Edward X5595-1-026-1-5 Trail X5583-1-041-5-5 OT16-01 Bloomfield OAC Prudence OT13-08 Maple Amber AAC Springfield OT17-02 AAC Halli AC Harmony AC Proteus Jari OT07-20 OT18-09 X5648-1-095-2-4
Data collected Date collected Population Score: Jun 16 Flowering: Jul 22-24 Heights: Aug 14 Maturity: Sep 7 Lodging: Oct 6 Yield: Oct 25 Moisture: Oct 25 Seed Weight g/100: Oct 26 Agronomic info Previous year’s crop: Barley Silage Soil Type: Erickson Loam Clay Landscape: Rolling with trees to the east Seedbed preparation: Heavy harrowed twice Table 3: Spring 2020 Soil Test
Available Added Type
N 61 lb/ac - -
P 47 ppm 10 lb/ac
K 393 ppm - -
Inoculant added with seed; P banded with seed Table 4: Pesticide Application
Crop stage Date Product Rate
Pre-emerge May 19 RoundUp
Heat
0.64 L/ac
28.0 g/ac
In-crop Jul 22 UAN 28%
Viper
0.8 L/ac
0.4 L/ac
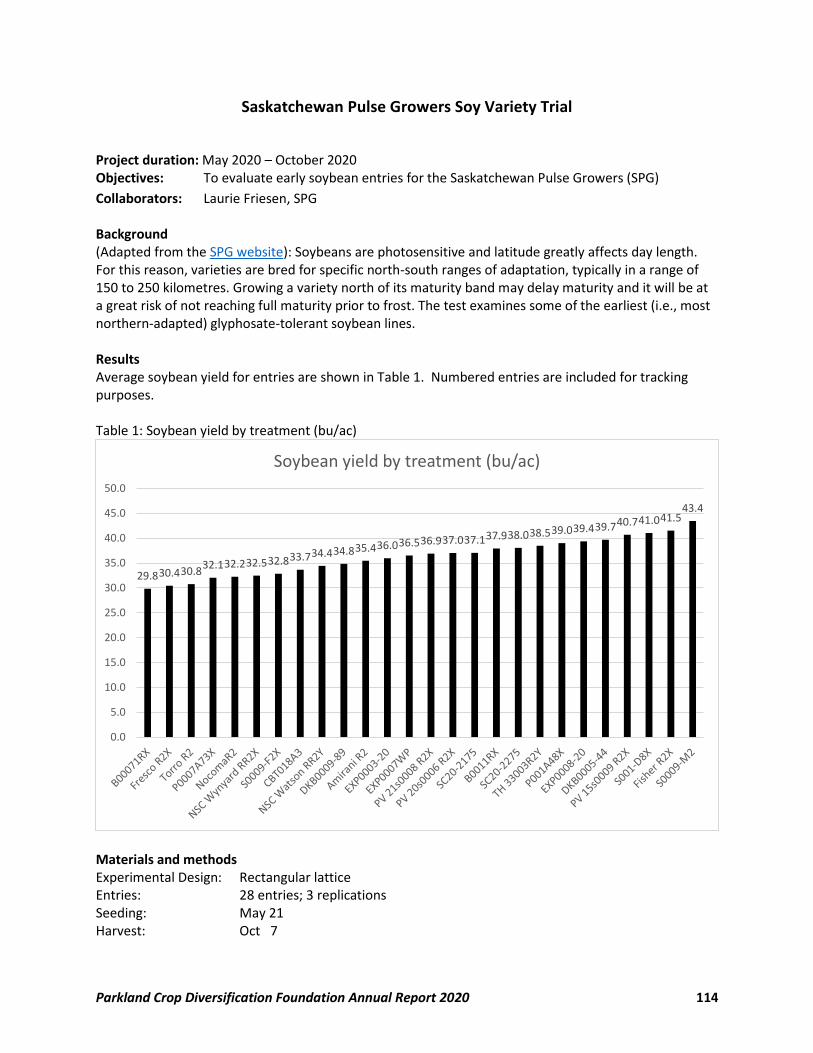
Parkland Crop Diversification Foundation Annual Report 2020 114
Saskatchewan Pulse Growers Soy Variety Trial
Project duration: May 2020 – October 2020 Objectives: To evaluate early soybean entries for the Saskatchewan Pulse Growers (SPG)
Collaborators: Laurie Friesen, SPG
Background (Adapted from the SPG website): Soybeans are photosensitive and latitude greatly affects day length. For this reason, varieties are bred for specific north-south ranges of adaptation, typically in a range of 150 to 250 kilometres. Growing a variety north of its maturity band may delay maturity and it will be at a great risk of not reaching full maturity prior to frost. The test examines some of the earliest (i.e., most northern-adapted) glyphosate-tolerant soybean lines. Results Average soybean yield for entries are shown in Table 1. Numbered entries are included for tracking purposes. Table 1: Soybean yield by treatment (bu/ac)
Materials and methods Experimental Design: Rectangular lattice Entries: 28 entries; 3 replications Seeding: May 21 Harvest: Oct 7
29.830.430.832.132.232.532.833.734.434.835.436.036.536.937.037.137.938.038.539.039.439.740.741.041.5
43.4
0.0
5.0
10.0
15.0
20.0
25.0
30.0
35.0
40.0
45.0
50.0
Soybean yield by treatment (bu/ac)
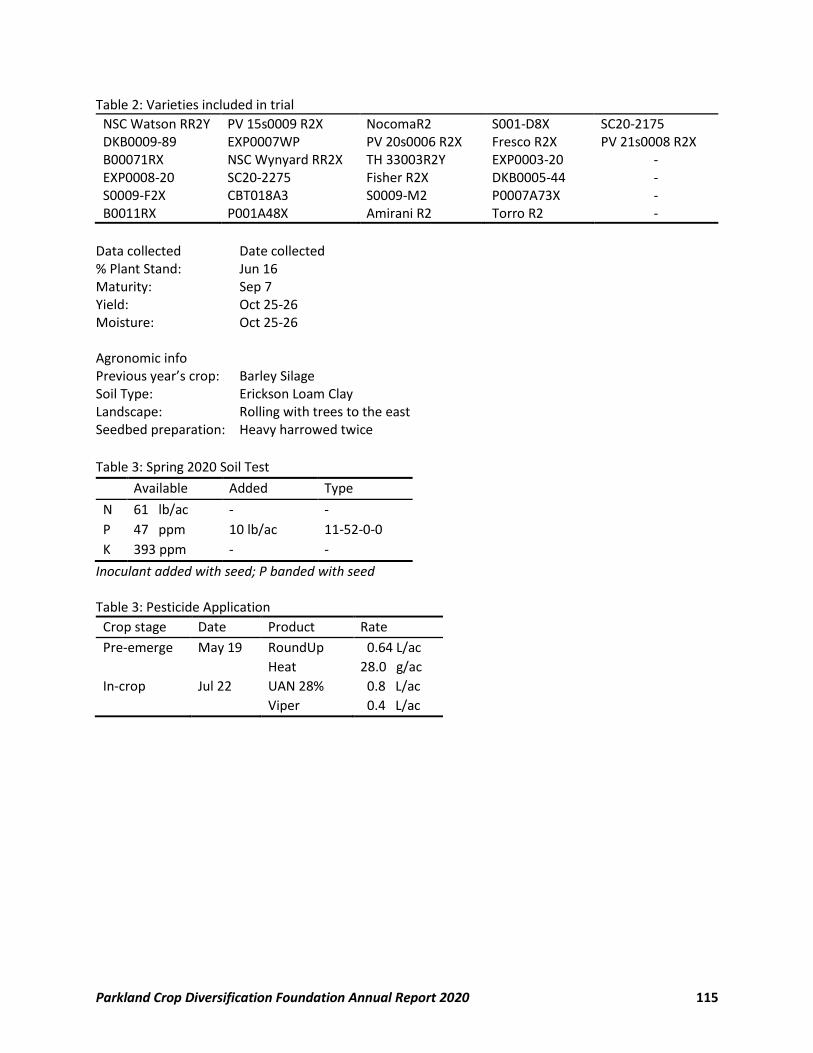
Parkland Crop Diversification Foundation Annual Report 2020 115
Table 2: Varieties included in trial
NSC Watson RR2Y PV 15s0009 R2X NocomaR2 S001-D8X SC20-2175 DKB0009-89 EXP0007WP PV 20s0006 R2X Fresco R2X PV 21s0008 R2X B00071RX NSC Wynyard RR2X TH 33003R2Y EXP0003-20 - EXP0008-20 SC20-2275 Fisher R2X DKB0005-44 - S0009-F2X CBT018A3 S0009-M2 P0007A73X - B0011RX P001A48X Amirani R2 Torro R2 -
Data collected Date collected % Plant Stand: Jun 16 Maturity: Sep 7 Yield: Oct 25-26 Moisture: Oct 25-26 Agronomic info Previous year’s crop: Barley Silage Soil Type: Erickson Loam Clay Landscape: Rolling with trees to the east Seedbed preparation: Heavy harrowed twice
Table 3: Spring 2020 Soil Test
Available Added Type
N 61 lb/ac - -
P 47 ppm 10 lb/ac 11-52-0-0
K 393 ppm - -
Inoculant added with seed; P banded with seed Table 3: Pesticide Application
Crop stage Date Product Rate
Pre-emerge May 19 RoundUp
Heat
0.64 L/ac
28.0 g/ac
In-crop Jul 22 UAN 28%
Viper
0.8 L/ac
0.4 L/ac
Parkland Crop Diversification Foundation Annual Report 2020 116
Wheat Trials
Parkland Crop Diversification Foundation Annual Report 2020 117
Parkland Coop Wheat Variety Evaluation
Project duration: May 2020 – August 2020 Objectives: To evaluate spring wheat varieties for the Parkland Coop
Collaborators: Dean Spanner – Coordinator, University of Alberta Research Station
Klaus Strenzke – Research Technician, University of Alberta Research Station
Background The Parkland Cooperative wheat trial is conducted across the Prairies as a resource for wheat breeders to generate data in support of registration of new Canada Western Red Spring varieties. Additional samples taken to test for wheat midge were sent away at the end of July. Results These data were generated for the Parkland Coop; however, due to intellectual property issues pertaining to Plant Breeders’ Rights, results for individual lines are not provided in this report. Table 1 provides the entries in this test. For more information on the Coop trial, contact Klaus Strenzke, University of Alberta.
Materials and methods Experimental Design: Rectangular Lattice Entries: 30 varieties Seeding: May 11 Harvest: Sep 1 Table 1: Varieties included in trial at Roblin, 2020
AAC Brandon PT5003 PT660 PT4001 PT799
AC Carberry PT5005 PT661 PT4002 PT7000
Glenn PT793 PT795 PT5009 PT7001
Parata PT496 PT258 PT5010 PT7002
PT789 PT5007 PT499 PT5011 PT7003
PT495 PT5008 PT4000 PT5012 PT7004
Agronomic information Previous year’s crop: Barley Silage Soil Type: Erickson Loam Clay Landscape: Rolling with trees to the east Seedbed preparation: Heavy harrowed Data collected Date collected Maturity: Aug 25 Height: Aug 5 Lodging: Sep 1 Yield: Sep 1 Moisture: Sep 1
Parkland Crop Diversification Foundation Annual Report 2020 118
Table 2: 2020 Fertility Information
Available Added Type
N 70 lb/ac 119 lb/ac 46-0-0
P 41 ppm 15 lb/ac 11-56-0-0
K 545 ppm - -
Table 3: Pesticide Application
Crop stage Date Product Rate
Pre-emerge May 19 Heat 28.0 g/ac
Round-up 0.64 L/ac
In-crop Jun 22 PrestigeXC-A 0.17 L/ac
Desiccation Aug 25 RoundUp 0.64 L/ac
Heat 20.0 g/ac
Merge 0.3 L/ac
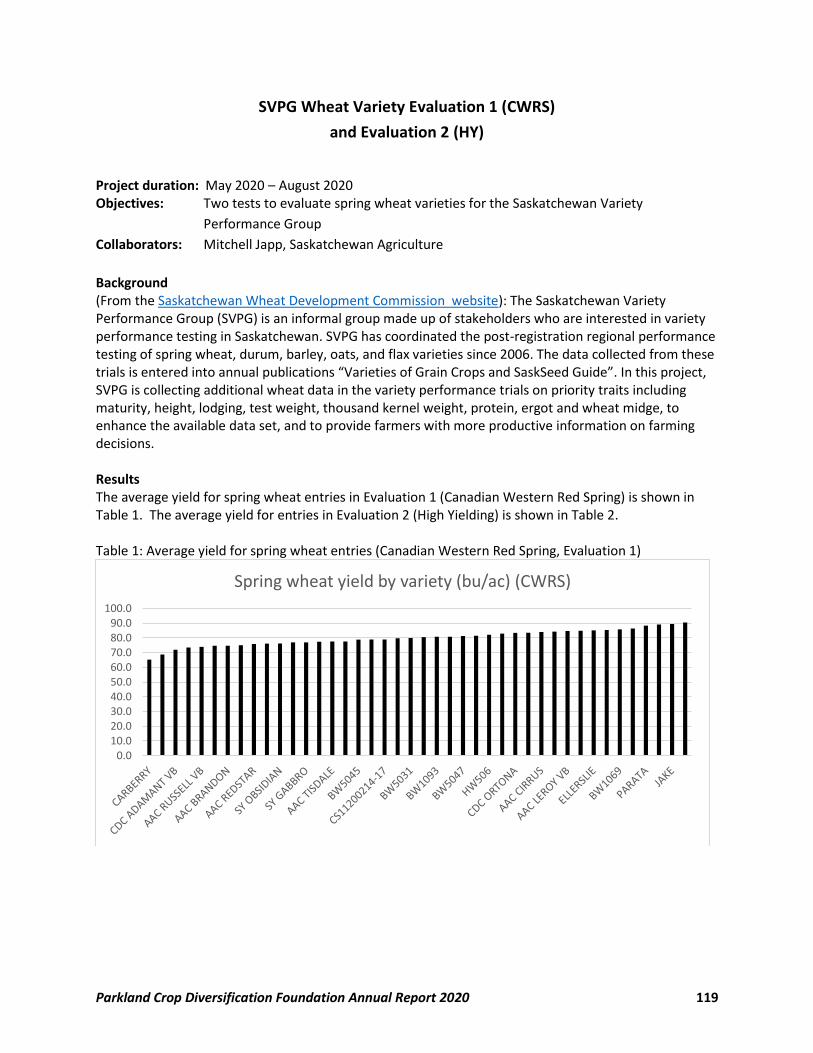
Parkland Crop Diversification Foundation Annual Report 2020 119
SVPG Wheat Variety Evaluation 1 (CWRS)
and Evaluation 2 (HY)
Project duration: May 2020 – August 2020 Objectives: Two tests to evaluate spring wheat varieties for the Saskatchewan Variety
Performance Group
Collaborators: Mitchell Japp, Saskatchewan Agriculture
Background (From the Saskatchewan Wheat Development Commission website): The Saskatchewan Variety Performance Group (SVPG) is an informal group made up of stakeholders who are interested in variety performance testing in Saskatchewan. SVPG has coordinated the post-registration regional performance testing of spring wheat, durum, barley, oats, and flax varieties since 2006. The data collected from these trials is entered into annual publications “Varieties of Grain Crops and SaskSeed Guide”. In this project, SVPG is collecting additional wheat data in the variety performance trials on priority traits including maturity, height, lodging, test weight, thousand kernel weight, protein, ergot and wheat midge, to enhance the available data set, and to provide farmers with more productive information on farming decisions. Results The average yield for spring wheat entries in Evaluation 1 (Canadian Western Red Spring) is shown in Table 1. The average yield for entries in Evaluation 2 (High Yielding) is shown in Table 2. Table 1: Average yield for spring wheat entries (Canadian Western Red Spring, Evaluation 1)
0.010.020.030.040.050.060.070.080.090.0
100.0
Spring wheat yield by variety (bu/ac) (CWRS)
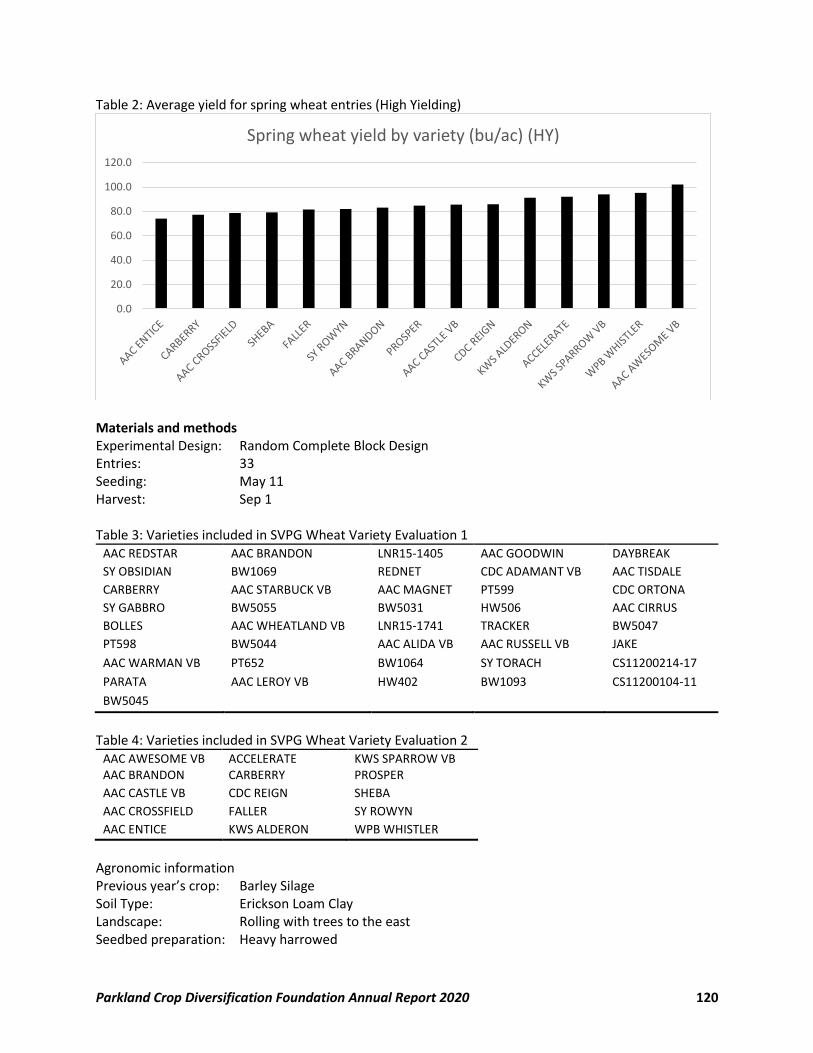
Parkland Crop Diversification Foundation Annual Report 2020 120
Table 2: Average yield for spring wheat entries (High Yielding)
Materials and methods Experimental Design: Random Complete Block Design Entries: 33 Seeding: May 11 Harvest: Sep 1 Table 3: Varieties included in SVPG Wheat Variety Evaluation 1
AAC REDSTAR AAC BRANDON LNR15-1405 AAC GOODWIN DAYBREAK
SY OBSIDIAN BW1069 REDNET CDC ADAMANT VB AAC TISDALE
CARBERRY AAC STARBUCK VB AAC MAGNET PT599 CDC ORTONA
SY GABBRO BW5055 BW5031 HW506 AAC CIRRUS
BOLLES AAC WHEATLAND VB LNR15-1741 TRACKER BW5047
PT598 BW5044 AAC ALIDA VB AAC RUSSELL VB JAKE
AAC WARMAN VB PT652 BW1064 SY TORACH CS11200214-17
PARATA AAC LEROY VB HW402 BW1093 CS11200104-11
BW5045
Table 4: Varieties included in SVPG Wheat Variety Evaluation 2
AAC AWESOME VB ACCELERATE KWS SPARROW VB AAC BRANDON CARBERRY PROSPER
AAC CASTLE VB CDC REIGN SHEBA
AAC CROSSFIELD FALLER SY ROWYN
AAC ENTICE KWS ALDERON WPB WHISTLER
Agronomic information Previous year’s crop: Barley Silage Soil Type: Erickson Loam Clay Landscape: Rolling with trees to the east Seedbed preparation: Heavy harrowed
0.0
20.0
40.0
60.0
80.0
100.0
120.0
Spring wheat yield by variety (bu/ac) (HY)
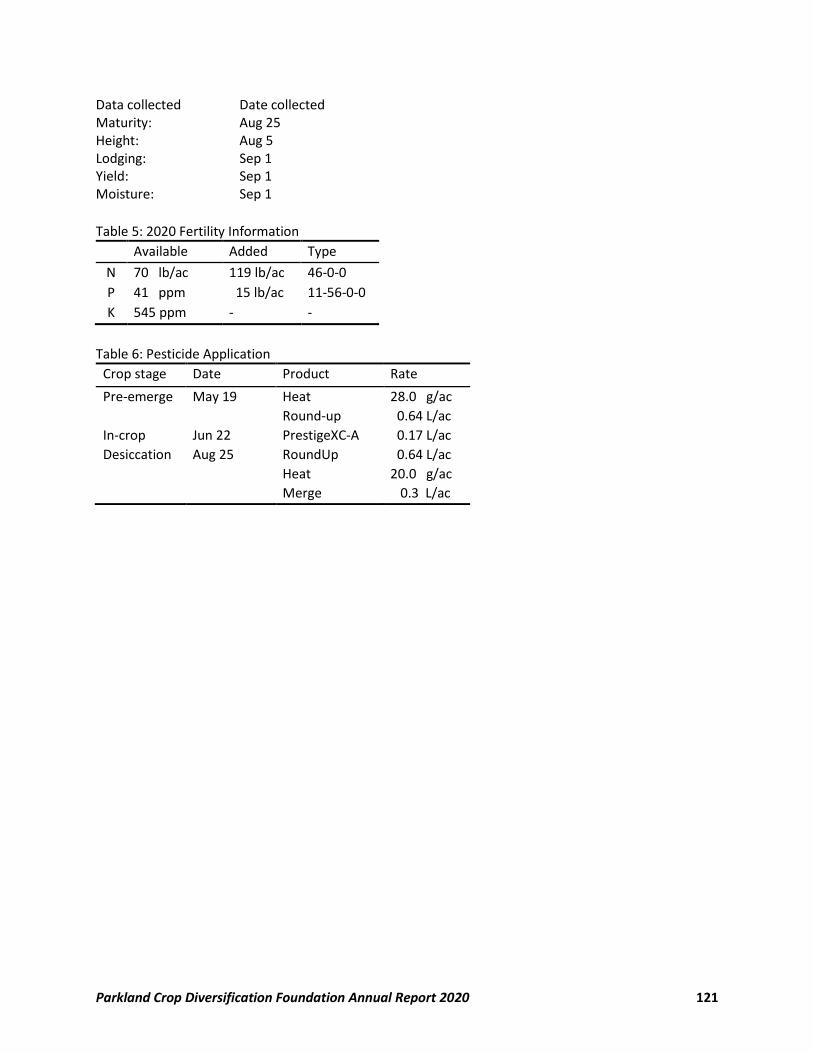
Parkland Crop Diversification Foundation Annual Report 2020 121
Data collected Date collected Maturity: Aug 25 Height: Aug 5 Lodging: Sep 1 Yield: Sep 1 Moisture: Sep 1
Table 5: 2020 Fertility Information
Available Added Type
N 70 lb/ac 119 lb/ac 46-0-0
P 41 ppm 15 lb/ac 11-56-0-0
K 545 ppm - -
Table 6: Pesticide Application
Crop stage Date Product Rate
Pre-emerge May 19 Heat 28.0 g/ac
Round-up 0.64 L/ac
In-crop Jun 22 PrestigeXC-A 0.17 L/ac
Desiccation Aug 25 RoundUp 0.64 L/ac
Heat 20.0 g/ac
Merge 0.3 L/ac
Parkland Crop Diversification Foundation Annual Report 2020 122
Ducks Unlimited Canada: Winter wheat fertility program to maximize yield potential
of new winter wheat varieties (Adapted from a report by Justice Zhanda, WADO)
Project duration: 2019-2020
Objectives: To compare historical/standard “Producer Practice [100% spring]” fertility program
to a balanced “High Yield Practice [Balanced]” as determined by Western Ag Soil
analysis and recommendations.
Collaborators: Elmer Kaskiw, Ducks Unlimited Canada, Western Ag Lab and Professional Agronomy
Background
Following decades of extensive work in winter wheat production in North America, many researchers
and producers have begun to implement best management practices to obtain higher grain yield and
improve profitability in the crop. Management practices presently being implemented to improve
winter wheat production include; increasing seeding rate, application of starter fertilizer by banding
during seeding, variety selection, pest control (Anderson, 2008) and split application, during planting in
fall and at tillering or stem elongation in spring (Schulz et al., 2015). Fertility management, in particular
nitrogen and phosphorus, remains the integral part of the overall management package aimed at
achieving higher yields in winter wheat (Halvorson et al. 1987). Recommended fertilizer management,
particularly nitrogen, differs widely in winter wheat production but the crop’s nitrogen demand is
correlated to yield potential and availability of moisture in dryland productions systems (Beres et al.,
2018). Compared to spring wheat, winter wheat presents more challenges in development as a result of
its higher nitrogen demand during the long vegetative phase, hence the reason why it requires 25 to
50% more N than spring wheat in the Prairies (Fowler et al., 1989). The ideal fertility management
package would help counteract escalating cost of production per unit area, which is the main goal that
producers aim to achieve. There is still a knowledge gap on the rates as well as timing of application of
nitrogen fertilizer, particularly in Western Canada, that would result in improved yield without
compromising the quality of grain and economic returns. Morris et al. (2018) suggested the
implementation of adaptive use of nitrogen to help augment and improve nitrogen application rate
decision making by farmers. Therefore, there is a great need to continue with research on the best
management practices that can be availed to producers to improve economic returns in winter wheat
production.
Materials and Methods
This study was established at four locations; Melita, Arborg, Carberry and Roblin in Manitoba in the fall
of 2019 (Table 2). In Melita, wheat was seeded onto wheat stubble to a depth of 0.5” on September 16
using a 6-row dual knife seed hawk air seeder. The soil was characterized as
Ryerson5Loam/Regent5Loam. Preemergence weed control was necessary to ensure a clean seedbed
and this was done using Roundup tank mixed with Aim at 0.75 L ac-1 and 0.015 L ac-1, respectively. Post
emergence weed control was done in spring by application of Achieve and Mextrol herbicides tank
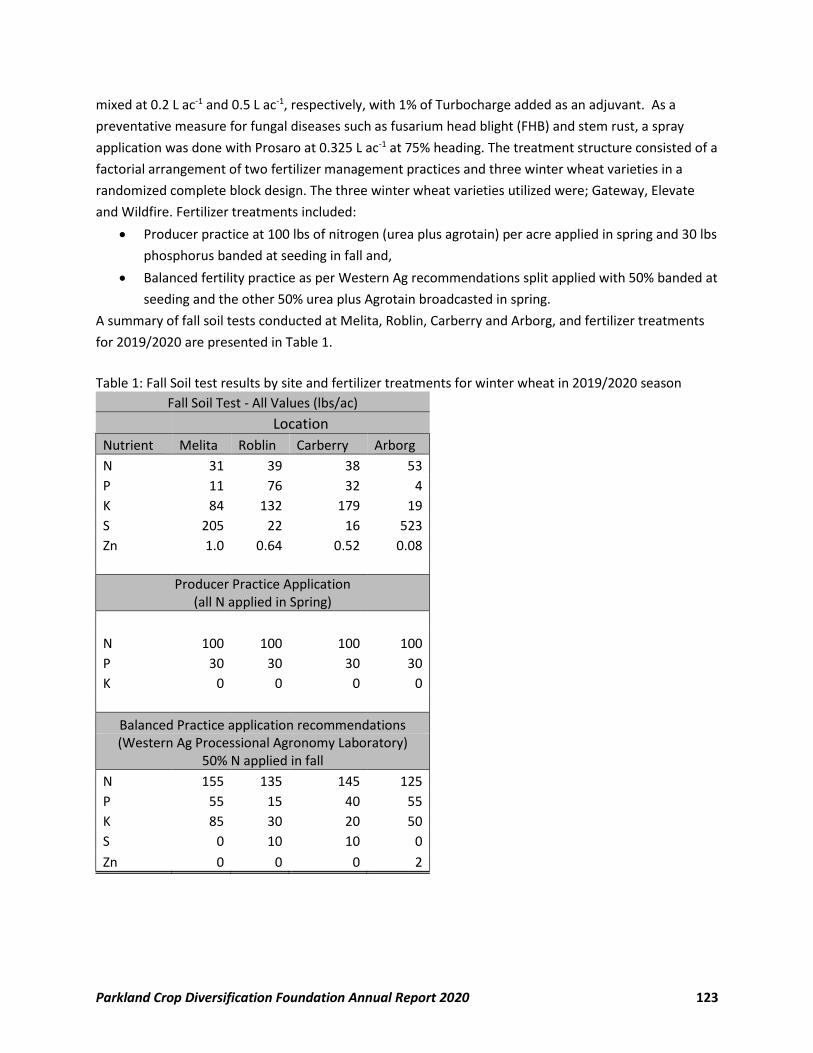
Parkland Crop Diversification Foundation Annual Report 2020 123
mixed at 0.2 L ac-1 and 0.5 L ac-1, respectively, with 1% of Turbocharge added as an adjuvant. As a
preventative measure for fungal diseases such as fusarium head blight (FHB) and stem rust, a spray
application was done with Prosaro at 0.325 L ac-1 at 75% heading. The treatment structure consisted of a
factorial arrangement of two fertilizer management practices and three winter wheat varieties in a
randomized complete block design. The three winter wheat varieties utilized were; Gateway, Elevate
and Wildfire. Fertilizer treatments included:
Producer practice at 100 lbs of nitrogen (urea plus agrotain) per acre applied in spring and 30 lbs
phosphorus banded at seeding in fall and,
Balanced fertility practice as per Western Ag recommendations split applied with 50% banded at
seeding and the other 50% urea plus Agrotain broadcasted in spring.
A summary of fall soil tests conducted at Melita, Roblin, Carberry and Arborg, and fertilizer treatments
for 2019/2020 are presented in Table 1.
Table 1: Fall Soil test results by site and fertilizer treatments for winter wheat in 2019/2020 season
Fall Soil Test - All Values (lbs/ac)
Location
Nutrient Melita Roblin Carberry Arborg
N 31 39 38 53
P 11 76 32 4
K 84 132 179 19
S 205 22 16 523
Zn 1.0 0.64 0.52 0.08
Producer Practice Application (all N applied in Spring)
N 100 100 100 100
P 30 30 30 30
K 0 0 0 0
Balanced Practice application recommendations (Western Ag Processional Agronomy Laboratory)
50% N applied in fall
N 155 135 145 125
P 55 15 40 55
K 85 30 20 50
S 0 10 10 0
Zn 0 0 0 2
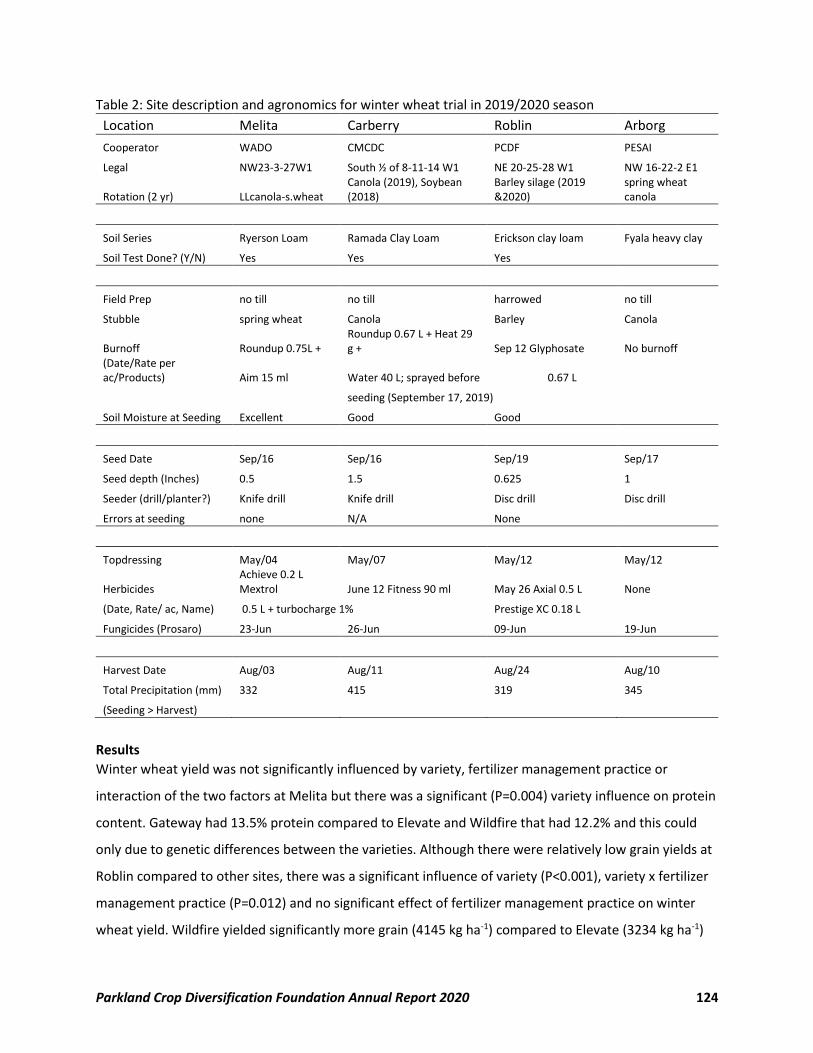
Parkland Crop Diversification Foundation Annual Report 2020 124
Table 2: Site description and agronomics for winter wheat trial in 2019/2020 season
Location Melita Carberry Roblin Arborg
Cooperator WADO CMCDC PCDF PESAI
Legal NW23-3-27W1 South ½ of 8-11-14 W1 NE 20-25-28 W1 NW 16-22-2 E1
Rotation (2 yr) LLcanola-s.wheat Canola (2019), Soybean (2018)
Barley silage (2019 &2020)
spring wheat canola
Soil Series Ryerson Loam Ramada Clay Loam Erickson clay loam Fyala heavy clay
Soil Test Done? (Y/N) Yes Yes Yes
Field Prep no till no till harrowed no till
Stubble spring wheat Canola Barley Canola
Burnoff Roundup 0.75L + Roundup 0.67 L + Heat 29 g + Sep 12 Glyphosate No burnoff
(Date/Rate per ac/Products) Aim 15 ml Water 40 L; sprayed before 0.67 L
seeding (September 17, 2019)
Soil Moisture at Seeding Excellent Good Good
Seed Date Sep/16 Sep/16 Sep/19 Sep/17
Seed depth (Inches) 0.5 1.5 0.625 1
Seeder (drill/planter?) Knife drill Knife drill Disc drill Disc drill
Errors at seeding none N/A None
Topdressing May/04 May/07 May/12 May/12
Herbicides Achieve 0.2 L Mextrol June 12 Fitness 90 ml May 26 Axial 0.5 L None
(Date, Rate/ ac, Name) 0.5 L + turbocharge 1% Prestige XC 0.18 L
Fungicides (Prosaro) 23-Jun 26-Jun 09-Jun 19-Jun
Harvest Date Aug/03 Aug/11 Aug/24 Aug/10
Total Precipitation (mm) 332 415 319 345
(Seeding > Harvest)
Results
Winter wheat yield was not significantly influenced by variety, fertilizer management practice or
interaction of the two factors at Melita but there was a significant (P=0.004) variety influence on protein
content. Gateway had 13.5% protein compared to Elevate and Wildfire that had 12.2% and this could
only due to genetic differences between the varieties. Although there were relatively low grain yields at
Roblin compared to other sites, there was a significant influence of variety (P<0.001), variety x fertilizer
management practice (P=0.012) and no significant effect of fertilizer management practice on winter
wheat yield. Wildfire yielded significantly more grain (4145 kg ha-1) compared to Elevate (3234 kg ha-1)
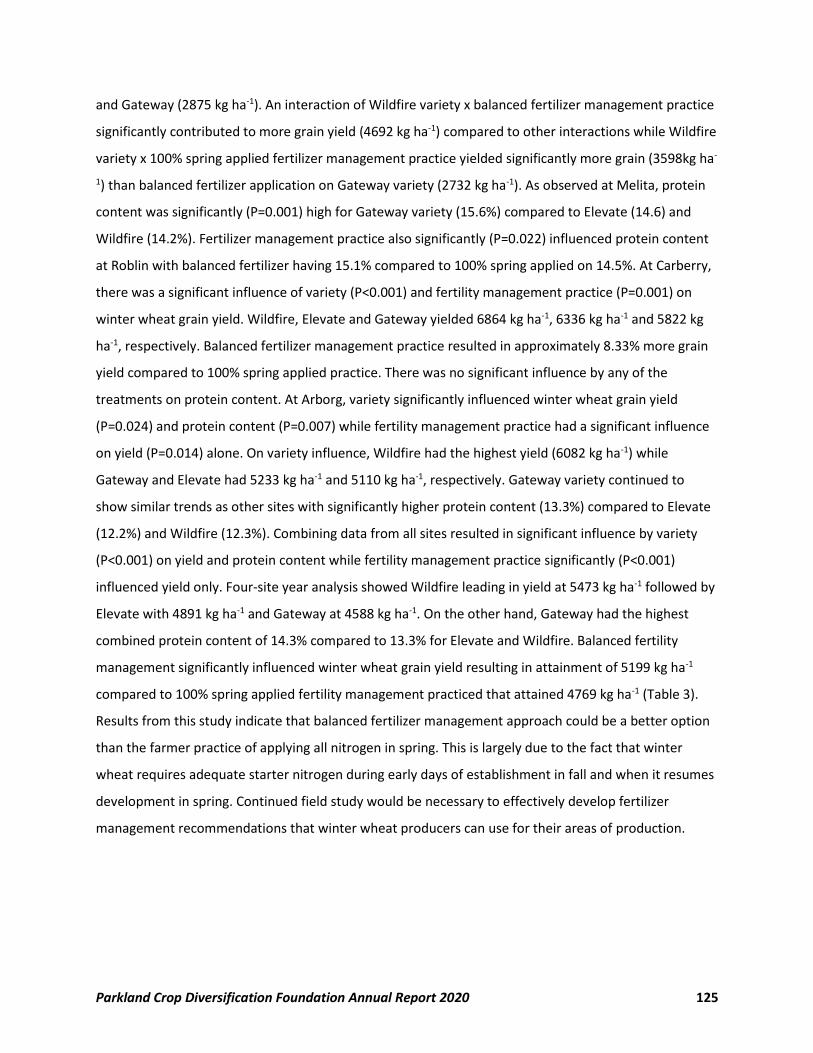
Parkland Crop Diversification Foundation Annual Report 2020 125
and Gateway (2875 kg ha-1). An interaction of Wildfire variety x balanced fertilizer management practice
significantly contributed to more grain yield (4692 kg ha-1) compared to other interactions while Wildfire
variety x 100% spring applied fertilizer management practice yielded significantly more grain (3598kg ha-
1) than balanced fertilizer application on Gateway variety (2732 kg ha-1). As observed at Melita, protein
content was significantly (P=0.001) high for Gateway variety (15.6%) compared to Elevate (14.6) and
Wildfire (14.2%). Fertilizer management practice also significantly (P=0.022) influenced protein content
at Roblin with balanced fertilizer having 15.1% compared to 100% spring applied on 14.5%. At Carberry,
there was a significant influence of variety (P<0.001) and fertility management practice (P=0.001) on
winter wheat grain yield. Wildfire, Elevate and Gateway yielded 6864 kg ha-1, 6336 kg ha-1 and 5822 kg
ha-1, respectively. Balanced fertilizer management practice resulted in approximately 8.33% more grain
yield compared to 100% spring applied practice. There was no significant influence by any of the
treatments on protein content. At Arborg, variety significantly influenced winter wheat grain yield
(P=0.024) and protein content (P=0.007) while fertility management practice had a significant influence
on yield (P=0.014) alone. On variety influence, Wildfire had the highest yield (6082 kg ha-1) while
Gateway and Elevate had 5233 kg ha-1 and 5110 kg ha-1, respectively. Gateway variety continued to
show similar trends as other sites with significantly higher protein content (13.3%) compared to Elevate
(12.2%) and Wildfire (12.3%). Combining data from all sites resulted in significant influence by variety
(P<0.001) on yield and protein content while fertility management practice significantly (P<0.001)
influenced yield only. Four-site year analysis showed Wildfire leading in yield at 5473 kg ha-1 followed by
Elevate with 4891 kg ha-1 and Gateway at 4588 kg ha-1. On the other hand, Gateway had the highest
combined protein content of 14.3% compared to 13.3% for Elevate and Wildfire. Balanced fertility
management significantly influenced winter wheat grain yield resulting in attainment of 5199 kg ha-1
compared to 100% spring applied fertility management practiced that attained 4769 kg ha-1 (Table 3).
Results from this study indicate that balanced fertilizer management approach could be a better option
than the farmer practice of applying all nitrogen in spring. This is largely due to the fact that winter
wheat requires adequate starter nitrogen during early days of establishment in fall and when it resumes
development in spring. Continued field study would be necessary to effectively develop fertilizer
management recommendations that winter wheat producers can use for their areas of production.
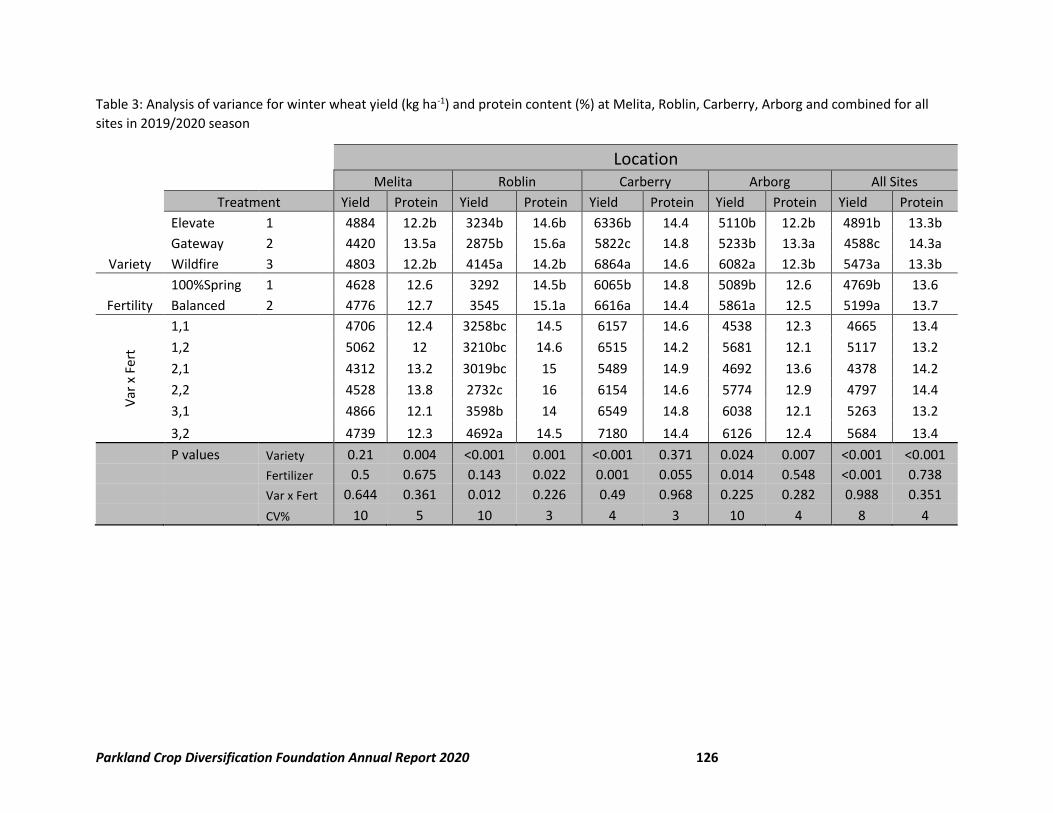
Parkland Crop Diversification Foundation Annual Report 2020 126
Table 3: Analysis of variance for winter wheat yield (kg ha-1) and protein content (%) at Melita, Roblin, Carberry, Arborg and combined for all
sites in 2019/2020 season
Location
Melita Roblin Carberry Arborg All Sites
Treatment Yield Protein Yield Protein Yield Protein Yield Protein Yield Protein
Variety
Elevate 1 4884 12.2b 3234b 14.6b 6336b 14.4 5110b 12.2b 4891b 13.3b
Gateway 2 4420 13.5a 2875b 15.6a 5822c 14.8 5233b 13.3a 4588c 14.3a
Wildfire 3 4803 12.2b 4145a 14.2b 6864a 14.6 6082a 12.3b 5473a 13.3b
Fertility
100%Spring 1 4628 12.6 3292 14.5b 6065b 14.8 5089b 12.6 4769b 13.6
Balanced 2 4776 12.7 3545 15.1a 6616a 14.4 5861a 12.5 5199a 13.7
Var
x F
ert
1,1 4706 12.4 3258bc 14.5 6157 14.6 4538 12.3 4665 13.4
1,2 5062 12 3210bc 14.6 6515 14.2 5681 12.1 5117 13.2
2,1 4312 13.2 3019bc 15 5489 14.9 4692 13.6 4378 14.2
2,2 4528 13.8 2732c 16 6154 14.6 5774 12.9 4797 14.4
3,1 4866 12.1 3598b 14 6549 14.8 6038 12.1 5263 13.2
3,2 4739 12.3 4692a 14.5 7180 14.4 6126 12.4 5684 13.4
P values Variety 0.21 0.004 <0.001 0.001 <0.001 0.371 0.024 0.007 <0.001 <0.001
Fertilizer 0.5 0.675 0.143 0.022 0.001 0.055 0.014 0.548 <0.001 0.738
Var x Fert 0.644 0.361 0.012 0.226 0.49 0.968 0.225 0.282 0.988 0.351
CV% 10 5 10 3 4 3 10 4 8 4
Parkland Crop Diversification Foundation Annual Report 2020 127
References
Anderson, R. L. 2008. Growth and Yield of Winter Wheat as Affected by the Preceding Crop and Crop
Management. Agronomy Journal 100 (4) 977-980.
Beres, B. L., Graf, R. J., Irvine, R. B., O’Donovan, J. T., Harker, K.N., Johnson, E. N., Brandt, S., Hao, X.,
Thomas, B. W., Turkington, T. K., and Stevenson, F. C. 2018. Enhanced Nitrogen Management Strategies
for Winter Wheat Production in the Canadian Prairies. Canadian Journal of Plant Science 98:3.
https://doi.org/10.1139/cjps-2017-0319
Fowler, D. B., Brydon, J., and Baker, R. J. 1989. Nitrogen fertilization of no-till winter wheat and rye. I.
Yield and agronomic responses. Agron. J. 81: 66–72.
Halvorson, A.D., Alley, M. M., and Murphy, L. S. 1987. Nutrient Requirements and Fertilizer Use: In
Wheat and Wheat Improvement – Agronomy Monograph (13) 2nd Edition. Madison, WI 53711, USA.
Morris, T.F., Murrell, T. S., Beegle, D. B., Camberato, J., Ferguson, R., Ketterings, Q. 2018. Strengths and
limitations of nitrogen recommendations, tests, and models for corn. Agron. J. 110:1–37.
doi:10.2134/agronj2017.02.0112
Schulz, R., Makary, T., Hubert, S., Hartung, K., Gruber, S., Donath, S., Dohler, J., Weiss, K., Ehrhart, E.,
Claupein, W., Piepho, H. P., Pekrun, C., and Müller, T. 2015. Is it necessary to split nitrogen fertilization
for winter wheat? On-farm research on Luvisols in South-West Germany. J. Agric. Sci. 153(4): 575–587.
Parkland Crop Diversification Foundation Annual Report 2020 128
Horticulture Trials
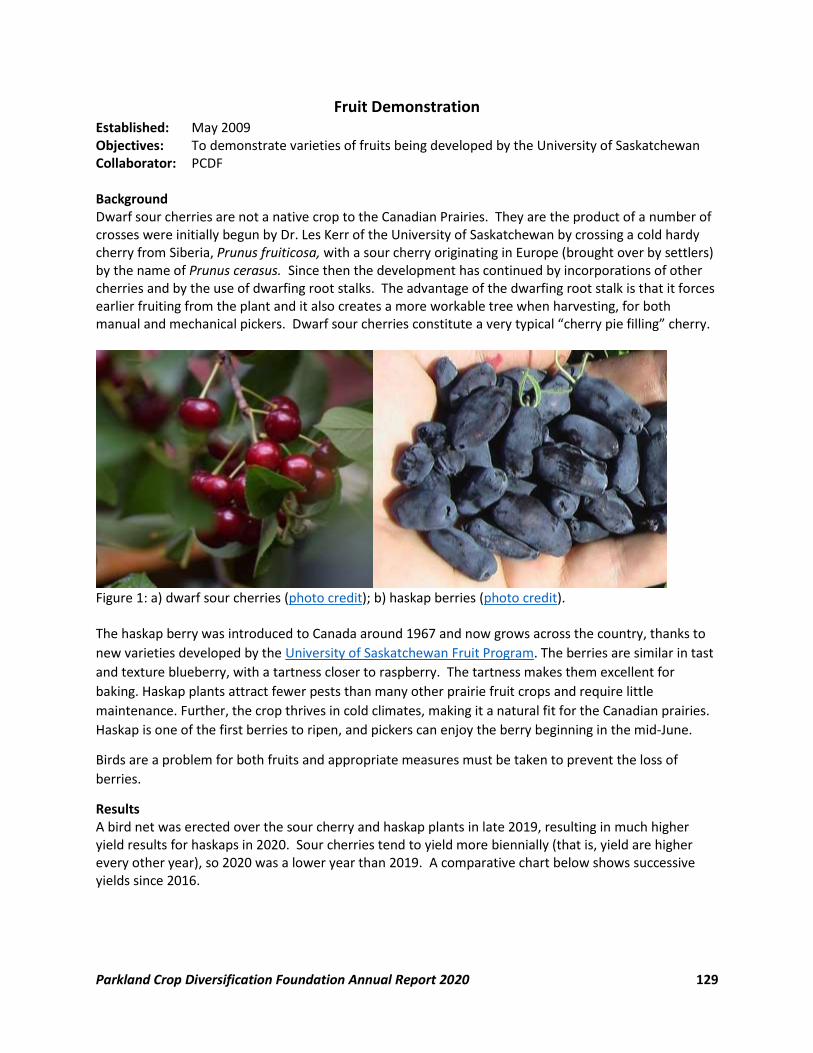
Parkland Crop Diversification Foundation Annual Report 2020 129
Fruit Demonstration Established: May 2009 Objectives: To demonstrate varieties of fruits being developed by the University of Saskatchewan Collaborator: PCDF Background Dwarf sour cherries are not a native crop to the Canadian Prairies. They are the product of a number of crosses were initially begun by Dr. Les Kerr of the University of Saskatchewan by crossing a cold hardy cherry from Siberia, Prunus fruiticosa, with a sour cherry originating in Europe (brought over by settlers) by the name of Prunus cerasus. Since then the development has continued by incorporations of other cherries and by the use of dwarfing root stalks. The advantage of the dwarfing root stalk is that it forces earlier fruiting from the plant and it also creates a more workable tree when harvesting, for both manual and mechanical pickers. Dwarf sour cherries constitute a very typical “cherry pie filling” cherry.
Figure 1: a) dwarf sour cherries (photo credit); b) haskap berries (photo credit).
The haskap berry was introduced to Canada around 1967 and now grows across the country, thanks to
new varieties developed by the University of Saskatchewan Fruit Program. The berries are similar in tast
and texture blueberry, with a tartness closer to raspberry. The tartness makes them excellent for
baking. Haskap plants attract fewer pests than many other prairie fruit crops and require little
maintenance. Further, the crop thrives in cold climates, making it a natural fit for the Canadian prairies.
Haskap is one of the first berries to ripen, and pickers can enjoy the berry beginning in the mid-June.
Birds are a problem for both fruits and appropriate measures must be taken to prevent the loss of
berries.
Results A bird net was erected over the sour cherry and haskap plants in late 2019, resulting in much higher yield results for haskaps in 2020. Sour cherries tend to yield more biennially (that is, yield are higher every other year), so 2020 was a lower year than 2019. A comparative chart below shows successive yields since 2016.
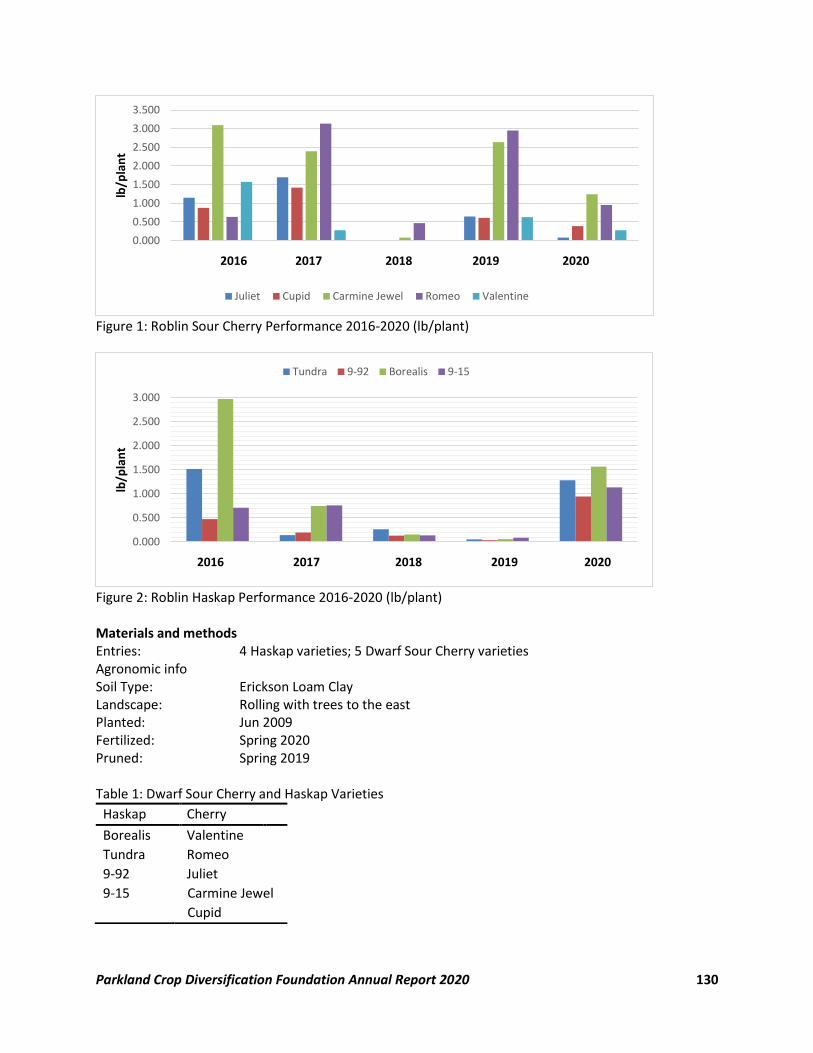
Parkland Crop Diversification Foundation Annual Report 2020 130
Figure 1: Roblin Sour Cherry Performance 2016-2020 (lb/plant)
Figure 2: Roblin Haskap Performance 2016-2020 (lb/plant) Materials and methods Entries: 4 Haskap varieties; 5 Dwarf Sour Cherry varieties Agronomic info Soil Type: Erickson Loam Clay Landscape: Rolling with trees to the east Planted: Jun 2009 Fertilized: Spring 2020 Pruned: Spring 2019 Table 1: Dwarf Sour Cherry and Haskap Varieties
0.000
0.500
1.000
1.500
2.000
2.500
3.000
3.500lb
/pla
nt
2016 2017 2018 2019 2020
Juliet Cupid Carmine Jewel Romeo Valentine
0.000
0.500
1.000
1.500
2.000
2.500
3.000
lb/p
lan
t
2016 2017 2018 2019 2020
Tundra 9-92 Borealis 9-15
Haskap Cherry
Borealis Valentine
Tundra Romeo
9-92 Juliet
9-15 Carmine Jewel
Cupid
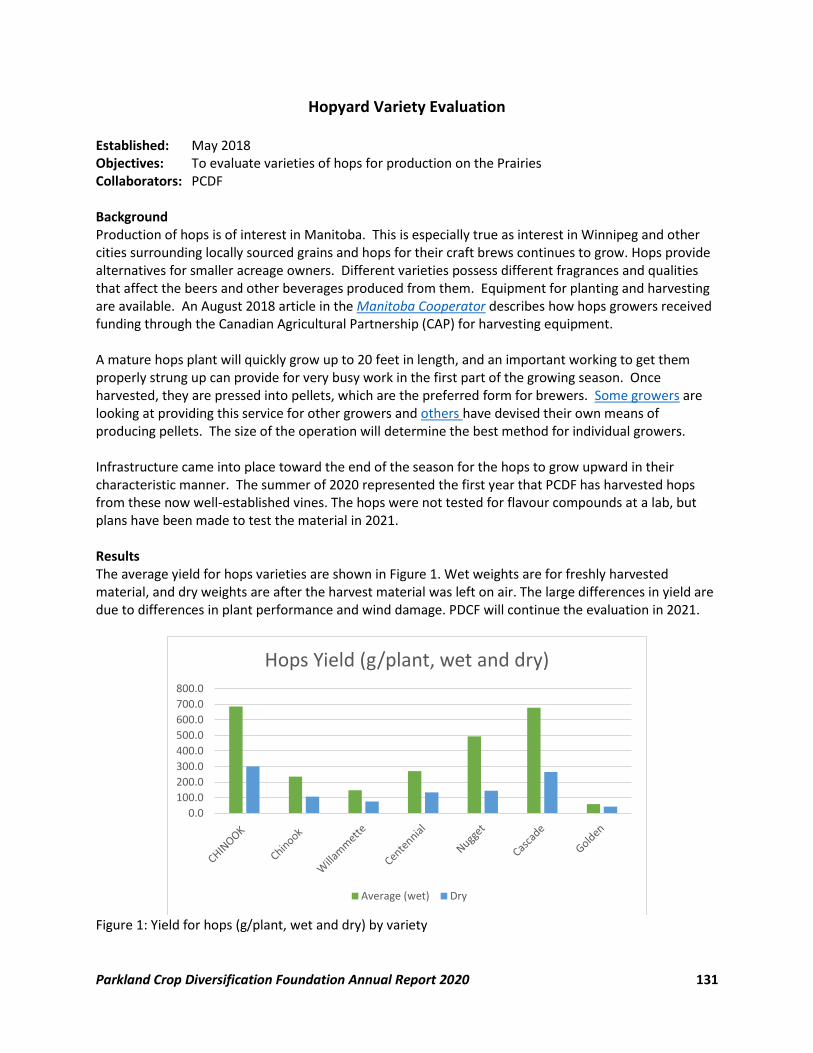
Parkland Crop Diversification Foundation Annual Report 2020 131
Hopyard Variety Evaluation Established: May 2018 Objectives: To evaluate varieties of hops for production on the Prairies Collaborators: PCDF Background Production of hops is of interest in Manitoba. This is especially true as interest in Winnipeg and other cities surrounding locally sourced grains and hops for their craft brews continues to grow. Hops provide alternatives for smaller acreage owners. Different varieties possess different fragrances and qualities that affect the beers and other beverages produced from them. Equipment for planting and harvesting are available. An August 2018 article in the Manitoba Cooperator describes how hops growers received funding through the Canadian Agricultural Partnership (CAP) for harvesting equipment. A mature hops plant will quickly grow up to 20 feet in length, and an important working to get them properly strung up can provide for very busy work in the first part of the growing season. Once harvested, they are pressed into pellets, which are the preferred form for brewers. Some growers are looking at providing this service for other growers and others have devised their own means of producing pellets. The size of the operation will determine the best method for individual growers. Infrastructure came into place toward the end of the season for the hops to grow upward in their characteristic manner. The summer of 2020 represented the first year that PCDF has harvested hops from these now well-established vines. The hops were not tested for flavour compounds at a lab, but plans have been made to test the material in 2021.
Results The average yield for hops varieties are shown in Figure 1. Wet weights are for freshly harvested material, and dry weights are after the harvest material was left on air. The large differences in yield are due to differences in plant performance and wind damage. PDCF will continue the evaluation in 2021.
Figure 1: Yield for hops (g/plant, wet and dry) by variety
0.0
100.0
200.0
300.0
400.0
500.0
600.0
700.0
800.0
Hops Yield (g/plant, wet and dry)
Average (wet) Dry
Parkland Crop Diversification Foundation Annual Report 2020 132
Materials and methods Entries: 6 varieties in 3 repetitions Varieties: See Table 1 Table 1: Hops Varieties at Roblin
Agronomic info Soil Type: Erickson Loam Clay Landscape: Rolling with trees to the east Planted: Jun 2018 Added Fertility: Composted sheep manure (2018, at planting) 100-20-10-15 lb/ac N-P-K-S added May 5, 2020
Chinook Willammette
Centennial Nugget
Golden Cascade
Parkland Crop Diversification Foundation Annual Report 2020 133