Embed Size (px)
Citation preview

ANNUAL
TELECOMMUNICATIONS
MONITORING REPORT
2020 Key facts
Date: 16 March 2021 – version 2

2
Annual Telecommunications Monitoring Report 2020
Contents
New Zealand telecommunications snapshot statistics 4
Introduction 5
Purpose of this report 5
Background and data sources 5
Key developments in 2020 6
Fixed-line connections 7
Copper connections drop 24% 7
Households continue to drop landlines 8
Retail revenues 9
Retail telecommunications revenue down 9
Mobile roaming revenue falls following COVID-19 related travel restrictions 10
Growth in data usage 11
COVID-19 accelerates growth in fixed broadband data usage 11
Mobile data consumption continues to grow 13
OECD price benchmarking 14
Price of high-speed fixed broadband plans drops 14
Entry level mobile plan prices steady 16
Household expenditure on telecommunications 17
Average monthly expenditure on telecommunications increases 17
Telecommunications expenditure as a proportion of total expenditure stable 17
Consumers concerned about the costs of telecommunication services 18
Broadband speeds 19
Average broadband download speeds exceed OECD average 19
Local performance 19
Impact of COVID-19 lockdown on NZ internet performance 20
Fibre Max investigation 21
Industry investment 23
Fibre investment drops while mobile investment rises 23
Market shares 25
Fixed broadband market 25
Mobile market 26
Market monitoring updates 27
Ongoing section 9A studies 27
Upcoming section 9A work 27
List of defined terms 28

3
Annual Telecommunications Monitoring Report 2020

4
Annual Telecommunications Monitoring Report 2020
New Zealand telecommunications snapshot statistics
2010 2011 2012 2013 2014 2015 2016 2017 2018 2019 /11 /12 /13 /14 /15 /16 /17 /18 /19 /20
Total industry metrics
Total telecommunications
retail revenue ($bn) 5.03 5.25 5.21 5.17 5.11 5.28 5.37 5.42 5.32 5.12
Total telecommunications
investment ($bn) 1.24 1.27 1.58 1.69 1.77 1.59 1.58 1.66 1.71 1.61
Fixed line metrics
Fixed lines (mil) 1.88 1.88 1.85 1.85 1.86 1.87 1.79 1.76 1.85 1.79
Total fixed broadband
connections (mil) 1.18 1.27 1.34 1.41 1.45 1.50 1.58 1.65 1.70 1.76
Fixed line broadband
connections per 100
population
27.1 29.0 30.4 31.6 32.0 32.5 32.9 33.7 34.4 34.6
Fixed monthly data use per
broadband connection (GB) 10 18 26 32 48 69 117 172 207 284
Fixed wireless (000's) 39 31 26 24 20 27 122 165 191 221
Copper broadband lines
(000's)a 1076 1169 1237 1273 1270 1171 976 806 620 487
UFB (government sponsored
fibre) lines (000's)b - 1 10 39 106 241 413 605 821 1004
Chargeable fixed voice call
minutes (bn) 6.12 5.71 5.47 5.13 4.66 4.34 3.44 3.10 2.72 2.44
Total fixed line retail revenues
($bn) 2.89 2.86 2.77 2.68 2.58 2.60 2.62 2.58 2.49 2.39
Mobile metrics
Mobile connections (mil)c 5.2 5.4 5.3 5.6 5.8 6.1 6.4 6.4 6.0 6.2
Active mobile connections per
100 population 119 122 119 124 127 129 134 131 122 122
Share mobile pre-paid (%) 65.7 64.9 63.3 63.6 62.3 60.7 60.3 58.1 52.7 51.8
Average monthly mobile data
usage (GB) 0.10 0.13 0.21 0.32 0.47 0.72 1.25 2.04 2.75 3.29
Mobile voice call minutes (bn) 4.40 4.42 4.77 5.30 6.63 7.81 8.77 9.34 9.41 10.1
SMS messages sent (bn) 13.6 13.9 13.0 12.0 12.1 11.3 9.2 8.8 8.1 7.3
Total mobile retail revenues
($bn) 2.14 2.38 2.44 2.49 2.54 2.68 2.75 2.83 2.83 2.74
a Data from Chorus b Data from Crown Infrastructure Partners (CIP) c Prepay connections for all years are counted as those active in the prior 6 months.

5
Annual Telecommunications Monitoring Report 2020
Introduction
Purpose of this report
This is the Commerce Commission’s (Commission) 14th annual telecommunications market
monitoring report. This report presents key industry metrics and longer-term
telecommunications historical trends in New Zealand for 2020.
This report is released under section 9A of the Telecommunications Act 2001 (the Act).
Section 9A requires us to monitor competition in, and the performance and development of,
telecommunications markets. This monitoring report is additional to our monitoring
associated with specific determinations and information disclosure.
Background and data sources
Since 2007, we have collected data from various sources to monitor and understand trends
in New Zealand’s telecommunications markets, and to inform the industry and the public
about our findings.1
Each year we send a voluntary questionnaire to the industry requesting information for the
financial year ending in June. The data collected in response to our 2020 questionnaire is
referred to as the 2020 results in this report.2
Aggregated results from our annual industry questionnaire are published alongside this
report and are available on our website.3,4 Revenues and prices are expressed as nominal
figures (not adjusted for inflation between years) unless otherwise indicated. Connection
numbers, unless otherwise indicated, refer to both residential and business connections.
Where more recent industry data is available and used, the different time period is noted.
We thank all the respondents who submitted data and look forward to their continued
cooperation. We welcome any comments or feedback on the questionnaire and this report.
1 Telecommunications Act 2001, section 9A. 2 The data from the industry questionnaire is for the 12 months to 30 June 2020 when it is a measure of
volume like minutes. Where the data is a snapshot in time such as subscriber numbers, it is the data as at
30 June 2020. 3 The data used in our report is sometimes revised by the respondents or the Commission when it appears
inaccurate, an error has been made, or it was an estimate. Consequently, some prior year figures used in
previous reports may have been revised. 4 https://comcom.govt.nz/regulated-industries/telecommunications/monitoring-the-telecommunications-
market/annual-telecommunications-market-monitoring-report

6
Annual Telecommunications Monitoring Report 2020
Key developments in 2020 COVID-19 accelerates growth in fixed broadband data usage
COVID-19 lockdowns in 2020 changed the way Kiwis worked, learned and played. This led to
marked growth in fixed broadband usage. Average fixed broadband usage per month
increased by 77GB this year to 284GB. This represents a growth rate of 37% compared to
2019 when the growth rate was 15%.
Mobile roaming revenue falls following travel restrictions
Border closures restricting travel led to total mobile roaming revenue dropping 15% to
$96.6 million in the year to 30 June 2020. Revenue from domestic customers roaming
overseas fell by 20% while revenue from subscribers of overseas networks roaming in New
Zealand increased 2% on 2019.
Popularity of uncapped mobile plans rises
In 2020, 14% of residential on-account subscribers purchased uncapped ‘endless’ or
‘unlimited’5 mobile bundles, up from 7% in 2019. Similarly, 8% of business on-account
subscribers purchased uncapped mobile bundles in 2020, up from 2% in 2019.
Copper connections drop 24%
In the year to 30 September 2020, total copper broadband connections dropped 24% to
441,000. This drop occurred across all variants, including higher speed VDSL. This continues
the trend seen in 2019 when copper broadband connections dropped 23%.
Households continue to drop landlines
Households continue to move away from landlines for calling with residential landline
connections down 12% on last year. Over half of household fixed line connections now have
no voice service (naked broadband).
5 These uncapped data plans are not truly endless or unlimited as they are subject to fair-use terms and
MNOs significantly reduce customers’ speeds after a certain amount of data has been consumed.

7
Annual Telecommunications Monitoring Report 2020
Fixed-line connections Copper connections drop 24%
Figure 1: Fixed-line broadband connections by technology
Source: Chorus, CIP, annual telecommunications questionnaire
In the year to 30 September 2020, total copper broadband connections dropped 24% to
441,000, split between 220,000 ADSL connections, 207,000 VDSL connections, and 14,000
UCLL connections. As shown in Figure 1, this continues an ongoing trend of copper
broadband connections dropping while fibre and fixed wireless broadband connections rise.
From August 2021, Chorus will be able to stop supplying copper services in areas where
fibre is available, provided that the consumer protections in the Commission’s Copper
Withdrawal Code are met.6
As at 30 September 2020, around 1.69 million households and businesses were able to
connect to the Ultra-Fast Broadband (UFB) fibre network with 1.05 million of them having
already moved to fibre.7
6 The Commission published the final Copper Withdrawal Code in December 2020. The Code and Reasons
Paper can be found at https://comcom.govt.nz/regulated-industries/telecommunications/regulated-
services/consumer-protections-for-copper-withdrawal/copper-withdrawal-code 7 Crown Infrastructure Partners “Quarterly Connectivity Update – Q3: to 30 September 2020”
0
100
200
300
400
500
600
700
800
900
1,000
1,100
1,200
1,300
Co
nn
ect
ion
s (0
00
's)
UCLL Cable Fixed wireless VDSL
ADSL Fibre All Copper

8
Annual Telecommunications Monitoring Report 2020
The UFB2 build is ongoing and at the end of 2022, over 1.8 million households and
businesses, or 87% of New Zealanders, should have the ability to connect to fibre.
Fixed wireless connections have increased to 221,000 up 16% from last year. As at 30 June
2020, New Zealand ranked third highest out of the OECD countries for fixed wireless
broadband connections with 4.5 subscriptions per 100 of population, behind the Czech
Republic at 14.9 and the Slovak Republic at 7.9.8
Households continue to drop landlines
Consumers are moving away from traditional landline services for calling. Landline
connections (including broadband-voice bundles) have continued to decline in 2020, down
12% on last year.
As shown in Figure 2 below, over half of household fixed-line connections now have no
voice service (naked broadband). This situation indicates more and more households now
opting to not have a home phone.
Figure 2: Residential fixed-lines by connection type
Approximately a third of those households that still have a home phone are using a
traditional copper phone line, with the other two-thirds of residential landlines now on
newer technologies like fibre and fixed wireless.
In November 2020, the Commission published the 111 Contact Code. The Code supports
consumers who can no longer call 111 in a power cut because they have moved to landline
technologies like fibre and fixed wireless. These technologies need a power supply in the
home to work, meaning they will not work in a power cut, without an independent power
source.
8 https://www.oecd.org/sti/broadband/broadband-statistics/
-
200
400
600
800
1,000
1,200
1,400
1,600
1,800
Co
nn
ect
ion
s (0
00
's)
Voice only Broadband and voice bundle
Naked broadband Total residential fixed lines

9
Annual Telecommunications Monitoring Report 2020
Under the Code, telecommunications service providers must tell new customers, and
remind existing customers at least once a year, that their home phone may not work in a
power cut. Providers must also tell their customers how they can protect themselves and
where to go for further support.9
Retail revenues Retail telecommunications revenue down
Figure 3: Telecommunications retail revenues by service
Figure 3 shows that retail telecommunications revenue is down from $5.32 billion in 2019.
Mobile revenue was down 3% to $2.74 billion in 2020. This fall in revenue, coupled with the
decrease in fixed network revenue of 4% to $2.39 billion, resulted in total retail
telecommunications revenue decreasing (by 4%) in 2020 to $5.12 billion.
9 The 111 Contact Code and Reasons Paper can be found at https://comcom.govt.nz/regulated-
industries/telecommunications/projects/commission-111-contact-code
0
1
2
3
4
5
6
Re
tail
reve
nu
es
(bill
ion
s $
)
Total fixed network Total mobile Total telecommunications

10
Annual Telecommunications Monitoring Report 2020
Mobile roaming revenue falls following COVID-19 related travel restrictions
Figure 4: Mobile roaming revenue by type
As shown in Figure 4 above, total mobile roaming revenue in the year to 30 June 2020 fell
15% down to $96.6 million. Border closures associated with COVID-19 resulted in revenue
from domestic customers roaming overseas dropping by $17.9m compared to the prior
year. However, revenue from subscribers of overseas networks roaming in New Zealand
increased slightly (2%) to $23.7 million in the year to 30 June 2020.
0
20
40
60
80
100
120
140
160
Ro
am
ing
re
ven
ue
s (m
illio
ns
$)
Domestic customers roaming overseas Subscribers of overseas networks roaming in NZ
Total roaming revenue

11
Annual Telecommunications Monitoring Report 2020
Growth in data usage COVID-19 accelerates growth in fixed broadband data usage
Figure 5: Average fixed-line broadband data consumption
While consumption of fixed broadband has grown year-on-year, COVID-19 lockdowns and
the associated changes in the way Kiwis worked, learned and played further pushed up fixed
broadband data usage in 2020. Our questionnaire responses indicated that average fixed
broadband usage per month increased by 77GB this year to 284GB, as shown in Figure 5
above.10 This usage represents a growth rate of 37% compared to 2019 when the growth
rate was 15%.
The impact of COVID-19 alert level changes on fixed broadband usage can be seen in Figure
6 on page 12.11 Usage spiked at the end of March when New Zealand moved up to alert
level 4. Usage then gradually reduced as New Zealand moved down alert levels from late
April until we reached alert level 1 on 8 June 2020.
10 This is an average for whole year to 30 June 2020 for all fixed-line connections. This is not comparable to
the monthly broadband usage averages published by Chorus. 11 Figure 6 only shows broadband usage on the Chorus network so may not be indicative of the usage
trends on other local fibre companies’ networks, fixed wireless, satellite or HFC cable usage.
0
50
100
150
200
250
300
Da
ta u
sed
pe
r co
nn
ect
ion
pe
r m
on
th (
GB
)

12
Annual Telecommunications Monitoring Report 2020
Figure 6: Daily broadband usage on Chorus’ network
Source: Chorus via Statistics New Zealand’s COVID-19 data portal
0
5
10
15
20
25
Gig
ab
yte
s (
mill
ion
s)

13
Annual Telecommunications Monitoring Report 2020
Mobile data consumption continues to grow
Figure 7: Mobile data consumption12
The amount of data consumed over mobile networks by retail customers continued to grow
in 2020, as shown in Figure 7. The average amount of mobile data consumed per connection
is now 3.29GB per month. However, the rate of usage growth did ease, with growth this
year of 20% compared to 2019 when growth was 35%.
Uptake of uncapped ‘endless’ or ‘unlimited’ data bundles by on-account customers has
grown considerably since 2019. 14% (or 233,000) of residential on-account subscribers now
purchase uncapped mobile bundles, up from 7% in 2019.
Similarly, 8% of business on-account subscribers purchased uncapped mobile bundles in
2020, up from 2% in 2019.
12 Calculated based on connections who have used mobile data.
0.00
0.50
1.00
1.50
2.00
2.50
3.00
3.50
Ave
rag
e m
on
thly
da
ta p
er
con
ne
ctio
n (
GB
)

14
Annual Telecommunications Monitoring Report 2020
OECD price benchmarking Each year we benchmark prices New Zealanders are paying for common plans for fixed-line
broadband and mobile against the OECD. We use the database that has been prepared by
the Teligen division at Strategy Analytics.13, 14
Price of high-speed fixed broadband plans drops
Most consumers of fixed-line telecommunications services buy either a bundle that includes
both a voice and broadband service or naked broadband. The remaining 4% of residential
consumers purchase a voice-only service.
To get an indication of how New Zealand fixed-line broadband prices compare to those
overseas, we compared the New Zealand price against an OECD average price for fixed
broadband services for various levels of usage and speed.15
The entry level home broadband plan offered by most retailers now offers 60GB to 150GB
of data. With 85% of consumers on unlimited plans, we continued to use:
• 60GB, 150GB and 500GB of data for the benchmarking this year;
• 500GB as a proxy for unlimited plans; and
• Varying speed levels to reflect the capabilities provided to customers and
technologies able to provide these speeds. For example, the ultra-high user category
(900Mbps) can only be provided with fibre or HFC cable technologies.
The price of the cheapest high user and ultra-high user broadband only plans have
decreased $10 since 2019, to $73, as shown in Table 1 below.
We note that there are some limitations to the cheapest offer that meets these categories:
• The high user plan can only be purchased for $73 if a customer also purchases a pay-
monthly mobile plan from Vodafone; and
• The cheapest ultra-high user plan is an HFC cable plan so is only available in parts of
Wellington, Kapiti and Christchurch.
13 Teligen typically collects plan information on the incumbent providers who serve at least 70% of
customers in a given country. 14 The countries included in calculating the average vary because not all have comparable plans. 15 Spark, Vodafone, Slingshot and Orcon are the only New Zealand brands included in Teligen’s fixed-line
broadband benchmark dataset.

15
Annual Telecommunications Monitoring Report 2020
Table 1: Fixed-line broadband only benchmarking
Price in NZD (PPP)
Price difference
from 2019 Dec-20
Broadband only NZ rank in
OECD NZ
OECD
average NZ
OECD
average
Entry level 31/37 $65 $53 +$12 +$1
60GB 10Mbps
Medium user 30/37 $73 $58 +$3
no
change 150GB 30Mbps
High user 26/37 $73 $67 -$10
no
change Unlimited (500GB) 100Mbps
Ultra-high user 12/33 $73 $111 -$10 -$79
Unlimited (500GB) 900Mbps
Source: Strategy Analytics
Meanwhile, the price of the cheapest entry level fixed broadband only plan has increased
from $53 last year (2019) to $65 this year (2020). This increase results from Vodafone no
longer offering its Basic Home Broadband packages.
As shown in Table 2 below, the price of the cheapest high user and ultra-high user
broadband and voice bundles decreased $6 to $84 this year (2020).
Like naked broadband, the ultra-high user category is the only broadband and voice bundle
category where New Zealand prices are cheaper than the OECD average.
Table 2: Fixed-line broadband and voice benchmarking
Price in NZD (PPP)
Price difference
from 2019 Dec-20
Broadband + voice NZ rank
in OECD NZ
OECD
average NZ
OECD
average
Entry level 23/29 $75 $65 +$12 -$1
60GB 10Mbps
Medium user 22/29 $80 $70 +$6 -$2
150GB 30Mbps
High user 21/28 $84 $77 -$6 -$2
Unlimited (500GB) 100Mbps
Ultra-high user 10/22 $84 $115 -$6 -$8
Unlimited (500GB) 900Mbps
Source: Strategy Analytics

16
Annual Telecommunications Monitoring Report 2020
Entry level mobile plan prices steady
New Zealand mobile phone users are now consuming an average of 3.29GB of data per
connection per month along with 166 minutes of voice.
32% of on-account residential consumers purchase mobile plans with more than 8GB of
data. We have therefore included in our mobile benchmarking this year an ‘ultra-high’
category with unlimited minutes and 20GB of data.
Table 3 shows that New Zealand’s benchmarked mobile prices were below the OECD
average for the entry level and medium user categories but above the OECD average for the
high user and ultra-high user category.
Table 3: Mobile phone services benchmarking
Price in NZD (PPP)
Nov-20
Price difference
from 2019
Mobile phone services NZ rank in
OECD NZ
OECD
Average NZ
OECD
average
Entry level 11/37 $18 $24
no
change -$2
30 calls + 500MB
Medium user 17/37 $28 $32
no
change -$4
100 calls + 2GB
High user 27/37 $47 $42 -$1 -$8
300 calls + 5GB
Ultra-high user 22/34 $76 $68 +$4 -$11
Unlimited calls + 20GB
Source: Strategy Analytics
Changes in New Zealand prices since 2019 were mixed with: 16
• The entry level and medium category remaining unchanged at $18 and $28
respectively;
• The high user category decreasing $1 to $47; and
• The ultra-high user category increasing $4 to $76.
Although the price of the ultra-high category has increased by $4, the data allowance of the
plan that meets this basket has also increased from a capped plan with 33GB to an
uncapped plan with 40GB of data at unthrottled speeds.
16 Skinny, Spark and Vodafone are the only New Zealand brands included in Teligen’s mobile benchmark
dataset

17
Annual Telecommunications Monitoring Report 2020
Household expenditure on
telecommunications Average monthly expenditure on telecommunications increases
Statistics New Zealand’s Household Economic Survey (HES) collects information on
household expenditure on a three-yearly basis. Data from the most recent survey for the
year ended 30 June 2019 was released in March 2020.
Figure 8 below shows the average household spend on common household bills per month
based on the most recent HES data. On average, households spent $142 per month on
telecommunications services in 2019 up from $135 in 2016.
Figure 8: Average monthly household expenditure on common household bills
Source: Statistics New Zealand, household economic survey
Of these common household bills, only energy (such as electricity and gas) showed a
decrease in expenditure between 2016 and 2019. Overall, the 2019 HES estimated that, on
average, households spent a total of $5,857 per month on goods and services.
Telecommunications expenditure as a proportion of total expenditure stable
As shown in Figure 9, household expenditure on telecommunications as a proportion of
total household expenditure is relatively stable. In 2019, the HES estimated that expenditure
on telecommunications services was 2.42% of total estimated annual household
expenditure. This represents a small decrease from 2016 when telecommunications
expenditure was estimated to be 2.46% of total estimated household expenditure.
135184 202
260
440
665
142211 194
284
536
720
0
100
200
300
400
500
600
700
800
Telco services Petrol Energy Insurance Rent Grocery food
Ave
rag
e m
on
thly
sp
en
d (
$)
2015/16 2018/19

18
Annual Telecommunications Monitoring Report 2020
Figure 9: Telecommunications expenditure as a proportion of total expenditure
Source: Statistics New Zealand, household economic survey
Consumers concerned about the costs of telecommunication services
ConsumerNZ conducts an annual nationally representative survey of consumers. The 2020
survey included a question about what everyday costs concerned them. 41% of consumers
highlighted telecommunications services as an everyday cost that they were concerned
with, as shown in Figure 10.
Figure 10: Percent of consumers concerned about everyday costs
Source: ConsumerNZ, 2020 consumer survey
This is a drop from 2018 when 49% of consumers highlighted telecommunications services
as an everyday cost that they are concerned about.
0%
1%
2%
3%
4%P
rop
ort
ion
of
tota
l exp
en
dit
ure
0 10 20 30 40 50 60 70
Telco services
Contents insurance
Car insurance
Household energy
Fuel
Food and groceries
% concerned about cost

19
Annual Telecommunications Monitoring Report 2020
Broadband speeds
Average broadband download speeds exceed OECD average
The website Cable.co.uk creates a yearly worldwide broadband speed league based on data
gathered internationally by Measurement Lab (M-Lab). The league ranks the average
download speed on fixed broadband connections.17
In 2020, New Zealand ranked 12th in the OECD, with average fixed broadband download
speeds of almost 67Mbps.18 Figure 11 below compares New Zealand against the same
subset of OECD countries shown in the affordability graphs on page 3. New Zealand’s
average fixed broadband download speeds exceed Australia, Japan and the OECD average of
53Mbps.
Figure 11: Average broadband download speed
Source: Cable.co.uk
Local performance
We released our Spring 2020 Measuring Broadband New Zealand (MBNZ) Report on
9 December 2020. This report from independent testing partner SamKnows provided a
breakdown of the broadband speeds by technology in New Zealand, as shown in Figure 12
below.
17 Full results and methodology can be found at https://www.cable.co.uk/broadband/speed/worldwide-
speed-league/#map 18 Due to M-lab’s platform upgrade, 2020 download speeds are not comparable with 2019 download
speeds.
0
10
20
30
40
50
60
70
80
Do
wn
loa
d s
pe
ed
(M
bp
s)

20
Annual Telecommunications Monitoring Report 2020
Figure 12: Average broadband download speed by technology
Source: Measuring Broadband New Zealand Spring Report, December 2020
The Spring 2020 report includes further breakdown of the technology results by areas
(North Island/ South Island, Region, Urban/ Rural), and a retailer breakdown for Fibre 100
plans.
The report also includes tests showing the performance you can expect to see on popular
social media, online gaming, video streaming, and video conferencing services. The full
report and previous reports can be found on our MBNZ reports webpage.19
Impact of COVID-19 lockdown on NZ internet performance
New Zealand entered alert level 4 in response to the COVID-19 pandemic on 26 March 2020.
The huge increase in the number of New Zealanders staying connected, working and
learning from home caused heavy demand on broadband networks during the lockdown
period.
During the first week of lockdown, wholesale provider Chorus released regular reports on
the volume of traffic passing through its network.20 The reports showed that internet usage
was at a record high immediately following lockdown with levels stabilising after 7 to 8 days.
Throughout the lockdown, Chorus reported that, while traffic volume was high (see Figure 6
on page 12), it was within the range designed to be accommodated by its network.
19 https://comcom.govt.nz/regulated-industries/telecommunications/monitoring-the-telecommunications-
market/monitoring-new-zealands-broadband/Reports-from-Measuring-Broadband-New-Zealand 20 See Chorus’ COVID-19 media releases 24 March 2020 to 3 April 2020, for example
https://company.chorus.co.nz/covid-19-chorus-network-broadband-traffic-update-6
8.6
42.426.0
99.7
620.6
8.542.1
21.3
98.6
559.3
0.0
100.0
200.0
300.0
400.0
500.0
600.0
700.0
ADSL VDSL Fixed Wireless Fibre 100 Fibre Max
Do
wn
loa
d s
pe
ed
(M
bp
s)
24/7 Peak
21
Annual Telecommunications Monitoring Report 2020
Despite those increases in traffic, the MBNZ testing showed that copper and fibre download
speeds stayed fairly steady for most households, as shown in Figure 13.
Figure 13: Impact of lockdown on download speeds
Source: Measuring Broadband New Zealand Autumn Report, May 2020
On average, download speeds for copper (ADSL and VDSL) and Fibre 100 plans continued to
perform well, with average download speeds unaffected. Average download speeds for the
fastest plan that we test, Fibre Max, decreased by about 4%, which most consumers would
not notice given the high speeds on these plans. By contrast, average download speeds for
fixed wireless decreased by around 25%, reflecting the susceptibility of performance of
these services to loads on the mobile networks over which they are provided.
Fibre Max investigation
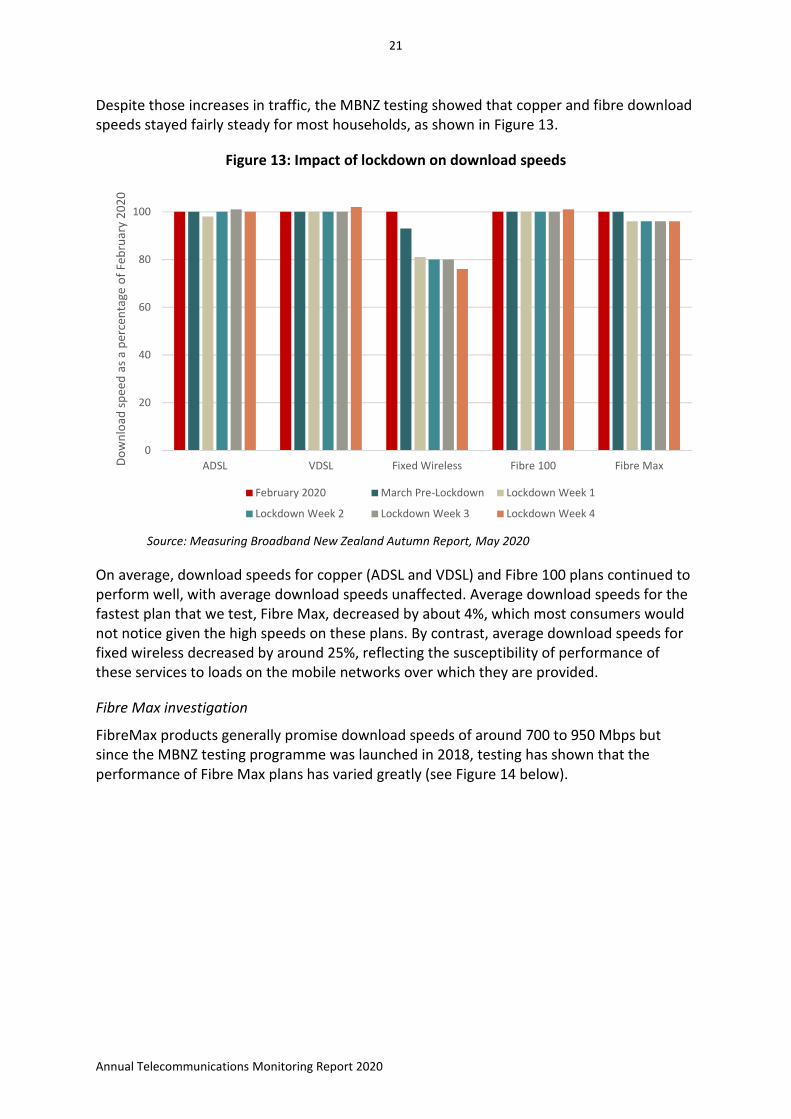
FibreMax products generally promise download speeds of around 700 to 950 Mbps but
since the MBNZ testing programme was launched in 2018, testing has shown that the
performance of Fibre Max plans has varied greatly (see Figure 14 below).
0
20
40
60
80
100
ADSL VDSL Fixed Wireless Fibre 100 Fibre MaxDo
wn
loa
d s
pe
ed
as
a p
erc
en
tag
e o
f Fe
bru
ary
20
20
February 2020 March Pre-Lockdown Lockdown Week 1
Lockdown Week 2 Lockdown Week 3 Lockdown Week 4
22
Annual Telecommunications Monitoring Report 2020
Figure 14: Distribution of download speed tests results on Fibre Max plans
Source: Measuring Broadband New Zealand Spring Report, December 2020
To help identify the cause of the inconsistent performance, in 2020 a working group of
retailers and fibre wholesalers worked with the Commission and independent testing
partner, SamKnows.
In December 2020, a Fibre Max Status Update Report was published that outlines the
conclusions from the investigation into Fibre Max performance.21 Multiple factors were
discovered during the investigation and the resulting network changes implemented are
helping to lift the performance of Fibre Max plans.
Two retailers have already seen their average download speeds improve by 150-250 Mbps.
There are further changes planned to enhance the performance of Fibre Max plans including
improvements to wholesale equipment.
This investigation highlighted the value of the programme for improving internet
performance for all New Zealanders.
The next testing report, due to be released in the April 2021, will further assess the
improvement of Fibre Max plans and results by retailers.
21 The Fibre Max Status Update Report can be found at https://comcom.govt.nz/regulated-
industries/telecommunications/monitoring-the-telecommunications-market/monitoring-new-zealands-
broadband/Reports-from-Measuring-Broadband-New-Zealand; and a more detailed Fibre Max
Investigation Report can be found at https://comcom.govt.nz/regulated-
industries/telecommunications/monitoring-the-telecommunications-market/monitoring-new-zealands-
broadband
5.6%7.6% 7.6% 7.4%
8.7% 8.9%7.6%
9.6%
14.8%
22.2%
0%
5%
10%
15%
20%
25%
% o
f D
ow
nlo
ad
te
sts
Download speed (Mbps)

23
Annual Telecommunications Monitoring Report 2020
Industry investment Fibre investment drops while mobile investment rises
In recent years, telecommunications industry investment has been led by Chorus and the
Local Fibre Companies (LFCs), as shown in Figure 15 below. However, with the UFB build
now 93% complete, investment by Chorus and the LFCs has dropped. This drop has led to
overall investment decreasing by 6% to $1.61 billion in 2020.
Figure 15: Telecommunications investment
Figure 16 below shows investment broken down by component. In 2020, investment in the
fibre access network decreased 11% to $718 million, while investment in the mobile access
network increased by 24% to $249 million. This lift in mobile access network investment is
likely due to the rollout of 5G starting.
Investment in the core and backhaul network was down on last year to $190 million while
IT systems investment was unchanged from last year at $269 million. Other investment,
which includes copper access investment, decreased 19% in 2020 to $269 million.
Retailers, mobile and
other network operators
Fibre and copper
access network
operators
0
0.2
0.4
0.6
0.8
1
1.2
1.4
1.6
1.8
2
Inve
stm
en
t (b
illio
ns
$)

24
Annual Telecommunications Monitoring Report 2020
Figure 16: Investment by component
0
100
200
300
400
500
600
700
800
900
Inve
stm
en
t (m
illio
ns
$)
Fibre access Mobile access Core and backhaul
Other investment IT systems

25
Annual Telecommunications Monitoring Report 2020
Market shares Fixed broadband market
Figure 17 shows the 2020 estimated market shares of the largest retailers of fixed-line
broadband by number of connections.
The smaller retailers continue to grow their share of market connections with the market
share of ‘Other’ providers’ increasing from 11% in 2019 to 13% this year.
2degrees overtook Trustpower to become the 4th largest provider with 7% of the market.
Spark’s market share, which includes its sub-brand Skinny, marginally decreased from 41%
in 2019 to 40% in 2020. Vodafone’s market share also dropped, from 24% in 2019 to 21% in
2020. While Vocus’ market share remained steady at 13%.
Figure 17: Estimated fixed broadband retailer market share by connections
Spark
40%
Vodafone
21%
Vocus
13%
2degrees
7%
Trustpower
6%
Other
13%

26
Annual Telecommunications Monitoring Report 2020
Mobile market
Figure 18 shows the 2020 market shares of the main mobile market operators plus the five
Mobile Virtual Network Operators (MVNOs) included in our questionnaire (Compass, Kogan
Mobile, Trustpower, Vocus, and Warehouse Mobile).
Figure 18: Mobile market shares by subscribers22
Vodafone and Spark (including its sub-brand Skinny) both take 40% of the market each.
MVNO subscribers make up the final 1.4% of the mobile market with 88,500 subscribers, up
10% on last year.
Both Kogan Mobile and Trustpower were included for the first time in our questionnaire
with Kogan Mobile launching in September 2019 on the Vodafone network and Trustpower
launching in the first half of 2020 on the Spark network.
22 Market shares are not directly comparable to 2019 due to a methodological change. The graph included
in the 2019 report used a mix of publicly reported subscriber numbers and responses to our
questionnaire (which use different prepay subscriber definitions), while the 2020 graph only uses
responses to our questionnaire.
Spark
40%
Vodafone
40%
2degrees
19%
MVNOs
1%

27
Annual Telecommunications Monitoring Report 2020
Market monitoring updates
Ongoing section 9A studies
Measuring Broadband New Zealand (MBNZ)
Our MBNZ programme aims to provide consumers with independent information on
broadband performance across different technologies, providers and plans to help them
choose the best broadband for their household.
We have so far released six reports that compare technologies across several measures
including download and upload speeds, video streaming, social media, online gaming and
video conferencing services performance. Our December 2020 report also included
geographic and provider comparisons for the Fibre 100 plan.
We are still looking for volunteers to complete our sample of 3,000. Adding more volunteers
to the programme will enable us to show more comparisons of providers and geographic
regions across all the measures and plans we test.
To volunteer go to www.measuringbroadbandnewzealand.com.
Mobile bill review
The purpose of our section 9A study of mobile bills was to understand how well consumers
match their purchasing decisions with their mobile usage, how they consume different types
of mobile services, such as add-ons and casual rates, and whether relatively passive
consumers could save money if they changed their purchasing behaviour.
In March 2021 the three mobile network operators committed to implement a set of
measures to provide greater access and transparency of spend and usage information for
consumers. These measures will be implemented by the three network operators by the
end of 2021, and should enable consumers to assess whether they are on the right mobile
plan for their needs
Upcoming section 9A work
Consumer retail service quality survey
We have commissioned a large-scale survey to measure consumers’ experience of specific
areas of telecommunications retail service quality, for example, customer service and the
speed and performance of their telecommunications services.
Information from the survey will steer the focus of the Commission’s activities to resolve
any issues of poor quality. We also intend to publish information from the survey to help
consumers choose their phone or broadband services.

28
Annual Telecommunications Monitoring Report 2020
List of defined terms ADSL Asymmetric Digital Subscriber Line – a type of DSL
CIP Crown Infrastructure Partners – Crown agency formerly known as Crown Fibre Holdings
DSL Digital Subscriber Line – method of transmitting high-speed data and, if necessary, voice
simultaneously over a copper phone line
GB Gigabyte. 1 gigabyte = 1024 megabytes
HES Household Economic Survey – Statistics New Zealand survey which collects information on
household income, savings, and expenditure
HFC cable Hybrid Fibre-Coaxial cable – broadband network in parts of Wellington, Kapiti and Christchurch
which uses fibre-optic and copper cabling
LFC Local Fibre Company - these are the four companies contracted with government agency Crown
Infrastructure Partners to deploy the UFB fibre network
M-Lab Measurement Lab – an open source project dedicated to providing an open, verifiable
measurement platform for global network performance
MB Megabyte – a multiple of the unit byte for measuring the quantity of digital information
MBNZ Measuring Broadband New Zealand – a programme run by the Commission to measure the
broadband performance of New Zealand households
Mbps Megabits per second – used to measure data transfer speeds of high bandwidth connections, such
as fibre, Ethernet and cable modems
MVNO Mobile Virtual Network Operator – an operator that provides mobile phone services but does not
generally have its own licensed frequency allocation of radio spectrum or much of the
infrastructure required to provide mobile telephone service. It therefore relies on buying services
from an operator with a full mobile network. The amount of control it has over the services it offers
will vary according to the nature of its agreement
OECD Organisation for Economic Co-operation and Development
PPP Purchasing Power Parity – an exchange rate designed to equalise standard-of-living differences
between countries, and generally accepted as an appropriate conversion method for non-tradable
goods and services
SMS Short Message Service – commonly known as a text messaging, is a service for sending short
messages between mobile devices
The Act The Telecommunications Act 2001
UCLL Unbundled Copper Local Loop – a Chorus copper line that connects a phone user to the local
exchange that can be accessed by retail telecommunications providers to provide a voice and
broadband service
UFB Ultra-Fast Broadband – the name given to the Government’s initiative to roll out a
fibre-to-the-premises access network to give households and businesses access to very high-speed
broadband
VDSL Very High Bitrate (high-speed) DSL