Embed Size (px)
Citation preview

2020ANNUAL REPORT
For
per
sona
l use
onl
y

West African Resources Limited
TABLE OF CONTENTS CORPORATE INFORMATION ......................................................................................................................................... 1 CHAIRMAN’S LETTER .................................................................................................................................................... 2 2020 IN BRIEF ............................................................................................................................................................... 3 DIRECTORS’ REPORT ..................................................................................................................................................... 4 REMUNERATION REPORT (AUDITED) ......................................................................................................................... 24 CONSOLIDATED STATEMENT OF PROFIT OR LOSS AND OTHER COMPREHENSIVE INCOME ..................................... 35 CONSOLIDATED STATEMENT OF FINANCIAL POSITION ............................................................................................. 36 CONSOLIDATED STATEMENT OF CHANGES IN EQUITY .............................................................................................. 37 CONSOLIDATED STATEMENT OF CASH FLOWS .......................................................................................................... 38 NOTES TO THE CONSOLIDATED FINANCIAL STATEMENTS ......................................................................................... 39 DIRECTORS’ DECLARATION ......................................................................................................................................... 75 AUDITOR’S INDEPENDENCE DECLARATION ................................................................................................................ 76 INDEPENDENT AUDITOR’S REPORT ............................................................................................................................ 77 ASX ADDITIONAL INFORMATION................................................................................................................................ 81 SUMMARY OF TENEMENTS ........................................................................................................................................ 83
For
per
sona
l use
onl
y

West African Resources Limited|1
CORPORATE INFORMATION
Company Burkina Faso office West African Resources Limited Secteur 27, Quartier Ouayalghin, Parcelles 07, Lot 22, Section SL, ABN Ouagadougou, Burkina Faso 70 121 539 375 T: +226 25 36 73 84 Directors Website Richard Hyde (Executive Chairman and CEO) www.westafricanresources.com Lyndon Hopkins (Executive Director and COO) Rod Leonard (Non-Executive Director) Share registry Libby Mounsey (Non-Executive Director) Computershare Investor Services Pty Ltd Nigel Spicer (Non-Executive Director) Level 11, 172 St George’s Terrace Stewart Findlay (Non-Executive Director) Perth WA 6000 Australia T: +61 (8) 9323 2000 Company Secretary Padraig O’Donoghue Auditors HLB Mann Judd (WA Partnership) Principal place of business Level 4, 130 Stirling Street Level 1, 1 Alvan Street Perth WA 6000 Australia Subiaco WA 6008 Australia Security exchange Registered office Australian Securities Exchange Ltd (ASX) Level 1, 1 Alvan Street Level 40, Central Park Subiaco WA 6008 Australia 152-158 St George’s Terrace T: +61 (8) 9481 7344 Perth WA 6000
For
per
sona
l use
onl
y

2|West African Resources Limited
CHAIRMAN’S LETTER Dear Fellow Shareholders, I am pleased to present the 2020 Annual Report for West African Resources Limited (ASX: WAF). 2020 was a tremendously successful year for WAF and its shareholders considering the challenges we faced while ramping up during the global pandemic. The consolidated group generated strong financial results during the first year of gold production with A$148 million of operating cash flow, A$99 million profit, and a healthy A$95 million cash balance at year end after making an early debt repayment of US$25 million. Additionally, investments in the acquisition of the Toega gold deposit and deep exploration drill holes at M1 South Deeps were well rewarded with a 65% increase in Sanbrado’s Mineral Resources to 5.1 million ounces at 2 grams per tonne gold. The Company’s 2020 achievements also included completing the construction of Sanbrado ahead of schedule and under budget, pouring first gold on 18 March 2020, declaring commencement of commercial production on 1 May 2020 and producing 136,476 ounces of gold at an AISC of US$1,021 per ounce. These achievements strongly demonstrate the commercial and technical capabilities of West African’s team and our determination to deliver on our promises, in a safe, efficient, considered and cost-effective manner. This Annual Report includes a sustainability summary highlighting the Company’s commitment to delivering on its environmental and social responsibility programs using internationally recognised standards. Our Company is committed to Burkina Faso and to operating Sanbrado in a manner that will provide widespread economic benefits for the Burkina Faso Government, local and regional communities, and our other stakeholders.
WAF updated its Board in 2020 as the Company repositioned for the production-phase of Sanbrado. Two new independent Non-executive Directors, Libby Mounsey and Stewart Findlay, joined the board while Simon Storm and Mark Connelly retired as Non-executive Directors on 29 May 2020. Ms Mounsey chairs the Remuneration Committee and has brought valuable HR and industrial relations skills to the Board. Mr Findlay has an extensive background in financial markets and chairs the Audit Committee. Our other two Non-executive independent Directors, Rod Leonard and Nigel Spicer have world-class mineral processing and mining backgrounds, respectively including significant experience in Africa. The Board recently appointed Mr Leonard as Lead Independent Director to enhance the Company’s governance framework. Whilst I am proud of the Company’s achievements in 2020 our focus continues to be on the future of the Company. We recently set West African’s maiden guidance at 250,000 to 280,000 ounces of gold for 2021 at an AISC of US$720 to US$800 per ounce. We also released the 10-year production outlook with Sanbrado set to average over 200,000 ounces of gold per annum from 2021 to 2030. These metrics provide an incredibly strong base upon which the Company can continue to grow through targeted drilling and exploration creating further value for our shareholders and stakeholders. I would like to congratulate West African’s dedicated team who have worked safely to achieve our goals and thank my fellow Board members for their support.
RICHARD HYDE Executive Chairman & CEO
For
per
sona
l use
onl
y

West African Resources Limited|3
2020 IN BRIEF
18 Mar First gold poured at Sanbrado
29 Apr Definitive agreement to acquire Toega gold deposit
1 May Sanbrado commences commercial production
30 Sep High-grade gold mineralisation intercepted beneath ore reserves at M1 South
6 Nov Early US$25 million debt repayment
136,476 ounces US$1,021 AISC/oz
GOLD PRODUCTION
5.1 million ounces YEAR-END RESOURCES
1.5 million ounces YEAR-END RESERVES
A$98.9 million NET PROFIT
For
per
sona
l use
onl
y

4|West African Resources Limited
DIRECTORS’ REPORT The Directors present their report together with the consolidated financial report of West African Resources Limited (the “Company”) and its controlled subsidiaries (the “Group”, “West African” or “WAF”) for the-year ended 31 December 2020.
ABOUT WEST AFRICAN RESOURCES LIMITED
West African Resources Limited (the “Company”) and its subsidiaries (the “Group”, “WAF”, or “West African”) is the operator and 90% owner of the Sanbrado Gold Project (Sanbrado) in Burkina Faso. The government of Burkina Faso retains a 10% equity interest in Sanbrado.
The Group’s mineral portfolio also includes gold and copper-gold exploration permits in Burkina Faso.
OPERATING REVIEW
LOCATION
Sanbrado is located in central Burkina Faso, 90 kilometres east-southeast of the capital city of Ouagadougou.
For
per
sona
l use
onl
y

West African Resources Limited|5
SANBRADO CONSTRUCTION COMPLETED IN FIRST HALF OF 2020
Construction of Sanbrado was completed in early 2020 ahead of schedule and under-budget, with first gold pour occurring in March 2020 and commercial production declared on 1 May 2020.
figure 1 - Sanbrado processing plant
SANBRADO PRODUCTION STATISTICS
West African Resources completed its maiden year of operations at Sanbrado with 136,476 ounces of gold produced. The key 2020 production statistics for Sanbrado used by management are contained in the following table. As 2020 is the first year of operation for Sanbrado, prior year comparatives are not available.
Unit Year 2020
OP mining
Total movement BCM '000 8,909
Total movement kt 21,415
Strip ratio w:o 5.1
Ore mined kt 3,494
Mined grade g/t 1.3
Contained gold oz 145,803
UG mining
Ore mined kt 119
Mined grade g/t 10.0
Contained gold oz 38,232
Processing
Ore milled kt 2,616
Head grade g/t 1.7
Recovery % 93.4
Gold produced oz 136,476
Gold poured oz 133,534
For
per
sona
l use
onl
y

6|West African Resources Limited
SAFETY
The Company is pleased to report Sanbrado’s safety performance for 2020:
• there were no significant health or safety incidents during the year; and • the annual TRIFR rate was 2.61.
OPEN PIT MINING
After initial mobilisation by the open pit mining contractor in December 2019, open pit mining ramped up to full production capacity during the first quarter of 2020. The mining plan for 2020 was to initially develop the higher-grade M5 South Stage 1 and M1 South pits with the M1 North pit being developed towards the end of the year. Due to the early completion of construction, subsequent performance of the process plant (processing softer oxide and transition ores at a rate 30% above the nameplate design capacity) the mining of the M5 North Stage 1 pit was brought forward by 12 months to provide a low strip ratio ore source to meet the process plant demand. Site layout of the project is shown below in figure 2 and a long section through M5 is show in figure 3.
figure 2 - Sanbrado layout
1 Western Australian Total Mining Average TRIFR of 6.2. Department of Mines, Industry Regulation and Safety, 2020, Safety performance in the Western Australian mineral industry — accident and injury statistics 2019-20: Department of Mines, Industry Regulation and Safety, Western Australia. https://www.dmp.wa.gov.au/Documents/Safety/MSH_Stats_Reports_SafetyPerfWA_2019-20.pdf
For
per
sona
l use
onl
y

West African Resources Limited|7
During 2020 the total material movement from the open pits was 21 Mt at a strip ratio of 5:1 to provide 3.5 Mt of ore at an average grade of 1.3 g/t Au. Lower grade ore was stockpiled with preferential treatment of higher-grade material. Total stockpiles at the end of 2020 were 1.0 Mt at a grade of 1.2 g/t Au.
figure 3 – Long section through the M5 Pit
UNDERGROUND MINING
During 2020 some 2.6 km of development for the decline and stope access was completed. At the end of 2020 the decline was 297 m below surface (vertically) providing access to the base of the second mining panel. Ore mined from the underground during 2020 was comprised of 60 kt of stoping ore at 9.0 g/t Au and 60 kt of ore from development drives at 11.0 g/t Au.
Development and stoping completed to 31 December 2020 is illustrated in Figure 5 below.
PROCESSING
Commissioning of the process plant commenced in March 2020 with commercial production achieved in May. During 2020 a total of 2.6 Mt was milled at a grade of 1.7 g/t Au producing 136,476 ounces of gold.
figure 4 – Sanbrado process plant
For
per
sona
l use
onl
y

8|West African Resources Limited
figure 5 – Isometric diagram of M1 South
For
per
sona
l use
onl
y

West African Resources Limited|9
GROWTH
Toega acquisition
On 29 April 2020 WAF announced it had signed a definitive agreement to acquire 100% of the Toega gold deposit from B2Gold and their partner GAMS-Mining F&I Ltd with the aim of upgrading the Toega resource for future processing though the Sanbrado process plant. The Toega deposit is located 14km southwest of the Sanbrado.
On 9 March 2021 WAF announced on ASX that it had completed work to report an Inferred Mineral Resource for the Toega deposit of 22 million tonnes at a grade of 2.1 g/t for 1.3 million contained ounces of gold.
M1 South Deeps
During 2020 WAF returned positive results from extension drilling beneath the currently defined M1 South Ore Reserve (“M1 South Deeps”).
On 9 March 2021 WAF announced on ASX that it had completed a technical evaluation including resource estimation and mine planning to determine the development requirements to extend the M1 South underground mine. It also reported an Inferred Mineral Resource for M1 South Deeps of 2.1 million tonnes at a grade of 12.4 g/t for 820,000 contained ounces of gold.
Long term production targets
In the above-noted 9 March 2021 ASX announcement WAF outlined its long-term production targets for Sanbrado which include both M1 South Deeps and Toega material in the life-of-mine plan to extend the life of the Sanbrado project by 5 years from 2028 to 2033 with:
• Toega open pit mining to commence with the pre-strip in 2023 and Toega material being included in the processing schedule from 2024; and
• M1 South Deeps underground material being included in the processing schedule from 2025.
Inferred Mineral Resources have lower confidence levels than an Indicated Mineral Resources and there is no certainty that further resource definition work will result in the conversion of Inferred Mineral Resources to the Indicated category.
figure 6 – Sanbrado accommodation camp
For
per
sona
l use
onl
y

10|West African Resources Limited
SUSTAINABILITY REVIEW
This sustainability summary report highlights the Group’s activities in three interrelated areas for the period of January to December 2020, including:
• governance, • community engagement and socio-economic contribution and • environmental performance.
Development of West African’s sustainability reporting is ongoing as the Group aligns with reporting frameworks. For 2020 the reporting focuses on Sanbrado and includes references to the recently acquired Toega gold deposit situated 14km south west of Sanbrado.
In 2019 West African engaged independent international experts to undertake a comprehensive review of the Sanbrado operations, including the Group’s environmental and social management programs, stakeholder engagement, socio-economic contribution, and governance practices.
“By undertaking a rigorous review of our environmental, social and governance practices, we have an understanding of where our key environmental and social risks are and what we need to do to eliminate, reduce and manage them.”
This extensive review was structured using leading global industry practices and sustainability frameworks, including the Equator Principles and the International Finance Corporation’s Performance Standards for management of environmental and social risks. The result of the review was an Environmental and Social Action Plan (ESAP) that has guided the environmental and social activities being undertaken at Sanbrado in conjunction with compliance requirements and industry practices. Additional focus and training in areas such as the United Nations Voluntary Principles on Security and Human Rights has placed matters of significance in doing business internationally at the forefront of Sanbrado operations.
Despite the challenges presented by the COVID-19 pandemic in 2020, WAF continued to meet or exceed its sustainability targets. By the end of December 2020, a majority of the actions and improvements identified in the ESAP had been completed or were in advanced stages of completion across areas of environment, social and health and safety.
OUR PEOPLE
Health and safety
Although 2020 was a challenging year for businesses and communities around the world, West African maintained its health and safety standards and practices. The Company’s management team responded to the COVID-19 situation by ensuring staff and contractors were aware of the current health guidelines set out by the World Health Organisation and the Government of Burkina Faso. Actions such as social distancing, maintaining personal hygiene, and wearing appropriate personal protective equipment were made mandatory. The Sanbrado on-site clinic became equipped to administer COVID-19 tests and a policy for managing the pandemic was issued. National and international staff were kept informed of the quickly changing conditions around the world.
Employee engagement
The Group’s renumeration and employment policies are non-discriminatory and are based on experience and skill set. West African recognises its responsibility to seek local and national talent. Local employment at the Sanbrado project accounted for 45% of total staff while regional employment accounted for 49%. These figures are similar to 2019 but with a slight increase in regional employment in 2020. Employees are encouraged to share regular feedback with senior management and the rest of the Group. Sanbrado transitioned from exploration into construction in 2019, and 2020 marked the first year of operations.
International employees
9%
Commune of Boudry(local)45%
Ganzourgou Province(regional)
4%
Rest of Burkina
Faso42%
Employee origin
For
per
sona
l use
onl
y

West African Resources Limited|11
Diversity
West African is committed to its Diversity Policy and to providing an inclusive workplace for all staff and contractors and this includes being an equal opportunity employer that embraces diversity. The Group recognises that the benefits of diversity are many, including creating a friendly and supportive work environment and improved communication and collaboration.
An overview of WAF’s diversity performance for the reporting period is presented below. For each indicator presented our performance has remained the same or improved from 2019.
In 2020 West African provided 42 internship positions in a range of technical areas to national personnel. Twelve of these positions were held by females.
The majority of interns (31) were from the local communities and 16 of them went on to be employed by Sanbrado following the completion of their internships.
0 5 10 15 20 25
Industrial EngineeringSurveyingElectricalGeologyLogistics
Mine EngineeringMetallurgy
MedicalFinance
Industrial MaintenanceProcess
Social RelationsHuman Resources
Number of interns in technical areas
Male Female
For
per
sona
l use
onl
y

12|West African Resources Limited
OUR COMMUNITY
WAF is committed to having a positive impact on its communities. This is driven by the Code of Conduct and Community Relations policy.
Stakeholder engagement
From its early exploration days to current Sanbrado operations diversity in our communities has dictated how we engage with our stakeholders. Updated stakeholder mapping in 2020 provided an insight into changes to the Group’s stakeholders and what that means to the way we communicate with them.
The Group shares information through its website, press releases, annual reports and subject-specific reports. In Burkina Faso, the Stakeholder Engagement Plans (“SEPs”) set out how the Group engages with the community, civil society and government stakeholders. The SEPs are living documents. Through the pandemic the management team responded in keeping with national health advice and that of the World Health Organisation. When restrictions on gatherings were in effect public gatherings such as townhall meetings and visits from Community Relations Officers were temporarily replaced with regular telephone calls and an increase in the number of community notice board news bulletins.
When restrictions for gatherings were lifted WAF resumed face-to-face community engagement activities, including the CCCPAS meetings. The CCCPAS is the Communal Consultative Framework of the Sanbrado Gold Project (Cadre Consultatif Communal du Projet Aurifiere de Sanbrado), established to oversee engagement between Sanbrado operations and its stakeholders. The committee meets regularly to discuss progress with resettlement and community development activities and information management. The committee has representatives from local and regional government departments, male and female representatives of Sanbrado’s communities and mine management staff.
A grievance redress mechanism is utilised to receive community feedback and complaints. Grievances can be submitted by different means to ensure the process is accessible to all and is considerate of literacy, gender and cultural practices. The mechanism has proven to work well.
Economic contribution
WAF recognises its role in local and national economic development. In 2020, the Group contributed more than A$21 million in royalties and taxes to the Burkina Faso economy. Of this, more than A$3.4 million was contributed to the Local Development Fund. Local employment and procurement policies also played an important role in ensuring WAF contributed to the local economy.
Other contributions included construction of 14 new water wells including arsenic filtration units to ensure the wells produce potable water, and one livestock vaccination park.
Social programs and understanding our neighbourhood
In 2020 WAF aimed at strengthening its social management programs and planning for an updated socio-economic baseline survey for the first quarter of 2021. One of the key plans finalised in 2020 was the Social Monitoring and Evaluation Plan (SMEP) designed to track and report implementation of WAF’s social management programming. The SMEP integrates management of specific areas such as community development, livelihood restoration, influx management, local employment and procurement, among others. In keeping with industry good practice, the socio-economic baseline data update is planned to take place approximately every 3 years to provide an understanding into how our “neighbourhood” is evolving and to keep informed of the positive and negative impacts of the Group’s operations and how it can improve its support to local development.
For
per
sona
l use
onl
y

West African Resources Limited|13
Health and education
Health and Education are key pillars of WAF’s community development and for its own staff. In addition to building a new community health centre in the village of Pousghin, WAF launched an education campaign on communicable diseases and family planning. The campaign saw almost 100,000 participants with a near even split of males to females (51% and 49%, respectively).
In response to the pandemic, the Group donated personal protective equipment to administrative authorities and impacted local communities including face masks, hand sanitiser, soap and hand washing stations. Medications and medical consumables were also provided to national and local health centres, and health associations working to support HIV/AIDS programs.
For youth specifically, WAF has supported training of 20 young people from the Commune of Boudry in trades including electrical, construction, welding and metal construction, mechanical, and masonry. Other support programs focused on providing driving lessons to 25 youth. The Group also continued with donations of school supplies and equipment.
Livelihood Restoration and Relocation
The Sanbrado Mine was designed to minimise physical displacement without compromising the safe and efficient operation of the mine. This meant that some residents needed to be relocated to a safe distance from the mine’s operations. Extensive consultation and negotiation were undertaken with affected landowners who lost access to their land. Support from the local authorities was also sought in order to determine compensation and entitlement agreements. As of September 2020, construction was completed on 290 new homes, and 127 latrines, shower and cooking facilities for project affected people. Land titles have also been acquired for physically displaced persons and 100% of first year compensation payments have been made and 90% of second year payments.
An intensive livelihood restoration program was also kicked off which focused on enhancing the local agricultural sector and helping families affected by Sanbrado. Various projects were undertaken including distribution of 75 tonnes of agricultural inputs to 310 recipients, preparation of more than 300 hectares of fields for cultivation and education programs centred on improving crop yields of maize, cowpea, millet, and sesame seed. A pilot irrigation project was commenced with input from the communities.
Other livelihood restoration activities included alternative livelihood training for artisanal miners, personal finance training for affected families, weaving, fabric dying workshops and provision of microcredit facilities to women in the local communities.
For
per
sona
l use
onl
y

14|West African Resources Limited
ENVIRONMENT
Environmental Management Systems
A major Company milestone in 2020 included the development of a comprehensive Environmental and Social Management System (ESMS) following ISO 14001 & ISO 45001 guidelines. Each department received training on how to implement the ESMS, and on the development and use of performance measurement tools. Underpinning the system are departmental risk registers and associated action plans which help ensure that each risk has been characterised and an approach, timeline and a point of responsibility assigned. Our internal and external progress reports have been adjusted to allow for close tracking of our progress in completing the action plans, undertaking audits and identifying where additional resources may be required to continue the positive momentum this process has started. The Group had no major environmental incidents in 2020.
Where possible West African looks for ways of improving water management. In 2020, Sanbrado reused approximately 583,583 kilolitres of water in its operation. Here are some of the main ways this was accomplished:
Water source Re-used for Re-usage (kilolitres)
Grey water Re-used for watering vegetable gardens, plants and lawns in camp, and for general gardening
2,433
Water from tailings storage facility (TSF) Re-used for process plant operation 581,100
Water from machinery wash bays Re-used for dust suppression 50
Monitoring and Emergency Readiness
Emergency response readiness and competency were assessed in the last quarter of 2020 and demonstrated to be reflective of our operating needs. WAF continuously monitors environmental parameters such as air quality and water quality in and surrounding its areas of operations to make sure the Group’s activities are compliant with national regulatory requirements for pollution management and follow international guidelines such as the World Bank Environmental, Health and Safety Guidelines (2007) and specific guidelines developed by the World Health Organisation.
Climate Change
Like other mining operations, Sanbrado uses large amounts of fuel and energy to power the operation. Recognising this, WAF completed an initial inventory of its scope-1 greenhouse gas emissions (GHG) as part of an environmental review prior to Sanbrado commencing operations. The key sources of projected emissions from Sanbrado were power generation and vehicle exhaust. The projected total CO2 emissions for Sanbrado during operations was approximately 45,864 tpa, of which the power station accounted for 81%. As part of its approach for climate change mitigation WAF will be undertaking an updated GHG emissions inventory in 2021 to characterise actual emissions from Sanbrado. Results from the inventory will shape WAF’s efforts in mitigating its emissions.
During 2021 WAF will also complete a study investigating the potential addition of solar power to the energy matrix used to generate power on site with the aim of reducing carbon emissions and reliance on fossil fuels.
In addition to understanding its contributions to climate change, WAF celebrated National Tree Day with the local communities by launching a reforestation campaign consisting of planting more than 3,300 trees of local ecological, nutritional and economic value. WAF recognises the value of trees as carbon sinks and their economic value to the local communities.
Mine rehabilitation
Progressive rehabilitation was another area of focus during the reporting period. An updated Mine Reclamation and Closure Plan and a Reclamation and Revegetation Management Plan were developed. Early seed trials have commenced. The Sanbrado Mine is designed in such a way that allows the Group to undertake progressive rehabilitation from the start of our operations and continue as the project evolves. Following industry good practice and updated guidelines such as the ICMM Integrated Mine Closure: Good Practice Guide (2019), WAF understands its responsibility to plan for closure early on and to leave a positive legacy. In the coming year WAF will shift its focus to furthering its knowledge in the natural resources surrounding the Sanbrado operation. Although the existing habitat was highly degraded from decades of over grazing and clearing, with the help of subject matter experts and traditional local knowledge, the team will conduct further biodiversity studies to find opportunities for improving biodiversity values where it can. Progressive rehabilitation projects of impacted areas, revegetation and building a vegetation propagation nursery and local seed bank will form part of WAF’s ongoing environmental management programs.
For
per
sona
l use
onl
y
West African Resources Limited|15
FINANCIAL REVIEW
COST PER OUNCE PERFORMANCE
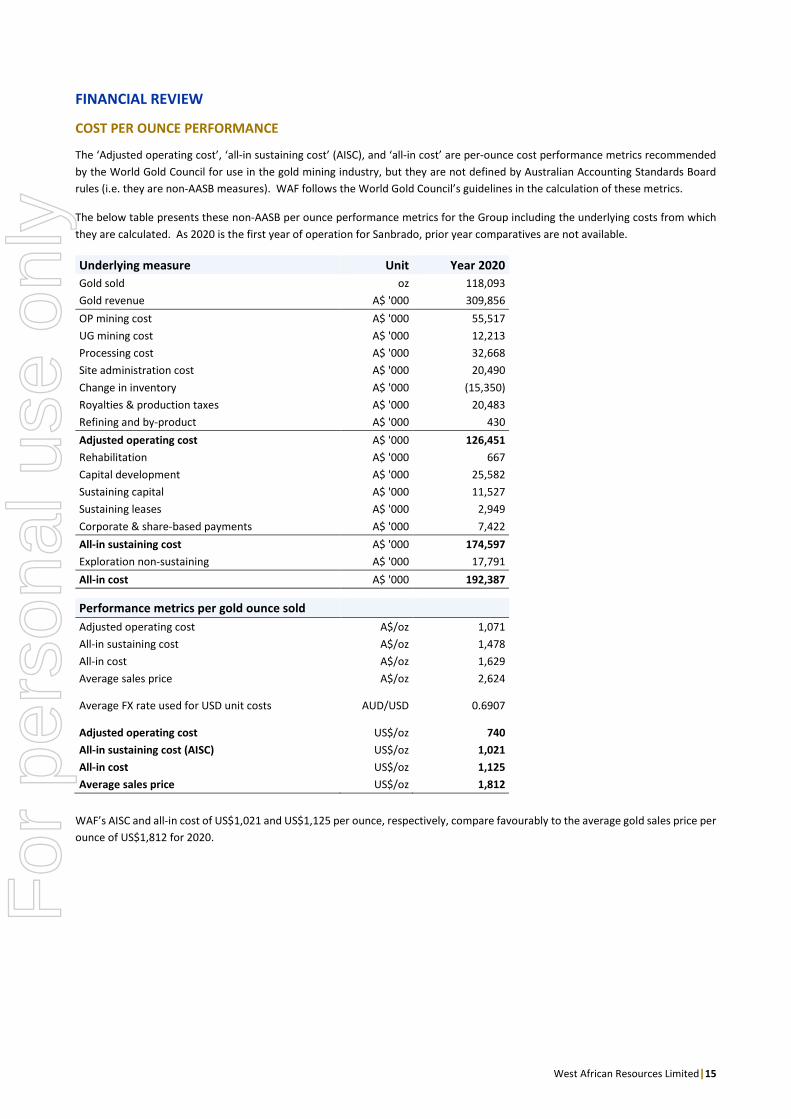
The ‘Adjusted operating cost’, ‘all-in sustaining cost’ (AISC), and ‘all-in cost’ are per-ounce cost performance metrics recommended by the World Gold Council for use in the gold mining industry, but they are not defined by Australian Accounting Standards Board rules (i.e. they are non-AASB measures). WAF follows the World Gold Council’s guidelines in the calculation of these metrics.
The below table presents these non-AASB per ounce performance metrics for the Group including the underlying costs from which they are calculated. As 2020 is the first year of operation for Sanbrado, prior year comparatives are not available.
Underlying measure Unit Year 2020 Gold sold oz 118,093 Gold revenue A$ '000 309,856 OP mining cost A$ '000 55,517 UG mining cost A$ '000 12,213 Processing cost A$ '000 32,668 Site administration cost A$ '000 20,490 Change in inventory A$ '000 (15,350) Royalties & production taxes A$ '000 20,483 Refining and by-product A$ '000 430 Adjusted operating cost A$ '000 126,451 Rehabilitation A$ '000 667 Capital development A$ '000 25,582 Sustaining capital A$ '000 11,527 Sustaining leases A$ '000 2,949 Corporate & share-based payments A$ '000 7,422 All-in sustaining cost A$ '000 174,597 Exploration non-sustaining A$ '000 17,791 All-in cost A$ '000 192,387
Performance metrics per gold ounce sold Adjusted operating cost A$/oz 1,071 All-in sustaining cost A$/oz 1,478 All-in cost A$/oz 1,629 Average sales price A$/oz 2,624
Average FX rate used for USD unit costs AUD/USD 0.6907
Adjusted operating cost US$/oz 740 All-in sustaining cost (AISC) US$/oz 1,021 All-in cost US$/oz 1,125 Average sales price US$/oz 1,812
WAF’s AISC and all-in cost of US$1,021 and US$1,125 per ounce, respectively, compare favourably to the average gold sales price per ounce of US$1,812 for 2020.
For
per
sona
l use
onl
y

RECONCILIATION OF NON-AASB MEASURES TO FINANCIAL STATEMENTS
A reconciliation of ‘Adjusted Operating Cost per ounce and AISC per ounce is presented below:
Description
Financial Statement reference*
2020 $'000
Cost of sales P/L 145,148 (Less)/plus items: Depreciation Note 4 (23,985) Non-cash inventory movements Note 4 5,746 By-product credits N/A (458) Adjusted operating costs 126,451 plus items: Reclamation & remediation (accretion & amortisation) N/A 667 Corporate and technical services P/L 5,079 Share-based payments P/L 2,343 Capital development Note 10 25,582 Sustaining capital Note 10 11,527 Sustaining leases CF 2,949 Total All-in sustaining cost (AISC) 174,597 Gold sold (ounces) 118,093 Adjusted operating cost per ounce ($A/oz) 740 AISC per ounce (A$/oz) 1,478
* The financial Statement references in above table are abbreviated as follows: P/L = Consolidated Statement of Profit or Loss and Other Comprehensive Income CF = Consolidated Statement Of Cash Flows N/A= a direct cross reference to the Financial Statements is not available
GROUP FINANCIAL RESULTS
All amounts are in Australian dollars, unless otherwise stated.
Net profit after tax of $98,900,000 for the year compares favourably to the $4,334,000 net loss of the comparative year reflecting that Sanbrado commenced commercial production on 1 May 2020. Finance expenses of $26,139,000 were recorded in the year versus nil in the comparative period due to the accounting treatment to capitalise the Sanbrado project financing costs to mines under construction during whole of the prior year while Sanbrado was in the construction phase and to commence expensing them from the start of commercial production. Corporate and technical services cost of $5,079,000 in the year were higher than the $3,994,000 of the comparative year mainly due to higher salaries expenses.
The $194,755,000 increase in total assets during the year was partly offset by the $96,721,000 increase in total liabilities resulting in a $98,034,000 increase in net assets over the period. The increase in total assets mainly reflects the construction and operation of Sanbrado with a $86,886,000 increase in property, plant and equipment (“PPE”), a $15,255,000 increase in exploration and evaluation (“E&E”) assets, a $33,983,000 increase working capital (cash, plus trade and other receivables, plus inventories less trade and other payables less deferred revenue), and a $8,753,000 decrease in loans and borrowings, partially offset by a $42,468,000 increase in tax liabilities (current plus deferred tax liabilities). The PPE increase reflects construction of Sanbrado in the year. The increase in E&E assets mainly reflects acquisition costs for the Toega gold deposit. The working capital increase reflects the commencement of commercial gold production at Sanbrado in the year and the build-up of $19,275,000 of value-added tax receivables due from the Burkina Faso government. The decrease in loans and borrowings reflects US$25 million of drawings of the Taurus syndicated debt facility fully offset by US$25 million of facility repayments with the decrease being due to foreign exchange gains recorded on the USD loan balance. The increase in tax liabilities reflects the Group’s profit result for the year.
16|West African Resources Limited
For
per
sona
l use
onl
y

17|West African Resources Limited
RESOURCES AND RESERVES STATEMENT
SANBRADO MINERAL RESOURCES
The following two tables provide a year-on-year Mineral Resources comparison for Sanbrado, showing a 64.5% increase in Total Resources to 5.1 million ounces of gold.
Sanbrado 31 December 2020 Resources
Measured Resource Indicated Resource Inferred Resource Total Resource*
Deposit Cutoff g/t Tonnes Grade
g/t Contained Au
oz Tonnes Grade g/t
Contained Au oz Tonnes Grade
g/t Contained Au
oz Tonnes Grade g/t
Contained Au oz
M1 South 0.5 260,000 2.7 23,000 510,000 6.3 100,000 10,000 3.5 1,000 780,000 5.1 130,000 M1 South UG 1.5 410,000 15.1 200,000 1,200,000 14.1 540,000 140,000 4.4 20,000 1,700,000 13.6 760,000 M1 South Deeps 1.5 - - - - 2,100,000 12.4 820,000 2,100,000 12.4 820,000 M5 0.5 110,000 1.8 6,000 35,000,000 1.2 1,400,000 17,000,000 1.1 580,000 52,000,000 1.2 2,000,000 M1 North 0.5 140,000 1.6 7,000 640,000 2.1 42,000 400,000 2.0 26,000 1,200,000 2.0 75,000 M3 0.5 - - 170,000 2.0 11,000 190,000 1.5 9,000 360,000 1.7 20,000 Stockpile 1,000,000 1.2 38,000 - - - - 1,000,000 1.2 38,000 Toega 0.5 - - - - 22,000,000 1.9 1,300,000 22,000,000 1.9 1,300,000
Total* 1,900,000 4.4 270,000 37,000,000 1.7 2,100,000 41,000,000 2.1 2,800,000 81,000,000 2.0 5,100,000
Sanbrado 31 December 2019 Resources
Measured Resource Indicated Resource Inferred Resource Total Resource*
Deposit Cutoff g/t Tonnes Grade
g/t Contained Au
oz Tonnes Grade g/t
Contained Au oz Tonnes Grade
g/t Contained Au
oz Tonnes Grade g/t
Contained Au oz
M1 South 0.5 - - 850,000 6.4 178,000 50,000 5.2 5,000 900,000 6.3 183,000
M1 South UG 3 - - 1,000,000 21.9 697,000 300,000 11.2 117,000 1,300,000 19.5 810,000
M5 0.5 - - 36,650,000 1.2 1,470,000 14,600,000 1.1 520,000 51,000,000 1.2 2,000,000
M1 North 0.5 - - 750,000 2.0 49,000 500,000 2.0 32,000 1,250,000 2.0 81,000
M3 0.5 - - 150,000 2.0 11,000 200,000 1.5 9,000 350,000 1.8 20,000
Total* - - 39,400,000 1.9 2,405,000 15,650,000 1.3 683,000 55,000,000 1.7 3,100,000
*Due to rounding the totals in the above two tables may not precisely add up to, and ounces may not precisely calculate to, the amounts provided.
For
per
sona
l use
onl
y

West African Resources Limited|18
SANBRADO ORE RESERVES
The below two tables provide a year-on-year Ore Reserves comparison for Sanbrado.
Sanbrado 31 December 2020 Ore Reserve by Category
Mining Category Tonne Mt
Gold Grade g/t
Contained Gold koz*
Open Pit Proved 1.4 1.5 68
Provable 16.0 1.6 800
Underground Proved 0.046 8.6 130
Provable 1.6 9.2 480
Total Proved and Probable Ore Reserve* 20.0 2.3 1,500
Sanbrado 31 December 2019
Ore Reserve by Category
Mining Category Tonne Mt
Gold Grade g/t
Contained Gold koz*
Open Pit Proved 0.0 0.0 0
Provable 19.5 1.6 1,004
Underground Proved 0.0 0.0 0
Provable 2.0 10.2 646
Total Proved and Probable Ore Reserve* 21.6 2.4 1,650
*Due to rounding the totals in the above two tables may not precisely add up to, and ounces may not precisely calculate to, the amounts provided.
The changes to the Ore Reserve from December 2019 to December 2020 are comprised of:
• Depletion due to mining is 146,000 oz. • Re-estimation of the M1 South Mineral Resources and changes to cut-off grade led to a decrease in open pit Ore Reserves of
46,000 oz. • Redesign of the M5 final pit has increased Ore Reserves by 42,000 oz.
COMPETENT PERSONS STATEMENT
All information on the Sanbrado Gold Project Mineral Resources and Ore Reserves has been extracted from the ASX announcement related by West African on 9th March 2021 entitled “West African set for +1- years of +200,000oz average gold production”. West African confirms that it is not aware of any new information or data that materially affects the information included in the original ASX announcement and that all material assumptions and technical parameters underpinning the estimates in the ASX announcement continue to apply and have not materially changed. West African confirms that the form and context in which the Competent Persons findings are presented have not been materially modified form the original ASX announcement.
Information in this report that relates to Mineral Resources and Ore Reserves is based on information complied by Brian Wolfe (Mineral Resources with the exclusion of M1 South Deeps), Neil Silvio (M1 South Deeps Mineral Resources), Andrew Fox (M1 South underground Ore Reserves) and Stuart Cruickshanks (open pit Ore Reserves) who are Competent Persons. Mr Wolfe is an independent consultant and a Member of the Australian Institute of Geoscientists. Mr Silvio is a full-time employee of the company and a Member of the Australian Institute of Mining and Metallurgy. Mr Fox is an independent consultant and a Member of the Australian Institute of Mining and Metallurgy. Mr Cruickshanks is a full-time employee of the company and a Fellow of the Australian Institute of Mining and Metallurgy.
For
per
sona
l use
onl
y

West African Resources Limited|19
INFORMATION ON DIRECTORS AND COMPANY SECRETARY
The names of Directors who held office during or since the end of the year and until the date of this report are as follows. Directors were in office for this entire period unless otherwise stated.
CURRENT DIRECTORS
RICHARD HYDE BSc (Geology and Geophysics), MAusIMM, MAIG
LYNDON HOPKINS BSc (Geology), MAusIMM, MAIG
ROD LEONARD BSc and MSc (Metallurgical Engineering), MAusIMM, MSME
Executive Chairman and Chief Executive Officer
Executive Director and Chief Operating Officer
Lead Independent Director and Non-Executive Director
Richard Hyde is a geologist with 25 years’ experience in the mining industry and more than 19 years of experience in West Africa. Richard has managed large exploration and development projects for gold and base metals in Australia, Africa and Eastern Europe. He led the Company from incorporation in 2006, IPO in 2010, and through the discovery, development, and operation of the Sanbrado Gold Project. Mr Hyde is a founding shareholder and commenced as a Director in 2006.
Lyndon Hopkins is a geologist with more than 30 years’ experience in gold exploration, development and production in Australia and Africa. He was Chief Operating Officer of Equigold NL’s Ivory Coast operations and managed the in-country aspects of the project development and feasibility study for the Bonikro Gold Mine. More recently, he was Mine Manager for the construction of Regis Resources Ltd’s Rosemont Gold Mr Hopkins has been West African’s Chief Operating Officer since 2015 and joined the Board on 6 September 2019.
Rod Leonard is one of the founding Directors of Lycopodium (ASX: LYL) and served as an Executive Director of Lycopodium Limited from 2004 to 2019. He has more than 30 years’ experience in the operation and project development of major projects in North and South America, Africa, Asia and Australia. He has been involved in many aspects of the mineral processing industry from process development, feasibility studies, and design assignments as well as commissioning of projects. Mr Leonard joined the Board on 6 September 2019 and was appointed as Lead Independent Director on 2 February 2021.
Committee memberships: Technical
Committee memberships: Technical
Committee memberships: Remuneration, Technical and Audit
Other ASX listed directorship: Nil
Other ASX listed directorship: Nil
Other ASX listed directorship: Lycopodium Limited
Previous ASX listed directorship in the last 3 years: Nil
Previous ASX listed directorship in the last 3 years: Nil
Previous ASX listed directorship in the last 3 years: Nil
For
per
sona
l use
onl
y

West African Resources Limited|20
ELIZABETH (LIBBY) MOUNSEY BBus (Human Resources and Industrial Relations), MAICD
NIGEL SPICER BSc (Mining), CEng, MAusIMM
STEWART FINDLAY BCom (Accounting and Finance), MAICD
Non-Executive Director Non-Executive Director Non-Executive Director
Libby Mounsey has over 30 years’ experience in human resources and industrial relations across the mining, construction, health, fisheries, and aviation industries. Over the last 15 years she has held senior positions with resource companies in various stages of development through feasibility, construction and operations. Libby holds a Bachelor of Business (Human Resources & Industrial Relations) from Edith Cowan University and is a Member of the Australian Institute of Company Directors.
Nigel Spicer is a Mining Engineer with more than 40 years’ experience in mining and has held operational and executive management positions with mining companies in Africa, UK, Australia, Indonesia, PNG, Brazil and Philippines. He has extensive open pit and underground (narrow vein and bulk tonnage) mining experience across a range of commodities, including gold and copper. He has significant experience managing both owner and contract mining fleets and has been involved in the successful commissioning of a number of gold mines in Australia and Africa.
Stewart Findlay has over 25 years financial markets experience and has provided project finance (senior secured debt and corporate facilities), equity investments, commodity hedging arrangements and corporate advice to a large number of resource companies. He has held senior positions in the metals and mining divisions of Macquarie Bank and National Australia Bank. Stewart holds a Bachelor of Commerce (Accounting & Finance) from the University of New South Wales and is a Member of the Australian Institute of Company Directors.
Ms Mounsey joined the Board on 29 May 2020.
Mr Spicer joined the Board on 6 September 2019.
Mr Leonard joined the Board on 6 September 2019.
Committee memberships: Remuneration (Chair)
Committee memberships: Audit, Technical (Chair)
Committee memberships: Audit (Chair), Remuneration
Other ASX listed directorship: Nil
Other ASX listed directorship: Nil
Other ASX listed directorship: Nil
Previous ASX listed directorship in the last 3 years: Nil
Previous ASX listed directorship in the last 3 years: Nil
Previous ASX listed directorship in the last 3 years: Nil
PAST DIRECTORS WHO RETIRED DURING THE YEAR
MARK CONNELLY retired 29 May 2020 SIMON STORM retired 29 May 2020
COMPANY SECRETARY
PADRAIG O’DONOGHUE appointed as CFO on 4 June 2018 and as Company Secretary on 29 May 2020
For
per
sona
l use
onl
y

West African Resources Limited|21
PRINCIPAL ACTIVITIES
The principal activities of the Group during the year were development and operation of the Group’s key asset, the Sanbrado Gold Project (“Sanbrado”), located in Burkina Faso; and mineral exploration in Burkina Faso.
West African Resources Limited owns a 90% beneficial interest in Société des Mines de Sanbrado SA (“SOMISA”), which owns 100% of Sanbrado. The government of Burkina Faso retains a 10% equity interest in SOMISA.
DIVIDENDS
No dividends have been paid or declared since the start of the year and the Directors do not recommend the payment of a dividend in respect of the year.
SIGNIFICANT CHANGES IN THE STATE OF AFFAIRS
The Group completed construction and commenced commercial production at the Sanbrado gold project during the year.
SIGNIFICANT EVENTS AFTER BALANCE SHEET DATE
There has not arisen in the interval between the end of the reporting period and the date of this report, any item, transaction or event of a material and unusual nature likely, in the opinion of the Directors of the Company, to affect substantially the operations of the Group, the results of those operations or the state of affairs of the Group in subsequent financial years.
LIKELY DEVELOPMENTS AND EXPECTED RESULTS
In the opinion of the Directors, likely developments in and expected results of the operations of the Group have been disclosed in the “Operating and Financial Review” and “Significant Events After Balance Sheet Date” sections of this Annual Report. Disclosure of any further information regarding likely developments in the operations of the Group in future years and the expected results of those operations is likely to result in unreasonable prejudice to the Company.
For
per
sona
l use
onl
y
22|West African Resources Limited
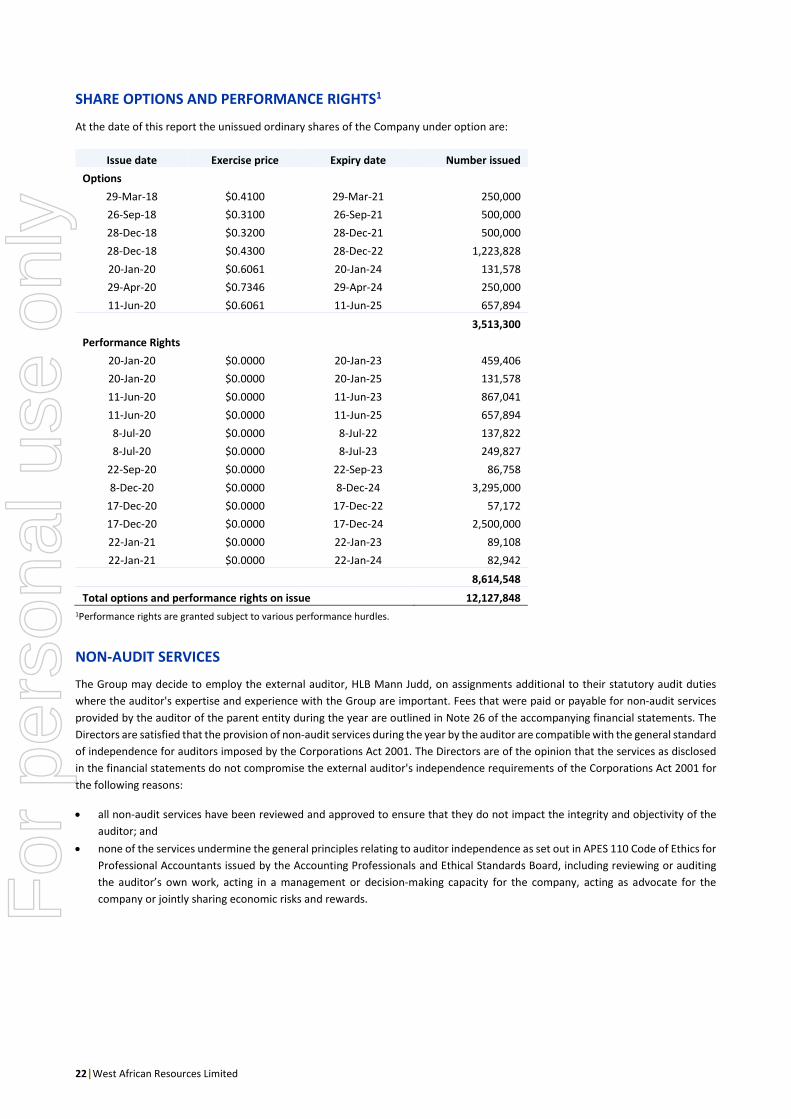
SHARE OPTIONS AND PERFORMANCE RIGHTS1
At the date of this report the unissued ordinary shares of the Company under option are:
Issue date Exercise price Expiry date Number issued Options
29-Mar-18 $0.4100 29-Mar-21 250,000 26-Sep-18 $0.3100 26-Sep-21 500,000 28-Dec-18 $0.3200 28-Dec-21 500,000 28-Dec-18 $0.4300 28-Dec-22 1,223,828 20-Jan-20 $0.6061 20-Jan-24 131,578 29-Apr-20 $0.7346 29-Apr-24 250,000 11-Jun-20 $0.6061 11-Jun-25 657,894
3,513,300 Performance Rights
20-Jan-20 $0.0000 20-Jan-23 459,406 20-Jan-20 $0.0000 20-Jan-25 131,578 11-Jun-20 $0.0000 11-Jun-23 867,041 11-Jun-20 $0.0000 11-Jun-25 657,894 8-Jul-20 $0.0000 8-Jul-22 137,822 8-Jul-20 $0.0000 8-Jul-23 249,827
22-Sep-20 $0.0000 22-Sep-23 86,758 8-Dec-20 $0.0000 8-Dec-24 3,295,000
17-Dec-20 $0.0000 17-Dec-22 57,172 17-Dec-20 $0.0000 17-Dec-24 2,500,000 22-Jan-21 $0.0000 22-Jan-23 89,108 22-Jan-21 $0.0000 22-Jan-24 82,942
8,614,548 Total options and performance rights on issue 12,127,848
1Performance rights are granted subject to various performance hurdles.
NON-AUDIT SERVICES
The Group may decide to employ the external auditor, HLB Mann Judd, on assignments additional to their statutory audit duties where the auditor's expertise and experience with the Group are important. Fees that were paid or payable for non-audit services provided by the auditor of the parent entity during the year are outlined in Note 26 of the accompanying financial statements. The Directors are satisfied that the provision of non-audit services during the year by the auditor are compatible with the general standard of independence for auditors imposed by the Corporations Act 2001. The Directors are of the opinion that the services as disclosed in the financial statements do not compromise the external auditor's independence requirements of the Corporations Act 2001 for the following reasons:
• all non-audit services have been reviewed and approved to ensure that they do not impact the integrity and objectivity of the auditor; and
• none of the services undermine the general principles relating to auditor independence as set out in APES 110 Code of Ethics for Professional Accountants issued by the Accounting Professionals and Ethical Standards Board, including reviewing or auditing the auditor’s own work, acting in a management or decision-making capacity for the company, acting as advocate for the company or jointly sharing economic risks and rewards.
For
per
sona
l use
onl
y

West African Resources Limited|23
DIRECTORS’ MEETINGS
The number of Directors’ meetings held during the year and the number of meetings attended by each director were as follows:
Director Directors’ Meetings
Audit Committee Meetings
Remuneration Committee Meetings
Technical Committee Meetings
A B A B A B A B Richard Hyde 7 7 - - - - 4 4 Lyndon Hopkins 7 7 - - - - 4 4 Rod Leonard 7 7 2 2 2 2 4 4 Nigel Spicer 7 7 2 2 - - 4 4 Stewart Findlay 5 5 1 1 2 2 - - Libby Mounsey 5 5 - - 2 2 - - Mark Connelly 3 3 1 1 - - - - Simon Storm 3 3 1 1 - - - - A – the number of meetings held whilst a Director or a committee member B – the number of meetings the Director or committee member attended
ROUNDING OF AMOUNTS
The Company is of a kind referred to in “ASIC Corporations (Rounding in Financial/Directors’ Report) Instrument 2016/191”, issued by the Australian Securities and Investments Commission, relating to the “rounding off” of amounts in the Directors’ Report and accompanying financial statements. Amounts in the Directors’ Report and accompanying financial statements have been rounded off in accordance with that Rounding Instrument to the nearest thousand dollars, or in certain noted cases, to the nearest dollar. All amounts are in Australian dollars, unless otherwise stated.
For
per
sona
l use
onl
y

West African Resources Limited|24
REMUNERATION REPORT (AUDITED) The Directors of West African Resources Limited present the Remuneration Report for the Group for the year ended 31 December 2020. This Remuneration Report forms part of the Directors’ Report and has been prepared in accordance with the Corporations Act 2001.
1 REMUNERATION REPORT OVERVIEW
This Remuneration Report details the remuneration arrangements for West African’s Key Management Personnel (“KMP”), being: • the Non-Executive Directors (“NEDs”); and • the Executive Directors and the other senior executives with authority for planning, directing and controlling the major
activities of the Group (together the “Executives”).
The KMP during the year are set out below:
Name Position Appointed Retired Non-Executive Directors Nigel Spicer Non-Executive Director September 2019 - Rod Leonard Non-Executive Director September 2019 - Stewart Findlay Non-Executive Director May 2020 - Libby Mounsey Non-Executive Director May 2020 - Mark Connelly Non-Executive Director June 2015 May 2020 Simon Storm Non-Executive Director & Company Secretary November 2007 May 2020 Executive Directors Richard Hyde Executive Chairman and Chief Executive Officer September 2006 - Lyndon Hopkins Executive Director and Chief Operating Officer September 2019 - Senior Executives Padraig O’Donoghue Chief Financial Officer and June 2018 - Company Secretary May 2020 - Matthew Wilcox Chief Development Officer September 2018 -
2 GROUP PERFORMANCE AND ITS LINK TO SHAREHOLDER RETURNS
The following table provides the earnings per share, dividends per share, net profit (loss) and share price of West African Resources at 31 December 2020 compared to the 4 previous reporting periods.
Period ending December 2020 December 2019 December 2018 June 2018 June 2017 Reporting period length 12 months 12 months 6 months 12 months 12 months EPS (cents) 11.3 (0.5) (0.5) (4.3) (3.0) Dividends (cents per share) Nil Nil Nil Nil Nil Net profit / loss ($’000) 98,900 (4,334) (3,551) (25,300) (14,324) Share price ($) 1.050 0.430 0.250 0.380 0.355
For
per
sona
l use
onl
y

West African Resources Limited|25
3 REMUNERATION GOVERNANCE
A. REMUNERATION COMMITTEE RESPONSIBILITY
The Remuneration Committee is a subcommittee of the Board. It is primarily responsible for making recommendations to the Board on: • Non-Executive Director (“NED”) remuneration; • Executive remuneration, including the executive incentive scheme framework and associated policies, targets, and awards;
and • matters related to Executive and NED recruitment, retention, performance measurement and termination.
The Remuneration Committee assesses the appropriateness of the nature and amount of remuneration of NEDs and Executives by reference to relevant employment market conditions with the overall objective of maximising stakeholder benefit from the retention and incentivization of a high performing director and executive team. Further information on the duties and responsibilities of the Remuneration Committee is contained in the Remuneration Committee Charter which is available on the Company’s website.
B. USE OF REMUNERATION ADVISORS
In 2018 the Remuneration Committee engaged BDO Remuneration and Reward Pty Ltd (“BDO”) to review and provide recommendations on the design of Group’s overall executive remuneration and incentive framework and policies. BDO was consulted again by the Remuneration Committee in 2020 to advise on the overall executive incentive framework and a special remuneration initiative by the Company to address identified retention risks of Executives and other key senior employees related to mining industry employment market conditions, COVID-19-related travel restriction, and the transition of Sanbrado from construction phase to operations phase. BDO’s recommendations were provided to the Remuneration Committee as an input into decision making and were used to assist the Committee and the Board in setting out remuneration packages suitable for the Company. The Board considered BDO’s recommendations along with other factors in making its remuneration decisions.
Both BDO and the Board were satisfied the advice received from BDO was free from undue influence from the KMP to whom the recommendations applied. The amount paid to BDO for remuneration advice in 2020 was $15,750 (2019: $Nil), excluding GST.
C. EXECUTIVE REMUNERATION POLICY
In determining executive remuneration, the Board aims to ensure that remuneration practices are: • competitive and reasonable, enabling the Company to attract and retain high calibre talent; • aligned to the Company’s performance, strategic and business objectives and the creation of shareholder value; • transparent and easily understood; and • acceptable to shareholders.
The Company’s approach to remuneration ensures that remuneration is competitive, performance focused, clearly links appropriate reward with desired business performance, and is simple to administer and understand by Executives and shareholders.
In line with the remuneration policy, remuneration levels are reviewed annually to ensure alignment to the market and the Company’s stated objectives.
For
per
sona
l use
onl
y
26|West African Resources Limited
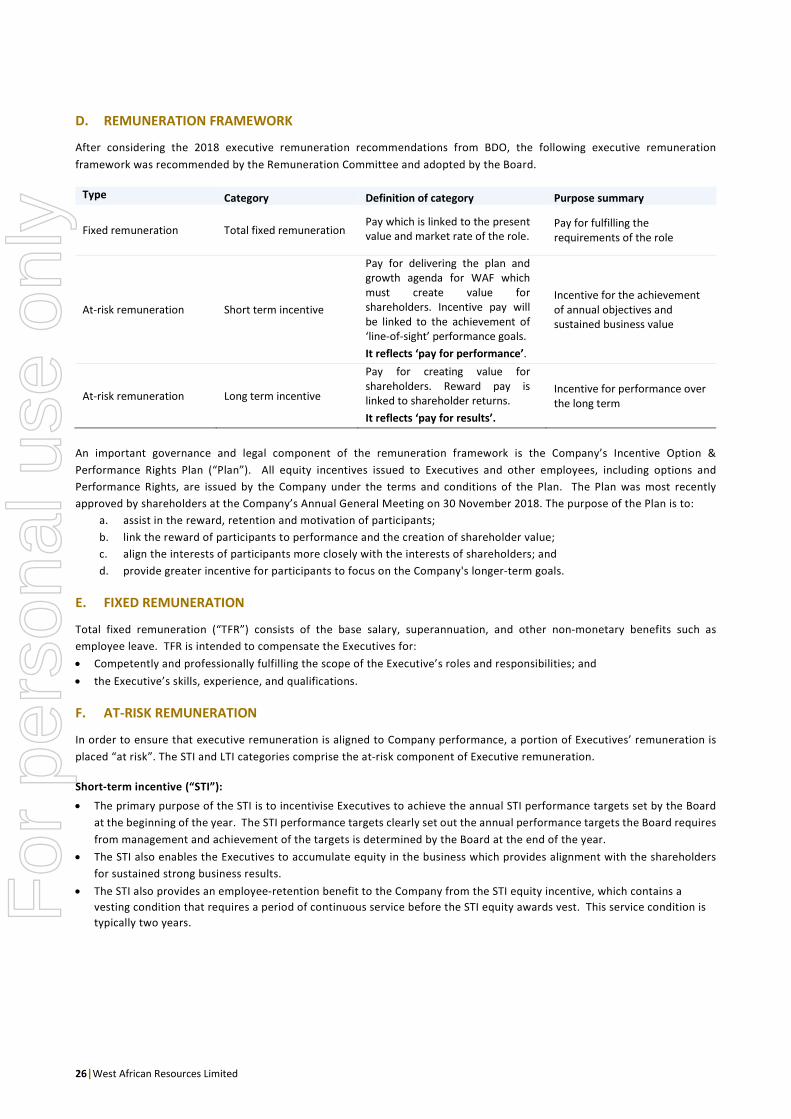
D. REMUNERATION FRAMEWORK
After considering the 2018 executive remuneration recommendations from BDO, the following executive remuneration framework was recommended by the Remuneration Committee and adopted by the Board.
Type Category Definition of category Purpose summary
Fixed remuneration Total fixed remuneration Pay which is linked to the present value and market rate of the role.
Pay for fulfilling the requirements of the role
At-risk remuneration Short term incentive
Pay for delivering the plan and growth agenda for WAF which must create value for shareholders. Incentive pay will be linked to the achievement of ‘line-of-sight’ performance goals. It reflects ‘pay for performance’.
Incentive for the achievement of annual objectives and sustained business value
At-risk remuneration Long term incentive
Pay for creating value for shareholders. Reward pay is linked to shareholder returns. It reflects ‘pay for results’.
Incentive for performance over the long term
An important governance and legal component of the remuneration framework is the Company’s Incentive Option & Performance Rights Plan (“Plan”). All equity incentives issued to Executives and other employees, including options and Performance Rights, are issued by the Company under the terms and conditions of the Plan. The Plan was most recently approved by shareholders at the Company’s Annual General Meeting on 30 November 2018. The purpose of the Plan is to:
a. assist in the reward, retention and motivation of participants; b. link the reward of participants to performance and the creation of shareholder value; c. align the interests of participants more closely with the interests of shareholders; and d. provide greater incentive for participants to focus on the Company's longer-term goals.
E. FIXED REMUNERATION
Total fixed remuneration (“TFR”) consists of the base salary, superannuation, and other non-monetary benefits such as employee leave. TFR is intended to compensate the Executives for: • Competently and professionally fulfilling the scope of the Executive’s roles and responsibilities; and • the Executive’s skills, experience, and qualifications.
F. AT-RISK REMUNERATION
In order to ensure that executive remuneration is aligned to Company performance, a portion of Executives’ remuneration is placed “at risk”. The STI and LTI categories comprise the at-risk component of Executive remuneration.
Short-term incentive (“STI”):
• The primary purpose of the STI is to incentivise Executives to achieve the annual STI performance targets set by the Board at the beginning of the year. The STI performance targets clearly set out the annual performance targets the Board requires from management and achievement of the targets is determined by the Board at the end of the year.
• The STI also enables the Executives to accumulate equity in the business which provides alignment with the shareholders for sustained strong business results.
• The STI also provides an employee-retention benefit to the Company from the STI equity incentive, which contains a vesting condition that requires a period of continuous service before the STI equity awards vest. This service condition is typically two years. F
or p
erso
nal u
se o
nly

West African Resources Limited|27
Long-term Incentive (“LTI”): • The LTI is designed to incentivise Executives in the creation of long-term shareholder value as evidenced by market and non-
market measures, by rewarding the Executives for the achievement of long-term performance targets set by the board at the beginning of the long-term performance period. The long-term targets are set out by the Board to provide clear and measurable direction as to what the Board and shareholders require from management by the end of the long-term performance period, which is typically a minimum of 3 years.
• The LTI also enables the Executives to accumulate equity in the business which provides alignment with the shareholders for sustained strong business results.
• The LTI also provides an employee-retention benefit to the Company from the LTI equity awards that contain a vesting condition that requires the Executive to remain in continuous service to the Company until the equity awards vest.
4 NON-EXECUTIVE DIRECTOR REMUNERATION
West African Resources Limited’s NED fee policy is designed to attract and retain high calibre Directors who can discharge the roles and responsibilities required in terms of good governance, strong oversight, independence and objectivity.
The Company’s constitution and the ASX listing rules specify that the NED fee pool limit shall be approved periodically by shareholders. The last determination at an AGM was an aggregate fee pool of $900,000 per year to ensure the Company can continue to attract and retain a high-performing Board of Directors with the appropriate overall skillset and composition.
The Remuneration Committee considered advice from BDO regarding the remuneration paid to NEDs. This advice was largely based on a review against comparable companies. NED remuneration consists solely of their director fees. There is no scheme to provide retirement benefits to NEDs other than statutory superannuation. Aside from being offered the option of receiving 30% of their director fees in the form of Performance Rights, NEDs do not participate in any performance related incentive programs.
Whilst WAF has no minimum shareholding policy for NEDs, the Board is of the view that it is beneficial for NEDs to hold an equity interest because it is an alignment with the Company’s shareholders. The NED fee structure for 2020 was either one of the following, at the election of each individual NED.
i) 100% of NED fees, being $75,000 annually, paid in cash; or ii) 70% of the above NED fees paid in cash and 30% paid in Performance Rights (30% equity component).
The 30% equity component of the structure has been approved, in respect of each participating Director, at a General Meeting of Shareholders of the Company. All of the Company’s NEDs elected to participate in the 30% equity component respect of their 2020 NED fees.
During 2020, the NED fees covered all activities associated with the Directors’ role on the Board and no additional fees were paid to NEDs for being a chairperson or member of a committee.
NEDs are entitled to be paid, as the Board determines, for additional services provided to the Group outside of their Director responsibilities. They may also be reimbursed for out-of-pocket expenses they incur as a result of their directorships.
For
per
sona
l use
onl
y

28|West African Resources Limited
5 EXECUTIVE REMUNERATION
A. EXECUTIVE REMUNERATION STRUCTURE
The remuneration framework provides for total remuneration for each Executive to be split between the fixed and at-risk components in the following portions:
Executive Fixed
remuneration
At-risk remuneration (STI and LTI)
Executive Chairman & CEO 42% 58% Chief Operating Officer 45% 55% Other Executives 50% 50%
The ‘at-risk’ apportionment for each Executive is comprised as follows, which shows a significant weighting towards the long-term (LTI) component, which in the Board’s view provides a balance of Executive incentivization that aligns with shareholders for both short-term results and long-term sustainable returns.
Executive
STI cash
incentive
STI equity
incentive
LTI equity
incentive Executive Chairman & CEO 14% 25% 61% Chief Operating Officer 17% 25% 58% Other Executives 20% 40% 40%
The proportions in the above tables are used as a guide by the Remuneration Committee to recommend to the Board the maximum of each component of at-risk remuneration that can be earned by the Executives each year. The equity incentives are awarded by the Board early in the year, with the number awarded calculated based on the 7-day VWAP of WAF shares at the beginning of the incentive performance period. The number of equity incentives that will ultimately vest and be available to be exercised by the Executives is determined by the Board based on the assessment and achievement of the vesting conditions set out when the equity incentives were awarded. The vesting conditions of the equity awards represent both market and non-market performance targets that the Board needs management to achieve in order to earn that portion of their at-risk remuneration.
The equity incentives also provide an employee-retention benefit to the Company, in addition to the performance target incentives. For example, the STI equity incentives include a 2-year continuous service vesting condition and the LTI equity incentives include a condition that the incentive will lapse if the Executive’s employment terminates before the board determines that the performance hurdle vesting conditions have been satisfied.
B. EXECUTIVE SERVICE AGREEMENTS
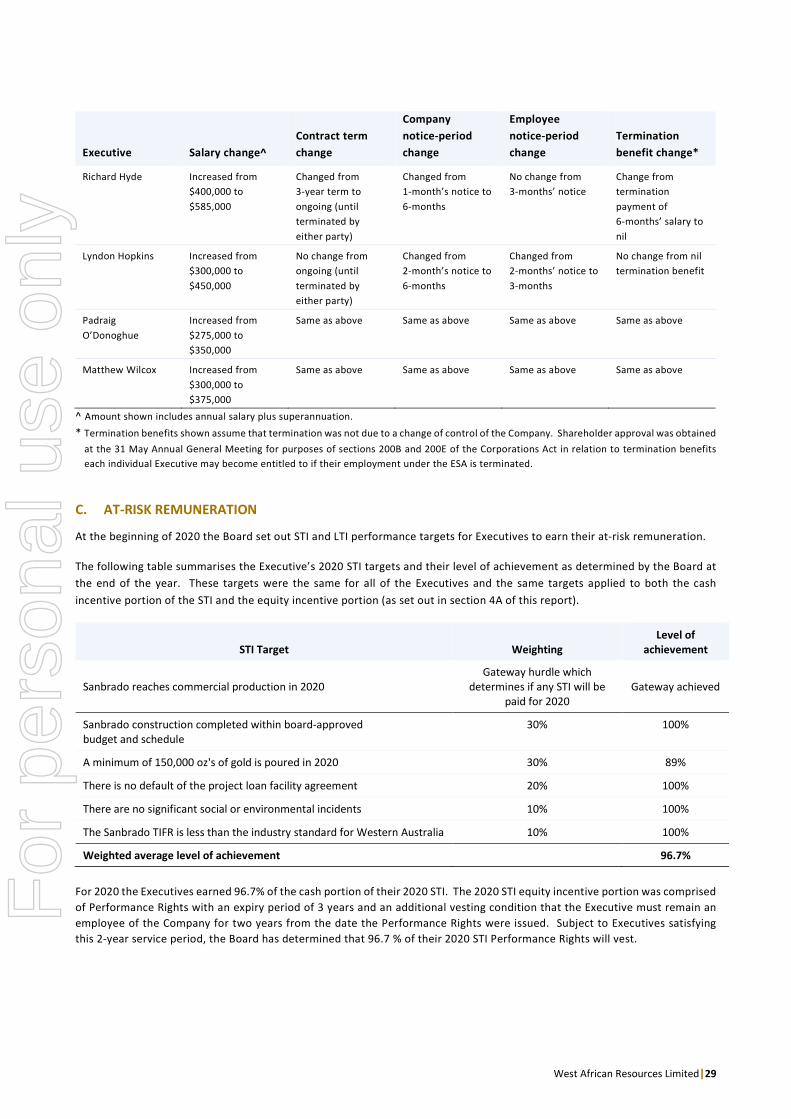
Commensurate with construction of the Sanbrado Gold Project and its transition to commercial production, the Remuneration Committee undertook a review of the Executives’ Service Agreements (“ESAs”) and TFRs. The review included external independent legal advice on the ESAs and comparisons of TFRs to similar peer companies. As 2020 was the first year of mining operations for WAF, the comparative peer group changed from being other exploration and development companies to WAF’s new mining-company peers. The review resulted in the Company entering into new ESAs with each of the Executives that included adjustments to their TFRs. The TRF changes took effect from 1 May 2020, being the date that Sanbrado commenced commercial production. The other provisions of the new ESAs took effect from 1 March 2020 for Richard Hyde and 1 April 2020 for the other Executives. Key changes to the Executives ESAs are shown in the following table.
For
per
sona
l use
onl
y
West African Resources Limited|29
Executive Salary change^ Contract term change
Company notice-period change
Employee notice-period change
Termination benefit change*
Richard Hyde Increased from $400,000 to $585,000
Changed from 3-year term to ongoing (until terminated by either party)
Changed from 1-month’s notice to 6-months
No change from 3-months’ notice
Change from termination payment of 6-months’ salary to nil
Lyndon Hopkins Increased from $300,000 to $450,000
No change from ongoing (until terminated by either party)
Changed from 2-month’s notice to 6-months
Changed from 2-months’ notice to 3-months
No change from nil termination benefit
Padraig O’Donoghue
Increased from $275,000 to $350,000
Same as above Same as above Same as above Same as above
Matthew Wilcox Increased from $300,000 to $375,000
Same as above Same as above Same as above Same as above
^ Amount shown includes annual salary plus superannuation. * Termination benefits shown assume that termination was not due to a change of control of the Company. Shareholder approval was obtained
at the 31 May Annual General Meeting for purposes of sections 200B and 200E of the Corporations Act in relation to termination benefits each individual Executive may become entitled to if their employment under the ESA is terminated.
C. AT-RISK REMUNERATION
At the beginning of 2020 the Board set out STI and LTI performance targets for Executives to earn their at-risk remuneration.
The following table summarises the Executive’s 2020 STI targets and their level of achievement as determined by the Board at the end of the year. These targets were the same for all of the Executives and the same targets applied to both the cash incentive portion of the STI and the equity incentive portion (as set out in section 4A of this report).
STI Target Weighting Level of
achievement
Sanbrado reaches commercial production in 2020 Gateway hurdle which
determines if any STI will be paid for 2020
Gateway achieved
Sanbrado construction completed within board-approved budget and schedule
30% 100%
A minimum of 150,000 oz's of gold is poured in 2020 30% 89%
There is no default of the project loan facility agreement 20% 100%
There are no significant social or environmental incidents 10% 100%
The Sanbrado TIFR is less than the industry standard for Western Australia 10% 100%
Weighted average level of achievement 96.7%
For 2020 the Executives earned 96.7% of the cash portion of their 2020 STI. The 2020 STI equity incentive portion was comprised of Performance Rights with an expiry period of 3 years and an additional vesting condition that the Executive must remain an employee of the Company for two years from the date the Performance Rights were issued. Subject to Executives satisfying this 2-year service period, the Board has determined that 96.7 % of their 2020 STI Performance Rights will vest.
For
per
sona
l use
onl
y
30|West African Resources Limited
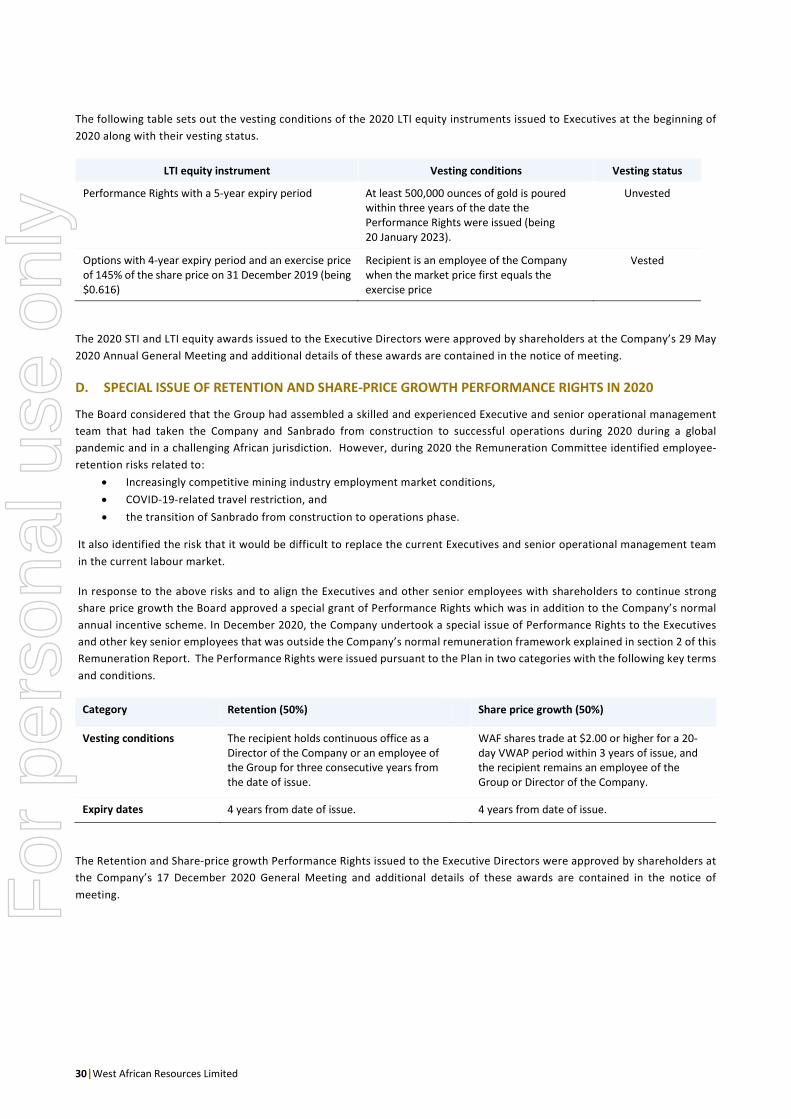
The following table sets out the vesting conditions of the 2020 LTI equity instruments issued to Executives at the beginning of 2020 along with their vesting status.
LTI equity instrument Vesting conditions Vesting status
Performance Rights with a 5-year expiry period At least 500,000 ounces of gold is poured within three years of the date the Performance Rights were issued (being 20 January 2023).
Unvested
Options with 4-year expiry period and an exercise price of 145% of the share price on 31 December 2019 (being $0.616)
Recipient is an employee of the Company when the market price first equals the exercise price
Vested
The 2020 STI and LTI equity awards issued to the Executive Directors were approved by shareholders at the Company’s 29 May 2020 Annual General Meeting and additional details of these awards are contained in the notice of meeting.
D. SPECIAL ISSUE OF RETENTION AND SHARE-PRICE GROWTH PERFORMANCE RIGHTS IN 2020
The Board considered that the Group had assembled a skilled and experienced Executive and senior operational management team that had taken the Company and Sanbrado from construction to successful operations during 2020 during a global pandemic and in a challenging African jurisdiction. However, during 2020 the Remuneration Committee identified employee-retention risks related to:
• Increasingly competitive mining industry employment market conditions, • COVID-19-related travel restriction, and • the transition of Sanbrado from construction to operations phase.
It also identified the risk that it would be difficult to replace the current Executives and senior operational management team in the current labour market.
In response to the above risks and to align the Executives and other senior employees with shareholders to continue strong share price growth the Board approved a special grant of Performance Rights which was in addition to the Company’s normal annual incentive scheme. In December 2020, the Company undertook a special issue of Performance Rights to the Executives and other key senior employees that was outside the Company’s normal remuneration framework explained in section 2 of this Remuneration Report. The Performance Rights were issued pursuant to the Plan in two categories with the following key terms and conditions.
Category Retention (50%) Share price growth (50%)
Vesting conditions The recipient holds continuous office as a Director of the Company or an employee of the Group for three consecutive years from the date of issue.
WAF shares trade at $2.00 or higher for a 20-day VWAP period within 3 years of issue, and the recipient remains an employee of the Group or Director of the Company.
Expiry dates 4 years from date of issue. 4 years from date of issue.
The Retention and Share-price growth Performance Rights issued to the Executive Directors were approved by shareholders at the Company’s 17 December 2020 General Meeting and additional details of these awards are contained in the notice of meeting.F
or p
erso
nal u
se o
nly

31|West African Resources Limited
6 KMP REMUNERATION OUTCOMES
The remuneration disclosures of the KMP for the year ended 31 December 2020 in accordance with Australian Accounting Standards are detailed in the following table.
Fixed remuneration Variable remuneration Performance based % of
remuneration
Cash salary
and fees Super
Annual and Long
Service Leave Total
Cash bonus Options
Performance Rights Total
Fixed remuneration
Remuneration linked to
performance $ $ $ $ $ $ $ $ % %
Executive Directors Richard 31 Dec 20 489,814 40,199 40,527 570,540 - 282,750 374,866 657,616 46% 54% Hyde 31 Dec 19 400,000 - - 400,000 - 122,881 158,147 281,028 59% 41% Lyndon 31 Dec 20 372,842 31,491 46,327 450,660 - 159,998 247,206 407,204 53% 47% Hopkins 31 Dec 19 273,973 26,027 52,588 352,588 - 39,979 97,188 137,167 72% 28% Non-Executive Directors Rod 31 Dec 20 45,993 6,507 - 52,500 - - 32,526 32,526 62% 38% Leonard 31 Dec 19 20,358 1,934 - 22,292 - - - - 100% 0% Nigel 31 Dec 20 52,500 - - 52,500 - 32,526 32,526 62% 38% Spicer 31 Dec 19 60,292 - - 60,292 - - - - 100% 0% Stewart 31 Dec 20 31,049 - - 31,049 - 1,118 1,118 97% 3% Findlay 31 Dec 19 - - - - - - - - - - Libby 31 Dec 20 73,311 3,814 - 77,125 - 1,118 1,118 99% 1% Mounsey* 31 Dec 19 - - - - - - - - - - Mark 31 Dec 20 21,593 - - 21,593 - 72,528 9,254 81,782 21% 79% Connelly 31 Dec 19 100,000 - - 100,000 - 175,068 - 175,068 36% 64% Simon 31 Dec 20 25,340 - - 25,340 - 20,837 9,254 30,091 46% 54% Storm 31 Dec 19 80,850 - - 80,850 - 55,951 - 55,951 59% 41% Ian 31 Dec 20 - - - - - - - - 0% 0% Kerr 31 Dec 19 70,445 6,507 - 76,952 - 58,940 - 58,940 57% 43% Executives Padraig 31 Dec 20 299,276 28,431 31,742 359,449 - 161,113 85,598 246,711 59% 41% O’Donoghue 31 Dec 19 251,142 23,858 32,132 307,132 - 48,540 29,131 77,672 80% 20% Matthew 31 Dec 20 366,692 34,836 33,735 435,263 51,778 58,970 173,647 284,395 60% 40% Wilcox 31 Dec 19 273,973 26,027 24,631 324,631 - 86,938 - 86,938 79% 21%
Total 31 Dec 20 1,778,410 145,278 152,331 2,076,019 51,778 756,196 967,113 1,775,087 54% 46% 31 Dec 19 1,531,033 84,353 109,351 1,724,737 - 588,297 284,466 872,764 66% 34%
*Cash salary and fees includes $46,076 paid to Just HR Pty Ltd, for whom Ms Mounsey is a director and shareholder, for HR consulting services on normal commercial terms whilst she was a Director of the Company
For
per
sona
l use
onl
y
West African Resources Limited|32
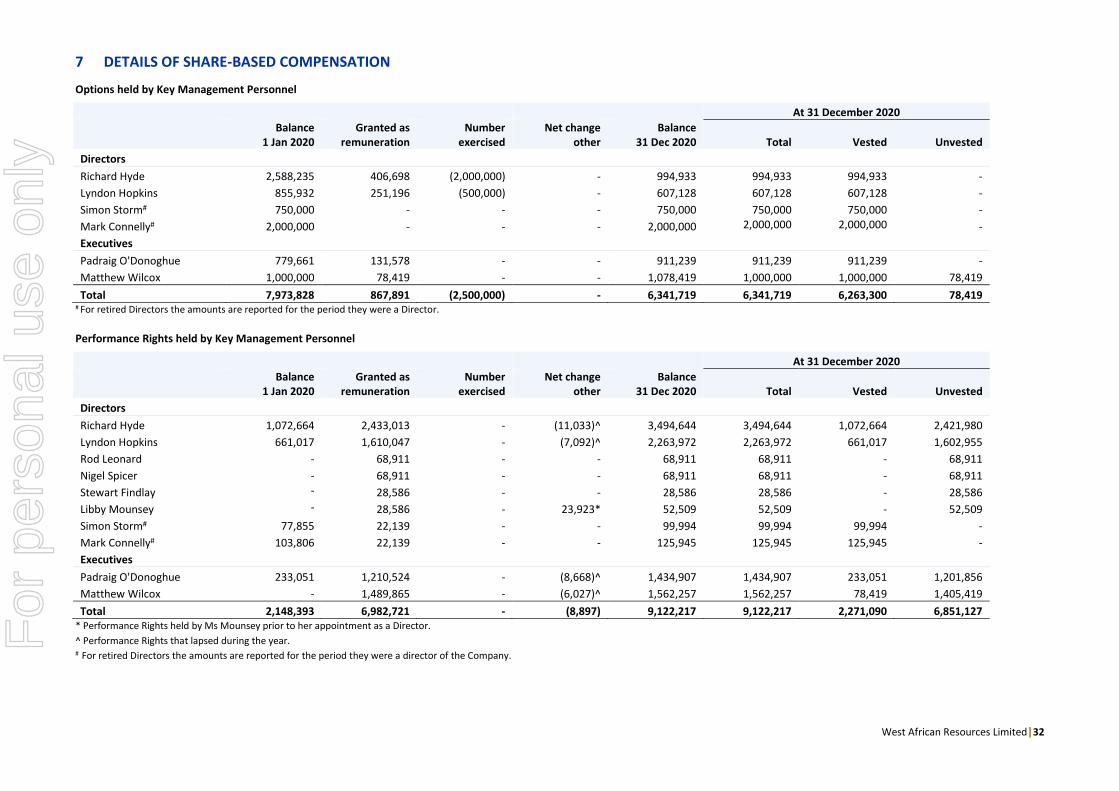
7 DETAILS OF SHARE-BASED COMPENSATION
Options held by Key Management Personnel
At 31 December 2020
Balance
1 Jan 2020 Granted as
remuneration Number
exercised Net change
other Balance
31 Dec 2020 Total Vested Unvested Directors Richard Hyde 2,588,235 406,698 (2,000,000) - 994,933 994,933 994,933 - Lyndon Hopkins 855,932 251,196 (500,000) - 607,128 607,128 607,128 - Simon Storm# 750,000 - - - 750,000 750,000 750,000 - Mark Connelly# 2,000,000 - - - 2,000,000 2,000,000 2,000,000 - Executives Padraig O'Donoghue 779,661 131,578 - - 911,239 911,239 911,239 - Matthew Wilcox 1,000,000 78,419 - - 1,078,419 1,000,000 1,000,000 78,419 Total 7,973,828 867,891 (2,500,000) - 6,341,719 6,341,719 6,263,300 78,419
# For retired Directors the amounts are reported for the period they were a Director.
Performance Rights held by Key Management Personnel
At 31 December 2020
Balance
1 Jan 2020 Granted as
remuneration Number
exercised Net change
other Balance
31 Dec 2020 Total Vested Unvested Directors Richard Hyde 1,072,664 2,433,013 - (11,033)^ 3,494,644 3,494,644 1,072,664 2,421,980 Lyndon Hopkins 661,017 1,610,047 - (7,092)^ 2,263,972 2,263,972 661,017 1,602,955 Rod Leonard - 68,911 - - 68,911 68,911 - 68,911 Nigel Spicer - 68,911 - - 68,911 68,911 - 68,911 Stewart Findlay - 28,586 - - 28,586 28,586 - 28,586 Libby Mounsey - 28,586 - 23,923* 52,509 52,509 - 52,509 Simon Storm# 77,855 22,139 - - 99,994 99,994 99,994 - Mark Connelly# 103,806 22,139 - - 125,945 125,945 125,945 - Executives Padraig O'Donoghue 233,051 1,210,524 - (8,668)^ 1,434,907 1,434,907 233,051 1,201,856 Matthew Wilcox - 1,489,865 - (6,027)^ 1,562,257 1,562,257 78,419 1,405,419 Total 2,148,393 6,982,721 - (8,897) 9,122,217 9,122,217 2,271,090 6,851,127
* Performance Rights held by Ms Mounsey prior to her appointment as a Director. ^ Performance Rights that lapsed during the year. # For retired Directors the amounts are reported for the period they were a director of the Company.
For
per
sona
l use
onl
y
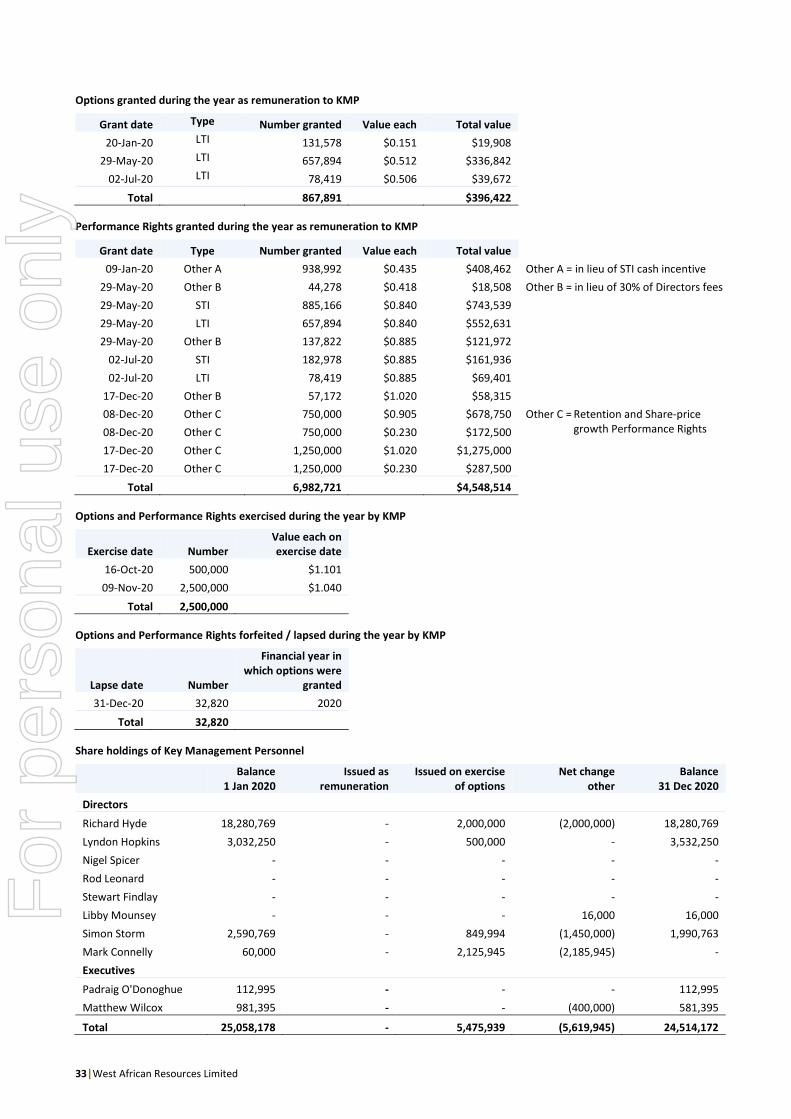
33|West African Resources Limited
Options granted during the year as remuneration to KMP
Grant date Type Number granted Value each Total value 20-Jan-20 LTI 131,578 $0.151 $19,908
29-May-20 LTI 657,894 $0.512 $336,842 02-Jul-20 LTI 78,419 $0.506 $39,672
Total 867,891 $396,422
Performance Rights granted during the year as remuneration to KMP
Grant date Type Number granted Value each Total value
09-Jan-20 Other A 938,992 $0.435 $408,462 Other A = in lieu of STI cash incentive 29-May-20 Other B 44,278 $0.418 $18,508 Other B = in lieu of 30% of Directors fees 29-May-20 STI 885,166 $0.840 $743,539
29-May-20 LTI 657,894 $0.840 $552,631
29-May-20 Other B 137,822 $0.885 $121,972
02-Jul-20 STI 182,978 $0.885 $161,936
02-Jul-20 LTI 78,419 $0.885 $69,401
17-Dec-20 Other B 57,172 $1.020 $58,315
08-Dec-20 Other C 750,000 $0.905 $678,750 Other C = Retention and Share-price 08-Dec-20 Other C 750,000 $0.230 $172,500 growth Performance Rights
17-Dec-20 Other C 1,250,000 $1.020 $1,275,000
17-Dec-20 Other C 1,250,000 $0.230 $287,500
Total 6,982,721 $4,548,514
Options and Performance Rights exercised during the year by KMP
Exercise date Number Value each on exercise date
16-Oct-20 500,000 $1.101 09-Nov-20 2,500,000 $1.040
Total 2,500,000
Options and Performance Rights forfeited / lapsed during the year by KMP
Lapse date Number
Financial year in which options were
granted 31-Dec-20 32,820 2020
Total 32,820
Share holdings of Key Management Personnel
Balance
1 Jan 2020 Issued as
remuneration Issued on exercise
of options Net change
other Balance
31 Dec 2020 Directors
Richard Hyde 18,280,769 - 2,000,000 (2,000,000) 18,280,769 Lyndon Hopkins 3,032,250 - 500,000 - 3,532,250 Nigel Spicer - - - - - Rod Leonard - - - - - Stewart Findlay - - - - - Libby Mounsey - - - 16,000 16,000 Simon Storm 2,590,769 - 849,994 (1,450,000) 1,990,763 Mark Connelly 60,000 - 2,125,945 (2,185,945) - Executives
Padraig O'Donoghue 112,995 - - - 112,995 Matthew Wilcox 981,395 - - (400,000) 581,395
Total 25,058,178 - 5,475,939 (5,619,945) 24,514,172
For
per
sona
l use
onl
y

West African Resources Limited|34
8 LOAN TO KMP
A loan was provided to Richard Hyde in a prior year to exercise 2,000,000 options at 14.5 cents. The loan carried interest at 5.5% per annum with a maturity date of 30 June 2021. Mr Hyde fully repaid the loan during the year and the balance outstanding at year end was nil (2019: $319,673).
End of Audited Remuneration Report.
AUDITOR INDEPENDENCE
Section 307C of the Corporations Act 2001 requires our auditors, HLB Mann Judd, to provide the Directors of the Company with an Independence Declaration in relation to the audit of the financial report. This written Auditor’s Independence Declaration is set out on page 76 and forms part of this Directors’ Report.
Signed in accordance with a resolution of the Directors.
RICHARD HYDE Executive Chairman & CEO Perth, 26 March 2021
For
per
sona
l use
onl
y

West African Resources Limited|35
CONSOLIDATED STATEMENT OF PROFIT OR LOSS AND OTHER COMPREHENSIVE INCOME FOR THE YEAR ENDED 31 DECEMBER 2020
2020 2019 Note $'000 $'000
Revenue from continuing operations 3 311,167 1,239 Cost of sales 4(a) (145,148) (179) Exploration and evaluation expenses (2,517) (2,236) Corporate and technical services (5,079) (3,994) Share-based payments (2,343) (533) Other expenses 4(b) (2,769) - Finance expenses (26,139) (5) Forex realised loss (806) (986) Forex unrealised gain 15,002 2,362 Profit (Loss) before tax 141,368 (4,334) Income tax expense 5 (42,468) - Profit (Loss) after tax 98,900 (4,334) OTHER COMPREHENSIVE INCOME: Items that may be reclassified subsequently to profit or loss:
Foreign currency translation differences for foreign operations (5,553) (1,213)
Other comprehensive loss, net of income tax (5,553) (1,213) Total comprehensive profit (loss) for the year 93,347 (5,547) Profit (loss) attributable to:
Owners of the parent 89,362 (4,275) Non-controlling interest 24 9,538 (59)
98,900 (4,334) Total comprehensive profit (loss) attributable to:
Owners of the parent 83,809 (5,488) Non-controlling interest 24 9,538 (59)
93,347 (5,547) Basic profit (loss) per share (cents per share) 6 11.3 (0.5) Diluted profit (loss) per share (cents per share) 6 11.2 (0.5)
The above Consolidated Statement of Profit or Loss and Other Comprehensive Income should be read in conjunction with the accompanying notes.
For
per
sona
l use
onl
y

West African Resources Limited|36
CONSOLIDATED STATEMENT OF FINANCIAL POSITION AS AT 31 DECEMBER 2020
2020 2019 Note $'000 $'000
CURRENT ASSETS Cash and cash equivalents 7 95,027 83,584 Trade and other receivables 8 22,635 1,501 Inventories 9 51,950 - Financial assets 39 38 Total current assets 169,651 85,123 NON-CURRENT ASSETS Property, plant and equipment 10 329,587 242,701 Right-of-use assets 11 16,220 8,135 Exploration and evaluation assets 13 15,255 - Total non-current assets 361,062 250,836 TOTAL ASSETS 530,713 335,959 CURRENT LIABILITIES Trade and other payables 14 40,479 13,890 Deferred revenue 23,957 - Loans and borrowings 15 132,664 22 Lease liabilities 16 4,581 1,866 Current tax payable 20,819 - Total current liabilities 222,500 15,778 NON-CURRENT LIABILITIES Loans and borrowings 15 93,669 235,063 Lease liabilities 16 11,225 6,609 Provisions 17 9,406 4,278 Deferred tax liabilities 18 21,648 - Total non-current liabilities 135,948 245,950 TOTAL LIABILITIES 358,448 261,728 NET ASSETS 172,265 74,231 EQUITY Issued capital 19 165,263 162,919 Reserves 20 3,851 7,373 Accumulated losses (3,885) (93,940) Equity attributable to owners of the parent 165,229 76,352 Non-controlling interest 7,036 (2,121) TOTAL EQUITY 172,265 74,231
The above Consolidated Statement of Financial Position should be read in conjunction with the accompanying notes.
For
per
sona
l use
onl
y

West African Resources Limited|37
CONSOLIDATED STATEMENT OF CHANGES IN EQUITY FOR THE YEAR ENDED 31 DECEMBER 2020
Issued capital Accumulated losses Foreign currency
translation reserve Share-based
payments reserve Non-controlling
interest Total $'000 $'000 $'000 $'000 $'000 $'000 Balance at 1 January 2019 161,947 (89,640) 670 6,874 (2,088) 77,763 Loss after tax - (4,275) - - (59) (4.334) Other comprehensive income for the period - - (1,213) - - (1,213) Total comprehensive profit (loss) for the period - (4,275) (1,213) - (59) (5,547) Shares issued during the year net of transaction costs 972 - - - - 972 Transfer to non-controlling interest - (26) - - 26 - Share-based payments - - - 1,043 - 1,042 Balance at 31 December 2019 162,919 (93,940) (543) 7,916 (2,121) 74,231 Balance at 1 January 2020 162,919 (93,940) (543) 7,916 (2,121) 74,231 Profit after tax - 89,362 - - 9,538 98,900 Other comprehensive profit (loss) for the period - - (5,553) - - (5,553) Total comprehensive profit (loss) for the period - 89,362 (5,553) - 9,538 93,347 Shares issued during the period net of transaction costs 2,344 - - - - 2,344 Transfer to non-controlling interest - 381 - - (381) - Share-based payments - - - 2,343 - 2,343 Reclassification of expired options - 312 - (312) - - Balance at 31 December 2020 165,263 (3,885) (6,096) 9,947 7,036 172,265
The above Consolidated Statement of Changes in Equity should be read in conjunction with the accompanying notes.
For
per
sona
l use
onl
y

West African Resources Limited|38
CONSOLIDATED STATEMENT OF CASH FLOWS FOR THE YEAR ENDED 31 DECEMBER 2020
2020 2019 Note $'000 $'000 OPERATING ACTIVITIES Receipts from customers 334,271 - Payments to suppliers and employees (186,702) (7,850) Interest received 681 1,266 Interest paid (576) (5) Other income 247 2 Net cash inflow (outflow) from operating activities 21(a) 147,921 (6,587) INVESTING ACTIVITIES Payments for property, plant and equipment (93,052) (54) Development expenditure - (200,027) Capitalised exploration and evaluation expenditure (16,404) - Capitalised interest paid during construction (7,738) (8,887) Repayment of loan by related party 290 - Net cash outflow from investing activities (116,904) (208,968) FINANCING ACTIVITIES Proceeds from issue of shares - 219 Proceeds from exercise of share options 2,369 770 Proceeds from borrowings 37,832 251,799 Repayment of borrowings (35,463) Payments for share issue costs (22) (17) Payments for lease liabilities (2,949) (1,130) Interest paid on borrowings (15,020) - Financing costs (7,369) - Transaction costs related to loans and borrowings (489) (19,077) Net cash inflow (outflow) from financing activities (21,111) 232,564 Net increase in cash held 9,906 17,009 Cash at the beginning of the financial period 83,584 66,355
Effect of exchange rate changes on the balance of cash held in foreign currencies 1,537 220 Cash at the end of the financial period 7 95,027 83,584
The above Consolidated Statement of Cash Flows should be read in conjunction with the accompanying notes.
For
per
sona
l use
onl
y

West African Resources Limited|39
NOTES TO THE CONSOLIDATED FINANCIAL STATEMENTS FOR THE YEAR ENDED 31 DECEMBER 2020 1 BASIS OF PREPARATION
A. BASIS OF ACCOUNTING
These financial statements are presented in Australian dollars and are general purpose financial statements which have been prepared in accordance with applicable accounting standards, the Corporations Act 2001 and mandatory professional reporting requirements in Australia (including the Australian equivalents of International Financial Reporting Standards). They have also been prepared on the basis of historical cost and do not take into account changing money values. The accounting policies are consistent with those of the previous financial period, unless otherwise stated.
Information for West African Resources Limited as an individual parent entity is provided in Note 31.
B. ROUNDING OF AMOUNTS
The Company is of a kind referred to in Rounding Instrument 2016/191, issued by the Australian Securities and Investments Commission, relating to the “rounding off” of amounts in the financial statements. Amounts in the financial statements have been rounded off in accordance with that Rounding Instrument to the nearest thousand dollars ($000’s), unless otherwise stated.
C. PRINCIPLES OF CONSOLIDATION
The consolidated financial statements comprise the financial statements of the Group. The financial statements of the subsidiaries are prepared for the same reporting period as the parent company, using consistent accounting policies.
All intercompany balances and transactions, including unrealised profits arising from intra-group transactions, have been eliminated in full. Unrealised losses are eliminated unless costs cannot be recovered. Subsidiaries are consolidated from the date on which control is transferred to the Group and cease to be consolidated from the date on which control is transferred out of the Group. Where there is loss of control of a subsidiary, the consolidated financial statements include the results for the part of the reporting period during which West African Resources Limited has control.
D. CHANGE IN PRESENTATION OF COMPARATIVES
New expense classification components have been introduced into the Consolidated Statement of Profit and Loss and Other Comprehensive Income to improve understanding of the profit and loss results of the Sanbrado mining operation that commenced commercial production in the reporting period. Accordingly, certain expenses in the comparative period have been reclassified from the presentation component used in the 31 December 2019 financial statements as follows:
Prior to change in presentation New classification component 31 December 2019 $'000
Personnel costs 2,918 Cost of sales Consultants 628 Cost of sales Contractors 16 Cost of sales Occupancy costs 71 Cost of sales Legal costs 22 Cost of sales Travel and accommodation 318 Corporate and technical services Listed entity costs 194 Corporate and technical services Overheads 370 Corporate and technical services Interest expense - lease 5 Finance expenses Depreciation expense 184 Cost of sales Also, prior to the change in presentation $1,452,000 of ‘exploration and evaluation expenditure’ was shown as a separate line in the Consolidated Statement of Cash Flows. These exploration and evaluation expenditures are now included in the line item for ‘payments to suppliers and employees’ in the comparative period of the Consolidated Statement of Cash Flows.
For
per
sona
l use
onl
y

40|West African Resources Ltd
1 BASIS OF PREPARATION (CONTINUED)
E. ADOPTION OF NEW AND REVISED STANDARDS
The Directors have reviewed all of the new and revised Standards and Interpretations on issue not yet adopted by the Group for the period ended 31 December 2020. The Group has adopted all the new or amended Accounting Standards and Interpretations issued by the Australian Accounting Standard’s Board that are mandatory to the current reporting period.
Any new or amended Accounting Standards or Interpretations that are not yet mandatory have not been early adopted.
F. SIGNIFICANT ACCOUNTING JUDGEMENTS AND KEY ESTIMATES
The preparation of this financial report requires management to make judgements, estimates and assumptions that affect the application of accounting policies and the reported amounts of assets, liabilities, income and expenses. Actual results may differ from these estimates.
In preparing this financial report, the following key judgements, estimates and assumptions were made by management in applying the Group’s accounting policies:
Date of commencement of commercial production Setting the pre-determined levels of operating capacity intended by management for deciding when development of the Sanbrado gold project was completed and production started. This date is known as the ‘date of commencement of commercial production’ and is used for establishing when project costs of an operating nature are no longer capitalised to mines under construction and when depreciation and amortisation of the associated assets commences.
Accounting for leases • Assessing contracts to determine whether they contain a lease and if so, whether they also contain non-lease components. • Estimating the useful lives and depreciation rates of right-of-use assets. • Setting the discount rate of the lease contracts, which is used in the calculation of lease liabilities.
Exploration and evaluation costs On a case-by-case basis, assessing whether the acquisition costs of particular mineral properties will be expensed or whether it is appropriate to capitalised them as exploration and evaluation (E&E) assets.
Valuation of rehabilitation provision • Estimating the future cash flows to settle mine restoration obligations. • Setting the discount rate used in the calculation of the rehabilitation provision.
Property, plant and equipment • Setting the useful lives and depreciation rates for plant and equipment. • Assessing assets for impairment of their carrying value.
Group consolidation Setting the functional currency used for each entity in the Group.
Income tax • Interpreting tax legislation in a number of countries. • Estimating future tax outcomes.
Classification of borrowings Estimating future cash flows which impact on the classification of the syndicated debt facility as current versus non-current borrowings.
Share-based payments • Estimating the fair value of the share-based payments at the date at which they are granted. • Estimating number of share-based payment awards to employees that will ultimately vest at each reporting date.
Value added tax receivable Estimating the amount recoverable and timing of recovery of VAT receivable from the Burkina Faso government.
For
per
sona
l use
onl
y

West African Resources Limited|41
1 BASIS OF PREPARATION (CONTINUED)
G. REVENUE
The Group primarily generates revenue from the sale of gold bullion. This sales revenue is recognised when ownership of the metal is transferred to the buyer. This typically occurs when physical bullion, from a contracted sale, is transferred from the Group’s metal account to the metal account of the buyer.
Where the Group receives provisional payments from buyers in advance of transfer of ownership, the Group classifies the provisional payment as a deferred revenue liability until ownership is transferred and the associated revenue is recognised.
H. INCOME TAXES
The income tax expense or benefit for the period is based on the profit or loss for the year adjusted for any non-assessable or disallowed items. It is calculated using tax rates that have been enacted or are substantially enacted as at balance date.
Deferred tax is provided on all temporary differences arising between the tax bases of assets and liabilities and their carrying amounts in the financial statements. No deferred income tax will be recognised from the initial recognition of an asset or liability, excluding a business combination, where there is no effect on accounting or taxation profit or loss.
Deferred income tax assets are recognised to the extent that it is probable that the future tax profits will be available against which deductible temporary differences will be utilised. The amount of the benefits brought to account or which may be realised in the future is based on the assumption that no adverse change will occur in the income taxation legislation and the anticipation that the economic unit will derive sufficient future assessable income to enable the benefits to be realised and comply with the conditions of deductibility imposed by law.
I. OTHER TAXES
Revenues, expenses and assets are recognised net of the amount of value added taxes (“VAT”) except: • when the VAT incurred on a purchase of goods and services is not recoverable from the taxation authority, in which case the VAT
is recognised as part of the cost of acquisition of the asset or as part of the expense item as applicable; and • receivables and payables, which are stated with the amount of VAT included.
Australian goods and services tax (“GST”) is a type of VAT.
The net amount of VAT recoverable from, or payable to, the taxation authority is included as part of receivables or payables in the statement of financial position.
Cash flows are included in the statement of cash flows on a gross basis and the VAT component of cash flows arising from investing and financing activities, which is recoverable from, or payable to, the taxation authority is classified as operating cash flows.
Commitments and contingencies are disclosed net of the amount of VAT recoverable from, or payable to, the taxation authority.
J. CASH AND CASH EQUIVALENTS
Cash comprises cash at bank and in hand. Cash equivalents are short term, highly liquid investments that are readily convertible to known amounts of cash and which are subject to an insignificant risk of changes in value.
For the purposes of the Statement of Cash Flows, cash and cash equivalents consist of cash and cash equivalents as defined above.
K. INVENTORIES
Ore stockpiles, gold in circuit and finished goods (being gold doré and gold bullion) inventories are valued at the lower of weighted average cost and net realisable value. Costs include direct production costs and an appropriate allocation of attributable overheads. Depreciation and amortisation attributable to production of the inventory are also included in the cost of inventory.
Inventories of consumable supplies and spare parts are valued at the lower of weighted average cost and net realisable value. Net realisable value is the estimated selling price in the ordinary course of business less estimated cost of completion, and the estimated costs necessary to make the sale.
For
per
sona
l use
onl
y

42|West African Resources Ltd
1 BASIS OF PREPARATION (CONTINUED)
L. PROPERTY, PLANT AND EQUIPMENT
Each class of property, plant and equipment (“PP&E”) is carried at cost or fair value, less where applicable, any accumulated depreciation and impairment losses. The cost of an item of PP&E consists of the purchase price, applicable borrowing costs, any costs directly attributable to bringing the asset to the location and condition necessary for its intended use, and an initial estimate of the costs of dismantling and removing the item and restoring the site on which it is located.
The carrying amount of the PP&E is reviewed at each balance sheet date to assess whether there is any indication that the assets may be impaired. If any such indication exists, then the recoverable amount of the assets is estimated. An asset’s carrying amount is written down immediately to its recoverable amount if the asset’s carrying amount is greater than the estimated recoverable amount.
Gains and losses on disposal of PP&E are determined by comparing proceeds with the carrying amount. These gains and losses are included in the statement of profit or loss and other comprehensive income.
Mines under construction
Expenditure on the construction, installation, and completion of infrastructure facilities for mining properties is capitalised to mines under construction. The expenditure includes direct costs of construction, drilling costs and removal of overburden to gain access to the ore, borrowing costs capitalised during construction and an appropriate allocation of attributable overheads. The capitalised amount is net of proceeds from the sale of ore extracted during the construction phase to the extent that it is considered integral to the development of the mine. Any costs incurred in testing the assets to determine if they are functioning as intended, are capitalised, net of any proceeds received from selling any product produced while testing. Where these proceeds exceed the cost of testing, any excess is recognised in the statement of profit or loss and other comprehensive income.
After reaching pre-determined levels of operating capacity intended by management, known as ‘commencement of commercial production’, the assets included in mines under construction are transferred out of mines under construction to their appropriate PP&E category and depreciation and amortisation commence.
Mine development assets
Mine development represents expenditure incurred in relation to overburden removal based on underlying mining activities and related mining data and construction costs and underground development incurred by, or on behalf of, the Group previously accumulated and carried forward in relation to mineral properties in which mining has now commenced. Such expenditure comprises direct costs and an allocation of directly related overhead expenditure.
All expenditure incurred prior to the commencement of production from each development property is carried forward to the extent to which recoupment out of future revenue from the sale of production, or from the sale of the property, is reasonably assured. When further development expenditure is incurred in respect of a mine property after the commencement of commercial production, such expenditure is carried forward as part of the cost of the mine property only when future economic benefits are reasonably assured, otherwise the expenditure is classified as part of the cost of production and expensed as incurred. Such capitalised development expenditure is added to the total carrying value of the mine development being amortised.
Mine development costs (as transferred from exploration and evaluation and/or mines under construction) are amortised on a units-of-production basis over the life of mine to which they relate. In applying the units of production method, amortisation is calculated using the expected total contained ounces as determined by the life of mine plan specific to that mine property. For development expenditure undertaken during production, the amortisation rate is based on the ratio of total development expenditure (incurred and anticipated) over the expected total contained ounces as estimated by the relevant life of mine plan to achieve a consistent amortisation rate per ounce. The rate per ounce is typically updated annually as the life of mine plans are revised.
For
per
sona
l use
onl
y
West African Resources Limited|43
1 BASIS OF PREPARATION (CONTINUED)
L. PROPERTY, PLANT AND EQUIPMENT (CONTINUED)
Depreciation
Depreciation of non-mine specific PP&E is calculated using the straight-line method to allocate their cost or revalued amounts, net of their residual values, over their estimated useful lives determined as follows:
Land and buildings 3 to 10 years Office equipment 3 to 10 years Plant and equipment 3 to 10 years Light vehicles 3 years
The assets’ residual values and useful lives are reviewed and adjusted if appropriate, at each balance sheet date.
M. EXPLORATION AND EVALUATION
Mineral exploration and evaluation (“E&E”) costs are expensed as incurred. Acquisition costs related to mineral properties will normally be expensed but will be assessed on a case by case basis and if appropriate may be capitalised. These acquisition costs are only carried forward as an E&E asset to the extent that they are expected to be recouped through the successful development or sale of the mineral property. Accumulated acquisition costs in relation to abandoned mineral properties are written off in full against profit or loss in the year in which the decision to abandon is made.
Where a decision has been made to proceed with development in respect of a particular area of interest, the associated E&E assets are transferred to PP&E and all future E&E costs for the area of interest are classified as PP&E within either mines under construction or mine development assets, as appropriate.
N. RECOVERABLE AMOUNT OF NON-CURRENT ASSETS
The carrying amounts of non-current assets are reviewed annually to ensure they are not in excess of the recoverable amounts from those assets. The recoverable amount is assessed on the basis of the expected net cash flows, which will be received from the assets employed and subsequent disposal. The expected net cash flows have been or will be discounted to present values in determining recoverable amounts.
O. TRADE AND OTHER ACCOUNTS PAYABLE
Trade and other accounts payable represent the principal amounts outstanding at balance date, plus, where applicable, any accrued interest.
P. BORROWINGS
Borrowings are initially recognised at fair value, net of transaction costs incurred. Borrowings are subsequently measured at amortised cost. Any difference between the proceeds (net of transaction costs) and the redemption amount is recognised in profit or loss over the period of the borrowings using the effective interest method. Fees paid on the establishment of loan facilities are recognised as transaction costs of the loan to the extent that it is probable that some or all of the facility will be drawn down. In this case, the fee is deferred until the draw down occurs. To the extent there is no evidence that it is probable that some or all of the facility will be drawn down, the fee is capitalised as a prepayment for liquidity services and amortised over the period of the facility to which it relates.
Borrowings are removed from the statement of financial position when the obligation specified in the contract is discharged, cancelled or expired. The difference between the carrying amount of a financial liability that has been extinguished or transferred to another party and the consideration paid, including any non-cash assets transferred or liabilities assumed, is recognised in profit or loss as other income or finance costs.
Borrowings are classified as current liabilities unless the Group has an unconditional right to defer settlement of the liability for at least 12 months after the reporting period.
For
per
sona
l use
onl
y

44|West African Resources Ltd
1 BASIS OF PREPARATION (CONTINUED)
Q. LEASE LIABILITIES
Lease liabilities
A lease liability is recognised at the commencement date of a lease. The lease liability is initially recognised at the present value of the lease payments to be made over the term of the lease, discounted using the interest rate implicit in the lease or, if that rate cannot be readily determined, the consolidated entity's incremental borrowing rate. Lease payments comprise of fixed payments less any lease incentives receivable, variable lease payments that depend on an index or a rate, amounts expected to be paid under residual value guarantees, exercise price of a purchase option when the exercise of the option is reasonably certain to occur, and any anticipated termination penalties. The variable lease payments that do not depend on an index or a rate are expensed in the period in which they are incurred.
Lease liabilities are measured at amortised cost using the effective interest method. The carrying amounts are remeasured if there is a change in the following: future lease payments arising from a change in an index or a rate used; residual guarantee; lease term; certainty of a purchase option and termination penalties. When a lease liability is remeasured, an adjustment is made to the corresponding right-of use asset, or to profit or loss if the carrying amount of the right-of-use asset is fully written down.
Finance costs
Finance costs attributable to qualifying assets are capitalised as part of the asset. All other finance costs are expensed in the period in which they are incurred.
Right-of-use assets
Right-of-use asset is recognised at the commencement date of a lease. The right-of-use asset is measured at cost, which comprises the initial amount of the lease liability, adjusted for, as applicable, any lease payments made at or before the commencement date net of any lease incentives received, any initial direct costs incurred, and, except where included in the cost of inventories, an estimate of costs expected to be incurred for dismantling and removing the underlying asset, and restoring the site or asset.
Right-of-use assets are depreciated on a straight-line basis over the unexpired period of the lease or the estimated useful life of the asset, whichever is the shorter. Where the consolidated entity expects to obtain ownership of the leased asset at the end of the lease term, the depreciation is over its estimated useful life. Right-of use assets are subject to impairment or adjusted for any remeasurement of lease liabilities.
The consolidated entity has elected not to recognise a right-of-use asset and corresponding lease liability for short-term leases with terms of 12 months or less and leases of low-value assets. Lease payments on these assets are expensed to profit or loss as incurred.
R. ISSUED CAPITAL
Ordinary Shares are classified as equity.
Incremental costs directly attributable to the issue of new shares or options are shown in equity as a deduction, net of tax, from the proceeds. Incremental costs directly attributable to the issue of new shares or options, or for the acquisition of a business, are included in the cost of the acquisition as part of the purchase consideration.
S. EMPLOYEE BENEFITS
Provision is made for employee benefits accumulated as a result of employees rendering services up to the reporting date. These benefits include wages and salaries, annual leave, and long service leave.
Liabilities arising in respect of wages and salaries, annual leave and any other employee benefits expected to be settled within 12 months of the reporting date are measured at their nominal amounts based on remuneration rates which are expected to be paid when the liability is settled. All other employee benefit liabilities are measured at the present value of the estimated future cash outflow to be made in respect of services provided by employees up to the reporting date. In determining the present value of future cash outflows, the market yield as at the reporting date on national government bonds, which have terms to maturity approximating the terms of the related liability, are used.
For
per
sona
l use
onl
y

West African Resources Limited|45
T. SHARE-BASED PAYMENTS
The Group provides benefits to employees (including Directors) of the Group in the form of share-based payment transactions, whereby employees render services in exchange for shares or rights over shares (“equity-settled transactions”). The cost of these equity-settled transactions with employees is measured by reference to the fair value at the date at which they are granted. The fair value is determined by a valuation using Black-Scholes or Binomial option pricing models.
The cost of equity-settled transactions is recognised, together with a corresponding increase in equity, over the period in which the performance conditions are fulfilled, ending on the date on which the relevant employees become fully entitled to the award (“vesting date”). The cumulative expense recognised for equity-settled transactions at each reporting date until vesting date reflects (i) the extent to which the vesting period has expired and (ii) the estimated number of awards that will ultimately vest. This estimate is formed based on the best available information at balance date. No adjustment is made for the likelihood of market performance conditions being met as the effect of these conditions is included in the determination of fair value at grant date.
No expense is recognised for awards that do not ultimately vest, except for awards where vesting is conditional upon a market condition. Where an equity-settled award is cancelled, it is treated as if it had vested on the date of cancellation, and any expense not yet recognised for the award is recognised immediately. However, if a new award is substituted for the cancelled award and designated as a replacement award on the date that it is granted, the cancelled and new award are treated as if they were a modification of the original award.
U. FOREIGN CURRENCY TRANSLATION
Both the functional and presentation currency of West African Resources Limited and its Australian subsidiary are Australian dollars. Each entity in the Group determines its own functional currency and items included in the financial statements of each entity are measured using that functional currency.
Transactions in foreign currencies are initially recorded in the functional currency by applying the exchange rates ruling at the date of the transaction. Monetary assets and liabilities denominated in foreign currencies are retranslated at the rate of exchange ruling at the balance date.
All exchange differences in the consolidated financial report are taken to profit or loss with the exception of differences on foreign currency borrowings that provide a hedge against a net investment in a foreign entity. These are taken directly to equity until the disposal of the net investment, at which time they are recognised in profit or loss.
Tax charges and credits attributable to exchange differences on those borrowings are also recognised in equity.
Non-monetary items that are measured in terms of historical cost in a foreign currency are translated using the exchange rate as at the date of the initial transaction.
Non-monetary items measured at fair value in a foreign currency are translated using the exchange rates at the date when the fair value was determined.
The functional currency of the foreign subsidiaries, Wura Resources Pty Ltd SARL, West African Resources Development SARL, Tanlouka SARL and Société des Mines de Sanbrado SARL, is the Communaute Financière Africaine Franc (CFA). The functional currency of the foreign subsidiary, Channel Resources Ltd is the Canadian Dollar (CAD). The functional currency of the foreign subsidiaries, Channel Resources (Cayman I) Ltd and Channel Resources (Cayman II) Ltd is the United States Dollar (USD).
As at the reporting date the assets and liabilities of the subsidiaries are translated into the presentation currency of West African Resources Limited at the rate of exchange ruling at the balance date and their income and expenses are translated at the average exchange rate for the year.
The exchange differences arising on the translation are taken directly to a separate component of equity, being recognised in the foreign currency translation reserve.
On disposal of a foreign entity, the deferred cumulative amount recognised in equity relating to that particular foreign operation is recognised in profit or loss.
For
per
sona
l use
onl
y
46|West African Resources Ltd
1 BASIS OF PREPARATION (CONTINUED)
V. FINANCIAL ASSETS
Financial assets are classified, at initial recognition, and subsequently measured at amortised cost, at fair value through other comprehensive income (OCI), or fair value through profit or loss (FVTPL).
The classification of financial assets at initial recognition that are debt instruments depends on the financial asset’s contractual cash flow characteristics and the Group’s business model for managing them. With the exception of trade receivables that do not contain a significant financing component or for which the Group has applied the practical expedient, the Group initially measures a financial asset at its fair value plus, in the case of a financial asset not at fair value through profit or loss, transaction costs. Trade receivables that do not contain a significant financial component or for which the Group has applied the practical expedient for contracts that have a maturity of one year or less, are measured at the transaction price determined under AASB 15.
In order for a financial asset to be classified and measured at amortised cost of fair value through OCI, it needs to give rise to cash flows that are ‘solely payments of principal and interest (SPPI)’ on the principal amount outstanding. This assessment is referred to as the SPPI test and is performed at an instrument level.
The Group’s business model for managing financial assets refers to how it manages its financial assets in order to generate cash flows. The business model determines whether cash flows will result from collecting contractual cash flows, selling the financial assets, or both.
Purchases or sales of financial assets that require delivery of assets within a time frame established by regulation or convention in the market place (regular way trades) are recognised on the trade date, i.e. the date that the Group commits to purchase or sell the asset.
Subsequent measurement
For the purposes of subsequent measurement, financial assets are classified in four categories:
i. Financial assets at amortised cost (debt instruments) ii. Financial assets at fair value through OCI with recycling of cumulative gains and losses (debt instruments) iii. Financial assets designated at fair value through OCI with no recycling of cumulative gains and losses upon derecognition (equity
instruments) iv. Financial assets at fair value through profit or loss
Financial assets at amortised cost (debt instruments)
This category is the most relevant to the Group. The Group measures financial assets at amortised cost if both of the following conditions are met:
• The financial asset is held within a business model with the objectives to hold financial assets in order to collect contractual cash flows; and
• The contractual terms of the financial asset give rise, on specified dates, to cash flows that are solely payments of principal and interest on the principal amount outstanding.
Financial assets at amortised cost are subsequently measured using the effective interest rate (EIR) method and are subject to impairment. Interest received is recognised as part of finance income in the statement of profit or loss and other comprehensive income. Gains and losses are recognised in profit or loss when the asset is derecognised, modified or impaired.
Financial assets at fair value through profit or loss
Financial assets that do not meet the criteria for amortised cost are measured at fair value through profit or loss.
For
per
sona
l use
onl
y

West African Resources Limited|47
1 BASIS OF PREPARATION (CONTINUED) W. PARENT ENTITY FINANCIAL INFORMATION
The financial information for the parent entity, West African Resources Limited, disclosed in Note 31 has been prepared on the same basis as the Group.
2 SEGMENT REPORTING
A. DESCRIPTION OF SEGMENTS
The Group has identified its operating segments based on the internal reports that are reviewed and used by the Board and the executive management team in assessing performance and in determining the allocation of resources.
As there were no operating mines in previous reporting periods the Group considered its business operations to be one reporting segment in mineral exploration and development. During the current reporting period, the Group changed the internal reporting basis of its operations to match changes in the operational structure of the business, with the resultant operating segments being as follows:
(a) Mining Operations: in the current period comprise the Sanbrado Gold Project operations located in Burkina Faso. (b) Exploration: in the current period comprises exploration and evaluation activities in locations other than Sanbrado.
B. SEGMENT INFORMATION
Mining
operations Exploration Other Total 31 December 2020 $'000 $'000 $'000 $'000 Total segment revenue 310,667 129 371 311,167 Total segment expenses 145,148 2,516 5,079 152,743 Total segment results 165,519 (2,388) (4,708) 158,423 Segment assets at 31 December 2020 471,222 17,339 42,152 530,713 Segment liabilities at 31 December 2020 137,036 232 221,180 358,448 Segment result is reconciled to the profit before income tax as follows: 2020 $’000 Total segment results 158,423 Share-based payments (2,343) Finance expenses (26,139) Other expenses (2,769) Net foreign exchange losses 14,196 Profit before income tax 141,368
All metal sales in the year were made to MKS (Switzerland) SA.
For
per
sona
l use
onl
y

48|West African Resources Ltd
3 REVENUE
2020 2019 $'000 $'000
Metal sales 310,315 - Interest received 605 1,237 Other income 247 2 311,167 1,239
4 EXPENSES
2020 2019 $'000 $'000
(a) Cost of sales Production expenses 120,888 - Royalties and other selling costs 21,371 - Depreciation and amortisation 23,985 - Changes in inventory (cash) (15,350) - Changes in inventory (non-cash) (5,746) - 145,148 - (b) Other expenses Accretion of rehabilitation provision 125 - Depreciation and amortisation 76 - Withholding tax expense 2,568 - 2,769 -
5 INCOME TAX
A. INCOME TAX RECOGNISED IN PROFIT OR LOSS
2020 2019 $'000 $'000
Current tax 20,819 - Deferred tax 21,649 - (Under) Over provided in prior years - - 42,468 -
For
per
sona
l use
onl
y

West African Resources Limited|49
5 INCOME TAX (CONTINUED) B. NUMERICAL RECONCILIATION OF INCOME TAX EXPENSE TO PRIMA FACIE TAX PAYABLE
2020 2019 $’000 $’000
Accounting profit (loss) before tax 141,368 (4,334)
Income tax benefit (expense) at 30% (31 December 2019: 27.5%) 42,410 1,192 Add (Deduct): Non-deductible expenses 4,302 (4) Effect of differences in foreign tax rates (3,657) - Effect of differences in foreign exchange (904) (601) Deferred tax movement re borrowing costs 2,361 - Other permanent adjustment (3,769) - Movement in unrecognised deferred tax assets 1,725 - Temporary differences not recognised - (1,456)
Tax losses utilised not previously brought to account - 601
Income tax expense (benefit) 42,468 - C. UNRECOGNISED DEFERRED TAX BALANCES
2020 2019
$’000 $’000
(a) Unrecognised deferred tax assets Annual leave provision 75 - Accrued expenses 46 1,503 Employee provisions 59 1,841 Long service leave provision 13 - Borrowings 16,961 - Leases 93 - Share issue costs - 1,191 Tax losses 14,496 23,946 Section 40-880 undeducted losses 82 - (b) Unrecognised deferred tax liabilities Prepayments (2) (100) Accrued interest - (13) Right-of-use assets (90) -
Borrowing costs (1,032) -
Net unrecognised deferred tax asset 30,701 28,368
For
per
sona
l use
onl
y

50|West African Resources Ltd
6 EARNINGS PER SHARE
2020 2019 $ $ Basic profit (loss) per share (cents per share) 11.3 (0.5) Diluted profit (loss) per share (cents per share) 11.2 (0.5)
The profit (loss) and weighted average number of ordinary shares used in the calculation of basic earnings per share is as follows: Profit (Loss) for the year 98,900,509 (4,333,608)
Weighted average number of shares outstanding during the period used in calculations of basic profit (loss) per share 873,899,037 868,631,331
Weighted average number of diluted shares outstanding during the period used in calculations of diluted profit (loss) per share 880,451,906 876,071,746
7 CASH AND CASH EQUIVALENTS
2020 2019 $'000 $'000 Cash at bank 94,944 83,567 Cash in hand 83 17 95,027 83,584
For
per
sona
l use
onl
y

West African Resources Limited|51
8 TRADE AND OTHER RECEIVABLES
2020 2019 $'000 $'000 Current Interest receivable - 45 Prepayments 2,945 362 Other receivables 19,690 2,858 Loan to Director - 320 Allowance for impairment - (2,084) 22,635 1,501
Other receivables include value added tax receivable from the Burkina Faso government of $19,275,000 (2019: $2,084,000).
2020 2019 $'000 $'000 Movement in the allowance for doubtful debts Balance at the beginning of the year (2,084) (2,166) Impairment losses and reversals recognised on receivables 2,084 82 Balance at the end of the year - (2,084) Ageing of past due but not impaired 30 - 60 days 19,690 819 60 - 90 days - - 90 - 120 days - 320 Total 19,690 1,139
9 INVENTORIES
2020 2019 $'000 $'000
Ore stockpiles – cost 24,895 - Finished goods – cost 14,131 - Gold in circuit – cost 2,278 - Consumable supplies and spares – cost 10,646 - 51,950 -
For
per
sona
l use
onl
y

52|West African Resources Ltd
10 PROPERTY, PLANT AND EQUIPMENT
Mine development
assets Mines under construction
Capital in progress
Land and buildings
Office equipment
Plant and equipment Light vehicles Total
Cost and accumulated depreciation $’000 $’000 $’000 $’000 $’000 $’000 $’000 $’000 31 December 2019 Gross carrying amount at cost - 242,477 - 188 302 1,665 928 245,560 Accumulated depreciation - - - (137) (246) (1,580) (895) (2,859) Net carrying amount - 242,477 - 51 56 85 32 242,701 31 December 2020 Gross carrying amount at cost 100,427 - 11,527 31,137 298 205,828 4,021 353,238 Accumulated depreciation (6,601) - - (2,074) (273) (13,183) (1,520) (23,651) Net carrying amount 93,826 - 11,527 29,063 25 192,645 2,501 329,587 Carrying value 31 December 2019 At the beginning of the period - 18,830 - 102 50 188 48 19,218 Additions - 223,675 - - 40 - 8 223,723 Depreciation expensed for the period - - - (4) (12) (51) (23) (89) Depreciation capitalised for the period - - - (47) (22) (51) - (120) Change in rehabilitation provision - 2,098 - - - - - 2,098 Effects of movement in foreign exchange - (2,126) - (1) - (2) - (2,129) Net of accumulated depreciation - 242,477 - 51 56 85 32 242,701 31 December 2020 At the beginning of the period - 242,477 - 51 56 85 32 242,701 Transfers from mine under construction 69,783 (308,014) - 30,951 - 204,178 3,102 - Transfers to inventory - (28,669) - - - - - (28,669) Additions 25,582 100,719 11,527 - - - - 137,828 Depreciation expensed for the period (6,885) - - (2,005) (24) (12,100) (660) (21,674) Depreciation capitalised for the period - 41 - (16) (8) (17) - - Change in rehabilitation provision 5,062 - - - - - - 5,062 Effects of movement in foreign exchange 284 (6,554) - 82 1 499 27 (5,661) Net of accumulated depreciation 93,826 - 11,527 29,063 25 192,645 2,501 329,587
For
per
sona
l use
onl
y

West African Resources Limited|53
11 RIGHT-OF-USE ASSETS
Property Equipment Total $'000 $'000 $'000 Balance at 1 January 2019 - - - Additions 127 9,479 9,606 Depreciation charge for the year (95) (1,391) (1,486) Effects of movement in foreign exchange - 15 15 Balance at 31 December 2019 32 8,103 8,135 Balance at 1 January 2020 32 8,103 8,135 Additions 359 10,838 11,197 Depreciation charge for the year (92) (3,073) (3,165) Effects of movement in foreign exchange - 53 53 Balance at 31 December 2020 299 15,921 16,220
12 MINE PROPERTIES
2020 2019 $'000 $'000 Mines under construction Balance at 1 January 242,477 18,830 Additions 100,719 222,878 Change in rehabilitation provision - 2,098 Transfers to property, plant and equipment (308,014) - Transfers to other assets (28,669) - Depreciation capitalised for the year 41 - Effects of movement in foreign exchange (6,554) (1,329) Balance at 31 December - 242,477
13 EXPLORATION AND EVALUATION ASSETS
2020 2019 $'000 $'000
Balance at 1 January - - Additions 15,255 - Balance at 31 December 15,255 -
During the year, the Group recognised $15,255,000 of exploration and evaluation asset additions relating to acquisition costs for the Toega gold deposit (2019: nil).
The recoupment of costs carried forward in relation to areas of interest in the exploration and evaluation phase is dependent on the successful development and commercial exploitation or sale of the respective areas.
For
per
sona
l use
onl
y

54|West African Resources Ltd
14 TRADE AND OTHER PAYABLES
2020 2019 $'000 $'000 Current Trade payables 24,418 8,091 Accruals 15,366 5,465 Other payables 695 334 40,479 13,890
15 LOANS AND BORROWINGS
2020 2019 $'000 $'000 Current 132,664 22 Non-current 93,669 235,063 226,333 235,085
A. SYNDICATED DEBT FACILITY
2020 2019 $'000 $'000 Current 132,455 - Non-current 81,488 230,325 213,943 230,325
Syndicated debt facility denominated in USD arranged by Taurus Mining Finance for the development of the Sanbrado gold project, which is secured against the assets of the Group. Interest is charged at 7.75% per annum and scheduled monthly repayments commence on 31 March 2021. As at 31 December 2020 the balance due was US$175 million and no additional drawings are available (2019: balance due was $175 million and US$25 million was available to be drawn). The Group is also obligated to pay a product fee under the facility (refer to note 23C(i)). Estimates of future cash flows used for classification of the debt facility between current and non-current may differ from the actual outcomes in the next financial year.
B. SUPPLIER LOAN FACILITIES
2020 2019 $'000 $'000 Current 209 22 Non-current 12,181 4,738 12,390 4,760
In 2019 a loan facility was entered into with Byrnecut Burkina Faso SARL as a component of the Sanbrado underground mining services contract. The facility has a limit of US$10 million and interest is charged at a rate of 9.75% per annum. Interest is payable half-yearly and the principal is due 6 months before termination of the 5-year services contract. The balance outstanding under the facility at 31 December 2020 was US$9.6 million inclusive of accrued interest.
For
per
sona
l use
onl
y

West African Resources Limited|55
16 LEASES
2020 2019 $'000 $'000 Current 4,581 1,866 Non-current 11,225 6,609 15,806 8,475 Amounts recognised in profit or loss Interest on lease liabilities 576 5 Expenses relating to short-term leases 41 70 617 75 Amounts recognised in the statement of cash flows Total cash outflow for leases 2,949 784
17 PROVISIONS
2020 2019 $'000 $'000 Non-current Long service leave provision 44 60 Rehabilitation provision 9,362 4,218 9,406 4,278 Reconciliation of movements in rehabilitation provision: Balance at the start of the period 4,218 2,121 Increase in rehabilitation provision during the year 5,182 2,097 Effects of movement in foreign exchange (38) - Balance at the end of the period 9,362 4,218
The Group’s rehabilitation provision is the best estimate of the present value of the future cash flows required to settle the Sanbrado mine site restoration obligations at the reporting date, based on current legal requirements and technology. The amount provided each period is also capitalised as an asset under mine development assets in property, plant and equipment.
18 DEFERRED TAX LIABILITIES
2020 2019 $'000 $'000 Deferred tax liabilities Trade and other receivables 7 Property, plant and equipment 6,911 - Trade and other payables 175 - Borrowings 7,070 Borrowing costs 7,485 - Net deferred tax liabilities 21,648 -
For
per
sona
l use
onl
y

56|West African Resources Ltd
19 ISSUED CAPITAL
2020 2019 $'000 $'000 Fully paid ordinary shares 165,263 162,919 (a) Number of shares No. No. At start of period 870,478,852 863,524,727 Issue of shares 30 January 2019 - 876,000
Issue of shares on exercise of options 8,203,794 6,078,125 Balance at end of period 878,682,646 870,478,852 (b) Value of shares $'000 $'000 At start of period 162,919 161,947 Issue of shares 30 January 2019 - 219 Issue of shares on exercise of options 2,369 770 Share issue costs (25) (17) Balance at end of period 165,263 162,919
20 RESERVES
2020 2019 $'000 $'000 Reserves 3,851 7,373 Reserves comprise the following: (a) Foreign currency translation reserve At start of period (543) 670 Currency translation differences (5,553) (1,213) Balance at end of period (6,096) (543) (b) Share-based payments reserve At start of period 7,916 6,874 Options issued – share-based payment expense 2,251 974 Options issued in lieu of directors fees 92 68 Reclassification of expired options (312) - Balance at end of period 9,947 7,916
For
per
sona
l use
onl
y

West African Resources Limited|57
20 RESERVES (CONTINUED)
Nature and purpose of reserves
(a) Foreign currency translation reserve
The foreign currency translation reserve is used to record the Group’s exchange differences arising from the translation of loans to foreign subsidiaries that are expected to be repaid in the long term and the translation of the financial statements of foreign subsidiaries.
(b) Shared-based payments reserve
The shared-based payments reserve is used to recognise the fair value of options issued by the Company to Directors, employees and other suppliers or consultants that are not exercised or expired.
21 CASH FLOW INFORMATION
A. RECONCILIATION OF PROFIT (LOSS) AFTER INCOME TAX TO NET CASHFLOWS FROM OPERATING ACTIVITIES
2020 2019 $'000 $'000 Profit (Loss) after income tax 98,900 (4,334) Adjustment for: Depreciation and amortisation 24,061 184 Share-based payments 2,343 1,043 Accretion of rehabilitation provision 125 - Financing costs 25,563 - Net foreign exchange (gain) loss (15,002) (2,363) 135,990 (5,470) Changes in assets and liabilities (Increase) Decrease in trade and other receivables (18,260) 173 (Increase) Decrease in inventories (26,461) - (Decrease) Increase in trade and other payables 14,185 (1,290) (Decrease) Increase in current tax payable 20,819 - (Decrease) Increase in deferred tax liabilities 21,648 - Net cash flows from operating activities 147,921 (6,587)
For
per
sona
l use
onl
y

58|West African Resources Ltd
21 CASH FLOW INFORMATION (CONTINUED) B. RECONCILIATION OF LOANS AND BORROWINGS AND LEASES TO NET CASH FLOWS FROM FINANCING
ACTIVITIES
Loans and borrowings Lease liabilities Total $’000 $’000 $’000 Balance at 1 January 2019 - 127 127 Net cash from (used in) financing activities 232,722 (1,130) 231,592 Transfer of prior year capitalised borrowing costs (1,066) - (1,066) Amortisation of borrowing costs 1,208 - 1,208 Effects of movement in foreign exchange (2,511) - (2,511) Other changes (28) - (28) Supplier facility utilised 4,760 - 4,760 Leases entered into during the year - 9,478 9,478 Balance at 31 December 2019 235,086 8,475 243,561 Balance at 1 January 2020 235,086 8,475 243,561 Net cash from (used in) financing activities (13,140) (2,949) (16,089) Amortisation of borrowing costs 5,054 - 5,054 Effects of movement in foreign exchange (8,626) (558) (9,184) Supplier facility utilised 7,959 - 7,959 Leases entered into during the year - 10,838 10,838 Balance at 31 December 2020 226,333 15,806 242,139
22 DIVIDENDS
No dividends have been paid or declared payable during the year (2019: nil).
For
per
sona
l use
onl
y

West African Resources Limited|59
23 COMMITMENTS AND OTHER CONTINGENCIES
A. COMMITMENTS IN RELATION TO EXPLORATION AND MINING LEASE
In order to maintain current rights of tenure to exploration tenements, the Group is required to outlay rental fees and to meet the minimum expenditure requirements. These discretionary costs are not provided for in the financial statements and will be payable as follows:
2020 2019 $'000 $'000 Due within 1 year 10,635 424 Due after 1 year but not more than 5 years 14,340 33 Due after 5 years - -
24,975 457
B. COMMITMENTS IN RELATION TO OPERATIONS
Commitments of the Group in relation to the operations of the Sanbrado Gold Project mine site will be payable as follows:
2020 2019 $'000 $'000 Due within 1 year 5,528 21,626 Due after 1 year but not more than 5 years - - Due after 5 years - -
5,528 21,626
C. CONTINGENT LIABILITIES
(i) Product fee
Under the syndicated debt facility the Group has a contractual commitment to pay a fee on the first 1,250,000 ounces of gold refined from the Sanbrado Gold project (the “Product Fee”). The Product Fee for each ounce of gold refined is calculated as the spread between the LBMA quoted am fix price on the date the refined gold is credited to the Group’s metals account and the lowest LBMA quoted gold price (am fix or pm fix) during the preceding 8 business day period.
The Group has the option to buy back the Product Fee commitment at any time by paying cash consideration equal to the net present value (applying a 5% annual discount rate, and assuming the timing of gold production as set out in the mine production schedule) of the pre-agreed price per ounce for the remaining committed ounces.
During the year the Group incurred US$4,324,519 (A$6,261,000) of Product Fees in relation to 118,093 ounces of refined gold (2019: nil) that are recorded under ‘finance expenses’ in the ‘statement of profit or loss and other comprehensive income’. This represents an average payment per ounce of US$36.62. The Group had 1,131,907 ounces remaining under the Product Fee commitment at 31 December 2020 (31 December 2019: 1,250,000).
(ii) Other contingent liabilities
There were no other material contingent liabilities at the end of the year (31 December 2019: nil).
For
per
sona
l use
onl
y

60|West African Resources Ltd
24 INTEREST IN SUBSIDIARIES
The consolidated financial statements include the financial statements of West African Resources Limited and the subsidiaries listed in the following table:
Ownership interest
Country of incorporation
2020 2019
Controlled entities % % Parent Entity: West African Resources Limited Australia Subsidiaries of West African Resources Limited: WAF Finance Pty Ltd Australia 100 100 Wura Resources Pty Ltd SARL Burkina Faso 100 100 West African Resources Development SARL Burkina Faso 100 100 Channel Resources Ltd Canada 100 100 which owns Channel Resources (Cayman I) Ltd Cayman Islands 100 100 which owns Channel Resources (Cayman II) Ltd Cayman Islands 100 100 which owns Tanlouka SARL Burkina Faso 100 100
Société des Mines de Sanbrado SA 1 Burkina Faso 90 90 1The remaining 10% of Société des Mines de Sanbrado SA is held by the government of Burkina Faso which is entitled to a free carried 10% interest in the project.
Intercompany transactions between the parent entity and its subsidiaries are eliminated on consolidation.
Consolidated Parent Entity 2020 2019 2020 2019 $'000 $'000 $'000 $'000 Amounts owed by (to) related parties Subsidiaries WAF Finance Pty Ltd - - 40,496 14,212 Wura Resources Pty Ltd SARL - - 23,926 22,788 Société des Mines de Sanbrado SA - - 12,784 44,150 West African Resources Development SARL - - 16,950 560 Tanlouka SARL - - 3,457 18,717 Channel Resources (Cayman I) Ltd - - 56 43 Channel Resources (Cayman II) Ltd - - 59 44 Channel Resources Ltd - - 1 (8) Total - - 97,729 100,506 Provision for impairment - - (56,230) (54,806) - - 41,499 45,700 Further information with respect to related party transactions are included in Note 27.
For
per
sona
l use
onl
y

West African Resources Limited|61
24 INTEREST IN SUBSIDIARIES (CONTINUED)
Summarised financial information for Société des Mines de Sanbrado SA before intragroup eliminations is set out below.
2020 2019 $'000 $'000
STATEMENT OF PROFIT OR LOSS AND OTHER COMPREHENSIVE INCOME Revenue 309,856 - Profit (Loss) for the year: Attributable to owners of the parent 85,845 (621) Attributable to non-controlling interest 9,538 (59) 95,383 (680) STATEMENT OF FINANCIAL POSITION Assets Current assets 123,601 1,860 Non-current assets 345,489 214,887 469,090 216,747 Liabilities Current liabilities 329,052 225,354 Non-current liabilities 69,671 12,600 398,723 237,954 Equity Attributable to owners of the parent 63,330 (19,086) Attributable to non-controlling interest 7,037 (2,121) 70,367 (21,207) STATEMENT OF CASH FLOWS Net cash from (used in) operating activities 165,477 (1,436) Net cash from (used in) investing activities (92,532) (164,211) Net cash from (used in) financing activities (18,701) 165,571 54,244 (76)
25 SUBSEQUENT EVENTS AFTER THE BALANCE DATE
There has not arisen in the interval between the end of the reporting period and the date of this report, any item, transaction or event of a material and unusual nature likely, in the opinion of the Directors of the Company, to affect substantially the operations of the Group, the results of those operations or the state of affairs of the Group in subsequent financial years.
For
per
sona
l use
onl
y

62|West African Resources Ltd
26 AUDITORS’ REMUNERATION
2020 2019 $'000 $'000 The auditor of West African Resources Limited is HLB Mann Judd Audit or review of the financial statements 53 46 All other services - - 53 46 Amounts received or due and receivable by non HLB Mann Judd audit firms Audit or review of the Burkina Faso financial reports 19 18 19 18
27 DIRECTORS AND EXECUTIVE DISCLOSURES
A. DETAILS OF KEY MANAGEMENT PERSONNEL
Non-Executive Directors Appointed Resigned Rod Leonard Non-Executive Director September 2019 - Nigel Spicer Non-Executive Director September 2019 - Stewart Findlay Non-Executive Director 29 May 2020 - Libby Mounsey Non-Executive Director 29 May 2020 - Mark Connelly Non-Executive Director June 2015 29 May 2020 Simon Storm Non-Executive Director and Company Secretary November 2007 29 May 2020 Executive Directors Richard Hyde Executive Chairman and CEO September 2006 - Lyndon Hopkins1 Executive Director and COO September 2019 - Other Executives (KMPs) Padraig O’Donoghue Chief Financial Officer and Company Secretary June 20182 - Matthew Wilcox Chief Development Officer September 2018 - 1Date appointed a Director (employed since January 2017). 2Date appointed as Company Secretary was May 2020 (employed since June 2018).
B. COMPENSATION OF KEY MANAGEMENT PERSONNEL
2020 2019 $'000 $'000 Short-term employee benefits 1,938 1,640 Post-employment benefits 145 84 Share-based payments 1,723 873 3,806 2,597
C. COMPENSATION BY CATEGORY OF KEY MANAGEMENT PERSONNEL FOR THE YEAR
Consulting fees were paid to Directors, details of which are included in the Remuneration Report in the Directors’ Report. Salaries were paid to the Chief Executive Officer, Chief Operating Officer, Chief Financial Officer and Chief Development Officer, details of which are included in the Remuneration Report in the Directors’ Report.
For
per
sona
l use
onl
y

West African Resources Limited|63
27 DIRECTOR AND EXECUTIVE DISCLOSURES (CONTINUED)
D. LOANS TO KEY MANAGEMENT PERSONNEL
A loan was provided to Richard Hyde in a prior year to exercise 2,000,000 options at 14.5 cents. The loan carried interest at 5.5% per annum with a maturity date of 30 June 2021. Mr Hyde fully repaid the loan during the year and the balance outstanding at year end was nil (2019: $319,673).
E. OTHER TRANSACTIONS AND BALANCES WITH KEY MANAGEMENT PERSONNEL
There were no other transactions and outstanding balances with key management personnel for the year ended 31 December 2020 that are not already included in the Remuneration Report in the Directors’ Report.
28 FINANCIAL INSTRUMENTS
2020 2019 $'000 $'000 Financial assets Cash and cash equivalents (Note 7) 95,027 83,584 Trade and other receivables (Note 8) 22,635 1,501 Financial assets 39 38 117,701 85,123 Financial liabilities Trade and other payables (Note 14) (40,479) (13,890) Loans and borrowings* (Note 15) (239,781) (256,559) Lease liabilities (Note 16) (15,807) (8,475) (296,066) (278,924)
*Loans and borrowings amount as disclosed in Note 15 includes capitalised transaction costs of $13,448,000.
29 FINANCIAL RISK MANAGEMENT
The Group's activities expose it to a variety of financial risks: market risk (including currency risk, interest rate risk, and price risk), credit risk and liquidity risk. The Group's overall risk management program focuses on the unpredictability of financial markets and seeks to minimise potential adverse effects on the financial performance of the Group.
A. MARKET RISK
(i) Interest rate risk
The Group’s main interest rate risk arises from its cash balances. Cash held at variable rates expose the Group to cash flow interest rate risk while cash deposits at fixed rates expose the Group to fair value interest rate risk. During the year, the Group’s cash deposits at variable rates were denominated in Australian Dollars (“AUD”), United States Dollars (“USD”), Euros, and Communaute Financière Africaine Francs (“CFA”).
For
per
sona
l use
onl
y

64|West African Resources Ltd
29 FINANCIAL RISK MANAGEMENT (CONTINUED)
A. MARKET RISK (CONTINUED)
(i) Interest rate risk (continued)
The tables below analyse the Group's financial assets and financial liabilities into maturity groupings based on the remaining period at the reporting date to the contractual maturity date.
Consolidated Fixed Interest Rate Maturing
Weighted Average Effective Interest
Rate
Floating Interest
Rate Within
Year 1 to 5 Years
Over 5 Years
Non-interest bearing Total
$’000 $’000 $’000 $’000 $’000 $’000
31 December 2019 Financial assets Cash and cash equivalents 1.7% 76,366 - - - 7,218 83,584 Trade and other receivables 5.5% - 320 - - 1,181 1,501 Financial assets 2.7% - 38 - - - 38 Total financial assets 76,366 358 - - 8,399 85,123 Financial liabilities Trade and other payables - - - - 13,890 13,890 Loans and borrowings - 21,315 235,244 - - 256,559 Lease liabilities - 1,866 6,609 - - 8,475 Total financial liabilities - 23,181 241,853 - 13,890 278,924 31 December 2020 Financial assets Cash and cash equivalents 0.7% 63,464 - - - 31,563 95,027 Trade and other receivables 0.0% - - - - 22,635 22,635 Financial assets 1.0% - 39 - - - 39 Total financial assets 63,464 39 - - 54,198 117,701 Financial liabilities Trade and other payables 0.00% - - - - 40,479 40,479 Loans and borrowings 7.62% - 133,672 108,253 - - 241,925 Lease liabilities 6.50% - 4,581 11,225 - - 15,806 Total financial liabilities - 138,253 119,478 - 40,479 298,210
For
per
sona
l use
onl
y

West African Resources Limited|65
29 FINANCIAL RISK MANAGEMENT (CONTINUED) A. MARKET RISK (CONTINUED)
(ii) Interest rate sensitivity
At 31 December 2020, if variable interest rates for the full year were -/+ 0.5% from the year-end rate with all other variables held constant, pre-tax profit for the year would have moved as per the table below.
2020 2019 $'000 $'000 +0.5% 447 374 -0.5% (447) (374)
The sensitivity is calculated using the average cash position for the year ended 31 December 2020. The interest income in Note 4 of $605,024 (31 December 2019: $1,239,000) reflects cash balances in the year that ranged between $40,878,483 and $73,476,229 (31 December 2019: $30,480,000 and $83,584,000).
(iii) Foreign currency risk
The Group operates internationally and is exposed to foreign exchange risk primarily arising from costs denominated in CFA and USD, and loans and borrowings denominated in USD.
The Group also has transactional currency exposures. Such exposure arises from purchases by an operating entity in currencies other than the functional currency.
The Group does not have a policy to enter into forward contracts or other hedge derivatives.
At 31 December, the Group had the following exposure to CFA, Euro, and USD foreign currencies expressed in AUD equivalents:
2020 2019 $'000 $'000 Financial assets Cash and cash equivalents 82,172 76,484 Trade and other receivables 21,456 2,272 103,628 78,756 Financial liabilities Trade and other payables 72,362 16,134 Loans and borrowings 236,848 258,946 Lease liabilities 15,491 8,442 Tax liabilities 41,590 - 366,291 283,522
For
per
sona
l use
onl
y

66|West African Resources Ltd
29 FINANCIAL RISK MANAGEMENT (CONTINUED) A. MARKET RISK (CONTINUED)
(iv) Exchange rate sensitivity
A 10 per cent strengthening or weakening of the AUD against the following currencies at 31 December would have increased (decreased) net assets by the amounts shown in the below table. This analysis assumes that all other variables, in particular interest rates, remain constant. The analysis is performed on the same basis for the year ended 31 December 2019.
+10% -10% 2020 2019 2020 2019 $'000 $'000 $'000 $'000 USD 19,019 17,413 (23,245) (21,282) CFA (34,862) 1,854 42,609 (2,266) EUR 1,958 (651) (2,394) 796
(v) Price risk
The Group is exposed to commodity price risk on its future gold production. This risk is estimated by management using forecasts of the quantity and cost of future gold production. While the Group’s price risk could be partially managed using a range of different types of hedging instruments, the Group did not have any open hedge instruments at 31 December 2020 (2019: nil).
B. CREDIT RISK
Credit risk arises primarily from the Group’s cash and cash equivalents held with financial institutions. The banks the Group uses for cash deposits and transactions are limited to high credit quality financial institutions.
The maximum exposure to credit risk at the reporting date is the carrying amount of the financial assets as summarised at the beginning of this note.
C. LIQUIDITY RISK
Liquidity risk is the risk the Group will not be able to meet its financial obligations as they fall due. Liquidity risk management involves maintaining sufficient cash on hand or undrawn credit facilities to meet the operating requirements of the business. This is currently managed through cash and cash equivalents ($95,027,000 as at 31 December 2020) and prudent cash flow and financial commitment management. The tables below analyse the Group's financial assets and liabilities into maturity groupings based on the remaining period at the reporting date to the contractual maturity date.
For
per
sona
l use
onl
y

West African Resources Limited|67
29 FINANCIAL RISK MANAGEMENT (CONTINUED)
Maturity analysis of financial assets and liabilities based on management's expectation
Consolidated <6 months 6-12 months 1-5 years >5 years Total
$'000 $'000 $'000 $'000 $'000 31 December 2019 Financial assets Cash and cash equivalents 83,584 - - - 83,584 Trade and other receivables 1,501 - - - 1,501 Financial assets 38 - - - 38 Total financial assets 85,123 - - - 85,123 Financial liabilities Trade and other payables (13,890) - - - (13,890) Loan and borrowings (8,058) (13,257) (235,244) - (256,559) Lease liabilities (915) (951) (6,609) - (8,475) Total financial liabilities (22,863) (14,208) (241,853) - (278,924) Net maturity 62,260 (14,208) (241,853) - (193,801) 31 December 2020 Financial assets Cash and cash equivalents 95,027 - - - 95,027 Trade and other receivables 22,635 - - - 22,635 Financial assets 39 - - - 39 Total financial assets 117,701 - - - 117,701 Financial liabilities Trade and other payables (40,479) - - - (40,479) Loans and borrowing (58,600) (89,151) (116,252) - (264,003) Lease liabilities (2,524) (2,524) (12,101) - (17,149) Total financial liabilities (101,603) (91,675) (128,353) - (321,631) Net maturity 16,098 (91,675) (128,353) - (203,930)
For
per
sona
l use
onl
y

68|West African Resources Ltd
30 SHARE-BASED PAYMENTS
A. RECOGNISED SHARE-BASED PAYMENTS
The expenses recognised for services received during the year are shown in the table below:
2020 2019 $'000 $'000 Share-based payments to Directors 1,254 708 Share-based payments to employees 955 330 Share-based payments to third party 133 5 2,343 1,043
The share-based payment plans are described below. There have been no cancellations or modifications to the plan during the year.
B. TRANSACTIONS SETTLED USING SHARES
No transactions were settled in the current year using shares.
C. EMPLOYEE SHARE AND OPTION PLAN
Under the Incentive Options and Performance Rights Plan (“Incentive Plan”), grants are made to senior executives and other staff members who have made an impact on the Group’s performance. Grants are delivered in the form of options or performance rights which vest over periods as determined by the Board of Directors.
D. PERFORMANCE RIGHTS
Performance rights are granted under the Incentive Plan for nil consideration and are subject to vesting conditions as determined by the Board of Directors. Any performance rights that do not vest by their expiry date will lapse. Upon vesting, these performance rights will be settled in ordinary fully paid shares of the Company.
(a) Summary of performance rights granted under the Incentive Plan
2020 Number 2020 WAEP* 2019 Number 2019 WAEP* Outstanding at the beginning of the year 2,287,295 - 1,966,732a - Granted during the year 10,636,406 - 320,563b - Exercised during the year (303,794) - - - Lapsed/cancelled during the year (62,180) - - - Outstanding at the end of the year 12,557,727 - 2,287,295 - Exercisable at the end of the year 2,027,779 - - - *WAEP = weighted average exercise price
The performance rights outstanding at the end of the year had a weighted average remaining contractual life of 1,200 days (31 December 2019: 1,027 days)
a1,223,828 opening performance rights from 2019 have been reclassified as options. They are now included in Note 31E(a) below. b259,516 options granted in 2019 have now been reclassified as performance rights.
For
per
sona
l use
onl
y

West African Resources Limited|69
30 SHARE-BASED PAYMENTS (CONTINUED)
D. PERFORMANCE RIGHTS (CONTINUED)
(b) Fair value of performance rights granted
The fair value of the performance rights granted during the year was determined using the Black-Scholes, Monte Carlo Simulation and Binomial pricing methods.
Number issued Grant date
Original expiry period
Dividend yield
Expected volatility
Risk-free interest rate
Exercise price
Share price on grant
date 963,948 9-Jan-20 3 years 0% 54% 2.75% $0.0000 $0.4350 263,157 9-Jan-20 5 years 0% 54% 2.75% $0.0000 $0.4350 131,578 9-Jan-20 4 years 0% 54% 2.75% $0.0000 $0.4350
44,278 29-May-20 2 years 0% 60% 5.75% $0.0000 $0.8400 885,166 29-May-20 3 years 0% 60% 5.75% $0.0000 $0.8400 657,894 29-May-20 5 years 0% 74% 3.25% $0.0000 $0.8400 182,978 2-Jul-20 3 years 0% 64% 5.75% $0.0000 $0.8850
78,419 2-Jul-20 5 years 0% 72% 3.25% $0.0000 $0.8850 137,822 29-May-20 2 years 0% 64% 5.75% $0.0000 $0.8400
75,358 8-Jul-20 3 years 0% 59% 5.75% $0.0000 $0.9600 113,636 22-Sep-20 3 years 0% 67% 2.25% $0.0000 $1.0500
2,275,500 27-Nov-20 4 years 0% 62% 0.25% $0.0000 $0.9050 2,275,500 27-Nov-20 4 years 0% 62% 0.25% $0.0000 $0.9050
57,172 17-Dec-20 2 years 0% 67% 2.25% $0.0000 $1.0200 1,250,000 17-Dec-20 4 years 0% 62% 0.25% $0.0000 $1.0200 1,250,000 17-Dec-20 4 years 0% 61% 0.25% $0.0000 $1.0200
E. OPTIONS
Options are issued for nil consideration. The exercise price, vesting conditions and expiry date are determined by the Board of Directors. Any options that are not exercised by the expiry date will lapse. Upon vesting, these options will be settled in ordinary fully paid shares of the Company.
(a) Summary of options granted by the Group
2020 Number 2020 WAEP* 2019 Number 2019 WAEP*
Outstanding at the beginning of the year 11,873,828 $0.3163 18,692,437a $0.2364
Granted during the year 1,117,891 $0.6486 1,000,000b $0.2594 Exercised during the year (7,900,000) $0.2998 (6,078,125) $0.1267
Lapsed/cancelled during the year (250,000) $0.2400 (2,000,000) $0.1250 Outstanding at the end of the year 4,841,719 $0.4228 11,873,828 $0.3163 Exercisable at the end of the year 4,841,719 $0.4228 1,223,828 $0.4300 *WAEP = weighted average exercise price
The share options outstanding at the end of the year had a weighted average remaining contractual life of 374 days (31 December 2019: 469 days).
a1,223,828 opening performance rights from 2019 have been reclassified as options. b259,516 options granted in 2019 have now been reclassified as performance rights. They are now included in Note 31D(a) above.
For
per
sona
l use
onl
y

70|West African Resources Ltd
30 SHARE-BASED PAYMENTS (CONTINUED)
E. SHARE OPTIONS (CONTINUED)
(b) Fair value of options granted
The fair value of the options granted during the period was determined using the Black-Scholes and Monte Carlo Simulation pricing methods.
Further details of the basis of valuation appear below. During the year the company granted 867,891 options, with a fair value of $396,422, to Directors and employees under the Incentive Plan (31 December 2019: 1,259,516) in addition to 250,000 options, with a fair value of $98,350, to a third party.
Number issued Grant date
Original expiry period
Dividend yield
Expected volatility
Risk-free interest rate
Exercise price
Share price on grant
date 131,578 9-Jan-20 4 years 0% 54% 2.75% $0.6061 $0.4350 250,000 29-Apr-20 4 years 0% 67% 3.25% $0.7346 $0.7400 657,894 29-May-20 4 years 0% 67% 3.25% $0.6061 $0.8400
78,419 2-Jul-20 4 years 0% 66% 3.25% $0.7309 $0.8850
For
per
sona
l use
onl
y

West African Resources Limited|71
30 SHARE-BASED PAYMENTS (CONTINUED) E. OPTIONS AND PERFORMANCE RIGHTS BALANCES
The outstanding balance of performance rights as at 31 December 2020 is presented in the following table.
Number of performance rights
Grant date Vesting date Expiry date Exercise
price Granted Lapsed /
Cancelled Exercised On issue Vested
28-Dec-18
When the Company achieves the certain milestones in relation to its Sanbrado Gold Project within 12 months of the date the rights were issued 28-Dec-21 $0.0000 1,022,565 - - 1,022,565 1,022,565
28-Dec-18 First gold pour and commercial production 28-Dec-23 $0.0000 944,167 - - 944,167 944,167
14-Feb-19 Hold continuous office as a director of the Company for 1 year from the date the rights were issued 14-Feb-21 $0.0000 259,516 - (259,516) - -
07-Jul-19 When KPIs are achieved 01-Jun-22 $0.0000 61,047 - - 61,047 61,047
9-Jan-20 Hold continuous office as an employee or a director of the Company for 1 year from the date the rights were issued 20-Jan-23 $0.0000 963,948 - - 963,948 -
9-Jan-20 When KPIs are achieved and hold continuous office as an employee of the Company for 2 years from the date the rights were issued 20-Jan-23 $0.0000 263,157 (8,668) - 254,489 -
9-Jan-20 500,000oz gold poured within 3 years from the date the rights were issued 20-Jan-23 $0.0000 131,578 - - 131,578 -
29-May-20 Hold continuous office as a director of the Company for 1 year from the date the rights were issued 11-Jun-22 $0.0000 44,278 - (44,278) - -
29-May-20 Hold continuous office as an employee of the Company for 1 year from the date the rights were issued 11-Jun-23 $0.0000 334,927 - - 334,927 -
29-May-20 When KPIs are achieved and hold continuous office as an employee of the Company for 2 years from the date the rights were issued 11-Jun-23 $0.0000 550,239 (18,125) - 532,114 -
29-May-20 500,000oz gold poured within 3 years from the date the rights were issued 11-Jun-25 $0.0000 657,894 - - 657,894 -
2-Jul-20 When KPIs are achieved and hold continuous office as an employee of the Company for 2 years from the date the rights were issued 8-Jul-23 $0.0000 182,978 (6,027) - 176,951 -
2-Jul-20 500,000oz gold poured within 3 years from the date the rights were issued 8-Jul-25 $0.0000 78,419 - - 78,419 -
For
per
sona
l use
onl
y
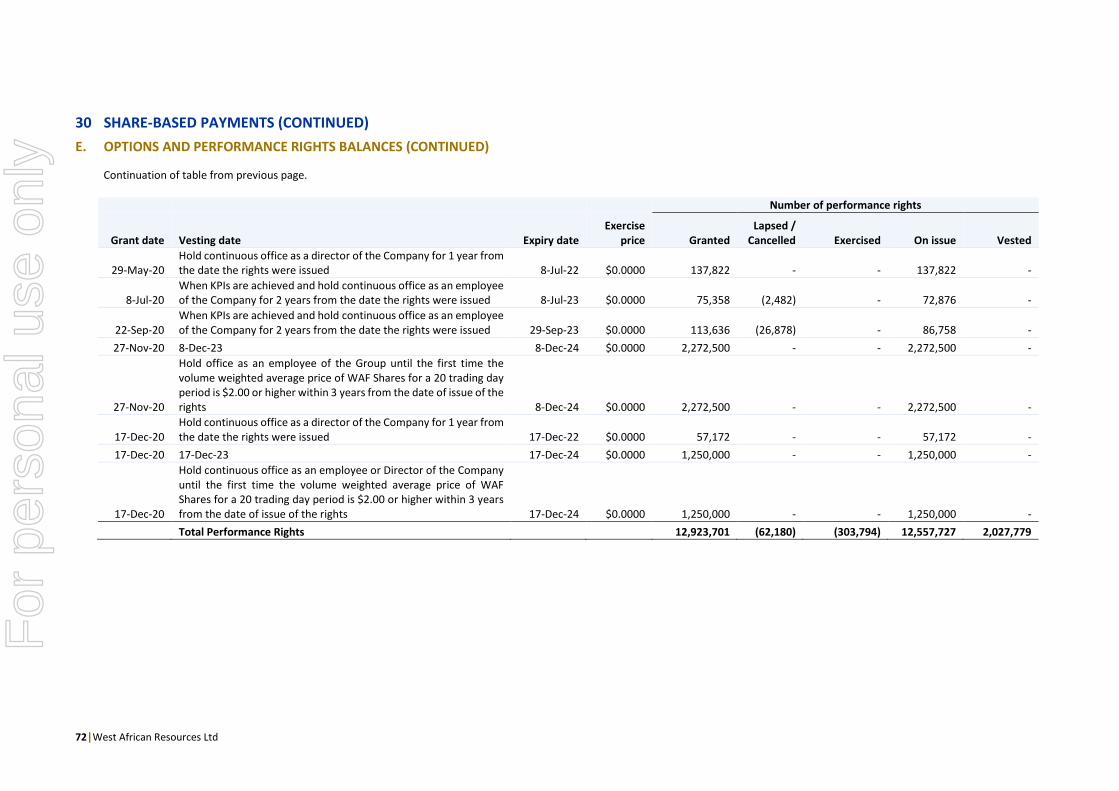
72|West African Resources Ltd
30 SHARE-BASED PAYMENTS (CONTINUED) E. OPTIONS AND PERFORMANCE RIGHTS BALANCES (CONTINUED)
Continuation of table from previous page.
Number of performance rights
Grant date Vesting date Expiry date Exercise
price Granted Lapsed /
Cancelled Exercised On issue Vested
29-May-20 Hold continuous office as a director of the Company for 1 year from the date the rights were issued 8-Jul-22 $0.0000 137,822 - - 137,822 -
8-Jul-20 When KPIs are achieved and hold continuous office as an employee of the Company for 2 years from the date the rights were issued 8-Jul-23 $0.0000 75,358 (2,482) - 72,876 -
22-Sep-20 When KPIs are achieved and hold continuous office as an employee of the Company for 2 years from the date the rights were issued 29-Sep-23 $0.0000 113,636 (26,878) - 86,758 -
27-Nov-20 8-Dec-23 8-Dec-24 $0.0000 2,272,500 - - 2,272,500 -
27-Nov-20
Hold office as an employee of the Group until the first time the volume weighted average price of WAF Shares for a 20 trading day period is $2.00 or higher within 3 years from the date of issue of the rights 8-Dec-24 $0.0000 2,272,500 - - 2,272,500 -
17-Dec-20 Hold continuous office as a director of the Company for 1 year from the date the rights were issued 17-Dec-22 $0.0000 57,172 - - 57,172 -
17-Dec-20 17-Dec-23 17-Dec-24 $0.0000 1,250,000 - - 1,250,000 -
17-Dec-20
Hold continuous office as an employee or Director of the Company until the first time the volume weighted average price of WAF Shares for a 20 trading day period is $2.00 or higher within 3 years from the date of issue of the rights 17-Dec-24 $0.0000 1,250,000 - - 1,250,000 -
Total Performance Rights 12,923,701 (62,180) (303,794) 12,557,727 2,027,779
For
per
sona
l use
onl
y

West African Resources Limited|73
30 SHARE-BASED PAYMENTS (CONTINUED) E. SHARE OPTIONS (CONTINUED)
The outstanding balance of options as at 31 December 2020 is presented in the following table:
Number of options
Grant date Vesting date Expiry date Exercise
price Granted Lapsed /
Cancelled Exercised On issue Vested
21-Mar-17 First gold production 21-Mar-20 $0.2400 400,000 (250,000) (150,000) - - 12-May-17 First gold production 12-May-20 $0.2400 500,000 - (500,000) - - 18-Oct-17 First gold production 18-Oct-20 $0.3750 750,000 - (750,000) - - 03-Nov-17 First gold production 09-Nov-20 $0.2400 2,750,000 - (2,750,000) - - 29-Mar-18 First gold production 29-Mar-21 $0.4100 1,250,000 - (1,000,000) 250,000 250,000 26-Sep-18 First gold production 26-Sep-21 $0.3100 500,000 - - 500,000 500,000 28-Nov-18 First gold production and first concrete pour for the plant 28-Nov-21 $0.3100 1,000,000 - - 1,000,000 1,000,000 28-Dec-18 First gold pour and commercial production 28-Dec-21 $0.3200 2,500,000 - (2,000,000) 500,000 500,000
28-Dec-18 When the company’s share price first equals the option exercise price ($0.4300) 28-Dec-22 $0.4300 1,223,828 - - 1,223,828 1,223,828
05-Mar-19 First gold pour and commercial production 05-Mar-22 $0.2950 1,000,000 - (750,000) 250,000 250,000
20-Jan-20 When the company’s share price first equals the option exercise price ($0.6061) 20-Jan-24 $0.6061 131,578 - - 131,578 131,578
29-Apr-20 29 April 2020 29-Apr-24 $0.7346 250,000 - - 250,000 250,000
11-Jun-20 When the company’s share price first equals the option exercise price ($0.6061) 11-Jun-24 $0.6061 657,894 - - 657,894 657,894
2-Jul-20 When the company’s share price first equals the option exercise price ($0.7309) 8-Jul-24 $0.7309 78,419 - - 78,419 78,419
Total options 12,991,719 (250,000) (7,900,000) 4,841,719 4,841,719
For
per
sona
l use
onl
y

74|West African Resources Ltd
31 PARENT ENTITY FINANCIAL INFORMATION
The individual financial statements for the parent entity show the following aggregate amounts:
Parent 2020 2019 $'000 $'000
STATEMENT OF FINANCIAL POSITION Current assets 16,579 18,258 Non-current assets 82,620 77,011 Total assets 99,199 95,269 Current liabilities 990 1,998 Non-current liabilities 272 57 Total liabilities 1,262 2,056 Net assets 97,937 93,213 Equity Issued capital 165,263 162,919 Reserves 9,948 7,917 Accumulated losses (77,274) (77,623) Total equity 97,937 93,213
PROFIT FOR THE REPORTING PERIOD 37 23,219 Income tax benefit - - Total comprehensive profit 37 23,219
Guarantees, commitments and contingencies
There are no guarantees, commitments or contingencies in the parent entity other than $194,507 of rental property lease commitments due within one year (31 December 2019: $187,006).
For
per
sona
l use
onl
y
West African Resources Limited|75
DIRECTORS’ DECLARATION In the opinion of the Directors:
a. The financial statements, notes and the additional disclosures included in the Directors’ Report, designated as audited, of the consolidated entity are in accordance with the Corporations Act 2001 including:
(i) giving a true and fair view of the Group’s financial position as at 31 December 2020 and of its performance for the year then ended; and
(ii) complying with Australian Accounting Standards and Corporations Regulations 2001.
b. There are reasonable grounds to believe that the Company will be able to pay its debts as and when they become due and payable.
c. The financial statements also comply with International Financial Reporting Standards as disclosed in note 1A.
This declaration has been made after receiving the declarations required to be made to the Directors in accordance with Section 295A of the Corporations Act 2001 for the year ended 31 December 2020.
This declaration is signed in accordance with a resolution of the Board of Directors.
RICHARD HYDE Executive Chairman & CEO 26 March 2021
For
per
sona
l use
onl
y

76|West African Resources Limited
AUDITOR’S INDEPENDENCE DECLARATION
As lead auditor for the audit of the consolidated financial report of West African Resources Limited for the year ended 31 December 2020, I declare that to the best of my knowledge and belief, there have been no contraventions of:
a) the auditor independence requirements of the Corporations Act 2001 in relation to the audit; and
b) any applicable code of professional conduct in relation to the audit.
Perth, Western Australia
26 March 2021
B G McVeigh
Partner
For
per
sona
l use
onl
y
West African Resources Ltd|77
INDEPENDENT AUDITOR’S REPORT To the members of West African Resources Limited
Report on the Audit of the Financial Report
Opinion
We have audited the financial report of West African Resources Limited (“the Company”) and its controlled entities (“the Group”), which comprises the consolidated statement of financial position as at 31 December 2020, the consolidated statement of profit or loss and other comprehensive income, the consolidated statement of changes in equity and the consolidated statement of cash flows for the year then ended, and notes to the financial statements, including a summary of significant accounting policies, and the directors’ declaration. In our opinion, the accompanying financial report of the Group is in accordance with the Corporations Act 2001, including: a) giving a true and fair view of the Group’s financial position as at 31 December 2020 and of its
financial performance for the year then ended; and b) complying with Australian Accounting Standards and the Corporations Regulations 2001. Basis for opinion
We conducted our audit in accordance with Australian Auditing Standards. Our responsibilities under those standards are further described in the Auditor’s Responsibilities for the Audit of the Financial Report section of our report. We are independent of the Group in accordance with the auditor independence requirements of the Corporations Act 2001 and the ethical requirements of the Accounting Professional and Ethical Standards Board’s APES 110 Code of Ethics for Professional Accountants (“the Code”) that are relevant to our audit of the financial report in Australia. We have also fulfilled our other ethical responsibilities in accordance with the Code. We believe that the audit evidence we have obtained is sufficient and appropriate to provide a basis for our opinion. Key audit matters
Key audit matters are those matters that, in our professional judgement, were of most significance in our audit of the financial report of the current period. These matters were addressed in the context of our audit of the financial report as a whole, and in forming our opinion thereon, and we do not provide a separate opinion on these matters. We have determined the matters described below to be the key audit matters to be communicated in our report.
For
per
sona
l use
onl
y

78|West African Resources Ltd
Key Audit Matter How our audit addressed the key audit matter
Property, plant and equipment Note 10 to the financial report
The Sanbrado Gold Project transitioned from the development phase to the production phase during the year. The existence, accuracy and completeness of capitalised expenditure incurred as part of the development and construction of the Sanbrado Gold Project was considered a key audit matter. This is due to the size of the capitalised expenditure of $329,587,000. The Group used judgement in the identification and allocation of cost between operating expenditure and capitalised expenditure. The risks we focussed on included:
• The existence of capital expenditure; and
• The capital nature of expenditure
particularly the determination of when the
Sambrado Gold Project was considered
capable of operating at commercial
production and in a manner intended by
the Group.
Our audit procedures included but were not limited to the following:
• We evaluated the Group’s processes and controls
in place with respect to purchasing.
• Assessment of the allocation of costs between
operating expenditure and capital expenditure by
inspecting documentation on a sample basis and
assessing the nature of the underlying activity.
• Challenging the Group’s determination of
commercial production declaration from 1 May
2020 by evaluating the criteria by which the
declaration was made against the underlying
documentation and industry practice.
• Assessing the disclosures in the financial report
against the requirements of the accounting
standards.
• Consideration of any Impairment indicators
Revenue recognition Notes 3 to the financial report
The Group generates revenue predominantly from the sale of gold. The Group recognised sales revenue of $311,167,000 for the year (2019: $1,239,000). Revenue recognition is considered to be a key audit matter given the significance of revenue to the Group’s results as well as the fraud risk around cut-off including:
• An overstatement of revenues through
premature revenue recognition or
recording of fictious revenues.
• Revenue not being recognised when
control is transferred to the customer,
resulting in revenue not being recognised
in the correct accounting period.
Revenue is recognised when control is transferred to the buyer and the amount of revenue can be reliably determined. This occurs for the Group when the refining process is completed and ownership is transferred.
Our audit procedures included but were not limited to the following:
• Understanding the Group’s process for revenue
and controls in place around gold sales.
• Testing all gold sales transactions during the year
to invoice and receipt of cash.
• Assessing the Group’s policies for recognition of
revenue against the requirements of the
accounting standards and checked these were
adequately disclosed in the financial statements.
• Sales cut-off procedures focussing on sales in
December 2020 and January 2021, testing a
sample of transactions to underlying
documentation and assessing the period in which
they were recognised.
For
per
sona
l use
onl
y

West African Resources Ltd|79
Information other than the financial report and auditor’s report thereon
The directors are responsible for the other information. The other information comprises the information included in the Group’s annual report for the year ended 31 December 2020, but does not include the financial report and our auditor’s report thereon. Our opinion on the financial report does not cover the other information and accordingly we do not express any form of assurance conclusion thereon. In connection with our audit of the financial report, our responsibility is to read the other information and, in doing so, consider whether the other information is materially inconsistent with the financial report or our knowledge obtained in the audit or otherwise appears to be materially misstated. If, based on the work we have performed, we conclude that there is a material misstatement of this other information, we are required to report that fact. We have nothing to report in this regard. Responsibilities of the directors for the financial report
The directors of the Company are responsible for the preparation of the financial report that gives a true and fair view in accordance with Australian Accounting Standards and the Corporations Act 2001 and for such internal control as the directors determine is necessary to enable the preparation of the financial report that gives a true and fair view and is free from material misstatement, whether due to fraud or error. In preparing the financial report, the directors are responsible for assessing the ability of the Group to continue as a going concern, disclosing, as applicable, matters related to going concern and using the going concern basis of accounting unless the directors either intend to liquidate the Group or to cease operations, or have no realistic alternative but to do so. Auditor’s responsibilities for the audit of the financial report
Our objectives are to obtain reasonable assurance about whether the financial report as a whole is free from material misstatement, whether due to fraud or error, and to issue an auditor’s report that includes our opinion. Reasonable assurance is a high level of assurance, but is not a guarantee that an audit conducted in accordance with Australian Auditing Standards will always detect a material misstatement when it exists. Misstatements can arise from fraud or error and are considered material if, individually or in the aggregate, they could reasonably be expected to influence the economic decisions of users taken on the basis of this financial report. As part of an audit in accordance with the Australian Auditing Standards, we exercise professional judgement and maintain professional scepticism throughout the audit. We also: - Identify and assess the risks of material misstatement of the financial report, whether due to
fraud or error, design and perform audit procedures responsive to those risks, and obtain audit evidence that is sufficient and appropriate to provide a basis for our opinion. The risk of not detecting a material misstatement resulting from fraud is higher than for one resulting from error, as fraud may involve collusion, forgery, intentional omissions, misrepresentations, or the override of internal control.
- Obtain an understanding of internal control relevant to the audit in order to design audit procedures that are appropriate in the circumstances, but not for the purpose of expressing an opinion on the effectiveness of the Group’s internal control.
- Evaluate the appropriateness of accounting policies used and the reasonableness of accounting estimates and related disclosures made by the directors.
- Conclude on the appropriateness of the directors’ use of the going concern basis of accounting and, based on the audit evidence obtained, whether a material uncertainty exists related to events or conditions that may cast significant doubt on the Group’s ability to continue as a going concern. If we conclude that a material uncertainty exists, we are required to draw attention in our auditor’s report to the related disclosures in the financial report or, if such disclosures are inadequate, to modify our opinion. Our conclusions are based on the audit evidence obtained up to the date of our auditor’s report. However, future events or conditions may cause the Group to cease to continue as a going concern.
For
per
sona
l use
onl
y

80|West African Resources Ltd
- Evaluate the overall presentation, structure and content of the financial report, including the disclosures, and whether the financial report represents the underlying transactions and events in a manner that achieves fair presentation.
We communicate with the directors regarding, among other matters, the planned scope and timing of the audit and significant audit findings, including any significant deficiencies in internal control that we identify during our audit. We also provide the directors with a statement that we have complied with relevant ethical requirements regarding independence, and to communicate with them all relationships and other matters that may reasonably be thought to bear on our independence, and where applicable, related safeguards. From the matters communicated with the directors, we determine those matters that were of most significance in the audit of the financial report of the current period and are therefore the key audit matters. We describe these matters in our auditor’s report unless law or regulation precludes public disclosure about the matter or when, in extremely rare circumstances, we determine that a matter should not be communicated in our report because the adverse consequences of doing so would reasonably be expected to outweigh the public interest benefits of such communication.
Report on the Remuneration Report
Opinion on the Remuneration Report
We have audited the Remuneration Report included within the directors’ report for the year ended 31 December 2020. In our opinion, the Remuneration Report of West African Resources Limited for the year ended 31 December 2020 complies with section 300A of the Corporations Act 2001. Responsibilities
The directors of the Company are responsible for the preparation and presentation of the Remuneration Report in accordance with section 300A of the Corporations Act 2001. Our responsibility is to express an opinion on the Remuneration Report, based on our audit conducted in accordance with Australian Auditing Standards. HLB Mann Judd B G McVeigh Chartered Accountants Partner Perth, Western Australia 26 March 2021
For
per
sona
l use
onl
y

West African Resources Limited|81
ASX ADDITIONAL INFORMATION Additional information required by the Australian Securities Exchange Ltd and not shown elsewhere in this report is as follows. The information is current as at 12 March 2021.
DISTRIBUTION OF SHARES
Distribution Number of holders Securities held 1 – 1,000 534 288,849 1,001 – 5,000 1,270 3,594,282 5,001 – 10,000 764 6,278,189 10,000 – 100,000 1,479 52,065,028 100,001 – and over 372 820,571,527 Total 4,419 882,797,875
The number of shareholdings held in less than marketable parcels is 262.
SUBSTANTIAL SHAREHOLDERS
An extract of the Company’s Register of Substantial Shareholders (who hold 5% or more of the issued capital) is set out below.
Shareholder Name No. of shares held % Holding 1 VANECK ASSOCIATES CORPORATION 96,355,007 10.9% 2 L1 CAPITAL PTY LTD 66,733,887 7.6% 3 SPROTT INC. 45,648,659 5.2% 4 VANGUARD GROUP 44,624,433 5.1% Total 253,361,986 28.7%
TWENTY LARGEST SHAREHOLDERS
Shareholder Name No. of shares held % Holding 1 HSBC CUSTODY NOMINEES (AUSTRALIA) LIMITED 259,299,708 29.37% 2 J P MORGAN NOMINEES AUSTRALIA PTY LIMITED 122,933,748 13.93% 3 CITICORP NOMINEES PTY LIMITED 54,678,863 6.19% 4 CS THIRD NOMINEES PTY LIMITED <HSBC CUST NOM AU LTD 13 A/C> 41,337,178 4.68% 5 BNP PARIBAS NOMS PTY LTD <DRP> 32,833,202 3.72% 6 MR PHILLIP RICHARD PERRY 28,235,834 3.20% 7 HSBC CUSTODY NOMINEES (AUSTRALIA) LIMITED-GSCO ECA 23,317,629 2.64% 8 MR RICHARD HYDE 19,353,433 2.19% 9 NATIONAL NOMINEES LIMITED 18,730,825 2.12%
10 BNP PARIBAS NOMINEES PTY LTD SIX SIS LTD <DRP A/C> 16,201,750 1.84% 11 AIGLE ROYAL CAPITAL PTY LTD <AIGLE ROYAL CAPITAL DIS A/C> 14,100,000 1.60% 12 STICHTING LICHFIELD US\C <A/C 051 52041 9> 13,250,000 1.50% 13 ZERO NOMINEES PTY LTD 12,500,000 1.42% 14 BNP PARIBAS NOMINEES PTY LTD <IB AU NOMS RETAILCLIENT DRP> 12,444,461 1.41% 15 AIGLE ROYAL CAPITAL PTY LTD <AIGLE ROYAL CAPITAL DIS A/C> 8,900,000 1.01% 16 UBS NOMINEES PTY LTD 5,064,934 0.57% 17 BNP PARIBAS NOMINEES PTY LTD <AGENCY LENDING DRP A/C> 4,883,292 0.55%
18 MR GRAEME JOHN HAINES + MRS SHARNI GAY HAINES + MR MALCOLM ARNOLD HAINES <G & S HAINES SF A/C> 4,760,700 0.54%
19 LUJETA PTY LTD <THE MARGARET ACCOUNT> 3,846,154 0.44% 20 MAJI INVESTMENTS PTY LTD 2,001,717 0.23%
Total 698,673,428 79.14%
For
per
sona
l use
onl
y

82|West African Resources Ltd
STOCK EXCHANGE LISTING
Listing has been granted for the ordinary shares (ASX code: WAF) of the Company on the Australian Securities Exchange Limited "ASX") with 882,797,875 ordinary shares on the Company’s register.
VOTING RIGHTS
All shares carry one vote per unit without restriction.
UNLISTED OPTIONS
12,127,848 options and performance rights are held by 33 option holders.
Neither options nor performance rights carry a right to vote.
For
per
sona
l use
onl
y

West African Resources Limited 83
SUMMARY OF TENEMENTS AT 11 MARCH 2021
Tenement name Registered holder % held Tenement number Grant
date Expiry
date Tenement
type Area ( km2) Geographical location
Damongto4 Wura Resources Pty Ltd SARL 100% No 2018-184/MMC/SG/DGCM 5-Sep-18 1-Mar-21 EL 26 Ganzourgou Province
Goudré1 Wura Resources Pty Ltd SARL 100% No 2018-186/MMC/SG/DGCM 5-Sep-18 23-Mar-21 EL 175 Ganzourgou Province
Manessé II Tanlouka SARL 100% N2020-254/MMC/SG/DGCM 13-Nov-20 12-Nov-23 EL 86.67 Ganzourgou Province
Bollé2 Wura Resources Pty Ltd SARL 100% No 17 – 223//MMC/SG/DGCM 21-Nov-20 20-Nov-20 EL 205.5 Ganzourgou Province
Zam Sud4 Wura Resources Pty Ltd SARL 100% No 2018-183/MMC/SG/DGCM 5-Sep-18 1-Mar-21 EL 17.46 Ganzourgou Province
Diakora2 Jean Donessoune 100% No 2017-140/MMC/SG/DGCM 7-Sep-17 6-Sep-20 EL 58.66 Comoe Province
Dounougou2 Jean Donessoune 100% No 2017-139/MMC/SG/DGCM 7-Sep-17 6-Sep-20 EL 132.57 Comoe Province
Tieradeni I2 Jean Donessoune 100% No 2017-138/MMC/SG/DGCM 7-Sep-17 6-Sep-20 EL 141.5 Comoe Province
Nakomgo3 Kiaka Gold SARL 100% No 2017-179/ MMC/SG/DGCM 24-Oct-17 23-Oct-20 EL 249.19 Bazega and Ganzourgou Provinces
Mankarga V3 Jacques Teegawêndé Zongo 100% No 2020-170/ MMC/SG/DGCM 16-Jul-20 15-Jul-23 EL 52.595 Ganzourgou Province
Sanbrado Société des Mines de Sanbrado SA 90%
Décret No 2017 – 104/PRES/PM/MEMC/MINEFID/MEEVCC Arrêté No 2018-139/MMC/SG/DGMG
13-Mar-17 12-Mar-24 ML 25.9 Ganzourgou Province
1 Exceptional renewal application in progress. 2 Permit renewal has been approved. Waiting for the new permit order to be issued. 3 Permit renewal approval pending. 4 Permit renouncement in progress.
For
per
sona
l use
onl
y

West African Resources Limited ACN 121 539 375 ABN 70 121 539 375
T: + 61 8 9481 7344 E: [email protected] W: westafricanresources.com
PO Box: PO Box 1412, Subiaco WA 6904
Principal Office: Level 1, 1 Alvan Street, Subiaco WA 6008
ASX: WAF
For
per
sona
l use
onl
y


![From: Kevin Lewis [mailto:Kevin.Lewis@asx.com.au] … Kevin Lewis [mailto:Kevin.Lewis@asx.com.au] Sent: Tuesday, 6 February 2018 11:55 AM To: Gary Morgan Cc: Rick Holliday-Smith; Dominic](https://img.pdfslide.net/doc/110x75/5b00a7c47f8b9ad85d8cead6/from-kevin-lewis-mailtokevinlewisasxcomau-kevin-lewis-mailtokevinlewisasxcomau.jpg)