Embed Size (px)
Citation preview
City Auditor’s 2020 Audit of City
Employees’ Workforce Diversity and Salary Trends
Report# 2020/21-10|November 2020
Jorge Oseguera, City Auditor
Farishta Ahrary, Principal Fiscal Policy Analyst
Chevelle Jackson, Fiscal Policy Analyst
Research and Analysis Division
Office of the City Auditor 1
November 2020
The City of Sacramento’s Office of the City Auditor can be contacted by phone at 916-808-7270 or at the address below:
915 I Street
MC09100
Historic City Hall, Floor 2
Sacramento, CA 95814
Whistleblower Hotline
In the interest of public accountability and being responsible stewards of public funds, the City has established a whistleblower hotline. The hotline protects the anonymity of those leaving tips to the extent permitted by law. The service is available 24 hours a day, 7 days week, 365 days per year. Through this service, all phone calls and emails will be received
anonymously by third party staff.
Report online at https://www.reportlineweb.com/cityofsacramento or call toll-free: 888-245-8859.
Office of the City Auditor 2
November 2020
Table of Contents Fact Sheet ......................................................................................................................................................................................................... 4
Introduction ...................................................................................................................................................................................................... 5
Background ....................................................................................................................................................................................................... 5
Federal Reporting Requirements ............................................................................................................................................................................... 5
Process for Collecting Ethnicity/Racial Information .................................................................................................................................................. 6
Process for Collecting Gender Information ............................................................................................................................................................... 8
Updated Reporting Process ....................................................................................................................................................................................... 8
Diversity in the Workplace ....................................................................................................................................................................................... 10
Gender Pay Gap ....................................................................................................................................................................................................... 10
Improvements since Last Audit ....................................................................................................................................................................... 14
Opt-in Survey ........................................................................................................................................................................................................... 17
City of Sacramento Gender and Ethnic Diversity Dashboard .................................................................................................................................. 18
Objective, Scope, and Methodology ................................................................................................................................................................ 19
Chapter 1: Demographics of City of Sacramento Residents.............................................................................................................................. 20
Chapter 2: Demographics of City of Sacramento Employees ............................................................................................................................ 23
Chapter 3: Gender Analysis of City of Sacramento Employees ......................................................................................................................... 31
Chapter 4: Ethnicity/Race Analysis of City of Sacramento Employees .............................................................................................................. 38
Chapter 5: Salary Analysis of City of Sacramento Employees ........................................................................................................................... 48
Average Salary of City Employees as of July 1, 2020 ............................................................................................................................................... 48
Average Salary of City Employees 2016-2020 ......................................................................................................................................................... 58
Relative Earnings of Male and Female City Employees ........................................................................................................................................... 69
Chapter 6: Analysis of Each Department Over Time ........................................................................................................................................ 73
Office of the City Auditor 3
November 2020
Appendix 1: Human Resources Department’s Management Definitions .......................................................................................................... 90
Appendix 2: Human Resources Department’s Management Classes ................................................................................................................ 94
Department Response ................................................................................................................................................................................... 101
4
Office of the City Auditor 5
November 2020
Introduction In accordance with the City Auditor’s 2020/21 Audit Plan, we have completed the 2020 Audit of City Employees’ Workforce Diversity and Salary Trends. We believe this report meets our objective of providing an informative overview of the City of Sacramento employees, in accordance with Generally Accepted Government Auditing Standards Section 8.128. We did not seek to test internal controls, such as those related to the City’s hiring, development, management, and retention of city employees. We conducted this audit in accordance with Generally Accepted Government Auditing Standards. Those standards require that we plan and perform the audit to obtain sufficient, appropriate evidence to provide a reasonable basis for our findings and conclusions based on our audit objectives. We believe that the evidence obtained provides a reasonable basis for our findings and conclusions based on our audit objectives. The City Auditor’s Office would like to thank the City Manager’s Office; the City Attorney’s Office, and the Human Resources Department.
Background In May 2016, the City Council directed the City Auditor to conduct an assessment of the diversity of City of Sacramento employees and compare the results to the demographics of the City of Sacramento residents 1. The assessment was to include the City’s employee demographics related to age, ethnicity/race 2, and gender, as well as a breakdown of the demographics as they relate to different employee classifications and salaries. The City Council subsequently requested that the City Auditor conduct this review annually. This report will analyze City employee demographics as of July 1, 2020 and analyze employee diversity trends from 2016 through 2020.
Federal Reporting Requirements The City of Sacramento is required by federal law to maintain certain employee demographics and report biennially (every odd-numbered year) to the Equal Employment Opportunity Commission (EEOC). Title VII of the Civil Rights Act of 1964, as amended by the Equal Employment Opportunity Act of 1972, requires all state and local governments that have 15 or more employees to record demographic information of City employees and report the data to EEOC.
1 This request was made during the May 10, 2016 City Council Meeting: http://sacramento.granicus.com/player/clip/3807?view_id=&caption_id=2988780&redirect=true 2 Throughout the report, we will use ethnicity/race due to possible difference of opinion or interpretation of the terms.
Office of the City Auditor 6
November 2020
EEOC uses the following race and ethnicity/racial categories:
• Hispanic or Latino - A person of Cuban, Mexican, Puerto Rican, South or Central American, or other Spanish culture or origin regardless of race.
• White (Non-Hispanic or Latino) – All persons having origins in any of the original peoples of Europe, North Africa, or the Middle East. • Black or African American (Non-Hispanic or Latino) - A person having origins in any of the Black racial groups of Africa. • Asian (Non-Hispanic or Latino) - A person having origins in any of the original peoples of the Far East, Southeast Asia, or the Indian
Subcontinent, including, for example, Cambodia, China, India, Japan, Korea, Malaysia, Pakistan, the Philippine Islands, Thailand, and Vietnam.
• Native Hawaiian or Other Pacific Islander (Non-Hispanic or Latino) - A person having origins in any of the peoples of Hawaii, Guam, Samoa, or other Pacific Islands.
• American Indian or Alaska Native (Non-Hispanic or Latino) - A person having origins in any of the original peoples of North and South America (including Central America), and who maintain tribal affiliation or community attachment.
• Two or More Races (Non-Hispanic or Latino) - Persons who identify with two or more racial categories named above. To fulfill EEOC reporting requirements, the City’s Human Resources Department uses demographic information from the electronic Citywide Accounting and Personnel System (eCAPS) to populate the required EEOC reports.
Process for Collecting Ethnicity/Racial Information When completing an employment application for the City of Sacramento, prospective employees are asked to disclose their ethnicity/race. Once hired, the Human Resources Department inputs the new employee’s ethnic/racial information into eCAPS. Since the selection of an ethnic/racial category on the application is voluntary, some applicants may choose not to select an ethnicity, resulting in “NOTSPEC” being entered into eCAPS. The City of Sacramento uses the following ethnic/racial categories in eCAPS:
• AMINDIAN: Abbreviation for American Indian or Alaska Native - A person having origins in any of the original peoples of North and South America (including Central America), and who maintains tribal affiliation or community attachment.
• ASIAN: A person having origins in any of the original peoples of the Far East, Southeast Asia, or the Indian subcontinent, including for example Cambodia, China, Japan, Korea, Malaysia, Pakistan, Thailand, and Vietnam.
• BLACK: A person having origins in any of the Black racial groups of Africa. • FILIPINO: All persons having origins from the Philippine Islands. • HAWPACIFIC: Abbreviation for Native Hawaiian or other Pacific Islander - A person having origins in any of the peoples of Hawaii, Guam,
Office of the City Auditor 7
November 2020
Samoa, or other Pacific Islands. • HISPANIC: A person of Cuban, Mexican, Puerto Rican, South or Central American, or other Spanish culture or origin, regardless of race. • WHITE: All persons having origins in any of the original peoples of Europe. • MENA: Abbreviation for Middle Eastern or North African - All persons having origins in any of the original peoples of the Middle East or
North Africa. • NOTSPEC: Abbreviation for Not Specified - Employee declined to answer. • TWOMORE: Persons who identify with two or more racial categories named above.
When reporting City demographics to the EEOC, employees identified as “FILIPINO” are reported under the EEOC’s “Asian” category and employees identified as “MENA” are reported under the EEOC’s “White” category. Additionally, the Human Resources Department confirmed that they do not report employees designated “NOTSPEC” to the EEOC. Since the 2017 Audit of the City’s Gender and Ethnic Diversity report, the Human Resources Department developed a process to designate ethnicity and gender data for those employees who do not self-select. 3
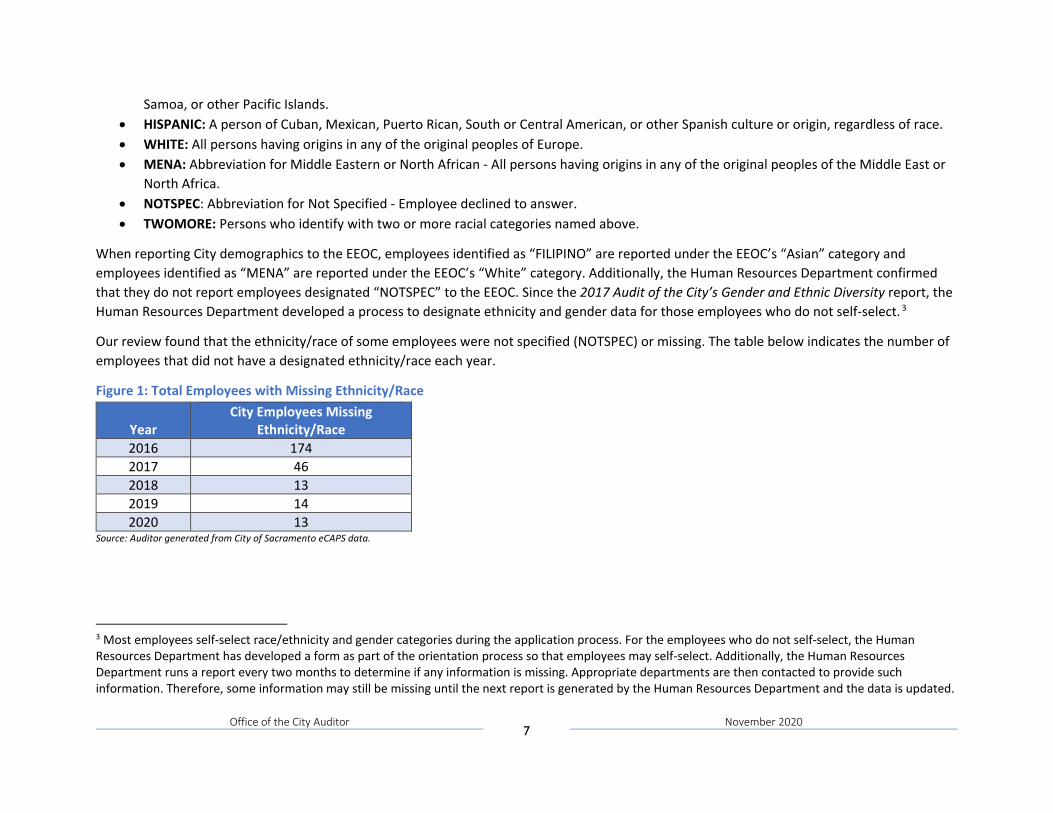
Our review found that the ethnicity/race of some employees were not specified (NOTSPEC) or missing. The table below indicates the number of employees that did not have a designated ethnicity/race each year.
Figure 1: Total Employees with Missing Ethnicity/Race
Year City Employees Missing
Ethnicity/Race 2016 174 2017 46 2018 13 2019 14 2020 13
Source: Auditor generated from City of Sacramento eCAPS data.
3 Most employees self-select race/ethnicity and gender categories during the application process. For the employees who do not self-select, the Human Resources Department has developed a form as part of the orientation process so that employees may self-select. Additionally, the Human Resources Department runs a report every two months to determine if any information is missing. Appropriate departments are then contacted to provide such information. Therefore, some information may still be missing until the next report is generated by the Human Resources Department and the data is updated.
Office of the City Auditor 8
November 2020
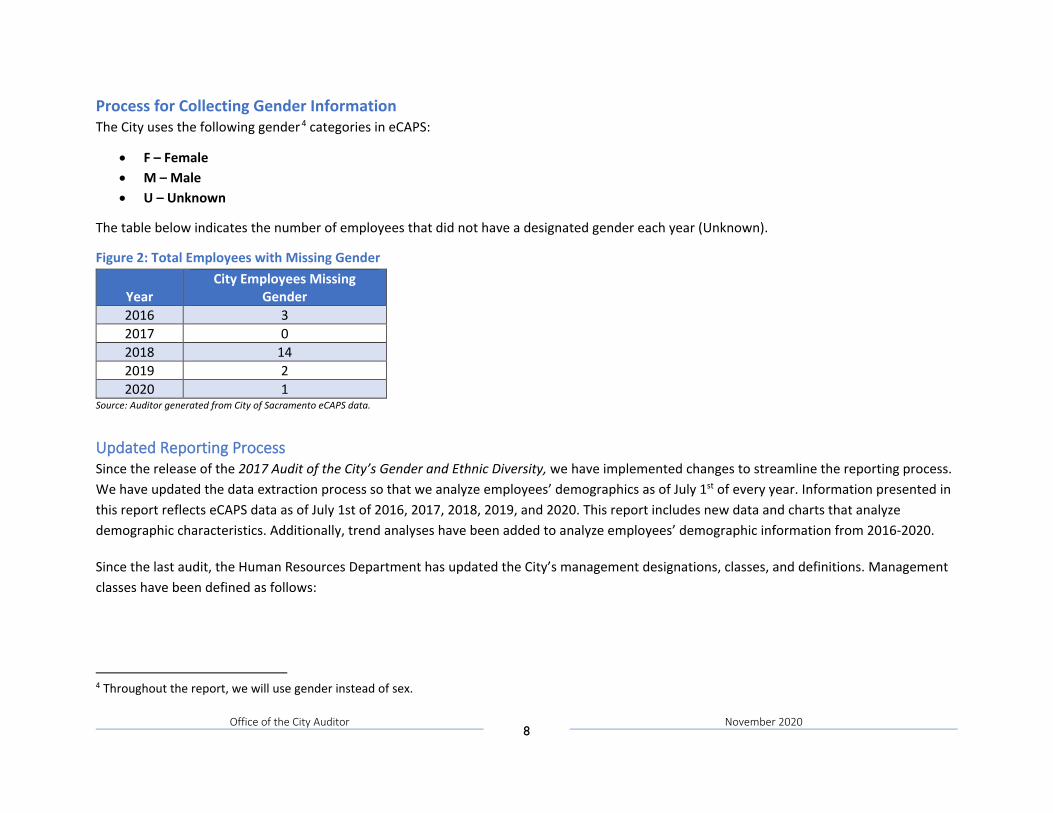
Process for Collecting Gender Information The City uses the following gender 4 categories in eCAPS:
• F – Female • M – Male • U – Unknown
The table below indicates the number of employees that did not have a designated gender each year (Unknown).
Figure 2: Total Employees with Missing Gender
Year City Employees Missing
Gender 2016 3 2017 0 2018 14 2019 2 2020 1
Source: Auditor generated from City of Sacramento eCAPS data.
Updated Reporting Process Since the release of the 2017 Audit of the City’s Gender and Ethnic Diversity, we have implemented changes to streamline the reporting process. We have updated the data extraction process so that we analyze employees’ demographics as of July 1st of every year. Information presented in this report reflects eCAPS data as of July 1st of 2016, 2017, 2018, 2019, and 2020. This report includes new data and charts that analyze demographic characteristics. Additionally, trend analyses have been added to analyze employees’ demographic information from 2016-2020.
Since the last audit, the Human Resources Department has updated the City’s management designations, classes, and definitions. Management classes have been defined as follows:
4 Throughout the report, we will use gender instead of sex.
Office of the City Auditor 9
November 2020
• Mid-Level: Responsible for one or more program(s) or section(s) of varied complexity; makes decisions that impact daily operations; typically reports directly or indirectly to a division manager and typically manages clerical, maintenance, technical and/or professional employees.
• Senior: Responsible for a division; directs the development and implementation of division goals and strategic plans; oversees the operation of division activities and functions; monitors organizational structure, staff assignments, service levels, and administrative systems; typically reports directly to a department head and typically manages mid-level managers.
• Executive: Responsible for a department or multiple departments; directs the development and implementation of department goals
and strategic plans; oversees the operation of department activities and functions; establishes organizational structure, staff assignments, service levels, and administrative systems; makes critical decisions with Citywide impact; typically reports directly to the City Manager or Mayor and Council, typically manages senior managers; and retains final hiring authority.
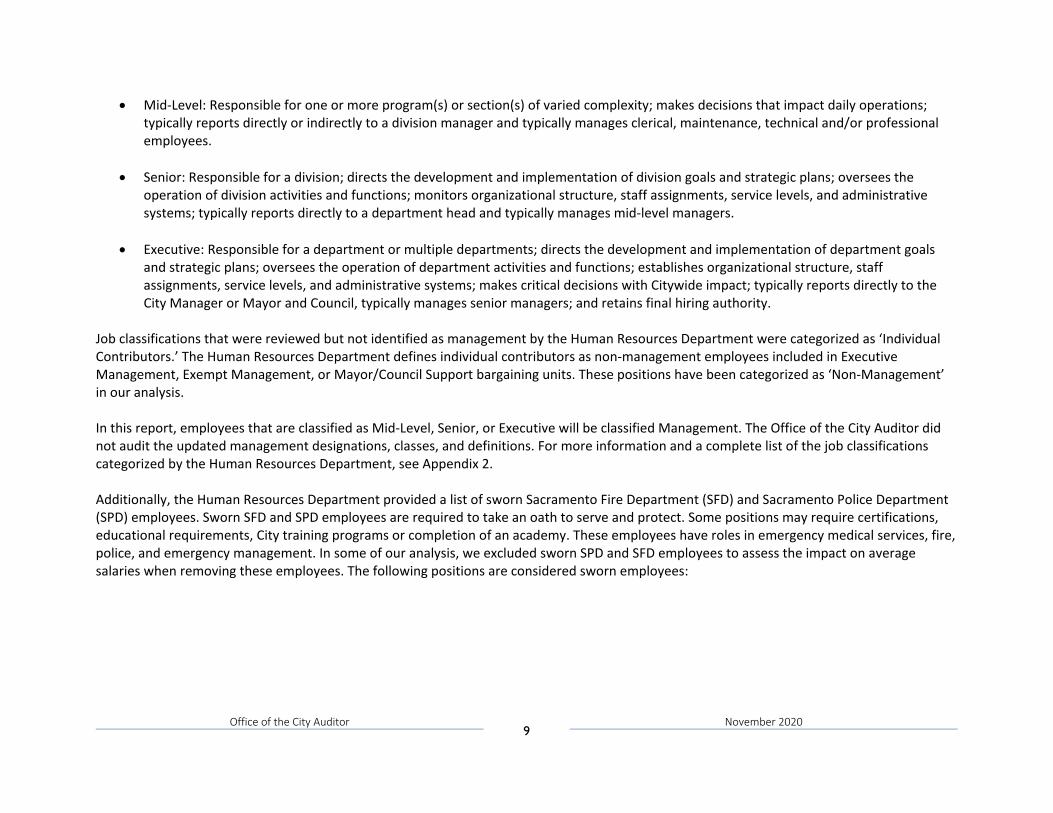
Job classifications that were reviewed but not identified as management by the Human Resources Department were categorized as ‘Individual Contributors.’ The Human Resources Department defines individual contributors as non-management employees included in Executive Management, Exempt Management, or Mayor/Council Support bargaining units. These positions have been categorized as ‘Non-Management’ in our analysis. In this report, employees that are classified as Mid-Level, Senior, or Executive will be classified Management. The Office of the City Auditor did not audit the updated management designations, classes, and definitions. For more information and a complete list of the job classifications categorized by the Human Resources Department, see Appendix 2. Additionally, the Human Resources Department provided a list of sworn Sacramento Fire Department (SFD) and Sacramento Police Department (SPD) employees. Sworn SFD and SPD employees are required to take an oath to serve and protect. Some positions may require certifications, educational requirements, City training programs or completion of an academy. These employees have roles in emergency medical services, fire, police, and emergency management. In some of our analysis, we excluded sworn SPD and SFD employees to assess the impact on average salaries when removing these employees. The following positions are considered sworn employees:
Office of the City Auditor 10
November 2020
Figure 3: Sworn Employee Positions Sworn Classes - Sacramento Fire Department & Sacramento Police Department
Deputy Fire Chief Fire Investigator I Police Chief Deputy Police Chief Fire Investigator II Police Lieutenant Fire Assistant Chief Fire Marshal Police Officer Fire Battalion Chief Fire Prevention Officer I Police Sergeant Fire Battalion Chief (Admin) Fire Prevention Officer II Reserve Police Officer I Fire Captain Firefighter Reserve Police Officer II Fire Captain (Admin) Firefighter (Admin) Reserve Police Officer III Fire Chief Firefighter (Paramedic-Admin) Reserve Police Sergeant Fire Engineer Police Captain Senior Fire Prevention Officer Fire Engineer (Admin)
Source: The Human Resources Department
Diversity in the Workplace Conducting annual reviews of gender and ethnicity throughout the City of Sacramento can help assess progress over time. The report contains trend analyses that analyzes past trends of gender, ethnicity, and average salary over time within the City of Sacramento.
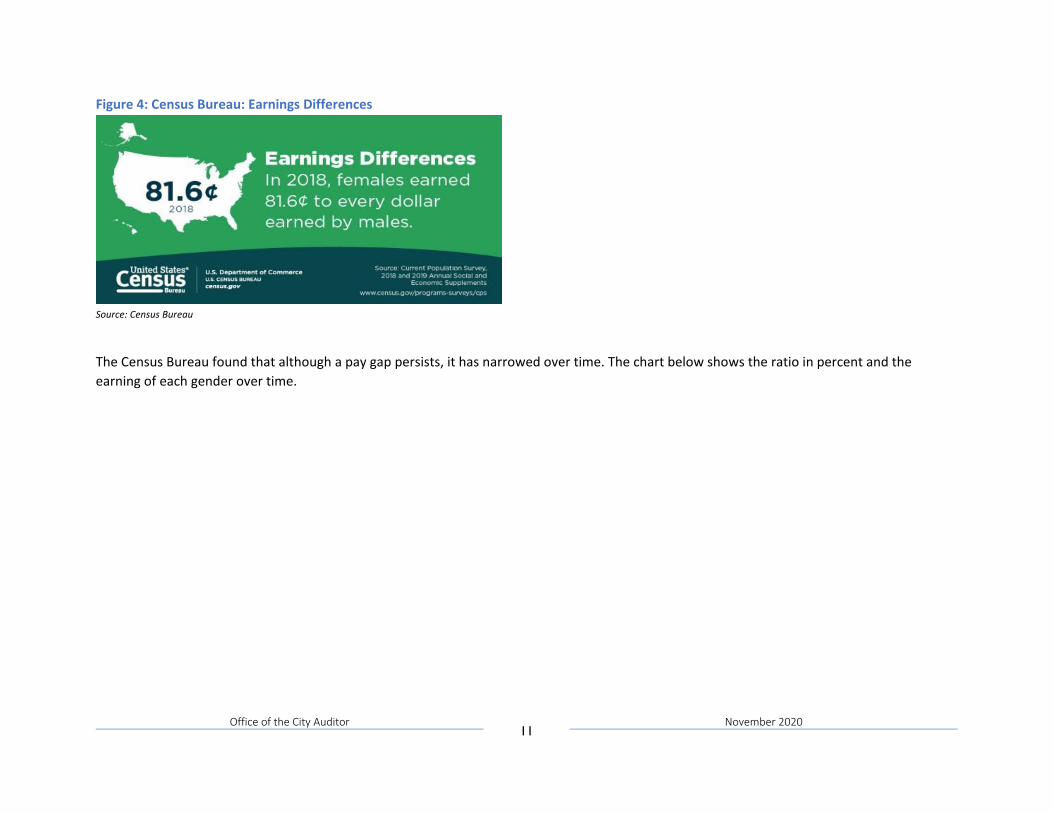
Gender Pay Gap The National Committee on Pay Equity first observed Equal Pay Day March 31, 1996 as an event to illustrate the pay gap between men’s and women’s wages. The U.S. Census Bureau uses data from the Current Population Survey (CPS) to continue pay gap studies of full-time employees over time. The CPS obtains demographic and labor force data from a sample of 600,000 occupied households monthly. It also uses the median earnings of full-time workers to determine the pay gap between men and women. The most recent report found that it will take until 2059 for women to receive equal pay. 5 In figure 4 below, the Census reported the earnings differences between genders.
5 Women Still Have to Work Three Months Longer to Equal What Men Earned in a Year, Census Bureau, 2020 https://www.census.gov/library/stories/2020/03/equal-pay-day-is-march-31-earliest-since-1996.html
Office of the City Auditor 11
November 2020
Figure 4: Census Bureau: Earnings Differences
Source: Census Bureau
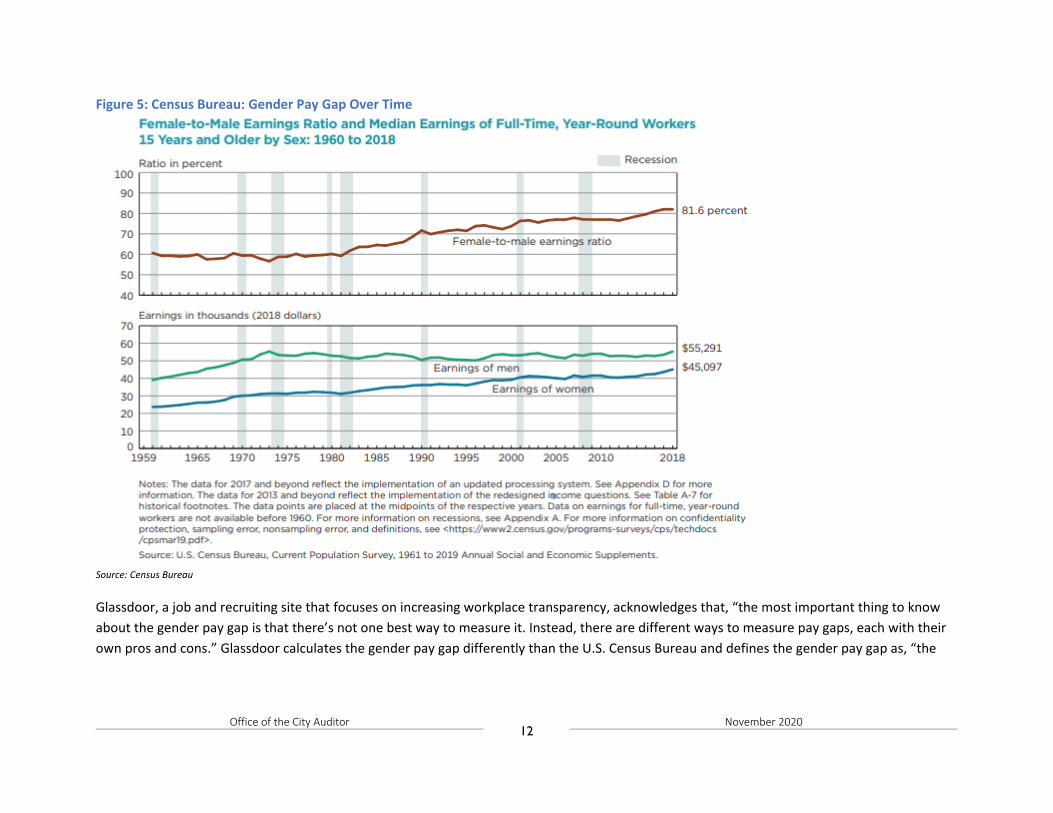
The Census Bureau found that although a pay gap persists, it has narrowed over time. The chart below shows the ratio in percent and the earning of each gender over time.
Office of the City Auditor 12
November 2020
Figure 5: Census Bureau: Gender Pay Gap Over Time
Source: Census Bureau
Glassdoor, a job and recruiting site that focuses on increasing workplace transparency, acknowledges that, “the most important thing to know about the gender pay gap is that there’s not one best way to measure it. Instead, there are different ways to measure pay gaps, each with their own pros and cons.” Glassdoor calculates the gender pay gap differently than the U.S. Census Bureau and defines the gender pay gap as, “the
Office of the City Auditor 13
November 2020
difference between average pay for men and women, both before and after we’ve accounted for differences among workers in education, experience, job roles, employee performance and other factors aside from gender that affect pay.” 6 The Economic Policy Institute, a nonprofit think tank that conducts research and analysis on the economic status of America, examines the gender gap and if it exists. They acknowledge, “the presence of alternative ways to measure the gap can create a misconception that data on the gender wage gap are unreliable. However, the data on the gender wage gap are remarkably clear and (unfortunately) consistent about the scale of the gap. In simple terms, that no matter how you measure it, there is a gap.” 7 According to the Economic Policy Institute,
The most common analytical mistake people make when discussing the gender wage gap is to assume that as long as it is measured “correctly,” it will tell us precisely how much gender-based discrimination affects what women are paid.
Specifically, some people note that the commonly cited measures of the gender wage gap do not control for workers’ demographic characteristics (such measures are often labeled unadjusted). They speculate that the “unadjusted” gender wage gap could simply be reflecting other influences, such as levels of education, labor market experiences, and occupations. And because gender wage gaps that are “adjusted” for workers’ characteristics (through multivariate regression) are often smaller than unadjusted measures, people commonly infer that gender discrimination is a smaller problem in the American economy than thought.
However, the adjusted gender wage gap really only narrows the analysis to the potential role of gender discrimination along one dimension: to differential pay for equivalent work. But this simple adjustment misses all of the potential differences in opportunities for men and women that affect and constrain the choices they make before they ever bargain with an employer over a wage. While multivariate regression can be used to distill the role of discrimination in the narrowest sense, it cannot capture how discrimination affects differences in opportunity.
Although we did not audit the City’s gender pay gap in this report, we performed a high-level review by comparing the average annual base salary of employees by gender and ethnicity/race. Some employees are eligible for, and receive, supplemental pay such as overtime, incentives, and allowances that are not captured in this analysis.
6 How to Analyze Your Gender Pay Gap: An Employer's Guide, Glassdoor, 2017, https://www.glassdoor.com/research/app/uploads/sites/2/2019/03/GD_Report_AnalyzingGenderPayGap_v2-2.pdf 7 What is the gender pay gap and is it real?, Economic Policy Institute, 2016, https://www.epi.org/publication/what-is-the-gender-pay-gap-and-is-it-real/
Office of the City Auditor 14
November 2020
Improvements since Last Audit Since the release of the 2017 Audit of the City’s Gender and Ethnic Diversity in January 2018, various improvements, programs, and recommendations have been implemented to help build a more representative, equitable, and inclusive City of Sacramento.
The Office of the City Manager
In July 2018, the Office of the City Manager hired a Diversity and Equity Manager and created the Office of Diversity and Equity. The Office of Diversity and Equity is committed to leading efforts to build a more representative, equitable, and inclusive City of Sacramento. The Diversity and Equity Manager develops, organizes, implements, manages, and evaluates Citywide diversity, equity, and inclusion programs and activities. The three priorities of the Diversity and Equity Manager for FY 2018-19 were: Priority #1 Complete the Local and Regional Government Alliance on Race & Equity (GARE) Cohort (Completed in May 2019) -- From December 2018 through May 2019, 12 staff leaders from the City of Sacramento completed the GARE’s Northern California learning cohort to build capacity and strategic planning that embeds racial equity in decision making and outcomes. From June through November 2019, the learning cohort continued to meet to draft a five-year equity action plan focused on workforce equity.
Priority #2 Develop a Race & Gender Equity Action Plan (2020-2025) (Completed in January 2020) - Race & Gender Equity Action Plan (2020-2025) serves as a living road map to guide the work of all City departments and offices to organize and operationalize a racial equity lens to cultivate a City workforce that is more reflective of the community we serve.
Priority #3 Pilot an Equity & Inclusion Leadership Series (EILS)
Office of the City Auditor 15
November 2020
Developed in collaboration with the City of Sacramento’s Human Resources Department’s Organizational Development Team, this pilot series offered a variety of learning and training opportunities that included D&logues, 5 Approaches to Diversity & Inclusion, Equity Choice Points in Decision Making and Performance Management. The EILS will resume with new offerings in 2021.
As of October 2020, the Office of the City Manager has completed the following: • Released the 2018 Ethnicity & Gender Diversity Report which reviewed the City’s workforce and efforts to diversify the
organization in April 2019. • In December 2018, became a member and participant in Government Alliance on Race and Equity (GARE) and completed the
cohort in May 2019. • Developed a draft of the 5-year Race and Gender Equity Action Plan (RGEAP) focused on workforce equity in January 2020. • In direct collaboration with HR/Organizational Development conducted a virtual 21 Day Racial Equity Habit Building
Challenge as part of the Equity & Inclusion Leadership Series in August 2020. • Worked with the Human Resources Department to develop and finalize the Citywide Recruitment, Hiring and Selection
Manual in September 2020. • Began the roll out of the RGEAP to all city departments in October 2020.
Office of the City Auditor 16
November 2020
The Human Resources Department
The Human Resources department has implemented all three of our recommendations in the 2017 Audit of the City’s Gender and Ethnic Diversity:
1. Develop a process to designate ethnicity/race and gender data for those employees who do not self-select. 2. Update the City’s information systems and develop controls to ensure all required employees are reported to the EEOC. 3. Work with the EEOC to determine what actions, if any, are required to correct the 2017 EEO-4 report.
The implementation of these recommendations improved data collection processes. For example, the number of full-time and part-time employees who did not specify their ethnicity/race in eCAPS decreased from 174 in 2016 to 13 in 2020. Additionally, the number of full-time and part-time employees who did not specify their gender in eCAPS decreased from three in 2016 to one in 2020. To determine the ethnicity/race of employees that did not self-report, the Human Resources Department requested managers to complete a “visual” determination of the employee’s ethnicity/race or gender in accordance with EEOC requirements. Designating the ethnicity/race and gender data for employees who do not self-select allows the City to be compliant with the EEOC. Additionally, since the release of the initial audit, additional ethnic/racial groups were added to eCAPS. During the 2016 Audit of the City’s Gender and Ethnic Diversity, City employees did not have the ability to select MENA or TWOMORE. Therefore, the number of MENA and TWOMORE employees have increased. The Human Resources Department also explained that as of February 28, 2020, an applicant can choose from three gender options: male, female, and non-binary when applying for a position with the City. However, eCAPS has not yet been updated to allow for the three options for employees. When an applicant that is subsequently hired by the City selects non-binary in their application, their gender is entered into eCAPS as Unknown.
In addition, the Human Resources Department highlighted the following accomplishments in their FY 2020/21 Approved Budget:
• Conducted a Request for Proposal for citywide classification and compensation study. • Completed training with Government Alliance on Race and Equity (GARE), a national network of governments working to achieve racial
equity and advancement opportunities for all. • Partnered with the City Manager’s Office and Diversity and Equity Manager to develop and implement an Equity and Inclusion Leadership
Series for managers/supervisors and all other employees. • Implemented new requirements for executive recruitment firms to increase diversity accountability and gender representation among
applicants.

Office of the City Auditor 17
November 2020
Opt-in Survey With feedback from the Diversity and Equity Manager, City Attorney’s Office, Human Resources Department and Sacramento LGBTQ+ Community Center, the Office of the City Auditor used Survey Monkey, an opt-in survey software, to collect and analyze employee data that is not available in eCAPS. We used Survey Monkey to create a survey to measure employee perception of inclusion and work environment. The survey also included additional demographic questions such as the sexual orientation and gender identity of survey respondents. The Office of the City Auditor conducted the citywide 2020 Diversity, Equity, and Inclusion Survey from February 25, 2020 to March 24, 2020 . We distributed the survey to City employees through their City email account. Figure 6 displays the survey announcement graphic that was included in the citywide email to employees. We highlighted the purpose of the survey and topics that were covered in the survey. Figure 6: 2020 Diversity, Equity, and Inclusion Survey Announcement
Source: Auditor generated graphic.
8 The original survey close date was March 20, 2020. We extended the survey close date to gather more responses.
Office of the City Auditor 18
November 2020
There were 4,656 full-time and part-time employees when the survey was launched on February 25, 2020. We received a total of 787 survey responses (almost 17 percent of City staff participated in the survey). City employees provided responses to questions that measured employee perception of inclusion and work environment, provided informative feedback in open-ended response questions, and provided demographic information that will allow the City to expand inclusion measures. The results of this survey have been released in a separate report.
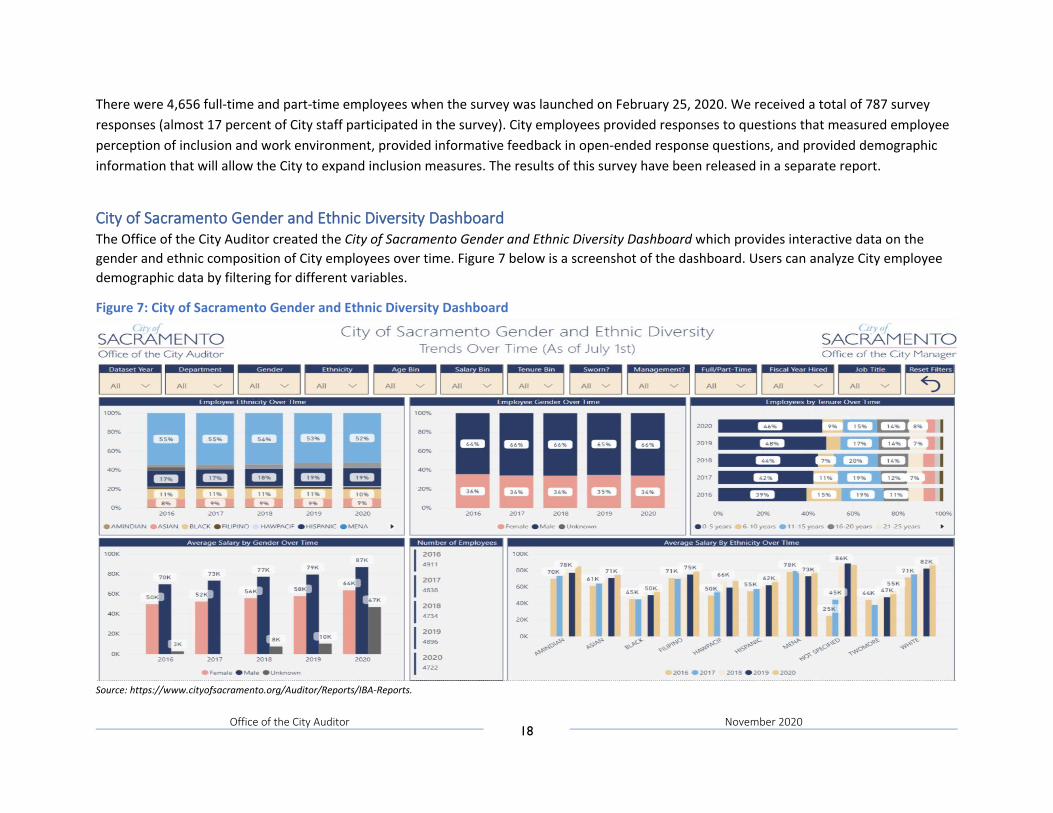
City of Sacramento Gender and Ethnic Diversity Dashboard The Office of the City Auditor created the City of Sacramento Gender and Ethnic Diversity Dashboard which provides interactive data on the gender and ethnic composition of City employees over time. Figure 7 below is a screenshot of the dashboard. Users can analyze City employee demographic data by filtering for different variables.
Figure 7: City of Sacramento Gender and Ethnic Diversity Dashboard
Source: https://www.cityofsacramento.org/Auditor/Reports/IBA-Reports.
Office of the City Auditor 19
November 2020
Objective, Scope, and Methodology Similar to previous diversity audits, the objective of this audit was to assess the diversity of City employees as it compares to the diversity of City of Sacramento residents. This year’s report also has trend analyses which examine City employees’ demographics from 2016 to 2020. Our analysis focused on full-time and part-time employees as of July 1st of each year. To conduct this assessment, we primarily analyzed employee personnel information through eCAPS. The eCAPS data included information such as the identification number, name, salary rate, position title, management level, bargaining unit, gender, ethnicity/race, and employment date of each employee. To determine the demographics of City of Sacramento residents, we relied on the U.S. Census Bureau’s 2016-2019 American Community Survey for ethnicity/race, sex, and household income. In addition, we used LGBTQ+ statistics from Gallup, a global analytics and advice firm that conducts surveys. 9
9 Throughout the report, we will use the term LGBTQ+ to represent lesbian, gay, bisexual, transgender, Queer, and other communities.
Office of the City Auditor 20
November 2020
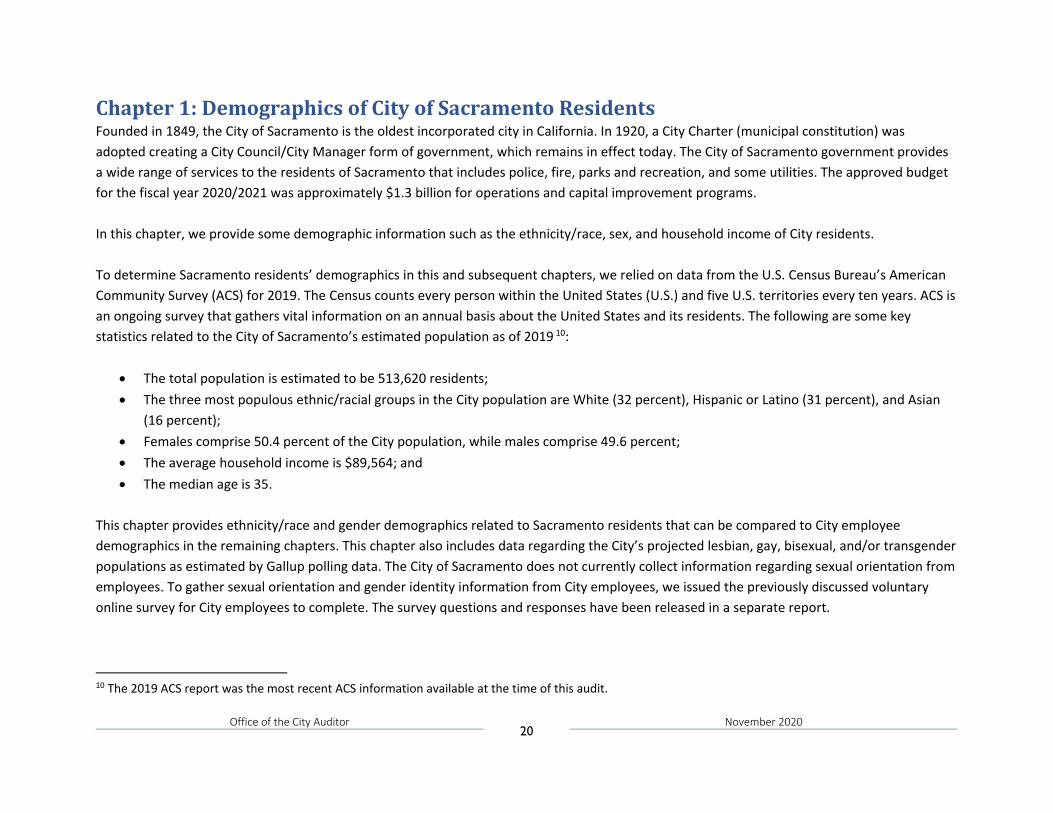
Chapter 1: Demographics of City of Sacramento Residents Founded in 1849, the City of Sacramento is the oldest incorporated city in California. In 1920, a City Charter (municipal constitution) was adopted creating a City Council/City Manager form of government, which remains in effect today. The City of Sacramento government provides a wide range of services to the residents of Sacramento that includes police, fire, parks and recreation, and some utilities. The approved budget for the fiscal year 2020/2021 was approximately $1.3 billion for operations and capital improvement programs. In this chapter, we provide some demographic information such as the ethnicity/race, sex, and household income of City residents. To determine Sacramento residents’ demographics in this and subsequent chapters, we relied on data from the U.S. Census Bureau’s American Community Survey (ACS) for 2019. The Census counts every person within the United States (U.S.) and five U.S. territories every ten years. ACS is an ongoing survey that gathers vital information on an annual basis about the United States and its residents. The following are some key statistics related to the City of Sacramento’s estimated population as of 2019 10:
• The total population is estimated to be 513,620 residents; • The three most populous ethnic/racial groups in the City population are White (32 percent), Hispanic or Latino (31 percent), and Asian
(16 percent); • Females comprise 50.4 percent of the City population, while males comprise 49.6 percent; • The average household income is $89,564; and • The median age is 35.
This chapter provides ethnicity/race and gender demographics related to Sacramento residents that can be compared to City employee demographics in the remaining chapters. This chapter also includes data regarding the City’s projected lesbian, gay, bisexual, and/or transgender populations as estimated by Gallup polling data. The City of Sacramento does not currently collect information regarding sexual orientation from employees. To gather sexual orientation and gender identity information from City employees, we issued the previously discussed voluntary online survey for City employees to complete. The survey questions and responses have been released in a separate report.
10 The 2019 ACS report was the most recent ACS information available at the time of this audit.
Office of the City Auditor 21
November 2020
Figure 8 below shows Sacramento’s 2019 population estimate by ethnicity/race based on the 2019 American Community Survey. 11
Figure 8: Estimated Population of Sacramento Residents by Ethnicity/Race (513,620 total)
Source: American Community Survey
11 The U.S. Census Bureau does not have ethnic categories for MENA. In the data provided by the Census Bureau, MENA is combined with White.
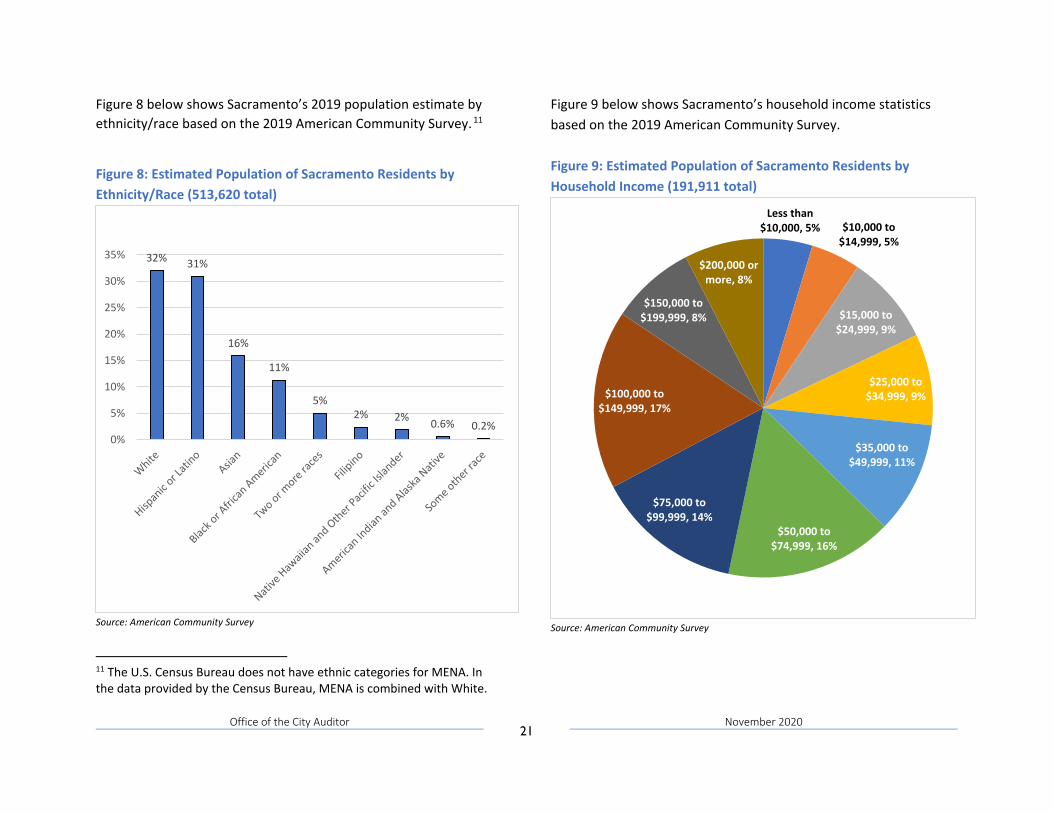
Figure 9 below shows Sacramento’s household income statistics based on the 2019 American Community Survey. Figure 9: Estimated Population of Sacramento Residents by Household Income (191,911 total)
Source: American Community Survey
32% 31%
16%
11%
5%2% 2% 0.6% 0.2%
0%
5%
10%
15%
20%
25%
30%
35%
Less than $10,000, 5% $10,000 to
$14,999, 5%
$15,000 to $24,999, 9%
$25,000 to $34,999, 9%
$35,000 to $49,999, 11%
$50,000 to $74,999, 16%
$75,000 to $99,999, 14%
$100,000 to $149,999, 17%
$150,000 to $199,999, 8%
$200,000 or more, 8%
Office of the City Auditor 22
November 2020
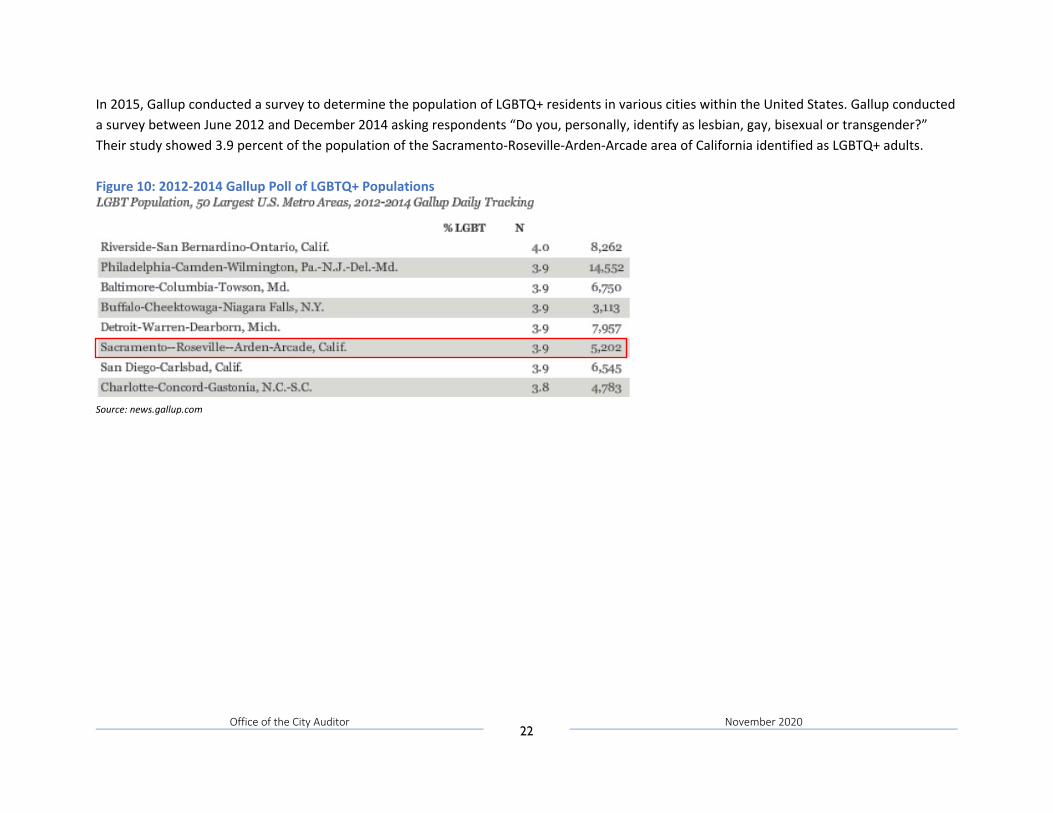
In 2015, Gallup conducted a survey to determine the population of LGBTQ+ residents in various cities within the United States. Gallup conducted a survey between June 2012 and December 2014 asking respondents “Do you, personally, identify as lesbian, gay, bisexual or transgender?” Their study showed 3.9 percent of the population of the Sacramento-Roseville-Arden-Arcade area of California identified as LGBTQ+ adults. Figure 10: 2012-2014 Gallup Poll of LGBTQ+ Populations
Source: news.gallup.com
Office of the City Auditor 23
November 2020
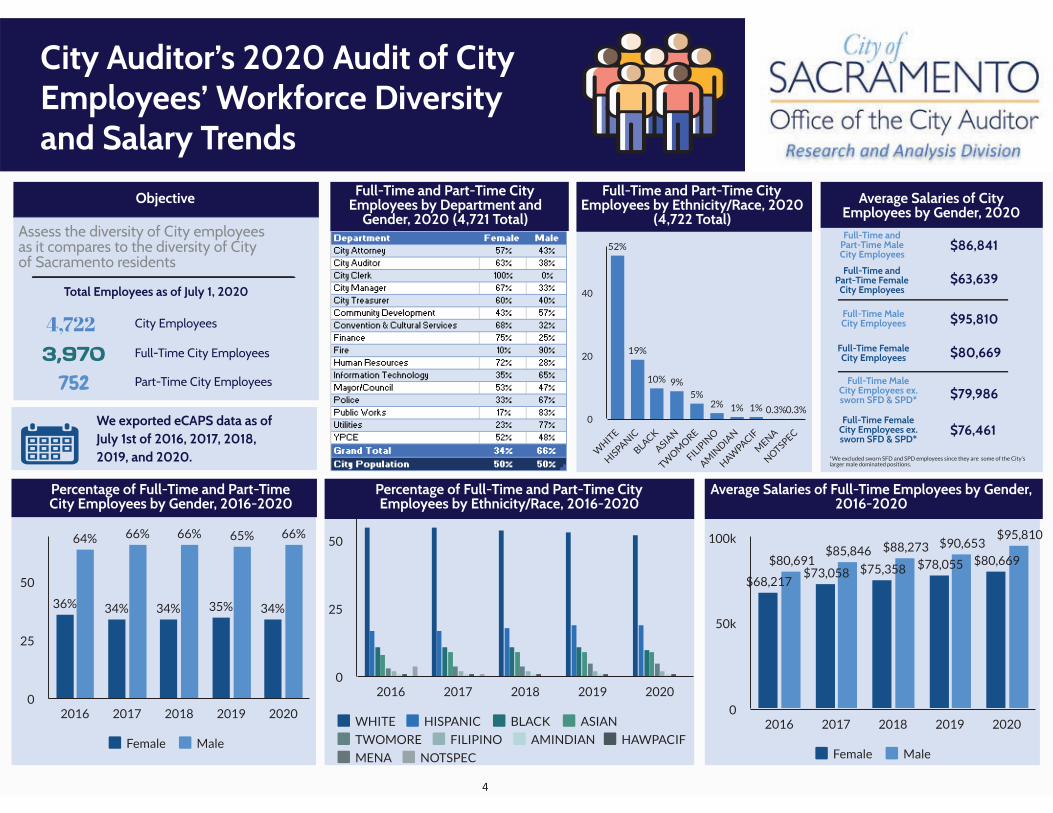
Chapter 2: Demographics of City of Sacramento Employees In 2016, the City Council directed the Office of the City Auditor to conduct the initial Audit of the City’s Gender and Ethic Diversity. Subsequently, the City Auditor’s Office received direction to perform the audit annually. Each assessment included the City’s employee demographics related to ethnicity/race and gender, as well as a breakout of the demographics as they relate to different employee classifications. This year’s report has trend analysis which examines City employees’ demographics from 2016 to 2020. We exported eCAPS data as of July 1st of each year. The following are some key statistics related to the City of Sacramento’s employees as of July 1, 2020:
• The total number of City employees was 4,722; • The total number of full-time employees was 3,970; • The total number of part-time employees was 752; and • The average age of City employees was 41.
The salary statistics below analyze the base salary of employees and do not represent their take home salary and supplemental pay such as incentives, allowances, and overtime.
Office of the City Auditor 24
November 2020
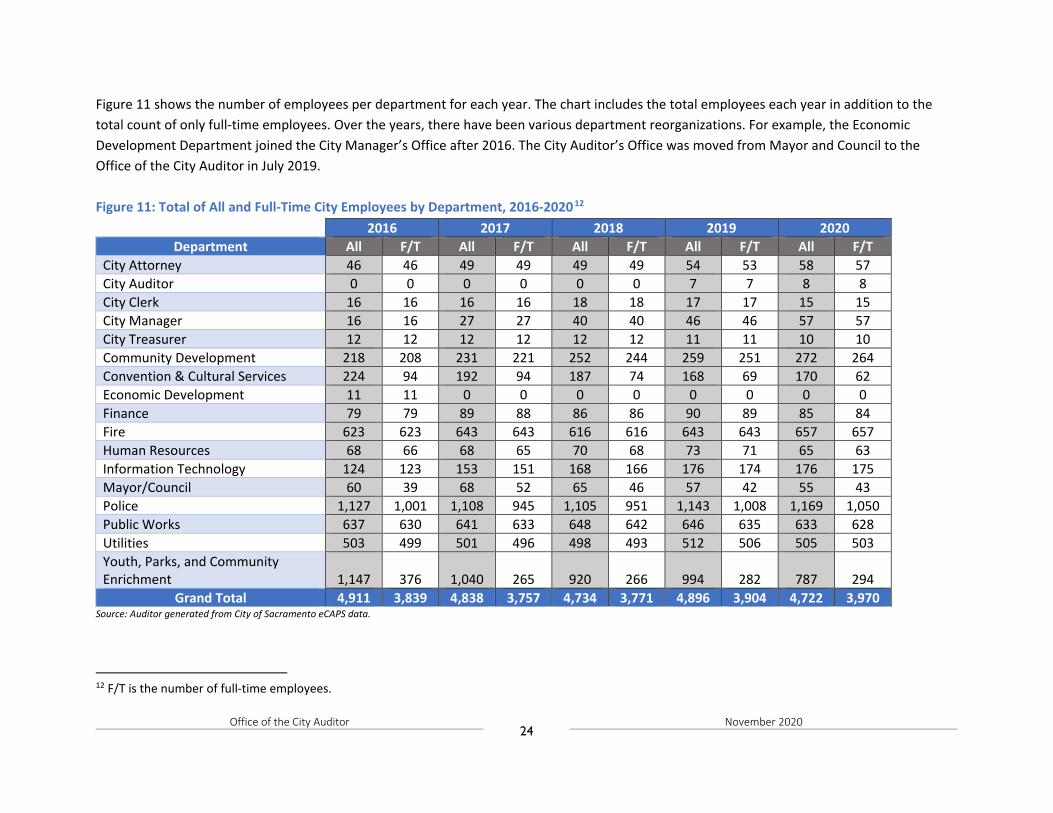
Figure 11 shows the number of employees per department for each year. The chart includes the total employees each year in addition to the total count of only full-time employees. Over the years, there have been various department reorganizations. For example, the Economic Development Department joined the City Manager’s Office after 2016. The City Auditor’s Office was moved from Mayor and Council to the Office of the City Auditor in July 2019.
Figure 11: Total of All and Full-Time City Employees by Department, 2016-2020 12
2016 2017 2018 2019 2020 Department All F/T All F/T All F/T All F/T All F/T
City Attorney 46 46 49 49 49 49 54 53 58 57 City Auditor 0 0 0 0 0 0 7 7 8 8 City Clerk 16 16 16 16 18 18 17 17 15 15 City Manager 16 16 27 27 40 40 46 46 57 57 City Treasurer 12 12 12 12 12 12 11 11 10 10 Community Development 218 208 231 221 252 244 259 251 272 264 Convention & Cultural Services 224 94 192 94 187 74 168 69 170 62 Economic Development 11 11 0 0 0 0 0 0 0 0 Finance 79 79 89 88 86 86 90 89 85 84 Fire 623 623 643 643 616 616 643 643 657 657 Human Resources 68 66 68 65 70 68 73 71 65 63 Information Technology 124 123 153 151 168 166 176 174 176 175 Mayor/Council 60 39 68 52 65 46 57 42 55 43 Police 1,127 1,001 1,108 945 1,105 951 1,143 1,008 1,169 1,050 Public Works 637 630 641 633 648 642 646 635 633 628 Utilities 503 499 501 496 498 493 512 506 505 503 Youth, Parks, and Community Enrichment 1,147 376 1,040 265 920 266 994 282 787 294
Grand Total 4,911 3,839 4,838 3,757 4,734 3,771 4,896 3,904 4,722 3,970 Source: Auditor generated from City of Sacramento eCAPS data.
12 F/T is the number of full-time employees.
Office of the City Auditor 25
November 2020
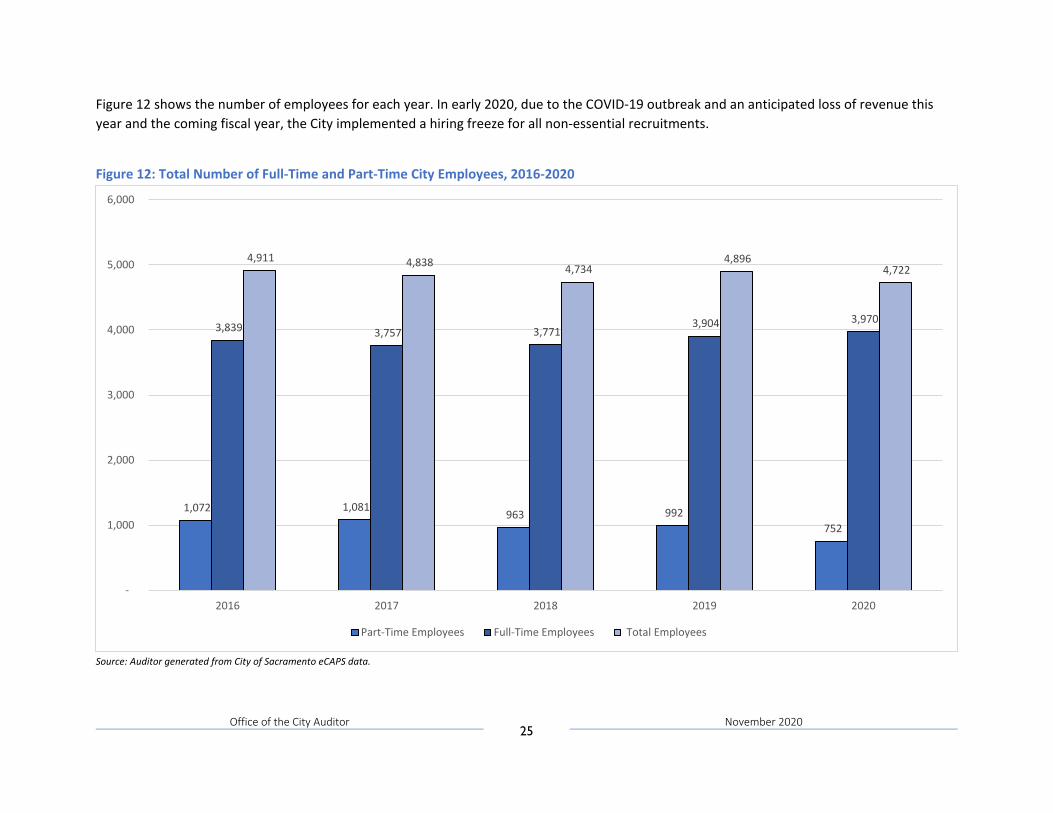
Figure 12 shows the number of employees for each year. In early 2020, due to the COVID-19 outbreak and an anticipated loss of revenue this year and the coming fiscal year, the City implemented a hiring freeze for all non-essential recruitments.
Figure 12: Total Number of Full-Time and Part-Time City Employees, 2016-2020
Source: Auditor generated from City of Sacramento eCAPS data.
1,072 1,081 963 992
752
3,839 3,757 3,771 3,904 3,970
4,911 4,838 4,734 4,896
4,722
-
1,000
2,000
3,000
4,000
5,000
6,000
2016 2017 2018 2019 2020
Part-Time Employees Full-Time Employees Total Employees
Office of the City Auditor 26
November 2020
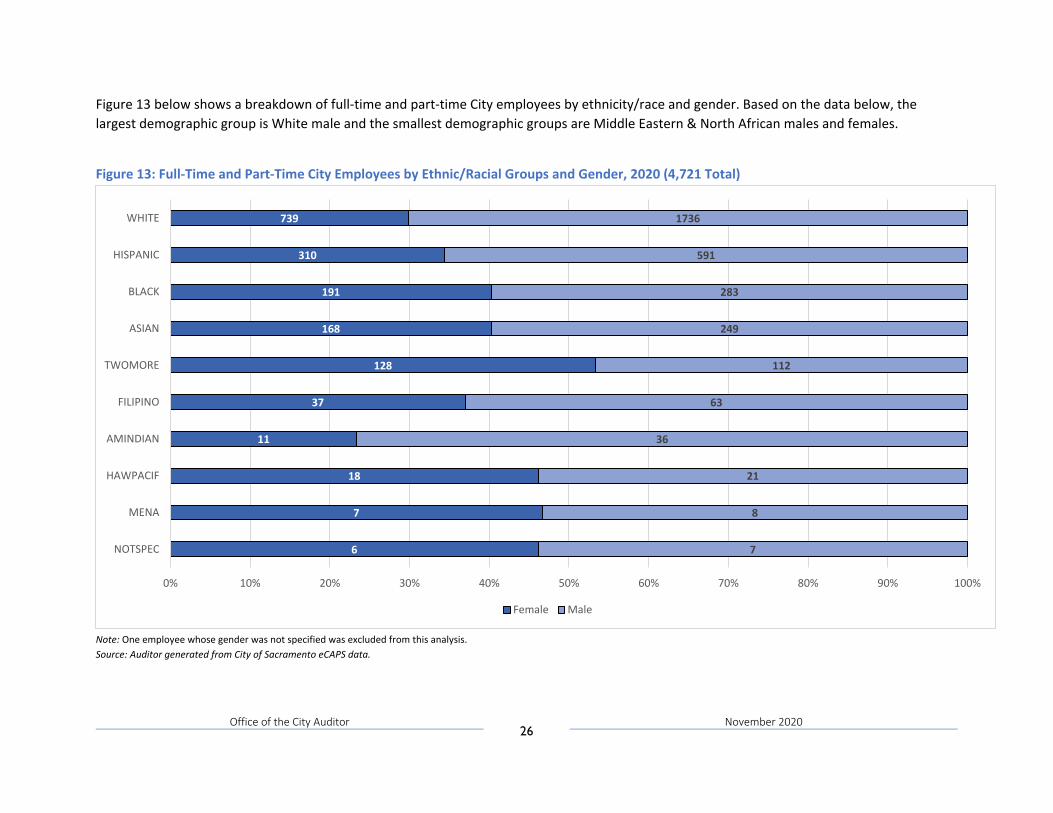
Figure 13 below shows a breakdown of full-time and part-time City employees by ethnicity/race and gender. Based on the data below, the largest demographic group is White male and the smallest demographic groups are Middle Eastern & North African males and females.
Figure 13: Full-Time and Part-Time City Employees by Ethnic/Racial Groups and Gender, 2020 (4,721 Total)
Note: One employee whose gender was not specified was excluded from this analysis. Source: Auditor generated from City of Sacramento eCAPS data.
6
7
18
11
37
128
168
191
310
739
7
8
21
36
63
112
249
283
591
1736
0% 10% 20% 30% 40% 50% 60% 70% 80% 90% 100%
NOTSPEC
MENA
HAWPACIF
AMINDIAN
FILIPINO
TWOMORE
ASIAN
BLACK
HISPANIC
WHITE
Female Male
Office of the City Auditor 27
November 2020
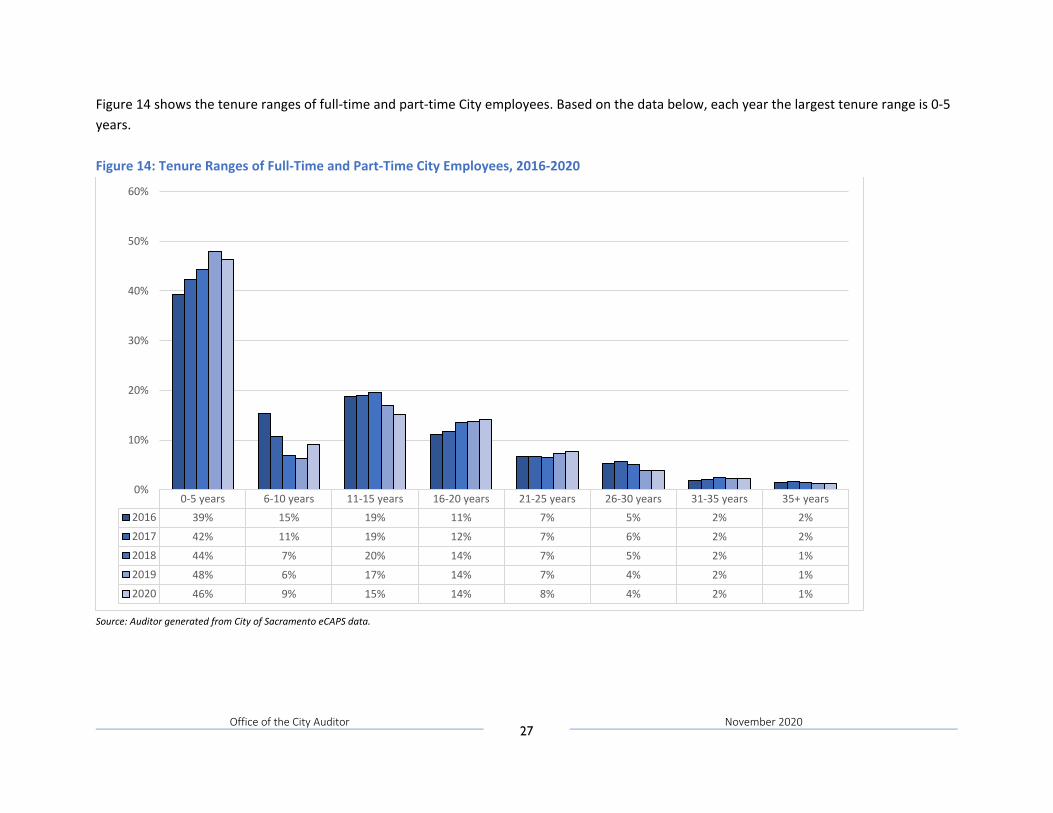
Figure 14 shows the tenure ranges of full-time and part-time City employees. Based on the data below, each year the largest tenure range is 0-5 years. Figure 14: Tenure Ranges of Full-Time and Part-Time City Employees, 2016-2020
Source: Auditor generated from City of Sacramento eCAPS data.
0-5 years 6-10 years 11-15 years 16-20 years 21-25 years 26-30 years 31-35 years 35+ years2016 39% 15% 19% 11% 7% 5% 2% 2%2017 42% 11% 19% 12% 7% 6% 2% 2%2018 44% 7% 20% 14% 7% 5% 2% 1%2019 48% 6% 17% 14% 7% 4% 2% 1%2020 46% 9% 15% 14% 8% 4% 2% 1%
0%
10%
20%
30%
40%
50%
60%
Office of the City Auditor 28
November 2020
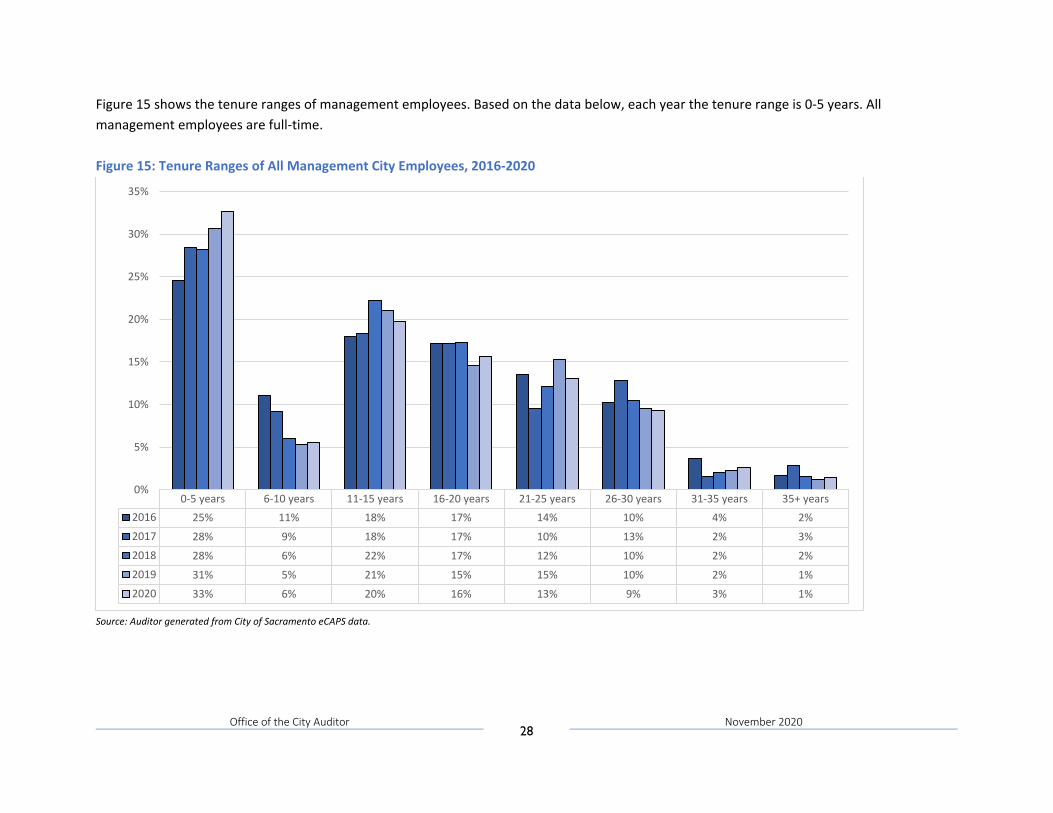
Figure 15 shows the tenure ranges of management employees. Based on the data below, each year the tenure range is 0-5 years. All management employees are full-time. Figure 15: Tenure Ranges of All Management City Employees, 2016-2020
Source: Auditor generated from City of Sacramento eCAPS data.
0-5 years 6-10 years 11-15 years 16-20 years 21-25 years 26-30 years 31-35 years 35+ years2016 25% 11% 18% 17% 14% 10% 4% 2%2017 28% 9% 18% 17% 10% 13% 2% 3%2018 28% 6% 22% 17% 12% 10% 2% 2%2019 31% 5% 21% 15% 15% 10% 2% 1%2020 33% 6% 20% 16% 13% 9% 3% 1%
0%
5%
10%
15%
20%
25%
30%
35%
Office of the City Auditor 29
November 2020
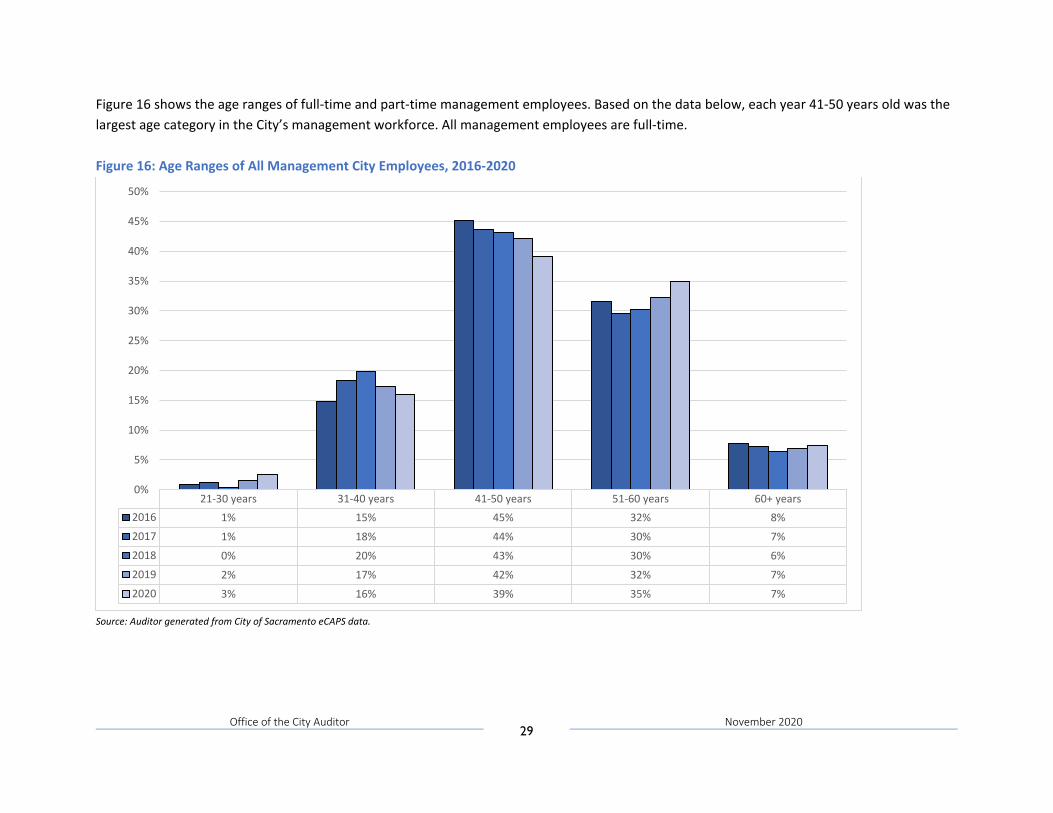
Figure 16 shows the age ranges of full-time and part-time management employees. Based on the data below, each year 41-50 years old was the largest age category in the City’s management workforce. All management employees are full-time. Figure 16: Age Ranges of All Management City Employees, 2016-2020
Source: Auditor generated from City of Sacramento eCAPS data.
21-30 years 31-40 years 41-50 years 51-60 years 60+ years2016 1% 15% 45% 32% 8%2017 1% 18% 44% 30% 7%2018 0% 20% 43% 30% 6%2019 2% 17% 42% 32% 7%2020 3% 16% 39% 35% 7%
0%
5%
10%
15%
20%
25%
30%
35%
40%
45%
50%
Office of the City Auditor 30
November 2020
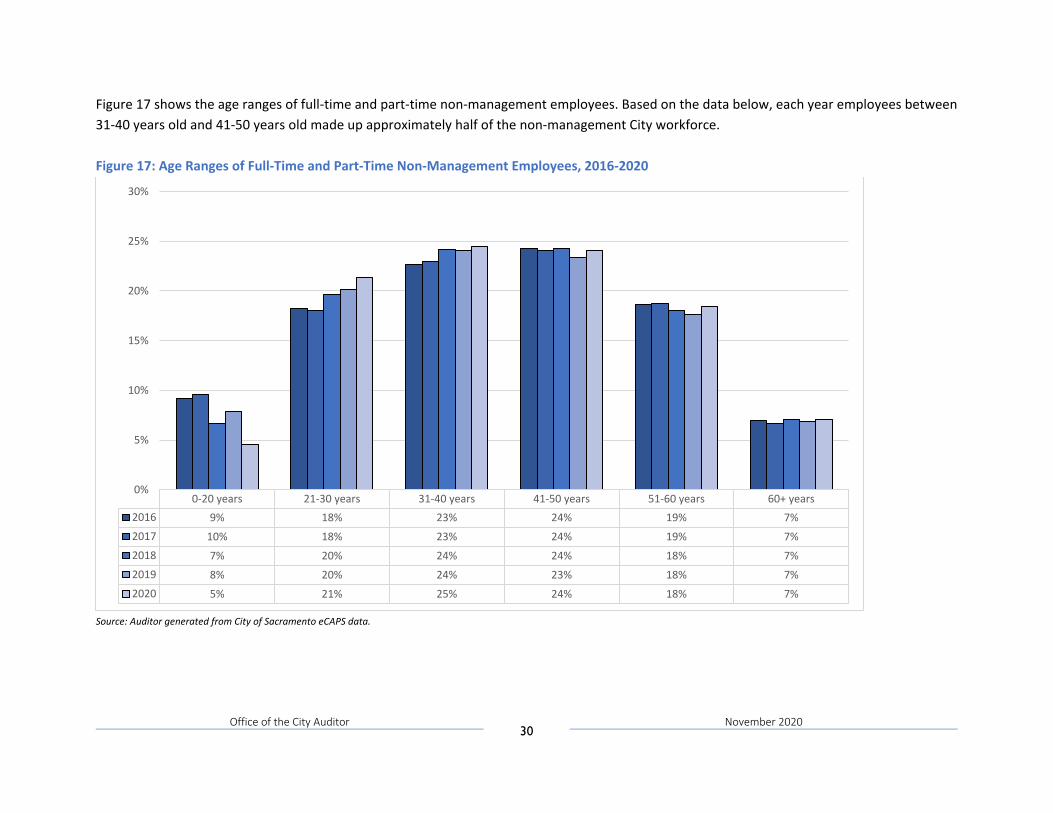
Figure 17 shows the age ranges of full-time and part-time non-management employees. Based on the data below, each year employees between 31-40 years old and 41-50 years old made up approximately half of the non-management City workforce. Figure 17: Age Ranges of Full-Time and Part-Time Non-Management Employees, 2016-2020
Source: Auditor generated from City of Sacramento eCAPS data.
0-20 years 21-30 years 31-40 years 41-50 years 51-60 years 60+ years2016 9% 18% 23% 24% 19% 7%2017 10% 18% 23% 24% 19% 7%2018 7% 20% 24% 24% 18% 7%2019 8% 20% 24% 23% 18% 7%2020 5% 21% 25% 24% 18% 7%
0%
5%
10%
15%
20%
25%
30%
Office of the City Auditor 31
November 2020
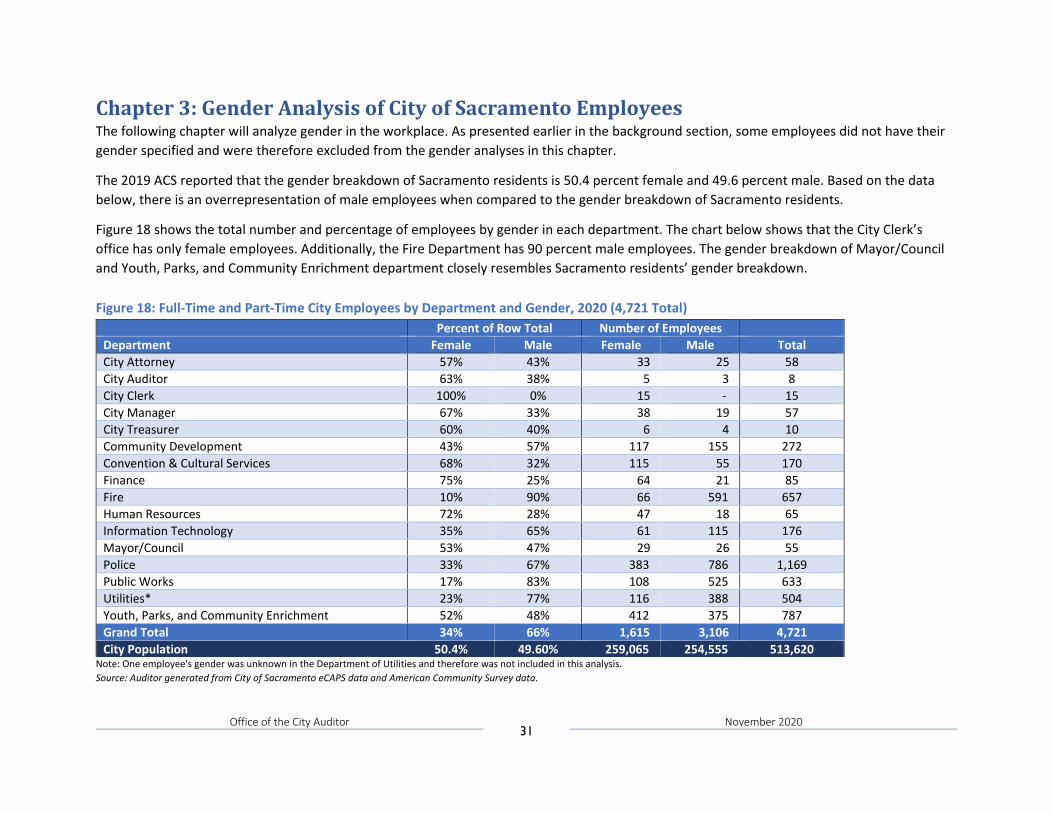
Chapter 3: Gender Analysis of City of Sacramento Employees The following chapter will analyze gender in the workplace. As presented earlier in the background section, some employees did not have their gender specified and were therefore excluded from the gender analyses in this chapter.
The 2019 ACS reported that the gender breakdown of Sacramento residents is 50.4 percent female and 49.6 percent male. Based on the data below, there is an overrepresentation of male employees when compared to the gender breakdown of Sacramento residents.
Figure 18 shows the total number and percentage of employees by gender in each department. The chart below shows that the City Clerk’s office has only female employees. Additionally, the Fire Department has 90 percent male employees. The gender breakdown of Mayor/Council and Youth, Parks, and Community Enrichment department closely resembles Sacramento residents’ gender breakdown. Figure 18: Full-Time and Part-Time City Employees by Department and Gender, 2020 (4,721 Total)
Percent of Row Total Number of Employees Department Female Male Female Male Total City Attorney 57% 43% 33 25 58 City Auditor 63% 38% 5 3 8 City Clerk 100% 0% 15 - 15 City Manager 67% 33% 38 19 57 City Treasurer 60% 40% 6 4 10 Community Development 43% 57% 117 155 272 Convention & Cultural Services 68% 32% 115 55 170 Finance 75% 25% 64 21 85 Fire 10% 90% 66 591 657 Human Resources 72% 28% 47 18 65 Information Technology 35% 65% 61 115 176 Mayor/Council 53% 47% 29 26 55 Police 33% 67% 383 786 1,169 Public Works 17% 83% 108 525 633 Utilities* 23% 77% 116 388 504 Youth, Parks, and Community Enrichment 52% 48% 412 375 787 Grand Total 34% 66% 1,615 3,106 4,721 City Population 50.4% 49.60% 259,065 254,555 513,620
Note: One employee's gender was unknown in the Department of Utilities and therefore was not included in this analysis. Source: Auditor generated from City of Sacramento eCAPS data and American Community Survey data.
Office of the City Auditor 32
November 2020
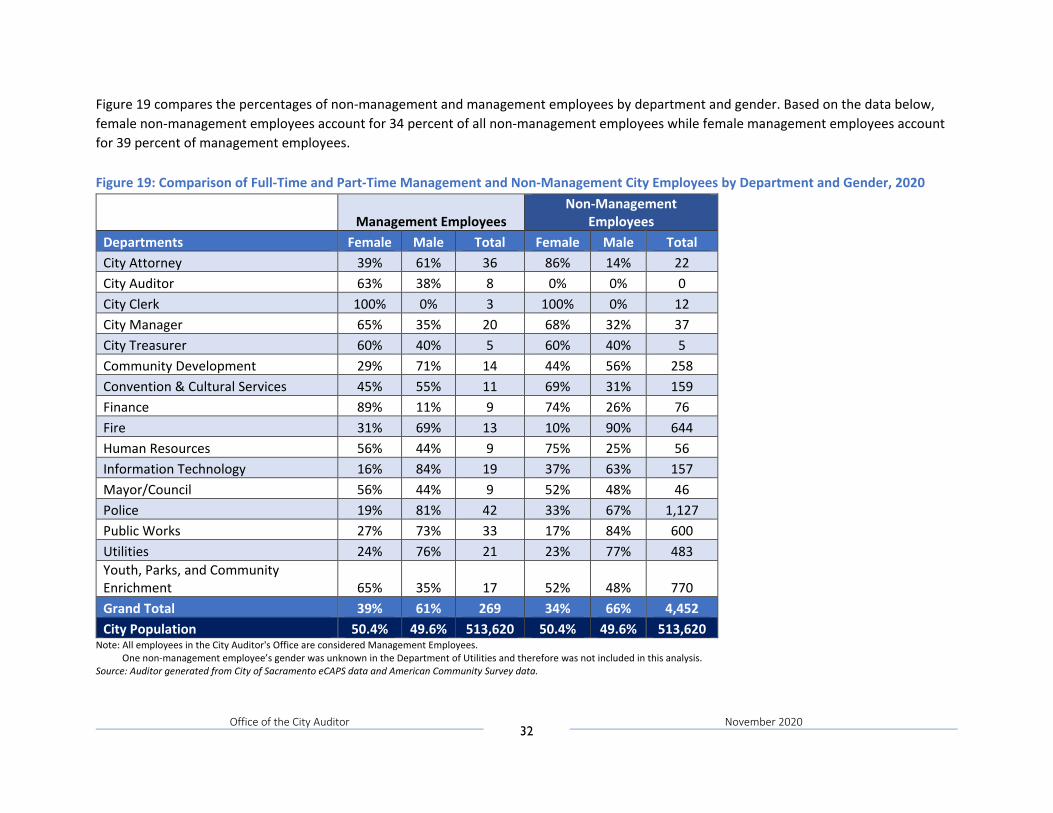
Figure 19 compares the percentages of non-management and management employees by department and gender. Based on the data below, female non-management employees account for 34 percent of all non-management employees while female management employees account for 39 percent of management employees. Figure 19: Comparison of Full-Time and Part-Time Management and Non-Management City Employees by Department and Gender, 2020
Management Employees Non-Management
Employees Departments Female Male Total Female Male Total City Attorney 39% 61% 36 86% 14% 22 City Auditor 63% 38% 8 0% 0% 0 City Clerk 100% 0% 3 100% 0% 12 City Manager 65% 35% 20 68% 32% 37 City Treasurer 60% 40% 5 60% 40% 5 Community Development 29% 71% 14 44% 56% 258 Convention & Cultural Services 45% 55% 11 69% 31% 159 Finance 89% 11% 9 74% 26% 76 Fire 31% 69% 13 10% 90% 644 Human Resources 56% 44% 9 75% 25% 56 Information Technology 16% 84% 19 37% 63% 157 Mayor/Council 56% 44% 9 52% 48% 46 Police 19% 81% 42 33% 67% 1,127 Public Works 27% 73% 33 17% 84% 600 Utilities 24% 76% 21 23% 77% 483 Youth, Parks, and Community Enrichment 65% 35% 17 52% 48% 770 Grand Total 39% 61% 269 34% 66% 4,452 City Population 50.4% 49.6% 513,620 50.4% 49.6% 513,620
Note: All employees in the City Auditor's Office are considered Management Employees. One non-management employee’s gender was unknown in the Department of Utilities and therefore was not included in this analysis. Source: Auditor generated from City of Sacramento eCAPS data and American Community Survey data.
Office of the City Auditor 33
November 2020
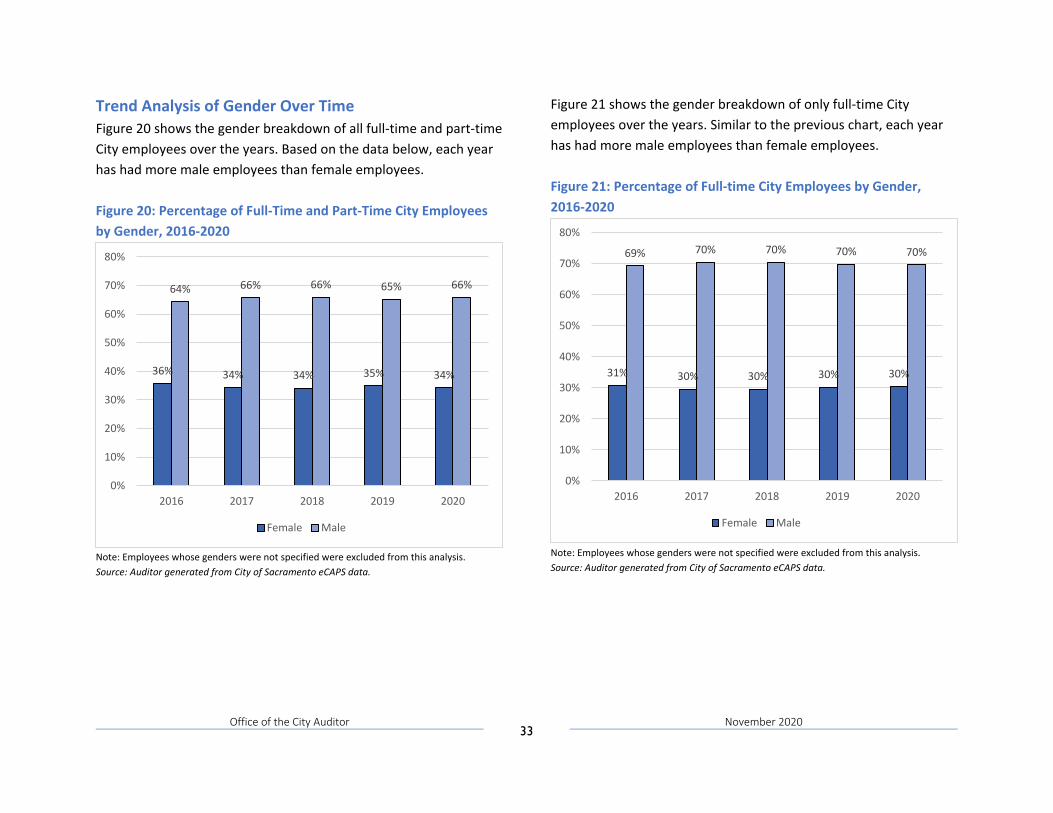
Trend Analysis of Gender Over Time Figure 20 shows the gender breakdown of all full-time and part-time City employees over the years. Based on the data below, each year has had more male employees than female employees. Figure 20: Percentage of Full-Time and Part-Time City Employees by Gender, 2016-2020
Note: Employees whose genders were not specified were excluded from this analysis. Source: Auditor generated from City of Sacramento eCAPS data.
Figure 21 shows the gender breakdown of only full-time City employees over the years. Similar to the previous chart, each year has had more male employees than female employees. Figure 21: Percentage of Full-time City Employees by Gender, 2016-2020
Note: Employees whose genders were not specified were excluded from this analysis. Source: Auditor generated from City of Sacramento eCAPS data.
36% 34% 34% 35% 34%
64% 66% 66% 65% 66%
0%
10%
20%
30%
40%
50%
60%
70%
80%
2016 2017 2018 2019 2020
Female Male
31% 30% 30% 30% 30%
69% 70% 70% 70% 70%
0%
10%
20%
30%
40%
50%
60%
70%
80%
2016 2017 2018 2019 2020
Female Male
Office of the City Auditor 34
November 2020
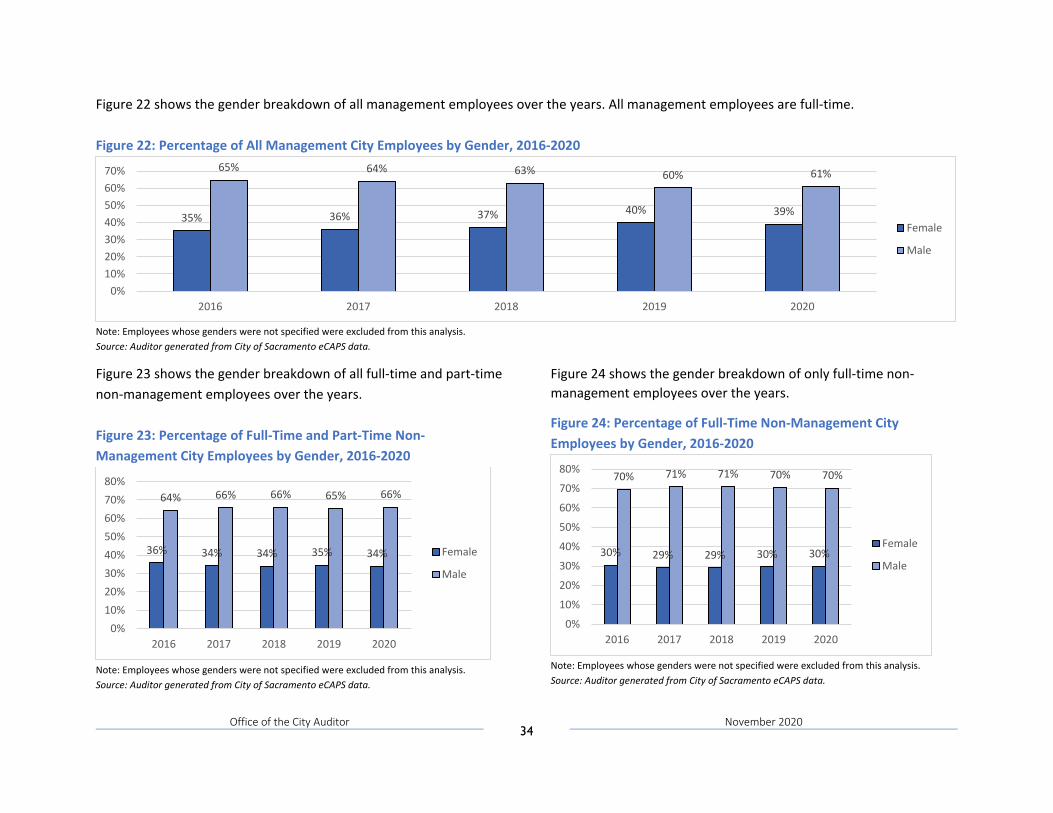
Figure 22 shows the gender breakdown of all management employees over the years. All management employees are full-time. Figure 22: Percentage of All Management City Employees by Gender, 2016-2020
Note: Employees whose genders were not specified were excluded from this analysis. Source: Auditor generated from City of Sacramento eCAPS data.
Figure 23 shows the gender breakdown of all full-time and part-time non-management employees over the years. Figure 23: Percentage of Full-Time and Part-Time Non-Management City Employees by Gender, 2016-2020
Note: Employees whose genders were not specified were excluded from this analysis. Source: Auditor generated from City of Sacramento eCAPS data.
Figure 24 shows the gender breakdown of only full-time non-management employees over the years.
Figure 24: Percentage of Full-Time Non-Management City Employees by Gender, 2016-2020
Note: Employees whose genders were not specified were excluded from this analysis. Source: Auditor generated from City of Sacramento eCAPS data.
35% 36% 37% 40% 39%
65% 64% 63% 60% 61%
0%10%20%30%40%50%60%70%
2016 2017 2018 2019 2020
Female
Male
36% 34% 34% 35% 34%
64% 66% 66% 65% 66%
0%10%20%30%40%50%60%70%80%
2016 2017 2018 2019 2020
Female
Male
30% 29% 29% 30% 30%
70% 71% 71% 70% 70%
0%
10%
20%
30%
40%
50%
60%
70%
80%
2016 2017 2018 2019 2020
Female
Male
Office of the City Auditor 35
November 2020
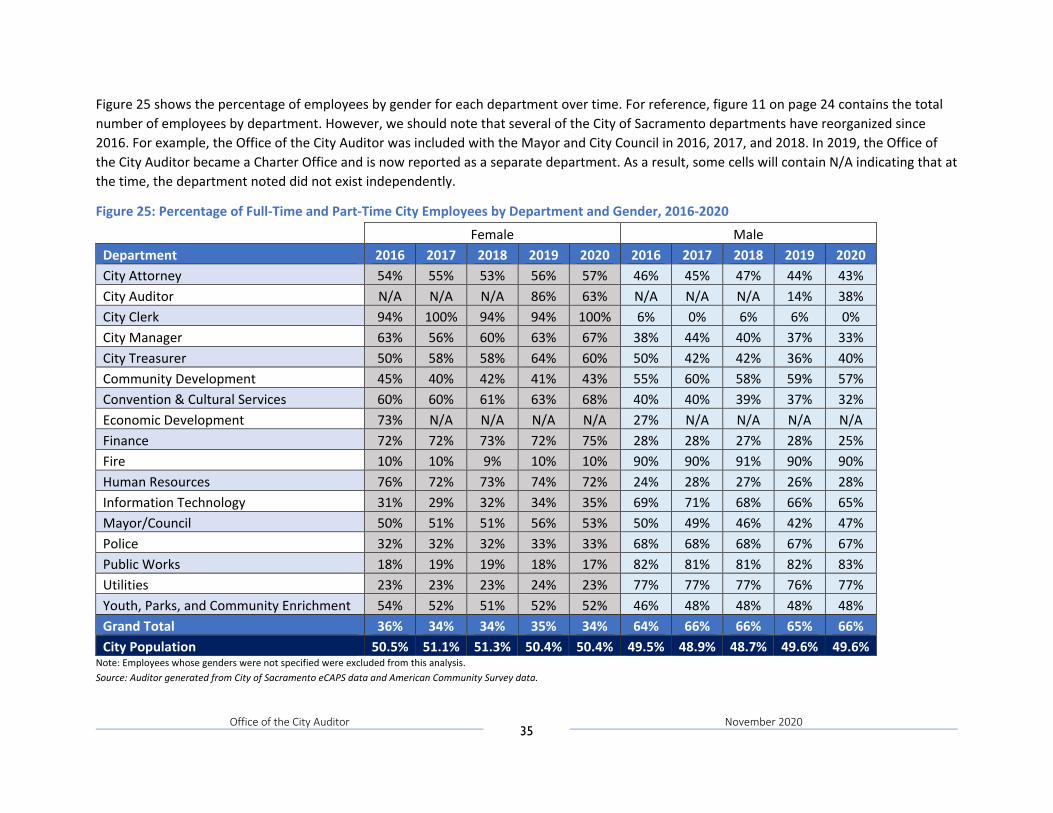
Figure 25 shows the percentage of employees by gender for each department over time. For reference, figure 11 on page 24 contains the total number of employees by department. However, we should note that several of the City of Sacramento departments have reorganized since 2016. For example, the Office of the City Auditor was included with the Mayor and City Council in 2016, 2017, and 2018. In 2019, the Office of the City Auditor became a Charter Office and is now reported as a separate department. As a result, some cells will contain N/A indicating that at the time, the department noted did not exist independently.
Figure 25: Percentage of Full-Time and Part-Time City Employees by Department and Gender, 2016-2020
Female Male Department 2016 2017 2018 2019 2020 2016 2017 2018 2019 2020 City Attorney 54% 55% 53% 56% 57% 46% 45% 47% 44% 43% City Auditor N/A N/A N/A 86% 63% N/A N/A N/A 14% 38% City Clerk 94% 100% 94% 94% 100% 6% 0% 6% 6% 0% City Manager 63% 56% 60% 63% 67% 38% 44% 40% 37% 33% City Treasurer 50% 58% 58% 64% 60% 50% 42% 42% 36% 40% Community Development 45% 40% 42% 41% 43% 55% 60% 58% 59% 57% Convention & Cultural Services 60% 60% 61% 63% 68% 40% 40% 39% 37% 32% Economic Development 73% N/A N/A N/A N/A 27% N/A N/A N/A N/A Finance 72% 72% 73% 72% 75% 28% 28% 27% 28% 25% Fire 10% 10% 9% 10% 10% 90% 90% 91% 90% 90% Human Resources 76% 72% 73% 74% 72% 24% 28% 27% 26% 28% Information Technology 31% 29% 32% 34% 35% 69% 71% 68% 66% 65% Mayor/Council 50% 51% 51% 56% 53% 50% 49% 46% 42% 47% Police 32% 32% 32% 33% 33% 68% 68% 68% 67% 67% Public Works 18% 19% 19% 18% 17% 82% 81% 81% 82% 83% Utilities 23% 23% 23% 24% 23% 77% 77% 77% 76% 77% Youth, Parks, and Community Enrichment 54% 52% 51% 52% 52% 46% 48% 48% 48% 48% Grand Total 36% 34% 34% 35% 34% 64% 66% 66% 65% 66% City Population 50.5% 51.1% 51.3% 50.4% 50.4% 49.5% 48.9% 48.7% 49.6% 49.6%
Note: Employees whose genders were not specified were excluded from this analysis. Source: Auditor generated from City of Sacramento eCAPS data and American Community Survey data.
Office of the City Auditor 36
November 2020
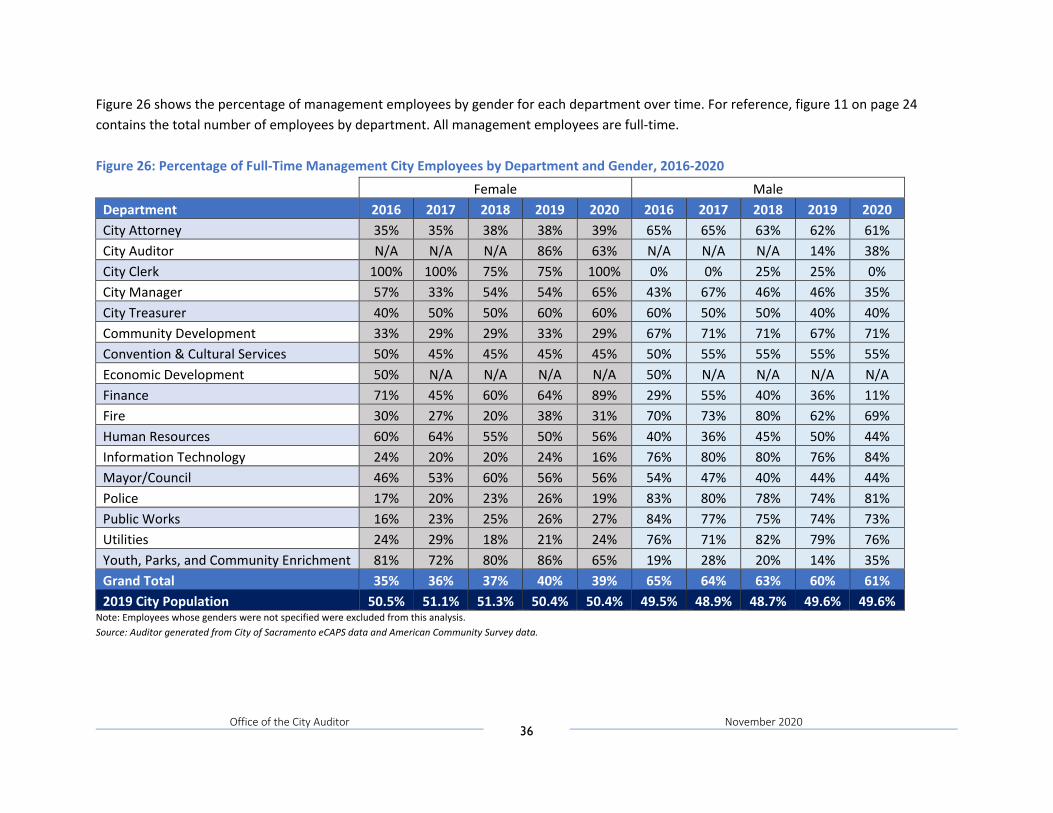
Figure 26 shows the percentage of management employees by gender for each department over time. For reference, figure 11 on page 24 contains the total number of employees by department. All management employees are full-time. Figure 26: Percentage of Full-Time Management City Employees by Department and Gender, 2016-2020
Female Male Department 2016 2017 2018 2019 2020 2016 2017 2018 2019 2020 City Attorney 35% 35% 38% 38% 39% 65% 65% 63% 62% 61% City Auditor N/A N/A N/A 86% 63% N/A N/A N/A 14% 38% City Clerk 100% 100% 75% 75% 100% 0% 0% 25% 25% 0% City Manager 57% 33% 54% 54% 65% 43% 67% 46% 46% 35% City Treasurer 40% 50% 50% 60% 60% 60% 50% 50% 40% 40% Community Development 33% 29% 29% 33% 29% 67% 71% 71% 67% 71% Convention & Cultural Services 50% 45% 45% 45% 45% 50% 55% 55% 55% 55% Economic Development 50% N/A N/A N/A N/A 50% N/A N/A N/A N/A Finance 71% 45% 60% 64% 89% 29% 55% 40% 36% 11% Fire 30% 27% 20% 38% 31% 70% 73% 80% 62% 69% Human Resources 60% 64% 55% 50% 56% 40% 36% 45% 50% 44% Information Technology 24% 20% 20% 24% 16% 76% 80% 80% 76% 84% Mayor/Council 46% 53% 60% 56% 56% 54% 47% 40% 44% 44% Police 17% 20% 23% 26% 19% 83% 80% 78% 74% 81% Public Works 16% 23% 25% 26% 27% 84% 77% 75% 74% 73% Utilities 24% 29% 18% 21% 24% 76% 71% 82% 79% 76% Youth, Parks, and Community Enrichment 81% 72% 80% 86% 65% 19% 28% 20% 14% 35% Grand Total 35% 36% 37% 40% 39% 65% 64% 63% 60% 61% 2019 City Population 50.5% 51.1% 51.3% 50.4% 50.4% 49.5% 48.9% 48.7% 49.6% 49.6%
Note: Employees whose genders were not specified were excluded from this analysis. Source: Auditor generated from City of Sacramento eCAPS data and American Community Survey data.
Office of the City Auditor 37
November 2020
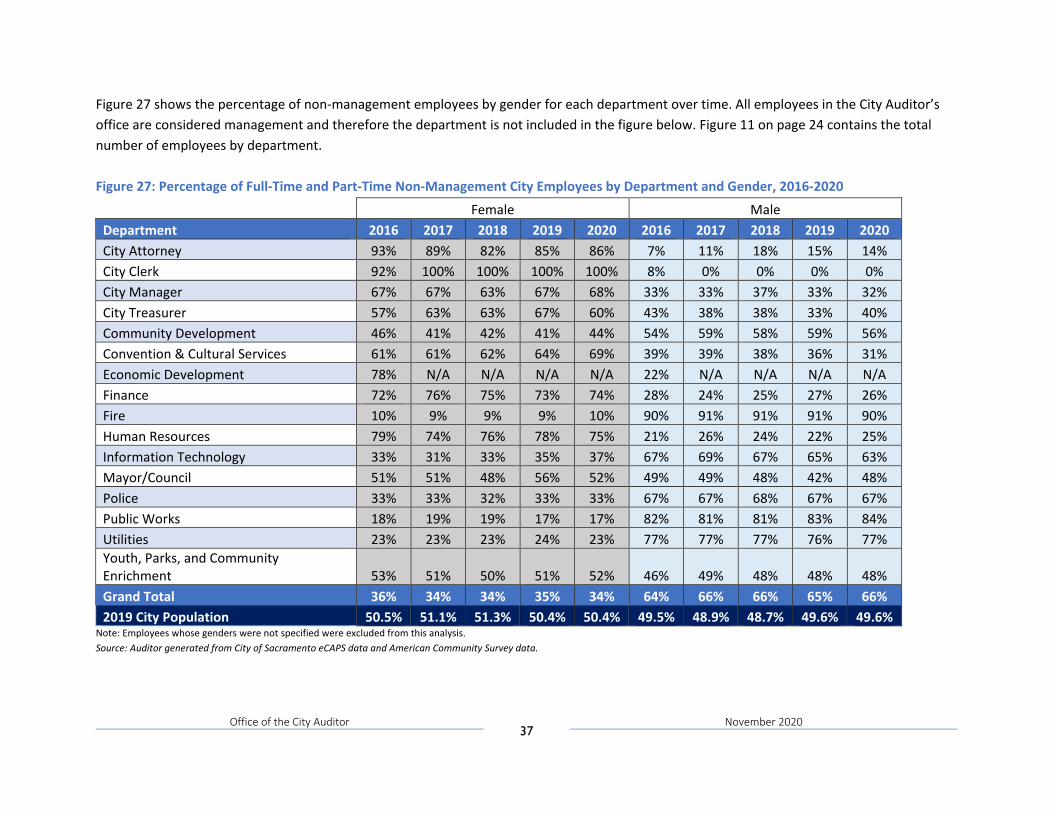
Figure 27 shows the percentage of non-management employees by gender for each department over time. All employees in the City Auditor’s office are considered management and therefore the department is not included in the figure below. Figure 11 on page 24 contains the total number of employees by department. Figure 27: Percentage of Full-Time and Part-Time Non-Management City Employees by Department and Gender, 2016-2020
Female Male Department 2016 2017 2018 2019 2020 2016 2017 2018 2019 2020 City Attorney 93% 89% 82% 85% 86% 7% 11% 18% 15% 14% City Clerk 92% 100% 100% 100% 100% 8% 0% 0% 0% 0% City Manager 67% 67% 63% 67% 68% 33% 33% 37% 33% 32% City Treasurer 57% 63% 63% 67% 60% 43% 38% 38% 33% 40% Community Development 46% 41% 42% 41% 44% 54% 59% 58% 59% 56% Convention & Cultural Services 61% 61% 62% 64% 69% 39% 39% 38% 36% 31% Economic Development 78% N/A N/A N/A N/A 22% N/A N/A N/A N/A Finance 72% 76% 75% 73% 74% 28% 24% 25% 27% 26% Fire 10% 9% 9% 9% 10% 90% 91% 91% 91% 90% Human Resources 79% 74% 76% 78% 75% 21% 26% 24% 22% 25% Information Technology 33% 31% 33% 35% 37% 67% 69% 67% 65% 63% Mayor/Council 51% 51% 48% 56% 52% 49% 49% 48% 42% 48% Police 33% 33% 32% 33% 33% 67% 67% 68% 67% 67% Public Works 18% 19% 19% 17% 17% 82% 81% 81% 83% 84% Utilities 23% 23% 23% 24% 23% 77% 77% 77% 76% 77% Youth, Parks, and Community Enrichment 53% 51% 50% 51% 52% 46% 49% 48% 48% 48% Grand Total 36% 34% 34% 35% 34% 64% 66% 66% 65% 66% 2019 City Population 50.5% 51.1% 51.3% 50.4% 50.4% 49.5% 48.9% 48.7% 49.6% 49.6%
Note: Employees whose genders were not specified were excluded from this analysis. Source: Auditor generated from City of Sacramento eCAPS data and American Community Survey data.
Office of the City Auditor 38
November 2020
Chapter 4: Ethnicity/Race Analysis of City of Sacramento Employees This chapter will analyze the ethnicity/race of City of Sacramento employees.
Ethnic/Racial Demographics of City Employees as of July 1, 2020
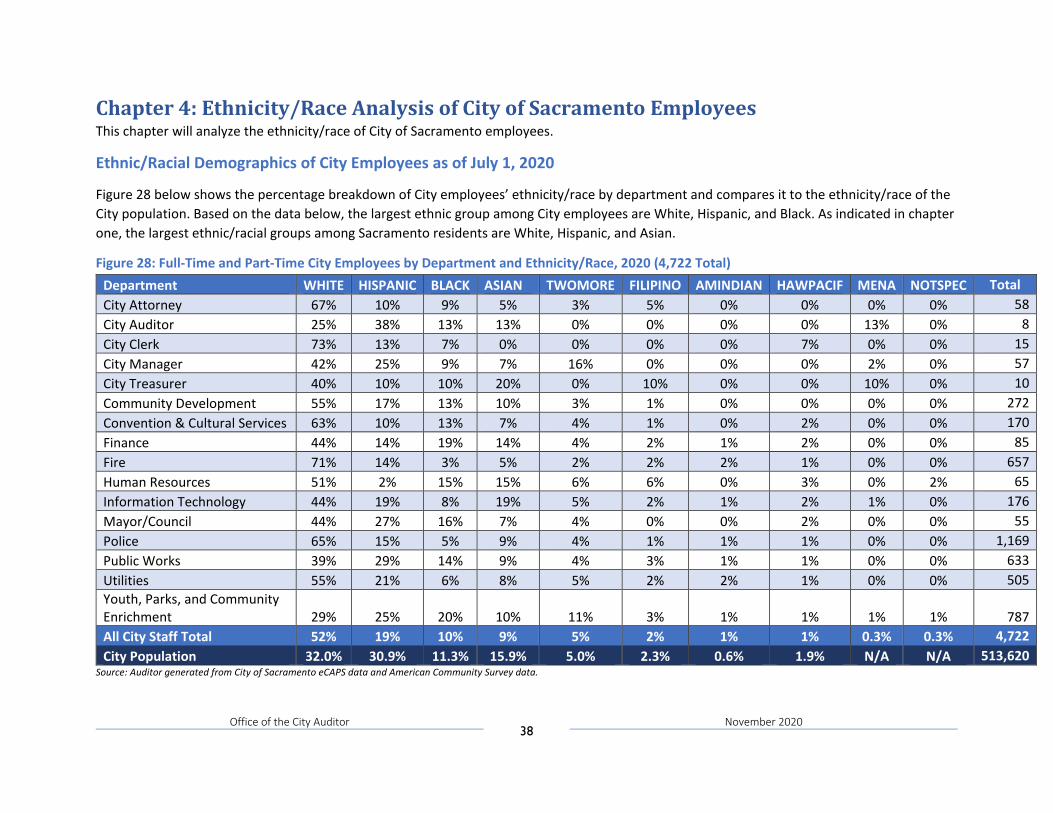
Figure 28 below shows the percentage breakdown of City employees’ ethnicity/race by department and compares it to the ethnicity/race of the City population. Based on the data below, the largest ethnic group among City employees are White, Hispanic, and Black. As indicated in chapter one, the largest ethnic/racial groups among Sacramento residents are White, Hispanic, and Asian.
Figure 28: Full-Time and Part-Time City Employees by Department and Ethnicity/Race, 2020 (4,722 Total) Department WHITE HISPANIC BLACK ASIAN TWOMORE FILIPINO AMINDIAN HAWPACIF MENA NOTSPEC Total City Attorney 67% 10% 9% 5% 3% 5% 0% 0% 0% 0% 58 City Auditor 25% 38% 13% 13% 0% 0% 0% 0% 13% 0% 8 City Clerk 73% 13% 7% 0% 0% 0% 0% 7% 0% 0% 15 City Manager 42% 25% 9% 7% 16% 0% 0% 0% 2% 0% 57 City Treasurer 40% 10% 10% 20% 0% 10% 0% 0% 10% 0% 10 Community Development 55% 17% 13% 10% 3% 1% 0% 0% 0% 0% 272 Convention & Cultural Services 63% 10% 13% 7% 4% 1% 0% 2% 0% 0% 170 Finance 44% 14% 19% 14% 4% 2% 1% 2% 0% 0% 85 Fire 71% 14% 3% 5% 2% 2% 2% 1% 0% 0% 657 Human Resources 51% 2% 15% 15% 6% 6% 0% 3% 0% 2% 65 Information Technology 44% 19% 8% 19% 5% 2% 1% 2% 1% 0% 176 Mayor/Council 44% 27% 16% 7% 4% 0% 0% 2% 0% 0% 55 Police 65% 15% 5% 9% 4% 1% 1% 1% 0% 0% 1,169 Public Works 39% 29% 14% 9% 4% 3% 1% 1% 0% 0% 633 Utilities 55% 21% 6% 8% 5% 2% 2% 1% 0% 0% 505 Youth, Parks, and Community Enrichment 29% 25% 20% 10% 11% 3% 1% 1% 1% 1% 787 All City Staff Total 52% 19% 10% 9% 5% 2% 1% 1% 0.3% 0.3% 4,722 City Population 32.0% 30.9% 11.3% 15.9% 5.0% 2.3% 0.6% 1.9% N/A N/A 513,620
Source: Auditor generated from City of Sacramento eCAPS data and American Community Survey data.
Office of the City Auditor 39
November 2020
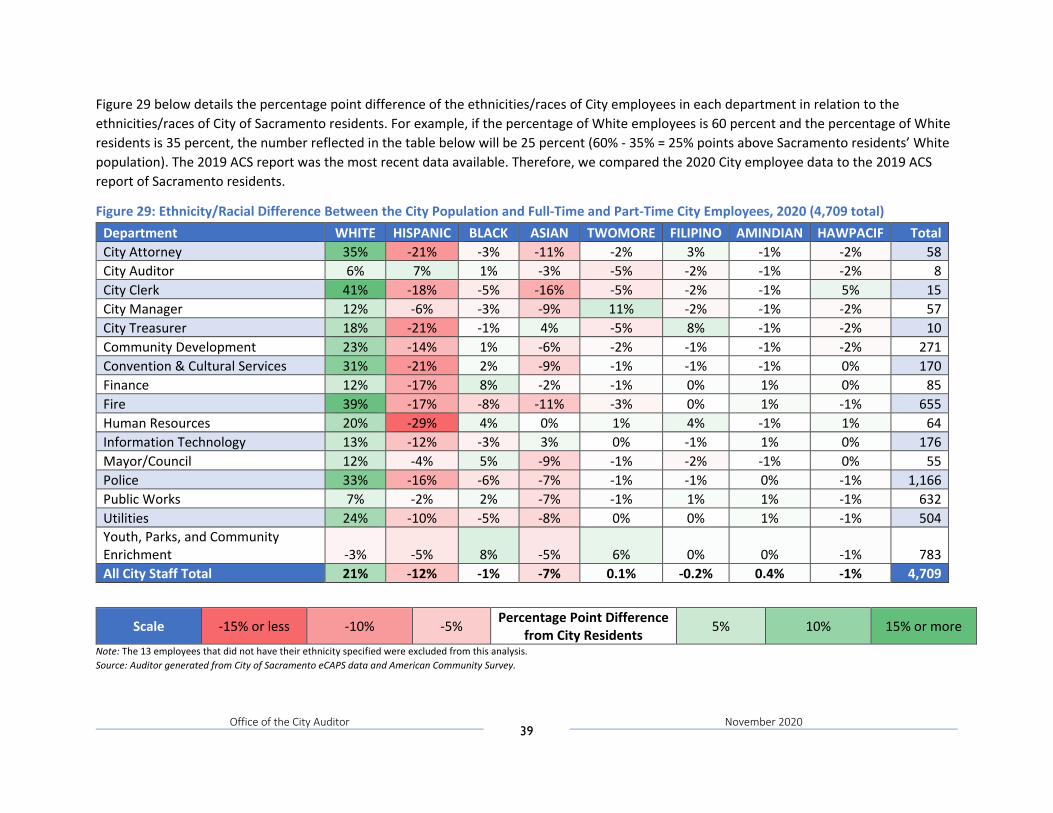
Figure 29 below details the percentage point difference of the ethnicities/races of City employees in each department in relation to the ethnicities/races of City of Sacramento residents. For example, if the percentage of White employees is 60 percent and the percentage of White residents is 35 percent, the number reflected in the table below will be 25 percent (60% - 35% = 25% points above Sacramento residents’ White population). The 2019 ACS report was the most recent data available. Therefore, we compared the 2020 City employee data to the 2019 ACS report of Sacramento residents.
Figure 29: Ethnicity/Racial Difference Between the City Population and Full-Time and Part-Time City Employees, 2020 (4,709 total) Department WHITE HISPANIC BLACK ASIAN TWOMORE FILIPINO AMINDIAN HAWPACIF Total City Attorney 35% -21% -3% -11% -2% 3% -1% -2% 58 City Auditor 6% 7% 1% -3% -5% -2% -1% -2% 8 City Clerk 41% -18% -5% -16% -5% -2% -1% 5% 15 City Manager 12% -6% -3% -9% 11% -2% -1% -2% 57 City Treasurer 18% -21% -1% 4% -5% 8% -1% -2% 10 Community Development 23% -14% 1% -6% -2% -1% -1% -2% 271 Convention & Cultural Services 31% -21% 2% -9% -1% -1% -1% 0% 170 Finance 12% -17% 8% -2% -1% 0% 1% 0% 85 Fire 39% -17% -8% -11% -3% 0% 1% -1% 655 Human Resources 20% -29% 4% 0% 1% 4% -1% 1% 64 Information Technology 13% -12% -3% 3% 0% -1% 1% 0% 176 Mayor/Council 12% -4% 5% -9% -1% -2% -1% 0% 55 Police 33% -16% -6% -7% -1% -1% 0% -1% 1,166 Public Works 7% -2% 2% -7% -1% 1% 1% -1% 632 Utilities 24% -10% -5% -8% 0% 0% 1% -1% 504 Youth, Parks, and Community Enrichment -3% -5% 8% -5% 6% 0% 0% -1% 783 All City Staff Total 21% -12% -1% -7% 0.1% -0.2% 0.4% -1% 4,709
Scale -15% or less -10% -5% Percentage Point Difference from City Residents 5% 10% 15% or more
Note: The 13 employees that did not have their ethnicity specified were excluded from this analysis. Source: Auditor generated from City of Sacramento eCAPS data and American Community Survey.
Office of the City Auditor 40
November 2020
Ethnic/Racial Demographics of City Employees 2016-2020
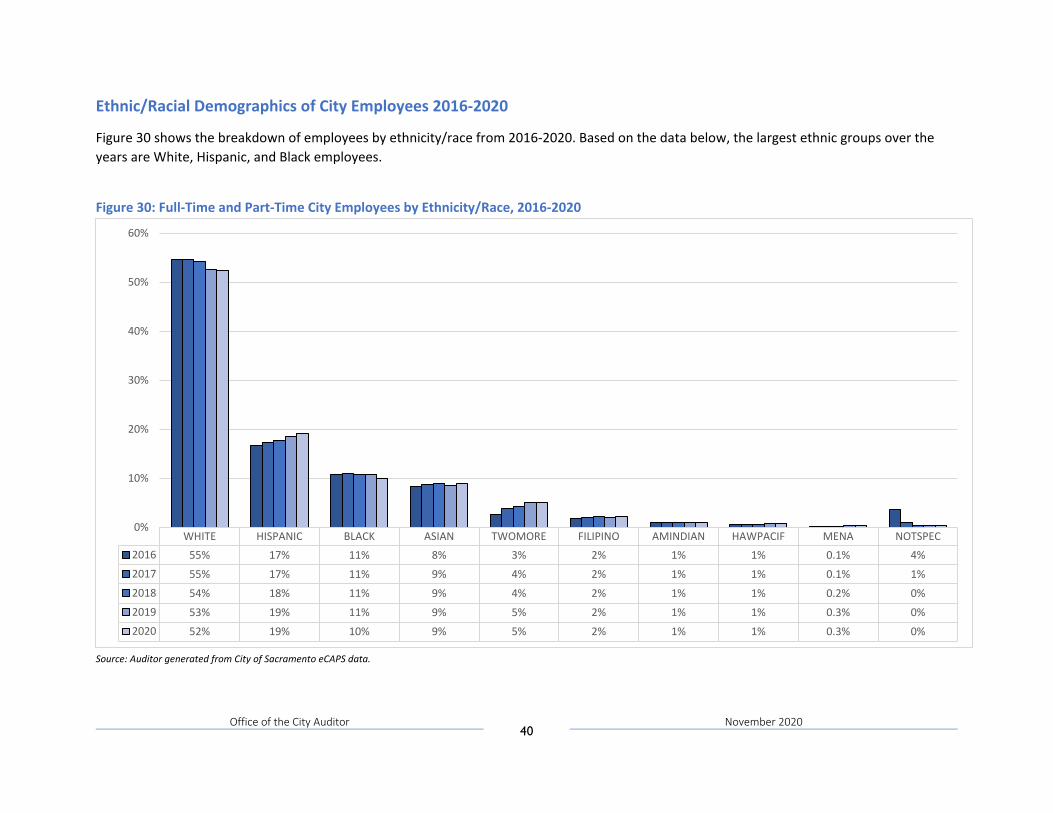
Figure 30 shows the breakdown of employees by ethnicity/race from 2016-2020. Based on the data below, the largest ethnic groups over the years are White, Hispanic, and Black employees.
Figure 30: Full-Time and Part-Time City Employees by Ethnicity/Race, 2016-2020
Source: Auditor generated from City of Sacramento eCAPS data.
WHITE HISPANIC BLACK ASIAN TWOMORE FILIPINO AMINDIAN HAWPACIF MENA NOTSPEC2016 55% 17% 11% 8% 3% 2% 1% 1% 0.1% 4%2017 55% 17% 11% 9% 4% 2% 1% 1% 0.1% 1%2018 54% 18% 11% 9% 4% 2% 1% 1% 0.2% 0%2019 53% 19% 11% 9% 5% 2% 1% 1% 0.3% 0%2020 52% 19% 10% 9% 5% 2% 1% 1% 0.3% 0%
0%
10%
20%
30%
40%
50%
60%
Office of the City Auditor 41
November 2020
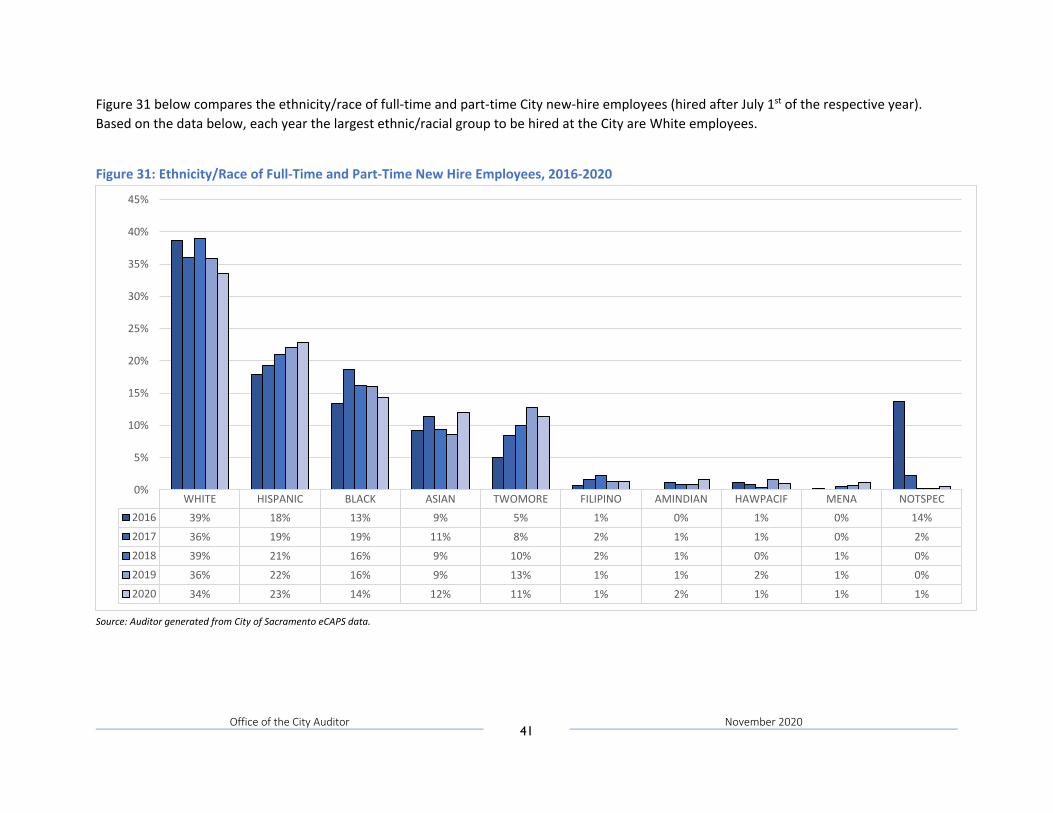
Figure 31 below compares the ethnicity/race of full-time and part-time City new-hire employees (hired after July 1st of the respective year). Based on the data below, each year the largest ethnic/racial group to be hired at the City are White employees.
Figure 31: Ethnicity/Race of Full-Time and Part-Time New Hire Employees, 2016-2020
Source: Auditor generated from City of Sacramento eCAPS data.
WHITE HISPANIC BLACK ASIAN TWOMORE FILIPINO AMINDIAN HAWPACIF MENA NOTSPEC2016 39% 18% 13% 9% 5% 1% 0% 1% 0% 14%2017 36% 19% 19% 11% 8% 2% 1% 1% 0% 2%2018 39% 21% 16% 9% 10% 2% 1% 0% 1% 0%2019 36% 22% 16% 9% 13% 1% 1% 2% 1% 0%2020 34% 23% 14% 12% 11% 1% 2% 1% 1% 1%
0%
5%
10%
15%
20%
25%
30%
35%
40%
45%
Office of the City Auditor 42
November 2020
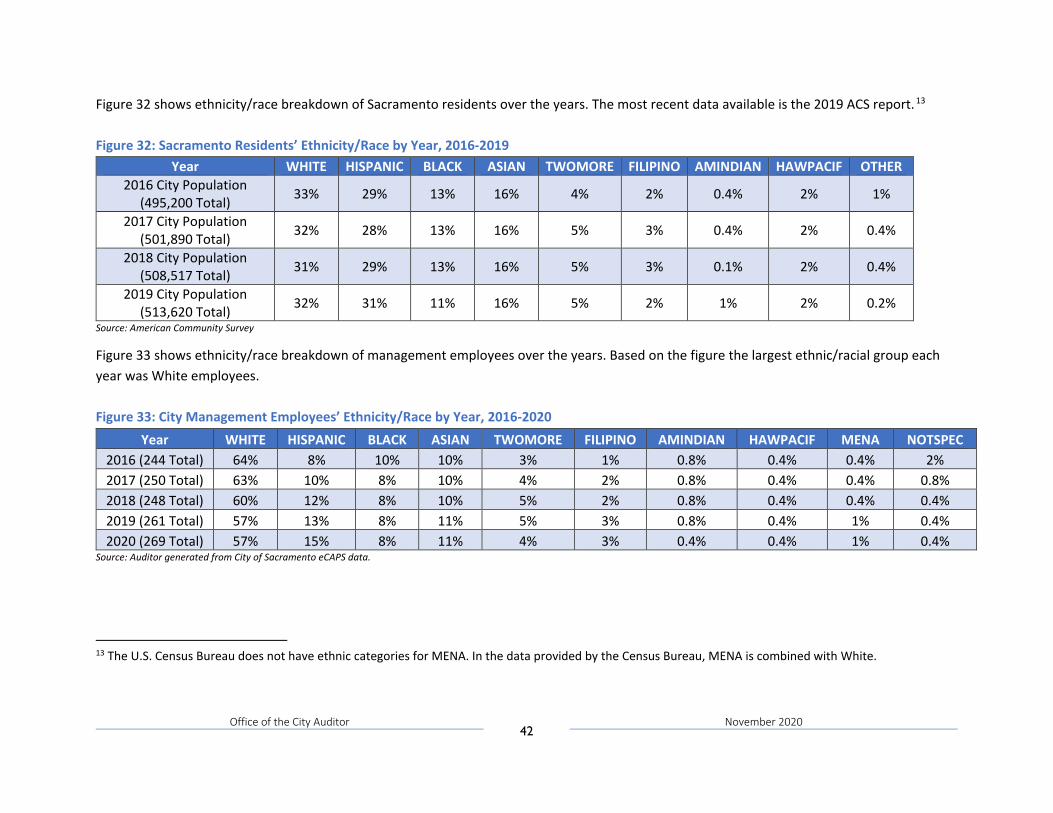
Figure 32 shows ethnicity/race breakdown of Sacramento residents over the years. The most recent data available is the 2019 ACS report. 13 Figure 32: Sacramento Residents’ Ethnicity/Race by Year, 2016-2019
Year WHITE HISPANIC BLACK ASIAN TWOMORE FILIPINO AMINDIAN HAWPACIF OTHER 2016 City Population
(495,200 Total) 33% 29% 13% 16% 4% 2% 0.4% 2% 1%
2017 City Population (501,890 Total) 32% 28% 13% 16% 5% 3% 0.4% 2% 0.4%
2018 City Population (508,517 Total) 31% 29% 13% 16% 5% 3% 0.1% 2% 0.4%
2019 City Population (513,620 Total) 32% 31% 11% 16% 5% 2% 1% 2% 0.2%
Source: American Community Survey
Figure 33 shows ethnicity/race breakdown of management employees over the years. Based on the figure the largest ethnic/racial group each year was White employees. Figure 33: City Management Employees’ Ethnicity/Race by Year, 2016-2020
Year WHITE HISPANIC BLACK ASIAN TWOMORE FILIPINO AMINDIAN HAWPACIF MENA NOTSPEC 2016 (244 Total) 64% 8% 10% 10% 3% 1% 0.8% 0.4% 0.4% 2% 2017 (250 Total) 63% 10% 8% 10% 4% 2% 0.8% 0.4% 0.4% 0.8% 2018 (248 Total) 60% 12% 8% 10% 5% 2% 0.8% 0.4% 0.4% 0.4% 2019 (261 Total) 57% 13% 8% 11% 5% 3% 0.8% 0.4% 1% 0.4% 2020 (269 Total) 57% 15% 8% 11% 4% 3% 0.4% 0.4% 1% 0.4%
Source: Auditor generated from City of Sacramento eCAPS data.
13 The U.S. Census Bureau does not have ethnic categories for MENA. In the data provided by the Census Bureau, MENA is combined with White.
Office of the City Auditor 43
November 2020
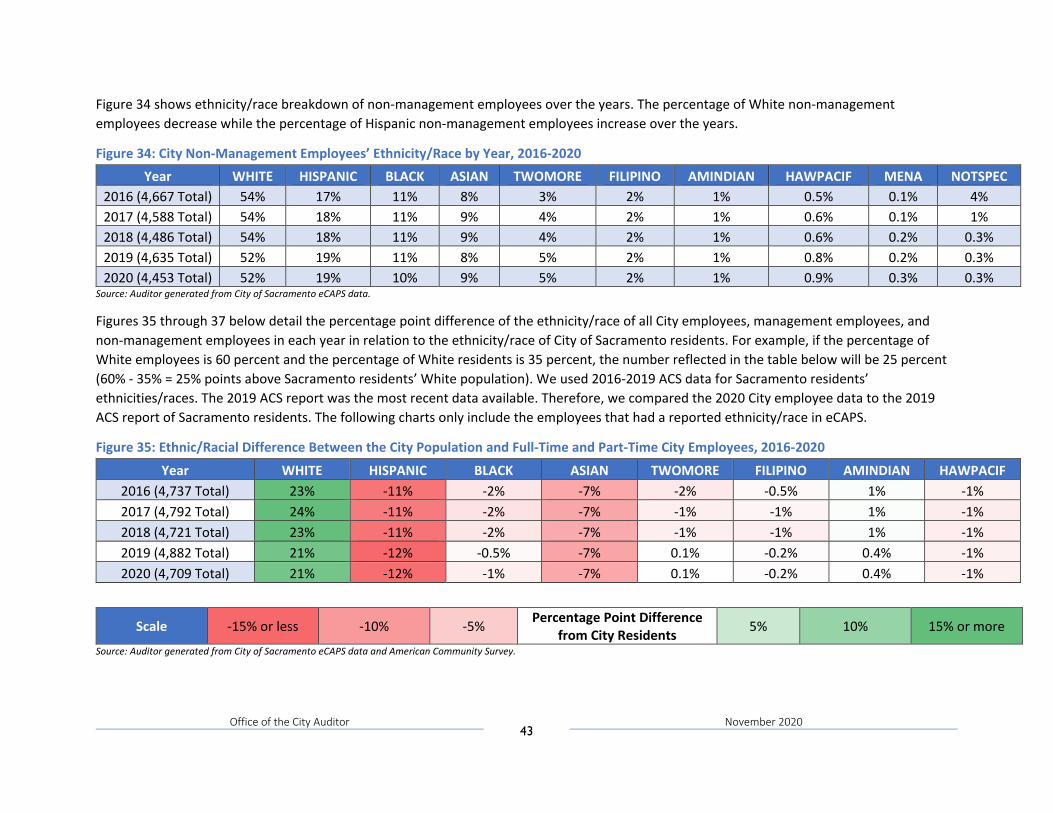
Figure 34 shows ethnicity/race breakdown of non-management employees over the years. The percentage of White non-management employees decrease while the percentage of Hispanic non-management employees increase over the years.
Figure 34: City Non-Management Employees’ Ethnicity/Race by Year, 2016-2020 Year WHITE HISPANIC BLACK ASIAN TWOMORE FILIPINO AMINDIAN HAWPACIF MENA NOTSPEC
2016 (4,667 Total) 54% 17% 11% 8% 3% 2% 1% 0.5% 0.1% 4% 2017 (4,588 Total) 54% 18% 11% 9% 4% 2% 1% 0.6% 0.1% 1% 2018 (4,486 Total) 54% 18% 11% 9% 4% 2% 1% 0.6% 0.2% 0.3% 2019 (4,635 Total) 52% 19% 11% 8% 5% 2% 1% 0.8% 0.2% 0.3% 2020 (4,453 Total) 52% 19% 10% 9% 5% 2% 1% 0.9% 0.3% 0.3%
Source: Auditor generated from City of Sacramento eCAPS data.
Figures 35 through 37 below detail the percentage point difference of the ethnicity/race of all City employees, management employees, and non-management employees in each year in relation to the ethnicity/race of City of Sacramento residents. For example, if the percentage of White employees is 60 percent and the percentage of White residents is 35 percent, the number reflected in the table below will be 25 percent (60% - 35% = 25% points above Sacramento residents’ White population). We used 2016-2019 ACS data for Sacramento residents’ ethnicities/races. The 2019 ACS report was the most recent data available. Therefore, we compared the 2020 City employee data to the 2019 ACS report of Sacramento residents. The following charts only include the employees that had a reported ethnicity/race in eCAPS.
Figure 35: Ethnic/Racial Difference Between the City Population and Full-Time and Part-Time City Employees, 2016-2020
Year WHITE HISPANIC BLACK ASIAN TWOMORE FILIPINO AMINDIAN HAWPACIF 2016 (4,737 Total) 23% -11% -2% -7% -2% -0.5% 1% -1% 2017 (4,792 Total) 24% -11% -2% -7% -1% -1% 1% -1% 2018 (4,721 Total) 23% -11% -2% -7% -1% -1% 1% -1% 2019 (4,882 Total) 21% -12% -0.5% -7% 0.1% -0.2% 0.4% -1% 2020 (4,709 Total) 21% -12% -1% -7% 0.1% -0.2% 0.4% -1%
Scale -15% or less -10% -5% Percentage Point Difference from City Residents 5% 10% 15% or more
Source: Auditor generated from City of Sacramento eCAPS data and American Community Survey.
Office of the City Auditor 44
November 2020
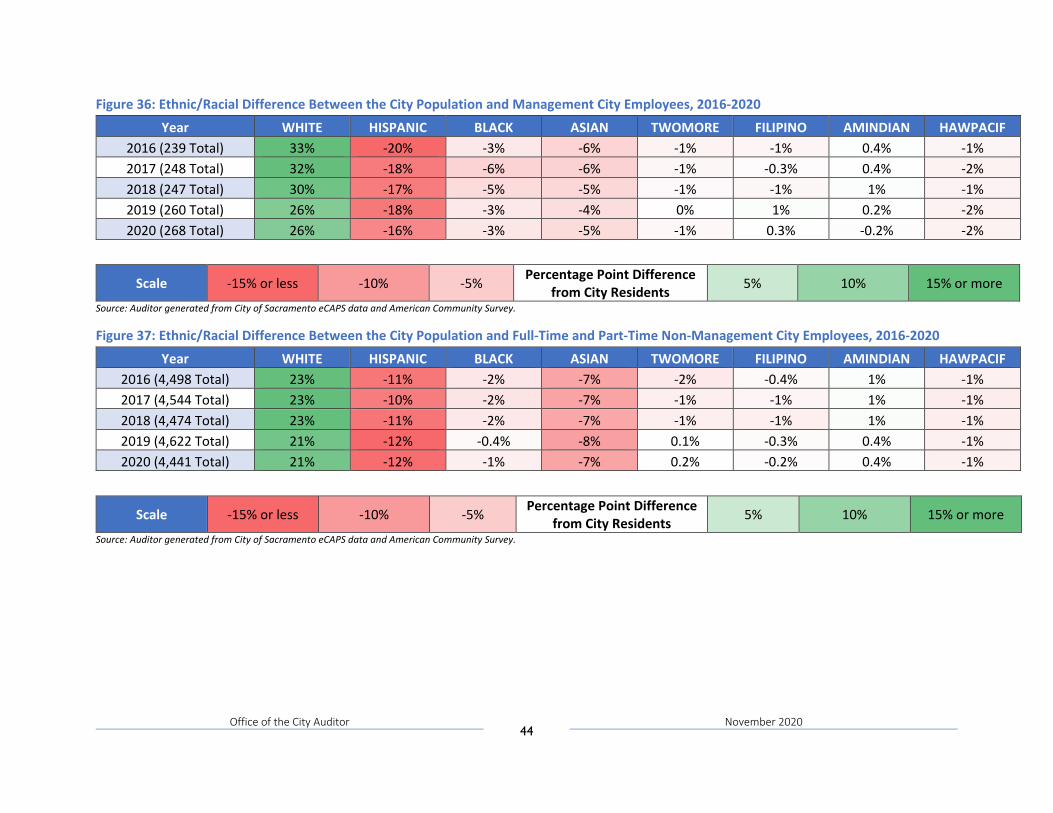
Figure 36: Ethnic/Racial Difference Between the City Population and Management City Employees, 2016-2020
Year WHITE HISPANIC BLACK ASIAN TWOMORE FILIPINO AMINDIAN HAWPACIF 2016 (239 Total) 33% -20% -3% -6% -1% -1% 0.4% -1% 2017 (248 Total) 32% -18% -6% -6% -1% -0.3% 0.4% -2% 2018 (247 Total) 30% -17% -5% -5% -1% -1% 1% -1% 2019 (260 Total) 26% -18% -3% -4% 0% 1% 0.2% -2% 2020 (268 Total) 26% -16% -3% -5% -1% 0.3% -0.2% -2%
Scale -15% or less -10% -5% Percentage Point Difference from City Residents 5% 10% 15% or more
Source: Auditor generated from City of Sacramento eCAPS data and American Community Survey.
Figure 37: Ethnic/Racial Difference Between the City Population and Full-Time and Part-Time Non-Management City Employees, 2016-2020
Year WHITE HISPANIC BLACK ASIAN TWOMORE FILIPINO AMINDIAN HAWPACIF 2016 (4,498 Total) 23% -11% -2% -7% -2% -0.4% 1% -1% 2017 (4,544 Total) 23% -10% -2% -7% -1% -1% 1% -1% 2018 (4,474 Total) 23% -11% -2% -7% -1% -1% 1% -1% 2019 (4,622 Total) 21% -12% -0.4% -8% 0.1% -0.3% 0.4% -1% 2020 (4,441 Total) 21% -12% -1% -7% 0.2% -0.2% 0.4% -1%
Scale -15% or less -10% -5% Percentage Point Difference from City Residents 5% 10% 15% or more
Source: Auditor generated from City of Sacramento eCAPS data and American Community Survey.
Office of the City Auditor 45
November 2020
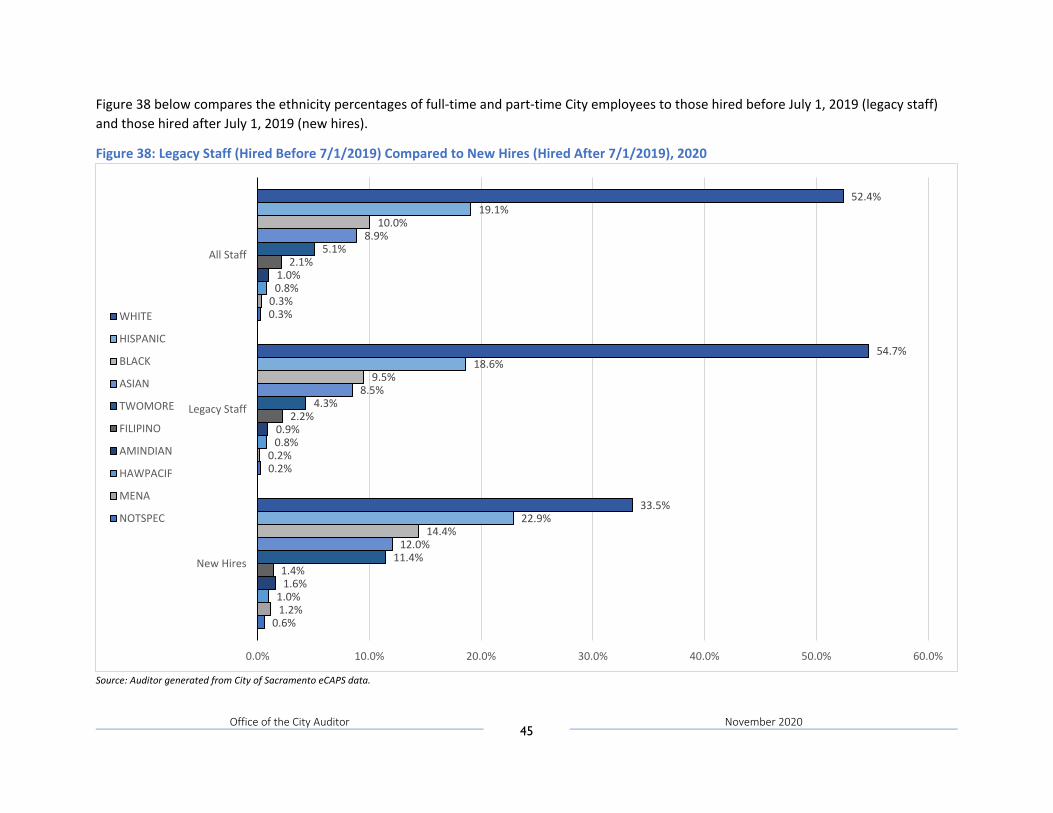
Figure 38 below compares the ethnicity percentages of full-time and part-time City employees to those hired before July 1, 2019 (legacy staff) and those hired after July 1, 2019 (new hires).
Figure 38: Legacy Staff (Hired Before 7/1/2019) Compared to New Hires (Hired After 7/1/2019), 2020
Source: Auditor generated from City of Sacramento eCAPS data.
0.6%
0.2%
0.3%
1.2%
0.2%
0.3%
1.0%
0.8%
0.8%
1.6%
0.9%
1.0%
1.4%
2.2%
2.1%
11.4%
4.3%
5.1%
12.0%
8.5%
8.9%
14.4%
9.5%
10.0%
22.9%
18.6%
19.1%
33.5%
54.7%
52.4%
0.0% 10.0% 20.0% 30.0% 40.0% 50.0% 60.0%
New Hires
Legacy Staff
All Staff
WHITE
HISPANIC
BLACK
ASIAN
TWOMORE
FILIPINO
AMINDIAN
HAWPACIF
MENA
NOTSPEC
Office of the City Auditor 46
November 2020
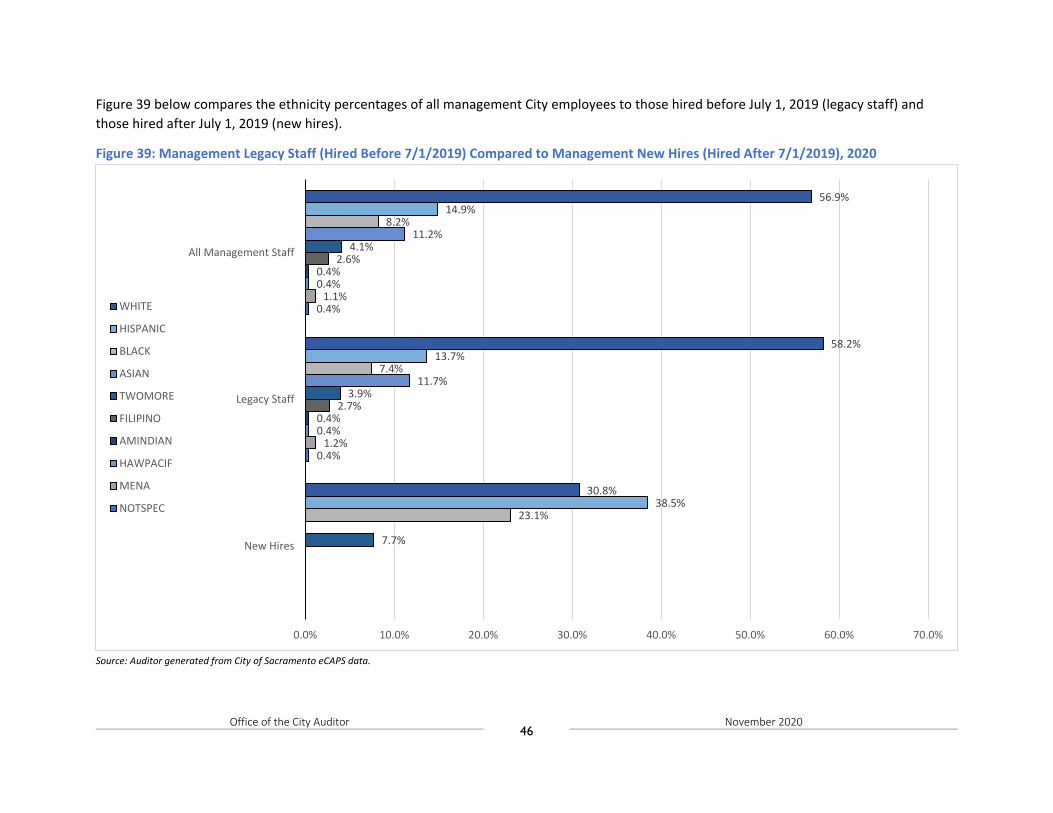
Figure 39 below compares the ethnicity percentages of all management City employees to those hired before July 1, 2019 (legacy staff) and those hired after July 1, 2019 (new hires).
Figure 39: Management Legacy Staff (Hired Before 7/1/2019) Compared to Management New Hires (Hired After 7/1/2019), 2020
Source: Auditor generated from City of Sacramento eCAPS data.
0.4%
0.4%
1.2%
1.1%
0.4%
0.4%
0.4%
0.4%
2.7%
2.6%
7.7%
3.9%
4.1%
11.7%
11.2%
23.1%
7.4%
8.2%
38.5%
13.7%
14.9%
30.8%
58.2%
56.9%
0.0% 10.0% 20.0% 30.0% 40.0% 50.0% 60.0% 70.0%
New Hires
Legacy Staff
All Management Staff
WHITE
HISPANIC
BLACK
ASIAN
TWOMORE
FILIPINO
AMINDIAN
HAWPACIF
MENA
NOTSPEC
Office of the City Auditor 47
November 2020
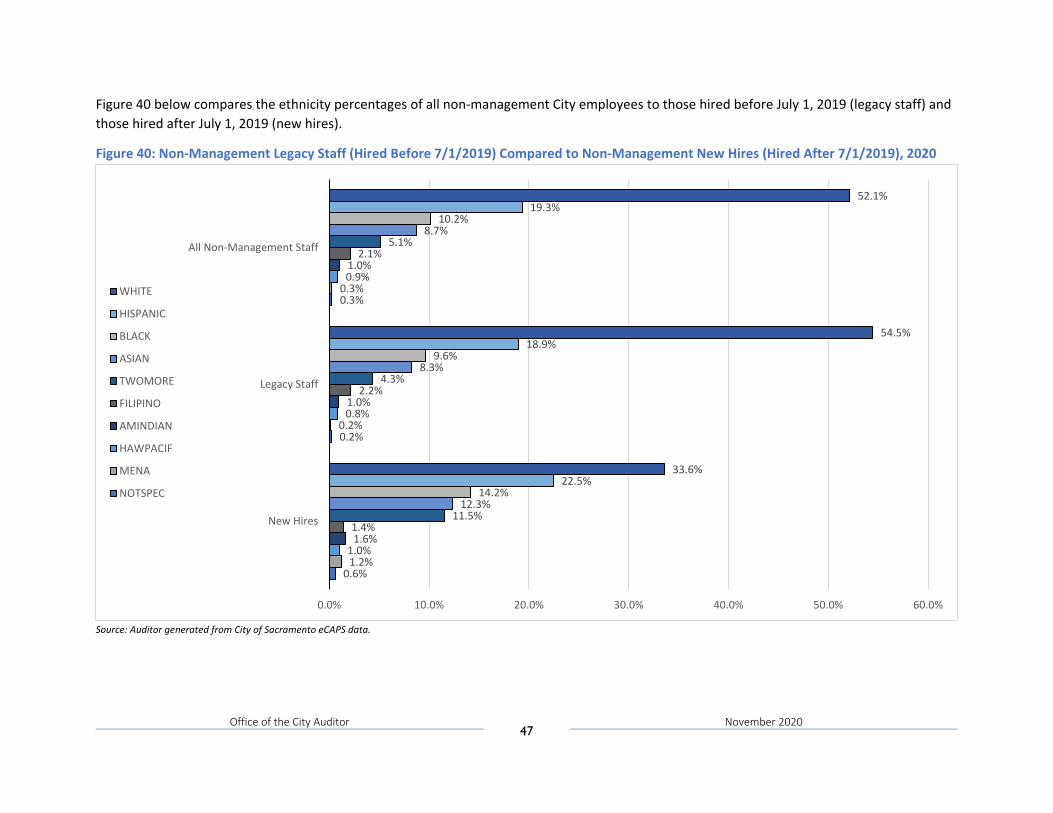
Figure 40 below compares the ethnicity percentages of all non-management City employees to those hired before July 1, 2019 (legacy staff) and those hired after July 1, 2019 (new hires).
Figure 40: Non-Management Legacy Staff (Hired Before 7/1/2019) Compared to Non-Management New Hires (Hired After 7/1/2019), 2020
Source: Auditor generated from City of Sacramento eCAPS data.
0.6%
0.2%
0.3%
1.2%
0.2%
0.3%
1.0%
0.8%
0.9%
1.6%
1.0%
1.0%
1.4%
2.2%
2.1%
11.5%
4.3%
5.1%
12.3%
8.3%
8.7%
14.2%
9.6%
10.2%
22.5%
18.9%
19.3%
33.6%
54.5%
52.1%
0.0% 10.0% 20.0% 30.0% 40.0% 50.0% 60.0%
New Hires
Legacy Staff
All Non-Management Staff
WHITE
HISPANIC
BLACK
ASIAN
TWOMORE
FILIPINO
AMINDIAN
HAWPACIF
MENA
NOTSPEC
Office of the City Auditor 48
November 2020
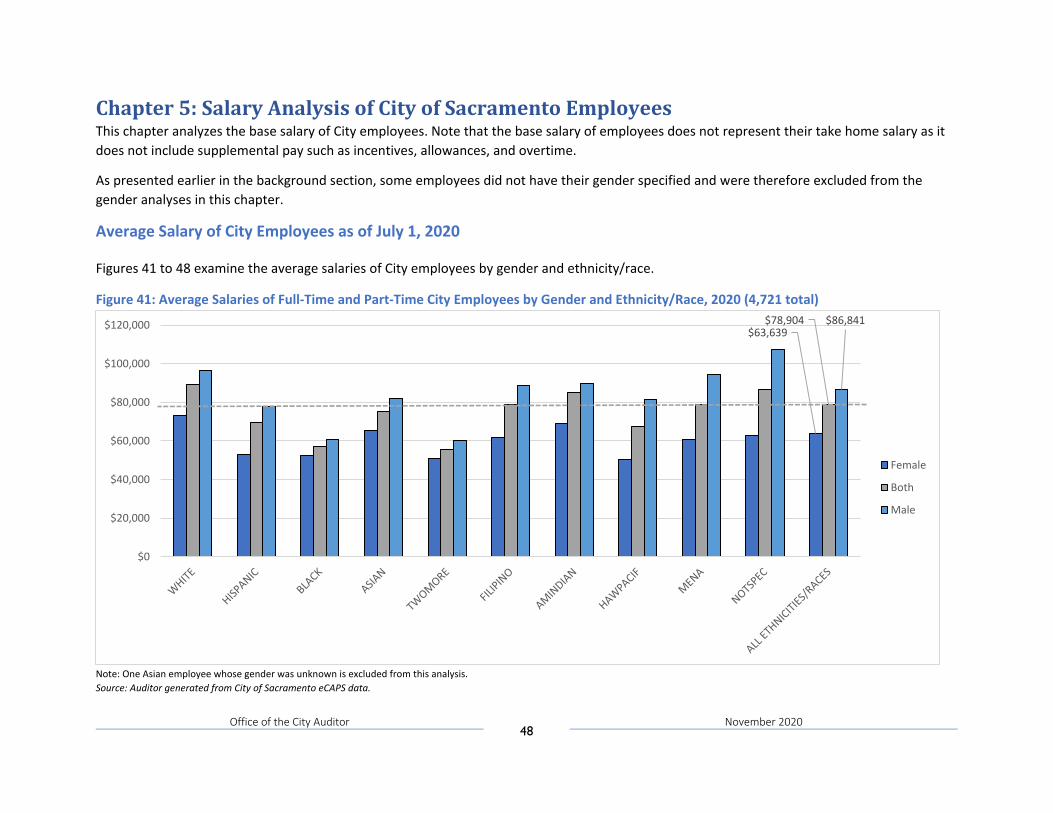
Chapter 5: Salary Analysis of City of Sacramento Employees This chapter analyzes the base salary of City employees. Note that the base salary of employees does not represent their take home salary as it does not include supplemental pay such as incentives, allowances, and overtime.
As presented earlier in the background section, some employees did not have their gender specified and were therefore excluded from the gender analyses in this chapter.
Average Salary of City Employees as of July 1, 2020
Figures 41 to 48 examine the average salaries of City employees by gender and ethnicity/race.
Figure 41: Average Salaries of Full-Time and Part-Time City Employees by Gender and Ethnicity/Race, 2020 (4,721 total)
Note: One Asian employee whose gender was unknown is excluded from this analysis. Source: Auditor generated from City of Sacramento eCAPS data.
$63,639$78,904 $86,841
$0
$20,000
$40,000
$60,000
$80,000
$100,000
$120,000
Female
Both
Male
Office of the City Auditor 49
November 2020
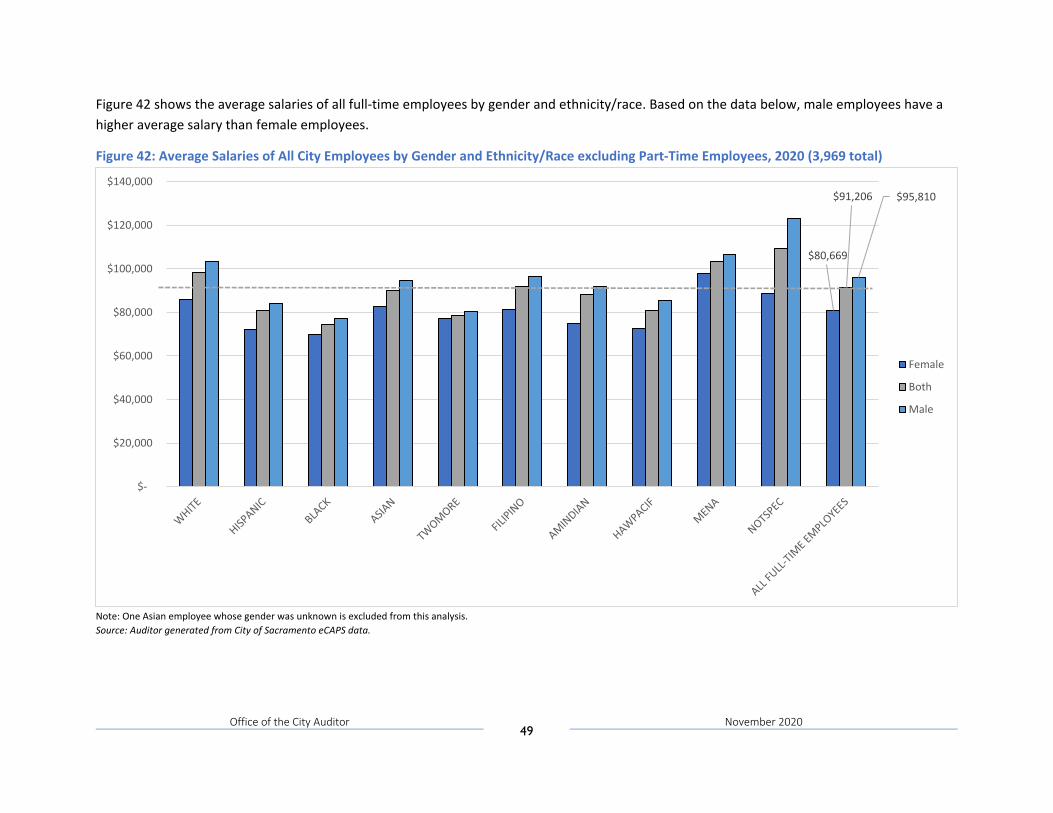
Figure 42 shows the average salaries of all full-time employees by gender and ethnicity/race. Based on the data below, male employees have a higher average salary than female employees.
Figure 42: Average Salaries of All City Employees by Gender and Ethnicity/Race excluding Part-Time Employees, 2020 (3,969 total)
Note: One Asian employee whose gender was unknown is excluded from this analysis. Source: Auditor generated from City of Sacramento eCAPS data.
$80,669
$91,206 $95,810
$-
$20,000
$40,000
$60,000
$80,000
$100,000
$120,000
$140,000
Female
Both
Male
Office of the City Auditor 50
November 2020
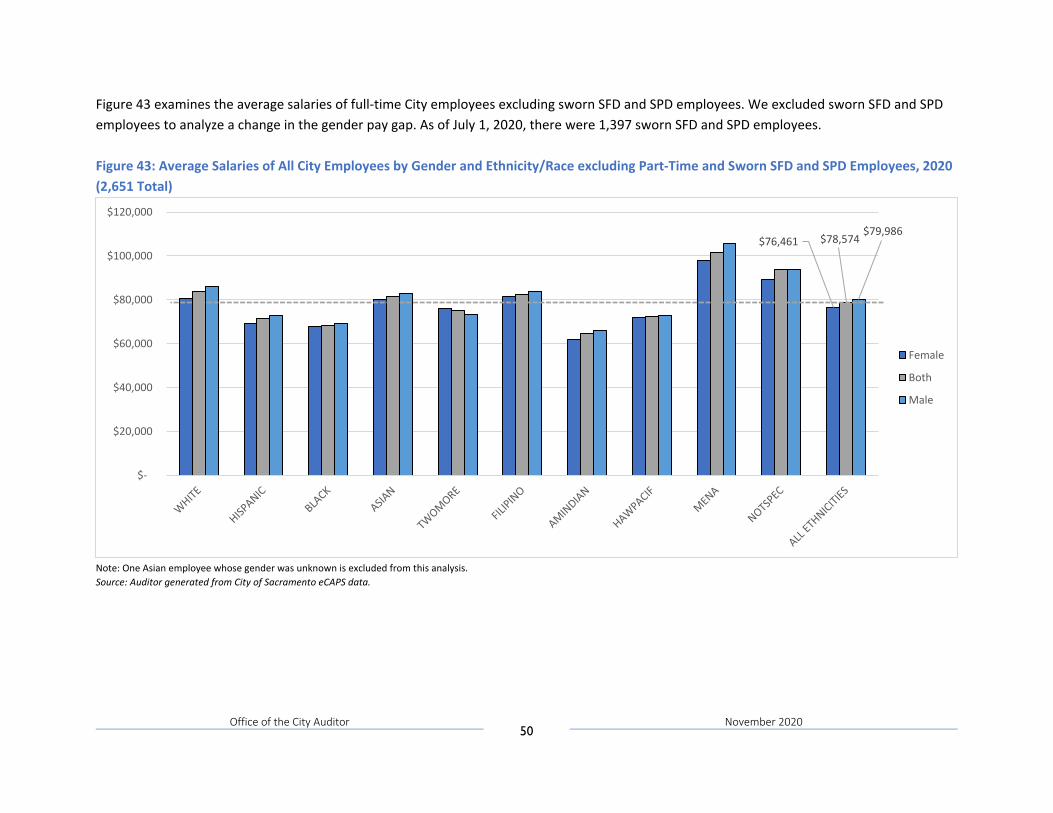
Figure 43 examines the average salaries of full-time City employees excluding sworn SFD and SPD employees. We excluded sworn SFD and SPD employees to analyze a change in the gender pay gap. As of July 1, 2020, there were 1,397 sworn SFD and SPD employees. Figure 43: Average Salaries of All City Employees by Gender and Ethnicity/Race excluding Part-Time and Sworn SFD and SPD Employees, 2020 (2,651 Total)
Note: One Asian employee whose gender was unknown is excluded from this analysis. Source: Auditor generated from City of Sacramento eCAPS data.
$76,461 $78,574 $79,986
$-
$20,000
$40,000
$60,000
$80,000
$100,000
$120,000
Female
Both
Male
Office of the City Auditor 51
November 2020
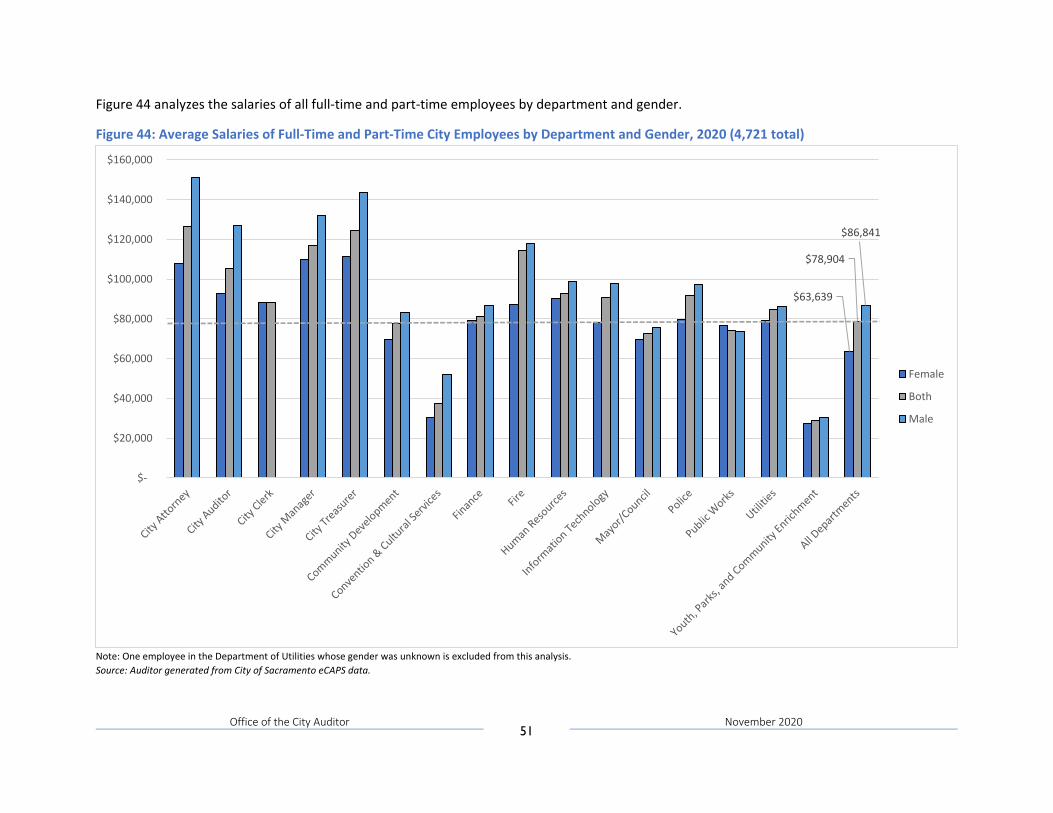
Figure 44 analyzes the salaries of all full-time and part-time employees by department and gender.
Figure 44: Average Salaries of Full-Time and Part-Time City Employees by Department and Gender, 2020 (4,721 total)
Note: One employee in the Department of Utilities whose gender was unknown is excluded from this analysis. Source: Auditor generated from City of Sacramento eCAPS data.
$63,639
$78,904
$86,841
$-
$20,000
$40,000
$60,000
$80,000
$100,000
$120,000
$140,000
$160,000
Female
Both
Male
Office of the City Auditor 52
November 2020
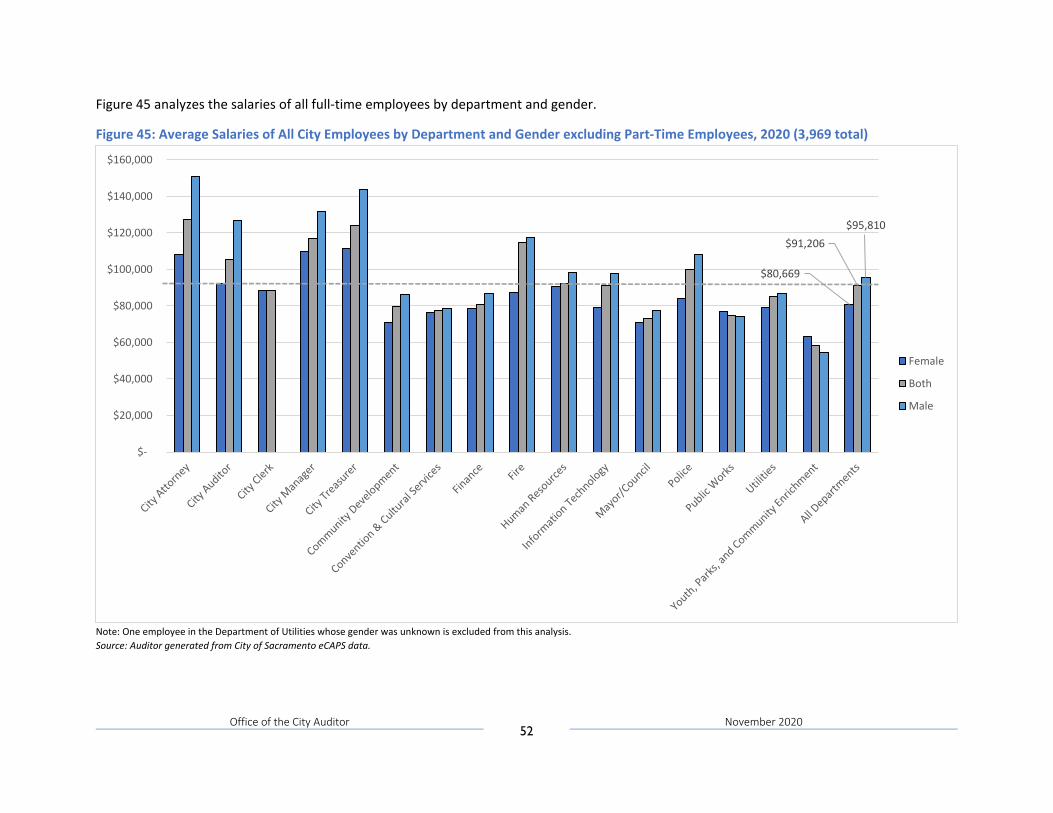
Figure 45 analyzes the salaries of all full-time employees by department and gender.
Figure 45: Average Salaries of All City Employees by Department and Gender excluding Part-Time Employees, 2020 (3,969 total)
Note: One employee in the Department of Utilities whose gender was unknown is excluded from this analysis. Source: Auditor generated from City of Sacramento eCAPS data.
$80,669
$91,206 $95,810
$-
$20,000
$40,000
$60,000
$80,000
$100,000
$120,000
$140,000
$160,000
Female
Both
Male
Office of the City Auditor 53
November 2020
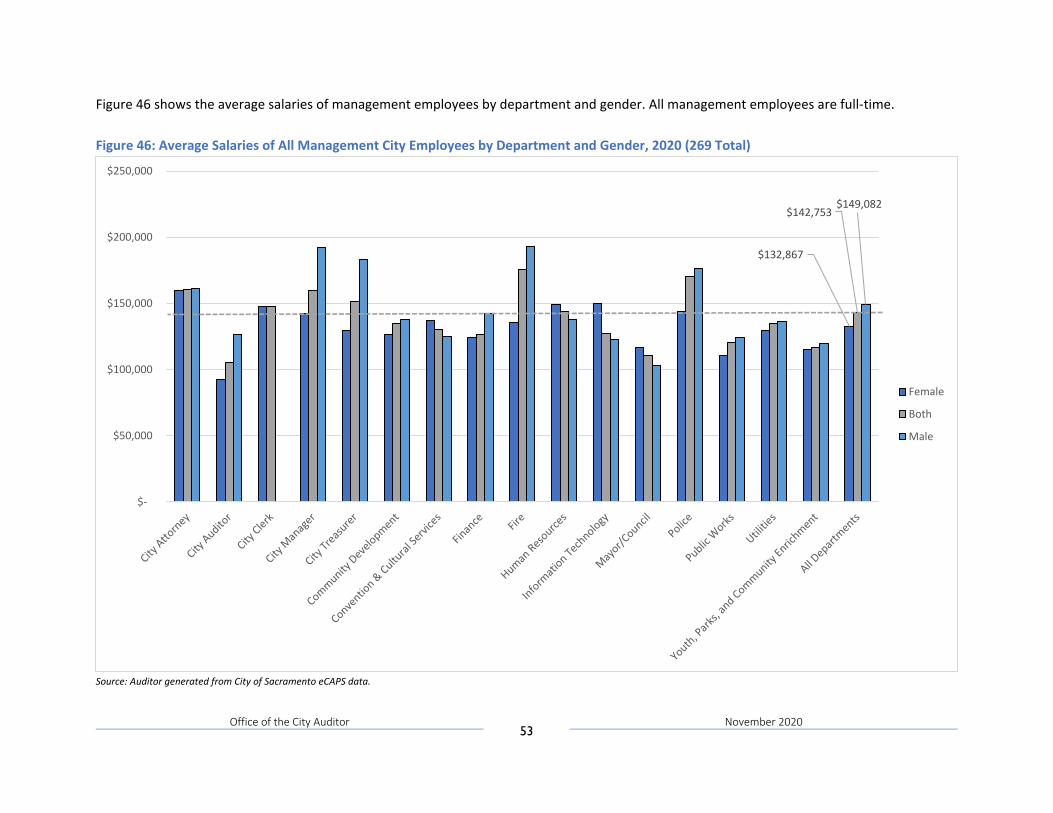
Figure 46 shows the average salaries of management employees by department and gender. All management employees are full-time. Figure 46: Average Salaries of All Management City Employees by Department and Gender, 2020 (269 Total)
Source: Auditor generated from City of Sacramento eCAPS data.
$132,867
$142,753 $149,082
$-
$50,000
$100,000
$150,000
$200,000
$250,000
Female
Both
Male
Office of the City Auditor 54
November 2020
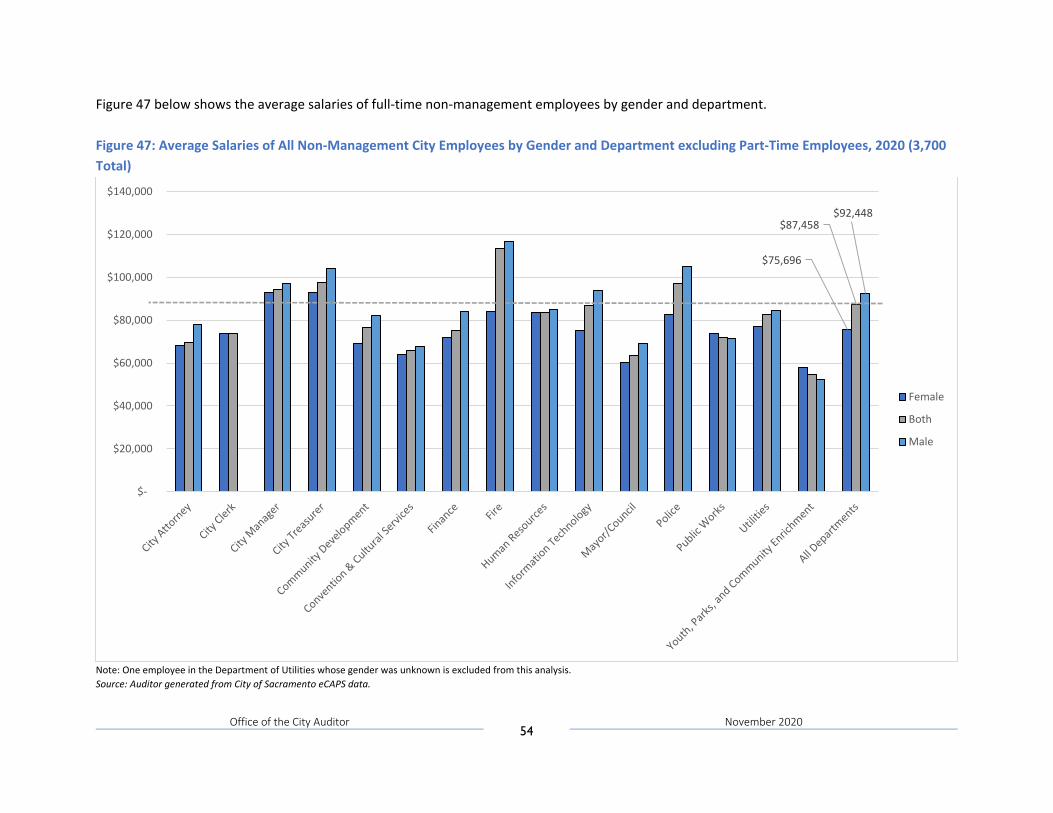
Figure 47 below shows the average salaries of full-time non-management employees by gender and department. Figure 47: Average Salaries of All Non-Management City Employees by Gender and Department excluding Part-Time Employees, 2020 (3,700 Total)
Note: One employee in the Department of Utilities whose gender was unknown is excluded from this analysis. Source: Auditor generated from City of Sacramento eCAPS data.
$75,696
$87,458 $92,448
$-
$20,000
$40,000
$60,000
$80,000
$100,000
$120,000
$140,000
Female
Both
Male
Office of the City Auditor 55
November 2020
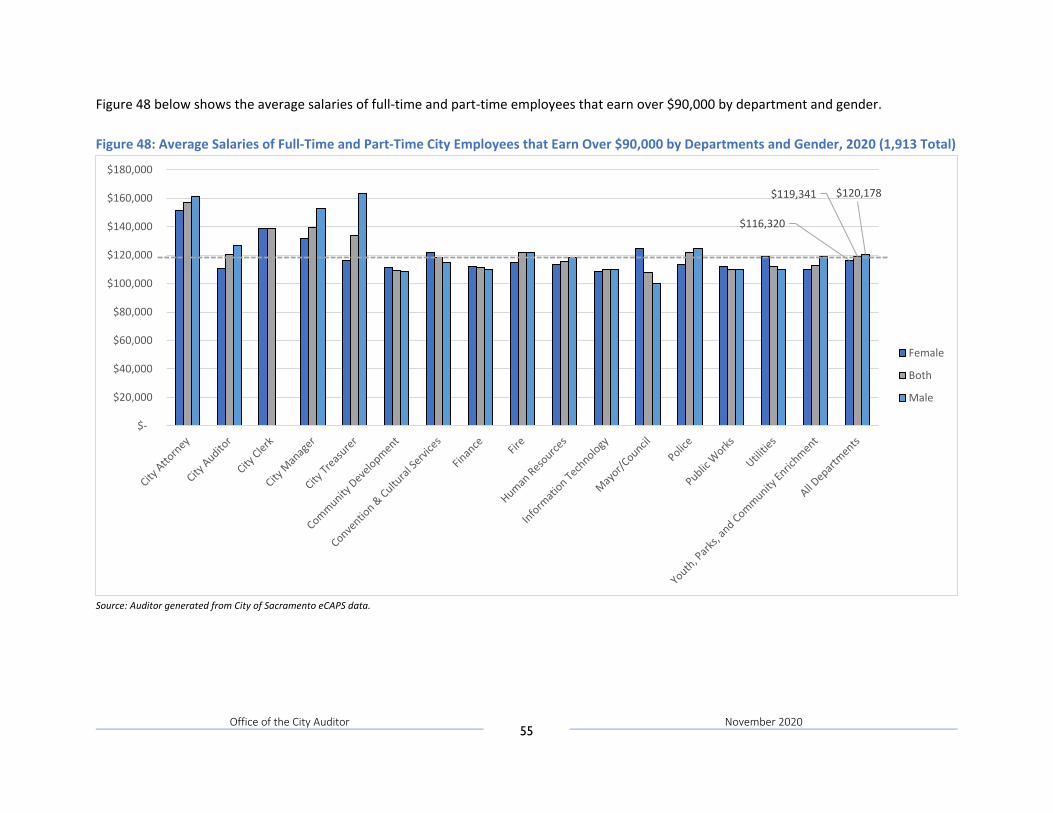
Figure 48 below shows the average salaries of full-time and part-time employees that earn over $90,000 by department and gender. Figure 48: Average Salaries of Full-Time and Part-Time City Employees that Earn Over $90,000 by Departments and Gender, 2020 (1,913 Total)
Source: Auditor generated from City of Sacramento eCAPS data.
$116,320
$119,341 $120,178
$-
$20,000
$40,000
$60,000
$80,000
$100,000
$120,000
$140,000
$160,000
$180,000
Female
Both
Male
Office of the City Auditor 56
November 2020
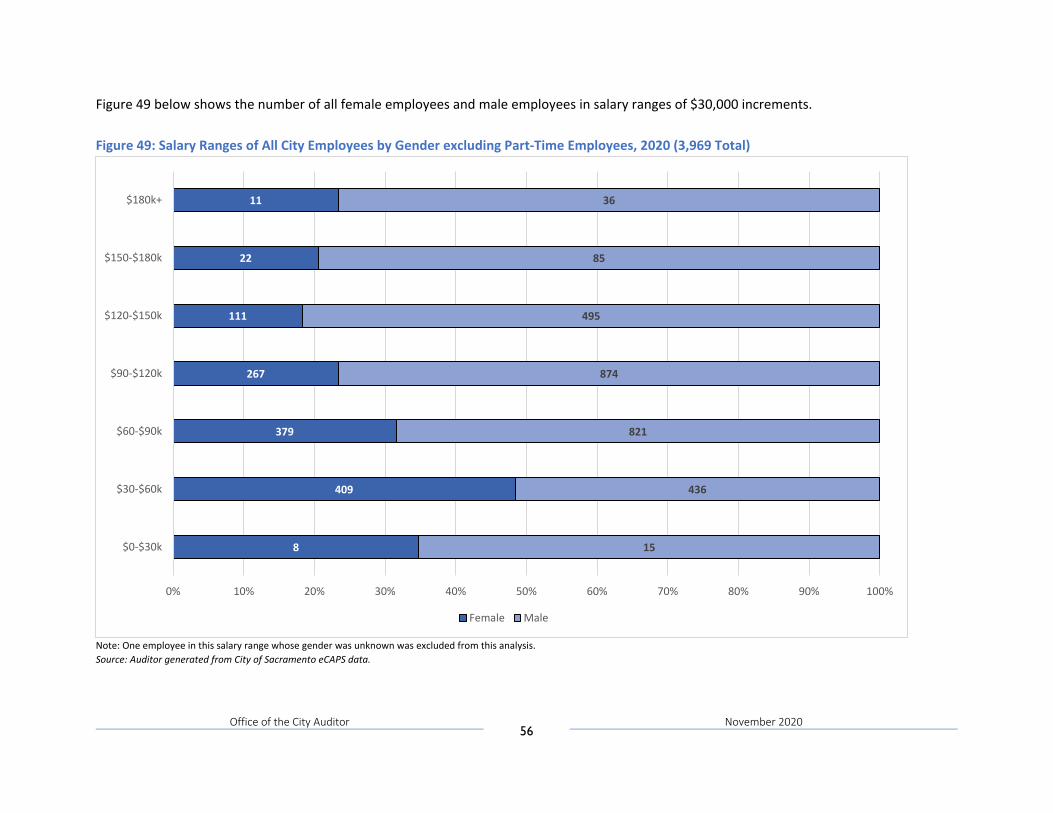
Figure 49 below shows the number of all female employees and male employees in salary ranges of $30,000 increments. Figure 49: Salary Ranges of All City Employees by Gender excluding Part-Time Employees, 2020 (3,969 Total)
Note: One employee in this salary range whose gender was unknown was excluded from this analysis. Source: Auditor generated from City of Sacramento eCAPS data.
8
409
379
267
111
22
11
15
436
821
874
495
85
36
0% 10% 20% 30% 40% 50% 60% 70% 80% 90% 100%
$0-$30k
$30-$60k
$60-$90k
$90-$120k
$120-$150k
$150-$180k
$180k+
Female Male
Office of the City Auditor 57
November 2020
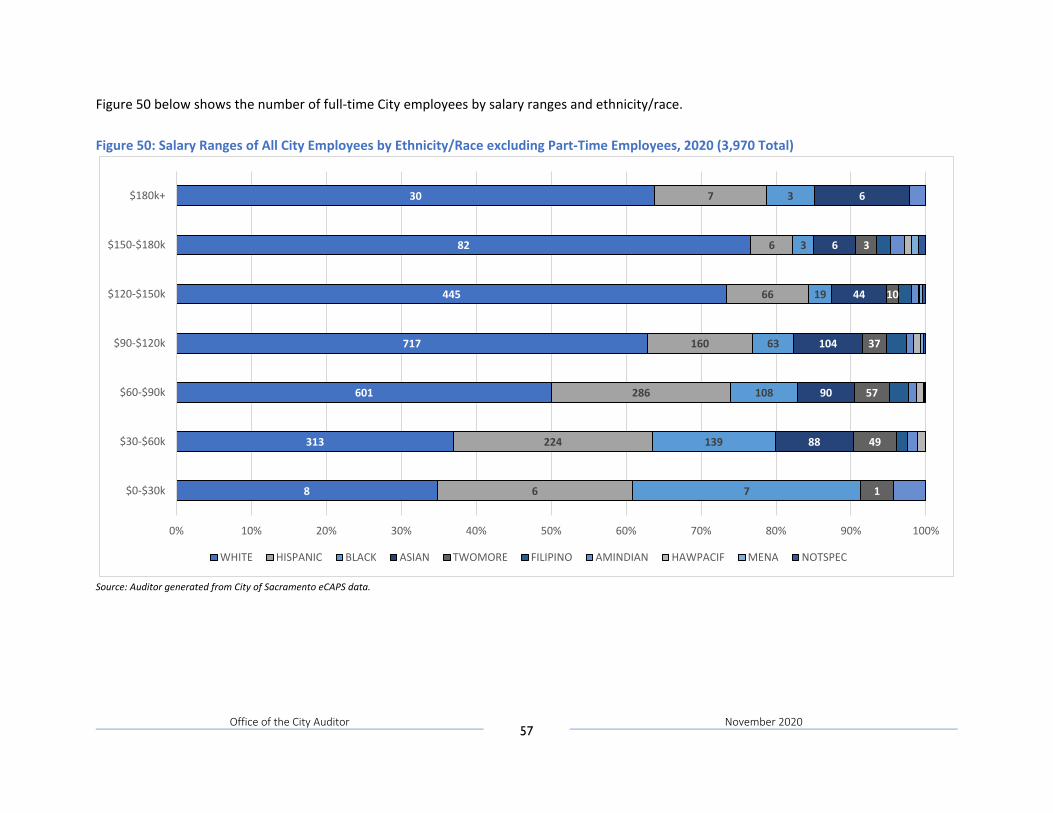
Figure 50 below shows the number of full-time City employees by salary ranges and ethnicity/race. Figure 50: Salary Ranges of All City Employees by Ethnicity/Race excluding Part-Time Employees, 2020 (3,970 Total)
Source: Auditor generated from City of Sacramento eCAPS data.
8
313
601
717
445
82
30
6
224
286
160
66
6
7
7
139
108
63
19
3
3
88
90
104
44
6
6
1
49
57
37
10
3
0% 10% 20% 30% 40% 50% 60% 70% 80% 90% 100%
$0-$30k
$30-$60k
$60-$90k
$90-$120k
$120-$150k
$150-$180k
$180k+
WHITE HISPANIC BLACK ASIAN TWOMORE FILIPINO AMINDIAN HAWPACIF MENA NOTSPEC
Office of the City Auditor 58
November 2020
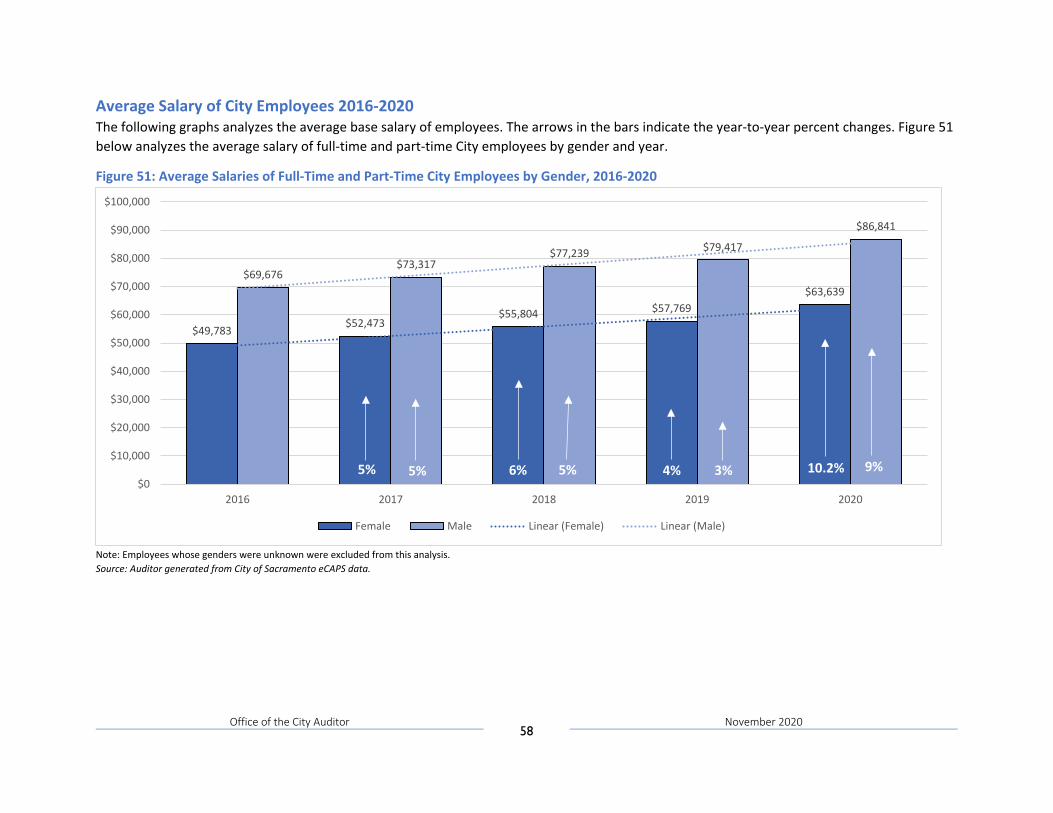
Average Salary of City Employees 2016-2020 The following graphs analyzes the average base salary of employees. The arrows in the bars indicate the year-to-year percent changes. Figure 51 below analyzes the average salary of full-time and part-time City employees by gender and year.
Figure 51: Average Salaries of Full-Time and Part-Time City Employees by Gender, 2016-2020
Note: Employees whose genders were unknown were excluded from this analysis. Source: Auditor generated from City of Sacramento eCAPS data.
$49,783$52,473
$55,804 $57,769$63,639
$69,676$73,317
$77,239 $79,417
$86,841
$0
$10,000
$20,000
$30,000
$40,000
$50,000
$60,000
$70,000
$80,000
$90,000
$100,000
2016 2017 2018 2019 2020
Female Male Linear (Female) Linear (Male)
5% 5% 6% 5% 4% 3% 10.2% 9%
Office of the City Auditor 59
November 2020
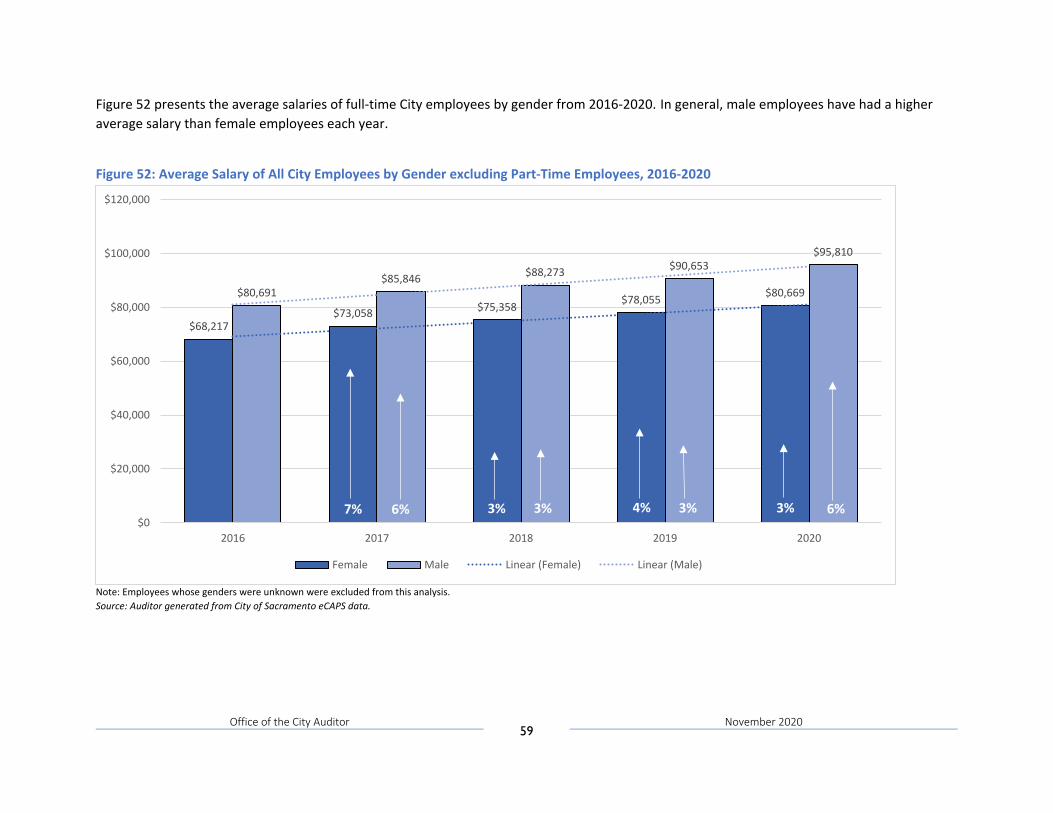
Figure 52 presents the average salaries of full-time City employees by gender from 2016-2020. In general, male employees have had a higher average salary than female employees each year.
Figure 52: Average Salary of All City Employees by Gender excluding Part-Time Employees, 2016-2020
Note: Employees whose genders were unknown were excluded from this analysis. Source: Auditor generated from City of Sacramento eCAPS data.
$68,217$73,058 $75,358 $78,055 $80,669$80,691
$85,846 $88,273 $90,653$95,810
$0
$20,000
$40,000
$60,000
$80,000
$100,000
$120,000
2016 2017 2018 2019 2020
Female Male Linear (Female) Linear (Male)
7% 6% 3% 3% 4% 3% 3% 6%
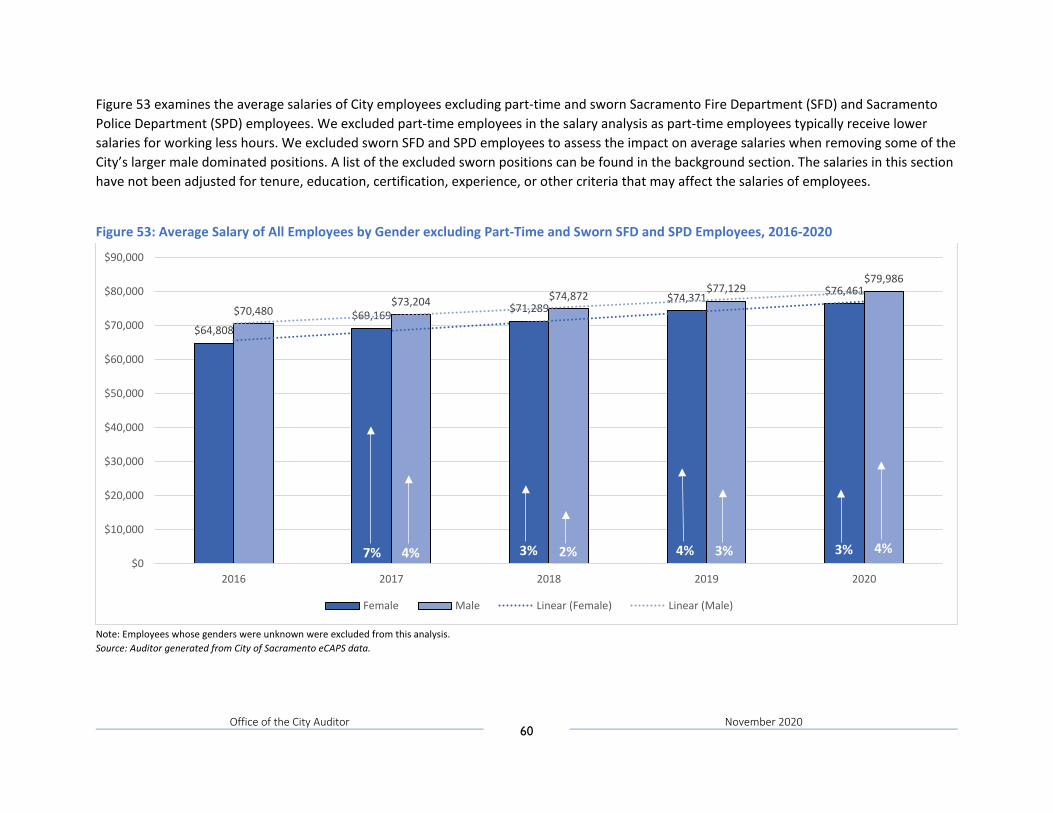
Office of the City Auditor 60
November 2020
Figure 53 examines the average salaries of City employees excluding part-time and sworn Sacramento Fire Department (SFD) and Sacramento Police Department (SPD) employees. We excluded part-time employees in the salary analysis as part-time employees typically receive lower salaries for working less hours. We excluded sworn SFD and SPD employees to assess the impact on average salaries when removing some of the City’s larger male dominated positions. A list of the excluded sworn positions can be found in the background section. The salaries in this section have not been adjusted for tenure, education, certification, experience, or other criteria that may affect the salaries of employees.
Figure 53: Average Salary of All Employees by Gender excluding Part-Time and Sworn SFD and SPD Employees, 2016-2020
Note: Employees whose genders were unknown were excluded from this analysis. Source: Auditor generated from City of Sacramento eCAPS data.
$64,808$69,169 $71,289
$74,371 $76,461
$70,480$73,204 $74,872
$77,129$79,986
$0
$10,000
$20,000
$30,000
$40,000
$50,000
$60,000
$70,000
$80,000
$90,000
2016 2017 2018 2019 2020
Female Male Linear (Female) Linear (Male)
7% 4% 3% 3%2% 4% 3% 4%
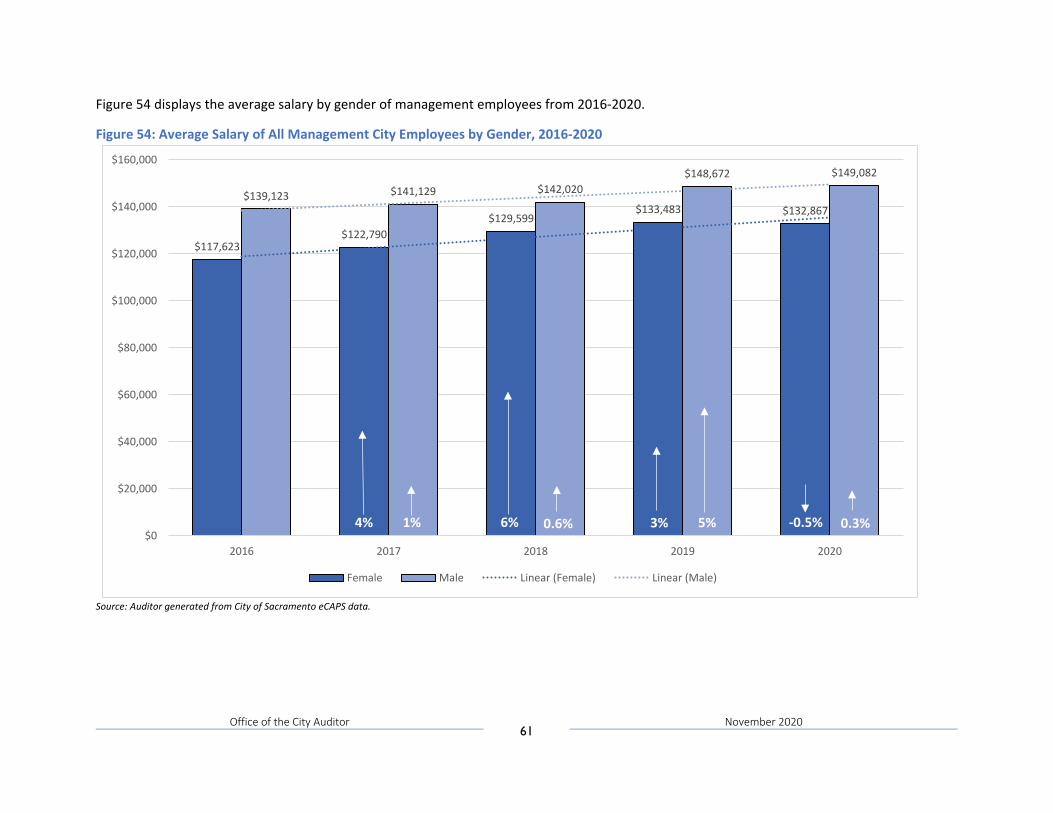
Office of the City Auditor 61
November 2020
Figure 54 displays the average salary by gender of management employees from 2016-2020.
Figure 54: Average Salary of All Management City Employees by Gender, 2016-2020
Source: Auditor generated from City of Sacramento eCAPS data.
$117,623$122,790
$129,599$133,483 $132,867
$139,123 $141,129 $142,020$148,672 $149,082
$0
$20,000
$40,000
$60,000
$80,000
$100,000
$120,000
$140,000
$160,000
2016 2017 2018 2019 2020
Female Male Linear (Female) Linear (Male)
4% 1% 6% 0.6% 3% 5% -0.5% 0.3%
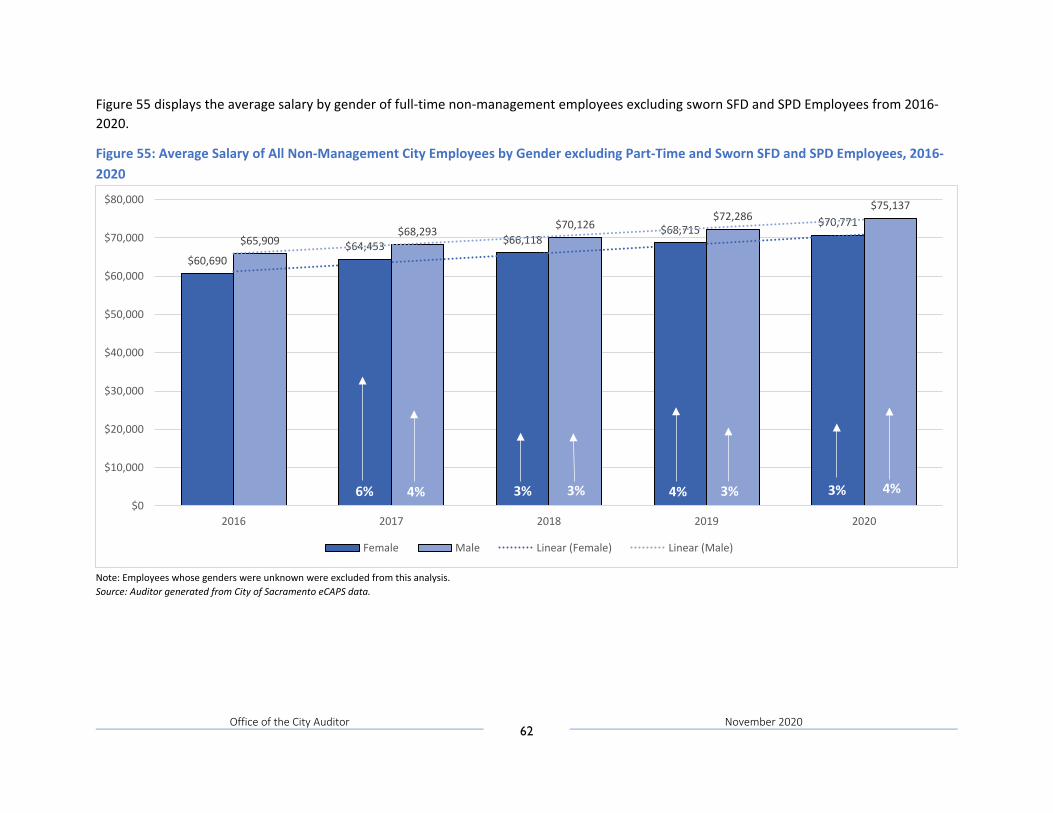
Office of the City Auditor 62
November 2020
Figure 55 displays the average salary by gender of full-time non-management employees excluding sworn SFD and SPD Employees from 2016-2020.
Figure 55: Average Salary of All Non-Management City Employees by Gender excluding Part-Time and Sworn SFD and SPD Employees, 2016-2020
Note: Employees whose genders were unknown were excluded from this analysis. Source: Auditor generated from City of Sacramento eCAPS data.
$60,690$64,453 $66,118
$68,715$70,771
$65,909$68,293 $70,126
$72,286$75,137
$0
$10,000
$20,000
$30,000
$40,000
$50,000
$60,000
$70,000
$80,000
2016 2017 2018 2019 2020
Female Male Linear (Female) Linear (Male)
6% 4% 3% 3% 4% 3% 3% 4%
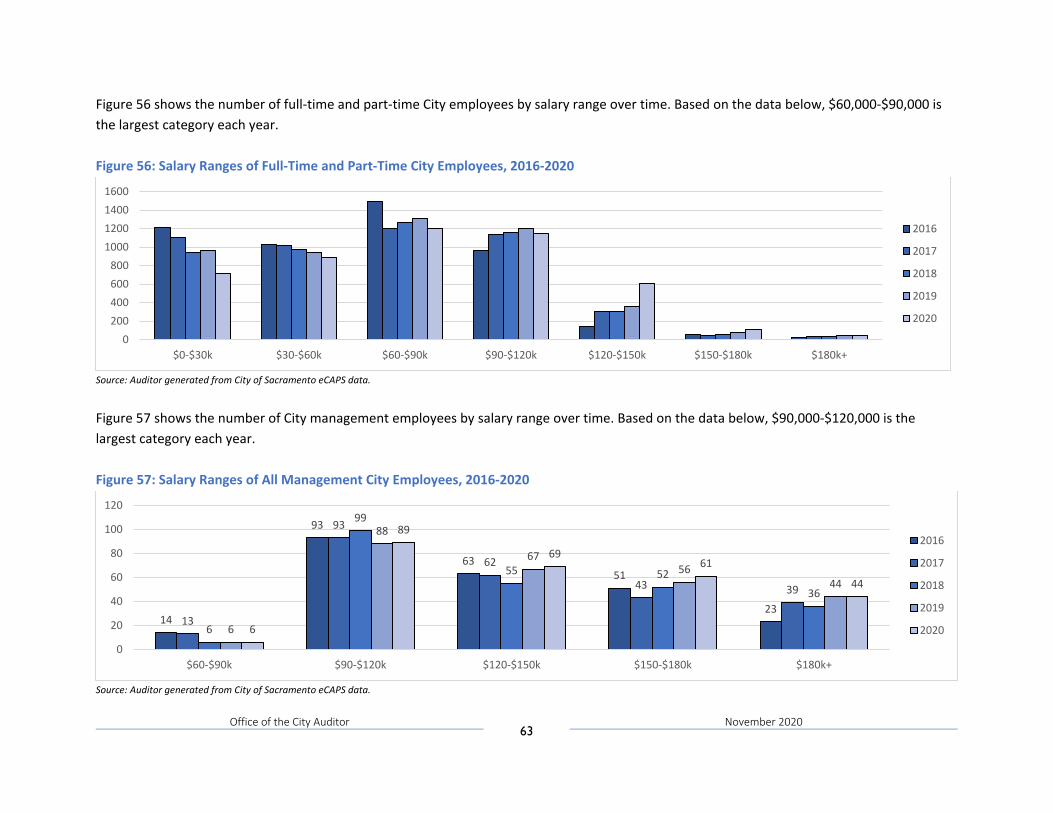
Office of the City Auditor 63
November 2020
Figure 56 shows the number of full-time and part-time City employees by salary range over time. Based on the data below, $60,000-$90,000 is the largest category each year. Figure 56: Salary Ranges of Full-Time and Part-Time City Employees, 2016-2020
Source: Auditor generated from City of Sacramento eCAPS data. Figure 57 shows the number of City management employees by salary range over time. Based on the data below, $90,000-$120,000 is the largest category each year. Figure 57: Salary Ranges of All Management City Employees, 2016-2020
Source: Auditor generated from City of Sacramento eCAPS data.
0200400600800
1000120014001600
$0-$30k $30-$60k $60-$90k $90-$120k $120-$150k $150-$180k $180k+
2016
2017
2018
2019
2020
14
93
6351
2313
93
62
43 39
6
99
55 52
36
6
88
6756
44
6
89
6961
44
0
20
40
60
80
100
120
$60-$90k $90-$120k $120-$150k $150-$180k $180k+
2016
2017
2018
2019
2020
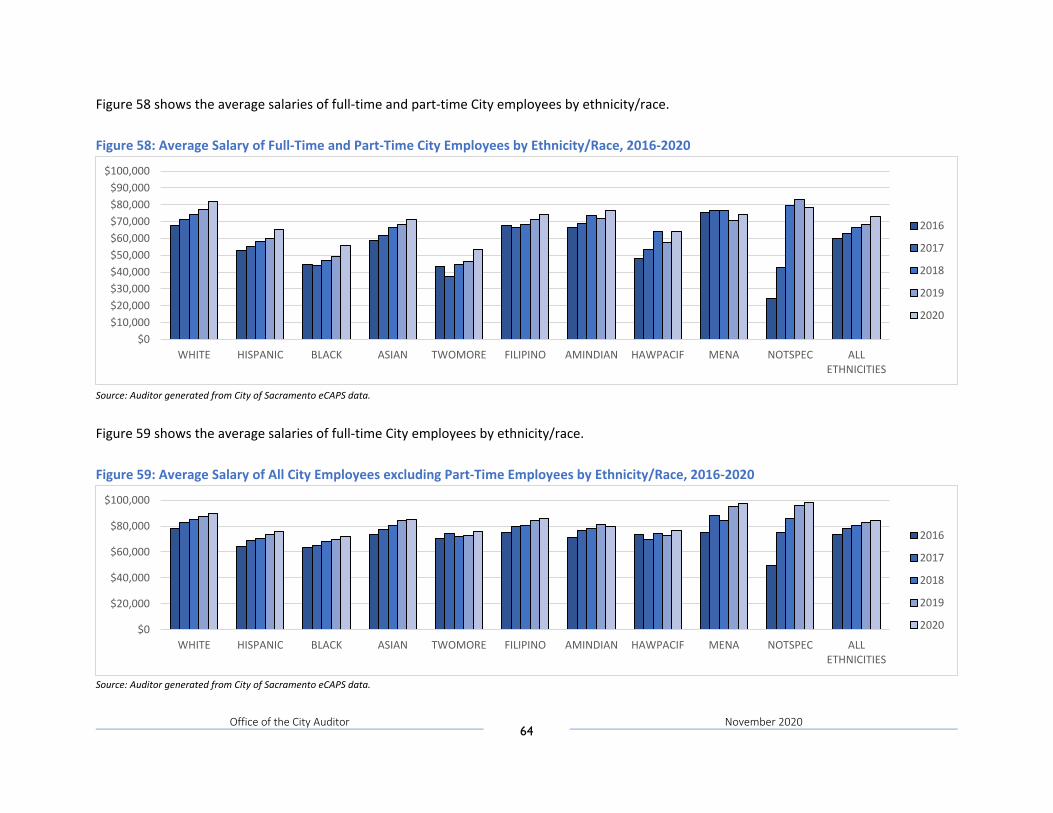
Office of the City Auditor 64
November 2020
Figure 58 shows the average salaries of full-time and part-time City employees by ethnicity/race. Figure 58: Average Salary of Full-Time and Part-Time City Employees by Ethnicity/Race, 2016-2020
Source: Auditor generated from City of Sacramento eCAPS data. Figure 59 shows the average salaries of full-time City employees by ethnicity/race. Figure 59: Average Salary of All City Employees excluding Part-Time Employees by Ethnicity/Race, 2016-2020
Source: Auditor generated from City of Sacramento eCAPS data.
$0$10,000$20,000$30,000$40,000$50,000$60,000$70,000$80,000$90,000
$100,000
WHITE HISPANIC BLACK ASIAN TWOMORE FILIPINO AMINDIAN HAWPACIF MENA NOTSPEC ALLETHNICITIES
2016
2017
2018
2019
2020
$0
$20,000
$40,000
$60,000
$80,000
$100,000
WHITE HISPANIC BLACK ASIAN TWOMORE FILIPINO AMINDIAN HAWPACIF MENA NOTSPEC ALLETHNICITIES
2016
2017
2018
2019
2020
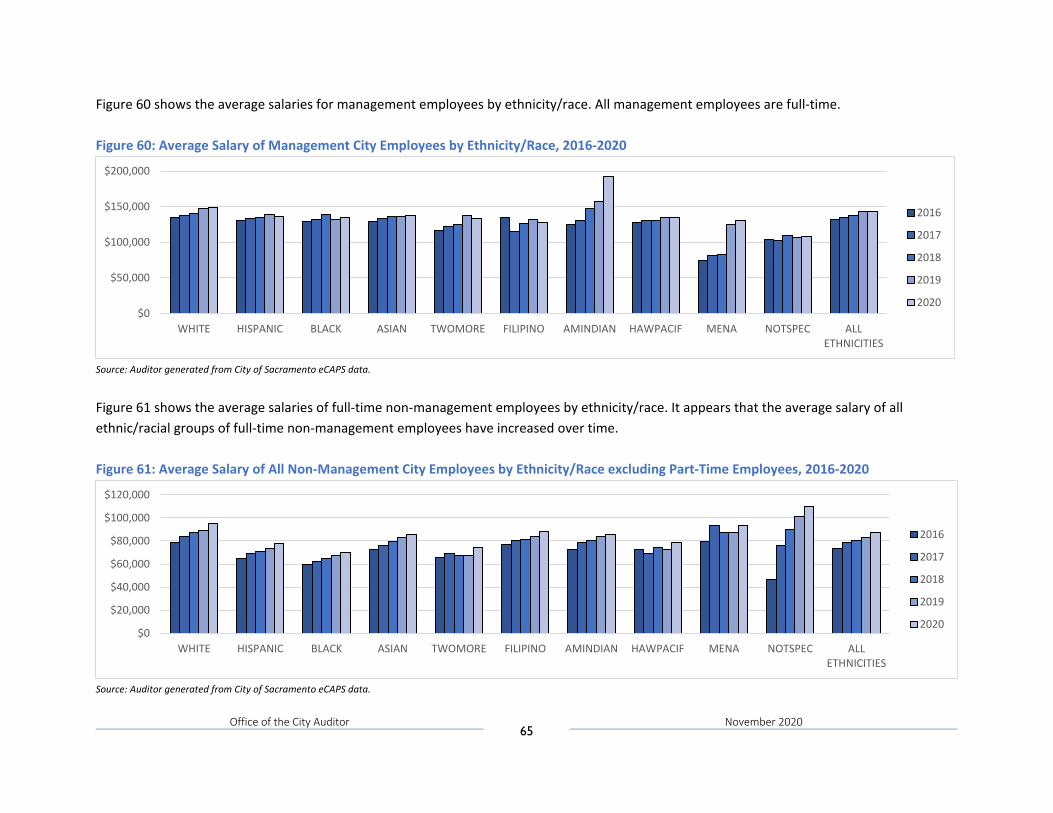
Office of the City Auditor 65
November 2020
Figure 60 shows the average salaries for management employees by ethnicity/race. All management employees are full-time. Figure 60: Average Salary of Management City Employees by Ethnicity/Race, 2016-2020
Source: Auditor generated from City of Sacramento eCAPS data. Figure 61 shows the average salaries of full-time non-management employees by ethnicity/race. It appears that the average salary of all ethnic/racial groups of full-time non-management employees have increased over time. Figure 61: Average Salary of All Non-Management City Employees by Ethnicity/Race excluding Part-Time Employees, 2016-2020
Source: Auditor generated from City of Sacramento eCAPS data.
$0
$50,000
$100,000
$150,000
$200,000
WHITE HISPANIC BLACK ASIAN TWOMORE FILIPINO AMINDIAN HAWPACIF MENA NOTSPEC ALLETHNICITIES
2016
2017
2018
2019
2020
$0
$20,000
$40,000
$60,000
$80,000
$100,000
$120,000
WHITE HISPANIC BLACK ASIAN TWOMORE FILIPINO AMINDIAN HAWPACIF MENA NOTSPEC ALLETHNICITIES
2016
2017
2018
2019
2020
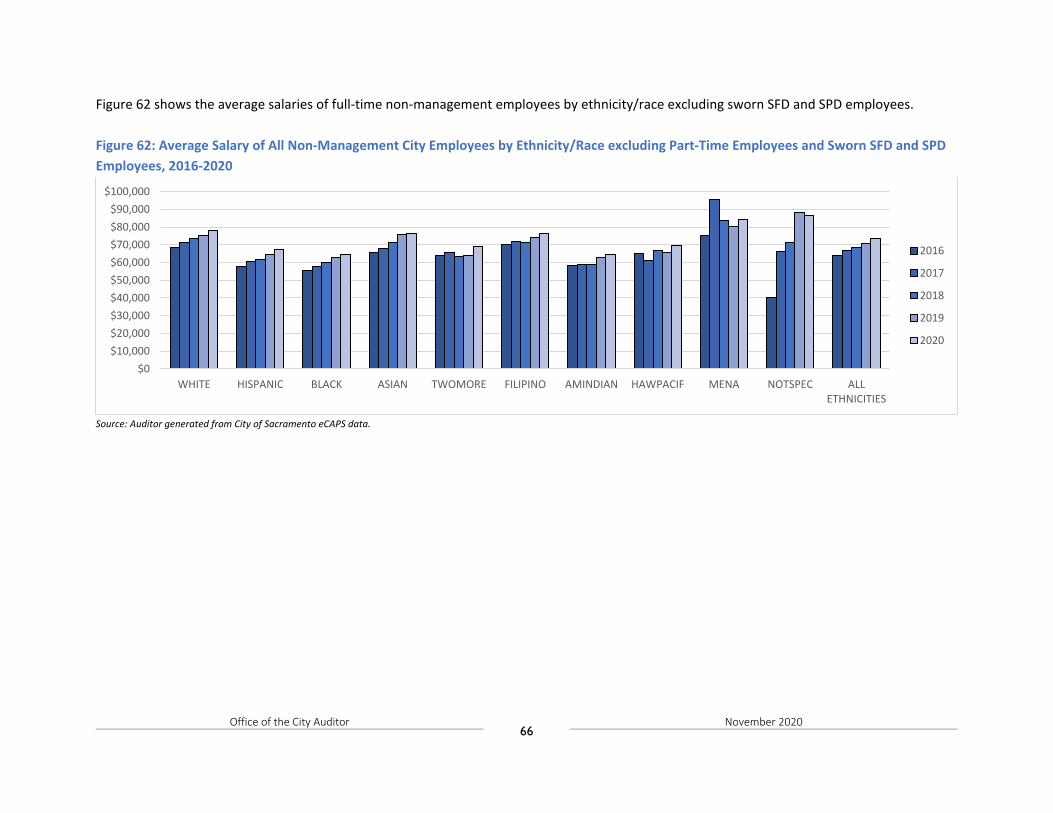
Office of the City Auditor 66
November 2020
Figure 62 shows the average salaries of full-time non-management employees by ethnicity/race excluding sworn SFD and SPD employees. Figure 62: Average Salary of All Non-Management City Employees by Ethnicity/Race excluding Part-Time Employees and Sworn SFD and SPD Employees, 2016-2020
Source: Auditor generated from City of Sacramento eCAPS data.
$0$10,000$20,000$30,000$40,000$50,000$60,000$70,000$80,000$90,000
$100,000
WHITE HISPANIC BLACK ASIAN TWOMORE FILIPINO AMINDIAN HAWPACIF MENA NOTSPEC ALLETHNICITIES
2016
2017
2018
2019
2020
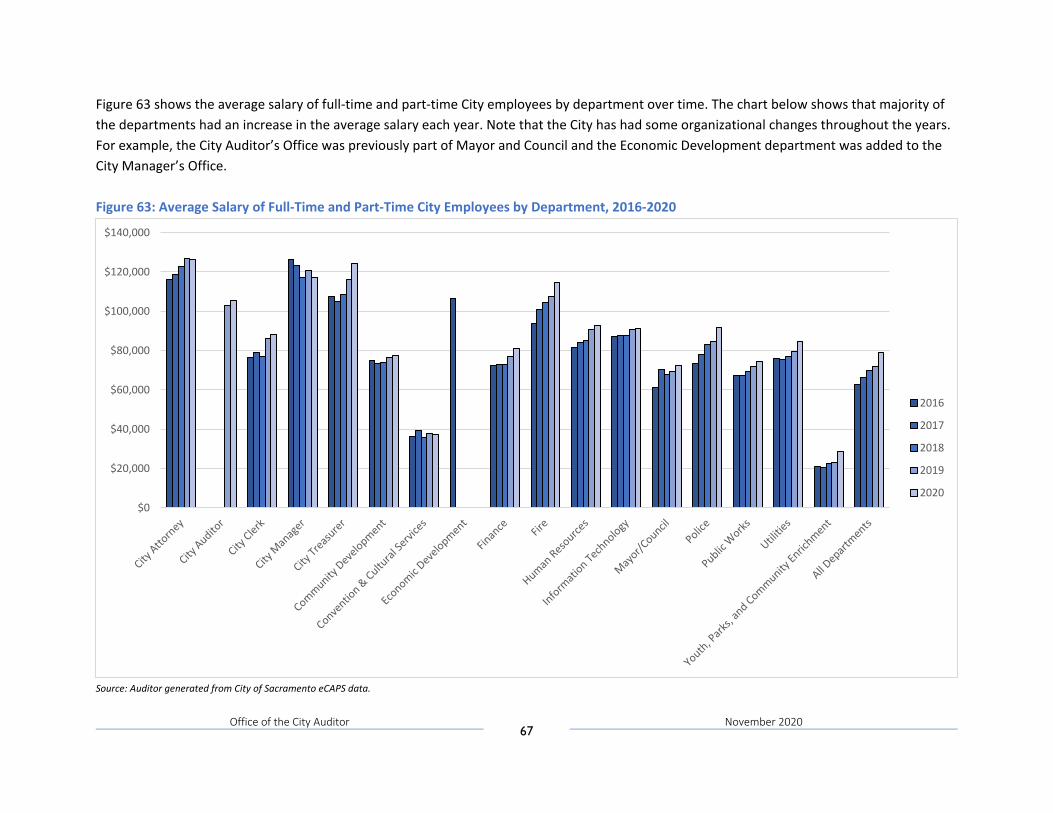
Office of the City Auditor 67
November 2020
Figure 63 shows the average salary of full-time and part-time City employees by department over time. The chart below shows that majority of the departments had an increase in the average salary each year. Note that the City has had some organizational changes throughout the years. For example, the City Auditor’s Office was previously part of Mayor and Council and the Economic Development department was added to the City Manager’s Office. Figure 63: Average Salary of Full-Time and Part-Time City Employees by Department, 2016-2020
Source: Auditor generated from City of Sacramento eCAPS data.
$0
$20,000
$40,000
$60,000
$80,000
$100,000
$120,000
$140,000
2016
2017
2018
2019
2020
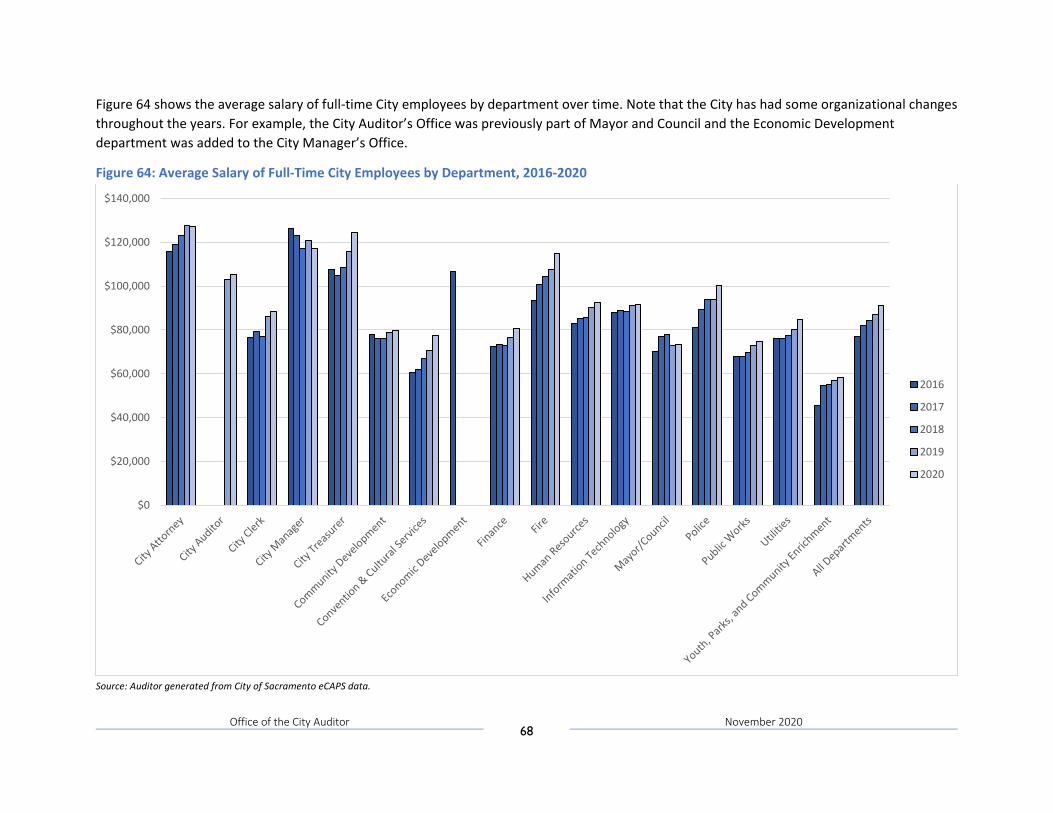
Office of the City Auditor 68
November 2020
Figure 64 shows the average salary of full-time City employees by department over time. Note that the City has had some organizational changes throughout the years. For example, the City Auditor’s Office was previously part of Mayor and Council and the Economic Development department was added to the City Manager’s Office.
Figure 64: Average Salary of Full-Time City Employees by Department, 2016-2020
Source: Auditor generated from City of Sacramento eCAPS data.
$0
$20,000
$40,000
$60,000
$80,000
$100,000
$120,000
$140,000
2016
2017
2018
2019
2020
Office of the City Auditor 69
November 2020
Relative Earnings of Male and Female City Employees The following section examines the average salary of City Employees. According to Salary.com, “you can calculate the average base, mean salary, or average salary by adding all the salaries for a select group of employees and then dividing the sum by the number of employees in the group.“ 14 Additionally, they explain, “the average salary represents what the “typical employee” earns and can be pulled higher or lower by high salaries or low salaries at the extreme ends of the distribution.” 15
In this section we review the average salaries of various City employees to compare the salaries of male and female employees in various demographic groups. We found the following earning differences between genders and ethnicities/races.
• Average earnings for full-time female City employees are approximately 78 percent of those of full-time White male employees. • When examining full-time male average salaries, the top earning male demographic groups are Middle Eastern or North African with
an average salary of $106,672 16 and the lowest earning is Black male employees $77,121. • When examining full-time female average salaries, the top earning female demographic group is Middle Eastern or North African
with an average salary of $97,89017 and the lowest earning is Black female employees at $69,897. In the following charts, we performed an analysis which compares the average salaries of employees by ethnic/racial groups and gender. To determine the ratio of earnings, we compared all the demographic groups to the largest demographic group at the City which is White male employees. Employees whose gender or ethnicity/race were unknown were excluded from these analyses.
14 Salary.com is a resource for compensation data and education. 15 Defining the Difference Between Average and Median Salary. Salary.com, 2019, https://www.salary.com/blog/defining-the-difference-between-average-and-median-salary/ 16 There were seven Middle Eastern or North African male employees. 17 There were four Middle Eastern or North African female employees.
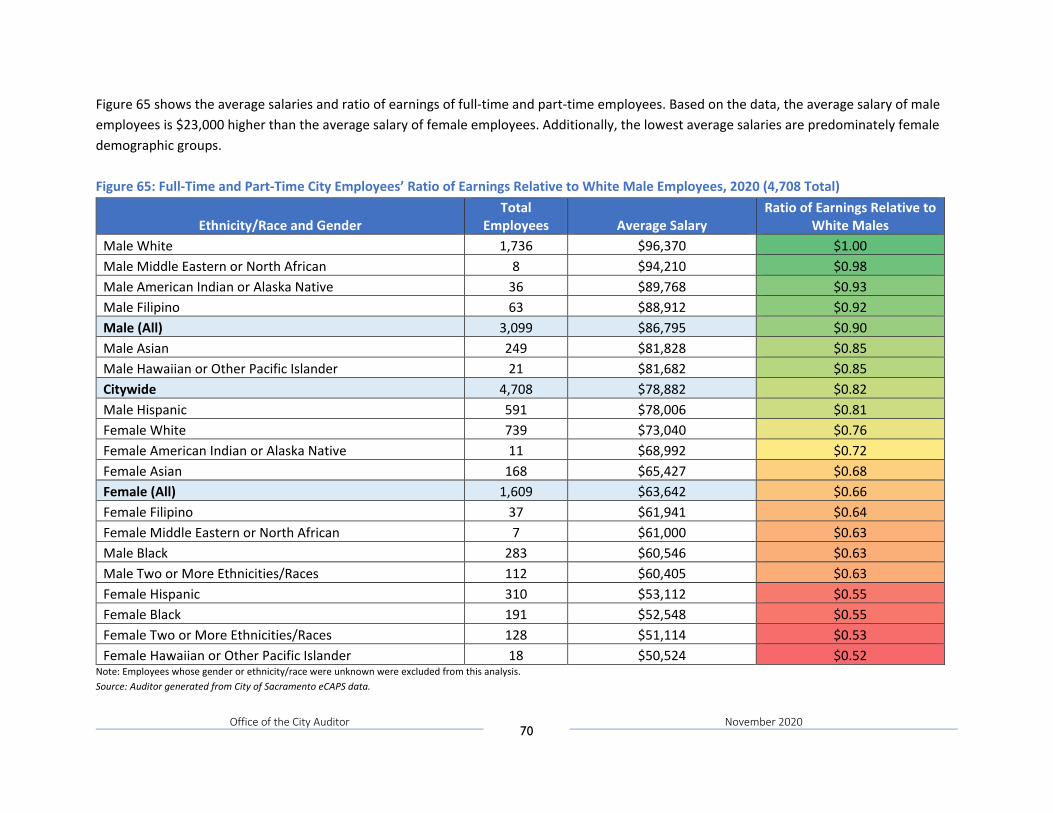
Office of the City Auditor 70
November 2020
Figure 65 shows the average salaries and ratio of earnings of full-time and part-time employees. Based on the data, the average salary of male employees is $23,000 higher than the average salary of female employees. Additionally, the lowest average salaries are predominately female demographic groups. Figure 65: Full-Time and Part-Time City Employees’ Ratio of Earnings Relative to White Male Employees, 2020 (4,708 Total)
Ethnicity/Race and Gender Total
Employees Average Salary Ratio of Earnings Relative to
White Males Male White 1,736 $96,370 $1.00 Male Middle Eastern or North African 8 $94,210 $0.98 Male American Indian or Alaska Native 36 $89,768 $0.93 Male Filipino 63 $88,912 $0.92 Male (All) 3,099 $86,795 $0.90 Male Asian 249 $81,828 $0.85 Male Hawaiian or Other Pacific Islander 21 $81,682 $0.85 Citywide 4,708 $78,882 $0.82 Male Hispanic 591 $78,006 $0.81 Female White 739 $73,040 $0.76 Female American Indian or Alaska Native 11 $68,992 $0.72 Female Asian 168 $65,427 $0.68 Female (All) 1,609 $63,642 $0.66 Female Filipino 37 $61,941 $0.64 Female Middle Eastern or North African 7 $61,000 $0.63 Male Black 283 $60,546 $0.63 Male Two or More Ethnicities/Races 112 $60,405 $0.63 Female Hispanic 310 $53,112 $0.55 Female Black 191 $52,548 $0.55 Female Two or More Ethnicities/Races 128 $51,114 $0.53 Female Hawaiian or Other Pacific Islander 18 $50,524 $0.52
Note: Employees whose gender or ethnicity/race were unknown were excluded from this analysis. Source: Auditor generated from City of Sacramento eCAPS data.
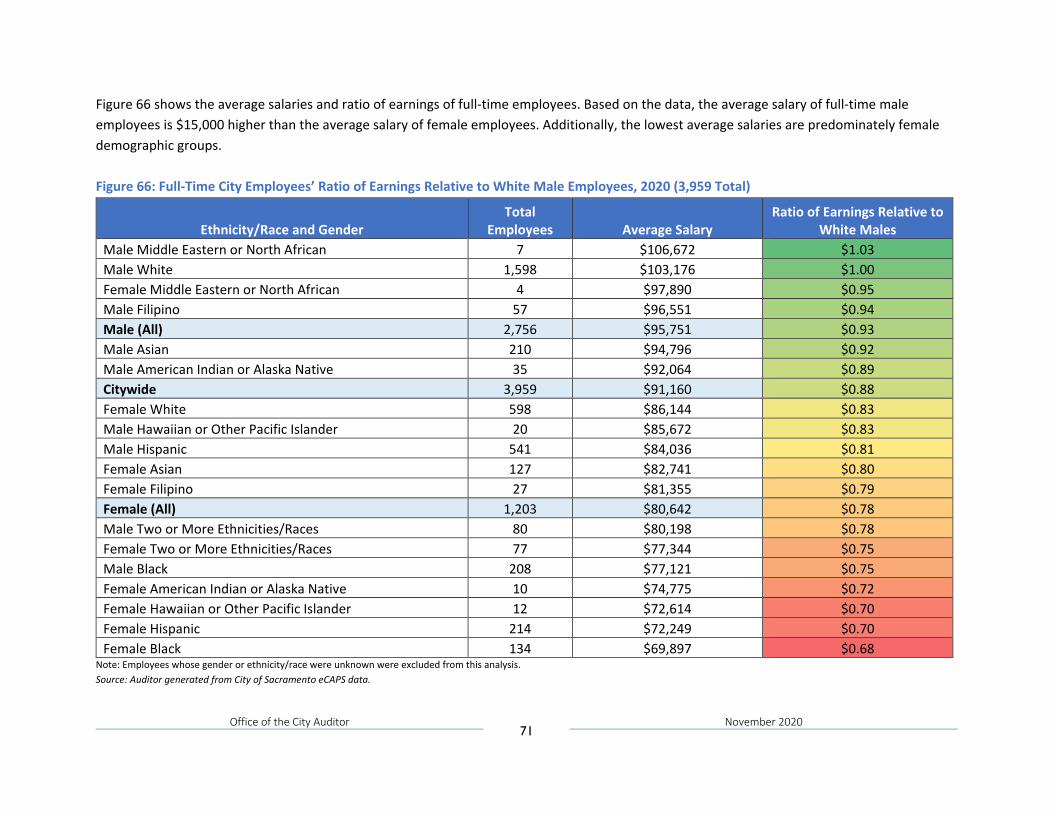
Office of the City Auditor 71
November 2020
Figure 66 shows the average salaries and ratio of earnings of full-time employees. Based on the data, the average salary of full-time male employees is $15,000 higher than the average salary of female employees. Additionally, the lowest average salaries are predominately female demographic groups. Figure 66: Full-Time City Employees’ Ratio of Earnings Relative to White Male Employees, 2020 (3,959 Total)
Ethnicity/Race and Gender Total
Employees Average Salary Ratio of Earnings Relative to
White Males Male Middle Eastern or North African 7 $106,672 $1.03 Male White 1,598 $103,176 $1.00 Female Middle Eastern or North African 4 $97,890 $0.95 Male Filipino 57 $96,551 $0.94 Male (All) 2,756 $95,751 $0.93 Male Asian 210 $94,796 $0.92 Male American Indian or Alaska Native 35 $92,064 $0.89 Citywide 3,959 $91,160 $0.88 Female White 598 $86,144 $0.83 Male Hawaiian or Other Pacific Islander 20 $85,672 $0.83 Male Hispanic 541 $84,036 $0.81 Female Asian 127 $82,741 $0.80 Female Filipino 27 $81,355 $0.79 Female (All) 1,203 $80,642 $0.78 Male Two or More Ethnicities/Races 80 $80,198 $0.78 Female Two or More Ethnicities/Races 77 $77,344 $0.75 Male Black 208 $77,121 $0.75 Female American Indian or Alaska Native 10 $74,775 $0.72 Female Hawaiian or Other Pacific Islander 12 $72,614 $0.70 Female Hispanic 214 $72,249 $0.70 Female Black 134 $69,897 $0.68
Note: Employees whose gender or ethnicity/race were unknown were excluded from this analysis. Source: Auditor generated from City of Sacramento eCAPS data.
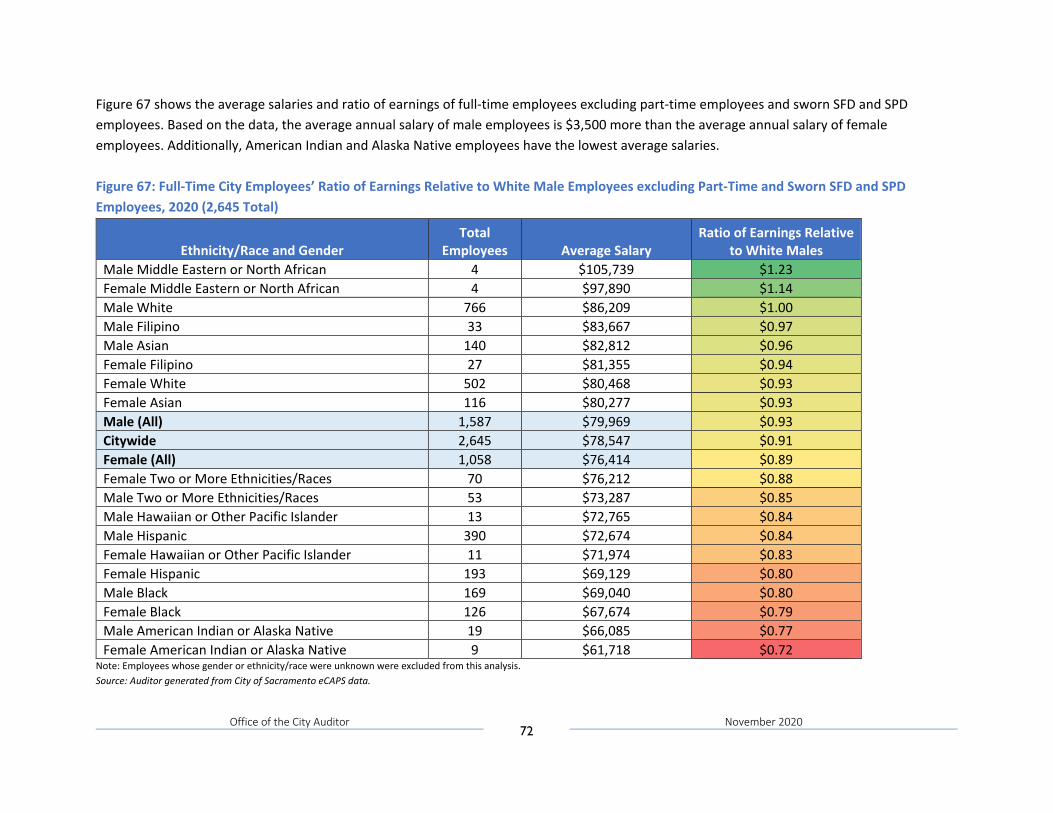
Office of the City Auditor 72
November 2020
Figure 67 shows the average salaries and ratio of earnings of full-time employees excluding part-time employees and sworn SFD and SPD employees. Based on the data, the average annual salary of male employees is $3,500 more than the average annual salary of female employees. Additionally, American Indian and Alaska Native employees have the lowest average salaries. Figure 67: Full-Time City Employees’ Ratio of Earnings Relative to White Male Employees excluding Part-Time and Sworn SFD and SPD Employees, 2020 (2,645 Total)
Ethnicity/Race and Gender Total
Employees Average Salary Ratio of Earnings Relative
to White Males Male Middle Eastern or North African 4 $105,739 $1.23 Female Middle Eastern or North African 4 $97,890 $1.14 Male White 766 $86,209 $1.00 Male Filipino 33 $83,667 $0.97 Male Asian 140 $82,812 $0.96 Female Filipino 27 $81,355 $0.94 Female White 502 $80,468 $0.93 Female Asian 116 $80,277 $0.93 Male (All) 1,587 $79,969 $0.93 Citywide 2,645 $78,547 $0.91 Female (All) 1,058 $76,414 $0.89 Female Two or More Ethnicities/Races 70 $76,212 $0.88 Male Two or More Ethnicities/Races 53 $73,287 $0.85 Male Hawaiian or Other Pacific Islander 13 $72,765 $0.84 Male Hispanic 390 $72,674 $0.84 Female Hawaiian or Other Pacific Islander 11 $71,974 $0.83 Female Hispanic 193 $69,129 $0.80 Male Black 169 $69,040 $0.80 Female Black 126 $67,674 $0.79 Male American Indian or Alaska Native 19 $66,085 $0.77 Female American Indian or Alaska Native 9 $61,718 $0.72
Note: Employees whose gender or ethnicity/race were unknown were excluded from this analysis. Source: Auditor generated from City of Sacramento eCAPS data.
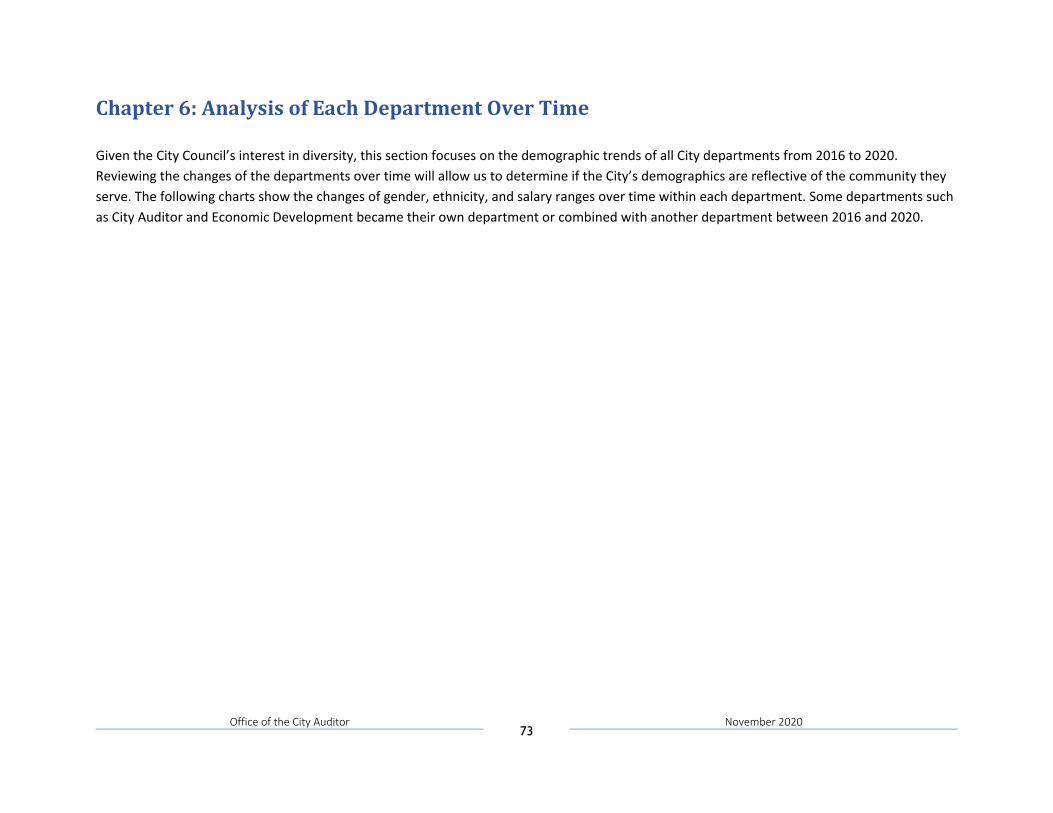
Office of the City Auditor 73
November 2020
Chapter 6: Analysis of Each Department Over Time Given the City Council’s interest in diversity, this section focuses on the demographic trends of all City departments from 2016 to 2020. Reviewing the changes of the departments over time will allow us to determine if the City’s demographics are reflective of the community they serve. The following charts show the changes of gender, ethnicity, and salary ranges over time within each department. Some departments such as City Auditor and Economic Development became their own department or combined with another department between 2016 and 2020.
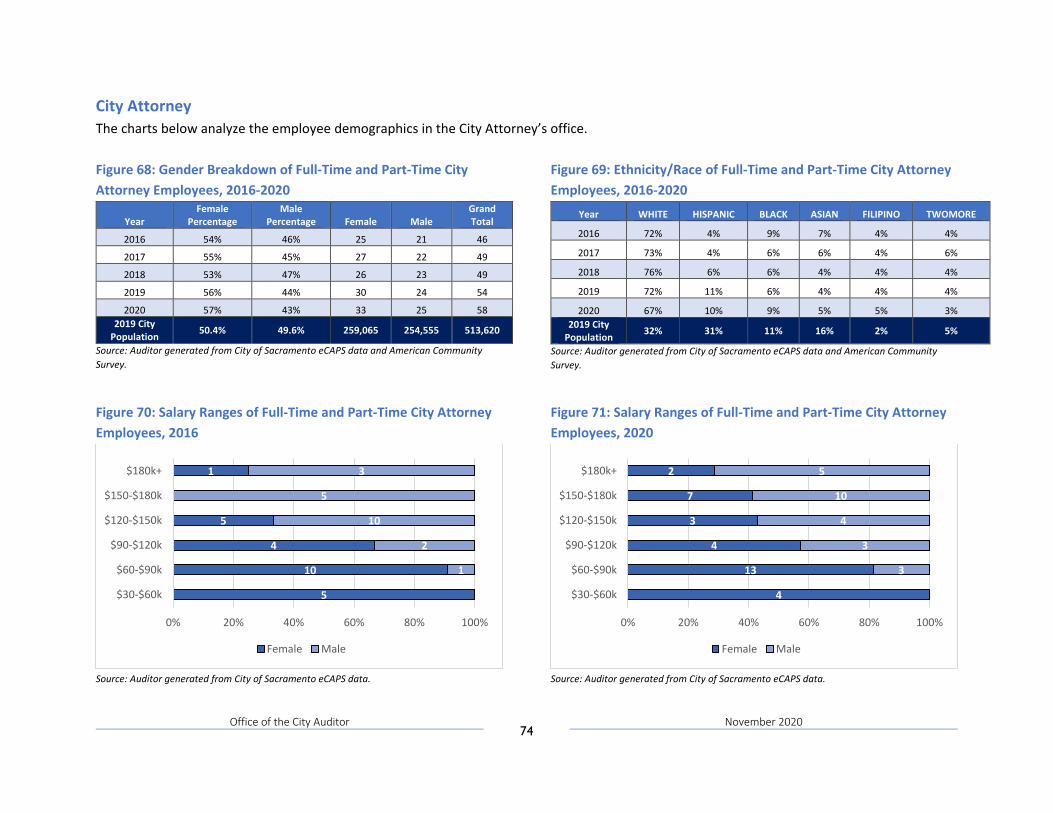
Office of the City Auditor 74
November 2020
City Attorney The charts below analyze the employee demographics in the City Attorney’s office.
Figure 68: Gender Breakdown of Full-Time and Part-Time City Attorney Employees, 2016-2020
Year Female
Percentage Male
Percentage Female Male Grand Total
2016 54% 46% 25 21 46
2017 55% 45% 27 22 49
2018 53% 47% 26 23 49
2019 56% 44% 30 24 54
2020 57% 43% 33 25 58 2019 City
Population 50.4% 49.6% 259,065 254,555 513,620
Source: Auditor generated from City of Sacramento eCAPS data and American Community Survey.
Figure 69: Ethnicity/Race of Full-Time and Part-Time City Attorney Employees, 2016-2020
Year WHITE HISPANIC BLACK ASIAN FILIPINO TWOMORE
2016 72% 4% 9% 7% 4% 4%
2017 73% 4% 6% 6% 4% 6%
2018 76% 6% 6% 4% 4% 4%
2019 72% 11% 6% 4% 4% 4%
2020 67% 10% 9% 5% 5% 3% 2019 City
Population 32% 31% 11% 16% 2% 5%
Source: Auditor generated from City of Sacramento eCAPS data and American Community Survey.
Figure 70: Salary Ranges of Full-Time and Part-Time City Attorney Employees, 2016
Source: Auditor generated from City of Sacramento eCAPS data.
Figure 71: Salary Ranges of Full-Time and Part-Time City Attorney Employees, 2020
Source: Auditor generated from City of Sacramento eCAPS data.
5
10
4
5
1
1
2
10
5
3
0% 20% 40% 60% 80% 100%
$30-$60k
$60-$90k
$90-$120k
$120-$150k
$150-$180k
$180k+
Female Male
4
13
4
3
7
2
3
3
4
10
5
0% 20% 40% 60% 80% 100%
$30-$60k
$60-$90k
$90-$120k
$120-$150k
$150-$180k
$180k+
Female Male
Office of the City Auditor 75
November 2020
City Auditor The charts below analyze the employee demographics in the City Auditor’s office. According to the FY2019/20 Approved Budget, “with the passing of the Sacramento City Government Accountability and Efficiency Act (Measure K) in November 2018, the City Auditor was established as a charter office and the duties of the City Auditor and the Independent Budget Analyst were combined.” The City Auditor was previously a part of Mayor and Council in 2016, 2017, and 2018. All employees are full-time. Figure 72: Gender Breakdown of Full-Time City Auditor Employees, 2016-2020
Year Female
Percentage Male
Percentage Female Male Grand Total
2019 86% 14% 6 1 7 2020 63% 38% 5 3 8
2019 City Population 50.4% 49.6% 259,065 254,555 513,620
Source: Auditor generated from City of Sacramento eCAPS data and American Community Survey.
Figure 73: Ethnicity/Race of Full-Time City Auditor Employees, 2016-2020
Year WHITE HISPANIC BLACK ASIAN MENA 2019 14% 29% 14% 29% 14% 2020 25% 38% 13% 13% 13%
2019 City Population 32% 31% 11% 16% N/A
Source: Auditor generated from City of Sacramento eCAPS data and American Community Survey.
Figure 74: Salary Ranges of Full-Time City Auditor Employees, 2020
Source: Auditor generated from City of Sacramento eCAPS data.
3
2 2
1
0% 20% 40% 60% 80% 100%
$60-$90k
$90-$120k
$180k+
Female Male

Office of the City Auditor 76
November 2020
City Clerk The charts below analyze the employee demographics in the City Clerk’s office. All employees are full-time. Figure 75: Gender Breakdown of Full-Time City Clerk Employees, 2016-2020
Year Female
Percentage Male
Percentage Female Male Grand Total
2016 94% 6% 15 1 16 2017 100% 0% 16 0 16 2018 94% 6% 17 1 18 2019 94% 6% 16 1 17 2020 100% 0% 15 0 15
2019 City Population 50.4% 49.6% 259,065 254,555 513,620
Source: Auditor generated from City of Sacramento eCAPS data and American Community Survey.
Figure 76: Ethnicity/Race of Full-Time City Clerk Employees, 2016-2020
Year WHITE HISPANIC BLACK TWOMORE FILIPINO HAWPACIF 2016 63% 13% 13% 0% 6% 6% 2017 69% 6% 19% 0% 0% 6% 2018 72% 11% 11% 0% 0% 6% 2019 65% 18% 6% 6% 0% 6% 2020 73% 13% 7% 0% 0% 7%
2019 City Population 32% 31% 11% 5% 2% 2%
Source: Auditor generated from City of Sacramento eCAPS data and American Community Survey.
Figure 77: Salary Ranges of Full-Time City Clerk Employees, 2016
Source: Auditor generated from City of Sacramento eCAPS data.
Figure 78: Salary Ranges of Full-Time City Clerk Employees, 2020
Source: Auditor generated from City of Sacramento eCAPS data.
7
4
3
1
1
80% 85% 90% 95% 100%
$30-$60k
$60-$90k
$90-$120k
$180k+
Female Male
3
8
1
2
1
0% 20% 40% 60% 80% 100%
$30-$60k
$60-$90k
$90-$120k
$120-$150k
$150-$180k
Female
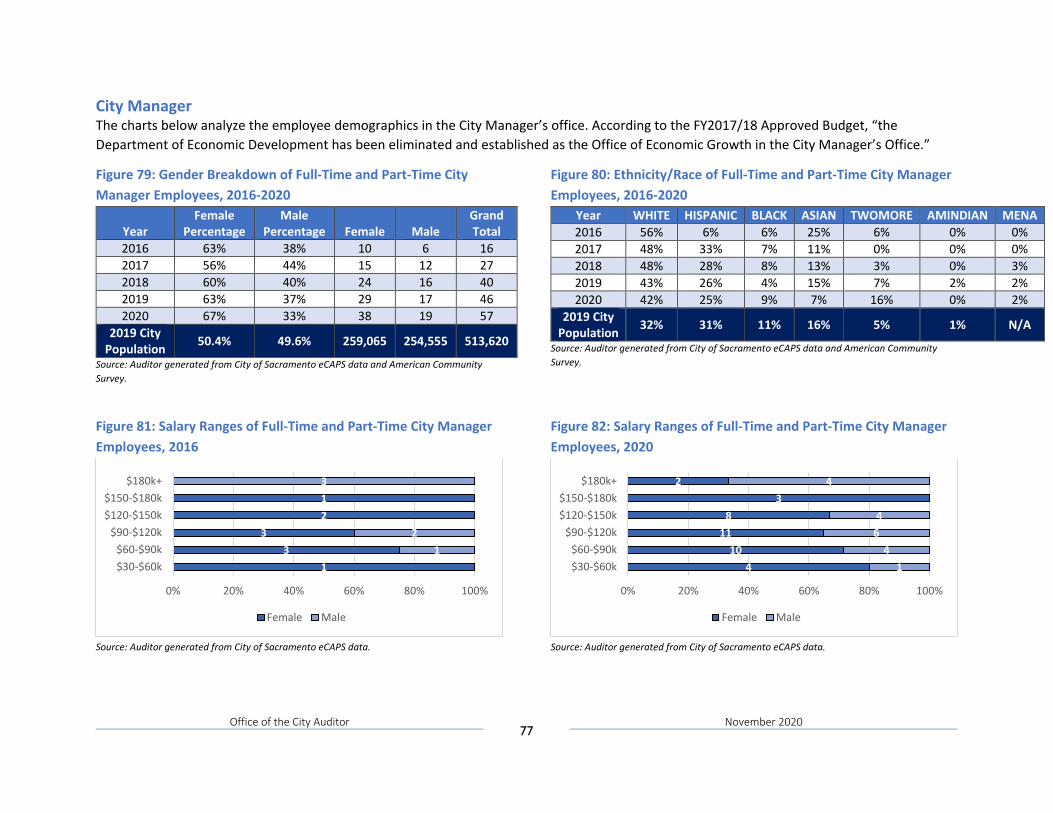
Office of the City Auditor 77
November 2020
City Manager The charts below analyze the employee demographics in the City Manager’s office. According to the FY2017/18 Approved Budget, “the Department of Economic Development has been eliminated and established as the Office of Economic Growth in the City Manager’s Office.”
Figure 79: Gender Breakdown of Full-Time and Part-Time City Manager Employees, 2016-2020
Year Female
Percentage Male
Percentage Female Male Grand Total
2016 63% 38% 10 6 16 2017 56% 44% 15 12 27 2018 60% 40% 24 16 40 2019 63% 37% 29 17 46 2020 67% 33% 38 19 57
2019 City Population 50.4% 49.6% 259,065 254,555 513,620
Source: Auditor generated from City of Sacramento eCAPS data and American Community Survey.
Figure 80: Ethnicity/Race of Full-Time and Part-Time City Manager Employees, 2016-2020
Year WHITE HISPANIC BLACK ASIAN TWOMORE AMINDIAN MENA 2016 56% 6% 6% 25% 6% 0% 0% 2017 48% 33% 7% 11% 0% 0% 0% 2018 48% 28% 8% 13% 3% 0% 3% 2019 43% 26% 4% 15% 7% 2% 2% 2020 42% 25% 9% 7% 16% 0% 2%
2019 City Population 32% 31% 11% 16% 5% 1% N/A
Source: Auditor generated from City of Sacramento eCAPS data and American Community Survey.
Figure 81: Salary Ranges of Full-Time and Part-Time City Manager Employees, 2016
Source: Auditor generated from City of Sacramento eCAPS data.
Figure 82: Salary Ranges of Full-Time and Part-Time City Manager Employees, 2020
Source: Auditor generated from City of Sacramento eCAPS data.
13
321
12
3
0% 20% 40% 60% 80% 100%
$30-$60k$60-$90k
$90-$120k$120-$150k$150-$180k
$180k+
Female Male
410
118
32
14
64
4
0% 20% 40% 60% 80% 100%
$30-$60k$60-$90k
$90-$120k$120-$150k$150-$180k
$180k+
Female Male
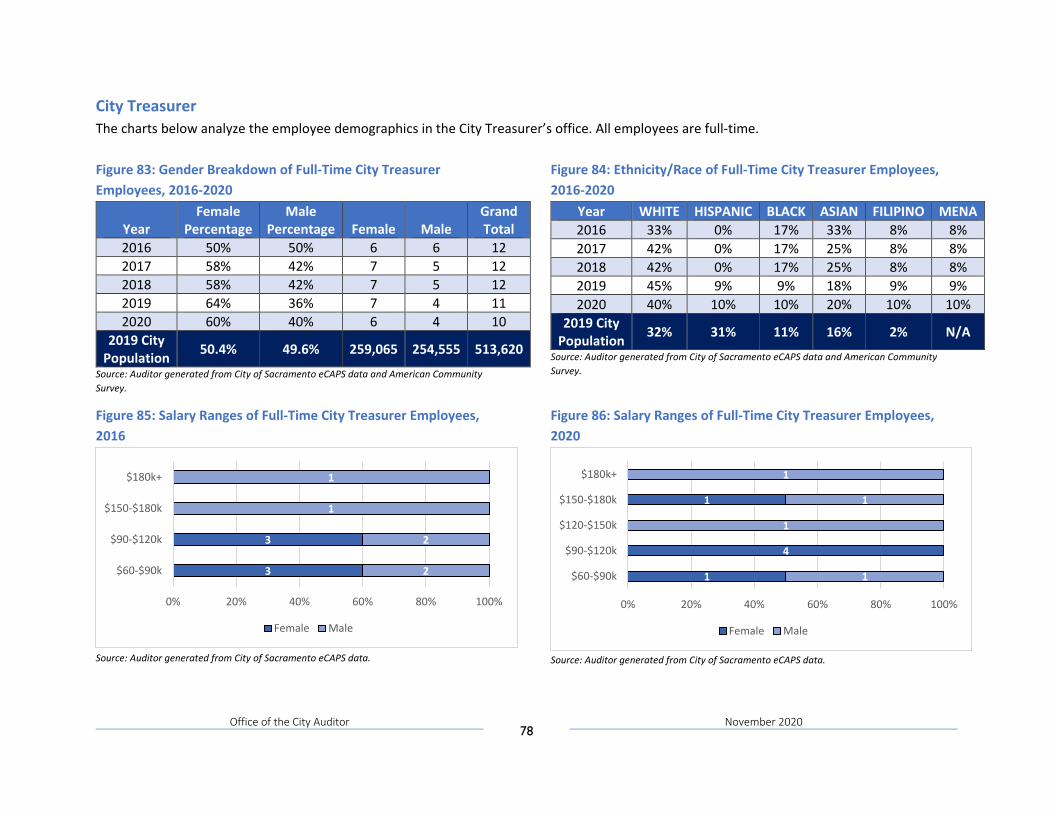
Office of the City Auditor 78
November 2020
City Treasurer The charts below analyze the employee demographics in the City Treasurer’s office. All employees are full-time. Figure 83: Gender Breakdown of Full-Time City Treasurer Employees, 2016-2020
Year Female
Percentage Male
Percentage Female Male Grand Total
2016 50% 50% 6 6 12 2017 58% 42% 7 5 12 2018 58% 42% 7 5 12 2019 64% 36% 7 4 11 2020 60% 40% 6 4 10
2019 City Population 50.4% 49.6% 259,065 254,555 513,620
Source: Auditor generated from City of Sacramento eCAPS data and American Community Survey.
Figure 84: Ethnicity/Race of Full-Time City Treasurer Employees, 2016-2020
Year WHITE HISPANIC BLACK ASIAN FILIPINO MENA 2016 33% 0% 17% 33% 8% 8% 2017 42% 0% 17% 25% 8% 8% 2018 42% 0% 17% 25% 8% 8% 2019 45% 9% 9% 18% 9% 9% 2020 40% 10% 10% 20% 10% 10%
2019 City Population 32% 31% 11% 16% 2% N/A
Source: Auditor generated from City of Sacramento eCAPS data and American Community Survey.
Figure 85: Salary Ranges of Full-Time City Treasurer Employees, 2016
Source: Auditor generated from City of Sacramento eCAPS data.
Figure 86: Salary Ranges of Full-Time City Treasurer Employees, 2020
Source: Auditor generated from City of Sacramento eCAPS data.
3
3
2
2
1
1
0% 20% 40% 60% 80% 100%
$60-$90k
$90-$120k
$150-$180k
$180k+
Female Male
1
4
1
1
1
1
1
0% 20% 40% 60% 80% 100%
$60-$90k
$90-$120k
$120-$150k
$150-$180k
$180k+
Female Male
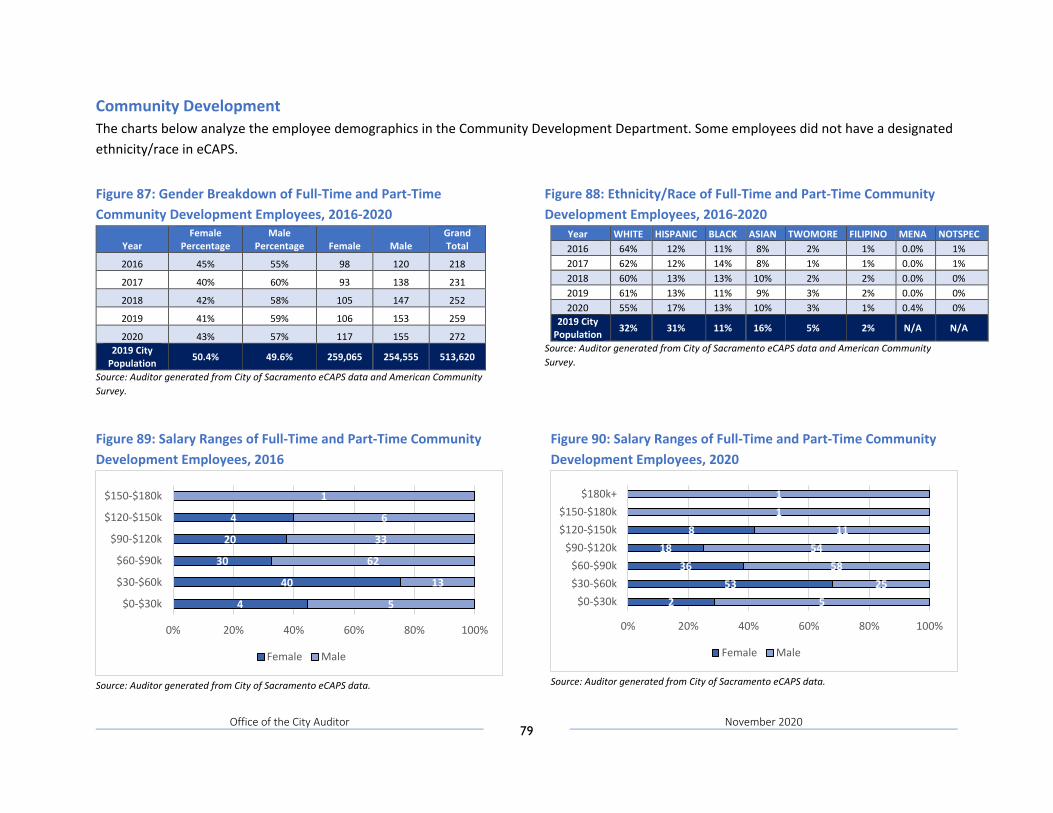
Office of the City Auditor 79
November 2020
Community Development The charts below analyze the employee demographics in the Community Development Department. Some employees did not have a designated ethnicity/race in eCAPS. Figure 87: Gender Breakdown of Full-Time and Part-Time Community Development Employees, 2016-2020
Year Female
Percentage Male
Percentage Female Male Grand Total
2016 45% 55% 98 120 218
2017 40% 60% 93 138 231
2018 42% 58% 105 147 252
2019 41% 59% 106 153 259
2020 43% 57% 117 155 272 2019 City
Population 50.4% 49.6% 259,065 254,555 513,620
Source: Auditor generated from City of Sacramento eCAPS data and American Community Survey.
Figure 88: Ethnicity/Race of Full-Time and Part-Time Community Development Employees, 2016-2020
Year WHITE HISPANIC BLACK ASIAN TWOMORE FILIPINO MENA NOTSPEC 2016 64% 12% 11% 8% 2% 1% 0.0% 1% 2017 62% 12% 14% 8% 1% 1% 0.0% 1% 2018 60% 13% 13% 10% 2% 2% 0.0% 0% 2019 61% 13% 11% 9% 3% 2% 0.0% 0% 2020 55% 17% 13% 10% 3% 1% 0.4% 0%
2019 City Population 32% 31% 11% 16% 5% 2% N/A N/A
Source: Auditor generated from City of Sacramento eCAPS data and American Community Survey.
Figure 89: Salary Ranges of Full-Time and Part-Time Community Development Employees, 2016
Source: Auditor generated from City of Sacramento eCAPS data.
Figure 90: Salary Ranges of Full-Time and Part-Time Community Development Employees, 2020
Source: Auditor generated from City of Sacramento eCAPS data.
4
40
30
20
4
5
13
62
33
6
1
0% 20% 40% 60% 80% 100%
$0-$30k
$30-$60k
$60-$90k
$90-$120k
$120-$150k
$150-$180k
Female Male
253
3618
8
525
5854
1111
0% 20% 40% 60% 80% 100%
$0-$30k$30-$60k$60-$90k
$90-$120k$120-$150k$150-$180k
$180k+
Female Male
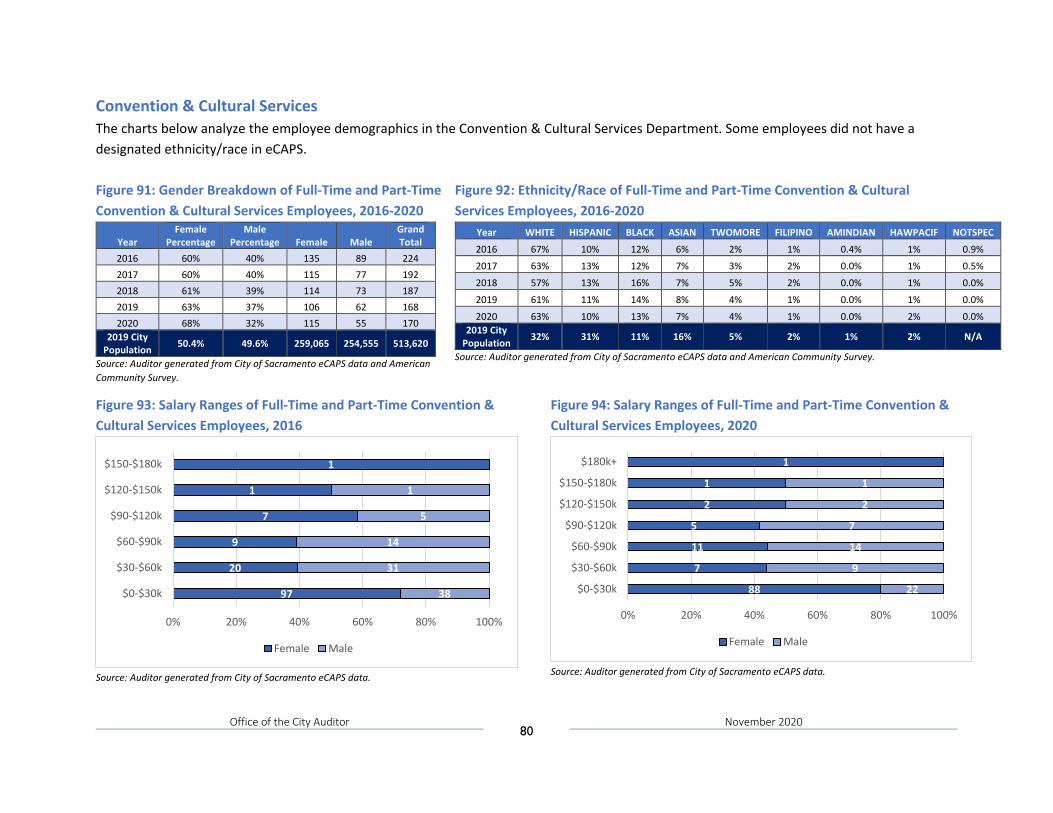
Office of the City Auditor 80
November 2020
Convention & Cultural Services The charts below analyze the employee demographics in the Convention & Cultural Services Department. Some employees did not have a designated ethnicity/race in eCAPS. Figure 91: Gender Breakdown of Full-Time and Part-Time Convention & Cultural Services Employees, 2016-2020
Year Female
Percentage Male
Percentage Female Male Grand Total
2016 60% 40% 135 89 224 2017 60% 40% 115 77 192 2018 61% 39% 114 73 187 2019 63% 37% 106 62 168 2020 68% 32% 115 55 170
2019 City Population 50.4% 49.6% 259,065 254,555 513,620
Source: Auditor generated from City of Sacramento eCAPS data and American Community Survey.
Figure 92: Ethnicity/Race of Full-Time and Part-Time Convention & Cultural Services Employees, 2016-2020
Year WHITE HISPANIC BLACK ASIAN TWOMORE FILIPINO AMINDIAN HAWPACIF NOTSPEC
2016 67% 10% 12% 6% 2% 1% 0.4% 1% 0.9% 2017 63% 13% 12% 7% 3% 2% 0.0% 1% 0.5%
2018 57% 13% 16% 7% 5% 2% 0.0% 1% 0.0%
2019 61% 11% 14% 8% 4% 1% 0.0% 1% 0.0%
2020 63% 10% 13% 7% 4% 1% 0.0% 2% 0.0% 2019 City
Population 32% 31% 11% 16% 5% 2% 1% 2% N/A
Source: Auditor generated from City of Sacramento eCAPS data and American Community Survey.
Figure 93: Salary Ranges of Full-Time and Part-Time Convention & Cultural Services Employees, 2016
Source: Auditor generated from City of Sacramento eCAPS data.
Figure 94: Salary Ranges of Full-Time and Part-Time Convention & Cultural Services Employees, 2020
Source: Auditor generated from City of Sacramento eCAPS data.
97
20
9
7
1
1
38
31
14
5
1
0% 20% 40% 60% 80% 100%
$0-$30k
$30-$60k
$60-$90k
$90-$120k
$120-$150k
$150-$180k
Female Male
88
7
11
5
2
1
1
22
9
14
7
2
1
0% 20% 40% 60% 80% 100%
$0-$30k
$30-$60k
$60-$90k
$90-$120k
$120-$150k
$150-$180k
$180k+
Female Male
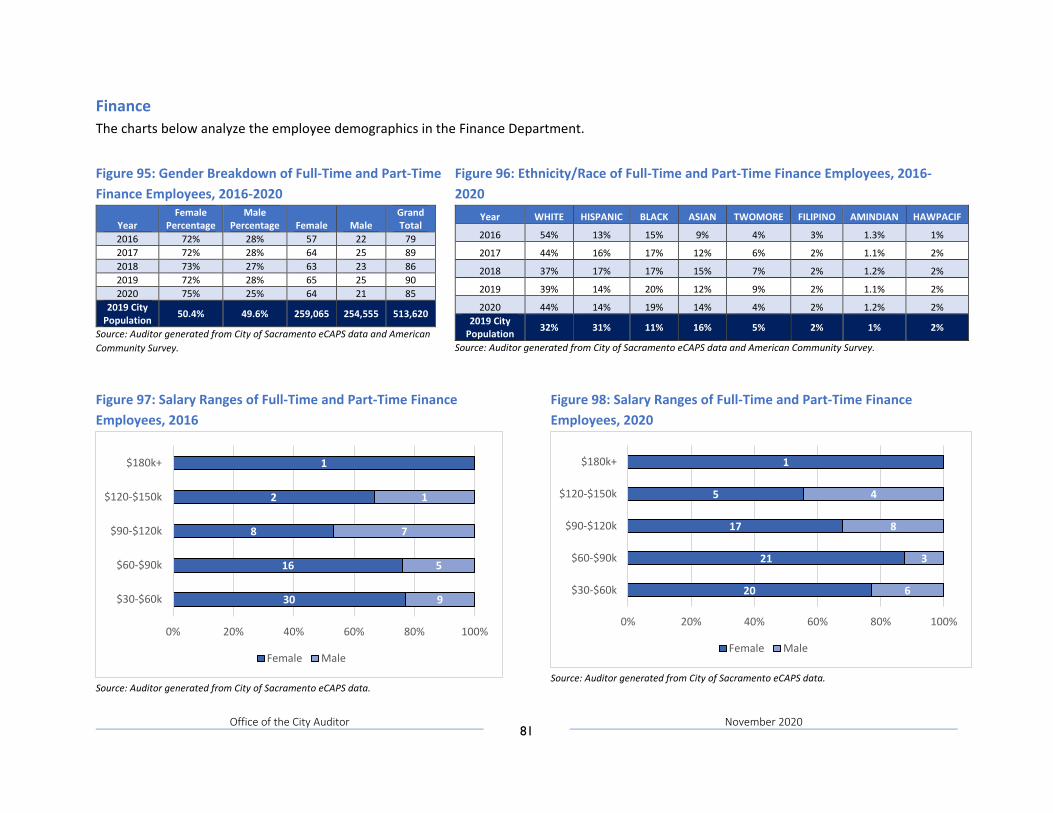
Office of the City Auditor 81
November 2020
Finance The charts below analyze the employee demographics in the Finance Department. Figure 95: Gender Breakdown of Full-Time and Part-Time Finance Employees, 2016-2020
Year Female
Percentage Male
Percentage Female Male Grand Total
2016 72% 28% 57 22 79 2017 72% 28% 64 25 89 2018 73% 27% 63 23 86 2019 72% 28% 65 25 90 2020 75% 25% 64 21 85
2019 City Population 50.4% 49.6% 259,065 254,555 513,620
Source: Auditor generated from City of Sacramento eCAPS data and American Community Survey.
Figure 96: Ethnicity/Race of Full-Time and Part-Time Finance Employees, 2016-2020
Year WHITE HISPANIC BLACK ASIAN TWOMORE FILIPINO AMINDIAN HAWPACIF
2016 54% 13% 15% 9% 4% 3% 1.3% 1%
2017 44% 16% 17% 12% 6% 2% 1.1% 2%
2018 37% 17% 17% 15% 7% 2% 1.2% 2%
2019 39% 14% 20% 12% 9% 2% 1.1% 2%
2020 44% 14% 19% 14% 4% 2% 1.2% 2% 2019 City
Population 32% 31% 11% 16% 5% 2% 1% 2%
Source: Auditor generated from City of Sacramento eCAPS data and American Community Survey.
Figure 97: Salary Ranges of Full-Time and Part-Time Finance Employees, 2016
Source: Auditor generated from City of Sacramento eCAPS data.
Figure 98: Salary Ranges of Full-Time and Part-Time Finance Employees, 2020
Source: Auditor generated from City of Sacramento eCAPS data.
30
16
8
2
1
9
5
7
1
0% 20% 40% 60% 80% 100%
$30-$60k
$60-$90k
$90-$120k
$120-$150k
$180k+
Female Male
20
21
17
5
1
6
3
8
4
0% 20% 40% 60% 80% 100%
$30-$60k
$60-$90k
$90-$120k
$120-$150k
$180k+
Female Male
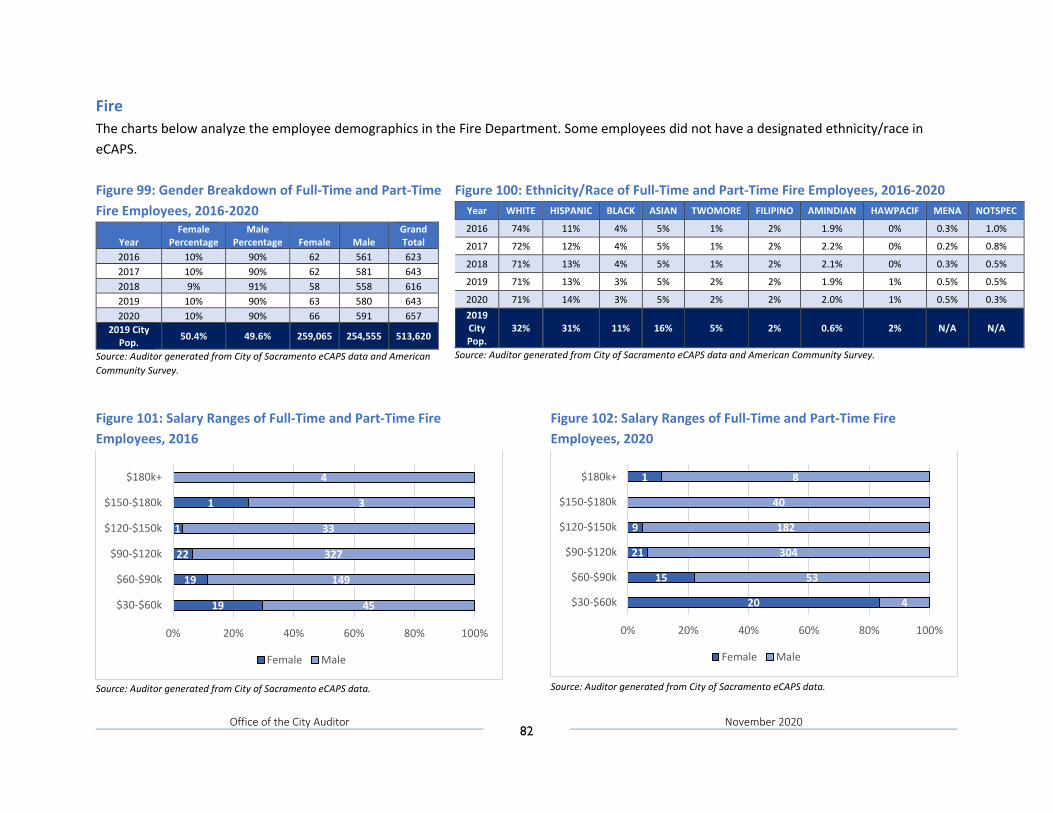
Office of the City Auditor 82
November 2020
Fire The charts below analyze the employee demographics in the Fire Department. Some employees did not have a designated ethnicity/race in eCAPS.
Figure 99: Gender Breakdown of Full-Time and Part-Time Fire Employees, 2016-2020
Year Female
Percentage Male
Percentage Female Male Grand Total
2016 10% 90% 62 561 623 2017 10% 90% 62 581 643 2018 9% 91% 58 558 616 2019 10% 90% 63 580 643 2020 10% 90% 66 591 657
2019 City Pop. 50.4% 49.6% 259,065 254,555 513,620
Source: Auditor generated from City of Sacramento eCAPS data and American Community Survey.
Figure 100: Ethnicity/Race of Full-Time and Part-Time Fire Employees, 2016-2020 Year WHITE HISPANIC BLACK ASIAN TWOMORE FILIPINO AMINDIAN HAWPACIF MENA NOTSPEC
2016 74% 11% 4% 5% 1% 2% 1.9% 0% 0.3% 1.0%
2017 72% 12% 4% 5% 1% 2% 2.2% 0% 0.2% 0.8%
2018 71% 13% 4% 5% 1% 2% 2.1% 0% 0.3% 0.5%
2019 71% 13% 3% 5% 2% 2% 1.9% 1% 0.5% 0.5%
2020 71% 14% 3% 5% 2% 2% 2.0% 1% 0.5% 0.3% 2019 City Pop.
32% 31% 11% 16% 5% 2% 0.6% 2% N/A N/A
Source: Auditor generated from City of Sacramento eCAPS data and American Community Survey.
Figure 101: Salary Ranges of Full-Time and Part-Time Fire Employees, 2016
Source: Auditor generated from City of Sacramento eCAPS data.
Figure 102: Salary Ranges of Full-Time and Part-Time Fire Employees, 2020
Source: Auditor generated from City of Sacramento eCAPS data.
19
19
22
1
1
45
149
327
33
3
4
0% 20% 40% 60% 80% 100%
$30-$60k
$60-$90k
$90-$120k
$120-$150k
$150-$180k
$180k+
Female Male
20
15
21
9
1
4
53
304
182
40
8
0% 20% 40% 60% 80% 100%
$30-$60k
$60-$90k
$90-$120k
$120-$150k
$150-$180k
$180k+
Female Male
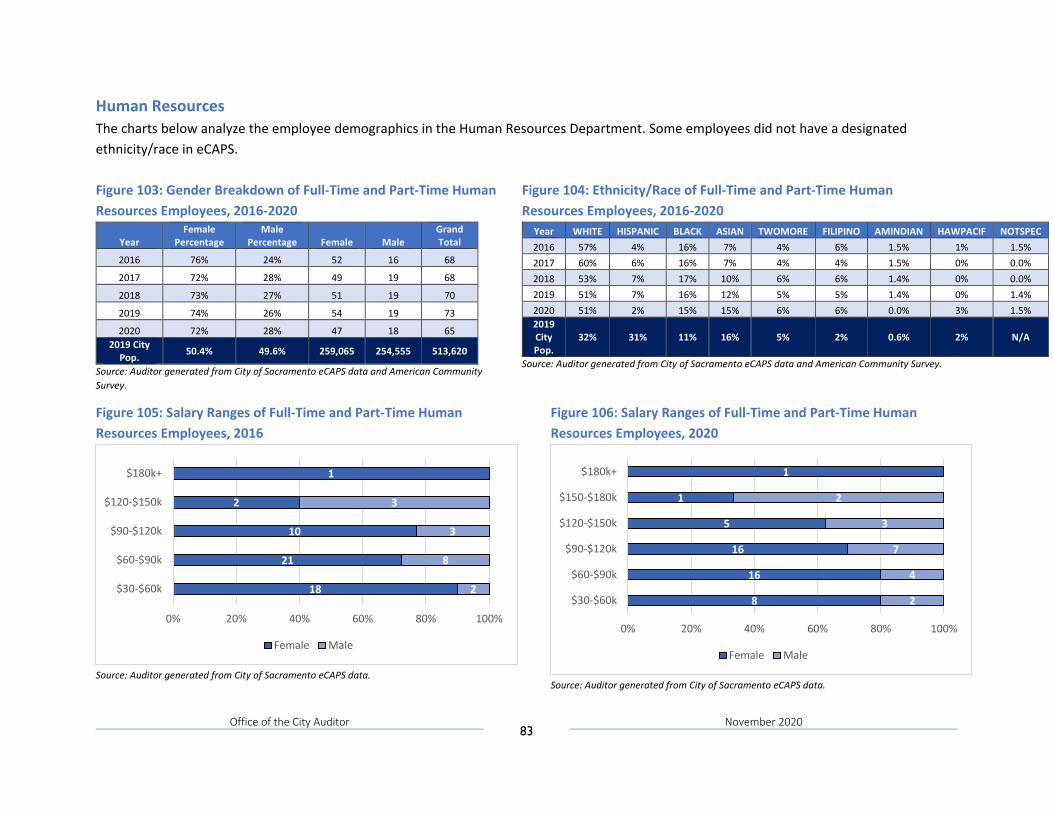
Office of the City Auditor 83
November 2020
Human Resources The charts below analyze the employee demographics in the Human Resources Department. Some employees did not have a designated ethnicity/race in eCAPS. Figure 103: Gender Breakdown of Full-Time and Part-Time Human Resources Employees, 2016-2020
Year Female
Percentage Male
Percentage Female Male Grand Total
2016 76% 24% 52 16 68
2017 72% 28% 49 19 68
2018 73% 27% 51 19 70
2019 74% 26% 54 19 73
2020 72% 28% 47 18 65 2019 City
Pop. 50.4% 49.6% 259,065 254,555 513,620
Source: Auditor generated from City of Sacramento eCAPS data and American Community Survey.
Figure 104: Ethnicity/Race of Full-Time and Part-Time Human Resources Employees, 2016-2020
Year WHITE HISPANIC BLACK ASIAN TWOMORE FILIPINO AMINDIAN HAWPACIF NOTSPEC 2016 57% 4% 16% 7% 4% 6% 1.5% 1% 1.5% 2017 60% 6% 16% 7% 4% 4% 1.5% 0% 0.0% 2018 53% 7% 17% 10% 6% 6% 1.4% 0% 0.0% 2019 51% 7% 16% 12% 5% 5% 1.4% 0% 1.4% 2020 51% 2% 15% 15% 6% 6% 0.0% 3% 1.5% 2019 City Pop.
32% 31% 11% 16% 5% 2% 0.6% 2% N/A
Source: Auditor generated from City of Sacramento eCAPS data and American Community Survey.
Figure 105: Salary Ranges of Full-Time and Part-Time Human Resources Employees, 2016
Source: Auditor generated from City of Sacramento eCAPS data.
Figure 106: Salary Ranges of Full-Time and Part-Time Human Resources Employees, 2020
Source: Auditor generated from City of Sacramento eCAPS data.
18
21
10
2
1
2
8
3
3
0% 20% 40% 60% 80% 100%
$30-$60k
$60-$90k
$90-$120k
$120-$150k
$180k+
Female Male
8
16
16
5
1
1
2
4
7
3
2
0% 20% 40% 60% 80% 100%
$30-$60k
$60-$90k
$90-$120k
$120-$150k
$150-$180k
$180k+
Female Male
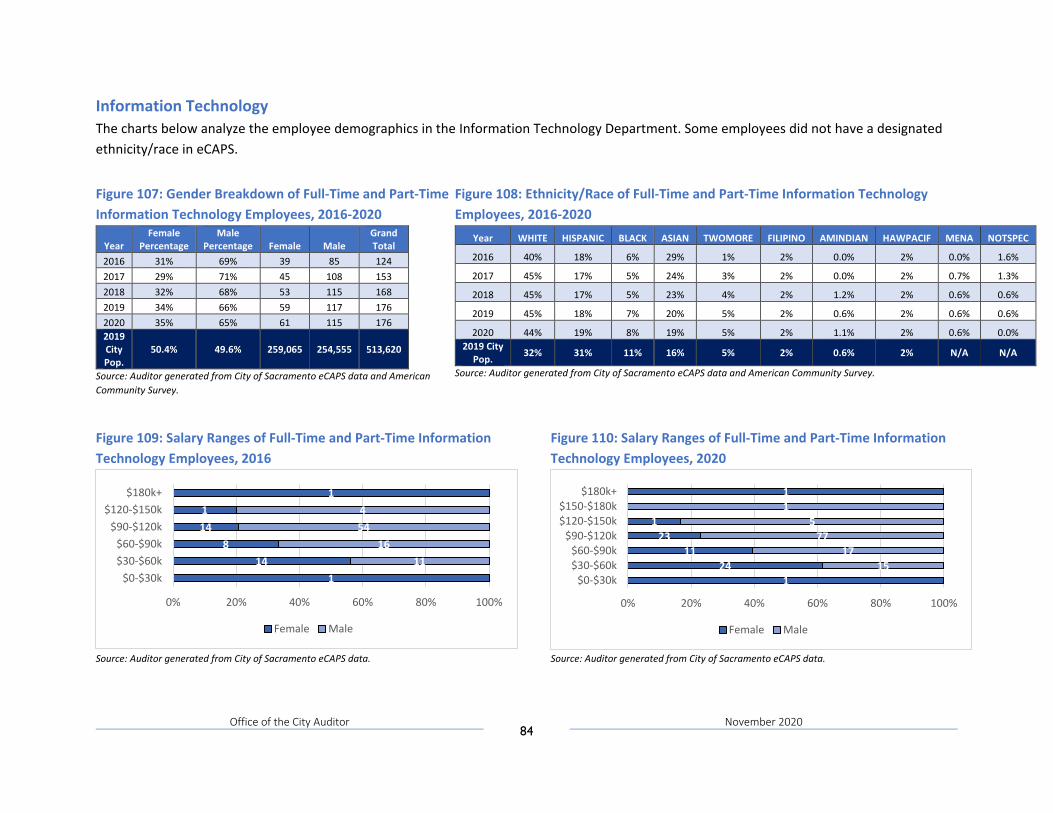
Office of the City Auditor 84
November 2020
Information Technology The charts below analyze the employee demographics in the Information Technology Department. Some employees did not have a designated ethnicity/race in eCAPS. Figure 107: Gender Breakdown of Full-Time and Part-Time Information Technology Employees, 2016-2020
Year Female
Percentage Male
Percentage Female Male Grand Total
2016 31% 69% 39 85 124 2017 29% 71% 45 108 153 2018 32% 68% 53 115 168 2019 34% 66% 59 117 176 2020 35% 65% 61 115 176 2019 City Pop.
50.4% 49.6% 259,065 254,555 513,620
Source: Auditor generated from City of Sacramento eCAPS data and American Community Survey.
Figure 108: Ethnicity/Race of Full-Time and Part-Time Information Technology Employees, 2016-2020
Year WHITE HISPANIC BLACK ASIAN TWOMORE FILIPINO AMINDIAN HAWPACIF MENA NOTSPEC
2016 40% 18% 6% 29% 1% 2% 0.0% 2% 0.0% 1.6%
2017 45% 17% 5% 24% 3% 2% 0.0% 2% 0.7% 1.3%
2018 45% 17% 5% 23% 4% 2% 1.2% 2% 0.6% 0.6%
2019 45% 18% 7% 20% 5% 2% 0.6% 2% 0.6% 0.6%
2020 44% 19% 8% 19% 5% 2% 1.1% 2% 0.6% 0.0% 2019 City
Pop. 32% 31% 11% 16% 5% 2% 0.6% 2% N/A N/A
Source: Auditor generated from City of Sacramento eCAPS data and American Community Survey.
Figure 109: Salary Ranges of Full-Time and Part-Time Information Technology Employees, 2016
Source: Auditor generated from City of Sacramento eCAPS data.
Figure 110: Salary Ranges of Full-Time and Part-Time Information Technology Employees, 2020
Source: Auditor generated from City of Sacramento eCAPS data.
114
8141
1
1116
544
0% 20% 40% 60% 80% 100%
$0-$30k$30-$60k$60-$90k
$90-$120k$120-$150k
$180k+
Female Male
124
1123
1
1
1517
775
1
0% 20% 40% 60% 80% 100%
$0-$30k$30-$60k$60-$90k
$90-$120k$120-$150k$150-$180k
$180k+
Female Male
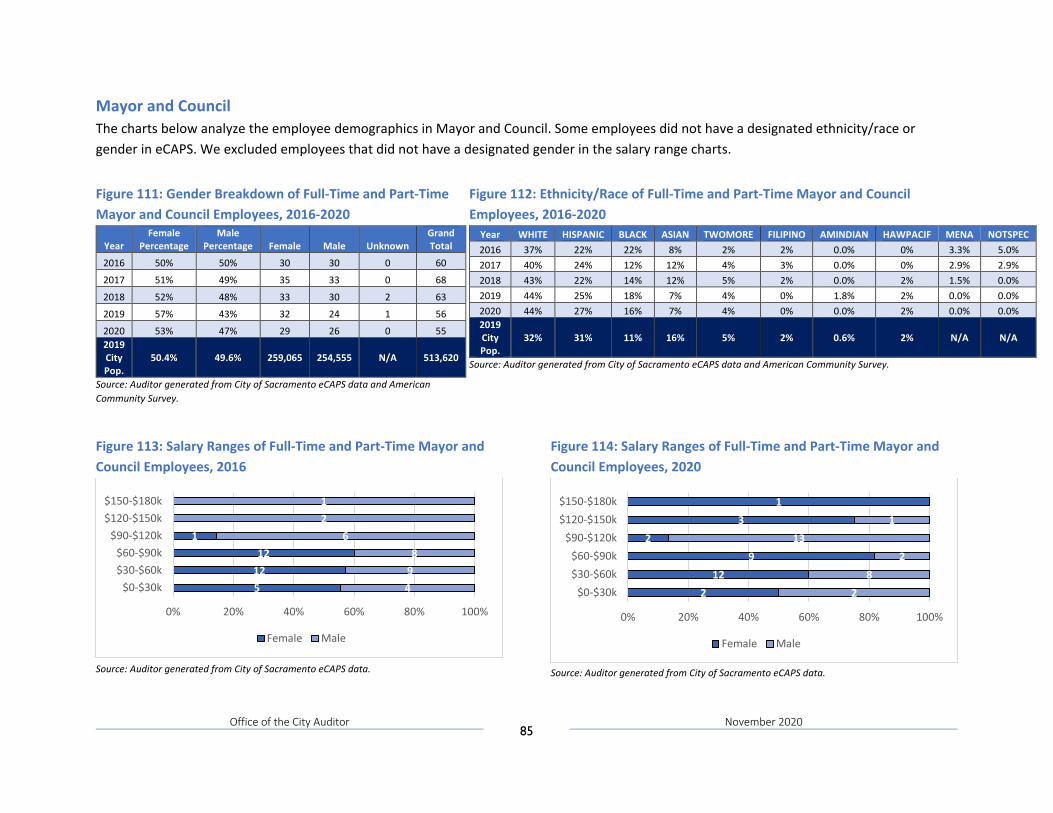
Office of the City Auditor 85
November 2020
Mayor and Council The charts below analyze the employee demographics in Mayor and Council. Some employees did not have a designated ethnicity/race or gender in eCAPS. We excluded employees that did not have a designated gender in the salary range charts. Figure 111: Gender Breakdown of Full-Time and Part-Time Mayor and Council Employees, 2016-2020
Year Female
Percentage Male
Percentage Female Male Unknown Grand Total
2016 50% 50% 30 30 0 60
2017 51% 49% 35 33 0 68
2018 52% 48% 33 30 2 63
2019 57% 43% 32 24 1 56
2020 53% 47% 29 26 0 55 2019 City Pop.
50.4% 49.6% 259,065 254,555 N/A 513,620
Source: Auditor generated from City of Sacramento eCAPS data and American Community Survey.
Figure 112: Ethnicity/Race of Full-Time and Part-Time Mayor and Council Employees, 2016-2020
Year WHITE HISPANIC BLACK ASIAN TWOMORE FILIPINO AMINDIAN HAWPACIF MENA NOTSPEC 2016 37% 22% 22% 8% 2% 2% 0.0% 0% 3.3% 5.0% 2017 40% 24% 12% 12% 4% 3% 0.0% 0% 2.9% 2.9% 2018 43% 22% 14% 12% 5% 2% 0.0% 2% 1.5% 0.0% 2019 44% 25% 18% 7% 4% 0% 1.8% 2% 0.0% 0.0% 2020 44% 27% 16% 7% 4% 0% 0.0% 2% 0.0% 0.0% 2019 City Pop.
32% 31% 11% 16% 5% 2% 0.6% 2% N/A N/A
Source: Auditor generated from City of Sacramento eCAPS data and American Community Survey.
Figure 113: Salary Ranges of Full-Time and Part-Time Mayor and Council Employees, 2016
Source: Auditor generated from City of Sacramento eCAPS data.
Figure 114: Salary Ranges of Full-Time and Part-Time Mayor and Council Employees, 2020
Source: Auditor generated from City of Sacramento eCAPS data.
51212
1
498
621
0% 20% 40% 60% 80% 100%
$0-$30k$30-$60k$60-$90k
$90-$120k$120-$150k$150-$180k
Female Male
212
92
31
28
213
1
0% 20% 40% 60% 80% 100%
$0-$30k$30-$60k$60-$90k
$90-$120k$120-$150k$150-$180k
Female Male

Office of the City Auditor 86
November 2020
Police The charts below analyze the employee demographics in the Police Department. Some employees did not have a designated ethnicity/race in eCAPS. Figure 115: Gender Breakdown of Full-Time and Part-Time Police Employees, 2016-2020
Year Female
Percentage Male
Percentage Female Male Grand Total
2016 32% 68% 366 761 1,127
2017 32% 68% 356 752 1,108
2018 32% 68% 353 752 1,105
2019 33% 67% 379 764 1,143
2020 33% 67% 383 786 1,169 2019 City Pop.
50.4% 49.6% 259,065 254,555 513,620
Source: Auditor generated from City of Sacramento eCAPS data and American Community Survey.
Figure 116: Ethnicity/Race of Full-Time and Part-Time Police Employees, 2016-2020
Year WHITE HISPANIC BLACK ASIAN TWOMORE FILIPINO AMINDIAN HAWPACIF MENA NOTSPEC
2016 70% 13% 5% 8% 1% 1% 1.0% 1% 0.1% 0.4%
2017 68% 13% 6% 8% 1% 1% 0.6% 1% 0.1% 0.4%
2018 68% 13% 6% 8% 2% 2% 0.7% 1% 0.1% 0.3%
2019 67% 13% 6% 8% 3% 2% 0.5% 1% 0.1% 0.3%
2020 65% 15% 5% 9% 4% 1% 0.6% 1% 0.1% 0.3% 2019 City Pop.
32% 31% 11% 16% 5% 2% 0.6% 1.9% N/A N/A
Source: Auditor generated from City of Sacramento eCAPS data and American Community Survey.
Figure 117: Salary Ranges of Full-Time and Part-Time Police Employees, 2016
Source: Auditor generated from City of Sacramento eCAPS data.
Figure 118: Salary Ranges of Full-Time and Part-Time Police Employees, 2020
Source: Auditor generated from City of Sacramento eCAPS data.
4893
1685115
10956
3512095
274
0% 20% 40% 60% 80% 100%
$0-$30k$30-$60k$60-$90k
$90-$120k$120-$150k$150-$180k
$180k+
Female Male
21
93
138
80
48
1
2
67
81
161
214
231
19
13
0% 20% 40% 60% 80% 100%
$0-$30k
$30-$60k
$60-$90k
$90-$120k
$120-$150k
$150-$180k
$180k+
Female Male
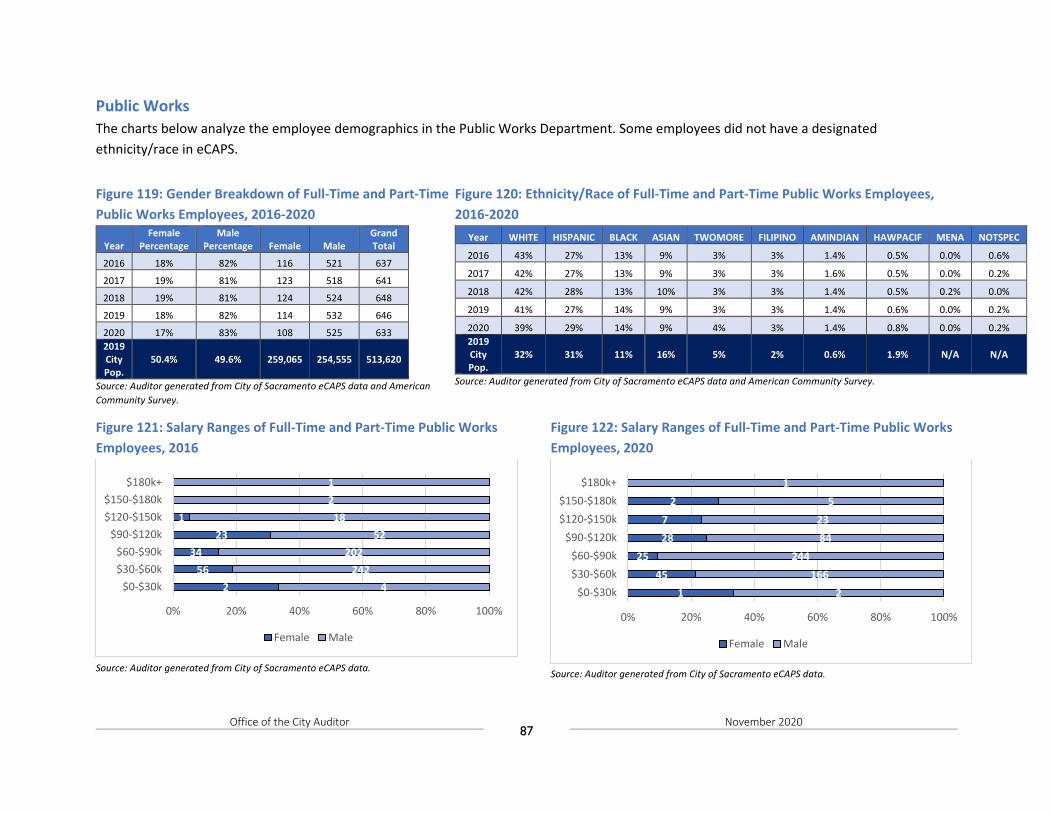
Office of the City Auditor 87
November 2020
Public Works The charts below analyze the employee demographics in the Public Works Department. Some employees did not have a designated ethnicity/race in eCAPS. Figure 119: Gender Breakdown of Full-Time and Part-Time Public Works Employees, 2016-2020
Year Female
Percentage Male
Percentage Female Male Grand Total
2016 18% 82% 116 521 637
2017 19% 81% 123 518 641
2018 19% 81% 124 524 648
2019 18% 82% 114 532 646
2020 17% 83% 108 525 633 2019 City Pop.
50.4% 49.6% 259,065 254,555 513,620
Source: Auditor generated from City of Sacramento eCAPS data and American Community Survey.
Figure 120: Ethnicity/Race of Full-Time and Part-Time Public Works Employees, 2016-2020
Year WHITE HISPANIC BLACK ASIAN TWOMORE FILIPINO AMINDIAN HAWPACIF MENA NOTSPEC
2016 43% 27% 13% 9% 3% 3% 1.4% 0.5% 0.0% 0.6%
2017 42% 27% 13% 9% 3% 3% 1.6% 0.5% 0.0% 0.2%
2018 42% 28% 13% 10% 3% 3% 1.4% 0.5% 0.2% 0.0%
2019 41% 27% 14% 9% 3% 3% 1.4% 0.6% 0.0% 0.2%
2020 39% 29% 14% 9% 4% 3% 1.4% 0.8% 0.0% 0.2% 2019 City Pop.
32% 31% 11% 16% 5% 2% 0.6% 1.9% N/A N/A
Source: Auditor generated from City of Sacramento eCAPS data and American Community Survey.
Figure 121: Salary Ranges of Full-Time and Part-Time Public Works Employees, 2016
Source: Auditor generated from City of Sacramento eCAPS data.
Figure 122: Salary Ranges of Full-Time and Part-Time Public Works Employees, 2020
Source: Auditor generated from City of Sacramento eCAPS data.
256
3423
1
4242
20252
1821
0% 20% 40% 60% 80% 100%
$0-$30k$30-$60k$60-$90k
$90-$120k$120-$150k$150-$180k
$180k+
Female Male
145
25287
2
2166
2448423
51
0% 20% 40% 60% 80% 100%
$0-$30k$30-$60k$60-$90k
$90-$120k$120-$150k$150-$180k
$180k+
Female Male
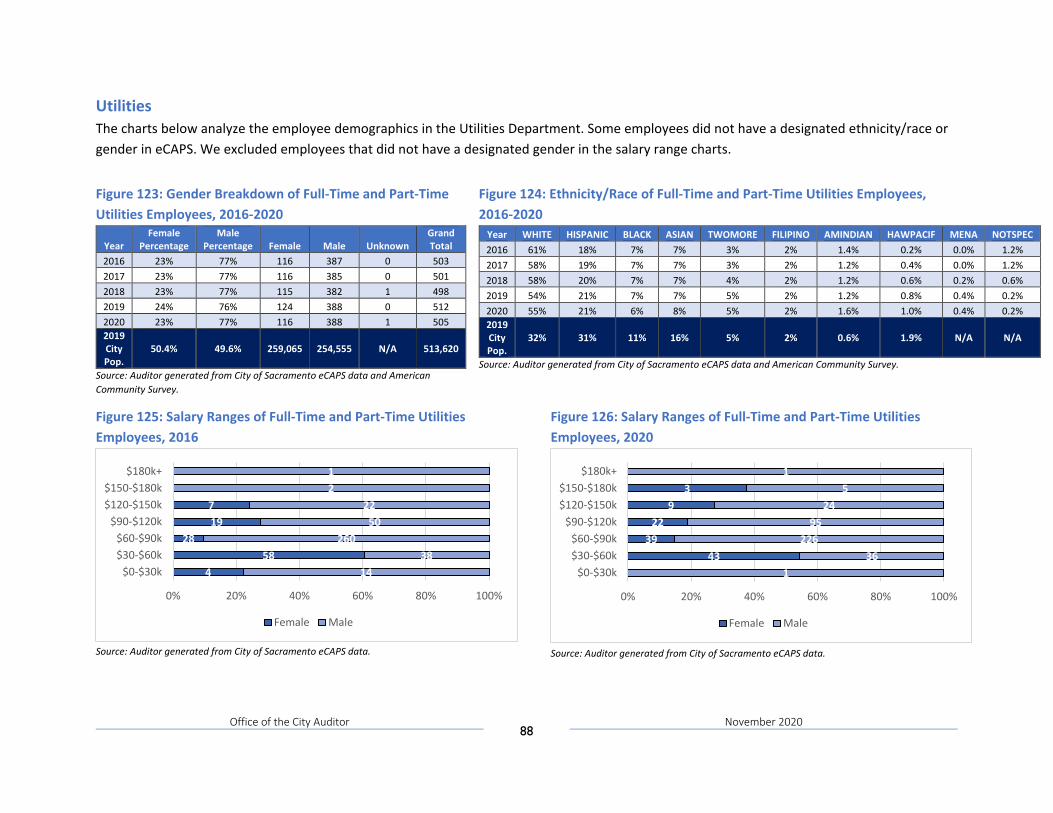
Office of the City Auditor 88
November 2020
Utilities The charts below analyze the employee demographics in the Utilities Department. Some employees did not have a designated ethnicity/race or gender in eCAPS. We excluded employees that did not have a designated gender in the salary range charts. Figure 123: Gender Breakdown of Full-Time and Part-Time Utilities Employees, 2016-2020
Year Female
Percentage Male
Percentage Female Male Unknown Grand Total
2016 23% 77% 116 387 0 503 2017 23% 77% 116 385 0 501 2018 23% 77% 115 382 1 498 2019 24% 76% 124 388 0 512 2020 23% 77% 116 388 1 505 2019 City Pop.
50.4% 49.6% 259,065 254,555 N/A 513,620
Source: Auditor generated from City of Sacramento eCAPS data and American Community Survey.
Figure 124: Ethnicity/Race of Full-Time and Part-Time Utilities Employees, 2016-2020
Year WHITE HISPANIC BLACK ASIAN TWOMORE FILIPINO AMINDIAN HAWPACIF MENA NOTSPEC 2016 61% 18% 7% 7% 3% 2% 1.4% 0.2% 0.0% 1.2% 2017 58% 19% 7% 7% 3% 2% 1.2% 0.4% 0.0% 1.2% 2018 58% 20% 7% 7% 4% 2% 1.2% 0.6% 0.2% 0.6% 2019 54% 21% 7% 7% 5% 2% 1.2% 0.8% 0.4% 0.2% 2020 55% 21% 6% 8% 5% 2% 1.6% 1.0% 0.4% 0.2% 2019 City Pop.
32% 31% 11% 16% 5% 2% 0.6% 1.9% N/A N/A
Source: Auditor generated from City of Sacramento eCAPS data and American Community Survey.
Figure 125: Salary Ranges of Full-Time and Part-Time Utilities Employees, 2016
Source: Auditor generated from City of Sacramento eCAPS data.
Figure 126: Salary Ranges of Full-Time and Part-Time Utilities Employees, 2020
Source: Auditor generated from City of Sacramento eCAPS data.
458
28197
1438
26050
2221
0% 20% 40% 60% 80% 100%
$0-$30k$30-$60k$60-$90k
$90-$120k$120-$150k$150-$180k
$180k+
Female Male
4339
229
3
136
22695
245
1
0% 20% 40% 60% 80% 100%
$0-$30k$30-$60k$60-$90k
$90-$120k$120-$150k$150-$180k
$180k+
Female Male
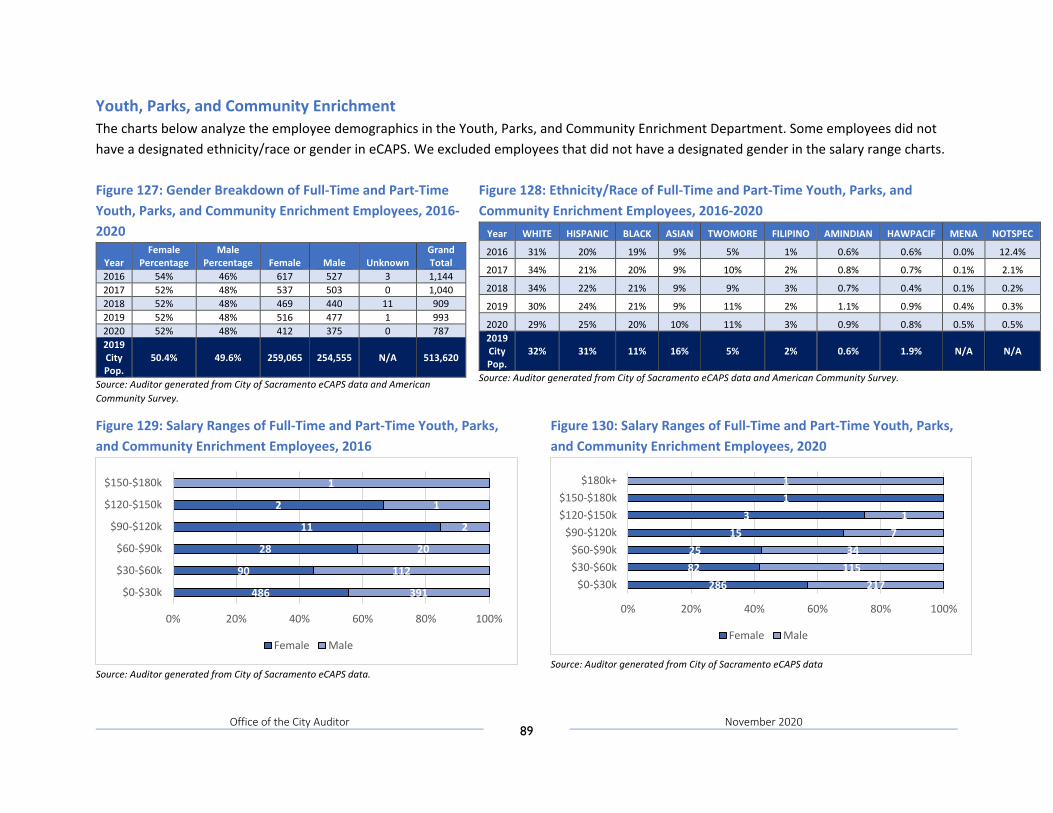
Office of the City Auditor 89
November 2020
Youth, Parks, and Community Enrichment The charts below analyze the employee demographics in the Youth, Parks, and Community Enrichment Department. Some employees did not have a designated ethnicity/race or gender in eCAPS. We excluded employees that did not have a designated gender in the salary range charts. Figure 127: Gender Breakdown of Full-Time and Part-Time Youth, Parks, and Community Enrichment Employees, 2016-2020
Year Female
Percentage Male
Percentage Female Male Unknown Grand Total
2016 54% 46% 617 527 3 1,144 2017 52% 48% 537 503 0 1,040 2018 52% 48% 469 440 11 909 2019 52% 48% 516 477 1 993 2020 52% 48% 412 375 0 787 2019 City Pop.
50.4% 49.6% 259,065 254,555 N/A 513,620
Source: Auditor generated from City of Sacramento eCAPS data and American Community Survey.
Figure 128: Ethnicity/Race of Full-Time and Part-Time Youth, Parks, and Community Enrichment Employees, 2016-2020
Year WHITE HISPANIC BLACK ASIAN TWOMORE FILIPINO AMINDIAN HAWPACIF MENA NOTSPEC
2016 31% 20% 19% 9% 5% 1% 0.6% 0.6% 0.0% 12.4%
2017 34% 21% 20% 9% 10% 2% 0.8% 0.7% 0.1% 2.1%
2018 34% 22% 21% 9% 9% 3% 0.7% 0.4% 0.1% 0.2%
2019 30% 24% 21% 9% 11% 2% 1.1% 0.9% 0.4% 0.3%
2020 29% 25% 20% 10% 11% 3% 0.9% 0.8% 0.5% 0.5% 2019 City Pop.
32% 31% 11% 16% 5% 2% 0.6% 1.9% N/A N/A
Source: Auditor generated from City of Sacramento eCAPS data and American Community Survey.
Figure 129: Salary Ranges of Full-Time and Part-Time Youth, Parks, and Community Enrichment Employees, 2016
Source: Auditor generated from City of Sacramento eCAPS data.
Figure 130: Salary Ranges of Full-Time and Part-Time Youth, Parks, and Community Enrichment Employees, 2020
Source: Auditor generated from City of Sacramento eCAPS data
486
90
28
11
2
391
112
20
2
1
1
0% 20% 40% 60% 80% 100%
$0-$30k
$30-$60k
$60-$90k
$90-$120k
$120-$150k
$150-$180k
Female Male
2868225
153
1
21711534
71
1
0% 20% 40% 60% 80% 100%
$0-$30k$30-$60k$60-$90k
$90-$120k$120-$150k$150-$180k
$180k+
Female Male
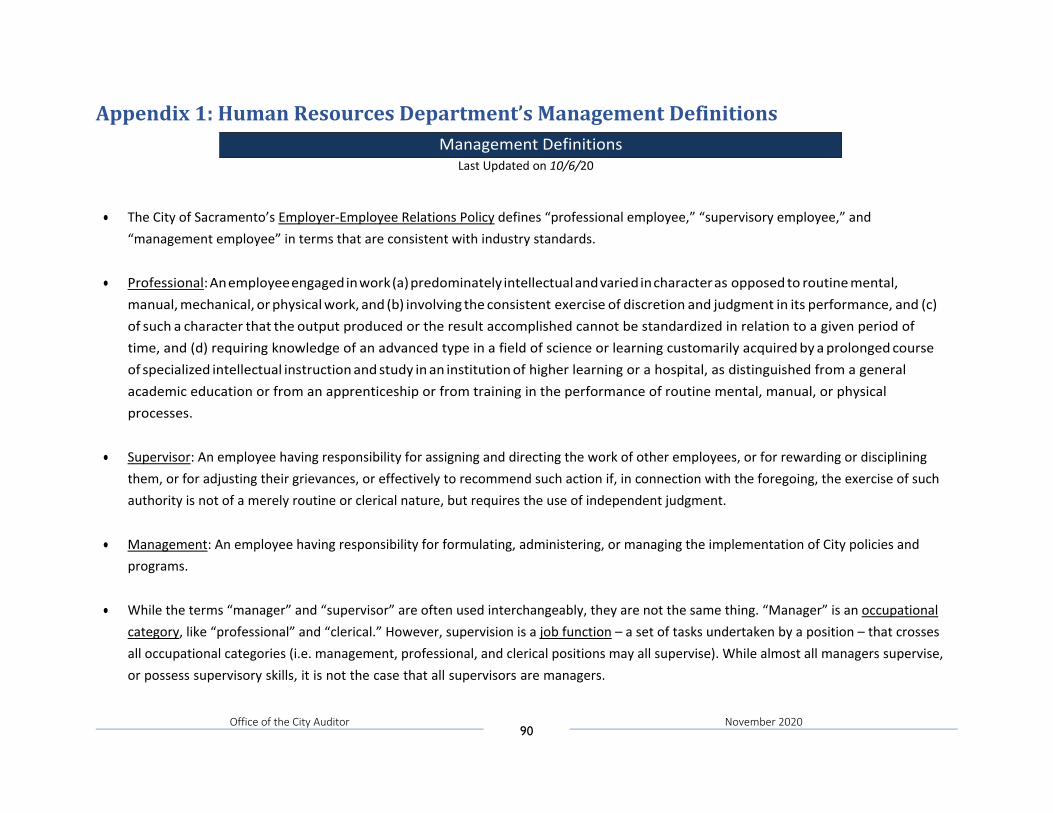
Office of the City Auditor 90
November 2020
Appendix 1: Human Resources Department’s Management Definitions
Last Updated on 10/6/20
• The City of Sacramento’s Employer-Employee Relations Policy defines “professional employee,” “supervisory employee,” and
“management employee” in terms that are consistent with industry standards.
• Professional: An employee engaged in work (a) predominately intellectual and varied in character as opposed to routine mental,
manual, mechanical, or physical work, and (b) involving the consistent exercise of discretion and judgment in its performance, and (c) of such a character that the output produced or the result accomplished cannot be standardized in relation to a given period of time, and (d) requiring knowledge of an advanced type in a field of science or learning customarily acquired by a prolonged course of specialized intellectual instruction and study in an institution of higher learning or a hospital, as distinguished from a general academic education or from an apprenticeship or from training in the performance of routine mental, manual, or physical processes.
• Supervisor: An employee having responsibility for assigning and directing the work of other employees, or for rewarding or disciplining
them, or for adjusting their grievances, or effectively to recommend such action if, in connection with the foregoing, the exercise of such authority is not of a merely routine or clerical nature, but requires the use of independent judgment.
• Management: An employee having responsibility for formulating, administering, or managing the implementation of City policies and
programs.
• While the terms “manager” and “supervisor” are often used interchangeably, they are not the same thing. “Manager” is an occupational
category, like “professional” and “clerical.” However, supervision is a job function – a set of tasks undertaken by a position – that crosses all occupational categories (i.e. management, professional, and clerical positions may all supervise). While almost all managers supervise, or possess supervisory skills, it is not the case that all supervisors are managers.
Management Definitions
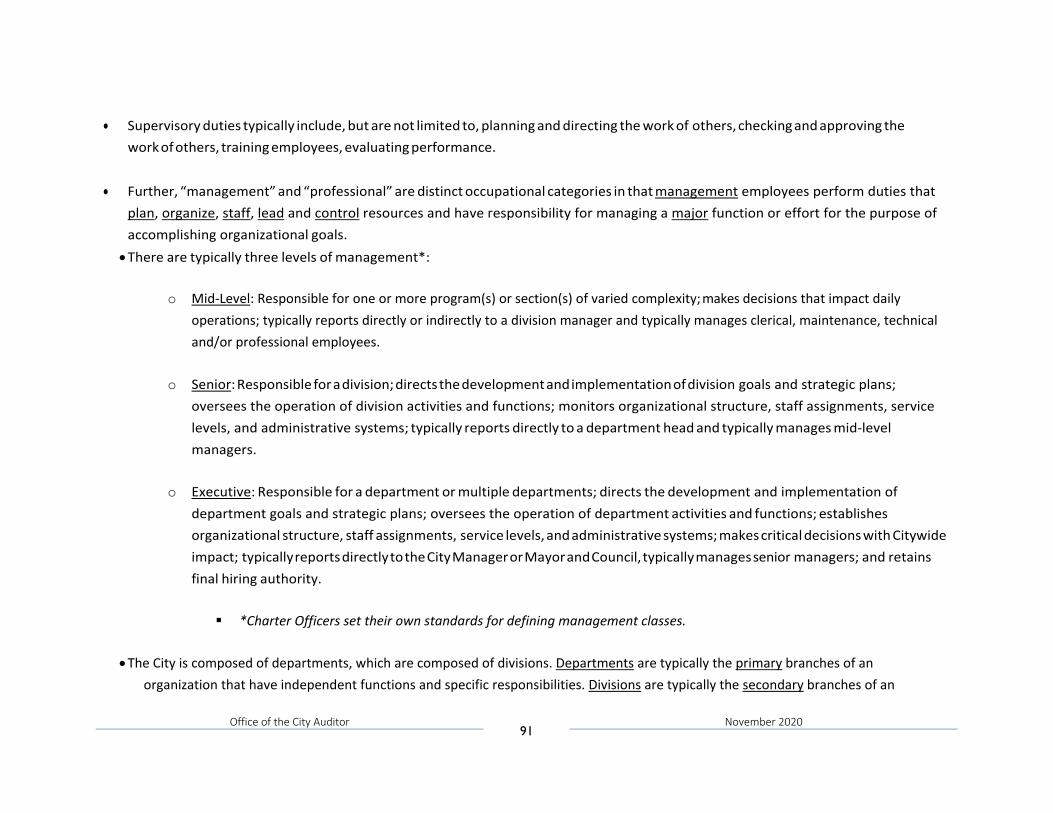
Office of the City Auditor 91
November 2020
• Supervisory duties typically include, but are not limited to, planning and directing the work of others, checking and approving the
work of others, training employees, evaluating performance.
• Further, “management” and “professional” are distinct occupational categories in that management employees perform duties that
plan, organize, staff, lead and control resources and have responsibility for managing a major function or effort for the purpose of accomplishing organizational goals. • There are typically three levels of management*:
o Mid-Level: Responsible for one or more program(s) or section(s) of varied complexity; makes decisions that impact daily
operations; typically reports directly or indirectly to a division manager and typically manages clerical, maintenance, technical and/or professional employees.
o Senior: Responsible for a division; directs the development and implementation of division goals and strategic plans;
oversees the operation of division activities and functions; monitors organizational structure, staff assignments, service levels, and administrative systems; typically reports directly to a department head and typically manages mid-level managers.
o Executive: Responsible for a department or multiple departments; directs the development and implementation of
department goals and strategic plans; oversees the operation of department activities and functions; establishes organizational structure, staff assignments, service levels, and administrative systems; makes critical decisions with Citywide impact; typically reports directly to the City Manager or Mayor and Council, typically manages senior managers; and retains final hiring authority.
*Charter Officers set their own standards for defining management classes.
• The City is composed of departments, which are composed of divisions. Departments are typically the primary branches of an
organization that have independent functions and specific responsibilities. Divisions are typically the secondary branches of an
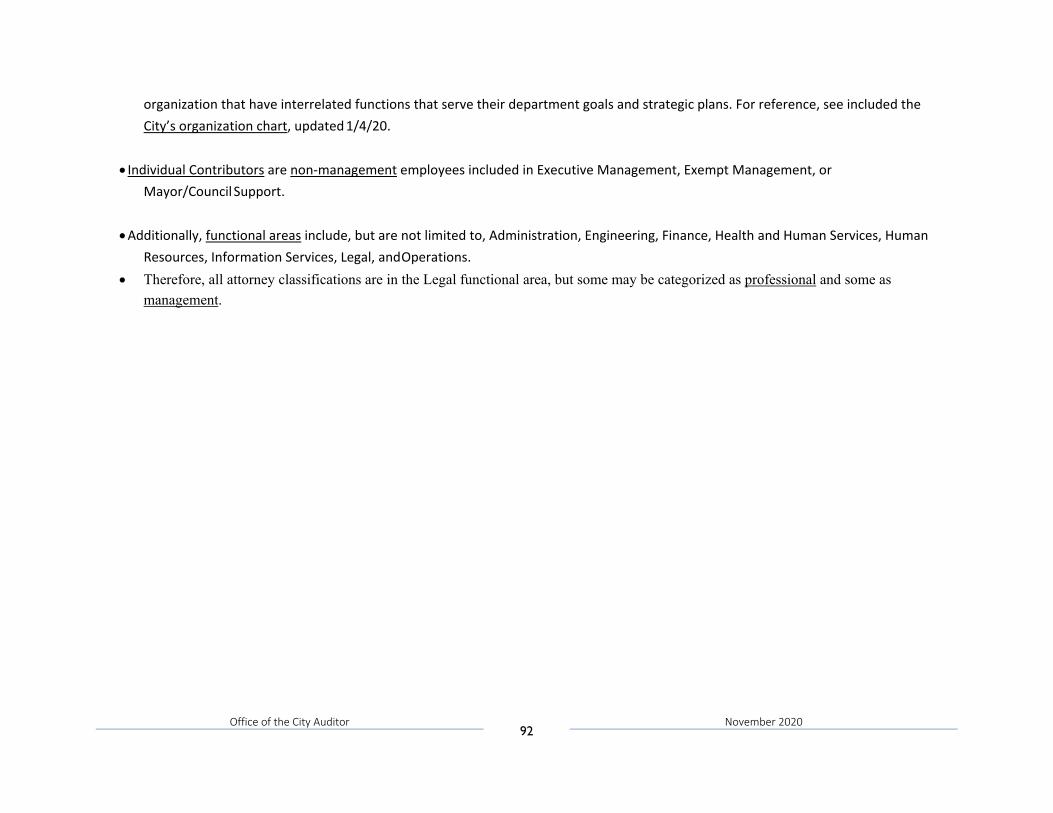
Office of the City Auditor 92
November 2020
organization that have interrelated functions that serve their department goals and strategic plans. For reference, see included the City’s organization chart, updated 1/4/20.
• Individual Contributors are non-management employees included in Executive Management, Exempt Management, or
Mayor/Council Support.
• Additionally, functional areas include, but are not limited to, Administration, Engineering, Finance, Health and Human Services, Human
Resources, Information Services, Legal, and Operations. • Therefore, all attorney classifications are in the Legal functional area, but some may be categorized as professional and some as
management.
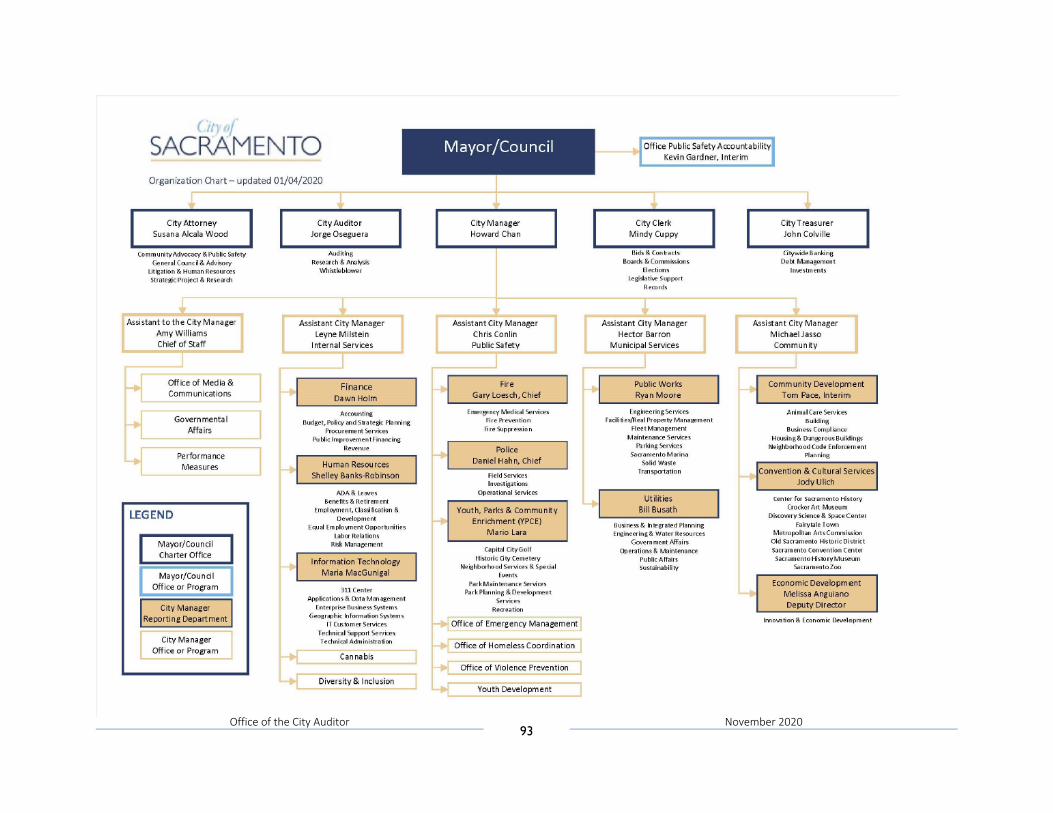
Office of the City Auditor 93
November 2020
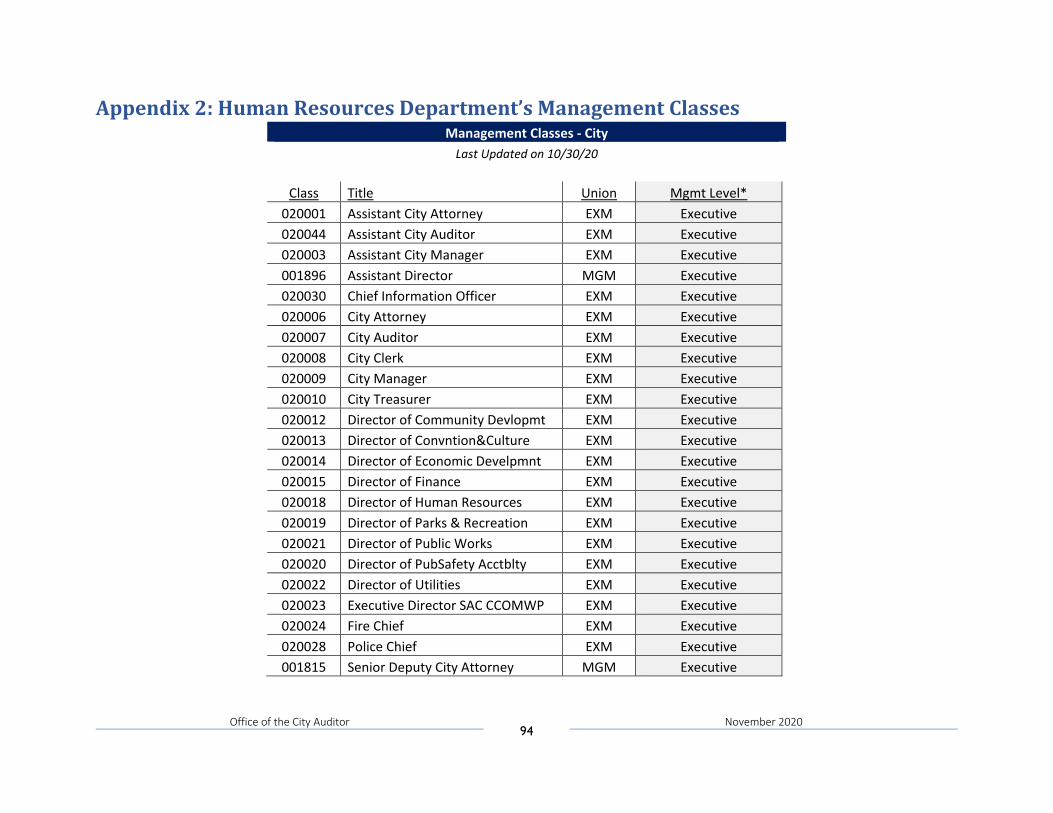
Office of the City Auditor 94
November 2020
Appendix 2: Human Resources Department’s Management Classes Management Classes - City
Last Updated on 10/30/20
Class Title Union Mgmt Level*
020001 Assistant City Attorney EXM Executive 020044 Assistant City Auditor EXM Executive 020003 Assistant City Manager EXM Executive 001896 Assistant Director MGM Executive 020030 Chief Information Officer EXM Executive 020006 City Attorney EXM Executive 020007 City Auditor EXM Executive 020008 City Clerk EXM Executive 020009 City Manager EXM Executive 020010 City Treasurer EXM Executive 020012 Director of Community Devlopmt EXM Executive 020013 Director of Convntion&Culture EXM Executive 020014 Director of Economic Develpmnt EXM Executive 020015 Director of Finance EXM Executive 020018 Director of Human Resources EXM Executive 020019 Director of Parks & Recreation EXM Executive 020021 Director of Public Works EXM Executive 020020 Director of PubSafety Acctblty EXM Executive 020022 Director of Utilities EXM Executive 020023 Executive Director SAC CCOMWP EXM Executive 020024 Fire Chief EXM Executive 020028 Police Chief EXM Executive 001815 Senior Deputy City Attorney MGM Executive
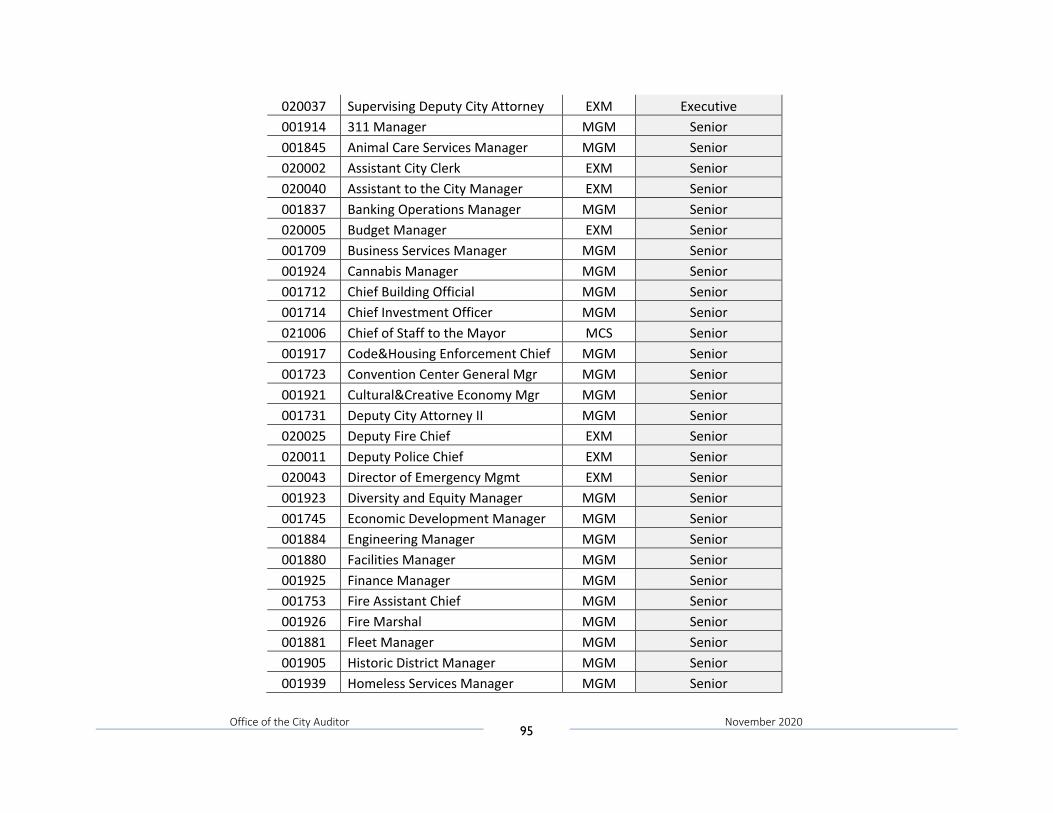
Office of the City Auditor 95
November 2020
020037 Supervising Deputy City Attorney EXM Executive 001914 311 Manager MGM Senior 001845 Animal Care Services Manager MGM Senior 020002 Assistant City Clerk EXM Senior 020040 Assistant to the City Manager EXM Senior 001837 Banking Operations Manager MGM Senior 020005 Budget Manager EXM Senior 001709 Business Services Manager MGM Senior 001924 Cannabis Manager MGM Senior 001712 Chief Building Official MGM Senior 001714 Chief Investment Officer MGM Senior 021006 Chief of Staff to the Mayor MCS Senior 001917 Code&Housing Enforcement Chief MGM Senior 001723 Convention Center General Mgr MGM Senior 001921 Cultural&Creative Economy Mgr MGM Senior 001731 Deputy City Attorney II MGM Senior 020025 Deputy Fire Chief EXM Senior 020011 Deputy Police Chief EXM Senior 020043 Director of Emergency Mgmt EXM Senior 001923 Diversity and Equity Manager MGM Senior 001745 Economic Development Manager MGM Senior 001884 Engineering Manager MGM Senior 001880 Facilities Manager MGM Senior 001925 Finance Manager MGM Senior 001753 Fire Assistant Chief MGM Senior 001926 Fire Marshal MGM Senior 001881 Fleet Manager MGM Senior 001905 Historic District Manager MGM Senior 001939 Homeless Services Manager MGM Senior
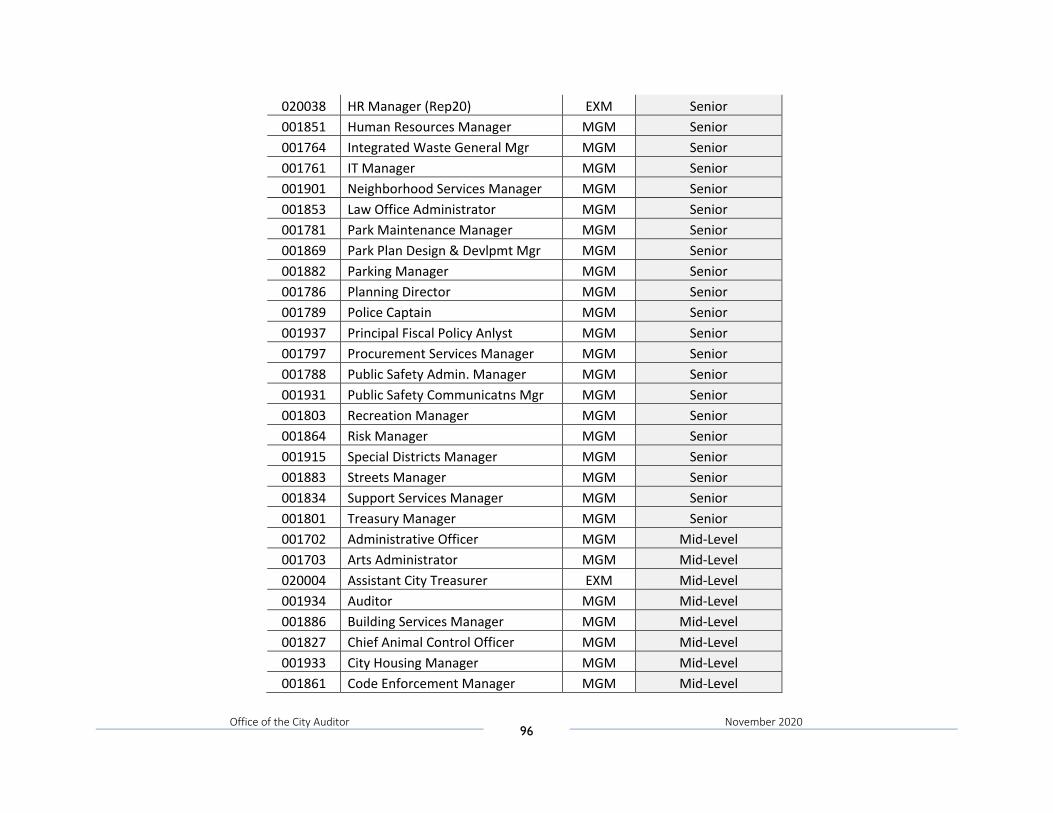
Office of the City Auditor 96
November 2020
020038 HR Manager (Rep20) EXM Senior 001851 Human Resources Manager MGM Senior 001764 Integrated Waste General Mgr MGM Senior 001761 IT Manager MGM Senior 001901 Neighborhood Services Manager MGM Senior 001853 Law Office Administrator MGM Senior 001781 Park Maintenance Manager MGM Senior 001869 Park Plan Design & Devlpmt Mgr MGM Senior 001882 Parking Manager MGM Senior 001786 Planning Director MGM Senior 001789 Police Captain MGM Senior 001937 Principal Fiscal Policy Anlyst MGM Senior 001797 Procurement Services Manager MGM Senior 001788 Public Safety Admin. Manager MGM Senior 001931 Public Safety Communicatns Mgr MGM Senior 001803 Recreation Manager MGM Senior 001864 Risk Manager MGM Senior 001915 Special Districts Manager MGM Senior 001883 Streets Manager MGM Senior 001834 Support Services Manager MGM Senior 001801 Treasury Manager MGM Senior 001702 Administrative Officer MGM Mid-Level 001703 Arts Administrator MGM Mid-Level 020004 Assistant City Treasurer EXM Mid-Level 001934 Auditor MGM Mid-Level 001886 Building Services Manager MGM Mid-Level 001827 Chief Animal Control Officer MGM Mid-Level 001933 City Housing Manager MGM Mid-Level 001861 Code Enforcement Manager MGM Mid-Level
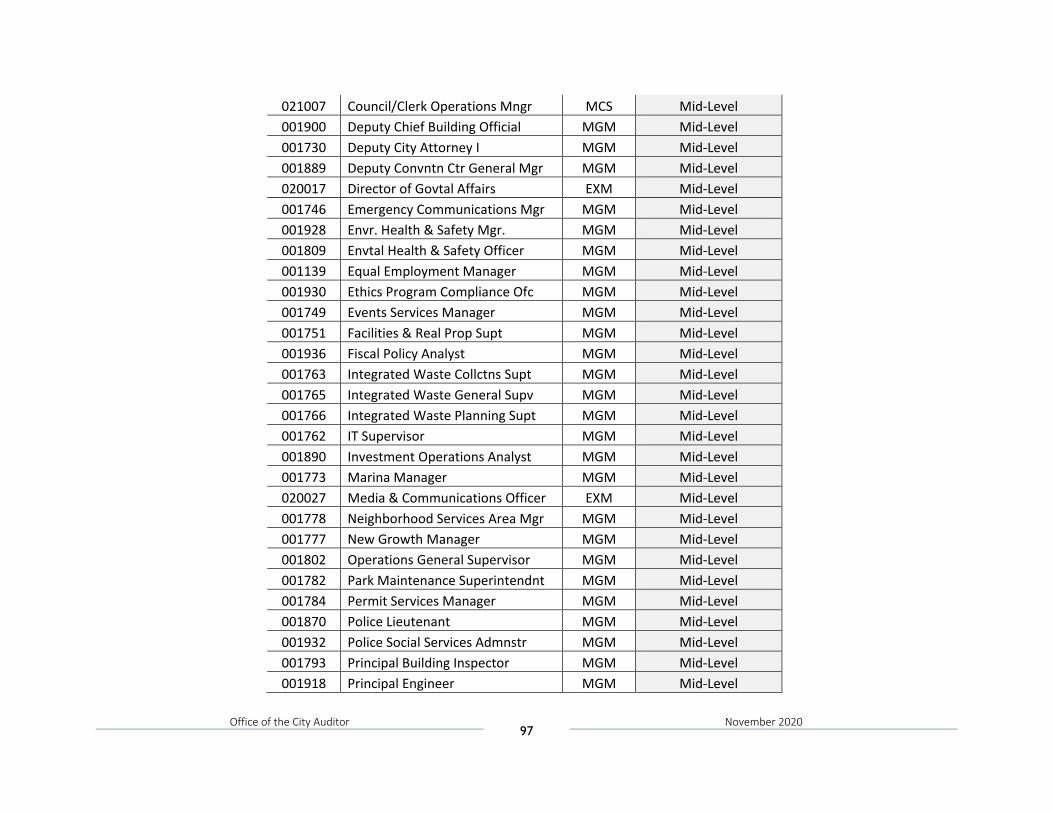
Office of the City Auditor 97
November 2020
021007 Council/Clerk Operations Mngr MCS Mid-Level 001900 Deputy Chief Building Official MGM Mid-Level 001730 Deputy City Attorney I MGM Mid-Level 001889 Deputy Convntn Ctr General Mgr MGM Mid-Level 020017 Director of Govtal Affairs EXM Mid-Level 001746 Emergency Communications Mgr MGM Mid-Level 001928 Envr. Health & Safety Mgr. MGM Mid-Level 001809 Envtal Health & Safety Officer MGM Mid-Level 001139 Equal Employment Manager MGM Mid-Level 001930 Ethics Program Compliance Ofc MGM Mid-Level 001749 Events Services Manager MGM Mid-Level 001751 Facilities & Real Prop Supt MGM Mid-Level 001936 Fiscal Policy Analyst MGM Mid-Level 001763 Integrated Waste Collctns Supt MGM Mid-Level 001765 Integrated Waste General Supv MGM Mid-Level 001766 Integrated Waste Planning Supt MGM Mid-Level 001762 IT Supervisor MGM Mid-Level 001890 Investment Operations Analyst MGM Mid-Level 001773 Marina Manager MGM Mid-Level 020027 Media & Communications Officer EXM Mid-Level 001778 Neighborhood Services Area Mgr MGM Mid-Level 001777 New Growth Manager MGM Mid-Level 001802 Operations General Supervisor MGM Mid-Level 001782 Park Maintenance Superintendnt MGM Mid-Level 001784 Permit Services Manager MGM Mid-Level 001870 Police Lieutenant MGM Mid-Level 001932 Police Social Services Admnstr MGM Mid-Level 001793 Principal Building Inspector MGM Mid-Level 001918 Principal Engineer MGM Mid-Level
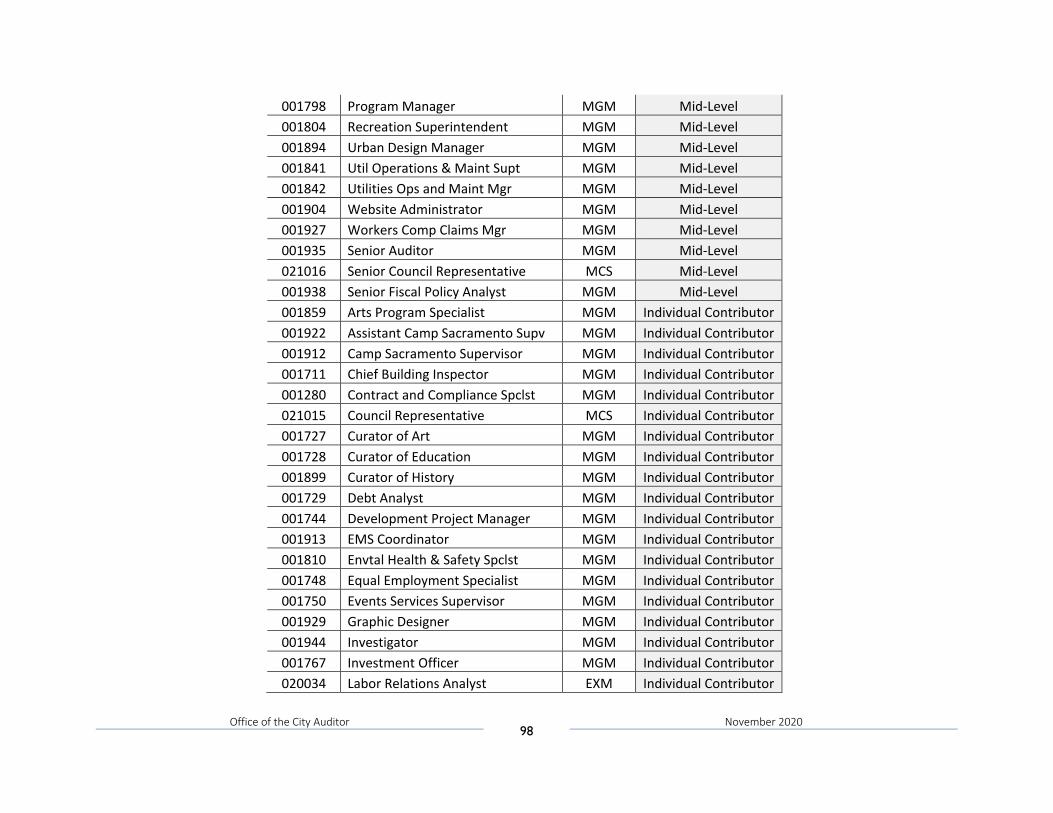
Office of the City Auditor 98
November 2020
001798 Program Manager MGM Mid-Level 001804 Recreation Superintendent MGM Mid-Level 001894 Urban Design Manager MGM Mid-Level 001841 Util Operations & Maint Supt MGM Mid-Level 001842 Utilities Ops and Maint Mgr MGM Mid-Level 001904 Website Administrator MGM Mid-Level 001927 Workers Comp Claims Mgr MGM Mid-Level 001935 Senior Auditor MGM Mid-Level 021016 Senior Council Representative MCS Mid-Level 001938 Senior Fiscal Policy Analyst MGM Mid-Level 001859 Arts Program Specialist MGM Individual Contributor 001922 Assistant Camp Sacramento Supv MGM Individual Contributor 001912 Camp Sacramento Supervisor MGM Individual Contributor 001711 Chief Building Inspector MGM Individual Contributor 001280 Contract and Compliance Spclst MGM Individual Contributor 021015 Council Representative MCS Individual Contributor 001727 Curator of Art MGM Individual Contributor 001728 Curator of Education MGM Individual Contributor 001899 Curator of History MGM Individual Contributor 001729 Debt Analyst MGM Individual Contributor 001744 Development Project Manager MGM Individual Contributor 001913 EMS Coordinator MGM Individual Contributor 001810 Envtal Health & Safety Spclst MGM Individual Contributor 001748 Equal Employment Specialist MGM Individual Contributor 001750 Events Services Supervisor MGM Individual Contributor 001929 Graphic Designer MGM Individual Contributor 001944 Investigator MGM Individual Contributor 001767 Investment Officer MGM Individual Contributor 020034 Labor Relations Analyst EXM Individual Contributor
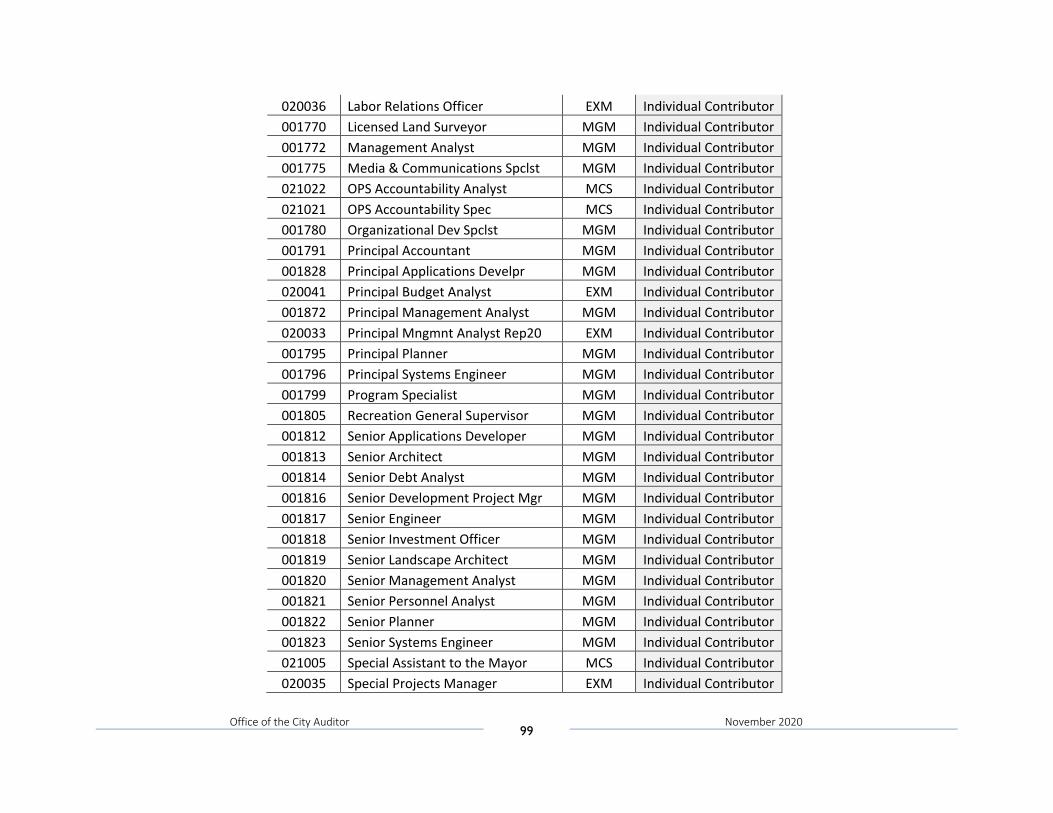
Office of the City Auditor 99
November 2020
020036 Labor Relations Officer EXM Individual Contributor 001770 Licensed Land Surveyor MGM Individual Contributor 001772 Management Analyst MGM Individual Contributor 001775 Media & Communications Spclst MGM Individual Contributor 021022 OPS Accountability Analyst MCS Individual Contributor 021021 OPS Accountability Spec MCS Individual Contributor 001780 Organizational Dev Spclst MGM Individual Contributor 001791 Principal Accountant MGM Individual Contributor 001828 Principal Applications Develpr MGM Individual Contributor 020041 Principal Budget Analyst EXM Individual Contributor 001872 Principal Management Analyst MGM Individual Contributor 020033 Principal Mngmnt Analyst Rep20 EXM Individual Contributor 001795 Principal Planner MGM Individual Contributor 001796 Principal Systems Engineer MGM Individual Contributor 001799 Program Specialist MGM Individual Contributor 001805 Recreation General Supervisor MGM Individual Contributor 001812 Senior Applications Developer MGM Individual Contributor 001813 Senior Architect MGM Individual Contributor 001814 Senior Debt Analyst MGM Individual Contributor 001816 Senior Development Project Mgr MGM Individual Contributor 001817 Senior Engineer MGM Individual Contributor 001818 Senior Investment Officer MGM Individual Contributor 001819 Senior Landscape Architect MGM Individual Contributor 001820 Senior Management Analyst MGM Individual Contributor 001821 Senior Personnel Analyst MGM Individual Contributor 001822 Senior Planner MGM Individual Contributor 001823 Senior Systems Engineer MGM Individual Contributor 021005 Special Assistant to the Mayor MCS Individual Contributor 020035 Special Projects Manager EXM Individual Contributor
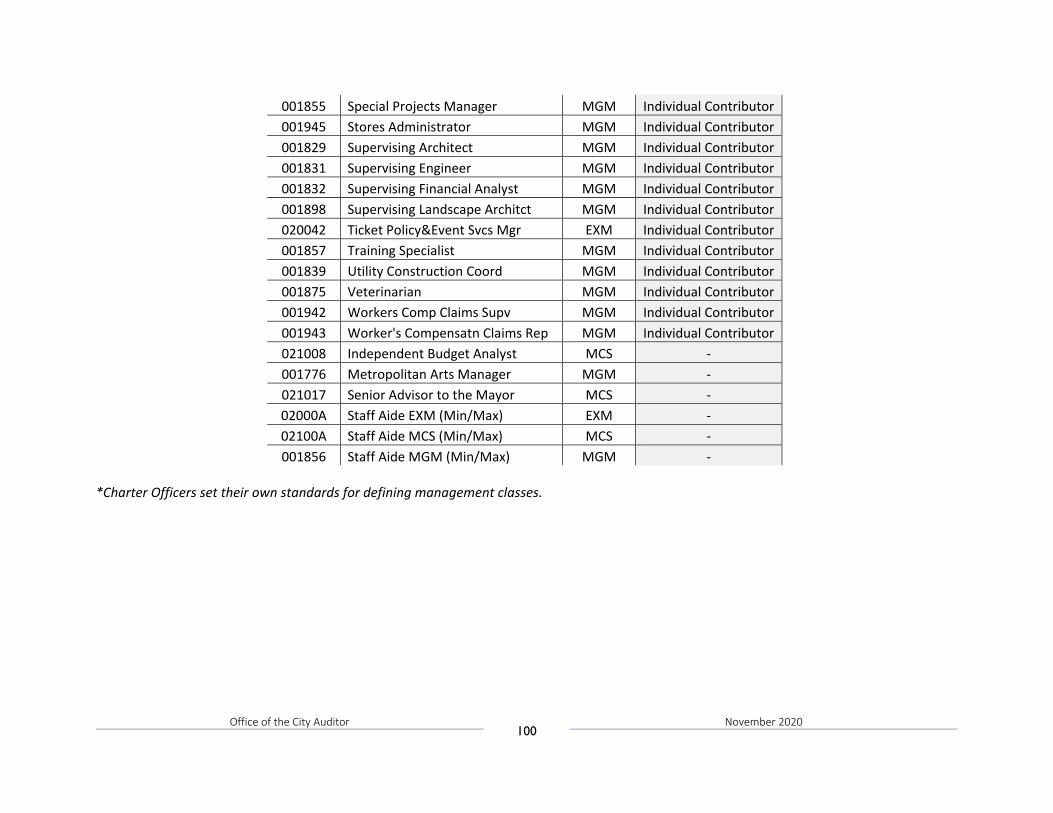
Office of the City Auditor 100
November 2020
001855 Special Projects Manager MGM Individual Contributor 001945 Stores Administrator MGM Individual Contributor 001829 Supervising Architect MGM Individual Contributor 001831 Supervising Engineer MGM Individual Contributor 001832 Supervising Financial Analyst MGM Individual Contributor 001898 Supervising Landscape Architct MGM Individual Contributor 020042 Ticket Policy&Event Svcs Mgr EXM Individual Contributor 001857 Training Specialist MGM Individual Contributor 001839 Utility Construction Coord MGM Individual Contributor 001875 Veterinarian MGM Individual Contributor 001942 Workers Comp Claims Supv MGM Individual Contributor 001943 Worker's Compensatn Claims Rep MGM Individual Contributor 021008 Independent Budget Analyst MCS - 001776 Metropolitan Arts Manager MGM - 021017 Senior Advisor to the Mayor MCS - 02000A Staff Aide EXM (Min/Max) EXM - 02100A Staff Aide MCS (Min/Max) MCS - 001856 Staff Aide MGM (Min/Max) MGM -
*Charter Officers set their own standards for defining management classes.
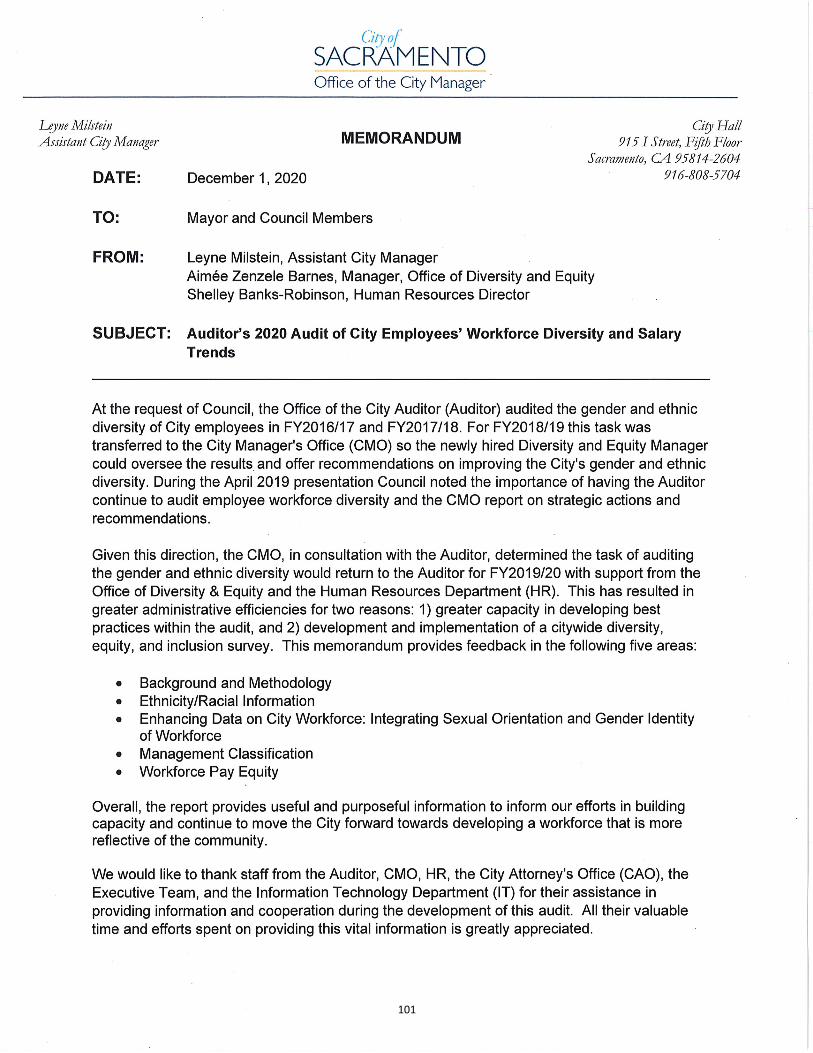
101
102
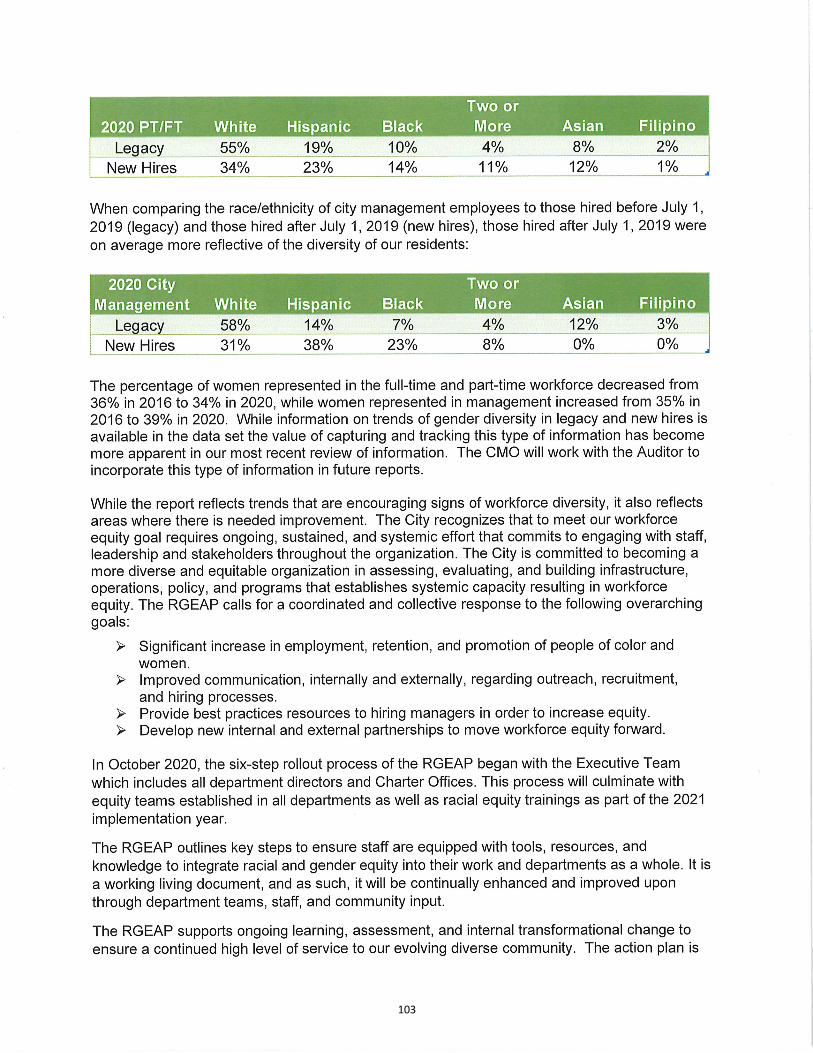
103
104
105
106
107