Embed Size (px)
Citation preview
ARIZONA MOTOR VEHICLE CRASH FACTS
2020


2020 Arizona Crash Facts Summary
2020 Arizona Crash Facts Summary Page i
Intentionally left blank
2020 Motor Vehicle Crash Facts for the State of Arizona
Prepared by:
The Arizona Department of Transportation Transportation Systems Management and Operations
Publication Date: July 27, 2021
This publication is an annual statistical review of the motor vehicle crashes in the State of Arizona for the calendar year 2020. The results are compiled from Arizona Traffic Crash Reports submitted to the Arizona Department of Transportation by state, county, city, tribal, and other law enforcement agencies. Specific inquiries regarding the data in this report should be directed to:
The Arizona Department of Transportation Transportation Systems Management and Operations
Traffic Safety Section 1615 West Jackson Street
Phoenix, AZ 85007
E-mail: [email protected]
In order to provide the most current information, preliminary data is utilized when necessary. For this reason, previous or future reports may differ slightly and we encourage you to refer to the latest issue of Motor Vehicle Crash Facts.
This issue as well as previous issues of this publication may be viewed and downloaded from the ADOT Web Site: 1H1Hwww.azdot.gov/crashfacts
2020 Arizona Crash Facts Summary
Page ii 2020 Arizona Crash Facts Summary
Douglas A. Ducey Governor
Arizona Department of Transportation
John S. Halikowski Director
State Transportation Board
Steve Stratton – District 4 Chairman
Jesse Thompson – District 5 Vice Chairman
Members Jackie Meck – District 1 Jenn Daniels – District 1 Ted Maxwell – District 2
Richard Searle – District 3Gary Knight – District 6
2020 Arizona Crash Facts Summary
2020 Arizona Crash Facts Summary Page iii
OVERVIEW
Section 1: – Highlights and Historical Trends .......................................................................................... 1
Section 2: – Geographic Location ............................................................................................................... 9
Section 3: – Crash Descriptions ................................................................................................................ 17
Section 4: – Safety Devices ........................................................................................................................ 23
Section 5: – Motor Vehicle and Driver Descriptions .............................................................................. 26
Section 6: – Alcohol Related Crashes ....................................................................................................... 33
Section 7: – Pedestrian and Pedalcyclist Crashes ................................................................................... 42
Section 8: – Motorcycle (MC) Crashes .................................................................................................... 48
Acknowledgements .................................................................................................................................... 58

2020 Arizona Crash Facts Summary
Page iv 2020 Arizona Crash Facts Summary
Table of Contents
Section 1: Highlights and Historical Trends………………………………………...............................................................................1 Arizona Crash Facts Summary and Comparison.........................................................................................................................................2 Arizona at a Glance – 2020………………………………………………………………………………………………………………..2 Licensed Drivers, Motor Vehicle Registration and Crash History in Arizona……………………………………………………………3 Historical Trends – VMT and Rates.……………..……………………………………………………………………………………….3 Statewide Economic Loss Due to Motor Vehicle Crashes………………………………………………………………………………..4 State Adjusted Crash Costs……………………………………………………………………………………………………..................4 Traffic Crashes in Arizona by Year………………………………………………………………………………………….....................5 Victims of Motor Vehicle Crashes…………………………………………………………………………………………......................6 Suspected Serious Injuries by Person Type 2016-2020….…….………………………………………………………………………….6 Young Drivers (age 15-24) killed in crashes 2016-2020.……....…………………………………………………………………………6 State Highway System (SHS) vs Local Road Fatalities………………..………………………………………........................................7 Arizona Fatality Rate vs. Injury Rate….………………………………………………………………………….....................................7 Traffic Fatalities by Geographic Region…………………………………………………………………………………………………..7 Traffic Injuries by Geographic Region……………………………………………………………………………………………………7 Holiday Crash Statistics………………………………………………………………………………………….......................................8 Section 2: Geographic Location………………………………………………………………………………………………………....9 Crash Severity by First Harmful Event Statewide……………………………………………………………………………………….10 Crashes by County……………………………………………………………………………………………………………………….10 Crash Severity by First Harmful Event in Urban Areas…………………………………………………………………………………11 Crash Severity by First Harmful Event in Rural Areas………………………………………………………………………………….11 Analysis by Jurisdiction………………………………………………………………………………………………………………….12 Total Fatalities by County for 2019 and 2020…………………………………………………………………………………...............15 Urban and Rural Crashes by Day of Week……………………………………………………………………………………................16 Urban and Rural Fatal Crashes by Day of Week………………………………………………………………………………………...16 All Urban and Rural Crashes vs. Urban and Rural Fatal Crashes by Month…………………………………………………………….16 Section 3: Crash Descriptions……………………………………….....................................................................................................17 Manner of Collision in Multi-Vehicle Crashes…………………………………………………………………………………………..18 Lighting Conditions……………………………………………………………………………………………………………………...18 Weather Conditions……………………………………………………………………………………………………………………...18 Road Surface Conditions……………………………………………………………………………………………...............................19 Roadway Grade…………………………………………………………………………………………………………………………..19 Roadway Alignment……………………………………………………………………………………………………………………..19 All Crashes vs. Fatal Crashes by Time of Day - Weekdays……………………………………………………………………………..20 All Crashes vs. Fatal Crashes by Time of Day - Weekends……………………………………………………………………………..20 Crashes by Day of Week…………………………………………………………………………………………………………………21 Fatal Crashes by Day of Week…………………………………………………………………………………………………………...21 All Crashes vs. Fatal Crashes by Month…………………………………………………………………………………………………21 Crashes by Hour and Day of Week………………………………………………………………………………………………………22 Section 4: Safety Devices……………………………………….............................................................................................................23 Child Safety Device Usage (less than five years old)………………………...………………………………………………………….24 Driver Safety Device Usage……………………………………………………………………………………………………………...24 Passenger Safety Device Usage………………………………………………………………………………………………………….24 Driver Safety Device Usage by Gender………………………………………………………………………………………………….25 Driver Safety Device Usage by Age……………………………………………………………………………………………………..25 Section 5: Motor Vehicle and Driver Descriptions………………………………………...................................................................26 Arizona Motor Vehicle Registrations……………………………………………………………………………………….…………...27 Motor Vehicle Crash Involvement by Vehicle Type…………………………………………………………………………………….27 Hit and Run Drivers Involved in Crashes………………………………………………………………………………………………..28

2020 Arizona Crash Facts Summary
2020 Arizona Crash Facts Summary Page v
Gender of Drivers Involved in Crashes………………………………………………………………………………………………….28 License Status of Drivers Involved in Crashes…………………………………………………………………………………………..28 Passengers Killed and Injured by Age and Gender……………………………………………………………………………………...28 Drivers and Passengers Killed and Injured by Vehicle Type……………………………………………………………………………29 Drivers Killed and Injured by Age and Gender………………………………………………………………………………………….29 Licensed Drivers in Arizona by Age…………………………………………………………………………………………………….30 Driver Involvement by Age……………………………………………………………………………………………………………...30 Driver Violations………………………………………………………………………………………………………………………...31 Driver Physical Condition………………………………………………………………………………………………………………..31 Distracted Driving Behavior……………………………………………………………………………………………………………..32 Secondary Crashes……………………………………………………………………………………………………………………….32 Section 6: Alcohol Related Crashes………………………………………............................................................................................33 Economic Loss Due to Alcohol Related Crashes in Arizona for 2020…………………………………………………………………..34 Alcohol Related Crash History…………………………………………………………………………………………………………..34 Manner of Collision in Alcohol Related Crashes………………………………………………………………………………………..34 Alcohol Related Crashes by First Harmful Event………………………………………….…………………………………………….35 Alcohol Related Crashes by Vehicle Type………………………………………………………………………………………………35 Lighting Conditions in Alcohol Related Crashes………………………………………………………………………………………..36 Road Surface Conditions in Alcohol Related Crashes…………………………………………………………………………………..36 Gender of Drivers Involved in Alcohol Related Crashes………………………………………………………………………………..36 Driver Involvement by Age in Alcohol Related Crashes………………………………………………………………………………..37 When Alcohol Related Crashes Occurred in 2020………………………………………………………………………………………37 Safety Device Usage for Drinking Drivers………………………………………………………………………………………………37 Persons Killed and Injured in Alcohol Related Crashes…………………………………………………………………………………38 Alcohol Related Crashes by County……………………………………………………………………………………………………..38 All Alcohol Related Crashes vs. Fatal Alcohol Related Crashes by Day of Week……………………………………………………...39 All Alcohol Related Crashes vs. Fatal Alcohol Related Crashes by Month……………………………………………………………..39 All Alcohol Related Crashes vs. Fatal Alcohol Related Crashes - Weekdays…………………………………………………………..40 All Alcohol Related Crashes vs. Fatal Alcohol Related Crashes - Weekends…………………………………………………………..40 Alcohol Related Crashes by Hour and Day of Week……………………………………………………………………………………41 Section 7: Pedestrian and Pedalcyclist Crashes………………………………………........................................................................42 Pedestrians Killed and Injured By Age and Gender……………………………………………………………………………………..43 Pedestrian Crashes by Geographic Location…………………………………………………………………………………………….43 Pedestrian Crash History………………………………………………………………………………………………………………....43 Pedestrians Killed by Age and Action…………………………………………………………………………………………………...44 Pedestrians Injured by Age and Action………………………………………………………………………………………………….44 Pedestrian Physical Condition in Motor Vehicle Crashes……………………………………………………………………………….44 Lighting Conditions in Pedestrian Crashes………………………………………………………………………………………………45 Weather Conditions in Pedestrian Crashes………………………………………………………………………………………………45 Pedalcyclists Killed and Injured by Age and Gender……………………………………………………………………………….…...45 Pedalcycle Crashes by Geographic Location…………………………………………………………………………………………….46 Pedalcycle Crash History………………………………………………………………………………………………………………...46 Lighting Conditions in Pedalcyclist Crashes………………………………………………………………………………………….....46 Weather Conditions in Pedalcyclist Crashes…………………………………………………………………………………………….46 Pedestrian Crashes by County…………………………………………………………………………………………………………...47 Pedalcyclist Crashes by County………………………………………………………………………………………………………….47 Section 8: Motorcycle (MC) Crashes……………………………………….........................................................................................48 MC Fatalities by Year……………………………………………………………………………………………………………………49 MC Registrations in Arizona…………………………………………………………………………………………………………….49 Fatality Rate per Registered MC…………………………………………………………………………………………………………49 Percent of MC Crashes to All Crashes…………………………………………………………………………………………………..49 MC Crashes by First Harmful Event…………………………………………………………………………………………………….50 Lighting Conditions in MC Crashes……………………………………………………………………………………………………..50 Road Surface Conditions in MC Crashes………………………………………………………………………………………………..50 MC Crashes by Geographic Location……………………………………………………………………………………………………51

2020 Arizona Crash Facts Summary
Page vi 2020 Arizona Crash Facts Summary
Operator Involvement by Age in MC Crashes…………………………………………………………………………………………..51 MC Operator Physical Condition………………………………………………………………………………………………………...51 Helmet Use by Gender……………………………………..…………………………………………………………………………….52 MC Operator’s Helmet Use……………………………………………………………………………………………………………...52 MC Passenger’s Helmet Use…………………………………………………………………………………………………………….52 MC Operators and Passengers Killed and Injured……………………………………………………………………………………….53 MC Operator Violations.………………………………………………………………………………………………………………...53 All MC Crashes vs. Fatal MC Crashes by Time of Day - Weekdays……………………………………………………………………54 All MC Crashes vs. Fatal MC Crashes by Time of Day - Weekends……………………………………………………………………54 All MC Crashes vs. Fatal MC Crashes by Day of Week………………………………………………………………………………...55 Alcohol Related MC Crashes vs. Fatal Alcohol Related MC Crashes by Day of Week………………………………………………...55 MC Crashes by Hour and Day of Week…………………………………………………………………………………………………56 MC Crashes by County……………………………………………………………………………………..............................................57 Manner of Collision in MC Crashes ……………………………………………………………………………………………………..57 Acknowledgements………………………………………......................................................................................................................58

2020 Arizona Crash Facts Summary
2020 Arizona Crash Facts Summary Page vii
BREAKDOWN OF ALL CRASHES IN ARIZONATOTAL 98,778FATAL 970INJURY 28,610
PROPERTY DAMAGE ONLY 69,198URBAN 85,244RURAL 13,534
ALCOHOL RELATED 4,506PEDESTRIAN 1,523PEDALCYCLE 830
MOTORCYCLE 2,317SINGLE VEHICLE 17,766MULTI-VEHICLE 81,012
BREAKDOWN OF FATAL CRASHES IN ARIZONATOTAL 970
ALCOHOL RELATED 163URBAN 587RURAL 383
SINGLE VEHICLE 314MULTI-VEHICLE 656
ALCOHOL RELATED SINGLE VEHICLE 46ALCOHOL RELATED MULTI-VEHICLE 117
BREAKDOWN OF PERSONS KILLED AND INJUREDTYPE KILLED INJURED
IN ALL CRASHES 1,057 41,350IN ALCOHOL RELATED CRASHES 181 2,863
IN URBAN CRASHES 624 35,155IN RURAL CRASHES 433 6,195
IN SPEED RELATED CRASHES* 337 15,839IN LANE DEPARTURE CRASHES 648 13,212
IN CRASHES ON THE STATE HIGHWAY SYSTEM 388 13,411IN CRASHES ON LOCAL ROADS 669 27,939
USING SAFETY DEVICE 287 33,239NOT USING SAFETY DEVICE 313 2,607
DRIVERS AGE 24 OR YOUNGER 97 6,570DRINKING DRIVERS AGE 24 OR YOUNGER 11 317
BREAKDOWN OF CRASHES BY TIMEPEAK MONTH FOR ALL CRASHES JANUARY
PEAK DAY FOR ALL CRASHES FRIDAYPEAK HOUR FOR ALL CRASHES 4 PM - 5 PM
PEAK MONTH FOR FATAL CRASHES FEBRUARY AND SEPTEMBER PEAK DAY FOR FATAL CRASHES SATURDAY
PEAK HOUR FOR FATAL CRASHES 7 PM - 8 PM AND 9 PM - 10 PMPEAK DATE FOR ALL CRASHES IN 2020 FRIDAY FEBRUARY 14TH (502 CRASHES)
PEAK DATE FOR FATAL CRASHES IN 2020 5 DAYS TIED WITH 7 CRASHES (2/21, 9/19, 10/28, 11/3, 12/13)PEAK HOUR FOR MOTORCYCLE CRASHES 5 PM - 6 PM
PEAK HOUR FOR ALCOHOL RELATED CRASHES 6 PM - 7 PMPEAK HOUR FOR PEDESTRIAN CRASHES 7 PM - 8 PMPEAK HOUR FOR PEDALCYCLE CRASHES 4 PM - 5 PM
*Note: These numbers represent the total number of fatalities and injuries in crashes where the violation "speed too fast for conditions" or "exceeded lawful speed" was marked on the crash report.
2020 Arizona Crash Facts Summary
Page viii 2020 Arizona Crash Facts Summary
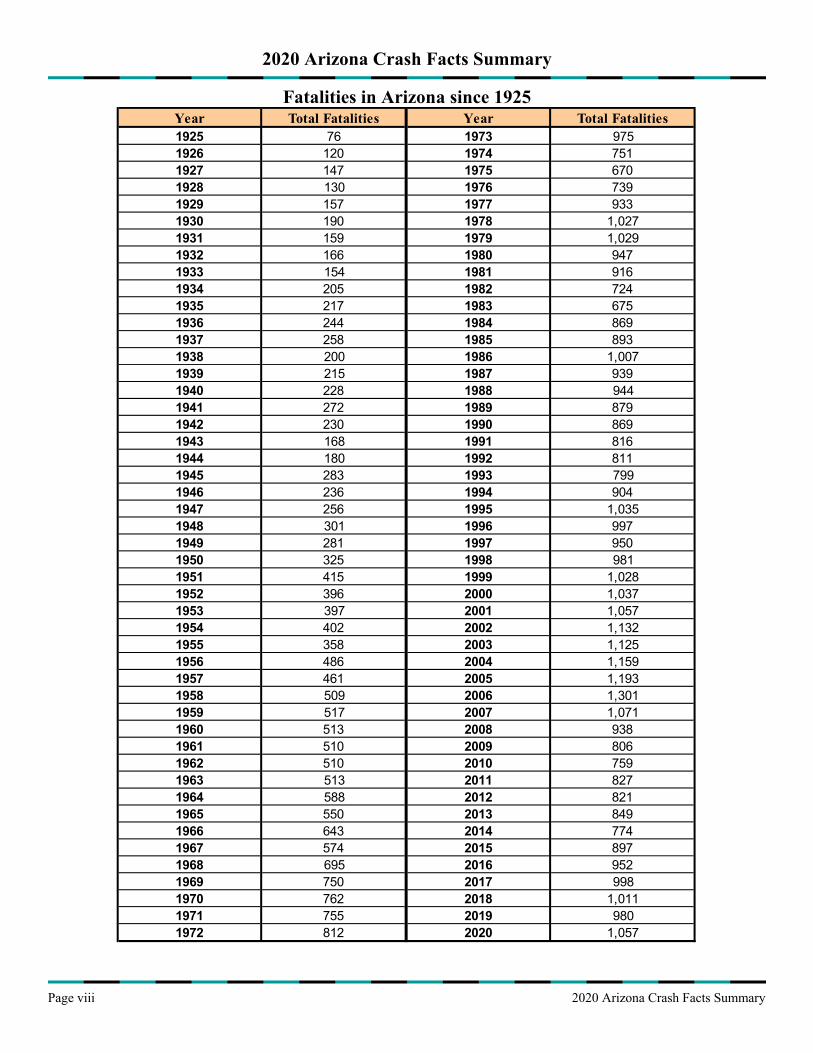
Fatalities in Arizona since 1925
Year Total Fatalities Year Total Fatalities1925 76 1973 9751926 120 1974 7511927 147 1975 6701928 130 1976 7391929 157 1977 9331930 190 1978 1,0271931 159 1979 1,0291932 166 1980 9471933 154 1981 9161934 205 1982 7241935 217 1983 6751936 244 1984 8691937 258 1985 8931938 200 1986 1,0071939 215 1987 9391940 228 1988 9441941 272 1989 8791942 230 1990 8691943 168 1991 8161944 180 1992 8111945 283 1993 7991946 236 1994 9041947 256 1995 1,0351948 301 1996 9971949 281 1997 9501950 325 1998 9811951 415 1999 1,0281952 396 2000 1,0371953 397 2001 1,0571954 402 2002 1,1321955 358 2003 1,1251956 486 2004 1,1591957 461 2005 1,1931958 509 2006 1,3011959 517 2007 1,0711960 513 2008 9381961 510 2009 8061962 510 2010 7591963 513 2011 8271964 588 2012 8211965 550 2013 8491966 643 2014 7741967 574 2015 8971968 695 2016 9521969 750 2017 9981970 762 2018 1,0111971 755 2019 9801972 812 2020 1,057

Section 1 Highlights and Historical Trends
Page 1 – 2020 Arizona Crash Facts Summary
Total Crashes98,778
100.00%
Fatal Crashes
Injury Crashes
Property Damage Only Crashes
970 28,610 69,1980.98% 28.96% 70.05%
Killed Injured1,057 41,350
Possible Injuries
Suspected Minor Injuries
Suspected Serious Injuries
21,887 16,383 3,08052.93% 39.62% 7.45%
Drivers Passengers Pedestrians Pedalcyclists33
57.33% 17.31% 22.23% 3.12%235606 183

Section 1: – Highlights and Historical Trends
Page 2 – 2020 Arizona Crash Facts Summary
Table 1 – 1 Arizona Crash Facts Summary and Comparison
Arizona at a Glance – 2020 • Approximately 2.89 persons were killed each day.
• One person was killed every 8 hours and 17 minutes.
• There were 113 persons injured every day.
• One person was injured every 12 minutes and 45 seconds.
• Alcohol Related crashes accounted for 4.56% of all crashes and 16.80% of all fatal crashes.
• Of all alcohol related crashes, 82.65% occurred in Urban areas and 17.35% occurred in Rural areas, while 68.71% of all alcohol related fatal crashes occurred in Urban areas and 31.29% occurred in Rural areas.
• Single vehicle crashes accounted for 17.99% of all crashes and 32.37% of all fatal crashes.
• Of all Pedestrian crashes, 15.23% were fatal while 3.98% of Pedalcycle crashes were fatal.
• Crashes which occurred during daylight hours (6:00 a.m. to 6:00 p.m.) accounted for 70.0% of all crashes.
• Motor vehicle crashes resulted in $17.193 billion in economic losses to Arizona.
• Children age 14 and younger accounted for 41 fatalities and 2,104 injuries in motor vehicle crashes.
Category 2019 2020 Percent Change
Total Crashes 130,366 98,778 -24.23%Total Fatalities 980 1,057 7.86%Total Injuries 54,080 41,350 -23.54%Alcohol Related Fatalities 258 181 -29.84%Alcohol Related Injuries 2,999 2,863 -4.53%Urban Fatalities 583 624 7.03%Urban Injuries 47,000 35,155 -25.20%Rural Fatalities 397 433 9.07%Rural Injuries 7,080 6,195 -12.50%MC Operator and Passenger Fatalities 170 160 -5.88%MC Operator and Passenger Injuries 2,250 1,921 -14.62%Pedestrians Fatalities 218 235 7.80%Pedestrians Injuries 1,716 1,351 -21.27%Pedalcyclist Fatalities 30 33 10.00%Pedalcyclist Injuries 1,262 812 -35.66%Millions of vehicle miles traveled (VMT) 70,281 65,574 -6.70%Fatalities per 100 million VMT 1.39 1.61 15.60%Injuries per 100 million VMT 76.95 63.06 -18.05%

Section 1: – Highlights and Historical Trends
Page 3 – 2020 Arizona Crash Facts Summary
Table 1 – 2 Licensed Drivers, Motor Vehicle Registration
and Crash History in Arizona
Table 1 – 3 Historical Trends – VMT and Rates
Calendar Year
Total Crashes
Fatal Crashes
Injury Crashes
Property Damage Only
Crashes
Total Persons Killed
Total Persons Injured
Total Licensed Drivers
Total Registered Vehicles
2006 143,504 1,126 45,395 96,983 1,301 70,013 4,091,789 4,748,957
2007 141,193 952 43,560 96,681 1,071 66,062 4,212,393 4,848,162
2008 120,557 843 37,515 82,199 938 56,539 4,360,711 4,842,188
2009 107,149 709 33,506 72,934 806 50,809 4,434,719 4,787,350
2010 106,900 695 33,419 72,786 759 50,463 4,537,653 4,805,904
2011 103,958 756 33,223 69,979 827 49,856 4,634,405 4,855,014
2012 103,940 738 33,595 69,607 821 50,089 4,736,517 4,969,620
2013 107,576 782 34,137 72,657 849 50,440 4,826,903 5,130,780
2014 109,883 709 34,589 74,585 774 51,114 4,922,676 5,300,980
2015 117,121 811 36,371 79,939 897 53,922 5,025,811 5,487,058
2016 127,345 856 38,776 87,713 952 57,003 5,135,262 5,677,208
2017 127,858 917 38,103 88,838 998 55,938 5,221,403 5,843,368
2018 127,747 918 36,710 90,119 1,011 53,679 5,308,307 6,009,850
2019 130,366 909 37,103 92,354 980 54,080 5,375,341 6,167,481
2020 98,778 970 28,610 69,198 1,057 41,350 5,772,928 6,356,220
CalendarYear
Arizona Fatality
Rate
Arizona Injury Rate
Arizona Traffic
Fatalities
Estimated Motor Vehicle Miles
Traveled
Arizona Fatal Crash Rate
2016 1.45 86.89 952 65,606 1.30
2017 1.53 85.97 998 65,069 1.41
2018 1.53 81.15 1,011 66,145 1.39
2019 1.39 76.95 980 70,281 1.29
2020 1.61 63.06 1,057 65,574 1.48
Vehicle miles traveled are shown in million miles and rates per 100 million miles

Section 1: – Highlights and Historical Trends
Page 4 – 2020 Arizona Crash Facts Summary
Statewide Economic Loss Due to Motor Vehicle Crashes
Table 1 – 4
Table 1 – 5 State Adjusted Crash Costs
Source: www.safety.fhwa.dot.gov/hsip/docs/fhwasa17071.pdf
Fatalities $10,057,747,147Suspected Serious Injuries $1,695,536,920Suspected Minor Injuries $2,443,229,556Possible Injuries $2,257,534,615Property Damage Only $739,034,640
$17,193,082,878TOTAL
Estimated Economic Loss by CountyCost of Traffic Crashes
Fatalities Injuries PDO TotalApache 228,368,904$ 36,942,187$ $ 2,467,080 267,778,171$ Cochise 237,884,275$ 72,234,969$ 6,632,280$ 316,751,524$ Coconino 409,160,953$ 169,203,551$ 18,711,360$ 597,075,864$ Gila 218,853,533$ 87,695,516$ 6,258,480$ 312,807,529$ Graham 142,730,565$ 30,505,950$ 2,338,920$ 175,575,435$ Greenlee $ 0 5,722,703$ 523,320$ 6,246,023$ La Paz 161,761,307$ 34,992,258$ 2,445,720$ 199,199,285$ Maricopa 4,681,562,532$ 4,230,621,476$ 546,324,720$ 9,458,508,728$ Mohave 532,860,776$ 229,270,174$ 19,565,760$ 781,696,710$ Navajo 361,584,098$ 81,249,831$ 8,704,200$ 451,538,129$ Pima 1,541,490,102$ 672,747,389$ 60,342,000$ 2,274,579,491$ Pinal 570,922,260$ 281,309,447$ 24,179,520$ 876,411,227$ Santa Cruz 66,607,597$ 10,149,247$ 1,783,560$ 78,540,404$ Yavapai 608,983,744$ 279,750,607$ 24,179,520$ 912,913,871$ Yuma 294,976,501$ 173,905,786$ 14,578,200$ 483,460,487$
TOTALS 10,057,747,147$ 6,396,301,091$ 739,034,640$ 17,193,082,878$
County
1. Fatality $9,515,371
2. Suspected Serious Injury $550,499
3. Suspected Minor Injury $149,132
4. Possible Injury $103,145
5. Property Damage Only $10,680

Section 1: – Highlights and Historical Trends
Page 5 – 2020 Arizona Crash Facts Summary
Traffic Crashes in Arizona by Year Chart 1 – 1 Chart 1 – 2
Total Crashes Fatal Crashes
98,778
127,747
130,366127,858
127,345
97,000
102,000
107,000
112,000
117,000
122,000
127,000
132,000
2016 2017 2018 2019 2020
970
918
909917
856
850
900
950
2016 2017 2018 2019 2020
Chart 1 – 3 Chart 1 – 4 Injury Crashes Property Damage Only Crashes
28,610
36,710
37,103
38,10338,776
27,000
29,000
31,000
33,000
35,000
37,000
39,000
2016 2017 2018 2019 2020
69,198
90,11992,354
88,838
87,713
68,500
72,500
76,500
80,500
84,500
88,500
92,500
2016 2017 2018 2019 2020
Section 1: – Highlights and Historical Trends
Page 6 – 2020 Arizona Crash Facts Summary
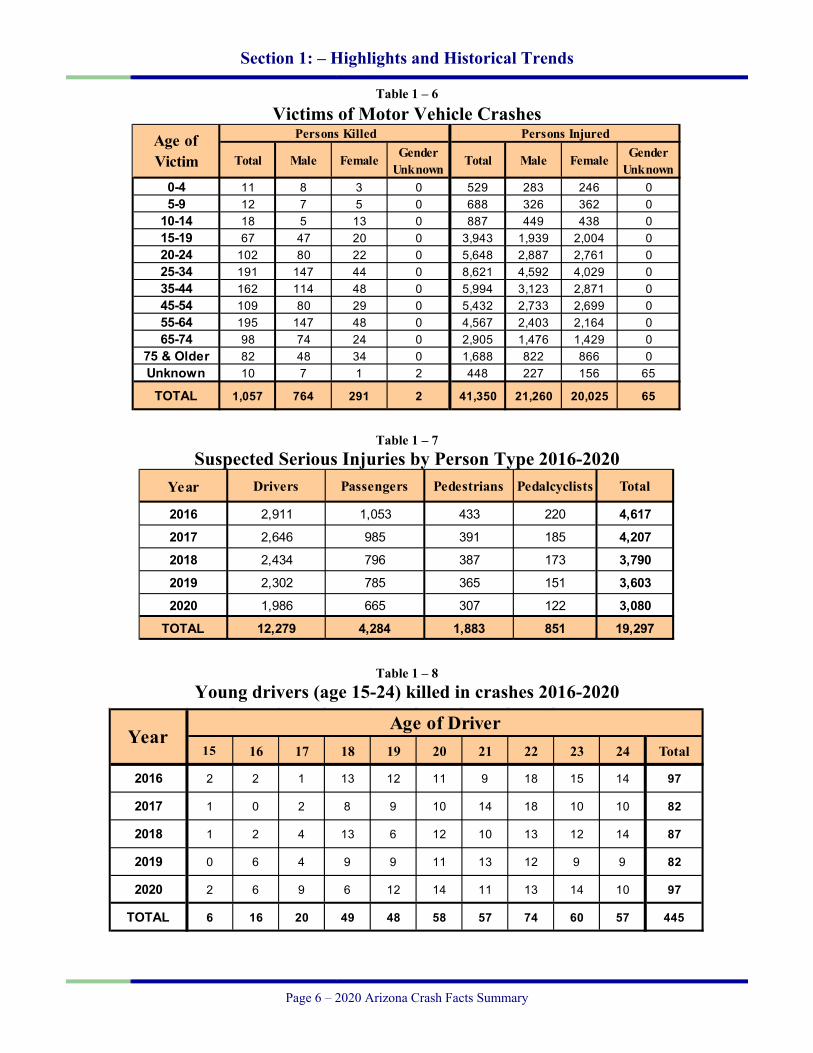
Table 1 – 6 Victims of Motor Vehicle Crashes
Table 1 – 7 Suspected Serious Injuries by Person Type 2016-2020
Table 1 – 8 Young drivers (age 15-24) killed in crashes 2016-2020
Persons Killed Persons Injured
Total Male Female Gender Unknown
Total Male Female Gender Unknown
0-4 11 8 3 0 529 283 246 05-9 12 7 5 0 688 326 362 0
10-14 18 5 13 0 887 449 438 015-19 67 47 20 0 3,943 1,939 2,004 020-24 102 80 22 0 5,648 2,887 2,761 025-34 191 147 44 0 8,621 4,592 4,029 035-44 162 114 48 0 5,994 3,123 2,871 045-54 109 80 29 0 5,432 2,733 2,699 055-64 195 147 48 0 4,567 2,403 2,164 065-74 98 74 24 0 2,905 1,476 1,429 0
75 & Older 82 48 34 0 1,688 822 866 0Unknown 10 7 1 2 448 227 156 65
TOTAL 1,057 764 291 2 41,350 21,260 20,025 65
Age ofVictim
Year Drivers Passengers Pedestrians Pedalcyclists Total
2016 2,911 1,053 433 220 4,6172017 2,646 985 391 185 4,2072018 2,434 796 387 173 3,7902019 2,302 785 365 151 3,6032020 1,986 665 307 122 3,080
TOTAL 12,279 4,284 1,883 851 19,297
15 16 17 18 19 20 21 22 23 24 Total
2016 2 2 1 13 12 11 9 18 15 14 97
2017 1 0 2 8 9 10 14 18 10 10 82
2018 1 2 4 13 6 12 10 13 12 14 87
2019 0 6 4 9 9 11 13 12 9 9 82
2020 2 6 9 6 12 14 11 13 14 10 97
TOTAL 6 16 20 49 48 58 57 74 60 57 445
YearAge of Driver

Section 1: – Highlights and Historical Trends
Page 7 – 2020 Arizona Crash Facts Summary
Chart 1 – 5 Chart 1 – 6 State Highway System (SHS) vs Local Road Fatalities Arizona Fatality Rate vs. Injury Rate
598 603
640
608
388371 372
395
354
669
300
400
500
600
700
2016 2017 2018 2019 2020
SHS Local
1.45
1.53 1.53
1.39
1.61
63.06
81.1576.95
85.9786.89
1.30
1.60
1.90
2.20
2016 2017 2018 2019 202035
45
55
65
75
85
95
Fatal Rate Injury Rate
Chart 1 – 7 Chart 1 – 8 Traffic Fatalities by Geographic Region Traffic Injuries by Geographic Region
355381
353
397
433
624658583617597
952
998 1,011980
1,057
250
350
450
550
650
750
850
950
1,050
1,150
2016 2017 2018 2019 2020
Urban Fatalities Rural Fatalities
6,00
9
5,77
1
5,71
5
7,08
0
6,19
535
,155
47,9
64
47,0
00
50,1
67
50,9
9457,003
55,93853,679 54,080
41,350
9,000
19,000
29,000
39,000
49,000
59,000
2016 2017 2018 2019 2020
Urban Injuries Rural Injuries

Section 1: – Highlights and Historical Trends
Page 8 – 2020 Arizona Crash Facts Summary
Table 1 – 9 Holiday Crash Statistics
Holidays such as Memorial Day, Labor Day, and Thanksgiving are regarded as three or four day weekend holidays for statistical purposes. Holidays such as Christmas, New Year’s Day, and the Fourth of July are celebrated on specific dates; which make the holiday period range from two to five days in length. Holiday fatality statistics are based on fatal crashes occurring from 6:00 p.m. on the last working day prior to the holiday through 5:59 a.m. the day following the holiday period. Example: Thanksgiving fatalities are counted from Wednesday evening at 6:00 p.m. through 5:59 a.m. of the following Monday.
2020 Holidays Beginning at 6:00 p.m.
Ending at 5:59 a.m.
Number of Days
Fatal Crashes
PersonsKilled
Alcohol Related Fatal Crashes
Alcohol Related Fatalities
Tuesday Thursday12/31/2019 1/2/2020
Friday Tuesday5/22/2020 5/26/2020Thursday Monday7/2/2020 7/6/2020
Friday Tuesday9/4/2020 9/8/2020
Wednesday Monday11/25/2020 11/30/2020Thursday Monday
12/24/2020 12/28/2020
Fatal Crashesby Year
New Year’s Day
Memorial Day July 4th Labor Day Thanksgiving Christmas Day Total
2016 6 7 13 7 11 4 48
2017 12 5 4 9 16 10 56
2018 10 7 5 8 8 10 48
2019 8 13 13 12 11 2 59
2020 2 11 9 10 12 10 54
Persons KilledNew Year’s
DayMemorial
Day July 4th Labor Day Thanksgiving Christmas Day Total
2016 6 7 15 8 11 6 53
2017 13 7 4 9 17 10 60
2018 10 8 5 9 8 11 51
2019 9 13 14 12 11 2 61
2020 2 11 9 10 12 14 58
Number of Days New Year’s Day
Memorial Day July 4th Labor Day Thanksgiving Christmas Day Total
2016 4 4 4 4 5 4 25
2017 4 4 2 4 5 4 23
2018 4 4 2 4 5 5 24
2019 5 4 5 4 5 2 25
2020 2 4 4 4 5 4 23
New Year’s Day
Memorial Day
2
4
2
4
2 2 2
11 11 4
1
Labor Day 4 10 10 2 2
4 9 9 1July 4th
4
Christmas Day 4 10 14 1 3
Thanksgiving Day 5 12 12 4

Section 2 Geographic Location
Page 9 – 2020 Arizona Crash Facts Summary
Fatal Crashes Killed
587624 Possible
Injuries
0.69% 59.04% 19,54455.59%
Injury Crashes
Suspected Minor Injuries
24,493 13,42628.73% 38.19%
UrbanCrashes
Suspected Serious Injuries
85,244 Property 2,185
86.30% Damage Only 6.22%
60,164
70.58%
Fatal Crashes
Killed
383433 Possible
Injuries2.83% 40.96% 2,343
37.82%
Injury Crashes
Suspected Minor Injuries
Rural 4,117 2,957Crashes 30.42% 47.73%13,534
13.70%Property
Suspected Serious Injuries
Damage Only 8959,034 14.45%
66.75%
98,778
100.00%
Total Crashes

Section 2: – Geographic Location
Page 10 – 2020 Arizona Crash Facts Summary
Fatal Crashes in Arizona (970) accounted for 0.98% of all crashes, Injury Crashes (28,610) accounted for 28.96%, and Property Damage Only (PDO) Crashes (69,198)
accounted for 70.05%.
Table 2 – 1 Crash Severity by First Harmful Event Statewide
Table 2 – 2 Crashes by County
Number of Crashes Number of Persons
Total Fatal Injury PDO Killed Injured
Collision with Motor Vehicle in Transport 71,602 370 20,374 50,858 424 31,314
Overturning 1,853 99 1,144 610 107 1,601
Collision with Pedestrian 1,414 212 1,202 0 214 1,274
Collision with Pedalcyclist 805 33 772 0 34 810
Collision with Animal 1,776 2 179 1,595 2 221
Collision with Fixed Object 12,321 194 3,564 8,563 214 4,349
Collision with Non-fixed Object* 5,894 20 674 5,200 22 828
Vehicle Fire or Explosion 362 0 12 350 0 14
Other Non-collision** 562 5 103 454 5 115
Unknown 2,189 35 586 1,568 35 824
TOTAL 98,778 970 28,610 69,198 1,057 41,350
First Harmful Event Type
*Includes Collision with Parked Vehicles, Trains, Railway Vehicles, and Work Zone Equipment
**Includes Vehicle Immersion, Jackknife, and Cargo Loss or Shift
Number of Persons
Total Fatal Injury PDO Killed InjuredApache 374 24 119 231 24 182Cochise 909 21 267 621 25 393Coconino 2,362 39 571 1,752 43 856Gila 914 21 307 586 23 463Graham 323 10 94 219 15 147Greenlee 69 0 20 49 0 31La Paz 343 16 98 229 17 165Maricopa 71,611 460 19,997 51,154 492 28,855Mohave 2,698 51 815 1,832 56 1,211Navajo 1,162 31 316 815 38 453Pima 8,841 150 3,041 5,650 162 4,267Pinal 3,448 57 1,127 2,264 60 1,642Santa Cruz 209 5 37 167 7 56Yavapai 3,352 55 1,033 2,264 64 1,514Yuma 2,163 30 768 1,365 31 1,115
TOTAL 98,778 970 28,610 69,198 1,057 41,350
CountyNumber of Crashes
Section 2: – Geographic Location
Page 11 – 2020 Arizona Crash Facts Summary
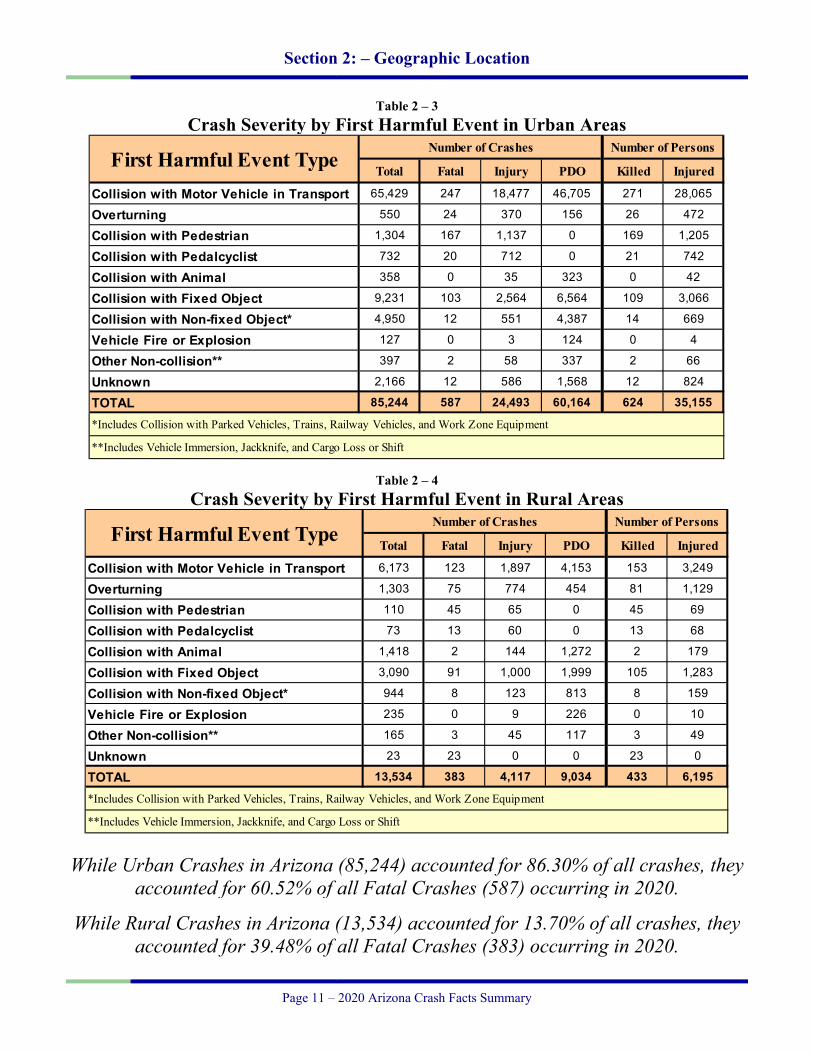
Table 2 – 3
Crash Severity by First Harmful Event in Urban Areas
Table 2 – 4 Crash Severity by First Harmful Event in Rural Areas
While Urban Crashes in Arizona (85,244) accounted for 86.30% of all crashes, they accounted for 60.52% of all Fatal Crashes (587) occurring in 2020.
While Rural Crashes in Arizona (13,534) accounted for 13.70% of all crashes, they accounted for 39.48% of all Fatal Crashes (383) occurring in 2020.
Number of Crashes Number of Persons
Total Fatal Injury PDO Killed Injured
Collision with Motor Vehicle in Transport 65,429 247 18,477 46,705 271 28,065
Overturning 550 24 370 156 26 472
Collision with Pedestrian 1,304 167 1,137 0 169 1,205
Collision with Pedalcyclist 732 20 712 0 21 742
Collision with Animal 358 0 35 323 0 42
Collision with Fixed Object 9,231 103 2,564 6,564 109 3,066
Collision with Non-fixed Object* 4,950 12 551 4,387 14 669
Vehicle Fire or Explosion 127 0 3 124 0 4
Other Non-collision** 397 2 58 337 2 66
Unknown 2,166 12 586 1,568 12 824
TOTAL 85,244 587 24,493 60,164 624 35,155
First Harmful Event Type
*Includes Collision with Parked Vehicles, Trains, Railway Vehicles, and Work Zone Equipment
**Includes Vehicle Immersion, Jackknife, and Cargo Loss or Shift
Number of Crashes Number of Persons
Total Fatal Injury PDO Killed Injured
Collision with Motor Vehicle in Transport 6,173 123 1,897 4,153 153 3,249
Overturning 1,303 75 774 454 81 1,129
Collision with Pedestrian 110 45 65 0 45 69
Collision with Pedalcyclist 73 13 60 0 13 68
Collision with Animal 1,418 2 144 1,272 2 179
Collision with Fixed Object 3,090 91 1,000 1,999 105 1,283
Collision with Non-fixed Object* 944 8 123 813 8 159
Vehicle Fire or Explosion 235 0 9 226 0 10
Other Non-collision** 165 3 45 117 3 49
Unknown 23 23 0 0 23 0
TOTAL 13,534 383 4,117 9,034 433 6,195
First Harmful Event Type
*Includes Collision with Parked Vehicles, Trains, Railway Vehicles, and Work Zone Equipment
**Includes Vehicle Immersion, Jackknife, and Cargo Loss or Shift

Section 2: – Geographic Location
Page 12 – 2020 Arizona Crash Facts Summary
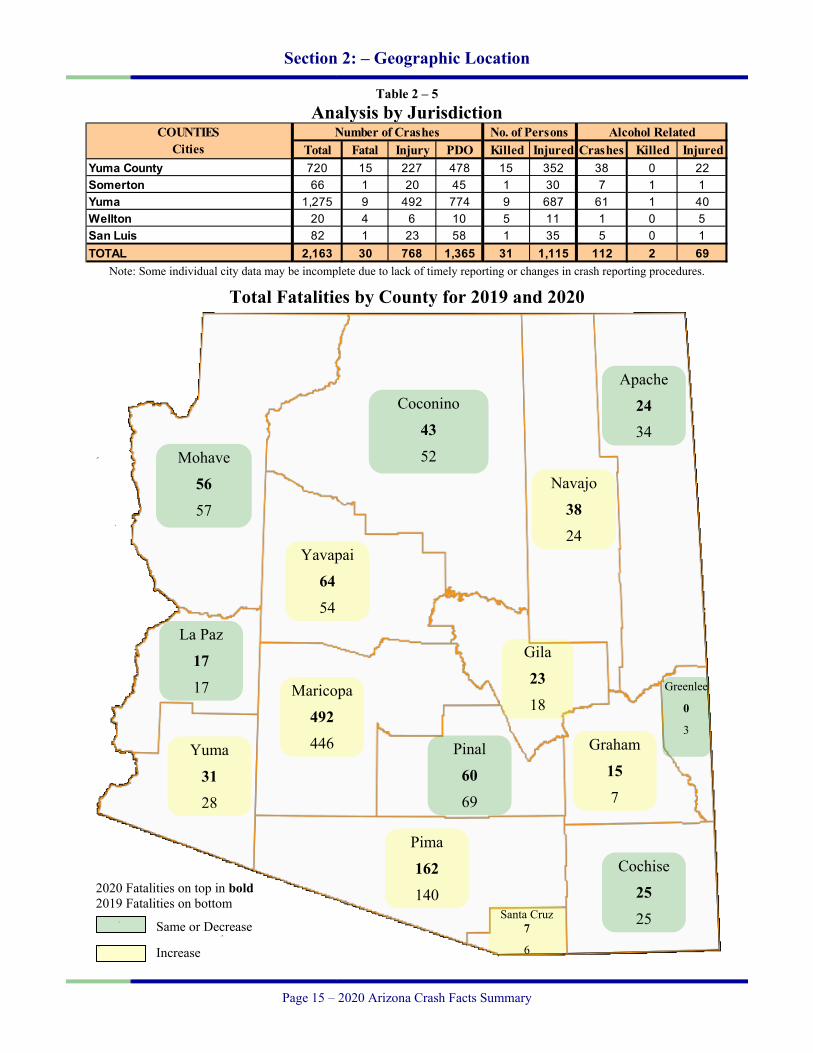
Table 2 – 5 Analysis by Jurisdiction
No. of Persons Alcohol RelatedTotal Fatal Injury PDO Killed Injured Crashes Killed Injured
Apache County 330 24 106 200 24 166 25 3 27Eagar 16 0 5 11 0 8 1 0 1Springerville 7 0 3 4 0 3 2 0 0St. Johns 21 0 5 16 0 5 2 0 1TOTAL 374 24 119 231 24 182 30 3 29
Cochise County 471 17 126 328 21 203 9 2 5Benson 69 1 17 51 1 26 3 0 1Bisbee 6 1 2 3 1 2 0 0 0Douglas 41 0 15 26 0 19 2 0 1Huachuca City 6 0 1 5 0 2 0 0 0Sierra Vista 285 1 94 190 1 122 15 0 3Tombstone 8 0 3 5 0 4 1 0 1Willcox 23 1 9 13 1 15 0 0 0TOTAL 909 21 267 621 25 393 30 2 11
Coconino County 1,126 34 299 793 38 473 69 7 62Flagstaff 1,035 4 230 801 4 328 73 1 36Fredonia 1 0 0 1 0 0 0 0 0Williams 80 0 18 62 0 20 4 0 5Page 57 0 13 44 0 22 13 0 6Sedona 63 1 11 51 1 13 0 0 0TOTAL 2,362 39 571 1,752 43 856 159 8 109
Gila County 524 17 193 314 19 281 39 1 45Globe 133 2 40 91 2 75 18 0 25Hayden 1 1 0 0 1 0 0 0 0Miami 13 0 5 8 0 5 2 0 1Payson 241 1 69 171 1 102 18 0 16Winkelman 2 0 0 2 0 0 0 0 0TOTAL 914 21 307 586 23 463 77 1 87
Graham County 137 10 48 79 15 87 13 5 16Pima 2 0 0 2 0 0 1 0 0Safford 121 0 26 95 0 36 12 0 11Thatcher 63 0 20 43 0 24 3 0 0TOTAL 323 10 94 219 15 147 29 5 27
Greenlee County 54 0 15 39 0 22 1 0 0Clifton 14 0 5 9 0 9 1 0 3Duncan 1 0 0 1 0 0 0 0 0TOTAL 69 0 20 49 0 31 2 0 3
COUNTIESCities
Number of Crashes

Section 2: – Geographic Location
Page 13 – 2020 Arizona Crash Facts Summary
Table 2 – 5 Analysis by Jurisdiction
Crashes in Maricopa County accounted for 72.50% of all crashes and 47.42% of fatal crashes.
No. of Persons Alcohol RelatedTotal Fatal Injury PDO Killed Injured Crashes Killed Injured
La Paz County 274 12 77 185 13 132 26 4 20Parker 16 0 5 11 0 9 0 0 0Quartzite 53 4 16 33 4 24 1 0 0TOTAL 343 16 98 229 17 165 27 4 20
Maricopa County 5,650 69 1,823 3,758 78 2,608 236 12 163Apache Junction 19 0 7 12 0 12 0 0 0Avondale 1,157 3 309 845 3 449 37 0 14Buckeye 688 9 228 451 9 358 39 0 25Cave Creek 66 0 26 40 0 43 3 0 2Chandler 2,813 14 793 2,006 17 1,176 131 1 81El Mirage 368 0 95 273 0 138 25 0 11Gila Bend 53 3 16 34 3 19 3 0 2Gilbert 2,064 6 348 1,710 6 450 72 1 29Glendale 4,642 43 1,196 3,403 47 1,685 189 13 81Goodyear 1,141 8 321 812 8 478 58 2 34Mesa 5,443 38 1,580 3,825 39 2,209 241 7 172Paradise Valley 102 0 28 74 0 36 6 0 2Peoria 2,307 10 769 1,528 10 1,098 86 0 66Phoenix 35,274 207 9,311 25,756 220 13,470 1,189 33 688Scottsdale 2,963 19 1,010 1,934 20 1,510 197 3 156Surprise 1,478 10 387 1,081 11 580 57 1 40Tempe 4,153 17 1,474 2,662 17 2,164 216 7 140Tolleson 289 1 82 206 1 119 15 0 8Wickenburg 139 1 23 115 1 29 5 0 3Youngtown 42 0 7 35 0 9 1 0 0Guadalupe 110 0 26 84 0 36 4 0 3Litchfield Park 20 0 6 14 0 8 1 0 1Queen Creek 476 1 85 390 1 114 16 0 5Fountain Hills 131 1 39 91 1 48 7 1 4Carefree 23 0 8 15 0 9 0 0 0TOTAL 71,611 460 19,997 51,154 492 28,855 2,834 81 1,730
Mohave County 1,229 39 390 800 42 616 78 7 59Kingman 474 2 124 348 3 168 18 0 13Lake Havasu City 485 5 162 318 6 226 48 0 29Bullhead City 495 5 134 356 5 191 29 3 16Colorado City 15 0 5 10 0 10 0 0 0TOTAL 2,698 51 815 1,832 56 1,211 173 10 117
COUNTIESCities
Number of Crashes

Section 2: – Geographic Location
Page 14 – 2020 Arizona Crash Facts Summary
Table 2 – 5 Analysis by Jurisdiction
No. of Persons Alcohol RelatedTotal Fatal Injury PDO Killed Injured Crashes Killed Injured
Navajo County 533 24 145 364 31 209 39 4 28Holbrook 43 1 16 26 1 23 4 1 2Show Low 315 3 89 223 3 122 10 0 3Snowflake 54 1 17 36 1 21 4 1 1Taylor 44 0 9 35 0 15 0 0 0Winslow 71 1 12 58 1 18 3 0 1Pinetop-Lakeside 102 1 28 73 1 45 6 1 7TOTAL 1,162 31 316 815 38 453 66 7 42
Pima County 2,442 51 739 1,652 57 1,084 152 13 98South Tucson 23 0 7 16 0 13 2 0 1Tucson 5,278 90 2,008 3,180 95 2,777 380 34 233Sahuarita 190 4 63 123 5 98 11 0 4Oro Valley 231 0 59 172 0 71 5 0 0Marana 677 5 165 507 5 224 28 1 14TOTAL 8,841 150 3,041 5,650 162 4,267 578 48 350
Pinal County 1,788 37 566 1,185 39 820 84 3 76Casa Grande 554 1 184 369 1 262 37 0 18Coolidge 144 3 60 81 3 110 7 0 9Eloy 129 4 49 76 4 81 5 0 2Florence 59 2 27 30 2 34 4 1 3Kearny 7 1 0 6 1 0 1 0 0Mammoth 3 0 1 2 0 4 0 0 0Queen Creek 23 0 6 17 0 7 1 0 2Superior 2 1 0 1 2 0 0 0 0Apache Junction 411 5 119 287 5 167 23 0 20Maricopa 328 3 115 210 3 157 25 0 17TOTAL 3,448 57 1,127 2,264 60 1,642 187 4 147
Santa Cruz County 161 3 25 133 5 40 9 0 5Nogales 48 2 12 34 2 16 0 0 0Patagonia 0 0 0 0 0 0 0 0 0TOTAL 209 5 37 167 7 56 9 0 5
Yavapai County 1,681 43 530 1,108 51 826 93 4 78Clarkdale 9 0 2 7 0 5 4 0 0Cottonwood 297 3 78 216 3 115 21 1 9Jerome 5 0 2 3 0 2 0 0 0Peoria 6 0 4 2 0 5 0 0 0Prescott 528 4 165 359 4 217 26 1 11Prescott Valley 403 1 125 277 1 175 22 0 5Chino Valley 161 1 43 117 1 59 5 0 2Camp Verde 167 2 54 111 3 67 19 0 11Dewey-Humboldt 22 1 4 17 1 8 3 0 1Sedona 65 0 21 44 0 29 0 0 0Wickenburg 8 0 5 3 0 6 0 0 0TOTAL 3,352 55 1,033 2,264 64 1,514 193 6 117
COUNTIESCities
Number of Crashes
Section 2: – Geographic Location
Page 15 – 2020 Arizona Crash Facts Summary
Table 2 – 5 Analysis by Jurisdiction
Note: Some individual city data may be incomplete due to lack of timely reporting or changes in crash reporting procedures.
Total Fatalities by County for 2019 and 2020
No. of Persons Alcohol RelatedTotal Fatal Injury PDO Killed Injured Crashes Killed Injured
Yuma County 720 15 227 478 15 352 38 0 22Somerton 66 1 20 45 1 30 7 1 1Yuma 1,275 9 492 774 9 687 61 1 40Wellton 20 4 6 10 5 11 1 0 5San Luis 82 1 23 58 1 35 5 0 1TOTAL 2,163 30 768 1,365 31 1,115 112 2 69
COUNTIESCities
Number of Crashes
Mohave
56
57
Coconino
43
52
2020 Fatalities on top in bold 2019 Fatalities on bottom
Same or Decrease
Increase
La Paz
17
17
Yuma
31 28
Yavapai
64
54
Maricopa 492
446
Navajo 38 24
Apache 24 34
Gila
23 18
Pinal
60
69
Pima
162
140
Cochise 25
25
Graham
15
7
Greenlee
0
3
Santa Cruz 7
6

Section 2: – Geographic Location
Page 16 – 2020 Arizona Crash Facts Summary
Chart 2 – 1 Chart 2 – 2 Urban and Rural Crashes by Day of Week Urban and Rural Fatal Crashes by Day of Week
10,961
8,111
11,794
13,111
13,351
13,302
14,614
1,835 1,908 2,212 1,863
2,0381,8241,854
5,000
10,000
15,000
MON TUE WED THU FRI SAT SUN0
3,000
6,000
9,000
12,000
15,000
18,000
URBAN RURAL
103
80
9091
8376
64
44
5659 60
42
54
68
45
95
145
MON TUE WED THU FRI SAT SUN0
30
60
URBAN RURAL
Chart 2 – 3
All Urban and Rural Crashes vs. Urban and Rural Fatal Crashes by Month
4660 56 62
52
23
4126
37 3730
51474456
28
29
56
30
2537
293533
7,544
1,170709
1,187
6,1976,648
6,038
7,309
4,284
7,345 7,2418,106
5,789
9,567 9,176
1,0731,081 1,212 1,0931,1681,3189871,262 1,274
-20
30
80
130
180
230
280
JAN FEB MAR APR MAY JUN JUL AUG SEP OCT NOV DEC-9,000
-4,000
1,000
6,000
11,000
URBAN FATAL RURAL FATAL URBAN ALL RURAL ALL

Section 3 Crash Descriptions
Page 17 – 2020 Arizona Crash Facts Summary
Urban Crashes
Fatal Crashes Killed
11,245 124 13063.30% 12.78% 12.30%
Single Vehicle
PDOInjury
Crashes Injured
17,766 8,138 2,983 3,52417.99% 11.76% 10.43% 8.52%
Fatal Crashes Killed
Rural Crashes
190 209
6,521 19.59% 19.77%36.70%
Injury Crashes Injured
PDO 1,990 2,6464,341 6.96% 6.40%
6.27%
Urban Crashes
Fatal Crashes
Killed
73,999 463 49491.34% 47.73% 46.74%
Multi-Vehicle PDO
Injury Crashes
Injured
81,012 52,026 21,510 31,63182.01% 75.18% 75.18% 76.50%
Fatal Crashes
Killed
Rural Crashes
193 224
7,013 19.90% 21.19%8.66%
Injury Crashes Injured
PDO 2,127 3,5494,693 7.43% 8.58%
6.78%
Total Crashes
98,778100.00%

Section 3: – Crash Descriptions
Page 18 – 2020 Arizona Crash Facts Summary
Table 3 – 1
Manner of Collision in Multi-Vehicle Crashes
Table 3 – 2 Lighting Conditions
Table 3 – 3 Weather Conditions
Angle 12,669 15.64% 84 12.80% 4,366 18.47% 8,219 14.49%Left Turn 14,123 17.43% 78 11.89% 5,078 21.48% 8,967 15.81%Rear End 31,868 39.34% 75 11.43% 9,309 39.38% 22,484 39.64%Head-On 1,681 2.08% 88 13.41% 656 2.78% 937 1.65%Sideswipe (same) 13,520 16.69% 26 3.96% 1,818 7.69% 11,676 20.59%Sideswipe (opposite) 1,441 1.78% 21 3.20% 314 1.33% 1,106 1.95%U-Turn 308 0.38% 3 0.46% 92 0.39% 213 0.38%Other* 4,749 5.86% 267 40.70% 1,897 8.03% 2,585 4.56%Unknown 653 0.81% 14 2.13% 107 0.45% 532 0.94%TOTAL 81,012 100.00% 656 100.00% 23,637 100.00% 56,719 100.00%
Number of CrashesManner of
Collision Type Total FatalPercent of
Total Crashes
InjuryPercent of
Fatal Crashes
Percent of Injury
Crashes
Percent of PDO
CrashesPDO
*Other includes pedestrian and pedalcyclist crashes
Number of Persons
Total Fatal Injury PDO Killed Injured
Daylight 67,043 393 19,519 47,131 436 28,187Dawn 1,869 17 549 1,303 18 801Dusk 2,781 25 843 1,913 27 1,247Dark - Lighted 20,224 243 5,869 14,112 253 8,468Dark - Not Lighted 5,913 175 1,691 4,047 198 2,457Dark - Unknown Lighting 401 38 58 305 44 77Unknown 547 79 81 387 81 113
TOTAL 98,778 970 28,610 69,198 1,057 41,350
Type of Lighting Conditions
Number of Crashes
Number of Persons
Total Fatal Injury PDO Killed Injured
Clear 88,940 720 25,914 62,306 789 37,456Cloudy 6,018 60 1,764 4,194 64 2,563Sleet/Hail 96 3 25 68 5 48Rain 2,509 12 682 1,815 12 942Snow or Blowing Snow 178 0 43 135 0 56Severe Crosswinds 5 0 2 3 0 3Blowing Sand, Soil, Dirt 65 0 14 51 0 23Fog, Smog, Smoke 64 1 23 40 1 33Other 53 0 16 37 0 24Unknown 850 174 127 549 186 202TOTAL 98,778 970 28,610 69,198 1,057 41,350
Type of Weather Conditions
Number of Crashes

Section 3: – Crash Descriptions
Page 19 – 2020 Arizona Crash Facts Summary
Table 3 – 4
Road Surface Conditions
Table 3 – 5 Roadway Grade
Table 3 – 6 Roadway Alignment
Number of Persons
Total In Fatal Crashes
In Injury Crashes
In PDO Crashes
Killed Injured
Dry 179,680 1,245 53,212 125,223 847 39,523Wet 6,009 36 1,760 4,213 27 1,325Snow/Slush 302 0 82 220 0 67Ice/Frost 253 1 62 190 1 59Water (standing or moving) 129 0 27 102 0 29Mud, Dirt, Gravel, Sand 385 6 149 230 7 166Other 70 0 22 48 0 22Unknown 2,844 210 435 2,199 175 159TOTAL 189,672 1,498 55,749 132,425 1,057 41,350
Type of Road Surface Condition
Number of Drivers
Number of Persons
Total In Fatal Crashes
In Injury Crashes
In PDO Crashes
Killed Injured
Level 176,420 1,079 51,839 123,502 730 38,171Downhill 5,680 104 1,931 3,645 86 1,735Uphill 4,801 83 1,502 3,216 51 1,224Hillcrest 39 1 11 27 1 11Sag/Dip/Bottom 46 0 14 32 0 7Unknown 2,686 231 452 2,003 189 202TOTAL 189,672 1,498 55,749 132,425 1,057 41,350
Type of Roadway Grade
Number of Drivers
Number of Persons
Total In Fatal Crashes
In Injury Crashes
In PDO Crashes
Killed Injured
Straight 176,364 1,070 52,325 122,969 716 38,333Curve Left 4,947 96 1,437 3,414 79 1,424Curve Right 5,148 92 1,453 3,603 67 1,330Unknown 3,213 240 534 2,439 195 263TOTAL 189,672 1,498 55,749 132,425 1,057 41,350
Type of Roadway
Alignment
Number of Drivers

Section 3: – Crash Descriptions
Page 20 – 2020 Arizona Crash Facts Summary
Chart 3 – 1 All Crashes vs. Fatal Crashes by Time of Day - Weekdays
0
10
20
30
40
50
60
70
80
90
100
110
120
13012
:00
AM
1:00
AM
2:00
AM
3:00
AM
4:00
AM
5:00
AM
6:00
AM
7:00
AM
8:00
AM
9:00
AM
10:0
0 A
M
11:0
0 A
M
12:0
0 PM
1:00
PM
2:00
PM
3:00
PM
4:00
PM
5:00
PM
6:00
PM
7:00
PM
8:00
PM
9:00
PM
10:0
0 PM
11:0
0 PM
-5,000
-3,000
-1,000
1,000
3,000
5,000
7,000
Fatal Crashes All Crashes
Chart 3 – 2 All Crashes vs. Fatal Crashes by Time of Day - Weekends
0
10
20
30
40
50
60
70
80
90
100
110
120
12:0
0 A
M
1:00
AM
2:00
AM
3:00
AM
4:00
AM
5:00
AM
6:00
AM
7:00
AM
8:00
AM
9:00
AM
10:0
0 A
M
11:0
0 A
M
12:0
0 PM
1:00
PM
2:00
PM
3:00
PM
4:00
PM
5:00
PM
6:00
PM
7:00
PM
8:00
PM
9:00
PM
10:0
0 PM
11:0
0 PM
-1,000
-500
0
500
1,000
1,500
2,000
2,500
3,000Fatal Crashes All Crashes

Section 3: – Crash Descriptions
Page 21 – 2020 Arizona Crash Facts Summary
Chart 3 – 3 Chart 3 – 4 Crashes by Day of Week Fatal Crashes by Day of Week
12,999
9,974
13,629
14,965
15,175
15,210
16,826
9,000
11,000
13,000
15,000
17,000
MON TUE WED THU FRI SAT SUN0
171
140
108
118
137
147149
100
120
140
160
180
MON TUE WED THU FRI SAT SUN0
Chart 3 – 5 All Crashes vs. Fatal Crashes by Month
67
97
5953
89
7282
8897 93 92
81
4,993
7,119 7,2707,860
8,6378,515 8,496 8,409
9,424
6,776
10,82910,450
50
70
90
110
130
150
170
190
210
230
250
JAN FEB MAR APR MAY JUN JUL AUG SEP OCT NOV DEC0
2,000
4,000
6,000
8,000
10,000
12,000
Fatal Crashes All Crashes

Section 3: – Crash Descriptions
Page 22 – 2020 Arizona Crash Facts Summary
Table 3 – 7 Crashes by Hour and Day of Week
Crashes during Weekends accounted for 28.31% of all crashes and 40.52% of Fatal Crashes.
Total Crashes Monday Tuesday Wednesday Thursday Friday Saturday Sunday Weekdays Weekends All Fatal All Fatal All Fatal All Fatal All Fatal All Fatal All Fatal All Fatal All Fatal All Fatal
12:00 AM 1,412 59 167 7 127 7 166 7 166 8 182 11 285 9 319 10 641 33 771 261:00 AM 1,069 22 122 3 98 3 106 1 132 3 158 5 216 2 237 5 494 12 575 102:00 AM 1,163 28 130 6 112 3 121 3 128 5 137 1 254 3 281 7 498 12 665 163:00 AM 933 23 105 0 93 2 104 5 107 6 127 1 181 3 216 6 431 14 502 94:00 AM 1,169 26 145 3 158 3 199 5 159 0 165 3 166 5 177 7 681 11 488 155:00 AM 2,103 28 309 2 362 3 350 8 365 4 311 5 230 2 176 4 1,388 20 715 86:00 AM 3,255 35 489 6 639 5 574 7 566 8 499 4 292 3 196 2 2,767 30 488 57:00 AM 4,594 24 747 4 864 4 831 4 879 3 732 3 335 3 206 3 4,053 18 541 68:00 AM 4,303 24 653 2 818 5 777 2 724 3 664 4 397 4 270 4 3,636 16 667 89:00 AM 3,900 27 560 2 597 7 590 2 632 4 638 2 546 8 337 2 3,017 17 883 1010:00 AM 4,370 25 666 1 625 2 637 7 670 6 666 4 688 2 418 3 3,264 20 1,106 511:00 AM 5,207 45 728 7 718 6 788 4 781 8 828 6 814 6 550 8 3,843 31 1,364 1412:00 PM 6,185 44 894 8 874 5 904 3 870 7 1,085 11 922 6 636 4 4,627 34 1,558 101:00 PM 6,201 44 868 9 888 3 954 3 932 7 1,077 7 844 8 638 7 4,719 29 1,482 152:00 PM 7,373 30 1,040 5 1,159 1 1,169 6 1,092 5 1,306 5 947 1 660 7 5,766 22 1,607 83:00 PM 8,115 42 1,202 5 1,376 7 1,347 7 1,283 3 1,434 5 796 7 677 8 6,642 27 1,473 154:00 PM 8,117 46 1,155 2 1,348 5 1,367 15 1,333 4 1,458 5 787 8 669 7 6,661 31 1,456 155:00 PM 7,527 43 1,061 2 1,195 4 1,259 7 1,237 9 1,350 6 815 10 610 5 6,102 28 1,425 156:00 PM 6,503 66 852 5 978 11 1,000 8 935 10 1,184 10 867 17 687 5 3,765 34 2,738 327:00 PM 4,677 67 594 8 622 7 614 7 716 8 846 12 696 14 589 11 2,546 30 2,131 378:00 PM 3,656 66 415 9 503 6 489 10 521 10 633 10 610 14 485 7 1,928 35 1,728 319:00 PM 2,898 67 299 5 355 12 355 7 423 6 537 11 521 18 408 8 1,432 30 1,466 3710:00 PM 2,369 42 251 3 283 4 307 11 320 3 462 9 432 6 314 6 1,161 21 1,208 2111:00 PM 1,679 47 177 4 173 3 202 8 204 7 347 9 358 12 218 4 756 22 923 25
TOTAL 98,778 970 13,629 108 14,965 118 15,210 147 15,175 137 16,826 149 12,999 171 9,974 140 70,818 577 27,960 393
Hour Beginning

Section 4 Safety Devices
Page 23 – 2020 Arizona Crash Facts Summary
Total Involved252,837
Drivers189,672 75.02%
Safety Device Used
Safety Device Not Used
Safety Device Use Unknown
158,388 83.51% 3,198 1.69% 28,086 14.81%
Killed Injured Killed Injured Killed Injured
234 25,148 237 1,769 135 2,564
Passengers63,165 24.98%
Safety Device Used
Safety Device Not Used
Safety Device Use Unknown
56,502 89.45% 1,833 2.90% 4,830 7.65%
Killed Injured Killed Injured Killed Injured
53 8,091 76 838 54 777

Section 4: – Safety Devices
Page 24 – 2020 Arizona Crash Facts Summary
Table 4 – 1 Child Safety Device Usage (less than five years old)
Table 4 – 2 Driver Safety Device Usage
Table 4 – 3 Passenger Safety Device Usage
Severity of InjurySafety Device Used
Percent of Safety Device
Used
Safety Device
Not Used
Percent ofSafety Device
Not Used
Safety Device Use Unknown
Percent of Unknown
No Injury 6,401 90.44% 67 58.77% 187 72.76%Unknown Injury 109 1.54% 2 1.75% 47 18.29%Possible Injury 351 4.96% 17 14.91% 7 2.72%Suspected Minor Injury 194 2.74% 19 16.67% 11 4.28%Suspected Serious Injury 19 0.27% 8 7.02% 3 1.17%Fatal Injury 4 0.06% 1 0.88% 2 0.78%TOTALS 7,078 100.00% 114 100.00% 257 100.00%
Severity of InjurySafety Device Used
Percent of Safety Device
Used
Safety Device
Not Used
Percent ofSafety Device
Not Used
Safety Device Use Unknown
Percent of Unknown
No Injury 131,531 83.04% 1,139 35.62% 15,954 56.80%Unknown Injury 1,475 0.93% 53 1.66% 9,433 33.59%Possible Injury 14,231 8.98% 482 15.07% 1,068 3.80%Suspected Minor Injury 9,799 6.19% 835 26.11% 1,080 3.85%Suspected Serious Injury 1,118 0.71% 452 14.13% 416 1.48%Fatal Injury 234 0.15% 237 7.41% 135 0.48%TOTALS 158,388 100.00% 3,198 100.00% 28,086 100.00%
Severity of InjurySafety Device Used
Percent of Safety Device
Used
Safety Device
Not Used
Percent ofSafety Device
Not Used
Safety Device Use Unknown
Percent of Unknown
No Injury 47,712 84.44% 864 47.14% 3,266 67.62%Unknown Injury 646 1.14% 55 3.00% 733 15.18%Possible Injury 4,795 8.49% 251 13.69% 356 7.37%Suspected Minor Injury 2,932 5.19% 394 21.49% 313 6.48%Suspected Serious Injury 364 0.64% 193 10.53% 108 2.24%Fatal Injury 53 0.09% 76 4.15% 54 1.12%TOTALS 56,502 100.00% 1,833 100.00% 4,830 100.00%
Section 4: – Safety Devices
Page 25 – 2020 Arizona Crash Facts Summary
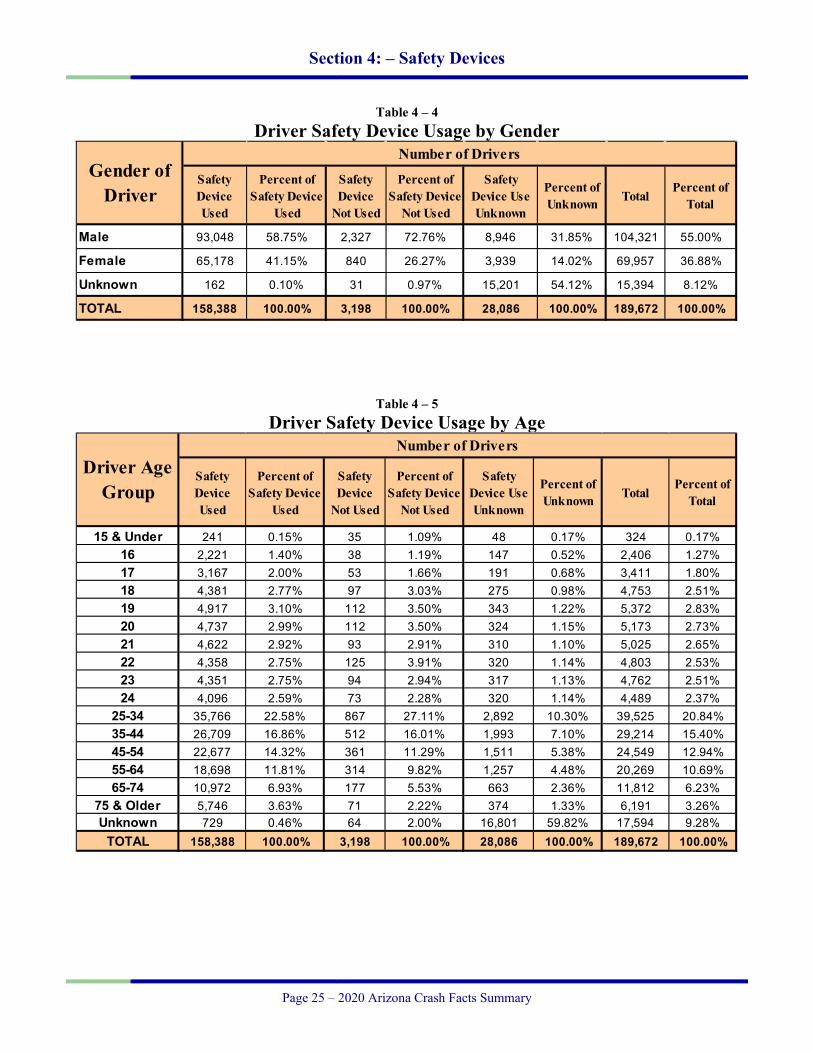
Table 4 – 4
Driver Safety Device Usage by Gender
Table 4 – 5 Driver Safety Device Usage by Age
Safety Device Used
Percent of Safety Device
Used
Safety Device
Not Used
Percent ofSafety Device
Not Used
Safety Device Use Unknown
Percent of Unknown Total
Percent of Total
Male 93,048 58.75% 2,327 72.76% 8,946 31.85% 104,321 55.00%
Female 65,178 41.15% 840 26.27% 3,939 14.02% 69,957 36.88%
Unknown 162 0.10% 31 0.97% 15,201 54.12% 15,394 8.12%
TOTAL 158,388 100.00% 3,198 100.00% 28,086 100.00% 189,672 100.00%
Gender of Driver
Number of Drivers
Safety Device Used
Percent of Safety Device
Used
Safety Device
Not Used
Percent ofSafety Device
Not Used
Safety Device Use Unknown
Percent of Unknown Total
Percent of Total
15 & Under 241 0.15% 35 1.09% 48 0.17% 324 0.17%16 2,221 1.40% 38 1.19% 147 0.52% 2,406 1.27%17 3,167 2.00% 53 1.66% 191 0.68% 3,411 1.80%18 4,381 2.77% 97 3.03% 275 0.98% 4,753 2.51%19 4,917 3.10% 112 3.50% 343 1.22% 5,372 2.83%20 4,737 2.99% 112 3.50% 324 1.15% 5,173 2.73%21 4,622 2.92% 93 2.91% 310 1.10% 5,025 2.65%22 4,358 2.75% 125 3.91% 320 1.14% 4,803 2.53%23 4,351 2.75% 94 2.94% 317 1.13% 4,762 2.51%24 4,096 2.59% 73 2.28% 320 1.14% 4,489 2.37%
25-34 35,766 22.58% 867 27.11% 2,892 10.30% 39,525 20.84%35-44 26,709 16.86% 512 16.01% 1,993 7.10% 29,214 15.40%45-54 22,677 14.32% 361 11.29% 1,511 5.38% 24,549 12.94%55-64 18,698 11.81% 314 9.82% 1,257 4.48% 20,269 10.69%65-74 10,972 6.93% 177 5.53% 663 2.36% 11,812 6.23%
75 & Older 5,746 3.63% 71 2.22% 374 1.33% 6,191 3.26%Unknown 729 0.46% 64 2.00% 16,801 59.82% 17,594 9.28%
TOTAL 158,388 100.00% 3,198 100.00% 28,086 100.00% 189,672 100.00%
Driver AgeGroup
Number of Drivers

Section 5 Motor Vehicle and Driver Descriptions
Page 26 – 2020 Arizona Crash Facts Summary
Total Crashes 98,778
Total Vehicles 1
189,672
Cars & Station Wagons Fatal Killed129,744 794 41368.40%
Injury Injured38,604 28,611
Pickup Trucks & Vans Fatal Killed 90,34631,184 272 97
16.44%Injury Injured9,006 5,345
Trucks & Buses Fatal Killed 21,90611,348 108 185.98%
Injury Injured2,564 1,175
Motorcycles Fatal Killed 8,6762,373 163 160
1.25%Injury Injured1,855 1,921
All other vehicles 2 Fatal Killed 35515,023 161 1017.92%
Injury Injured3,720 2,135
PDO11,142
PDO
PDO
PDO
PDO
1 - Includes driverless or parked vehicles 2 - Includes unknown vehicle type
Section 5: – Motor Vehicle and Driver Descriptions
Page 27 – 2020 Arizona Crash Facts Summary
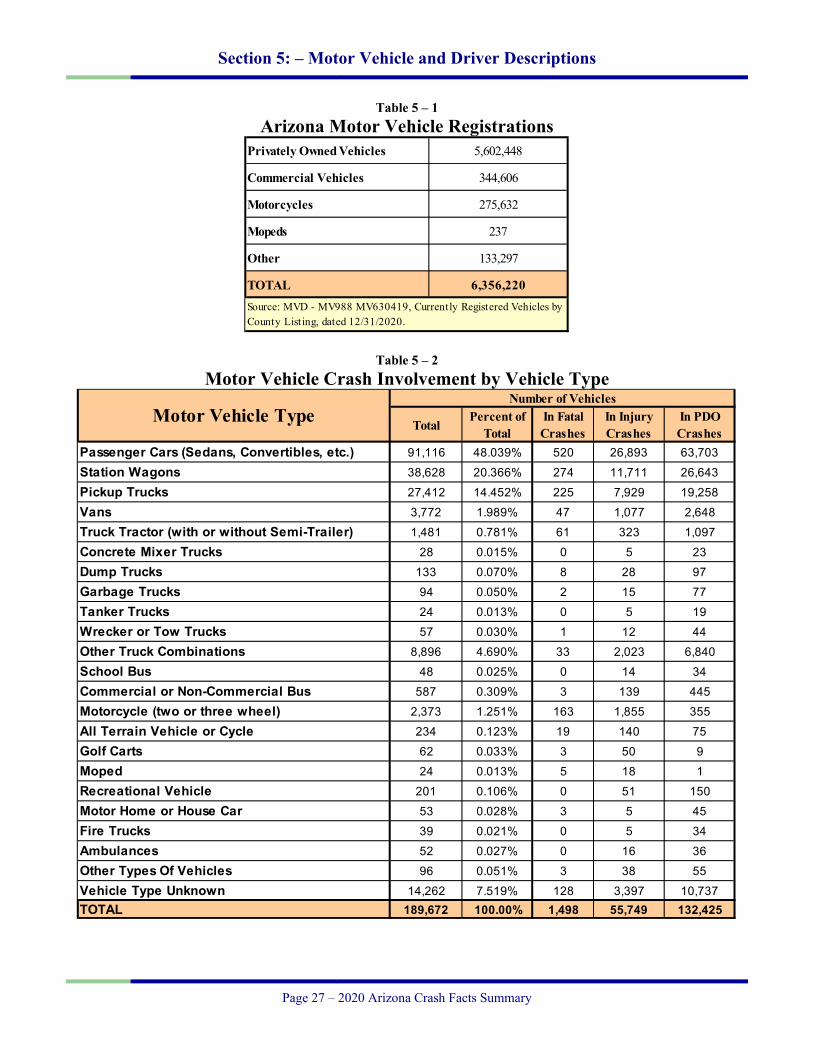
Table 5 – 1
Arizona Motor Vehicle Registrations
Table 5 – 2 Motor Vehicle Crash Involvement by Vehicle Type
Privately Owned Vehicles 5,602,448
Commercial Vehicles 344,606
Motorcycles 275,632
Mopeds 237
Other 133,297
TOTAL 6,356,220Source: MVD - MV988 MV630419, Currently Registered Vehicles by County Listing, dated 12/31/2020.
Number of Vehicles
TotalPercent of
TotalIn Fatal Crashes
In Injury Crashes
In PDO Crashes
Passenger Cars (Sedans, Convertibles, etc.) 91,116 48.039% 520 26,893 63,703Station Wagons 38,628 20.366% 274 11,711 26,643Pickup Trucks 27,412 14.452% 225 7,929 19,258Vans 3,772 1.989% 47 1,077 2,648Truck Tractor (with or without Semi-Trailer) 1,481 0.781% 61 323 1,097Concrete Mixer Trucks 28 0.015% 0 5 23Dump Trucks 133 0.070% 8 28 97Garbage Trucks 94 0.050% 2 15 77Tanker Trucks 24 0.013% 0 5 19Wrecker or Tow Trucks 57 0.030% 1 12 44Other Truck Combinations 8,896 4.690% 33 2,023 6,840School Bus 48 0.025% 0 14 34Commercial or Non-Commercial Bus 587 0.309% 3 139 445Motorcycle (two or three wheel) 2,373 1.251% 163 1,855 355All Terrain Vehicle or Cycle 234 0.123% 19 140 75Golf Carts 62 0.033% 3 50 9Moped 24 0.013% 5 18 1Recreational Vehicle 201 0.106% 0 51 150Motor Home or House Car 53 0.028% 3 5 45Fire Trucks 39 0.021% 0 5 34Ambulances 52 0.027% 0 16 36Other Types Of Vehicles 96 0.051% 3 38 55Vehicle Type Unknown 14,262 7.519% 128 3,397 10,737TOTAL 189,672 100.00% 1,498 55,749 132,425
Motor Vehicle Type

Section 5: – Motor Vehicle and Driver Descriptions
Page 28 – 2020 Arizona Crash Facts Summary
Table 5 – 3 Hit and Run Drivers Involved in Crashes
Table 5 – 4 Gender of Drivers Involved in Crashes
Table 5 – 5 License Status of Drivers Involved in Crashes
Table 5 – 6 Passengers Killed and Injured by Age and Gender
Number of PersonsTotal Fatal Injury PDO Killed Injured
Yes 13,512 77 2,421 11,014 78 3,102No 85,266 893 26,189 58,184 979 38,248TOTAL 98,778 970 28,610 69,198 1,057 41,350
Hit and Run Number of Crashes
TotalPercent of
TotalIn Fatal Crashes
Percent of Fatal
In Injury Crashes
Percent of Injury
In PDO Crashes
Percent of PDO
Male 104,321 55.00% 1,025 68.42% 31,457 56.43% 71,839 54.25%Female 69,957 36.88% 338 22.56% 21,917 39.31% 47,702 36.02%Unknown 15,394 8.12% 135 9.01% 2,375 4.26% 12,884 9.73%TOTAL 189,672 100.00% 1,498 100.00% 55,749 100.00% 132,425 100.00%
Gender of Driver
Number of Drivers
TotalPercent of Total
In Fatal Crashes
Percent of Fatal
In Injury Crashes
Percent of Injury
In PDO Crashes
Percent of PDO
Arizona License 132,468 69.84% 1,037 69.23% 40,604 72.83% 90,827 68.59%
All Others* 57,204 30.16% 461 30.77% 15,145 27.17% 41,598 31.41%TOTAL 189,672 100.00% 1,498 100.00% 55,749 100.00% 132,425 100.00%
*Includes drivers that have a suspended, revoked, out-of-state or country license, as well as drivers with no licenseor unknown license type
Number of DriversLicense Status of
Driver
Passengers Killed Passengers Injured
Total Male FemaleGender
Unknown Total Male FemaleGender
Unknown0-4 6 4 2 0 508 270 238 05-9 8 3 5 0 646 295 351 0
10-14 16 5 11 0 747 348 399 015-19 21 8 13 0 1,426 612 814 020-24 25 12 13 0 1,228 495 733 025-34 31 21 10 0 1,450 609 841 035-44 20 12 8 0 921 352 569 045-54 15 7 8 0 869 279 590 055-64 16 8 8 0 787 235 552 065-74 8 3 5 0 526 137 389 0
75 & Older 15 5 10 0 366 96 270 0Unknown 2 1 0 1 232 102 118 12
TOTAL 183 89 93 1 9,706 3,830 5,864 12
Age ofPassenger

Section 5: – Motor Vehicle and Driver Descriptions
Page 29 – 2020 Arizona Crash Facts Summary
Table 5 – 7 Drivers and Passengers Killed and Injured by Vehicle Type
Table 5 – 8 Drivers Killed and Injured by Age and Gender
Number of Drivers Number of Passengers
Killed Injured Killed Injured
Passenger Cars (Sedans, Convertibles, etc.) 208 15,239 75 4,813Station Wagons 93 6,170 37 2,389Pickup Trucks 62 3,416 13 1,209Vans 10 507 12 213Truck Tractor (with or without Semi-Trailer) 11 90 3 23Concrete Mixer Trucks 0 3 0 0Dump Trucks 0 8 0 1Garbage Trucks 0 4 0 2Tanker Trucks 0 1 0 0Wrecker or Tow Trucks 0 5 0 0Other Truck Combinations 3 699 1 221School Bus 0 5 0 1Commercial or Non-Commercial Bus 0 35 0 77Motorcycle (two or three wheel) 153 1,804 7 117All Terrain Vehicle or Cycle 15 108 5 80Golf Carts 3 44 0 13Moped 5 17 0 1Recreational Vehicle 0 26 0 10Motor Home or House Car 2 3 0 2Fire Trucks 0 3 0 5Ambulances 0 5 0 3Other Types Of Vehicles 2 27 0 2Vehicle Type Unknown 39 1,262 30 524TOTAL 606 29,481 183 9,706
Motor Vehicle Type
Total Male FemaleGender
Unknown Total Male FemaleGender
Unknown0-4 0 0 0 0 0 0 0 05-9 0 0 0 0 2 2 0 0
10-14 0 0 0 0 23 17 6 015-19 35 32 3 0 2,324 1,205 1,119 020-24 62 55 7 0 4,221 2,269 1,952 025-34 121 100 21 0 6,771 3,692 3,079 035-44 97 65 32 0 4,763 2,567 2,196 045-54 68 55 13 0 4,277 2,262 2,015 055-64 114 91 23 0 3,487 1,954 1,533 065-74 55 47 8 0 2,195 1,209 986 0
75 & Older 49 33 16 0 1,238 660 578 0Unknown 5 4 0 1 180 94 33 53
TOTAL 606 482 123 1 29,481 15,931 13,497 53
Age ofDriver
Drivers Killed Drivers Injured

Section 5: – Motor Vehicle and Driver Descriptions
Page 30 – 2020 Arizona Crash Facts Summary
Table 5 – 9
Licensed Drivers in Arizona by Age
Table 5 – 10 Driver Involvement by Age
Driver Male Female Unknown Total CumulativeAge Group Number Number Number Number Percent
16 11,849 0.41% 12,116 0.42% 0 23,965 0.42% 0.42%17 21,955 0.75% 21,276 0.75% 0 43,231 0.75% 1.16%18 29,805 1.02% 28,007 0.98% 1 57,813 1.00% 2.17%19 35,084 1.20% 32,810 1.15% 1 67,895 1.18% 3.34%20 39,788 1.36% 36,944 1.30% 0 76,732 1.33% 4.67%21 41,998 1.44% 39,160 1.37% 1 81,159 1.41% 6.08%22 44,091 1.51% 40,900 1.43% 0 84,991 1.47% 7.55%23 46,084 1.58% 41,985 1.47% 1 88,070 1.53% 9.07%24 47,459 1.62% 44,287 1.55% 0 91,746 1.59% 10.66%
25-34 520,282 17.81% 492,750 17.28% 4 1,013,036 17.55% 28.21%35-44 510,470 17.47% 489,297 17.16% 5 999,772 17.32% 45.53%45-54 501,192 17.16% 468,067 16.41% 0 969,259 16.79% 62.32%55-64 492,167 16.85% 490,179 17.19% 3 982,349 17.02% 79.34%65-74 353,409 12.10% 379,061 13.29% 1 732,471 12.69% 92.02%
75 & older 225,557 7.72% 234,882 8.24% 0 460,439 7.98% 100.00%
TOTALS 2,921,190 100.00% 2,851,721 100.00% 17 5,772,928 100.00% 100.00%
Source: MVD - MV708 MV650653-1, Point-in-T ime Driver Credential Report/All Driver Licenses by Age, Gender, & Class (page 19),dated 1/2/2021.
Percent of Male
Percent of Female
Percent of Total
TotalPercentof Total
In Fatal Crashes
Percentof Fatal
In Injury Crashes
Percentof Injury
In PDO Crashes
Percentof PDO
15 & Under 324 0.17% 5 0.33% 109 0.20% 210 0.16%16 2,406 1.27% 13 0.87% 630 1.13% 1,763 1.33%17 3,411 1.80% 17 1.13% 979 1.76% 2,415 1.82%18 4,753 2.51% 26 1.74% 1,342 2.41% 3,385 2.56%19 5,372 2.83% 27 1.80% 1,541 2.76% 3,804 2.87%20 5,173 2.73% 28 1.87% 1,580 2.83% 3,565 2.69%21 5,025 2.65% 31 2.07% 1,560 2.80% 3,434 2.59%22 4,803 2.53% 35 2.34% 1,481 2.66% 3,287 2.48%23 4,762 2.51% 39 2.60% 1,482 2.66% 3,241 2.45%24 4,489 2.37% 26 1.74% 1,393 2.50% 3,070 2.32%
25-34 39,525 20.84% 291 19.43% 12,244 21.96% 26,990 20.38%35-44 29,214 15.40% 235 15.69% 8,780 15.75% 20,199 15.25%45-54 24,549 12.94% 189 12.62% 7,643 13.71% 16,717 12.62%55-64 20,269 10.69% 211 14.09% 6,162 11.05% 13,896 10.49%65-74 11,812 6.23% 109 7.28% 3,844 6.90% 7,859 5.93%
75 & Older 6,191 3.26% 71 4.74% 2,089 3.75% 4,031 3.04%Unknown 17,594 9.28% 145 9.68% 2,890 5.18% 14,559 10.99%
TOTAL 189,672 100.00% 1,498 100.00% 55,749 100.00% 132,425 100.00%
Driver AgeGroup
Number of Drivers

Section 5: – Motor Vehicle and Driver Descriptions
Page 31 – 2020 Arizona Crash Facts Summary
Table 5 – 11
Driver Violations
Table 5 – 12 Driver Physical Condition
TotalPercentof Total
In Fatal Crashes
Percent of Fatal
In Injury Crashes
Percent of Injury
In PDO Crashes
Percent of PDO
No Improper Action 93,038 49.05% 543 36.25% 27,650 49.60% 64,845 48.97%Speed too Fast for Conditions 28,982 15.28% 161 10.75% 9,355 16.78% 19,466 14.70%Exceeded Lawful Speed 1,013 0.53% 70 4.67% 398 0.71% 545 0.41%Failed to Yield Right-Of-Way 16,621 8.76% 101 6.74% 5,715 10.25% 10,805 8.16%Followed Too Closely 5,599 2.95% 3 0.20% 1,446 2.59% 4,150 3.13%Ran Stop Sign 977 0.52% 14 0.93% 408 0.73% 555 0.42%Disregarded Traffic Signal 4,801 2.53% 47 3.14% 2,050 3.68% 2,704 2.04%Made Improper Turn 3,674 1.94% 6 0.40% 928 1.66% 2,740 2.07%Drove in Opposing Lane 343 0.18% 10 0.67% 119 0.21% 214 0.16%Drove Left of Center Line 625 0.33% 61 4.07% 243 0.44% 321 0.24%Passed in No-Passing Zone 114 0.06% 3 0.20% 36 0.06% 75 0.06%Unsafe Lane Change 6,515 3.43% 14 0.93% 998 1.79% 5,503 4.16%Failed to Keep in Proper Lane 5,289 2.79% 88 5.87% 1,326 2.38% 3,875 2.93%Crossed Median 145 0.08% 20 1.34% 66 0.12% 59 0.04%Aggressive Driving 205 0.11% 3 0.20% 59 0.11% 143 0.11%Wrong Way Driving 61 0.03% 12 0.80% 22 0.04% 27 0.02%Other 5,233 2.76% 41 2.74% 1,247 2.24% 3,945 2.98%Unknown 16,437 8.67% 301 20.09% 3,683 6.61% 12,453 9.40%TOTAL 189,672 100.00% 1,498 100.00% 55,749 100.00% 132,425 100.00%
Type of Violation or Behavior
Number of Drivers
Total Percentof Total
In Fatal Crashes
Percent of Fatal
In Injury Crashes
Percent of Injury
In PDO Crashes
Percent of PDO
No Apparent Influence 161,919 85.37% 726 48.46% 48,099 86.28% 113,094 85.40%Alcohol 4,405 2.32% 139 9.28% 1,788 3.21% 2,478 1.87%Illegal Drugs 787 0.41% 51 3.40% 366 0.66% 370 0.28%Medications 158 0.08% 4 0.27% 75 0.13% 79 0.06%Marijuana 141 0.07% 18 1.20% 54 0.10% 69 0.05%Illness or Physical Impairment 650 0.34% 14 0.93% 328 0.59% 308 0.23%Fell Asleep or Fatigued 1,368 0.72% 9 0.60% 520 0.93% 839 0.63%Other 668 0.35% 13 0.87% 225 0.40% 430 0.32%Unknown 19,576 10.32% 524 34.98% 4,294 7.70% 14,758 11.14%
TOTAL 189,672 100.00% 1,498 100.00% 55,749 100.00% 132,425 100.00%
Number of DriversType of
Condition

Section 5: – Motor Vehicle and Driver Descriptions
Page 32 – 2020 Arizona Crash Facts Summary
Table 5 – 13 Distracted Driving Behavior
Table 5 – 14
Secondary Crashes
TotalPercentof Total
In Fatal Crashes
Percent of Fatal
In Injury Crashes
Percent of Injury
In PDO Crashes
Percent of PDO
Not Distracted 140,037 73.83% 672 44.86% 41,722 74.84% 97,643 73.73%
Talking on Hands Free Device 168 0.09% 3 0.20% 57 0.10% 108 0.08%
Talking on Hand Held Device 298 0.16% 1 0.07% 84 0.15% 213 0.16%
Passenger 614 0.32% 3 0.20% 233 0.42% 378 0.29%
Other Activity with an Electronic Device 967 0.51% 1 0.07% 305 0.55% 661 0.50%
Manually Operating an Electronic Device 639 0.34% 5 0.33% 178 0.32% 456 0.34%
Other Inside the Vehicle (eating, drinking, etc.) 2,182 1.15% 9 0.60% 690 1.24% 1,483 1.12%
Outside the Vehicle (includes unspecified distractions)
1,853 0.98% 8 0.53% 580 1.04% 1,265 0.96%
Distracted Unknown Reason 1,389 0.73% 9 0.60% 502 0.90% 878 0.66%
Unknown 41,525 21.89% 787 52.54% 11,398 20.45% 29,340 22.16%
TOTAL 189,672 100.00% 1,498 100.00% 55,749 100.00% 132,425 100.00%
Type of DistractionNumber of Drivers
Number of Persons
Total Fatal Injury PDO Killed Injured
Yes 1,679 18 545 1,116 22 902
No 77,081 787 22,448 53,846 861 32,389
Unknown 20,018 165 5,617 14,236 174 8,059
TOTAL 98,778 970 28,610 69,198 1,057 41,350
Secondary Crash
Number of Crashes

Section 6 Alcohol Related Crashes
Page 33 – 2020 Arizona Crash Facts Summary
Total Crashes98,778
Alcohol Related Crashes4,506
4.56%
Fatal Crashes Killed163 181
3.62%
Non-Alcohol Injury Crashes InjuredRelated Crashes 1,874 2,863
94,272 41.59%95.44%
Property Damage Only2,469
54.79%
Urban Crashes Fatal Crashes Killed3,724 112 122
82.65% 68.71%
PDO Injury Crashes Injured2,130 1,482 2,250
86.27% 79.08%
Rural Crashes Fatal Crashes Killed
782 51 59
17.35% 31.29%
PDO Injury Crashes Injured
339 392 613
13.73% 20.92%

Section 6: – Alcohol Related Crashes
Page 34 – 2020 Arizona Crash Facts Summary
The statistics in the Alcohol Related section represent those crashes where the investigating officer indicated that a driver, pedestrian, or pedalcyclist had been drinking an alcoholic beverage and may or may not be substantiated by a blood or breath test. No assumption is to be made that the person was legally intoxicated (blood alcohol content of 0.08% or higher) at the time of the crash.
Table 6 – 1 Economic Loss Due to Alcohol Related Crashes in Arizona for 2020
Refer to note on Page 4 for Economic Loss Estimates
Table 6 – 2 Alcohol Related Crash History
Table 6 – 3 Manner of Collision in Alcohol Related Crashes
Fatalities $1,722,282,151Suspected Serious Injuries $276,900,997Suspected Minor Injuries $186,564,132Possible Injuries $114,387,805Property Damage Only $26,368,920
$2,326,504,005TOTAL
Year Alcohol Related Crashes
Percent of all Crashes
Persons Killed
Percent of all Fatalities
Persons Injured
Percent of all Injuries
2016 4,965 3.90% 302 31.72% 3,351 5.88%2017 4,921 3.85% 325 32.57% 3,181 5.69%2018 4,705 3.68% 265 26.21% 3,014 5.61%2019 4,944 3.79% 258 26.33% 2,999 5.55%2020 4,506 4.56% 181 17.12% 2,863 6.92%
TotalPercentof All
CrashesFatal
Percentof Fatal Crashes
InjuryPercentof Injury Crashes
PDOPercent of
PDO Crashes
Angle 386 14.48% 17 14.53% 182 15.76% 187 13.42%Left Turn 270 10.13% 7 5.98% 148 12.81% 115 8.26%Rear End 1,062 39.85% 20 17.09% 444 38.44% 598 42.93%Head-On 192 7.20% 16 13.68% 87 7.53% 89 6.39%Sideswipe (same) 343 12.87% 3 2.56% 111 9.61% 229 16.44%Sideswipe (opposite) 125 4.69% 8 6.84% 29 2.51% 88 6.32%U-Turn 12 0.45% 0 0.00% 6 0.52% 6 0.43%Other* 260 9.76% 46 39.32% 144 12.47% 70 5.03%Unknown 15 0.56% 0 0.00% 4 0.35% 11 0.79%
TOTAL 2,665 100.00% 117 100.00% 1,155 100.00% 1,393 100.00%
Manner ofCollision Type
Number of Crashes
Note: Includes only multi-vehicle alcohol related crashes*Other includes pedestrian and pedalcyclist crashes
Section 6: – Alcohol Related Crashes
Page 35 – 2020 Arizona Crash Facts Summary
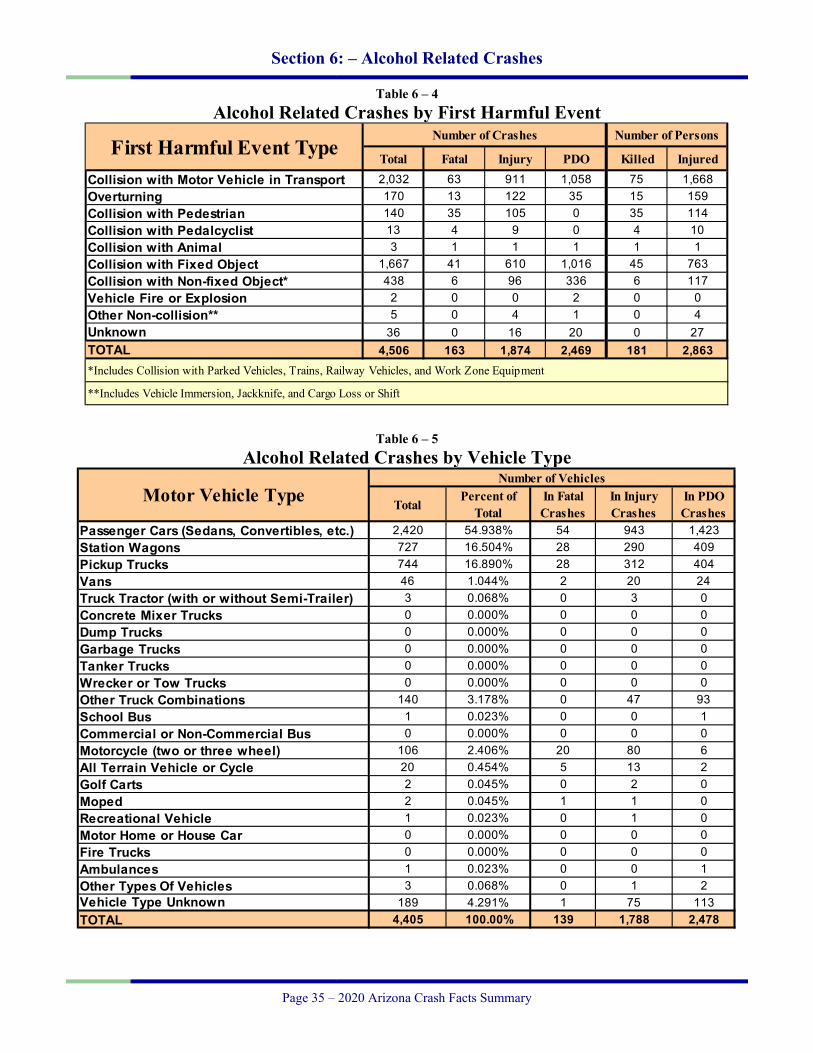
Table 6 – 4 Alcohol Related Crashes by First Harmful Event
Table 6 – 5 Alcohol Related Crashes by Vehicle Type
Number of Crashes Number of Persons
Total Fatal Injury PDO Killed InjuredCollision with Motor Vehicle in Transport 2,032 63 911 1,058 75 1,668Overturning 170 13 122 35 15 159Collision with Pedestrian 140 35 105 0 35 114Collision with Pedalcyclist 13 4 9 0 4 10Collision with Animal 3 1 1 1 1 1Collision with Fixed Object 1,667 41 610 1,016 45 763Collision with Non-fixed Object* 438 6 96 336 6 117Vehicle Fire or Explosion 2 0 0 2 0 0Other Non-collision** 5 0 4 1 0 4Unknown 36 0 16 20 0 27TOTAL 4,506 163 1,874 2,469 181 2,863
First Harmful Event Type
*Includes Collision with Parked Vehicles, Trains, Railway Vehicles, and Work Zone Equipment
**Includes Vehicle Immersion, Jackknife, and Cargo Loss or Shift
Number of Vehicles
TotalPercent of
TotalIn Fatal Crashes
In Injury Crashes
In PDO Crashes
Passenger Cars (Sedans, Convertibles, etc.) 2,420 54.938% 54 943 1,423Station Wagons 727 16.504% 28 290 409Pickup Trucks 744 16.890% 28 312 404Vans 46 1.044% 2 20 24Truck Tractor (with or without Semi-Trailer) 3 0.068% 0 3 0Concrete Mixer Trucks 0 0.000% 0 0 0Dump Trucks 0 0.000% 0 0 0Garbage Trucks 0 0.000% 0 0 0Tanker Trucks 0 0.000% 0 0 0Wrecker or Tow Trucks 0 0.000% 0 0 0Other Truck Combinations 140 3.178% 0 47 93School Bus 1 0.023% 0 0 1Commercial or Non-Commercial Bus 0 0.000% 0 0 0Motorcycle (two or three wheel) 106 2.406% 20 80 6All Terrain Vehicle or Cycle 20 0.454% 5 13 2Golf Carts 2 0.045% 0 2 0Moped 2 0.045% 1 1 0Recreational Vehicle 1 0.023% 0 1 0Motor Home or House Car 0 0.000% 0 0 0Fire Trucks 0 0.000% 0 0 0Ambulances 1 0.023% 0 0 1Other Types Of Vehicles 3 0.068% 0 1 2Vehicle Type Unknown 189 4.291% 1 75 113TOTAL 4,405 100.00% 139 1,788 2,478
Motor Vehicle Type
Section 6: – Alcohol Related Crashes
Page 36 – 2020 Arizona Crash Facts Summary
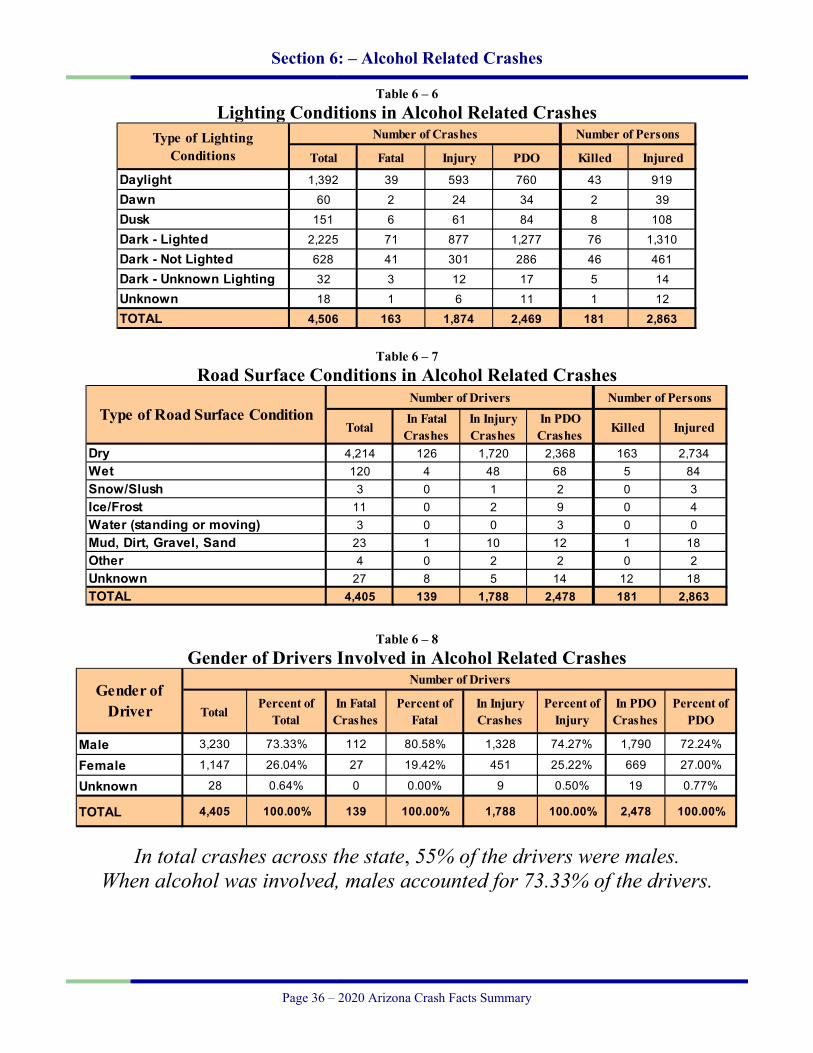
Table 6 – 6 Lighting Conditions in Alcohol Related Crashes
Table 6 – 7 Road Surface Conditions in Alcohol Related Crashes
Table 6 – 8 Gender of Drivers Involved in Alcohol Related Crashes
In total crashes across the state, 55% of the drivers were males. When alcohol was involved, males accounted for 73.33% of the drivers.
Number of Persons
Total Fatal Injury PDO Killed Injured
Daylight 1,392 39 593 760 43 919Dawn 60 2 24 34 2 39Dusk 151 6 61 84 8 108Dark - Lighted 2,225 71 877 1,277 76 1,310Dark - Not Lighted 628 41 301 286 46 461Dark - Unknown Lighting 32 3 12 17 5 14Unknown 18 1 6 11 1 12TOTAL 4,506 163 1,874 2,469 181 2,863
Type of Lighting Conditions
Number of Crashes
Number of Persons
TotalIn Fatal Crashes
In Injury Crashes
In PDO Crashes Killed Injured
Dry 4,214 126 1,720 2,368 163 2,734Wet 120 4 48 68 5 84Snow/Slush 3 0 1 2 0 3Ice/Frost 11 0 2 9 0 4Water (standing or moving) 3 0 0 3 0 0Mud, Dirt, Gravel, Sand 23 1 10 12 1 18Other 4 0 2 2 0 2Unknown 27 8 5 14 12 18TOTAL 4,405 139 1,788 2,478 181 2,863
Type of Road Surface ConditionNumber of Drivers
Male 3,230 73.33% 112 80.58% 1,328 74.27% 1,790 72.24%
Female 1,147 26.04% 27 19.42% 451 25.22% 669 27.00%
Unknown 28 0.64% 0 0.00% 9 0.50% 19 0.77%
TOTAL 4,405 100.00% 139 100.00% 1,788 100.00% 2,478 100.00%
In Fatal Crashes
Gender of Driver Total
Percent of Total
Number of Drivers
Percent of PDO
Percent of Fatal
In Injury Crashes
Percent of Injury
In PDO Crashes

Section 6: – Alcohol Related Crashes
Page 37 – 2020 Arizona Crash Facts Summary
Table 6 – 9 Driver Involvement by Age in Alcohol Related Crashes
Table 6 – 10 When Alcohol Related Crashes Occurred in 2020
Table 6 – 11 Safety Device Usage for Drinking Drivers
Total Percentof Total
In Fatal Crashes
Percentof Fatal
In Injury Crashes
Percentof Injury
In PDO Crashes
Percentof PDO
15 & Under 6 0.14% 1 0.72% 0 0.00% 5 0.20%16 17 0.39% 1 0.72% 5 0.28% 11 0.44%17 25 0.57% 0 0.00% 11 0.62% 14 0.56%18 64 1.45% 3 2.16% 21 1.17% 40 1.61%19 71 1.61% 3 2.16% 24 1.34% 44 1.78%20 101 2.29% 0 0.00% 54 3.02% 47 1.90%21 156 3.54% 4 2.88% 68 3.80% 84 3.39%22 187 4.25% 7 5.04% 75 4.19% 105 4.24%23 155 3.52% 9 6.47% 65 3.64% 81 3.27%24 176 4.00% 5 3.60% 82 4.59% 89 3.59%
25-34 1,436 32.60% 39 28.06% 596 33.33% 801 32.32%35-44 872 19.80% 30 21.58% 342 19.13% 500 20.18%45-54 500 11.35% 12 8.63% 206 11.52% 282 11.38%55-64 423 9.60% 17 12.23% 161 9.00% 245 9.89%65-74 139 3.16% 4 2.88% 57 3.19% 78 3.15%
75 & Older 27 0.61% 4 2.88% 6 0.34% 17 0.69%Unknown 50 1.14% 0 0.00% 15 0.84% 35 1.41%
TOTAL 4,405 100.00% 139 100.00% 1,788 100.00% 2,478 100.00%
Driver Age Group
Number of Drivers
Time of Day Total Weekday Weekend*Daytime** 1,288 805 483Nighttime 3,218 1,342 1,876
Total 4,506 2,147 2,359
**Daytime refers to the hours between 6:00 a.m. and 6:00 p.m.
*Weekend begins at 6:00 p.m. on Friday and continues until 6:00 a.m. Monday. All other times and days are considered Weekdays.
Severity of Injury Safety Device Not Used
Lap BeltLap &
Shoulder Belt
Protective Helmet
Other Unknown Totals
No Injury 116 35 1,826 4 4 830 2,815Unknown Injury 4 0 40 0 0 129 173Possible Injury 44 6 282 0 0 131 463Suspected Minor Injury 132 2 345 9 1 154 643Suspected Serious Injury 100 1 63 15 0 67 246Fatal Injury 32 1 12 8 0 12 65TOTALS 428 45 2,568 36 5 1,323 4,405

Section 6: – Alcohol Related Crashes
Page 38 – 2020 Arizona Crash Facts Summary
Table 6 – 12
Persons Killed and Injured in Alcohol Related Crashes
Table 6 – 13 Alcohol Related Crashes by County
Persons Killed Persons Injured
Total Male Female Total Male FemaleGender
Unknown0-4 0 0 0 40 24 16 05-9 2 1 1 36 18 18 0
10-14 5 1 4 53 24 29 015-19 9 6 3 212 124 88 020-24 26 22 4 462 288 174 025-34 33 27 6 793 513 280 035-44 34 23 11 502 346 156 045-54 26 17 9 332 213 119 055-64 32 25 7 260 169 91 065-74 10 7 3 105 68 37 0
75 & Older 4 1 3 36 22 14 0Unknown 0 0 0 32 21 5 6
TOTAL 181 130 51 2,863 1,830 1,027 6
Age ofVictim
Number of Persons
Total Fatal Injury PDO Killed InjuredApache 30 3 20 7 3 29Cochise 30 2 10 18 2 11Coconino 159 7 76 76 8 109Gila 77 1 47 29 1 87Graham 29 3 12 14 5 27Greenlee 2 0 1 1 0 3La Paz 27 3 12 12 4 20Maricopa 2,834 74 1,115 1,645 81 1,730Mohave 173 9 78 86 10 117Navajo 66 7 29 30 7 42Pima 578 43 242 293 48 350Pinal 187 4 95 88 4 147Santa Cruz 9 0 4 5 0 5Yavapai 193 5 88 100 6 117Yuma 112 2 45 65 2 69TOTAL 4,506 163 1,874 2,469 181 2,863
CountyNumber of Crashes

Section 6: – Alcohol Related Crashes
Page 39 – 2020 Arizona Crash Facts Summary
Chart 6 – 1 All Alcohol Related Crashes vs. Fatal Alcohol Related Crashes by Day of Week
13 1522
16
25
42
30
502 515
979906
694
447 463
0
10
20
30
40
50
60
70
80
90
100
110
120
130
140
MON TUE WED THU FRI SAT SUN-1,000
-750
-500
-250
0
250
500
750
1,000
1,250
1,500Fatal Crashes All Crashes
Chart 6 – 2 All Alcohol Related Crashes vs. Fatal Alcohol Related Crashes by Month
10
19
108
1915
1114
1115
1714
345
241
369352
380407
393
478
420
380375 366
0
10
20
30
40
50
60
70
JAN FEB MAR APR MAY JUN JUL AUG SEP OCT NOV DEC0
50
100
150
200
250
300
350
400
450
500
550Fatal Crashes All Crashes

Section 6: – Alcohol Related Crashes
Page 40 – 2020 Arizona Crash Facts Summary
Chart 6 – 3 All Alcohol Related Crashes vs. Fatal Alcohol Related Crashes - Weekdays
0
2
4
6
8
10
12
14
16
18
20
22
24
12:0
0 A
M
1:00
AM
2:00
AM
3:00
AM
4:00
AM
5:00
AM
6:00
AM
7:00
AM
8:00
AM
9:00
AM
10:0
0 A
M
11:0
0 A
M
12:0
0 PM
1:00
PM
2:00
PM
3:00
PM
4:00
PM
5:00
PM
6:00
PM
7:00
PM
8:00
PM
9:00
PM
10:0
0 PM
11:0
0 PM
-500
-400
-300
-200
-100
0
100
200
300Fatal Crashes All Crashes
Chart 6 – 4 All Alcohol Related Crashes vs. Fatal Alcohol Related Crashes - Weekends
0
3
6
9
12
15
18
21
24
12:0
0 A
M
1:00
AM
2:00
AM
3:00
AM
4:00
AM
5:00
AM
6:00
AM
7:00
AM
8:00
AM
9:00
AM
10:0
0 A
M
11:0
0 A
M
12:0
0 PM
1:00
PM
2:00
PM
3:00
PM
4:00
PM
5:00
PM
6:00
PM
7:00
PM
8:00
PM
9:00
PM
10:0
0 PM
11:0
0 PM
-700
-600
-500
-400
-300
-200
-100
0
100
200
300
Fatal Crashes All Crashes

Section 6: – Alcohol Related Crashes
Page 41 – 2020 Arizona Crash Facts Summary
Table 6 – 14 Alcohol Related Crashes by Hour and Day of Week
Crashes during Weekends accounted for 52.35% of all Alcohol Related crashes and 54.60% of Alcohol Related Fatal Crashes.
Total Crashes Monday Tuesday Wednesday Thursday Friday Saturday Sunday Weekdays Weekends
All Fatal All Fatal All Fatal All Fatal All Fatal All Fatal All Fatal All Fatal All Fatal All Fatal12:00 AM 243 7 31 0 18 0 16 0 26 1 24 0 58 2 70 4 84 1 159 61:00 AM 271 7 23 0 16 0 27 1 22 0 40 3 57 1 86 2 105 4 166 32:00 AM 300 11 27 2 24 1 26 2 26 1 38 1 75 1 84 3 114 5 186 63:00 AM 164 7 16 0 10 2 19 1 18 1 20 0 38 1 43 2 67 4 97 34:00 AM 129 2 13 0 6 0 13 0 12 0 11 0 31 0 43 2 42 0 87 25:00 AM 97 3 6 0 6 0 7 0 5 0 16 0 25 2 32 1 34 0 63 36:00 AM 77 3 6 1 5 0 7 1 8 1 11 0 22 0 18 0 37 3 40 07:00 AM 59 1 10 0 4 0 10 1 2 0 4 0 15 0 14 0 30 1 29 08:00 AM 40 3 2 1 5 0 6 0 3 0 6 1 9 1 9 0 22 2 18 19:00 AM 38 1 2 0 7 1 5 0 4 0 7 0 7 0 6 0 25 1 13 010:00 AM 54 2 6 0 7 0 6 1 6 1 3 0 10 0 16 0 28 2 26 011:00 AM 66 2 8 1 8 0 10 0 11 0 6 0 14 1 9 0 43 1 23 112:00 PM 112 4 16 1 12 0 10 0 17 1 19 2 16 0 22 0 74 4 38 01:00 PM 108 2 15 0 9 0 12 0 18 0 15 0 23 1 16 1 69 0 39 22:00 PM 132 3 15 1 26 0 11 0 16 0 17 1 22 0 25 1 85 2 47 13:00 PM 161 1 15 0 26 0 24 1 20 0 19 0 22 0 35 0 104 1 57 04:00 PM 199 6 29 1 31 1 26 0 18 0 32 1 38 2 25 1 136 3 63 35:00 PM 242 9 20 0 25 0 31 1 28 0 48 1 52 5 38 2 152 2 90 76:00 PM 359 13 40 0 41 1 45 2 36 2 57 0 80 6 60 2 162 5 197 87:00 PM 332 14 30 0 28 1 35 3 43 2 64 3 69 5 63 0 136 6 196 88:00 PM 353 20 36 2 39 3 44 3 50 3 45 4 79 4 60 1 169 11 184 99:00 PM 335 19 28 1 45 3 38 2 48 1 62 2 67 6 47 4 159 7 176 1210:00 PM 343 11 31 0 34 1 42 3 40 0 73 5 77 0 46 2 147 4 196 711:00 PM 292 12 22 2 31 1 32 0 38 2 57 1 73 4 39 2 123 5 169 7
TOTAL 4,506 163 447 13 463 15 502 22 515 16 694 25 979 42 906 30 2,147 74 2,359 89
Hour Beginning

Section 7 Pedestrian and Pedalcyclist Crashes
Page 42 – 2020 Arizona Crash Facts Summary
Total Crashes98,778
100.00%Fatal
CrashesPedestrians
Killed232 235
15.23%Pedestrian
CrashesInjury
CrashesPedestrians
Injured1,523 1,291 1,3511.54% 84.77%
Possible Injuries
Suspected Minor
Injuries
Suspected Serious Injuries
421 623 307
Fatal Crashes
Pedalcyclists Killed
33 333.98%
Pedalcycle Crashes
Injury Crashes
Pedalcyclists Injured
830 797 8120.84% 96.02%
Possible Injuries
Suspected Minor Injuries
Suspected Serious Injuries
All Other Crashes
283 407 122
96,42597.62%
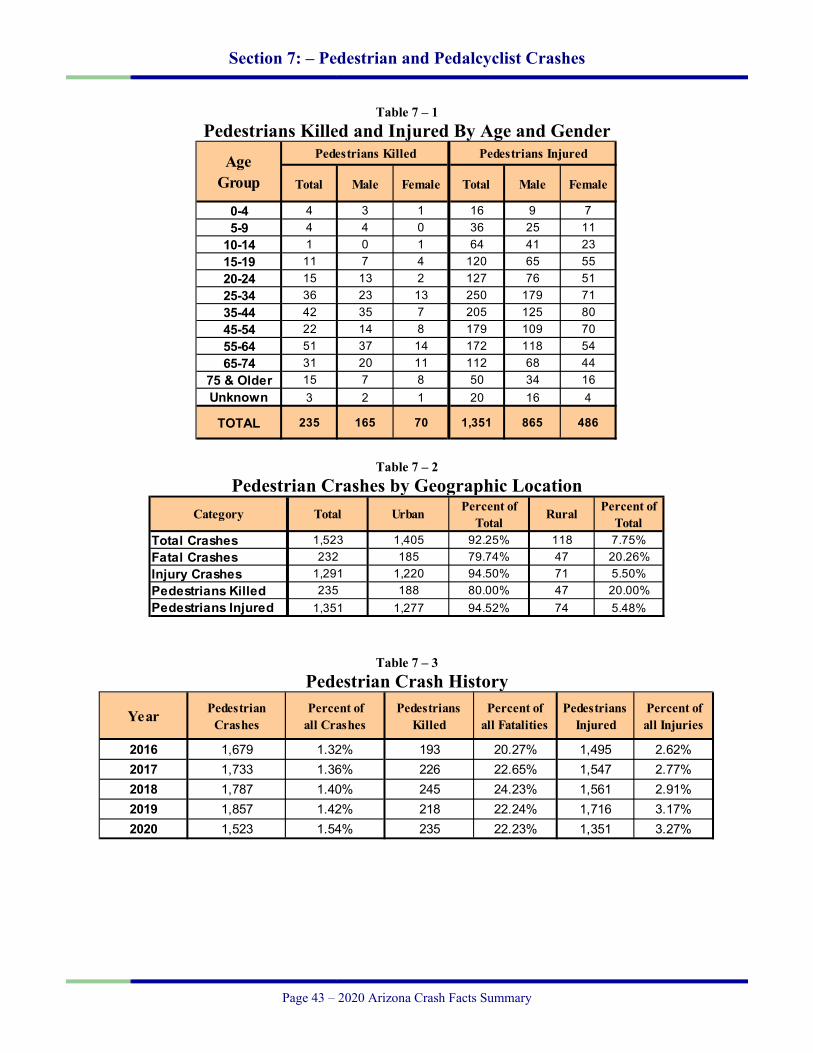
Section 7: – Pedestrian and Pedalcyclist Crashes
Page 43 – 2020 Arizona Crash Facts Summary
Table 7 – 1
Pedestrians Killed and Injured By Age and Gender
Table 7 – 2 Pedestrian Crashes by Geographic Location
Table 7 – 3 Pedestrian Crash History
Pedestrians Killed Pedestrians Injured
Total Male Female Total Male Female
0-4 4 3 1 16 9 75-9 4 4 0 36 25 11
10-14 1 0 1 64 41 2315-19 11 7 4 120 65 5520-24 15 13 2 127 76 5125-34 36 23 13 250 179 7135-44 42 35 7 205 125 8045-54 22 14 8 179 109 7055-64 51 37 14 172 118 5465-74 31 20 11 112 68 44
75 & Older 15 7 8 50 34 16Unknown 3 2 1 20 16 4
TOTAL 235 165 70 1,351 865 486
AgeGroup
Category Total Urban Percent of Total
Rural Percent of Total
Total Crashes 1,523 1,405 92.25% 118 7.75%Fatal Crashes 232 185 79.74% 47 20.26%Injury Crashes 1,291 1,220 94.50% 71 5.50%Pedestrians Killed 235 188 80.00% 47 20.00%Pedestrians Injured 1,351 1,277 94.52% 74 5.48%
Year Pedestrian Crashes
Percent of all Crashes
Pedestrians Killed
Percent of all Fatalities
Pedestrians Injured
Percent of all Injuries
2016 1,679 1.32% 193 20.27% 1,495 2.62%2017 1,733 1.36% 226 22.65% 1,547 2.77%2018 1,787 1.40% 245 24.23% 1,561 2.91%2019 1,857 1.42% 218 22.24% 1,716 3.17%2020 1,523 1.54% 235 22.23% 1,351 3.27%

Section 7: – Pedestrian and Pedalcyclist Crashes
Page 44 – 2020 Arizona Crash Facts Summary
Table 7 – 4 Pedestrians Killed by Age and Action
Table 7 – 5 Pedestrians Injured by Age and Action
Table 7 – 6 Pedestrian Physical Condition in Motor Vehicle Crashes
0-4 5-9 10-14 15-19 20-24 25-34 35-44 45-54 55-64 65-7475 & Older Unknown
Crossing Road 109 0 2 1 1 5 20 15 9 32 15 8 1Walking With Traffic 12 0 0 0 0 1 2 3 1 4 1 0 0Walking Against Traffic 11 0 0 0 1 0 1 0 3 3 2 1 0Standing 22 1 0 0 2 2 5 5 0 4 2 1 0Lying 7 0 0 0 0 0 2 3 1 0 1 0 0Getting on/off Vehicle 2 0 0 0 0 0 0 2 0 0 0 0 0Working on/pushing Veh 0 0 0 0 0 0 0 0 0 0 0 0 0Working on Road 0 0 0 0 0 0 0 0 0 0 0 0 0Other 16 2 0 0 1 1 3 2 3 2 0 2 0Unknown 56 1 2 0 6 6 3 12 5 6 10 3 2TOTAL 235 4 4 1 11 15 36 42 22 51 31 15 3
PedestrianAction
TotalAge Group of Pedestrian
0-4 5-9 10-14 15-19 20-24 25-34 35-44 45-54 55-64 65-7475 & Older Unknown
Crossing Road 838 8 26 44 78 81 141 121 112 113 73 29 12Walking With Traffic 75 0 1 5 11 7 13 14 8 5 9 1 1Walking Against Traffic 82 0 0 6 9 3 18 11 15 9 5 6 0Standing 113 2 3 1 8 14 21 21 17 13 7 4 2Lying 5 0 0 0 0 0 1 2 1 1 0 0 0Getting on/off Vehicle 10 0 0 0 2 2 1 0 1 3 0 1 0Working on/pushing Veh 1 0 0 0 0 0 1 0 0 0 0 0 0Working on Road 9 0 0 0 0 2 1 3 2 0 1 0 0Other 150 4 5 6 6 15 33 25 18 18 12 4 4Unknown 68 2 1 2 6 3 20 8 5 10 5 5 1TOTAL 1,351 16 36 64 120 127 250 205 179 172 112 50 20
PedestrianAction
TotalAge Group of Pedestrian
Total Percentof Total
In Fatal Crashes
Percent of Fatal
In Injury Crashes
Percent of Injury
No Apparent Influence 1,001 63.11% 59 23.51% 942 70.56%Alcohol 123 7.76% 32 12.75% 91 6.82%Illegal Drugs 30 1.89% 13 5.18% 17 1.27%Medications 0 0.00% 0 0.00% 0 0.00%Marijuana 2 0.13% 2 0.80% 0 0.00%Illness or Physical Impairment 4 0.25% 0 0.00% 4 0.30%Fell Asleep or Fatigued 1 0.06% 1 0.40% 0 0.00%Other 12 0.76% 0 0.00% 12 0.90%Unknown 413 26.04% 144 57.37% 269 20.15%TOTAL 1,586 100.00% 251 100.00% 1,335 100.00%
Type of Condition
Number of Pedestrians

Section 7: – Pedestrian and Pedalcyclist Crashes
Page 45 – 2020 Arizona Crash Facts Summary
Table 7 – 7 Lighting Conditions in Pedestrian Crashes
Table 7 – 8 Weather Conditions in Pedestrian Crashes
Table 7 – 9 Pedalcyclists Killed and Injured by Age and Gender
Total Fatal InjuryDaylight 682 41 641Dawn 28 3 25Dusk 30 3 27Dark - Lighted 593 104 489Dark - Not Lighted 147 50 97Dark - Unknown Lighting 17 8 9Unknown 26 23 3TOTAL 1,523 232 1,291
Type of Lighting Conditions
Number of Crashes
Total Fatal InjuryClear 1,357 160 1,197Cloudy 70 19 51Sleet/Hail 1 0 1Rain 34 3 31Snow or Blowing Snow 1 0 1Severe Crosswinds 0 0 0Blowing Sand, Soil, Dirt 1 0 1Fog, Smog, Smoke 0 0 0Other 4 0 4Unknown 55 50 5TOTAL 1,523 232 1,291
Type of Weather Conditions Number of Crashes
Pedalcyclists Killed Pedalcyclists Injured
Total Male Female Total Male Female
0-4 1 1 0 5 4 15-9 0 0 0 4 4 0
10-14 1 0 1 53 43 1015-19 0 0 0 73 57 1620-24 0 0 0 72 47 2525-34 3 3 0 150 112 3835-44 3 2 1 105 79 2645-54 4 4 0 107 83 2455-64 14 11 3 121 96 2565-74 4 4 0 72 62 10
75 & Older 3 3 0 34 32 2Unknown 0 0 0 16 15 1
TOTAL 33 28 5 812 634 178
AgeGroup

Section 7: – Pedestrian and Pedalcyclist Crashes
Page 46 – 2020 Arizona Crash Facts Summary
Table 7 – 10 Pedalcycle Crashes by Geographic Location
Table 7 – 11 Pedalcycle Crash History
Table 7 – 12 Lighting Conditions in Pedalcyclist Crashes
Table 7 – 13 Weather Conditions in Pedalcyclist Crashes
Category Total Urban Percent of Total
Rural Percent of Total
Total Crashes 830 755 90.96% 75 9.04%Fatal Crashes 33 20 60.61% 13 39.39%Injury Crashes 797 735 92.22% 62 7.78%Pedalcyclists Killed 33 21 63.64% 12 36.36%Pedalcyclists Injured 812 745 91.75% 67 8.25%
YearPedalcycle Crashes
Percent of all Crashes
Pedalcyclists Killed
Percent of all Fatalities
Pedalcyclists Injured
Percent of all Injuries
2016 1,518 1.19% 31 3.26% 1,389 2.44%2017 1,523 1.19% 32 3.21% 1,406 2.51%2018 1,291 1.01% 24 2.37% 1,194 2.22%2019 1,279 0.98% 30 3.06% 1,262 2.33%2020 830 0.84% 33 3.12% 812 1.96%
Total Fatal Injury
Daylight 618 16 602Dawn 12 2 10Dusk 27 3 24Dark - Lighted 141 4 137Dark - Not Lighted 25 5 20Dark - Unknown Lighting 2 1 1Unknown 5 2 3TOTAL 830 33 797
Type of Lighting Conditions
Number of Crashes
Total Fatal InjuryClear 765 28 737Cloudy 44 1 43Sleet/Hail 0 0 0Rain 7 0 7Snow or Blowing Snow 0 0 0Severe Crosswinds 0 0 0Blowing Sand, Soil, Dirt 0 0 0Fog, Smog, Smoke 1 0 1Other 0 0 0Unknown 13 4 9TOTAL 830 33 797
Type of Weather Conditions Number of Crashes

Section 7: – Pedestrian and Pedalcyclist Crashes
Page 47 – 2020 Arizona Crash Facts Summary
Table 7 – 14 Pedestrian Crashes by County
Maricopa and Pima Counties accounted for 80.85% of pedestrian fatalities.
Table 7 – 15 Pedalcyclist Crashes by County
Number of PedestriansTotal Fatal Injury Killed Injured
Apache 8 4 4 4 4Cochise 12 3 9 3 9Coconino 40 8 32 8 32Gila 13 5 8 5 8Graham 3 1 2 1 2Greenlee 0 0 0 0 0La Paz 1 1 0 1 0Maricopa 1,076 143 933 145 976Mohave 27 4 23 4 23Navajo 10 4 6 4 6Pima 241 44 197 45 212Pinal 33 6 27 6 27Santa Cruz 1 0 1 0 1Yavapai 24 3 21 3 23Yuma 34 6 28 6 28TOTAL 1,523 232 1,291 235 1,351
County Number of Crashes
Number of PedalcyclistsTotal Fatal Injury Killed Injured
Apache 1 0 1 0 1Cochise 12 4 8 4 8Coconino 19 1 18 1 18Gila 2 0 2 0 2Graham 1 1 0 1 1Greenlee 0 0 0 0 0La Paz 0 0 0 0 0Maricopa 576 15 561 16 571Mohave 13 0 13 0 13Navajo 5 1 4 1 4Pima 126 7 119 7 120Pinal 43 2 41 2 43Santa Cruz 2 1 1 1 1Yavapai 16 1 15 0 16Yuma 14 0 14 0 14TOTAL 830 33 797 33 812
County Number of Crashes
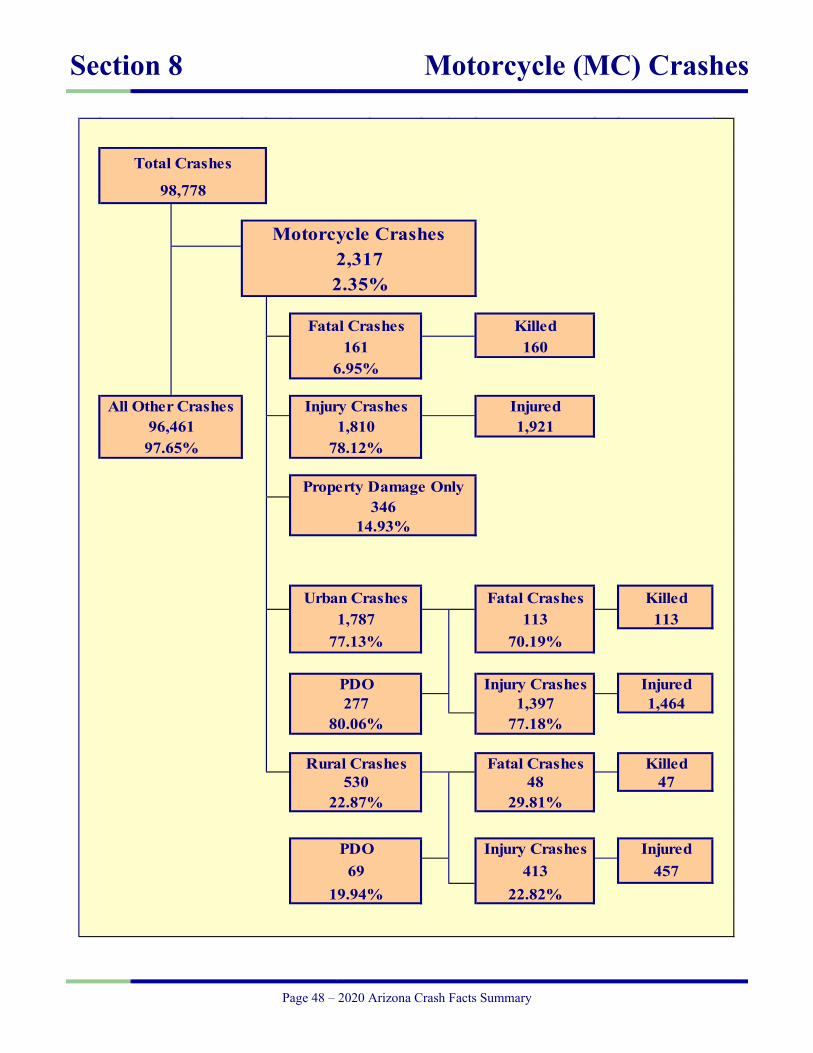
Section 8 Motorcycle (MC) Crashes
Page 48 – 2020 Arizona Crash Facts Summary
Total Crashes
98,778
Motorcycle Crashes2,3172.35%
Fatal Crashes Killed161 160
6.95%
All Other Crashes Injury Crashes Injured96,461 1,810 1,92197.65% 78.12%
Property Damage Only346
14.93%
Urban Crashes Fatal Crashes Killed1,787 113 113
77.13% 70.19%
PDO Injury Crashes Injured277 1,397 1,464
80.06% 77.18%
Rural Crashes Fatal Crashes Killed530 48 47
22.87% 29.81%
PDO Injury Crashes Injured69 413 457
19.94% 22.82%

Section 8: – Motorcycle (MC) Crashes
Page 49 – 2020 Arizona Crash Facts Summary
Chart 8 – 1 Chart 8 – 2 MC Fatalities by Year MC Registrations in Arizona
160
154
170
161
145
135
145
155
165
175
2016 2017 2018 2019 2020
275,632
210,427
209,719
207,610
203,498
197,000
207,000
217,000
227,000
237,000
247,000
257,000
267,000
277,000
2016 2017 2018 2019 2020
Total Point-in-Time of Registered Motorcycles at the end of
Calendar year 2020. (Source: MVD - MV988 MV630419 Currently Registered Vehicles by County
Listing (motorcycle sub category), reports dated 12/31/2020.)
Chart 8 – 3 Chart 8 – 4 Fatality Rate per Registered MC Percent of MC Crashes to All Crashes
0.58
0.732
0.8110.775
0.713
0.50
0.60
0.70
0.80
2016 2017 2018 2019 2020
2.35%
2.16%
2.06%
2.29%
2.45%
2.0%
2.2%
2.4%
2016 2017 2018 2019 2020

Section 8: – Motorcycle (MC) Crashes
Page 50 – 2020 Arizona Crash Facts Summary
Table 8 – 1 MC Crashes by First Harmful Event
Table 8 – 2 Lighting Conditions in MC Crashes
Table 8 – 3 Road Surface Conditions in MC Crashes
Number of Crashes
Total Fatal Injury PDOCollision with Motor Vehicle in Transport 1,309 95 961 253Overturning 323 20 284 19Collision with Pedestrian 15 1 14 0Collision with Pedalcyclist 7 1 6 0Collision with Animal 22 0 19 3Collision with Fixed Object 455 35 382 38Collision with Non-fixed Object* 85 2 59 24Vehicle Fire or Explosion 5 0 3 2Other Non-collision** 60 1 54 5Unknown 36 6 28 2TOTAL 2,317 161 1,810 346
First Harmful Event Type
*Includes Collision with Parked Vehicles, Trains, Railway Vehicles, and Work Zone Equipment
**Includes Vehicle Immersion, Jackknife, and Cargo Loss or Shift
Total Fatal Injury PDODaylight 1,533 81 1,206 246Dawn 37 2 30 5Dusk 86 7 65 14Dark - Lighted 492 44 384 64Dark - Not Lighted 147 14 118 15Dark - Unknown Lighting 7 3 3 1Unknown 15 10 4 1TOTAL 2,317 161 1,810 346
Type of Lighting Conditions
Number of Crashes
TotalIn Fatal Crashes
In Injury Crashes
In PDO Crashes
Dry 2,265 139 1,794 332Wet 28 1 25 2Snow/Slush 1 0 1 0Ice/Frost 1 0 1 0Water (standing or moving) 2 0 1 1Mud, Dirt, Gravel, Sand 28 2 21 5Other 6 0 6 0Unknown 42 21 6 15TOTAL 2,373 163 1,855 355
Type of Road Surface ConditionNumber of Operators

Section 8: – Motorcycle (MC) Crashes
Page 51 – 2020 Arizona Crash Facts Summary
Table 8 – 4 MC Crashes by Geographic Location
Table 8 – 5
Operator Involvement by Age in MC Crashes
Table 8 – 6 MC Operator Physical Condition
Category Total Urban Percent of Total
Rural Percent of Total
Total Crashes 2,317 1,787 77.13% 530 22.87%Fatal Crashes 161 113 70.19% 48 29.81%Injury Crashes 1,810 1,397 77.18% 413 22.82%PDO Crashes 346 277 80.06% 69 19.94%Persons Killed 160 113 70.63% 47 29.38%Persons Injured 1,921 1,464 76.21% 457 23.79%
TotalPercentof Total
In Fatal Crashes
Percentof Fatal
In Injury Crashes
Percentof Injury
In PDO Crashes
Percentof PDO
15 & Under 15 0.63% 0 0.00% 13 0.70% 2 0.56%16 10 0.42% 1 0.61% 9 0.49% 0 0.00%17 9 0.38% 1 0.61% 8 0.43% 0 0.00%18 41 1.73% 1 0.61% 36 1.94% 4 1.13%19 47 1.98% 3 1.84% 38 2.05% 6 1.69%20 63 2.65% 3 1.84% 51 2.75% 9 2.54%21 69 2.91% 2 1.23% 60 3.23% 7 1.97%22 73 3.08% 4 2.45% 56 3.02% 13 3.66%23 73 3.08% 5 3.07% 63 3.40% 5 1.41%24 72 3.03% 4 2.45% 60 3.23% 8 2.25%
25-34 530 22.33% 32 19.63% 424 22.86% 74 20.85%35-44 383 16.14% 20 12.27% 314 16.93% 49 13.80%45-54 382 16.10% 25 15.34% 303 16.33% 54 15.21%55-64 344 14.50% 37 22.70% 258 13.91% 49 13.80%65-74 157 6.62% 17 10.43% 123 6.63% 17 4.79%
75 & Older 31 1.31% 7 4.29% 21 1.13% 3 0.85%Unknown 74 3.12% 1 0.61% 18 0.97% 55 15.49%
TOTAL 2,373 100.00% 163 100.00% 1,855 100.00% 355 100.00%
Operator Age Group
Number of Operators
TotalPercentof Total
In Fatal Crashes
Percent of Fatal
In Injury Crashes
Percent of Injury
In PDO Crashes
Percent of PDO
No Apparent Influence 1,905 80.28% 49 30.06% 1,575 84.91% 281 79.15%Alcohol 106 4.47% 20 12.27% 80 4.31% 6 1.69%Illegal Drugs 20 0.84% 15 9.20% 5 0.27% 0 0.00%Medications 0 0.00% 0 0.00% 0 0.00% 0 0.00%Marijuana 5 0.21% 4 2.45% 1 0.05% 0 0.00%Illness or Physical Impairment 8 0.34% 0 0.00% 7 0.38% 1 0.28%Fell Asleep or Fatigued 4 0.17% 0 0.00% 4 0.22% 0 0.00%Other 9 0.38% 1 0.61% 5 0.27% 3 0.85%Unknown 316 13.32% 74 45.40% 178 9.60% 64 18.03%TOTAL 2,373 100.00% 163 100.00% 1,855 100.00% 355 100.00%
Type of Condition
Number of Operators

Section 8: – Motorcycle (MC) Crashes
Page 52 – 2020 Arizona Crash Facts Summary
Table 8 – 7 MC Operator’s Helmet Use
Table 8 – 8 MC Passenger’s Helmet Use
Table 8 – 9
Helmet Use by Gender
Severity of InjuryHelmet
UsedPercent of
TotalHelmet
Not UsedPercent of
Total UnknownPercent of
Total TotalPercent of
TotalNo Injury 166 14.16% 43 9.17% 152 20.77% 361 15.21%Unknown Injury 11 0.94% 2 0.43% 42 5.74% 55 2.32%Possible Injury 193 16.47% 63 13.43% 126 17.21% 382 16.10%Suspected Minor Injury 517 44.11% 158 33.69% 268 36.61% 943 39.74%Suspected Serious Injury 215 18.34% 136 29.00% 128 17.49% 479 20.19%Fatal Injury 70 5.97% 67 14.29% 16 2.19% 153 6.45%TOTALS 1,172 100.00% 469 100.00% 732 100.00% 2,373 100.00%
Severity of InjuryHelmet
UsedPercent of
TotalHelmet
Not UsedPercent of
Total UnknownPercent of
Total TotalPercent of
TotalNo Injury 12 17.39% 2 4.44% 7 19.44% 21 14.00%Unknown Injury 1 1.45% 0 0.00% 4 11.11% 5 3.33%Possible Injury 11 15.94% 5 11.11% 3 8.33% 19 12.67%Suspected Minor Injury 31 44.93% 22 48.89% 11 30.56% 64 42.67%Suspected Serious Injury 13 18.84% 10 22.22% 11 30.56% 34 22.67%Fatal Injury 1 1.45% 6 13.33% 0 0.00% 7 4.67%TOTALS 69 100.00% 45 100.00% 36 100.00% 150 100.00%
Helmet Used
Percent of Helmet Used
Helmet Not Used
Percent of Helmet Not
Used
Helmet Use Unknown
Percent of Unknown
Total Percent of Total
Male 1,087 87.59% 446 86.77% 656 85.42% 2,189 86.76%
Female 145 11.68% 67 13.04% 71 9.24% 283 11.22%
Unknown 9 0.73% 1 0.19% 41 5.34% 51 2.02%
TOTAL 1,241 100.00% 514 100.00% 768 100.00% 2,523 100.00%
GenderNumber of Operators and Passengers

Section 8: – Motorcycle (MC) Crashes
Page 53 – 2020 Arizona Crash Facts Summary
Table 8 – 10 MC Operators and Passengers Killed and Injured
Table 8 – 11 MC Operator Violations
Persons Killed Persons Injured
Total Male Female Total Male Female GenderUnknown
0-4 0 0 0 0 0 0 05-9 0 0 0 1 1 0 0
10-14 0 0 0 13 9 4 015-19 6 6 0 99 90 9 020-24 17 16 1 305 278 27 025-34 32 31 1 441 399 42 035-44 19 19 0 324 285 39 045-54 27 21 6 309 258 51 055-64 35 31 4 275 236 39 065-74 17 15 2 121 106 15 0
75 & Older 7 7 0 21 21 0 0Unknown 0 0 0 12 9 1 2
TOTAL 160 146 14 1,921 1,692 227 2
Age ofVictim
Number of Operators
TotalPercentof Total
In Fatal Crashes
Percent of Fatal
In Injury Crashes
Percent of Injury
In PDO Crashes
Percent of PDO
No Improper Action 1,090 45.93% 41 25.15% 888 47.87% 161 45.35%Speed too Fast for Conditions 532 22.42% 35 21.47% 429 23.13% 68 19.15%Exceeded Lawful Speed 54 2.28% 14 8.59% 36 1.94% 4 1.13%Failed to Yield Right-Of-Way 59 2.49% 6 3.68% 44 2.37% 9 2.54%Followed Too Closely 76 3.20% 0 0.00% 52 2.80% 24 6.76%Ran Stop Sign 12 0.51% 0 0.00% 12 0.65% 0 0.00%Disregarded Traffic Signal 43 1.81% 8 4.91% 32 1.73% 3 0.85%Made Improper Turn 12 0.51% 0 0.00% 7 0.38% 5 1.41%Drove in Opposing Lane 3 0.13% 0 0.00% 3 0.16% 0 0.00%Drove Left of Center Line 13 0.55% 4 2.45% 9 0.49% 0 0.00%Passed in No-Passing Zone 10 0.42% 0 0.00% 10 0.54% 0 0.00%Unsafe Lane Change 43 1.81% 2 1.23% 35 1.89% 6 1.69%Failed to Keep in Proper Lane 98 4.13% 13 7.98% 71 3.83% 14 3.94%Crossed Median 1 0.04% 0 0.00% 1 0.05% 0 0.00%Aggressive Driving 8 0.34% 0 0.00% 7 0.38% 1 0.28%Wrong Way Driving 0 0.00% 0 0.00% 0 0.00% 0 0.00%Other 81 3.41% 6 3.68% 67 3.61% 8 2.25%Unknown 238 10.03% 34 20.86% 152 8.19% 52 14.65%TOTAL 2,373 100.00% 163 100.00% 1,855 100.00% 355 100.00%
Type of Violation or Behavior

Section 8: – Motorcycle (MC) Crashes
Page 54 – 2020 Arizona Crash Facts Summary
Chart 8 – 5 All MC Crashes vs. Fatal MC Crashes by Time of Day - Weekdays
0
2
4
6
8
10
12
14
16
18
20
22
24
12:0
0 A
M
1:00
AM
2:00
AM
3:00
AM
4:00
AM
5:00
AM
6:00
AM
7:00
AM
8:00
AM
9:00
AM
10:0
0 A
M
11:0
0 A
M
12:0
0 PM
1:00
PM
2:00
PM
3:00
PM
4:00
PM
5:00
PM
6:00
PM
7:00
PM
8:00
PM
9:00
PM
10:0
0 PM
11:0
0 PM
-350
-300
-250
-200
-150
-100
-50
0
50
100
150
200
250Fatal Crashes All Crashes
Chart 8 – 6 All MC Crashes vs. Fatal MC Crashes by Time of Day - Weekends
0
2
4
6
8
10
12
14
16
18
12:0
0 A
M
1:00
AM
2:00
AM
3:00
AM
4:00
AM
5:00
AM
6:00
AM
7:00
AM
8:00
AM
9:00
AM
10:0
0 A
M
11:0
0 A
M
12:0
0 PM
1:00
PM
2:00
PM
3:00
PM
4:00
PM
5:00
PM
6:00
PM
7:00
PM
8:00
PM
9:00
PM
10:0
0 PM
11:0
0 PM
-150
-120
-90
-60
-30
0
30
60
90
Fatal Crashes All Crashes

Section 8: – Motorcycle (MC) Crashes
Page 55 – 2020 Arizona Crash Facts Summary
Chart 8 – 7 All MC Crashes vs. Fatal MC Crashes by Day of Week
1619
28
18
2631
23
292 305
443
348355
274300
0
20
40
60
80
100
MON TUE WED THU FRI SAT SUN0
100
200
300
400
500
Fatal Crashes All Crashes
Chart 8 – 8 Alcohol Related MC Crashes vs. Fatal Alcohol Related MC Crashes by Day of Week
2
0
7
1
4
9
5
11 12
48
2528
7 9
0
6
12
18
24
30
MON TUE WED THU FRI SAT SUN-70
-40
-10
20
50
Fatal Crashes All Crashes
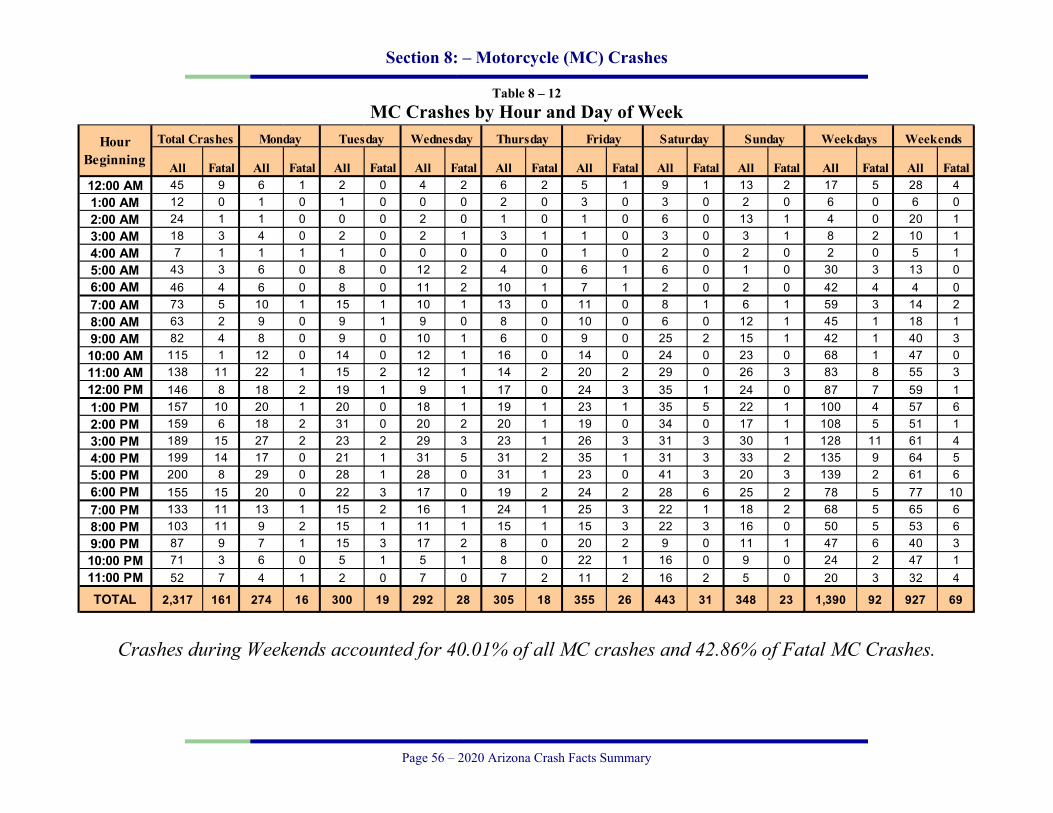
Section 8: – Motorcycle (MC) Crashes
Page 56 – 2020 Arizona Crash Facts Summary
Table 8 – 12 MC Crashes by Hour and Day of Week
Crashes during Weekends accounted for 40.01% of all MC crashes and 42.86% of Fatal MC Crashes.
Total Crashes Monday Tuesday Wednesday Thursday Friday Saturday Sunday Weekdays Weekends
All Fatal All Fatal All Fatal All Fatal All Fatal All Fatal All Fatal All Fatal All Fatal All Fatal12:00 AM 45 9 6 1 2 0 4 2 6 2 5 1 9 1 13 2 17 5 28 41:00 AM 12 0 1 0 1 0 0 0 2 0 3 0 3 0 2 0 6 0 6 02:00 AM 24 1 1 0 0 0 2 0 1 0 1 0 6 0 13 1 4 0 20 13:00 AM 18 3 4 0 2 0 2 1 3 1 1 0 3 0 3 1 8 2 10 14:00 AM 7 1 1 1 1 0 0 0 0 0 1 0 2 0 2 0 2 0 5 15:00 AM 43 3 6 0 8 0 12 2 4 0 6 1 6 0 1 0 30 3 13 06:00 AM 46 4 6 0 8 0 11 2 10 1 7 1 2 0 2 0 42 4 4 07:00 AM 73 5 10 1 15 1 10 1 13 0 11 0 8 1 6 1 59 3 14 28:00 AM 63 2 9 0 9 1 9 0 8 0 10 0 6 0 12 1 45 1 18 19:00 AM 82 4 8 0 9 0 10 1 6 0 9 0 25 2 15 1 42 1 40 310:00 AM 115 1 12 0 14 0 12 1 16 0 14 0 24 0 23 0 68 1 47 011:00 AM 138 11 22 1 15 2 12 1 14 2 20 2 29 0 26 3 83 8 55 312:00 PM 146 8 18 2 19 1 9 1 17 0 24 3 35 1 24 0 87 7 59 11:00 PM 157 10 20 1 20 0 18 1 19 1 23 1 35 5 22 1 100 4 57 62:00 PM 159 6 18 2 31 0 20 2 20 1 19 0 34 0 17 1 108 5 51 13:00 PM 189 15 27 2 23 2 29 3 23 1 26 3 31 3 30 1 128 11 61 44:00 PM 199 14 17 0 21 1 31 5 31 2 35 1 31 3 33 2 135 9 64 55:00 PM 200 8 29 0 28 1 28 0 31 1 23 0 41 3 20 3 139 2 61 66:00 PM 155 15 20 0 22 3 17 0 19 2 24 2 28 6 25 2 78 5 77 107:00 PM 133 11 13 1 15 2 16 1 24 1 25 3 22 1 18 2 68 5 65 68:00 PM 103 11 9 2 15 1 11 1 15 1 15 3 22 3 16 0 50 5 53 69:00 PM 87 9 7 1 15 3 17 2 8 0 20 2 9 0 11 1 47 6 40 310:00 PM 71 3 6 0 5 1 5 1 8 0 22 1 16 0 9 0 24 2 47 111:00 PM 52 7 4 1 2 0 7 0 7 2 11 2 16 2 5 0 20 3 32 4
TOTAL 2,317 161 274 16 300 19 292 28 305 18 355 26 443 31 348 23 1,390 92 927 69
Hour Beginning
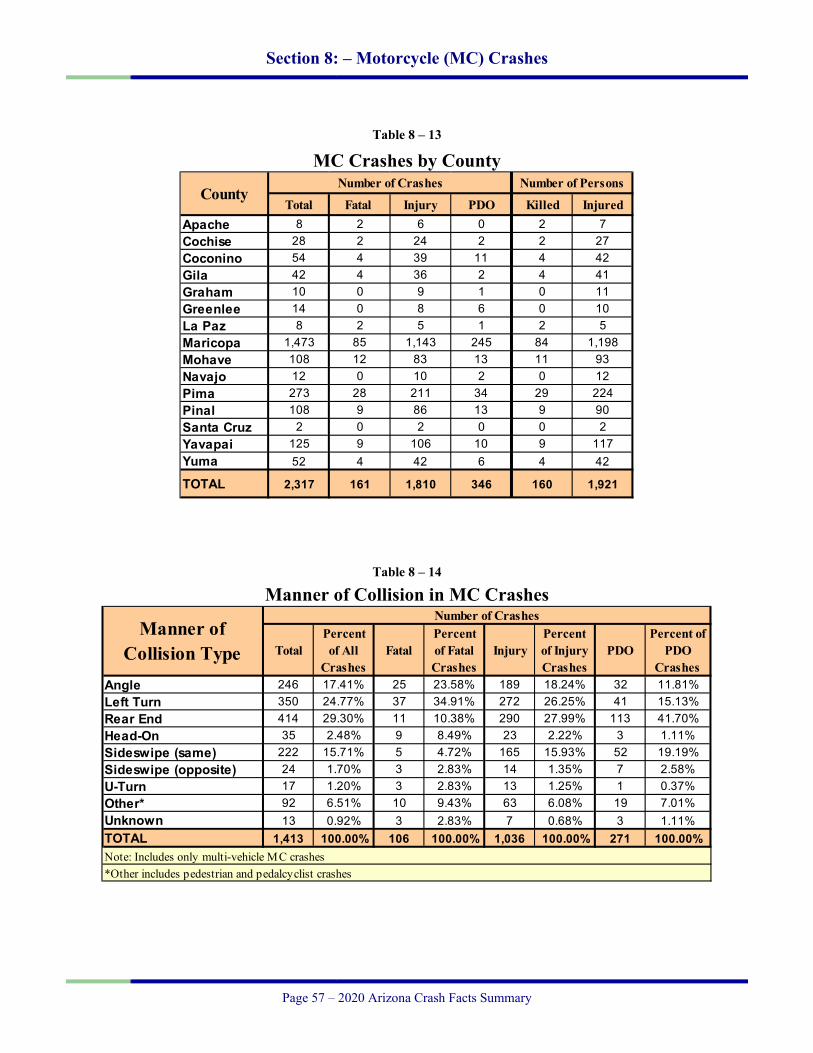
Section 8: – Motorcycle (MC) Crashes
Page 57 – 2020 Arizona Crash Facts Summary
Table 8 – 13 MC Crashes by County
Table 8 – 14 Manner of Collision in MC Crashes
Number of Persons
Total Fatal Injury PDO Killed InjuredApache 8 2 6 0 2 7Cochise 28 2 24 2 2 27Coconino 54 4 39 11 4 42Gila 42 4 36 2 4 41Graham 10 0 9 1 0 11Greenlee 14 0 8 6 0 10La Paz 8 2 5 1 2 5Maricopa 1,473 85 1,143 245 84 1,198Mohave 108 12 83 13 11 93Navajo 12 0 10 2 0 12Pima 273 28 211 34 29 224Pinal 108 9 86 13 9 90Santa Cruz 2 0 2 0 0 2Yavapai 125 9 106 10 9 117Yuma 52 4 42 6 4 42
TOTAL 2,317 161 1,810 346 160 1,921
CountyNumber of Crashes
TotalPercentof All
CrashesFatal
Percentof Fatal Crashes
InjuryPercentof Injury Crashes
PDOPercent of
PDO Crashes
Angle 246 17.41% 25 23.58% 189 18.24% 32 11.81%Left Turn 350 24.77% 37 34.91% 272 26.25% 41 15.13%Rear End 414 29.30% 11 10.38% 290 27.99% 113 41.70%Head-On 35 2.48% 9 8.49% 23 2.22% 3 1.11%Sideswipe (same) 222 15.71% 5 4.72% 165 15.93% 52 19.19%Sideswipe (opposite) 24 1.70% 3 2.83% 14 1.35% 7 2.58%U-Turn 17 1.20% 3 2.83% 13 1.25% 1 0.37%Other* 92 6.51% 10 9.43% 63 6.08% 19 7.01%Unknown 13 0.92% 3 2.83% 7 0.68% 3 1.11%TOTAL 1,413 100.00% 106 100.00% 1,036 100.00% 271 100.00%
*Other includes pedestrian and pedalcyclist crashesNote: Includes only multi-vehicle MC crashes
Manner ofCollision Type
Number of Crashes

Page 58 – 2020 Arizona Crash Facts Summary
Acknowledgements
Special gratitude to our other providers of data and information including:
The Information Technology Group, Arizona Department of Transportation
Motor Vehicle Division, Arizona Department of Transportation
Multimodal Planning Division, Arizona Department of Transportation
The Federal Highway Administration, U.S. Department of Transportation
National Highway Transportation Safety Administration