Embed Size (px)
Citation preview

2020 FISCAL STRATEGY
DOCUMENT
Presented to Cabinet on 31st May 2019
By
Ken Ofori-Atta
Minister for Finance
In Fulfilment of the Requirements of Section 15 of the Public Financial Management Act, 2016 (Act 921) and Regulation 6 of the
PFM Regulations (LI2378)
i
Acronyms and Abbreviations ABFA Annual Budget Funding Amount
ATM Average Time to Maturity
BoG Bank of Ghana
BoP Balance of Payments
CAGD Controller and Accountant General’s Department
CAPEX Capital Expenditure
CBG Consolidated Bank Ghana Limited
CMO Commodities Market Outlook
DSA Debt Sustainability Analysis
ECF Extended Credit Facility
ECG Electricity Company of Ghana
EDRL Energy Debt Recovery Levy
EPOS Electric Point of Sales
ESLA Energy Sector Levy Act
ESRP Energy Sector Recovery Programme
FCCL Fiscal Commitment and Contingent Liabilities
FRA Fiscal Responsibility Act
FSD Fiscal Strategy Document
FX Foreign Currency
FRU Fiscal Risk Unit
GAT Ghana Amalgamated Trust
GDP Gross Domestic Product
GETFund Ghana Education Trust Fund
GH¢ Ghana Cedi
GIS Gross International Reserve
GRIDCO Ghana Grid Company Limited
GSE-CI Ghana Stock Exchange Composite Index
GSS Ghana Statistical Service
HIPC Heavily Indebted Poor Countries
IPP Independent Power Producer
MFI Microfinance Institution
MPC Monetary Policy Committee
MPR Monetary Policy Rate
MTDS Medium-Term Debt Strategy
NPLs Non-Performing Loans
PFJ Planting for Food and Job
PFM Public Financial Management
PPA Public Procurement Act
PPP Public-Private Partnership
SOE State-Owned Enterprise
SSA Sub-Saharan Africa
VRA Volta River Authority
WEO World Economic Outlook
ii
Table of Contents Acronyms and Abbreviations ................................................................................................ i
List of Tables ...................................................................................................................... iii
List of Figures ..................................................................................................................... iii
Appendix ............................................................................................................................. iii
EXECUTIVE SUMMARY ..................................................................................................... 1
CHAPTER ONE: INTRODUCTION ..................................................................................... 4
CHAPTER TWO: MACROECONOMIC DEVELOPMENTS ................................................ 5
2.1 Global Economic Developments ................................................................................. 5
2.2 Domestic Economic Developments ............................................................................ 6
2.3 First Quarter Fiscal Performance and Revised 2019 Fiscal Framework ................... 12
CHAPTER THREE: MEDIUM-TERM MACRO-FISCAL FRAMEWORK .......................... 14
3.1 Medium-Term Development Policies ........................................................................ 14
3.2 Medium-Term Macroeconomic Forecasts ................................................................ 14
3.3 Medium-Term Fiscal Policy Objectives and Targets ................................................. 15
3.4 Specific Numerical Fiscal Rules ............................................................................... 16
CHAPTER FOUR: FISCAL RISK STATEMENT ............................................................... 17
4.1 Introduction ............................................................................................................... 17
4.2 Macroeconomic Risks .............................................................................................. 17
4.3 Specific Fiscal Risks ................................................................................................. 20
4.4 Broad Measures to Address Fiscal Risks ................................................................. 20
CHAPTER FIVE: MEDIUM-TERM DEBT MANAGEMENT STRATEGY AND DEBT
SUSTAINABILITY ANALYSIS .......................................................................................... 21
5.1 Introduction ............................................................................................................... 21
5.2 Recent Public Debt Developments ........................................................................... 21
5.3 Debt Sustainability Analysis ...................................................................................... 21
5.4 Strategies to Improve on the DSA results ................................................................. 23
5.5 Debt Ceilings Strategies ........................................................................................... 24
CHAPTER SIX: PROGRESS REPORT ON THE IMPLEMENTATION OF THE 2019
FISCAL STRATEGY DOCUMENT .................................................................................... 26
6.1 Summary of 2019 FSD ............................................................................................. 26
6.2 Implementation of Fiscal Policy Measures ............................................................... 27
CHAPTER SEVEN: CONCLUSION .................................................................................. 28

iii
List of Tables
Table 1: Macroeconomic Targets for 2018 and 2019 .......................................................... 6
Table 2: Summary of Central Government Operations and Financing - 2017/2018 .......... 10
Table 3: Summary of 2019 Q1 Fiscal Performance ........................................................... 12
Table 4: 2019 Revised Fiscal Framework .......................................................................... 13
Table 5: GDP Growth Rates in the 2019 Revised Fiscal Framework ................................ 15
Table 6: Cost-Risk Indicators (2019-2022) ........................................................................ 24
Table 7: Risk Indicators for MTDS ..................................................................................... 25
Table 8: 2019 FSD compared with 2019 Budget (percent) ................................................ 26
Table 9: Summary of Approved Fiscal Framework for 2019 FSD and Budget ................... 26
Table 10: Status of Fiscal Measures in the 2019 FSD ....................................................... 27
List of Figures
Figure 1: GDP Growth, 2014-2018 ...................................................................................... 7
Figure 2: Confidence intervals around overall real GDP growth rate forecasts .................. 18
Figure 3: Confidence intervals around non-oil real GDP growth rate forecasts ................. 18
Figure 4: Confidence intervals around tax/GDP ratio forecasts ......................................... 19
Figure 5: Confidence intervals around overall fiscal balance/GDP forecasts ..................... 19
Figure 6: Repayment Profile of Existing Public Debt – 2019-2060 .................................... 23
Appendix
Appendix A1: Fiscal Risks Assessment Framework……………………………........29

2020 Fiscal Strategy Document
1
EXECUTIVE SUMMARY
1. The 2020 Fiscal Strategy Document (2020 FSD) is the third to be submitted to Cabinet under the Public Financial Management Act, 2016 (Act 921). Section 15 of the PFM Act requires the Minister responsible for Finance to prepare and submit a Fiscal Strategy Document (FSD) to Cabinet no later than the end of May of each financial year.
2. The main purpose of the 2020 FSD is to provide the medium-term fiscal framework, with measurable fiscal objectives and targets, to guide the preparation of the 2020 Budget Statement and Economic Policy of Government, as part of our efforts to ensure budget credibility and transparency, as well as fiscal sustainability.
Recent Economic Developments
3. The global economy expanded by 3.6 percent in 2018 compared to an outturn of 3.8 percent in 2017, according to the April 2019 edition of the IMF’s World Economic Outlook (WEO). Similarly, growth in Sub-Saharan Africa (SSA) marginally improved to 3.0 percent in 2018 from 2.9 percent in 2017.
4. On the domestic front, provisional data released by the Ghana Statistical Service (GSS) show that overall real GDP growth (including oil) was 6.3 percent in 2018, which was above the projected growth rate of 5.6 percent.
5. The disinflation process continued in 2018 and into January 2019, remaining broadly within the medium-term target band of 8±2 percent. Headline inflation rate declined to 9.4 percent in December 2018 and further to 9.0 percent in January 2019, compared to 11.4 percent in December 2017. Inflation increased to 9.2 percent in February and further to 9.3 percent and 9.5 percent in March and April, respectively. The slowdown in the inflation rate reflected the reduction of non-food inflation rate, tight monetary policy stance over the past years, and relative stability of the exchange rate. However, inflation inched up gradually in the three months to April 2019, reflecting pass-through effects from the recent currency depreciation.
6. On the domestic currency market, the Ghana cedi cumulatively depreciated by 8.4 percent against the US dollar at the end of 2018, up from 4.9 percent at the end of 2017, mainly reflecting emerging market sentiments and the effect of US-China trade wars. The cedi came under pressure in February 2019, but the pressure receded towards the end of the first quarter of 2019, resulting in a cumulative depreciation of 5.8 percent against the US Dollar at the end of May 2019. The stability of the domestic currency is mainly due to supportive policies and the improved supply of foreign exchange partly from the recent Eurobond issue.
7. Ghana’s public debt stock increased to 57.9 percent of GDP at the end of 2018, from 55.6 percent of GDP in 2017. The increase in the debt-to-GDP ratio partly reflects the financial sector bailout fiscal cost of GH¢9.8 billion. In nominal terms, the gross public debt stock at the end of 2018 was GH¢173,068.7 million (US$35,888.5 million), up from GH¢142.6 billion (US$32,292.5 million) in 2017. The stock of public debt further increased by GH¢24.9 billion over the end-December 2018 to GH¢198.0 billion (57.5

2020 Fiscal Strategy Document
2
percent of GDP) at the end of March 2019, partly reflecting the depreciation of the cedi against the US dollar earlier in the year.
8. Provisional fiscal data for end-year 2018 point to further consolidation of Government’s public finances relative to the same period in 2017. The fiscal deficit (on cash basis) amounted to GH¢11,672.7 million or 3.9 percent of GDP, down from an end-year fiscal deficit position of GH¢12,244.7 million (4.8% of GDP) in 2017.
9. Provisional 2019 Q1 fiscal data indicate that fiscal operations for the period resulted in an overall fiscal deficit of GH¢6,359.6 million or 1.8 percent of GDP. The outturn represents a 30.0 percent increase over the programmed deficit target of GH¢4,891.9 million or 1.4 percent of GDP, which reflects pressures mainly from payments of unbudgeted expenditures, including energy sector Independent Power Producers’ (IPPs) bills. These expenditure pressures have the potential of widening the fiscal deficit if business continues as usual and corrective measures are not immediately applied to arrest the situation. The energy sector issues are likely to have a devastating effect on the economy if corrective measures are not taken now.
10. Recommended revenue and expenditure measures have been incorporated in the revised fiscal framework to keep the deficit at no more than 4.5 percent of GDP for 2019. Medium-Term Macroeconomic Framework
11. Overall real GDP is expected to grow by 7.1 percent in 2019, with the non-oil GDP expected to grow by 6.0 percent. Over the medium term, real GDP is expected to record an average growth of 6.3 percent, with projected rates of 6.6 percent in 2020, 5.2 percent in 2021, 6.6 percent in 2022, and 6.9 percent in 2023. The medium-term growth trajectory is underpinned by continued growth in oil and gas production and the impact of Government’s flagship programmes such as the Planting for Food and Jobs Programme and the 1-District 1-Factory Programme.
12. Monetary Policy over the medium-term will remain relatively tight. This will continue to provide the necessary anchor for inflation expectations and steer inflation towards the medium-term target band of 8±2 percent.
13. The external current account balance is expected to improve gradually. This will be reflected in the current account deficit declining to within sustainable levels of not exceeding 4.0 per cent of GDP, and consistent with a Foreign Reserves Import of Goods and Services cover of at least 3.5 months. Medium-Term Fiscal Targets
14. Fiscal policy over the medium-term will remain anchored on the fiscal deficit and the primary balance targets. Although the Fiscal Responsibility Act (FRA) allows for a fiscal deficit of up to 5 percent of GDP and requires the primary balance to be in surplus, the medium-term fiscal stance should equally remain supportive of debt sustainability.
15. A combination of revenue-enhancing and expenditure-containment and reduction measures are applied to arrive at a policy scenario for 2020 that is consistent with the

2020 Fiscal Strategy Document
3
requirements of the FRA. Under this policy scenario, the fiscal deficit target for 2020 is 4.5 percent of GDP but projected to tail off to under 4.0 percent of GDP over the medium-term. At these rates, the primary balance will also remain positive to support the reduction in the rate of debt accumulation over the period.
Conclusion and Recommendations
16. Even though the implementation of government’s economic programmes continues to impact positively on economic stability and growth, shortfalls in revenue mobilisation and emerging expenditure pressures, pose risks to fiscal and debt sustainability. Fiscal measures proposed will ensure that the fiscal deficit for 2019 does not exceed 4.5 percent of GDP whilst posting a primary surplus consistent with the FRA.
17. After stabilising at 4.5 percent of GDP in 2020, the fiscal deficit is expected to decline to below 4.0 percent of GDP from 2021 onwards.

2020 Fiscal Strategy Document
4
CHAPTER ONE: INTRODUCTION
18. The 2020 Fiscal Strategy Document (2020 FSD) is the third to be submitted to Cabinet under the Public Financial Management Act, 2016 (Act 921). The 2020 FSD is prepared and submitted to Cabinet for consideration in consonance with Section 15 of the PFM Act, which requires that the Minister responsible for Finance prepares and submits to Cabinet a Fiscal Strategy Document (FSD), not later than the end of May of each financial year.
19. Consistent with the PFM Act, the prime objective of fiscal policy of Government is to ensure macroeconomic stability of the country. Accordingly, the fiscal policy of Government has focused on reducing the fiscal deficit to low and sustainable levels to keep public debt on a declining path towards debt sustainability. The main purpose of the 2020 FSD, therefore, is to provide the medium-term fiscal framework, with measurable fiscal objectives and targets, to guide the preparation of the 2020 Budget Statement and Economic Policy of Government as part our efforts to ensure budget credibility and transparency, as well as fiscal sustainability.
20. Consistent with Section 13 (2) of the PFM Act, the formulation and implementation of the fiscal policy in the 2020 FSD is guided by the following fiscal policy principles:
i. sufficient revenue mobilisation and management of same to finance government
programmes;
ii. maintenance of prudent and sustainable levels of public debt;
iii. maintaining the fiscal balance at a sustainable level over the medium term;
iv. managing fiscal risks in a prudent manner; and
v. achieving efficiency, effectiveness, and value for money in our procurement
processes and expenditure allocations and outlays
21. These principles underscore a fiscal policy designed to promote broad-based economic growth, while also consolidating the gains made in the restoration of confidence in the economy.
22. The rest of the 2020 FSD is structured as follows: Chapter Two presents the macroeconomic developments in 2018 and the first quarter of 2019, while the medium-term macro-fiscal framework is presented in Chapter Three. Chapter Four presents the fiscal risk analysis, while the Medium-Term Debt Management Strategy and Debt Sustainability Analysis are presented in Chapter Five. Chapter Six presents the progress report on the implementation of the 2019 FSD while the Conclusion is presented in Chapter Seven.
2020 Fiscal Strategy Document
5
CHAPTER TWO: MACROECONOMIC DEVELOPMENTS
2.1 Global Economic Developments
Economic Growth 23. According to the IMF’s April 2019 Edition of World Economic Outlook, global
economic growth declined marginally to 3.6 percent in 2018, down from the 3.8 percent recorded in 2017. This is mainly attributed to an upsurge in trade tensions and tariff hikes between the United States and China, rising political tensions in Europe, a drop in business confidence, and tightening of financial conditions across economic and regional blocs.
24. Growth in Advanced economies dropped to 2.2 percent in 2018, compared to an outturn of 2.4 percent in 2017. This decline is attributed to the slowdown in business activity in the euro area, including weakening consumer and business sentiments, as well as delays associated with the introduction of new fuel emission standards for diesel-powered vehicles in Germany.
25. In Developing and Emerging-Market Economies, growth weakened by 0.3 percentage points to 4.5 percent compared to 4.8 percent in 2017. China’s growth declined from 6.8 percent in the first half of 2018 to 6.0 percent in the second half of the year. This was primarily due to domestic regulatory tightening to rein in debt, as well as further pressure from diminishing export orders as US tariff actions began to take hold in China.
26. Economic recovery in sub-Saharan Africa continued in 2018. According to the IMF’s April 2019 Edition of the Regional Economic Outlook, growth in Sub-Saharan Africa (SSA) increased from 2.9 percent in 2017 to 3.0 percent in 2018. Significantly, growth in Nigeria was 1.9 percent in 2018 from an outturn of 0.8 percent in 2017, driven by recovering oil production and a pickup in the non-oil economy.
27. Global growth projections have been revised downwards for 2019 and beyond, reflecting heightened policy uncertainty on a number of issues, including escalated trade tensions between the US and China, rising political tensions in Europe, unresolved Brexit negotiations, and geopolitical tensions. Inflation
28. Inflation generally picked up in 2017 and 2018. In advanced economies, inflation increased to 2.0 percent in 2018 from the 1.7 percent in 2017. Inflation is projected to reduce to 1.6 percent in 2019 before increasing to 2.1 percent in 2020. For Sub-Saharan Africa, inflation moderated from 11 percent in 2017 to 8.5 percent in 2018, and it is expected to reduce further to 8.1 percent in 2019 and 7.4 percent in 2020. Commodity Prices
29. Crude oil: Crude oil price remained strong in most part of 2018. According to the IMF’s April 2019 World Economic Outlook, price of crude oil averaged US$68.33 per barrel in 2018, an increase of 15.52 percent over the US$52.81 per barrel recorded in 2017. The increase in price of crude is due to supply restrictions resulting from the extension of the agreement by the Organization of the Petroleum Exporting Countries (OPEC)
2020 Fiscal Strategy Document
6
to limit supply, and stronger-than-expected global economic growth. Crude oil prices are projected to end 2019 at US$66.00 per barrel.
30. Gold: According to the April 2019 Commodity Markets Outlook (CMO) by the World Bank, Gold prices steadily trended upwards, averaging US$1,269 per troy oz in 2018, up from the US$1,258 per troy oz in 2017, on account of strong demand and a fall in the long-term real interest rate. Gold prices are projected to increase to US$1,310 per troy oz in 2019.
31. Cocoa: Cocoa prices rose by 3 percent in the first Quarter of 2018, but the price remained stable in the remaining past three quarters. Global average cocoa price is projected to remain unchanged during the 2018/19 crop year as favourable supplies by Côte d’Ivoire and Ghana (the two largest global producers) are expected to compensate for the projected production shortfalls from the rest of the world, including Brazil, Cameroon, Indonesia, and Nigeria. The world market price of cocoa beans increased marginally to US$2,290 per metric ton in 2018 from US$2,030 per metric ton in 2017 and is projected to remain at US$2,030 per metric ton in 2019 as well (CMO, April 2019).
2.2 Domestic Economic Developments
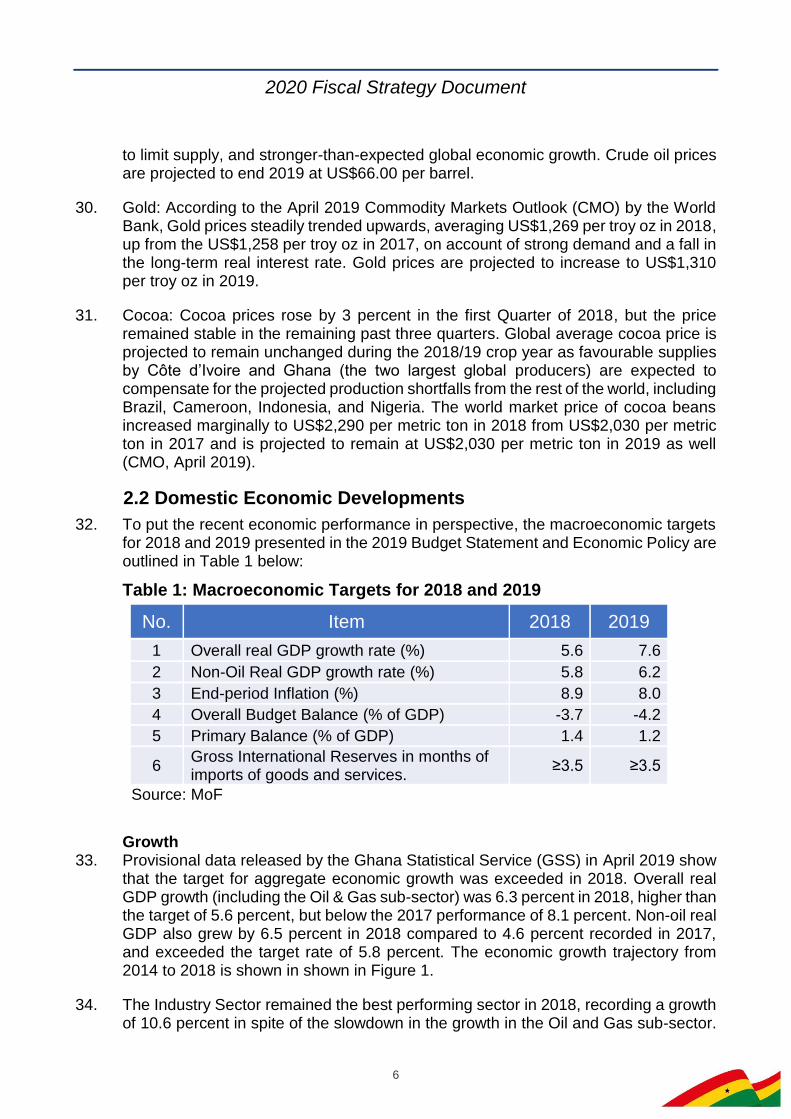
32. To put the recent economic performance in perspective, the macroeconomic targets for 2018 and 2019 presented in the 2019 Budget Statement and Economic Policy are outlined in Table 1 below:
Table 1: Macroeconomic Targets for 2018 and 2019
No. Item 2018 2019
1 Overall real GDP growth rate (%) 5.6 7.6
2 Non-Oil Real GDP growth rate (%) 5.8 6.2
3 End-period Inflation (%) 8.9 8.0
4 Overall Budget Balance (% of GDP) -3.7 -4.2
5 Primary Balance (% of GDP) 1.4 1.2
6 Gross International Reserves in months of imports of goods and services.
≥3.5 ≥3.5
Source: MoF
Growth
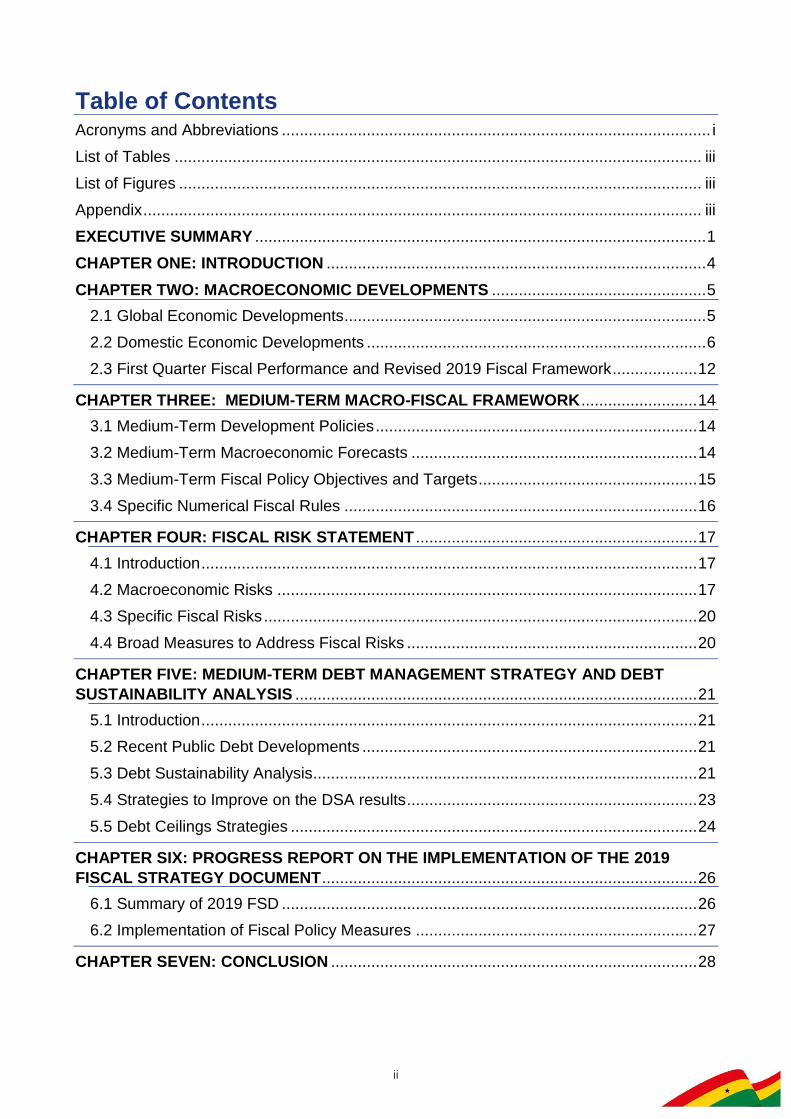
33. Provisional data released by the Ghana Statistical Service (GSS) in April 2019 show that the target for aggregate economic growth was exceeded in 2018. Overall real GDP growth (including the Oil & Gas sub-sector) was 6.3 percent in 2018, higher than the target of 5.6 percent, but below the 2017 performance of 8.1 percent. Non-oil real GDP also grew by 6.5 percent in 2018 compared to 4.6 percent recorded in 2017, and exceeded the target rate of 5.8 percent. The economic growth trajectory from 2014 to 2018 is shown in shown in Figure 1.
34. The Industry Sector remained the best performing sector in 2018, recording a growth of 10.6 percent in spite of the slowdown in the growth in the Oil and Gas sub-sector.

2020 Fiscal Strategy Document
7
This was followed by the Agriculture sector with a growth outturn of 4.8 percent, and Services with an outturn of 2.7 percent.
Figure 1: GDP Growth, 2014-2018
Source: GSS
35. The Services sector remained the largest sector, increasing its share of GDP from 46.0 percent in 2017 to 46.3 percent in 2018, followed by the Industry sector with a share of 34.0 percent up from 32.7 percent in 2017. The Agricultural sector had the smallest share of GDP at 19.7 percent at the end of 2018, down from 21.2 percent in 2017.
36. For the first quarter of 2019, the Bank of Ghana’s Composite Index of Economic Activity (CIEA) showed evidence of increased economic activity, with a yearly growth of 4.0 percent in March 2019, up from 2.9 percent a year earlier. This robust pace of economic activity is supported by improved sentiments from businesses, following the Ghana Cedi’s recovery from the recent sharp depreciation and favourable growth prospects, even though consumer sentiments weakened slightly as a result of recent increases in prices. Inflation
37. Inflation broadly decelerated from 11.8 percent in December 2017 to 9.4 percent in December 2018, underpinned by a relatively tight monetary policy stance, while inflation pressures and expectations remained well-anchored.
38. The slowdown was driven solely by a decline in the non-food inflation rate, which dropped from 13.6 percent in December 2017 to 9.4 percent in December 2018. Food inflation rate rose from 8.0 percent in December 2017 to 8.7 percent in December 2018. However, inflation has inched up gradually three months on the trot from February to April, reflecting pass-through effects of the currency depreciation during the period. Inflation increased from 9.0 percent in January to 9.2 percent in February, and then to 9.3 percent and 9.5 percent in March and April, respectively.
2.7 2.23.4
8.1
6.3
2.72.2
4.6 4.6
6.5
0
2
4
6
8
10
2014 2015 2016 2017 2018
Real GDP growth, oil Reall GDP growth, non-oil
2020 Fiscal Strategy Document
8
Money, Credit, and Capital Markets 39. Bank of Ghana’s Monetary Policy Committee (MPC) maintained a relatively tight
policy stance throughout 2018 with the objective of anchoring inflation expectations and ensuring stability of the domestic currency. The Policy Rate was reduced by a cumulative 300 basis points from 20.0 percent in December 2017 to 17.0 percent in December 2018, broadly in line with stable domestic economic conditions over the period. The Policy Rate was further reduced to 16.0 percent in January 2019 and remains unchanged.
40. Private sector end-December year-on-year credit growth in 2018 was 11.2 percent against 13.4 percent recorded a year earlier. In real terms, credit to the private sector grew by a modest 1.6 percent in December 2018, comparable to the 1.4 percent recorded in December 2017. Total outstanding credit to the private sector at the end of December 2018 was GH¢37,593.2 million, compared with GH¢33,987.0 million recorded in the corresponding period in 2017. Private sector credit growth continued to gain traction as banking sector liquidity improved, supported by the 2018 recapitalization exercise. Annual growth in private sector credit was up by 19.8 percent in April 2019, compared with 5.6 percent growth in the same period of 2018. On a year-to-date basis, private sector credit recorded a 5.1 percent growth in April 2019, compared with a contraction of 4.0 percent last year.
41. Developments in interest rates for 2018 showed that the money market rates performance were mixed in the short end of the market as well as the medium to long term segments. The interbank weighted average rate declined to end 2018 at 16.2 percent, down from 19.3 percent in December 2017. Interest rates on the money market stabilised at the end April 2019 partly reflecting a shift to foreign financing of the budget after the Eurobond issuance. The 91-day Treasury bill rate has stabilised at 14.7 percent whilst the 182-day instrument was stable at 15.1 percent at the end of April 2019. The weighted average interbank lending rate, which shows the rate at which commercial banks lend to each other, also dropped to 15.2 percent in April 2019 from 17.5 percent, following trends in the monetary policy rate. In the same direction, average lending rates of banks declined, though moderately, to 27.7 percent from 28.2 percent over the same comparative period. Balance of Payments
42. In the external front, the trade balance recorded a surplus in 2018 for the second consecutive year, the first time in over a decade. The trade surplus of US$1.78 billion (2.7% of GDP) at the end of December 2018 was underpinned by strong performance in some of the major export commodities, especially crude oil (which benefited from both volume and price developments) and non-traditional exports. The current account, however, recorded a deficit of US$2.07 billion (3.2 per cent of GDP) in 2018 compared to a deficit of US$2.00 billion (3.4% of GDP) in 2017 mainly as a result of the net outflows in the income account which outweighed the gains from the trade balance.
43. For the first quarter of 2019, the current account balance registered a surplus of US$294.5 million, equivalent to 0.4 percent of GDP. This was on the back of an improved trade surplus of US$794.4 million (1.2% of GDP), and a net outflow of US$500 million in the services and income account. The positive outturn in the current

2020 Fiscal Strategy Document
9
account balance, together with significant inflows into the capital and financial account—driven mainly by the proceeds from the March 2019 Eurobond issue—resulted in a balance of payments surplus of US$3.0 billion (4.4% of GDP) for the first quarter of 2019.
International Reserves
44. Gross International Reserves at the end of December 2018 was estimated at US$7,024.8 million, indicating a drawdown of US$530 from a stock position of US$7554.8 million at the end of December 2017. This was sufficient to provide cover for 3.6 months of imports in 2018, compared to 4.3 months of imports over the same comparative period in 2017.
45. Gross International Reserves position improved to US$9.9 billion (equivalent to 5.1 months of import cover) as at end-March 2019. However, as at end of April 2019, Gross International Reserves had reduced to US$9.3 billion (4.7 months import cover), largely on account of energy-related debt payments and higher repatriation obligations occasioned by domestic debt interest and coupon repayments to non-resident domestic debt holders
Exchange Rate
46. In the currency market, the Ghana cedi has fundamentally remained stable against the major currencies, on account of improved macroeconomic fundamentals and higher foreign exchange inflows. However, the foreign exchange market witnessed some volatility in December 2018 in line with the seasonal domestic demand pressures.
47. On the interbank market, the cedi cumulatively depreciated in 2018 by 8.39 percent, 3.93 percent, and 3.31 respectively against the dollar, euro, and pound sterling. This compares relatively to 4.88 percent, 16.23 percent and 12.91 percent against the dollar, euro and pound, respectively, in 2017.
48. The stability of cedi was temporarily ruffled as the currency came under pressure in February 2019. However, the situation normalised towards the end of the first quarter of 2019. The regained stability in the domestic currency is attributed to supportive fundamentals and the improved supply of foreign exchange, partly from the recent Eurobond issue. Cumulatively, the cedi depreciated against the US dollar by 5.8 percent at the end of May 2019.
2018 Fiscal Performance
49. Government’s overarching fiscal policy objective in 2018 was to further consolidate its public finances relative to the 2017 position. Consequently, the fiscal balance and primary balance were set as primary anchors. In the case of the fiscal balance, the target was to reduce the recorded deficit of 4.8 percent of GDP in 2017 to 3.7 percent in 2018. For the primary balance, the target was a surplus of 1.4 percent of GDP in 2018, an improvement over the surplus outturn of 0.8 percent in 2017.
50. To achieve these targets, Government set out a strategy to improve domestic revenue mobilization through improved tax compliance, as well as the introduction of new revenue measures announced during presentation of the Mid-Year Review of
2020 Fiscal Strategy Document
10
the Budget to Parliament. The new revenue measures included: imposition of a Luxury Vehicle Levy on motor vehicles with engine capacity of 2950cc and above; introduction of an additional Personal Income Tax band of 35 percent on monthly incomes in excess of GH¢10,000; and a restructuring of the VAT by separating the GETFund and NHIL levies from the Input-Output mechanism of the VAT and converting them into straight levies at rates of 2.5 percent, while maintaining the VAT rate at 12.5 percent.
51. Additionally, greater emphasis was placed on spending commitment controls, as well as expenditure rationalization and value for money measures.
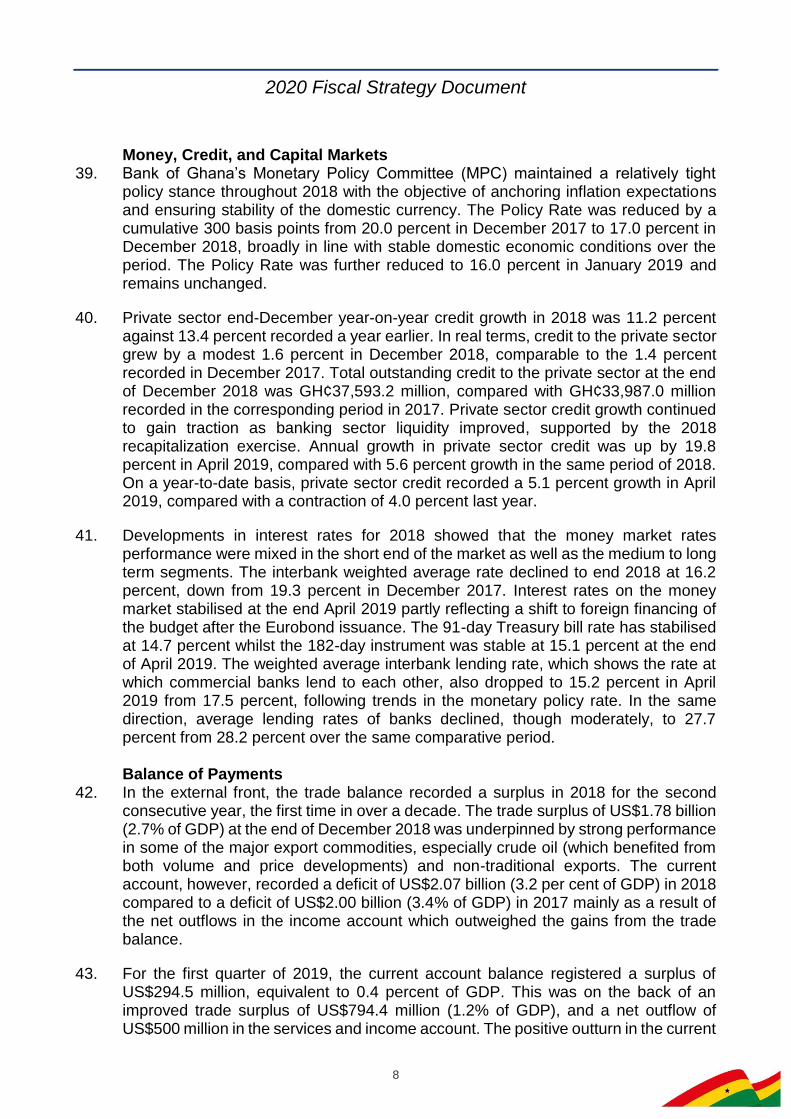
52. Provisional data show that Total Revenue and Grants for the period amounted to GH¢47,636.7 million (15.8 percent of GDP), constituting 97.1 percent of the annual target of GH¢49,059.0 million (16.4 percent of GDP) as shown in Table 2. The 2018 performance was 20.0 percent higher than the outturn for 2017. Of this amount, Domestic Revenue—which comprises all revenues except Grants received from Donor Partners—constituted about 97.6 percent and amounted to GH¢46,501.9 million, compared to a target of GH¢48,297.9 million.
Table 2: Summary of Central Government Operations and Financing -
2017/2018
No. Item
2017 2018 2018
Prov. Outturn Revised Prov. Outturn Dev. y/y
growth GH¢mn % of GDP GH¢mn
% of GDP GH¢mn
% of GDP GH¢mn %
1 Total Revenue & Grants 39,695 15.5 49,059 16.4 47,637 15.8 (1,422) (2.9) 20.0
2 Total Expenditure inc Arrears 51,939 20.2 60,030 20.1 59,310 19.7 (721) (1.2) 14.2
3 Overall Fiscal Balance (12,245) (4.8) (10,971) (3.7) (11,673) (3.9) (702) 6.4 (4.7)
4 Total Financing 12,245 4.8 10,971 3.7 11,673 3.9 702 6.4 (4.7)
5 o/w Foreign Financing (47) 0.0 4,704 1.6 2,724 0.9 (1,979) (42.1)
6 o/w Domestic Financing 12,292 4.8 6,268 2.1 8,949 3.0 2,681 42.8
7 Primary Fiscal Balance 1,327 0.5 4,121 1.4 4,149 1.4 29 0.7 212.6
Source: MoF
53. The shortfall recorded in Total Revenue and Grants was mainly due to the shortfall in Domestic Revenue. Specifically, revenue shortfalls emanated from both Non-oil Tax and Non-Tax revenues due the following reasons:
i. non-implementation of Electronic Point of Sales devices (EPOs) policy; ii. delay in the implementation of Tax Stamp policy; iii. lower recorded CIF Values of imports, and admittance of large volumes of
imports into exempt or low tariff (zero-rated) categories; iv. non-realisation of expected SOE Dividends targets; v. non-materialisation of Gas Receipts due to intra-energy sector cross debt issues;
and vi. non-realisation of proceeds from the sale of electromagnetic spectrum.

2020 Fiscal Strategy Document
11
54. Disbursement of Grants exceeded the target by about 49.1 percent and amounted to GH¢1,134.8 million compared to the target of GH¢761.1 million.
55. Total Expenditure including arrears clearance for the period were broadly contained within budgetary constraints, amounting to GH¢59,309.5 million (19.7 percent of GDP) against a target of GH¢60,030.2 million (20.1 percent of GDP) as shown in Table 2. The outturn was 1.2 percent lower than the budgetary appropriation for the year.
56. Expenditure on Wages and Salaries for the period amounted to GH¢17,212.9 million, about 1.0 percent higher than the target of GH¢17,041.9 million. The main reason for the deviation was higher than programmed wage-related allowances. In addition, about GH¢47.2 million was used to clear wage arrears from previous years.
57. Expenditure on Goods and Services for the period amounted to GH¢5,127.9 million against the target of GH¢3,682.3 million. The outturn exceeded the appropriation by 39.3 percent on account of a one-off security-related expenditures in the year. On a year-to-year basis, the outturn recorded growth by 106.6 percent.
58. Interest Payments amounted to GH¢15,821.8 million, 4.8 percent higher than the target of GH¢15,091.6 million. The dominant component, domestic interest payments, was 16.6 percent higher than the outturn for the same period in 2017.
59. Transfer to Other Government Units, which includes transfers to the District Assemblies Common Fund (DACF) and Ghana Education Trust Fund (GETFund), among others, was less than the programmed amount by 11.5 percent, recording an outturn of GH¢10,789.2 million.
60. Total Capital Expenditure for the period amounted to GH¢4,738.3 million, falling short of the target by 25.9 percent.
61. As shown in Table 2, the Overall Budget Balance, registered a deficit of GH¢11,672.7 million, or 3.9 percent of GDP, which was financed from both domestic and external sources. Total Domestic Financing amounted to GH¢8,948.6 million, equivalent to 3.0 percent of GDP, and constituted 84 percent of the total financing. Foreign financing amounted to GH¢2,724.2 million, some 0.9 percent of GDP, against a target of GH¢4,703.5 million or 1.6 percent of GDP. The primary balance recorded a surplus of GHS4,149.1 million, equivalent to 1.4 percent of GDP, comparable to the targeted surplus of GH¢4,215.9 million, also 1.4 percent of GDP. The recorded primary surplus was a key factor in the decline in growth of the public debt 2018.

2020 Fiscal Strategy Document
12
Public Debt Developments 62. Provisional data indicate that Ghana’s public debt increased from 55.6 percent of
GDP in 2017 to 57.9 percent of GDP in 2018. A large part of the 2018 debt additions resulted from the cleaning up of the financial sector bailout programme. In nominal terms, the gross public debt stock amounted to GH¢173,068.7 million (US$35,888.5 million) at end-December 2018, representing 21.4 percent increase over the end-December 2017 position. The domestic debt component rose from GH¢66,769.1 million (US$15,118.4 million or 26.0 percent of GDP) in 2017 to GH¢ 86,899.7 million (US$18,020.0 million or 29.1 percent of GDP) in 2018. Similarly, external debt increased from GH¢75,847.5 million (US$17,174.1 million or 29.6 percent of GDP) in 2017 to GH¢86,169.0 million (US$17,868.5 billion or 28.8 percent of GDP) in 2018.
63. The share of external debt in total debt stock declined from 53.2 percent in 2017 to 49.8 percent in 2018. Correspondingly, the share of domestic debt increased from 46.8 percent to 50.2 percent of total debt over the same period.
64. The stock of public debt rose to 57.5 percent of GDP (GH¢198.0 billion) at the end of March 2019, compared with 49.5 percent of GDP (GH¢147.9 billion) at the end of March 2018. The 2018 position reflected the cost of the financial sector bailout and the depreciation of the cedi against the US dollar, which increased the value of the external debt in cedi terms.
2.3 First Quarter Fiscal Performance and Revised 2019 Fiscal Framework
65. To ensure the downward path of the fiscal deficit, the 2019 Fiscal Framework presented in the 2019 Budget Statement set the fiscal deficit for 2019 at 4.2 percent of GDP. The primary balance was also programmed to remain positive at 1.2 percent of GDP to ensure a stabilising growth rate of the public debt stock.
66. Implementation of the 2019 Budget though end-March show revenue mobilisation to be off-track. Total Revenue and Grants have fallen short of the first quarter target 17.5 percent, as shown in Table 3. In particular, the Non-oil Tax Revenue component was below target by 9.1 percent, which may be further exacerbated in the short- term by the impact of the policy to reduce the benchmark import values which form the base for the assessment of customs duties, tariffs, fees and levies.
Table 3: Summary of 2019 Q1 Fiscal Performance
No. Item
2019
Budget Q1 Prog Q1 Prov
GH¢mn % of GDP
GH¢mn % of GDP
GH¢mn % of GDP
Dev. (%)
1 Revenue and Grants 58,905 17.1 12,432 3.6 10,255 3.0 (17.5)
2 Expenditures 72,711 21.1 17,324 5.0 16,614 4.8 (4.1)
3 Overall Fiscal Balance (14,536) (4.2) (4,892) (1.4) (6,360) (1.8) 30.0
4 Primary Balance 4,110 1.2 (1,065) (0.3) (2,592) (0.8) 143.0
Source: MoF

2020 Fiscal Strategy Document
13
67. This notwithstanding, additional measures (such as the Sale of Electromagnetic Spectrum, Telco's Licenses renewal fees, Capital Gains Tax from extractive industry and strengthening of compliance at the ports) are being taken to ensure that the revenue target for 2019 is achieved.
68. Unfortunately, the same level of optimism does not hold for the expenditure budget. So far, the implementation of the 2019 Budget is threatened payments made in respect of security and energy. The energy sector issues are likely to have a devastating effect on the economy if corrective measures are not taken now.
69. Thus far, we have borrowed more from the domestic market than programmed to make up for the revenue shortfalls and to meet these additional expenditure pressures.
70. To protect the credibility of our fiscal stance following these developments, the 2019 fiscal framework has been recalibrated and a deficit target of no more than 4.5 percent of GDP is recommended as shown in Table 4. This revised target is consistent with the DSA and does not immediately worsen our current debt sustainability status of being at risk of debt distress.
Table 4: 2019 Revised Fiscal Framework
S/N Item
2019
Budget Policy
GH¢Mn % of GDP GH¢Mn % of GDP
1 Total Revenue & Grants 58,905 17.1 59,844 17.3
2 Total Expenditures (incl. arrears) 73,441 21.3 75,549 21.8
3 Overall Fiscal Balance (Cash) (14,536) (4.2) (15,706) (4.5)
4 Total Financing 14,536 4.2 15,706 4.5
5 Primary Balance 4,110 1.2 5,921 1.7
6 Nominal GDP 344,455 345,946
Source: MoF
71. The recommended revised fiscal framework for 2019, considers a combination of measures that must be adopted for immediate implementation if we are to safeguard our macroeconomic gains.

2020 Fiscal Strategy Document
14
CHAPTER THREE: MEDIUM-TERM MACRO-FISCAL FRAMEWORK
3.1 Medium-Term Development Policies
72. The medium-term macroeconomic framework is informed by the following:
President’s Coordinated Programme (2017-2024);
An Agenda for Jobs: Creating Prosperity and Equal Opportunity for all (2018-
2021);
Ghana Beyond Aid Agenda;
UN Agenda 2030 (SDGs);
AU Agenda 2063; and
PFM Act, 2016 (Act 921) and its companion Regulations
73. The vision of the President’s Coordinated Programme of Social and Economic Policies is to create “an optimistic, self-confident and prosperous nation, through the creative exploitation of our human and natural resources, and operating within a democratic, open and fair society, in which mutual trust and economic opportunities exist for all”. The vision is underpinned by four development goals, namely:
Build a prosperous country;
Create opportunities for all Ghanaians;
Safeguarding the Natural Environment and ensuring a Resilient Built
environment; and
Maintaining a stable, United and Safe Country.
74. The broad macroeconomic objectives that are being pursued to support the achievement of the vision and the development goals are to:
Ensure irreversibility and sustainability of Macroeconomic Stability;
Accelerate inclusive and climate resilient growth; and
Deepen structural reforms to make the machinery of Government work more
efficiently and effectively to sustain and consolidate macroeconomic stability and
build buffers enough to withstand both domestic and external headwinds.
3.2 Medium-Term Macroeconomic Forecasts
Broad GDP Assumptions 75. The provisional 2018 real GDP growth rate released by the GSS is 6.3 percent up
from a projection of 5.6 percent. This provides a bigger base for the projection of GDP for 2020 and the medium term. The bigger base is expected to result in a relatively lower growth than originally projected in the 2019 Budget.

2020 Fiscal Strategy Document
15
76. The revised 2019-2023 GDP growth projections are summarised in Table 5 below:
Table 5: GDP Growth Rates in the 2019 Revised Fiscal Framework
N0. Item 2019 2020 2021 2022 2023
1 Agriculture 6.9 7 6.6 7.2 6.8
2 Industry 8.8 7.6 4 6.9 7.8
3 Services 5.4 5.3 5.3 5.8 6.1
4 Overall GDP 7.1 6.6 5.2 6.6 6.9
5 Non-Oil GDP 6.0 6.5 6.2 5.9 6.5
77. The broad assumptions underpinning the growth projections are summarised below:
Inflation is broadly expected to decline in the medium-term, resulting in a projected
declining GDP deflator;
2019 GDP growth to be fuelled by increased oil and gas volumes and growth in
crops; and
Growth in 2021 is expected to be lower than in 2020, due to an anticipated
slowdown in expenditures after the 2020 elections.
Monetary and External Sector Outlook 78. The current account balance for 2019 is projected at a deficit of 3.0 per cent of GDP,
an expected further improvement on previous outturns underpinned by expected increases in production volumes in crude oil, gold and non-traditional goods. Non-oil import bills are also expected grow in 2019. These expectations will lead to a projected overall balance of payments surplus backed largely by increases in foreign direct investments and portfolio debt securities, and Foreign Reserves import cover of not less than 3.5 months.
79. In the medium-term, the current account deficits are expected to decline gradually to within sustainable levels of not exceeding 4.0 per cent of GDP, and consistent with the import of goods and services cover of at least 3.5 months.
3.3 Medium-Term Fiscal Policy Objectives and Targets
80. The key focus of fiscal policy in 2020 and the medium-term should be the adoption of a strategy that simultaneously balances Government’s overarching economic policy objective of ensuring a stable macroeconomic environment on the one hand, and one that offers long-term solutions to some of the structural economic challenges on the other hand.
81. Consequently, the medium-term fiscal objectives to support our macroeconomic and growth programmes are to:
i. Ensure the macroeconomic stability of the country within the macroeconomic and
fiscal framework;

2020 Fiscal Strategy Document
16
ii. Reduce the fiscal deficit to sustainable levels and generate sufficient primary
surpluses to ensure a declining debt path to strengthen debt sustainability without
compromising growth;
iii. Enhance domestic revenue mobilization;
iv. Reduce budget rigidities and improve fiscal space to accommodate growth-
enhancing expenditures; and
v. Pursue expenditure efficiency measures to ensure value-for-money
82. To achieve the fiscal objectives and ensure that the fiscal rule imposed by the FRA are observed, the fiscal deficit is targeted at no more than 4.5 percent of GDP for both 2019 and 2020 before declining to under 4 percent of GDP in 2021 and the medium term.
3.4 Specific Numerical Fiscal Rules
83. In line with Section 16 (1) of the PFM Act, 2016 (Act 921), the measurable fiscal indicators to be monitored will comprise the following:
i. the non-oil primary balance (as a percentage of GDP) as the primary fiscal anchor;
with
ii. the public debt (as a percent of GDP), capital expenditure (as a percent of total
expenditures including arrears clearance), revenue (as a percentage of GDP),
and the wage bill (as a percentage of tax revenue) as the secondary indicators.
84. The numerical fiscal targets associated with the proposed 2020 fiscal framework are as follows:
i. Overall primary balance of not less than 1.1 percent of GDP;
ii. Capital expenditure of not less than 11.1 percent of total expenditures (including
arrears);
iii. Tax revenue-to-GDP ratio of not less than 13.6 percent; and
iv. Wage-to-Tax Revenue ratio of not more than 43.6 percent.

2020 Fiscal Strategy Document
17
CHAPTER FOUR: FISCAL RISK STATEMENT
4.1 Introduction
85. The fiscal risks statement published by the Ministry of Finance in March 2019 identified some fiscal risks. More specifically, these include macroeconomic factors, higher-than-expected increase in the wage bill, accumulation of arrears, unanticipated judgment debt payments, and crystallization of guarantees granted to SOEs. It is important to note that these fiscal risks are interdependent and highly correlated—the crystallization of one could trigger the materialization of others. The fiscal risk framework is summarized in Appendix A1. This section sets out to highlight key fiscal risks that can significantly affect the macro-fiscal outcomes set in the 2020 FSD. The section first discusses key macroeconomic risks, followed by specific fiscal risks. Measures are then proposed for the identified fiscal risks.
4.2 Macroeconomic Risks
86. Fiscal aggregates are sensitive to changes in macroeconomic variables. The 2018 Fiscal Risks Statement published by the MoF in March 2019 includes some macroeconomic sensitivity analysis that suggests that:
A 2-percentage points reduction in non-oil real GDP will increase both the fiscal
deficit as a percent of GDP and public debt as a percent of GDP by 0.8 percent
and 3.5 percent respectively;
A 10 percent fall in oil prices will increase the fiscal deficit by 0.5 percent of GDP
and the public debt stock by 0.9 percent of GDP in 2019; and
A 10 percent exchange rate depreciation will result in an increase in the debt-to-
GDP ratio by 1.53 percent in 2019 but could improve the fiscal deficit by 0.06
percent because FX-denominated inflows (oil revenue and foreign grants) will
exceed FX-denominated spending in 2019 (interest plus foreign financed capital
spending).
87. Forecasts are subject to inherent uncertainties, which tend to increase as the
forecast horizon lengthens. Forecast errors, measured as the differences between forecasts and outcomes, may arise due to a wide range of factors, including unexpected events such as a sudden fall in commodity prices, as was the case for oil prices in 2015. We use confidence intervals to illustrate the range of plausible outcomes around the forecasts.
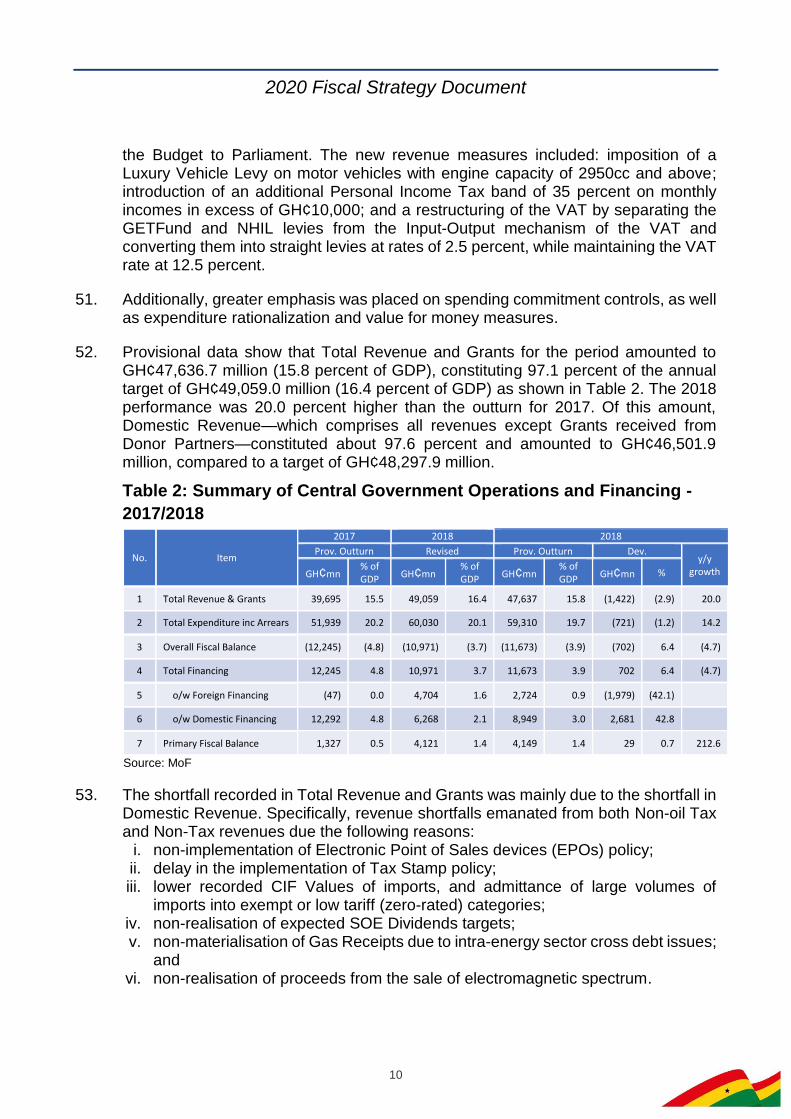
88. Figure 2-5 show the confidence internal around forecasts for overall real GDP growth rate, non-oil GDP, fiscal deficit as a percentage of GDP, and tax revenue as a percentage of GDP. Figure 2 shows that the overall real GDP growth rate for 2020 is expected to be around 6.6 percent, with the 70 per cent confidence interval ranging from 4.8 percent to 8.4 percent. The average annualised growth rate of overall real GDP in the four years to 2019-2022 is expected to be around 6.4 percent, with the 70 per cent confidence interval ranging from 4.6 percent to 8.1 percent. This implies that, if forecast errors
2020 Fiscal Strategy Document
18
remains similar to those recorded over recent years, then there is a 70 percent probability that overall GDP growth rate will fall within this range.
Figure 2: Confidence intervals around overall real GDP growth rate
forecasts
Note: The central line shows the actual outturn and the 2019 Budget forecasts. Confidence intervals are based on the root mean squared errors (RMSEs) of Budget forecasts.
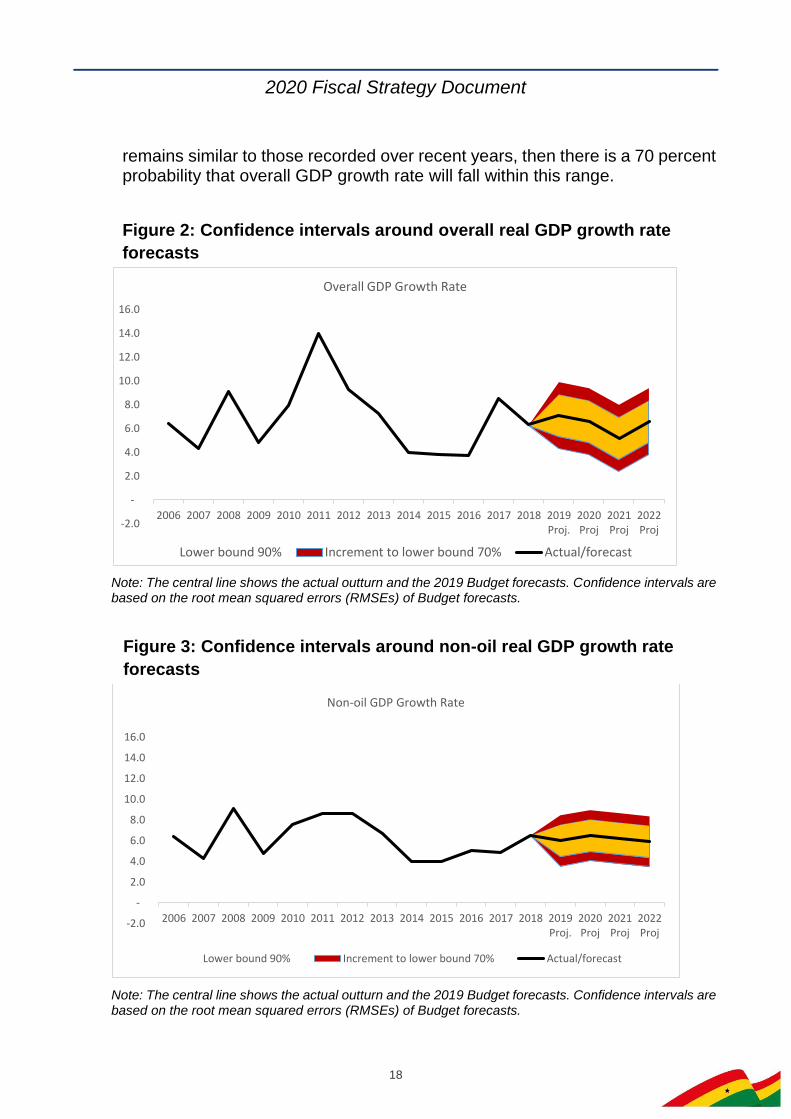
Figure 3: Confidence intervals around non-oil real GDP growth rate
forecasts
Note: The central line shows the actual outturn and the 2019 Budget forecasts. Confidence intervals are based on the root mean squared errors (RMSEs) of Budget forecasts.
-2.0
-
2.0
4.0
6.0
8.0
10.0
12.0
14.0
16.0
2006 2007 2008 2009 2010 2011 2012 2013 2014 2015 2016 2017 2018 2019Proj.
2020Proj
2021Proj
2022Proj
Overall GDP Growth Rate
Lower bound 90% Increment to lower bound 70% Actual/forecast
-2.0
-
2.0
4.0
6.0
8.0
10.0
12.0
14.0
16.0
2006 2007 2008 2009 2010 2011 2012 2013 2014 2015 2016 2017 2018 2019Proj.
2020Proj
2021Proj
2022Proj
Non-oil GDP Growth Rate
Lower bound 90% Increment to lower bound 70% Actual/forecast

2020 Fiscal Strategy Document
19
Figure 4: Confidence intervals around tax/GDP ratio forecasts
Note: The central line shows the actual outturn and the 2019 Budget forecasts. Confidence intervals are based on the root mean squared errors (RMSEs) of Budget forecasts.
Figure 5: Confidence intervals around overall fiscal balance/GDP forecasts
Note: The central line shows the actual outturn and the 2019 Budget forecasts. Confidence intervals are based on the root mean squared errors (RMSEs) of Budget forecasts. Source: Estimated with data from MoF and GSS
-
2.0
4.0
6.0
8.0
10.0
12.0
14.0
16.0
2009 2010 2011 2012 2013 2014 2015 2016 2017 2018 2019Proj.
2020Proj
2021Proj
2022Proj
Tax Revenue/ GDP Ratio
Increment to upper bound 70% Increment to upper bound 90% Actual/forecast
-14.0
-12.0
-10.0
-8.0
-6.0
-4.0
-2.0
-
2.0
4.0
2009 2010 2011 2012 2013 2014 2015 2016 2017 2018 2019Proj.
2020Proj
2021Proj
2022Proj
Overall Balance/GDP
Increment to upper bound 70% Increment to upper bound 90% Actual/forecast
2020 Fiscal Strategy Document
20
4.3 Specific Fiscal Risks
89. Apart from risks emerging from the general macroeconomic variables, significant fiscal risks are also emerging from some specific sources including State-Own Enterprises (SOEs), the financial sector, public investment and PPPs, expenditure and budget execution, as well as revenue. These sources have been analysed in detail in the 2018 Fiscal Risks Statement.
90. Contingent Liabilities from the State-Own Enterprises: Systemic losses from the energy sector SOEs stemming from high cost of fuel and power purchased from high cost IPPs, operational inefficiencies, low revenue collections, and non-payment practices among the public sector entities continue to pose significant risks.
91. Implicit Contingent Liabilities from the Financial Sector: Although stability and confidence is returning to the financial sector following the recent crisis, risks remain in some sectors, particularly, the specialised deposits taking institutions (SDIs). Given the progress made with phase 1 of the banking sector clean-up, phase 2 will focus on the SDIs.
92. Public Private Partnerships and Public Investment: PPPs present potentially
useful opportunities to expand public infrastructure, yet, they present a major source of fiscal risk. The fiscal risks associated with PPPs and Public Investments in general need to be managed to ensure that they do not compromise fiscal sustainability.
93. Expenditure and Budget Execution Risks: Key risks to expenditure include wage bill pressures, extra budgetary expenditures from the energy sector, 2020 election pressures, accumulation of arrears, and judgement debts, among others.
4.4 Broad Measures to Address Fiscal Risks
94. The institutionalization of several irreversibility structures including the PFM Act, 2016 the Public Procurement Act, the Fiscal Responsibility Act, the establishment of the Presidential Financial Stability and Fiscal Responsibility Advisory Councils will greatly reduce the incidence of fiscal risks. Strengthening of debt management practices through the preparation of the MTDS, debt re-profiling, and credit risks assessment of SOEs before on-lending and guarantees are issued to them is equally critical.

2020 Fiscal Strategy Document
21
CHAPTER FIVE: MEDIUM-TERM DEBT MANAGEMENT STRATEGY AND DEBT SUSTAINABILITY ANALYSIS
5.1 Introduction
95. This chapter focusses on the analytical framework for Debt Sustainability Analysis and the Medium-Term Debt Strategy. The issues arising from the analysis would be presented, and strategic options and recommendations made for consideration and adoption.
5.2 Recent Public Debt Developments
96. In nominal terms, Ghana’s public debt stock as at end-December 2018 stood at GH¢173,068.7 million (US$35,888.5 million), comprising external and domestic components of GH¢86,169.0 million (US$17,868.5 million) and GH¢86,899.7 million (US$18,020.0 million), respectively. At the end of February 2019, the public debt stock stood at GH¢180,687.1 million (US$36,032.5 million), comprising external and domestic debt of GH¢91,201.4 million (US$17,682.5 million) and GH¢89,485.72 million (US$17,349.9 million), respectively. As a percent of GDP, the gross public debt for 2018 was 57.6 percent against the target of 60 percent. As at the end of February 2019, the public debt stock as a percentage of GDP recorded a provisional figure of 52.5 percent.
5.3 Debt Sustainability Analysis
97. The latest Debt Sustainability Analysis shows that Ghana is at high risk of debt distress based on the borrowing assumptions and macroeconomic projections. Apart from the solvency ratios that improved on the back of the rebased GDP, all liquidity ratios breached the thresholds.
98. The results indicate that the solvency ratios (Debt-to-GDP Ratio) will improve over the period, with the baseline, historical, and shock scenarios showing a sustainable path over the long term.
0
5
10
15
20
25
30
35
40
45
50
2018 2020 2022 2024 2026 2028
PV of debt-to GDP ratio
Most extreme shock is One-time depreciation
Most extreme shock 1/Historical scenarioBaseline Threshold

2020 Fiscal Strategy Document
22
99. The result of the analysis showed that, under the External DSA, all indicators of external debt sustainability, except the PV of debt-to-exports ratio, are projected to breach their indicative thresholds over the medium-term of the next five (5) years under the baseline, a clear indication that Ghana is facing a high risk of external debt distress. External financing is increasing more than exports, an indicator that shows that foreign exchange availability could be a challenge in the outlook for the repayment of the loans.
100. Under the Public DSA, there are huge breaches to the thresholds under the baseline, historical and shocks scenarios, signifying liquidity challenges (debt service-to-revenue ratios) in honouring debt obligations. The breaches remain elevated throughout the projection period, also an indication that Government may be borrowing to repay debt a situation that could breach the primary balance ceilings. The debt service-to-export ratios further highlights the liquidity position of Government under all scenarios, as the baseline, historical, and shocks are all breached over the projection period, a further indication that exports by Ghana may be inadequate to meet debt service payment obligations.
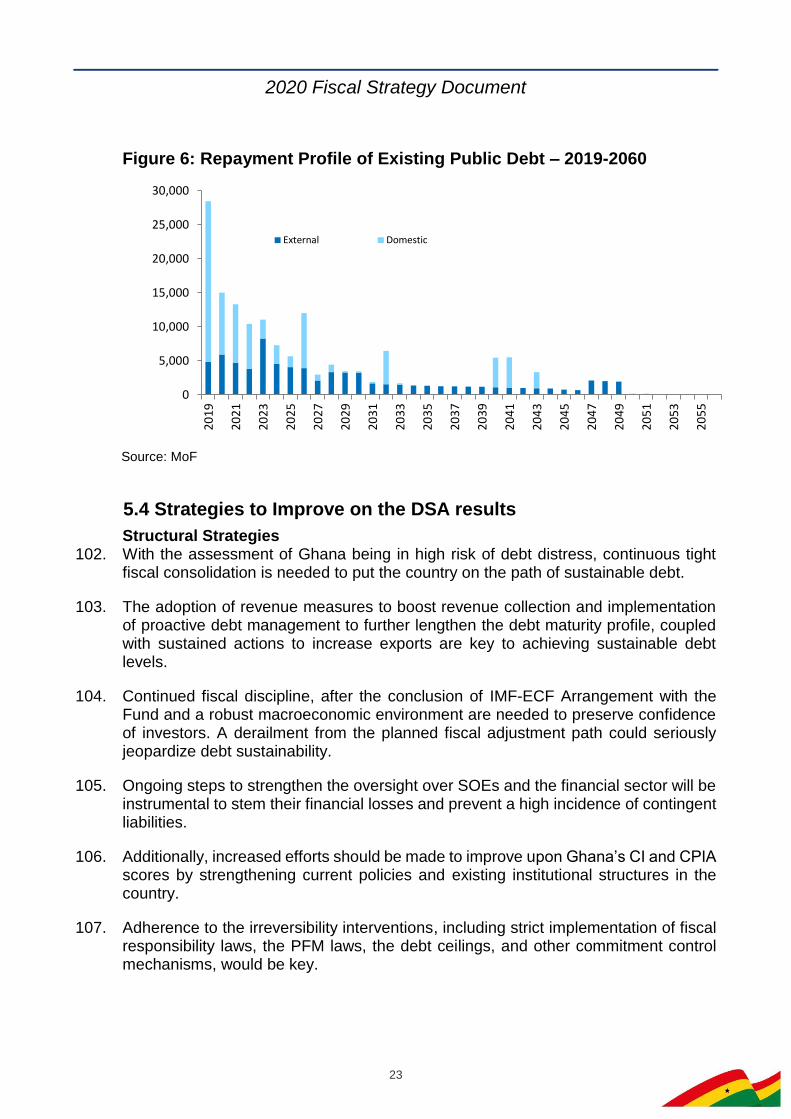
Redemption Profile of the Public Debt Portfolio 101. The redemption profile of the total debt portfolio shows a high concentration of debt
maturing within a year, due to the significant volumes of short-term domestic securities. The redemption profile of external debt is relatively smooth with an Average Time to Maturity (ATM) of 8.7 years, reflecting a moderately low refinancing risk, supported by a large proportion of concessional loans from multilateral and bilateral creditors still existing in the public debt portfolio (Figure 4).
0
5
10
15
20
25
30
35
40
2018 2020 2022 2024 2026 2028
Debt service-to-exports ratio
Most extreme shock is Exports0
10
20
30
40
50
60
70
2018 2020 2022 2024 2026 2028
Debt service-to-revenue ratio
Most extreme shock is
Most extreme shock 1/Historical scenarioBaseline Threshold
2020 Fiscal Strategy Document
23
Figure 6: Repayment Profile of Existing Public Debt – 2019-2060
Source: MoF
5.4 Strategies to Improve on the DSA results
Structural Strategies 102. With the assessment of Ghana being in high risk of debt distress, continuous tight
fiscal consolidation is needed to put the country on the path of sustainable debt.
103. The adoption of revenue measures to boost revenue collection and implementation of proactive debt management to further lengthen the debt maturity profile, coupled with sustained actions to increase exports are key to achieving sustainable debt levels.
104. Continued fiscal discipline, after the conclusion of IMF-ECF Arrangement with the Fund and a robust macroeconomic environment are needed to preserve confidence of investors. A derailment from the planned fiscal adjustment path could seriously jeopardize debt sustainability.
105. Ongoing steps to strengthen the oversight over SOEs and the financial sector will be instrumental to stem their financial losses and prevent a high incidence of contingent liabilities.
106. Additionally, increased efforts should be made to improve upon Ghana’s CI and CPIA scores by strengthening current policies and existing institutional structures in the country.
107. Adherence to the irreversibility interventions, including strict implementation of fiscal responsibility laws, the PFM laws, the debt ceilings, and other commitment control mechanisms, would be key.
0
5,000
10,000
15,000
20,000
25,000
30,000
20
19
20
21
20
23
20
25
20
27
20
29
20
31
20
33
20
35
20
37
20
39
20
41
20
43
20
45
20
47
20
49
20
51
20
53
20
55
External Domestic

2020 Fiscal Strategy Document
24
5.5 Debt Ceilings Strategies
108. It is recommended that non-concessional borrowing for the medium-term should remain at an annual limit of US$750 million for both 2020 and the medium-term.
109. Maintain a concessionality test of a minimum 35 percent grant element.
110. It is recommended also that Ghana keeps a debt-to-GDP ratio below 60 percent threshold over the medium-term. This would ensure that the country does not breach the levels on sustainable basis.
Medium-Term Debt Strategy (MTDS) 111. The main objective of the debt strategy is to finance the budget deficit at the least
possible cost and at a prudent level of risk.
112. Based on the current macroeconomic framework, the recent MTDS analysed four strategies, which is also in line with the Medium-Term Fiscal Framework.
113. Common to all the strategies is the continuous issuance of more medium-term bonds (3-year and 5-year) in all the years of the strategy period, as well as issuance of domestic debt to fund the financial sector bailout in 2019 and 2020.
114. All four strategies also assume the creation of a cash buffer of up to Gh¢1 billion in 2019 on top of the programmed net financing for active liability management and the timely servicing of Government debt obligations.
115. Furthermore, all four strategies assume the issuance of a 3-year US Dollar denominated bond in 2019 of an amount up to US$250 million, without a refinancing of the maturing one in 2020 as it is an election year.
Table 6: Cost-Risk Indicators (2019-2022)
Risk Indicators 2018 As at end 2022
S1 S2 S3 S4
Cost of Debt Weighted Av. IR (%) 10.7 11.0 11.2 11.0 10.1
Refinancing risk
Average Time to Maturity (ATM) -Years
8.7 8.1 8.3 8.2 8.5
Debt Maturing in 1 year (% of total)
17.6 20.3 15.3 19.4 17.1
Interest rate risk
Average Time to Re-fixing (ATR) - Years
8.5 7.4 7.6 7.5 7.7
Debt Re-fixing in 1 year (% of total)
24.1 30.0 25.0 29.1 28.2
Fixed Rate Debt (% of total) 91.9 89.6 89.6 89.6 88.2
FX risk FX Debt (% of total debt) 48.5 53.1 47.8 55.0 58.7
ST FX Debt (% of reserves) 14.1 18.5 18.5 18.5 18.5 Source: MoF

2020 Fiscal Strategy Document
25
116. The recommended strategy is Strategy 4, which best responds to Government’s intent to diversify the investor base and currency structure. It also seeks to continue the ongoing liability management programme to manage the risks embedded in the public debt portfolio and develop the domestic debt market. As part of the strategy to diversify the investor base, Government will explore the possibility of issuing new financing instruments such as Century bond, Green bond, Samurai bond, and Panda bond, among others.
117. The Strategy assumes a sovereign bond issue of US$3 billion on the ICM. It also assumes a sovereign bond issuance of US$1.5 billion in 2021, as well as increased inflows of about US$550 million in external commercial debt in 2020. The Strategy envisions the possible issuance of domestic debt of up to GH¢4 billion to fund a financial sector bailout in 2019, as well as the creation of a cash buffer of up to GH¢1 billion annually for active liability management operations. In addition, the chosen strategy assumes the issuance of a 3-year US Dollar denominated bond in 2019 of an amount up to US$250 million.
118. Strategic benchmarks set out in the MTDS is aimed at monitoring and ultimately reducing foreign currency risk, interest rate risk, and refinancing risk embedded in the public debt portfolio. Table 7 below shows the target set for the risk indicators.
Table 7: Risk Indicators for MTDS
Risk Indicators Target
Refinancing Risk Debt Maturing in 1 year (% of total) 15 - 20
Average Time to Maturity (ATM) - Years ≥ 7.8
Interest Rate Risk Debt Re-fixing in 1 year (% of total) ≤ 30
Floating Rate Debt (% of total external debt) 15 - 20
FX Risk USD debt (% of external debt) 70 ± 5 Source: MoF

2020 Fiscal Strategy Document
26
CHAPTER SIX: PROGRESS REPORT ON THE IMPLEMENTATION OF THE 2019 FISCAL STRATEGY DOCUMENT
119. This Chapter presents a progress report on the implementation of the FSD for the 2019 financial year, a requirement under the PFM Act.
6.1 Summary of 2019 FSD
120. The 2019 FSD growth projections and the 2019 Budget growth projections show some variations with the Budget overall growth rate projection falling slightly behind the FSD projections as highlighted in Table 8.
Table 8: 2019 FSD compared with 2019 Budget (percent)
Item 2019 FSD 2019 Budget Deviation
Agriculture 6.5 7.3 0.8
Industry 12.9 9.7 -3.2
Services 6.1 6.1 0.0
Overall GDP 8.2 7.6 -0.6
Non-Oil GDP 6.3 6.2 -0.1
Source: MoF
121. The variation mainly stems from updated GDP information as the time of Budget was being prepared as the Ghana Statistical Service (GSS) released updated GDP data for 2018. The Budget growth projections were based on the rebased GDP released by the GSS in September 2018 whereas the FSD projections were based on the old GDP series.
122. The results of the fiscal framework approved in the 2019 FSD was very close to the one approved in the 2019 Budget as shown in Table 9.
Table 9: Summary of Approved Fiscal Framework for 2019 FSD and
Budget
Item Units 2019 FSD 2019
Budget Deviation
Total Revenue & Grants GH¢bn 60.2 58.9 -1.3
% of GDP 21.2 17.1 -4.1
Total Expenditures GH¢bn 72.4 73.4 1.0
% of GDP 25.5 21.3 -4.2
Fiscal Balance GH¢bn -12.3 -14.5 -2.2
% of GDP -4.3 -4.2 0.1
Primary Balance GH¢bn 3.6 4.1 0.5
% of GDP 1.3 1.2 -0.1
Source: MoF
2020 Fiscal Strategy Document
27
6.2 Implementation of Fiscal Policy Measures
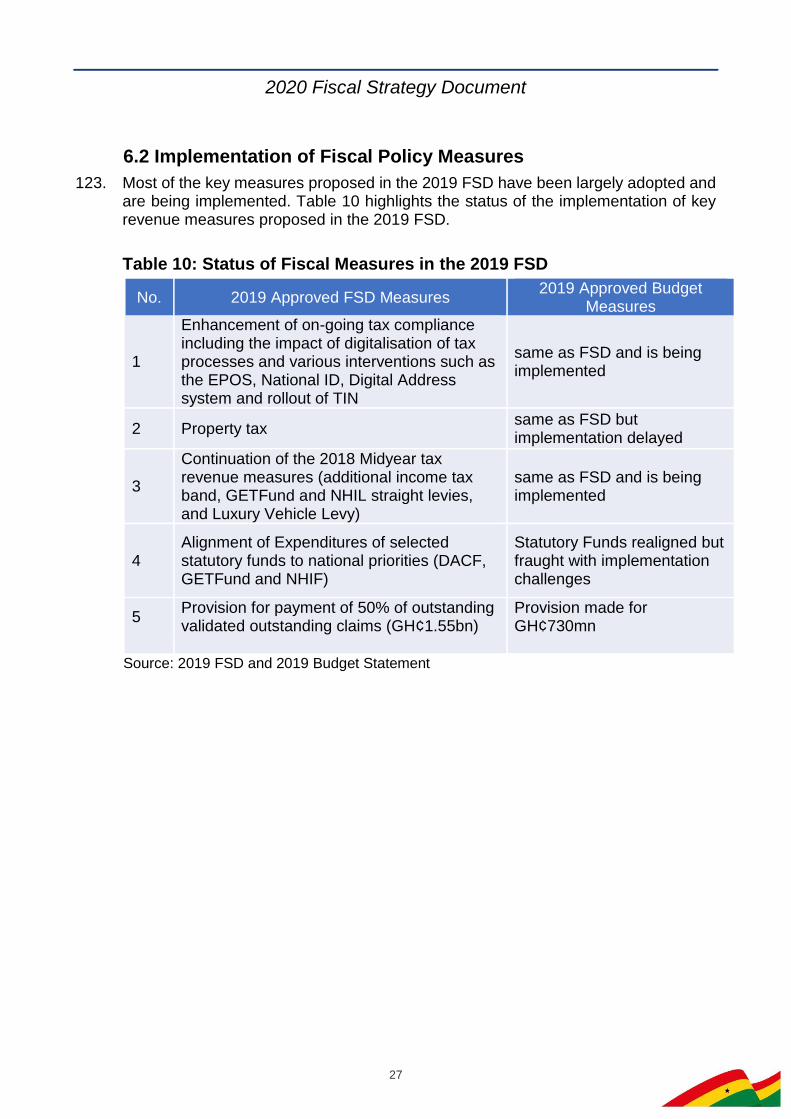
123. Most of the key measures proposed in the 2019 FSD have been largely adopted and are being implemented. Table 10 highlights the status of the implementation of key revenue measures proposed in the 2019 FSD.
Table 10: Status of Fiscal Measures in the 2019 FSD
No. 2019 Approved FSD Measures 2019 Approved Budget
Measures
1
Enhancement of on-going tax compliance including the impact of digitalisation of tax processes and various interventions such as the EPOS, National ID, Digital Address system and rollout of TIN
same as FSD and is being implemented
2 Property tax same as FSD but implementation delayed
3
Continuation of the 2018 Midyear tax revenue measures (additional income tax band, GETFund and NHIL straight levies, and Luxury Vehicle Levy)
same as FSD and is being implemented
4 Alignment of Expenditures of selected statutory funds to national priorities (DACF, GETFund and NHIF)
Statutory Funds realigned but fraught with implementation challenges
5 Provision for payment of 50% of outstanding validated outstanding claims (GH¢1.55bn)
Provision made for GH¢730mn
Source: 2019 FSD and 2019 Budget Statement

2020 Fiscal Strategy Document
28
CHAPTER SEVEN: CONCLUSION
Conclusion 124. Even though the implementation of government’s economic programmes continues
to impact positively on economic stability and growth, shortfalls in revenue mobilisation and emerging expenditure pressures, pose risks to fiscal and debt sustainability. Fiscal measures proposed will ensure that the fiscal deficit for 2019 does not exceed 4.5 percent of GDP whilst posting a primary surplus consistent with the FRA.
125. After stabilising at 4.5 percent of GDP in 2020, the fiscal deficit is expected to decline to below 4.0 percent of GDP from 2021 onwards

2020 Fiscal Strategy Document
29
Appendices Appendix A1: Fiscal Risks Assessment Framework
S/N Source Description Mitigation measures
1 Global economy
• Sharp tightening of global financial condition. • Reliance on non-resident investors is high. • Failure to secure financing will lead to: higher interest rates, further dampening growth and
exacerbating fiscal costs and debt dynamics. Erosion FX buffers and put pressure on the exchange
rate (scarce external financing)
• Bolster investors’ confidence
• Build FX buffers • Adopt contingency measures
2 Oil prices volatility
Sizeable deviations from baseline energy prices due to sharp drop in oil prices on the world market. Contraction of exports, Weakening the external position, Reducing the low reserve buffers and resulting in
exchange rate depreciation and inflationary pressures.
• Diversify the economy and export base • Improve business environment • Investing in human capital
3 Exchange rate depreciation
A depreciation may increase external debt service cost and FX-denominated, depletion of reserves, inflationary pressures
• Building comfortable reserves position; • Consideration for hedging of crude oil exports; • Diversifying the exports base; • Reducing public debts in general and FX-denominated debt in particular
Financial sector
• High NPLs and capital shortfalls in some parts of the financial sector. • Financial sector bailout cost, including cost for S&Ls.
• Resolution of distressed firms and tackling the NPL overhang. • Addressing SDIs to protect savings of the public • Need to strengthen supervision and oversight of the SDIs • Implementation of deposit protection law
4
2020 Fiscal Strategy Document
30
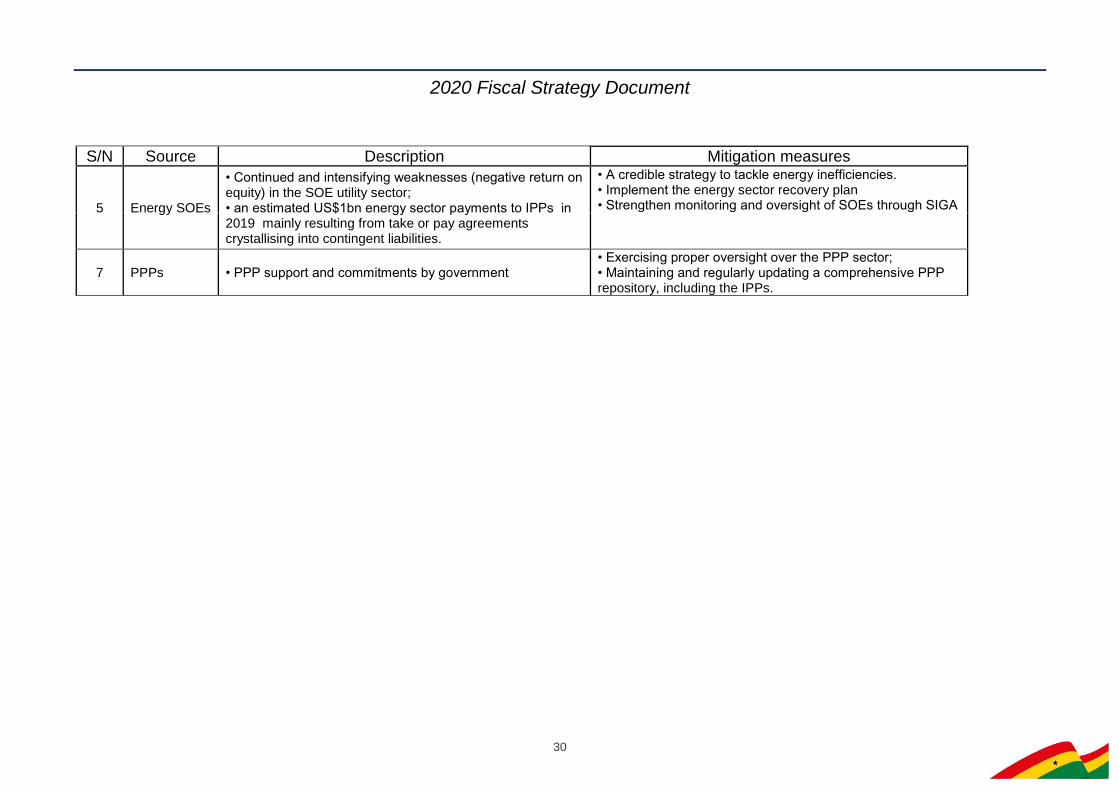
S/N Source Description Mitigation measures
5 Energy SOEs
• Continued and intensifying weaknesses (negative return on equity) in the SOE utility sector; • an estimated US$1bn energy sector payments to IPPs in 2019 mainly resulting from take or pay agreements crystallising into contingent liabilities.
• A credible strategy to tackle energy inefficiencies. • Implement the energy sector recovery plan • Strengthen monitoring and oversight of SOEs through SIGA
7 PPPs • PPP support and commitments by government • Exercising proper oversight over the PPP sector; • Maintaining and regularly updating a comprehensive PPP repository, including the IPPs.

© 2018. All rights reserved. No part of this publication may be stored in a retrieval system or
transmitted in any or by any means, electronic, mechanical, photocopying, recording or otherwise without the prior
written permission of the Ministry of Finance


![Fccl durango[1]](https://img.pdfslide.net/doc/110x75/55850eb4d8b42ac60a8b4ac9/fccl-durango1.jpg)