Embed Size (px)
Citation preview

United States AgriculturalExport Yearbook
2020
Foreign Agricultural ServiceU.S. DEPARTMENT OF AGRICULTURE

The 2020 U.S. Agricultural Export Yearbook provides a statistical summary of U.S. agricultural commodity exports to the world. This summary lists only the United States’ primary trading partners. The Yearbook is produced by the U.S. Department of Agriculture’s (USDA) Foreign Agricultural Service (FAS) using trade data published by the U.S. Census Bureau of the U.S. Department of Commerce. Foreign country export data was sourced from the reporting countries’ national statistical agencies as reported through Trade Data Monitor (TDM).
The 2020 U.S. Agricultural Export Yearbook consists of two sections: (1) top U.S. commodity exports and (2) top destinations for U.S. exports. The Yearbook utilizes FAS Product Groups that can be found at FAS’ Global Agricultural Trade System (GATS) located at https://apps.fas.usda.gov/gats/. The product groups are defined using the Harmonized Tariff Schedule (HTS) at the 10-digit level and aggregated into classifications that include the primary commodity and its derivatives. FAS has titled these product groups as “BICO (HS-10).” BICO is an FAS designation that stands for Bulk, Intermediate & Consumer Oriented goods. The bulk commodity groups, such as corn, wheat, and rice, are aggregations of very few HTS codes. For example, the soybeans product group includes only 2 HTS codes; and cotton includes only 5 codes; while the Beef and Beef Product category incorporates 26 HTS lines; Dairy Products includes 46 HTS lines; and Fresh Vegetables includes 70 HTS codes.
The 16 product groups or commodity aggregations, displayed in the Yearbook, are based on the United States’ largest export categories. Ethanol is not considered an agricultural product according to the USDA definition of agriculture, and its export value is not included in the total value of U.S. agricultural exports ($145.7 billion).1 However, a Yearbook page on ethanol has been included in this publication because of the large value of its exports and its importance to the agricultural community and rural America. The top 15 export product groups (not including ethanol) accounts for nearly 72 percent of total U.S. agricultural products exported in 2020.
The country Yearbook pages include the United States’ top 15 export destinations as well as a page for the United Kingdom (UK). The European Union (EU27+UK), a customs union comprised of 28 member states, is included as a single trading partner. The only exception is that the UK has its own yearbook page given the importance of its withdrawal from the EU-28. The top 14 export markets represent 80 percent of total U.S. agricultural exports in 2020.
Questions or comments about The 2020 U.S. Agricultural Export Yearbook can be directed to USDA’s Foreign Agricultural Service ([email protected]) (202-720-1335).
1 The USDA changed its definition of “agricultural products” in March 2021 to conform to World Trade Organization standards. The new definition includes ethanol.
INTRODUCTION

Commodities
Overview ............................................................................................................................ 1 Beef & Beef Products .................................................................................................... 3 Corn ...................................................................................................................................... 5Cotton .................................................................................................................................. 7Dairy Products ................................................................................................................. 9 Ethanol ............................................................................................................................. 12Fresh Fruits & Vegetables ......................................................................................... 15Pork & Pork Products ................................................................................................. 17Poultry Meat & Products .......................................................................................... 20Prepared Food ............................................................................................................... 23Rice .................................................................................................................................... 25Soybeans .......................................................................................................................... 27Tree Nuts ......................................................................................................................... 29Wheat ............................................................................................................................... 32
Countries
Overview ......................................................................................................................... 34Canada .............................................................................................................................. 36China ................................................................................................................................. 39Colombia .......................................................................................................................... 41Egypt ................................................................................................................................. 44EU27+UK ........................................................................................................................ 47Hong Kong ...................................................................................................................... 50Indonesia ......................................................................................................................... 52Japan ................................................................................................................................. 54Mexico .............................................................................................................................. 56Philippines ....................................................................................................................... 59South Korea .................................................................................................................... 61Taiwan ............................................................................................................................... 63Thailand............................................................................................................................ 65United Kingdom ............................................................................................................ 68Vietnam ............................................................................................................................ 71
TABLE OF CONTENTS

Commodity 2016 2017 2018 2019 2020 2019-2020 % Change
2016-2020 Average
Soybeans 22,839 21,456 17,058 18,663 25,683 38% 21,140
Corn 9,879 9,131 12,462 7,651 9,210 20% 9,667
Tree Nuts 7,902 8,479 8,515 9,076 8,402 -7% 8,475
Pork & Pork Products 5,936 6,485 6,403 6,952 7,715 11% 6,698
Beef & Beef Products 6,360 7,263 8,357 8,094 7,649 -6% 7,545
Prepared Food 6,118 5,938 6,245 6,731 6,733 -- 6,353
Dairy Products 4,698 5,377 5,493 5,924 6,453 9% 5,589
Wheat 5,346 6,058 5,387 6,232 6,298 1% 5,864
Cotton 3,967 5,845 6,562 6,148 5,976 -3% 5,700
Soybean Meal 4,073 3,881 5,073 4,365 4,758 9% 4,430
Fresh Fruit 4,564 4,752 4,676 4,384 4,325 -1% 4,540
Poultry Meat & Products 3,879 4,267 4,274 4,243 4,244 -- 4,181
Fresh Vegetables 2,446 2,513 2,577 2,672 2,564 -4% 2,554
Processed Vegetables 2,695 2,691 2,613 2,703 2,376 -12% 2,616
Ethanol (non-beverage) 2,042 2,412 2,663 2,349 2,333 -1% 2,360
Rice 1,784 1,709 1,678 1,850 1,877 1% 1,780
All Others 42,190 42,338 42,173 40,962 41,419 1% 41,816
Total exported 134,678 138,183 139,544 136,650 145,683 7% 138,948
Overview
Total U.S. agricultural exports in 2020 were nearly $146 billion, up almost 7 percent from 2019, and the second highest level on record (after Calendar Year 2014). The primary factor for this surge in exports was increased shipments of soybeans, corn, and pork to China.
Soybeans continued to be the United States’ No.1 agricultural export, increasing 38 percent to a record $25.7 billion in 2020 and accounting for nearly 18 percent of total U.S. agricultural exports. In 2020, soybean shipments to China accounted for 55 percent of total soybean exports, returning to levels prior to China’s imposition of
Top U.S. Agricultural Exports* (Values in millions of dollars)
EXPORT OVERVIEW
Source: U.S. Census Bureau Trade Data - BICO HS-10*Ethanol is not counted as an agricultural good in the USDA definition of agriculture
USDA - Foreign Agricultural Service - 2020 United States Agricultural Export Yearbook 1
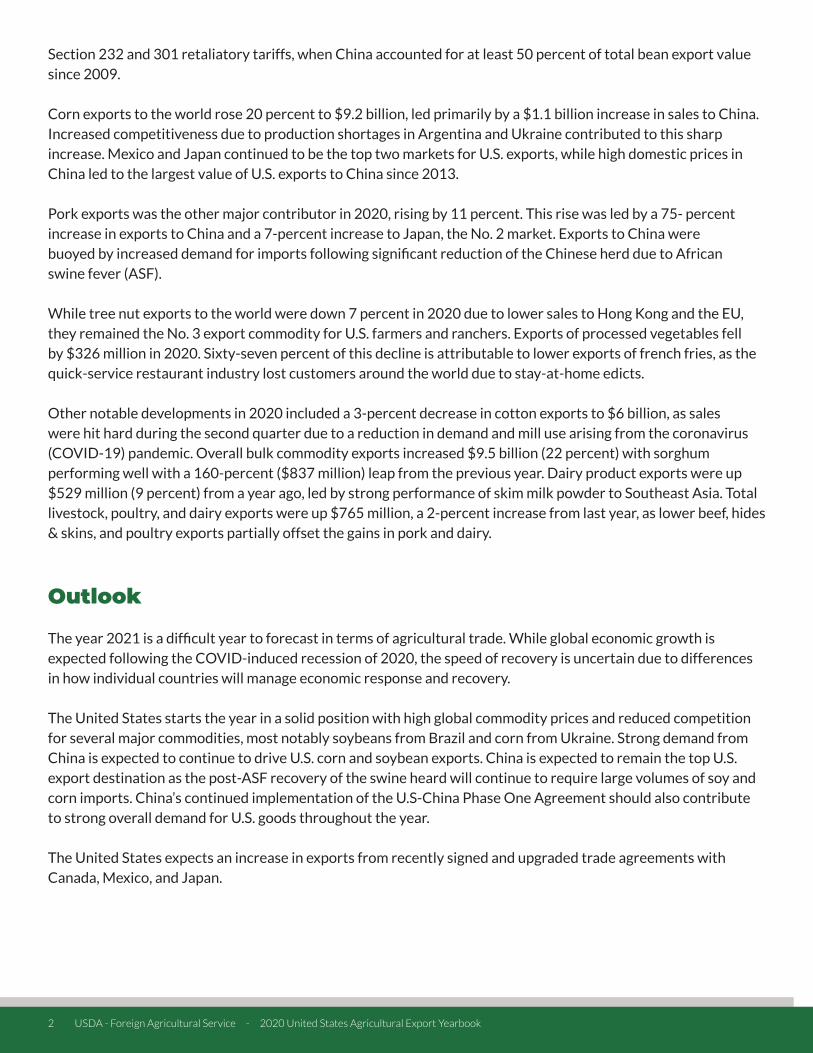
Section 232 and 301 retaliatory tariffs, when China accounted for at least 50 percent of total bean export value since 2009.
Corn exports to the world rose 20 percent to $9.2 billion, led primarily by a $1.1 billion increase in sales to China. Increased competitiveness due to production shortages in Argentina and Ukraine contributed to this sharp increase. Mexico and Japan continued to be the top two markets for U.S. exports, while high domestic prices in China led to the largest value of U.S. exports to China since 2013.
Pork exports was the other major contributor in 2020, rising by 11 percent. This rise was led by a 75- percent increase in exports to China and a 7-percent increase to Japan, the No. 2 market. Exports to China were buoyed by increased demand for imports following significant reduction of the Chinese herd due to African swine fever (ASF).
While tree nut exports to the world were down 7 percent in 2020 due to lower sales to Hong Kong and the EU, they remained the No. 3 export commodity for U.S. farmers and ranchers. Exports of processed vegetables fell by $326 million in 2020. Sixty-seven percent of this decline is attributable to lower exports of french fries, as the quick-service restaurant industry lost customers around the world due to stay-at-home edicts.
Other notable developments in 2020 included a 3-percent decrease in cotton exports to $6 billion, as sales were hit hard during the second quarter due to a reduction in demand and mill use arising from the coronavirus (COVID-19) pandemic. Overall bulk commodity exports increased $9.5 billion (22 percent) with sorghum performing well with a 160-percent ($837 million) leap from the previous year. Dairy product exports were up $529 million (9 percent) from a year ago, led by strong performance of skim milk powder to Southeast Asia. Total livestock, poultry, and dairy exports were up $765 million, a 2-percent increase from last year, as lower beef, hides & skins, and poultry exports partially offset the gains in pork and dairy.
Outlook
The year 2021 is a difficult year to forecast in terms of agricultural trade. While global economic growth is expected following the COVID-induced recession of 2020, the speed of recovery is uncertain due to differences in how individual countries will manage economic response and recovery.
The United States starts the year in a solid position with high global commodity prices and reduced competition for several major commodities, most notably soybeans from Brazil and corn from Ukraine. Strong demand from China is expected to continue to drive U.S. corn and soybean exports. China is expected to remain the top U.S. export destination as the post-ASF recovery of the swine heard will continue to require large volumes of soy and corn imports. China’s continued implementation of the U.S-China Phase One Agreement should also contribute to strong overall demand for U.S. goods throughout the year.
The United States expects an increase in exports from recently signed and upgraded trade agreements with Canada, Mexico, and Japan.
2 USDA - Foreign Agricultural Service - 2020 United States Agricultural Export Yearbook

Country 2016 2017 2018 2019 2020 2019-2020 % Change
2016-2020 Average
Japan 1,510 1,889 2,102 1,950 1,944 0% 1,879
South Korea 1,071 1,220 1,746 1,843 1,722 -7% 1,520
Mexico 977 979 1,058 1,107 853 -23% 995
Canada 758 791 745 654 728 11% 735
Hong Kong 684 884 964 746 666 -11% 789
Taiwan 363 409 552 568 552 -3% 489
China 4 31 61 86 310 260% 98
EU27+UK 247 252 231 193 153 -21% 215
Indonesia 39 54 62 85 72 -16% 62
Philippines 55 62 87 88 62 -29% 71
All Others 579 660 760 736 694 -6% 686
Total Exported 6,360 7,263 8,357 8,095 7,649 -6% 7,545
Highlights
In 2020, the value of U.S. beef & beef product exports contracted 5.5 percent year-over-year, largely due to supply chain constraints and foodservice struggles in the wake of the COVID-19 pandemic. Japan at $1.9 billion, South Korea at $1.7 billion, and Mexico at $853 million accounted for 59 percent of total U.S. sales. Mexico’s beef imports from the United States decreased due to its economic slowdown and an unfavorable exchange rate relative to the U.S. dollar. U.S. exports to Japan, the No. 1 market, remained flat from the previous year. The effects of additional exports to Japan early in 2020 were negated by a drastic decline in the second quarter after COVID-19 became more widespread. Exports of U.S. beef to China increased due to China’s removal of market access barriers pursuant to the Phase One Agreement and strong meat demand in China due to reduced domestic pork supplies. Overall, exports accounted for 11 percent of U.S. domestic production. The United States was the world’s largest beef producer, second-largest importer, and third-largest exporter by volume.
Top 10 Export Markets for U.S. Beef (Values in millions of dollars)
BEEF & BEEF PRODUCTS
Source: U.S. Census Bureau Trade Data - BICO HS-10
USDA - Foreign Agricultural Service - 2020 United States Agricultural Export Yearbook 3
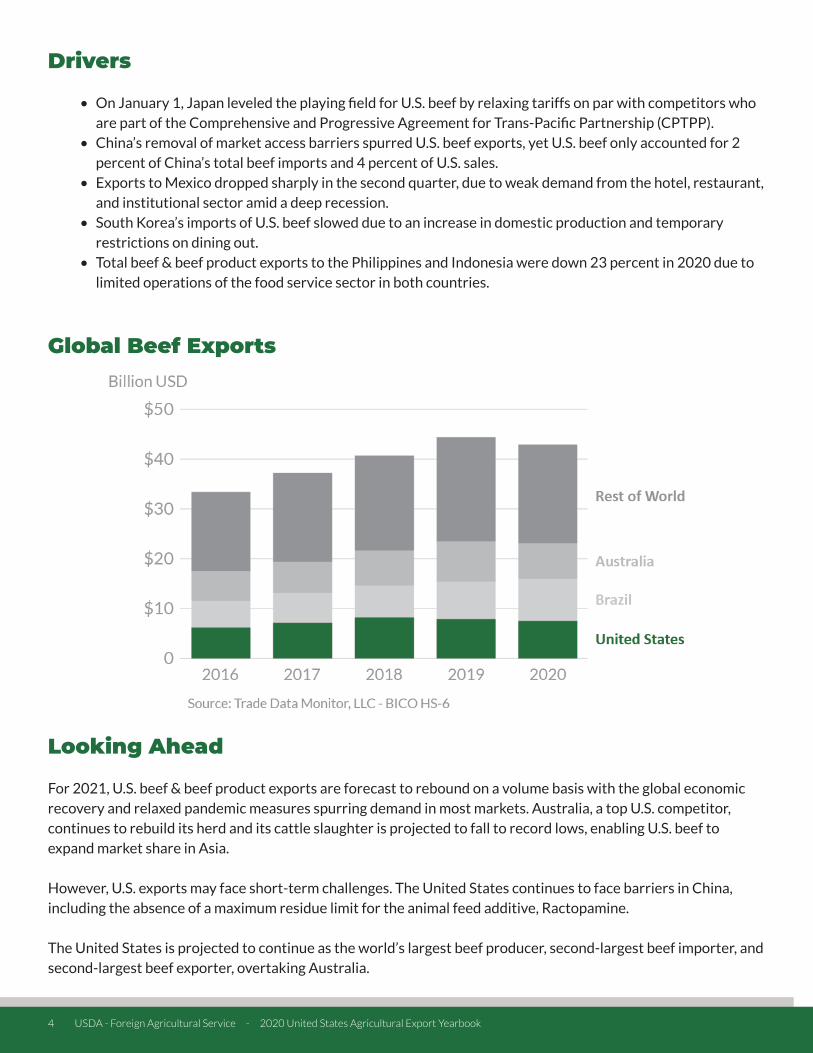
Drivers
• On January 1, Japan leveled the playing field for U.S. beef by relaxing tariffs on par with competitors who are part of the Comprehensive and Progressive Agreement for Trans-Pacific Partnership (CPTPP).
• China’s removal of market access barriers spurred U.S. beef exports, yet U.S. beef only accounted for 2 percent of China’s total beef imports and 4 percent of U.S. sales.
• Exports to Mexico dropped sharply in the second quarter, due to weak demand from the hotel, restaurant, and institutional sector amid a deep recession.
• South Korea’s imports of U.S. beef slowed due to an increase in domestic production and temporary restrictions on dining out.
• Total beef & beef product exports to the Philippines and Indonesia were down 23 percent in 2020 due to limited operations of the food service sector in both countries.
Global Beef Exports
Looking Ahead
For 2021, U.S. beef & beef product exports are forecast to rebound on a volume basis with the global economic recovery and relaxed pandemic measures spurring demand in most markets. Australia, a top U.S. competitor, continues to rebuild its herd and its cattle slaughter is projected to fall to record lows, enabling U.S. beef to expand market share in Asia.
However, U.S. exports may face short-term challenges. The United States continues to face barriers in China, including the absence of a maximum residue limit for the animal feed additive, Ractopamine.
The United States is projected to continue as the world’s largest beef producer, second-largest beef importer, and second-largest beef exporter, overtaking Australia.
4 USDA - Foreign Agricultural Service - 2020 United States Agricultural Export Yearbook

Country 2016 2017 2018 2019 2020 2019-2020 % Change
2016-2020 Average
Mexico 2,550 2,646 3,061 2,730 2,693 -1% 2,736
Japan 2,091 2,163 2,813 2,001 1,846 -8% 2,183
China 40 142 50 56 1,205 2072% 299
Colombia 771 785 927 683 876 28% 808
South Korea 865 705 1,356 359 548 53% 766
Canada 147 131 309 349 272 -22% 241
Guatemala 174 145 196 177 219 23% 182
Taiwan 460 395 593 228 179 -22% 371
Costa Rica 115 138 143 145 151 4% 138
Saudi Arabia 343 266 297 110 151 37% 233
All Others 2,324 1,615 2,718 814 1,072 32% 1709
Total Exported 9,879 9,131 12,462 7,651 9,210 20% 9,667
Highlights
U.S. corn exports were up $1.6 billion (20 percent) from a year ago to $9.2 billion in 2020. Strong feed demand in China contributed to this sharp increase, as did China’s implementation of the Phase One Agreement. Exports to China totaled $1.2 billion, the largest since 2012. China became the third largest destination for U.S. corn in 2020 after Mexico and Japan. The top three markets accounted for 62 percent of total U.S. corn exports. The sum total of U.S. corn exports to Colombia, South Korea, and Guatemala, three U.S. free trade partners, was up $424 million over 2019.
Drivers
• Exports to China were strong during the latter half of 2020 and ultimately exceeded the Phase One quota for 2020, as the recovery in China’s swine sector from the outbreaks of African swine fever (ASF) fueled demand for competitively priced feedstuffs.
Top 10 Export Markets for U.S. Corn (Values in millions of dollars)
CORN
Source: U.S. Census Bureau Trade Data - BICO HS-10
USDA - Foreign Agricultural Service - 2020 United States Agricultural Export Yearbook 5

• U.S. prices were competitive in global markets supported by abundant exportable supplies and weak domestic demand in the fuel ethanol sector amidst COVID-19.
• The depreciation of the U.S. dollar against a basket of currencies also boosted the competitiveness of U.S. corn overseas.
Global Corn Exports
Looking Ahead
U.S. corn is expected to remain competitive, with ample supplies and reduced competition from Ukraine, Argentina, and Brazil. Ukraine’s exports are forecast to be smaller (-17 percent) than the previous year due to a smaller crop. Corn prices in the South American countries remain elevated, reflecting tight stocks and strong domestic feed demand for animal production and meat exports. Moreover, Brazil’s corn is expected to come onto the market later than usual due to slow planting in the Center-West impacted by delays in the soybean harvest.
U.S. corn exports to China are expected to be stronger. At the end of January 2021, sales to China for delivery in 2021 stood at a record 11.6 million tons. China’s demand for competitively priced feedstuff should remain strong as its swine sector continues to rebound from ASF. High corn prices in China, which were nearly double those of U.S. corn at the end of January, are also expected to stimulate demand for imports.
With reduced competition, U.S. corn is expected to expand its market share in traditional markets in Asia and the Western Hemisphere, while rebuilding market share to countries in North Africa. In fact, U.S. sales and shipments to North African countries are off to a good start. At the end of January 2021, they totaled 750,000 tons compared to none a year ago.
6 USDA - Foreign Agricultural Service - 2020 United States Agricultural Export Yearbook

Country 2016 2017 2018 2019 2020 2019-2020 % Change
2016-2020 Average
China 551 973 920 705 1,821 158% 994
Vietnam 788 1,056 1,312 1,429 1,163 -19% 1,150
Pakistan 202 297 615 628 788 25% 506
Turkey 495 730 682 648 577 -11% 626
Bangladesh 95 284 387 388 330 -15% 297
Indonesia 346 498 600 416 264 -37% 425
Mexico 339 404 372 288 178 -38% 316
India 251 435 333 587 148 -75% 351
Thailand 164 213 272 215 119 -44% 197
South Korea 165 248 231 167 111 -34% 184
All Others 564 689 826 671 470 -30% 644
Total Exported 3,959 5,827 6,550 6,141 5,968 -3% 5,689
Highlights
U.S. exports of cotton declined 3 percent in 2020 to $6 billion but remained the fifth-highest export value on record. Exports to China surged by more than 150 percent to reach a 7-year high. Exports to Pakistan realized their fifth consecutive record. Exports to other markets were largely down, with 15 of the top 20 markets down by more than 30 percent. Much of the increase to China was destined for the State Reserve (SR), which limited supplies available for other markets. Brazil, which saw its third consecutive record crop, increased its market share relative to the United States in 20 of the top 25 import markets.
Global consumption in 2020 was dramatically affected by COVID-19 as consumer demand shrank and mill use fell by nearly 20 percent. Trade volume was reduced by nearly 10 percent. World and U.S. prices fell sharply in the first quarter of 2020 due to concerns over the impact of COVID-19 and large global stocks. However, prices rallied mid-year, supported by increasing prices for other commodities, and ended the year at a 2-year high.
Top 10 Export Markets for U.S. Cotton (Values in millions of dollars)
COTTON
Source: U.S. Census Bureau Trade Data - BICO HS-10
USDA - Foreign Agricultural Service - 2020 United States Agricultural Export Yearbook 7

Drivers
• Global impact of COVID-19 sharply decreased demand for cotton/textiles.• China State Reserve purchases of U.S. cotton limited availability of high-grade cotton to other markets.• Increased competition dampened U.S. exports as Brazil expanded export capacity and shipped record
volumes year-round, including during typically slow export months.
Global Cotton Exports
Looking Ahead
U.S. cotton exports are forecast unchanged at 15.5 million bales for the marketing year ending July 2022. Global trade volume is also expected stable.
SR purchases of U.S. cotton fueled shipments to China, and these types of purchases in 2021 are expected to shift back to domestic cotton, limiting U.S. sales.
Strong competition from key competitors such as Brazil is also expected to dampen U.S. exports. Brazil’s projected crop in the coming months is only down slightly from last year’s third consecutive record crop.
8 USDA - Foreign Agricultural Service - 2020 United States Agricultural Export Yearbook

Country 2016 2017 2018 2019 2020 2019-2020 % Change
2016-2020 Average
Mexico 1,218 1,312 1,398 1,546 1,416 -8% 1,378
Canada 630 637 641 667 676 1% 650
China 386 576 498 373 539 45% 474
Philippines 227 243 246 273 410 50% 280
South Korea 231 279 290 330 371 12% 300
Indonesia 158 132 165 239 352 47% 209
Japan 206 291 269 282 322 14% 274
Vietnam 120 112 145 170 185 9% 146
Australia 109 185 153 148 170 15% 153
Malaysia 87 90 101 109 157 45% 109
All Others 1,327 1,520 1,586 1,788 1,856 4% 1,615
Total Exported 4,698 5,377 5,493 5,924 6,453 9% 5,589
Highlights
U.S. dairy product exports grew by 9 percent to reach $6.5 billion in 2020 despite significant challenges posed by the COVID-19 pandemic and ongoing trade policy issues with Canada and China. While still below the record level in 2014, this was the fourth year in a row that the value of U.S. dairy product exports expanded, registering an average annual growth rate of 8 percent over this period.
Mexico, Canada, and China were the top three markets, accounting for about 45 percent of sales. Sales to Mexico were down 8 percent due to the COVID-19 pandemic leading to slower economic growth and reduced consumer spending. Southeast Asia remains a critical region for growth, with the value of dairy shipments up an impressive 25 percent from 2019 to reach $2.7 billion. There were notable increases in exports of whey & whey products to China, and skimmed milk powder (SMP) to the Philippines and Indonesia.
Top 10 Export Markets for U.S. Dairy (Values in millions of dollars)
DAIRY PRODUCTS
Source: U.S. Census Bureau Trade Data - BICO HS-10
USDA - Foreign Agricultural Service - 2020 United States Agricultural Export Yearbook 9

Drivers
• China started to rebuild its pig herd and demand for pig feeds led to growth in imports of U.S. whey & whey products.
• Global demand for dairy products was surprisingly strong in 2020 while the availability of exportable stocks was lower than in 2019. This was particularly true for SMP as EU27+UK surplus intervention stocks were completely drawn down. As a result, U.S. exporters made strong gains in Asian markets, particularly Indonesia and the Philippines.
• The low value of the U.S. dollar plus the availability of ample stocks meant that U.S. dairy products were competitive on major global markets.
• Mexican imports of U.S. dairy products declined due to a deteriorating macroeconomic situation resulting from low oil prices, a deep recession, a weak currency, and COVID-19 pandemic measures.
Global Dairy Exports
Looking Ahead
Despite ongoing trade policy challenges, the outlook for U.S. dairy exports in 2021 is positive. The global economy is expected to improve, and import demand is expected to remain robust. U.S. milk production is forecast to grow by nearly 2 percent while milk output from competitors, including New Zealand and the EU27+UK, is expected to be more moderate, growing by less than 1 percent. Early in 2021, international prices for several key dairy products are rising, underscoring some tightness in exportable supplies among competitors. The U.S. dairy industry is well positioned with competitive prices and ample exportable supplies of key products including milk powder, cheese, butter, and whey & whey products.
10 USDA - Foreign Agricultural Service - 2020 United States Agricultural Export Yearbook

Most of the growth in U.S. exports is expected to be in Mexico and Asia where import demand for dairy products is being driven by higher per capita incomes and an expanding middle class. In China, there is the additional factor of rebuilding the swine herd which already boosted imports of U.S. whey & whey products in late 2020. For the year, U.S. exports of dairy products on a fat-basis are forecasted to grow by 8 percent, primarily due to higher volumes of butter. On a skim-solid milk equivalent basis, exports are forecasted to grow by 3 percent due to increased shipments of SMP and whey & whey products. On a skimmed milk equivalent basis, this will mean that approximately 22 percent of U.S. milk production will be exported.
USDA - Foreign Agricultural Service - 2020 United States Agricultural Export Yearbook 11

Country 2016 2017 2018 2019 2020 2019-2020 % Change
2016-2020 Average
Canada 593 621 590 573 594 4% 594
Brazil 458 736 761 493 317 -36% 553
India 176 281 258 298 312 4% 265
EU27+UK 21 101 167 185 288 56% 152
South Korea 71 91 134 196 172 -12% 133
Colombia 10 56 76 116 121 4% 76
Mexico 58 56 51 52 119 128% 67
Peru 76 72 69 79 69 -13% 73
Philippines 103 101 125 94 67 -29% 98
Nigeria 34 45 33 33 58 74% 41
All Others 442 251 400 229 217 -5% 308
Total Exported 2,042 2,412 2,663 2,349 2,333 -1% 2,360
Highlights
In 2020, U.S. ethanol exports totaled 1.3 billion gallons valued at $2.3 billion. This volume was 9 percent lower than 2019 due to reduced demand for fuel use, and 20 percent below the record 1.7 billion gallons shipped in 2018. Year-over-year value fell only 1 percent due to higher prices for fuel ethanol and increased shipments of higher-value, medical-grade ethanol.
U.S. fuel ethanol to Brazil saw the largest absolute decline in 2020, due to Brazil’s COVID-19 impacted fuel market and a 40-percent depreciation in Brazil’s currency. Brazil’s 20 percent import duty continued to impact the market. Export volumes were also lower than expected to other fuel markets in 2020, most notably the Philippines, Colombia, and Peru. Sales to Canada held mostly steady as U.S. suppliers backfilled Canada’s increased sales to Europe. By contrast, U.S. fuel ethanol sales to mainland China rose from zero to 21.2 million gallons. Sales to Hong Kong added 10.5 million gallons.
Top 10 Export Markets for U.S. Ethanol (Values in millions of dollars)
ETHANOL
Source: U.S. Census Bureau Trade Data - BICO HS-10
12 USDA - Foreign Agricultural Service - 2020 United States Agricultural Export Yearbook

Differing from fuel ethanol markets and driven by demand for hand sanitizer, U.S. exports of other industrial and consumer ethanol rose, most notably to Mexico (up $67 million) and Nigeria (up $25 million). For the remaining top 10 markets, ethanol sales rose to the EU27+UK on strong demand for hand sanitizer and high local fuel ethanol prices, industrial ethanol sales to India inched higher to a record $312 million, and industrial ethanol sales to South Korea dropped as China covered South Korea’s demand for medical-grade product.
Drivers
• Regulations, limited infrastructure, and oil company resistance limit growth of ethanol blends above 10 percent in the U.S. market, thus raising the importance of export growth. Limited growth for higher blends and mostly static fuel demand also limit U.S. domestic market expansion.
• U.S. ethanol exports are mostly impacted by fuel markets since most is used as transport fuel. Sales are also impacted by markets for ethanol used as an industrial chemical and in consumer products, including hand sanitizers, with 20-25 percent of U.S. exports typically used for these non-fuel applications.
• In 2020, COVID-19 and reduced mobility severely impacted global gasoline markets and thus fuel ethanol demand. The impact on U.S. ethanol exports was sharp and swift with lower sales of fuel ethanol from March onward supporting a rise in the non-fuel portion of U.S. exports to an unprecedented 40 percent.
• Canada and Brazil remain the top markets for U.S. ethanol. Canada’s fuel ethanol imports are stable with no trade restrictions on U.S. suppliers who consistently cover about 40 percent of Canada’s consumption. U.S. suppliers also cover virtually all of Brazil’s fuel ethanol imports, but trade is impacted by several factors including sugar and oil prices and a volatile exchange rate.
• The United States has free trade agreements with four of the top 10 ethanol export destinations, which help reduce barriers to U.S. ethanol.
Global Ethanol Exports
USDA - Foreign Agricultural Service - 2020 United States Agricultural Export Yearbook 13

Looking Ahead
As the spread of COVID-19 slows and vaccines are distributed in 2021, global demand for gasoline and ethanol will start recovering. Beyond 2021, with the world emerging from the pandemic, gasoline and ethanol markets will further recover, although the pace and degree will vary by country.
Pre-pandemic, the United States supplied half of the world’s ethanol exports, but its market share dropped to an estimated 43 percent in 2020 as fuel demand collapsed and some countries (notably China and Brazil) captured more of the trade in medical-grade product. Markets should mostly rebalance in the coming 1-2 years, permitting U.S. market share to rise as the pandemic recedes and fuel ethanol reasserts its dominance in trade.
Demand for mobility grows as population and incomes grow, but ethanol-blended gasoline is only one of several means to meeting increased demand for mobility while lowering greenhouse gas emissions. Increased mass transit, improved fuel efficiency, lifestyle changes including telework, and alternative drive trains like electric motors are all factors affecting transport demand, with which ethanol must compete. Antidumping and countervailing duties placed by China, Brazil, the EU27+UK, and others, and licensing restrictions or import bans imposed by Argentina, Thailand, India, and the Philippines, all limit (or threaten to limit) the United States’ ability to export fuel ethanol, while markets for ethanol used as an industrial chemical and in consumer products are relatively barrier-free.
14 USDA - Foreign Agricultural Service - 2020 United States Agricultural Export Yearbook

Country 2016 2017 2018 2019 2020 2019-2020 % Change
2016-2020 Average
Canada 3,440 3,487 3,487 3,471 3,471 0% 3,471
Mexico 602 704 760 803 772 -4% 728
South Korea 401 508 512 419 480 15% 464
Japan 481 413 427 401 373 -7% 419
Taiwan 317 292 278 323 263 -19% 295
EU27+UK 234 246 247 216 199 -8% 228
Hong Kong 292 302 248 205 190 -7% 247
Vietnam 67 72 103 140 138 -1% 104
China 188 226 177 119 112 -6% 164
Australia 117 118 118 112 104 -7% 114
All Others 869 896 965 848 788 -7% 873
Total Exported 7,010 7,265 7,252 7,056 6,889 -2% 7,094
Highlights
In 2020, the value of U.S. fresh fruit and vegetable exports to the world reached $6.9 billion, a 2- percent decline from the prior year. Due to geographic proximity and climate, Canada remained the top U.S. market, accounting for 49 percent of total exports, or $3.5 billion. Mexico came in a distant second with 10 percent of U.S. exports while no other markets had more than 7 percent share of exports.
U.S. apple exports experienced the greatest drop, down $105 million from 2019 and accounting for more than half of the overall decline, with the largest losses in Taiwan, India, and Canada. U.S. orange exports had the largest growth, up $48 million on higher exports to South Korea and Canada. Fruit and vegetable exports to China declined for the third year in a row. However, South Korea saw a significant gain of $61 million. Apples, pears, peaches, citrus, table grapes, and cherries continue to make up nearly half of total U.S. fresh fruit and vegetable exports.
Top 10 Export Markets for U.S. Fresh Fruits and Vegetables (Values in millions of dollars)
FRESH FRUITS & VEGETABLES
Source: U.S. Census Bureau Trade Data - BICO HS-10
USDA - Foreign Agricultural Service - 2020 United States Agricultural Export Yearbook 15

Drivers
• Top fresh fruit export commodities included apples, grapes, oranges, and cherries, which accounted for a combined $2.6 billion, with top markets including Canada, Mexico, Japan, South Korea, and Taiwan.
• Top fresh vegetable export commodities included lettuce, potatoes, sweet potatoes, onions, and cauliflower, which accounted for a combined $1.2 billion, with top markets including Canada, the EU27+UK, and Mexico.
• India imposed an additional 20 percent tariff on U.S. apples in June 2019, bringing the total tariff rate to 70 percent.
• Regulatory requirements, including pesticide maximum residue levels (MRLs) on U.S. fruits and vegetables that differ from those of the United States, continued to challenge exporters selling to the EU27+UK and South Korea. The United States continues to adopt science-based standards.
Global Fresh Fruit and Vegetable Exports
Looking Ahead
U.S. apple production is forecast to decline due to weather-damaged crops in Washington and Michigan. Reduced supplies are expected to pressure exports lower. U.S. table grape production is forecast up more than 100,000 tons to 1 million. Despite good quality supplies, lower demand from Mexico is expected to reduce exports. U.S. orange production is forecast down more than 10 percent with production in Florida forecast to drop 20 percent due to above average droppage. Exports are forecast to be down with the drop in production. Cherry exports are projected to decline for the third straight year, reflecting lower supplies but also China’s retaliatory Section 232 tariffs. New growth markets for fresh fruit and vegetables include the Dominican Republic, Kuwait, and Peru. During the last 10 years, the growth rate for fresh vegetables has been trending up on the strength of shipments to Canada, the EU27+UK, and Mexico, while fresh fruit exports continue to decline from their 2013 peak, primarily due to lower table grape, apple, and orange shipments.
16 USDA - Foreign Agricultural Service - 2020 United States Agricultural Export Yearbook

Country 2016 2017 2018 2019 2020 2019-2020 % Change
2016-2020 Average
China 713 662 571 1,300 2,280 75% 1,105
Japan 1,553 1,626 1,631 1,523 1,626 7% 1,592
Mexico 1,360 1,514 1,311 1,278 1,153 -10% 1,323
Canada 798 793 765 802 853 6% 802
South Korea 364 475 670 593 453 -24% 511
Australia 178 208 227 302 253 -16% 234
Colombia 105 163 215 222 147 -34% 170
Chile 54 85 91 123 136 11% 97
Philippines 79 98 116 93 115 23% 100
Hong Kong 360 415 282 154 91 -41% 260
All Others 373 446 524 562 608 8% 503
Total Exported 5,936 6,485 6,403 6,952 7,715 11% 6,698
Highlights
In 2020, the value of U.S. pork & pork product exports to the world reached a record $7.7 billion, up 11 percent from the prior year. The top three markets, accounting for 66 percent of exports, were China at $2.3 billion, Japan at $1.6 billion, and Mexico at $1.2 billion. China overtook Japan as the top market for U.S. pork as African swine fever (ASF) continued to limit China’s domestic pork supplies and buoy demand for imports. However, exports to Japan also rebounded with implementation of lower tariffs under the U.S.-Japan Trade Agreement and major U.S. competitors increasingly focused on the Chinese market. Meanwhile, U.S. exports to Mexico struggled in 2020 as a depreciating peso and weak economy stifled import demand.
Drivers
• China became the largest market for U.S. pork in 2020, generating an additional $1 billion in exports over the previous year, due to decreased Chinese production resulting from ASF.
Top 10 Export Markets for U.S. Pork (Values in millions of dollars)
PORK & PORK PRODUCTS
Source: U.S. Census Bureau Trade Data - BICO HS-10
USDA - Foreign Agricultural Service - 2020 United States Agricultural Export Yearbook 17

• Exports to Japan increased $100 million as the tariffs faced by U.S. pork were reduced as part of the U.S.-Japan Trade Agreement.
• Import demand in the Philippines and Vietnam rose as those countries attempt to manage ASF outbreaks, leading to an additional $60 million in U.S. exports.
• A weak Hotel, Restaurant, and Institutional sector in South Korea depressed U.S. exports to that market by $140 million in 2020.
• A difficult economic environment and devalued peso limited Mexican buying power and led U.S. exports to decline by more than $100 million.
• Exports of pork to Colombia dropped 34 percent in 2020 because of strict COVID-19 lockdowns that lowered demand in the food service sector.
• Decreased transshipment of products to China is primarily responsible for a $63 million reduction in pork exports to Hong Kong last year.
Global Pork Exports
Looking Ahead
While Chinese pork prices remain high and import demand will continue to be considerably higher than the pre-ASF era, China imports are expected to contract year-over-year as their hog sector recovers. Increased competition in the Chinese market will cause U.S. pork export volumes to ease from the 2020 record. Lower exports to China will be partially offset as improving economic conditions promote growth in traditional markets such as Mexico and South Korea. Additionally, the Philippines and Vietnam are poised for robust import demand as these countries continue to rebound from ASF.
18 USDA - Foreign Agricultural Service - 2020 United States Agricultural Export Yearbook

In addition to impacting global import demand, ASF has the potential to reshuffle global trade flows as major exporters cope with the disease. Towards the end of 2020, the discovery of ASF in Germany in feral swine effectively restricted German pork exports to key Asian markets. Ultimately, the ability to shift supply chains on the continent, with other member states picking up the slack, prevented total EU27+UK exports from severe impacts.
USDA - Foreign Agricultural Service - 2020 United States Agricultural Export Yearbook 19

Country 2016 2017 2018 2019 2020 2019-2020 % Change
2016-2020 Average
Mexico 932 933 956 1,077 983 -9% 976
China 34 36 47 10 762 7277% 178
Canada 510 459 405 354 349 -1% 416
Taiwan 127 152 189 187 224 20% 176
Cuba 105 165 155 190 144 -25% 152
Vietnam 79 76 110 140 128 -9% 107
Guatemala 104 118 123 132 111 -15% 118
Hong Kong 426 469 431 353 107 -70% 357
Colombia 66 70 82 114 93 -18% 85
Angola 86 156 184 150 82 -45% 131
All Others 1,411 1,632 1,590 1,536 1,261 -10% 1,486
Total Exported 3,879 4,267 4,274 4,243 4,244 0% 4,181
Highlights
In 2020, the value of U.S. poultry & poultry product exports to the world reached $4.2 billion, unchanged from 2019 and thus failing to return to the pre-2015 highly pathogenic avian influenza (HPAI) outbreak levels. The top three markets, accounting for 49 percent of sales, were Mexico at $983 million, China at $762 million, and Canada at $349 million. The reopening of the Chinese market, the continuation of generally positive trade conditions, and modest growth in global demand as consumers viewed poultry meat as a low-cost animal protein supported sales in 2020. With shipments to many major markets lower in 2020, the key positive development was the reopening of the Chinese market, which buoyed total exports. U.S. exports of poultry & poultry products are primarily comprised of broiler meat (about 74 percent) to mostly developing country markets. Consequently, economic growth and rising incomes in low-and middle-income countries will bode well for growing exports.
Top 10 Export Markets for U.S. Poultry Products* (Values in millions of dollars)
POULTRY MEAT & PRODUCTS
Source: U.S. Census Bureau Trade Data - BICO HS-10 *Excluding eggs
20 USDA - Foreign Agricultural Service - 2020 United States Agricultural Export Yearbook

Drivers
• Exports fell to all major markets except for Taiwan and China, the reopening of which was critical to supporting total U.S. shipments. Sixty-one percent ($461 million) of shipments to China were chicken paws, a product for which there is virtually no other significant market. As a result, total exports of U.S. chicken paws reached a historic $958 million in 2020.
• The United States continued to face market access issues in South Korea, South Africa, Indonesia, Saudi Arabia, and India due to non-tariff barriers and purported sanitary issues.
• Strong competition from Brazilian exports has elevated the competitive environment along with shipments from rising poultry suppliers including Turkey, Ukraine, Argentina, and Russia.
• The United States continues to emphasize to the global trading community that the use of risk-based analysis and sound science are the best ways to approach long-standing challenges such as Highly Pathogenic Avian Influenza regionalization and establishment of veterinary drug standards.
Global Poultry Exports
Looking Ahead
The volume of U.S. poultry meat (excluding paws) exports is forecast flat in 2021 and prices are expected to decline which will negatively impact the total value of shipments. Exportable supplies of U.S. poultry meat will be constrained as forecasted higher feed prices will stymie U.S. production, forecast to rise less than 1 percent.
While global poultry meat consumption has been relatively resilient as a low-cost versatile animal protein amid the COVID-19 economic downturn, global economic recovery will yield limited gains in short-term demand. However, the USDA Long-Term Projections reflect a positive outlook and forecast U.S. poultry meat exports to grow nearly 25 percent during the next 10 years.
USDA - Foreign Agricultural Service - 2020 United States Agricultural Export Yearbook 21

The United States is expected to maintain its position as the second-largest exporter of poultry meat behind Brazil, but U.S. market share of global trade will decline slightly. During the coming decade, growing population and rising incomes, particularly in low- and middle-income countries, will spur increased meat consumption, fostering demand for competitively priced chicken meat.
22 USDA - Foreign Agricultural Service - 2020 United States Agricultural Export Yearbook
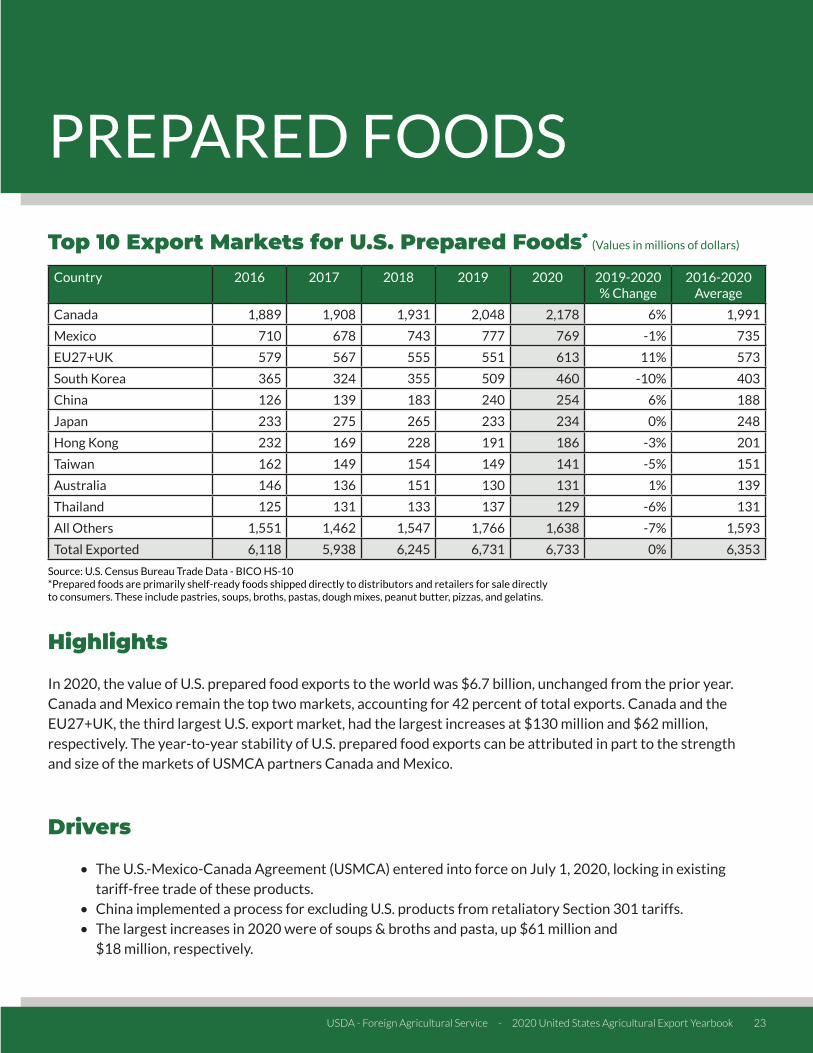
Country 2016 2017 2018 2019 2020 2019-2020 % Change
2016-2020 Average
Canada 1,889 1,908 1,931 2,048 2,178 6% 1,991
Mexico 710 678 743 777 769 -1% 735
EU27+UK 579 567 555 551 613 11% 573
South Korea 365 324 355 509 460 -10% 403
China 126 139 183 240 254 6% 188
Japan 233 275 265 233 234 0% 248
Hong Kong 232 169 228 191 186 -3% 201
Taiwan 162 149 154 149 141 -5% 151
Australia 146 136 151 130 131 1% 139
Thailand 125 131 133 137 129 -6% 131
All Others 1,551 1,462 1,547 1,766 1,638 -7% 1,593
Total Exported 6,118 5,938 6,245 6,731 6,733 0% 6,353
Highlights
In 2020, the value of U.S. prepared food exports to the world was $6.7 billion, unchanged from the prior year. Canada and Mexico remain the top two markets, accounting for 42 percent of total exports. Canada and the EU27+UK, the third largest U.S. export market, had the largest increases at $130 million and $62 million, respectively. The year-to-year stability of U.S. prepared food exports can be attributed in part to the strength and size of the markets of USMCA partners Canada and Mexico.
Drivers
• The U.S.-Mexico-Canada Agreement (USMCA) entered into force on July 1, 2020, locking in existing tariff-free trade of these products.
• China implemented a process for excluding U.S. products from retaliatory Section 301 tariffs.• The largest increases in 2020 were of soups & broths and pasta, up $61 million and
$18 million, respectively.
Top 10 Export Markets for U.S. Prepared Foods* (Values in millions of dollars)
PREPARED FOODS
Source: U.S. Census Bureau Trade Data - BICO HS-10 *Prepared foods are primarily shelf-ready foods shipped directly to distributors and retailers for sale directly to consumers. These include pastries, soups, broths, pastas, dough mixes, peanut butter, pizzas, and gelatins.
USDA - Foreign Agricultural Service - 2020 United States Agricultural Export Yearbook 23

Looking Ahead
The global trade of prepared foods has nearly doubled in the last decade. Demand is driven in large part by income growth and urbanization, both generally leading to increased consumer desire for convenient, shelf-ready packaged foods. Imported prepared foods provide variety for consumers, and often supply producers in domestic processed food sectors. Asian markets, especially China, have been the fastest growing for prepared foods in recent years, reflecting the effect of income growth on consumption habits. These trends are expected to continue and will likely provide strong markets for U.S. prepared food exports into the future.
However, there are many trade barriers facing prepared foods, including front-of-package labeling (FOPL), marketing and advertising restrictions, and penalties on foods that exceed certain thresholds of nutrients like sugar, fat, saturated fat, and sodium. In October 2020, Mexico implemented its new FOPL warning style labels. U.S. exports of about $3.4 billion are expected to be impacted. Mexico also implemented bans in two states in October, prohibiting the sale of products that carry warning labels to people under the age of 18. A Federal level ban is under consideration, as are proposals for nearly all other states.
In November 2020, Colombia established maximum sodium limits for foods that will be implemented in phases during the next 3 years. Products that exceed these limits will be subject to sanctions. This will impact about $54 million of U.S. exports each year. Latin American countries are expected to consider more regulations for prepared foods in 2021, driven largely by the recommendations of the World Health Organization and Pan-American Health Organization.
The COVID-19 pandemic did not have a significant impact on U.S. exports of prepared foods in 2020, likely because these products are most frequently purchased directly from supermarkets for preparation at home rather than at restaurants. Decreases in global income levels may affect consumer capacity to purchase packaged food, but it is unlikely that this effect will be long term.
In 2020, 63 percent of total U.S. exports of prepared foods were to free trade agreement partner countries. Negotiations with future free trade agreement partners like Kenya provide opportunities to address existing tariff and non-tariff barriers and create a pathway to new customers in regions of the world where income and demand are rising.
24 USDA - Foreign Agricultural Service - 2020 United States Agricultural Export Yearbook

Country 2016 2017 2018 2019 2020 2019-2020 % Change
2016-2020 Average
Japan 234 190 232 275 261 -5% 238
Mexico 266 292 268 278 245 -12% 270
Haiti 190 237 206 206 245 19% 217
Canada 148 148 175 194 194 0% 172
South Korea 105 85 89 120 162 34% 112
Saudi Arabia 92 88 73 98 105 7% 91
Jordan 73 90 66 73 77 5% 76
Colombia 58 51 54 49 65 33% 55
Honduras 71 45 61 47 45 -4% 54
Brazil 1 0 1 0 38 21172% 8
All Others 546 483 453 510 440 -14% 486
Total Exported 1,784 1,709 1,678 1,850 1,877 2% 1780
Highlights
In 2020, the value of U.S. rice exports to the world was $1.9 billion, up 1.5 percent from the prior year. The top three markets, accounting for 40 percent of exports, were Japan at $261 million, Mexico at $245 million, and Haiti at $245 million. U.S. exports to Mexico declined as South American suppliers expanded market share in that primarily paddy market. Countries where the United States has free trade agreements remained significant markets, particularly in the Western Hemisphere.
Drivers
• U.S. rice export value rose 1.5 percent based on higher unit values, despite lower volumes.• Commercial exports to Haiti expanded, both in terms of volume and unit value.• Exports to Brazil were the highest since 2003, due to Brazil’s tightening supplies prompting
increased imports.
Top 10 Export Markets for U.S. Rice (Values in millions of dollars)
RICE
Source: U.S. Census Bureau Trade Data - BICO HS-10
USDA - Foreign Agricultural Service - 2020 United States Agricultural Export Yearbook 25

• Larger medium grain exports to South Korea more than offset lower exports to Japan.• Exports to Colombia rose with larger paddy rice volumes, benefiting from the free trade agreement with
the United States.• While Mexico remains the top U.S. market, export volumes declined in 2020 amid a smaller U.S. crop in
2019-2020 and increased competition from South America. These factors also led to declining exports to some Central American countries.
Global Rice Exports
Looking Ahead
Looking ahead to 2021, exports are forecast higher despite smaller production forecasts for 2021-2022. Demand for U.S. rice is expected to remain strong in core markets such as Mexico and Haiti. The outlook is favorable for maintaining a strong market presence in countries with free trade agreements such as Colombia, Central America, and the Dominican Republic. Exports for U.S. medium-grain rice, especially to East Asian markets such as Japan and South Korea, are forecast to remain steady. U.S. prices remain high relative to Asian prices, making it challenging to compete in price-sensitive markets including Africa and Southeast Asia. Thai and Vietnamese export prices are expected to decline amid the new harvest, while Indian export prices remain very low in comparison to other suppliers.
26 USDA - Foreign Agricultural Service - 2020 United States Agricultural Export Yearbook
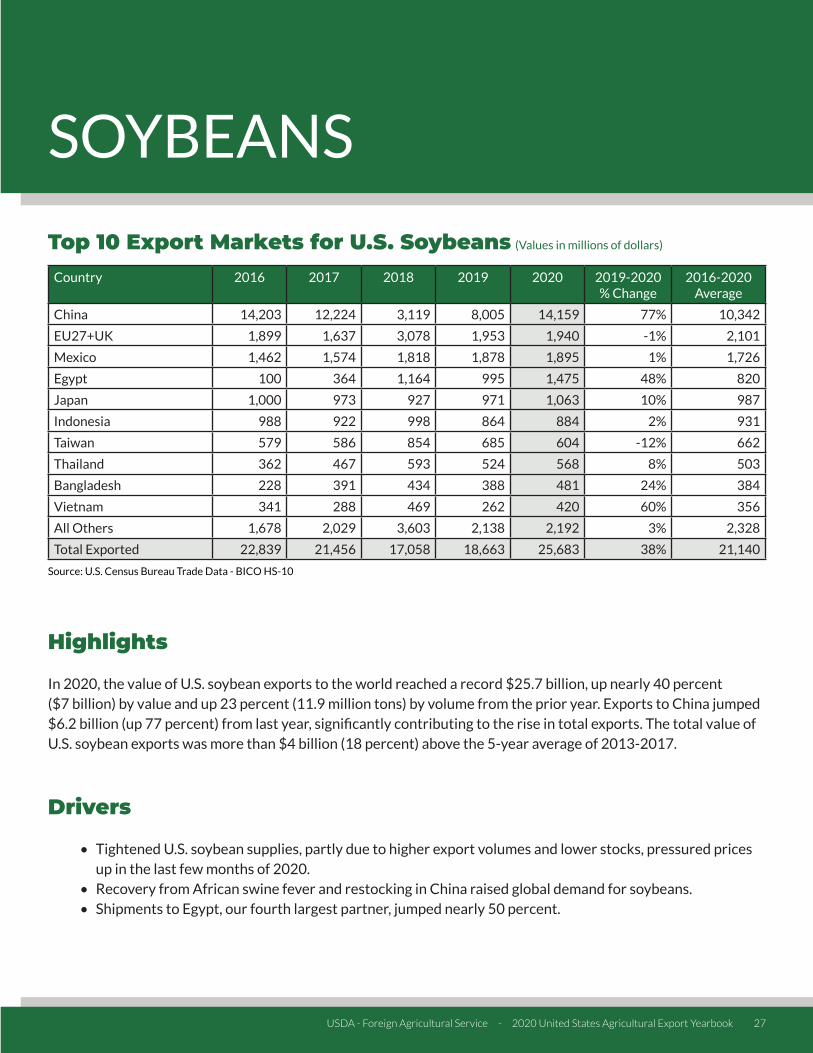
Country 2016 2017 2018 2019 2020 2019-2020 % Change
2016-2020 Average
China 14,203 12,224 3,119 8,005 14,159 77% 10,342
EU27+UK 1,899 1,637 3,078 1,953 1,940 -1% 2,101
Mexico 1,462 1,574 1,818 1,878 1,895 1% 1,726
Egypt 100 364 1,164 995 1,475 48% 820
Japan 1,000 973 927 971 1,063 10% 987
Indonesia 988 922 998 864 884 2% 931
Taiwan 579 586 854 685 604 -12% 662
Thailand 362 467 593 524 568 8% 503
Bangladesh 228 391 434 388 481 24% 384
Vietnam 341 288 469 262 420 60% 356
All Others 1,678 2,029 3,603 2,138 2,192 3% 2,328
Total Exported 22,839 21,456 17,058 18,663 25,683 38% 21,140
Highlights
In 2020, the value of U.S. soybean exports to the world reached a record $25.7 billion, up nearly 40 percent ($7 billion) by value and up 23 percent (11.9 million tons) by volume from the prior year. Exports to China jumped $6.2 billion (up 77 percent) from last year, significantly contributing to the rise in total exports. The total value of U.S. soybean exports was more than $4 billion (18 percent) above the 5-year average of 2013-2017.
Drivers
• Tightened U.S. soybean supplies, partly due to higher export volumes and lower stocks, pressured prices up in the last few months of 2020.
• Recovery from African swine fever and restocking in China raised global demand for soybeans. • Shipments to Egypt, our fourth largest partner, jumped nearly 50 percent.
Top 10 Export Markets for U.S. Soybeans (Values in millions of dollars)
SOYBEANS
Source: U.S. Census Bureau Trade Data - BICO HS-10
USDA - Foreign Agricultural Service - 2020 United States Agricultural Export Yearbook 27

Global Soybean Exports
Looking Ahead
U.S. soybean exports are forecast at record levels for the marketing year ending in August (2020-2021). Soybean shipments are back on trend this MY with large sales being shipped out in late 2020 and early 2021. Sales are expected to drop during the normal South American shipping season. Surging demand from China as it rebuilds its stocks and the swine sector recovers from ASF have led to record shipments early in 2020-2021 compared to the same time period in prior years. As of early February 2021, 33.9 million tons have been shipped to China and another 1.9 million have been sold awaiting shipment. The United States will continue to face competition from Brazil, the largest exporter of soybeans. Exports to the EU27+UK are expected to remain steady as total commitments are at similar levels to last year, while exports to Mexico are expected to rise as total commitments are up 25 percent.
28 USDA - Foreign Agricultural Service - 2020 United States Agricultural Export Yearbook

Country 2016 2017 2018 2019 2020 2019-2020 % Change
2016-2020 Average
EU27+UK 2,585 2,707 2,769 3,115 2,879 -8% 2,811
India 521 738 663 823 914 11% 732
China 182 243 328 606 746 23% 421
Canada 598 643 696 697 737 6% 674
Japan 374 398 434 416 386 -7% 402
Mexico 253 256 371 343 329 -4% 310
United Arab Emirates 310 301 304 439 308 -30% 332
South Korea 296 306 290 291 295 2% 295
Hong Kong 1,156 1,251 1,052 692 271 -61% 884
Turkey 365 308 279 340 250 -27% 309
All Others 1,261 1,329 1,331 1,313 1,286 -2% 1,304
Total Exported 7,902 8,479 8,515 9,076 8,402 -7% 8,475
Highlights
In 2020, the value of U.S. tree nut exports to the world was $8.4 billion, a 7 percent decrease from 2019. The top three markets, accounting for 54 percent of sales, were the European Union (EU27+UK) at $2.9 billion, India at $914 million, and China at $746 million. While tree nut exports were up to India (11 percent), China (23 percent), and Canada (6 percent) in 2020, this was more than offset by lower sales to Hong Kong, the EU27+UK, and the United Arab Emirates. Record harvests put downward pressure on unit values, particularly for almonds. U.S. exports continue to dominate the global almond, pistachio, and walnut markets despite disruptions due to retaliatory tariffs and restrictive phytosanitary requirements. The breakout of 2020 tree nut exports was 55 percent almonds ($4.7 billion), 20 percent pistachios ($1.7 billion), 15 percent walnuts ($1.2 billion), 5 percent pecans ($432 million), 4 percent ‘mixed & other nuts’ ($296 million), and 1 percent hazelnuts ($97 million).
Top 10 Export Markets for U.S. Tree Nuts (Values in millions of dollars)
TREE NUTS
Source: U.S. Census Bureau Trade Data - BICO HS-10
USDA - Foreign Agricultural Service - 2020 United States Agricultural Export Yearbook 29

Drivers
• Exports to Hong Kong declined $422 million due to China’s tightening of import controls on product passing through Hong Kong, which was only partially offset by $140 million in additional direct sales to China.
• The unit value of almonds dropped nearly 20 percent, which contributed to tree nut exports to the EU27+UK declining $236 million and the United Arab Emirates falling $131 million.
• Exports to India continue to expand on strong consumer demand for almonds, and to a lesser extent, walnuts.
Global Tree Nut Exports
Looking Ahead
Moving forward, the United States is likely to maintain its 80 percent share of world almond production and nearly 90 percent share of trade, with limited competition from Australia. The U.S. walnut industry commands half of world trade, with modest competition from China, Chile, and Ukraine. Although China produces more than 40 percent of the world’s walnuts, its exports only account for about 15 percent of world trade due to variety preferences and strong domestic demand. The U.S. pistachio industry will likely remain in close competition with Iran to be the world’s leading producer and exporter, often trading places depending on yield conditions.
New market opportunities for U.S. tree nut exports include countries in Central and South America. The United States has competitive advantages in tree nut production and exports, with 10-year growth averaging 7 percent annually and is well-positioned to maintain its global dominance.
30 USDA - Foreign Agricultural Service - 2020 United States Agricultural Export Yearbook

Some issues affecting future sales include compliance with pesticide maximum residue levels (MRLs) which has increasingly presented exporters with challenges selling to the European Union. The United States continues to advocate for countries to adopt science-based standards. U.S. tree nut producers also face concern over Japan’s stringent enforcement and testing protocol for aflatoxins which lead to 100 percent monitoring on U.S. shipments. The speed at which the global economy recovers from the COVID pandemic will impact the recovery in tree nut exports.
USDA - Foreign Agricultural Service - 2020 United States Agricultural Export Yearbook 31

Country 2016 2017 2018 2019 2020 2019-2020 % Change
2016-2020 Average
Philippines 592 555 642 708 826 17% 665
Mexico 612 852 662 812 778 -4% 743
Japan 604 714 717 609 635 4% 656
China 205 351 106 56 570 926% 258
South Korea 248 328 363 300 340 13% 316
Nigeria 265 372 193 473 312 -34% 323
Taiwan 257 295 267 324 311 -4% 291
Indonesia 192 298 177 282 275 -3% 245
EU27+UK 165 153 210 210 246 17% 197
Yemen 92 84 103 168 195 16% 128
All Others 2,113 2,055 1,946 2,290 1,810 -21% 2,043
Total Exported 5,346 6,058 5,387 6,232 6,298 1% 5,864
Highlights
In 2020, the value of U.S. wheat exports to the world reached $6.3 billion, up 1 percent from 2019 due to increased demand from China. The top three markets, accounting for 36 percent of sales, were the Philippines at $826 million, Mexico at $778 million, and Japan at $635 million. Increased demand from China offset stronger competition from Russia and Canada in key markets including Nigeria.
Drivers
• Mexico, the Philippines, Japan, and South Korea continue as consistent buyers of U.S. wheat, accounting for 41 percent of total U.S. wheat exports.
• China was the largest growth market for U.S. wheat in 2020. U.S. wheat exports to China shrunk to $56 million in 2019 but surged to $570 million in 2020, a ten-fold increase.
• The extension of Brazil’s wheat tariff rate quota (TRQ) for non-Mercosur countries, along with reduced competition from Argentina, allowed U.S. wheat to expand its market share in Brazil. U.S. wheat exports to Brazil were $159 million in 2020, up 84 percent from 2019.
Top 10 Export Markets for U.S. Wheat (Values in millions of dollars)
WHEAT
Source: U.S. Census Bureau Trade Data - BICO HS-10
32 USDA - Foreign Agricultural Service - 2020 United States Agricultural Export Yearbook

• A major challenge for U.S. wheat was competition from major exporting countries in price-sensitive markets in Africa and the Middle East.
Global Wheat Exports
Looking Ahead
Global trade in wheat is expected to grow in years to come, with major competitors to the United States being Russia, Canada, Australia, Ukraine, and the European Union. The United States is likely to continue as a major supplier of wheat to much of Latin America and East & Southeast Asia, with Mexico, the Philippines, and Japan expected to be strong, reliable markets for U.S. wheat.
U.S. competitiveness in core markets during 2021 is likely to remain strong based on continued demand from China and export restrictions in Russia. The Russian government will implement an indefinite floating export tax on wheat that may limit the country’s production and exports. This could offer an opportunity for U.S. wheat to expand its exports to markets where Russia has maintained a price advantage. However, the European Union is expected to have abundant exportable supplies amid a larger crop. Considering this competition, U.S. exports to Africa and the Middle East may face challenges in 2021. China is expected to have strong demand for imported wheat in 2021, and the United States will likely continue expanding exports there. Brazil’s 750,000-ton TRQ was recently extended for another year, offering additional export opportunities for U.S. wheat in South America.
USDA - Foreign Agricultural Service - 2020 United States Agricultural Export Yearbook 33

Country 2016 2017 2018 2019 2020 2019-2020 % Change
2016-2020 Average
China 21,394 19,476 9,145 13,860 26,434 91% 18,062
Canada 20,307 20,608 20,867 20,886 20,992 1% 20,732
Mexico 17,827 18,598 19,090 19,179 18,094 -6% 18,558
Japan 11,030 11,915 12,925 11,740 11,487 -2% 11,819
EU27+UK 11,523 11,438 13,502 11,761 11,234 -4% 11,892
South Korea 6,183 6,872 8,313 7,524 7,530 0% 7,285
Vietnam 2,656 2,532 3,991 3,480 3,348 -4% 3,201
Taiwan 3,226 3,317 3,949 3,565 3,262 -9% 3,464
Philippines 2,573 2,581 2,954 2,898 3,151 9% 2,831
Indonesia 2,678 2,892 3,094 2,858 2,832 -1% 2,871
Colombia 2,383 2,528 2,904 2,667 2,740 3% 2,644
Hong Kong 3,832 4,213 3,959 2,992 2,018 -33% 3,403
Egypt 741 770 1,914 1,558 1,930 24% 1,383
Thailand 1,594 1,839 2,121 1,825 1,775 -3% 1,831
United Kingdom 1,906 1,702 1,823 1,649 1,603 -3% 1,737
All Others 26,731 28,603 30,816 29,858 28,854 -3% 28,972
World Total 134,678 138,183 139,544 136,650 145,683 7% 138,948
Highlights
U.S. agricultural exports rebounded in 2020 with a 7-percent ($9 billion) increase from the previous year. Record exports of $26.4 billion to China were a $12.6 billion increase from 2019, which offset a $3.5 billion decrease in exports to the rest of the world.
In 2020, China established a process for importers to seek exclusions from retaliatory Section 301 tariffs on U.S. products, including agricultural products. China also removed certain structural barriers to trade, expanding market access for a variety of U.S. agricultural exports in the world’s largest food import market. Simultaneously, increased U.S. competitiveness, due to production issues with foreign competitors and increased grain and oilseed prices in China, led to a surge in demand for U.S. exports.
Top U.S. Agricultural Export Markets (Values in millions of dollars)
COUNTRY OVERVIEW
Source: U.S. Census Bureau Trade Data *UK is counted in the EU-27+UK, but also reported as a separate market given its withdrawal from the EU customs union.
34 USDA - Foreign Agricultural Service - 2020 United States Agricultural Export Yearbook

Amongst the other top 15 markets, U.S. exports declined to 10 of those destinations. While the COVID-19 pandemic had a limited impact on the overall value of global trade of agricultural goods, there were impacts on some specific commodities, especially those used in manufacturing, such as cotton and hides, and high-value products such as beef and tree nuts.
The economic slowdown and public health restrictions, including on the hospitality sector, were more pronounced in some countries than others. Mexico experienced a deep recession contributing to a 6-percent decline in imports from the United States.
North American trading partners and the advanced economies of Japan, the European Union, and South Korea remained in the top 6 importing nations of U.S. goods. The emerging economies of Southeast Asia continued to be strong importers with Vietnam, the Philippines, Indonesia, and Thailand all remaining in the top 15. The Philippines was a success story in 2020, increasing imports by 9 percent, led by greater values of dairy products and soybean meal. Egypt increased imports from the United States by 24 percent led by greater purchases of soybeans, dairy products, and tree nuts.
Other than Mexico, U.S. exports fell sharply to the EU27+UK, Taiwan, and Hong Kong. The largest decreases to the EU27+UK were in tree nuts, beef, and wine. Taiwan imported less soybeans, corn, and cotton, and Hong Kong reduced their imports of U.S. tree nuts, poultry, beef, and fresh fruit.
USDA - Foreign Agricultural Service - 2020 United States Agricultural Export Yearbook 35

Commodity 2016 2017 2018 2019 2020 2019-2020 % Change
2016-2020 Average
Prepared Food 1,889 1,908 1,931 2,048 2,178 6% 1,991
Fresh Vegetables 1,807 1,878 1,884 1,986 1,891 -5% 1,889
Fresh Fruit 1,633 1,608 1,533 1,485 1,580 6% 1,568
Snack Foods 1,315 1,355 1,407 1,393 1,335 -4% 1,361
Non-Alcoholic Beverages* 1,156 1,087 1,069 1,041 1,013 -3% 1,073
Pork & Pork Products 798 793 765 802 853 6% 802
Dog & Cat Food 597 640 645 751 842 12% 695
Chocolate & Cocoa Products
749 748 713 713 753 6% 735
Tree Nuts 598 643 696 697 737 6% 674
Beef & Beef Products 758 791 745 654 728 11% 735
All Other 9,007 9,157 9,480 9,317 9,082 -3% 9,208
Total Exported 20,307 20,608 20,867 20,886 20,992 1% 20,732
Highlights
In 2020, Canada was the second largest market for U.S. agricultural exports, totaling $21 billion. This represents a 1-percent increase from 2019. On July 1, 2020, the United States–Mexico–Canada Agreement (USMCA) entered into force, expanding U.S. access to Canada for certain dairy, poultry, and egg products. The United States maintained the No. 1 position in Canada’s agricultural market with a 57-percent market share. The largest percentage export growth to Canada was in dog & cat food, increasing 12 percent, followed closely by beef & beef products at 11 percent. Exports of fresh fruit, pork & pork products, and prepared foods all increased 6 percent last year. The top 3 largest decreases in exports to Canada in 2020 were in fresh vegetables ($95 million), snack foods ($57 million), and non-alcoholic beverages ($28 million), losing 5 percent, 4 percent, and 3 percent, respectively. Despite these decreases, Canada remained the top market in 2020 for U.S. prepared food, fresh fruit, feeds & fodders, fresh vegetables, snack foods, and processed vegetables.
Top 10 U.S. Agricultural Exports to Canada (Values in millions of dollars)
CANADA
Source: U.S. Census Bureau Trade Data - BICO HS-10 *Excludes juices
36 USDA - Foreign Agricultural Service - 2020 United States Agricultural Export Yearbook

Drivers
• Processed foods such as prepared foods, snack foods, and beverages, as well as fresh fruits and vegetables, continue to be the top exports to Canada. Climatic conditions and geographic proximity provide the United States with a strong competitive advantage in supplying fresh goods to Canada while highly integrated supply chains and logistical advantages ensure the timely delivery of processed foods and retail-ready goods.
• U.S. exports of dog & cat food were up by $91 million, a 12-percent increase by value from 2019 and representative of a 91-percent market share. In 2020, Canadian dog & cat food imports from the world also increased 12 percent by value.
• U.S. exports of beef & beef products increased $73 million from 2019 but remained below 2015-2018 levels. Overall Canadian beef imports from the world increased 22 percent by value, with the United States capturing 63 percent market share by value and 56 percent by volume.
• U.S. dairy product exports reached a record high, climbing 1 percent to more than $675 million, with increases in milk-based drinks (up 7 percent to $88 million) and various cheeses (up 24 percent to $69 million) offsetting declines in exports of butter (down 16 percent), whey protein (down 12 percent), and other products.
Canada’s Agricultural Suppliers
Looking Ahead
On July 1, 2020, USMCA entered into force, strengthening the long-standing North American free trade relationship. USMCA maintains the zero tariffs between the three countries that were in place under NAFTA,
USDA - Foreign Agricultural Service - 2020 United States Agricultural Export Yearbook 37

as well as provides new market access for a wide range of U.S. dairy products through tariff-rate quotas (TRQs). The Agreement also requires Canada to eliminate its milk classes 6 and 7, which allowed unfairly low-priced Canadian dairy products to undersell U.S. products in Canada and in third country markets.
Canada’s global chicken and chicken product imports before USMCA entered into force were constrained by (i) Canada’s WTO TRQ or by (ii) a regulation that calculated as a percentage of Canadian chicken production in the preceding calendar year, whichever was larger. USMCA provides a country-specific TRQ for poultry for the United States, preserving a portion of the market for U.S. exporters, even as the Canadian market evolves and becomes more competitive and open to other partners. The United States still has access to Canada’s WTO TRQ.
The USMCA contains new and enforceable rules to ensure that sanitary and phytosanitary measures (SPS) are science-based and developed and implemented in a transparent and non-discriminatory manner. The USMCA obligates Canada to eliminate discrimination in grading of U.S. wheat and the requirement for a country-of-origin statement on quality grade certificates for U.S. wheat.
The Distilled Spirits, Wine, Beer, and Other Alcohol Beverages Annex of the USMCA Agriculture Chapter contains non-discrimination and transparency commitments regarding sale and distribution of alcoholic beverages. Also, the Parties agreed to labeling and certification provisions to help prevent technical barriers to trade in wine and distilled spirits.
In a USMCA side letter with the United States, Canada committed to ensure that British Columbia eliminate measures governing grocery store wine sales that discriminate against U.S. wine, no later than November 1, 2019.
Canada has implemented free trade agreements with other agricultural exporting blocs: the 11-nation Comprehensive and Progressive Agreement for Trans-Pacific Partnership (CPTPP) and the Comprehensive Economic and Trade Agreement (CETA) with the European Union. Canada is in the process of implementing a Canada-United Kingdom Trade Continuity Agreement following the United Kingdom’s exit from the European Union. Though Canada is a mature market with modest economic growth and low population growth, there remains significant export growth potential in Quebec, a regional economy the size of the Philippines, where U.S. products are underrepresented.
38 USDA - Foreign Agricultural Service - 2020 United States Agricultural Export Yearbook

Commodity 2016 2017 2018 2019 2020 2019-2020 % Change
2016-2020 Average
Soybeans 14,203 12,224 3,119 8,005 14,160 77% 10,342
Pork & Pork Products 713 662 571 1,300 2,280 75% 1,105
Cotton 554 978 925 707 1,826 158% 998
Corn 40 142 50 56 1,205 2052% 299
Coarse Grains* 1,030 838 521 191 1,153 504% 747
Poultry Meat & Products**
34 36 47 10 762 7520% 178
Tree Nuts 182 243 328 606 746 23% 421
Wheat 205 351 106 56 570 918% 258
Dairy Products 386 576 498 373 539 45% 474
Hay 355 341 272 291 413 42% 334
All Other 3,693 3,086 2,709 2,267 2,781 23% 2,907
Total Exported 21,395 19,476 9,145 13,860 26,435 91% 18,062
Highlights
In 2020, U.S. agricultural exports to China totaled $26.4 billion, up $12.6 billion from 2019. China was the largest market for U.S. agricultural exports, a position it last held in 2016. Brazil (22 percent market share) and the United States (15 percent) were the top suppliers of agricultural goods to China, followed by the European Union with 14 percent. In 2020, China established a process for importers to seek exclusions for retaliatory Section 301 tariffs on U.S. products, including agricultural products. China also removed certain structural barriers to trade, expanding market access for a variety of U.S. agricultural exports in the world’s largest food import market. Exports of all top 10 commodity groups increased in 2020, with the largest increases for soybeans, corn, and cotton which were up $6.2 billion, $1.2 billion, and $1.1 billion, respectively. In addition, U.S. exports of pork & pork products, coarse grains (excluding corn), and poultry meat & products (excluding eggs) were up $980 million, $962 million, and $752 million, respectively. While exports for most commodity groups were up, a few including processed vegetables, hides & skins, and wine & beer were down $29 million, $23 million, and $18 million, respectively.
Top 10 U.S. Agricultural Exports to China (Values in millions of dollars)
CHINA
Source: U.S. Census Bureau Trade Data - BICO HS-10 *Excludes corn **Excludes eggs
USDA - Foreign Agricultural Service - 2020 United States Agricultural Export Yearbook 39

Drivers
• The Chinese Government created an exclusion process for retaliatory Section 301 tariffs on a wide range of products; imports of these products have risen significantly since this process was granted.
• China’s economic recovery from COVID-19 led to strong demand for U.S. agricultural products, including cotton, soybeans, wheat, and corn.
• African swine fever significantly reduced China’s swine herd, which led to increases in demand for U.S. pork & pork products. In addition, Chinese demand for U.S. soybeans and feed products grew, as China worked to rebuild its swine population.
China’s Agricultural Suppliers
Looking Ahead
China committed to purchases nearly $40 billion per year of U.S. agricultural products for the first 2 years (2020 and 2021) of the Phase One Agreement. Due in part to the COVID-19 pandemic and related impacts on global demand, China missed its commitment by about 30 percent. Under the agreement, China removed specified structural barriers to U.S. agricultural products with 50 of these 57 commitments implemented on time. China also implemented a program to exempt retaliatory tariffs which improves the competitiveness of U.S. goods.
China’s strong demand for U.S. agricultural products is expected to continue. China recovered from COVID-19 more quickly than most of the world and is increasing purchases of U.S. agricultural products, including corn, soybeans, and other animal feeds needed to replenish its growing swine heard. Continued economic growth and an expanding middle-class also bodes well for increased exports of poultry, fruits and vegetables, and other higher-valued consumer- oriented goods.
40 USDA - Foreign Agricultural Service - 2020 United States Agricultural Export Yearbook

Commodity 2016 2017 2018 2019 2020 2019-2020 % Change
2016-2020 Average
Corn 771 785 927 682 876 28% 808
Soybean Meal 259 340 481 412 485 18% 395
Soybeans 195 212 256 223 191 -14% 215
Pork & Pork Products 105 163 215 221 147 -34% 170
Wheat 181 173 88 137 133 -3% 142
Dairy Products 88 65 72 145 128 -12% 100
Poultry Meat & Products* 66 70 82 114 93 -18% 85
Feeds & Fodders 76 80 98 81 84 4% 84
Soybean Oil 62 73 100 57 77 36% 74
Rice 58 51 54 49 65 33% 56
All Other 522 516 531 546 461 -16% 515
Total Exported 2,383 2,528 2,904 2,667 2,740 3% 2,644
Highlights
In 2020, Colombia was the 11th largest destination for U.S. agricultural exports, totaling $2.7 billion. This represents a 3-percent increase from 2019. The United States is Colombia’s top supplier of agricultural goods by a wide margin, representing 48 percent of the total import market. The EU27+UK is Colombia’s second-largest supplier with only 8 percent market share. The U.S.-Colombia Trade Promotion Agreement (CTPA) has expanded export opportunities for many U.S. agricultural products. The largest year-to-year export increase was seen in corn, up 28 percent to $876 million in 2020. Exports of soybean meal, soybean oil, and rice also rose last year, up $73 million, $20 million, and $16 million, respectively. Exports of pork & pork products plummeted $74 million, while soybeans and poultry dropped $32 million and $21 million, respectively. In 2020, Colombia was the fourth-largest market for U.S. corn exports, third- largest market for U.S. soybean meal, and seventh-largest market for U.S. pork.
Top 10 U.S. Agricultural Exports to Colombia (Values in millions of dollars)
COLOMBIA
Source: U.S. Census Bureau Trade Data - BICO HS-10 *Excludes eggs
USDA - Foreign Agricultural Service - 2020 United States Agricultural Export Yearbook 41

Drivers
• In 2020, the economic slowdown associated with COVID-19 led to decreased food and agricultural exports to Colombia across many product categories. Increases in bulk and intermediate product sales narrowly made up for strong decreases in consumer-oriented product exports. In 2020, U.S. food and agricultural exports to Colombia grew 2.7 percent, reaching $2.9 billion.
• Corn and soy products, destined for domestic processing, were among the few growth categories in 2020, driven primarily by the expansion of Colombia’s aquaculture and egg industries. U.S. corn was able to recover substantial market share lost to Argentina and Brazil during 2019.
• U.S. ethanol exports to Colombia totaled $121 million, up 4 percent from 2019, despite challenges in the market such as a 4-month import ban instituted by Colombia as part of its COVID-19 response, a 2year countervailing duty issued in May 2020, and decreasing demand for gasoline due to COVID-19 containment measures.
• In 2020, U.S. rice exports increased around 20,000 tons, though U.S. market share decreased as Peru also ramped up shipments to Colombia.
• Policy issues continue to constrain U.S. dairy exports to Colombia. Dairy exports to Colombia grew dramatically in 2019 and show potential for future growth if these policy issues are addressed.
Colombia’s Agricultural Suppliers
Looking Ahead
Colombia is the leading destination for U.S. agricultural exports to South America, and the United States continues to be the main supplier for most Colombian agricultural imports due to CTPA trade preferences.
42 USDA - Foreign Agricultural Service - 2020 United States Agricultural Export Yearbook

In 2020, the United States faced increased competition from South American exporters likely due to the Colombia-Mercosur Economic Complementation Agreement, which removes or lowers duties on many agricultural products imported from Brazil, Argentina, Paraguay, and Uruguay. As of October 2020, tariffs on white corn and wheat from MERCOSUR countries were zero, while the tariff on yellow corn from MERCOSUR countries was 5 percent. Canadian exports, especially in wheat and legumes, remain competitive. The Colombia-Canada Free Trade Agreement entered into force a year before the 2012 CTPA, resulting in a “head-start” advantage to Canadian exporters that strengthened their trade relations with Colombian millers.
Income and population growth in Colombia are projected to continue driving increases in demand for most imported agricultural products. Most importantly, corn, soybean meal, and soybean oil imports are expected to grow over the next 10 years, and the United States is in a favorable position to meet Colombia’s needs. Although the COVID-19 pandemic has slowed economic growth and demand for imports, Colombia is expected to make a recovery. U.S. consumer-oriented food exports, such as pork, poultry, and dairy, are expected to continue rapid growth in Colombia as economic growth and middle-class expansion return after the economic impacts of the pandemic pass.
USDA - Foreign Agricultural Service - 2020 United States Agricultural Export Yearbook 43

Commodity 2016 2017 2018 2019 2020 2019-2020 % Change
2016-2020 Average
Soybeans 100 364 1,164 995 1,475 48% 820
Dairy Products 29 35 30 45 77 69% 43
Feeds & Fodders 79 70 84 78 59 -24% 74
Beef & Beef Products 99 72 66 77 57 -26% 74
Tree Nuts 32 10 23 32 51 59% 30
Vegetable Oils* 51 48 34 31 37 18% 40
Cotton 34 36 55 31 28 -11% 37
Wheat 20 34 24 180 25 -86% 57
Soybean Oil 13 0 -- 0 23 -- 7
Corn 153 23 320 0 8 -- 101
All Other 131 78 114 89 90 1% 100
Total Exported 741 770 1,914 1,558 1,930 24% 1,383
Highlights
In 2020, Egypt was the 13th largest destination for U.S. agricultural exports by value, totaling $1.9 billion. This represents a 24-percent increase from 2019. The United States is the second- largest agricultural supplier to Egypt with 14 percent market share, just behind the EU27+UK with 16 percent market share. Exporters from the United States face competition from the European Union Member States which have a geographical advantage, lower shipping rates, and a free trade agreement which provides preferential tariffs to EU-origin products. The largest export growth for the United States was seen in soybeans and dairy products, up $480 million and $32 million, respectively. Exports of soybean oil grew from $0 in 2019 to $23 million last year, while tree nut shipments increased 59 percent to $51 million annually. Meanwhile, exports of wheat were down more than $150 million. Exports of feeds & fodders and beef & beef products fell by $19 million and $20 million, respectively.
Top 10 U.S. Agricultural Exports to Egypt (Values in millions of dollars)
EGYPT
Source: U.S. Census Bureau Trade Data - BICO HS-10 *Excludes soybeans
44 USDA - Foreign Agricultural Service - 2020 United States Agricultural Export Yearbook

USDA - Foreign Agricultural Service - 2020 United States Agricultural Export Yearbook 45
Drivers
• Soybean exports in 2020 reached a record $1.5 billion, up $480 million from 2019. U.S. soybeans benefitted from expanded local crushing capacity in Egypt.
• After falling 17 percent in 2019, U.S. soybean exports to Egypt recovered in 2020 to a historical record, rising to become the third-largest global market.
• Egypt imported less wheat from the United States in 2020 after record imports of $180 million the year before due to a higher price gap between U.S. origin and other suppliers and an uptick in global export prices during the early stages of the COVID-19 pandemic.
• Growth in the processing and retail sectors continued to spur imports of consumer-oriented goods such as beef, dairy, and tree nuts.
Egypt’s Agricultural Suppliers
Looking Ahead
Egypt boasted strong macroeconomic fundamentals prior to the COVID-19 pandemic with strong economic growth and a rapidly growing middle class. As part of its pandemic response, Egypt raised public spending and tapped international debt markets. Egypt’s agricultural import market outlook remains dependent on the global recovery from COVID-19. In 2019, tourism to Egypt led vibrant import growth for higher value consumer goods such as beef & beef products and dairy products. Egypt’s Hotel, Restaurant, and Institution sector is forecast to grow by 15-20 percent in 2021 as tourism continues to rebound following years of political unrest and public security concerns.

With high population growth, Egypt continues to rely on imports for more than 50 percent of its food and agricultural product needs. With limited agricultural resources, low agricultural productivity, and a rapidly growing population, Egypt is the world’s largest wheat importer. Egyptian officials prioritize food security and maintain one of the world’s largest food subsidy programs. Approximately 71 million of Egypt’s population, or about two-thirds, are beneficiaries of the country’s bread subsidy program. Egypt imported less wheat from the United States in 2020 after record imports of $180 million the year before as domestic production recovered from a serious drought and importers responded to higher global export prices during the early stages of the COVID-19 pandemic. Egypt’s General Authority for Supply Commodities (GASC) has 15 approved origin countries for wheat imports, of which Russia was the largest supplier by a wide margin last year at $1.6 billion in total value. Russia’s near-record wheat harvests in 2020, combined with the depreciation of the ruble against the dollar, resulted in record purchases by the GASC. Ukraine was Egypt’s second-largest wheat supplier in 2020 at $688 million in value. In 2021, Egypt’s overall demand for imported wheat is forecast higher based on population growth and the inclusion of pasta in the food subsidy program.
Challenges facing U.S. exporters of agricultural products to Egypt include a de-facto ban on poultry parts, with imports restricted to whole, frozen birds. In addition, Egypt only recognizes one U.S.-based halal certifier, which limits access and increases the cost for halal-certified products. Although Egypt remains the largest market for U.S. frozen beef livers, Egypt historically followed EU-based standards for maximum residue levels (MRLs) for ractopamine in beef products and mandatory testing, which restricted trade. In 2020, Egypt undertook a review of the safety of ractopamine. The United States continues to work with Egypt to implement MRLs consistent with international standards. Egypt continues to block market access for U.S. seed potatoes. In addition, several U.S. agricultural products – including retail packaged products, pet foods, apples, and pears – face higher tariffs than comparable products from the EU. Egypt signed an Association Agreement with the EU, which entered into force in 2004, and which grants duty-free access for most EU-origin agricultural products.
The devaluation of the Egyptian pound and inflationary pressure on food prices have driven consumers to lower-priced, locally produced, consumer-oriented products. This has led to an expansion of the Egyptian food-processing sector, and increased imports of food and beverage ingredients and additives to support the growing sector.
46 USDA - Foreign Agricultural Service - 2020 United States Agricultural Export Yearbook

Commodity 2016 2017 2018 2019 2020 2019-2020 % Change
2016-2020 Average
Tree Nuts 2,585 2,707 2,769 3,115 2,879 -8% 2,811
Soybeans 1,899 1,637 3,078 1,953 1,940 -1% 2,101
Prepared Food 579 567 555 551 613 11% 573
Wine & Beer 756 635 560 513 483 -6% 589
Planting Seeds 412 450 468 468 414 -11% 442
Vegetable Oils* 363 347 260 233 249 7% 290
Wheat 165 153 210 210 246 17% 197
Feeds & Fodders 324 331 383 250 237 -5% 305
Processed Fruit 301 293 261 252 230 -9% 267
Soybean Meal 73 97 341 217 209 -3% 187
All Other 4,065 4,220 4,619 4,001 3,736 -7% 4,128
Total Exported 11,523 11,438 13,502 11,761 11,234 -4% 11,892
Highlights
The 27 Member States of the European Union and the United Kingdom were collectively the fifth largest destination for U.S. agricultural exports in 2020 at $11.2 billion. This represents a 4 percent decline from 2019. The United States maintained the No. 2 position in EU market share at 9 percent, second only to Brazil. On June 20, 2018, the EU adopted additional retaliatory tariffs ranging from 10 percent to 25 percent on a range of agricultural, consumer, and industrial products and materials imported from the United States. While these tariffs and discriminatory import regulations continue to challenge U.S. agricultural exports, the EU maintains a strong position in the top 5 of U.S. agricultural product export markets. The commodities that saw the largest increase in exports to the EU in 2020 were prepared foods at $62 million, wheat at $35 million, and vegetable oils at $16 million. Reductions in exports were seen in tree nuts ($236 million), planting seeds ($53 million), wine & beer ($31 million), processed fruits ($22 million), feeds & fodders ($13 million), and soybean meal ($7 million). Despite these reductions, the EU remained the top market for tree nuts, planting seeds, and pulses.
Top 10 U.S. Agricultural Exports to EU27+UK (Values in millions of dollars)
EUROPEAN UNION + UK
Source: U.S. Census Bureau Trade Data - BICO HS-10 *Excludes soybeans
USDA - Foreign Agricultural Service - 2020 United States Agricultural Export Yearbook 47

Drivers
• In 2020, the decline in U.S. agricultural exports to the EU was shared across sectors – planting seeds, processed products, tree nuts, and feed. This year’s decline in the feed sector deepened the impact of the previous year’s decline, partially the result of Section 232 retaliatory tariffs that the EU imposed on corn, sorghum, and rye from April 27 to August 27, 2020.
• The EU imposition of 25 percent tariffs in retaliation for U.S. duties on steel and aluminum has contributed to a decline in U.S. exports to the EU for some processed agricultural products. In addition, in November 2020, the EU imposed trade retaliation on U.S. goods, including 25 percent tariffs on various agricultural products, in connection with a WTO dispute against the United States related to large civil aircraft. These additional tariffs and the economic impact of COVID-19 altered the EU’s imports and consumption of U.S. agricultural goods.
• The wine & beer sector has been hit particularly hard by the COVID-19 pandemic, largely due to decreased demand for alcoholic beverages in the hospitality sectors that have experienced unforeseen closures and capacity restrictions. Uncertainty caused by the United Kingdom’s (UK’s) exit from the EU has impacted the transatlantic wine trade, particularly because the UK serves as the major hub for bottling U.S. wine bulk shipments destined for the EU.
• Record U.S. harvests put downward pressure on almond unit values in 2020. The unit value of almonds dropped nearly 20 percent, which contributed to the decline in tree nut export value. U.S. exports of pistachios and almonds continued to be affected by trade disruptions from aflatoxin phytosanitary requirements.
• U.S. wheat exports to the EU, primarily durum to Italy, increased due to a dip in production in the EU and Italian millers buying extra supply because of COVID-19. In calendar year (CY) 2021, it is anticipated that U.S. wheat exports will decline as production and supply stabilize.
• In CY 2020, U.S. exports of prepared food to the EU reached a record high of $613 million, up $62 million from the previous year. The Netherlands, UK, and Austria accounted for 74 percent of the export growth with increases of $9 million, $24 million, and $11 million, respectively. Likely driven by increasing demand for shelf-stable products during the COVID-19 pandemic, canned prepared foods saw a 233-percent increase, from $5 million to $16 million. Most notably, U.S. exports of canned prepared foods to the Netherlands rose from $2 million to $10 million.
48 USDA - Foreign Agricultural Service - 2020 United States Agricultural Export Yearbook

European Union’s Agricultural Suppliers
Looking Ahead
Several non-tariff barriers continue to have profound effects on U.S. agricultural exports to the EU. In addition, COVID-19 has greatly impacted EU economic growth, tourism, restaurant dining, and demand for certain food, and the Eurozone economy declined by 5.1 percent in fiscal year 2020. However, it is expected that the EU will rebound quickly as a major importer of U.S. agricultural products following pandemic and economic recovery. Despite the withdrawal of the UK from the EU, the EU is expected to remain a key market for exports of U.S. agricultural goods. Supply interruptions resulting from the UK’s withdrawal have the potential to present both opportunities and threats for U.S. agricultural exports. In addition, potential removal of retaliatory tariffs would significantly increase opportunities for U.S. agricultural exports, most notably from the feed and wine & beer sectors.
The United States and the EU are both competitors and robust trading partners in agricultural products. Nevertheless, there is much work to be done on trade-restrictive policies. Pressing issues include tariffs, geographical indications, and the EU’s hazard-based approaches, including regulatory policies on maximum residue limits for pesticides, regulatory timelines for approving genetically engineered products, veterinary drug restrictions, and newly adopted model certificates for products of animal origin. The EU’s implementation of proposed actions under its Farm to Fork Initiative also has the potential to affect U.S. agricultural exports.
Increased cooperation with the EU would facilitate opportunities to address some of these challenges. Although U.S. agricultural exports to the EU declined in most commodity areas from 2019 to 2020, prepared food and household food products, such as wheat and vegetable oils, were areas of growth for U.S. agricultural exports, reflecting higher demand for staple and convenience foods due to stay-at-home restrictions. As the world’s second largest importer of agricultural goods, the EU remains a valuable potential market given the current U.S. modest 9 percent market share.
USDA - Foreign Agricultural Service - 2020 United States Agricultural Export Yearbook 49

Commodity 2016 2017 2018 2019 2020 2019-2020 % Change
2016-2020 Average
Beef & Beef Products 684 884 964 746 666 -11% 789
Tree Nuts 1,156 1,251 1,052 692 271 -61% 884
Prepared Food 232 169 228 191 186 -3% 201
Fresh Fruit 281 291 237 194 181 -7% 237
Poultry Meat & Products* 426 469 431 353 107 -70% 357
Pork & Pork Products 360 415 282 154 91 -41% 260
Dog & Cat Food 40 50 62 57 68 21% 55
Wine & Beer 101 120 131 114 65 -43% 106
Processed Vegetables 54 49 53 54 42 -21% 50
Eggs & Products 39 38 46 46 39 -15% 42
All Other 459 477 473 391 302 -23% 422
Total Exported 3,832 4,213 3,959 2,992 2,018 -33% 3,403
Highlights
In 2020, Hong Kong was the 12th largest destination for U.S. food and agricultural exports, totaling $2 billion. This represents a 33-percent decrease from 2019. In 2020, Hong Kong also remained the sixth-largest market for consumer-oriented agricultural exports, valued at more than $1.8 billion, or 86 percent of U.S. agricultural exports to Hong Kong. The United States was the third-largest supplier of agricultural goods with 11 percent market share, behind China with 19 percent and the EU27+UK with 16 percent. The downward export trend to Hong Kong in 2020 was largely due to travel constraints in reaction to the global outbreak of COVID-19. Additionally, an increase in direct U.S. agricultural exports to China reduced the frequency of transshipment through Hong Kong, resulting in a decrease in U.S. agricultural exports to Hong Kong. Hong Kong is the fifth-largest export market for U.S. beef at more than $665 million, the sixth-largest market for fresh fruit at $180 million, the seventh-largest market for wine at $64 million, and the seventh-largest market for fish products at $123 million. Among the few products that saw increases to Hong Kong in 2020 were dog & cat food and cotton, which grew $11 million and $3 million, or 21 and 58 percent, respectively. Exports of poultry meat & products (excluding eggs), beef & beef products, and pork & pork products fell last year by $246 million, $80 million, and $63 million, respectively.
Top 10 U.S. Agricultural Exports to Hong Kong (Values in millions of dollars)
HONG KONG
Source: U.S. Census Bureau Trade Data - BICO HS-10 *Excludes eggs
50 USDA - Foreign Agricultural Service - 2020 United States Agricultural Export Yearbook

USDA - Foreign Agricultural Service - 2020 United States Agricultural Export Yearbook 51
Drivers
• In January 2020, Hong Kong was one of the first places outside of China to confirm cases of COVID-19. The Hong Kong Government has implemented stringent measures to control the spread of the coronavirus, effectively shutting down the critical leisure tourism sector. Prior to the pandemic, Hong Kong was the most visited destination in the world, fueling the demand for high-value U.S. agricultural exports for the hospitality industry.
• While the sales of premium products to the Hotel, Restaurant, and Institutional food service sector have been adversely affected, retail sales of food products in supermarkets have increased as people cook at home more as a result of public health measures.
• Direct U.S. agricultural exports to mainland China increased, decreasing the likelihood of transshipment of goods through Hong Kong.
Hong Kong’s Agricultural Suppliers
Looking Ahead
Hong Kong will continue to be an important market for U.S. agricultural and food exports, free from tariffs and taxes. More than 95 percent of Hong Kong’s food supplies are imported, and U.S. products are well received by Hong Kong consumers because of enforceable U.S. food safety standards and the consistent quality of U.S. products. While ongoing political tensions may reduce Hong Kong’s desirability as a business center for international companies, the jurisdiction, as a free port that allows for the free flow of goods and capital, continues to play an important role in introducing and establishing U.S. products for the larger Asian market. As Hong Kong and the broader global economy emerge from the coronavirus pandemic, U.S. agricultural exports should be able to recover some lost ground in Hong Kong.

Commodity 2016 2017 2018 2019 2020 2019-2020 % Change
2016-2020 Average
Soybeans 988 922 998 864 884 2% 931
Dairy Products 158 132 165 239 352 47% 209
Wheat 192 298 177 282 275 -3% 245
Cotton 346 498 600 416 264 -37% 425
Feeds & Fodders 264 251 161 149 131 -12% 191
Soybean Meal 14 28 123 15 96 525% 55
Prepared Food 60 75 70 89 85 -5% 76
Beef & Beef Products 39 54 62 85 72 -16% 62
Fresh Fruit 81 64 52 59 48 -19% 61
Tobacco 85 55 71 42 43 2% 59
All Other 451 515 615 618 582 -6% 556
Total Exported 2,678 2,892 3,094 2,858 2,832 -1% 2,871
Highlights
In 2020, Indonesia was the 10th-largest destination for U.S. agricultural exports, totaling $2.8 billion. This represents a 1-percent decrease from 2019 and an 8-percent fall from a record-setting 2018. The United States is Indonesia’s top supplier of agricultural goods with 16 percent market share, followed by China with 13 percent and Australia with 10 percent. Indonesia is the largest economy in Southeast Asia, with a rapidly growing middle class. The largest increases in imports from the United States were seen in dairy products and soybean meal, up $113 million and $81 million, respectively. Soybeans continued to be the largest export product to Indonesia by a wide margin, increasing $20 million from 2019 to $884 million annually. Exports of cotton plummeted, down more than 50 percent from a record high in 2018 to $264 million in 2020. Shipments of feeds & fodder, beef & beef products, and fresh fruit also declined last year, by $18 million, $13 million, and $11 million, respectively.
Drivers
• In 2020, strong demand for dairy solids from the food manufacturing sector, competitive U.S. prices, and a shift in government policy in favor of U.S. dairy products vis-à-vis European Union products boosted U.S.
Top 10 U.S. Agricultural Exports to Indonesia (Values in millions of dollars)
INDONESIA
Source: U.S. Census Bureau Trade Data - BICO HS-10
52 USDA - Foreign Agricultural Service - 2020 United States Agricultural Export Yearbook

dairy exports to a record $352 million, an increase of 47 percent from the previous year.• Indonesian regulations preventing the import of corn continues to drive large imports of wheat for
food and feed. • Due to a collapse in orders from Indonesia’s traditional textile markets (United States, the EU, and Japan),
U.S. cotton exports plummeted 37 percent.• Unfavorable exchange rates during the first quarter of the year followed by rapidly rising prices during
the final half of the year resulted in sluggish demand for U.S. soybeans and stagnant exports. Most imported soybeans are used for foods like tempeh and tofu, not feed.
• Continued strong demand from Indonesia’s poultry sector drove strong growth in U.S. feed ingredient (dried distillers’ grains with solubles, corn gluten, soybean meal).
Indonesia’s Agricultural Suppliers
Looking Ahead
With an estimated population of 271 million and the largest economy in Southeast Asia, Indonesia is the fourth most populous country in the world with a growing middle class, which provides further opportunities for U.S. food and beverage exports. Indonesia is also in the process of reforming its import licensing system for horticultural imports, which may benefit U.S. horticultural exports destined for Indonesia by dismantling certain onerous import requirements.
U.S. agricultural exports to Indonesia also face challenges. Indonesia continues to seek “self-sufficiency” in key agricultural commodities which could mean limiting agricultural imports. In October 2019, Indonesia began a 5-year, phased-in implementation of new halal requirements for food and beverages, which is likely to pose significant challenges for U.S. exporters in years to come.
USDA - Foreign Agricultural Service - 2020 United States Agricultural Export Yearbook 53

Commodity 2016 2017 2018 2019 2020 2019-2020 % Change
2016-2020 Average
Beef & Beef Products 1,510 1,889 2,102 1,950 1,944 0% 1,879
Corn 2,091 2,163 2,813 2,001 1,846 -8% 2,183
Pork & Pork Products 1,553 1,626 1,631 1,523 1,626 7% 1,592
Soybeans 1,000 973 927 971 1,063 10% 987
Wheat 604 714 717 609 635 4% 656
Hay 374 414 426 491 487 -1% 438
Processed Vegetables 477 510 502 499 467 -6% 491
Tree Nuts 374 398 434 416 386 -7% 402
Dairy Products 206 291 269 282 322 14% 274
Fresh Fruit 343 316 319 323 315 -3% 323
All Other 2,496 2,620 2,785 2,674 2,395 -10% 2,594
Total Exported 11,030 11,915 12,925 11,740 11,487 -2% 11,819
Highlights
In 2020, Japan moved up from the fifth to the fourth-largest U.S. agricultural export market, with exports valued at $11.5 billion. This occurred despite a 2-percent decrease from 2019’s $11.7 billion export value. The United States maintained the No. 1 market share for Japan at 24 percent, followed by the EU27+UK at 13 percent and China at 12 percent. In October 2019, the United States and Japan signed the United States–Japan Trade Agreement (USJTA), making more than 90 percent of U.S. agricultural exports to Japan duty-free or eligible for preferential tariff access. The largest export growth for U.S. agriculture to Japan was in pork (up $102 million), soybeans (up $93 million), dairy (up $40 million), and wheat (up $26 million). The largest reductions were in corn (down $155 million), processed vegetables (down $32 million), tree nuts (down $30 million), and fresh fruit (down $9 million). Despite these declines, Japan maintained its position as the top market for U.S. beef & beef products, rice, and hay.
Top 10 U.S. Agricultural Exports to Japan (Values in millions of dollars)
JAPAN
Source: U.S. Census Bureau Trade Data - BICO HS-10
54 USDA - Foreign Agricultural Service - 2020 United States Agricultural Export Yearbook

USDA - Foreign Agricultural Service - 2020 United States Agricultural Export Yearbook 55
Drivers
• Improved market access achieved through USJTA with Comprehensive and Progressive Agreement for Trans-Pacific Partnership signatories and European Union members created a more competitive environment for U.S. exports.
• The reduction of tariffs on cheese products and complete elimination of import duties on products such as milk albumin and lactose, combined with COVID-19 associated disruptions to Japan’s supply chain, prompted shifts in overall dairy imports by Japan.
• The COVID-19 pandemic had little impact on Japanese feed demand, and the United States remained the largest supplier of corn, soybeans, and hay in 2020.
• The United States recaptured the position of largest supplier of beef and pork products to Japan as tariff reductions went into effect and supply disruptions hit Australian and European Union competitors.
Japan’s Agricultural Suppliers
Looking Ahead
Reductions in tariffs on the largest agricultural producing nations, including the United States, will continue to drive competition in the Japanese market in the short term. As Japan recovers from the COVID-19 pandemic and demand for key products such as beef and pork return to pre-pandemic levels, the United States stands to significantly improve market share and export values. However, Japan’s declining population will limit opportunities for long-term growth in the United States’ fourth largest agricultural export destination. Several products, most notably rice, were excluded from Phase One of the agreement and remain at a market access disadvantage compared to competing nations. The United States will continue efforts to improve market access and achieve an equitable trade environment in Japan.
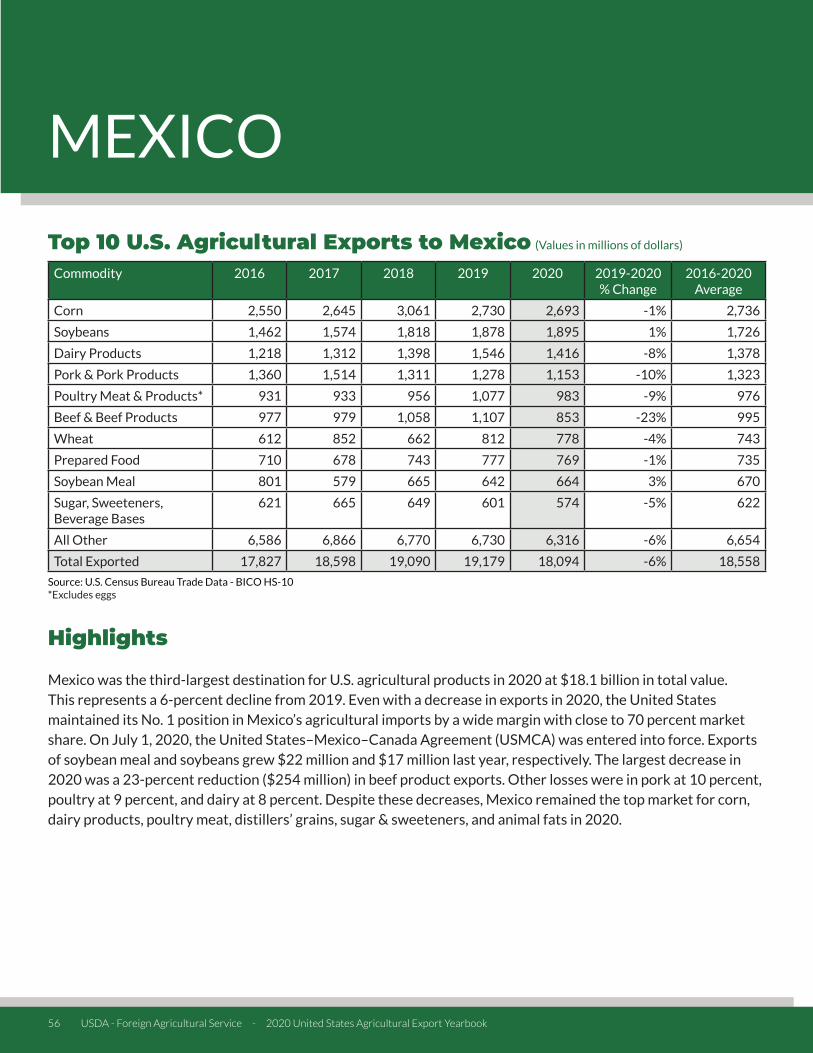
Commodity 2016 2017 2018 2019 2020 2019-2020 % Change
2016-2020 Average
Corn 2,550 2,645 3,061 2,730 2,693 -1% 2,736
Soybeans 1,462 1,574 1,818 1,878 1,895 1% 1,726
Dairy Products 1,218 1,312 1,398 1,546 1,416 -8% 1,378
Pork & Pork Products 1,360 1,514 1,311 1,278 1,153 -10% 1,323
Poultry Meat & Products* 931 933 956 1,077 983 -9% 976
Beef & Beef Products 977 979 1,058 1,107 853 -23% 995
Wheat 612 852 662 812 778 -4% 743
Prepared Food 710 678 743 777 769 -1% 735
Soybean Meal 801 579 665 642 664 3% 670
Sugar, Sweeteners, Beverage Bases
621 665 649 601 574 -5% 622
All Other 6,586 6,866 6,770 6,730 6,316 -6% 6,654
Total Exported 17,827 18,598 19,090 19,179 18,094 -6% 18,558
Highlights
Mexico was the third-largest destination for U.S. agricultural products in 2020 at $18.1 billion in total value. This represents a 6-percent decline from 2019. Even with a decrease in exports in 2020, the United States maintained its No. 1 position in Mexico’s agricultural imports by a wide margin with close to 70 percent market share. On July 1, 2020, the United States–Mexico–Canada Agreement (USMCA) was entered into force. Exports of soybean meal and soybeans grew $22 million and $17 million last year, respectively. The largest decrease in 2020 was a 23-percent reduction ($254 million) in beef product exports. Other losses were in pork at 10 percent, poultry at 9 percent, and dairy at 8 percent. Despite these decreases, Mexico remained the top market for corn, dairy products, poultry meat, distillers’ grains, sugar & sweeteners, and animal fats in 2020.
Top 10 U.S. Agricultural Exports to Mexico (Values in millions of dollars)
MEXICO
Source: U.S. Census Bureau Trade Data - BICO HS-10 *Excludes eggs
56 USDA - Foreign Agricultural Service - 2020 United States Agricultural Export Yearbook

USDA - Foreign Agricultural Service - 2020 United States Agricultural Export Yearbook 57
Drivers
• Deep COVID-19-related economic shocks in Mexico caused a 6-percent overall decline in imports of agricultural products from the United States in 2020 compared to 2019.
• Lower purchasing power led to decreases in U.S. exports of animal proteins, particularly high-value U.S. beef, which dropped 23 percent to $853 million in 2020. Consumer preference for lower priced animal products resulted in lesser declines for U.S. dairy, pork, and poultry exports, which totaled $1.4 billion, $1.2 billion, and 983 million, respectively.
• U.S. exports of corn declined slightly to $2.7 billion because of decreased demand for animal feed.• Depressed consumer purchasing power led to reduced demand for higher priced imported fruits such
as apples, pears, and grapes, with U.S. fresh fruit exports declining 11 percent to $545 million.• U.S. exports of soybean meal and soybeans to Mexico increased to $1.9 billion and $665 million,
respectively, due to decreased availability from international competitors. Mexico’s Agricultural Suppliers
Looking Ahead
The outlook for U.S. agricultural exports to Mexico in 2021 remains muted amidst a continuing economic crisis. Once Mexico’s economy recovers, U.S. exports of consumer-oriented, bulk, and intermediate agricultural products are anticipated to recover. Implementation of the USMCA ensures tariffs between the two countries remain at zero.
USMCA contains new and enforceable rules to ensure that sanitary and phytosanitary measures (SPS) are science-based and developed and implemented in a transparent and non-discriminatory manner.

The Distilled Spirits, Wine, Beer, and Other Alcohol Beverages Annex of the USMCA Agriculture Chapter contains non-discrimination and transparency commitments regarding sale and distribution of alcoholic beverages. Also, the Parties agreed to labeling and certification provisions to help prevent technical barriers to trade in wine and distilled spirits.
In a side letter, Mexico confirms that market access of U.S. products in Mexico is not restricted due to the mere use of the individual cheese terms listed in the letter.
USDA will continue working to expand market access for U.S. potatoes, with an anticipated final ruling on a case brought by the Mexican potato industry. A positive ruling could provide U.S. fresh potatoes with access to all of Mexico. Currently, Mexico prohibits the shipment of U.S. fresh potatoes beyond a 26-kilometer zone along the U.S.-Mexico border.
USDA will continue advocating for science-based policies on biotechnology product approvals and pesticides. On December 31, 2020, Mexico published a final decree under which existing authorizations “for the use of genetically modified corn grain in the diet of Mexican women and men” will be revoked and new authorizations are prohibited until genetically modified corn grain is completely replaced by January 31, 2024. The same decree calls for the phase-out of the use of glyphosate and glyphosate-containing products by January 31, 2024. USDA will continue to work to prevent any trade disruptions from the decree.
58 USDA - Foreign Agricultural Service - 2020 United States Agricultural Export Yearbook

Commodity 2016 2017 2018 2019 2020 2019-2020 % Change
2016-2020 Average
Soybean Meal 729 747 884 788 899 14% 810
Wheat 592 555 642 708 826 17% 665
Dairy Products 227 243 246 273 410 50% 280
Prepared Food 89 92 105 111 127 15% 105
Pork & Pork Products 79 98 116 93 115 23% 100
Poultry Meat & Products* 77 92 111 102 64 -37% 89
Beef & Beef Products 55 62 87 88 62 -29% 71
Snack Foods 63 54 59 60 59 -2% 59
Processed Vegetables 72 79 83 110 55 -50% 80
Soybeans 104 92 66 52 54 4% 74
All Other 486 467 555 513 480 -6% 500
Total Exported 2,573 2,581 2,954 2,898 3,151 9% 2,831
Highlights
In 2020, the Philippines was the ninth-largest destination for U.S. agricultural exports, totaling $3.2 billion. This represents a 9-percent increase from 2019 and set a record for U.S. agricultural exports to the Philippines. The United States is expected to be the Philippines’s top supplier of agricultural goods with 23 percent market share, followed by the EU27+UK with 11 percent. The Philippine applied most-favored nation tariffs are among the lowest in the region and often close to the preferential rates offered to U.S. competitors. The largest export increases in 2020 were seen in dairy products, wheat, and soybean meal, up $137 million, $118 million, and $111 million, respectively. Exports of prepared foods rose 15 percent to $127 million and exports of pork products grew 23 percent after declining in 2019. Processed vegetables, poultry meat & products (excluding eggs), and
beef & beef products declined in 2020 by $55 million, $38 million, and $26 million, respectively.
Drivers
• Despite a 2020 decline in the Philippine gross domestic product due to COVID-19, U.S. wheat exports increased by 17 percent from 2019. This could be attributed to strong demand for milling wheat, as
Top 10 U.S. Agricultural Exports to Philippines (Values in millions of dollars)
PHILIPPINES
Source: U.S. Census Bureau Trade Data - BICO HS-10 *Excludes eggs
USDA - Foreign Agricultural Service - 2020 United States Agricultural Export Yearbook 59

Filipino consumers stocked up on wheat-based food items such as bread throughout the pandemic. The United States has nearly 100 percent market share for milling wheat.
• Despite a 2020 decline in livestock and poultry production, soybean meal exports rose 14 percent from 2019. Possible drivers could be increased aquaculture and layer production as well as hog producers switching from swill to commercial feed.
• The collapse of the quick-service restaurant industry due to COVID-19 explains a drop in U.S. frozen french fries, beef, and poultry imports. In addition, U.S. frozen french fries have faced a 10-percent tariff since 2019, whereas they were tariff-free after 2015 as a concession by the Philippines to win the WTO’s support for its extension of quantitative restrictions on rice imports.
• Increased demand for U.S. pork can be attributed to the decline in domestic Philippine pork production due to African swine fever.
Philippines’ Agricultural Suppliers
Looking Ahead
The Philippines has a young, fast-growing, and highly urbanized population with strong preference for U.S. food and beverage products. With a population of 109 million, opportunities for imported food and beverage products offer strong potential for growth into the future.
As of early 2021, certain agricultural products, such as corn, chipping potatoes, pork, and poultry products, face both in-quota and out-of-quota tariffs under the Philippines’ tariff rate quota system which can present a challenge for U.S. food and agricultural exports. Throughout 2020, the Philippines faced food inflation and the government considered reforms to its tariff rate quota system to allow greater market access for agricultural imports. A more liberalized Philippine trade policy would provide better prospects for U.S. agricultural products.
60 USDA - Foreign Agricultural Service - 2020 United States Agricultural Export Yearbook

Commodity 2016 2017 2018 2019 2020 2019-2020 % Change
2016-2020 Average
Beef & Beef Products 1,071 1,220 1,746 1,843 1,722 -7% 1,520
Corn 864 705 1,356 359 548 53% 766
Prepared Food 365 324 355 509 460 -10% 403
Fresh Fruit 389 493 494 405 459 13% 448
Pork & Pork Products 364 475 670 593 453 -24% 511
Dairy Products 231 279 290 330 370 12% 300
Soybeans 227 294 327 396 361 -9% 321
Wheat 248 328 363 300 340 13% 316
Tree Nuts 296 306 290 291 295 2% 295
Feeds & Fodders 152 158 157 202 235 16% 181
All Other 1,976 2,290 2,265 2,296 2,287 0% 2,223
Total Exported 6,183 6,872 8,313 7,524 7,530 0% 7,285
Highlights
South Korea kept the No. 6 position in the U.S. agricultural export market at $7.5 billion in 2020, representing a fractional increase from 2019. The United States is South Korea’s top supplier of agricultural products by a large margin, occupying a 30-percent market share. The EU27+UK and China are the second and third largest suppliers with 14 percent market share and 10 percent market share, respectively. Under the United States–Korea Free Trade Agreement (KORUS), South Korea eliminated tariffs on almost two-thirds of U.S. agricultural exports. U.S. agricultural products now entering South Korea duty-free include wheat, corn, soybeans, hides & skins, cotton, cherries, pistachios, almonds, orange juice, grape juice, and wine. Other agricultural products receive duty-free access under tariff-rate quotas (TRQs), including skim & whole milk powder, cheese, dextrin, modified starches, barley, popcorn, oranges, potatoes, honey, and hay. The commodities which experienced the largest value growth in 2020 were corn with a 53-percent increase, wheat with a 13-percent increase, fresh fruit with a 13-percent increase, and dairy with a 12-percent increase. On the other side, reductions were seen in pork (24 percent), prepared foods (10 percent), and beef (7 percent). South Korea remained the top U.S. export market for soybean oil, fresh oranges, and fresh cheese in 2020.
Top 10 U.S. Agricultural Exports to South Korea (Values in millions of dollars)
SOUTH KOREA
Source: U.S. Census Bureau Trade Data - BICO HS-10
USDA - Foreign Agricultural Service - 2020 United States Agricultural Export Yearbook 61
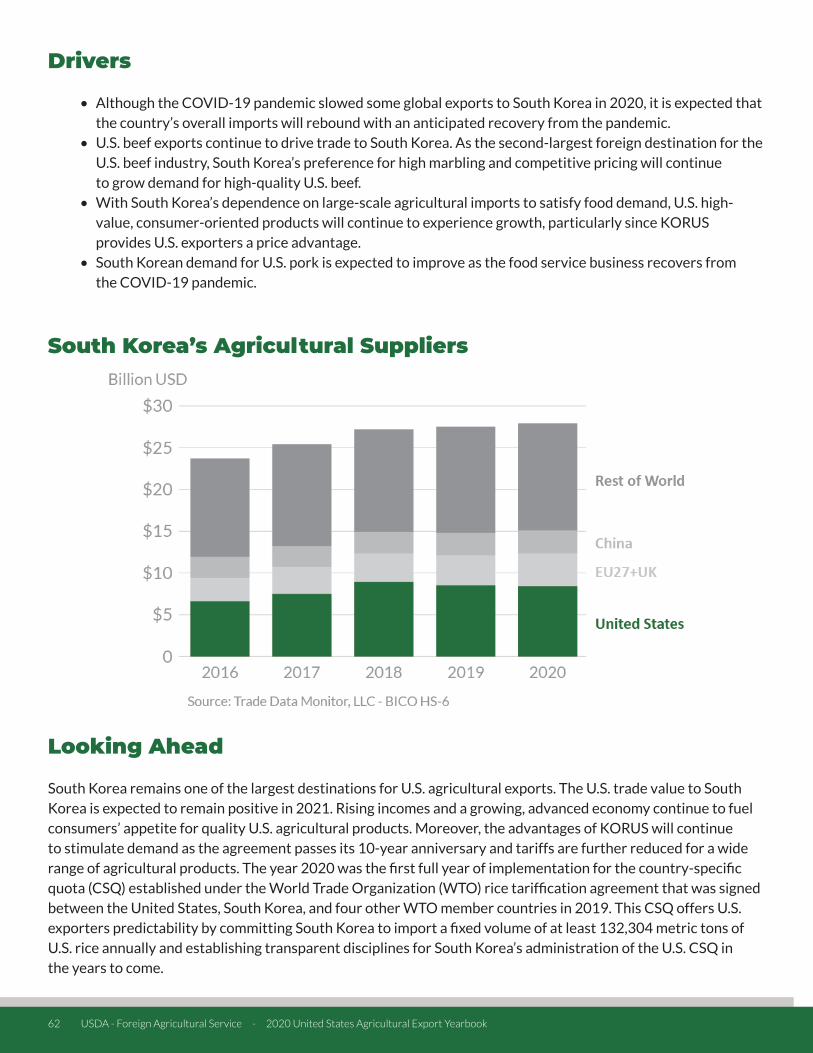
Drivers
• Although the COVID-19 pandemic slowed some global exports to South Korea in 2020, it is expected that the country’s overall imports will rebound with an anticipated recovery from the pandemic.
• U.S. beef exports continue to drive trade to South Korea. As the second-largest foreign destination for the U.S. beef industry, South Korea’s preference for high marbling and competitive pricing will continue to grow demand for high-quality U.S. beef.
• With South Korea’s dependence on large-scale agricultural imports to satisfy food demand, U.S. high-value, consumer-oriented products will continue to experience growth, particularly since KORUS provides U.S. exporters a price advantage.
• South Korean demand for U.S. pork is expected to improve as the food service business recovers from the COVID-19 pandemic.
South Korea’s Agricultural Suppliers
Looking Ahead
South Korea remains one of the largest destinations for U.S. agricultural exports. The U.S. trade value to South Korea is expected to remain positive in 2021. Rising incomes and a growing, advanced economy continue to fuel consumers’ appetite for quality U.S. agricultural products. Moreover, the advantages of KORUS will continue to stimulate demand as the agreement passes its 10-year anniversary and tariffs are further reduced for a wide range of agricultural products. The year 2020 was the first full year of implementation for the country-specific quota (CSQ) established under the World Trade Organization (WTO) rice tariffication agreement that was signed between the United States, South Korea, and four other WTO member countries in 2019. This CSQ offers U.S. exporters predictability by committing South Korea to import a fixed volume of at least 132,304 metric tons of U.S. rice annually and establishing transparent disciplines for South Korea’s administration of the U.S. CSQ in the years to come.
62 USDA - Foreign Agricultural Service - 2020 United States Agricultural Export Yearbook

Commodity 2016 2017 2018 2019 2020 2019-2020 % Change
2016-2020 Average
Soybeans 579 586 854 685 604 -12% 662
Beef & Beef Products 363 409 552 568 552 -3% 489
Wheat 257 295 267 324 311 -4% 291
Poultry Meat & Products* 127 152 189 187 224 20% 176
Fresh Fruit 220 218 199 252 197 -22% 217
Corn 460 395 593 228 179 -22% 371
Prepared Food 162 149 154 149 141 -5% 151
Dairy Products 72 83 93 109 121 11% 96
Processed Vegetables 71 71 71 73 73 1% 72
Non-Alcoholic Beverages**
68 61 61 72 71 -1% 67
All Other 847 898 916 918 789 -14% 874
Total Exported 3,226 3,317 3,949 3,565 3,262 -9% 3,464
Highlights
In 2020, Taiwan was the eighth-largest destination for U.S. agricultural exports, totaling $3.3 billion. This represents a 9-percent decrease from 2019, and a 17-percent decrease from a record $3.9 billion in 2018. The United States is Taiwan’s top supplier of agricultural goods with 29 percent market share, followed by the EU27+UK with 12 percent. In 2020, the largest export growth was in poultry meat & products (excluding eggs), up $37 million. Dairy products also rose, up 11 percent to $121 million. Virtually all other top commodities to Taiwan declined in value. Exports of U.S. soybeans decreased by more than $80 million, while exports of corn continued to fell due in part to lower domestic consumption, higher U.S. prices, and competition from South America. Shipments of fresh fruit, beef & beef products, and wheat were down $55 million, $16 million, and $13 million, respectively. While Taiwan is one of the largest per capita consumers of U.S. agricultural goods, U.S. food products are facing increased competition from third country competitors with preferential trade agreements, such as beef and dairy products from New Zealand.
Top 10 U.S. Agricultural Exports to Taiwan (Values in millions of dollars)
TAIWAN
Source: U.S. Census Bureau Trade Data - BICO HS-10 *Excludes eggs **Excludes juices
USDA - Foreign Agricultural Service - 2020 United States Agricultural Export Yearbook 63

Drivers
• Increased soybean prices, combined with lower coronavirus pandemic-related food and feed demand, resulted in decreased exports from 2018 and 2019 levels.
• Higher prices, competition from South America, and effects from the coronavirus pandemic resulted in slightly decreased corn exports.
• U.S. poultry meat and products increased by 20 percent in 2020, aided by a decrease in Taiwan’s poultry production.
• Taiwan’s developed economy, relatively high per-capita income, and deepening ties with the United States continue to make it an important agricultural export market for U.S. producers.
Taiwan’s Agricultural Suppliers
Looking Ahead
Taiwan’s successful response to the coronavirus pandemic resulted in extremely low levels of virus transmission, setting the stage for economic growth as global demand recovers. Changing consumer preferences and eating habits provide continued opportunities to U.S. exporters in higher value agricultural commodities and consumer-oriented food products. U.S. agricultural exports will remain strong. However, pork exports are decreasing, as regulatory actions implemented on January 1, 2021, including country-of-origin labeling measures, continue to affect the market.
Importantly, Taiwan announced the easing of restrictions on imports of U.S. pork and beef in August 2020, allowing products containing ractopamine.
64 USDA - Foreign Agricultural Service - 2020 United States Agricultural Export Yearbook

Commodity 2016 2017 2018 2019 2020 2019-2020 % Change
2016-2020 Average
Soybeans 362 467 593 524 568 8% 503
Wheat 147 175 180 162 171 5% 167
Prepared Food 125 131 133 137 129 -6% 131
Cotton 164 213 273 215 119 -45% 197
Feeds & Fodders 82 84 84 86 100 16% 87
Dairy Products 35 50 35 56 75 34% 50
Tree Nuts 31 22 32 42 36 -12% 33
Fresh Fruit 40 37 39 45 35 -22% 39
Hides & Skins 60 129 120 59 32 -45% 80
Chocolate & Cocoa Products
12 15 15 20 20 -3% 16
All Other 536 516 617 479 490 2% 528
Total Exported 1,594 1,839 2,121 1,825 1,775 -3% 1,831
Highlights
In 2020, Thailand was the 14th-largest destination for U.S. agricultural exports, totaling $1.8 billion. This represents a 3-percent decrease from 2019. The United States was Thailand’s third-largest supplier of agricultural goods with 13 percent market share, behind Brazil with 15 percent and China with 13 percent. The largest export growth seen last year was in distillers’ grains and soybeans, up more than $71 million and $44 million, respectively. Additionally, exports of dairy products, feeds & fodders, and wheat increased by $19 million, $14 million, and $9 million, respectively. Exports of cotton were down by $96 million. Exports of soybean meal,
hides & skins, and fresh fruit decreased by $50 million, $27 million, and $10 million, respectively.
Top 10 U.S. Agricultural Exports to Thailand (Values in millions of dollars)
THAILAND
Source: U.S. Census Bureau Trade Data - BICO HS-10
USDA - Foreign Agricultural Service - 2020 United States Agricultural Export Yearbook 65

Drivers
• The COVID-19 pandemic hit Thailand’s service sector the hardest, which accounts for 63 percent of gross domestic product and constitutes around half of total employment.
• Competitive prices are important for U.S. agricultural products’ market share due to strong competition from key suppliers that have free trade agreements with Thailand.
• Increasing live swine exports to neighboring countries that had African swine fever outbreaks boosted import demand for feed ingredients, especially for U.S. full-fat soybean and dried distillers’ grains.
• Flour mills built up their wheat inventories to cushion the trade impact of new government import regulations to be implemented in June 2021, leading to an unusual increase in import demand for wheat grain.
• COVID-19 related measures accelerated the online food business in Thailand, creating new opportunities for U.S. consumer-ready products.
• The country’s increasing urbanization has contributed to a growing demand for imported, high-value food and beverage products among the middle- and upper-income population.
Thailand’s Agricultural Suppliers
Looking Ahead
In 2020, the effects of the COVID-19 pandemic contributed to a 6-percent contraction of Thailand’s real GDP from 2019. The economy is expected to recover when foreign tourists return after pandemic restrictions are lifted. The recovery in tourism will drive import demand for U.S. commodity and food products, especially for high-value consumer products such as beef, dairy products, fresh fruits, frozen and dehydrated potatoes, nuts, processed and frozen ready-to-eat foods, fruit juices, and alcoholic beverages (including wine, beer, and spirits).
66 USDA - Foreign Agricultural Service - 2020 United States Agricultural Export Yearbook
Thai consumers have increased their demand for “immunity boosting” foods such as fresh fruits, vitamin beverages, dried fruits & nuts, and food supplements. This will create excellent market opportunities for U.S. suppliers.
Soybeans from the United States are expected to lose market share relative to cheaper soybeans from Brazil, as upward pressure from Chinese demand raises U.S. prices. Additionally, the Regional Comprehensive Economic Partnership (RCEP) that Thailand signed in November 2020 with 14 other countries provides preferential access for some products and will likely increase the cost of U.S. products compared to RCEP countries.
USDA - Foreign Agricultural Service - 2020 United States Agricultural Export Yearbook 67

Commodity 2016 2017 2018 2019 2020 2019-2020 % Change
"2016-2020 Average"
Wine & Beer 363 262 257 263 250 -5% 279
Tree Nuts 200 212 197 211 197 -7% 204
Prepared Food 191 157 167 151 175 16% 168
Fresh Vegetables 84 84 86 77 73 -5% 81
Soybeans 90 0 109 100 60 -40% 72
Snack Foods 66 58 49 49 57 16% 56
Vegetable Oils* 22 28 40 39 41 4% 34
Feeds & Fodders 58 42 68 52 39 -26% 52
Dairy Products 5 9 27 12 36 186% 18
Animal Fats 35 61 22 23 34 51% 35
All Other 790 788 801 672 641 -5% 739
Total Exported 1,906 1,702 1,823 1,649 1,603 -3% 1,737
Highlights
In 2020, the United Kingdom (UK) was the 15th-largest destination for U.S. agricultural exports, totaling $1.6 billion. This represents a 3-percent decrease from 2019 value. While the COVID-19 pandemic has negatively affected the foodservice sector, grocery retailers, especially online grocery shopping platforms, have benefited. The UK’s withdrawal from the European Union may provide opportunities for the United States to increase market share in the UK. The United States continues to be the second-largest supplier of agricultural goods, behind the combined member states of the European Union. The UK was the 12th-largest market in the world for U.S. consumer-oriented products such as wine and snack foods. The largest export growth in 2020 was seen in prepared food and dairy products, up $24 million and $23 million, respectively. Exports of soybeans were down by more than $39 million. Exports of tree nuts, feeds & fodders, and wine & beer were down $14 million, $13 million, and $13 million, respectively.
Top 10 U.S. Agricultural Exports to United Kingdom (Values in millions of dollars)
UNITED KINGDOM
Source: U.S. Census Bureau Trade Data - BICO HS-10 *Excludes soybeans
68 USDA - Foreign Agricultural Service - 2020 United States Agricultural Export Yearbook
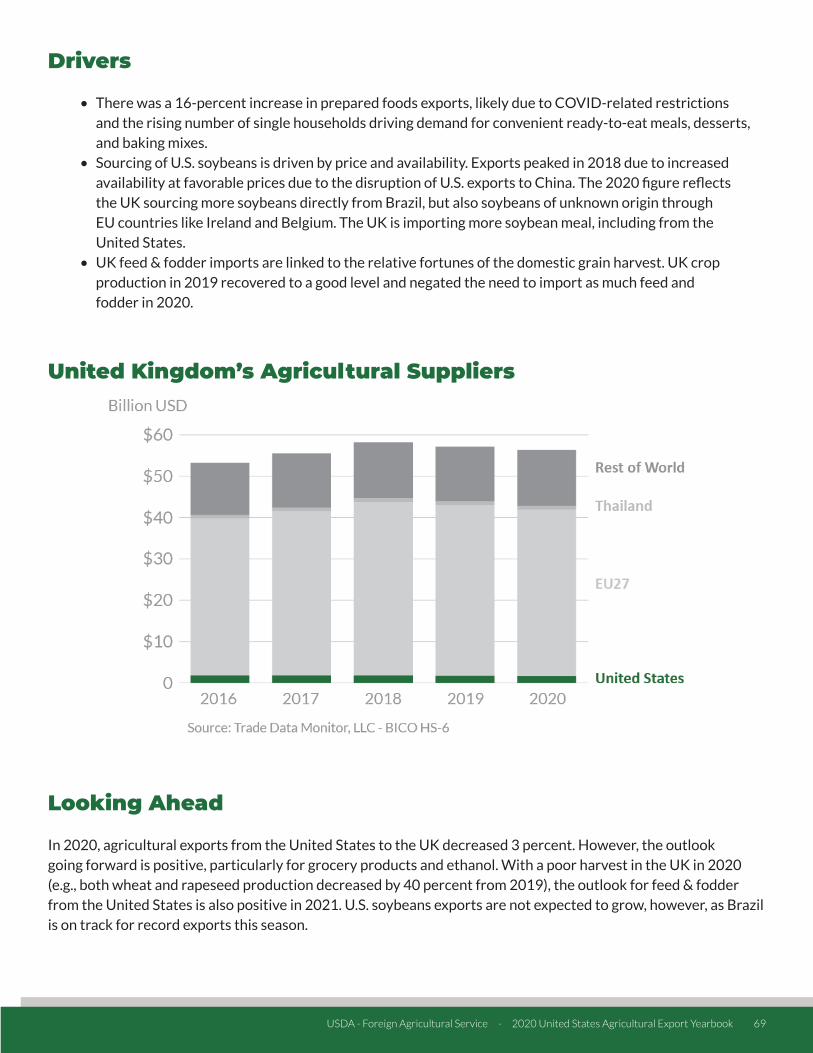
Drivers
• There was a 16-percent increase in prepared foods exports, likely due to COVID-related restrictions and the rising number of single households driving demand for convenient ready-to-eat meals, desserts, and baking mixes.
• Sourcing of U.S. soybeans is driven by price and availability. Exports peaked in 2018 due to increased availability at favorable prices due to the disruption of U.S. exports to China. The 2020 figure reflects the UK sourcing more soybeans directly from Brazil, but also soybeans of unknown origin through EU countries like Ireland and Belgium. The UK is importing more soybean meal, including from the United States.
• UK feed & fodder imports are linked to the relative fortunes of the domestic grain harvest. UK crop production in 2019 recovered to a good level and negated the need to import as much feed and fodder in 2020.
United Kingdom’s Agricultural Suppliers
Looking Ahead
In 2020, agricultural exports from the United States to the UK decreased 3 percent. However, the outlook going forward is positive, particularly for grocery products and ethanol. With a poor harvest in the UK in 2020 (e.g., both wheat and rapeseed production decreased by 40 percent from 2019), the outlook for feed & fodder from the United States is also positive in 2021. U.S. soybeans exports are not expected to grow, however, as Brazil is on track for record exports this season.
USDA - Foreign Agricultural Service - 2020 United States Agricultural Export Yearbook 69

The UK departed the European Union (EU) customs union in December 2020. As a starting point, the UK is basing its food law and import requirements on EU legislation, including the format of animal and plant export health certificates. There is still uncertainty about the approach the UK will take moving forward.
The United States and the EU will continue to be competitors in the UK market with the EU having advantages of proximity, integrated supply chains, and trade without import duties. U.S. products will face most favored nation tariffs, which for a number of products exceed 25 percent. In addition, rules of origin under the UK-EU Trade Agreement could impact the re-export of imported third country goods from the UK to the EU if insufficiently processed in the UK. This could impact U.S. products that are transshipped or packaged in the UK and continue to the EU market.
70 USDA - Foreign Agricultural Service - 2020 United States Agricultural Export Yearbook

Commodity 2016 2017 2018 2019 2020 2019-2020 % Change
2016-2020 Average
Cotton 788 1,056 1,312 1,430 1,163 -19% 1,150
Soybeans 341 288 469 262 420 60% 356
Dairy Products 120 112 145 170 185 9% 146
Tree Nuts 331 308 287 121 139 15% 237
Wheat 50 28 68 72 136 89% 71
Fresh Fruit 67 72 102 139 135 -3% 103
Poultry Meat & Products* 79 76 110 140 128 -9% 107
Prepared Food 46 44 50 117 86 -26% 69
Soybean Meal 74 75 305 195 76 -61% 145
Feeds & Fodders 71 57 77 61 62 2% 66
All Other 689 416 1,066 773 818 6% 752
Total Exported 2,656 2,532 3,991 3,480 3,348 -4% 3,201
Highlights
In 2020, Vietnam was the seventh-largest destination for U.S. agricultural exports, totaling $3.3 billion. This represents a 4-percent decline from 2019, and a 16-percent decline from a record-setting 2018. The United States is Vietnam’s second-largest supplier of agricultural goods, following China. Continued economic integration and FTA negotiations have allowed more openings for foreign products. The largest export growth from the United States to Vietnam in 2020 was in soybeans and wheat, up $158 million and $64 million, respectively. Exports of distillers’ grains, tree nuts, and dairy products also increased, by $28 million, $18 million, and $15 million, respectively. Exports of cotton were down by more than $260 million. For the first time since 2014, Vietnam was not the top destination for U.S. cotton, surpassed handily by China. Exports of soybean meal plummeted by $119 million in 2020, while prepared food shipments fell $31 million after swelling to a record high of $117 million in 2019.
Top 10 U.S. Agricultural Exports to Vietnam (Values in millions of dollars)
VIETNAM
Source: U.S. Census Bureau Trade Data - BICO HS-10 *Excludes eggs
USDA - Foreign Agricultural Service - 2020 United States Agricultural Export Yearbook 71

Drivers
• Vietnam has one of Southeast Asia’s fastest-growing economies, as well as a fast-growing middle class that has more than doubled in size since 2014.
• Vietnamese consumers continue to view U.S. food and agricultural products as safe and high quality. • Despite recording positive gross domestic product growth in 2020, the crisis caused by the COVID-19
pandemic continues to negatively affect Vietnam’s economy. The tourism and food service sectors are among the hardest hit.
• The slow recovery from an African swine fever outbreak continues to affect the agricultural sector, flattening demand for animal feed while stimulating additional demand for pork and poultry imports.
Vietnam’s Agricultural Suppliers
Looking Ahead
Despite COVID-19, Vietnam had economic growth of 2.9 percent in 2020. With a young, highly educated population and significant foreign direct investment, Vietnam is expected to recover quickly from the current global economic downturn. Relatively high tariffs and strong competition from countries benefitting from preferential trade agreements with Vietnam will constitute the most significant challenges to a diverse range of U.S. food and agricultural exports. Vietnam entered into numerous free trade agreements (FTAs) with third countries, including the Comprehensive and Progressive Agreement for Trans-Pacific Partnership, the European Union-Vietnam FTA, and the Regional Comprehensive Economic Partnership. Currently, the United States is subject to high most-favored-nation tariffs, while competitors from other markets, including China, Australia, Canada, New Zealand, and the European Union, gain greater market share as tariffs decline under their FTAs.
72 USDA - Foreign Agricultural Service - 2020 United States Agricultural Export Yearbook

As a result of significant engagement, many agricultural trade irritants with the United States have been eliminated. Vietnam improved its meat and poultry facility registration process and restarted its approval process for biotechnology products. Vietnam also granted market access for U.S. sorghum, oranges, and blueberries. The United States continues to work on market access for U.S. grapefruit, lemons, mandarin, and stone fruit.
USDA - Foreign Agricultural Service - 2020 United States Agricultural Export Yearbook 73


![USDA Foreign Agricultural Service GAIN Report · Annual Report Beijing [CH1] [CH] USDA Foreign Agricultural Service GAIN Report ... €€Yum! Brands Inc €€McDonald's Corp €€Xiao](https://img.pdfslide.net/doc/110x75/5e90655f6222961e38015440/usda-foreign-agricultural-service-gain-report-annual-report-beijing-ch1-ch-usda.jpg)


![USDA Foreign Agricultural Service GAIN Report[JA] USDA Foreign Agricultural Service GAIN Report Template Version 2.09 GAIN Report - JA7057 Page 2 of 26 UNCLASSIFIED USDA Foreign Agricultural](https://img.pdfslide.net/doc/110x75/603d02067cb26f184670b295/usda-foreign-agricultural-service-gain-report-ja-usda-foreign-agricultural-service.jpg)