Embed Size (px)
Citation preview
Business Conditions in the Midst of the Pandemic
Top Technologies in Use Onsite and Factors Impacting Wider Adoption
Top Means of Improving Safety Onsite
Owner Perspective: e-Ticketing is the Key to Improving Site Safety
2020 No. 1
F O U N D I N G PA R T N E R P L AT I N U M PA R T N E R G O L D PA R T N E R S

Message From the PublisherWelcome to the inaugural issue of The Civil Quar-terly, a unique periodic research report focused solely on heavy/civil/infrastructure design and construction.
This critical segment of the US economy employs over a million workers and spends over $300B annually on materials, tools, equipment, technology and jobsite services, while successfully completing many of our country’s largest and most complex projects with demanding schedules and challenging conditions. It is also undergoing an exciting digital transformation with innovative new tools and processes enabling improved performance and enhanced services.
Based on quarterly surveys of engineers and con-tractors by Dodge Data & Analytics, each issue will feature:
■ A rotating series of key metrics related to con-tractors’ current business conditions and perfor-mance. Early issues will establish the baselinesfor these metrics, and future issues will showhow they are responding to changing marketconditions.
■ A deeper look into major trends shaping thefuture of civil design and construction.
■ Thoughtful insights from interviews with DOTofficials and other relevant experts.
We want to thank our partners for supporting this important new venture and look forward to becom-ing a trusted source of information for you about the heavy/civil/infrastructure market.
Stephen JonesSenior Director, Industry Insights Research
Dodge Data & Analytics
Message From the Founding PartnerThe value of good data can never be overstated. Our company was born out of the need to understand vast amounts of information in order to detect collusive behavior. That was in the 1970s. Over 40 years later, statistical analysis is only part of what we do—but increasing the availability and accuracy of information is a crucial aspect of our ethos.
Insights. Integrity. Innovation. Those are the pillars that guide Infotech. This report is guided by the same overarching prin-ciples. It’s something entirely new for our industry, the first heavy/civil/infrastruc-ture report of its kind. It’s filled with insights that will empower a $300B segment to make informed decisions. There’s an old adage that says making decisions without data is like driving with your eyes closed. As data-driven technology like BIM and GIS become increas-ingly prevalent, we expect this report to con-tribute to those evolutions.
We want decision-makers and stakeholders to feel confident in their data-backed deci-sions. We want to build relationships where we inform and are informed by industry lead-ers. Above all, we want to grow our intelli-gence and understanding together.
Let’s use this data to move our industry forward, together.
Will McClavePresident of Systems
Infotech

C I V I L Q U A R T E R L Y Volume 1 1
We Want Your Feedback!What do you think about the findings and perspec-tives you see in this edition of The Civil Quarterly? What are your thoughts/hopes/concerns about the business of heavy civil con-struction? Do you have sugges-tions for what you’d like to see explored in future editions? We’d love to hear from you and will be
featuring reader com-ments and responses in future issues. Please send all comments to [email protected].
We read all feedback carefully, but may not be able to respond to each submission individually. If you pro-vide your email address, you agree that we may contact you to better understand the comments you submitted.
DODGE DATA & ANALYTICS Research and Analytics
Leadership Team
President & CEO
Dan McCarthy
Senior Vice President Custom Solutions
Tim Waal
Senior Director Innovation & Product Management
Dave DiNitto
Senior Director Industry Insights Research
Stephen Jones
Director, Industry Insights Research
Donna Laquidara-Carr, Ph.D., LEED AP
CIVIL QUARTERLY
Editor
Stephen Jones
Managing Editor
Donna Laquidara-Carr, Ph.D., LEED AP
Design Director
Pegi Goodman
Research Project Manager
Dana Gilmore, MRA, PRC
Media Contact Nicole Sullivan
AFFECT Public Relations & Social Media, 212-398-9680,
©2020 Dodge Data & Analytics34 Crosby Drive, Bedford MA 01730
1-800-591-4462
Contents
2 Data from Quarterly Survey
2 Business Conditions
7 Special Topic: Technology
15 Special Topic: Safety
18 Engineer Insights on Safety and Technology
20 Voices of the Industry Cedric Wilkinson Engineering Technician Senior Davenport Construction Office, Iowa DOT
22 A Closer Look Impacts of the COVID-19 Outbreak on Civil Construction
27 Methodology
29 Resources

2 Volume 1 C I V I L Q U A R T E R L Y
Current BacklogCurrent BacklogContractors were asked how many months of backlog they currently have and how many months of backlog that they consider ideal. The ratio of average current to average ideal backlog is 92, which means that the distribution of backlog shown in the chart at right closely approximates the ideal backlog for the civil contractors. This suggests that the pandemic has not yet had a notable negative impact on the amount of backlog. Among companies, backlog levels are nearly evenly split between those reporting six months or fewer and those reporting higher levels of backlog.
More Than 12 Months 7 Months to 12 Months 6 Months or Fewer
25%
23%
52%
BUSINESS CONDITIONS
11%
18%
28%7%
36%
Increased Significantly
Increased Somewhat
Stayed About the Same
Decreased Somewhat
Decreased Significantly
How Backlog Has ChangedSuccessful pursuit of new business is the lifeblood of every civil contractor. To track this dynamic, they were asked how their backlog has changed over the last six months.
■ 29% report an increase, with 11% characterizing it as significant.
■ This is offset, however, by over one third (35%) who cite a decline, though only a few (7%) call it significant.
Dodge will continue to track backlog as a key indicator of business health in future surveys and report on how conditions are impacting it.
Change in Backlog in Last 6 Months
Each Civil Quarterly survey takes the pulse of civil contractors about a variety of business conditions they are experiencing, from backlog, revenue and profit margins, to project performance, costs and planned investments. While this first edition estab-lishes a baseline for several of these metrics, future issues will revisit them at rele-vant intervals to highlight how market forces are impacting them.

C I V I L Q U A R T E R L Y Volume 1 3
High/Very High ConfidenceNeutralLow/No ConfidenceNot Sure
BUSINESS CONDITIONS
New Business ConfidenceEvery quarter, civil contractors will be asked to rate their confidence in the market’s abil-ity to provide new business opportunities for the next 12 and 24 months on a 10-point scale. The chart at right indicates this quarter’s results.
Over half (56%) of contractors currently have a high/very high level of confidence in the market for the next 12 months, and only 17% report a low level of confidence. This sug-gests that few heavy civil contractors expect to see a big impact on upcoming work this year due to the response to the pandemic.
The 24-month outlook is even rosier, with nearly two thirds (63%) reporting high levels of confidence.
Revenue11%
26%
11%
Profit Margin6%
22%
7%
32%28%
56%
3% 4%
22%
18%17%
14%
Next 24 Months
56%63%
3% 4%
22%18%17%14%
New Business Confidence
Next 12 Months
Projected Change in Revenue and Profit Margin in the Next 12 Months
Revenue and ProfitContractors were asked how they expect their revenues and profit mar-gins to change in the next 12 months. More expect an increase in revenue than those who expect profit mar-gins to grow. However, the share of contractors expecting a decrease in revenue is slightly larger than those expecting an increase (a 2-point dif-ference), and the 9-point gap between those more pessimistic than optimis-tic about their profit margins is even higher. This suggests that, while civil contractors are optimistic about the amount of work, they do see chal-lenges impacting their bottom lines.
Moderate DecreaseSignificant Decrease
Significant IncreaseModerate Increase
4 Volume 1 C I V I L Q U A R T E R L Y
Need for and Supply of Unskilled Workers
Need to Hire More Skilled Workers In the Next Three Months
40%
19%
60%
8%
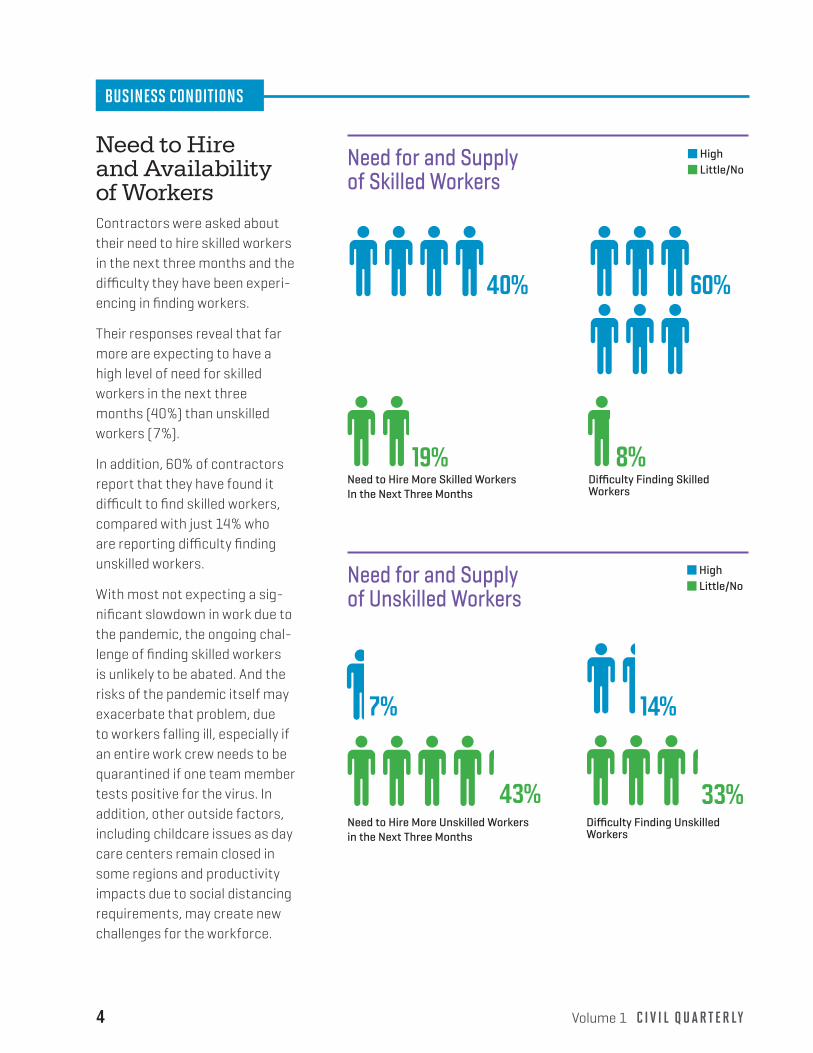
Need to Hire and Availability of WorkersContractors were asked about their need to hire skilled workers in the next three months and the difficulty they have been experi-encing in finding workers.
Their responses reveal that far more are expecting to have a high level of need for skilled workers in the next three months (40%) than unskilled workers (7%).
In addition, 60% of contractors report that they have found it difficult to find skilled workers, compared with just 14% who are reporting difficulty finding unskilled workers.
With most not expecting a sig-nificant slowdown in work due to the pandemic, the ongoing chal-lenge of finding skilled workers is unlikely to be abated. And the risks of the pandemic itself may exacerbate that problem, due to workers falling ill, especially if an entire work crew needs to be quarantined if one team member tests positive for the virus. In addition, other outside factors, including childcare issues as day care centers remain closed in some regions and productivity impacts due to social distancing requirements, may create new challenges for the workforce.
Need for and Supply of Skilled Workers
Need to Hire More Unskilled Workers in the Next Three Months
7%
43%Difficulty Finding Unskilled Workers
14%
33%
Difficulty Finding Skilled Workers
HighLittle/No
HighLittle/No
BUSINESS CONDITIONS

C I V I L Q U A R T E R L Y Volume 1 5
Types of Skilled Workers Most Difficult to FindOver half of contractors who have difficulty finding skilled workers report that the types of workers that are the most difficult to find are site/excavation/foundation workers and concrete workers. These two categories of workers are critical to many different types of heavy civil construction, from roads to water/wastewater projects, so continued shortages are likely to have a high impact on this sector as a whole.
A high percentage (40%) also cite utility workers as challenging to find.
Impacts of Skilled Worker ShortagesContractors were asked the degree to which they agree or disagree with a series of state-ments about skilled worker shortages.
The majority agree that the skill levels of the workers (79%) they encounter don’t match their needs. The impact of this is reflected in the 65% who believe that they are chal-lenged to meet schedule requirements due to a shortage of skilled workers.
Impacts on new business are also evident in the 55% who put in higher bids on their proj-ects due to worker shortages and the 41% who turn down work opportunities due to this issue.
These findings reinforce the broad impact of skilled worker shortages.
Effect of the Shortage of Skilled Workers
Workers Most Difficult to Find
Site Work/Excavation/Foundation
Mechanical
15%
Paving
51%Utility
Concrete
55%
40%
27%
We are turning down opportunities for work due
to a shortage of skilled workers.
41%11%
55%We are putting in higher bids due to a shortage of
skilled workers.
7%
65%We are challenged to
meet schedule requirements because of a shortage of skilled
workers.
16%
79%The skill levels of available
skilled workers don’t match our needs.
27%Strongly AgreeAgree
BUSINESS CONDITIONS

6 Volume 1 C I V I L Q U A R T E R L Y
Expected Change in Skills and Cost of Workers Contractors were asked whether they expect the skill levels and cost of skilled workers to improve, stay about the same or worsen over the next six months.
Most contractors already believe that skill levels are not sufficient, and the majority (60%) expect it to stay that way, with only 15% expecting it to worsen. Furthermore, over half of con-tractors expect the cost of skilled labor to increase, which may account for their concerns about profit margins even in a relatively active market. (See page 3.)
Expected Change in Skill Levels and Cost of Skilled Workers in the Next Six Months
Effect of Higher Cost of Skilled LaborAccording to contractors who think cost will increase
23%We are
turning down opportunities
for work due to increased labor
costs.
3%27%
We are losing new business oppor-tunities because
of increased labor costs.
43%We are challenged
to meet project budget requirements because of increased
labor costs.
Effect of the Higher Cost of Skilled LaborContractors who expect increases in the cost of skilled labor were asked about the degree to which they agree with statements about its impact. Nearly half (43%) report that they are challenged to meet the budget requirements as labor costs increase, which again is likely impacting their profit margins. Around one quarter are also losing new business opportunities or turning down opportunities to work due to the increased cost, which could ultimately cause the cost of projects to increase due to fewer contractors competing for projects.
Strongly AgreeAgree
SKILL LEVEL
COST
Improve
Worsen
Decrease
Increase
BUSINESS CONDITIONS
23%
6%
15%
53%
C I V I L Q U A R T E R L Y Volume 1 7
Technology Data on New Technologies Transforming Civil Construction
23%
10%
23%
15%
Utility Detection
Robotic Total
Stations
Laser Scanning/
Lidar
Mobile Mapping Systems
40%
36%
28%
28%
Use of Site Capture Technology
36% 35% 50%50%
Utility Detection
Robotic Total Stations
Laser Scanning/Lidar
Mobile Mapping Systems
Intensity of UseAverage percentage of applicable projects on which tech is used
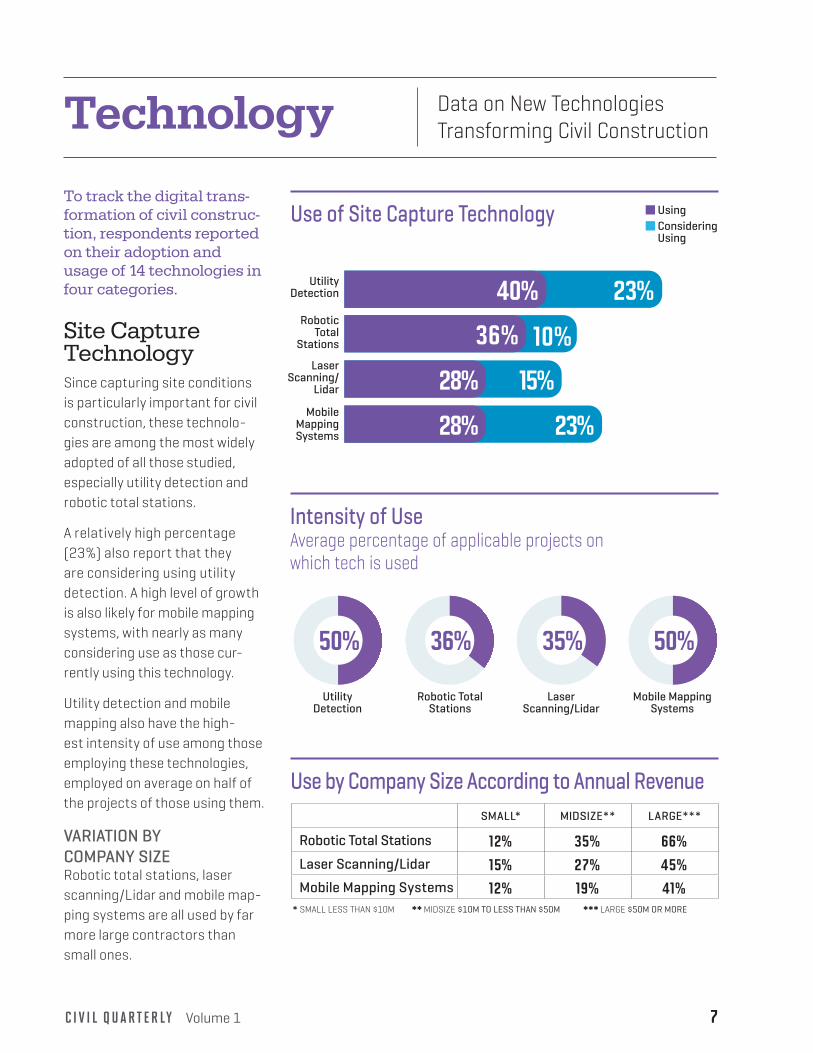
To track the digital trans-formation of civil construc-tion, respondents reported on their adoption and usage of 14 technologies in four categories.
Site Capture TechnologySince capturing site conditions is particularly important for civil construction, these technolo-gies are among the most widely adopted of all those studied, especially utility detection and robotic total stations.
A relatively high percentage (23%) also report that they are considering using utility detection. A high level of growth is also likely for mobile mapping systems, with nearly as many considering use as those cur-rently using this technology.
Utility detection and mobile mapping also have the high-est intensity of use among those employing these technologies, employed on average on half of the projects of those using them.
VARIATION BY COMPANY SIZERobotic total stations, laser scanning/Lidar and mobile map-ping systems are all used by far more large contractors than small ones.
Use by Company Size According to Annual RevenueSMALL* MIDSIZE** LARGE***
Robotic Total Stations 12% 35% 66%Laser Scanning/Lidar 15% 27% 45%Mobile Mapping Systems 12% 19% 41%
* SMALL LESS THAN $10M * * MIDSIZE $10M TO LESS THAN $50M * ** LARGE $50M OR MORE
UsingConsidering Using
8
20%
23%
15%
13%
Equipment Tagging
E-Ticketing/ Electronic Proof
of Delivery
Wearable Technologies
RFID Tagging
35%
24%
8%
14%
Use of Tracking Technology
64% 54% 57% 50%
Equipment Tagging
E-Ticketing/ Electronic Proof of
Delivery
Wearable Technologies
RFID Tagging
Intensity of UseAverage percentage of applicable projects on which tech is used
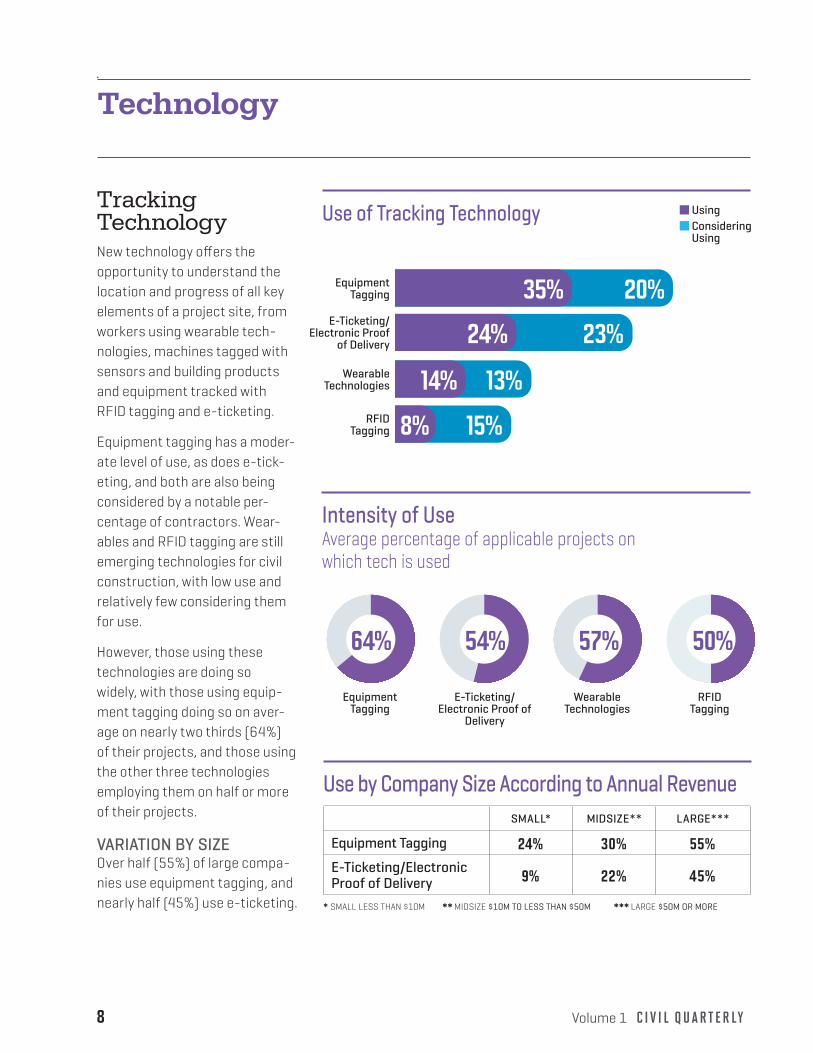
Tracking TechnologyNew technology offers the opportunity to understand the location and progress of all key elements of a project site, from workers using wearable tech-nologies, machines tagged with sensors and building products and equipment tracked with RFID tagging and e-ticketing.
Equipment tagging has a moder-ate level of use, as does e-tick-eting, and both are also being considered by a notable per-centage of contractors. Wear-ables and RFID tagging are still emerging technologies for civil construction, with low use and relatively few considering them for use.
However, those using these technologies are doing so widely, with those using equip-ment tagging doing so on aver-age on nearly two thirds (64%)of their projects, and those using the other three technologies employing them on half or more of their projects.
VARIATION BY SIZEOver half (55%) of large compa-nies use equipment tagging, and nearly half (45%) use e-ticketing.
Use by Company Size According to Annual RevenueSMALL* MIDSIZE** LARGE***
Equipment Tagging 24% 30% 55%E-Ticketing/Electronic Proof of Delivery 9% 22% 45%
* SMALL LESS THAN $10M * * MIDSIZE $10M TO LESS THAN $50M * ** LARGE $50M OR MORE
UsingConsidering Using
Technology
Volume 1 C I V I L Q U A R T E R L Y
C I V I L Q U A R T E R L Y Volume 1 9
Technology
17%
15%
11%
Drones
Machine Control
Rovers
51%
47%
28%
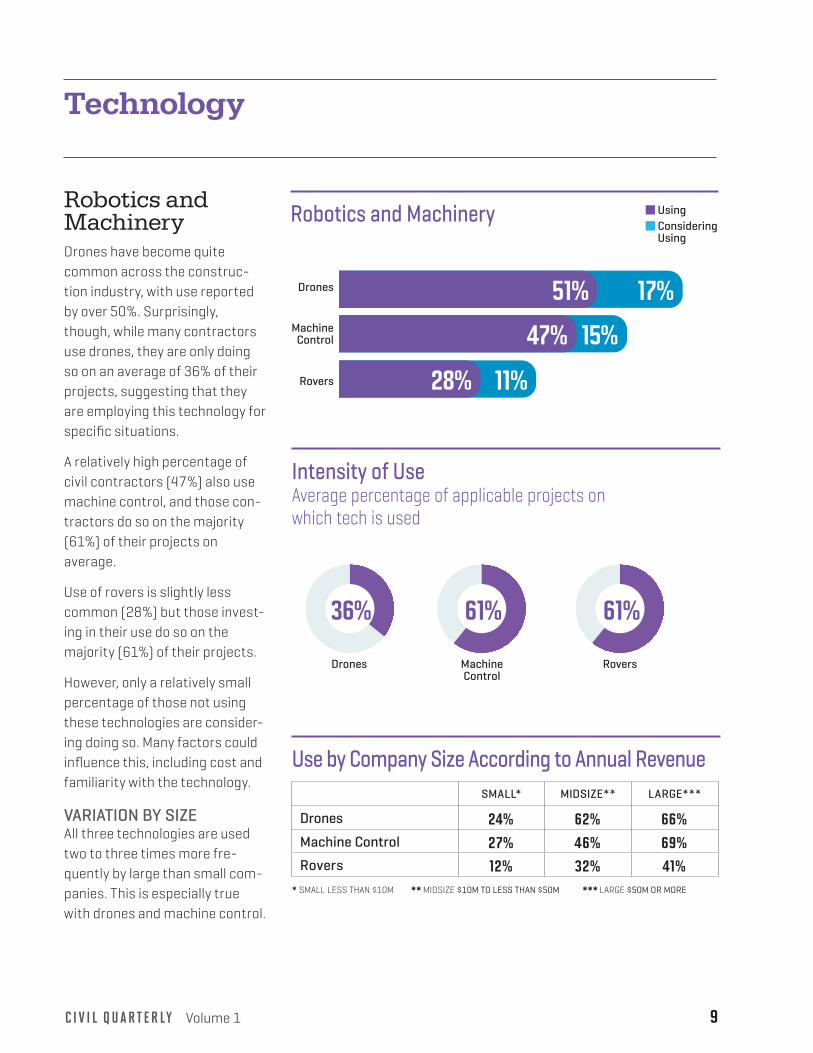
Robotics and Machinery Robotics and MachineryDrones have become quite common across the construc-tion industry, with use reported by over 50%. Surprisingly, though, while many contractors use drones, they are only doing so on an average of 36% of their projects, suggesting that they are employing this technology for specific situations.
A relatively high percentage of civil contractors (47%) also use machine control, and those con-tractors do so on the majority (61%) of their projects on average.
Use of rovers is slightly less common (28%) but those invest-ing in their use do so on the majority (61%) of their projects.
However, only a relatively small percentage of those not using these technologies are consider-ing doing so. Many factors could influence this, including cost and familiarity with the technology.
VARIATION BY SIZEAll three technologies are used two to three times more fre-quently by large than small com-panies. This is especially true with drones and machine control.
Intensity of UseAverage percentage of applicable projects on which tech is used
36% 61%
Drones Machine Control
Rovers
61%
Use by Company Size According to Annual RevenueSMALL* MIDSIZE** LARGE***
Drones 24% 62% 66%Machine Control 27% 46% 69%Rovers 12% 32% 41%
* SMALL LESS THAN $10M * * MIDSIZE $10M TO LESS THAN $50M * ** LARGE $50M OR MORE
UsingConsidering Using
10
18%
11%
14%
Ruggedized Tablets
Virtual Reality
Augmented Reality
51%
10%
Other Technologies
Intensity of UseAverage percentage of applicable projects on which tech is used
3%
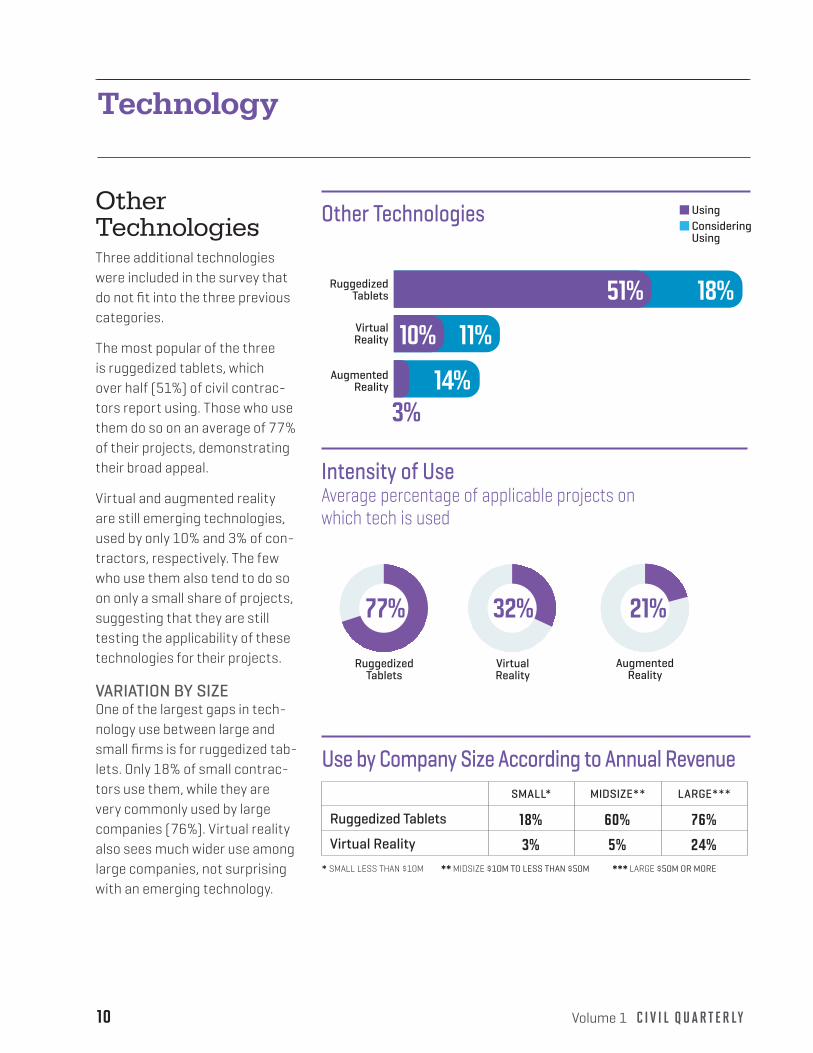
Other TechnologiesThree additional technologies were included in the survey that do not fit into the three previous categories.
The most popular of the three is ruggedized tablets, which over half (51%) of civil contrac-tors report using. Those who use them do so on an average of 77% of their projects, demonstrating their broad appeal.
Virtual and augmented reality are still emerging technologies, used by only 10% and 3% of con-tractors, respectively. The few who use them also tend to do so on only a small share of projects, suggesting that they are still testing the applicability of these technologies for their projects.
VARIATION BY SIZEOne of the largest gaps in tech-nology use between large and small firms is for ruggedized tab-lets. Only 18% of small contrac-tors use them, while they are very commonly used by large companies (76%). Virtual reality also sees much wider use among large companies, not surprising with an emerging technology.
Use by Company Size According to Annual RevenueSMALL* MIDSIZE** LARGE***
Ruggedized Tablets 18% 60% 76%Virtual Reality 3% 5% 24%
* SMALL LESS THAN $10M * * MIDSIZE $10M TO LESS THAN $50M * ** LARGE $50M OR MORE
UsingConsidering Using
77% 32% 21%
Ruggedized Tablets
Virtual Reality
Augmented Reality
Technology
Volume 1 C I V I L Q U A R T E R L Y
C I V I L Q U A R T E R L Y Volume 1 11
Technology
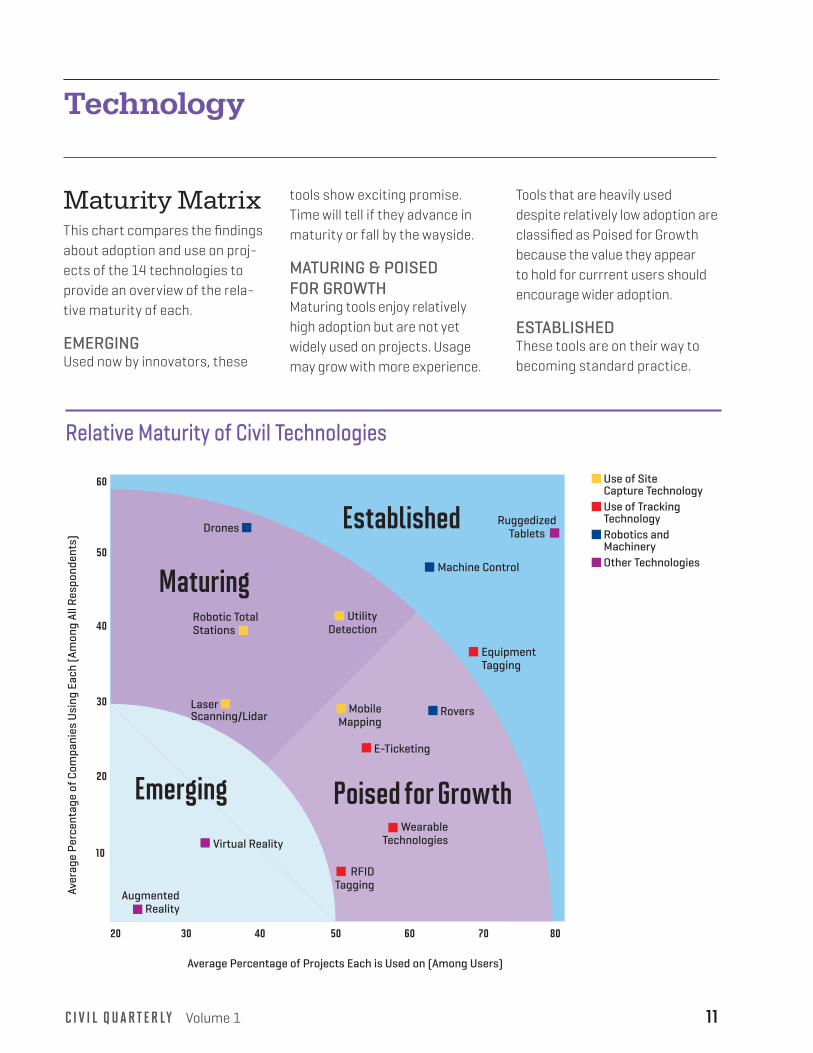
Maturity MatrixThis chart compares the findings about adoption and use on proj-ects of the 14 technologies to provide an overview of the rela-tive maturity of each.
EMERGINGUsed now by innovators, these
tools show exciting promise. Time will tell if they advance in maturity or fall by the wayside.
MATURING & POISED FOR GROWTHMaturing tools enjoy relatively high adoption but are not yet widely used on projects. Usage may grow with more experience.
Tools that are heavily used despite relatively low adoption are classified as Poised for Growth because the value they appear to hold for currrent users should encourage wider adoption.
ESTABLISHEDThese tools are on their way to becoming standard practice.
Relative Maturity of Civil Technologies
Use of Site Capture TechnologyUse of Tracking TechnologyRobotics and MachineryOther Technologies
Average Percentage of Projects Each is Used on (Among Users)
Aver
age
Perc
enta
ge o
f Com
pani
es U
sing
Eac
h (A
mon
g Al
l Res
pond
ents
)
20 30 40 50 8060 70
10
20
30
40
50
60
Ruggedized Tablets
Virtual Reality
Utility Detection
Robotic Total Stations
Laser Scanning/Lidar
Mobile Mapping
Equipment Tagging
E-Ticketing
Wearable Technologies
RFID Tagging
Drones
Machine Control
Rovers
Maturing
Poised for Growth
Established
Augmented Reality
Emerging

12
Technology
Most Important BenefitsContractors were asked to select the top three benefits they expect to receive from deploying new technologies at their sites from a list of seven options.
The most frequently identi-fied benefit is increased pro-ductivity, and it is the only one included by more than half of contractors (57%). Productivity has been a chal-lenge on construction sites for many years, and recent events in the industry dealing with the COVID-19 crisis have only exacerbated the impor-tance of this factor.
Budget and safety perfor-mance are nearly tied as the second and third most important benefits sought from deploying new tech-nology onsite. Many of the technologies included in this study, including wearables, RFID tracking, machine control, laser scanning/Lidar and mobile mapping sys-tems can all help improve productivity, budget man-agement and safety performance.
The remaining four benefits
are all considered to be among the top three by between one quar-ter and one third of contractors. The strong performance of all the benefits included underscores the high expectations that con-tractors have for the ability of new technology to improve project performance.
VARIATION BY SIZE Midsize contractors more fre-quently select increased pro-ductivity (73%) than do large contractors (38%).Gathering data for analysis is the opposite, selected more frequently by large contractors (43%) than by midsize ones (19%).
Most Important Benefits Expected From New Technologies (Selected in the Top 3)
Improved Ability to Manage Workforce Onsite 26%
Improved Ability to Win Projects28%
Better Ability to Manage Project Schedule 30%
Improved Ability to Gather Data on Projects for Analysis32%
Improved Safety Performance40%
Better Ability to Manage Project Budget 41%
Increased Productivity57%
Volume 1 C I V I L Q U A R T E R L Y

C I V I L Q U A R T E R L Y Volume 1 13
Biggest Barriers to Investing in New Technologies (Selected in the Top 3)
Biggest Barriers to New Technology AdoptionContractors selected the top three from nine possible bar-riers preventing them from investing in new technologies. Three barriers in particular are most frequently selected.
The top barrier is cost, the only one selected by more than half of the survey respondents. Contractors have small margins, and few have dedicated budgets for technology, often leading to limitations in their potential to invest, despite high expec-tations about improved proj-ect performance.
The other two major barri-ers both have to do with their workforce. They are very con-cerned about the issue of adoption of the technology in the field, and many also feel that the lack of skilled resources to manage the technology is an important barrier. This underscores the findings of other Dodge stud-ies that demonstrate that ease of use and maintenance are critical success fac-tors for construction-related technologies.
Lack of a Dedicated Innovation Budget14%
Insufficient Data on Benefits of the Technology 23%
Insufficient Knowledge of Specific Technologies to Prioritize Investment28%
Lack of Skilled Resources to Manage Technology40%
Concerns About Workforce Adoption/Use of Technology47%
Cost of Technology Is Too High56%
Not Given Direction by Project Owner2%
Lack of Leadership Support for Technology Investment10%
Concerns About Security and Privacy11%
Technology

14 Volume 1 C I V I L Q U A R T E R L Y
Technology
In addition to external barri-ers like the cost of technology, internal processes at compa-nies at the corporate and proj-ect level can be an obstacle to the successful adoption of new technology. To better under-stand which are more signifi-cant, contractors were asked to rate the degree to which pro-cesses at the corporate and project level were an obsta-cle to adoption. The chart below shows those who believe these
Procurement Process:
Corporate Level
Not an Obstacle
14%
42%
Significant Obstacle/Prevents Adoption
Implementation Process:
Corporate Level
29%
29%Implementation
Process:Project Level
42%
17% Training/User Adoption:
Project Level
9%
43%
Degree of Obstacles to Adoption of New Technologies
Internal Company Obstacles to New Technology Adoption
processes are not an obstacle and those who find them to be a serious obstacle or actually pre-vent adoption.
For most contractors, the more significant obstacles to adopt-ing new technologies lie at the project level rather than at the corporate level. Very few find the procurement process at their companies to be a nota-ble obstacle, and fewer than one third (29%) believe that the
implementation process at the corporate level provides a seri-ous barrier. On the other hand, nearly half find that implemen-tation and training at the project level are significant obstacles to technology adoption at their companies. This is not a ques-tion of resources, since large companies (52%) are more likely to find training/user adoption to be an obstacle than do small ones (21%). These findings rein-force the conclusion that tech-nologies that are intuitive and easy to use are necessary to be successful onsite.

C I V I L Q U A R T E R L Y Volume 1 15
Safety of workers and the communities impacted by civil projects are always high-priority concerns for civil contractors. Respondents reported on their safety investments, policies and processes in several categories.
Importance of Safety Investment Safety of workers and the communities impacted by civil projects are always high-priority concerns for civil contrac-tors. Respondents reported on their safety investments, policies and pro-cesses in several categories
Contractors were asked whether they had seen a change in the importance of safety investments in the last two years and whether they expected a change in the next two years.
Of course, the big change that has occurred between previous safety investments and future ones is the COVID-19 outbreak. However, despite investments in measures to prevent infection, nearly the same percent-age of contractors report that safety investments have become more/much more important in the last two years (63%) as those that expect that they will be more/much more important in the next two years (64%). This steadiness highlights the central role that improv-ing safety has played in the heavy civil sector for many years.
Safety
3%
Data: Importance and Means of Improving Safety
Change in Safety Investment in the Last Two Years
36%50%
Change in Safety Investment Expected in the Next Two Years
34%44%
Less ImportantAbout the SameMore ImportantMuch More Important
Less ImportantAbout the SameMore ImportantMuch More Important
19%
14%

16 Volume 1 C I V I L Q U A R T E R L Y
Protecting Workers
89% 77% 77% 72%
Regular Communication
About Safety With Employees
Safety Policies Based on Industry
Best Practices
Emphasis on Safety Culture
Requiring Safety Training Twice a
Year or More
Safety
47%
Tracking Safety Data Across Projects to Determine
Company Best Practices
14%
Wearable Technology*
4%
Video Tracking/AI Analysis of Worker
Behavior, Ergonomics, etc.
* Percentage reporting using wearable technology in previous question. (See page 8.)
Means to Protect WorkersContractors were asked about seven different means they use to protect workers. Among them, contractors currently place a high degree of emphasis on pro-cesses and policies to improve safety. Nearly all (89%) report that they engage in regular com-munication about safety with employees, and over 70% employ safety policies based on industry best practices, place an empha-sis on safety culture and require safety training twice a year or more.
Conversely, technology is not yet widely used to support their safety efforts. Fewer than half (47%) are tracking safety data across projects to determine company best practices, and only 14% have employed wear-able technology on their jobsites. This suggests that there is still untapped potential for technol-ogy to help contractors improve their safety performance.
Video tracking combined with AI (artificial intelligence) analy-sis is just beginning to emerge, and was included in this study for the purpose of benchmarking its progress over time.
VARIATION BY SIZEWhile the vast majority of large (83%) and midsize (76%) com-panies employ at least one of the seven means to improve safety included in the study, just over half (51%) of small com-panies do. The most significant
differences are in the empha-sis on safety culture (selected by 93% of large companies and only 64% of small compa-nies) and in tracking safety data across projects (72% of large companies versus 21% of small companies).

C I V I L Q U A R T E R L Y Volume 1 17
Protecting the Surrounding Community
62% 19% 7%
Ongoing Communica-
tion About Major Project Activity Throughout the
Project (e.g., DOT website)
Automated Equipment
Video Tracking/AI Analysis of Jobsite
for Public Safety
Protecting Equipment
51% 19% 15%
Sensors on Equipment Identifying
Location
Wearables on Employees That Identify Which Employees Are
Trained to Operate Specific Equipment
Assets
Automated Equipment
Means to Protect the CommunityContractors were asked to select any means through which they seek to protect the commu-nity surrounding their jobsites. Again, the process choice of ongoing communication about major project activity is widely used, selected by 62%. Technol-ogy options, on the other hand, are less common, with only 19% using automated equipment and only 7% using video tracking/AI analysis of the jobsite for public safety.
Means of Protecting EquipmentContractors were also asked to select any means by which they protect equipment. All three options provided involve technology, and among these, the most widely selected by contractors are the use of sen-sors on equipment identifying location. Only 19% report using wearables that identify which employees are trained to oper-ate specific equipment, and only 15% currently use automated equipment.
VARIATION BY SIZEGenerally, large companies use more means to protect equip-ment assets than do small ones, with 83% of large companies reporting using at least one of
the three options, compared with only 45% of small companies. The biggest difference is in the use of sensors on equipment, which is used by 72% of large companies but only 24% of small ones.
Safety

18 Volume 1 C I V I L Q U A R T E R L Y
Engineer Insights
In addition to the 99 heavy civil contractors taking part in the survey, 21 civil engineers also answered questions about the use of technology and safety practices on their projects, and a few trends emerge from their responses.
Use of Technology on ProjectsThe civil engineers were asked whether they are aware of the 14 technologies either in use or being considered for use on their project sites, the same 14 technologies that contractors were asked about. While for many technologies, the engineers´ responses were similar to those of the contractors, they differed notably about the level of use of five of them.
Wider Perceived Use A higher percentage of engineers than contrac-tors report the use of two of the technologies involved in site capture on their projects: robotic total stations and laser scanning/Lidar. It is important to note that they were only asked about the use of the technologies, not about which tech-nologies were specifically used by contractors. It may be that both robotic total stations and laser scanning/Lidar were used on their projects to capture site conditions before contractors join a project. These site capture technologies are also likely to have the greatest impact on the engi-neers’ designs, far more than tracking or robot-ics, so it is not surprising that they may be widely aware of their use.
Interestingly, the only other technology more widely reported by engineers in use on proj-ects than by contractors is RFID tagging. In fact,
nearly one quarter of the engineers who partici-pated reported that RFID tagging is being used on their projects, a much higher percentage than the contractors who are aware of its use.
Less Perceived UseFewer engineers report seeing use of technolo-gies that specifically relate to the equipment used by contractors onsite: machine control and equip-ment tagging. It is likely that civil engineers do not always have the opportunity to know what tech-nologies are used onsite, and these two types of technologies would impact the construction site work more than the design.
Benefits and Barriers to Technology Adoption OnsiteFor the most part, the perception of civil engi-neers of the benefits of and barriers to technology adoption onsite correspond closely to the insights of the contractors. (See pages 12 and 13 for the contractor responses.) But in each case, there is one exception to this rule.
Nearly all of the civil engineers select the improved ability to gather data on projects as one of the top benefits of technology onsite, while only one third of the contractors do. More data on projects could help engineers improve design if a sufficient feedback loop could be established.
Civil engineers appear to underestimate the chal-lenge posed by the lack of skilled resources to manage technology onsite, with about one quar-ter of the engineers reporting that this is a top barrier compared with 40% of the contractors.
Adoption of Technology and Safety Practices From the Perspective of Civil Engineers
C I V I L Q U A R T E R L Y Volume 1 19
Differences in Perceived Use of Technology Between Engineers and Contractors
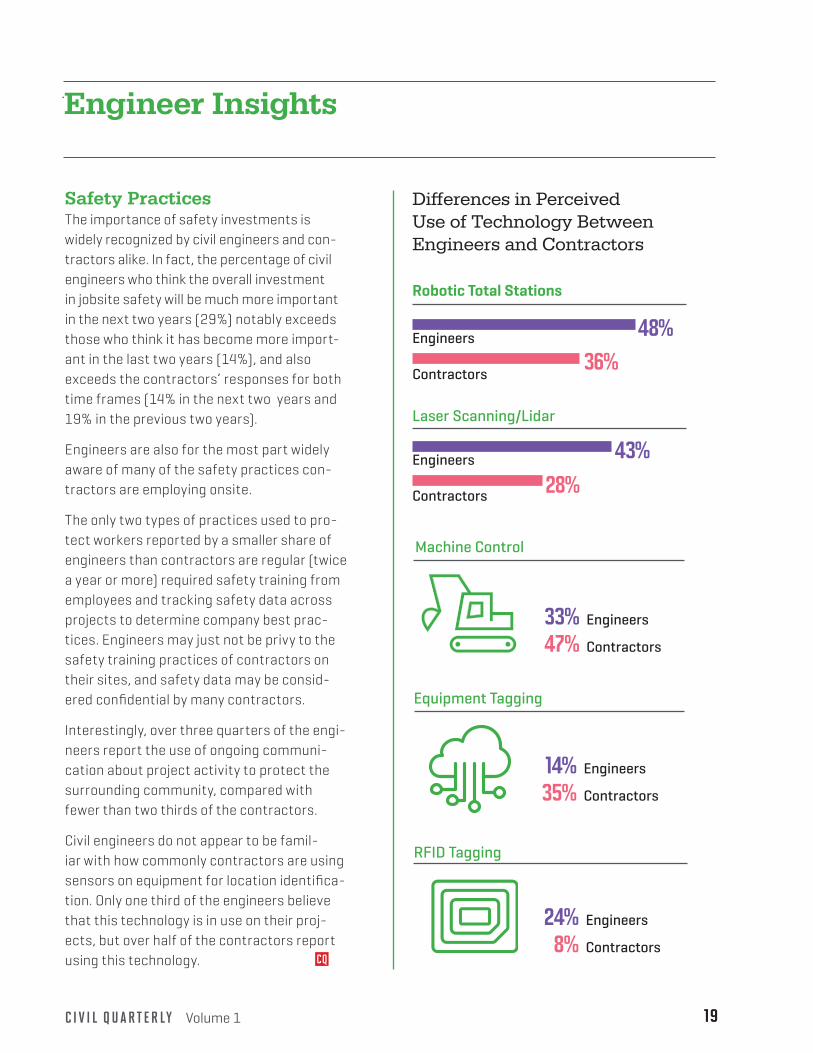
Safety PracticesThe importance of safety investments is widely recognized by civil engineers and con-tractors alike. In fact, the percentage of civil engineers who think the overall investment in jobsite safety will be much more important in the next two years (29%) notably exceeds those who think it has become more import-ant in the last two years (14%), and also exceeds the contractors’ responses for both time frames (14% in the next two years and 19% in the previous two years).
Engineers are also for the most part widely aware of many of the safety practices con-tractors are employing onsite.
The only two types of practices used to pro-tect workers reported by a smaller share of engineers than contractors are regular (twice a year or more) required safety training from employees and tracking safety data across projects to determine company best prac-tices. Engineers may just not be privy to the safety training practices of contractors on their sites, and safety data may be consid-ered confidential by many contractors.
Interestingly, over three quarters of the engi-neers report the use of ongoing communi-cation about project activity to protect the surrounding community, compared with fewer than two thirds of the contractors.
Civil engineers do not appear to be famil-iar with how commonly contractors are using sensors on equipment for location identifica-tion. Only one third of the engineers believe that this technology is in use on their proj-ects, but over half of the contractors report using this technology.
Laser Scanning/Lidar
43%28%
Engineers
Contractors
Robotic Total Stations
48%36%
Engineers
Contractors
Machine Control
33% Engineers
47% Contractors
Equipment Tagging
14% Engineers
35% Contractors
RFID Tagging
24% Engineers
8% Contractors
Engineer Insights
20 Volume 1 C I V I L Q U A R T E R L Y
Voices of the Industry
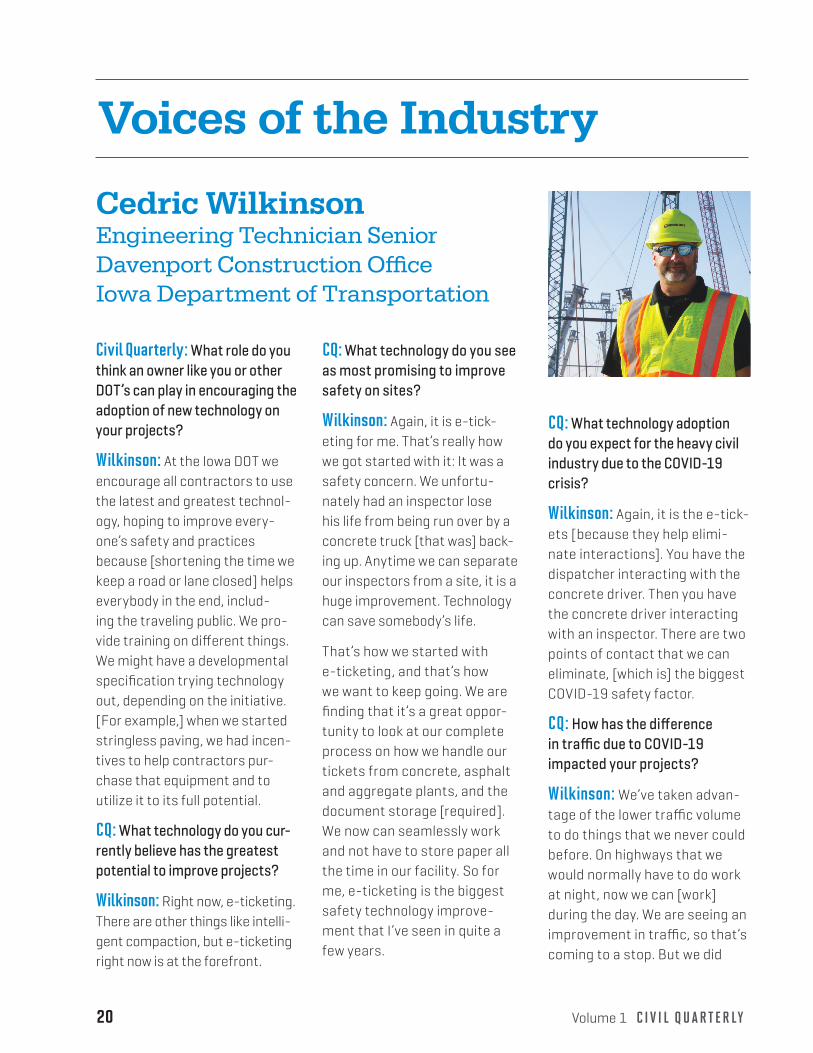
Civil Quarterly: What role do you think an owner like you or other DOT’s can play in encouraging the adoption of new technology on your projects?
Wilkinson: At the Iowa DOT we encourage all contractors to use the latest and greatest technol-ogy, hoping to improve every-one’s safety and practices because [shortening the time we keep a road or lane closed] helps everybody in the end, includ-ing the traveling public. We pro-vide training on different things. We might have a developmental specification trying technology out, depending on the initiative. [For example,] when we started stringless paving, we had incen-tives to help contractors pur-chase that equipment and to utilize it to its full potential.
CQ: What technology do you cur-rently believe has the greatest potential to improve projects?
Wilkinson: Right now, e-ticketing. There are other things like intelli-gent compaction, but e-ticketing right now is at the forefront.
Cedric Wilkinson Engineering Technician Senior Davenport Construction OfficeIowa Department of Transportation
CQ: What technology do you see as most promising to improve safety on sites?
Wilkinson: Again, it is e-tick-eting for me. That’s really how we got started with it: It was a safety concern. We unfortu-nately had an inspector lose his life from being run over by a concrete truck [that was] back-ing up. Anytime we can separate our inspectors from a site, it is a huge improvement. Technology can save somebody’s life.
That’s how we started with e-ticketing, and that’s how we want to keep going. We are finding that it’s a great oppor-tunity to look at our complete process on how we handle our tickets from concrete, asphalt and aggregate plants, and the document storage [required]. We now can seamlessly work and not have to store paper all the time in our facility. So for me, e-ticketing is the biggest safety technology improve-ment that I’ve seen in quite a few years.
CQ: What technology adoption do you expect for the heavy civil industry due to the COVID-19 crisis?
Wilkinson: Again, it is the e-tick-ets [because they help elimi-nate interactions]. You have the dispatcher interacting with the concrete driver. Then you have the concrete driver interacting with an inspector. There are two points of contact that we can eliminate, [which is] the biggest COVID-19 safety factor.
CQ: How has the difference in traffic due to COVID-19 impacted your projects?
Wilkinson: We’ve taken advan-tage of the lower traffic volume to do things that we never could before. On highways that we would normally have to do work at night, now we can [work] during the day. We are seeing an improvement in traffic, so that’s coming to a stop. But we did

C I V I L Q U A R T E R L Y Volume 1 21
take advantage of [the period with lighter traffic] to get things done when we could.
CQ: How have you seen approaches to improving safety on projects change over the last few years?
Wilkinson: It’s something we’re always talking about. In Iowa we’ve got the Move Over law where if there’s somebody on a shoulder, people are encour-aged to move over, slow down. We’ve implemented that every-body has to wear safety vests on a project. Ten years ago, that did not happen. You might have an orange T-shirt or maybe a yellow T-shirt on. But now, safety vests with reflective sheeting [are mandatory].We’ve improved our
Anytime we can
separate our
inspectors from
a site, it is a huge
improvement.
Technology can
save somebody’s
life.
messaging to the public with dynamic message boards. We’ve done a lot to alert drivers about work zones. Keeping the work-ers safe in a work zone is a No. 1 priority here at the Iowa DOT.
CQ: Has the COVID-19 crisis changed your perspective on how to consider safety on proj-ects in any other ways beyond what we’ve already discussed about e-ticketing?
Wilkinson: Yes. Thinking about [social distancing] and how can we do things differently. What do we need to interact with contractors and contractors’ employees? How do we as an agency stay at a distance? Are there ways that we can improve upon [our processes] to keep
our social distancing and not have that interaction?
CQ: Would you continue to try to minimize points of contact even after there is a vaccine or treat-ment?
Wilkinson: Yes, I think we’re finding unique ways to do that. We’re working differently, and we’re improving some aspects and we’re not on others. So some of it will go back to normal, but maybe some other things will stay [because] we have found better ways [to con-duct our interactions]. So I think it’s both. I think we really can improve [on some aspects of how we do work], and then other things pretty much need to go back to normal.
Voices of the Industry

22 Volume 1 C I V I L Q U A R T E R L Y
A Closer Look
In many ways, heavy civil con-struction has been spared many of the impacts of the COVID-19 outbreak that other industries—and even other sectors of con-struction—have experienced. However, a closer examination reveals that heavy civil projects are experiencing some impacts, and a few longer-term effects are also expected to influence the industry in the future.
Essential WorkIn many jurisdictions, heavy civil construction was declared essential work and was not halted when stay-at-home orders became prevalent. This is in sharp contrast to commer-cial construction: In a survey conducted by Dodge in April, 87% of commercial contractors reported that they were expe-riencing project delays due to COVID-19, and the average share of projects experiencing delays was about 40%, according to the Commercial Construction Index.1
In contrast, for many road proj-ects, the stay-at-home orders
1 USG+USCC Commercial Construction Index, 2nd Quarter 2020, www.construc-tion.com/toolkit/reports.
Impacts of the COVID-19 Outbreak on Civil Construction
were an opportunity. Ananth Prasad, president of the Florida Transportation Builders Associa-tion notes that in Florida, “proj-ects were accelerated because the contractors were given the ability [due to restrictions lifted by the Florida DOT] to work longer hours because there was no traffic on major roads.”
However, the declaration about what was considered essen-tial construction was not always clear in every region. Rob Cop-persmith, vice president of membership at the Michi-gan Infrastructure and Trans-portation Association (MITA), notes that in Michigan, there was a lot of confusion when the orders first came through about requirements, especially since they varied between the state and the local municipalities. For example, he describes one
contractor that worked on three projects in the same county, but the municipalities in which each were located had different safety requirements. He states that the lack of a single policy “created an administrative nightmare for a lot of our contractors initially.”
To help address the situation, MTA partnered with five other associations in the state to create a COVID-19 guidance doc-ument to help ensure that the same level of attention to health and safety protocols were taking place on all active jobsites in Michigan. They also communi-cated actively with their mem-bership, putting out a series of bulletins with clarifications to their members.
Onsite AdaptationsAnother area where the impacts of the COVID-19 outbreak differ for civil construction compared with commercial construction is the challenge presented by social distancing. In the Com-mercial Construction Index for the second quarter of 2020, 92% of contractors doing commer-cial construction report that they have changed their work procedures to increase social

C I V I L Q U A R T E R L Y Volume 1 23
distancing, and in a previous study conducted by Dodge, many contractors also stated that some of their project delays were due to the productivity impacts of these measures.
For many heavy civil projects, social distancing is not perceived to be a problem. Sharuk Khanna, director of innovation for Disney Construction, explains that “the social distancing rule of six feet didn’t really affect the work we did because that’s usually the average bubble that you keep to create a safe workspace in your own work zone anyway.” Neither Khanna, Prasad nor Coppersmith note any productivity impacts due to the need for social dis-tancing.
Heightened attention to PPE and sanitation, though, are definitely being implemented, but these merely place greater empha-sis on practices already encour-aged. Coppersmith states, “Let’s face it, there’s a reason why con-struction was allowed to work through this from the start, and it’s because we are an industry that is used to using PPE and is used to being trained on a regu-lar basis on very job-specific pro-cesses.”
Khanna believes that degree of training and reinforcement of small measures like wearing
a mask when in proximity to other workers and avoiding face touching, have a bigger impact than heavy monitoring measures like taking the temperature of workers. His safety director has been providing messages to their staff to reinforce the impor-tance of behaviors that are safer during the pandemic, Including “having a heightened sense of awareness of people around you, being a bit more diligent about not touching your face, other people or materials, and keeping higher access to gloves, masks, sanitizer, hand-washing sta-tions.” He says that not only have workers not pushed back, but he believes that, out of concern about bringing the virus home to their families, they are helping to
reinforce these behaviors on the jobsite. Rather than project man-agers enforcing these rules, he believes that those not adopt-ing these behaviors, will “only be hurting [themselves] socially within [their] group and on the jobsite because no one would want to work near [them].”
However, despite the minimal changes needed to how work is done onsite, there are still some challenges companies need to overcome to maintain social dis-tancing. Prasad points out that his organization has shared some recommendations with their members about how to safely transport workers to the jobsite. He describes a number of differ-ent ways that contractors are
“We are a good eight weeks into this, and now it is just the new normal way of doing business.” — ananth prasad, florida transportation builders association
Many companies are taking workers temperatures, but small worker behavior adjustments may be even more important in keeping workers safe.

24 Volume 1 C I V I L Q U A R T E R L Y
dealing with this challenge, from installing plexiglass to separate the driver and the passenger, to restricting how many people can be in a company vehicle at one time, to renting additional vehi-cles to add to their fleet during the crisis to prevent overcrowding.
Prasad believes the heavy civil sector is doing a good job adapt-ing to these small changes. He points out that he recently polled construction firms that represent about 11,000 to 12,000 employ-ees and in that group, only 17 or 18 positive cases of the virus had been reported. He also thinks the new measures will stay in place: “I think those practices will continue on … We are a good eight weeks into this, and now it is just the new normal way of doing business.”
Supply Chain ChallengesOne area that has had a notable impact on heavy civil construc-tion so far has been issues with the supply chain. According to Rachelle VanDeventer, vice pres-ident of public relations for MITA, people struggled in the begin-ning to find PPE, an experience that Khanna also shared. How-ever, PPE supply was not the only issue with the supply chain, especially at the beginning of the crisis. Coppersmith explains that even though their projects were
deemed essential, manufactur-ers in their supply chain did not necessarily receive that same designation. “We had concrete companies that weren’t open because their MDOT or munici-pal work wasn’t enough to justify opening a plant,” he says.
For Disney Construction, the greatest impact so far has been felt because of supply chain
issues, but not necessarily due to manufacturers being closed. He describes one instance where they had a three-week delay on a project because, due to social distancing requirements at the manufacturing facility, state officials could not enter as needed to certify a valve required on the project. They worked around it as far as they could, but he states, “ultimately, some-thing that gets held up like that becomes a critical path.”
Khanna states that for a lot of the normal commodity items they buy for their projects, “the lead times have been pushed out on average maybe 10%, 15%.” He believes that this could be due to a variety of issues, from lower
A Closer Look
Supply chain issues initially led to some delays.

C I V I L Q U A R T E R L Y Volume 1 25
staffing in manufacturing facili-ties to fewer drivers available to transport materials.
However, both Khanna and the folks from MITA believe that the industry has adjusted and that supply chain issues are getting better.
Funding for New WorkOne concern expressed by both VanDeventer and Coppersmith is whether projects will continue to be funded as revenues decline for public agencies. They regard this as a longer-term issue rather than a short-term concern, with gas tax revenues reduced and the path of recovery for the economy still not fully clear.
Prasad also expects revenue shortfalls, but because of the way that Florida funds projects, he believes the impacts will be reduced. With the fiscal year running from July to June, he expects that some projects that cannot be funded in the upcom-ing fiscal year will merely shift a few months to the summer of 2021. He says, “Most econ-omists in Florida agree that when we get into the next fiscal year, we’ll be back. It may not be back to pre-COVID levels, but we’ll be back to pretty healthy levels.” And as he points out, on
a major project, “a delay of three months letting is marginal for impacts.”
Technology Those in the industry who have invested in technologies that eliminated paper forms have seen the benefit during the COVID-19 crisis. For example, Prasad says that the Florida DOT field offices have largely gone electronic, and that their system has allowed them to process all elements dealing with paying contractors, from pay estimates to electronic fund transfers.
Khanna also notes how Dis-ney’s investment in optimizing
tools and processes electroni-cally made the transition to work at home relatively seamless. He states, “I needed to help people get the hardware they needed to set up a remote office. And that was that. There wasn’t any change in how we operated as a company because we already had shifted to the cloud, our time cards were already electronic, all of our recording was done on a cloud server through a shared program.” The only paper that was left was signing checks, and with their VPN, the accounting staff could still prep them. Their president took home a check printer so that he could sign the
“There wasn’t any change in how we operated as a company because we already had shifted to the cloud.” — sharuk khanna, disney construction
As tax revenues continue to decline, will projects be funded?

26 Volume 1 C I V I L Q U A R T E R L Y
A Closer Look
checks, and even that paper-de-pendent process was resolved with minimal disruption.
Khanna notes, though, that all companies have not benefited as well. “I know other companies really struggled because every-thing was still paper, and there was a lot of mailing that had to happen and physical pickups.”
The culture change is also a big factor that firms struggle with. Khanna has spoken with IT people who told him that this is “one of the most difficult things they’ve had to go through because what some people want to hold on to from the office just isn’t practi-cal. Not everyone needs to have a printer or a scanner in their home office. [Those are] things that a lot of people from an older gener-ation think are necessities when they are not.”
Longer-Term Change From COVID-19Khanna believes that work-ing remotely will become more widely accepted in construc-tion than it was before COVID-19, even though this industry has been resistant to it. “A lot of owners and CEOs still have the mentality that if you are in the office, that’s how you create production, because that is the mentality you have on the
jobsite. But this new world has forced us to look at it from a new perspective, which I think is better.” He believes that people are happier working from home and that this actually benefits productivity, since people can manage their lives better. He cau-tions, “Construction has one of the higher burnout rates when it comes to management … . [The experience of working remotely over an extended period] will force companies to take a long hard look at how they operate and hopefully keep that talent that would otherwise have left because they [had to work] in the office.” He believes a more flexi-ble schedule, balanced between working in the office and home,
could even have the effect of attracting new people to the industry. “You could start to bring in incredible talent that [previ-ously] wouldn’t have given con-struction a second look,” he states.
VanDeventer is more cautious about the changes she sees taking hold. She sees electronic forms becoming more common and states that “we’ve done a lot more to change to electronic communications so that we are not face-to-face." But she cau-tions, "I don’t know that is always a good thing.” She believes it will be a process of seeing what will stay or go as companies adapt to new approaches.
Working remotely may become the new normal in construction.

C I V I L Q U A R T E R L Y Volume 1 27
Dodge Data & Analytics conducted an online survey from April 20 to May 20, 2020 of contractors and engineers active in civil projects. They were drawn from several sources:
■ The DD&A Contrac-tor Panel (over 2,700 decision-makers that includes general con-tractors, construction managers, design-build-ers and trade contrac-tors)
■ The DD&A database of contractors and engi-neers
■ Outreach by Infotech, Command Alkon, Leica, University of Florida and the Transportation Research Board.
99 contractors active in civil projects responded to the survey.
■ 60% are general contrac-tors
■ 22% are non-building contractors
■ 3% are construction managers
■ 2% are design-builders
■ 13% are specialty trade contractors
Job Functions Two thirds of the contractor survey respondents are in leadership roles in their organizations, either at the project level or at the executive level. The respondents in the "other" category include business functions like marketing, business development and sales.
Location of Work Nearly all of the contractors (96%) reported that the majority of their work takes place in one of four census regions.
Estimator27%
Project Leadership (Project Manager/Project Engineer/Project Executive/Construction Manager)35%
Northeast14%
Midwest22%
South28%
West32%
Other7%
Majority of Work in More Than One Region4%
METHODOLOGY
Executive (CEO/Owner/Partner/President/Principal/Other C-Level)31%
28 Volume 1 C I V I L Q U A R T E R L Y
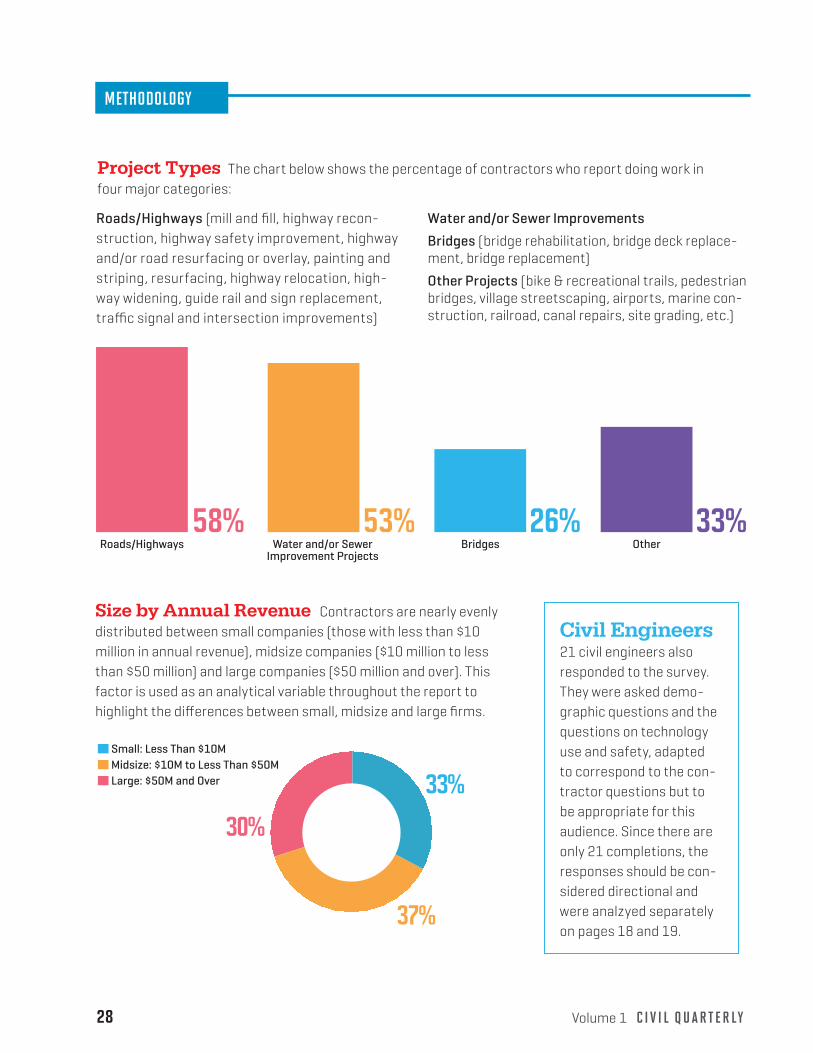
Civil Engineers 21 civil engineers also responded to the survey. They were asked demo-graphic questions and the questions on technology use and safety, adapted to correspond to the con-tractor questions but to be appropriate for this audience. Since there are only 21 completions, the responses should be con-sidered directional and were analzyed separately on pages 18 and 19.
Size by Annual Revenue Contractors are nearly evenly distributed between small companies (those with less than $10 million in annual revenue), midsize companies ($10 million to less than $50 million) and large companies ($50 million and over). This factor is used as an analytical variable throughout the report to highlight the differences between small, midsize and large firms.
Project Types The chart below shows the percentage of contractors who report doing work in four major categories:
33%
37%
30%
Small: Less Than $10MMidsize: $10M to Less Than $50MLarge: $50M and Over
33% 26% 53% 58%
Roads/Highways (mill and fill, highway recon-struction, highway safety improvement, highway and/or road resurfacing or overlay, painting and striping, resurfacing, highway relocation, high-way widening, guide rail and sign replacement, traffic signal and intersection improvements)
Roads/Highways Water and/or Sewer Improvement Projects
Bridges Other
Water and/or Sewer Improvements
Bridges (bridge rehabilitation, bridge deck replace-ment, bridge replacement)
Other Projects (bike & recreational trails, pedestrian bridges, village streetscaping, airports, marine con-struction, railroad, canal repairs, site grading, etc.)
METHODOLOGY

29
Additional Resources on the Heavy Civil Construction IndustryFOUNDING PARTNERInfotech www.infotechinc.com
PLATINUM PARTNERLeica Geosystems https://leica-geosystems.com/en-us
GOLD PARTNERSCommand Alkon http://commandalkon.com
Digital Construction Works www.digitalconstructionworks.com
RESEARCH PARTNERSTransportation Research Board (TRB) www.nationalacademies.org/trb/transportation-research-board
The University of Florida M. E. Rinker, Sr. School of Construction Management https://dcp.ufl.edu/rinker
Jobsite Tech Group https://jobsitetechgroup.com/
OTHER RESOURCESDesign-Build Institute of America https://dbia.org
FHWA Resource Center https://www.fhwa.dot.gov/resourcecenter/
AcknowledgementsWe would like to thank our founding partner, Infotech, for their vision in joining us in this effort. We would also like to thank our platinum partner, Leica Geosystems and gold partners, Command Alkon and Digital Construction Works.
We appreciate the efforts of our research partners, the University of Florida, the Transportation Research Board and Jobsite Tech Group, in helping us distribte the survey.
We thank all those who participated in interviews for sharing their insights and experience with us on critical topics impacting heavy civil construction.
We also want to thank Ron Perkins from Jobsite Tech Group for his inspirational support of the efforts to launch this publication from the start.
We Need Your Feedback!What would you like to see on this report? What trends would you like to know more about? Let us know at [email protected].
RESOURCES

About Dodge Data & Analytics Dodge Data & Analytics is North America’s leading provider of analytics and software-based workflow integration solutions for the construction industry. Building product manufacturers, architects, engineers, contractors, and service providers leverage Dodge to identify and pursue unseen growth opportunities and execute on those opportunities for enhanced business performance. Whether it’s on a local, regional or national level, Dodge makes the hidden obvious, empowering its clients to better understand their markets, uncover key relationships, size growth opportunities, and pursue those opportunities with success.
The company’s construction project information is the most comprehensive and verified in the industry. Dodge is leveraging its 100-year-old legacy of continuous innovation to help the industry meet the building challenges of the future. To learn more, visit www.construction.com.
For more information on these reports and others, visit www.construction.com/resources
Industry Insights Research on trends impacting the construction industry is featured in reports available for free at www.construction.com/toolkit/reports.