Embed Size (px)
Citation preview

Key Figures
GDP Growth (Q3 ’20) -3.49%
Inflation (y.o.y. Dec ’20) 1.68%
Credit Growth (y.o.y. Q3 ‘20) 0.89%
BI 7-Day Repo Rate (7-day, Dec ‘20) 3.75%
Current Account Balance (%GDP) (Q3 ‘20) 0.40%
IDR/USD (Dec ‘20) IDR14,094
Macroeconomic & Financial Sector Policy Research
Jahen F. Rezki, Ph.D. [email protected]
Syahda Sabrina [email protected]
Nauli A. Desdiani [email protected]
Teuku Riefky [email protected]
Amalia Cesarina [email protected]
Meila Husna [email protected]
Indonesia Economic Outlook Q1 - 2021 1
To keep you updated with our free monthly and quarterly reports, please subscribe. Scan the QR code below
or go to http://bit.ly/LPEMCommentarySubscription
Q1 - 2021
2021: A Pandemic Odyssey
Highlights
• As the pandemic persists and will not be ending in the foreseeable future, GDP
growth in Q4-2020 is expected to reach around -2.9% (estimate range from -3.1%
to -2.7%); around -2.2% to -2.1% for overall 2020.
• The gloomy economic performance has continued to the Q3-2020 with the top
four sectors of Indonesia’s economy still experienced a negative growth.
• While contributing significantly to the aggregate consumption, upper-middle class
are still accumulating their savings as uncertainty is still high.
• A slight increase in investment realization might be caused by recent series of
events, such as vaccines rollout and the favorable outcome of the U.S. election,
that triggered positive sentiment by investors.
• While the better-than-expected trade performance amidst the health crisis has
released the pressures on Indonesia’s current account balance and Rupiah, it does
not reflect the sign of recovery in real sector as imports remain under duress.
Resuming the pattern of the first half of 2020, Indonesia’s economic figure in Q3-2020 came as a disappointment to many as it was worse than expected. Recorded at -3.49% (y.o.y), the official GDP growth of Q3-2020 practically puts Indonesia in a technical recession. Observing deeper to its sectors, the top four sectors of Indonesia’s economy (i.e., manufacturing, wholesale & retail trade, construction, and mining & quarrying sectors) which accounted for more than half of the GDP, still experienced a negative growth in Q3 2020. While in the expenditure side, almost all of the GDP components contracted except the government spending. The total credit fell sharply to its lowest level in line with the slowdown in business activities and weak consumer demand. The persistent muted core inflation suggests that the the purchasing power remains weak until the end of the year. Despite the deep economic downturn due to the health crisis, Indonesia recorded eight consecutive months of trade suprluses from May to December 2020. The trade performance has released the pressures on Indonesia’s current account balance and Rupiah, where current account balance recorded surplus in Q3-2020 and Rupiah is relatively manageable until the end of the year. However, the series of trade balance surpluses does not represent a better economic outlook as it was spurred by the significant drop in imports due to weak international and domestic demand. There is no promising sign of the real sector recovery as long as the imports, which are mainly consisted of raw and capital goods, remains low.
Table 1: LPEM FEB UI GDP Growth Forecast Q4-2020 FY 2020 FY 2021
-3.1% to -2.7% -2.2%to -2.1% 4.4% to 4.8%

Indonesia Economic Outlook Q1-2021 2
Q1-2021
During the end of 2020, there were several positive news that catalyze the positive sentiments toward the prospect of the future economy, such as the favorable results of the US elections and vaccines rollout all across the globe. The excellent performance of financial markets and currencies as 2020 marching to its end somewhat gave the impression that the economy was getting better. However, as we know all too well, there is no sustained economic progress towards recovery without an improvement of the health aspects and daily cases. Indonesia’s current condition illustrates neatly this contradictory. While Rupiah and stock market index is having its best performance lately since the pandemic began, the daily cases of Covid-19 recorded are at its highest. People who are holding financial assets are reaping a fat profit while in the real sectors business are putting their best to avoid bankruptcy and the poor are struggling to meet their subsistence needs; thus, painting an ironical picture of the economic conditions. It is quite a certainty that the economy will still be under stress at least for this year; thus, we predict that the GDP growth for Q4-2020 and FY2020 will be on the negative territory. While it is still very early, it is rather safe to assume that 2021 will not be an easy ride for the global economy, including Indonesia. The economic growth is estimated to reach around -2.9% (estimate range from -3.1% to -2.7%) in Q4-2020, making the growth for FY2020 at around -2.2% to -2.1% and at 4.4% to 4.8% for FY2021.
2021 Fiscal and Monetary Challenges
2020 State Budget: Unabsorbed Stimulus due to Demand Problems The pandemic has been presenting extreme challenges for government and business across the world, including Indonesia. As the spread of Covid-19 in Indonesia persists until the beginning of 2021, it has exacerbated uncertainty in the economy. The weakened demand, coupled with disrupted supply, has carried the national economy into recession. As a result, government revenue fell sharply in 2020. On the other hand, the Government of Indonesia (GoI) has taken extraordinary measures as an immediate response to the Covid-19 pandemic, including significant changes in the 2020 state budget (APBN). The President has issued Presidential Decree 54/2020 which contained revisions to the 2020 State Budget in April, followed by Presidential Decree 72/2020 in mid-2020. In the revision, there is an adjustment in state revenue and expenditure, as well as a target deficit to be 6.34% from the previous 1.76%.
As a result of the economic downturn and stimulus provided in the form of incentives for businesses during the pandemic in 2020, tax revenues have decreased significantly. The non-tax revenues (PNBP) have also reduced due to limited activities during the implementation of social restrictions. In terms of expenditure, the GoI has not only increased but also reallocated the state budget to deal with the Covid-19 pandemic. The lower tax revenues and increases in government expenditures are expected to stabilize the economy as it will amplify household and business spending during the economic downturn. In theory, this event called to the needs of countercyclical fiscal policy which happens automatically when the economy slows because the tax payments fall and the health and social protection spending rises. But in an unprecedented

Indonesia Economic Outlook Q1-2021 3
Q1-2021
event where the sharp economic downturn appears, automatic fiscal stabilizers may be insufficient and larger fiscal stimulus may be needed. Nevertheless, the constructive impact of the fiscal stimulus will be materialized only if it is implemented and targeted in an effective and efficient manner.
Table A: Indonesia’s State Budget in 2020
Source: Ministry of Finance
However, the budget absorption has not been maximized as seen from the realization figures. This is partly due to the unabsorbed allocated budget of National Economic Recovery (Pemulihan Ekonomi Nasional/PEN) program funds for the health sector, sectoral group & local governments, and business incentives. To deal with the impact of Covid-19, the government has allocated funds through the PEN program of IDR695.2 trillion or 4.2% of Indonesia's GDP. Until the end of 2020, the realization of the PEN program had reached IDR579.78 trillion (83.45%) with the realization of support for SOEs and social protection reaching more than 100% of the allocated budget.
Figure A: National Economic Recovery Program Allocation
Figure B: National Economic Recovery Program Realization
Source: Ministry of Finance
Source: Ministry of Finance
Businesses across all economic sectors are disrupted by the Covid-19 pandemic. Some sectors are heavily contracted due to physical and social distancing, namely accommodation and food and beverages services, transportation services, construction, trade, manufacturing, and other services. To dampen the downturn in business activities, several ways have been taken by the GoI. GoI has three main focuses in helping business actors on the economic recovery agenda, namely the MSMEs support program, corporate financing, and business incentives. While the program for MSMEs is mainly established in the form of asset quality determination and credit restructuring & financing, the corporate financing stimulus is conducted purposely for helping the SOEs to operate amidst the pandemic. On the other hand, the business incentives are generated in the form of tax incentives for all taxpayers affected by the pandemic. It includes the article 21 income tax exemption, article 22 import tax exemption, article 25 income tax deduction, and VAT relaxation. Besides keeping the businesses from the risk of default, the fiscal incentives for
UU 20/2019Presidential Decree
54/2020Presidential Decree
72/2020
Budget Realization (% of Presidential Decree 72/2020)
State Revenue 2,233.2 1,760.9 1,699.9 96.1 1. Tax Revenues 1,865.7 1,462.6 1,404.5 89.3 2. Non-Tax Revenues (PNBP) 367.0 297.8 294.1 91.3 3. Grant 0.5 0.5 1.3 945.8 State Expenditures 2,540.4 2,613.8 2,739.2 94.6 1. Central Government Expenditures 1,683.5 1,851.1 1,975.2 92.5 2. Local Budget Transfer (TKDD) 856.9 762.7 763.9 99.8 Deficit (307.2) (852.9) (1,039.2) 92.0 (% of GDP) (1.76) (5.07) (6.34) (6.09) Budget Financing 307.2 852.9 1,039.2 114.6
Description(in IDR trillion)
State Budget (APBN) 2020

Indonesia Economic Outlook Q1-2021 4
Q1-2021
businesses are also designed to give a quick boost to the economy. Unfortunately, the business incentives in the form of tax incentives have not performed well enough. Until the end of 2020, the realization of the business incentives is still under 50% of the initial budget. It might reflect that the fiscal stimulus has not picked up business activities as demand is still muted.
Figure C: Net Budget Financing (SILPA) and Budget Deficit
Source: CEIC
Further, Indonesia’s remaining budget financing (SILPA) in 2020 is recorded at the highest level at IDR234.7 trillion. It has jumped four times higher than its number last year at IDR46.40 trillion. Even though the increase is in line with the more profound government budget deficit, it also shows that the budget capacity for economic recovery program has not fully utilized. To maximize the existing fund, the GoI needs to refocus on the most effective policy. As the demand is still far from a rebound, fiscal policy should focus on boosting the demand rather than giving incentives to businesses. GoI should be providing higher relief for many households, including low-income families and unemployed, that is affected by the Covid-19 pandemic. The incentive to this group is most likely to stimulate the economy as they will spend the money quickly. As yet, the realization of the health and social recovery program has performed well, but it still has a room for improvement as the GoI has high remaining budget financing. By shifting the focus from the business incentives to the health and social protection incentives, the GoI is expected to gain benefits in the short-run without hurting the budget in the long-run.
2021 State Budget: Limited Fiscal Space, More Well-Targeted Allocation is Needed
A year has passed since the first outbreak appeared in Wuhan, China. The virus has become a global threat that put many aspects in a vulnerable condition, especially the public health system, economic and business activity, and social integration and cooperation. In Indonesia, 2020 has turned into such a challenging year along with the massive spread of the virus that costs many valuable lives. As a policymaker, GoI has planned many substantial moves to maintain the economic and social balances amid the temporary halt of activities caused by the pandemic. However, the unprecedented plans such as PEN also cost an immense amount of loss reflected by a deep slump of 2020 budget deficit by -6.34% of GDP. Other than the recovery plans that need to be funded, several incentives such as tax break, on the other side, reduce the government revenue and give additional burden to 2020 budget.
In 2021 budget, it is clearly described that revenue will likely increase as well as the spending. The development of vaccine and the implementation of health protocol that may help to prevent transmission of the virus in public places are expected to gradually increase the economic and social activities. On the revenue side, the tax will be the primary source of 2021 budget with 2.8%
44.7 46.5 21.9 25.7 22.2 24.6 26.2 25.6 36.2 53.4
234.7
6.1%
0%
1%
2%
3%
4%
5%
6%
7%
0
200
400
600
800
1,000
1,200
2010 2011 2012 2013 2014 2015 2016 2017 2018 2019 2020*
IDR Trillion
Net Budget Financing (SILPA) - Left Axis Government Financing - Left Axis
Budget Deficit to GDP (Right) - Right Axis
Indonesia Economic Outlook Q1-2021 5
Q1-2021
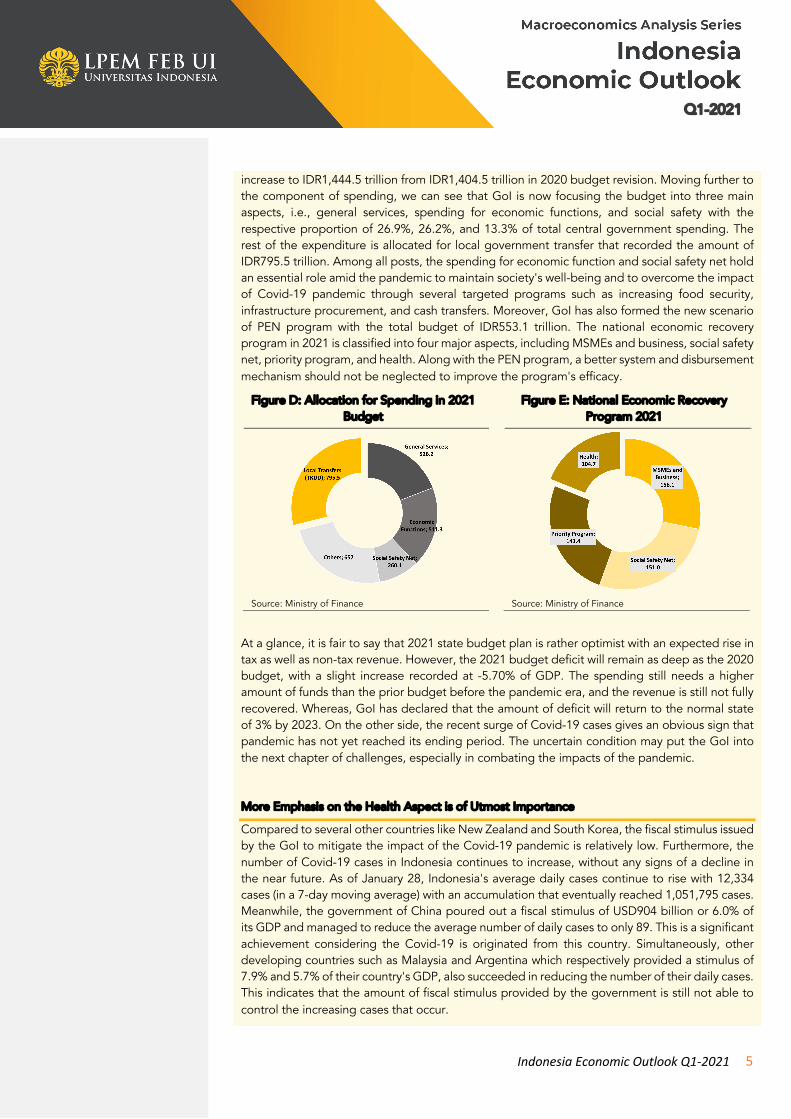
increase to IDR1,444.5 trillion from IDR1,404.5 trillion in 2020 budget revision. Moving further to the component of spending, we can see that GoI is now focusing the budget into three main aspects, i.e., general services, spending for economic functions, and social safety with the respective proportion of 26.9%, 26.2%, and 13.3% of total central government spending. The rest of the expenditure is allocated for local government transfer that recorded the amount of IDR795.5 trillion. Among all posts, the spending for economic function and social safety net hold an essential role amid the pandemic to maintain society's well-being and to overcome the impact of Covid-19 pandemic through several targeted programs such as increasing food security, infrastructure procurement, and cash transfers. Moreover, GoI has also formed the new scenario of PEN program with the total budget of IDR553.1 trillion. The national economic recovery program in 2021 is classified into four major aspects, including MSMEs and business, social safety net, priority program, and health. Along with the PEN program, a better system and disbursement mechanism should not be neglected to improve the program's efficacy.
Figure D: Allocation for Spending in 2021 Budget
Figure E: National Economic Recovery Program 2021
Source: Ministry of Finance
Source: Ministry of Finance
At a glance, it is fair to say that 2021 state budget plan is rather optimist with an expected rise in tax as well as non-tax revenue. However, the 2021 budget deficit will remain as deep as the 2020 budget, with a slight increase recorded at -5.70% of GDP. The spending still needs a higher amount of funds than the prior budget before the pandemic era, and the revenue is still not fully recovered. Whereas, GoI has declared that the amount of deficit will return to the normal state of 3% by 2023. On the other side, the recent surge of Covid-19 cases gives an obvious sign that pandemic has not yet reached its ending period. The uncertain condition may put the GoI into the next chapter of challenges, especially in combating the impacts of the pandemic.
More Emphasis on the Health Aspect is of Utmost Importance
Compared to several other countries like New Zealand and South Korea, the fiscal stimulus issued by the GoI to mitigate the impact of the Covid-19 pandemic is relatively low. Furthermore, the number of Covid-19 cases in Indonesia continues to increase, without any signs of a decline in the near future. As of January 28, Indonesia's average daily cases continue to rise with 12,334 cases (in a 7-day moving average) with an accumulation that eventually reached 1,051,795 cases. Meanwhile, the government of China poured out a fiscal stimulus of USD904 billion or 6.0% of its GDP and managed to reduce the average number of daily cases to only 89. This is a significant achievement considering the Covid-19 is originated from this country. Simultaneously, other developing countries such as Malaysia and Argentina which respectively provided a stimulus of 7.9% and 5.7% of their country's GDP, also succeeded in reducing the number of their daily cases. This indicates that the amount of fiscal stimulus provided by the government is still not able to control the increasing cases that occur.

Indonesia Economic Outlook Q1-2021 6
Q1-2021
Figure F: Comparison of Fiscal Stimulus in Response to Covid-19 Pandemic
Figure G: Comparison of Covid-19 Daily Cases (in 7-Day Moving Average)
Source: IMF Fiscal Measures Database (2021)
Source: Worldometer (2021)
As the pandemic will not reach its end-game period anytime soon, better preparation is urgently needed to prevent any sudden disturbance that may worsen the condition. Prioritizing economic aspects and social safety nets are essential, but the health system holds the key to unlock the pandemic trap. As the health sector plays an important role, maintaining and increasing the quality of health services should be in the top list of the recovery program. Looking at the figure above, we may say that our country was not in a favorable condition, in terms of the health system, to fight the sudden shock caused by the pandemic. The ratio of hospital bed over 1000 of populations shows that even the value of 1.18 exceeded the WHO standard of 1.0 in 2019, Covid-19 pandemic has shown that the availability of health facility such as hospital bed was far behind the required amount. Compared to other countries with high population density such as China, the quantity of hospital bed in Indonesia may not be a substantial endowment to face the outbreak. China, moreover, has shown a significant increase every year that on the other side also indicated that the country had increased several amounts of investment in the health sector. Not to mention one of the best-practice countries for tackling the Covid-19 outbreak, South Korea, with a more than sufficient quantity of health facility.
Figure H: Comparison of Fiscal Stimulus for Health Sector in Response to Covid-19
Pandemic
Figure I: Comparison of Hospital Bed Ratio (per 1000 populations)
Source: IMF Fiscal Measures Database (2021)
Source: Ministry of Health and WDI World Bank (2021)
Recently, GoI has allocated approximately USD5 billion, or equivalent to 0.2% of GDP, fiscal measures focusing on health sector during the pandemic era. However, looking at the figure above, the allocation is rather low compared to other countries such as China as the virus’s country origin. Moreover, compared to the similar emerging market such as India and Argentina, the percentage of health stimulus per GDP is still relatively low as the two countries recorded 0.5% and 0.3% allocation respectively. Learning from the success story of New Zealand, a country which considered succeed in tackling Covid-19 cases has poured approximately USD2.5 billion

Indonesia Economic Outlook Q1-2021 7
Q1-2021
fiscal stimulus for health sector. The nominal amount may seem lower compared the allocation in Indonesia, however, it is equivalent to 1.2% of the New Zealand GDP. If the health facility is not properly prepared, then it may take a longer period to overcome the pandemic crisis as the health sector plays as the main determinant in Covid-19 pandemic era. Such mechanism will bring nothing but another chain of catastrophe and put the fiscal capacity in risk. Focusing expenditure on health aspect as well as maintaining the disbursement system of the stimulus shall help to suppress the ongoing virus spread and overcome the current bad impact caused by the pandemic.
Not Only Real Sector, Banking Sector is Also Under Duress
Since the beginning of the pandemic, the signs of cracking fault lines are emerging within the banking sector. As the crisis brought a massive divide within the population, the middle-upper income group accumulates their savings at a rapid scale as the uncertainty is mounting and the poorest groups of population keep withdrawing their money from banks to manage meeting their subsistence and credit payment. This is reflected in the figure of deposit growth where it reaches its highest growth since 2015, as most of the banking deposit is contributed by middle-upper class savings (Figure J). However, the Covid-19 pandemic puts the economy and aggregate demand paralyzed and the business activities are putting their best to survive the current cataclysm; thus, credit growth took a nosedive and recorded its first negative growth since Asian Financial Crisis. These two combined puts heavy pressure on the banking sector as they are incapable of channeling its soaring liquidity into productive loans to the economy. Flood of liquidity in the banking sector with no productive channel to the real economy is translated into a dismal banking performance. As shown by Figure K, Loan-to-Deposit (LDR) ratio reached its lowest level in the last eight years and Net Interest Margin (NIM) reached its lowest in the last five years, hurting the profitability of the banking sector substantially.
Figure J: Credit and Deposit Growth Figure K: Banking Performance
Source: CEIC
Source: CEIC
The policymakers, specifically Ministry of Finance (MoF) and Bank Indonesia (BI), are putting their best effort to ensure the financial sector could endure the pandemic with ample liquidity by providing massive stimulus and maintaining accommodative stance. Yet, the repercussion of bloated liquidity without any fertile credit channel to the real sector is a recipe of future disaster in the banking sector. Figure L shows growth of M2/GDP and credit/GDP, which indicates that the growing liquidity during the pandemic is simply not matched by the growth of worthy projects or economic activities to lend to as the M2/GDP grew substantially higher than the credit/GDP. Another hazard stalking the banking sector is the ‘ticking bomb’ of non-performing loans (NPL). While the GoI has formulated various stimulus to ease the pressure of NPL amidst the pandemic, we still see a rising figure of NPL as the third quarter of 2020 recorded the highest average NPL since 2010 (Figure M). All in all, while banking sector might not be anyone’s priority as we are still facing a blatant challenge in the health sector and real economy, it is wise for policymakers to
-2
0
2
4
6
8
10
12
14
Jan-2018
Apr-2018
Jul-2018
Oct-2018
Jan-2019
Apr-2019
Jul-2019
Oct-2019
Jan-2020
Apr-2020
Jul-2020
Oct-2020
Credit Growth (%, y.o.y) Deposit Growth (%, y.o.y)
Beginning of the Pandemic
4.0
4.4
4.8
5.2
5.6
6.0
80
84
88
92
96
100
Jan-2016
Apr-2016
Jul-2016
Oct-2016
Jan-2017
Apr-2017
Jul-2017
Oct-2017
Jan-2018
Apr-2018
Jul-2018
Oct-2018
Jan-2019
Apr-2019
Jul-2019
Oct-2019
Jan-2020
Apr-2020
Jul-2020
Oct-2020
Loans to Deposit (LDR) Ratio, LHS (%) Net Interest Margin (NIM), RHS (%)
Beginning of the Pandemic

Indonesia Economic Outlook Q1-2021 8
Q1-2021
start laying out a strategy to ensure the risk possessed by the banking sector would not put Indonesia into another crisis once the recovery from the Covid-19 begun to take place; lest it will be too late.
Figure L: Money Growth and Credit Growth
Figure M: Total Credit and NPL
Source: CEIC
Source: CEIC
Taper Tantrum 2.0: The Risk of Asymmetric Timing of Recovery
To counteract the disruption caused by the Covid-19, the government and central banks across the world have enacted sizable fiscal and monetary stimulus measures. Many central banks worldwide such as ECB, the Fed, BoJ have imposed a bond-purchasing program known as Quantitative Easing (QE) as part of efforts to support the economy and add liquidity in the market by keeping long-term interest rates low. With suppressed bond yields and interest rates, investors have sought out riskier assets to generate returns or to meet their liabilities during this unprecedented time. As interest rates in developed economies remained low, investors were attracted to the higher yields offered in many emerging economies, including Indonesia. As long as other countries are still implementing this unconventional monetary policy and focusing vigorous economic recovery, a resurgence of portfolio will remain flow into EM countries and the exchange rate is maintained.
However, as now might be too early to talk about capital flows reversal, the age of ultra-low asset prices and flooding liquidity might push developed countries to implement tapering-policies once the recovery takes place to suppress the potential bubble in their domestic. Like its name, this action caused “tantrum” in the market underpinned by the overreaction of investors in the face of a simultaneous rise in interest rates and yields in the US. As a consequence, investors become more risk-averse and pull back their portfolios to save haven assets. The divergence in monetary policies in the US and in other countries, where the US is tightening and other countries are loosening, will cause the US dollar to continue rising against other currencies; thus, the taper tantrum occurred and became the most critical drivers of rapid currency depreciation in EM countries.
Scarred with the memory of the taper tantrum in 2013, which is proved difficult for some to shake off, the potential to repeat the same story now seems inevitable. The policymakers, specifically MoF and BI must anticipate the increasing risk of capital outflow and exchange rate pressures if the Fed or even many advanced countries' central banks all take their foot off the monetary accelerator at the same time, especially when the economy has made substantial progress supported by improvement in inflation and employment. However, what needs to be considered is that BI cannot use the same conventional tools by tightening the monetary policies. During 2013 taper tantrum, a ‘sudden stop’ and reversal of capital flows lead currencies to depreciate sharply, forcing BI to raise interest rates to stabilize the financial market. However, monetary policy tightening is a privilege and can be used to control capital outflows and high inflation
-4
0
4
8
12
16
20
Jan-2018
Apr-2018
Jul-2018
Oct-2018
Jan-2019
Apr-2019
Jul-2019
Oct-2019
Jan-2020
Apr-2020
Jul-2020
Oct-2020
M2/GDP Growth (%, y.o.y) Credit/GDP Growth (%, y.o.y)
Beginning of the Pandemic
4679
4877
5043
5208 5235
53975481
5549 5584 5582 5530
2.83
2.752.71
2.56 2.55 2.562.60
2.68
2.77
3.00
3.20
2.4
2.6
2.8
3.0
3.2
3.4
3,600
4,000
4,400
4,800
5,200
5,600
Mar-18
Jun-18Sep-18
Dec-18
Mar-19
Jun-19Sep-19
Dec-19
Mar-20
Jun-20Sep-20
IDR Trillion
Credit (LHS) NPL (RHS)
%
Indonesia Economic Outlook Q1-2021 9
Q1-2021
Prolonged Economic Dismal Until Improvement in Health Aspect
Closing the book of 2020, we have seen a crisis like never before. Covid-19 pandemic as the highlight of 2020 to some extent could be compared to the 1918 Spanish Flu, as close as it gets. However, not so many people would still be alive today to tell us the story of Spanish Flu and what lessons could be learned from it in full details; thus, leaving the world on its own to formulate and decide what’s best measure to take to solve the ongoing cataclysm. Marching into 2021, some countries (e.g., New Zealand and Vietnam) boasted that they have the crisis under control. Regardless, the new variant of Covid-19 virus is emerging and nobody could be certain how vast and long the escalation would be. This is understandable as we all failed spectacularly to estimate the impact of Covid-19 pandemic on its early days. Keeping this in mind, while it is still very early, it is rather safe to assume that 2021 will not be an easy ride for the global economy, including Indonesia.
During the end of 2020, there were several positive news that catalyze the positive sentiments toward the prospect of the future economy, such as the favorable results of the US elections and vaccines rollout all across the globe. For emerging markets, the positive global sentiments have driven their economic data into a cheerful figure as their currencies appreciated rapidly and the financial market index had its episode of showing a green color. Despite everything, the financial market figures have its
pressure only in times of robust domestic economic condition. Unfortunately, in the past Indonesia had an option to choose ‘stability over growth’ but, when the time of future economic recovery comes, Indonesia will still need fiscal and monetary expansion to support the recovery progress; any fiscal or monetary tightening would only hurt the process.
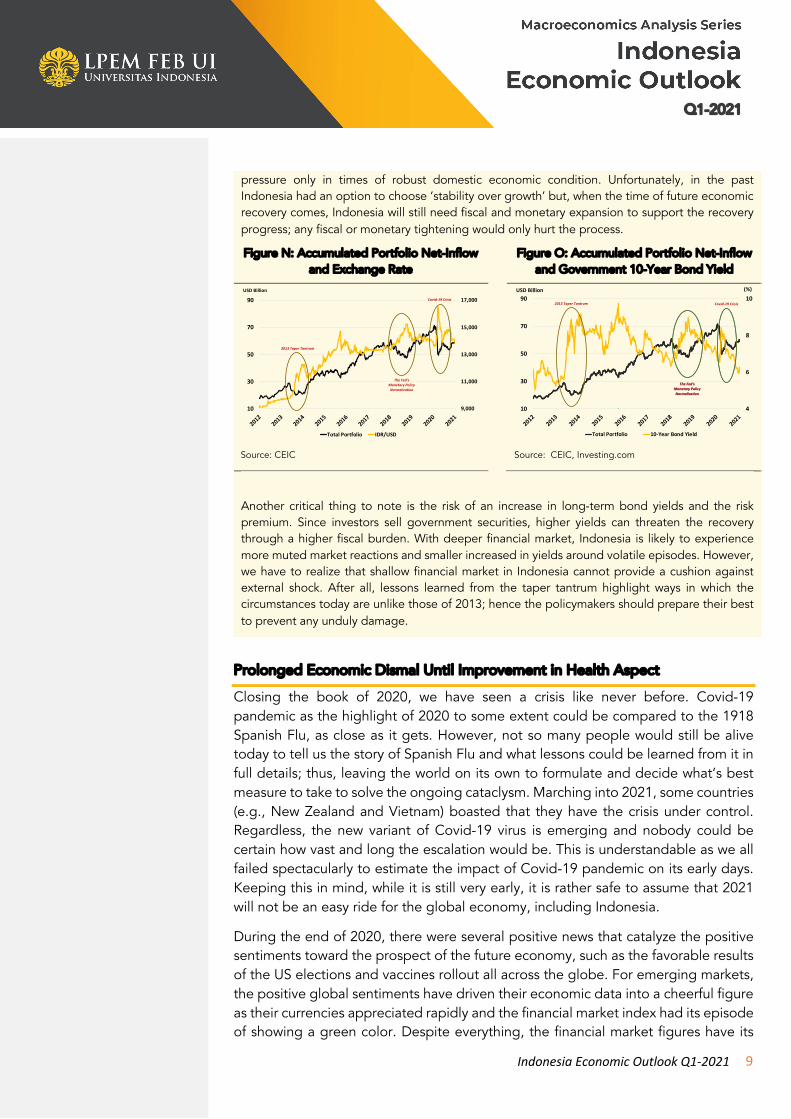
Figure N: Accumulated Portfolio Net-Inflow and Exchange Rate
Figure O: Accumulated Portfolio Net-Inflow and Government 10-Year Bond Yield
Source: CEIC
Source: CEIC, Investing.com
Another critical thing to note is the risk of an increase in long-term bond yields and the risk premium. Since investors sell government securities, higher yields can threaten the recovery through a higher fiscal burden. With deeper financial market, Indonesia is likely to experience more muted market reactions and smaller increased in yields around volatile episodes. However, we have to realize that shallow financial market in Indonesia cannot provide a cushion against external shock. After all, lessons learned from the taper tantrum highlight ways in which the circumstances today are unlike those of 2013; hence the policymakers should prepare their best to prevent any unduly damage.
9,000
11,000
13,000
15,000
17,000
10
30
50
70
90
2012
2013
2014
2015
2016
2017
2018
2019
2020
2021
USD Billion
Total Portfolio IDR/USD
2013 Taper Tantrum
Covid-19 Crisis
The Fed's Monetary Policy Normalization
4
6
8
10
10
30
50
70
90
2012
2013
2014
2015
2016
2017
2018
2019
2020
2021
USD Billion
Total Portfolio 10-Year Bond Yield
The Fed's Monetary Policy Normalization
2013 Taper Tantrum Covid-19 Crisis
The Fed's Monetary Policy Normalization
(%)

Indonesia Economic Outlook Q1-2021 10
Q1-2021
“One way the current crisis is different from the previous economic crisis of Indonesia is in its nature that harms not only the supply side, but also the demand side.”
semblance to mislead people to get an objective grasp of how the economy is really doing. The excellent performance of financial markets and currencies as 2020 marching to its end somewhat gave the impression that the economy was getting better. However, as we know all too well, there is no sustained economic progress towards recovery without an improvement of the health aspects and daily cases. Indonesia’s current condition illustrates neatly this contradictory. While Rupiah and stock market index is having its best performance lately since the pandemic began, the daily cases of Covid-19 recorded are at its highest. People who are holding financial assets are reaping a fat profit while in the real sectors business are putting their best to avoid bankruptcy and the poor are struggling to meet their subsistence needs; thus, painting an ironical picture of the economic conditions.
Figure 1: Growth of GDP and the Main Industries, 2016-2020Q3
Figure 2: Growth of Manufacturing Sector and Its Subsectors, 2016-2020Q3
Source: CEIC
Source: CEIC
One way the current crisis is different from the previous economic crisis of Indonesia is in its nature that harms not only the supply side, but also the demand side. Considering the 1998 Asian Financial Crisis, Indonesia was hit severely especially on the supply side, while the demand side was maintaining its feet rather firmly. Looking at the current situation, Covid-19 forces the economy and people to keep their operations and mobility to its minimum level to contain the spread of the pandemic. The implication being is that the businesses are operating sub-optimally, often forcing them to be out of business. Furthermore, lower-middle class are dissaving to maintain their basic needs while the upper-middle class are delaying their consumption and stockpiling their saving as they couldn’t spend their income on leisure and productive use which contributes a big share on the Indonesia’s aggregate consumption. This condition is reflected in the Indonesia’s economic figure of Q3-2020 as the continuation of gloomy economic performance since the first quarter of 2020. Resuming the pattern of the first half of 2020, Indonesia’s GDP growth in Q3 came as a disappointment to many as it was worse than expected. Recorded at -3.49% (y.o.y), the official GDP growth of Q3 practically puts Indonesia in a technical recession. Observing deeper to its sectors, the top four sectors of Indonesia’s economy (e.g. manufacturing, wholesale & retail trade, construction, and mining & quarrying sectors) which accounted for more than half of the GDP, still experienced a negative growth in Q3 2020. On the other hand, agriculture, forestry
Indonesia Economic Outlook Q1-2021 11
Q1-2021
“12 from 16 of manufacturing subsectors grew negatively, with the transport equipment was taking the hardest hit.”
and fisheries sector somewhat kept growing positively in Q3 2020, recorded at 2.15% (y.o.y), even higher than the previous two quarters as if untouched by the pandemic. Furthermore, ICT and human health & work activity sectors unsurprisingly recorded a double-digit growth in Q3 2020 of 10.61% (y.o.y) and 15.33% (y.o.y), consecutively.
Accounted for the biggest sector with the contribution of more than a fifth of Indonesia’s economy, manufacturing sector performed worse than the overall economy in Q3 2020. Recorded at -4.31% (y.o.y), manufacturing sector is at its lowest level of growth in history. 12 from 16 of manufacturing subsectors grew negatively, with the transport equipment was taking the hardest hit. As social mobility is kept to its minimum and economic activity is halted, transport equipment shrank almost a third of the previous quarter’s output, with the growth of -29.98% (y.o.y) in Q3 2020. Another subsector which recorded a double-digit negative growth is machinery and equipment, with the growth of -10.76% (y.o.y) which depress further from the growth of -13.42% (y.o.y) in the previous quarter as the production activities are muted. On the other hand, the two biggest subsectors of manufacturing industry grew positively. Food & beverages subsector, as the biggest subsector in the industry, recorded a growth of 0.66% (y.o.y) which is slightly higher than the previous quarter’s growth of 0.22% (y.o.y). Furthermore, chemicals, pharmaceutical & traditional medicine subsector were going strong as it grew massively. Recorded a double-digit growth of 14.96% (y.o.y) in Q3 2020, significantly higher than Q2 2020 of 8.65% (y.o.y), this subsector experienced its highest growth in the last eight years as the demand for pharmaceutical and medicine products is higher than ever due to the shadowing risk of catching the virus.
The transmission from a large-scale social restriction (PSBB) era to the new-normal phase in Q3-2020 contributed substantially to the wholesale and retail trade sector. Looking at the wholesale and retail trade sector, a rather good performance was shown by a -5.33% (y.o.y) growth in Q3-2020 compared to -7.58% (y.o.y) in Q2-2020. However, as the pandemic has not been prolonged, most people are still choosing to restrain their consumption along with the continuity of uncertain condition brought by the pandemic. As a result, negative growth was yet recorded in the regarding sector, which by means, the sector was still suffering from the pandemic impacts. Although the value was still considered as a deep fall to the wholesale and retail trade sector, a gradual increase proved that the economic activity would likely get better along with the implementation of health protocol that has increased the intensity of people’s mobilization. Looking further into the component of wholesale and retail sector, both motor and non-motor vehicle recorded negative growth of -18.10% (y.o.y) and -2.38% (y.o.y), respectively. Compared to the growth in Q2-2020, motor vehicle subsector showed a better performance than non-motor vehicle by approximately 21.77% (q.o.q) increase. However, given the proportion of motor vehicle to the wholesale and retail trade sector, the hefty amount of increase failed to transform the value into a favorable growth to the overall sector.

Indonesia Economic Outlook Q1-2021 12
Q1-2021
“As the PSBB had slowly been lifted in Q3-2020, the economic activities began to operate—under the health protocol measures.”
As the PSBB had slowly been lifted in Q3-2020, the economic activities began to operate—under the health protocol measures. Regarding the transportation and storage sector, Q3-2020 brought many positive impacts through the implementation of new-normal practices that resulted in a better sectoral performance. Although the regarding sector was still considered as the main loser in Q3-2020, with negative growth of -16.60% (y.o.y), the gradual increase of transportation and storage activities escalated the growth from the deep-fall of -30.76% (y.o.y) in preceding quarter. Other than the implementation of new-normal practices, more approachable tests for Covid-19 such as PCR and antigen also supported the increasing performance of transportation and storage sector as the tests have become the primary requirement before and after the trip. Looking more in-depth to the subsector of transportation and storage, the main driver of the negative value was air transport subsector that grew only -63.66% (y.o.y), followed by railways transportation with -51.10% (y.o.y) growth. Although a relatively small proportion compared to the other subsectors, the hefty amount of contraction succeeded to pull the performance of the overall sector downwards. However, the respective value of air and railways transport, on the other hand, showed a noteworthy performance compared to the growth in Q2-2020 that recorded at -80.12% (y.o.y) and -63.73% (y.o.y). Drew the same pattern, a notable increase in road and sea transport with the respective growth of -5.03% (y.o.y) and -5.27% (y.o.y) also maintained the performance of transportation and storage sector compared to -17.65% (y.o.y) and -17.48% (y.o.y) growth in Q2-2020. The new-normal practices were successfully affecting the transportation and storage sector with a sign of positive impacts.
The impact of Covid-19 pandemic continued in Q3-2020 with the negative growth that recorded in almost all sectors. However, compared to Q2-2020, the overall GDP performance drew a slightly better performance. As the transition of new-normal practices had barely begun and gradually lifted the large-scale social restriction, several sectors experienced a slight increase. The increasing intensity of people’s mobilization supported by several factors such as business re-opening and accessible test for Covid-19 positively affected the regarding sectors. On the other side, certain sectors were still enjoying a notable growth during the pandemic era. Continuing the trend of the previous quarters, the ICT sector recorded considerably
Figure 3: Growth of Wholesale and Retail Trade and Its Subsectors, 2016-2020Q3
Figure 4: Growth of Transport and Its Major Subsectors, 2016-2020Q3
Source: CEIC
Source: CEIC

Indonesia Economic Outlook Q1-2021 13
Q1-2021
“Some large sectors of the economy, notably food and consumer goods suffered much less as they tend to be essential.”
high growth of 10.41% (y.o.y). As the pandemic has not yet finished, the need for ICT sector will remain high along with the online learning and online working practices that replaced the face-to-face physical interactions. Summarizing the overall performance of economic growth in Q3-2020, it is fair to say that the implication of new-normal protocol effectively affected the operation of business and economics activities. However, as the pandemic is still around, it is worth to note that the transmission risk of the virus may be higher along with the rising performance of social mobility. The enforcement of health protocol during the new-normal period should be more intensive as we don’t expect any sudden hike of Covid-19 daily cases.
Keep the Wheels of Economic Recovery Turning
The prolonged economic disruption resulting from the Covid-19 pandemic led to lower consumer and business confidence and decreased personal spending across a broad range of categories, with spillover effects for a multitude of other sectors. Firms and several institutions, including schools and offices, take proactive measures to avoid infection by operating at below capacity and implementing a distance learning or working. Business closures whether through government bans or business decisions, resulting in lost wages for workers in many cases, especially in the informal economy where there is no paid leave; consequently, households have less income to spend. On the other side, although the government has slowly lifted PSBB restriction, upper-middle-income people are still reluctant to spend their money to the market, travel, going out to the public spaces, and other social activities as the transmission risk of the virus remain high. The impact of this pandemic was fully reflected in the expenditure side, where almost all of the GDP components contracted except the government spending, which grew 9.76% (y.o.y) driven by the rapid stimulus through the high realization of social assistance and government incentives for businesses. Meanwhile, the household consumption and investment contribute to more than 80% of GDP, shrank -4.04% and -6.48% (y.o.y) respectively.
Some large sectors of the economy, notably food and consumer goods suffered much less as they tend to be essential and purchasing these goods can also be done safely at home through delivery services and sometimes does not involve a high risk of infection. It can be seen from a slight improvement in the consumption of food and beverages in Q3-2020 to -0.69% from -0.89% (y.o.y) in the previous quarter, albeit still in contraction when compared to its figure last year. However, other sectors, such as non-essential goods, luxury goods, and restaurants were hit hard with the highest sharp decline recorded in transportation & communication followed by restaurant & hotel consumption, which contracted by -11.56% and -10.9% (y.o.y), making the respective overall growth until Q3-2020 to -9.32% and -8.19% (y.o.y).
When observing the investment component, the short-term economic impacts can translate into reductions in long-term growth. As people reduce social activities, the

Indonesia Economic Outlook Q1-2021 14
Q1-2021
“…economic growth will continue to improve in Q4-2020 in line with the easing of the social restriction, increased mobility during the year-end holiday period, the impact of the increased realization of fiscal stimulus, and improvement in the global economy.”
government and the private sector invest less in physical infrastructure, seen in the sharp contraction in investment in buildings & structures. Moreover, the decline in the capital goods’ demand due to a halt in production in almost all sectors as well as the disruption in the global supply chain contributed to a declining demand on investment in machinery & equipment as well as investment in vehicles.
Figure 5: Growth of Household Consumption and its Components, 2016-
2020Q3
Figure 6: Growth rate of Investment and its Main Components, 2016-2020Q3
Source: CEIC
Source: CEIC
Despite significant annual negative growth of -3.49% (y.o.y) which technically put Indonesia into first economic recession since the 1998 Asian financial crisis, Indonesia’s economy grew positively on a quarterly basis by 5.05% (q.o.q) in Q3-2020, indicated a sign of recovery. We also predict that economic growth will continue to improve in Q4-2020 in line with the easing of the social restriction, increased mobility during the year-end holiday period, the impact of the increased realization of fiscal stimulus, and improvement in the global economy. In 2021, GoI has allocated the new scenario of PEN program with a total budget of IDR553.1 trillion. With a much lower budget than the previous year of IDR695.2 trillion, GoI should better have a robust and swift strategy in 2021 to spend the budget effectively in order to revive the economy. Besides, the newly passed Job Creation Law is expected to push those many millions of informal enterprises and workers into the formal sector, thereby giving them some basic health and legal protection. With such an effort to improve investment and business climate, the law becomes an essential step towards increasing investment, especially to accelerate economic recovery when the Covid-19 ends. All in all, GoI still needs to focus on the implementation of stimulus packages to the social safety net, health aspects, and support for SOEs and business sectors, in particular, to prevent those who have lost their jobs from falling into poverty and to saving businesses that are at the brink of bankruptcy, while continuing several containment and mitigation measures of the Covid-19 pandemic for the economy to fully rebound from its dismal growth last year.
The Covid-19 pandemic has weakened global demand and is increasingly disrupting domestic economic activity. Looking deeper into credit performance, the total credit
-4.46
-2.70
-12.60
2.71
-15.34
-16 -12 -8 -4 0 4 8 12 16 20
Gross Fixed Capital Formation
Buildings & Structures
Machine & Equipment
Cultivated Resources
Vehicles
20162017201820192020
Weight in 2020Q3
100
74.7
9.7
6.8
4.9

Indonesia Economic Outlook Q1-2021 15
Q1-2021
“Most consumers are still concerned about the uncertainties; therefore, the upper-middle-class income prefers to save their money in the bank instead of spending it.”
fell sharply to its lowest level at 0.89% (y.o.y) in line with the slowdown in business activities and weak consumer demand. This figure is much lower than 8.68% annual growth recorded in the same quarter in 2019. Most consumers are still concerned about the uncertainties; therefore, the upper-middle-class income prefers to save their money in the bank instead of spending it. Besides, businesses also decide to delay their expansion plans which causes their idle funds to increase and opt to save their money; hence there is no demand of productive loans supported by the lowest level of the working capital loan with negative growth seen at -1.42% (y.o.y). The continuing decline was also seen in consumption and investment loans, which slowed to 1.08% and 4.83% in Q3-2020 from 2.89% and 7.16% in the previous quarter, respectively.
Figure 7: Shares of GDP Components, 2015Q1-2020Q3 (%)
Figure 8: Credit Growth by Purposes, 2016Q1-2020Q3 (y.o.y, %)
Source: CEIC
Source: CEIC
All in all, we estimate the credit growth will still be muted in Q4-2020 despite the back of low-interest rates as the demand is still weak. We also expect the credit may gradually improve this year with the ongoing accommodative monetary stance taken by BI to ensure there is sufficient liquidity in the market. With the lowest policy rate in history at 3.75%, the transmission of lower lending rates is expected to expand credit growth once the economy and demand started to rebound. On the other hand, BI has identified six priority sectors for which banks should disburse their credit, namely the food and beverage industry; the chemical, pharmaceutical, traditional medicine industries; forestry and logging; horticultural crops; plantation crops; and metal ore mining. These sectors have a low risk of default and make a considerable contribution to Indonesia's GDP and exports. The strategy of providing credit to these sectors is expected to accelerate productive loans.
A Year of Muted Economic Activity: The Lowest Inflation Rate in History
The annual figure of 2020 inflation rate is recorded at 1.68% (y.o.y) in December which is the lowest level of inflation in history. It is decreased significantly from 2.59% (y.o.y) in 2019 due to the sluggish economic activity during 2020. However, the increasing price of food, beverages, and tobacco drives the overall December’s

Indonesia Economic Outlook Q1-2021 16
Q1-2021
“The annual figure of 2020 inflation rate is recorded at 1.68% (y.o.y) which is the lowest level of inflation in history.”
inflation to rise for the fifth consecutive month to 1.68% (y.o.y) compared 1.59% (y.o.y) in the previous month. On a monthly basis, it is recorded at 0.45% (mom), which is the highest level in 2020. This can be seen from both the annual and monthly volatile food inflation that is respectively recorded at 3.62% (y.o.y) and 2.17% (mom). Several food commodities that experienced an increase in prices in December 2020 include chilies, eggs, purebred chicken, fresh fish, tomatoes, oranges, and cooking oil.
On the other hand, the declining trend of core inflation continues for the ninth consecutive month in December as the annual rate decelerated to 1.60% (y.o.y) and 0.05% (mom) compared to 1.67% (y.o.y) in the previous month and 0.12% (mom) in the same month last year. A conflicting trend of headline and core inflation might suggest that the upward inflationary pressure was not driven by an improvement in purchasing power and instead contributed by other components. Even though the volatile food products contribute positively, a lower inflation figure or even deflation is also recorded at other price components, such as transportation, ICT, and financial services. All in all, December concludes a year of muted economic activity as overall inflation for FY2020 fell below BI’s target range of 3%±1.
Figure 9: Inflation Rate (%, y.o.y) Figure 10: Inflation Rate (%, mom)
Source: CEIC
Source: CEIC
Positive Investors’ Sentiment Began to Appear
The Indonesian Investment Coordinating Board (BKPM) recorded a 1.6% increase in FDI and DDI realization in Q4-2020. This improvement was mainly contributed by an increasing foreign investment at 2.3% (y.o.y), while the realization of domestic investment slightly improved by 0.8%. This might be caused by recent series of events, such as vaccines rollout and the favorable outcome of the U.S. election, that triggered positive sentiment from investors to invest in primary and secondary sectors. The sectors that experienced an increase in foreign investment include construction; machinery and electronic industry; paper and printing industry; and pharmaceutical industry. Meanwhile, there has not been any improvement in the hotel and restaurant industry because of the extended social restriction policy and the potential surging cases of Covid-19.

Indonesia Economic Outlook Q1-2021 17
Q1-2021
“As imports mainly consist of raw and capital goods, the lower number of imports reflects the reduction in business production activities. There is no promising sign of the real sector recovery as long as the import remains low”
Figure 11: FDI and Domestic Investment (Nominal)
Figure 12: FDI Realization by Sectors (Nominal)
Source: CEIC
Source: CEIC
Structural Reforms to Boost Export
Despite the deep economic downturn due to the health crisis, Indonesia recorded eight consecutive months of international trade surpluses from May to December 2020. Exports in December has jumped 14% (y.o.y) compared to its figure last year, while imports declined by 0.5% (y.o.y). The better-than-expected trade performance amidst the Covid-19 pandemic has released the pressures on Indonesia’s current account balance and Rupiah. The Current Account Deficit (CAD) is reported at the narrowest level in Q2-2020, the figure is even improving in the Q3-2020 with the current account surplus at US$1 billion or 0.4% of GDP. The surplus in the current account is mainly driven by the goods trade surpluses, particularly non-oil and gas products, as the imports remain weak during the pandemic. In line with the surpluses in trade and current account, capital account balance has also jumped into the surplus territory from its deficit level as the demand for Indonesia’s assets are still robust. The positive figures of current account and capital account have provided BI with an ample room in maintaining Rupiah. As a result, Rupiah is relatively manageable until the end of the year with the depreciation rate at around 1.1% (ytd).
Figure 13: Monthly Trade Balance (Nominal) (Dec’15-Dec’20)
Figure 14: Exchange Rate and Accumulated Short-Term Capital Inflow
(Jan‘18-Dec’20)
Source: CEIC
Source: CEIC
-2.5
-1.5
-0.5
0.5
1.5
2.5
3.5
Dec-16 Jun-17 Dec-17 Jun-18 Dec-18 Jun-19 Dec-19 Jun-20 Dec-20
USD bn
TB: Oil and Gas TB: Non-Oil and Gas Trade Balance (TB)

Indonesia Economic Outlook Q1-2021 18
Q1-2021
“Nevertheless, GoI should prepare for the worst possible outcomes by designing and implementing robust monetary and fiscal policies while continuing several containment and mitigation measurements of the Covid-19 pandemic”
However, the series of surpluses in trade balance does not represent a better economic outlook as the trade surpluses in 2020 were spurred by a significant drop in imports due to weak international and domestic demand. From the annual growth, imports are dropped by 25% (y.o.y) and exports are declined by 9% (y.o.y) compared to their figures in 2019. As imports mainly consist of raw and capital goods, the lower number of imports reflects reduced business production activities. There is no promising sign of the real sector recovery as long as the import remains low. Further, the composition of Indonesia’s exports and imports are relatively unchanged until the end of the year. Exports are still dominated by mineral resources, vegetable fat, and precious metals, while the electronics and machinery products are the highest contributor to imports. The industrial chemicals products are also still the third-highest imported products by Indonesia from foreign countries as the high demand for medical supplies and equipment during the Covid-19 pandemic. The high domination of commodity goods in our exports brings a limited effect from exports to economic condition as the major exported products have a relatively low value-added. Indonesia’s exports still also face high uncertainty due to the volatility of commodity prices. To boost economic growth sooner, GoI and businesses should play an active role in finding the current world demand for essential products such as food, textile, and health-related. Also, GoI needs to prepare the strategy for shifting our exports to higher value-added products.
Figure 15: Indonesia Export Profile (Nov-Dec2020)
Figure 16: Indonesia Import Profile (Nov-Dec2020)
Source: CEIC
Source: CEIC
Another action Indonesia can take to support economic growth from its exports is the analysis of the competitiveness of our exports. GoI and business should be fully-aware with the international market, such as the implementation of trade restrictions between countries. The in-depth analysis and investigation of the current trade measures and remedies between Indonesia and other countries are critically needed as any barriers would hold back our exports. Further, Indonesia’s exports activities are well-known with the higher cost of freight and logistic compared to other peers. The logistic cost is still one of the barriers for starting the business in Indonesia due to the weak national infrastructure. To accelerate exports in the long-run, GoI needs to focus on reducing the freight and logistic cost for businesses. Despite the trade

Indonesia Economic Outlook Q1-2021 19
Q1-2021
figure in 2021 will highly depend on the recovery period of the health crisis, the list of takeaways to boost the economy above needs to be implemented sooner. Nevertheless, GoI should prepare for the worst possible outcomes by designing and implementing robust monetary and fiscal policies while continuing several containment and mitigation measurements of the Covid-19 pandemic.