Embed Size (px)
Citation preview
PRIVILEGED/CONFIDENTIAL INFORMATION OF EDUCATIONDYNAMICS, LLCCopyright © 2021 EducationDynamics, LLC. All Rights Reserved.
2021 & BeyondAttracting and Serving Two-Year
Post-Traditional Students

Carol AslanianFounder and President,
Aslanian Market Research
Steven FischerSenior Manager, Market
Research
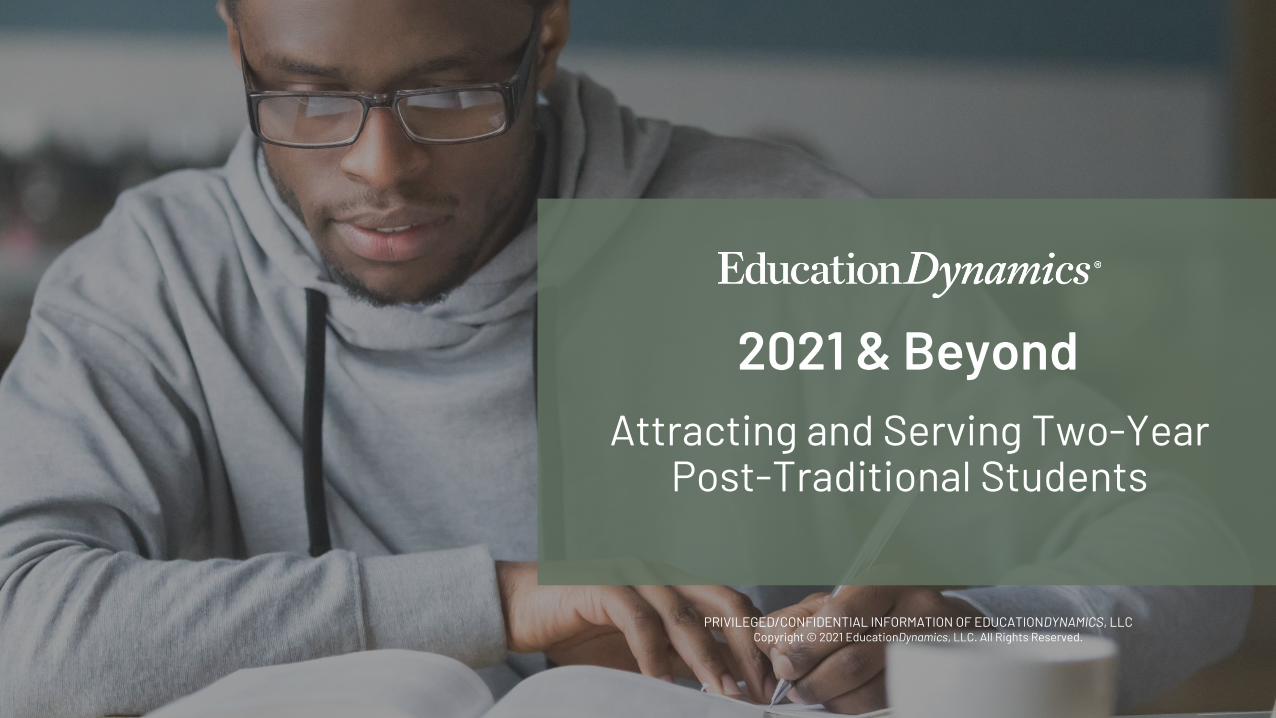
Here to Help PAID DIGITAL
Paid SearchPaid Social
Online DisplayDigital Retargeting
Organic Search& Social
Search Engine OptimizationContent Marketing
UXOrganic Social Media
CREATIVEPersona Development
Video ProductionDesign
Copywriting
OUTREACHEmail Marketing
SMSRingless Voicemail
Digital Media
AWARENESS MEDIA PLACEMENT
OTTTelevision
OutdoorRadio
INQUIRY GENERATIONConsumer Portals
ClicksContact Center
Affiliate Management
3
A snapshotof some of the services we offer that help our partners evolve.
STRATEGIC SUPPORTPrimary ResearchProgram Viability
Institutional AssessmentsConsulting
ENROLLMENT MANAGEMENTQualification
NurturingEnrollmentConsulting
ANALYTICSGlassPanel
TestingBenchmarking
Customized Reporting
3
PRIVILEGED/CONFIDENTIAL INFORMATION OF EDUCATIONDYNAMICS, LLCCopyright © 2021 EducationDynamics, LLC. All Rights Reserved.
College Education Trends
PRIVILEGED/CONFIDENTIAL INFORMATION OF EDUCATIONDYNAMICS, LLCCopyright © 2021 EducationDynamics, LLC. All Rights Reserved.
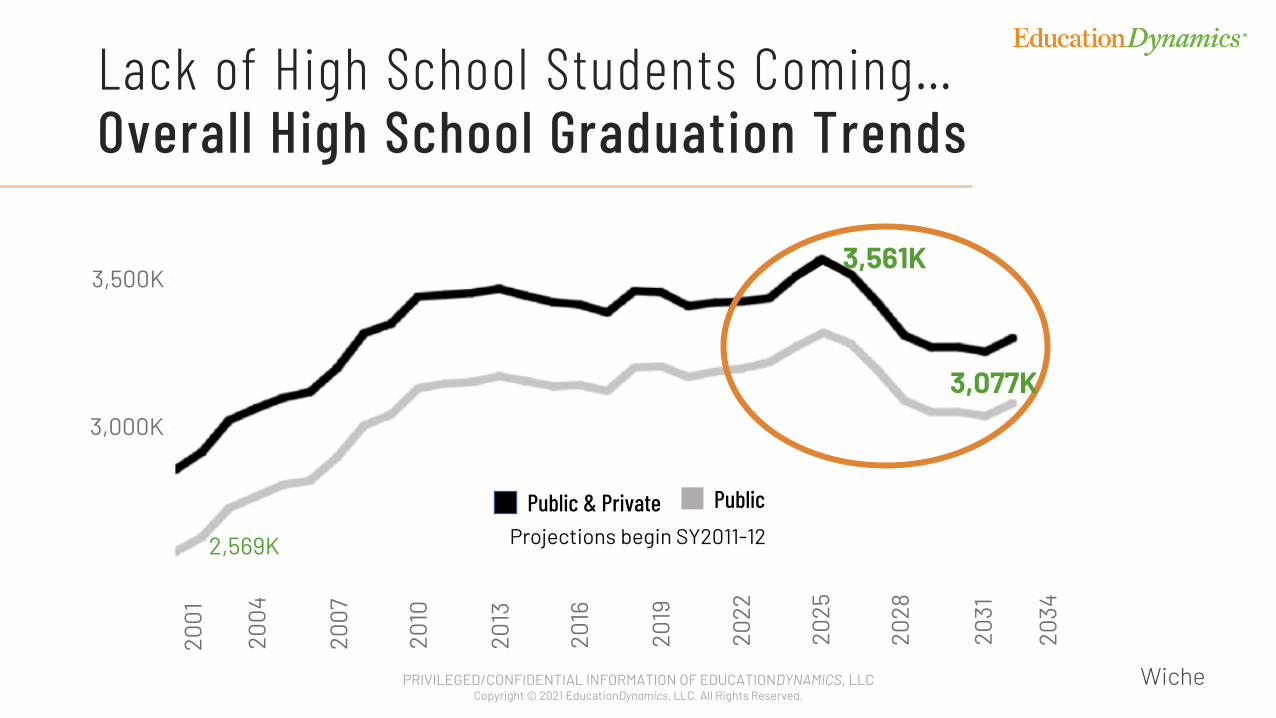
Lack of High School Students Coming…Overall High School Graduation Trends
Wiche
3,561K
3,077K
Public & Private Public
Projections begin SY2011-122,569K
2001
2004
2007
2010
2013
2016
2019
2022
2025
2028
2031
2034
3,500K
3,000K
PRIVILEGED/CONFIDENTIAL INFORMATION OF EDUCATIONDYNAMICS, LLCCopyright © 2021 EducationDynamics, LLC. All Rights Reserved.
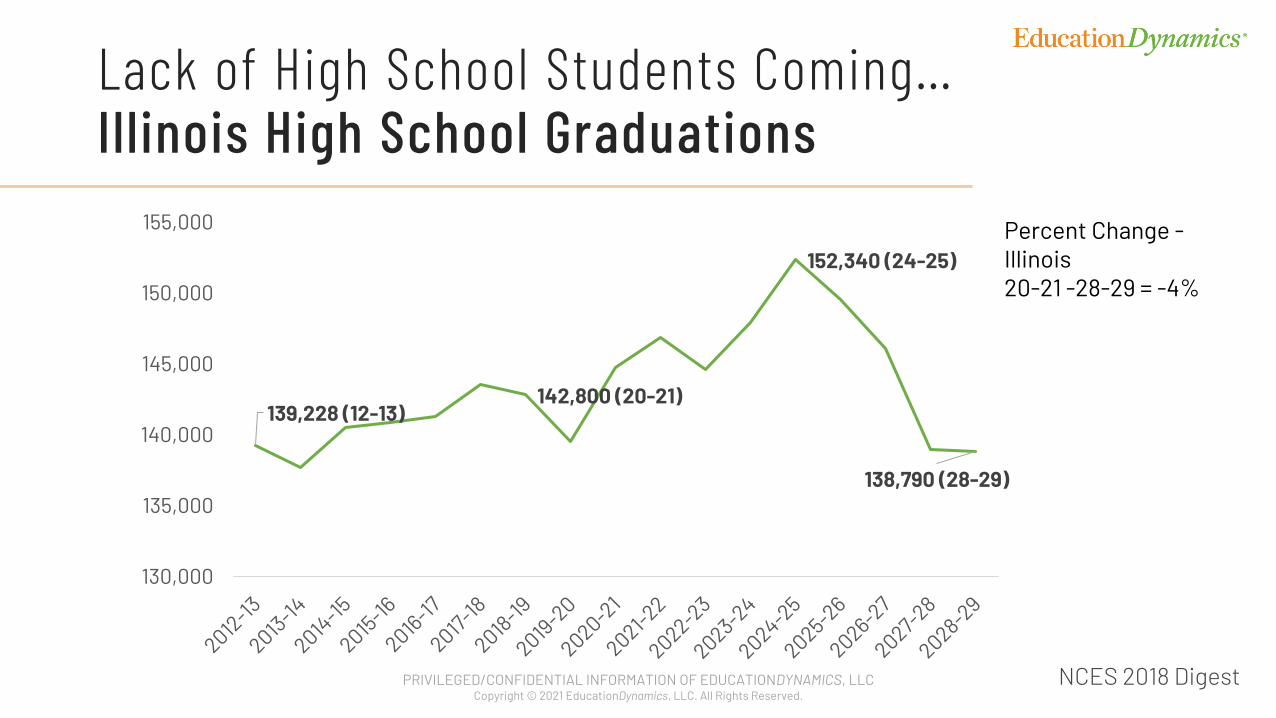
Lack of High School Students Coming…Illinois High School Graduations
NCES 2018 Digest
139,228 (12-13)142,800 (20-21)
152,340 (24-25)
138,790 (28-29)
130,000
135,000
140,000
145,000
150,000
155,000 Percent Change -Illinois20-21 -28-29 = -4%
PRIVILEGED/CONFIDENTIAL INFORMATION OF EDUCATIONDYNAMICS, LLCCopyright © 2021 EducationDynamics, LLC. All Rights Reserved.
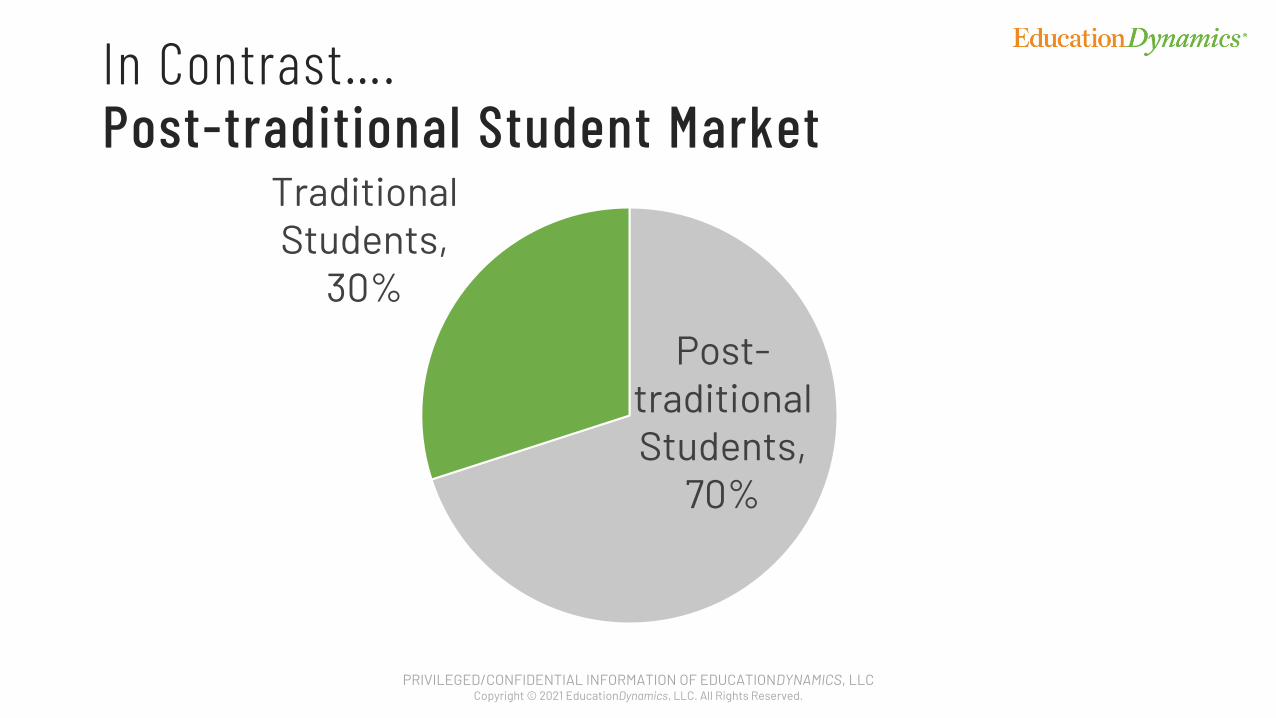
In Contrast…. Post-traditional Student Market
Post-traditional Students,
70%
Traditional Students,
30%
88PRIVILEGED/CONFIDENTIAL INFORMATION OF EDUCATIONDYNAMICS, LLCCopyright © 2021 EducationDynamics, LLC. All Rights Reserved.
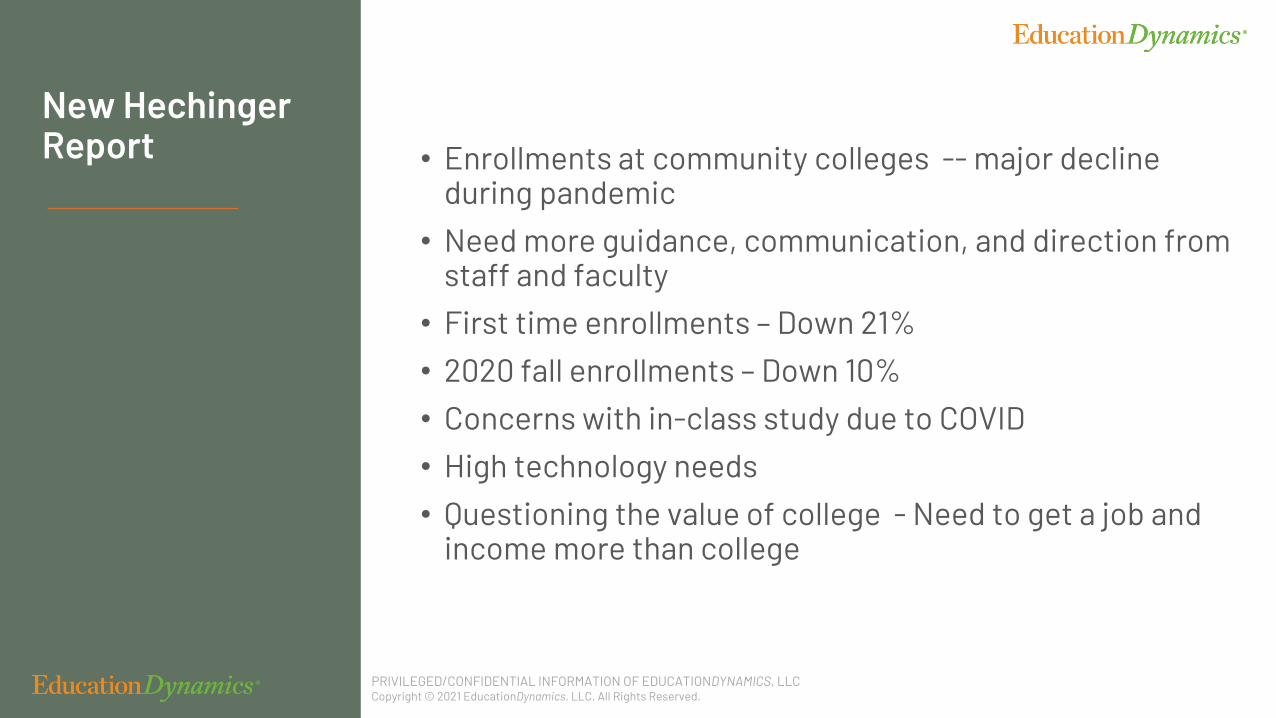
New Hechinger Report • Enrollments at community colleges -- major decline
during pandemic • Need more guidance, communication, and direction from
staff and faculty• First time enrollments – Down 21%• 2020 fall enrollments – Down 10%• Concerns with in-class study due to COVID• High technology needs• Questioning the value of college - Need to get a job and
income more than college
PRIVILEGED/CONFIDENTIAL INFORMATION OF EDUCATIONDYNAMICS, LLCCopyright © 2021 EducationDynamics, LLC. All Rights Reserved.
Post-Traditional Students 2020

Illinois and National Job Posting Trends
PRIVILEGED/CONFIDENTIAL INFORMATION OF EDUCATIONDYNAMICS, LLCCopyright © 2021 EducationDynamics, LLC. All Rights Reserved.
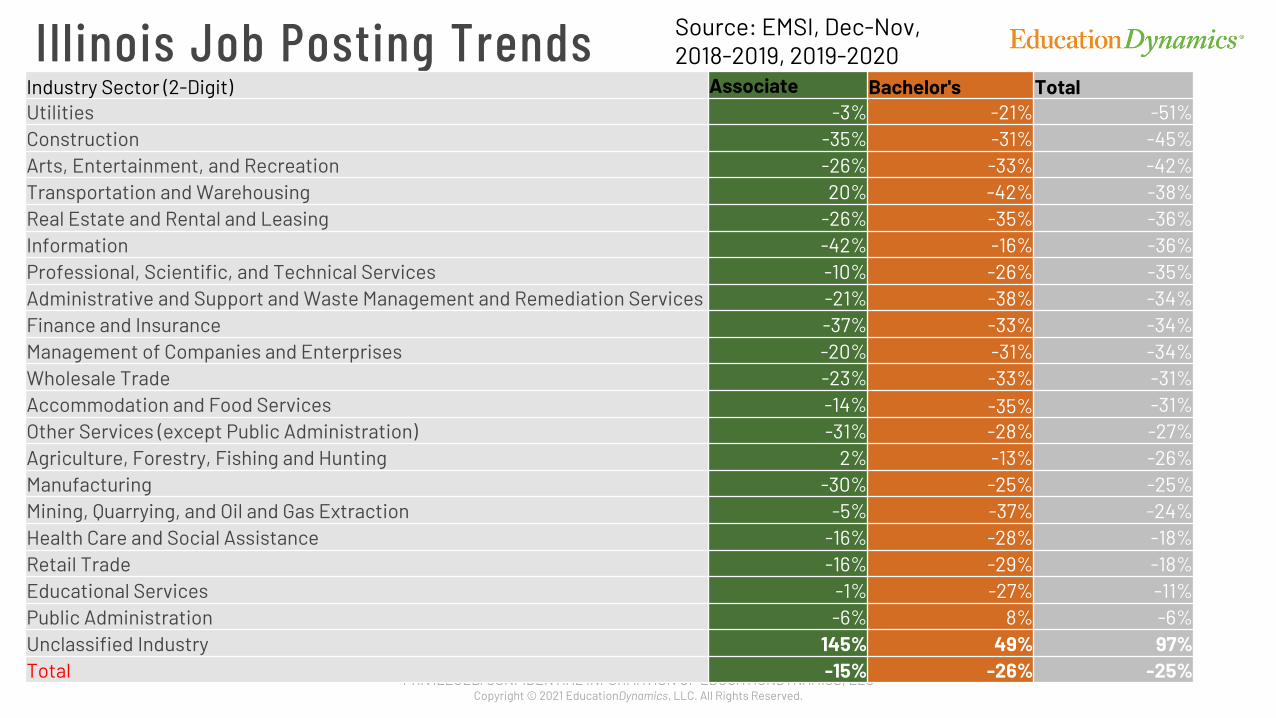
Illinois Job Posting Trends Industry Sector (2-Digit) Associate Bachelor's TotalUtilities -3% -21% -51%Construction -35% -31% -45%Arts, Entertainment, and Recreation -26% -33% -42%Transportation and Warehousing 20% -42% -38%Real Estate and Rental and Leasing -26% -35% -36%Information -42% -16% -36%Professional, Scientific, and Technical Services -10% -26% -35%Administrative and Support and Waste Management and Remediation Services -21% -38% -34%Finance and Insurance -37% -33% -34%Management of Companies and Enterprises -20% -31% -34%Wholesale Trade -23% -33% -31%Accommodation and Food Services -14% -35% -31%Other Services (except Public Administration) -31% -28% -27%Agriculture, Forestry, Fishing and Hunting 2% -13% -26%Manufacturing -30% -25% -25%Mining, Quarrying, and Oil and Gas Extraction -5% -37% -24%Health Care and Social Assistance -16% -28% -18%Retail Trade -16% -29% -18%Educational Services -1% -27% -11%Public Administration -6% 8% -6%Unclassified Industry 145% 49% 97%Total -15% -26% -25%
Source: EMSI, Dec-Nov, 2018-2019, 2019-2020
PRIVILEGED/CONFIDENTIAL INFORMATION OF EDUCATIONDYNAMICS, LLCCopyright © 2021 EducationDynamics, LLC. All Rights Reserved.
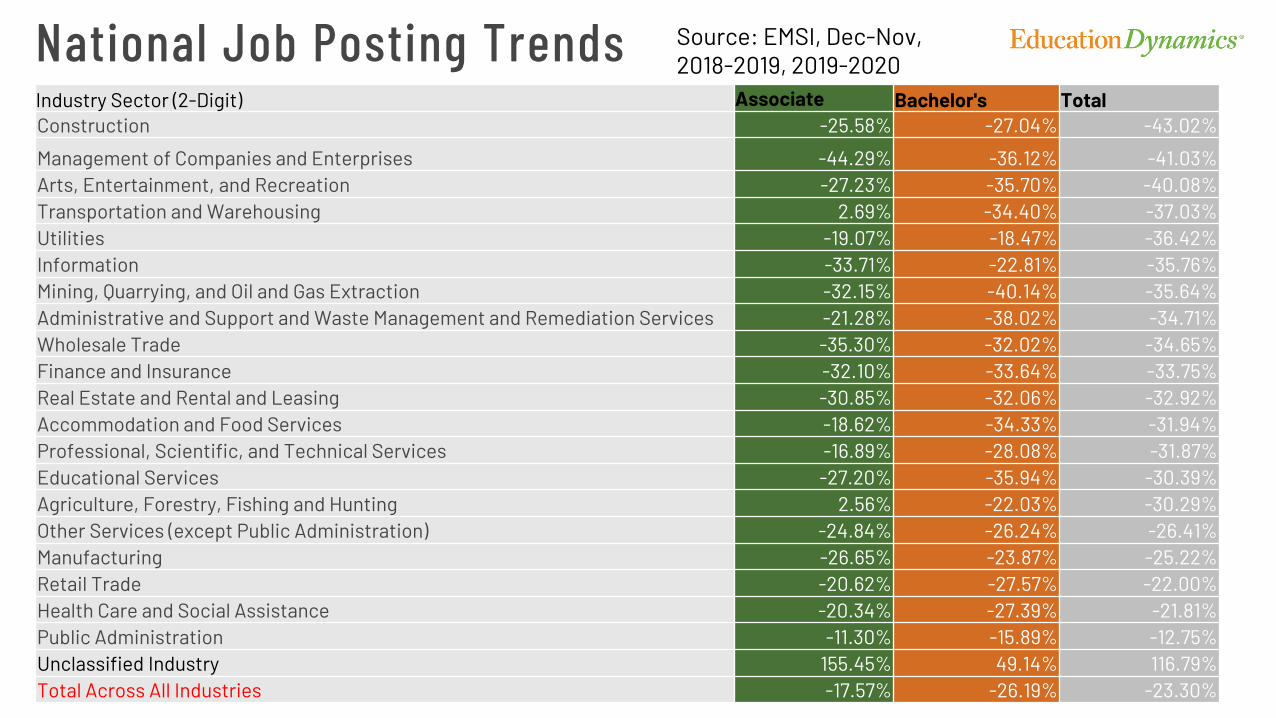
National Job Posting Trends Industry Sector (2-Digit) Associate Bachelor's TotalConstruction -25.58% -27.04% -43.02%
Management of Companies and Enterprises -44.29% -36.12% -41.03%Arts, Entertainment, and Recreation -27.23% -35.70% -40.08%Transportation and Warehousing 2.69% -34.40% -37.03%Utilities -19.07% -18.47% -36.42%Information -33.71% -22.81% -35.76%Mining, Quarrying, and Oil and Gas Extraction -32.15% -40.14% -35.64%Administrative and Support and Waste Management and Remediation Services -21.28% -38.02% -34.71%Wholesale Trade -35.30% -32.02% -34.65%Finance and Insurance -32.10% -33.64% -33.75%Real Estate and Rental and Leasing -30.85% -32.06% -32.92%Accommodation and Food Services -18.62% -34.33% -31.94%Professional, Scientific, and Technical Services -16.89% -28.08% -31.87%Educational Services -27.20% -35.94% -30.39%Agriculture, Forestry, Fishing and Hunting 2.56% -22.03% -30.29%Other Services (except Public Administration) -24.84% -26.24% -26.41%Manufacturing -26.65% -23.87% -25.22%Retail Trade -20.62% -27.57% -22.00%Health Care and Social Assistance -20.34% -27.39% -21.81%Public Administration -11.30% -15.89% -12.75%Unclassified Industry 155.45% 49.14% 116.79%Total Across All Industries -17.57% -26.19% -23.30%
Source: EMSI, Dec-Nov, 2018-2019, 2019-2020
National Study: Post-traditional Students
PRIVILEGED/CONFIDENTIAL INFORMATION OF EDUCATIONDYNAMICS, LLCCopyright © 2021 EducationDynamics, LLC. All Rights Reserved.
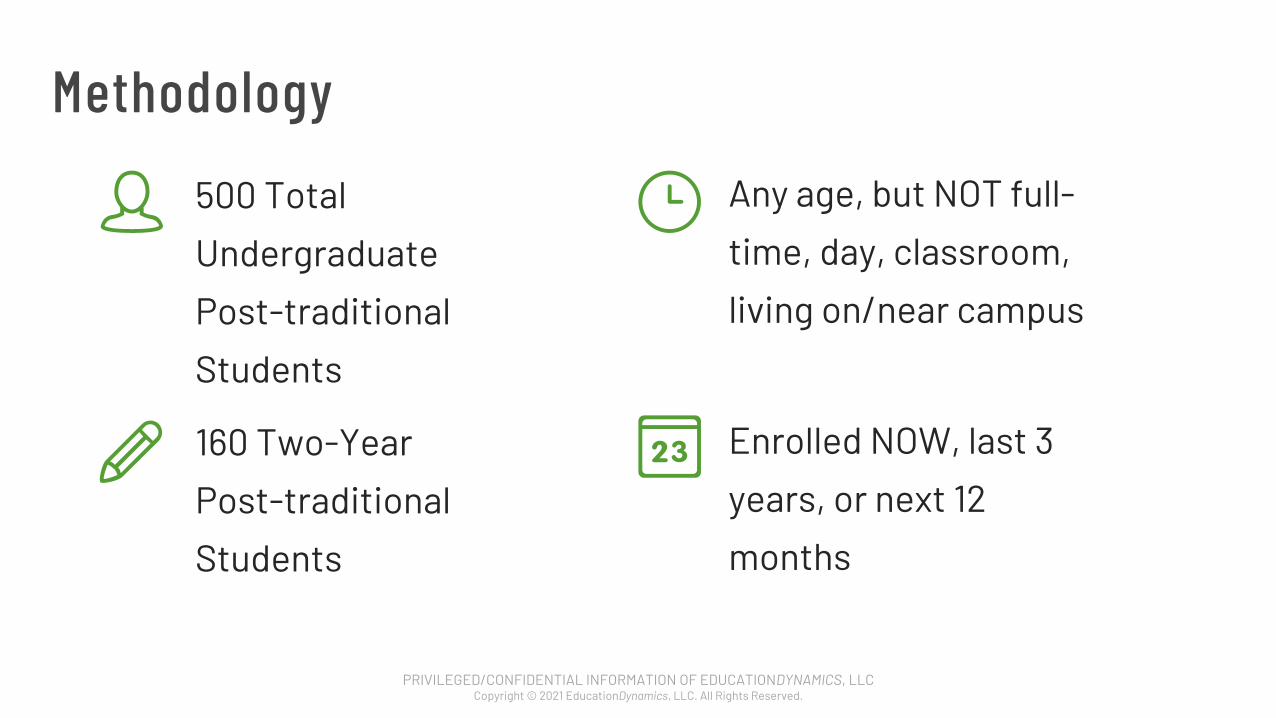
Methodology
500 Total
Undergraduate
Post-traditional
Students
160 Two-Year
Post-traditional
Students
Any age, but NOT full-
time, day, classroom,
living on/near campus
Enrolled NOW, last 3
years, or next 12
months
PRIVILEGED/CONFIDENTIAL INFORMATION OF EDUCATIONDYNAMICS, LLCCopyright © 2021 EducationDynamics, LLC. All Rights Reserved.
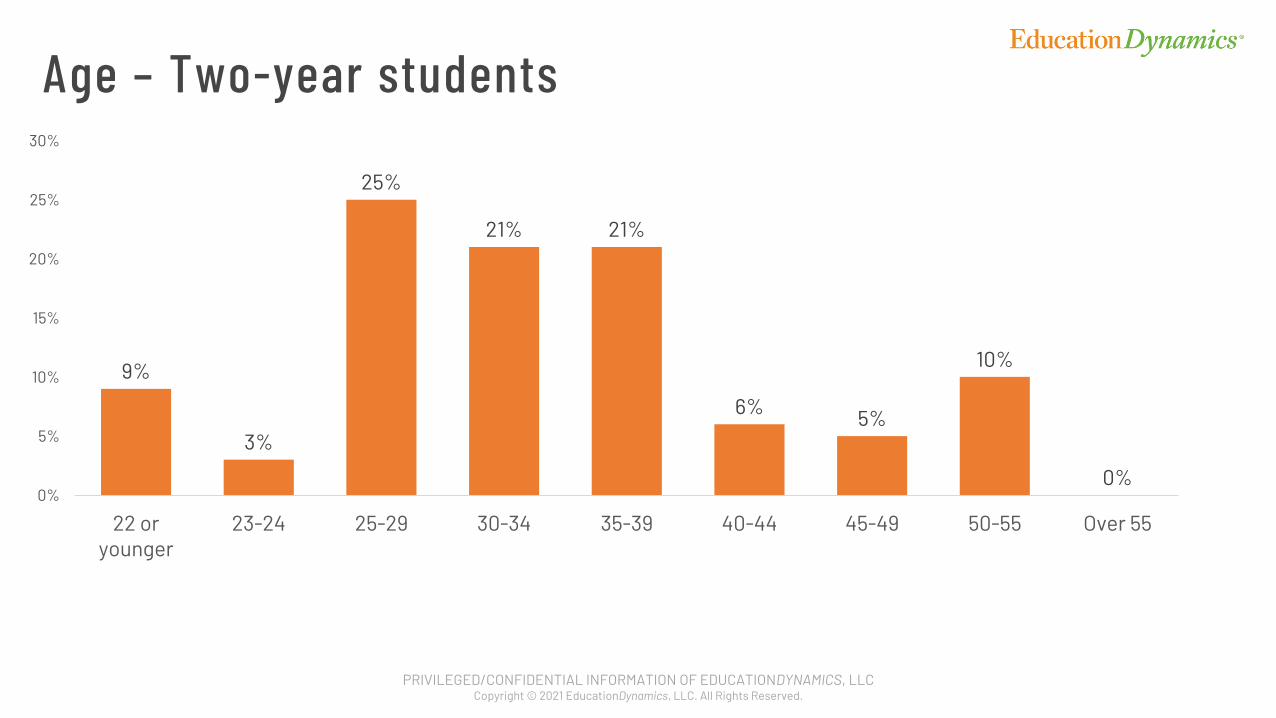
9%
3%
25%
21% 21%
6% 5%
10%
0%0%
5%
10%
15%
20%
25%
30%
22 oryounger
23-24 25-29 30-34 35-39 40-44 45-49 50-55 Over 55
Age – Two-year students
PRIVILEGED/CONFIDENTIAL INFORMATION OF EDUCATIONDYNAMICS, LLCCopyright © 2021 EducationDynamics, LLC. All Rights Reserved.
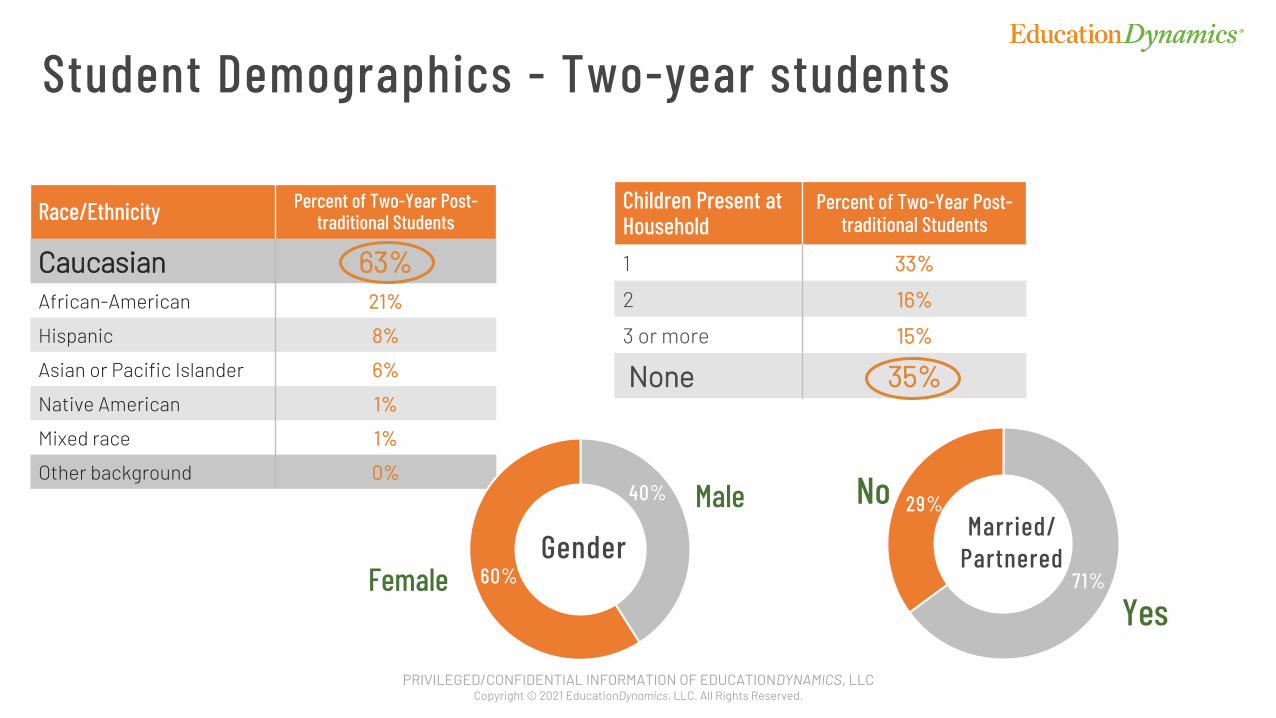
Race/Ethnicity Percent of Two-Year Post-traditional Students
Caucasian 63%African-American 21%
Hispanic 8%
Asian or Pacific Islander 6%
Native American 1%
Mixed race 1%
Other background 0%
Children Present at Household
Percent of Two-Year Post-traditional Students
1 33%
2 16%
3 or more 15%
None 35%
Married/Partnered
Yes
No 29%
71%Gender
Male
Female
40%
60%
Student Demographics - Two-year students
PRIVILEGED/CONFIDENTIAL INFORMATION OF EDUCATIONDYNAMICS, LLCCopyright © 2021 EducationDynamics, LLC. All Rights Reserved.
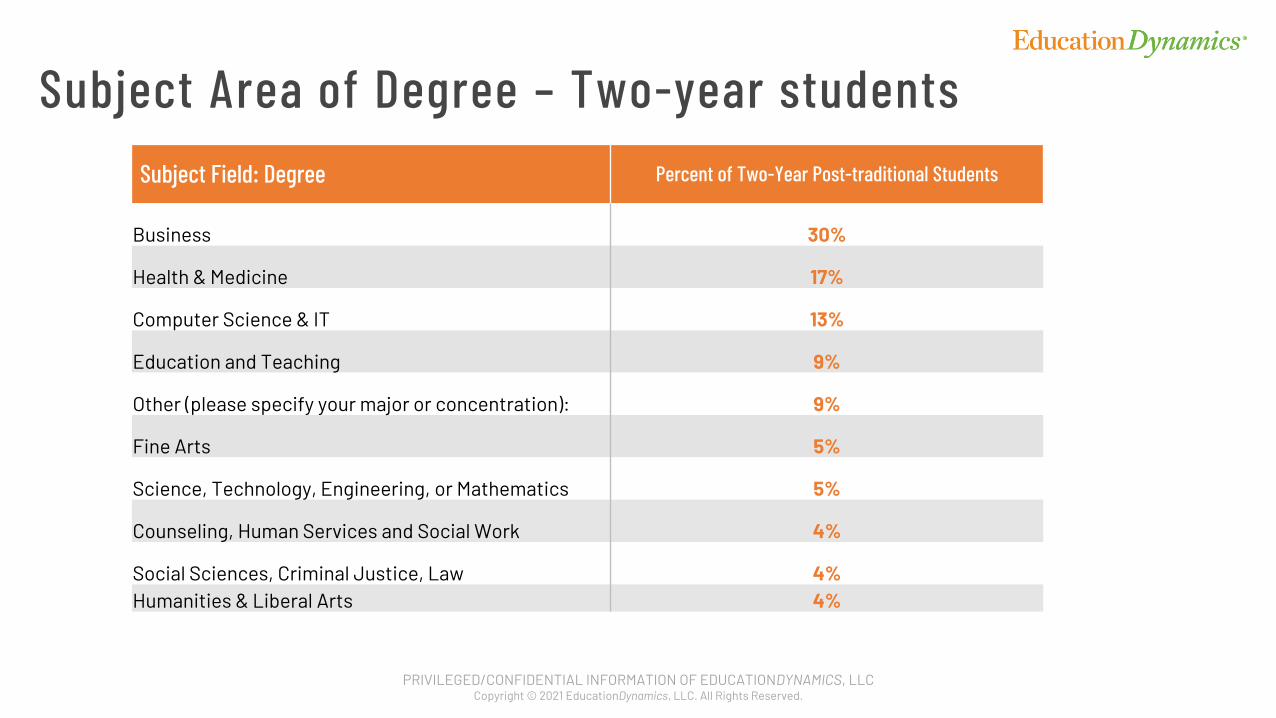
Subject Area of Degree – Two-year studentsSubject Field: Degree Percent of Two-Year Post-traditional Students
Business 30%
Health & Medicine 17%
Computer Science & IT 13%
Education and Teaching 9%
Other (please specify your major or concentration): 9%
Fine Arts 5%
Science, Technology, Engineering, or Mathematics 5%
Counseling, Human Services and Social Work 4%
Social Sciences, Criminal Justice, Law 4%Humanities & Liberal Arts 4%
PRIVILEGED/CONFIDENTIAL INFORMATION OF EDUCATIONDYNAMICS, LLCCopyright © 2021 EducationDynamics, LLC. All Rights Reserved.
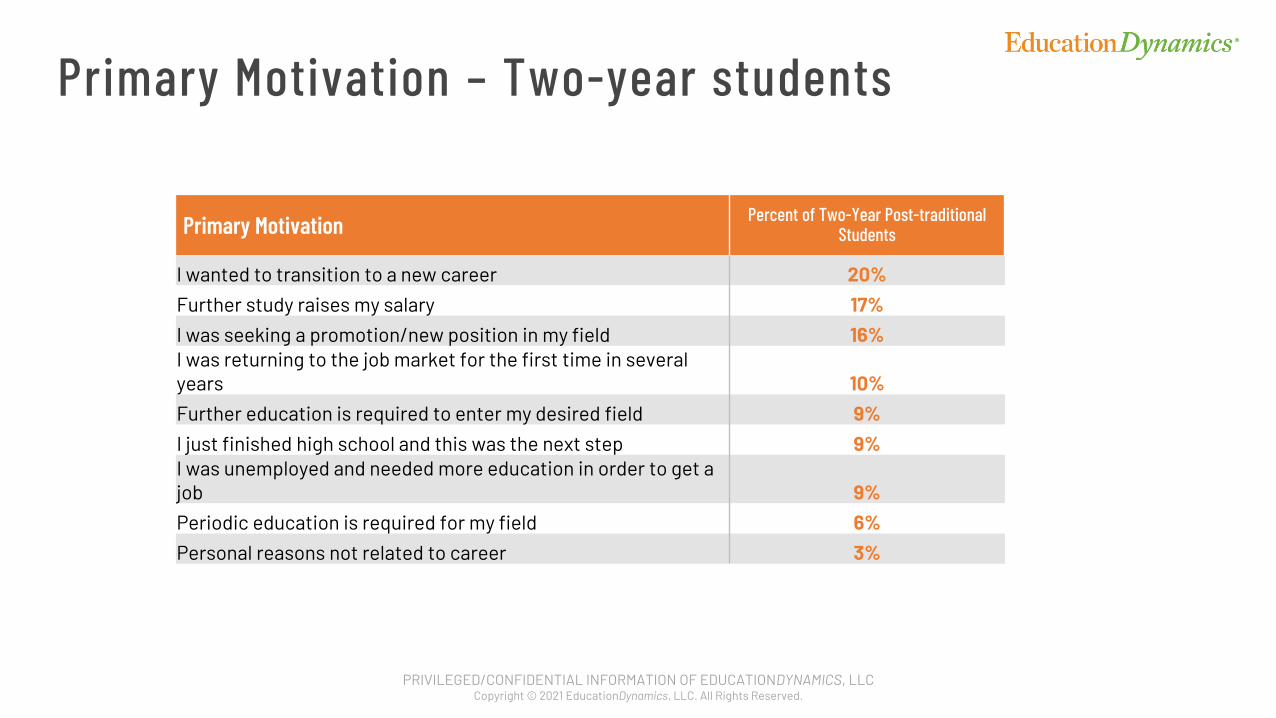
Primary Motivation Percent of Two-Year Post-traditional Students
I wanted to transition to a new career 20%
Further study raises my salary 17%
I was seeking a promotion/new position in my field 16%I was returning to the job market for the first time in several years 10%
Further education is required to enter my desired field 9%
I just finished high school and this was the next step 9%I was unemployed and needed more education in order to get a job 9%
Periodic education is required for my field 6%
Personal reasons not related to career 3%
Primary Motivation – Two-year students
PRIVILEGED/CONFIDENTIAL INFORMATION OF EDUCATIONDYNAMICS, LLCCopyright © 2021 EducationDynamics, LLC. All Rights Reserved.
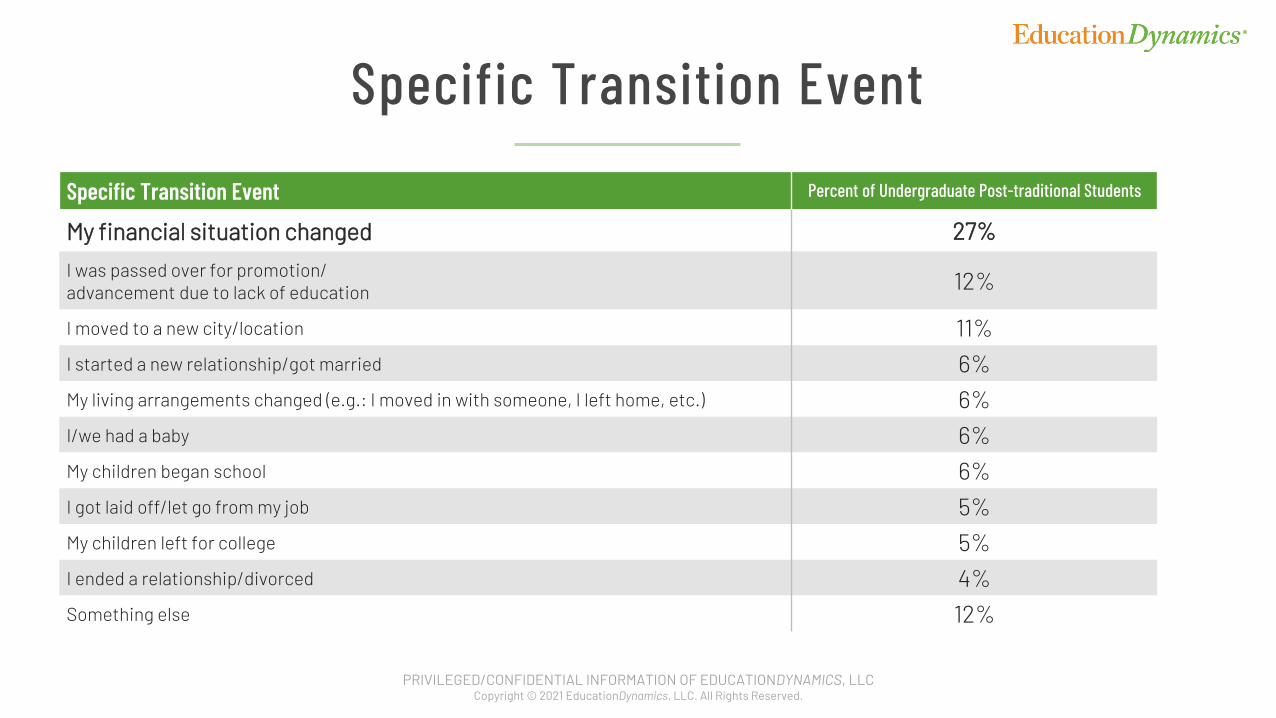
Specific Transition Event Percent of Undergraduate Post-traditional Students
My financial situation changed 27%
I was passed over for promotion/advancement due to lack of education 12%
I moved to a new city/location 11%I started a new relationship/got married 6%My living arrangements changed (e.g.: I moved in with someone, I left home, etc.) 6%I/we had a baby 6%My children began school 6%I got laid off/let go from my job 5%My children left for college 5%I ended a relationship/divorced 4%Something else 12%
Specific Transition Event
PRIVILEGED/CONFIDENTIAL INFORMATION OF EDUCATIONDYNAMICS, LLCCopyright © 2021 EducationDynamics, LLC. All Rights Reserved.
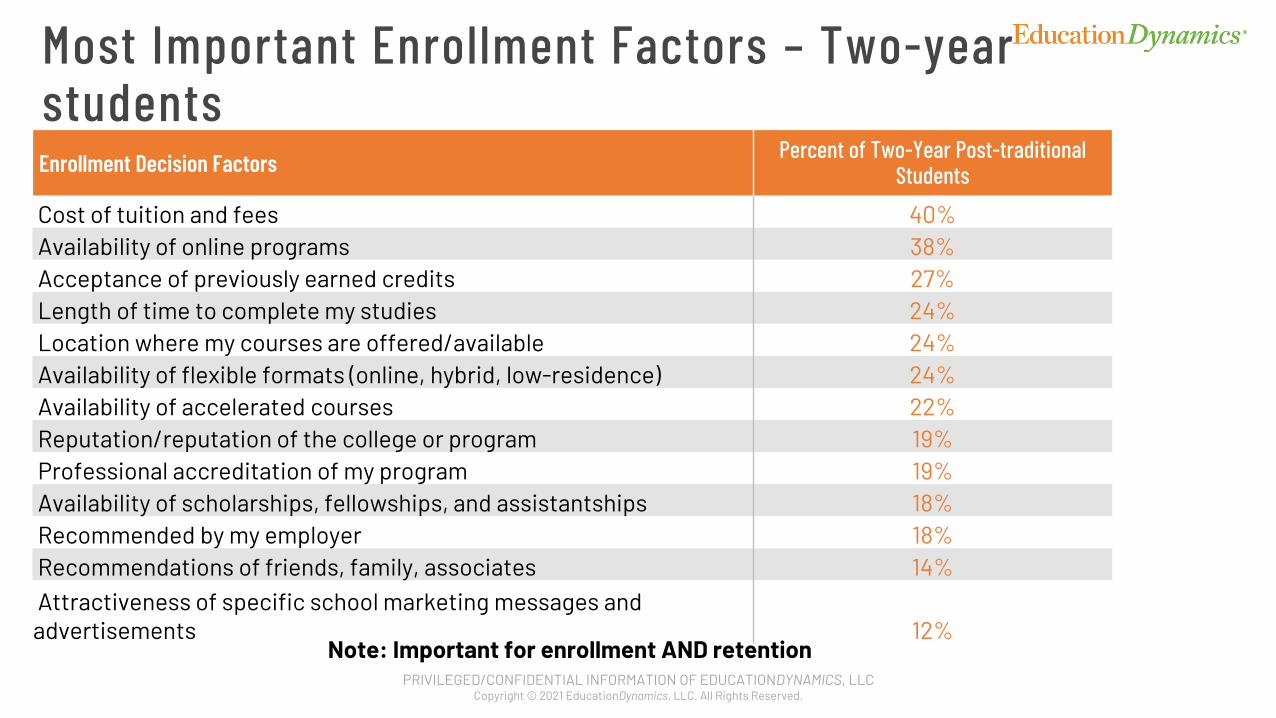
Enrollment Decision Factors Percent of Two-Year Post-traditional Students
Cost of tuition and fees 40%Availability of online programs 38%Acceptance of previously earned credits 27%Length of time to complete my studies 24%Location where my courses are offered/available 24%Availability of flexible formats (online, hybrid, low-residence) 24%Availability of accelerated courses 22%Reputation/reputation of the college or program 19%Professional accreditation of my program 19%Availability of scholarships, fellowships, and assistantships 18%Recommended by my employer 18%Recommendations of friends, family, associates 14%Attractiveness of specific school marketing messages and advertisements 12%
Most Important Enrollment Factors – Two-year students
Note: Important for enrollment AND retention
PRIVILEGED/CONFIDENTIAL INFORMATION OF EDUCATIONDYNAMICS, LLCCopyright © 2021 EducationDynamics, LLC. All Rights Reserved.
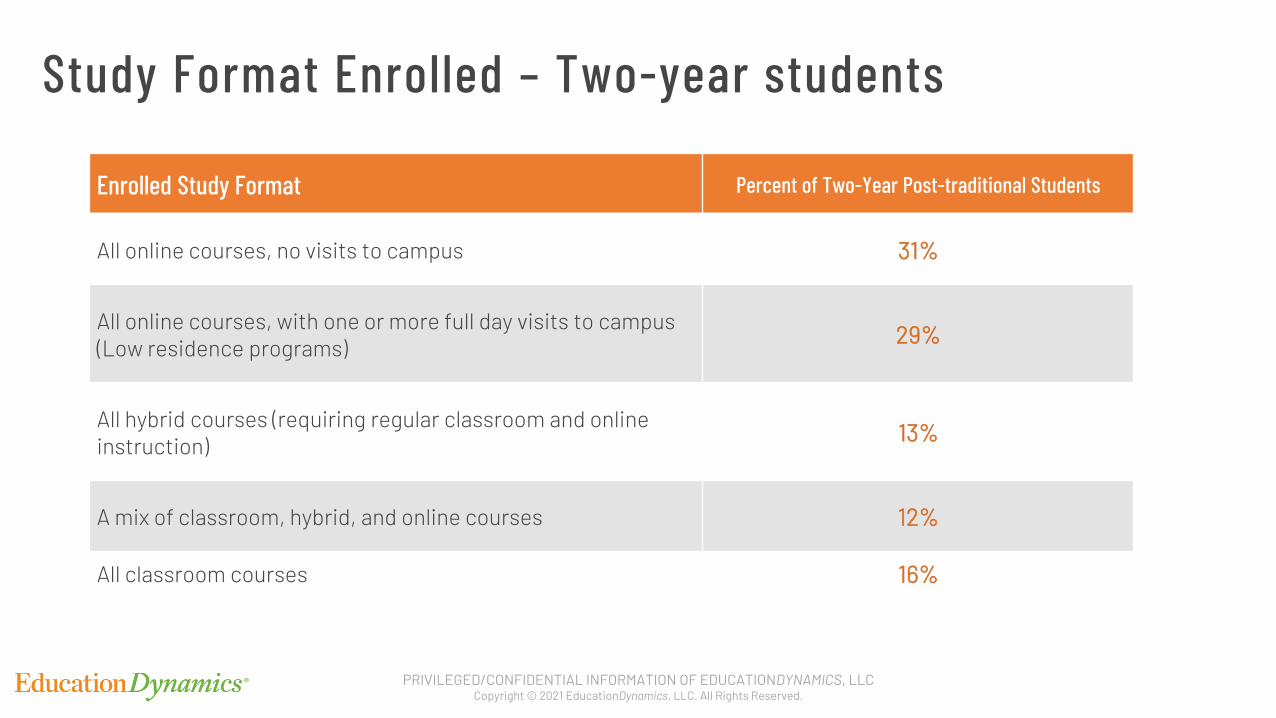
Enrolled Study Format Percent of Two-Year Post-traditional Students
All online courses, no visits to campus 31%
All online courses, with one or more full day visits to campus (Low residence programs) 29%
All hybrid courses (requiring regular classroom and online instruction) 13%
A mix of classroom, hybrid, and online courses 12%
All classroom courses 16%
Study Format Enrolled – Two-year students
PRIVILEGED/CONFIDENTIAL INFORMATION OF EDUCATIONDYNAMICS, LLCCopyright © 2021 EducationDynamics, LLC. All Rights Reserved.
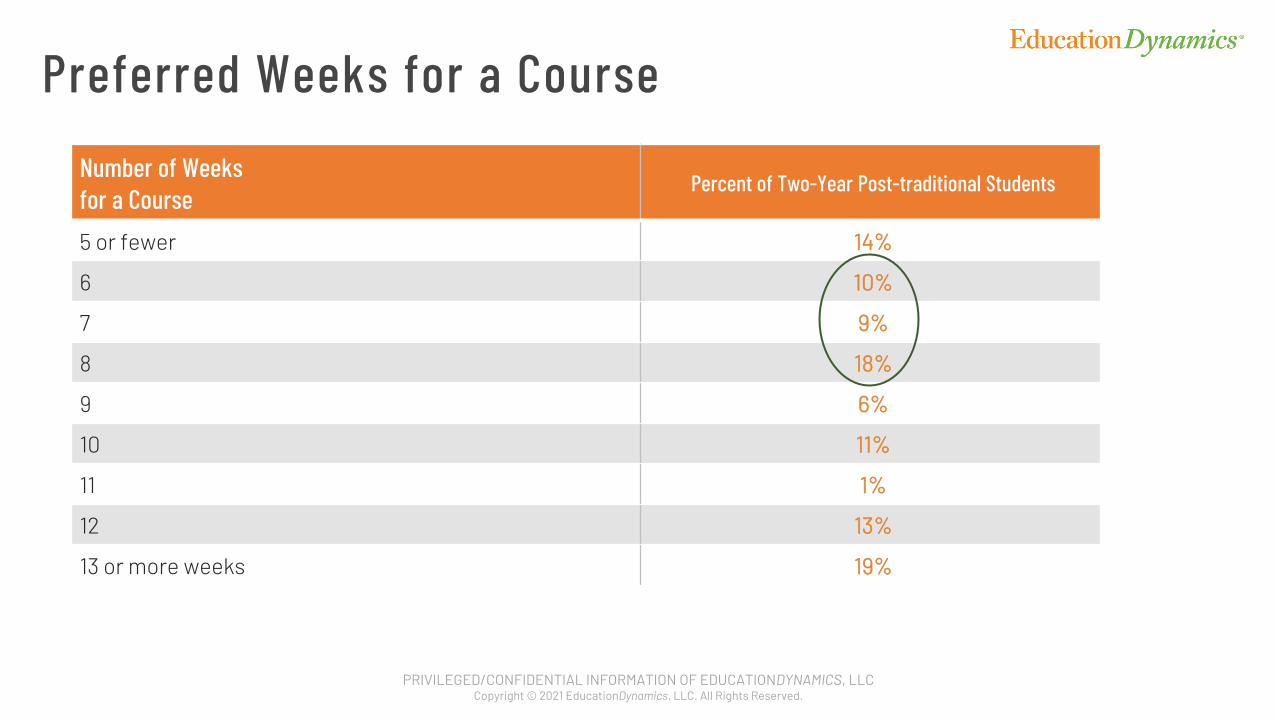
Number of Weeks for a Course
Percent of Two-Year Post-traditional Students
5 or fewer 14%
6 10%
7 9%
8 18%
9 6%
10 11%
11 1%
12 13%
13 or more weeks 19%
Preferred Weeks for a Course
PRIVILEGED/CONFIDENTIAL INFORMATION OF EDUCATIONDYNAMICS, LLCCopyright © 2021 EducationDynamics, LLC. All Rights Reserved.
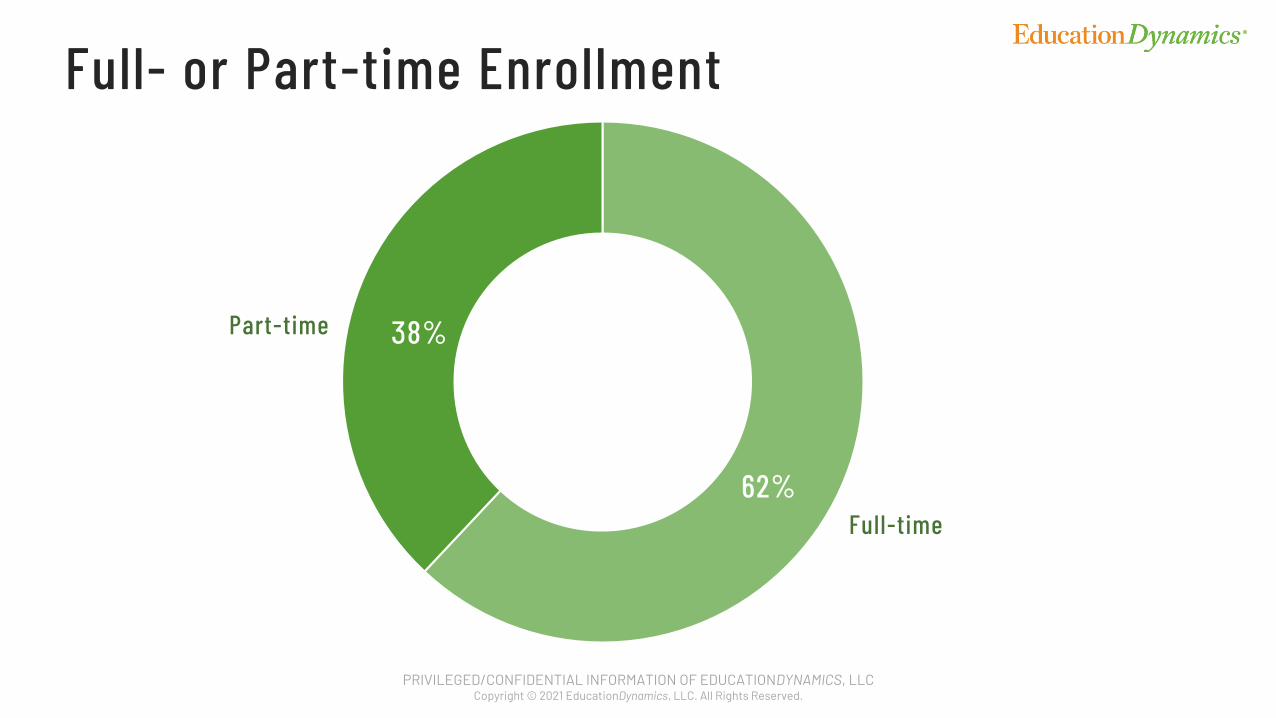
Full-time62%
38%Part-time
Full- or Part-time Enrollment
PRIVILEGED/CONFIDENTIAL INFORMATION OF EDUCATIONDYNAMICS, LLCCopyright © 2021 EducationDynamics, LLC. All Rights Reserved.
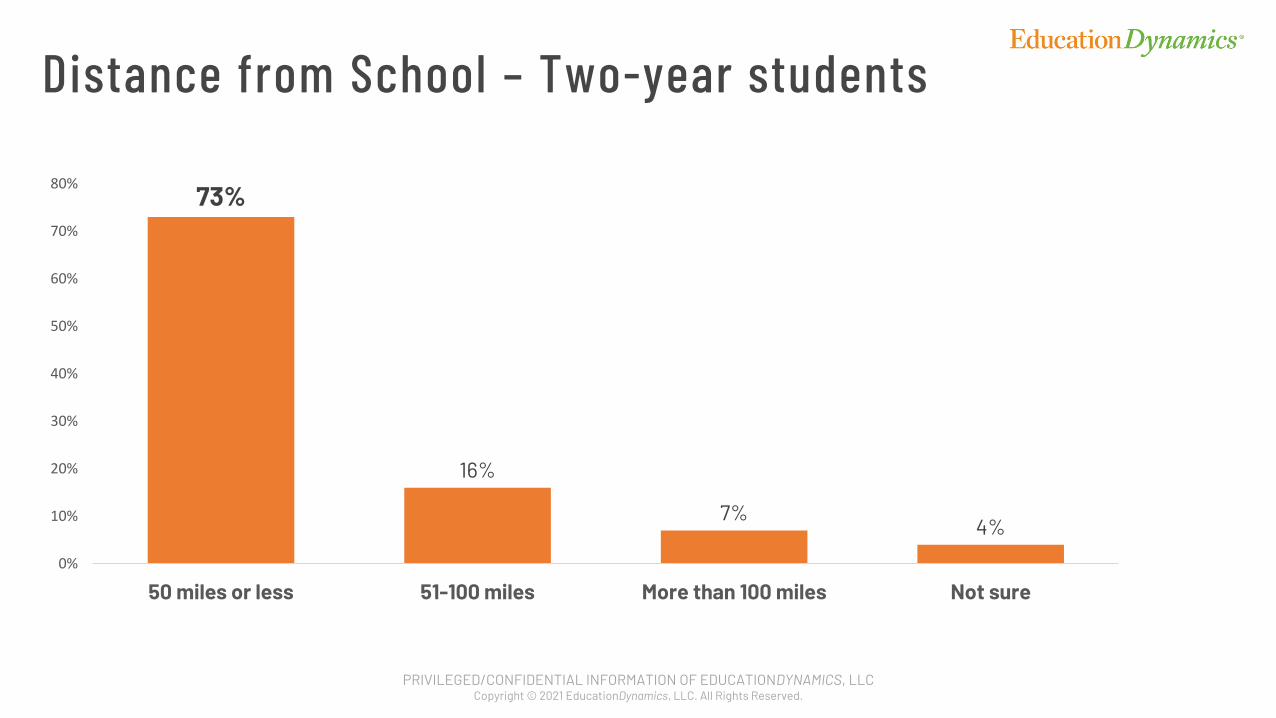
73%
16%
7%4%
0%
10%
20%
30%
40%
50%
60%
70%
80%
50 miles or less 51-100 miles More than 100 miles Not sure
Distance from School – Two-year students
PRIVILEGED/CONFIDENTIAL INFORMATION OF EDUCATIONDYNAMICS, LLCCopyright © 2021 EducationDynamics, LLC. All Rights Reserved.
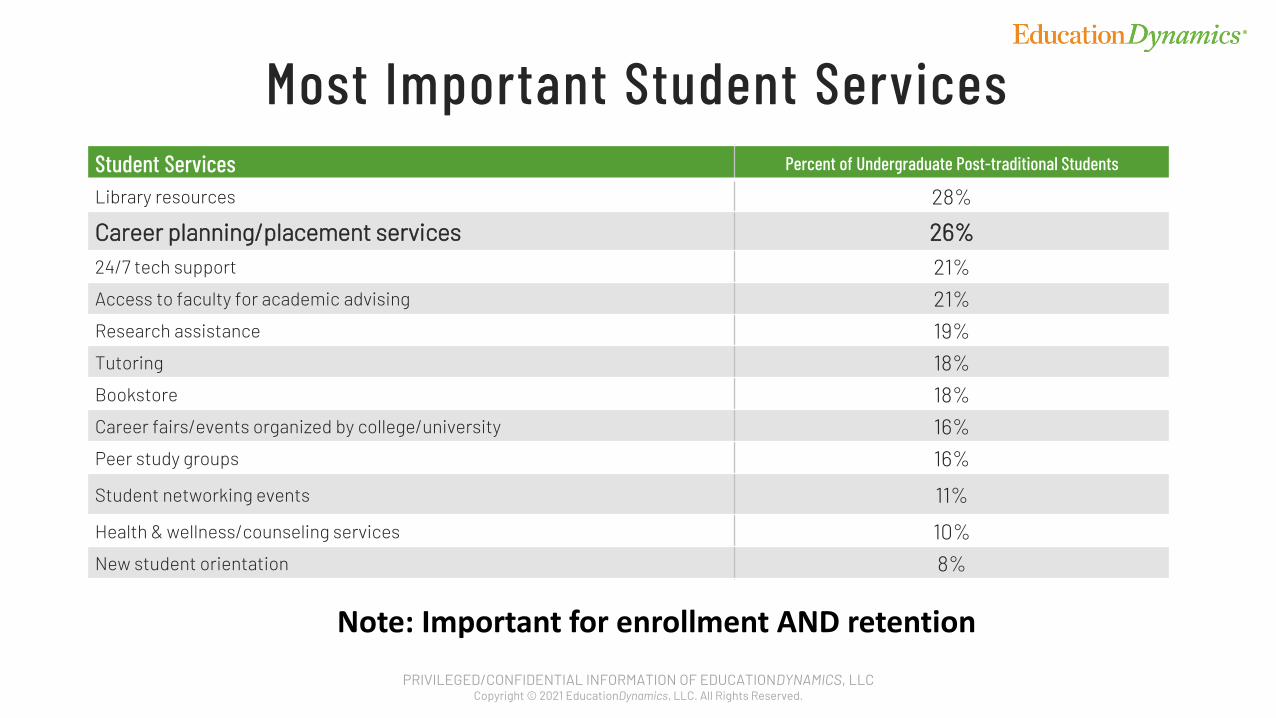
Student Services Percent of Undergraduate Post-traditional Students
Library resources 28%
Career planning/placement services 26%24/7 tech support 21%Access to faculty for academic advising 21%Research assistance 19%Tutoring 18%Bookstore 18%Career fairs/events organized by college/university 16%Peer study groups 16%
Student networking events 11%
Health & wellness/counseling services 10%New student orientation 8%
Most Important Student Services
Note: Important for enrollment AND retention
PRIVILEGED/CONFIDENTIAL INFORMATION OF EDUCATIONDYNAMICS, LLCCopyright © 2021 EducationDynamics, LLC. All Rights Reserved.
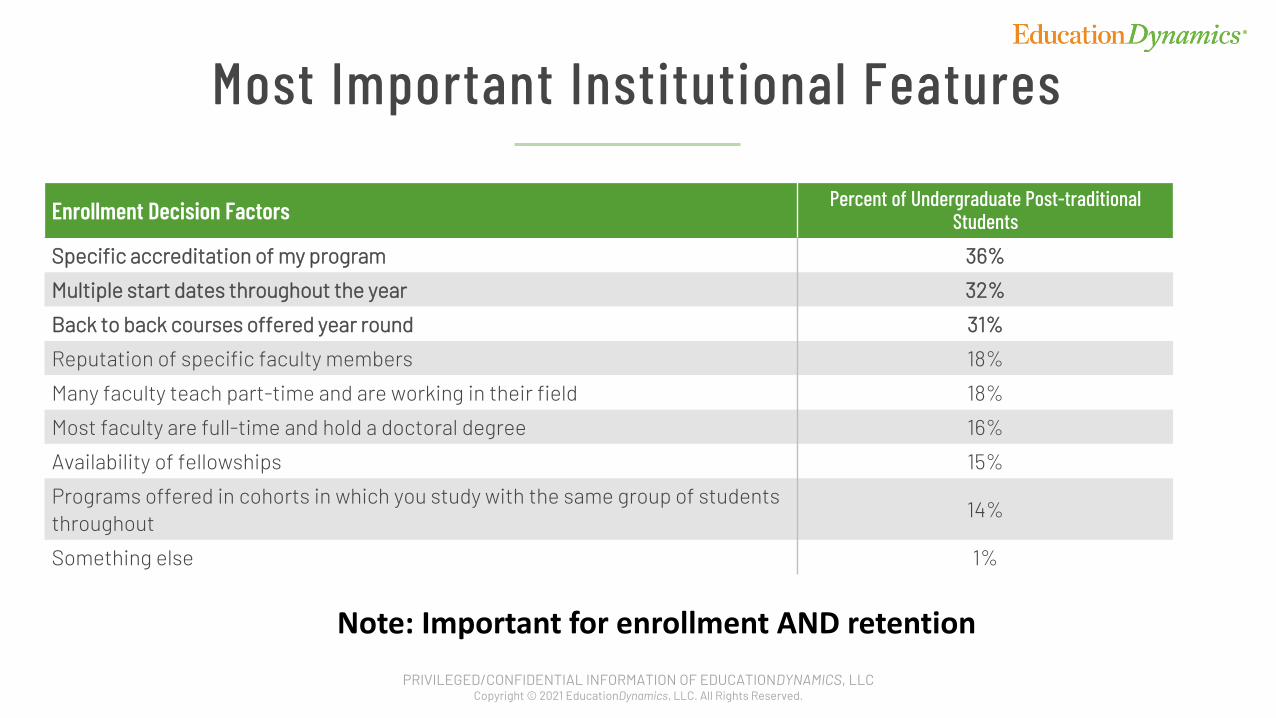
Most Important Institutional Features
Enrollment Decision Factors Percent of Undergraduate Post-traditional Students
Specific accreditation of my program 36%
Multiple start dates throughout the year 32%
Back to back courses offered year round 31%
Reputation of specific faculty members 18%
Many faculty teach part-time and are working in their field 18%
Most faculty are full-time and hold a doctoral degree 16%
Availability of fellowships 15%
Programs offered in cohorts in which you study with the same group of students throughout
14%
Something else 1%
Note: Important for enrollment AND retention
PRIVILEGED/CONFIDENTIAL INFORMATION OF EDUCATIONDYNAMICS, LLCCopyright © 2021 EducationDynamics, LLC. All Rights Reserved.
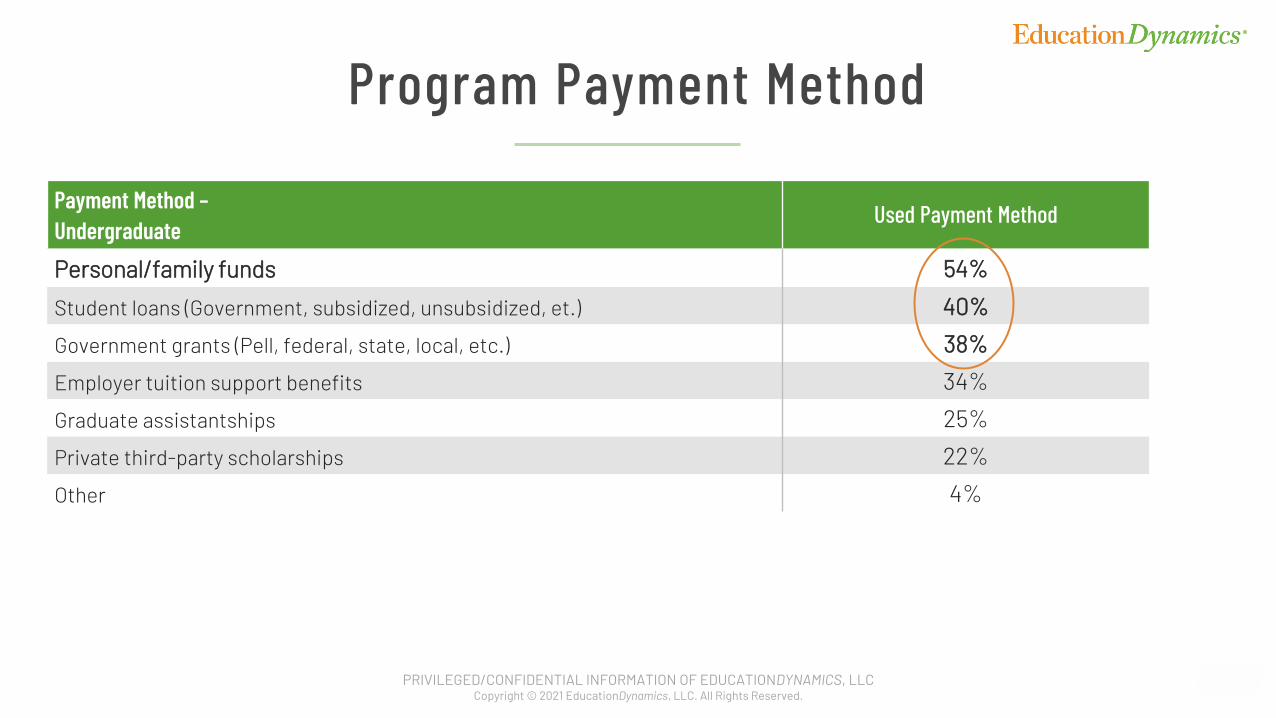
Program Payment Method
Payment Method –Undergraduate
Used Payment Method
Personal/family funds 54%
Student loans (Government, subsidized, unsubsidized, et.) 40%
Government grants (Pell, federal, state, local, etc.) 38%
Employer tuition support benefits 34%
Graduate assistantships 25%
Private third-party scholarships 22%
Other 4%
PRIVILEGED/CONFIDENTIAL INFORMATION OF EDUCATIONDYNAMICS, LLCCopyright © 2021 EducationDynamics, LLC. All Rights Reserved.
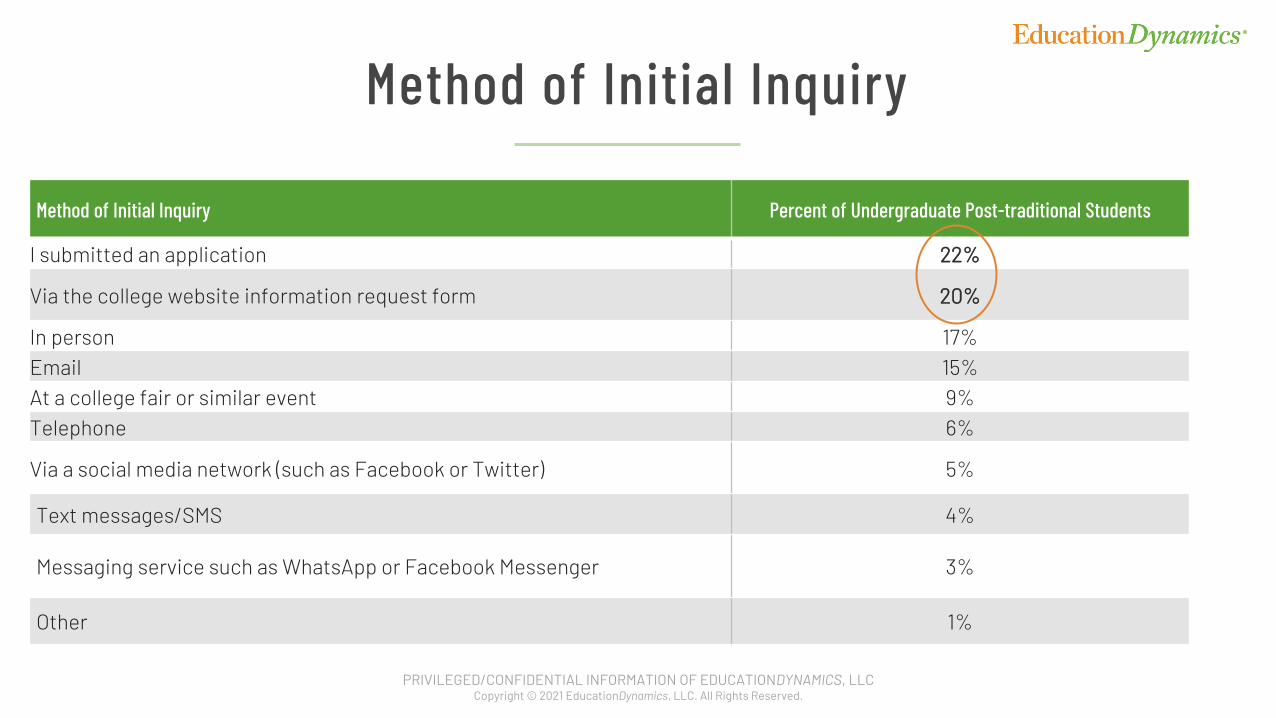
Method of Initial Inquiry Percent of Undergraduate Post-traditional Students
I submitted an application 22%
Via the college website information request form 20%
In person 17%Email 15%At a college fair or similar event 9%Telephone 6%
Via a social media network (such as Facebook or Twitter) 5%
Text messages/SMS 4%
Messaging service such as WhatsApp or Facebook Messenger 3%
Other 1%
Method of Initial Inquiry
PRIVILEGED/CONFIDENTIAL INFORMATION OF EDUCATIONDYNAMICS, LLCCopyright © 2021 EducationDynamics, LLC. All Rights Reserved.
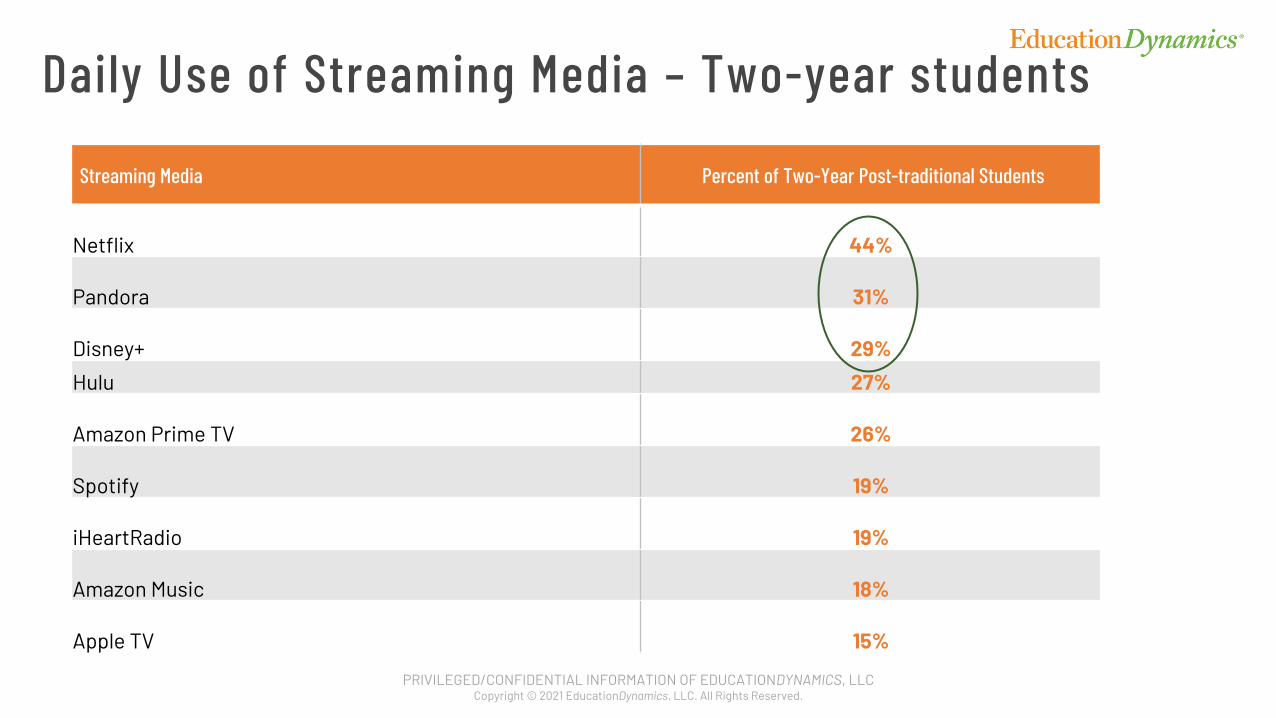
Streaming Media Percent of Two-Year Post-traditional Students
Netflix 44%
Pandora 31%
Disney+ 29%
Hulu 27%
Amazon Prime TV 26%
Spotify 19%
iHeartRadio 19%
Amazon Music 18%
Apple TV 15%
Daily Use of Streaming Media – Two-year students
PRIVILEGED/CONFIDENTIAL INFORMATION OF EDUCATIONDYNAMICS, LLCCopyright © 2021 EducationDynamics, LLC. All Rights Reserved.
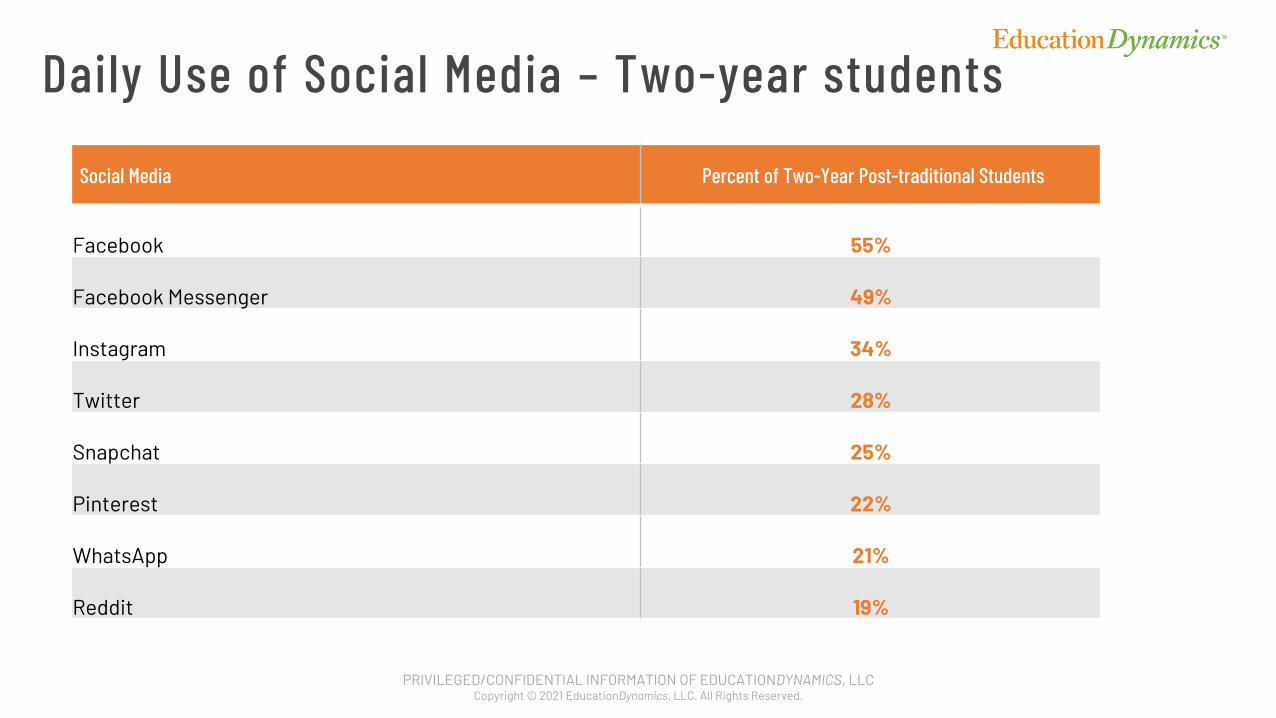
Social Media Percent of Two-Year Post-traditional Students
Facebook 55%
Facebook Messenger 49%
Instagram 34%
Twitter 28%
Snapchat 25%
Pinterest 22%
WhatsApp 21%
Reddit 19%
Daily Use of Social Media – Two-year students
Key Findings
3232
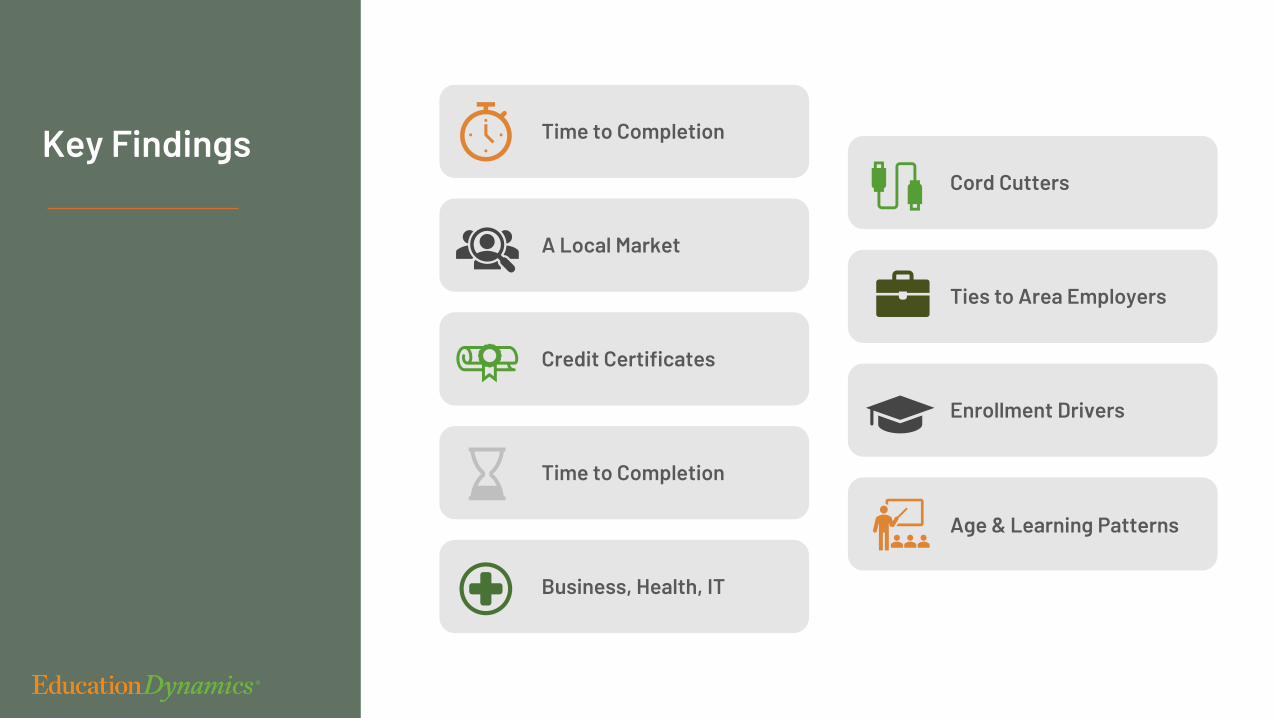
Key Findings Time to Completion
A Local Market
Credit Certificates
Time to Completion
Business, Health, IT
Cord Cutters
Ties to Area Employers
Enrollment Drivers
Age & Learning Patterns
Key findings for you?

Carol [email protected]
201 -377-3321
Steven [email protected]
201-377-3380
Contact Us
EducationDynamics.com/insights