Embed Size (px)
Citation preview
2021 Interim Financial Results
FOR THE SIX MONTHS ENDED 31 MARCH 2021INCORPORATING THE REQUIREMENTS OF APPENDIX 4D
WESTPAC BANKING CORPORATION ABN 33 007 457 141
Fix. Simplify. Perform.

II WESTPAC GROUP 2021 INTERIM FINANCIAL RESULTS
Results Announcement to the market
ASX Appendix 4DResults for announcement to the market1
Report for the half year ended 31 March 20212
Revenue from ordinary activities3,4 ($m) up 1% to $10,686
Profit from ordinary activities after tax attributable to equity holders4 ($m) up 189% to $3,443
Net profit for the period attributable to equity holders4 ($m) up 189% to $3,443
Dividend Distributions (cents per ordinary share)Amount per
securityFranked amount
per security
Interim dividend 58 58
Record date for determining entitlements to the dividend 14 May 2021
1. This document comprises the Westpac Group 2021 Interim Financial Results, including the 2021 Interim Financial Report contained in Section 4 and is provided to the Australian Securities Exchange under Listing Rule 4.2A.
2. This report should be read in conjunction with the 2020 Westpac Group Annual Report and any public announcements made in the period by the Westpac Group in accordance with the continuous disclosure requirements of the Corporations Act 2001 and ASX Listing Rules.
3. Comprises reported interest income, interest expense and non-interest income.4. Above comparisons are to the reported results for the six months ended 31 March 2020.
IIIWESTPAC GROUP 2021 INTERIM FINANCIAL RESULTS
1 2
34
56
7
Results Announcement to the market
Index
1.0 Group results 1
1.1 Reported results 1
1.2 Key financial information 3
1.3 Cash earnings results 4
1.4 Market share and system multiple metrics 10
2.0 Review of Group operations 11
2.1 Performance overview 15
2.2 Review of earnings 22
2.3 Credit quality 34
2.4 Balance sheet and funding 37
2.5 Capital and dividends 42
2.6 Sustainability performance 48
3.0 Divisional results 54
3.1 Consumer 55
3.2 Business 58
3.3 Westpac Institutional Bank 61
3.4 Westpac New Zealand 63
3.5 Specialist Businesses 66
3.6 Group Businesses 71
4.0 2021 Interim financial report 73
4.1 Directors’ report 74
4.2 Consolidated income statement 98
4.3 Consolidated statement of comprehensive income 99
4.4 Consolidated balance sheet 100
4.5 Consolidated statement of changes in equity 101
4.6 Consolidated cash flow statement 102
4.7 Notes to the consolidated financial statements 103
4.8 Statutory statements 135
5.0 Cash earnings financial information 138
6.0 Other information 149
6.1 Disclosure regarding forward-looking statements 149
6.2 References to websites 151
6.3 Credit ratings 151
6.4 Dividend reinvestment plan 151
6.5 Information on related entities 151
6.6 Financial calendar and Share Registry details 152
6.7 Exchange rates 155
7.0 Glossary 156

IV WESTPAC GROUP 2021 INTERIM FINANCIAL RESULTS
Results Announcement to the market
In this Interim Financial Results Announcement (Results Announcement) references to ‘Westpac’, ‘WBC’, ‘Westpac Group’, ‘the Group’, ‘we’, ‘us’ and ‘our’ are to Westpac Banking Corporation and its controlled entities, unless it clearly means just Westpac Banking Corporation.
All references to $ in this Results Announcement are to Australian dollars unless otherwise stated.
Financial calendarInterim Results Announcement released 3 May 2021
Ex-dividend date for interim dividend 13 May 2021
Record date for interim dividend (Sydney) 14 May 2021
Interim dividend payable 25 June 2021
Final Results Announcement (scheduled) 1 November 2021
1WESTPAC GROUP 2021 INTERIM FINANCIAL RESULTS
1 2
34
56
7
Group results
1.0 Group results
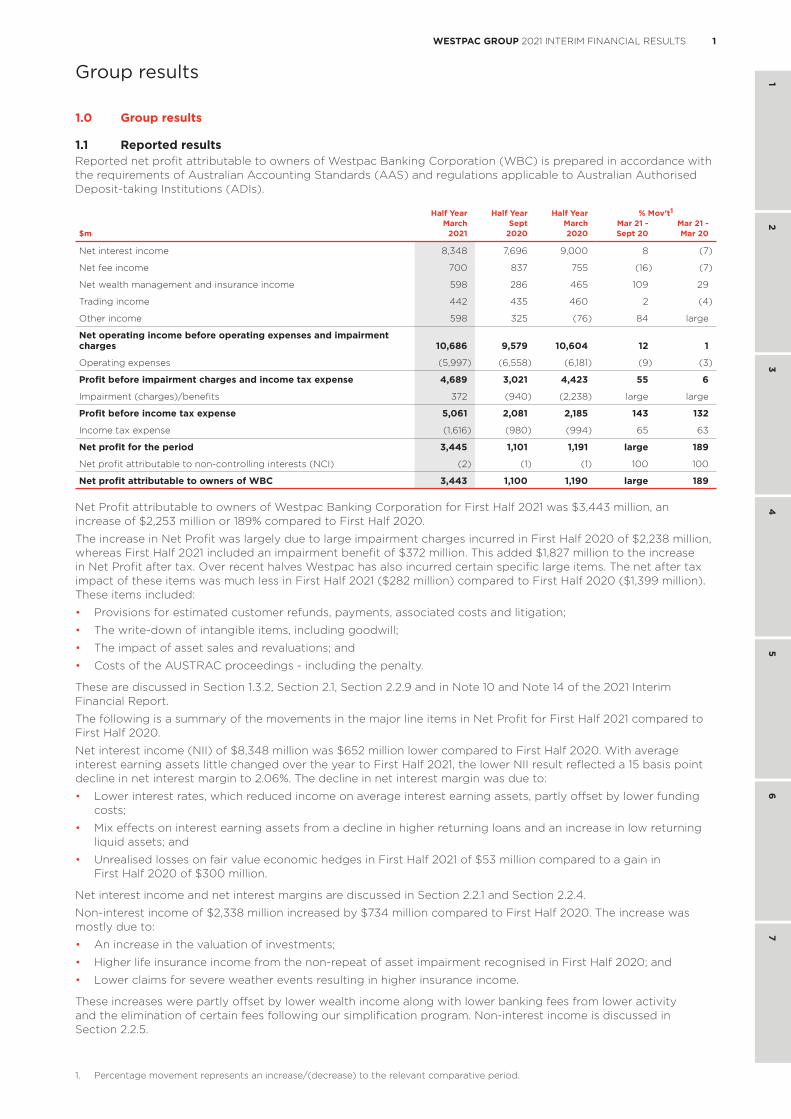
1.1 Reported resultsReported net profit attributable to owners of Westpac Banking Corporation (WBC) is prepared in accordance with the requirements of Australian Accounting Standards (AAS) and regulations applicable to Australian Authorised Deposit-taking Institutions (ADIs).
Half Year Half Year Half Year % Mov’t1
March Sept March Mar 21 - Mar 21 -$m 2021 2020 2020 Sept 20 Mar 20
Net interest income 8,348 7,696 9,000 8 (7)
Net fee income 700 837 755 (16) (7)
Net wealth management and insurance income 598 286 465 109 29
Trading income 442 435 460 2 (4)
Other income 598 325 (76) 84 large
Net operating income before operating expenses and impairment charges 10,686 9,579 10,604 12 1
Operating expenses (5,997) (6,558) (6,181) (9) (3)
Profit before impairment charges and income tax expense 4,689 3,021 4,423 55 6
Impairment (charges)/benefits 372 (940) (2,238) large large
Profit before income tax expense 5,061 2,081 2,185 143 132
Income tax expense (1,616) (980) (994) 65 63
Net profit for the period 3,445 1,101 1,191 large 189
Net profit attributable to non-controlling interests (NCI) (2) (1) (1) 100 100
Net profit attributable to owners of WBC 3,443 1,100 1,190 large 189
Net Profit attributable to owners of Westpac Banking Corporation for First Half 2021 was $3,443 million, an increase of $2,253 million or 189% compared to First Half 2020.
The increase in Net Profit was largely due to large impairment charges incurred in First Half 2020 of $2,238 million, whereas First Half 2021 included an impairment benefit of $372 million. This added $1,827 million to the increase in Net Profit after tax. Over recent halves Westpac has also incurred certain specific large items. The net after tax impact of these items was much less in First Half 2021 ($282 million) compared to First Half 2020 ($1,399 million). These items included:
• Provisions for estimated customer refunds, payments, associated costs and litigation;
• The write-down of intangible items, including goodwill;
• The impact of asset sales and revaluations; and
• Costs of the AUSTRAC proceedings - including the penalty.
These are discussed in Section 1.3.2, Section 2.1, Section 2.2.9 and in Note 10 and Note 14 of the 2021 Interim Financial Report.
The following is a summary of the movements in the major line items in Net Profit for First Half 2021 compared to First Half 2020.
Net interest income (NII) of $8,348 million was $652 million lower compared to First Half 2020. With average interest earning assets little changed over the year to First Half 2021, the lower NII result reflected a 15 basis point decline in net interest margin to 2.06%. The decline in net interest margin was due to:
• Lower interest rates, which reduced income on average interest earning assets, partly offset by lower funding costs;
• Mix effects on interest earning assets from a decline in higher returning loans and an increase in low returning liquid assets; and
• Unrealised losses on fair value economic hedges in First Half 2021 of $53 million compared to a gain in First Half 2020 of $300 million.
Net interest income and net interest margins are discussed in Section 2.2.1 and Section 2.2.4.
Non-interest income of $2,338 million increased by $734 million compared to First Half 2020. The increase was mostly due to:
• An increase in the valuation of investments;
• Higher life insurance income from the non-repeat of asset impairment recognised in First Half 2020; and
• Lower claims for severe weather events resulting in higher insurance income.
These increases were partly offset by lower wealth income along with lower banking fees from lower activity and the elimination of certain fees following our simplification program. Non-interest income is discussed in Section 2.2.5.
1. Percentage movement represents an increase/(decrease) to the relevant comparative period.

2 WESTPAC GROUP 2021 INTERIM FINANCIAL RESULTS
Group results
Operating expenses of $5,997 million decreased by $184 million compared to First Half 2020. The decline was due to $1,058 million in costs associated with the AUSTRAC proceedings in First Half 2020, partly offset by:
• An increase in full time equivalent (FTE) employees and associated costs, principally to improve risk management activities and improve our mortgage processing;
• Higher impairment of intangible assets including capitalised software and goodwill;
• Higher costs associated with the announced divestments of certain specialists businesses, and investments; and
• An increased charge for estimated customer refunds, payments, associated costs and litigation.
Operating expenses are discussed in Section 2.2.8.
In First Half 2021 the Group recognised an impairment benefit of $372 million compared to an impairment charge of $2,238 million in First Half 2020, a $2,610 million movement. In Full Year 2020 the Group materially increased provisions in response to the expected economic impact of COVID-19, including forecasts of a prolonged deterioration in economic activity, a rise in unemployment and a decline in property prices. Over the subsequent year to First Half 2021, the effect of COVID-19 was significantly less than expected at that time across most economic indicators. While a degree of uncertainty remains, some of the provisions booked through Full Year 2020 are no longer required and this contributed to the impairment benefits in First Half 2021. Impairment charges and asset quality are discussed further in Section 2.2.9, Section 2.3, and Note 10 and Note 11 of the 2021 Interim Financial Report.
Tax expense was up 63% in First Half 2021 compared to First Half 2020 from the rise in profit before tax. The effective tax rate was 31.9% and close to Australia’s corporate tax rate of 30%. This was lower than the 45.5% effective tax rate in First Half 2020 as penalties provided in that half were not tax deductible. Income tax expense is discussed in Section 2.2.10.

3WESTPAC GROUP 2021 INTERIM FINANCIAL RESULTS
1 2
34
56
7
Group results
1.2 Key financial information1
Half Year Half Year Half Year % Mov’tMarch Sept March Mar 21 - Mar 21 -
2021 2020 2020 Sept 20 Mar 20
Shareholder value
Earnings per ordinary share (cents) 94.5 30.5 33.2 large 185
Weighted average ordinary shares (millions)2 3,641 3,606 3,574 1 2
Fully franked dividends per ordinary share (cents)3 58 31 - 87 -
Dividend payout ratio3 61.75% 101.65% - large -
Return on average ordinary equity 9.92% 3.22% 3.52% large large
Average ordinary equity ($m) 69,583 68,403 67,625 2 3
Average total equity ($m) 69,634 68,454 67,678 2 3
Net tangible asset per ordinary share ($) 16.60 15.67 15.43 6 8
Business performance
Interest spread 1.97% 1.73% 2.08% 24 bps (11 bps)
Benefit of net non-interest bearing assets, liabilities and equity 0.09% 0.12% 0.13% (3 bps) (4 bps)
Net interest margin 2.06% 1.85% 2.21% 21 bps (15 bps)
Average interest earning assets ($m) 812,950 830,465 812,971 (2) -
Expense to income ratio 56.12% 68.46% 58.29% large (217 bps)
Capital, funding and liquidity
Common equity Tier 1 capital ratio
- APRA Basel III 12.34% 11.13% 10.81% 121 bps 153 bps
- Internationally comparable 18.08% 16.50% 15.81% 158 bps 227 bps
Credit risk weighted assets (credit RWA) ($m) 347,127 359,389 369,142 (3) (6)
Total risk weighted assets (RWA) ($m) 428,899 437,905 443,905 (2) (3)
Liquidity coverage ratio (LCR)4,5 124% 151% 140% large large
Net stable funding ratio (NSFR)5 123% 122% 117% 78 bps large
Asset quality5
Gross impaired exposures to gross loans 0.30% 0.40% 0.30% (10 bps) -
Gross impaired exposures to equity and total provisions 2.67% 3.74% 2.93% (107 bps) (26 bps)
Gross impaired exposures provisions to gross impaired exposures 47.03% 41.45% 50.09% large (306 bps)
Total committed exposures (TCE) ($bn) 1,072 1,060 1,082 1 (1)
Total stressed exposures as a % of TCE6 1.60% 1.91% 1.32% (31 bps) 28 bps
Total provisions to gross loans 79 bps 88 bps 80 bps (9 bps) (1 bps)
Mortgages 90+ day delinquencies 1.11% 1.50% 0.87% (39 bps) 24 bps
Other consumer loans 90+ day delinquencies 1.92% 2.09% 1.94% (17 bps) (2 bps)
Collectively assessed provisions to credit RWA 142 bps 154 bps 140 bps (12 bps) 2 bps
Balance sheet ($m)
Loans 688,218 693,059 719,678 (1) (4)
Total assets 889,459 911,946 967,662 (2) (8)
Deposits and other borrowings 585,401 591,131 582,920 (1) -
Total liabilities 817,358 843,872 900,016 (3) (9)
Total equity 72,101 68,074 67,646 6 7
Wealth Management
Average Group Funds ($bn) 220.9 200.2 224.6 10 (2)
Life insurance in-force premiums (Australia) ($m)7 943 953 1,208 (1) (22)
General insurance gross written premiums (Australia) ($m) 289 282 273 2 6
1. Averages are based on a six month period.2. Weighted average number of fully paid ordinary shares listed on the ASX for the relevant period less average Westpac shares held by
the Group (“Treasury shares”).3. The Board did not declare an interim dividend for First Half 2020.4. Liquidity coverage ratios is calculated on a quarterly average basis. Comparatives have been restated.5. Includes balances presented as held for sale.6. Stressed exposures include program managed loans 90 days plus and non-performing transaction managed loans.7. Refer to Section 3.5 Insurance key metrics for further details.
4 WESTPAC GROUP 2021 INTERIM FINANCIAL RESULTS
Group results
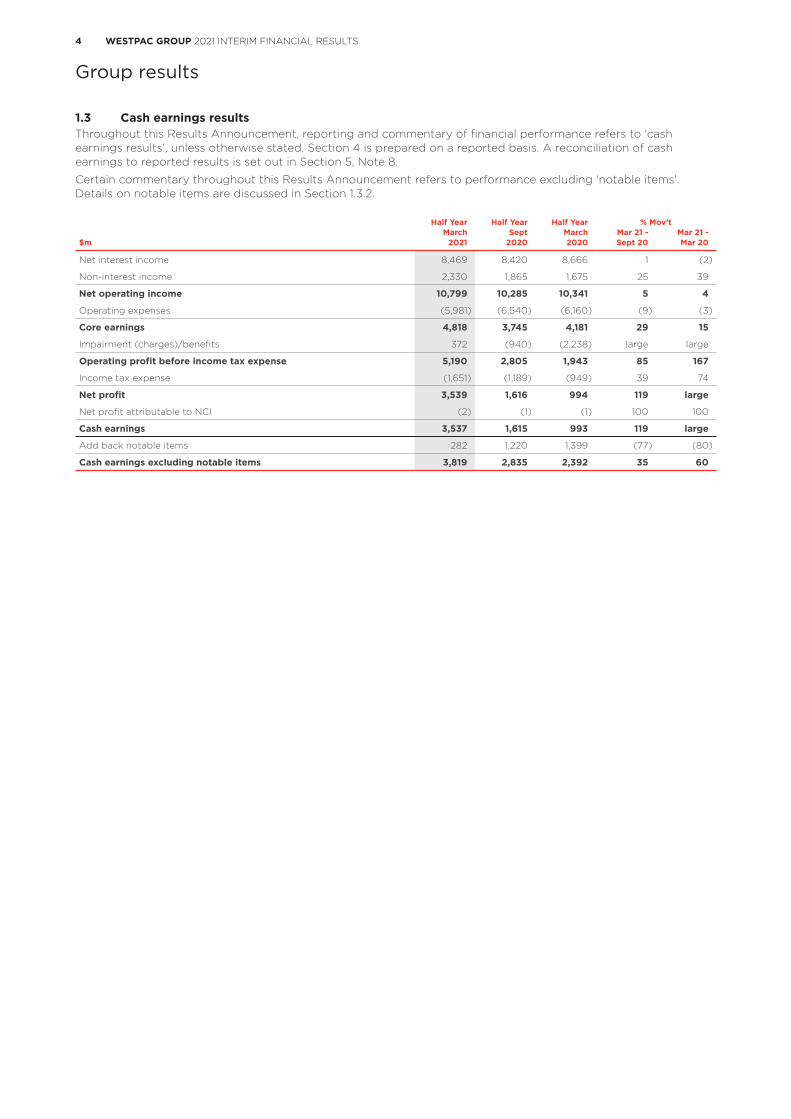
1.3 Cash earnings resultsThroughout this Results Announcement, reporting and commentary of financial performance refers to ‘cash earnings results’, unless otherwise stated. Section 4 is prepared on a reported basis. A reconciliation of cash earnings to reported results is set out in Section 5, Note 8.
Certain commentary throughout this Results Announcement refers to performance excluding ‘notable items’. Details on notable items are discussed in Section 1.3.2.
Half Year Half Year Half Year % Mov’tMarch Sept March Mar 21 - Mar 21 -
$m 2021 2020 2020 Sept 20 Mar 20
Net interest income 8,469 8,420 8,666 1 (2)
Non-interest income 2,330 1,865 1,675 25 39
Net operating income 10,799 10,285 10,341 5 4
Operating expenses (5,981) (6,540) (6,160) (9) (3)
Core earnings 4,818 3,745 4,181 29 15
Impairment (charges)/benefits 372 (940) (2,238) large large
Operating profit before income tax expense 5,190 2,805 1,943 85 167
Income tax expense (1,651) (1,189) (949) 39 74
Net profit 3,539 1,616 994 119 large
Net profit attributable to NCI (2) (1) (1) 100 100
Cash earnings 3,537 1,615 993 119 large
Add back notable items 282 1,220 1,399 (77) (80)
Cash earnings excluding notable items 3,819 2,835 2,392 35 60
5WESTPAC GROUP 2021 INTERIM FINANCIAL RESULTS
1 2
34
56
7
Group results
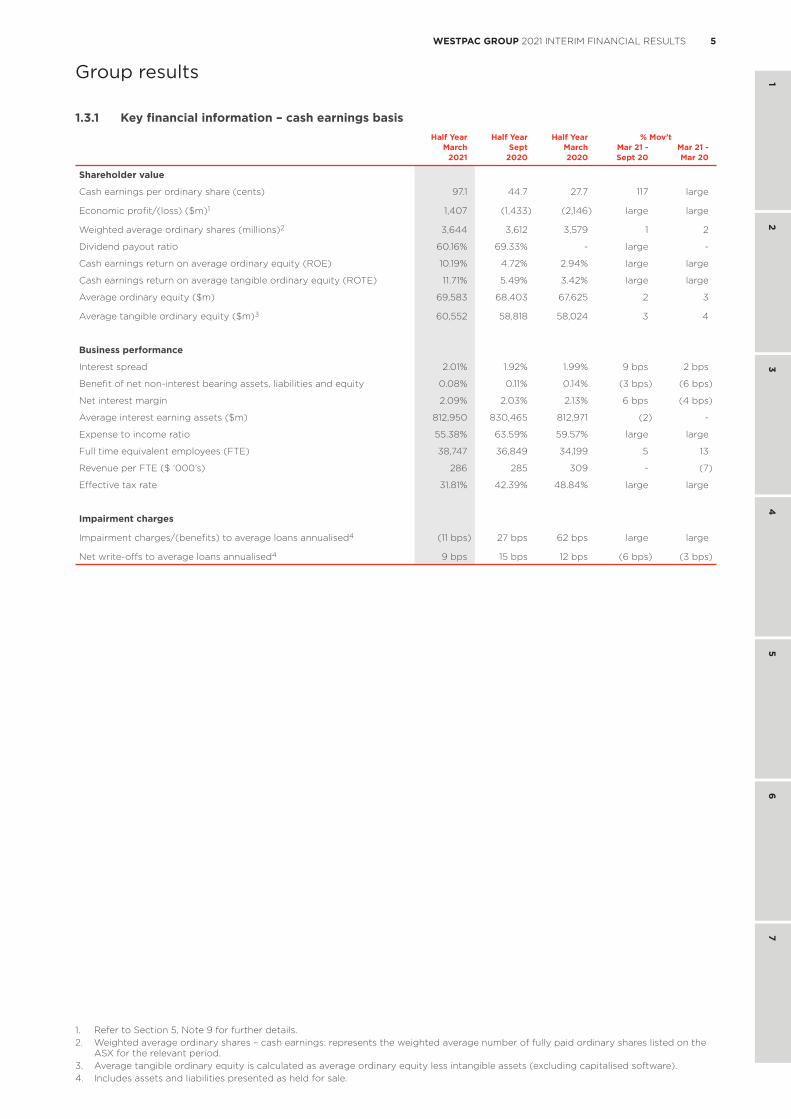
1.3.1 Key financial information – cash earnings basisHalf Year Half Year Half Year % Mov’t
March Sept March Mar 21 - Mar 21 -2021 2020 2020 Sept 20 Mar 20
Shareholder value
Cash earnings per ordinary share (cents) 97.1 44.7 27.7 117 large
Economic profit/(loss) ($m)1 1,407 (1,433) (2,146) large large
Weighted average ordinary shares (millions)2 3,644 3,612 3,579 1 2
Dividend payout ratio 60.16% 69.33% - large -
Cash earnings return on average ordinary equity (ROE) 10.19% 4.72% 2.94% large large
Cash earnings return on average tangible ordinary equity (ROTE) 11.71% 5.49% 3.42% large large
Average ordinary equity ($m) 69,583 68,403 67,625 2 3
Average tangible ordinary equity ($m)3 60,552 58,818 58,024 3 4
Business performance
Interest spread 2.01% 1.92% 1.99% 9 bps 2 bps
Benefit of net non-interest bearing assets, liabilities and equity 0.08% 0.11% 0.14% (3 bps) (6 bps)
Net interest margin 2.09% 2.03% 2.13% 6 bps (4 bps)
Average interest earning assets ($m) 812,950 830,465 812,971 (2) -
Expense to income ratio 55.38% 63.59% 59.57% large large
Full time equivalent employees (FTE) 38,747 36,849 34,199 5 13
Revenue per FTE ($ ‘000’s) 286 285 309 - (7)
Effective tax rate 31.81% 42.39% 48.84% large large
Impairment charges
Impairment charges/(benefits) to average loans annualised4 (11 bps) 27 bps 62 bps large large
Net write-offs to average loans annualised4 9 bps 15 bps 12 bps (6 bps) (3 bps)
1. Refer to Section 5, Note 9 for further details.2. Weighted average ordinary shares – cash earnings: represents the weighted average number of fully paid ordinary shares listed on the
ASX for the relevant period.3. Average tangible ordinary equity is calculated as average ordinary equity less intangible assets (excluding capitalised software).4. Includes assets and liabilities presented as held for sale.
6 WESTPAC GROUP 2021 INTERIM FINANCIAL RESULTS
Group results
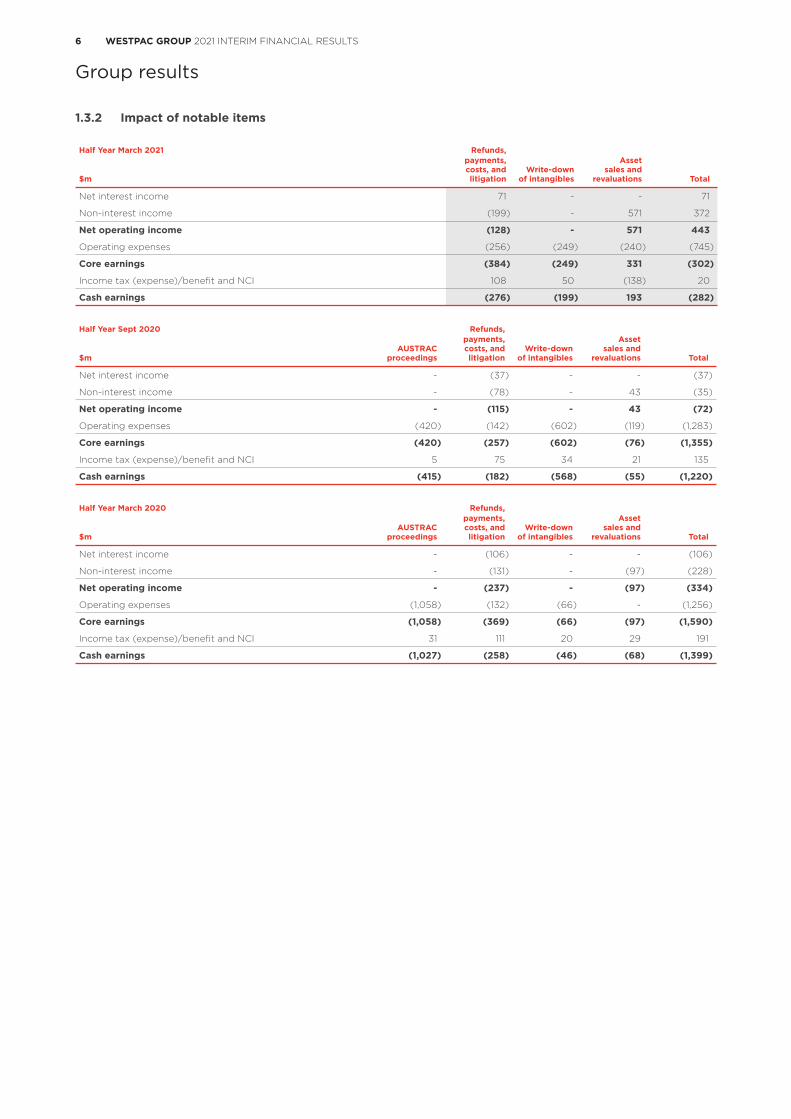
1.3.2 Impact of notable items
Half Year March 2021 Refunds,
$m
payments, costs, and litigation
Write-down of intangibles
Asset sales and
revaluations Total
Net interest income 71 - - 71
Non-interest income (199) - 571 372
Net operating income (128) - 571 443
Operating expenses (256) (249) (240) (745)
Core earnings (384) (249) 331 (302)
Income tax (expense)/benefit and NCI 108 50 (138) 20
Cash earnings (276) (199) 193 (282)
Half Year Sept 2020 Refunds,
$mAUSTRAC
proceedings
payments, costs, and litigation
Write-down of intangibles
Asset sales and
revaluations Total
Net interest income - (37) - - (37)
Non-interest income - (78) - 43 (35)
Net operating income - (115) - 43 (72)
Operating expenses (420) (142) (602) (119) (1,283)
Core earnings (420) (257) (602) (76) (1,355)
Income tax (expense)/benefit and NCI 5 75 34 21 135
Cash earnings (415) (182) (568) (55) (1,220)
Half Year March 2020 Refunds,
$mAUSTRAC
proceedings
payments, costs, and litigation
Write-down of intangibles
Asset sales and
revaluations Total
Net interest income - (106) - - (106)
Non-interest income - (131) - (97) (228)
Net operating income - (237) - (97) (334)
Operating expenses (1,058) (132) (66) - (1,256)
Core earnings (1,058) (369) (66) (97) (1,590)
Income tax (expense)/benefit and NCI 31 111 20 29 191
Cash earnings (1,027) (258) (46) (68) (1,399)
7WESTPAC GROUP 2021 INTERIM FINANCIAL RESULTS
1 2
34
56
7
Group results
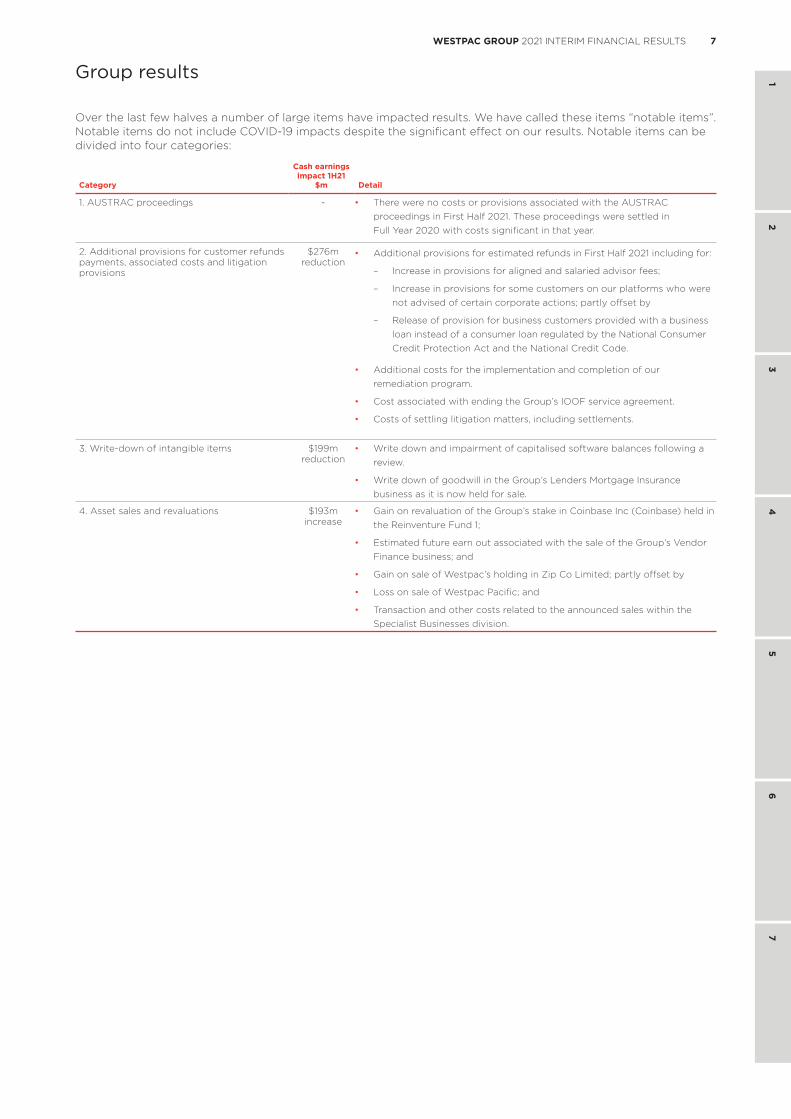
Over the last few halves a number of large items have impacted results. We have called these items “notable items”. Notable items do not include COVID-19 impacts despite the significant effect on our results. Notable items can be divided into four categories:
Category
Cash earnings impact 1H21
$m Detail
1. AUSTRAC proceedings - • There were no costs or provisions associated with the AUSTRAC proceedings in First Half 2021. These proceedings were settled in Full Year 2020 with costs significant in that year.
2. Additional provisions for customer refunds payments, associated costs and litigation provisions
$276m reduction
• Additional provisions for estimated refunds in First Half 2021 including for:
– Increase in provisions for aligned and salaried advisor fees;
– Increase in provisions for some customers on our platforms who were not advised of certain corporate actions; partly offset by
– Release of provision for business customers provided with a business loan instead of a consumer loan regulated by the National Consumer Credit Protection Act and the National Credit Code.
• Additional costs for the implementation and completion of our remediation program.
• Cost associated with ending the Group’s IOOF service agreement.
• Costs of settling litigation matters, including settlements.
3. Write-down of intangible items $199m reduction
• Write down and impairment of capitalised software balances following a review.
• Write down of goodwill in the Group’s Lenders Mortgage Insurance business as it is now held for sale.
4. Asset sales and revaluations $193m increase
• Gain on revaluation of the Group’s stake in Coinbase Inc (Coinbase) held in the Reinventure Fund 1;
• Estimated future earn out associated with the sale of the Group’s Vendor Finance business; and
• Gain on sale of Westpac’s holding in Zip Co Limited; partly offset by
• Loss on sale of Westpac Pacific; and
• Transaction and other costs related to the announced sales within the Specialist Businesses division.
8 WESTPAC GROUP 2021 INTERIM FINANCIAL RESULTS
Group results
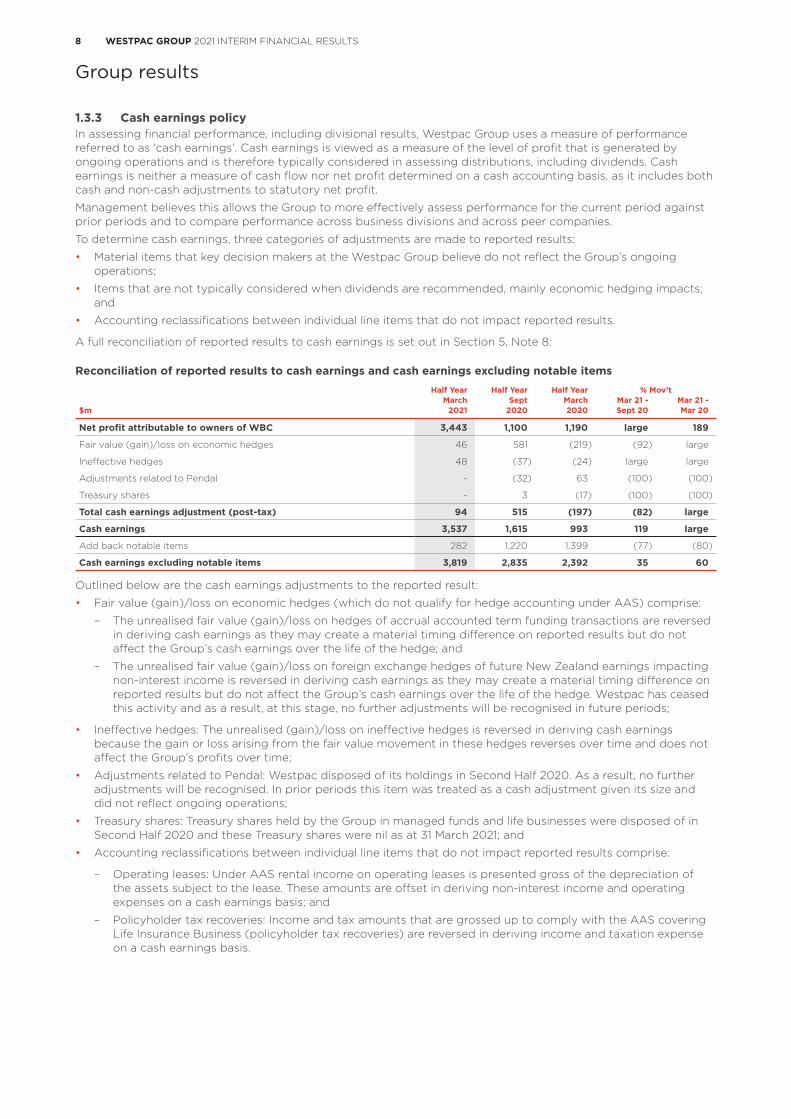
1.3.3 Cash earnings policyIn assessing financial performance, including divisional results, Westpac Group uses a measure of performance referred to as ‘cash earnings’. Cash earnings is viewed as a measure of the level of profit that is generated by ongoing operations and is therefore typically considered in assessing distributions, including dividends. Cash earnings is neither a measure of cash flow nor net profit determined on a cash accounting basis, as it includes both cash and non-cash adjustments to statutory net profit.
Management believes this allows the Group to more effectively assess performance for the current period against prior periods and to compare performance across business divisions and across peer companies.
To determine cash earnings, three categories of adjustments are made to reported results:
• Material items that key decision makers at the Westpac Group believe do not reflect the Group’s ongoing operations;
• Items that are not typically considered when dividends are recommended, mainly economic hedging impacts; and
• Accounting reclassifications between individual line items that do not impact reported results.
A full reconciliation of reported results to cash earnings is set out in Section 5, Note 8:
Reconciliation of reported results to cash earnings and cash earnings excluding notable itemsHalf Year Half Year Half Year % Mov’t
March Sept March Mar 21 - Mar 21 -$m 2021 2020 2020 Sept 20 Mar 20
Net profit attributable to owners of WBC 3,443 1,100 1,190 large 189
Fair value (gain)/loss on economic hedges 46 581 (219) (92) large
Ineffective hedges 48 (37) (24) large large
Adjustments related to Pendal - (32) 63 (100) (100)
Treasury shares - 3 (17) (100) (100)
Total cash earnings adjustment (post-tax) 94 515 (197) (82) large
Cash earnings 3,537 1,615 993 119 large
Add back notable items 282 1,220 1,399 (77) (80)
Cash earnings excluding notable items 3,819 2,835 2,392 35 60
Outlined below are the cash earnings adjustments to the reported result:
• Fair value (gain)/loss on economic hedges (which do not qualify for hedge accounting under AAS) comprise:
– The unrealised fair value (gain)/loss on hedges of accrual accounted term funding transactions are reversed in deriving cash earnings as they may create a material timing difference on reported results but do not affect the Group’s cash earnings over the life of the hedge; and
– The unrealised fair value (gain)/loss on foreign exchange hedges of future New Zealand earnings impacting non-interest income is reversed in deriving cash earnings as they may create a material timing difference on reported results but do not affect the Group’s cash earnings over the life of the hedge. Westpac has ceased this activity and as a result, at this stage, no further adjustments will be recognised in future periods;
• Ineffective hedges: The unrealised (gain)/loss on ineffective hedges is reversed in deriving cash earnings because the gain or loss arising from the fair value movement in these hedges reverses over time and does not affect the Group’s profits over time;
• Adjustments related to Pendal: Westpac disposed of its holdings in Second Half 2020. As a result, no further adjustments will be recognised. In prior periods this item was treated as a cash adjustment given its size and did not reflect ongoing operations;
• Treasury shares: Treasury shares held by the Group in managed funds and life businesses were disposed of in Second Half 2020 and these Treasury shares were nil as at 31 March 2021; and
• Accounting reclassifications between individual line items that do not impact reported results comprise:
– Operating leases: Under AAS rental income on operating leases is presented gross of the depreciation of the assets subject to the lease. These amounts are offset in deriving non-interest income and operating expenses on a cash earnings basis; and
– Policyholder tax recoveries: Income and tax amounts that are grossed up to comply with the AAS covering Life Insurance Business (policyholder tax recoveries) are reversed in deriving income and taxation expense on a cash earnings basis.

9WESTPAC GROUP 2021 INTERIM FINANCIAL RESULTS
1 2
34
56
7
Group results
1.3.4 Balance sheet presentation changesAs at 31 March 2021, Westpac has announced the sale of certain specialist businesses which include Westpac Vendor Finance business, Westpac General Insurance Limited, Westpac General Insurance Services Limited, Westpac Pacific and Westpac Lenders Mortgage Insurance Limited. The assets and liabilities of these businesses have been separately presented as assets held for sale and liabilities held for sale for First Half 2021. Comparatives were not restated for this change. Refer to Section 3.5 for cash earnings contribution of businesses held for sale and refer to Note 17 to the 2021 Interim Financial Report for further information.
1.3.5 This Results Announcement is unauditedPricewaterhouseCoopers has reviewed the financial statements contained within Section 4 of this Results Announcement and have issued an unmodified review report. All other sections, including the Directors’ Report in Section 4 of the Results Announcement have not been subject to review by PricewaterhouseCoopers. The financial information contained in this Results Announcement includes information extracted from the reviewed financial statements together with information that has not been reviewed. The cash earnings disclosed as part of this Results Announcement have not been separately reviewed by PricewaterhouseCoopers.
10 WESTPAC GROUP 2021 INTERIM FINANCIAL RESULTS
Group results
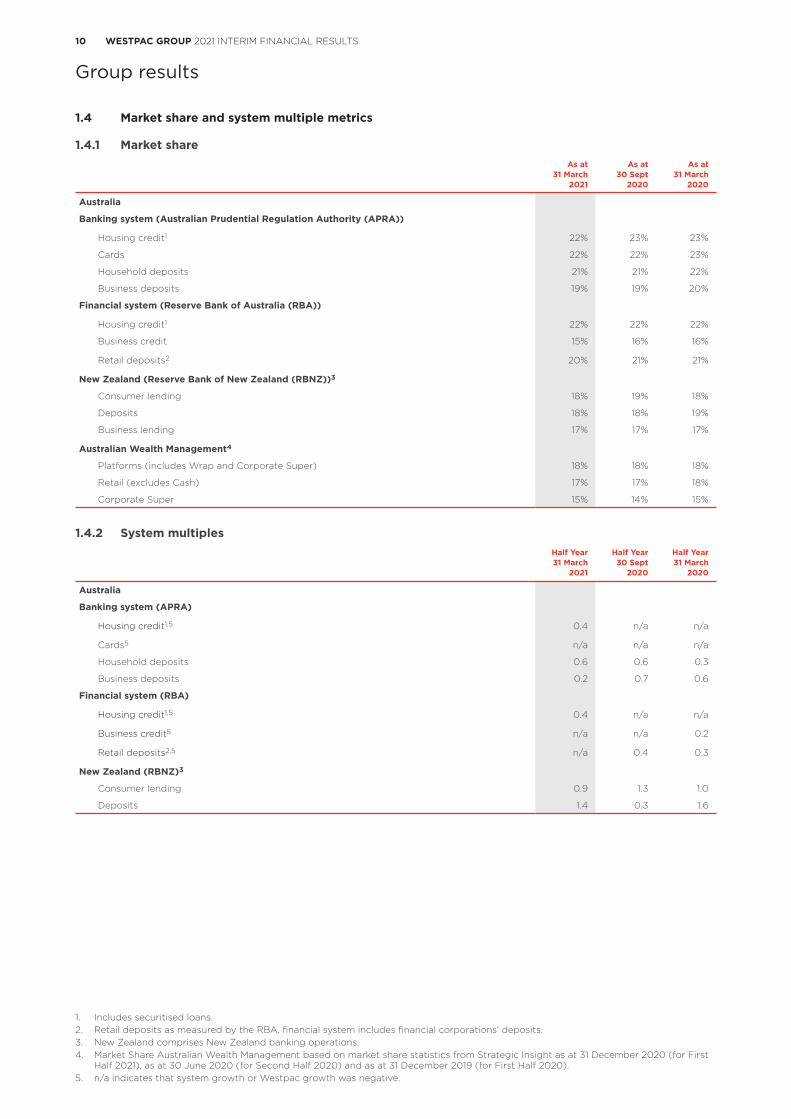
1.4 Market share and system multiple metrics
1.4.1 Market shareAs at As at As at
31 March 30 Sept 31 March2021 2020 2020
Australia
Banking system (Australian Prudential Regulation Authority (APRA))
Housing credit1 22% 23% 23%
Cards 22% 22% 23%
Household deposits 21% 21% 22%
Business deposits 19% 19% 20%
Financial system (Reserve Bank of Australia (RBA))
Housing credit1 22% 22% 22%
Business credit 15% 16% 16%
Retail deposits2 20% 21% 21%
New Zealand (Reserve Bank of New Zealand (RBNZ))3
Consumer lending 18% 19% 18%
Deposits 18% 18% 19%
Business lending 17% 17% 17%
Australian Wealth Management4
Platforms (includes Wrap and Corporate Super) 18% 18% 18%
Retail (excludes Cash) 17% 17% 18%
Corporate Super 15% 14% 15%
1.4.2 System multiplesHalf Year Half Year Half Year31 March 30 Sept 31 March
2021 2020 2020
Australia
Banking system (APRA)
Housing credit1,5 0.4 n/a n/a
Cards5 n/a n/a n/a
Household deposits 0.6 0.6 0.3
Business deposits 0.2 0.7 0.6
Financial system (RBA)
Housing credit1,5 0.4 n/a n/a
Business credit5 n/a n/a 0.2
Retail deposits2,5 n/a 0.4 0.3
New Zealand (RBNZ)3
Consumer lending 0.9 1.3 1.0
Deposits 1.4 0.3 1.6
1. Includes securitised loans.2. Retail deposits as measured by the RBA, financial system includes financial corporations’ deposits.3. New Zealand comprises New Zealand banking operations.4. Market Share Australian Wealth Management based on market share statistics from Strategic Insight as at 31 December 2020 (for First
Half 2021), as at 30 June 2020 (for Second Half 2020) and as at 31 December 2019 (for First Half 2020).5. n/a indicates that system growth or Westpac growth was negative.
11WESTPAC GROUP 2021 INTERIM FINANCIAL RESULTS
1 2
34
56
7
Review of Group operations
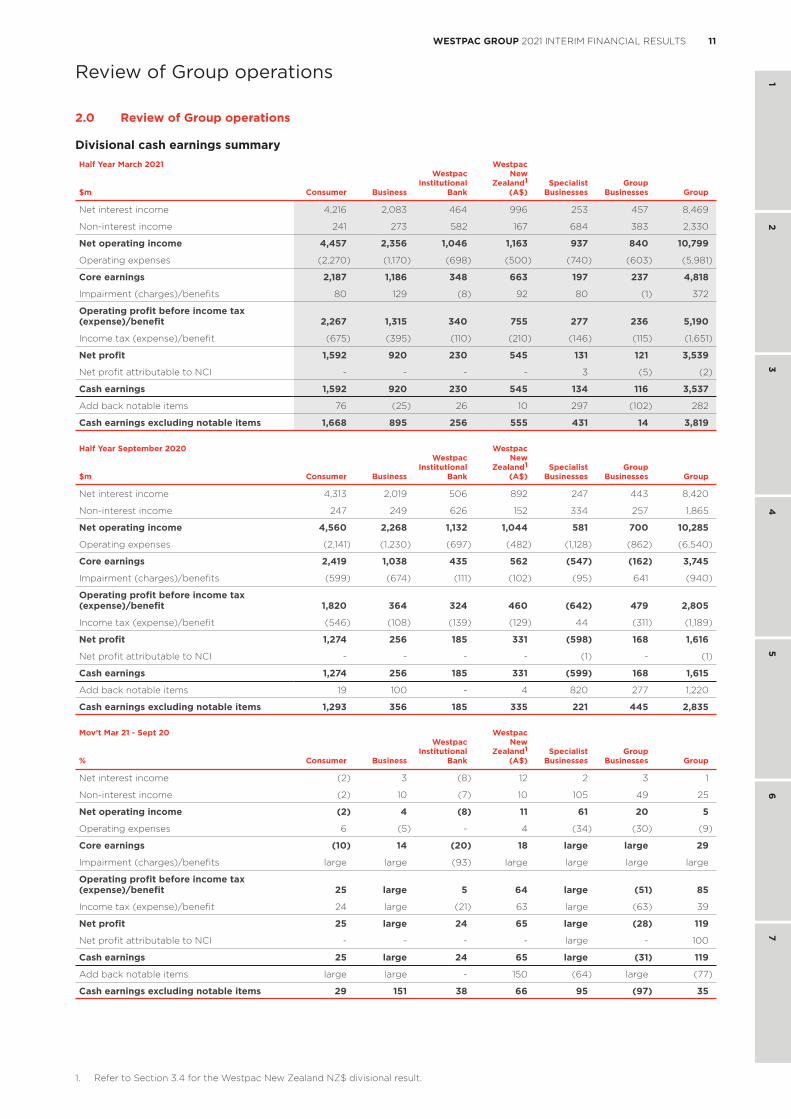
2.0 Review of Group operations
Divisional cash earnings summaryHalf Year March 2021
Consumer Business
Westpac Institutional
Bank
Westpac New
Zealand1
(A$)Specialist
BusinessesGroup
Businesses Group$m
Net interest income 4,216 2,083 464 996 253 457 8,469
Non-interest income 241 273 582 167 684 383 2,330
Net operating income 4,457 2,356 1,046 1,163 937 840 10,799
Operating expenses (2,270) (1,170) (698) (500) (740) (603) (5,981)
Core earnings 2,187 1,186 348 663 197 237 4,818
Impairment (charges)/benefits 80 129 (8) 92 80 (1) 372
Operating profit before income tax (expense)/benefit 2,267 1,315 340 755 277 236 5,190
Income tax (expense)/benefit (675) (395) (110) (210) (146) (115) (1,651)
Net profit 1,592 920 230 545 131 121 3,539
Net profit attributable to NCI - - - - 3 (5) (2)
Cash earnings 1,592 920 230 545 134 116 3,537
Add back notable items 76 (25) 26 10 297 (102) 282
Cash earnings excluding notable items 1,668 895 256 555 431 14 3,819
Half Year September 2020
Consumer Business
Westpac Institutional
Bank
Westpac New
Zealand1
(A$)Specialist
BusinessesGroup
Businesses Group$m
Net interest income 4,313 2,019 506 892 247 443 8,420
Non-interest income 247 249 626 152 334 257 1,865
Net operating income 4,560 2,268 1,132 1,044 581 700 10,285
Operating expenses (2,141) (1,230) (697) (482) (1,128) (862) (6,540)
Core earnings 2,419 1,038 435 562 (547) (162) 3,745
Impairment (charges)/benefits (599) (674) (111) (102) (95) 641 (940)
Operating profit before income tax (expense)/benefit 1,820 364 324 460 (642) 479 2,805
Income tax (expense)/benefit (546) (108) (139) (129) 44 (311) (1,189)
Net profit 1,274 256 185 331 (598) 168 1,616
Net profit attributable to NCI - - - - (1) - (1)
Cash earnings 1,274 256 185 331 (599) 168 1,615
Add back notable items 19 100 - 4 820 277 1,220
Cash earnings excluding notable items 1,293 356 185 335 221 445 2,835
Mov’t Mar 21 - Sept 20
Consumer Business
Westpac Institutional
Bank
Westpac New
Zealand1
(A$)Specialist
BusinessesGroup
Businesses Group%
Net interest income (2) 3 (8) 12 2 3 1
Non-interest income (2) 10 (7) 10 105 49 25
Net operating income (2) 4 (8) 11 61 20 5
Operating expenses 6 (5) - 4 (34) (30) (9)
Core earnings (10) 14 (20) 18 large large 29
Impairment (charges)/benefits large large (93) large large large large
Operating profit before income tax (expense)/benefit 25 large 5 64 large (51) 85
Income tax (expense)/benefit 24 large (21) 63 large (63) 39
Net profit 25 large 24 65 large (28) 119
Net profit attributable to NCI - - - - large - 100
Cash earnings 25 large 24 65 large (31) 119
Add back notable items large large - 150 (64) large (77)
Cash earnings excluding notable items 29 151 38 66 95 (97) 35
1. Refer to Section 3.4 for the Westpac New Zealand NZ$ divisional result.
12 WESTPAC GROUP 2021 INTERIM FINANCIAL RESULTS
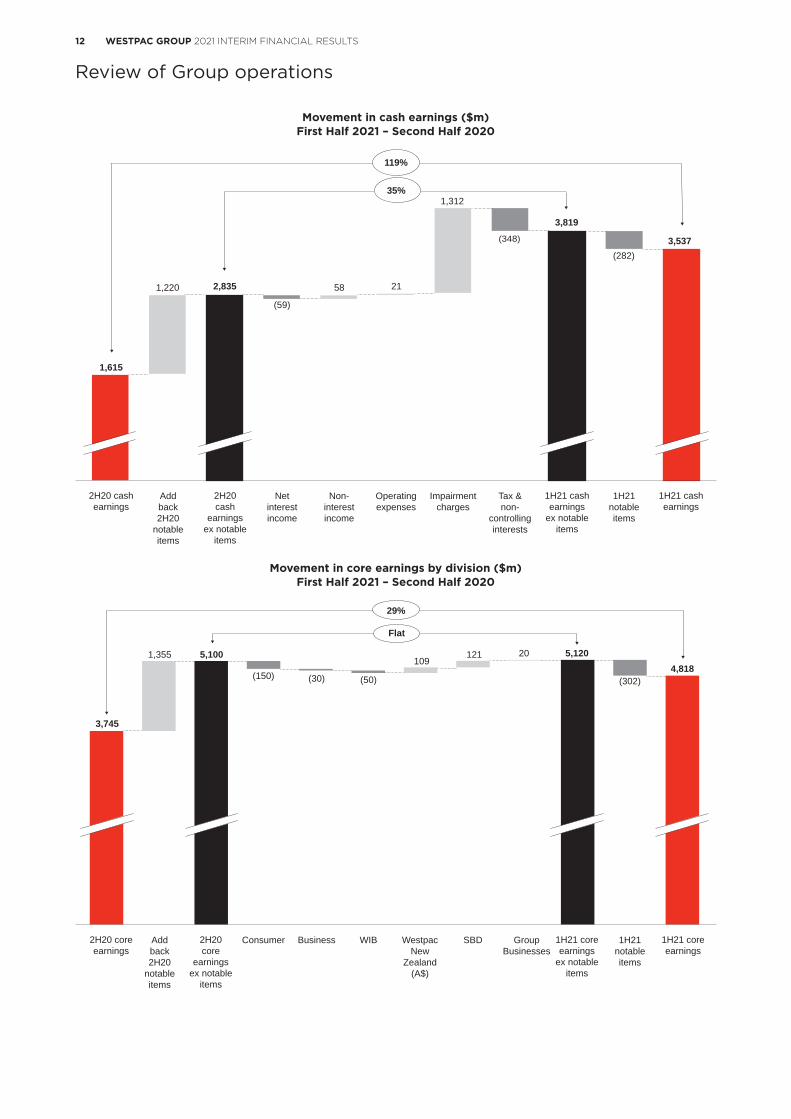
Review of Group operations
Movement in cash earnings ($m)First Half 2021 – Second Half 2020
2H20 cashearnings
Addback2H20
notableitems
2H20cash
earningsex notable
items
Netinterestincome
Non-interestincome
Operatingexpenses
Impairmentcharges
Tax &non-
controllinginterests
1H21 cashearnings
ex notableitems
1H21notableitems
1H21 cashearnings
1,615
1,220 2,835
(59)
58 21
1,312
(348)
3,819
(282)3,537
119%
35%
Movement in core earnings by division ($m)First Half 2021 – Second Half 2020
2H20 coreearnings
Addback2H20
notableitems
2H20core
earningsex notable
items
Consumer Business WIB WestpacNew
Zealand(A$)
SBD 1H21 coreearnings
ex notableitems
GroupBusinesses
1H21notableitems
1H21 coreearnings
3,745
1,355 5,100
(150) (30) (50)
109121 20 5,120
(302)4,818
29%
Flat
13WESTPAC GROUP 2021 INTERIM FINANCIAL RESULTS
1 2
34
56
7
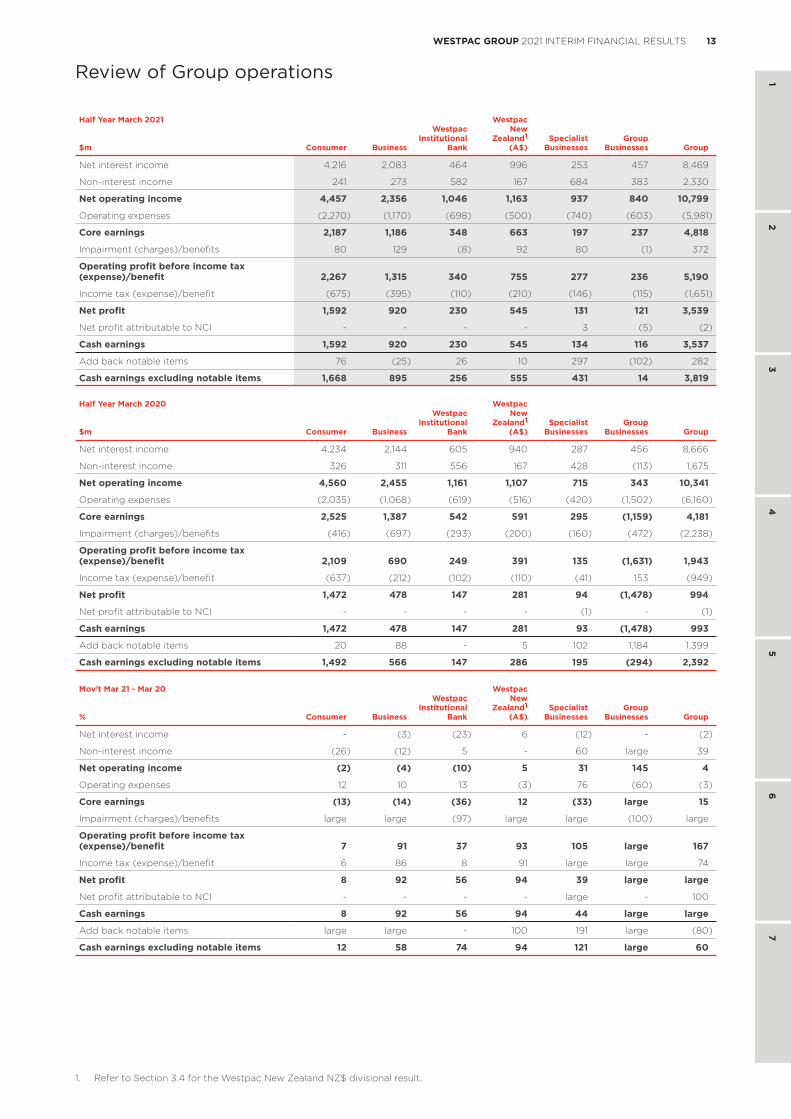
Review of Group operations
Half Year March 2021
Consumer Business
Westpac Institutional
Bank
Westpac New
Zealand1
(A$)Specialist
BusinessesGroup
Businesses Group$m
Net interest income 4,216 2,083 464 996 253 457 8,469
Non-interest income 241 273 582 167 684 383 2,330
Net operating income 4,457 2,356 1,046 1,163 937 840 10,799
Operating expenses (2,270) (1,170) (698) (500) (740) (603) (5,981)
Core earnings 2,187 1,186 348 663 197 237 4,818
Impairment (charges)/benefits 80 129 (8) 92 80 (1) 372
Operating profit before income tax (expense)/benefit 2,267 1,315 340 755 277 236 5,190
Income tax (expense)/benefit (675) (395) (110) (210) (146) (115) (1,651)
Net profit 1,592 920 230 545 131 121 3,539
Net profit attributable to NCI - - - - 3 (5) (2)
Cash earnings 1,592 920 230 545 134 116 3,537
Add back notable items 76 (25) 26 10 297 (102) 282
Cash earnings excluding notable items 1,668 895 256 555 431 14 3,819
Half Year March 2020
Consumer Business
Westpac Institutional
Bank
Westpac New
Zealand1
(A$)Specialist
BusinessesGroup
Businesses Group$m
Net interest income 4,234 2,144 605 940 287 456 8,666
Non-interest income 326 311 556 167 428 (113) 1,675
Net operating income 4,560 2,455 1,161 1,107 715 343 10,341
Operating expenses (2,035) (1,068) (619) (516) (420) (1,502) (6,160)
Core earnings 2,525 1,387 542 591 295 (1,159) 4,181
Impairment (charges)/benefits (416) (697) (293) (200) (160) (472) (2,238)
Operating profit before income tax (expense)/benefit 2,109 690 249 391 135 (1,631) 1,943
Income tax (expense)/benefit (637) (212) (102) (110) (41) 153 (949)
Net profit 1,472 478 147 281 94 (1,478) 994
Net profit attributable to NCI - - - - (1) - (1)
Cash earnings 1,472 478 147 281 93 (1,478) 993
Add back notable items 20 88 - 5 102 1,184 1,399
Cash earnings excluding notable items 1,492 566 147 286 195 (294) 2,392
Mov’t Mar 21 - Mar 20
Consumer Business
Westpac Institutional
Bank
Westpac New
Zealand1
(A$)Specialist
BusinessesGroup
Businesses Group%
Net interest income - (3) (23) 6 (12) - (2)
Non-interest income (26) (12) 5 - 60 large 39
Net operating income (2) (4) (10) 5 31 145 4
Operating expenses 12 10 13 (3) 76 (60) (3)
Core earnings (13) (14) (36) 12 (33) large 15
Impairment (charges)/benefits large large (97) large large (100) large
Operating profit before income tax (expense)/benefit 7 91 37 93 105 large 167
Income tax (expense)/benefit 6 86 8 91 large large 74
Net profit 8 92 56 94 39 large large
Net profit attributable to NCI - - - - large - 100
Cash earnings 8 92 56 94 44 large large
Add back notable items large large - 100 191 large (80)
Cash earnings excluding notable items 12 58 74 94 121 large 60
1. Refer to Section 3.4 for the Westpac New Zealand NZ$ divisional result.
14 WESTPAC GROUP 2021 INTERIM FINANCIAL RESULTS
Review of Group operations
Movement in cash earnings ($m)First Half 2021 – First Half 2020
1H20 cashearnings
Addback1H20
notableitems
1H20cash
earningsex notable
items
Netinterestincome
Non-interestincome
Operatingexpenses
Impairmentcharges
Tax &non-
controllinginterests
1H21 cashearnings
ex notableitems
1H21notableitems
1H21 cashearnings
993
1,399 2,392
(374)
55
(332)
2,610
(532)3,819
(282)3,537
256%
60%
Movement in core earnings by division ($m)First Half 2021 – First Half 2020
1H20 coreearnings
Addback1H20
notableitems
1H20core
earningsex notable
items
Consumer Business WIB WestpacNew
Zealand(A$)
GroupBusinesses
SBD 1H21 coreearnings
ex notableitems
1H21notableitems
1H21 coreearnings
4,181
1,590 5,771
(257)
(362)(157) (46)
79 92 5,120
(302)4,818
15%
(11%)
15WESTPAC GROUP 2021 INTERIM FINANCIAL RESULTS
1 2
34
56
7
Review of Group operations
2.1 Performance overview
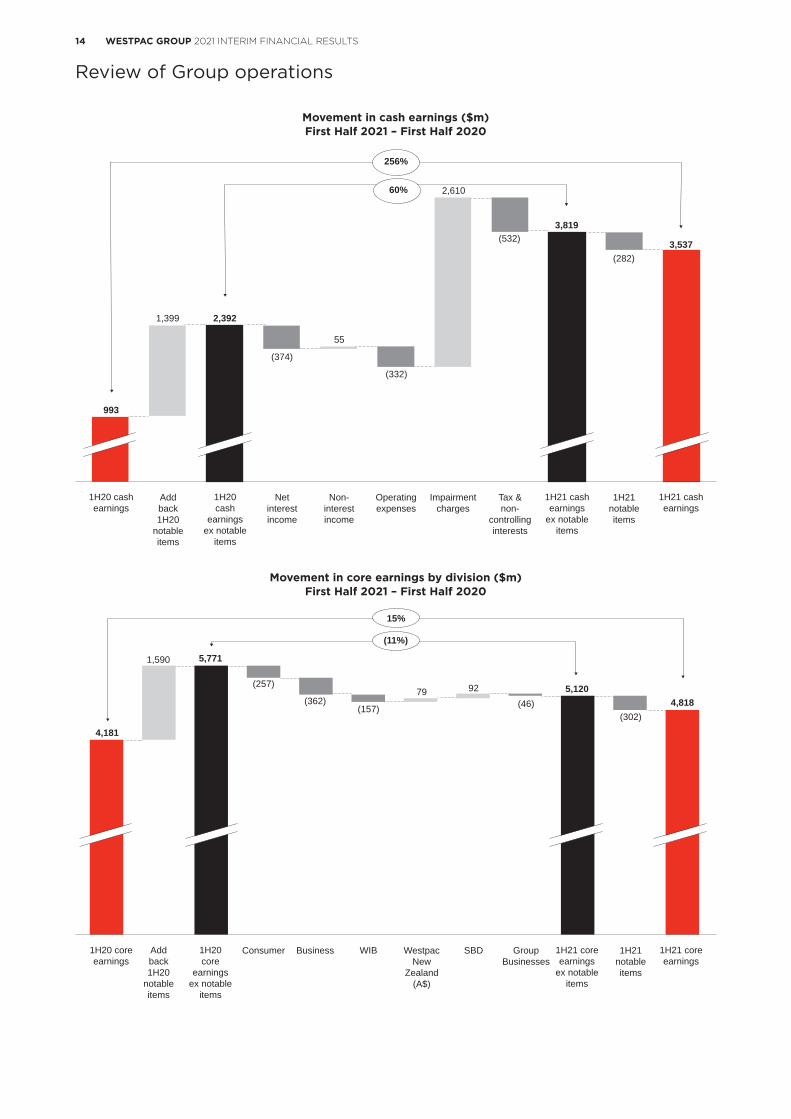
Overview First Half 2021 has been a period of progress for Westpac with higher cash earnings, a stronger balance sheet and momentum on our strategic priorities. Cash earnings for First Half 2021 were $3,537 million, up $1,922 million on Second Half 2020 and up $2,544 million on First Half 2020. Westpac’s cash return on equity was 10.2% in First Half 2021 while cash earnings per share were 97.1 cents per share, more than doubling over the half.
The increase in cash earnings in First Half 2021 compared to Second Half 2020 was predominantly due to a significant turnaround in impairment charges (a $918 million cash earnings increase) and a lower impact from large infrequent items (a $938 million cash earnings impact). In First Half 2021 these infrequent items included:
• Provisions for estimated customer refunds and payments and associated costs and litigation provisions;
• The write-down of intangible items, including goodwill; and
• The impact of asset sales and revaluations.
To help explain performance we have combined these infrequent items and called them “notable items”. Further detail on notable items is provided in Section 1.3.2 and Section 3.0. In aggregate, they reduced cash earnings in First Half 2021 by $282 million, by $1,220 million in Second Half 2020 and by $1,399 million in First Half 2020.
Excluding notable items, cash earnings for First Half 2021 were $3,819 million up $984 million or 35% on Second Half 2020 and up 60% on First Half 2020. The increase was mostly due to the impairment benefit from a combination of better credit quality metrics, a stronger operating environment and an improved economic outlook which meant that some impairment provisions, first booked in Full Year 2020, were no longer required.
Higher earnings, excluding notable items, were supported by a 3 basis point increase in margins and higher non-interest income, including from higher cards and platforms revenue. These were partly offset by a decline in lending and an increase in tax expense.
The rise in cash earnings contributed to a further strengthening of our balance sheet. Our common equity tier 1 (CET1) capital ratio increased 121 basis points to 12.34% while our funding and liquidity metrics are all comfortably above regulatory minimums. Given the improved results and higher capital the Board has determined to pay an interim ordinary dividend of 58 cents per share.
In 2020, Westpac underwent significant change with a new strategic direction, changes in the Board and management, establishment of the Specialist Businesses division to manage (and exit) non-core businesses and a reorganisation of our operations around a Lines of Business operating model. At the same time, we expanded initiatives to fix our issues, materially enhance our management of risk and improve our risk culture.
Supporting this change, we adopted a new purpose: “Helping Australians and New Zealanders succeed” which captures a key element of our culture of helping and reinforced our focus on service and customers. Recognising this new direction, we have aligned our strategy around three priorities; Fix, Simplify and Perform. In First Half 2021, we made good progress implementing our strategy and finalised our executive appointments including new roles of Chief Operating Officer and Group Executive Consumer & Business Banking. Developments under each priority are described below.
FixThis priority is focused on fixing our issues and lifting our control environment. This includes improving our management of risk, improving our risk culture and completing customer remediation as quickly as possible. Developments over First Half 2021 included:
• Expanding our CORE (Customer Outcomes and Risk Excellence) program to improve our financial and non-financial risk governance. The CORE program includes implementing the Integrated Plan, which was approved by APRA on 7 April 2021, with independent assurance reports to be completed by Promontory Australasia each quarter;
• Progressing customer remediation, paid over $200 million to approximately 570k customers in First Half 2021;
• ASIC and APRA both announced that no further action would be taken for matters relating to the AUSTRAC litigation following completion of their investigations;
• Improving our risk management capacity and capability with the addition of over 100 resources to:
– Support increased credit risk oversight to increase the speed and quality of decision making;
– Improve risk reporting through better data inputs, increasing automation of analysis and improving our tools for forecasting, behavioural analysis and provision modelling; and
– Lifting the quality and breadth of our stress testing.
• Progress in improving our financial crime program - over the last 18 months we have:
– Lifted capacity and capability via a 60% increase in the team;
– Addressed issues in the AUSTRAC Statement of Claim;
– Upgraded all risk assessment methodologies and monitoring solutions; and
– We are assessing high risk customers more frequently. More than doubling financial crime operations people investigating and reporting on Financial Crime - including suspicious matters.
Review of Group operations
16 WESTPAC GROUP 2021 INTERIM FINANCIAL RESULTS
Review of Group operations
While making progress, we recognise that following the Royal Commission into Misconduct in the Banking, Superannuation and Financial Services Industry, ASIC still has a number of investigations underway that primarily relate to our past practices and that these could result in further litigation, fines, penalties or other regulatory action. Our Contingent liabilities Note 14 to the Interim Financial Statements outlines these further.
SimplifyIn simplifying the business we are focused on three dimensions 1. portfolio simplification – the businesses we operate, 2. geographic simplification – where we operate, and 3. banking simplification – making it easier for our customers to bank with us, using digital to transform our operations.
Under portfolio simplification, our Specialist Businesses division was set up to manage the businesses we ultimately plan to exit. In First Half 2021 we:
• Entered into agreements to sell our General Insurance and Lenders Mortgage Insurance businesses, this followed the announced exit of Vendor Finance in Second Half 2020. Completion of these divestments is expected in Second Half 2021; and
• In New Zealand we completed the sale of our Wealth Advisory business.
Our remaining businesses for exit include our Auto Finance, Life Insurance and Superannuation, Investments and Platforms operations (SIP).
Geographic simplification has involved:
• The announced sale of Westpac Pacific comprising our PNG and Fiji businesses;
• Announcing the consolidation of our international operations, reducing our presence in Asia from 5 locations to a single hub in Singapore. The branches in Mumbai and Jakarta have now been closed with the remainder scheduled to close by the end of 2021; and
• Maintaining our presence in the key capital markets of New York and London and expanding our capability into Frankfurt in response to Brexit.
Banking simplification in First Half 2021 included:
• Combining the leadership of the Consumer and Business divisions into the Consumer & Business Banking division;
• Closing 49 branches across Australia and New Zealand and reducing the ATM network by a further 3%;
• Launching our new mobile banking iPhone app for all personal banking and sole trader customers;
• Removed around 100 customer fees to simplify how we operate, and improve the experience for customers; and
• Progressing the return of 1,000 offshore roles to Australia, with around 50% of the roles transitioned. This includes critical mortgage processes that were impacted through COVID-19.
PerformIn a low interest rate, highly competitive market it is vital that we improve our efficiency and effectiveness to improve shareholder returns and the sustainability of our dividends. Our Lines of Business operating model is key to this change facilitating greater clarity, better end-to-end process management and control, clearer accountability and speeding up decision making. In so doing we are enhancing service and optimising how we manage our business to generate appropriate returns.
Establishment of the mortgage line of business was a priority and provided end-to-end responsibility for all aspects of the mortgage process. This included origination, credit approvals, pricing and servicing. This new approach has enabled us to simplify all elements of the mortgage process and create a better experience for customers. Progress over the half included:
• Creating one digital origination process across all of our banking brands; and
• Implementing over 60 process and policy improvements to simplify the process for customers and bankers. This has led to less hand-offs across teams (including credit) and greater process consistency across brands and channels.
Key to improving financial performance is managing the business in a disciplined way across margins, expenses, asset quality and capital. It includes improving efficiency and in First Half 2021 we commenced our cost reset program, targeting an $8.0 billion cost base by FY24. While the benefits of this program will initially follow our simplification initiatives and migrating more activity to digital, we have also commenced work to clarify the resources needed to run a simpler organisation, completed an analysis of management layers, and continued to reduce our spending with third parties.
Supporting customersIn implementing our strategy, we have sharpened our focus on supporting customers. In First Half 2021, much of our attention was on assisting customers though the uncertainties created by COVID-19. Over 200,000 customers utilised COVID-19 deferral packages, helping them to manage their cash flows. While the vast majority of these customers have transitioned to full repayment, ongoing help has still been required for some affected customers.
17WESTPAC GROUP 2021 INTERIM FINANCIAL RESULTS
1 2
34
56
7
Review of Group operations
In addition, parts of Eastern Australia were also affected by significant floods in March this year and we provided around $6 million of emergency grants to almost 2,000 customers while also offering our natural disaster relief packages. We backed this support with a $10 million flood support fund.
Through the half we have continued to implement initiatives to help customers manage their finances or navigate difficult circumstances. Initiatives included:
• Enhancing the ability for customers to block their cards to limit online gambling;
• Implementing new measures to block inappropriate messages through payments channels; and
• Helping the more vulnerable in the community, with around 18,000 customers receiving assistance through our specialist team.
COVID-19COVID-19 has had a significant impact on economies and businesses around the globe, including on Westpac and its customers. These impacts were initially significant and far reaching and while the Australian and New Zealand economies have rebounded following the more severe shutdowns and social restrictions, some of the effects of the pandemic continue and could be long lasting. The effect of COVID-19 on Westpac can be broadly categorised into five impacts.
1. The economic impacts reduced loan demand, particularly in business lending, while low interest rates have contributed to lower net interest margins and put pressure on net interest income. However, low interest rates have reduced borrowing costs for customers and contributed to a rise in mortgage loan growth through First Half 2021.
2. In 2020, Westpac provided significant support to customers via repayment deferrals, fee waivers, special interest rates and special loans. These support measures have now been wound down and so the effect on net interest income and non-interest income has reduced. Where customers require further support we are providing this through our pre-existing hardship arrangements.
3. The economic impacts of COVID-19 led to a rise in stressed exposures. This contributed to a rise in impairment provisions in 2020 as we estimated potential losses. In First Half 2021 it became clear that the potential increase in stressed exposures will be less than initially expected, and after peaking around September 2020, the proportion of loans classified as stressed has now declined, although it has not returned to pre-pandemic levels. Despite the improving outlook, some uncertainty remains, and we will continue to monitor how customers manage the winding down of government assistance in determining impairment provisions.
4. Costs increased as we responded to higher demand for support, installed new safety measures into our locations and brought more roles back to Australia. Some of these costs will remain while we continue to focus on supporting customers and protecting employees through this time.
5. A stronger balance sheet through more capital, higher liquid assets and more customer deposits. These changes partly impact net interest income but also reduce returns from higher levels of capital.
Financial performance summary (First Half 2021 compared to Second Half 2020)Cash earnings for First Half 2021 were $3,537 million, up 119% on Second Half 2020. The result was higher due to a lower impact from notable items and an impairment benefit of $372 million compared to a $940 million impairment charge in Second Half 2020. Notable items are explained further in Section 1.3.2 and Section 3.0.
The cash earnings impact of notable items was $282 million in First Half 2021 (compared to $1,220 million in Second Half 2020). Excluding notable items, cash earnings were $3,819 million, up $984 million or 35% over Second Half 2020.
Net interest incomeNet interest income of $8,469 million was up 1% over the six months with a 6 basis point increase in net interest margins partly offset by a 2% decrease in average interest-earning assets. Excluding notable items, net interest income was lower (down $59 million).
Notable items in interest income were mostly related to provisions for customer refunds for business customers that were provided a business loan instead of a consumer loan regulated by the National Consumer Credit Protection Act and the National Credit Code. In First Half 2021 some of the provisions were no longer required and this increased net interest income.
The decline in average interest-earning assets was due to a 2% decline in average loans while average third party liquid assets were up 2% over the half.
On a spot basis, lending declined $3.0 billion (down <0.5%) mostly due to lower offshore lending, down $3.0 billion (28%)1 following our decision to consolidate our Asian points of presence. Australian business, institutional and personal lending were also lower (down 4%, 6% and 4% respectively). These declines were partly offset by higher Australian mortgages (up $2.6 billion) and a $1.7 billion increase in New Zealand lending (in $A terms). All the growth in New Zealand was in mortgages with a small decline in business lending.
In Australian mortgages, growth was concentrated in owner occupied lending which was up 3%, with first home buyers making up around 13% of the flow while investment lending was down 3%.
1. The movement in offshore lending includes offshore lending balances that are treated as held for sale.
18 WESTPAC GROUP 2021 INTERIM FINANCIAL RESULTS
Review of Group operations
Customer deposits were lower, down 1%, consistent with lower lending and the active management of spreads. Most of the decline was in offshore deposits in Asia, and in term deposits as customers preferred to keep their funds liquid. Australian at call balances were higher, up 3%, with stronger growth in transaction and savings deposits in the Consumer and Business divisions. New Zealand deposits were higher (up 3% in $A terms) in line with the rise in New Zealand lending.
Margins were up 6 basis points over the six months to 2.09%, while the margin excluding Treasury and Markets and notable items was 1.94%, up 3 basis points over the half. The higher margin was predominantly due to lower funding costs, including from deposits and the use of the RBA’s Term Funding Facility (TFF). Improved margins were partly offset by lower earnings on capital and from competition for new lending resulting in spreads below the portfolio average.
Non-interest incomeNon-interest income in First Half 2021 was up $465 million, or 25%. Excluding notable items, non-interest income was $58 million higher, up 3%.
Notable items benefited non-interest income by $372 million in First Half 2021 compared to a $35 million reduction in Second Half 2020. This benefit was due to the gain on the revaluation of Coinbase Inc. which added $546 million to non-interest income. This gain was partly offset by increased provisions for customer refunds in Advice and the write-down of some intangible items.
The 3% increase (excluding notable items) was predominantly due to:
• Higher insurance income from improved life insurance and lenders mortgage insurance contributions. These increases were partly offset by higher general insurance claims associated with seasonal weather events;
• An FX translation loss ($55 million) on the exit of our Mumbai branch incurred in Second Half 2020 led to an increase in Other income;
• Fee income increased from higher card fees as volumes rose and merchant fee waivers rolled off. These increases were partly offset by a reduction in fees from our simplification program which reduced the number of fees charged, and from higher ATM costs (contra revenue) following the sale of our offsite ATMs;
• Wealth income was lower from a further decline in fund margins as customers migrated to lower fee products partly offset by higher funds balances from improving markets; and
• Markets related income was lower with lower trading income and lower customer income mostly related to fixed income.
ExpensesOperating expenses were lower, down $559 million or 9% over the six months, with much of the decrease due to notable items. Excluding notable items expenses were down $21 million.
In First Half 2021 notable items in expenses were $745 million, including further provisions for remediation costs, litigation matters, the write-down of intangible assets and the cost of exiting our service agreement with IOOF. Performance fees linked to Reinventure (our fintech venture capital funds) following the revaluation of Coinbase were also higher. In Second Half 2020, notable items in expenses were $1,283 million including the final provision for the AUSTRAC penalty, write-downs of intangibles and provisions for remediation costs.
Through the half, we increased employees by 1,898 FTE, mainly in response to higher mortgage volumes and additional resources for risk and compliance programs. These increases were more than offset by lower restructuring expenses, increased use of leave provisions, a decline in some COVID-19 expenses and timing of project spend with more costs typically invested in the second half of the year. Costs of our distribution network were also lower following the closure of branches in Australia and New Zealand (49 in First Half 2021) and the prior sale of our offsite ATMs.
Asset quality and impairment chargesAfter initially deteriorating in 2020 from the economic impacts of COVID-19, credit quality metrics improved in First Half 2021. The improvement has been due to the success of government stimulus measures, better labour market conditions and the support provided to customers, including repayment deferrals.
Impaired assets to gross loans were 30 basis points at 31 March 2021 compared to 40 basis points at 30 September 2020. This was mostly due to a significant reduction in new impaired assets, with no new large impaired assets (>$50 million) emerging during the half. Stressed exposures to total committed exposures ended the six months at 1.60% compared to 1.91% at 30 September 2020. Delinquencies were also lower with mortgage 90+ day delinquencies down 39 basis points to 1.11% and other consumer 90+ day delinquencies down 17 basis points to 1.92%.
The improvement in credit quality, along with a better economic outlook, has meant that some provisions booked in Full Year 2020 were no longer required. This combined with the decline in lending led to an impairment benefit in First Half 2021 of $372 million. This compared to a $940 million impairment charge in Second Half 2020 – in aggregate, a $1.3 billion turnaround.
Total provision balances were lower over the half at $5.5 billion, down $655 million reflecting the improved economic conditions and outlook. Our ratio of total provisions to credit risk weighted assets was 1.59% at 31 March 2021, down from 1.71% at 30 September 2020. Our ratio of impaired asset provisions to impaired assets was 47%, up from 41% at September 2020.
19WESTPAC GROUP 2021 INTERIM FINANCIAL RESULTS
1 2
34
56
7
Review of Group operations
TaxThe Group booked a $1,651 million tax expense in First Half 2021 up 39% from Second Half 2020. The rise in tax paid was less than the 85% increase in earnings before tax as the effective tax rate reduced to 31.8%, down from 42.4% in Second Half 2020. The tax rate in First Half 2021 was close to Australia’s 30% corporate tax rate, while tax rates were higher in 2020 as the AUSTRAC penalty and some intangible asset write-downs were not tax deductible.
ROE and EPSThe large increase in cash earnings contributed to a significant increase in return and per share metrics, these increases were partly offset by increases in capital and a 2% rise in shares on issue. The cash earnings return on equity was 10.2% in First Half 2021 up from 4.7% for Second Half 2020. Cash earnings per ordinary share were 97.1 cents in First Half 2021, more than doubling from 44.7 cents over the prior six months.
Excluding notable items, cash earnings per share were 105 cents, compared to 78 cents for Second Half 2020, while the ROE was 11%.
Net tangible assets per share were $16.60 at 31 March 2021 up 6% over the past 6 months, due to the increase in capital over the half and lower intangible items.
CapitalThe Group’s capital position improved over the half with a CET1 ratio of 12.34% at 31 March 2021 up from 11.13% at 30 September 2020. The rise was due to the increase in cash earnings, a decline in risk weighted assets and lower capital deductions. The increase was also due to the full year dividend reinvestment plan being fully underwritten.
The Group’s funding and liquidity ratios remained comfortably above regulatory minimums with the average liquidity coverage ratio (LCR) for First Half 2021 of 124% and the net stable funding ratio (NSFR) ending the half at 123%.
DividendsThe Board determined an interim ordinary dividend of 58 cents per share, fully franked. This reflects a payout ratio of 60% based on cash earnings and 56% excluding notable items.
Based on the share price at 31 March 2021, the dividend equates to a yield of 4.8%.
No discount will be applied to the market price used to determine the number of shares issued under the DRP. The market price used to determine the number of shares issued under the DRP will be set over the 10 trading days commencing 19 May 2021. Westpac plans to neutralise the impact of the DRP and intends to arrange for the purchase of shares by a third party to satisfy the DRP for the 2021 interim dividend.
The 58 cent ordinary dividend is expected to be paid on 25 June 2021. After allowing for the 2021 interim ordinary dividend, the Group’s adjusted franking account balance was $3,560 million.
Bank LevyWestpac paid the Government’s Bank Levy of $195 million in First Half 2021. The Bank Levy in First Half 2021 was equal to 3.9% of cash earnings and is equivalent to 4 cents per share. The Bank Levy is included in net interest income where it reduced net interest margin by 5 basis points. In aggregate, taxes paid along with the Bank Levy give Westpac an adjusted effective tax rate of 34.3%.
Financial performance First Half 2021 – First Half 2020Cash earnings of $3,537 million were up $2,544 million or 256% over First Half 2020. The increase was principally due to a $2.6 billion positive movement in impairment charges ($1.8 billion after tax) and a lower notable items impact ($1.1 billion after tax). Excluding notable items, cash earnings were $3,819 million, up $1,427 million, or 60%.
Notable items for First Half 2021 reduced cash earnings by $282 million and included additional remediation and litigation costs, write-downs of intangible assets, cost of exiting the agreement with IOOF, and losses linked to the exit of Westpac Pacific. These costs were partly offset by a net gain on our investment in Coinbase of $288 million. In First Half 2020 notable items reduced cash earnings by $1,399 million which included provisions for the AUSTRAC penalty and provisions for refunds, payments, costs and litigation.
Net interest income was 2% lower over the prior corresponding period, with net interest margins 4 basis points lower. Average interest-earning assets were relatively flat over the prior corresponding period with lower lending offset by a rise in liquid assets. Total spot lending was 4% down over the year (down $29.6 billion) with the decline due to:
• Lower Australian lending split across mortgages (down $2.1 billion), business and institutional lending(down $12.4 billion) and other personal lending (down $3.4 billion);
• Lower NZ lending in $A terms. In $NZ, New Zealand lending was up $3.5 billion or 4% from growth inmortgages; and
• Reduced offshore lending mostly from a reduction in trade finance in Asia following our decision to consolidateour Asian points of presence.
20 WESTPAC GROUP 2021 INTERIM FINANCIAL RESULTS
Review of Group operations
Customer deposits increased $6.5 billion, lifting the customer deposit to loan ratio to 79.8%. Most of the deposit increase was in at call and non-interest bearing which increased $43.3 billion and $7.0 billion respectively. These increases were partly offset by lower term deposits.
Net interest margins were 4 basis points lower over the prior corresponding period with the margin, excluding Treasury and Markets and notable items, down 10 basis points. The decline was due to lower interest rates, loan competition and the mix impact from an increase in low yielding liquid assets. These decreases were partly offset by lower wholesale funding costs, including the cost of the TFF.
Non-interest income was up 39% over the prior corresponding period and was 3% higher excluding notable items. The increase excluding notable items was mainly due to higher insurance income across Life, General and Lenders Mortgage insurance. These gains were partly offset by lower wealth income from margin contraction and from lower trading income, including from the exit of energy trading.
Expenses were down 3% over the prior corresponding period due principally to lower notable items. Excluding notable items, expenses were up $332 million or 7%. The increase (excluding notable items) was mostly due to higher risk and compliance spending (including more staff), and employing more temporary and permanent employees to meet increased customer demands. These increases were partly offset by a reduction in the size of the distribution network.
Impairment charges were a benefit of $372 million in First Half 2021 compared to a cost of $2,238 million in First Half 2020, a $2.6 billion improvement. Individually assessed provisions were lower, mostly from a decline in new impaired assets and from collectively assessed provisions no longer required, consistent with the better asset quality and improving economic outlook.
Divisional performance summaryThe performance of each division between First Half 2021 compared to Second Half 2020 is discussed below. For a description of each division see Section 3.
ConsumerCash earnings of $1,592 million were $318 million (or 25%) higher than Second Half 2020, mostly from a $679 million turnaround in impairment charges ($476 million cash earnings impact). Notable items were $57 million higher over the prior half. Net interest income was down 2% with a 1% increase in lending more than offset by a 2 basis point contraction in net interest margin. Mortgage lending increased $5.5 billion, predominantly in owner occupied while investor lending decreased. The contraction in net interest margin was mostly related to elevated competition in mortgages, and portfolio mix impacts as customers shifted to lower spread fixed rate products, partly offset by lower funding costs and active management of deposit spreads. Non-interest income decreased 2%, mostly due to reduced revenue following the sale of our offsite ATMs and from the removal of certain fees as part of our simplification strategy. Expenses were 6% up from higher notable items, spending on risk and compliance programs and employing more resources in mortgage processing. The turnaround in impairment charges was principally due to the improved economic outlook.
BusinessCash earnings of $920 million were $664 million higher than Second Half 2020. Most of the improvement was due to an $803 million turnaround in impairment charges (moving from a charge to a benefit). Lower notable items (down $125 million) also contributed to the increase. Net interest income was up 3% although excluding notable items was down $44 million or 2%. The decline in net interest income (excluding notable items) was due to a 4% reduction in lending, partly offset by a 7 basis point expansion in margin. The expansion in net interest margin was mostly from a deposit mix shift to transaction and other at call accounts, along with term deposit spread management. Non-interest income was up 10% from the expiration of waivers on merchant fees introduced as part of COVID-19 support, as well as increased activity lifting card spending. Expenses (excluding notable items) increased $6 million or 1%, principally from increased risk, regulatory and compliance spend. The impairment benefit of $129 million was mostly due to collectively assessed provisions no longer required due to improving asset quality and a better economic outlook. Stressed assets to TCE decreased 10 basis points to 4.60% with the fall due to lower stress within the commercial portfolio and lower mortgage delinquencies.
Westpac Institutional BankCash earnings of $230 million were $45 million or 24% higher than Second Half 2020, primarily from a $103 million improvement in impairment charges. Operating income was 8% lower, from lower lending and a decline in financial markets revenue, partly offset by a 4 basis point expansion in net interest margin. Most of the decline in lending was in offshore (down $2.8 billion), reflecting the consolidation of our Asian operations. Non-interest income was lower (down $44 million) from lower trading income, primarily in fixed income trading. Customer markets income was also lower with reduced demand across all segments. These decreases were partly offset by derivative valuation adjustments and higher lending fees. Expenses were flat with decreased restructuring costs and lower professional services expenses, partly offset by increased software amortisation and higher notable items. An impairment charge of $8 million was recorded in First Half 2021, 93% lower than Second Half 2020 from a 47 basis point decrease in stressed exposures to TCE to 0.56% and lower collectively assessed provisions from an improvement in the economic outlook.
21WESTPAC GROUP 2021 INTERIM FINANCIAL RESULTS
1 2
34
56
7
Review of Group operations
Westpac New ZealandCash earnings of NZ$583 million were NZ$229 million (or 65%) higher than Second Half 2020. Net interest income was up 12%, from a 3% increase in lending and a 17 basis point expansion in net interest margin. Lending was concentrated in mortgages which increased 6%, partly offset by a decline in business lending as institutional customers continued to reduce gearing. The higher net interest margin was primarily due to higher deposit spreads from repricing and higher asset spreads. Non-interest income was up 9%. Excluding the NZ$8 million gain on sale of Wealth Advisory, non-interest income was up 4%, with higher cards related revenue partly offset by lower insurance income. Expenses were up 3% from increased technology spending and higher risk, regulatory and compliance costs, including implementing the RBNZ’s BS11 outsourcing requirements. An impairment benefit of $99 million was recorded (compared to an impairment charge of $109 million in Second Half 2020) as stressed exposures to TCE decreased 3 basis points to 1.56%, and mortgage 90+ day delinquencies decreased 19 basis points to 0.33%. The impairment benefit also reflected lower collectively assessed provisions from the improved economic outlook.
Following Reserve Bank of New Zealand (RBNZ) concerns around risk management and the management of liquidity, Westpac New Zealand Limited (WNZL) has been required to commission two independent reports under Section 95 of the RBNZ Act 1989. Further information in Section 4.1 Significant Developments.
Specialist BusinessesCash earnings were $134 million in First Half 2021 compared to a loss of $599 million in Second Half 2020, a $733 million improvement. Most of the improvement was due to a $523 million reduction in notable items while the contribution across the major business units (excluding notable items) was $210 million higher. Excluding notable items Superannuation, Investments and Platforms were up $67 million, Insurance was up $16 million while Banking was $127 million higher. Results of the major business lines (excluding notable items) included:
• Superannuation, Investments and Platforms cash earnings were $105 million, compared to $38 million in Second Half 2020. The rise was due to a higher contribution from platforms and superannuation with markets improving through the half. This was partly offset by lower margins and no contribution from Pendal following the sale of our remaining holding in Second Half 2020.
• Insurance recorded cash earnings of $165 million for First Half 2021, compared to $149 million in Second Half 2020. The rise was due to improved contribution from Life Insurance and Lenders Mortgage Insurance. These gains were partly offset by higher general insurance claims, consistent with more major weather events occurring in the first half of the year.
• Banking cash earnings (Auto, Vendor Finance and Westpac Pacific) recorded cash earnings of $161 million, compared to $34 million in Second Half 2020. Most of the increase was due to a turnaround in impairment charges (from a charge to a benefit) from the decline in the Auto book and improved asset quality.
Group Businesses Cash earnings of $116 million were 31% lower than Second Half 2020 cash earnings of $168 million. The contribution from Treasury was little changed over the half, with cash earnings of $299 million in First Half 2021 compared to $301 million in Second Half 2020. Notable items benefited earnings in First Half 2021 by $102 million, with net gains from a revaluation of our holdings in Coinbase partly offset by additional provisions required for Advice remediation. This compared to a reduction to earnings in Second Half 2020 of $277 million mostly due to AUSTRAC related provisions. Excluding notable items, cash earnings were $14 million in First Half 2021 down from $445 million. Most of the decline was due to an impairment benefit in Second Half 2020 compared to a small charge ($1 million) in First Half 2021. The provision benefit in Second Half 2020 was due to the allocation of centrally held provisions to divisions.
22 WESTPAC GROUP 2021 INTERIM FINANCIAL RESULTS
Review of Group operations
2.2 Review of earnings
2.2.1 Net interest income1 Half Year Half Year Half Year % Mov’t
March Sept March Mar 21 - Mar 21 -2021 2020 2020 Sept 20 Mar 20
Net interest Income ($m)
Net interest income excluding Treasury & Markets 7,942 7,894 8,155 1 (3)
Treasury net interest income2 482 459 444 5 9
Markets net interest income 45 67 67 (33) (33)
Net interest income 8,469 8,420 8,666 1 (2)
Add back notable items (71) 37 106 large large
Net interest income excluding notable items 8,398 8,457 8,772 (1) (4)
Average interest-earning assets ($m)
Loans3 648,767 664,871 675,273 (2) (4)
Third party liquid assets3,4 138,245 135,441 115,771 2 19
Other interest-earning assets3 25,938 30,153 21,927 (14) 18
Average interest-earning assets 812,950 830,465 812,971 (2) -
Net interest margin (%)
Group net interest margin 2.09% 2.03% 2.13% 6 bps (4 bps)
Group net interest margin excluding Treasury & Markets5 1.96% 1.90% 2.01% 6 bps (5 bps)
Excluding notable items (%)
Group net interest margin 2.07% 2.04% 2.16% 3 bps (9 bps)
Group net interest margin excluding Treasury & Markets5 1.94% 1.91% 2.04% 3 bps (10 bps)
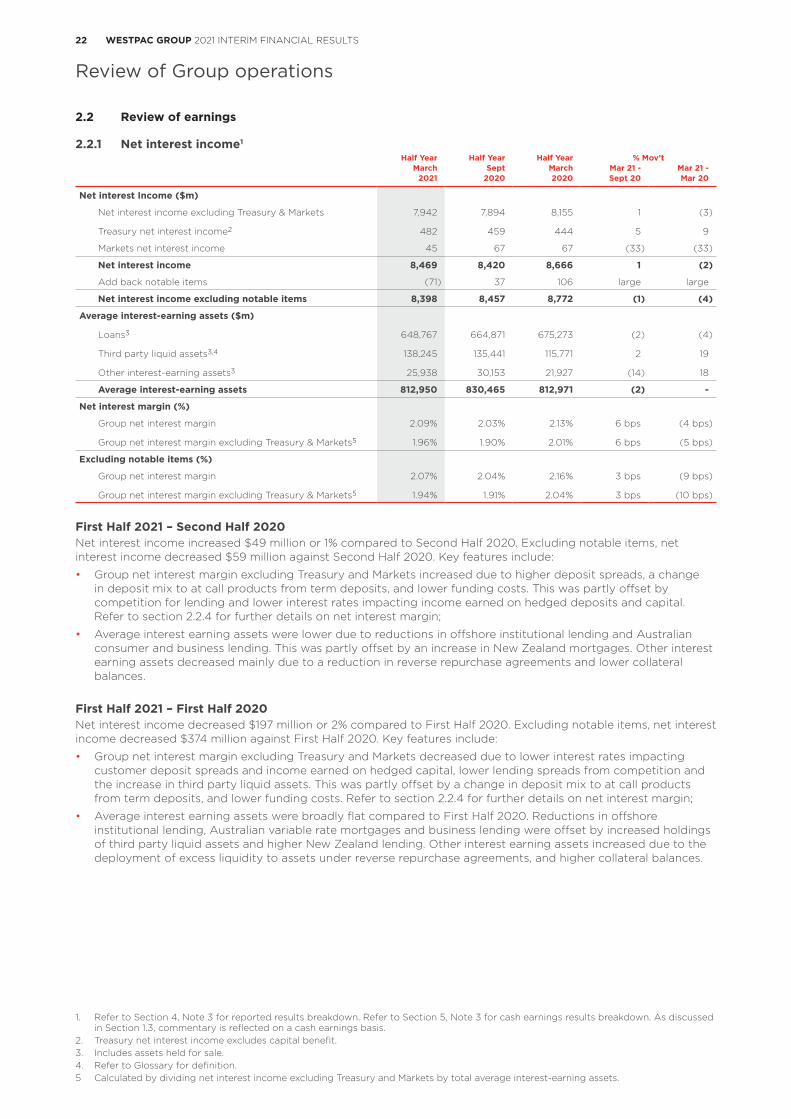
First Half 2021 – Second Half 2020 Net interest income increased $49 million or 1% compared to Second Half 2020. Excluding notable items, net interest income decreased $59 million against Second Half 2020. Key features include:
• Group net interest margin excluding Treasury and Markets increased due to higher deposit spreads, a change in deposit mix to at call products from term deposits, and lower funding costs. This was partly offset by competition for lending and lower interest rates impacting income earned on hedged deposits and capital. Refer to section 2.2.4 for further details on net interest margin;
• Average interest earning assets were lower due to reductions in offshore institutional lending and Australian consumer and business lending. This was partly offset by an increase in New Zealand mortgages. Other interest earning assets decreased mainly due to a reduction in reverse repurchase agreements and lower collateral balances.
First Half 2021 – First Half 2020 Net interest income decreased $197 million or 2% compared to First Half 2020. Excluding notable items, net interest income decreased $374 million against First Half 2020. Key features include:
• Group net interest margin excluding Treasury and Markets decreased due to lower interest rates impacting customer deposit spreads and income earned on hedged capital, lower lending spreads from competition and the increase in third party liquid assets. This was partly offset by a change in deposit mix to at call products from term deposits, and lower funding costs. Refer to section 2.2.4 for further details on net interest margin;
• Average interest earning assets were broadly flat compared to First Half 2020. Reductions in offshore institutional lending, Australian variable rate mortgages and business lending were offset by increased holdings of third party liquid assets and higher New Zealand lending. Other interest earning assets increased due to the deployment of excess liquidity to assets under reverse repurchase agreements, and higher collateral balances.
1. Refer to Section 4, Note 3 for reported results breakdown. Refer to Section 5, Note 3 for cash earnings results breakdown. As discussed in Section 1.3, commentary is reflected on a cash earnings basis.
2. Treasury net interest income excludes capital benefit.3. Includes assets held for sale.4. Refer to Glossary for definition.5 Calculated by dividing net interest income excluding Treasury and Markets by total average interest-earning assets.
Review of Group operations
23WESTPAC GROUP 2021 INTERIM FINANCIAL RESULTS
1 2
34
56
7
Review of Group operations
2.2.2 Loans
As at As at As at % Mov’t31 March 30 Sept 31 March Mar 21 - Mar 21 -
$m 2021 2020 2020 Sept 20 Mar 20
Australia 598,663 600,780 616,328 - (3)
Housing 443,557 440,933 445,663 1 -
Personal 16,458 17,081 19,854 (4) (17)
Business 142,965 147,584 155,322 (3) (8)
Provisions (4,317) (4,818) (4,511) (10) (4)
New Zealand (A$) 83,486 81,788 85,176 2 (2)
New Zealand (NZ$) 90,923 88,353 87,425 3 4
Housing 58,297 55,231 53,411 6 9
Personal 1,409 1,469 1,652 (4) (15)
Business 31,713 32,261 32,867 (2) (4)
Provisions (496) (608) (505) (18) (2)
Other overseas (A$) 6,069 10,491 18,174 (42) (67)
Total loans 688,218 693,059 719,678 (1) (4)
Loans held for sale1 1,819 - - - -
Total loans (including held for sale) 690,037 693,059 719,678 - (4)
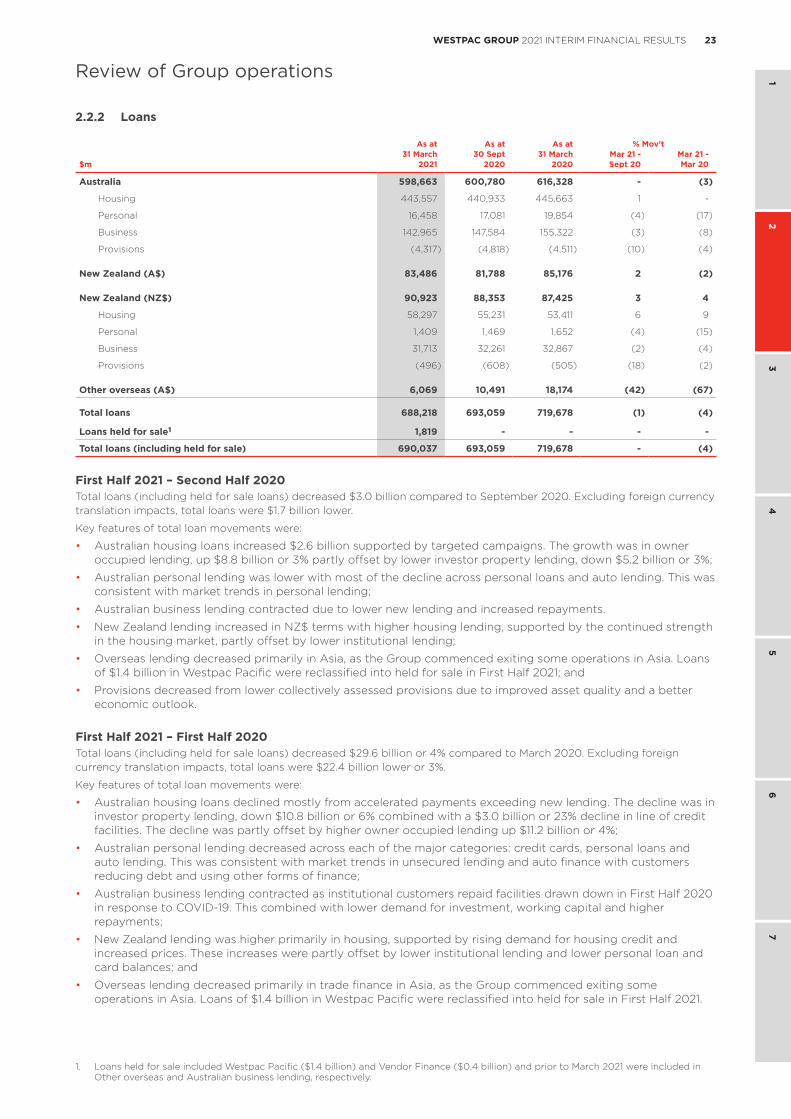
First Half 2021 – Second Half 2020Total loans (including held for sale loans) decreased $3.0 billion compared to September 2020. Excluding foreign currency translation impacts, total loans were $1.7 billion lower.
Key features of total loan movements were:
• Australian housing loans increased $2.6 billion supported by targeted campaigns. The growth was in owner occupied lending, up $8.8 billion or 3% partly offset by lower investor property lending, down $5.2 billion or 3%;
• Australian personal lending was lower with most of the decline across personal loans and auto lending. This was consistent with market trends in personal lending;
• Australian business lending contracted due to lower new lending and increased repayments.
• New Zealand lending increased in NZ$ terms with higher housing lending, supported by the continued strength in the housing market, partly offset by lower institutional lending;
• Overseas lending decreased primarily in Asia, as the Group commenced exiting some operations in Asia. Loans of $1.4 billion in Westpac Pacific were reclassified into held for sale in First Half 2021; and
• Provisions decreased from lower collectively assessed provisions due to improved asset quality and a better economic outlook.
First Half 2021 – First Half 2020Total loans (including held for sale loans) decreased $29.6 billion or 4% compared to March 2020. Excluding foreign currency translation impacts, total loans were $22.4 billion lower or 3%.
Key features of total loan movements were:
• Australian housing loans declined mostly from accelerated payments exceeding new lending. The decline was in investor property lending, down $10.8 billion or 6% combined with a $3.0 billion or 23% decline in line of credit facilities. The decline was partly offset by higher owner occupied lending up $11.2 billion or 4%;
• Australian personal lending decreased across each of the major categories: credit cards, personal loans and auto lending. This was consistent with market trends in unsecured lending and auto finance with customers reducing debt and using other forms of finance;
• Australian business lending contracted as institutional customers repaid facilities drawn down in First Half 2020 in response to COVID-19. This combined with lower demand for investment, working capital and higher repayments;
• New Zealand lending was higher primarily in housing, supported by rising demand for housing credit and increased prices. These increases were partly offset by lower institutional lending and lower personal loan and card balances; and
• Overseas lending decreased primarily in trade finance in Asia, as the Group commenced exiting some operations in Asia. Loans of $1.4 billion in Westpac Pacific were reclassified into held for sale in First Half 2021.
1. Loans held for sale included Westpac Pacific ($1.4 billion) and Vendor Finance ($0.4 billion) and prior to March 2021 were included in Other overseas and Australian business lending, respectively.
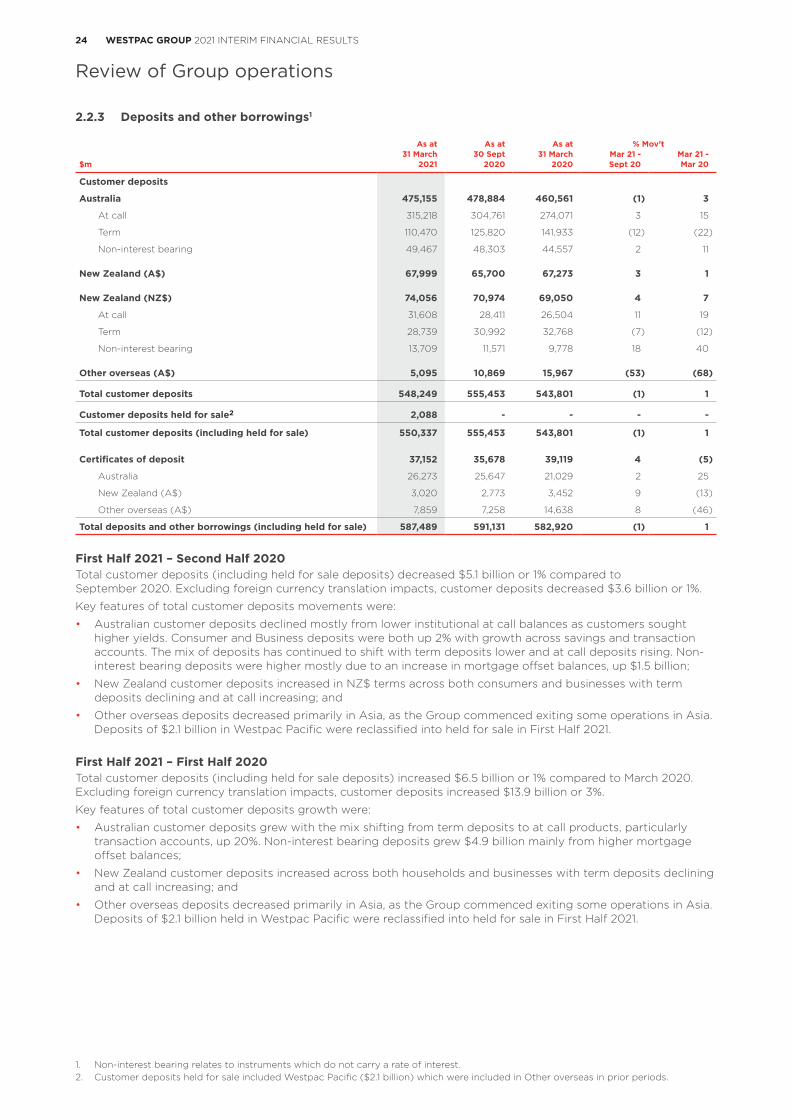
24 WESTPAC GROUP 2021 INTERIM FINANCIAL RESULTS
Review of Group operations
2.2.3 Deposits and other borrowings1
As at As at As at % Mov’t31 March 30 Sept 31 March Mar 21 - Mar 21 -
$m 2021 2020 2020 Sept 20 Mar 20
Customer deposits
Australia 475,155 478,884 460,561 (1) 3
At call 315,218 304,761 274,071 3 15
Term 110,470 125,820 141,933 (12) (22)
Non-interest bearing 49,467 48,303 44,557 2 11
New Zealand (A$) 67,999 65,700 67,273 3 1
New Zealand (NZ$) 74,056 70,974 69,050 4 7
At call 31,608 28,411 26,504 11 19
Term 28,739 30,992 32,768 (7) (12)
Non-interest bearing 13,709 11,571 9,778 18 40
Other overseas (A$) 5,095 10,869 15,967 (53) (68)
Total customer deposits 548,249 555,453 543,801 (1) 1
Customer deposits held for sale2 2,088 - - - -
Total customer deposits (including held for sale) 550,337 555,453 543,801 (1) 1
Certificates of deposit 37,152 35,678 39,119 4 (5)
Australia 26,273 25,647 21,029 2 25
New Zealand (A$) 3,020 2,773 3,452 9 (13)
Other overseas (A$) 7,859 7,258 14,638 8 (46)
Total deposits and other borrowings (including held for sale) 587,489 591,131 582,920 (1) 1
First Half 2021 – Second Half 2020Total customer deposits (including held for sale deposits) decreased $5.1 billion or 1% compared to September 2020. Excluding foreign currency translation impacts, customer deposits decreased $3.6 billion or 1%.
Key features of total customer deposits movements were:
• Australian customer deposits declined mostly from lower institutional at call balances as customers sought higher yields. Consumer and Business deposits were both up 2% with growth across savings and transaction accounts. The mix of deposits has continued to shift with term deposits lower and at call deposits rising. Non-interest bearing deposits were higher mostly due to an increase in mortgage offset balances, up $1.5 billion;
• New Zealand customer deposits increased in NZ$ terms across both consumers and businesses with term deposits declining and at call increasing; and
• Other overseas deposits decreased primarily in Asia, as the Group commenced exiting some operations in Asia. Deposits of $2.1 billion in Westpac Pacific were reclassified into held for sale in First Half 2021.
First Half 2021 – First Half 2020Total customer deposits (including held for sale deposits) increased $6.5 billion or 1% compared to March 2020. Excluding foreign currency translation impacts, customer deposits increased $13.9 billion or 3%.
Key features of total customer deposits growth were:
• Australian customer deposits grew with the mix shifting from term deposits to at call products, particularly transaction accounts, up 20%. Non-interest bearing deposits grew $4.9 billion mainly from higher mortgage offset balances;
• New Zealand customer deposits increased across both households and businesses with term deposits declining and at call increasing; and
• Other overseas deposits decreased primarily in Asia, as the Group commenced exiting some operations in Asia. Deposits of $2.1 billion held in Westpac Pacific were reclassified into held for sale in First Half 2021.
1. Non-interest bearing relates to instruments which do not carry a rate of interest.2. Customer deposits held for sale included Westpac Pacific ($2.1 billion) which were included in Other overseas in prior periods.
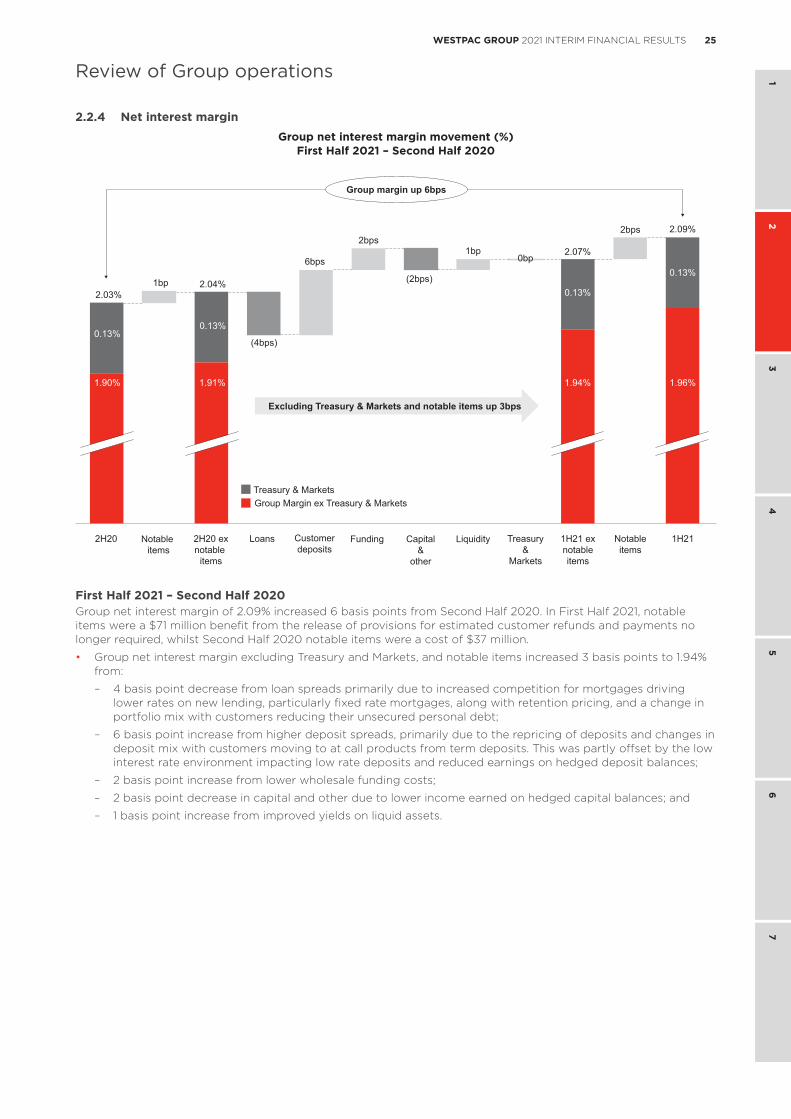
25WESTPAC GROUP 2021 INTERIM FINANCIAL RESULTS
1 2
34
56
7
Review of Group operations
2.2.4 Net interest margin Group net interest margin movement (%)
First Half 2021 – Second Half 2020
2H20 Notable items
2H20 exnotable
items
FundingLoans Customerdeposits
Capital&
other
Liquidity 1H21 exnotableitems
Treasury&
Markets
1H21Notableitems
2.03%
0.13%
1.90%
0.13%
0.13%
1.91% 1.94%
1bp
2bps
2.04%
(4bps)
2bps
0bp6bps
(2bps)
1bp 2.07%
0.13%
1.96%
2.09%
Group margin up 6bps
Treasury & MarketsGroup Margin ex Treasury & Markets
Excluding Treasury & Markets and notable items up 3bps
First Half 2021 – Second Half 2020 Group net interest margin of 2.09% increased 6 basis points from Second Half 2020. In First Half 2021, notable items were a $71 million benefit from the release of provisions for estimated customer refunds and payments no longer required, whilst Second Half 2020 notable items were a cost of $37 million.
• Group net interest margin excluding Treasury and Markets, and notable items increased 3 basis points to 1.94% from:
– 4 basis point decrease from loan spreads primarily due to increased competition for mortgages driving lower rates on new lending, particularly fixed rate mortgages, along with retention pricing, and a change in portfolio mix with customers reducing their unsecured personal debt;
– 6 basis point increase from higher deposit spreads, primarily due to the repricing of deposits and changes in deposit mix with customers moving to at call products from term deposits. This was partly offset by the low interest rate environment impacting low rate deposits and reduced earnings on hedged deposit balances;
– 2 basis point increase from lower wholesale funding costs;
– 2 basis point decrease in capital and other due to lower income earned on hedged capital balances; and
– 1 basis point increase from improved yields on liquid assets.
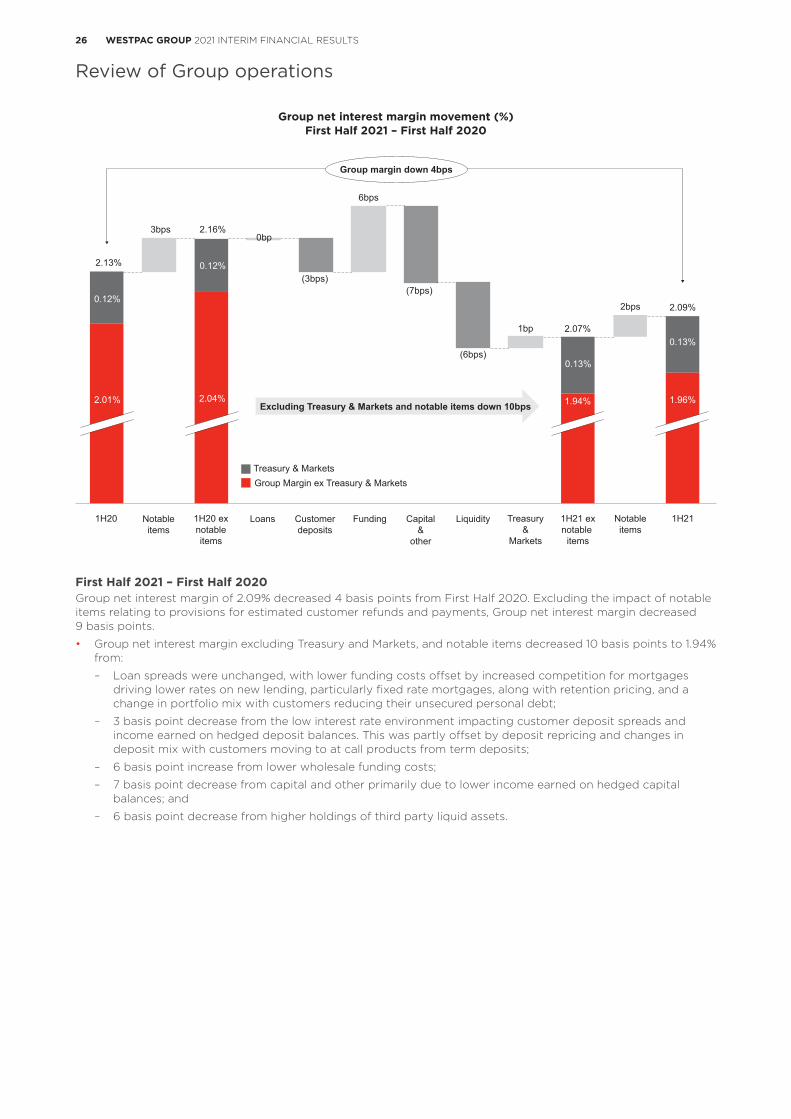
26 WESTPAC GROUP 2021 INTERIM FINANCIAL RESULTS
Review of Group operations
Group net interest margin movement (%) First Half 2021 – First Half 2020
Excluding Treasury & Markets and notable items down 10bps
1H20 Notableitems
1H20 exnotableitems
FundingLoans Customerdeposits
Capital&
other
Liquidity 1H21 exnotable
items
Treasury&
Markets
1H21Notableitems
2.13%
0.12%
2.01%
0.12%
0.13%
2.04% 1.94%
3bps
2bps
2.16%0bp
6bps
1bp
(3bps)(7bps)
(6bps)
2.07%
0.13%
1.96%
2.09%
Group margin down 4bps
Treasury & MarketsGroup Margin ex Treasury & Markets
0.13%
0.13%
First Half 2021 – First Half 2020Group net interest margin of 2.09% decreased 4 basis points from First Half 2020. Excluding the impact of notable items relating to provisions for estimated customer refunds and payments, Group net interest margin decreased 9 basis points.
• Group net interest margin excluding Treasury and Markets, and notable items decreased 10 basis points to 1.94% from:
– Loan spreads were unchanged, with lower funding costs offset by increased competition for mortgages driving lower rates on new lending, particularly fixed rate mortgages, along with retention pricing, and a change in portfolio mix with customers reducing their unsecured personal debt;
– 3 basis point decrease from the low interest rate environment impacting customer deposit spreads and income earned on hedged deposit balances. This was partly offset by deposit repricing and changes in deposit mix with customers moving to at call products from term deposits;
– 6 basis point increase from lower wholesale funding costs;
– 7 basis point decrease from capital and other primarily due to lower income earned on hedged capital balances; and
– 6 basis point decrease from higher holdings of third party liquid assets.
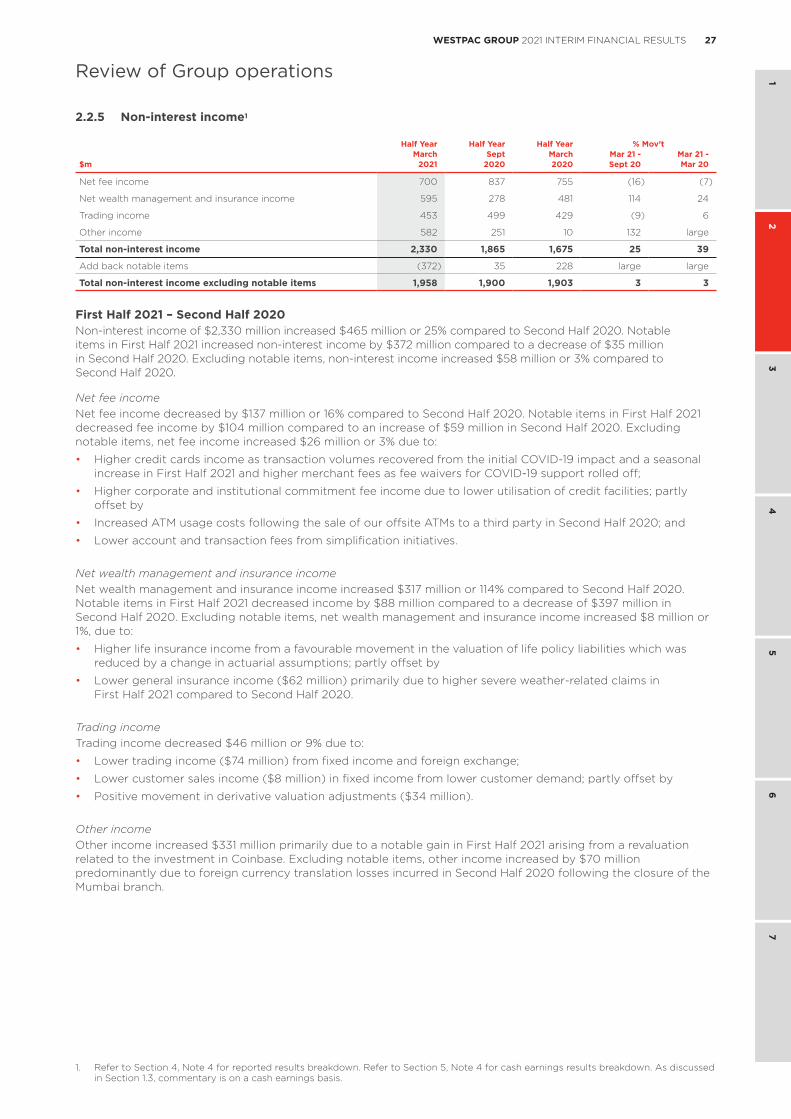
27WESTPAC GROUP 2021 INTERIM FINANCIAL RESULTS
1 2
34
56
7
Review of Group operations
2.2.5 Non-interest income1
Half Year Half Year Half Year % Mov’tMarch Sept March Mar 21 - Mar 21 -
$m 2021 2020 2020 Sept 20 Mar 20
Net fee income 700 837 755 (16) (7)
Net wealth management and insurance income 595 278 481 114 24
Trading income 453 499 429 (9) 6
Other income 582 251 10 132 large
Total non-interest income 2,330 1,865 1,675 25 39
Add back notable items (372) 35 228 large large
Total non-interest income excluding notable items 1,958 1,900 1,903 3 3
First Half 2021 – Second Half 2020Non-interest income of $2,330 million increased $465 million or 25% compared to Second Half 2020. Notable items in First Half 2021 increased non-interest income by $372 million compared to a decrease of $35 million in Second Half 2020. Excluding notable items, non-interest income increased $58 million or 3% compared to Second Half 2020.
Net fee incomeNet fee income decreased by $137 million or 16% compared to Second Half 2020. Notable items in First Half 2021 decreased fee income by $104 million compared to an increase of $59 million in Second Half 2020. Excluding notable items, net fee income increased $26 million or 3% due to:
• Higher credit cards income as transaction volumes recovered from the initial COVID-19 impact and a seasonal increase in First Half 2021 and higher merchant fees as fee waivers for COVID-19 support rolled off;
• Higher corporate and institutional commitment fee income due to lower utilisation of credit facilities; partly offset by
• Increased ATM usage costs following the sale of our offsite ATMs to a third party in Second Half 2020; and
• Lower account and transaction fees from simplification initiatives.
Net wealth management and insurance incomeNet wealth management and insurance income increased $317 million or 114% compared to Second Half 2020. Notable items in First Half 2021 decreased income by $88 million compared to a decrease of $397 million in Second Half 2020. Excluding notable items, net wealth management and insurance income increased $8 million or 1%, due to:
• Higher life insurance income from a favourable movement in the valuation of life policy liabilities which was reduced by a change in actuarial assumptions; partly offset by
• Lower general insurance income ($62 million) primarily due to higher severe weather-related claims in First Half 2021 compared to Second Half 2020.
Trading incomeTrading income decreased $46 million or 9% due to:
• Lower trading income ($74 million) from fixed income and foreign exchange;
• Lower customer sales income ($8 million) in fixed income from lower customer demand; partly offset by
• Positive movement in derivative valuation adjustments ($34 million).
Other incomeOther income increased $331 million primarily due to a notable gain in First Half 2021 arising from a revaluation related to the investment in Coinbase. Excluding notable items, other income increased by $70 million predominantly due to foreign currency translation losses incurred in Second Half 2020 following the closure of the Mumbai branch.
1. Refer to Section 4, Note 4 for reported results breakdown. Refer to Section 5, Note 4 for cash earnings results breakdown. As discussed in Section 1.3, commentary is on a cash earnings basis.
Review of Group operations
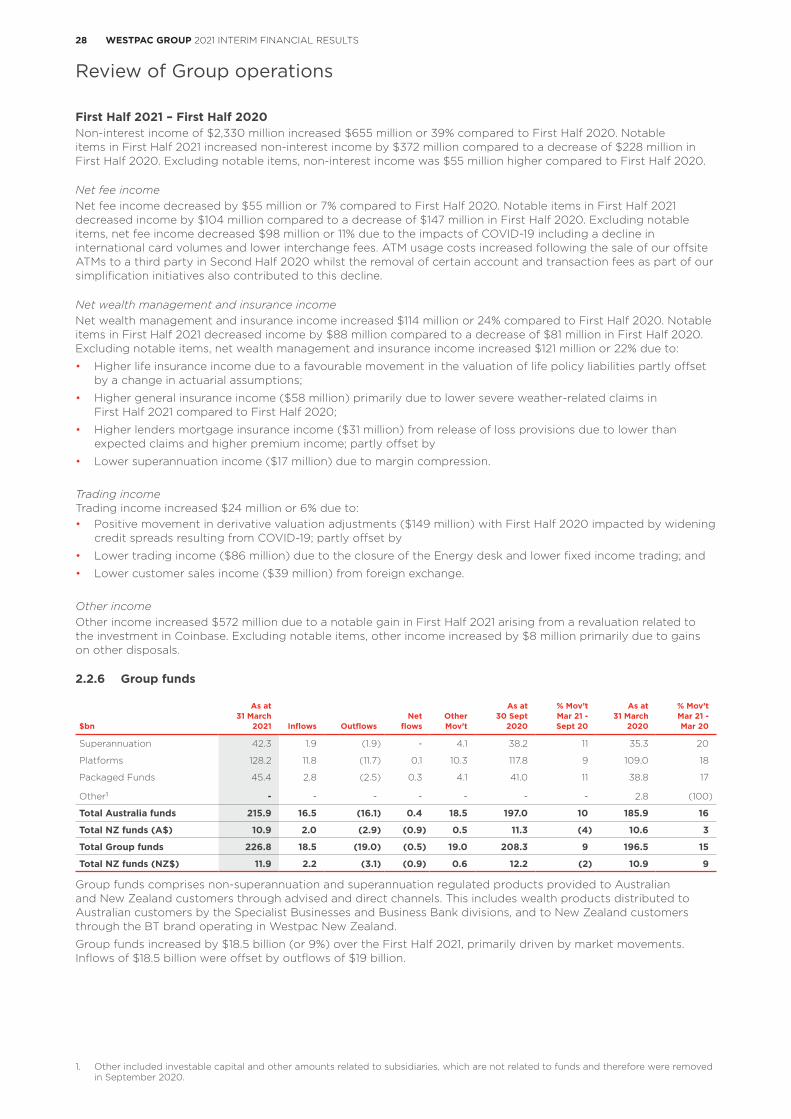
28 WESTPAC GROUP 2021 INTERIM FINANCIAL RESULTS
Review of Group operations
First Half 2021 – First Half 2020Non-interest income of $2,330 million increased $655 million or 39% compared to First Half 2020. Notable items in First Half 2021 increased non-interest income by $372 million compared to a decrease of $228 million in First Half 2020. Excluding notable items, non-interest income was $55 million higher compared to First Half 2020.
Net fee incomeNet fee income decreased by $55 million or 7% compared to First Half 2020. Notable items in First Half 2021 decreased income by $104 million compared to a decrease of $147 million in First Half 2020. Excluding notable items, net fee income decreased $98 million or 11% due to the impacts of COVID-19 including a decline in international card volumes and lower interchange fees. ATM usage costs increased following the sale of our offsite ATMs to a third party in Second Half 2020 whilst the removal of certain account and transaction fees as part of our simplification initiatives also contributed to this decline.
Net wealth management and insurance incomeNet wealth management and insurance income increased $114 million or 24% compared to First Half 2020. Notable items in First Half 2021 decreased income by $88 million compared to a decrease of $81 million in First Half 2020. Excluding notable items, net wealth management and insurance income increased $121 million or 22% due to:
• Higher life insurance income due to a favourable movement in the valuation of life policy liabilities partly offset by a change in actuarial assumptions;
• Higher general insurance income ($58 million) primarily due to lower severe weather-related claims in First Half 2021 compared to First Half 2020;
• Higher lenders mortgage insurance income ($31 million) from release of loss provisions due to lower than expected claims and higher premium income; partly offset by
• Lower superannuation income ($17 million) due to margin compression.
Trading income Trading income increased $24 million or 6% due to:• Positive movement in derivative valuation adjustments ($149 million) with First Half 2020 impacted by widening
credit spreads resulting from COVID-19; partly offset by
• Lower trading income ($86 million) due to the closure of the Energy desk and lower fixed income trading; and
• Lower customer sales income ($39 million) from foreign exchange.
Other incomeOther income increased $572 million due to a notable gain in First Half 2021 arising from a revaluation related to the investment in Coinbase. Excluding notable items, other income increased by $8 million primarily due to gains on other disposals.
2.2.6 Group funds
As at As at % Mov’t As at % Mov’t31 March Net Other 30 Sept Mar 21 - 31 March Mar 21 -
$bn 2021 Inflows Outflows flows Mov’t 2020 Sept 20 2020 Mar 20
Superannuation 42.3 1.9 (1.9) - 4.1 38.2 11 35.3 20
Platforms 128.2 11.8 (11.7) 0.1 10.3 117.8 9 109.0 18
Packaged Funds 45.4 2.8 (2.5) 0.3 4.1 41.0 11 38.8 17
Other1 - - - - - - - 2.8 (100)
Total Australia funds 215.9 16.5 (16.1) 0.4 18.5 197.0 10 185.9 16
Total NZ funds (A$) 10.9 2.0 (2.9) (0.9) 0.5 11.3 (4) 10.6 3
Total Group funds 226.8 18.5 (19.0) (0.5) 19.0 208.3 9 196.5 15
Total NZ funds (NZ$) 11.9 2.2 (3.1) (0.9) 0.6 12.2 (2) 10.9 9
Group funds comprises non-superannuation and superannuation regulated products provided to Australian and New Zealand customers through advised and direct channels. This includes wealth products distributed to Australian customers by the Specialist Businesses and Business Bank divisions, and to New Zealand customers through the BT brand operating in Westpac New Zealand.
Group funds increased by $18.5 billion (or 9%) over the First Half 2021, primarily driven by market movements. Inflows of $18.5 billion were offset by outflows of $19 billion.
1. Other included investable capital and other amounts related to subsidiaries, which are not related to funds and therefore were removed in September 2020.
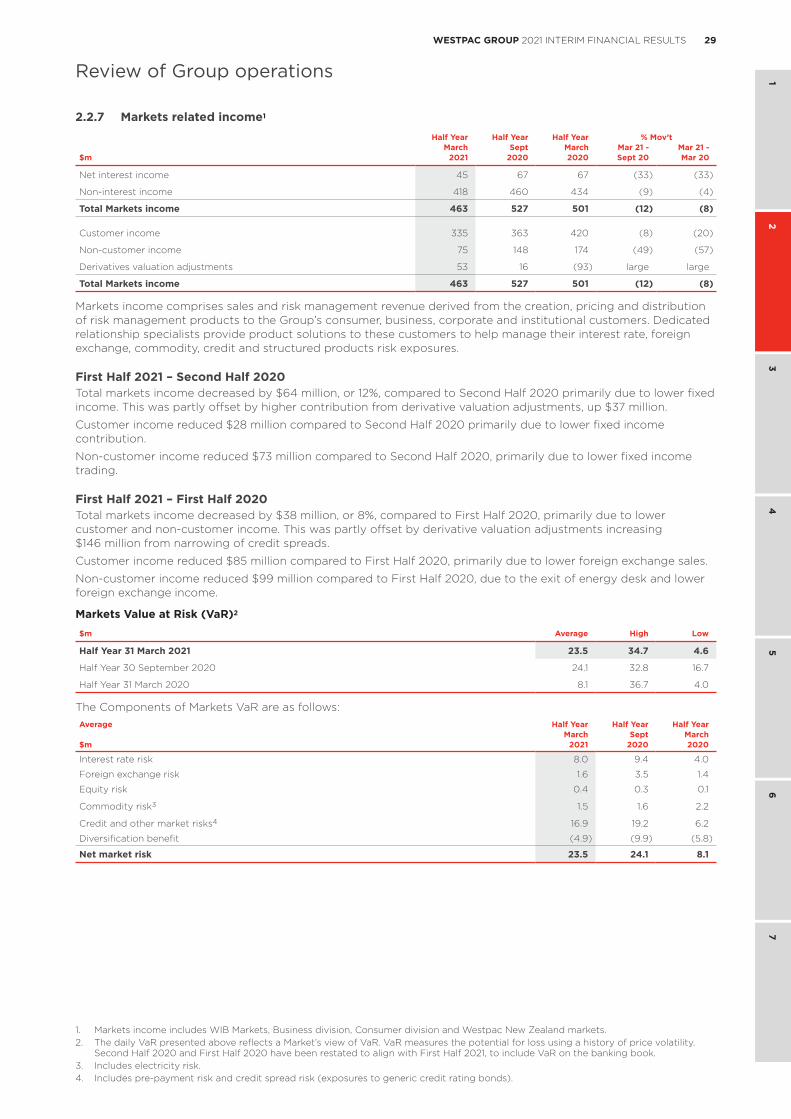
29WESTPAC GROUP 2021 INTERIM FINANCIAL RESULTS
1 2
34
56
7
Review of Group operations
2.2.7 Markets related income1
Half Year Half Year Half Year % Mov’tMarch Sept March Mar 21 - Mar 21 -
$m 2021 2020 2020 Sept 20 Mar 20
Net interest income 45 67 67 (33) (33)
Non-interest income 418 460 434 (9) (4)
Total Markets income 463 527 501 (12) (8)
Customer income 335 363 420 (8) (20)
Non-customer income 75 148 174 (49) (57)
Derivatives valuation adjustments 53 16 (93) large large
Total Markets income 463 527 501 (12) (8)
Markets income comprises sales and risk management revenue derived from the creation, pricing and distribution of risk management products to the Group’s consumer, business, corporate and institutional customers. Dedicated relationship specialists provide product solutions to these customers to help manage their interest rate, foreign exchange, commodity, credit and structured products risk exposures.
First Half 2021 – Second Half 2020Total markets income decreased by $64 million, or 12%, compared to Second Half 2020 primarily due to lower fixed income. This was partly offset by higher contribution from derivative valuation adjustments, up $37 million.
Customer income reduced $28 million compared to Second Half 2020 primarily due to lower fixed income contribution.
Non-customer income reduced $73 million compared to Second Half 2020, primarily due to lower fixed income trading.
First Half 2021 – First Half 2020Total markets income decreased by $38 million, or 8%, compared to First Half 2020, primarily due to lower customer and non-customer income. This was partly offset by derivative valuation adjustments increasing $146 million from narrowing of credit spreads.
Customer income reduced $85 million compared to First Half 2020, primarily due to lower foreign exchange sales.
Non-customer income reduced $99 million compared to First Half 2020, due to the exit of energy desk and lower foreign exchange income.
Markets Value at Risk (VaR)2
$m Average High Low
Half Year 31 March 2021 23.5 34.7 4.6
Half Year 30 September 2020 24.1 32.8 16.7
Half Year 31 March 2020 8.1 36.7 4.0
The Components of Markets VaR are as follows:Average Half Year Half Year Half Year
March Sept March$m 2021 2020 2020
Interest rate risk 8.0 9.4 4.0
Foreign exchange risk 1.6 3.5 1.4
Equity risk 0.4 0.3 0.1
Commodity risk3 1.5 1.6 2.2
Credit and other market risks4 16.9 19.2 6.2
Diversification benefit (4.9) (9.9) (5.8)
Net market risk 23.5 24.1 8.1
1. Markets income includes WIB Markets, Business division, Consumer division and Westpac New Zealand markets.2. The daily VaR presented above reflects a Market’s view of VaR. VaR measures the potential for loss using a history of price volatility.
Second Half 2020 and First Half 2020 have been restated to align with First Half 2021, to include VaR on the banking book.3. Includes electricity risk.4. Includes pre-payment risk and credit spread risk (exposures to generic credit rating bonds).
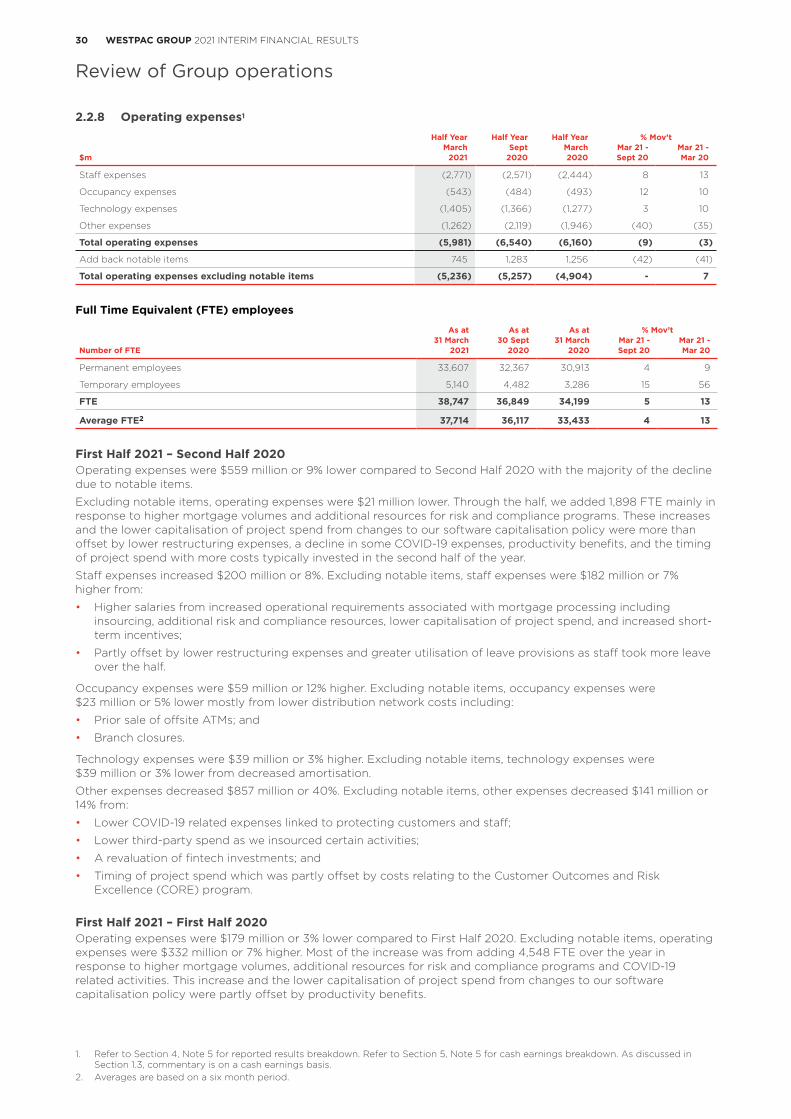
30 WESTPAC GROUP 2021 INTERIM FINANCIAL RESULTS
Review of Group operations
2.2.8 Operating expenses1 Half Year Half Year Half Year % Mov’t
March Sept March Mar 21 - Mar 21 -$m 2021 2020 2020 Sept 20 Mar 20
Staff expenses (2,771) (2,571) (2,444) 8 13
Occupancy expenses (543) (484) (493) 12 10
Technology expenses (1,405) (1,366) (1,277) 3 10
Other expenses (1,262) (2,119) (1,946) (40) (35)
Total operating expenses (5,981) (6,540) (6,160) (9) (3)
Add back notable items 745 1,283 1,256 (42) (41)
Total operating expenses excluding notable items (5,236) (5,257) (4,904) - 7
Full Time Equivalent (FTE) employees
As at As at As at % Mov’t31 March 30 Sept 31 March Mar 21 - Mar 21 -
Number of FTE 2021 2020 2020 Sept 20 Mar 20
Permanent employees 33,607 32,367 30,913 4 9
Temporary employees 5,140 4,482 3,286 15 56
FTE 38,747 36,849 34,199 5 13
Average FTE2 37,714 36,117 33,433 4 13
First Half 2021 – Second Half 2020 Operating expenses were $559 million or 9% lower compared to Second Half 2020 with the majority of the decline due to notable items.
Excluding notable items, operating expenses were $21 million lower. Through the half, we added 1,898 FTE mainly in response to higher mortgage volumes and additional resources for risk and compliance programs. These increases and the lower capitalisation of project spend from changes to our software capitalisation policy were more than offset by lower restructuring expenses, a decline in some COVID-19 expenses, productivity benefits, and the timing of project spend with more costs typically invested in the second half of the year.
Staff expenses increased $200 million or 8%. Excluding notable items, staff expenses were $182 million or 7% higher from:
• Higher salaries from increased operational requirements associated with mortgage processing including insourcing, additional risk and compliance resources, lower capitalisation of project spend, and increased short-term incentives;
• Partly offset by lower restructuring expenses and greater utilisation of leave provisions as staff took more leave over the half.
Occupancy expenses were $59 million or 12% higher. Excluding notable items, occupancy expenses were $23 million or 5% lower mostly from lower distribution network costs including:
• Prior sale of offsite ATMs; and
• Branch closures.
Technology expenses were $39 million or 3% higher. Excluding notable items, technology expenses were $39 million or 3% lower from decreased amortisation.
Other expenses decreased $857 million or 40%. Excluding notable items, other expenses decreased $141 million or 14% from:
• Lower COVID-19 related expenses linked to protecting customers and staff;
• Lower third-party spend as we insourced certain activities;
• A revaluation of fintech investments; and
• Timing of project spend which was partly offset by costs relating to the Customer Outcomes and Risk Excellence (CORE) program.
First Half 2021 – First Half 2020 Operating expenses were $179 million or 3% lower compared to First Half 2020. Excluding notable items, operating expenses were $332 million or 7% higher. Most of the increase was from adding 4,548 FTE over the year in response to higher mortgage volumes, additional resources for risk and compliance programs and COVID-19 related activities. This increase and the lower capitalisation of project spend from changes to our software capitalisation policy were partly offset by productivity benefits.
1. Refer to Section 4, Note 5 for reported results breakdown. Refer to Section 5, Note 5 for cash earnings breakdown. As discussed in Section 1.3, commentary is on a cash earnings basis.
2. Averages are based on a six month period.
Review of Group operations
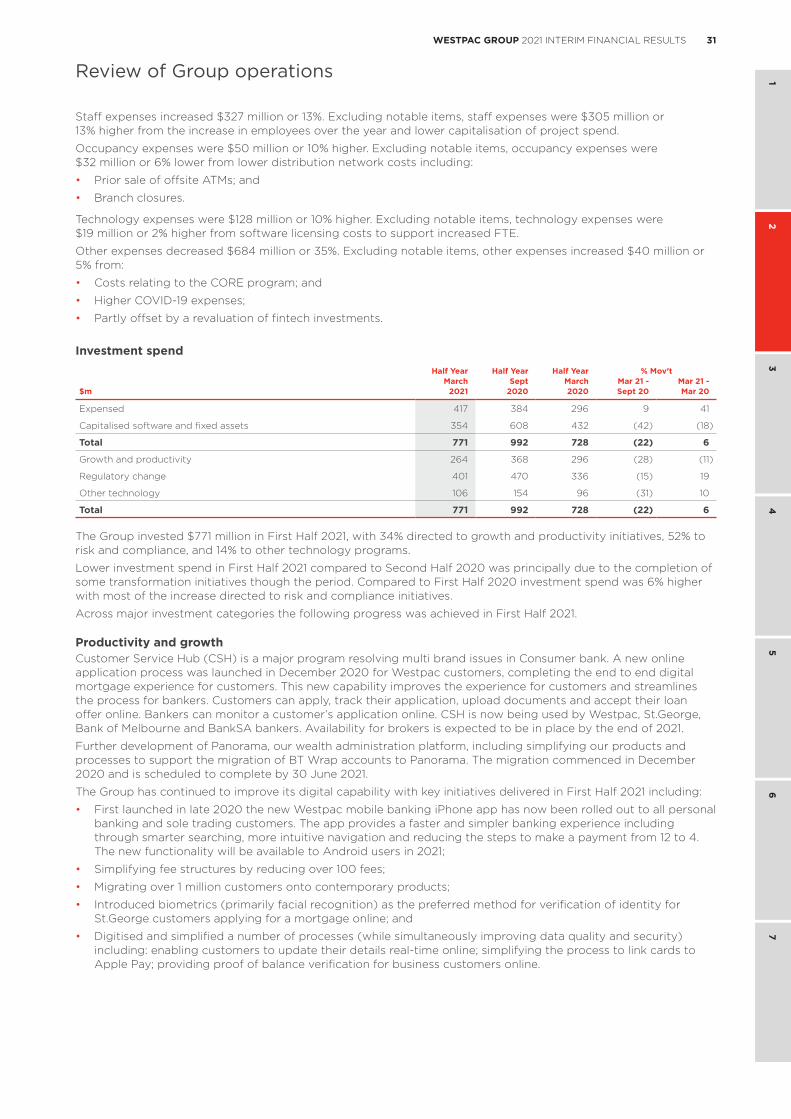
31WESTPAC GROUP 2021 INTERIM FINANCIAL RESULTS
1 2
34
56
7
Review of Group operations
Staff expenses increased $327 million or 13%. Excluding notable items, staff expenses were $305 million or 13% higher from the increase in employees over the year and lower capitalisation of project spend.
Occupancy expenses were $50 million or 10% higher. Excluding notable items, occupancy expenses were $32 million or 6% lower from lower distribution network costs including:
• Prior sale of offsite ATMs; and
• Branch closures.
Technology expenses were $128 million or 10% higher. Excluding notable items, technology expenses were $19 million or 2% higher from software licensing costs to support increased FTE.
Other expenses decreased $684 million or 35%. Excluding notable items, other expenses increased $40 million or 5% from:
• Costs relating to the CORE program; and
• Higher COVID-19 expenses;
• Partly offset by a revaluation of fintech investments.
Investment spendHalf Year Half Year Half Year % Mov’t
March Sept March Mar 21 - Mar 21 -$m 2021 2020 2020 Sept 20 Mar 20
Expensed 417 384 296 9 41
Capitalised software and fixed assets 354 608 432 (42) (18)
Total 771 992 728 (22) 6
Growth and productivity 264 368 296 (28) (11)
Regulatory change 401 470 336 (15) 19
Other technology 106 154 96 (31) 10
Total 771 992 728 (22) 6
The Group invested $771 million in First Half 2021, with 34% directed to growth and productivity initiatives, 52% to risk and compliance, and 14% to other technology programs.
Lower investment spend in First Half 2021 compared to Second Half 2020 was principally due to the completion of some transformation initiatives though the period. Compared to First Half 2020 investment spend was 6% higher with most of the increase directed to risk and compliance initiatives.
Across major investment categories the following progress was achieved in First Half 2021.
Productivity and growthCustomer Service Hub (CSH) is a major program resolving multi brand issues in Consumer bank. A new online application process was launched in December 2020 for Westpac customers, completing the end to end digital mortgage experience for customers. This new capability improves the experience for customers and streamlines the process for bankers. Customers can apply, track their application, upload documents and accept their loan offer online. Bankers can monitor a customer’s application online. CSH is now being used by Westpac, St.George, Bank of Melbourne and BankSA bankers. Availability for brokers is expected to be in place by the end of 2021.
Further development of Panorama, our wealth administration platform, including simplifying our products and processes to support the migration of BT Wrap accounts to Panorama. The migration commenced in December 2020 and is scheduled to complete by 30 June 2021.
The Group has continued to improve its digital capability with key initiatives delivered in First Half 2021 including:
• First launched in late 2020 the new Westpac mobile banking iPhone app has now been rolled out to all personal banking and sole trading customers. The app provides a faster and simpler banking experience including through smarter searching, more intuitive navigation and reducing the steps to make a payment from 12 to 4. The new functionality will be available to Android users in 2021;
• Simplifying fee structures by reducing over 100 fees;
• Migrating over 1 million customers onto contemporary products;
• Introduced biometrics (primarily facial recognition) as the preferred method for verification of identity for St.George customers applying for a mortgage online; and
• Digitised and simplified a number of processes (while simultaneously improving data quality and security) including: enabling customers to update their details real-time online; simplifying the process to link cards to Apple Pay; providing proof of balance verification for business customers online.
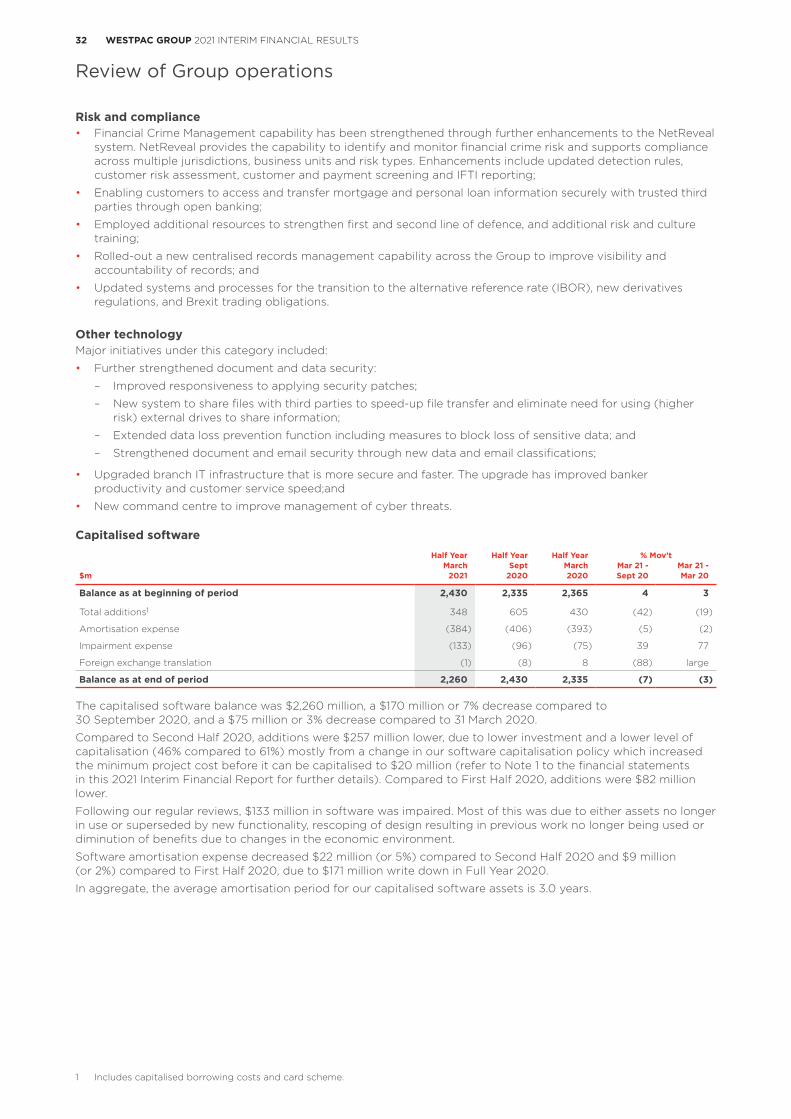
32 WESTPAC GROUP 2021 INTERIM FINANCIAL RESULTS
Review of Group operations
Risk and compliance• Financial Crime Management capability has been strengthened through further enhancements to the NetReveal
system. NetReveal provides the capability to identify and monitor financial crime risk and supports compliance across multiple jurisdictions, business units and risk types. Enhancements include updated detection rules, customer risk assessment, customer and payment screening and IFTI reporting;
• Enabling customers to access and transfer mortgage and personal loan information securely with trusted third parties through open banking;
• Employed additional resources to strengthen first and second line of defence, and additional risk and culture training;
• Rolled-out a new centralised records management capability across the Group to improve visibility and accountability of records; and
• Updated systems and processes for the transition to the alternative reference rate (IBOR), new derivatives regulations, and Brexit trading obligations.
Other technologyMajor initiatives under this category included:
• Further strengthened document and data security:
– Improved responsiveness to applying security patches;
– New system to share files with third parties to speed-up file transfer and eliminate need for using (higher risk) external drives to share information;
– Extended data loss prevention function including measures to block loss of sensitive data; and
– Strengthened document and email security through new data and email classifications;
• Upgraded branch IT infrastructure that is more secure and faster. The upgrade has improved banker productivity and customer service speed;and
• New command centre to improve management of cyber threats.
Capitalised softwareHalf Year Half Year Half Year % Mov’t
March Sept March Mar 21 - Mar 21 -$m 2021 2020 2020 Sept 20 Mar 20
Balance as at beginning of period 2,430 2,335 2,365 4 3
Total additions1 348 605 430 (42) (19)
Amortisation expense (384) (406) (393) (5) (2)
Impairment expense (133) (96) (75) 39 77
Foreign exchange translation (1) (8) 8 (88) large
Balance as at end of period 2,260 2,430 2,335 (7) (3)
The capitalised software balance was $2,260 million, a $170 million or 7% decrease compared to 30 September 2020, and a $75 million or 3% decrease compared to 31 March 2020.
Compared to Second Half 2020, additions were $257 million lower, due to lower investment and a lower level of capitalisation (46% compared to 61%) mostly from a change in our software capitalisation policy which increased the minimum project cost before it can be capitalised to $20 million (refer to Note 1 to the financial statements in this 2021 Interim Financial Report for further details). Compared to First Half 2020, additions were $82 million lower.
Following our regular reviews, $133 million in software was impaired. Most of this was due to either assets no longer in use or superseded by new functionality, rescoping of design resulting in previous work no longer being used or diminution of benefits due to changes in the economic environment.
Software amortisation expense decreased $22 million (or 5%) compared to Second Half 2020 and $9 million (or 2%) compared to First Half 2020, due to $171 million write down in Full Year 2020.
In aggregate, the average amortisation period for our capitalised software assets is 3.0 years.
1 Includes capitalised borrowing costs and card scheme.
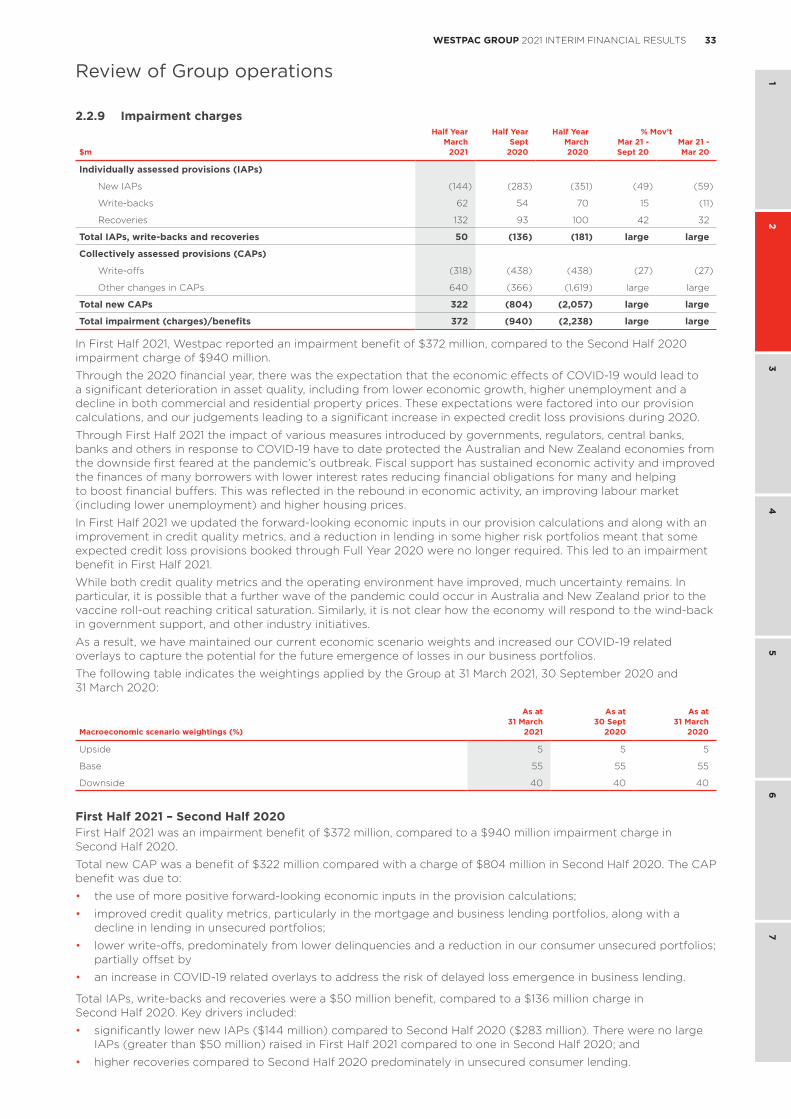
33WESTPAC GROUP 2021 INTERIM FINANCIAL RESULTS
1 2
34
56
7
Review of Group operations
2.2.9 Impairment chargesHalf Year Half Year Half Year % Mov’t
March Sept March Mar 21 - Mar 21 -$m 2021 2020 2020 Sept 20 Mar 20
Individually assessed provisions (IAPs)
New IAPs (144) (283) (351) (49) (59)
Write-backs 62 54 70 15 (11)
Recoveries 132 93 100 42 32
Total IAPs, write-backs and recoveries 50 (136) (181) large large
Collectively assessed provisions (CAPs)
Write-offs (318) (438) (438) (27) (27)
Other changes in CAPs 640 (366) (1,619) large large
Total new CAPs 322 (804) (2,057) large large
Total impairment (charges)/benefits 372 (940) (2,238) large large
In First Half 2021, Westpac reported an impairment benefit of $372 million, compared to the Second Half 2020 impairment charge of $940 million.
Through the 2020 financial year, there was the expectation that the economic effects of COVID-19 would lead to a significant deterioration in asset quality, including from lower economic growth, higher unemployment and a decline in both commercial and residential property prices. These expectations were factored into our provision calculations, and our judgements leading to a significant increase in expected credit loss provisions during 2020.
Through First Half 2021 the impact of various measures introduced by governments, regulators, central banks, banks and others in response to COVID-19 have to date protected the Australian and New Zealand economies from the downside first feared at the pandemic’s outbreak. Fiscal support has sustained economic activity and improved the finances of many borrowers with lower interest rates reducing financial obligations for many and helping to boost financial buffers. This was reflected in the rebound in economic activity, an improving labour market (including lower unemployment) and higher housing prices.
In First Half 2021 we updated the forward-looking economic inputs in our provision calculations and along with an improvement in credit quality metrics, and a reduction in lending in some higher risk portfolios meant that some expected credit loss provisions booked through Full Year 2020 were no longer required. This led to an impairment benefit in First Half 2021.
While both credit quality metrics and the operating environment have improved, much uncertainty remains. In particular, it is possible that a further wave of the pandemic could occur in Australia and New Zealand prior to the vaccine roll-out reaching critical saturation. Similarly, it is not clear how the economy will respond to the wind-back in government support, and other industry initiatives.
As a result, we have maintained our current economic scenario weights and increased our COVID-19 related overlays to capture the potential for the future emergence of losses in our business portfolios.
The following table indicates the weightings applied by the Group at 31 March 2021, 30 September 2020 and 31 March 2020:
As at As at As at31 March 30 Sept 31 March
Macroeconomic scenario weightings (%) 2021 2020 2020
Upside 5 5 5
Base 55 55 55
Downside 40 40 40
First Half 2021 – Second Half 2020First Half 2021 was an impairment benefit of $372 million, compared to a $940 million impairment charge in Second Half 2020.
Total new CAP was a benefit of $322 million compared with a charge of $804 million in Second Half 2020. The CAP benefit was due to:
• the use of more positive forward-looking economic inputs in the provision calculations;
• improved credit quality metrics, particularly in the mortgage and business lending portfolios, along with a decline in lending in unsecured portfolios;
• lower write-offs, predominately from lower delinquencies and a reduction in our consumer unsecured portfolios; partially offset by
• an increase in COVID-19 related overlays to address the risk of delayed loss emergence in business lending.
Total IAPs, write-backs and recoveries were a $50 million benefit, compared to a $136 million charge in Second Half 2020. Key drivers included:
• significantly lower new IAPs ($144 million) compared to Second Half 2020 ($283 million). There were no large IAPs (greater than $50 million) raised in First Half 2021 compared to one in Second Half 2020; and
• higher recoveries compared to Second Half 2020 predominately in unsecured consumer lending.
Review of Group operations
34 WESTPAC GROUP 2021 INTERIM FINANCIAL RESULTS
Review of Group operations
First Half 2021 – First Half 2020First Half 2021 was an impairment benefit of $372 million compared to an impairment charge of $2,238 million in First Half 2020.
Total new CAP was a benefit of $322 million compared with a charge of $2,057 million in First Half 2020. The benefit was due to:
• more positive forward-looking economic inputs in the provision calculations in First Half 2021;
• no change to the downside economic scenario weighting (in First Half 2020 more weight was assigned to the downside scenario) reflecting the high degree of uncertainty over the future impact of the pandemic; and
• a lower increase in overlay provisions in First Half 2021.
Total IAPs, write-backs and recoveries were a $50 million benefit, compared to a $181 million charge in First Half 2020. The benefit was due to:
• significantly lower new IAPs ($144 million) compared to First Half 2020 ($351 million). There were no large IAPs (greater than $50 million) raised in First Half 2021 compared to two in First Half 2020; and
• higher recoveries compared to First Half 2020 predominately in unsecured consumer lending driven by customers completing their hardship serviceability requirements.
2.2.10 Income tax expense
First Half 2021 – Second Half 2020The effective tax rate of 31.8% in First Half 2021 was significantly lower than the Second Half 2020 effective tax rate of 42.4% mainly due to the non-deductible provisions relating to the AUSTRAC civil proceedings recognised in Second Half 2020, and a reduction in goodwill impairments. The effective tax rate is above the Australian corporate tax rate of 30%.
First Half 2021 – First Half 2020The effective tax rate of 31.8% in First Half 2021 was also significantly lower than the effective tax rate of 48.8% in First Half 2020 mainly due to the non-deductible provisions relating to the AUSTRAC civil proceedings recognised in First Half 2020.
2.2.11 Non-controlling interestsNon-controlling interests represent results of non-wholly owned subsidiaries attributable to shareholders other than Westpac. These include profits attributable to the 10.1% shareholding in Westpac Bank-PNG-Limited and the 25% shareholding in St.George Motor Finance Limited that are not owned by Westpac.
2.3 Credit qualityThe portfolio performed well in First Half 2021 with stressed exposures as a percentage of total committed exposures reducing 31 basis points to 1.60% at 31 March 2021. This reduction comprised:
• a 10 basis point fall in watchlist and substandard exposures, from more rating upgrades in business lending and a lower number of downgrades. The improvement was across most industry sectors;
• a 14 basis point decline in 90 days past due and not impaired exposures from lower mortgage accounts in hardship. This decline was due to accounts exiting hardship in mid-calendar 2020 and have now completed their six-month serviceability requirements; and
• 7 basis point decrease in impaired exposures, driven by loans refinanced and regraded from impaired.
Lower impaired exposures saw the ratio of gross impaired exposures to gross loans decline by 10 basis points to 0.30% compared to 30 September 2020. Institutional impaired loans declined $216 million while Australian business impaired loans were $168 million lower.
At 31 March 2021, the ratio of gross impaired exposure provisions to gross impaired exposures was 47.0% (up from 41.5% at 30 September 2020) while the ratio of collectively assessed provisions to credit risk weighted assets decreased to 142 basis points (a 12 basis point reduction compared to September 2020).
Portfolio segments The institutional segment has seen a decrease in stress with stressed exposures to TCE falling 24 basis points to 0.32% compared to 30 September 2020. This was due to a reduction in both watchlist exposures and impaired exposures, from rating upgrades, the pay-down of debts and some write-offs.
The Australian business segment has seen stressed exposures to TCE fall 17 basis points to 6.74% compared to 30 September 2020. This was due to lower stress in Commercial portfolios, including Agriculture, Accommodation / Hotels / Clubs / Pubs, and Transport and Storage. Within total stressed exposures, impaired assets also declined leading to the ratio of impaired assets to TCE falling 19 basis points to 0.88% compared to 30 September 2020.
The commercial property sector has continued to perform well but has been one of the few sectors to experience an increase in stress. Stressed property exposures to TCE increased 9 basis points to 2.91% compared to 30 September 2020. The rise in stress has been most evident in the office and retail sectors.
35WESTPAC GROUP 2021 INTERIM FINANCIAL RESULTS
1 2
34
56
7
Review of Group operations
Australian mortgage 90+ day delinquencies were 42 basis points lower than 30 September 2020 at 1.20%. This improvement comprised:
• customers who exited hardship in 2020 and have now completed their 6 month serviceability period in First Half 2021 (43 basis points lower);
• recommencement of some collection activities that were put on hold as we prioritised supporting customers on deferral packages (9 basis points lower); partially offset by
• accounts that have exited a deferral package and have now become delinquent or migrated to hardship (10 basis points higher).
Properties in possession continued to decline over First Half 2021, down by 76 to 180 compared to 30 September 2020. The fall was due in part to a pause in repossession activities.
Other Australian consumer 90+ day delinquencies were 17 basis points lower than 30 September 2020 at 1.92%.The decline was due to a 26 basis point reduction from portfolio performance, partly offset by a 9 basis point increase from a decline in lending. Most of the reduction in delinquencies was in auto finance where the 90+ day delinquency was 35 basis points lower over the half at 2.45%. The 35 basis point decline included 85 basis points from portfolio performance partially offset by a 54 basis point increase from customers ending their COVID-19 deferral package and requiring additional support.
The New Zealand business portfolio has seen a small increase in stress from a rise in watchlist exposures partially offset by a fall in impaired exposures. Impaired business exposures to TCE fell 10 basis points to 0.44% compared to September 2020. The reduction in impaired assets was primarily due to the upgrade / sale / exposure reduction of two larger customers.
New Zealand mortgage 90+ day delinquencies were 19 basis points lower than 30 September 2020 at 0.33%. New Zealand other consumer 90+ day delinquencies were 18 basis points lower than 30 September 2020 at 1.91%. The improved 90+ day delinquencies were driven in part by improved performance along with the re-aging of customers after the exit of a COVID-19 package.
Provisions Total provisions were $5,508 million at 31 March 2021, $655 million lower than 30 September 2020. This was due to the use of more positive forward-looking economic inputs in the provisioning calculation, improved portfolio performance and a decline in some of our higher risk exposures.
However, the impact of COVID-19 on the Australian economy and the Group remains uncertain. To address this uncertainty, we have increased our COVID-19 related overlays to allow for the potential emergence of losses once the effect of support and stimulus measures reduces in our business portfolios. Total overlays increased $250 million to $902 million over the last 6 months.
IAPs were $564 million at 31 March 2021, $47 million lower than at 30 September 2020. The new and increased IAP result of $144 million was significantly lower than prior periods, especially considering the impact of the pandemic.
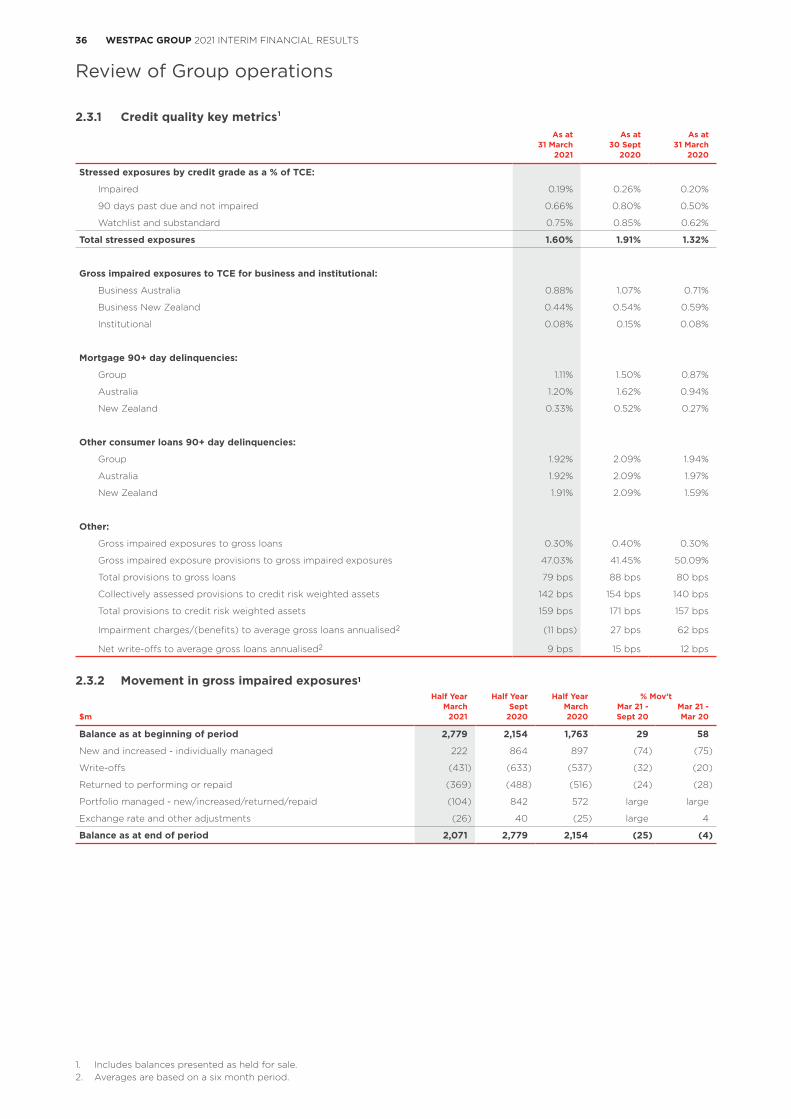
36 WESTPAC GROUP 2021 INTERIM FINANCIAL RESULTS
Review of Group operations
2.3.1 Credit quality key metrics¹ As at As at As at
31 March 30 Sept 31 March2021 2020 2020
Stressed exposures by credit grade as a % of TCE:
Impaired 0.19% 0.26% 0.20%
90 days past due and not impaired 0.66% 0.80% 0.50%
Watchlist and substandard 0.75% 0.85% 0.62%
Total stressed exposures 1.60% 1.91% 1.32%
Gross impaired exposures to TCE for business and institutional:
Business Australia 0.88% 1.07% 0.71%
Business New Zealand 0.44% 0.54% 0.59%
Institutional 0.08% 0.15% 0.08%
Mortgage 90+ day delinquencies:
Group 1.11% 1.50% 0.87%
Australia 1.20% 1.62% 0.94%
New Zealand 0.33% 0.52% 0.27%
Other consumer loans 90+ day delinquencies:
Group 1.92% 2.09% 1.94%
Australia 1.92% 2.09% 1.97%
New Zealand 1.91% 2.09% 1.59%
Other:
Gross impaired exposures to gross loans 0.30% 0.40% 0.30%
Gross impaired exposure provisions to gross impaired exposures 47.03% 41.45% 50.09%
Total provisions to gross loans 79 bps 88 bps 80 bps
Collectively assessed provisions to credit risk weighted assets 142 bps 154 bps 140 bps
Total provisions to credit risk weighted assets 159 bps 171 bps 157 bps
Impairment charges/(benefits) to average gross loans annualised2 (11 bps) 27 bps 62 bps
Net write-offs to average gross loans annualised2 9 bps 15 bps 12 bps
2.3.2 Movement in gross impaired exposures1
Half Year Half Year Half Year % Mov’tMarch Sept March Mar 21 - Mar 21 -
$m 2021 2020 2020 Sept 20 Mar 20
Balance as at beginning of period 2,779 2,154 1,763 29 58
New and increased - individually managed 222 864 897 (74) (75)
Write-offs (431) (633) (537) (32) (20)
Returned to performing or repaid (369) (488) (516) (24) (28)
Portfolio managed - new/increased/returned/repaid (104) 842 572 large large
Exchange rate and other adjustments (26) 40 (25) large 4
Balance as at end of period 2,071 2,779 2,154 (25) (4)
1. Includes balances presented as held for sale.2. Averages are based on a six month period.
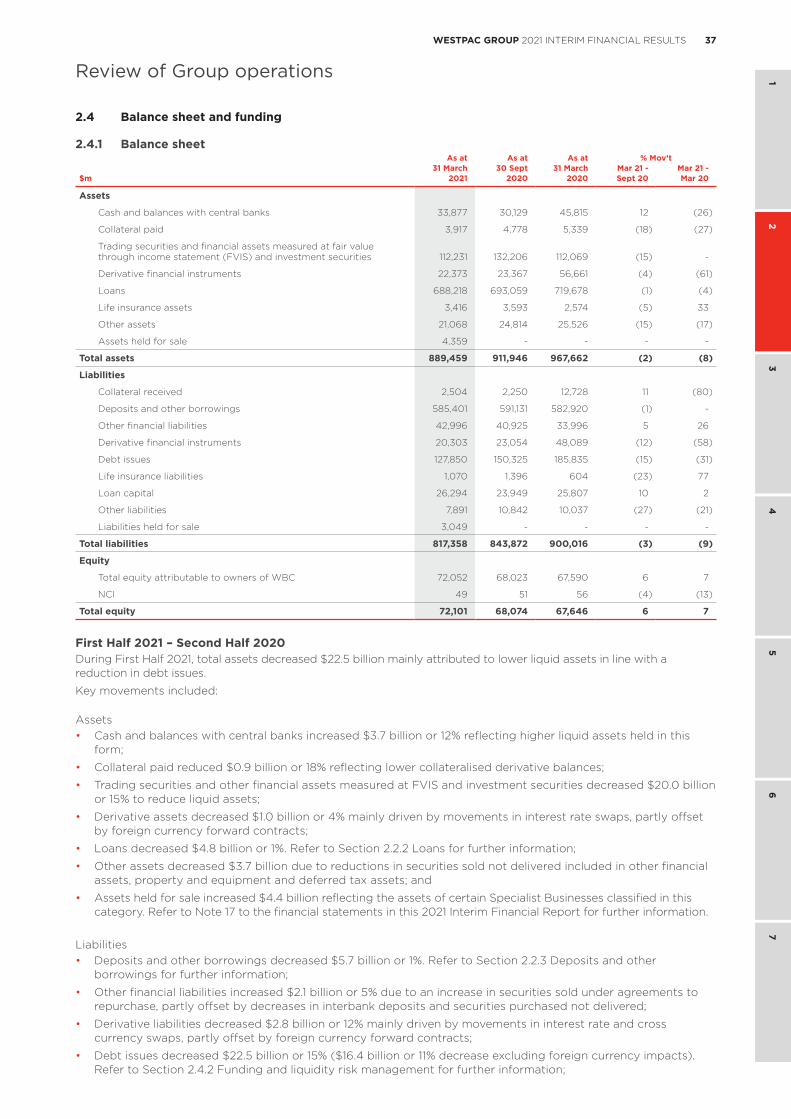
37WESTPAC GROUP 2021 INTERIM FINANCIAL RESULTS
1 2
34
56
7
Review of Group operations
2.4 Balance sheet and funding
2.4.1 Balance sheet As at As at As at % Mov’t
31 March 30 Sept 31 March Mar 21 - Mar 21 -$m 2021 2020 2020 Sept 20 Mar 20
Assets
Cash and balances with central banks 33,877 30,129 45,815 12 (26)
Collateral paid 3,917 4,778 5,339 (18) (27)
Trading securities and financial assets measured at fair value through income statement (FVIS) and investment securities 112,231 132,206 112,069 (15) -
Derivative financial instruments 22,373 23,367 56,661 (4) (61)
Loans 688,218 693,059 719,678 (1) (4)
Life insurance assets 3,416 3,593 2,574 (5) 33
Other assets 21,068 24,814 25,526 (15) (17)
Assets held for sale 4,359 - - - -
Total assets 889,459 911,946 967,662 (2) (8)
Liabilities
Collateral received 2,504 2,250 12,728 11 (80)
Deposits and other borrowings 585,401 591,131 582,920 (1) -
Other financial liabilities 42,996 40,925 33,996 5 26
Derivative financial instruments 20,303 23,054 48,089 (12) (58)
Debt issues 127,850 150,325 185,835 (15) (31)
Life insurance liabilities 1,070 1,396 604 (23) 77
Loan capital 26,294 23,949 25,807 10 2
Other liabilities 7,891 10,842 10,037 (27) (21)
Liabilities held for sale 3,049 - - - -
Total liabilities 817,358 843,872 900,016 (3) (9)
Equity
Total equity attributable to owners of WBC 72,052 68,023 67,590 6 7
NCI 49 51 56 (4) (13)
Total equity 72,101 68,074 67,646 6 7
First Half 2021 – Second Half 2020During First Half 2021, total assets decreased $22.5 billion mainly attributed to lower liquid assets in line with a reduction in debt issues.
Key movements included:
Assets• Cash and balances with central banks increased $3.7 billion or 12% reflecting higher liquid assets held in this
form;
• Collateral paid reduced $0.9 billion or 18% reflecting lower collateralised derivative balances;
• Trading securities and other financial assets measured at FVIS and investment securities decreased $20.0 billion or 15% to reduce liquid assets;
• Derivative assets decreased $1.0 billion or 4% mainly driven by movements in interest rate swaps, partly offset by foreign currency forward contracts;
• Loans decreased $4.8 billion or 1%. Refer to Section 2.2.2 Loans for further information;
• Other assets decreased $3.7 billion due to reductions in securities sold not delivered included in other financial assets, property and equipment and deferred tax assets; and
• Assets held for sale increased $4.4 billion reflecting the assets of certain Specialist Businesses classified in this category. Refer to Note 17 to the financial statements in this 2021 Interim Financial Report for further information.
Liabilities• Deposits and other borrowings decreased $5.7 billion or 1%. Refer to Section 2.2.3 Deposits and other
borrowings for further information;
• Other financial liabilities increased $2.1 billion or 5% due to an increase in securities sold under agreements to repurchase, partly offset by decreases in interbank deposits and securities purchased not delivered;
• Derivative liabilities decreased $2.8 billion or 12% mainly driven by movements in interest rate and cross currency swaps, partly offset by foreign currency forward contracts;
• Debt issues decreased $22.5 billion or 15% ($16.4 billion or 11% decrease excluding foreign currency impacts). Refer to Section 2.4.2 Funding and liquidity risk management for further information;
38 WESTPAC GROUP 2021 INTERIM FINANCIAL RESULTS
Review of Group operations
• Loan capital increased $2.3 billion or 10% reflecting $4.3 billion net issuances of Additional Tier 1 instruments (issuance of Westpac Capital Notes 7, partly offset by redemption of Westpac Capital Notes 3) and Tier 2 capital instruments. This was partly offset by $2.0 billion of foreign currency translation and fair value hedging impacts;
• Other liabilities decreased $3.0 billion or 27% due to reduction in provisions to settle the AUSTRAC civil proceedings and lower insurance related liabilities included in other liabilities as these were reclassified to liabilities held for sale; and
• Liabilities held for sale increased $3.0 billion reflecting the liabilities of certain Specialist Businesses classified in this category. Refer to Note 17 to the financial statements in this 2021 Interim Financial Report for further information.
Equity attributable to owners of WBC increased $4.0 billion or 6% reflecting retained profits during the period.
First Half 2021 – First Half 2020In First Half 2021, total assets decreased compared to 31 March 2020 reflecting the reduction in loans during the year to 31 March 2021. The Group’s funding composition also saw a decline in debt issues, partly offset by an increase in other financial liabilities from the drawdown of the Term Funding Facility.
Key movements included:
Assets• Cash and balances with central banks decreased $11.9 billion or 26% reflecting lower liquid assets held in this
form;
• Collateral paid reduced $1.4 billion or 27% reflecting lower collateralised derivative balances;
• Derivative assets decreased $34.3 billion or 61% mainly driven by movements in cross currency swaps, foreign currency forward contracts and interest rate swaps;
• Loans decreased $31.5 billion or 4%. Refer to Section 2.2.2 Loans for further information;
• Life insurance assets increased $0.8 billion or 33% mainly due to consolidation of new funds, partly offset by the transfer of assets to non-consolidated funds which all occurred during Second Half 2020;
• Other assets decreased $4.5 billion due to reductions in securities sold not delivered and interbank balances included in other financial assets, property and equipment and impairment of intangible assets; and
• Assets held for sale increased $4.4 billion reflecting the assets of certain Specialist Businesses classified in this category. Refer to Note 17 to the financial statements in this 2021 Interim Financial Report for further information.
Liabilities• Collateral received decreased $10.2 billion or 80% reflecting lower collateralised derivative balances;
• Deposits and other borrowings increased $2.5 billion. Refer to Section 2.2.3 Deposits and other borrowings for further information;
• Other financial liabilities increased $9.0 billion or 26% due to an increase in securities sold under agreements to repurchase, partly offset by decreases in interbank deposits and securities purchased not delivered;
• Derivative liabilities decreased $27.8 billion or 58% mainly driven by movements in cross currency swaps, foreign currency forward contracts and interest rate swaps;
• Debt issues decreased $58.0 billion or 31% ($37.5 billion or 20% decrease excluding foreign currency impacts). Refer to Section 2.4.2 Funding and liquidity risk management for further information;
• Loan capital increased $0.5 billion or 2% reflecting $4.3 billion net issuance of Additional Tier 1 instruments (issuance of Westpac Capital Notes 7, partly offset by redemption of Westpac Capital Notes 3) and Tier 2 capital instruments. This was partly offset by $3.8 billion of foreign currency translation and fair value hedging impacts;
• Other liabilities decreased $2.1 billion or 21% due to reduction in provisions to settle the AUSTRAC civil proceedings and lower insurance related liabilities included in other liabilities as these were reclassified to liabilities held for sale; and
• Liabilities held for sale increased $3.0 billion reflecting the liabilities of certain Specialist Businesses classified in this category. Refer to Note 17 to the financial statements in this 2021 Interim Financial Report for further information.
Equity attributable to owners of WBC increased $4.5 billion or 7% reflecting retained profits. The 2020 final dividend did not impact equity as the dividend reinvestment plan was fully underwritten.
39WESTPAC GROUP 2021 INTERIM FINANCIAL RESULTS
1 2
34
56
7
Review of Group operations
2.4.2 Funding and liquidity risk managementLiquidity risk is the risk that the Group will be unable to fund assets and meet obligations as they become due. This type of risk is inherent for all banks as intermediaries between depositors and borrowers. The Group has a liquidity risk management framework which seeks to meet cash flow obligations under a wide range of market conditions, including name specific and market-wide stress scenarios, as well as meeting the regulatory requirements of the LCR and NSFR.
The Group maintained funding and liquidity metrics comfortably above regulatory minimums throughout the First Half 2021. The Group’s March 2021 quarterly average LCR was 124% and its NSFR at 31 March 2021 was 123% as compared to regulatory minimums of 100% for both.
During First Half 2021, measures introduced by the Reserve Bank to support the economy remained in place. These include an historically low cash rate, additional liquidity injected into the financial system through daily market operations, the purchase of Australian Government bonds in the secondary market, and the Term Funding Facility (TFF). Through the TFF, funding is provided to eligible ADIs at a fixed interest rate of 10 to 25 basis points, for a maximum of three years.
At 31 March 2021, Westpac’s total TFF allowance was $30 billion and Westpac had drawn down $22 billion. Westpac has included its TFF allowance in the LCR and NSFR calculations for 31 March 2021 in accordance with prudential guidance.
LiquidityThe Group has a number of sources of liquidity that provide a buffer against periods of liquidity stress. These include High Quality Liquid Assets (HQLA) and the Committed Liquidity Facility (CLF), both of which are used to meet the Group’s LCR requirements. The Group also has access to non-HQLA and other assets that are eligible for re-purchase with a central bank under certain conditions.
• At 31 March 2021, Westpac held $113.4 billion in HQLA (30 September 2020: $131.7 billion). HQLA include cash, deposits with central banks, government securities and other high quality securities that are repo-eligible with the RBA. The HQLA portfolio is managed within the Group’s risk appetite and within regulatory requirements. HQLA decreased over the six months to 31 March 2021, in line with a reduction in debt maturities.
• Westpac’s CLF allocation for the 2021 calendar year, as approved by APRA, is $37 billion (2020 calendar year: $52 billion). The Group’s CLF allocation was reduced due to the significant increase in available HQLA, as well as higher system liquidity driven by fiscal and monetary policy. The fee to access the CLF was increased by the RBA on 1 January 2021 to 20 basis points (from 17 basis points).
• The Group also holds a portfolio of non-HQLA liquid assets that are repo-eligible with the Reserve Bank of Australia. These include private securities and self-originated AAA-rated mortgage-backed securities.
The Group’s total unencumbered liquid assets were $195.2 billion as at 31 March 2021 (30 September 2020: $221.2 billion). The reduction in liquid assets over the First Half 2021 mainly reflects lower HQLA and lower self-originated AAA-rated mortgage-backed securities.
LCRThe LCR is designed to enhance banks’ short-term resilience, by measuring the level of HQLA, as defined, held against its liquidity needs for a 30 calendar day period under a regulator-defined stress scenario. In addition to HQLA, Australian ADIs including Westpac also have access to the CLF, as set out above, to meet the requirements of the LCR.
Westpac’s average LCR for the quarter ended 31 March 2021 was 124 % (Westpac’s average LCR for the quarter ended 30 September 2020 was: 151%).
The reduction in the Group’s LCR mainly reflects a $15 billion reduction in the CLF (effective 1 December 2020) and an increase in other flows. The main driver of other flows was the Group’s requirement to increase the value of its net cash outflows by 10% for the purpose of calculating LCR (effective 1 January 2021). The overlay to the Group’s net cash outflows has been required by APRA in response to breaches of liquidity requirements predominantly relating to Westpac New Zealand Limited (WNZL). Further details are set out in the Significant Developments section of the 2021 Half Year Financial Results.
NSFRThe NSFR is designed to encourage banks’ longer-term funding resilience. To comply, banks are required to maintain an NSFR of at least 100% at all times. Westpac had an NSFR of 123% at 31 March 2021 (30 September 2020: 122%). Movements in the Group’s NSFR over the half represent a $1.1 billion increase in available stable funding, mainly due to deposits (up $2.9 billion) and equity (up $3.4 billion), partly offset by wholesale funding (down $4.9 billion). Required stable funding decreased by $2.4 billion.
FundingThe Group monitors the composition and stability of its funding so it remains within the Group’s funding risk appetite. This includes compliance with both the LCR and NSFR.
Review of Group operations
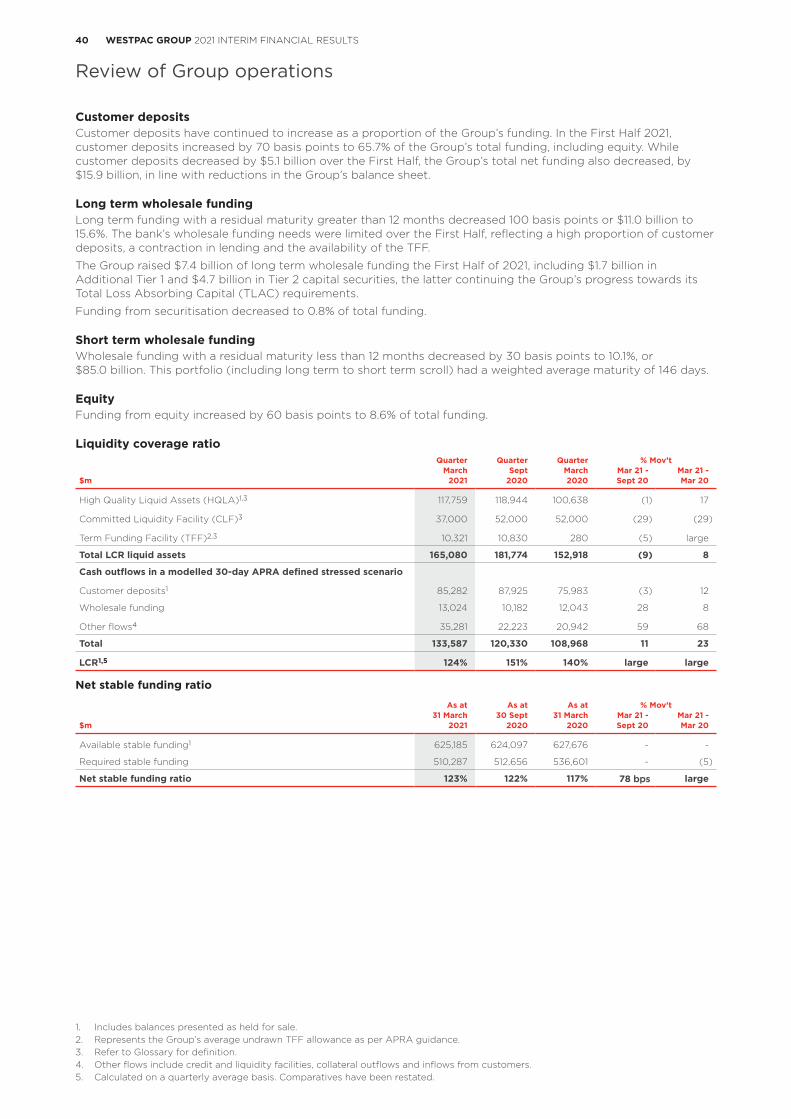
40 WESTPAC GROUP 2021 INTERIM FINANCIAL RESULTS
Review of Group operations
Customer depositsCustomer deposits have continued to increase as a proportion of the Group’s funding. In the First Half 2021, customer deposits increased by 70 basis points to 65.7% of the Group’s total funding, including equity. While customer deposits decreased by $5.1 billion over the First Half, the Group’s total net funding also decreased, by $15.9 billion, in line with reductions in the Group’s balance sheet.
Long term wholesale fundingLong term funding with a residual maturity greater than 12 months decreased 100 basis points or $11.0 billion to 15.6%. The bank’s wholesale funding needs were limited over the First Half, reflecting a high proportion of customer deposits, a contraction in lending and the availability of the TFF.
The Group raised $7.4 billion of long term wholesale funding the First Half of 2021, including $1.7 billion in Additional Tier 1 and $4.7 billion in Tier 2 capital securities, the latter continuing the Group’s progress towards its Total Loss Absorbing Capital (TLAC) requirements.
Funding from securitisation decreased to 0.8% of total funding.
Short term wholesale fundingWholesale funding with a residual maturity less than 12 months decreased by 30 basis points to 10.1%, or $85.0 billion. This portfolio (including long term to short term scroll) had a weighted average maturity of 146 days.
EquityFunding from equity increased by 60 basis points to 8.6% of total funding.
Liquidity coverage ratioQuarter Quarter Quarter % Mov’t
March Sept March Mar 21 - Mar 21 -$m 2021 2020 2020 Sept 20 Mar 20
High Quality Liquid Assets (HQLA)1,3 117,759 118,944 100,638 (1) 17
Committed Liquidity Facility (CLF)3 37,000 52,000 52,000 (29) (29)
Term Funding Facility (TFF)2,3 10,321 10,830 280 (5) large
Total LCR liquid assets 165,080 181,774 152,918 (9) 8
Cash outflows in a modelled 30-day APRA defined stressed scenario
Customer deposits1 85,282 87,925 75,983 (3) 12
Wholesale funding 13,024 10,182 12,043 28 8
Other flows4 35,281 22,223 20,942 59 68
Total 133,587 120,330 108,968 11 23
LCR1,5 124% 151% 140% large large
Net stable funding ratio
As at As at As at % Mov’t31 March 30 Sept 31 March Mar 21 - Mar 21 -
$m 2021 2020 2020 Sept 20 Mar 20
Available stable funding1 625,185 624,097 627,676 - -
Required stable funding 510,287 512,656 536,601 - (5)
Net stable funding ratio 123% 122% 117% 78 bps large
1. Includes balances presented as held for sale.2. Represents the Group’s average undrawn TFF allowance as per APRA guidance.3. Refer to Glossary for definition.4. Other flows include credit and liquidity facilities, collateral outflows and inflows from customers.5. Calculated on a quarterly average basis. Comparatives have been restated.
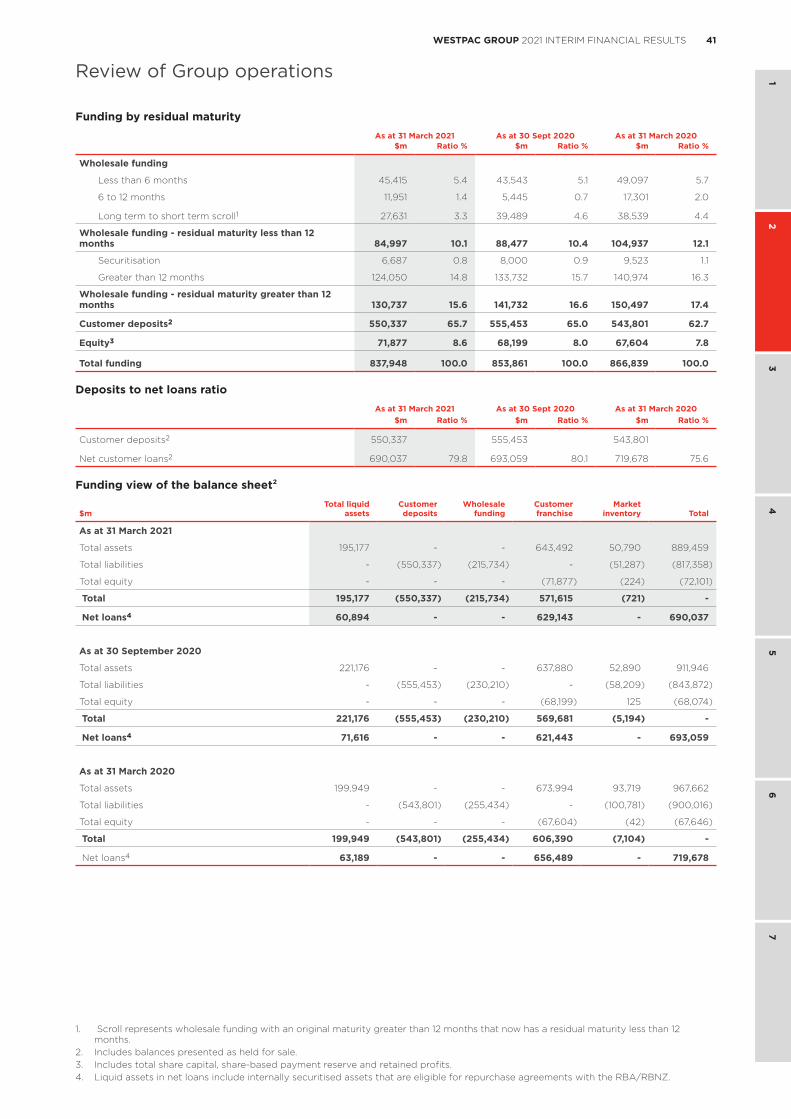
41WESTPAC GROUP 2021 INTERIM FINANCIAL RESULTS
1 2
34
56
7
Review of Group operations
Funding by residual maturityAs at 31 March 2021 As at 30 Sept 2020 As at 31 March 2020
$m Ratio % $m Ratio % $m Ratio %
Wholesale funding
Less than 6 months 45,415 5.4 43,543 5.1 49,097 5.7
6 to 12 months 11,951 1.4 5,445 0.7 17,301 2.0
Long term to short term scroll1 27,631 3.3 39,489 4.6 38,539 4.4
Wholesale funding - residual maturity less than 12 months 84,997 10.1 88,477 10.4 104,937 12.1
Securitisation 6,687 0.8 8,000 0.9 9,523 1.1
Greater than 12 months 124,050 14.8 133,732 15.7 140,974 16.3
Wholesale funding - residual maturity greater than 12 months 130,737 15.6 141,732 16.6 150,497 17.4
Customer deposits2 550,337 65.7 555,453 65.0 543,801 62.7
Equity3 71,877 8.6 68,199 8.0 67,604 7.8
Total funding 837,948 100.0 853,861 100.0 866,839 100.0
Deposits to net loans ratioAs at 31 March 2021 As at 30 Sept 2020 As at 31 March 2020
$m Ratio % $m Ratio % $m Ratio %
Customer deposits2 550,337 555,453 543,801
Net customer loans2 690,037 79.8 693,059 80.1 719,678 75.6
Funding view of the balance sheet²
$mTotal liquid
assetsCustomer deposits
Wholesale funding
Customer franchise
Market inventory Total
As at 31 March 2021
Total assets 195,177 - - 643,492 50,790 889,459
Total liabilities - (550,337) (215,734) - (51,287) (817,358)
Total equity - - - (71,877) (224) (72,101)
Total 195,177 (550,337) (215,734) 571,615 (721) -
Net loans4 60,894 - - 629,143 - 690,037
As at 30 September 2020
Total assets 221,176 - - 637,880 52,890 911,946
Total liabilities - (555,453) (230,210) - (58,209) (843,872)
Total equity - - - (68,199) 125 (68,074)
Total 221,176 (555,453) (230,210) 569,681 (5,194) -
Net loans4 71,616 - - 621,443 - 693,059
As at 31 March 2020
Total assets 199,949 - - 673,994 93,719 967,662
Total liabilities - (543,801) (255,434) - (100,781) (900,016)
Total equity - - - (67,604) (42) (67,646)
Total 199,949 (543,801) (255,434) 606,390 (7,104) -
Net loans4 63,189 - - 656,489 - 719,678
1. Scroll represents wholesale funding with an original maturity greater than 12 months that now has a residual maturity less than 12 months.
2. Includes balances presented as held for sale.3. Includes total share capital, share-based payment reserve and retained profits.4. Liquid assets in net loans include internally securitised assets that are eligible for repurchase agreements with the RBA/RBNZ.
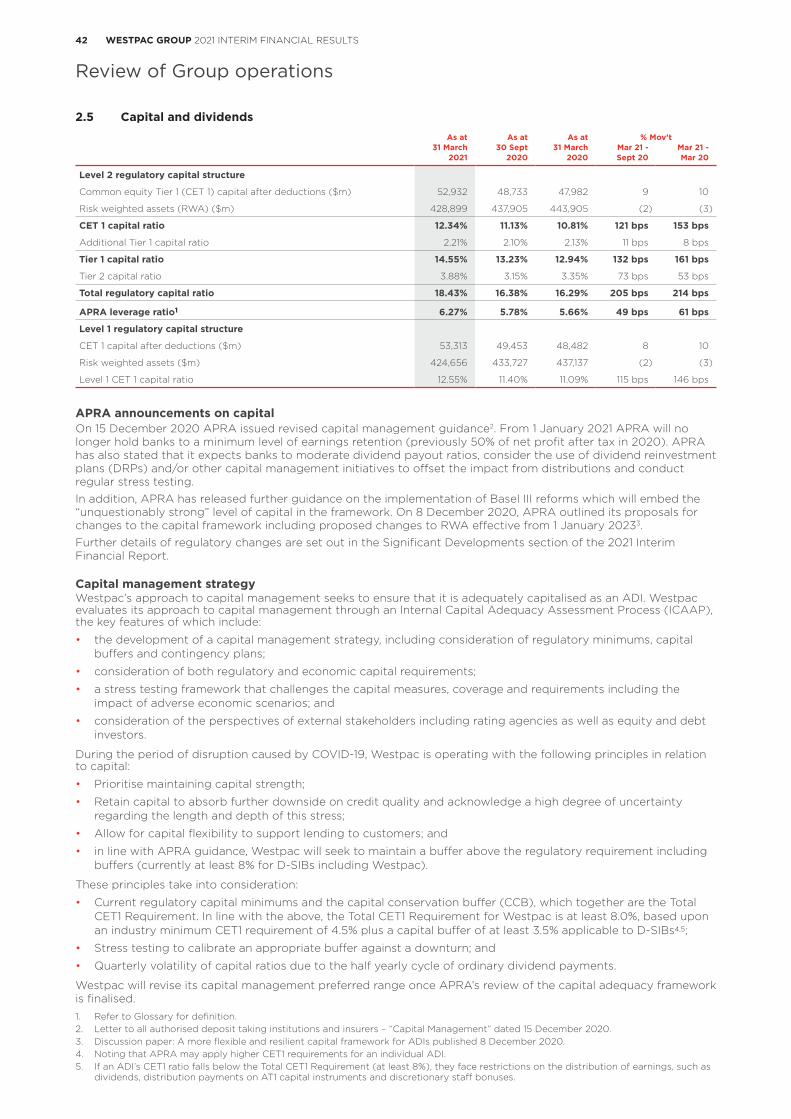
42 WESTPAC GROUP 2021 INTERIM FINANCIAL RESULTS
Review of Group operations
2.5 Capital and dividendsAs at As at As at % Mov’t
31 March 30 Sept 31 March Mar 21 - Mar 21 -2021 2020 2020 Sept 20 Mar 20
Level 2 regulatory capital structure
Common equity Tier 1 (CET 1) capital after deductions ($m) 52,932 48,733 47,982 9 10
Risk weighted assets (RWA) ($m) 428,899 437,905 443,905 (2) (3)
CET 1 capital ratio 12.34% 11.13% 10.81% 121 bps 153 bps
Additional Tier 1 capital ratio 2.21% 2.10% 2.13% 11 bps 8 bps
Tier 1 capital ratio 14.55% 13.23% 12.94% 132 bps 161 bps
Tier 2 capital ratio 3.88% 3.15% 3.35% 73 bps 53 bps
Total regulatory capital ratio 18.43% 16.38% 16.29% 205 bps 214 bps
APRA leverage ratio1 6.27% 5.78% 5.66% 49 bps 61 bps
Level 1 regulatory capital structure
CET 1 capital after deductions ($m) 53,313 49,453 48,482 8 10
Risk weighted assets ($m) 424,656 433,727 437,137 (2) (3)
Level 1 CET 1 capital ratio 12.55% 11.40% 11.09% 115 bps 146 bps
APRA announcements on capital On 15 December 2020 APRA issued revised capital management guidance2. From 1 January 2021 APRA will no longer hold banks to a minimum level of earnings retention (previously 50% of net profit after tax in 2020). APRA has also stated that it expects banks to moderate dividend payout ratios, consider the use of dividend reinvestment plans (DRPs) and/or other capital management initiatives to offset the impact from distributions and conduct regular stress testing. In addition, APRA has released further guidance on the implementation of Basel III reforms which will embed the “unquestionably strong” level of capital in the framework. On 8 December 2020, APRA outlined its proposals for changes to the capital framework including proposed changes to RWA effective from 1 January 20233. Further details of regulatory changes are set out in the Significant Developments section of the 2021 Interim Financial Report.
Capital management strategyWestpac’s approach to capital management seeks to ensure that it is adequately capitalised as an ADI. Westpac evaluates its approach to capital management through an Internal Capital Adequacy Assessment Process (ICAAP), the key features of which include:
• the development of a capital management strategy, including consideration of regulatory minimums, capital buffers and contingency plans;
• consideration of both regulatory and economic capital requirements;
• a stress testing framework that challenges the capital measures, coverage and requirements including the impact of adverse economic scenarios; and
• consideration of the perspectives of external stakeholders including rating agencies as well as equity and debt investors.
During the period of disruption caused by COVID-19, Westpac is operating with the following principles in relation to capital:
• Prioritise maintaining capital strength;
• Retain capital to absorb further downside on credit quality and acknowledge a high degree of uncertainty regarding the length and depth of this stress;
• Allow for capital flexibility to support lending to customers; and
• in line with APRA guidance, Westpac will seek to maintain a buffer above the regulatory requirement including buffers (currently at least 8% for D-SIBs including Westpac).
These principles take into consideration:
• Current regulatory capital minimums and the capital conservation buffer (CCB), which together are the Total CET1 Requirement. In line with the above, the Total CET1 Requirement for Westpac is at least 8.0%, based upon an industry minimum CET1 requirement of 4.5% plus a capital buffer of at least 3.5% applicable to D-SIBs4,5;
• Stress testing to calibrate an appropriate buffer against a downturn; and
• Quarterly volatility of capital ratios due to the half yearly cycle of ordinary dividend payments.
Westpac will revise its capital management preferred range once APRA’s review of the capital adequacy framework is finalised.
Review of Group operations
1. Refer to Glossary for definition.2. Letter to all authorised deposit taking institutions and insurers – “Capital Management” dated 15 December 2020.3. Discussion paper: A more flexible and resilient capital framework for ADIs published 8 December 2020.4. Noting that APRA may apply higher CET1 requirements for an individual ADI.5. If an ADI’s CET1 ratio falls below the Total CET1 Requirement (at least 8%), they face restrictions on the distribution of earnings, such as
dividends, distribution payments on AT1 capital instruments and discretionary staff bonuses.
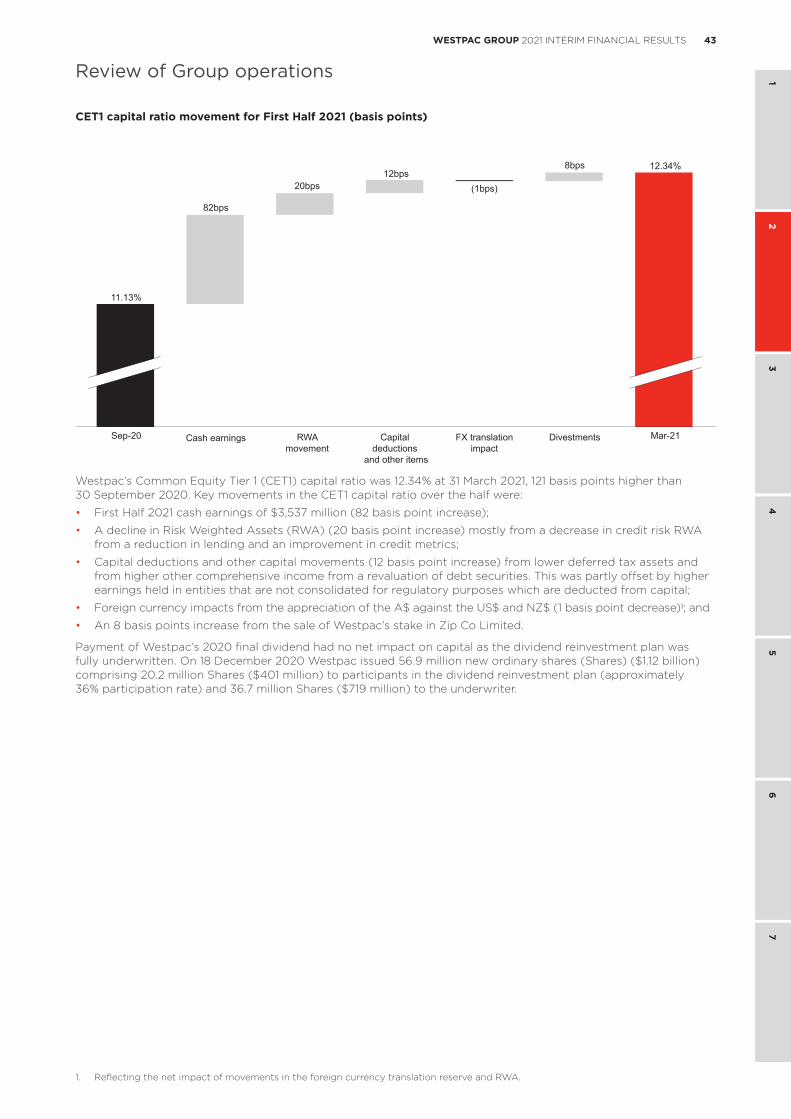
43WESTPAC GROUP 2021 INTERIM FINANCIAL RESULTS
1 2
34
56
7
Review of Group operations
CET1 capital ratio movement for First Half 2021 (basis points)
Sep-20 RWAmovement
Capital deductions
and other items
FX translationimpact
Divestments Mar-21
11.13%
82bps
8bps
20bps12bps
12.34%
Cash earnings
(1bps)
Westpac’s Common Equity Tier 1 (CET1) capital ratio was 12.34% at 31 March 2021, 121 basis points higher than 30 September 2020. Key movements in the CET1 capital ratio over the half were:
• First Half 2021 cash earnings of $3,537 million (82 basis point increase);
• A decline in Risk Weighted Assets (RWA) (20 basis point increase) mostly from a decrease in credit risk RWA from a reduction in lending and an improvement in credit metrics;
• Capital deductions and other capital movements (12 basis point increase) from lower deferred tax assets and from higher other comprehensive income from a revaluation of debt securities. This was partly offset by higher earnings held in entities that are not consolidated for regulatory purposes which are deducted from capital;
• Foreign currency impacts from the appreciation of the A$ against the US$ and NZ$ (1 basis point decrease)1; and
• An 8 basis points increase from the sale of Westpac’s stake in Zip Co Limited.
Payment of Westpac’s 2020 final dividend had no net impact on capital as the dividend reinvestment plan was fully underwritten. On 18 December 2020 Westpac issued 56.9 million new ordinary shares (Shares) ($1.12 billion) comprising 20.2 million Shares ($401 million) to participants in the dividend reinvestment plan (approximately 36% participation rate) and 36.7 million Shares ($719 million) to the underwriter.
1. Reflecting the net impact of movements in the foreign currency translation reserve and RWA.
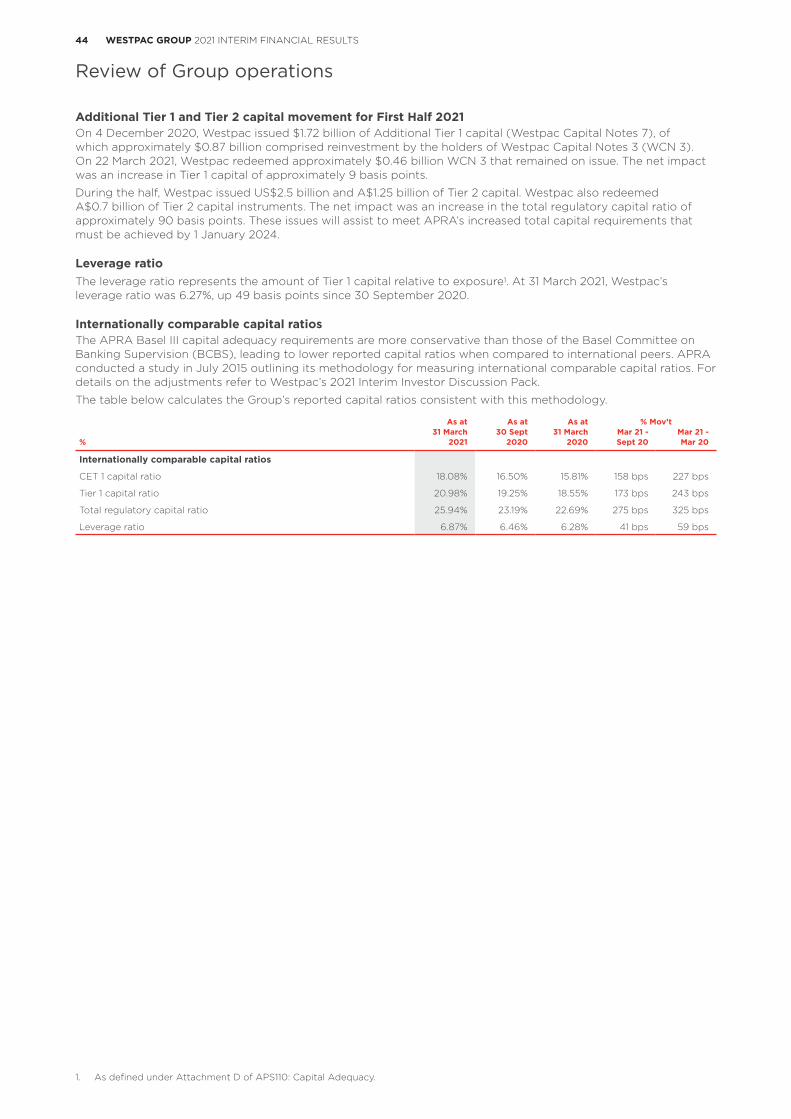
44 WESTPAC GROUP 2021 INTERIM FINANCIAL RESULTS
Review of Group operations
Additional Tier 1 and Tier 2 capital movement for First Half 2021On 4 December 2020, Westpac issued $1.72 billion of Additional Tier 1 capital (Westpac Capital Notes 7), of which approximately $0.87 billion comprised reinvestment by the holders of Westpac Capital Notes 3 (WCN 3). On 22 March 2021, Westpac redeemed approximately $0.46 billion WCN 3 that remained on issue. The net impact was an increase in Tier 1 capital of approximately 9 basis points.
During the half, Westpac issued US$2.5 billion and A$1.25 billion of Tier 2 capital. Westpac also redeemed A$0.7 billion of Tier 2 capital instruments. The net impact was an increase in the total regulatory capital ratio of approximately 90 basis points. These issues will assist to meet APRA’s increased total capital requirements that must be achieved by 1 January 2024.
Leverage ratioThe leverage ratio represents the amount of Tier 1 capital relative to exposure1. At 31 March 2021, Westpac’s leverage ratio was 6.27%, up 49 basis points since 30 September 2020.
Internationally comparable capital ratiosThe APRA Basel III capital adequacy requirements are more conservative than those of the Basel Committee on Banking Supervision (BCBS), leading to lower reported capital ratios when compared to international peers. APRA conducted a study in July 2015 outlining its methodology for measuring international comparable capital ratios. For details on the adjustments refer to Westpac’s 2021 Interim Investor Discussion Pack.
The table below calculates the Group’s reported capital ratios consistent with this methodology.
As at As at As at % Mov’t31 March 30 Sept 31 March Mar 21 - Mar 21 -
% 2021 2020 2020 Sept 20 Mar 20
Internationally comparable capital ratios
CET 1 capital ratio 18.08% 16.50% 15.81% 158 bps 227 bps
Tier 1 capital ratio 20.98% 19.25% 18.55% 173 bps 243 bps
Total regulatory capital ratio 25.94% 23.19% 22.69% 275 bps 325 bps
Leverage ratio 6.87% 6.46% 6.28% 41 bps 59 bps
1. As defined under Attachment D of APS110: Capital Adequacy.
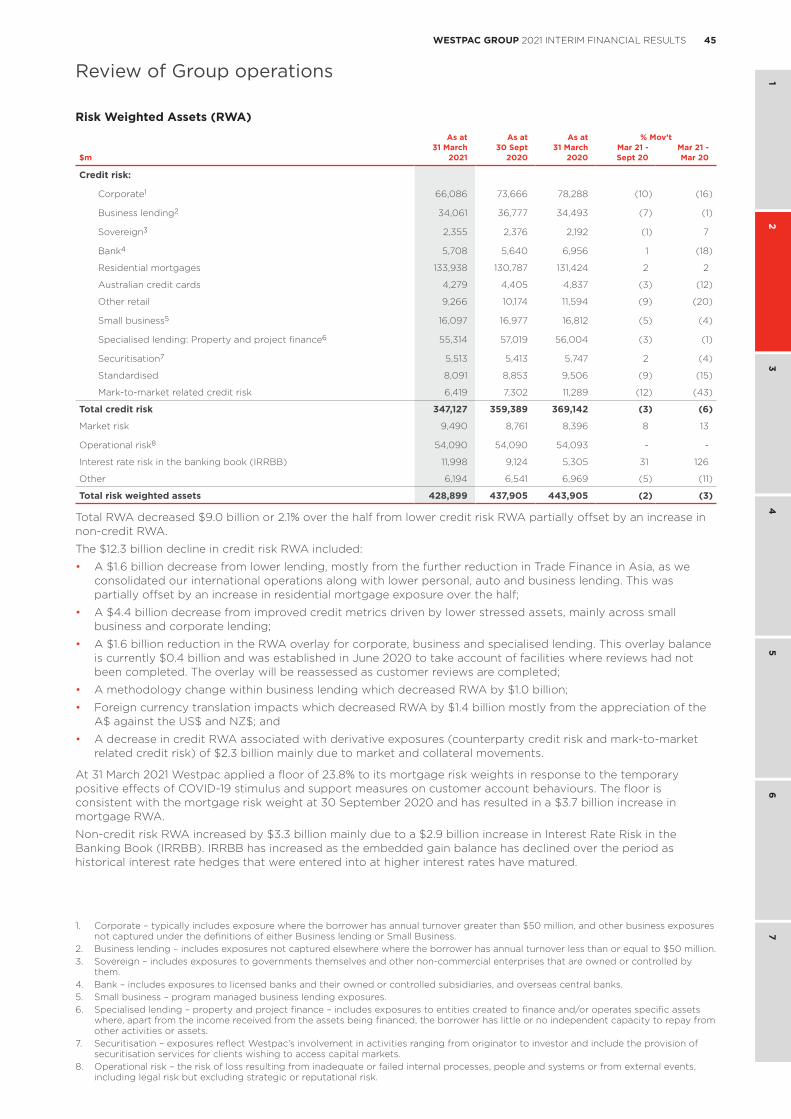
45WESTPAC GROUP 2021 INTERIM FINANCIAL RESULTS
1 2
34
56
7
Review of Group operations
Risk Weighted Assets (RWA)As at As at As at % Mov’t
31 March 30 Sept 31 March Mar 21 - Mar 21 -$m 2021 2020 2020 Sept 20 Mar 20
Credit risk:
Corporate1 66,086 73,666 78,288 (10) (16)
Business lending2 34,061 36,777 34,493 (7) (1)
Sovereign3 2,355 2,376 2,192 (1) 7
Bank4 5,708 5,640 6,956 1 (18)
Residential mortgages 133,938 130,787 131,424 2 2
Australian credit cards 4,279 4,405 4,837 (3) (12)
Other retail 9,266 10,174 11,594 (9) (20)
Small business5 16,097 16,977 16,812 (5) (4)
Specialised lending: Property and project finance6 55,314 57,019 56,004 (3) (1)
Securitisation7 5,513 5,413 5,747 2 (4)
Standardised 8,091 8,853 9,506 (9) (15)
Mark-to-market related credit risk 6,419 7,302 11,289 (12) (43)
Total credit risk 347,127 359,389 369,142 (3) (6)
Market risk 9,490 8,761 8,396 8 13
Operational risk8 54,090 54,090 54,093 - -
Interest rate risk in the banking book (IRRBB) 11,998 9,124 5,305 31 126
Other 6,194 6,541 6,969 (5) (11)
Total risk weighted assets 428,899 437,905 443,905 (2) (3)
Total RWA decreased $9.0 billion or 2.1% over the half from lower credit risk RWA partially offset by an increase in non-credit RWA.
The $12.3 billion decline in credit risk RWA included:
• A $1.6 billion decrease from lower lending, mostly from the further reduction in Trade Finance in Asia, as we consolidated our international operations along with lower personal, auto and business lending. This was partially offset by an increase in residential mortgage exposure over the half;
• A $4.4 billion decrease from improved credit metrics driven by lower stressed assets, mainly across small business and corporate lending;
• A $1.6 billion reduction in the RWA overlay for corporate, business and specialised lending. This overlay balance is currently $0.4 billion and was established in June 2020 to take account of facilities where reviews had not been completed. The overlay will be reassessed as customer reviews are completed;
• A methodology change within business lending which decreased RWA by $1.0 billion;
• Foreign currency translation impacts which decreased RWA by $1.4 billion mostly from the appreciation of the A$ against the US$ and NZ$; and
• A decrease in credit RWA associated with derivative exposures (counterparty credit risk and mark-to-market related credit risk) of $2.3 billion mainly due to market and collateral movements.
At 31 March 2021 Westpac applied a floor of 23.8% to its mortgage risk weights in response to the temporary positive effects of COVID-19 stimulus and support measures on customer account behaviours. The floor is consistent with the mortgage risk weight at 30 September 2020 and has resulted in a $3.7 billion increase in mortgage RWA.
Non-credit risk RWA increased by $3.3 billion mainly due to a $2.9 billion increase in Interest Rate Risk in the Banking Book (IRRBB). IRRBB has increased as the embedded gain balance has declined over the period as historical interest rate hedges that were entered into at higher interest rates have matured.
1. Corporate – typically includes exposure where the borrower has annual turnover greater than $50 million, and other business exposures not captured under the definitions of either Business lending or Small Business.
2. Business lending – includes exposures not captured elsewhere where the borrower has annual turnover less than or equal to $50 million.3. Sovereign – includes exposures to governments themselves and other non-commercial enterprises that are owned or controlled by
them.4. Bank – includes exposures to licensed banks and their owned or controlled subsidiaries, and overseas central banks.5. Small business – program managed business lending exposures.6. Specialised lending – property and project finance – includes exposures to entities created to finance and/or operates specific assets
where, apart from the income received from the assets being financed, the borrower has little or no independent capacity to repay from other activities or assets.
7. Securitisation – exposures reflect Westpac’s involvement in activities ranging from originator to investor and include the provision of securitisation services for clients wishing to access capital markets.
8. Operational risk – the risk of loss resulting from inadequate or failed internal processes, people and systems or from external events, including legal risk but excluding strategic or reputational risk.
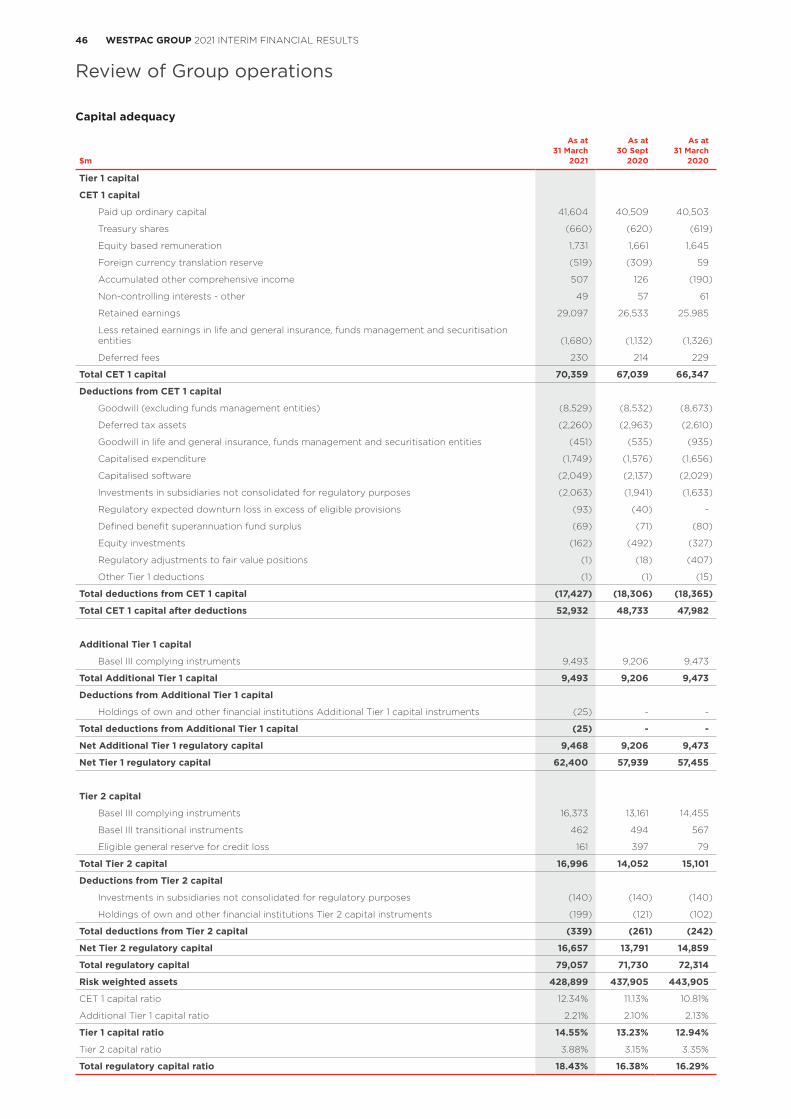
46 WESTPAC GROUP 2021 INTERIM FINANCIAL RESULTS
Review of Group operations
Capital adequacy
As at As at As at31 March 30 Sept 31 March
$m 2021 2020 2020
Tier 1 capital
CET 1 capital
Paid up ordinary capital 41,604 40,509 40,503
Treasury shares (660) (620) (619)
Equity based remuneration 1,731 1,661 1,645
Foreign currency translation reserve (519) (309) 59
Accumulated other comprehensive income 507 126 (190)
Non-controlling interests - other 49 57 61
Retained earnings 29,097 26,533 25,985
Less retained earnings in life and general insurance, funds management and securitisation entities (1,680) (1,132) (1,326)
Deferred fees 230 214 229
Total CET 1 capital 70,359 67,039 66,347
Deductions from CET 1 capital
Goodwill (excluding funds management entities) (8,529) (8,532) (8,673)
Deferred tax assets (2,260) (2,963) (2,610)
Goodwill in life and general insurance, funds management and securitisation entities (451) (535) (935)
Capitalised expenditure (1,749) (1,576) (1,656)
Capitalised software (2,049) (2,137) (2,029)
Investments in subsidiaries not consolidated for regulatory purposes (2,063) (1,941) (1,633)
Regulatory expected downturn loss in excess of eligible provisions (93) (40) -
Defined benefit superannuation fund surplus (69) (71) (80)
Equity investments (162) (492) (327)
Regulatory adjustments to fair value positions (1) (18) (407)
Other Tier 1 deductions (1) (1) (15)
Total deductions from CET 1 capital (17,427) (18,306) (18,365)
Total CET 1 capital after deductions 52,932 48,733 47,982
Additional Tier 1 capital
Basel III complying instruments 9,493 9,206 9,473
Total Additional Tier 1 capital 9,493 9,206 9,473
Deductions from Additional Tier 1 capital
Holdings of own and other financial institutions Additional Tier 1 capital instruments (25) - -
Total deductions from Additional Tier 1 capital (25) - -
Net Additional Tier 1 regulatory capital 9,468 9,206 9,473
Net Tier 1 regulatory capital 62,400 57,939 57,455
Tier 2 capital
Basel III complying instruments 16,373 13,161 14,455
Basel III transitional instruments 462 494 567
Eligible general reserve for credit loss 161 397 79
Total Tier 2 capital 16,996 14,052 15,101
Deductions from Tier 2 capital
Investments in subsidiaries not consolidated for regulatory purposes (140) (140) (140)
Holdings of own and other financial institutions Tier 2 capital instruments (199) (121) (102)
Total deductions from Tier 2 capital (339) (261) (242)
Net Tier 2 regulatory capital 16,657 13,791 14,859
Total regulatory capital 79,057 71,730 72,314
Risk weighted assets 428,899 437,905 443,905
CET 1 capital ratio 12.34% 11.13% 10.81%
Additional Tier 1 capital ratio 2.21% 2.10% 2.13%
Tier 1 capital ratio 14.55% 13.23% 12.94%
Tier 2 capital ratio 3.88% 3.15% 3.35%
Total regulatory capital ratio 18.43% 16.38% 16.29%
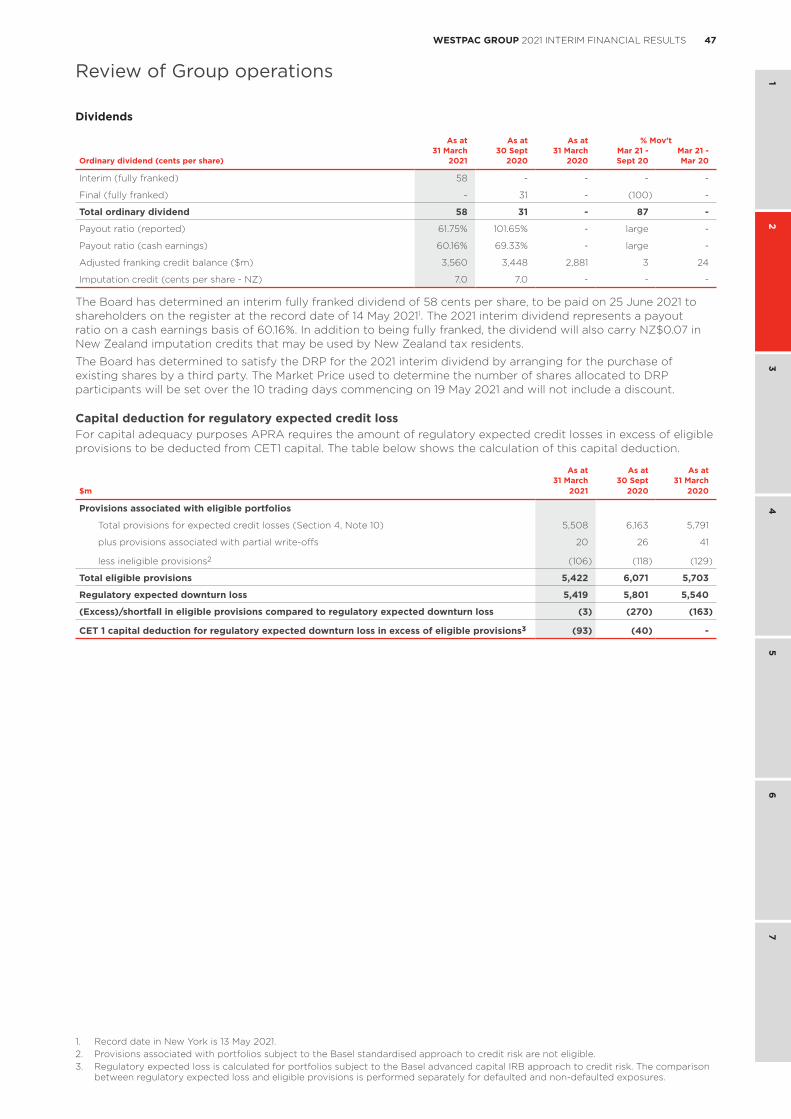
47WESTPAC GROUP 2021 INTERIM FINANCIAL RESULTS
1 2
34
56
7
Review of Group operations
Dividends
As at As at As at % Mov’t31 March 30 Sept 31 March Mar 21 - Mar 21 -
Ordinary dividend (cents per share) 2021 2020 2020 Sept 20 Mar 20
Interim (fully franked) 58 - - - -
Final (fully franked) - 31 - (100) -
Total ordinary dividend 58 31 - 87 -
Payout ratio (reported) 61.75% 101.65% - large -
Payout ratio (cash earnings) 60.16% 69.33% - large -
Adjusted franking credit balance ($m) 3,560 3,448 2,881 3 24
Imputation credit (cents per share - NZ) 7.0 7.0 - - -
The Board has determined an interim fully franked dividend of 58 cents per share, to be paid on 25 June 2021 to shareholders on the register at the record date of 14 May 20211. The 2021 interim dividend represents a payout ratio on a cash earnings basis of 60.16%. In addition to being fully franked, the dividend will also carry NZ$0.07 in New Zealand imputation credits that may be used by New Zealand tax residents.
The Board has determined to satisfy the DRP for the 2021 interim dividend by arranging for the purchase of existing shares by a third party. The Market Price used to determine the number of shares allocated to DRP participants will be set over the 10 trading days commencing on 19 May 2021 and will not include a discount.
Capital deduction for regulatory expected credit lossFor capital adequacy purposes APRA requires the amount of regulatory expected credit losses in excess of eligible provisions to be deducted from CET1 capital. The table below shows the calculation of this capital deduction.
As at As at As at31 March 30 Sept 31 March
$m 2021 2020 2020
Provisions associated with eligible portfolios
Total provisions for expected credit losses (Section 4, Note 10) 5,508 6,163 5,791
plus provisions associated with partial write-offs 20 26 41
less ineligible provisions2 (106) (118) (129)
Total eligible provisions 5,422 6,071 5,703
Regulatory expected downturn loss 5,419 5,801 5,540
(Excess)/shortfall in eligible provisions compared to regulatory expected downturn loss (3) (270) (163)
CET 1 capital deduction for regulatory expected downturn loss in excess of eligible provisions3 (93) (40) -
1. Record date in New York is 13 May 2021.2. Provisions associated with portfolios subject to the Basel standardised approach to credit risk are not eligible.3. Regulatory expected loss is calculated for portfolios subject to the Basel advanced capital IRB approach to credit risk. The comparison
between regulatory expected loss and eligible provisions is performed separately for defaulted and non-defaulted exposures.
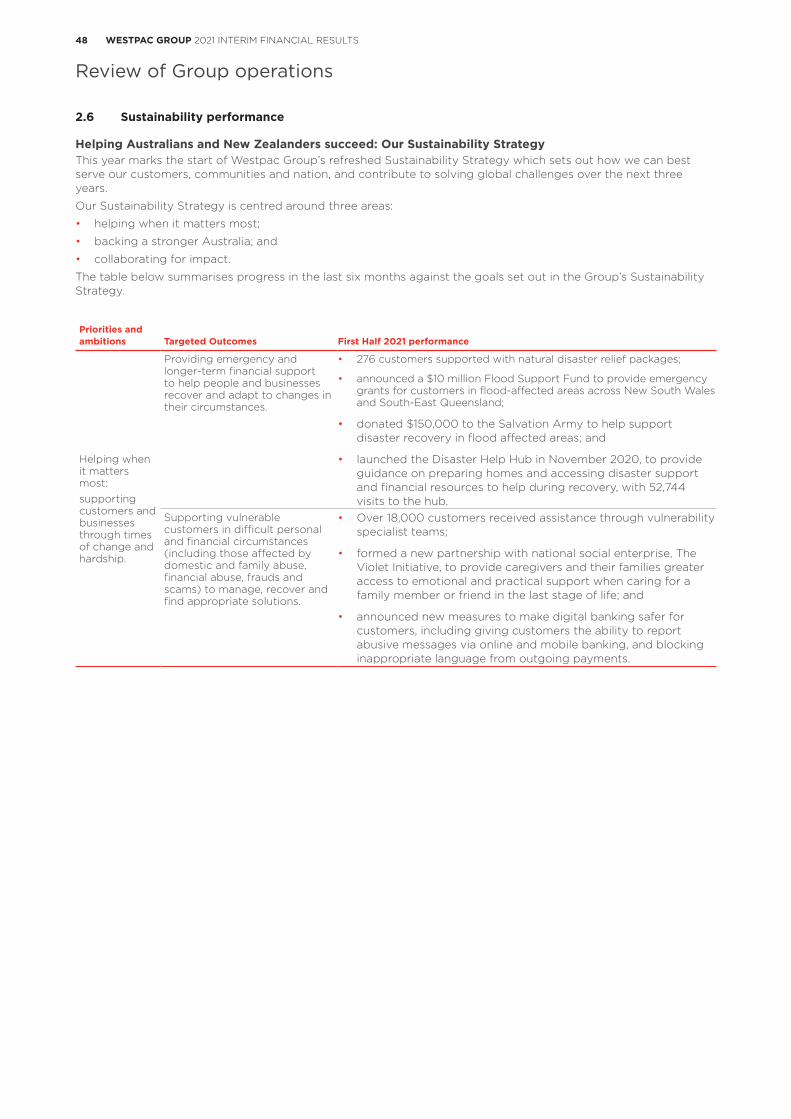
48 WESTPAC GROUP 2021 INTERIM FINANCIAL RESULTS
Review of Group operations
2.6 Sustainability performance
Helping Australians and New Zealanders succeed: Our Sustainability StrategyThis year marks the start of Westpac Group’s refreshed Sustainability Strategy which sets out how we can best serve our customers, communities and nation, and contribute to solving global challenges over the next three years.
Our Sustainability Strategy is centred around three areas:
• helping when it matters most;
• backing a stronger Australia; and
• collaborating for impact.
The table below summarises progress in the last six months against the goals set out in the Group’s Sustainability Strategy.
Priorities and ambitions Targeted Outcomes First Half 2021 performance
Helping when it matters most:supporting customers and businesses through times of change and hardship.
Providing emergency and longer-term financial support to help people and businesses recover and adapt to changes in their circumstances.
• 276 customers supported with natural disaster relief packages;
• announced a $10 million Flood Support Fund to provide emergency grants for customers in flood-affected areas across New South Wales and South-East Queensland;
• donated $150,000 to the Salvation Army to help support disaster recovery in flood affected areas; and
• launched the Disaster Help Hub in November 2020, to provide guidance on preparing homes and accessing disaster support and financial resources to help during recovery, with 52,744 visits to the hub.
Supporting vulnerable customers in difficult personal and financial circumstances (including those affected by domestic and family abuse, financial abuse, frauds and scams) to manage, recover and find appropriate solutions.
• Over 18,000 customers received assistance through vulnerability specialist teams;
• formed a new partnership with national social enterprise, The Violet Initiative, to provide caregivers and their families greater access to emotional and practical support when caring for a family member or friend in the last stage of life; and
• announced new measures to make digital banking safer for customers, including giving customers the ability to report abusive messages via online and mobile banking, and blocking inappropriate language from outgoing payments.
Review of Group operations
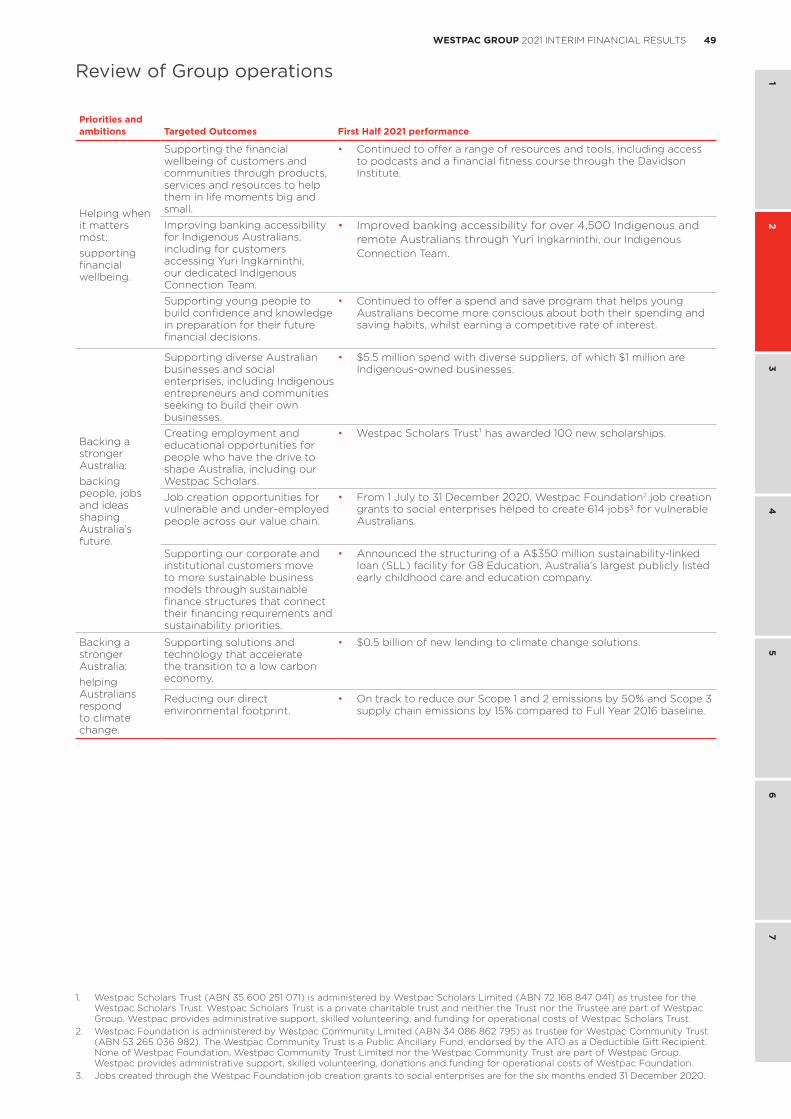
49WESTPAC GROUP 2021 INTERIM FINANCIAL RESULTS
1 2
34
56
7
Review of Group operations
Priorities and ambitions Targeted Outcomes First Half 2021 performance
Helping when it matters most:supporting financial wellbeing.
Supporting the financial wellbeing of customers and communities through products, services and resources to help them in life moments big and small.
• Continued to offer a range of resources and tools, including access to podcasts and a financial fitness course through the Davidson Institute.
Improving banking accessibility for Indigenous Australians, including for customers accessing Yuri Ingkarninthi, our dedicated Indigenous Connection Team.
• Improved banking accessibility for over 4,500 Indigenous and remote Australians through Yuri Ingkarninthi, our Indigenous Connection Team.
Supporting young people to build confidence and knowledge in preparation for their future financial decisions.
• Continued to offer a spend and save program that helps young Australians become more conscious about both their spending and saving habits, whilst earning a competitive rate of interest.
Backing a stronger Australia:backing people, jobs and ideas shaping Australia’s future.
Supporting diverse Australian businesses and social enterprises, including Indigenous entrepreneurs and communities seeking to build their own businesses.
• $5.5 million spend with diverse suppliers, of which $1 million are Indigenous-owned businesses.
Creating employment and educational opportunities for people who have the drive to shape Australia, including our Westpac Scholars.
• Westpac Scholars Trust¹ has awarded 100 new scholarships.
Job creation opportunities for vulnerable and under-employed people across our value chain.
• From 1 July to 31 December 2020, Westpac Foundation2 job creation grants to social enterprises helped to create 614 jobs3 for vulnerable Australians.
Supporting our corporate and institutional customers move to more sustainable business models through sustainable finance structures that connect their financing requirements and sustainability priorities.
• Announced the structuring of a A$350 million sustainability-linked loan (SLL) facility for G8 Education, Australia’s largest publicly listed early childhood care and education company.
Backing a stronger Australia:helping Australians respond to climate change.
Supporting solutions and technology that accelerate the transition to a low carbon economy.
• $0.5 billion of new lending to climate change solutions.
Reducing our direct environmental footprint.
• On track to reduce our Scope 1 and 2 emissions by 50% and Scope 3 supply chain emissions by 15% compared to Full Year 2016 baseline.
1. Westpac Scholars Trust (ABN 35 600 251 071) is administered by Westpac Scholars Limited (ABN 72 168 847 041) as trustee for the Westpac Scholars Trust. Westpac Scholars Trust is a private charitable trust and neither the Trust nor the Trustee are part of Westpac Group. Westpac provides administrative support, skilled volunteering, and funding for operational costs of Westpac Scholars Trust.
2. Westpac Foundation is administered by Westpac Community Limited (ABN 34 086 862 795) as trustee for Westpac Community Trust (ABN 53 265 036 982). The Westpac Community Trust is a Public Ancillary Fund, endorsed by the ATO as a Deductible Gift Recipient. None of Westpac Foundation, Westpac Community Trust Limited nor the Westpac Community Trust are part of Westpac Group. Westpac provides administrative support, skilled volunteering, donations and funding for operational costs of Westpac Foundation.
3. Jobs created through the Westpac Foundation job creation grants to social enterprises are for the six months ended 31 December 2020.
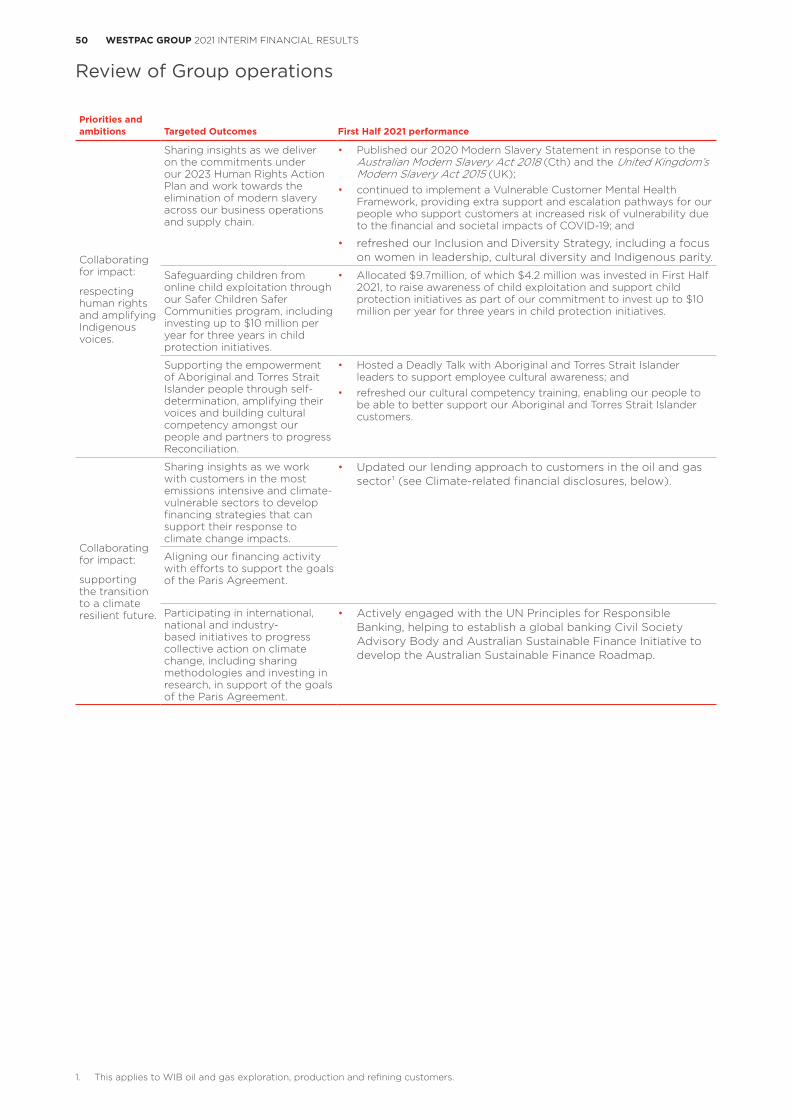
50 WESTPAC GROUP 2021 INTERIM FINANCIAL RESULTS
Review of Group operations
Priorities and ambitions Targeted Outcomes First Half 2021 performance
Collaborating for impact:
respecting human rights and amplifying Indigenous voices.
Sharing insights as we deliver on the commitments under our 2023 Human Rights Action Plan and work towards the elimination of modern slavery across our business operations and supply chain.
• Published our 2020 Modern Slavery Statement in response to the Australian Modern Slavery Act 2018 (Cth) and the United Kingdom’s Modern Slavery Act 2015 (UK);
• continued to implement a Vulnerable Customer Mental Health Framework, providing extra support and escalation pathways for our people who support customers at increased risk of vulnerability due to the financial and societal impacts of COVID-19; and
• refreshed our Inclusion and Diversity Strategy, including a focus on women in leadership, cultural diversity and Indigenous parity.
Safeguarding children from online child exploitation through our Safer Children Safer Communities program, including investing up to $10 million per year for three years in child protection initiatives.
• Allocated $9.7million, of which $4.2 million was invested in First Half 2021, to raise awareness of child exploitation and support child protection initiatives as part of our commitment to invest up to $10 million per year for three years in child protection initiatives.
Supporting the empowerment of Aboriginal and Torres Strait Islander people through self-determination, amplifying their voices and building cultural competency amongst our people and partners to progress Reconciliation.
• Hosted a Deadly Talk with Aboriginal and Torres Strait Islander leaders to support employee cultural awareness; and
• refreshed our cultural competency training, enabling our people to be able to better support our Aboriginal and Torres Strait Islander customers.
Collaborating for impact:
supporting the transition to a climate resilient future.
Sharing insights as we work with customers in the most emissions intensive and climate-vulnerable sectors to develop financing strategies that can support their response to climate change impacts.
• Updated our lending approach to customers in the oil and gas sector¹ (see Climate-related financial disclosures, below).
Aligning our financing activity with efforts to support the goals of the Paris Agreement.
Participating in international, national and industry-based initiatives to progress collective action on climate change, including sharing methodologies and investing in research, in support of the goals of the Paris Agreement.
• Actively engaged with the UN Principles for Responsible Banking, helping to establish a global banking Civil Society Advisory Body and Australian Sustainable Finance Initiative to develop the Australian Sustainable Finance Roadmap.
1. This applies to WIB oil and gas exploration, production and refining customers.
51WESTPAC GROUP 2021 INTERIM FINANCIAL RESULTS
1 2
34
56
7
Review of Group operations
2.6.1 Climate-related financial disclosuresWestpac Group is committed to managing our business in alignment with the Paris Agreement and the need to transition to a net zero emissions economy by 2050. The Group continues to integrate the consideration of climate-related risks and opportunities into our business operations. A summary of Westpac Group’s performance against the recommendations of the Task Force on Climate-related Financial Disclosures (TCFD) is provided below.
OversightThe Board has oversight of the Group’s approach to and management of climate change. Our Climate Change Position Statement and Action Plan (Climate Action Plan)1 is approved by the Board every three years. Updates on progress are provided on a twice-yearly basis.
The Board Risk Committee (BRC) considers and approves Westpac’s Sustainability Risk Management Framework (SRMF), which includes climate change risk, at least every two years. Quarterly updates to the BRC on climate change risk commenced from April 2021.
Implementation and management of the Climate Action Plan is led by Group Executives. A newly-established Reputation and Sustainability Risk team has taken accountability for the Group’s framework for managing reputation and sustainability risk. To ensure appropriate arrangements remain in place, work has commenced to review oversight arrangements in place of the Group Sustainability Council.
The Climate Change Financial Risk Committee focusses on work to identify and manage climate-related financial risks, including the potential impact on credit exposures from climate change-related transition and physical risks. The Committee is chaired by the Group Chief Credit Officer and is a sub-committee of the Group Credit Risk Committee.
An Environment Management Committee chaired by the Chief Property Officer is held quarterly to set and track strategies and initiatives to reduce the Group’s direct environmental footprint, particularly targets around energy and emissions.
Divisional risk committees consider the climate change dimensions of business activities as required. The WIB ESG Risk Committee considers transactions requiring enhanced environmental, social and governance (‘ESG’) due diligence, including for climate change risk.
StrategyThe Climate Action Plan describes Westpac’s climate change strategy. The strategy is underpinned by principles which recognise that:
• a transition to a net zero emissions economy is required by 2050;
• economic growth and emissions reductions are complementary goals;
• addressing climate change creates opportunities;
• climate-related risk is a financial risk; and
• collective action, transparency and disclosure matter.
The Climate Action Plan identifies three focus areas where the Group is expected to direct its attention over the short, medium and long term:
• help customers and communities respond to climate change;
• improve the climate change performance of our operations; and
• support initiatives and policies to achieve the goals of the Paris Agreement.
Risk management overviewWestpac Group’s Climate Action Plan sets out our overall approach to managing climate-related risks. Climate change risks are managed within the Group’s risk management framework including the SRMF, Group ESG Credit Policy and Risk Appetite Statements. We seek to understand the potential for climate-related transition, physical and litigation risks to impact our business, including the possible impact on credit risk, regulatory and reporting obligations, and our reputation. Climate change is included in the Group Risk Taxonomy under the credit risk, and reputational and sustainability risk categories. The Group regularly reviews this framework and ensures relevant aspects are appropriately reflected in the Climate Action Plan.
The Climate Action Plan sets out specific climate-related lending criteria which are applied at the portfolio and customer level where appropriate. If climate-related risks associated with a transaction are not within appetite then the application of conditions to sufficiently manage the risks will be considered, or the transaction may be declined. Climate-related risks may be escalated to relevant divisional and Group risk committees in accordance with the SRMF.
During First Half 2021, APRA commenced engagement with Westpac and other major Australian banks on its Climate Vulnerability Assessment. The Climate Vulnerability Assessment is expected to focus on stress testing material parts of Westpac’s credit strategy, under two climate scenarios focussed on transition and physical risk. A qualitative assessment of operational, market and liquidity risk, and data quality is also expected. The ADIs are engaged with APRA, directly and via the ABA on the final design of the Climate Vulnerability Assessment
1. The term ‘Climate Action Plan’ as used in this document refers to the most recent version: Climate Change Position Statement and 2023 Action Plan.
52 WESTPAC GROUP 2021 INTERIM FINANCIAL RESULTS
Review of Group operations
and have commenced preparations to respond. We will continue to evolve our approach to climate change risk management as required to align with changes in legal and regulatory requirements. In April APRA released a draft Prudential Practice Guide – Draft CPG 229 Climate Change Financial Risks (PPG) which sets out guidance on better practice in management of climate change financial risks. The draft PPG focusses on identification, measurement, monitoring, management and reporting of climate-related risks, and the role of scenario analysis, and is broadly aligned with the recommendations of the Taskforce on Climate-related Disclosures. We will review our current practices and future plans in light of the draft guidance, and provide feedback to APRA as part of its consultation process.
Scenario AnalysisWestpac used scenario analysis to inform our identification of industries exposed to climate-related risks over short, medium and long-term horizons1 - summary results are shown in the Metrics and Targets section, below. The findings from scenario analysis conducted in 2019 are reflected in our current Climate Action Plan which outlines enhanced lending standards for emissions-intensive sectors including management of lending exposure to thermal coal mining customers (as defined in that document) to zero by 2030, and emissions reduction targets for lending to the electricity generation sector to support Paris-aligned transition pathways.
In line with our Climate Action Plan we progressed analysis to further understand material climate-related risks in two areas of our portfolio during the First Half 2021: transition risk in the oil and gas sector, and physical risk in the mortgage book.
Transition risk in the oil and gas sectorWe completed an initial study of how global oil and gas demand might perform when carbon emissions are constrained in line with ‘well-below’ 2-degree and 1.5-degree transition pathways2.
Based on our initial findings we have updated our approach and internal ESG criteria by which climate-related risks and opportunities are assessed in the oil and gas sector, with a focus on WIB’s oil and gas exploration, production and refining customers.
Our updated approach means we will:
• expect any new oil and gas exploration, production and refining customers, to whom we provide lending, to have publicly disclosed Paris-aligned business goals;
• continue to support existing customers (particularly via sustainable finance structures) to develop Paris-aligned financing strategies using our internal ESG criteria to guide our approach; and
• continue to develop our approach and understanding of climate-related risk and opportunities in the oil and gas sector (including downstream segments) through engagement with our customers3.
We will continue to provide annual updates on our progress.
Physical risk in the Australian mortgage bookWe updated our approach to assessing the impact of extreme weather events under climate change scenarios on our Australian mortgage portfolio4. The analysis:
• used a generalised model of how extreme weather and climate change may affect a number of physical risks to a ‘Representative Property’ (an archetype of a modern Australian home) under a 4-degree scenario5;
• considered riverine flooding, coastal inundation, forest fires, extreme wind and soil subsidence;
• computed physical risk for each year from 1990 to 2100, allowing us to identify the potential impacts of current and future extreme weather and climate change;
• modelled a ‘static’ balance sheet with no population growth or movement, and did not consider the impact of adaptation measures or management actions to mitigate risks; and
• identified locations that may be at higher risk6 and assessed the Group’s current exposure to these locations.
The analysis suggests that while climate change will drive an ongoing increase in annual average losses over time, Westpac’s exposure in the Australian mortgage portfolio to locations identified as likely to be exposed to higher physical risks under a RCP8.5 scenario is around 1.7% of the current portfolio, increasing to around 2.0% by 2050.
Westpac understands the importance of both climate mitigation and adaptation efforts, including government and community planning measures, and the benefits of climate-resilient building characteristics to reduce property damage and impacts on customers, communities and shareholders. We continue to advocate for more research and investment into helping communities adapt and become resilient to climate-related impacts. The updated analysis is being used to improve our understanding of how to help individual customers respond to the impacts of climate change and in the potential for climate change to impact on loan serviceability and property values. We will continue to provide regular updates on our progress.
1. Further details explaining the Group’s approach to scenario analysis can be found in Westpac’s 2020 Sustainability Performance Report2. The ‘well below’ 2-degree scenario used the International Energy Agency’s Sustainable Development Scenario (SDS-2019) and the
1.5-degree scenario used the Asia-Pacific Integrated Model Shared Socio-Economic Pathways (AIM/CGE 2.0 SSP1-19) model.3. Initial focus on WIB customers.4. Excludes RAMS and Equity Acess.5. IPCC RCP8.5 scenario.6. ‘Higher risk’ were locations where insurance may become more expensive or unavailable.
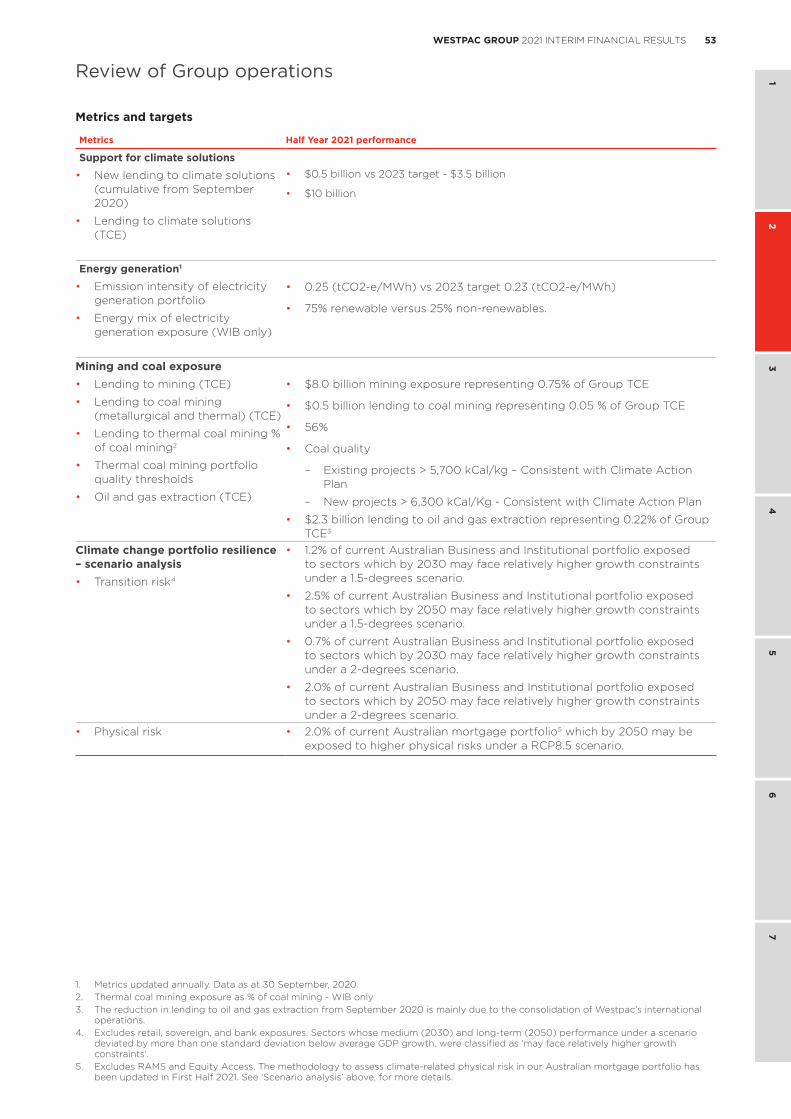
53WESTPAC GROUP 2021 INTERIM FINANCIAL RESULTS
1 2
34
56
7
Review of Group operations
Metrics and targets
Metrics Half Year 2021 performance
Support for climate solutions
• New lending to climate solutions (cumulative from September 2020)
• Lending to climate solutions (TCE)
• $0.5 billion vs 2023 target - $3.5 billion
• $10 billion
Energy generation1
• Emission intensity of electricity generation portfolio
• Energy mix of electricity generation exposure (WIB only)
• 0.25 (tCO2-e/MWh) vs 2023 target 0.23 (tCO2-e/MWh)
• 75% renewable versus 25% non-renewables.
Mining and coal exposure• Lending to mining (TCE)
• Lending to coal mining (metallurgical and thermal) (TCE)
• Lending to thermal coal mining % of coal mining2
• Thermal coal mining portfolio quality thresholds
• Oil and gas extraction (TCE)
• $8.0 billion mining exposure representing 0.75% of Group TCE
• $0.5 billion lending to coal mining representing 0.05 % of Group TCE
• 56%
• Coal quality
– Existing projects > 5,700 kCal/kg – Consistent with Climate Action Plan
– New projects > 6,300 kCal/Kg - Consistent with Climate Action Plan
• $2.3 billion lending to oil and gas extraction representing 0.22% of Group TCE3
Climate change portfolio resilience – scenario analysis• Transition risk 4
• 1.2% of current Australian Business and Institutional portfolio exposed to sectors which by 2030 may face relatively higher growth constraints under a 1.5-degrees scenario.
• 2.5% of current Australian Business and Institutional portfolio exposed to sectors which by 2050 may face relatively higher growth constraints under a 1.5-degrees scenario.
• 0.7% of current Australian Business and Institutional portfolio exposed to sectors which by 2030 may face relatively higher growth constraints under a 2-degrees scenario.
• 2.0% of current Australian Business and Institutional portfolio exposed to sectors which by 2050 may face relatively higher growth constraints under a 2-degrees scenario.
• Physical risk • 2.0% of current Australian mortgage portfolio5 which by 2050 may be exposed to higher physical risks under a RCP8.5 scenario.
1. Metrics updated annually. Data as at 30 September, 2020.2. Thermal coal mining exposure as % of coal mining - WIB only3. The reduction in lending to oil and gas extraction from September 2020 is mainly due to the consolidation of Westpac’s international
operations.4. Excludes retail, sovereign, and bank exposures. Sectors whose medium (2030) and long-term (2050) performance under a scenario
deviated by more than one standard deviation below average GDP growth, were classified as ‘may face relatively higher growth constraints’.
5. Excludes RAMS and Equity Access. The methodology to assess climate-related physical risk in our Australian mortgage portfolio has been updated in First Half 2021. See ‘Scenario analysis’ above, for more details.
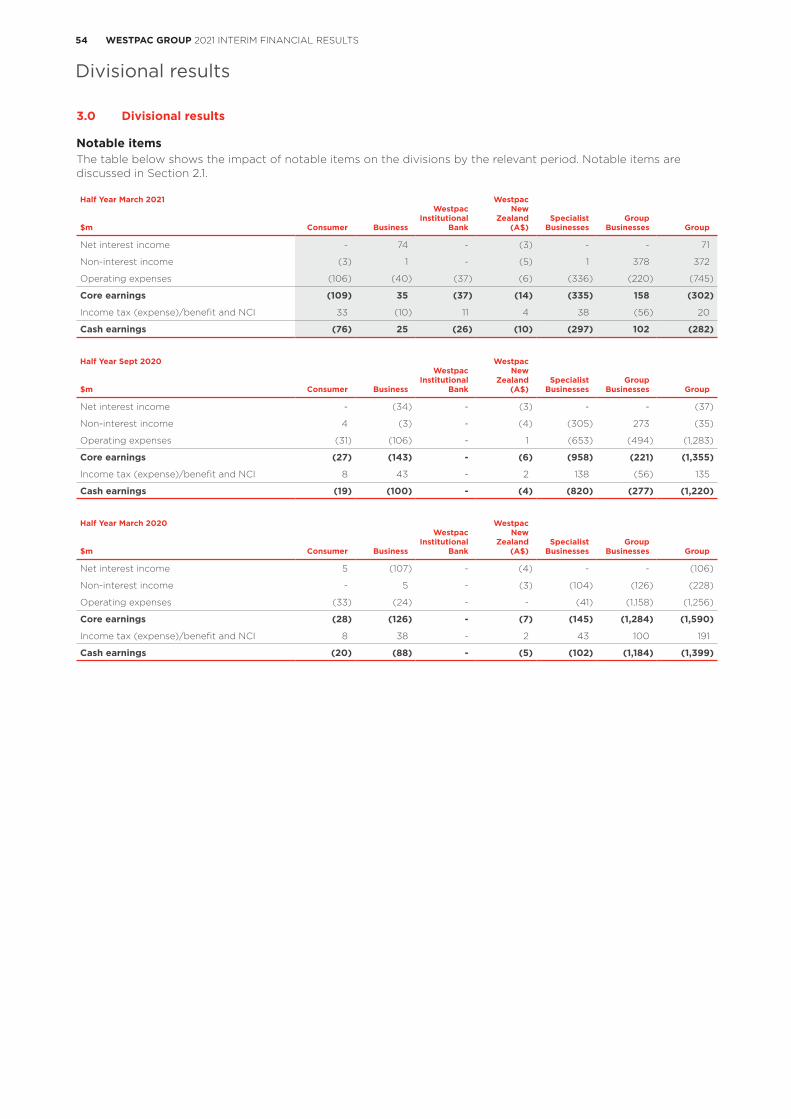
54 WESTPAC GROUP 2021 INTERIM FINANCIAL RESULTS
Divisional results
Divisional results
3.0 Divisional results
Notable itemsThe table below shows the impact of notable items on the divisions by the relevant period. Notable items are discussed in Section 2.1.
Half Year March 2021
Consumer Business
Westpac Institutional
Bank
Westpac New
Zealand (A$)
Group Businesses Group
$m
Specialist Businesses
Net interest income - 74 - (3) - - 71
Non-interest income (3) 1 - (5) 1 378 372
Operating expenses (106) (40) (37) (6) (336) (220) (745)
Core earnings (109) 35 (37) (14) (335) 158 (302)
Income tax (expense)/benefit and NCI 33 (10) 11 4 38 (56) 20
Cash earnings (76) 25 (26) (10) (297) 102 (282)
Half Year Sept 2020
Consumer Business
Westpac Institutional
Bank
Westpac New
Zealand (A$)
Group Businesses Group
$m
Specialist Businesses
Net interest income - (34) - (3) - - (37)
Non-interest income 4 (3) - (4) (305) 273 (35)
Operating expenses (31) (106) - 1 (653) (494) (1,283)
Core earnings (27) (143) - (6) (958) (221) (1,355)
Income tax (expense)/benefit and NCI 8 43 - 2 138 (56) 135
Cash earnings (19) (100) - (4) (820) (277) (1,220)
Half Year March 2020
Consumer Business
Westpac Institutional
Bank
Westpac New
Zealand (A$)
Group Businesses Group
$m
Specialist Businesses
Net interest income 5 (107) - (4) - - (106)
Non-interest income - 5 - (3) (104) (126) (228)
Operating expenses (33) (24) - - (41) (1,158) (1,256)
Core earnings (28) (126) - (7) (145) (1,284) (1,590)
Income tax (expense)/benefit and NCI 8 38 - 2 43 100 191
Cash earnings (20) (88) - (5) (102) (1,184) (1,399)
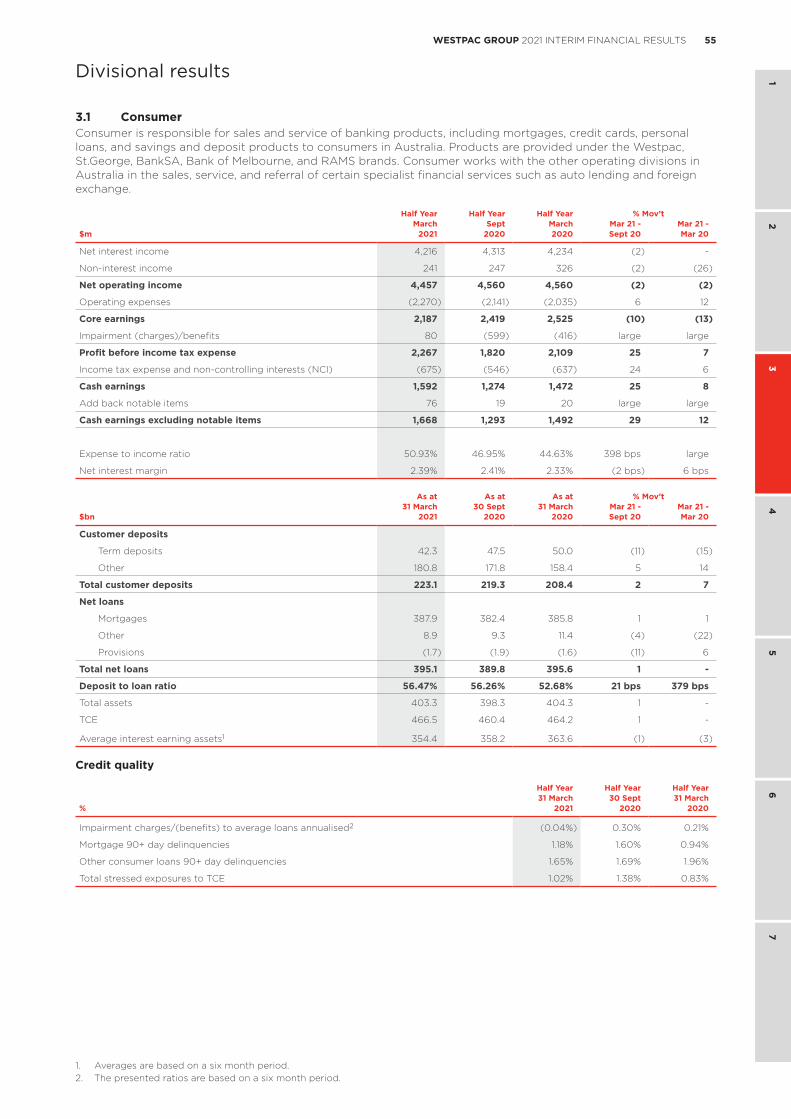
55WESTPAC GROUP 2021 INTERIM FINANCIAL RESULTS
1 2
34
56
7
Divisional results
3.1 ConsumerConsumer is responsible for sales and service of banking products, including mortgages, credit cards, personal loans, and savings and deposit products to consumers in Australia. Products are provided under the Westpac, St.George, BankSA, Bank of Melbourne, and RAMS brands. Consumer works with the other operating divisions in Australia in the sales, service, and referral of certain specialist financial services such as auto lending and foreign exchange.
Half Year Half Year Half Year % Mov’tMarch Sept March Mar 21 - Mar 21 -
$m 2021 2020 2020 Sept 20 Mar 20
Net interest income 4,216 4,313 4,234 (2) -
Non-interest income 241 247 326 (2) (26)
Net operating income 4,457 4,560 4,560 (2) (2)
Operating expenses (2,270) (2,141) (2,035) 6 12
Core earnings 2,187 2,419 2,525 (10) (13)
Impairment (charges)/benefits 80 (599) (416) large large
Profit before income tax expense 2,267 1,820 2,109 25 7
Income tax expense and non-controlling interests (NCI) (675) (546) (637) 24 6
Cash earnings 1,592 1,274 1,472 25 8
Add back notable items 76 19 20 large large
Cash earnings excluding notable items 1,668 1,293 1,492 29 12
Expense to income ratio 50.93% 46.95% 44.63% 398 bps large
Net interest margin 2.39% 2.41% 2.33% (2 bps) 6 bps
As at As at As at % Mov’t31 March 30 Sept 31 March Mar 21 - Mar 21 -
$bn 2021 2020 2020 Sept 20 Mar 20
Customer deposits
Term deposits 42.3 47.5 50.0 (11) (15)
Other 180.8 171.8 158.4 5 14
Total customer deposits 223.1 219.3 208.4 2 7
Net loans
Mortgages 387.9 382.4 385.8 1 1
Other 8.9 9.3 11.4 (4) (22)
Provisions (1.7) (1.9) (1.6) (11) 6
Total net loans 395.1 389.8 395.6 1 -
Deposit to loan ratio 56.47% 56.26% 52.68% 21 bps 379 bps
Total assets 403.3 398.3 404.3 1 -
TCE 466.5 460.4 464.2 1 -
Average interest earning assets1 354.4 358.2 363.6 (1) (3)
Credit quality
Half Year Half Year Half Year31 March 30 Sept 31 March
% 2021 2020 2020
Impairment charges/(benefits) to average loans annualised2 (0.04%) 0.30% 0.21%
Mortgage 90+ day delinquencies 1.18% 1.60% 0.94%
Other consumer loans 90+ day delinquencies 1.65% 1.69% 1.96%
Total stressed exposures to TCE 1.02% 1.38% 0.83%
1. Averages are based on a six month period.2. The presented ratios are based on a six month period.

56 WESTPAC GROUP 2021 INTERIM FINANCIAL RESULTS
Divisional results
Financial performance
First Half 2021 – Second Half 2020Cash earnings of $1,592 million were $318 million or 25% higher than Second Half 2020. Excluding notable items, cash earnings were $375 million higher, mostly due to an impairment benefit of $80 million in First Half 2021 compared to a $599 million impairment charge in Second Half 2020.
Net interest income down $97m, 2%
• Net loans increased 1% (or $5.3 billion) over the half. The increase in mortgage lending (up $5.5 billion) was due to targeted campaigns and more digital applications. Other personal lending declined $0.4 billion (or 4%) from customers paying down this form of debt;
• Deposits increased 2% (or $3.8 billion), with growth in at call balances as customers chose to hold less of their funds in term deposits; and
• Net interest margin was 2 basis points lower. Mortgage spreads were down from lower spreads on new mortgages, particularly fixed rate mortgages, and retention pricing. This was partly offset by lower funding costs along with higher deposit spreads.
Non-interest income down $6m, 2%
• Most of the decline was due to fees paid to a third party following the sale of our offsite ATMs and lower fee income from the removal of certain fees as part of our simplification strategy.
Expenses
up $129m, 6%
• Notable items increased expenses $75 million. Excluding this, expenses were up $54 million. The increase was due to:
– Higher spending on risk and compliance programs, including financial crime, fraud prevention and our financial and non-financial risk programs; and
– Increase in mortgage processing costs and additional resources to support customers, in particular customers exiting deferral packages and experiencing hardship.
• These increases were partly offset by savings from further use of our digital channels, organisation redesign, a reduction in our branch network (40 branches were closed in First Half 2021, adding to the 24 branches closed in 2020), and a reduction in our ATM network. Restructuring costs were also lower.
Impairment benefit of $80m compared to an impairment charge of $599m
• Impairment benefit from lower collectively assessed provisions from the improved economic outlook and improved asset quality; and
• Mortgage 90+ day delinquencies of 1.18%, 42 basis points lower than September 2020 (1.60%) from reduced levels of hardship. Other consumer 90+ day delinquencies of 1.65%, down 4 basis points over the half.
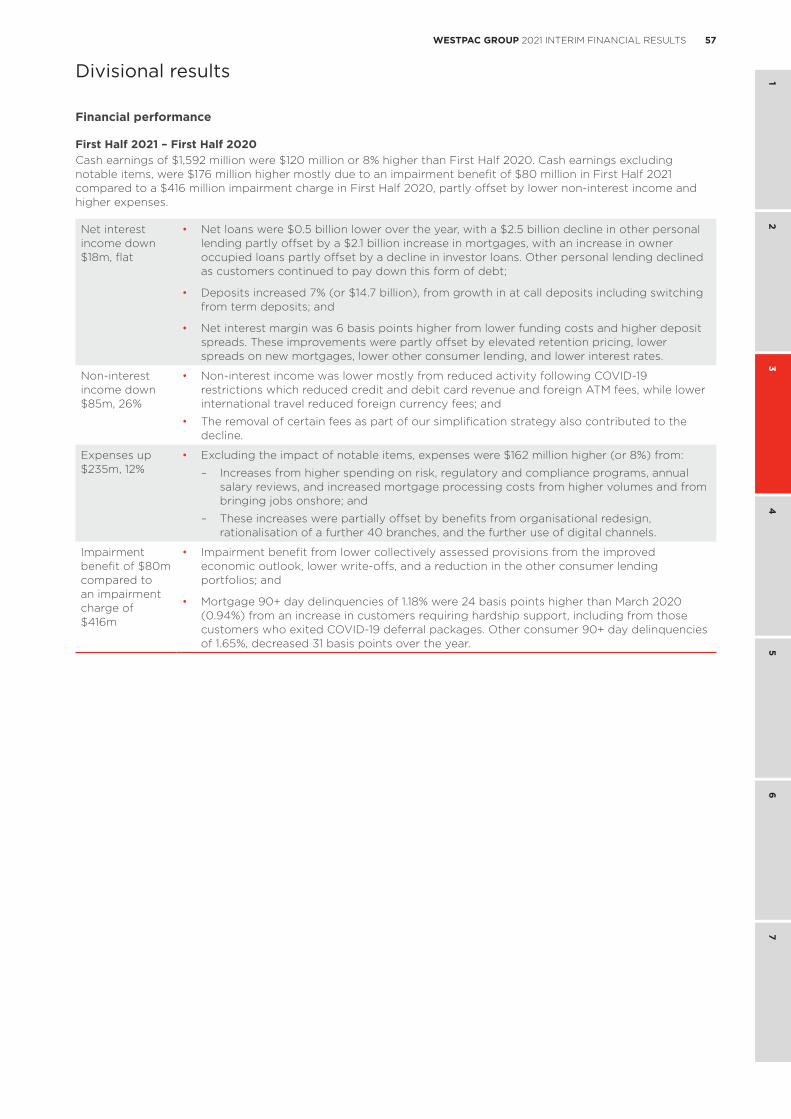
57WESTPAC GROUP 2021 INTERIM FINANCIAL RESULTS
1 2
34
56
7
Divisional results
Financial performance
First Half 2021 – First Half 2020Cash earnings of $1,592 million were $120 million or 8% higher than First Half 2020. Cash earnings excluding notable items, were $176 million higher mostly due to an impairment benefit of $80 million in First Half 2021 compared to a $416 million impairment charge in First Half 2020, partly offset by lower non-interest income and higher expenses.
Net interest income down $18m, flat
• Net loans were $0.5 billion lower over the year, with a $2.5 billion decline in other personal lending partly offset by a $2.1 billion increase in mortgages, with an increase in owner occupied loans partly offset by a decline in investor loans. Other personal lending declined as customers continued to pay down this form of debt;
• Deposits increased 7% (or $14.7 billion), from growth in at call deposits including switching from term deposits; and
• Net interest margin was 6 basis points higher from lower funding costs and higher deposit spreads. These improvements were partly offset by elevated retention pricing, lower spreads on new mortgages, lower other consumer lending, and lower interest rates.
Non-interest income down $85m, 26%
• Non-interest income was lower mostly from reduced activity following COVID-19 restrictions which reduced credit and debit card revenue and foreign ATM fees, while lower international travel reduced foreign currency fees; and
• The removal of certain fees as part of our simplification strategy also contributed to the decline.
Expenses up $235m, 12%
• Excluding the impact of notable items, expenses were $162 million higher (or 8%) from:
– Increases from higher spending on risk, regulatory and compliance programs, annual salary reviews, and increased mortgage processing costs from higher volumes and from bringing jobs onshore; and
– These increases were partially offset by benefits from organisational redesign, rationalisation of a further 40 branches, and the further use of digital channels.
Impairment benefit of $80m compared to an impairment charge of $416m
• Impairment benefit from lower collectively assessed provisions from the improved economic outlook, lower write-offs, and a reduction in the other consumer lending portfolios; and
• Mortgage 90+ day delinquencies of 1.18% were 24 basis points higher than March 2020 (0.94%) from an increase in customers requiring hardship support, including from those customers who exited COVID-19 deferral packages. Other consumer 90+ day delinquencies of 1.65%, decreased 31 basis points over the year.
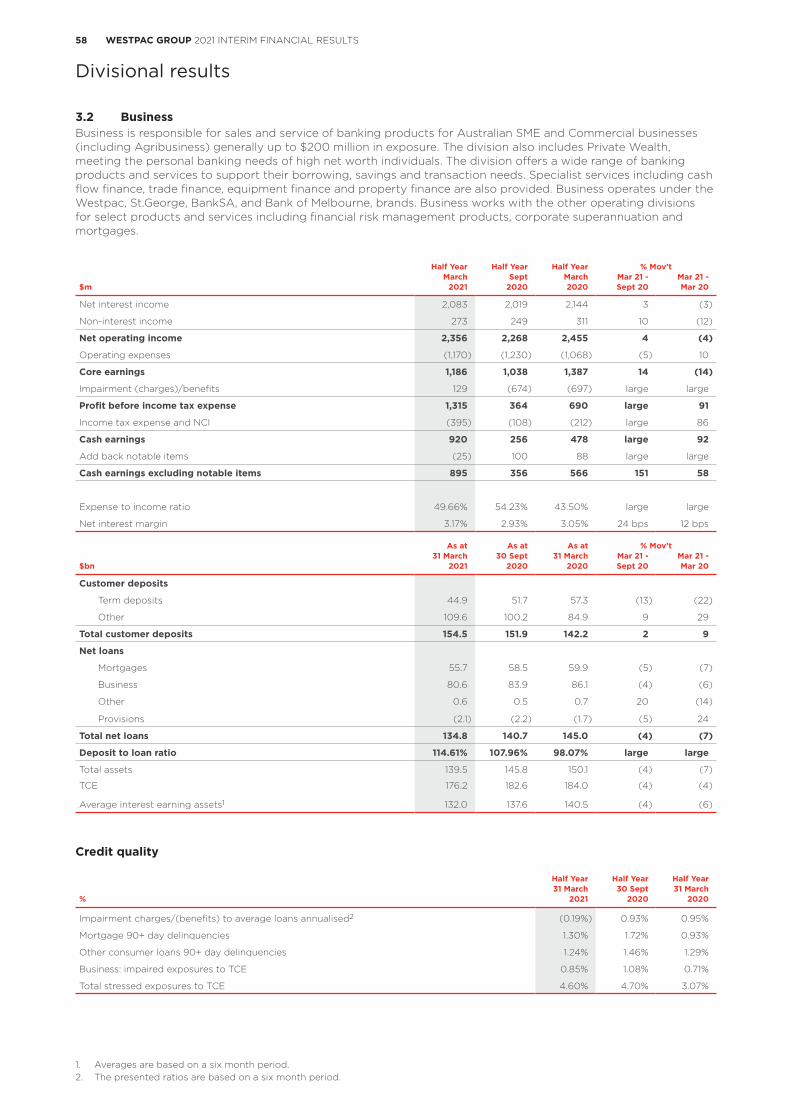
58 WESTPAC GROUP 2021 INTERIM FINANCIAL RESULTS
Divisional results
3.2 BusinessBusiness is responsible for sales and service of banking products for Australian SME and Commercial businesses (including Agribusiness) generally up to $200 million in exposure. The division also includes Private Wealth, meeting the personal banking needs of high net worth individuals. The division offers a wide range of banking products and services to support their borrowing, savings and transaction needs. Specialist services including cash flow finance, trade finance, equipment finance and property finance are also provided. Business operates under the Westpac, St.George, BankSA, and Bank of Melbourne, brands. Business works with the other operating divisions for select products and services including financial risk management products, corporate superannuation and mortgages.
Half Year Half Year Half Year % Mov’tMarch Sept March Mar 21 - Mar 21 -
$m 2021 2020 2020 Sept 20 Mar 20
Net interest income 2,083 2,019 2,144 3 (3)
Non-interest income 273 249 311 10 (12)
Net operating income 2,356 2,268 2,455 4 (4)
Operating expenses (1,170) (1,230) (1,068) (5) 10
Core earnings 1,186 1,038 1,387 14 (14)
Impairment (charges)/benefits 129 (674) (697) large large
Profit before income tax expense 1,315 364 690 large 91
Income tax expense and NCI (395) (108) (212) large 86
Cash earnings 920 256 478 large 92
Add back notable items (25) 100 88 large large
Cash earnings excluding notable items 895 356 566 151 58
Expense to income ratio 49.66% 54.23% 43.50% large large
Net interest margin 3.17% 2.93% 3.05% 24 bps 12 bps
As at As at As at % Mov’t31 March 30 Sept 31 March Mar 21 - Mar 21 -
$bn 2021 2020 2020 Sept 20 Mar 20
Customer deposits
Term deposits 44.9 51.7 57.3 (13) (22)
Other 109.6 100.2 84.9 9 29
Total customer deposits 154.5 151.9 142.2 2 9
Net loans
Mortgages 55.7 58.5 59.9 (5) (7)
Business 80.6 83.9 86.1 (4) (6)
Other 0.6 0.5 0.7 20 (14)
Provisions (2.1) (2.2) (1.7) (5) 24
Total net loans 134.8 140.7 145.0 (4) (7)
Deposit to loan ratio 114.61% 107.96% 98.07% large large
Total assets 139.5 145.8 150.1 (4) (7)
TCE 176.2 182.6 184.0 (4) (4)
Average interest earning assets1 132.0 137.6 140.5 (4) (6)
Credit quality
Half Year Half Year Half Year31 March 30 Sept 31 March
% 2021 2020 2020
Impairment charges/(benefits) to average loans annualised2 (0.19%) 0.93% 0.95%
Mortgage 90+ day delinquencies 1.30% 1.72% 0.93%
Other consumer loans 90+ day delinquencies 1.24% 1.46% 1.29%
Business: impaired exposures to TCE 0.85% 1.08% 0.71%
Total stressed exposures to TCE 4.60% 4.70% 3.07%
1. Averages are based on a six month period.2. The presented ratios are based on a six month period.
59WESTPAC GROUP 2021 INTERIM FINANCIAL RESULTS
1 2
34
56
7
Divisional results
Financial performance
First Half 2021 – Second Half 2020Cash earnings of $920 million were $664 million higher than Second Half 2020. Most of the improvement in cash earnings was due to an impairment benefit of $129 million compared to an impairment charge of $674 million in Second Half 2020. Lower notable items ($125 million reduction) also contributed to the increase in cash earnings.
Net interest income up $64m, 3%
• The rise in net interest income was due to lower notable items in First Half 2021 which were $108 million lower than Second Half 2020. Excluding this, net interest income was down $44 million (or 2%), with the higher net interest margin more than offset by lower lending;
• Net interest margin was 7 basis points higher excluding the impact of notable items mostly from a change in the mix of deposits to transaction and other at call products, and improved term deposit spreads;
• Net loans were 4% (or $5.9 billion) lower over the half across business lending and mortgages. Business lending was lower across most sectors with the largest declines in property and professional services; and
• Deposits were 2% (or $2.6 billion) higher with a $6.2 billion increase in transaction balances and a $3.2 billion increase in other at call balances supported by government stimulus measures and a customer preference to hold funds in transaction and other at call accounts. This was partly offset by a decline in term deposits.
Non-interest income up $24m, 10%
• Notable items had little impact on non-interest income ($4 million lower) with the increase mostly from higher merchant fees as fee waivers for COVID-19 support rolled off; and
• Other card revenue was also higher as activity and spending increased.
Expenses down $60m, 5%
• Notable items were $66 million lower than Second Half 2020. Excluding this impact, expenses were $6 million higher than Second Half 2020; and
• Most of the increase related to further spend on risk and compliance, with business as usual increases were largely offset by benefits from productivity savings.
Impairment benefit of $129m compared to an impairment charge of $674m
• Impairment benefit from lower collectively assessed provisions from the improved economic outlook and improved asset quality. Individually assessed provisions were also lower in the half; and
• The level of stressed assets to TCE decreased 10 basis points to 4.60%, mostly from a reduction in mortgage 90+ day delinquencies, and a decrease in watchlist and substandard exposures in the Commercial portfolio.
60 WESTPAC GROUP 2021 INTERIM FINANCIAL RESULTS
Divisional results
First Half 2021 – First Half 2020
Cash earnings of $920 million were $442 million higher than First Half 2020. Most of the improvement was due to an impairment benefit of $129 million compared to an impairment charge of $697 million in First Half 2020. Lower notable items ($113 million) also contributed to the increase in cash earnings.
Net interest income down $61m, 3%
• Excluding notable items, net interest income was down $242 million (11%);
• Net loans were 7% (or $10.2 billion) lower over the year, with the decline from lower investor mortgages and a 6% decline in business lending. Business lending was lower across most sectors with the largest declines in property, professional services, and retail. Higher provisions also contributed to the decline;
• Deposits were 9% (or $12.3 billion) higher over the year with a $16.1 billion rise in transaction balances and a $8.6 billion increase in other at call balances supported by government stimulus packages. This was partially offset by a $12.4 billion decline in term deposits given a preference to retain funds in transaction and other at call accounts; and
• Net interest margin was 12 basis points higher, but down 15 basis points excluding notable items. The lower margin was mostly from reduced deposit spreads from low interest rates along with special low interest rates on certain products as part of our COVID-19 support. These reductions were partly offset by deposit repricing and changes in deposit mix.
Non-interest income down $38m, 12%
• Notable items had little impact on movement in non-interest income (up $4 million); and
• Most of the decline was due to lower fees consistent with lower activity, a decline in overdrawn fees, and lower markets related income.
Expenses up $102m, 10%
• Notable items were $16 million higher than First Half 2020, excluding this impact, expenses were $86 million higher than First Half 2020; and
• The increase was due to spending to support customers impacted by COVID-19, increased spend on risk, regulatory and compliance programs and further investment in bankers.
Impairment benefit of $129m compared to an impairment charge of $697m
• Impairment benefit mostly from lower collectively assessed provisions from the improved economic outlook. Individually assessed provisions were also lower in the half; and
• The level of stressed assets to TCE increased 153 basis points to 4.60%, mostly from an increase in watchlist and substandard exposures in the Commercial portfolio.
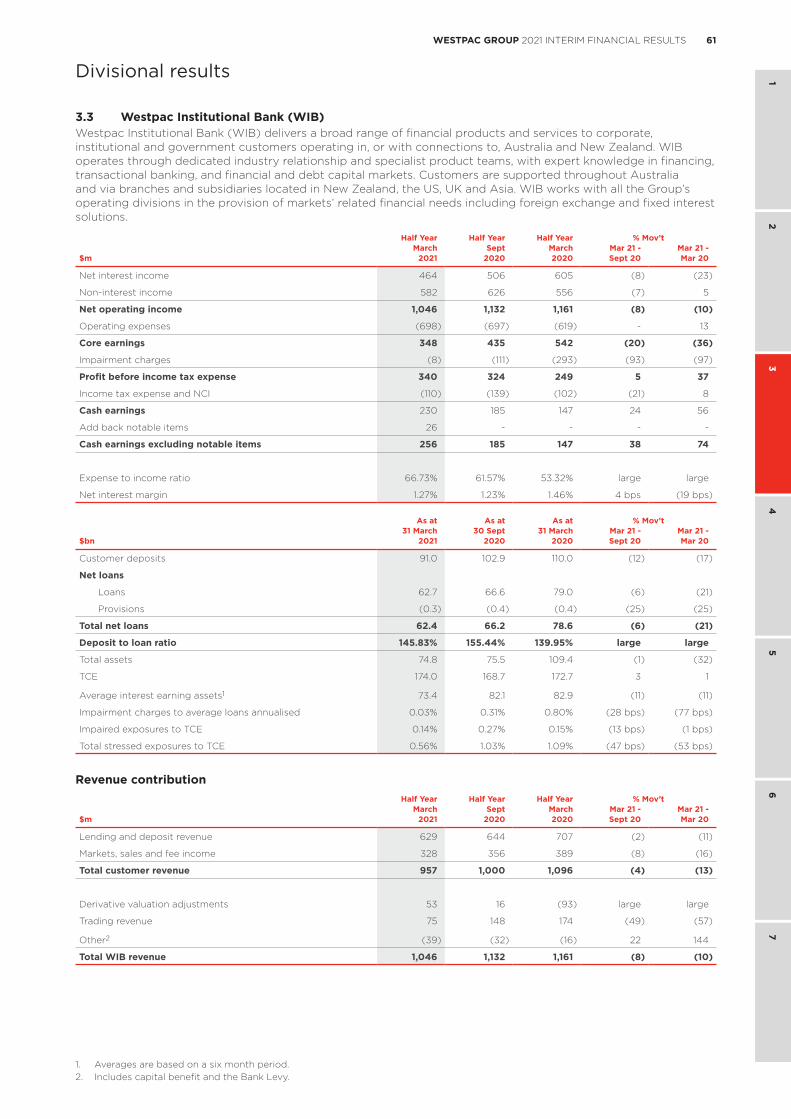
61WESTPAC GROUP 2021 INTERIM FINANCIAL RESULTS
1 2
34
56
7
Divisional results
3.3 Westpac Institutional Bank (WIB)Westpac Institutional Bank (WIB) delivers a broad range of financial products and services to corporate, institutional and government customers operating in, or with connections to, Australia and New Zealand. WIB operates through dedicated industry relationship and specialist product teams, with expert knowledge in financing, transactional banking, and financial and debt capital markets. Customers are supported throughout Australia and via branches and subsidiaries located in New Zealand, the US, UK and Asia. WIB works with all the Group’s operating divisions in the provision of markets’ related financial needs including foreign exchange and fixed interest solutions.
Half Year Half Year Half Year % Mov’tMarch Sept March Mar 21 - Mar 21 -
$m 2021 2020 2020 Sept 20 Mar 20
Net interest income 464 506 605 (8) (23)
Non-interest income 582 626 556 (7) 5
Net operating income 1,046 1,132 1,161 (8) (10)
Operating expenses (698) (697) (619) - 13
Core earnings 348 435 542 (20) (36)
Impairment charges (8) (111) (293) (93) (97)
Profit before income tax expense 340 324 249 5 37
Income tax expense and NCI (110) (139) (102) (21) 8
Cash earnings 230 185 147 24 56
Add back notable items 26 - - - -
Cash earnings excluding notable items 256 185 147 38 74
Expense to income ratio 66.73% 61.57% 53.32% large large
Net interest margin 1.27% 1.23% 1.46% 4 bps (19 bps)
As at As at As at % Mov’t31 March 30 Sept 31 March Mar 21 - Mar 21 -
$bn 2021 2020 2020 Sept 20 Mar 20
Customer deposits 91.0 102.9 110.0 (12) (17)
Net loans
Loans 62.7 66.6 79.0 (6) (21)
Provisions (0.3) (0.4) (0.4) (25) (25)
Total net loans 62.4 66.2 78.6 (6) (21)
Deposit to loan ratio 145.83% 155.44% 139.95% large large
Total assets 74.8 75.5 109.4 (1) (32)
TCE 174.0 168.7 172.7 3 1
Average interest earning assets1 73.4 82.1 82.9 (11) (11)
Impairment charges to average loans annualised 0.03% 0.31% 0.80% (28 bps) (77 bps)
Impaired exposures to TCE 0.14% 0.27% 0.15% (13 bps) (1 bps)
Total stressed exposures to TCE 0.56% 1.03% 1.09% (47 bps) (53 bps)
Revenue contributionHalf Year Half Year Half Year % Mov’t
March Sept March Mar 21 - Mar 21 -$m 2021 2020 2020 Sept 20 Mar 20
Lending and deposit revenue 629 644 707 (2) (11)
Markets, sales and fee income 328 356 389 (8) (16)
Total customer revenue 957 1,000 1,096 (4) (13)
Derivative valuation adjustments 53 16 (93) large large
Trading revenue 75 148 174 (49) (57)
Other2 (39) (32) (16) 22 144
Total WIB revenue 1,046 1,132 1,161 (8) (10)
1. Averages are based on a six month period.2. Includes capital benefit and the Bank Levy.
62 WESTPAC GROUP 2021 INTERIM FINANCIAL RESULTS
Divisional results
Financial performance
First Half 2021 – Second Half 2020Cash earnings of $230 million were $45 million or 24% higher than Second Half 2020. Notable items reduced cash earnings by $26 million in First Half 2021. Excluding notable items, cash earnings were $71 million or 38% higher mostly from the lower impairment charge.
Net interest income down $42m, 8%
• Net loans decreased 6%, or $3.8 billion, (5% or $3.4 billion excluding FX movements). Offshore lending was $2.8 billion lower, primarily in Asia, as the division began consolidating its operations. Lending was also lower from a decline in customer drawdowns;
• Deposits were 12%, or $11.9 billion lower, (11% or $11.7 billion excluding FX movements), mostly from lower at call balances. Disciplined pricing and customers seeking higher yields in the low interest rate environment contributed to the decline. The decision to consolidate our Asian operations contributed to a $3.4 billion decline in offshore deposits; and
• Net interest margin was up 4 basis points from a portfolio mix benefit in loans and deposits (including reducing the offshore balance sheet), and improved lending and term deposit spreads. This was partly offset by the effect of low interest rates on at call deposit spreads and earnings on capital.
Non-interest income down $44m, 7%
• Markets revenue was down $85 million from lower non-customer Markets income mostly from lower fixed income trading. Customer income was also lower as demand fell across all segments; and
• Partly offset by $37 million higher positive derivative valuation adjustments and higher loan fees, from an increase in undrawn balances.
Expenses up $1m, flat
• Increased expenses in relation to software asset write-down (a notable item of $37 million), higher software amortisation expenses and other technology costs were largely offset by lower restructuring costs, lower professional services expenses and a 4% reduction in FTE.
Impairment charges down $103m, 93%
• Decline was mostly due to lower new impaired assets. Collectively assessed provisions were also lower from the better economic outlook and improved asset quality. Reduced exposures also contributed to the reduction in collectively assessed provisions; and
• Stressed exposures to TCE of 0.56%, down 47 basis points compared to September 2020.
First Half 2021 – First Half 2020Cash earnings of $230 million were $83 million or 56% higher than First Half 2020. Notable items reduced cash earnings $26 million in First Half 2021. Excluding notable items, cash earnings were $109 million or 74% higher mostly from lower impairment charges and a higher contribution from derivative valuation adjustments. These gains were partly offset by lower income from a 19 basis point decline in net interest margin and lower Markets revenue.
Net interest income down $141m, 23%
• Net loans decreased 21% or $16.2 billion, (19% or $14.9 billion excluding FX movements), primarily from a reduction in offshore lending, including lower trade finance in Asia and from a prioritisation of return. Lending was also lower from a decline in utilisation levels following a lift in lending in March 2020 as corporates sought to increase liquidity in response to COVID-19;
• Deposits reduced 17% or $19.0 billion, (16% or $18.1 billion excluding FX movements). Offshore deposits were $8.3 billion lower, mostly from the decision to consolidate our Asian operations. Disciplined pricing and customers seeking higher yield in the low interest rate environment contributed to the decline in onshore deposits; and
• Net interest margin was down 19 basis points, with lower interest rates reducing deposit spreads and earnings on capital. This was partly offset by more disciplined lending and deposit pricing and benefits from changes in the lending and deposit mix.
Non-interest income up $26m, 5%
• $146 million movement in derivative valuation adjustments ($53 million benefit in First Half 2021 compared to a $93 million charge in First Half 2020);
• Higher undrawn loan fees; partly offset by
– Lower non-customer Markets income across FX and commodities including from the closure of the energy desk along with lower customer Markets income from lower FX sales and a decline in income in Asia; and
– A reduction in payments revenue due to lower transaction volumes, particularly offshore.
Expenses up $79m, 13%
• Excluding notable items, expenses increased $42 million (or 7%) mostly due to increased software amortisation, and higher risk and compliance related costs, including financial crime.
Impairment charges down $285m, 97%
• Lower collectively assessed provisions from an improvement in the economic outlook and improved asset quality. Reduced exposure and a reduction in new impaired assets also contributed to the lower impairment charge; and
• Stressed exposures to TCE of 0.56%, down 53 basis points compared to March 2020.
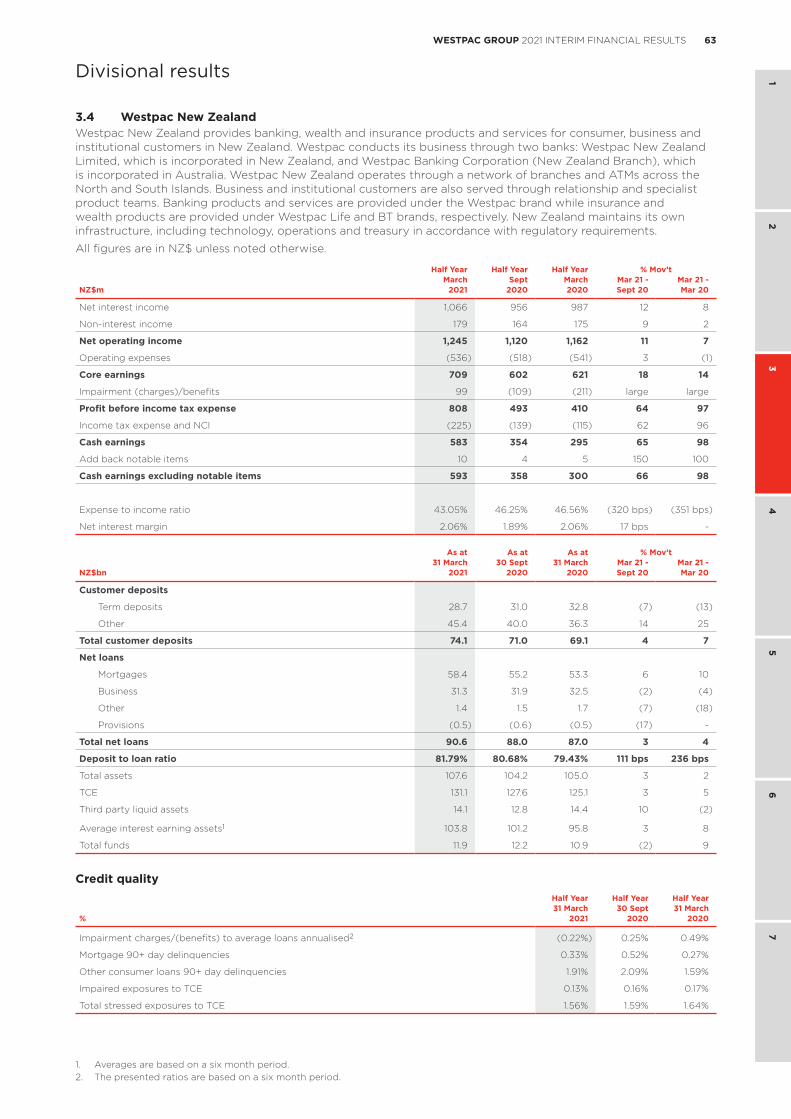
63WESTPAC GROUP 2021 INTERIM FINANCIAL RESULTS
1 2
34
56
7
Divisional results
3.4 Westpac New ZealandWestpac New Zealand provides banking, wealth and insurance products and services for consumer, business and institutional customers in New Zealand. Westpac conducts its business through two banks: Westpac New Zealand Limited, which is incorporated in New Zealand, and Westpac Banking Corporation (New Zealand Branch), which is incorporated in Australia. Westpac New Zealand operates through a network of branches and ATMs across the North and South Islands. Business and institutional customers are also served through relationship and specialist product teams. Banking products and services are provided under the Westpac brand while insurance and wealth products are provided under Westpac Life and BT brands, respectively. New Zealand maintains its own infrastructure, including technology, operations and treasury in accordance with regulatory requirements.
All figures are in NZ$ unless noted otherwise.
Half Year Half Year Half Year % Mov’tMarch Sept March Mar 21 - Mar 21 -
NZ$m 2021 2020 2020 Sept 20 Mar 20
Net interest income 1,066 956 987 12 8
Non-interest income 179 164 175 9 2
Net operating income 1,245 1,120 1,162 11 7
Operating expenses (536) (518) (541) 3 (1)
Core earnings 709 602 621 18 14
Impairment (charges)/benefits 99 (109) (211) large large
Profit before income tax expense 808 493 410 64 97
Income tax expense and NCI (225) (139) (115) 62 96
Cash earnings 583 354 295 65 98
Add back notable items 10 4 5 150 100
Cash earnings excluding notable items 593 358 300 66 98
Expense to income ratio 43.05% 46.25% 46.56% (320 bps) (351 bps)
Net interest margin 2.06% 1.89% 2.06% 17 bps -
As at As at As at % Mov’t31 March 30 Sept 31 March Mar 21 - Mar 21 -
NZ$bn 2021 2020 2020 Sept 20 Mar 20
Customer deposits
Term deposits 28.7 31.0 32.8 (7) (13)
Other 45.4 40.0 36.3 14 25
Total customer deposits 74.1 71.0 69.1 4 7
Net loans
Mortgages 58.4 55.2 53.3 6 10
Business 31.3 31.9 32.5 (2) (4)
Other 1.4 1.5 1.7 (7) (18)
Provisions (0.5) (0.6) (0.5) (17) -
Total net loans 90.6 88.0 87.0 3 4
Deposit to loan ratio 81.79% 80.68% 79.43% 111 bps 236 bps
Total assets 107.6 104.2 105.0 3 2
TCE 131.1 127.6 125.1 3 5
Third party liquid assets 14.1 12.8 14.4 10 (2)
Average interest earning assets1 103.8 101.2 95.8 3 8
Total funds 11.9 12.2 10.9 (2) 9
Credit qualityHalf Year Half Year Half Year31 March 30 Sept 31 March
% 2021 2020 2020
Impairment charges/(benefits) to average loans annualised2 (0.22%) 0.25% 0.49%
Mortgage 90+ day delinquencies 0.33% 0.52% 0.27%
Other consumer loans 90+ day delinquencies 1.91% 2.09% 1.59%
Impaired exposures to TCE 0.13% 0.16% 0.17%
Total stressed exposures to TCE 1.56% 1.59% 1.64%
1. Averages are based on a six month period.2. The presented ratios are based on a six month period.
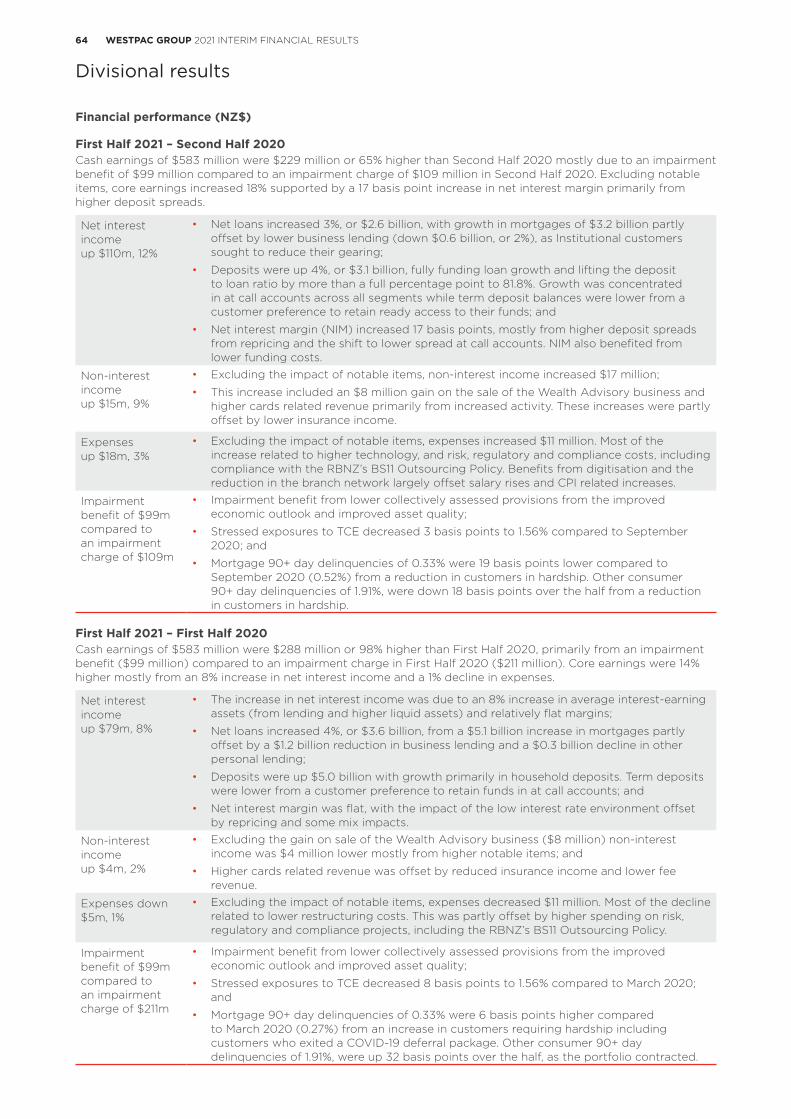
64 WESTPAC GROUP 2021 INTERIM FINANCIAL RESULTS
Divisional results
Financial performance (NZ$)
First Half 2021 – Second Half 2020Cash earnings of $583 million were $229 million or 65% higher than Second Half 2020 mostly due to an impairment benefit of $99 million compared to an impairment charge of $109 million in Second Half 2020. Excluding notable items, core earnings increased 18% supported by a 17 basis point increase in net interest margin primarily from higher deposit spreads.
Net interest income up $110m, 12%
• Net loans increased 3%, or $2.6 billion, with growth in mortgages of $3.2 billion partly offset by lower business lending (down $0.6 billion, or 2%), as Institutional customers sought to reduce their gearing;
• Deposits were up 4%, or $3.1 billion, fully funding loan growth and lifting the deposit to loan ratio by more than a full percentage point to 81.8%. Growth was concentrated in at call accounts across all segments while term deposit balances were lower from a customer preference to retain ready access to their funds; and
• Net interest margin (NIM) increased 17 basis points, mostly from higher deposit spreads from repricing and the shift to lower spread at call accounts. NIM also benefited from lower funding costs.
Non-interest income up $15m, 9%
• Excluding the impact of notable items, non-interest income increased $17 million;
• This increase included an $8 million gain on the sale of the Wealth Advisory business and higher cards related revenue primarily from increased activity. These increases were partly offset by lower insurance income.
Expenses up $18m, 3%
• Excluding the impact of notable items, expenses increased $11 million. Most of the increase related to higher technology, and risk, regulatory and compliance costs, including compliance with the RBNZ’s BS11 Outsourcing Policy. Benefits from digitisation and the reduction in the branch network largely offset salary rises and CPI related increases.
Impairment benefit of $99m compared to an impairment charge of $109m
• Impairment benefit from lower collectively assessed provisions from the improved economic outlook and improved asset quality;
• Stressed exposures to TCE decreased 3 basis points to 1.56% compared to September 2020; and
• Mortgage 90+ day delinquencies of 0.33% were 19 basis points lower compared to September 2020 (0.52%) from a reduction in customers in hardship. Other consumer 90+ day delinquencies of 1.91%, were down 18 basis points over the half from a reduction in customers in hardship.
First Half 2021 – First Half 2020Cash earnings of $583 million were $288 million or 98% higher than First Half 2020, primarily from an impairment benefit ($99 million) compared to an impairment charge in First Half 2020 ($211 million). Core earnings were 14% higher mostly from an 8% increase in net interest income and a 1% decline in expenses.
Net interest income up $79m, 8%
• The increase in net interest income was due to an 8% increase in average interest-earning assets (from lending and higher liquid assets) and relatively flat margins;
• Net loans increased 4%, or $3.6 billion, from a $5.1 billion increase in mortgages partly offset by a $1.2 billion reduction in business lending and a $0.3 billion decline in other personal lending;
• Deposits were up $5.0 billion with growth primarily in household deposits. Term deposits were lower from a customer preference to retain funds in at call accounts; and
• Net interest margin was flat, with the impact of the low interest rate environment offset by repricing and some mix impacts.
Non-interest income up $4m, 2%
• Excluding the gain on sale of the Wealth Advisory business ($8 million) non-interest income was $4 million lower mostly from higher notable items; and
• Higher cards related revenue was offset by reduced insurance income and lower fee revenue.
Expenses down $5m, 1%
• Excluding the impact of notable items, expenses decreased $11 million. Most of the decline related to lower restructuring costs. This was partly offset by higher spending on risk, regulatory and compliance projects, including the RBNZ’s BS11 Outsourcing Policy.
Impairment benefit of $99m compared to an impairment charge of $211m
• Impairment benefit from lower collectively assessed provisions from the improved economic outlook and improved asset quality;
• Stressed exposures to TCE decreased 8 basis points to 1.56% compared to March 2020; and
• Mortgage 90+ day delinquencies of 0.33% were 6 basis points higher compared to March 2020 (0.27%) from an increase in customers requiring hardship including customers who exited a COVID-19 deferral package. Other consumer 90+ day delinquencies of 1.91%, were up 32 basis points over the half, as the portfolio contracted.
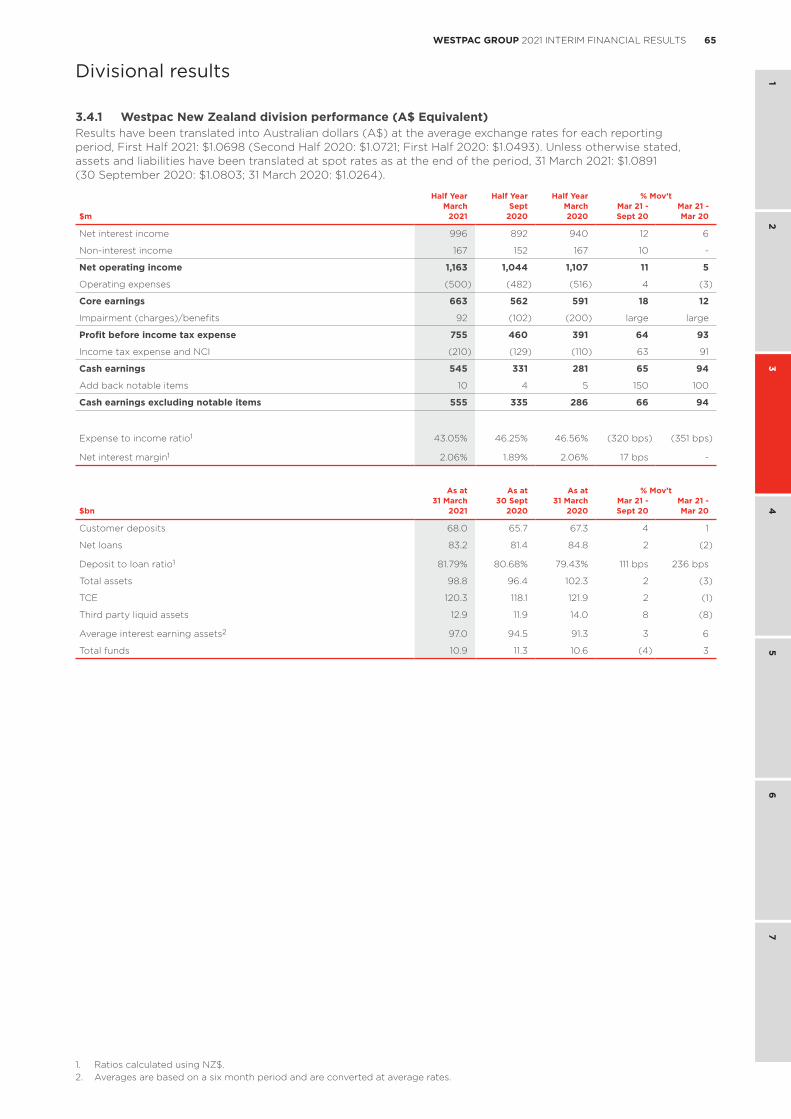
65WESTPAC GROUP 2021 INTERIM FINANCIAL RESULTS
1 2
34
56
7
Divisional results
3.4.1 Westpac New Zealand division performance (A$ Equivalent)Results have been translated into Australian dollars (A$) at the average exchange rates for each reporting period, First Half 2021: $1.0698 (Second Half 2020: $1.0721; First Half 2020: $1.0493). Unless otherwise stated, assets and liabilities have been translated at spot rates as at the end of the period, 31 March 2021: $1.0891 (30 September 2020: $1.0803; 31 March 2020: $1.0264).
Half Year Half Year Half Year % Mov’tMarch Sept March Mar 21 - Mar 21 -
$m 2021 2020 2020 Sept 20 Mar 20
Net interest income 996 892 940 12 6
Non-interest income 167 152 167 10 -
Net operating income 1,163 1,044 1,107 11 5
Operating expenses (500) (482) (516) 4 (3)
Core earnings 663 562 591 18 12
Impairment (charges)/benefits 92 (102) (200) large large
Profit before income tax expense 755 460 391 64 93
Income tax expense and NCI (210) (129) (110) 63 91
Cash earnings 545 331 281 65 94
Add back notable items 10 4 5 150 100
Cash earnings excluding notable items 555 335 286 66 94
Expense to income ratio1 43.05% 46.25% 46.56% (320 bps) (351 bps)
Net interest margin1 2.06% 1.89% 2.06% 17 bps -
As at As at As at % Mov’t31 March 30 Sept 31 March Mar 21 - Mar 21 -
$bn 2021 2020 2020 Sept 20 Mar 20
Customer deposits 68.0 65.7 67.3 4 1
Net loans 83.2 81.4 84.8 2 (2)
Deposit to loan ratio1 81.79% 80.68% 79.43% 111 bps 236 bps
Total assets 98.8 96.4 102.3 2 (3)
TCE 120.3 118.1 121.9 2 (1)
Third party liquid assets 12.9 11.9 14.0 8 (8)
Average interest earning assets2 97.0 94.5 91.3 3 6
Total funds 10.9 11.3 10.6 (4) 3
1. Ratios calculated using NZ$.2. Averages are based on a six month period and are converted at average rates.
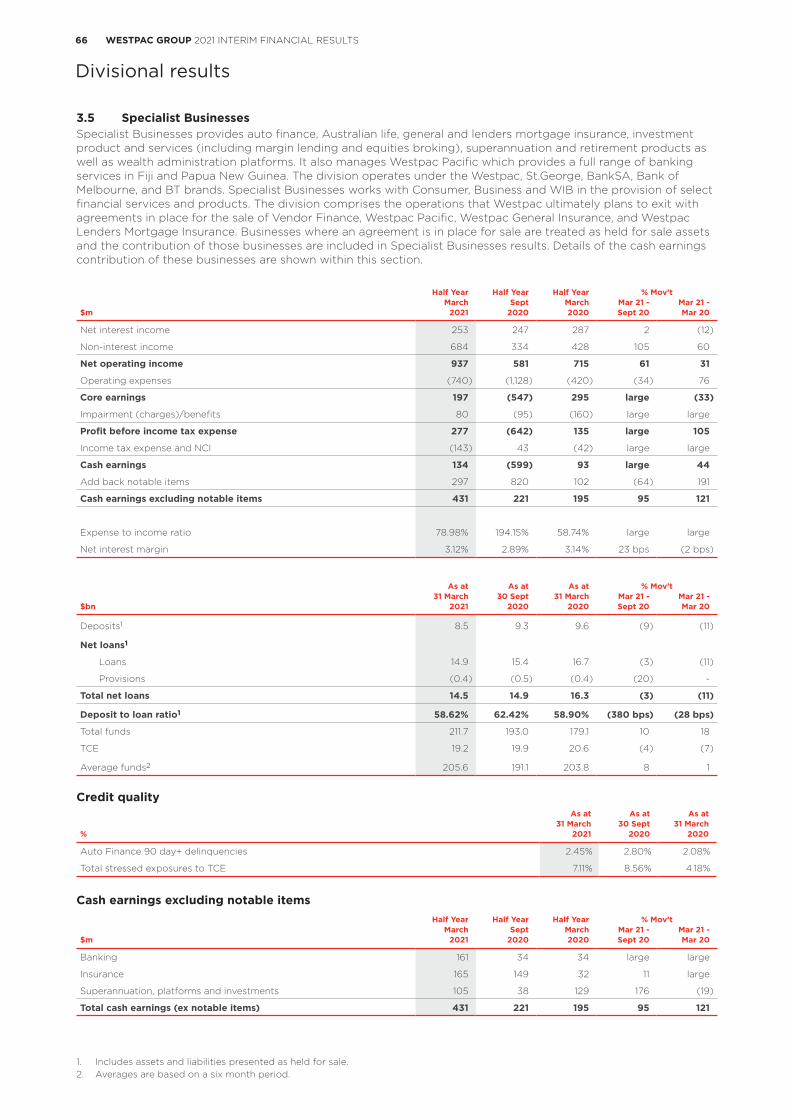
66 WESTPAC GROUP 2021 INTERIM FINANCIAL RESULTS
Divisional results
3.5 Specialist BusinessesSpecialist Businesses provides auto finance, Australian life, general and lenders mortgage insurance, investment product and services (including margin lending and equities broking), superannuation and retirement products as well as wealth administration platforms. It also manages Westpac Pacific which provides a full range of banking services in Fiji and Papua New Guinea. The division operates under the Westpac, St.George, BankSA, Bank of Melbourne, and BT brands. Specialist Businesses works with Consumer, Business and WIB in the provision of select financial services and products. The division comprises the operations that Westpac ultimately plans to exit with agreements in place for the sale of Vendor Finance, Westpac Pacific, Westpac General Insurance, and Westpac Lenders Mortgage Insurance. Businesses where an agreement is in place for sale are treated as held for sale assets and the contribution of those businesses are included in Specialist Businesses results. Details of the cash earnings contribution of these businesses are shown within this section.
Half Year Half Year Half Year % Mov’tMarch Sept March Mar 21 - Mar 21 -
$m 2021 2020 2020 Sept 20 Mar 20
Net interest income 253 247 287 2 (12)
Non-interest income 684 334 428 105 60
Net operating income 937 581 715 61 31
Operating expenses (740) (1,128) (420) (34) 76
Core earnings 197 (547) 295 large (33)
Impairment (charges)/benefits 80 (95) (160) large large
Profit before income tax expense 277 (642) 135 large 105
Income tax expense and NCI (143) 43 (42) large large
Cash earnings 134 (599) 93 large 44
Add back notable items 297 820 102 (64) 191
Cash earnings excluding notable items 431 221 195 95 121
Expense to income ratio 78.98% 194.15% 58.74% large large
Net interest margin 3.12% 2.89% 3.14% 23 bps (2 bps)
As at As at As at % Mov’t31 March 30 Sept 31 March Mar 21 - Mar 21 -
$bn 2021 2020 2020 Sept 20 Mar 20
Deposits1 8.5 9.3 9.6 (9) (11)
Net loans1
Loans 14.9 15.4 16.7 (3) (11)
Provisions (0.4) (0.5) (0.4) (20) -
Total net loans 14.5 14.9 16.3 (3) (11)
Deposit to loan ratio1 58.62% 62.42% 58.90% (380 bps) (28 bps)
Total funds 211.7 193.0 179.1 10 18
TCE 19.2 19.9 20.6 (4) (7)
Average funds2 205.6 191.1 203.8 8 1
Credit qualityAs at As at As at
31 March 30 Sept 31 March% 2021 2020 2020
Auto Finance 90 day+ delinquencies 2.45% 2.80% 2.08%
Total stressed exposures to TCE 7.11% 8.56% 4.18%
Cash earnings excluding notable itemsHalf Year Half Year Half Year % Mov’t
March Sept March Mar 21 - Mar 21 -$m 2021 2020 2020 Sept 20 Mar 20
Banking 161 34 34 large large
Insurance 165 149 32 11 large
Superannuation, platforms and investments 105 38 129 176 (19)
Total cash earnings (ex notable items) 431 221 195 95 121
1. Includes assets and liabilities presented as held for sale.2. Averages are based on a six month period.
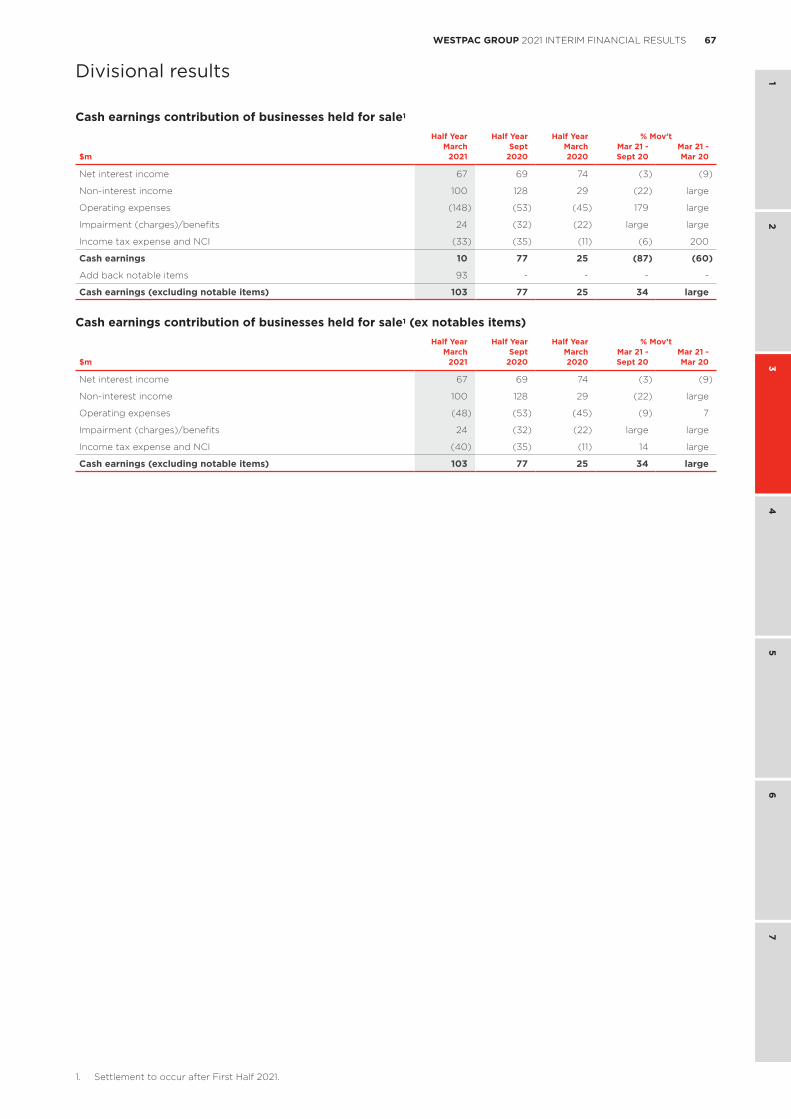
67WESTPAC GROUP 2021 INTERIM FINANCIAL RESULTS
1 2
34
56
7
Divisional results
Cash earnings contribution of businesses held for sale1
Half Year Half Year Half Year % Mov’tMarch Sept March Mar 21 - Mar 21 -
$m 2021 2020 2020 Sept 20 Mar 20
Net interest income 67 69 74 (3) (9)
Non-interest income 100 128 29 (22) large
Operating expenses (148) (53) (45) 179 large
Impairment (charges)/benefits 24 (32) (22) large large
Income tax expense and NCI (33) (35) (11) (6) 200
Cash earnings 10 77 25 (87) (60)
Add back notable items 93 - - - -
Cash earnings (excluding notable items) 103 77 25 34 large
1. Settlement to occur after First Half 2021.
Cash earnings contribution of businesses held for sale1 (ex notables items)Half Year Half Year Half Year % Mov’t
March Sept March Mar 21 - Mar 21 -$m 2021 2020 2020 Sept 20 Mar 20
Net interest income 67 69 74 (3) (9)
Non-interest income 100 128 29 (22) large
Operating expenses (48) (53) (45) (9) 7
Impairment (charges)/benefits 24 (32) (22) large large
Income tax expense and NCI (40) (35) (11) 14 large
Cash earnings (excluding notable items) 103 77 25 34 large
68 WESTPAC GROUP 2021 INTERIM FINANCIAL RESULTS
Divisional results
Financial performance
First Half 2021 – Second Half 2020Cash earnings of $134 million in First Half 2021 compared to a loss of $599 million in Second Half 2020, withlower notable items the driver of this improvement. Excluding notable items, First Half 2021 cash earnings were $431 million, $210 million higher than Second Half 2020, mostly from an impairment benefit of $80 million in First Half 2021 compared to an impairment charge of $95 million in Second Half 2020. Higher income from the insurance business and lower expenses also contributed to the increase.
Net interest income up $6m, 2%
• Net loans decreased 3% (or $0.4 billion), with Auto and Westpac Pacific lending both lower;
• Deposits decreased 9% (or $0.8 billion), mostly from a reduction in term deposits on Platforms from the low interest rate environment. Deposits in Westpac Pacific were also lower; and
• Net interest margin was up 23 basis points mostly from the roll off of interest rate reductions related to COVID-19 support packages, and lower holdings of other interest-bearing assets, including liquid assets.
Non-interest income up $350m, 105%
• Notable items were $306 million lower in First Half 2021. Excluding these non-interest income increased $44 million or 7%;
• Insurance income increased $44 million or 21% from:
– Life Insurance income was higher mostly from favourable valuation movements in life insurance policyholder liabilities from changes in the discount rate. Benefits from lower lapses and claims were offset by changes in actuarial assumptions and reinsurance costs;
– An increase in Lenders Mortgage Insurance contribution due to lower claims and an increase in premiums in line with the growth in the mortgage portfolio; partly offset by
– A decrease in General Insurance income due to an increase in severe weather related claims of $55 million.
• Superannuation, Platforms and Investments contribution increased $14 million from higher funds mostly due to the increase in the value of securities held on Australian and overseas securities exchanges. This was partly offset by margin compression from platform and superannuation pricing changes and lower revenue from lower interest rates on managed cash balances; and
• Banking income was lower from continued lower levels of activity, including in Westpac Pacific.
Expenses down $388m, 34%
• Notable items decreased $317 million compared to Second Half 2020. Excluding these, expenses were $71 million (or 15%) lower; and
• Most of the decline related to lower costs of providing COVID-19 support, cost seasonality (costs are typically higher in the second half of the year to support end of financial year processing), and lower project spend.
Impairment benefit of $80m compared to an impairment charge of $95m
• The impairment benefit reflects a lower collectively assessed provision from improvement in the economic outlook and improved asset quality; and
• The level of stressed exposures decreased 145 basis points to 7.11%, mostly from a decrease in watchlist exposures in the Commercial segment in Auto Finance, and a decrease in Auto delinquencies.
69WESTPAC GROUP 2021 INTERIM FINANCIAL RESULTS
1 2
34
56
7
Divisional results
First Half 2021 – First Half 2020Cash earnings of $134 million were $41 million higher than First Half 2020. Excluding notable items, First Half 2021 cash earnings were $431 million, $236 million higher than First Half 2020, mostly from an impairment benefit of $80 million in First Half 2021 compared to an impairment charge of $160 million in First Half 2020.
Net interest income down $34m, 12%
• Net loans decreased 11% (or $1.8 billion) over the year, mostly Auto loans, from increased run off. Lending in Westpac Pacific was also lower;
• Deposits decreased 11% (or $1.1 billion) over the year from a reduction in term deposits on Platforms from the low interest rate environment, and lower Westpac Pacific deposits; and
• Net interest margin was down 2 basis points mostly from reduced deposit spreads and lower earnings on capital from low interest rates.
Non-interest income up $256m, 60%
• Notable items were $105 million lower in First Half 2021. Excluding this, non-interest income increased by $151 million or 28%;
• Insurance income was up $179 million from:
– Life Insurance income was higher mostly from favourable valuation movements in life insurance policyholder liabilities from changes in the discount rate, partly offset by the impact of exiting Group Life and changes in actuarial assumptions and reinsurance costs;
– A higher contribution from Lenders Mortgage Insurance; and
– Lower severe weather related claims in General Insurance, $79 million in First Half 2021 compared to $140 million in First Half 2020.
• Superannuation, Platforms and Investments contribution was down $5 million or 1%, mostly from margin compression from platform and superannuation pricing changes and the migration to low rate products. Revenue from managed cash balances was also lower; and
• Banking income was lower, mostly from a reduction in revenue in Westpac Pacific from the impact of COVID-19 restrictions on tourism and associated merchant fees and foreign exchange income.
Expenses up $320m, 76%
• Notable items in First Half 2021 were $295 million higher than First Half 2020. Excluding these items, expenses were up $25 million or 7%; and
• The increase was due to higher technology related expenses and costs related to COVID-19 support activities.
Impairment benefit of $80m compared to an impairment charge of $160m
• The impairment benefit reflects a lower collectively assessed provision from improvement in the economic outlook and improved asset quality; and
• The level of stressed exposures increased 293 basis points to 7.11%, mostly from an increase in watchlist exposures in Westpac Pacific and higher delinquencies in the Auto portfolio.
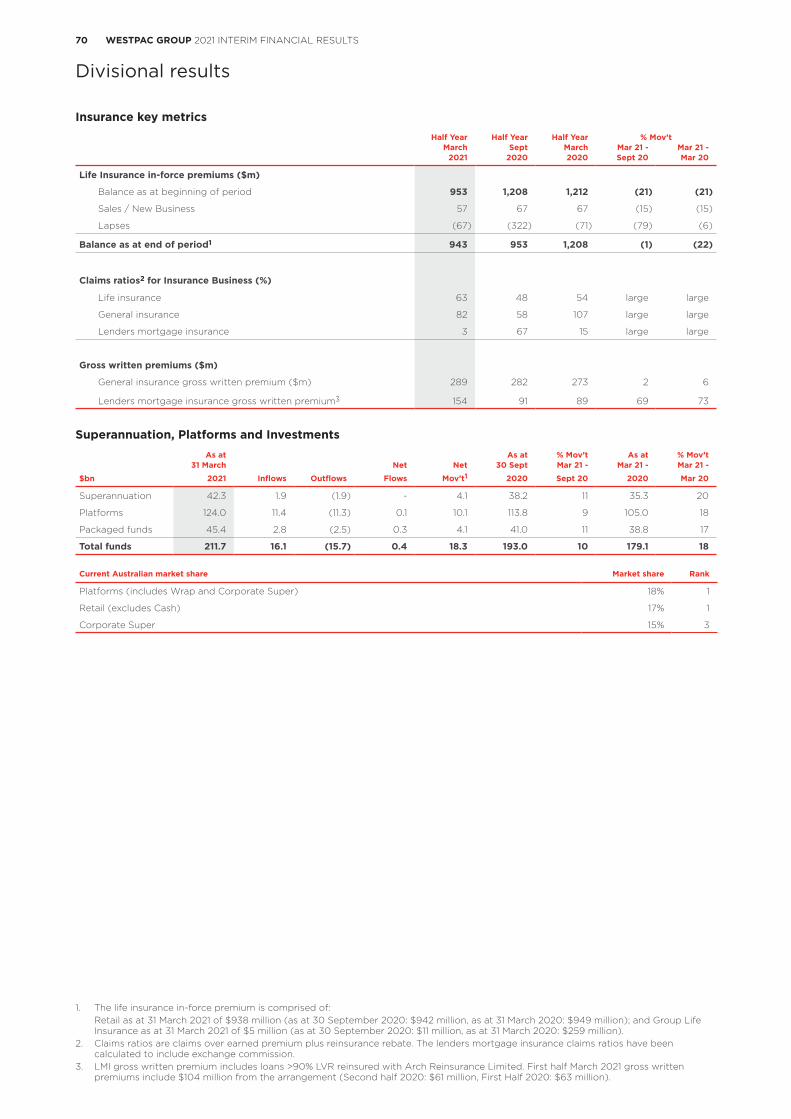
70 WESTPAC GROUP 2021 INTERIM FINANCIAL RESULTS
Divisional results
Insurance key metricsHalf Year Half Year Half Year % Mov’t
March Sept March Mar 21 - Mar 21 -2021 2020 2020 Sept 20 Mar 20
Life Insurance in-force premiums ($m)
Balance as at beginning of period 953 1,208 1,212 (21) (21)
Sales / New Business 57 67 67 (15) (15)
Lapses (67) (322) (71) (79) (6)
Balance as at end of period1 943 953 1,208 (1) (22)
Claims ratios2 for Insurance Business (%)
Life insurance 63 48 54 large large
General insurance 82 58 107 large large
Lenders mortgage insurance 3 67 15 large large
Gross written premiums ($m)
General insurance gross written premium ($m) 289 282 273 2 6
Lenders mortgage insurance gross written premium3 154 91 89 69 73
Superannuation, Platforms and InvestmentsAs at As at % Mov’t As at % Mov’t
31 March Net Net 30 Sept Mar 21 - Mar 21 - Mar 21 -
$bn 2021 Inflows Outflows Flows Mov’t1 2020 Sept 20 2020 Mar 20
Superannuation 42.3 1.9 (1.9) - 4.1 38.2 11 35.3 20
Platforms 124.0 11.4 (11.3) 0.1 10.1 113.8 9 105.0 18
Packaged funds 45.4 2.8 (2.5) 0.3 4.1 41.0 11 38.8 17
Total funds 211.7 16.1 (15.7) 0.4 18.3 193.0 10 179.1 18
Current Australian market share Market share Rank
Platforms (includes Wrap and Corporate Super) 18% 1
Retail (excludes Cash) 17% 1
Corporate Super 15% 3
1. The life insurance in-force premium is comprised of: Retail as at 31 March 2021 of $938 million (as at 30 September 2020: $942 million, as at 31 March 2020: $949 million); and Group Life
Insurance as at 31 March 2021 of $5 million (as at 30 September 2020: $11 million, as at 31 March 2020: $259 million).2. Claims ratios are claims over earned premium plus reinsurance rebate. The lenders mortgage insurance claims ratios have been
calculated to include exchange commission.3. LMI gross written premium includes loans >90% LVR reinsured with Arch Reinsurance Limited. First half March 2021 gross written
premiums include $104 million from the arrangement (Second half 2020: $61 million, First Half 2020: $63 million).
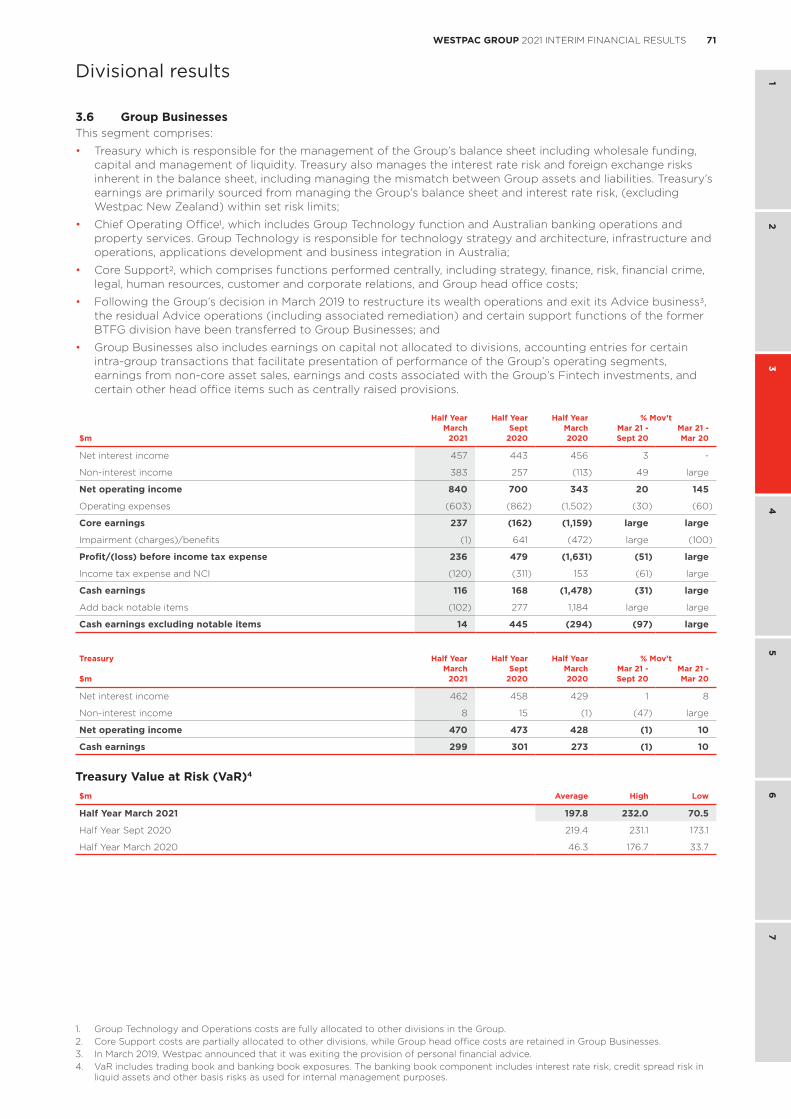
71WESTPAC GROUP 2021 INTERIM FINANCIAL RESULTS
1 2
34
56
7
Divisional results
3.6 Group BusinessesThis segment comprises:
• Treasury which is responsible for the management of the Group’s balance sheet including wholesale funding, capital and management of liquidity. Treasury also manages the interest rate risk and foreign exchange risks inherent in the balance sheet, including managing the mismatch between Group assets and liabilities. Treasury’s earnings are primarily sourced from managing the Group’s balance sheet and interest rate risk, (excluding Westpac New Zealand) within set risk limits;
• Chief Operating Office1, which includes Group Technology function and Australian banking operations and property services. Group Technology is responsible for technology strategy and architecture, infrastructure and operations, applications development and business integration in Australia;
• Core Support2, which comprises functions performed centrally, including strategy, finance, risk, financial crime, legal, human resources, customer and corporate relations, and Group head office costs;
• Following the Group’s decision in March 2019 to restructure its wealth operations and exit its Advice business3, the residual Advice operations (including associated remediation) and certain support functions of the former BTFG division have been transferred to Group Businesses; and
• Group Businesses also includes earnings on capital not allocated to divisions, accounting entries for certain intra-group transactions that facilitate presentation of performance of the Group’s operating segments, earnings from non-core asset sales, earnings and costs associated with the Group’s Fintech investments, and certain other head office items such as centrally raised provisions.
Half Year Half Year Half Year % Mov’tMarch Sept March Mar 21 - Mar 21 -
$m 2021 2020 2020 Sept 20 Mar 20
Net interest income 457 443 456 3 -
Non-interest income 383 257 (113) 49 large
Net operating income 840 700 343 20 145
Operating expenses (603) (862) (1,502) (30) (60)
Core earnings 237 (162) (1,159) large large
Impairment (charges)/benefits (1) 641 (472) large (100)
Profit/(loss) before income tax expense 236 479 (1,631) (51) large
Income tax expense and NCI (120) (311) 153 (61) large
Cash earnings 116 168 (1,478) (31) large
Add back notable items (102) 277 1,184 large large
Cash earnings excluding notable items 14 445 (294) (97) large
Treasury Half Year Half Year Half Year % Mov’tMarch Sept March Mar 21 - Mar 21 -
$m 2021 2020 2020 Sept 20 Mar 20
Net interest income 462 458 429 1 8
Non-interest income 8 15 (1) (47) large
Net operating income 470 473 428 (1) 10
Cash earnings 299 301 273 (1) 10
Treasury Value at Risk (VaR)4
$m Average High Low
Half Year March 2021 197.8 232.0 70.5
Half Year Sept 2020 219.4 231.1 173.1
Half Year March 2020 46.3 176.7 33.7
1. Group Technology and Operations costs are fully allocated to other divisions in the Group.2. Core Support costs are partially allocated to other divisions, while Group head office costs are retained in Group Businesses.3. In March 2019, Westpac announced that it was exiting the provision of personal financial advice.4. VaR includes trading book and banking book exposures. The banking book component includes interest rate risk, credit spread risk in
liquid assets and other basis risks as used for internal management purposes.
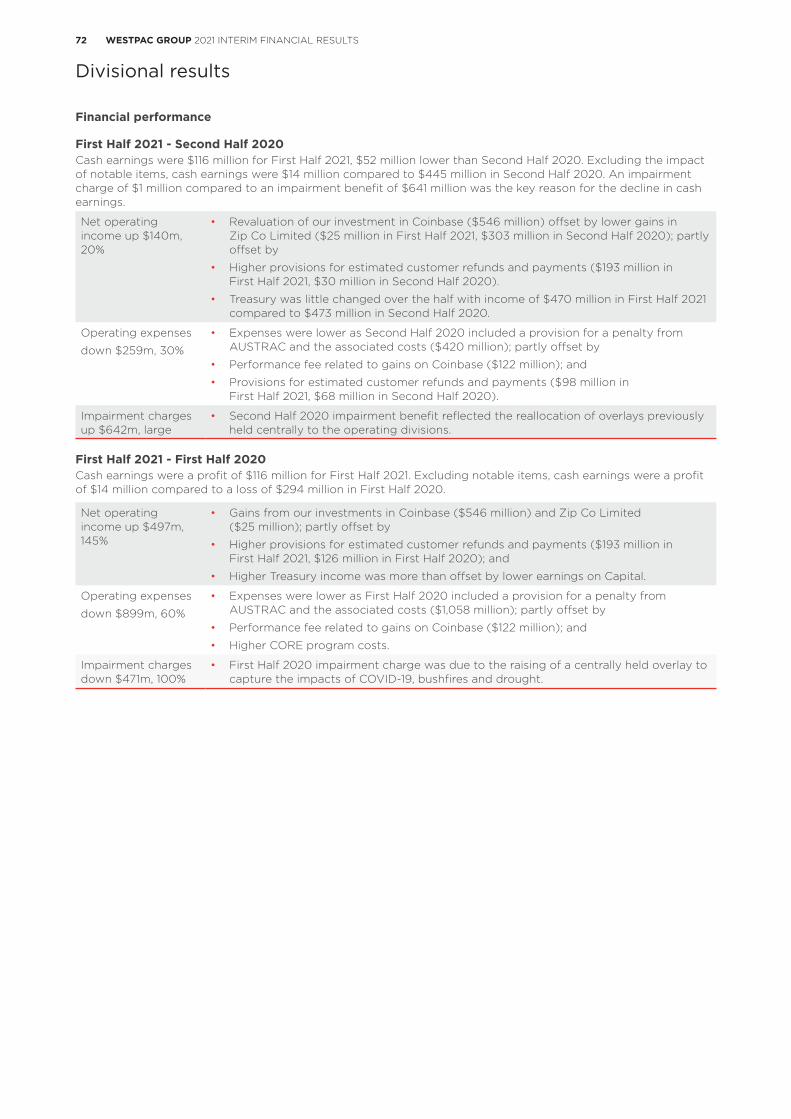
72 WESTPAC GROUP 2021 INTERIM FINANCIAL RESULTS
Divisional results
Financial performance
First Half 2021 - Second Half 2020Cash earnings were $116 million for First Half 2021, $52 million lower than Second Half 2020. Excluding the impact of notable items, cash earnings were $14 million compared to $445 million in Second Half 2020. An impairment charge of $1 million compared to an impairment benefit of $641 million was the key reason for the decline in cash earnings.
Net operating income up $140m, 20%
• Revaluation of our investment in Coinbase ($546 million) offset by lower gains in Zip Co Limited ($25 million in First Half 2021, $303 million in Second Half 2020); partly offset by
• Higher provisions for estimated customer refunds and payments ($193 million in First Half 2021, $30 million in Second Half 2020).
• Treasury was little changed over the half with income of $470 million in First Half 2021 compared to $473 million in Second Half 2020.
Operating expenses
down $259m, 30%
• Expenses were lower as Second Half 2020 included a provision for a penalty from AUSTRAC and the associated costs ($420 million); partly offset by
• Performance fee related to gains on Coinbase ($122 million); and
• Provisions for estimated customer refunds and payments ($98 million in First Half 2021, $68 million in Second Half 2020).
Impairment charges up $642m, large
• Second Half 2020 impairment benefit reflected the reallocation of overlays previously held centrally to the operating divisions.
First Half 2021 - First Half 2020Cash earnings were a profit of $116 million for First Half 2021. Excluding notable items, cash earnings were a profit of $14 million compared to a loss of $294 million in First Half 2020.
Net operating income up $497m, 145%
• Gains from our investments in Coinbase ($546 million) and Zip Co Limited ($25 million); partly offset by
• Higher provisions for estimated customer refunds and payments ($193 million in First Half 2021, $126 million in First Half 2020); and
• Higher Treasury income was more than offset by lower earnings on Capital.
Operating expenses
down $899m, 60%
• Expenses were lower as First Half 2020 included a provision for a penalty from AUSTRAC and the associated costs ($1,058 million); partly offset by
• Performance fee related to gains on Coinbase ($122 million); and
• Higher CORE program costs.
Impairment charges down $471m, 100%
• First Half 2020 impairment charge was due to the raising of a centrally held overlay to capture the impacts of COVID-19, bushfires and drought.
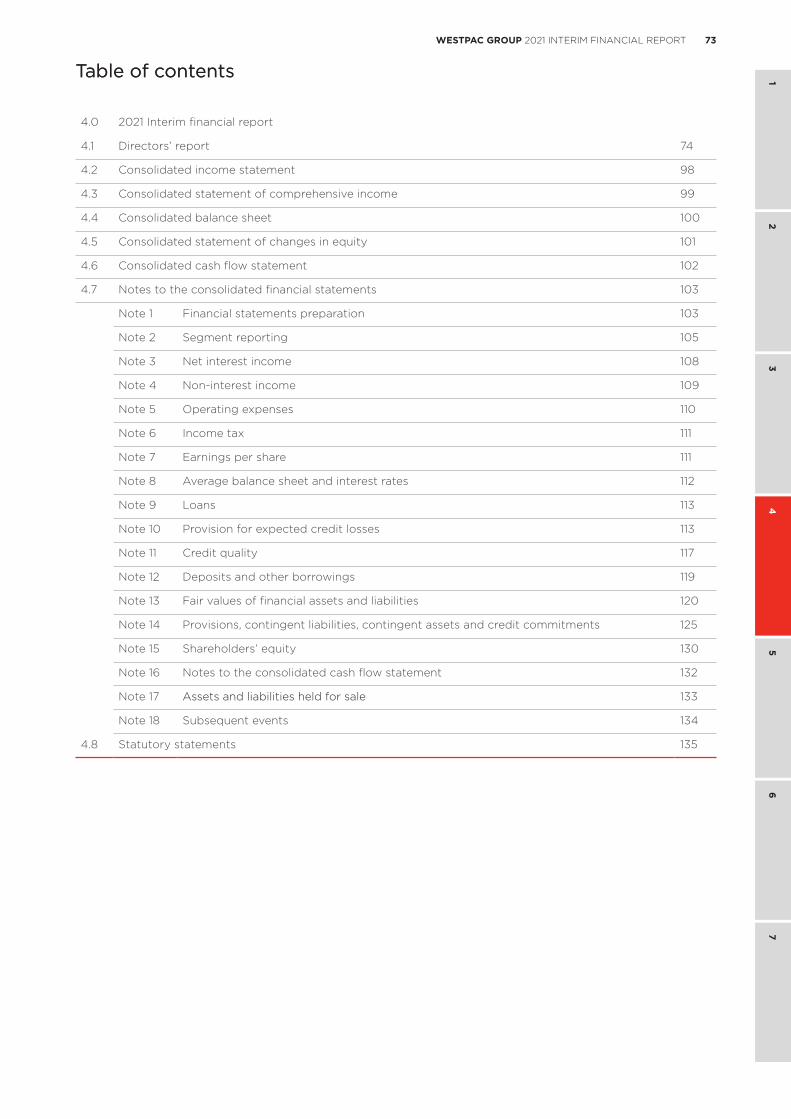
73WESTPAC GROUP 2021 INTERIM FINANCIAL REPORT
1 1
23
45
67
Table of contentsTable of contents
4.0 2021 Interim financial report
4.1 Directors’ report 74
4.2 Consolidated income statement 98
4.3 Consolidated statement of comprehensive income 99
4.4 Consolidated balance sheet 100
4.5 Consolidated statement of changes in equity 101
4.6 Consolidated cash flow statement 102
4.7 Notes to the consolidated financial statements 103
Note 1 Financial statements preparation 103
Note 2 Segment reporting 105
Note 3 Net interest income 108
Note 4 Non-interest income 109
Note 5 Operating expenses 110
Note 6 Income tax 111
Note 7 Earnings per share 111
Note 8 Average balance sheet and interest rates 112
Note 9 Loans 113
Note 10 Provision for expected credit losses 113
Note 11 Credit quality 117
Note 12 Deposits and other borrowings 119
Note 13 Fair values of financial assets and liabilities 120
Note 14 Provisions, contingent liabilities, contingent assets and credit commitments 125
Note 15 Shareholders’ equity 130
Note 16 Notes to the consolidated cash flow statement 132
Note 17 Assets and liabilities held for sale 133
Note 18 Subsequent events 134
4.8 Statutory statements 135
Table of contents
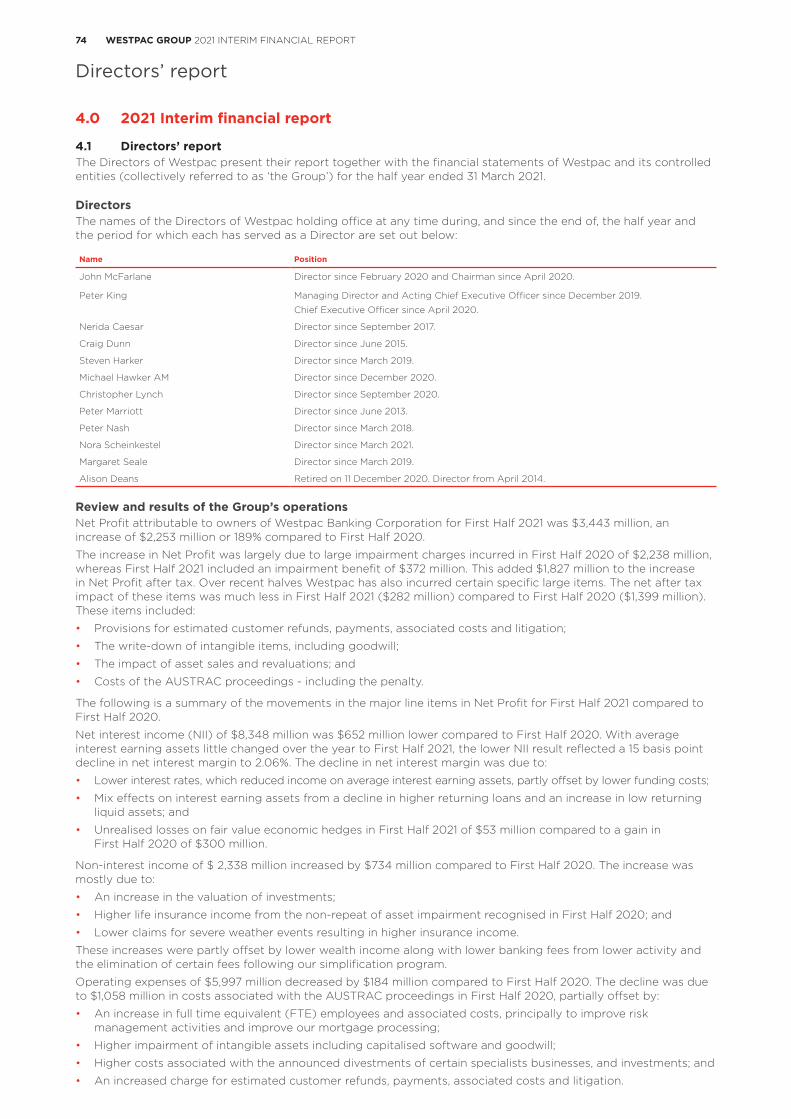
74 WESTPAC GROUP 2021 INTERIM FINANCIAL REPORT
Directors’ report
4.0 2021 Interim financial report
4.1 Directors’ reportThe Directors of Westpac present their report together with the financial statements of Westpac and its controlled entities (collectively referred to as ‘the Group’) for the half year ended 31 March 2021.
DirectorsThe names of the Directors of Westpac holding office at any time during, and since the end of, the half year and the period for which each has served as a Director are set out below:
Name Position
John McFarlane Director since February 2020 and Chairman since April 2020.
Peter King Managing Director and Acting Chief Executive Officer since December 2019.
Chief Executive Officer since April 2020.
Nerida Caesar Director since September 2017.
Craig Dunn Director since June 2015.
Steven Harker Director since March 2019.
Michael Hawker AM Director since December 2020.
Christopher Lynch Director since September 2020.
Peter Marriott Director since June 2013.
Peter Nash Director since March 2018.
Nora Scheinkestel Director since March 2021.
Margaret Seale Director since March 2019.
Alison Deans Retired on 11 December 2020. Director from April 2014.
Review and results of the Group’s operationsNet Profit attributable to owners of Westpac Banking Corporation for First Half 2021 was $3,443 million, an increase of $2,253 million or 189% compared to First Half 2020.
The increase in Net Profit was largely due to large impairment charges incurred in First Half 2020 of $2,238 million, whereas First Half 2021 included an impairment benefit of $372 million. This added $1,827 million to the increase in Net Profit after tax. Over recent halves Westpac has also incurred certain specific large items. The net after tax impact of these items was much less in First Half 2021 ($282 million) compared to First Half 2020 ($1,399 million). These items included:
• Provisions for estimated customer refunds, payments, associated costs and litigation;
• The write-down of intangible items, including goodwill;
• The impact of asset sales and revaluations; and
• Costs of the AUSTRAC proceedings - including the penalty.
The following is a summary of the movements in the major line items in Net Profit for First Half 2021 compared to First Half 2020.
Net interest income (NII) of $8,348 million was $652 million lower compared to First Half 2020. With average interest earning assets little changed over the year to First Half 2021, the lower NII result reflected a 15 basis point decline in net interest margin to 2.06%. The decline in net interest margin was due to:
• Lower interest rates, which reduced income on average interest earning assets, partly offset by lower funding costs;
• Mix effects on interest earning assets from a decline in higher returning loans and an increase in low returning liquid assets; and
• Unrealised losses on fair value economic hedges in First Half 2021 of $53 million compared to a gain in First Half 2020 of $300 million.
Non-interest income of $ 2,338 million increased by $734 million compared to First Half 2020. The increase was mostly due to:
• An increase in the valuation of investments;
• Higher life insurance income from the non-repeat of asset impairment recognised in First Half 2020; and
• Lower claims for severe weather events resulting in higher insurance income.
These increases were partly offset by lower wealth income along with lower banking fees from lower activity and the elimination of certain fees following our simplification program.
Operating expenses of $5,997 million decreased by $184 million compared to First Half 2020. The decline was due to $1,058 million in costs associated with the AUSTRAC proceedings in First Half 2020, partially offset by:
• An increase in full time equivalent (FTE) employees and associated costs, principally to improve risk management activities and improve our mortgage processing;
• Higher impairment of intangible assets including capitalised software and goodwill;
• Higher costs associated with the announced divestments of certain specialists businesses, and investments; and
• An increased charge for estimated customer refunds, payments, associated costs and litigation.
Directors’ report
75WESTPAC GROUP 2021 INTERIM FINANCIAL REPORT
1 1
23
45
67
Directors’ report
In First Half 2021 the Group recognised an impairment benefit of $372 million compared to an impairment charge of $2,238 million in First Half 2020, a $2,610 million movement. In Full Year 2020 the Group materially increased provisions in response to the expected economic impact of COVID-19, including forecasts of a prolonged deterioration in economic activity, a rise in unemployment and a decline in property prices. Over the subsequent year to First Half 2021, the effect of COVID-19 was significantly less than expected at that time across most economic indicators. While a degree of uncertainty remains, some of the provisions booked through Full Year 2020 are no longer required and this contributed to the impairment benefits in First Half 2021.
Tax expense was up 63% in First Half 2021 compared to First Half 2020 from the rise in profit before tax. The effective tax rate was 31.9% and close to Australia’s corporate tax rate of 30%. This was lower than the 45.5% effective tax rate in First Half 2020 as penalties provided in that half were not tax deductible.
The Board has determined an interim dividend of 58 cents per share, which will be fully franked.
A review of the operations and results of the Group and its divisions for the half year ended 31 March 2021 is set out in Section 2 and Section 3 of this interim results announcement and in ‘Risk factors’, which forms part of the Directors’ Report.
Further information about our financial position and financial results is included in the financial statements, which form part of the 2021 Interim Financial Report.
Significant developments
COVID-19 impactsThe social and economic impacts of COVID-19 over this half year have been impacted by the effectiveness of ongoing local and global containment measures, the development and roll out of vaccines, and prudential, industry, and economic response measures taken by governments world-wide.
In 2020, Westpac provided significant support to customers via repayment deferrals, fee waivers, special interest rates and special loans. The vast majority of these support measures have now been wound down. Where customers require further support, we are providing this through our pre-existing hardship arrangements.
The COVID-19 pandemic has also led to increased regulatory focus in certain areas, including operational resilience, technology, cyber security, capital management and stress testing. Further information in relation to APRA’s COVID-19 announcements on capital management are set out below under ‘APRA announcements affecting capital’ and ‘RBNZ capital review’.
Further information on the impacts of COVID-19 are set out in 2.1 ‘Performance overview’, ‘Risk factors’ in the Directors’ report and Note 10 to the financial statements in this Interim Financial Report.
Westpac significant developments – Australia
Changes to consumer and business divisionsOn 17 March 2021, Westpac announced that it was bringing together the leadership of its Consumer and Business divisions into a new Consumer & Business Banking division.
Exit of specialist businesses Sales of specialist businesses announced, but not yet completed, include Westpac’s sale of:
• its Vendor Finance business to Angle Finance;
• Westpac General Insurance Limited and Westpac General Insurance Services Limited to Allianz;
• its Pacific businesses (comprised of Fiji Branch of WBC and the Group’s 89.9% stake in Westpac Bank PNG Limited) to Kina Securities Limited; and
• Westpac Lenders Mortgage Insurance Limited to Arch Capital Group.
Further detail in relation to these sales is available in Note 17 to the financial statements in this Interim Financial Report.
Consolidation of Westpac’s international operations In line with Westpac’s announcement on 14 October 2020 regarding consolidation of its international operations, Westpac is reducing its presence in Asia to a single hub in Singapore. The branches in Mumbai and Jakarta have now been closed and consolidation of Westpac’s Asian operations into one hub in Singapore is targeted to occur by the end of 2021.
Westpac significant developments – New Zealand
Review of New Zealand business On 24 March 2021, Westpac announced that it is assessing the appropriate structure for its New Zealand business and whether a demerger would be in the best interests of shareholders. Westpac is in the early stage of this assessment and no decision has yet been made.
Directors’ report
76 WESTPAC GROUP 2021 INTERIM FINANCIAL REPORT
Directors’ report
Reports required under section 95 of the Reserve Bank of New Zealand Act 1989 On 23 March 2021, the RBNZ issued two notices to WNZL under section 95 of the Reserve Bank of New Zealand Act 1989 requiring WNZL to supply two external reviews to the RBNZ. The reports are required to address concerns raised by the RBNZ around WNZL’s risk governance processes following various compliance issues reported over recent years. Those issues include non-compliance with the RBNZ’s liquidity, capital adequacy and outsourcing requirements (as previously reported in WNZL’s RBNZ disclosure statements) and IT outages. While work has been underway to address these areas for some time, more work is required to meet WNZL’s expectations and those of the regulator.
The first report relates to the effectiveness of the actions WNZL has taken to improve the management of liquidity risk and the associated risk culture, following previously identified breaches of the RBNZ’s Liquidity Policy (BS13) and potential non-compliance identified through the RBNZ’s liquidity thematic review. Previous reviews identified the need to implement fundamental improvements to WNZL’s management of liquidity risk, and to make material changes to the culture in the relevant teams.
The second report requires the external reviewer to assess the effectiveness of risk governance at WNZL, with a particular focus on the role played by the Board.
The reviews apply only to WNZL and not the governance processes of Westpac in Australia or its New Zealand branch. However, on 1 December 2020, APRA announced actions that it was taking against Westpac for breaches of APRA’s Liquidity Policy. See ‘APRA action against Westpac for breaches of liquidity requirements’ below.
With effect from 31 March 2021, the RBNZ amended WNZL’s conditions of registration to apply an overlay to WNZL’s mismatch ratios. The overlay requires WNZL to discount the value of its liquid assets by approximately NZ$2.3 billion. This overlay will apply until the RBNZ is satisfied that:
• the RBNZ’s concerns regarding liquidity risk controls have been resolved; and
• sufficient progress has been made to address risk culture issues in WNZL’s Treasury and Market and Liquidity Risk functions.
WNZL is currently engaging with Westpac and the RBNZ in relation to potential experts to prepare the independent reports.
RBNZ capital review
On 5 December 2019, the RBNZ announced changes to the capital adequacy framework in New Zealand. The new framework includes the following key components:
• Setting a Tier 1 capital requirement of 16% of RWA for systemically important banks (including WNZL) and 14% for all other banks;
• Additional Tier 1 capital (‘AT1’) can comprise no more than 2.5% of the 16% Tier 1 capital requirement;
• Eligible Tier 1 capital will comprise common equity and redeemable perpetual preference shares. Existing AT1 instruments will be phased out over a seven-year period;
• Maintaining the existing Tier 2 capital requirement of 2% of RWA; and
• Recalibrating RWA for internal rating based banks, such as WNZL, such that aggregate RWA will increase to 90% of standardised RWA.
In response to the impacts of COVID-19, and to support credit availability, the RBNZ delayed the start date of increases in the required level of bank capital until 1 July 2022 with the other announced changes described above to be implemented from 1 July 2022 onwards. Banks will be given up to seven years to comply.
Regulatory and risk developments
APRA reviews and actions
Westpac and APRA enforceable undertaking on risk governance remediation and Integrated PlanOn 17 December 2019, following the commencement of the AUSTRAC proceedings and other significant prudential reviews, APRA announced it would conduct an extensive supervision program focused on Westpac’s risk governance, accountability and risk culture. On 1 December 2020, APRA notified Westpac of its progress, findings, and proposed next steps. In particular, APRA identified that Westpac has an immature and reactive risk culture, unclear accountabilities, capability shortfalls and inadequate oversight.
These outcomes are broadly consistent with Westpac’s own findings in the Culture, Governance and Accountability reassessment report released on 17 July 2020. While Westpac had commenced a number of risk programs to address these issues, APRA indicated that Westpac had not demonstrated the expected improvements from these programs and that a more holistic and integrated plan addressing the full scope of financial and non-financial risk issues, and their root causes, is required.
77WESTPAC GROUP 2021 INTERIM FINANCIAL REPORT
1 1
23
45
67
Directors’ report
On 3 December 2020, Westpac confirmed that it had entered into an enforceable undertaking (EU) with APRA on risk governance remediation. The key terms of the Westpac and APRA EU include:
• Integrated Plan: Developing a remediation plan which describes all major remediation activities related to risk governance, sets a clear timeline for implementation, and specifies who is accountable for delivery. APRA has approved Westpac’s Integrated Plan.
• Governance and independent oversight: Providing sufficient funding and resources to implement the Integrated Plan and establishing appropriate governance arrangements, including oversight of how outcomes are integrated into Westpac’s risk governance processes. Independent assurance over the implementation of the Integrated Plan is also required via an Independent Reviewer.
• Regular reporting: An Independent Reviewer to provide regular updates to APRA on Westpac’s compliance with the EU and Integrated Plan. The reporting will continue until otherwise agreed with APRA. Promontory Australasia has been appointed for this purpose and provided its first report to APRA on 5 March 2021. Westpac is also required to provide regular progress reports to APRA.
• Clarity on accountability: Incorporating accountability for the delivery of the Integrated Plan into relevant Banking Executive Accountability Regime statements and remuneration scorecards, which has occurred.
Given the Integrated Plan is designed to address risk governance shortcomings holistically, for both non-financial and financial risks, Westpac’s existing Group-wide program of remediation work, CORE – Customer Outcomes and Risk Excellence – has been expanded to deliver the Integrated Plan. Execution of the CORE program is ongoing.
Risk management Westpac is continuing to upgrade its end-to-end risk management. A range of significant shortcomings and areas for improvement in Westpac’s risk governance have been highlighted in recent reviews including its risk management framework, policies and systems, regulatory reporting, and data quality and management, as well as its risk capabilities. The Group has a number of risks which are currently considered outside of our risk appetite or do not meet the expectations of regulators.
Many of these areas of improvement are reflected in the Integrated Plan approved by APRA. The CORE program is designed to deliver many of these improvements. Key components of the CORE program include embedding a more proactive risk culture, embedding the three lines of defence model to establish clearer risk management accountabilities, improving the control environment, and improving risk awareness, capability and capacity through organisation-wide training and additional risk resources in the business. Execution of the CORE program is ongoing.
Other areas of improvement are ongoing and being addressed through significant investment in risk management expertise in areas such as operational risk, compliance, financial crime, stress testing, modelling, regulatory reporting and data quality and management.
Further information about risk management is set out in the ‘Risk management’ section in our 2020 Annual Report.
Provision of credit – reviews by APRA Following APRA’s reviews which assessed the adequacy of our credit risk management framework including our controls, end-to-end processes, policies and operating systems, long-standing weaknesses have been identified that require significant uplift. The Group is making changes to systems and controls to improve its end-to-end approach for its mortgage, business and institutional lending portfolios, as well as other key processes. This includes enhancing portfolio management practices, data governance, systems upgrades (including data collection and rationalisation), strengthening collateral management processes and improving assurance and oversight over our credit management frameworks. This program of work will also address issues identified by Westpac’s internal assurance and audit teams.
APRA action against Westpac for breaches of liquidity requirementsOn 1 December 2020, APRA announced that it was taking action for breaches of Westpac’s liquidity requirements predominantly relating to Westpac New Zealand Limited (WNZL). While the breaches have been rectified, and Westpac Group would have still continuously met its liquidity ratio minimums, Westpac Group had breached the prudential standards. Specifically, the liquidity coverage ratio (LCR) of WNZL, a material offshore subsidiary, would have been below 100% for much of 2019.
Westpac’s average LCR for the quarter ended 31 December 2020 was 152% and for the quarter ended 31 March 2021 was 124%.
APRA has required:
• An external review of our liquidity compliance arrangements and the effectiveness of the implementation of the recommendations of our Compliance Plan Review;
• An overlay on the Group’s liquidity requirements by applying a 10% increase to the Group’s net cash outflows. This overlay was applied from 1 January 2021 and will be in place until the shortcomings have been rectified. The impact of this overlay on the Group’s LCR as at 31 March 2021 was 12 percentage points; and
• An accountability review.
The APRA-mandated reviews have commenced and are in progress.
78 WESTPAC GROUP 2021 INTERIM FINANCIAL REPORT
Directors’ report
AUSTRAC matters and financial crime
AUSTRAC proceedings and related ASIC and APRA investigationsOn 20 November 2019, AUSTRAC commenced civil proceedings in the Federal Court of Australia against Westpac in relation to alleged contraventions of the Anti-Money Laundering and Counter-Terrorism Financing Act 2006 (Cth) (AML/CTF Act) (AUSTRAC proceedings). The proceedings were resolved by agreement in September 2020 and the settlement was approved by the Court on 21 October 2020. Pursuant to the agreement, the parties filed a Statement of Agreed Facts and Admissions with the Court, and Westpac paid a civil penalty of $1.3 billion and AUSTRAC’s legal costs of $3.75 million.
As previously disclosed, following the commencement of the AUSTRAC proceedings, ASIC and APRA each commenced investigations in relation to matters connected with the AUSTRAC proceedings. On 23 December 2020, ASIC informed Westpac that it had concluded its investigation and that it did not intend to take any enforcement action against Westpac or any individuals in connection with the investigation. On 12 March 2021, APRA also announced that it had closed its investigation.
Financial crime Westpac has been progressing actions to improve its financial crime program. This includes a significant multi-year program of work to improve its management of financial crime risks (including AML/CTF, Sanctions, Anti-Bribery and Corruption, Foreign Account Tax Compliance Act (FATCA) and Common Reporting Standards (CRS)).
Through this work, Westpac has identified further weaknesses and areas for improvement, which it is addressing. Specific focus areas include improving its AML/CTF policies, reviewing the completeness of data feeding into its AML/CTF systems and considering the adequacy and appropriateness of its AML/CTF processes and controls.
Westpac is also undertaking activities to remediate and improve controls in multiple areas, including the manner in which relevant customer identification procedures are applied, ongoing and enhanced customer due diligence, customer and payment screening, risk assessments, transaction monitoring and regulatory reporting including in relation to IFTIs, Threshold Transaction Reports and Suspicious Matter Reports (including ‘tipping off’ controls).
With increased focus on financial crime, further issues requiring attention have been identified and may continue to be identified.
As part of the remediation work the Group is also working to remediate gaps and enhance controls to support compliance with its FATCA and CRS obligations. Westpac is keeping the ATO apprised of the status of its remediation and control improvements.
Details about the consequences of failing to comply with financial crime obligations are set out in ‘Risk factors’ in the Directors’ report.
APRA capital requirements
Operational risk capital overlaysThe following additional capital overlays are currently applied by APRA to Westpac’s operational risk capital requirement:
• $500 million in response to Westpac’s Culture, Governance and Accountability self-assessment. The overlay has applied from 30 September 2019.
• $500 million in response to the magnitude and nature of issues that were the subject of the AUSTRAC proceedings. The overlay has applied from 31 December 2019.
Both of the overlays have been applied through an increase in RWA. The impact on Westpac’s Level 2 common equity Tier 1 (CET1) capital ratio at 31 March 2021 was a reduction of 35 basis points.
APRA announcements affecting capital As part of its response to the current economic environment following the COVID-19 pandemic, APRA has made the following announcements on capital:
• Updated guidance on capital management and dividends: On 15 December 2020, APRA issued revised capital management guidance to all ADIs and insurers that from 1 January 2021, APRA will no longer hold ADIs to a minimum level of earnings retention (previously 50% of net profit after tax in 2020). However, APRA has stated that it expects banks to moderate dividend payout ratios, consider the use of dividend reinvestment plans (DRPs) and/or other capital management initiatives to offset the impact from dividends and conduct regular stress testing.
• Temporary amendments to the calculation of RWA for COVID-19 support packages: Where a support package provided an option to defer repayments for a period of time, for RWA calculation purposes, a bank did not need to treat the period of the repayment holiday as a period of arrears (provided the borrower had previously been meeting their repayment obligations). In addition, the government’s ‘Coronavirus SME Guarantee Scheme’ is to be regarded as an eligible guarantee by the government for RWA calculation purposes. The temporary capital treatment was available until the earlier of either a maximum period of ten months from when the initial repayment deferral was granted, or 31 March 2021;
• Deferral of APRA’s implementation of the Basel III capital reforms by a year to January 2023; and
• Deferral of changes to APS 222 Associations with Related Entities by a year to 1 January 2022.
79WESTPAC GROUP 2021 INTERIM FINANCIAL REPORT
1 1
23
45
67
Directors’ report
In addition, APRA has released further guidance on the implementation of Basel III reforms which will embed the ‘unquestionably strong’ level of capital in the framework. On 8 December 2020, APRA outlined its proposals for changes to the capital framework, including proposed changes to RWA effective from 1 January 2023.
APRA’s proposed revisions to subsidiary capital investment treatment APRA has proposed changes to APS 111 Capital Adequacy Measurement of Capital including changes to the existing approach for equity exposures in banking and insurance subsidiaries (Level 1). There is no impact to Westpac’s reported capital ratios on a Level 2 basis. On 10 November 2020, APRA announced that until the revised APS 111 standard is implemented (which APRA have indicated is likely to be in 2022) the following transitional changes will apply:
• it will require any new or additional equity investments in banking and insurance subsidiaries to be fully funded by equity capital at Level 1 where such investment is above, or takes the aggregate value of the investment above, 10% of an ADI’s CET1 capital. The amount to be deduced from CET1 is the proportion of the new or additional investment that is above 10% of an ADI’s CET1 capital; and
• there will be no change to the capital treatment of any existing equity investments in these subsidiaries.
Additional loss absorbing capacityOn 9 July 2019, APRA announced a requirement for the Australian major banks (including Westpac) to increase their total capital requirements by three percentage points of RWA as measured under the current capital adequacy framework. This increase in total capital will take full effect from 1 January 2024.
The additional capital is expected to be raised through Tier 2 Capital and is likely to be offset by a decrease in other forms of long-term wholesale funding. Westpac is continuing to make progress towards the new requirements. As at 31 March 2021, Westpac’s Tier 2 ratio was 3.88%.
APRA is still targeting an additional four to five percentage points of loss-absorbing capacity. Over the next four years, APRA has stated that it will consider feasible alternative methods for raising the remaining 1-2 percentage points.
General regulatory changes affecting our businesses
Cyber resilienceAPRA, ASIC, and the Australian government have intensified their focus on cyber resilience, given the increasing incidence of cyber incidents. APRA is seeking to ensure that regulated entities improve their cyber resilience practices and in 2021 APRA will focus on the effective implementation of its Prudential Standard CPS 234 on Information Security. Westpac continues to enhance its systems and processes to mitigate cybersecurity risks, including in relation to third parties.
APRA prudential standard CPS 511: remuneration In 2019, APRA released for consultation a draft new prudential standard and supporting discussion paper on remuneration, aimed at clarifying and strengthening remuneration arrangements in APRA-regulated entities. The new standard will replace existing remuneration requirements under CPS/SPS 510 Governance.
On 12 November 2020, APRA released a revised draft of the standard which responded to industry feedback, and APRA undertook a subsequent round of consultation. APRA has indicated that it intends to finalise the new standard in mid-2021 with an effective date of 1 January 2023 for significant financial institutions that are authorised deposit-taking institutions (which includes Westpac).
Changes to responsible lending lawsOn 25 September 2020, the government announced a proposed simplification of Australia’s consumer credit regulatory regime. The proposed legislation passed the House of Representatives in March, however it has not passed the Senate (and it is not known when it will next be listed for debate). We are closely monitoring this and will make any changes to our systems and processes as appropriate.
In addition to the responsible lending obligations, consumer credit is subject to regulatory oversight through a range of mechanisms, including APRA standards and guidance in relation to credit assessments by ADIs. Accordingly, without analogous changes to these regulatory requirements, removal of the responsible lending obligations (if this occurs) may not necessarily have a significant impact on our overall consumer credit processes.
Focus on superannuation On 17 February 2021, the Treasury Laws Amendment (Your Future, Your Super) Bill 2021 was introduced. If passed, the key reforms involve:
• linking a person to their superannuation fund throughout their working life (unless a person chooses otherwise) to reduce people having unintended multiple superannuation accounts;
• requiring APRA to conduct an annual, objective test for MySuper products (and other prescribed products). The test will be applied to MySuper products from 1 July 2021 and trustees that fail the test will have to notify members of the underperformance. Where a product has failed the performance test in two consecutive years, the trustee will be prohibited from accepting new beneficiaries into that product. An online ATO ‘YourSuper’ comparison tool will also be introduced.
80 WESTPAC GROUP 2021 INTERIM FINANCIAL REPORT
Directors’ report
If passed, the current duty of trustees to act in the best interests of beneficiaries will become an obligation to perform their duties and exercise their powers in the best financial interests of the beneficiaries, and the evidential burden of proof for the best financial interests duty will be reversed, with the result that the trustee will have the onus of demonstrating they have met this obligation.
In addition, APRA is increasing its supervisory focus on superannuation providers, including BT, with an emphasis on member outcomes. Westpac’s BT superannuation entity trustee has been responding to APRA requests for information and addressing feedback from APRA in relation to the comparative underperformance of certain of its MySuper products, having regard to APRA’s most recent MySuper ‘Heat Maps’. BT’s superannuation trustee is also continuing with an ongoing program of work on enhancement of member outcomes.
Open banking regime The Competition and Consumer Act 2010 (Cth) contains a regime for a consumer data right that gives customers in Australia a right to direct that their data (starting with banking data) be shared with accredited third parties. Data sharing facilitates competition through easier product comparison and switching. This is expected to have significant implications for consumers and banks, including Westpac.
Open Banking commenced on 1 July 2020 with the four major banks and has been implemented across product lines on a staggered basis. Other brands in the Westpac Group will be required to commence data sharing on 1 July 2021.
Royal commission into the banking, superannuation and financial services industryImplementation of the 76 express recommendations in the Final Report of the Royal Commission into Misconduct in the Banking, Superannuation and Financial Services Industry continues to be a focus of Australia’s banking and financial services entities and their regulators.
Presently, 47 recommendations apply to Westpac. The Group continues with programs of work in relation to all of the applicable recommendations that have been the subject of legislative activity and/or regulatory activity and, to date, has implemented 15 recommendations. Two omnibus Bills addressing a number of recommendations were passed in December 2020 and February 2021 respectively.
Other impacts arising from the Royal Commission include a number of claims being brought against financial institutions in relation to certain matters considered during the Royal Commission, and the referral of several cases of misconduct to the financial regulators by Commissioner Hayne.
Litigation
ASIC’s outbound scaled advice division proceedingsOn 22 December 2016, ASIC commenced Federal Court proceedings against BT Funds Management Limited (BTFM) and Westpac Securities Administration Limited (WSAL) in relation to a number of superannuation account consolidation campaigns conducted between 2013 and 2016. ASIC has alleged that in the course of some of these campaigns, customers were provided with personal advice in contravention of a number of Corporations Act 2001 (Cth) (Corporations Act) provisions and selected 15 specific customers as the focus of their claim. Following an appeal by ASIC, on 28 October 2019, the Full Federal Court handed down its decision in ASIC’s favour and made findings that BTFM and WSAL each provided personal advice on relevant calls made to 14 of the 15 customers and made declarations of consequential contraventions of the Corporations Act (including section 912A(1)(a)). BTFM and WSAL appealed to the High Court of Australia and on 3 February 2021, the Court dismissed Westpac’s appeal and upheld the orders made by the Full Federal Court. The matter has been remitted to the Federal Court for a hearing on penalties which is listed for 24 August 2021.
ASIC’s proceedings against BT Funds Management and Asgard Capital Management On 20 August 2020, ASIC commenced proceedings in the Federal Court against BTFM and Asgard Capital Management Limited (ACML), in relation to an issue that was a case study in the Royal Commission. The allegations concern the inadvertent charging of financial adviser fees to 404 customers totaling $130,006 after a request had been made to remove the financial adviser from the customers’ accounts. The issue was self-reported to ASIC in 2017 and customers have been contacted and remediated. BTFM and ACML have accepted the allegations made by ASIC and are not defending the proceedings. The matter has been listed for a hearing on penalty on 22 July 2021.
ASIC’s consumer credit insurance proceedings On 7 April 2021, ASIC commenced proceedings in the Federal Court against Westpac in relation to the sale of consumer credit insurance (CCI) products to approximately 384 customers who ASIC alleges had not requested or agreed to acquire this product. ASIC is seeking, among other things, declarations of contraventions of certain civil penalty provisions and unspecified monetary penalties relating to the period from 7 April 2015 to 28 July 2015. Westpac has not sold CCI products since 2019.
Class action against Westpac Banking Corporation and Westpac Life Insurance Services LimitedOn 12 October 2017, a class action was filed in the Federal Court of Australia on behalf of customers who, since February 2011, obtained insurance issued by WLIS on the recommendation of financial advisers employed within the Westpac Group. The plaintiffs alleged that aspects of the financial advice provided by those advisers breached fiduciary and statutory duties owed to the advisers’ clients, including the duty to act in the best interests of the client, and that WLIS was knowingly involved in those alleged breaches. The parties have now reached agreement on a proposed settlement of this matter. The proposed settlement remains subject to Federal Court approval.
81WESTPAC GROUP 2021 INTERIM FINANCIAL REPORT
1 1
23
45
67
Directors’ report
Class action in the U.S. relating to bank bill swap rate In August 2016, a class action was filed in the United States District Court for the Southern District of New York against Westpac and a number of other Australian and international banks and brokers alleging misconduct in relation to the bank bill swap reference rate. Westpac has reached agreement with the Plaintiffs to settle this class action. On 2 March 2021, a Stipulation and Agreement of Settlement was filed with the Court. Under this agreement, which Westpac entered into on a no-admissions basis and which is subject to Court approval, Westpac agreed to pay a settlement sum of USD 25,000,000 and agreed to certain ongoing co-operation obligations.
Class action relating to cash in superannuationOn 5 September 2019, a class action against BTFM and WLIS was commenced in the Federal Court of Australia in relation to aspects of BTFM’s BT Super for Life cash investment option. The claim follows other industry class actions. It is alleged that BTFM failed to adhere to a number of obligations under the general law, the relevant trust deed and the Superannuation Industry (Supervision) Act 1993 (Cth), and that WLIS was knowingly concerned with BTFM’s alleged contraventions. The damages sought are unspecified. BTFM and WLIS are defending the proceedings.
Class action relating to consumer credit insuranceOn 28 February 2020, a class action was commenced against Westpac Banking Corporation, Westpac General Insurance Limited and WLIS in the Federal Court of Australia in relation to Westpac’s sale of CCI. The claim follows other industry class actions. It is alleged that the three entities failed to adhere to a number of obligations in selling CCI in conjunction with credit cards, personal loans and flexi loans. The damages sought by the claim are unspecified. The three entities are defending the proceedings.
Class action relating to payment of flex commissions to auto dealersOn 16 July 2020, a class action was commenced against Westpac Banking Corporation and St.George Finance Limited (SGF) in the Supreme Court of Victoria in relation to flex commissions paid to auto dealers from 1 March 2013 to 31 October 2018. This proceeding is one of two class actions commenced against a number of lenders in the auto finance industry.
It is alleged that Westpac and SGF are liable for the unfair conduct of dealers acting as credit representatives and engaged in misleading or deceptive conduct. The damages sought are unspecified. Westpac and SGF are defending the proceedings. Another law firm publicly announced in July 2020 that it is preparing to commence a class action against Westpac entities in relation to flex commissions paid to auto dealers. Westpac has not been served with a claim from that law firm on flex commissions. Westpac has not paid flex commissions since 1 November 2018 following an industry-wide ban issued by ASIC.
Australian and U.S. AUSTRAC related class actions Westpac is defending a class action proceeding which was commenced in December 2019 in the Federal Court of Australia on behalf of certain investors who acquired an interest in Westpac securities between 16 December 2013 and 19 November 2019. The proceeding involves allegations relating to market disclosure issues connected to Westpac’s monitoring of financial crime over the relevant period and matters which were the subject of the AUSTRAC proceedings (referred to in ‘AUSTRAC matters and financial crime’). The damages sought are unspecified. However, given the time period in question and the nature of the claims, it is likely any alleged damages will be significant.
In January 2020, a U.S. class action was brought on behalf of certain investors in Westpac securities between 11 November 2015 and 19 November 2019. That claim related to market disclosure issues connected to Westpac’s monitoring of financial crime over the relevant period and matters which were the subject of the AUSTRAC proceedings. The parties have agreed to settle these proceedings and Westpac has agreed to pay an amount of US$3.1 million. The settlement remains subject to approval by the District Court of Oregon.
Potential class actions Westpac is aware from media reports and other publicly available material that other class actions against Westpac entities are being investigated. In July 2020, a law firm publicly stated that it intends to commence a class action against BTFM alleging that since 2014, BTFM did not act in the best interests of members of certain superannuation funds when obtaining group insurance policies. In August 2020, another law firm announced that it is investigating claims on behalf of persons who in the past 6 years acquired, renewed or continued to hold a financial product (including life insurance) on the advice or recommendation of a financial adviser from Magnitude Group, Securitor Financial Group or Westpac Banking Corporation. Westpac has not been served with a claim in relation to either of these matters and has no information about the proposed claims beyond the public statements issued by the law firms involved.
82 WESTPAC GROUP 2021 INTERIM FINANCIAL REPORT
Directors’ report
Risk factorsOur business is subject to risks that can adversely impact our financial performance, financial condition and future performance. If any of the following risks occur, our business, prospects, reputation, financial performance or financial condition could be materially adversely affected, with the result that the trading price of our securities could decline and as a security holder you could lose all, or part, of your investment. You should carefully consider the risks described and the other information in this Results Announcement and in our 2020 Annual Report before investing in our securities. The risks and uncertainties described below are not the only ones we face. Additional risks and uncertainties that we are unaware of, or that we currently deem to be immaterial, may also become important factors that affect us.
Risks relating to our business
We have suffered, and could in the future suffer, information security risks, including cyberattacksThe Group (and its external service providers) is subject to information security risks. These risks are heightened by:
• new technologies and increased digital service options;
• increased use of the internet and telecommunications to conduct financial transactions;
• the growing sophistication of attackers;
• the COVID-19 pandemic, which has resulted in many Westpac employees (and staff of service providers) working remotely or from other sites, potentially providing increased opportunities for cyber threat actors to exploit.
These risks could result in information security risks such as cyberattacks, espionage and/or errors happening at an unprecedented pace, scale and reach. While Westpac has systems in place to protect against, detect and respond to cyberattacks, these systems have not always been, and may not always be, effective. Westpac and its customers could suffer losses from cyberattacks, information security breaches or ineffective cyber resilience. The Group may not be able to anticipate and prevent a cyberattack, effectively respond to a cyberattack and/or rectify or minimise damage resulting from a cyberattack. Our external service providers, and other parties that facilitate our activities and financial platforms and infrastructure (such as payment systems and exchanges) are also subject to the risk of cyberattacks, which could in turn impact Westpac.
Our operations rely on the secure processing, storage and transmission of information on our computer systems and networks, and the systems and networks of external suppliers. Although we implement measures to protect the confidentiality and integrity of our information, there is a risk that the computer systems, software and networks on which we, or our service providers, rely may be subject to security breaches, unauthorised access, malicious software, external attacks or internal breaches that could have an adverse impact on our confidential information or that of our customers and counterparties.
A range of potential consequences could arise from a successful cyberattack, such as:
• systems disrupting operations due to not operating properly;
• damage to technology infrastructure;
• adverse impacts to network access, operations or availability of services;
• loss of customers;
• loss of market share;
• loss of data or information;
• reputational damage;
• claims for compensation;
• breach of privacy laws;
• adverse regulatory action including fines or penalties and increased regulatory scrutiny;
• litigation; and
• significant additional resources required to modify or enhance our systems or to investigate and remediate any vulnerabilities or incidents.
All these potential consequences could negatively affect our business, prospects, reputation, financial performance or financial condition.
As cyber threats evolve, we may need to spend significant resources to modify or enhance our systems or investigate and remediate any vulnerabilities or incidents.
83WESTPAC GROUP 2021 INTERIM FINANCIAL REPORT
1 1
23
45
67
Directors’ report
COVID-19 has had, and may continue to have (and a pandemic like COVID-19 could in the future have), an adverse effect on the GroupThe Group is vulnerable to the impacts of a communicable disease outbreak or a pandemic. The COVID-19 pandemic has had, and may continue to have, a negative impact on our customers, shareholders, employees and financial performance, among other adverse effects.
The COVID-19 pandemic has disrupted, and will continue to disrupt, numerous industries and global supply chains, while important measures to mitigate its impact (such as restrictions on businesses, movement and public gatherings) have had, and may continue to have, a negative effect on economic activity.
While economic activity has improved in Australia more recently, the decrease in economic activity over 2020 has affected, and may in the future affect, demand for Westpac’s products and services for an unknown time and by an unknown amount. The associated financial stress on Westpac’s customers has, and is expected to, increase impairments, defaults and write-offs. Westpac has increased its COVID-19 related overlays to allow for the potential emergence of losses once the effect of support and stimulus measures reduces in its business portfolios, however, further increases may be required. For more information refer to Note 10 to the financial statements in this Interim Financial Report and Note 21 to the financial statements in our 2020 Annual Report.
Westpac has supported customers impacted by the pandemic by lowering interest rates on certain products, waiving certain fees and granting deferrals of certain loan repayments. These initiatives have had and may continue to have a negative impact on the Group’s financial performance and may see the Group assume greater risk than it would have under ordinary circumstances. There is also the potential for further government or regulator intervention to support the economy and customers impacted by COVID-19 which may require banks (including Westpac) to support those interventions.
Actions taken by regulators in response to the COVID-19 pandemic have impacted and could in the future impact the Group. As an example, regulators in some overseas jurisdictions have exercised their powers to prevent banks from declaring dividends or undertaking share buybacks. In New Zealand, in April 2020, the RBNZ made the decision to freeze dividend payments by banks in New Zealand, and in March 2021, it eased the restriction to place a 50% dividend restriction on the distribution of dividends on ordinary shares by banks in New Zealand until 1 July 2022. This prevents Westpac’s subsidiary, Westpac New Zealand Limited, from paying more than 50% of its earnings as dividends and negatively impacts Westpac’s Level 1 CET1 capital ratio. More recently, the RBNZ has moved to stem the rapid growth in house prices by introducing new Loan Value Ratio restrictions on mortgage lending for both owner-occupier and investor-based borrowers.
APRA has written to Australian banks (including Westpac) and outlined its expectations that they continue to moderate dividend payout ratios and consider the use of dividend reinvestment plans and/or other capital management initiatives to offset the impact on capital from distributions.
Further information about impacts on the Group as a result of actions taken by regulators in response to the COVID-19 pandemic is outlined in ‘Significant Developments’.
Westpac’s business activities and operations have been, and may in the future be, disrupted by disease outbreaks or pandemics. For example, the COVID-19 pandemic has resulted in Westpac and its third party suppliers closing workplaces and suspending the provision of services through certain channels for a period.
When such outbreaks or pandemics occur, Westpac may need to adjust its risk appetite, policies or controls so it can respond to the outbreak or pandemic and protect the well-being of staff and customers who visit our premises. These changes could have unforeseen consequences and expose the Group to increased regulatory focus and/or media scrutiny.
Further, to respond to the COVID-19 pandemic, Westpac has implemented (and may in the future implement) new measures in very short periods of time. Taking this type of action may increase the risk that an operational or compliance breakdown occurs, potentially leading to financial losses, impacts on customer service or regulatory and/or legal action.
The COVID-19 pandemic has impacted the Group’s ability to pay dividends, with the Group electing not to pay an interim dividend last financial year given the desire to retain a strong balance sheet and the ongoing uncertainty in the operating environment. It is possible that the COVID-19 pandemic, or another communicable disease outbreak or pandemic like COVID-19, will negatively impact the Group’s ability to pay future dividends or make capital distributions.
There continues to be uncertainty associated with the COVID-19 pandemic, including the ultimate course, duration and severity of the disease and effectiveness of vaccination programs, future actions that may be taken by governments and businesses to attempt to contain the virus or mitigate its impact and the effectiveness of such actions, the timing and speed of economic recovery and the widespread availability and ultimate effectiveness of vaccinations for COVID-19. In turn, this has the potential for longer term impacts on Westpac’s customers, business and operations. The COVID-19 pandemic may also heighten other risks described below.
We could be adversely affected by legal or regulatory changeThe Group’s business, prospects, reputation, financial performance and financial condition have been, and could in the future be, adversely affected by changes to law, regulation, policies, supervisory activities and the expectations of our regulators. The Group operates in an environment where there is increased regulation and scrutiny of financial services providers.
Regulatory change has directly and adversely affected the Group’s financial performance and financial condition, and could do so in the future. In recent years, laws and regulations have been introduced requiring Westpac to hold more liquidity and higher capital, and a Bank Levy (based on liabilities) has been imposed on Australia’s largest banks. Laws and regulations that have a similar effect could be passed in the future, including as a result of APRA’s proposed capital policy reforms.
84 WESTPAC GROUP 2021 INTERIM FINANCIAL REPORT
Directors’ report
Regulatory changes may also affect how we operate. For example, recent regulation has altered the way we provide our products and services, in some cases requiring us to change or discontinue our offerings. Regulation could also limit our flexibility, require us to incur substantial costs, impact the profitability of our businesses, result in the Group being unable to increase or maintain market share and/or create pressure on margins and fees.
There are many sources of regulatory change that could affect our business. Such change could stem from international bodies, such as the Basel Committee on Banking Supervision (BCBS), or from reviews and inquiries commissioned by governments (including the Royal Commission into Misconduct in the Banking, Superannuation and Financial Services Industry) or regulators. Reviews and commissions of inquiry may lead to, and in some cases already have led to, substantial regulatory change, which could have a material impact on the Group.
Regulation impacting our business may not always be released in a timely manner before its date of implementation. Similarly, early announcements of regulatory change may not be specific and significantly differ from the final regulation. In those cases, the Group may not be able to effectively manage its compliance design in the timeframes available.
Relevant governments or regulators could also revise their application of regulatory policies, thereby impacting our business (such as macro-prudential limits on lending).
It is critical the Group manages regulatory change effectively. The failure to do so has resulted, and could in the future result, in the Group not meeting its compliance obligations, the potential consequences of which are set out below in ‘We have been and could be adversely affected by failing to comply with laws, regulations or regulatory policy’. We expect that we will continue to invest significantly in compliance and the management and implementation of regulatory change, and significant management attention and resources may be required to update existing, or implement new, processes to comply with such new regulations.
The Group’s ability to manage regulatory change has been, and may in the future be, impacted by the COVID-19 pandemic or similar pandemics. The COVID-19 pandemic has caused significant disruptions and delays to regulatory change projects, increasing the risk that the Group may not comply with new regulations when they come into effect. The governmental response to COVID-19 has also seen new legislation and regulation, which may increase compliance risks. The Group may also incur significant costs responding to this new legislation and regulation.
For further information about regulatory changes affecting the Group, refer to ‘Significant developments’ and the sections ‘Critical accounting assumptions and estimates’ and ‘Future developments’ in Note 1 to the financial statements in this Interim Financial Report.
We have been and could be adversely affected by failing to comply with laws, regulations or regulatory policyWe are responsible for ensuring that we comply with all applicable legal and regulatory requirements and industry codes of practice in the jurisdictions in which we operate or obtain funding, as well as meeting our ethical standards.
The Group is subject to conduct and compliance risk. These risks are exacerbated by the increasing complexity and volume of regulation, including where we interpret our obligations and rights differently to regulators or a Court, tribunal or other body. The potential for this is heightened when regulation is new, untested or is not accompanied by extensive regulatory guidance.
The Group’s compliance management system is designed to identify, assess and manage compliance risk. However, this system has not always been, and may not always be, effective. Breakdowns have, and may in the future, occur due to flaws in the design or implementation of controls or processes. This has resulted in, and may in the future result in, potential breaches of compliance obligations as well as poor customer outcomes.
Conduct risk could occur through the provision of products and services to customers that do not meet their needs or do not meet the expectations of the market, as well as the poor conduct of our employees, contractors, agents, authorised representatives and external services providers. This could occur through a failure to meet professional obligations to specific clients (including fiduciary and suitability requirements), weakness in risk culture or corporate governance or organisational culture, poor product design and implementation, failure to adequately consider customer needs or selling products and services outside of customer target markets. This could include deliberate attempts by such individuals to circumvent Westpac’s controls, processes and procedures or reckless or negligent actions that could result in the circumvention of Westpac’s controls, processes and procedures. The Group depends on its people to ‘do the right thing’ to meet its compliance obligations and abide by its Code of Conduct. Inappropriate or poor conduct by these individuals such as not following a policy or engaging in misconduct has resulted, and could result, in poor customer outcomes and a failure by the Group to meet its compliance obligations. The large number of employees and the staff of our third-party contractors working remotely due to the COVID-19 pandemic may negatively affect the Group’s compliance controls and monitoring processes, and there may be an increased risk that staff fail to follow internal policies or that customers may be adversely affected through privacy breaches.
While we have frameworks, policies, processes and controls that are designed to manage poor conduct outcomes, these frameworks, policies, processes and controls have been, and may be, ineffective. The failure of these frameworks, policies, processes and controls could result in financial losses (including incurring substantial remediation costs and as a result of litigation by regulators and customers) and reputational damage, which could adversely affect our business, prospects, financial performance or financial condition.
85WESTPAC GROUP 2021 INTERIM FINANCIAL REPORT
1 1
23
45
67
Directors’ report
The Group’s failure, or suspected failure, to comply with a compliance obligation has in the past and could in the future lead to a regulator commencing surveillance or an investigation. The Group is currently subject to a number of investigations and reviews by regulators (refer to ‘Significant developments’ and Note 14 to the financial statements in this Interim Financial Report for more detail). The Group has devoted (and will need to continue to devote) significant resources and has incurred (and will continue to incur) costs for these reviews and investigations, which may adversely affect Westpac’s business, operations, reputation, financial performance and ability to pay dividends.
Depending on the circumstances, regulatory reviews and investigations have in the past and may in the future result in a regulator taking administrative or enforcement action against the Group and/or its representatives. Regulators could pursue civil or criminal proceedings, seeking substantial fines, civil penalties or other enforcement outcomes. In addition, regulatory investigations may lead to adverse findings against directors and management, including potential disqualification.
In many cases, our regulators have broad powers. For example, APRA can, in certain circumstances, issue directions to us (such as a direction to comply with a prudential requirement, conduct an audit or take remedial action) or disqualify an ‘Accountable Person’ under the Banking and Executive Accountability Regime.
APRA can also require the Group to hold additional capital either through a capital overlay or higher risk weighted assets. APRA imposed a $500 million overlay to our operational risk capital requirement following the completion of our self-assessment into our frameworks and practices in relation to culture, governance and accountability and a further $500 million overlay following the commencement of civil penalty proceedings by AUSTRAC (both overlays were applied through an increase in risk weighted assets). If the Group incurs additional capital overlays, it may need to raise additional capital, which could have an adverse impact on our financial performance and financial condition.
The political and regulatory environment that the Group operates in has seen (and may in the future see) our regulators (including any new regulator) receive new powers along with materially increased penalties for corporate and financial sector misconduct. In particular, ASIC can commence civil penalty proceedings and seek civil penalties (currently up to $525 million per offence) against an Australian Financial Services licensee (such as Westpac) for failing to do all things necessary to ensure that financial services provided under the licence are provided efficiently, honestly and fairly. The Group may also face significant penalties for failing to comply with other obligations, and a failure by the Group may result in multiple contraventions leading to large penalties.
Our regulators have adjusted and may in the future continue to adjust the way they approach oversight, potentially preferring their enforcement powers over a more consultative approach. For example, ASIC committed to a ‘Why not litigate?’ approach and has prioritised case studies and referrals arising from the Royal Commission and significant market misconduct. APRA has also committed to a revised enforcement approach (including a new Supervision Risk and Intensity Model), indicating it will use enforcement where appropriate to prevent and address serious prudential risks and hold entities and individuals to account.
There may also be a shift in the type and focus of enforcement proceedings commenced by regulators in the future. For example, regulators may increasingly seek to refer investigations for potential criminal consideration to the Commonwealth Department of Public Prosecutions or other prosecutorial bodies. This may result in an increase in criminal prosecutions against institutions and/or their employees or representatives.
The way regulators supervise and monitor institutions has also changed and may continue to change in the future. An example is ASIC’s ‘Close and Continuous Monitoring’ (CCM) program involving onsite reviews of financial services entities, including Westpac.
The Group is responding to a high volume of regulatory requests from ASIC, APRA and other regulators. This is consistent with the long-term trend towards enhanced supervision and monitoring and greater enforcement activity by regulators.
Disruptions to Westpac’s business, operations, third-party contractors and suppliers resulting from the COVID-19 pandemic have increased and may continue to increase the risk that Westpac will not be able to satisfy commitments made to regulators about improving processes and/or resolving outstanding issues, potentially increasing the prospect of a regulator taking action against the Group.
Regulatory action commenced against the Group has exposed and may in the future expose the Group to an increased risk of litigation brought by third parties (including through class action proceedings), which may require the Group to pay compensation to third parties and/or undertake further remediation activities.
Regulatory investigations, inquiries, litigation, fines, penalties, infringement notices, revocation, suspension or variation of conditions of regulatory licences or other enforcement or administrative action or agreements (such as enforceable undertakings) could, either individually or in aggregate with other regulatory action, adversely affect our business, prospects, reputation, financial performance or financial condition. For further details about regulatory matters that may affect the Group, refer to ‘Significant developments’.
86 WESTPAC GROUP 2021 INTERIM FINANCIAL REPORT
Directors’ report
We have suffered, and in the future could suffer, losses and be adversely affected by the failure to implement effective risk managementOur risk management framework has not always been, or may not in the future prove to be, effective.
This could be because the design of the framework is inadequate or that key risk management policies, controls and processes may be ineffective, due to inadequacies in their design, technology failures or because of poor implementation or high execution risk. The potential for these types of failings is heightened if the Group does not have enough appropriately skilled, trained and qualified employees in key positions.
There are also inherent limitations with any risk management framework as risks may exist, or emerge in the future, that we have not anticipated or identified, and our controls may not be effective.
The risk management framework may also prove ineffective because of weaknesses in risk culture, which may result in risks and control weaknesses not being identified, escalated or acted upon. Recent analysis and reviews, in addition to regulatory feedback, have highlighted that the framework is not operating satisfactorily in a number of respects and needs to be improved. The Group has a number of risks which sit outside our risk appetite or do not meet the expectations of regulators. Many of these areas requiring improvement relate to the enforceable undertaking entered into with APRA by Westpac in December 2020 (in respect of which further information is in ‘Significant developments’). Further, a deficiency in the design or operation of our remuneration structures could have a negative effect, potentially resulting in staff engaging in excessive risk-taking behaviours.
As part of the Group’s risk management framework, the Group measures and monitors risks against its risk appetite. If a risk is out-of-appetite, the Group needs to take steps to bring this risk back into appetite in a timely way. However, the Group may not always be able to achieve this within proposed timeframes. This may occur because, for example, the Group experiences delays in enhancing its information technology systems or in recruiting sufficient numbers of appropriately trained staff for required activities. It is also possible that due to external factors beyond our control, certain risks may be inherently outside of appetite for periods of time. The Group is required to periodically review its risk management framework to determine if it remains appropriate.
If the Group is unable to bring risks back into appetite, or if it is determined that the Group’s risk management framework is no longer appropriate, the Group may incur unexpected losses and be required to undertake considerable remedial work, including incurring substantial costs. The failure to remedy this situation could result in increased scrutiny from regulators, who could require (amongst other things) that the Group hold additional capital or direct the Group to spend money to enhance its risk management systems and controls. Weaknesses in risk management systems and controls have recently led to adverse outcomes for the Group, with APRA requiring Westpac to hold additional capital following the completion of its Culture, Governance and Accountability self-assessment, as well as the payment of a civil penalty of $1.3 billion as a result of the civil penalty proceedings brought by AUSTRAC against Westpac. In the reporting period, APRA accepted an Enforceable Undertaking from Westpac, reflecting the crystallisation of many of the risks discussed above, and APRA has approved Westpac’s integrated plan in relation to risk governance. Inadequacies in addressing risks or in the Group’s risk management framework could also result in the Group failing to meet a compliance obligation and/or financial losses.
If any of our governance or risk management processes and procedures prove ineffective or inadequate or are otherwise not appropriately implemented, as has occurred, we could be exposed to higher levels of risk than expected which may result in unexpected losses, imposition of capital requirements, breaches of compliance obligations and reputational damage which could adversely affect our business, prospects, financial performance or financial condition.
For a discussion of our risk management procedures, refer to the ‘Risk management’ section in our 2020 Annual Report.
The failure to comply with financial crime obligations has had and could have further adverse effects on our business and reputationThe Group is subject to anti-money laundering and counter-terrorism financing (AML/CTF) laws, anti-bribery and corruption laws, economic and trade sanctions laws and tax transparency laws in the jurisdictions in which it operates. These laws can be complex and, in some circumstances, impose a diverse range of obligations. As a result, regulatory, operational and compliance risks are heightened. For example, AML/CTF laws require Westpac and other regulated institutions to (amongst other things) undertake the applicable customer identification procedures, conduct ongoing and enhanced due diligence on customers, maintain and comply with an AML/CTF program and undertake ongoing risk assessments.
AML/CTF laws also require Westpac to report certain matters and transactions to regulators (including international funds transfer instructions, threshold transaction reports and suspicious matter reports) and ensure that certain information is not disclosed to third parties in a way that would contravene the ‘tipping off’ provisions in AML/CTF legislation. The failure to comply with these laws has had, and in the future may have, adverse impacts for the Group.
In recent years there has been, and there continues to be, increased focus on compliance with financial crime obligations, with regulators globally commencing large-scale investigations and taking enforcement action for identified non-compliance (often seeking significant penalties). Further, due to the Group’s large number of customers and transaction volumes, the undetected failure or the ineffective implementation, monitoring or remediation of a system, policy, process or control (including a regulatory reporting obligation) has resulted, and could in the future result, in a significant number of breaches of AML/CTF obligations. This in turn could lead to significant penalties, such as in the AUSTRAC proceedings described below, and other adverse impacts for the Group, such as reputational damage.
87WESTPAC GROUP 2021 INTERIM FINANCIAL REPORT
1 1
23
45
67
Directors’ report
While the Group has systems, policies, processes and controls in place designed to manage its financial crime obligations (including reporting obligations), these have not always been, and may not in the future always be, effective. This could be for a range of reasons, including, for example, a deficiency in the design of a control or a technology failure. Our analysis and reviews, in addition to regulator feedback, have highlighted that our systems, policies, processes and controls are not operating satisfactorily in a number of respects and require improvement.
The Group is currently undertaking a significant multi-year program of work to strengthen areas of control weakness in its financial crime risk management framework (including important aspects of its money laundering and terrorism financing risk assessments and governance) and seek to rectify the management of this risk. The Group has increased dedicated financial crime risk expertise and resources to deliver the financial crime program of work. With increased focus on financial crime, further issues requiring attention have been identified and may continue to be identified. For further information, refer to ‘Significant developments’.
Although the Group provides updates to AUSTRAC, the ATO and other regulators on its remediation and other program activities, there is no assurance that AUSTRAC, the ATO or other regulators will agree that its remediation and program update activities will be adequate or effectively enhance the Group’s compliance programs.
If we fail, to comply with these financial crime obligations, we could face, and have in the past faced, regulatory enforcement action such as litigation, significant fines, penalties and the revocation, suspension or variation of licence conditions. For example, we paid a civil penalty of $1.3 billion as a result of the civil proceedings brought by AUSTRAC against Westpac on 20 November 2019 for certain contraventions of the Anti-Money Laundering and Counter-Terrorism Financing Act 2006 (Cth). Further information on the AUSTRAC proceedings and other financial crime matters is in ‘Significant developments’.
Non-compliance or alleged non-compliance with our financial crime related obligations and public disclosure have also resulted in, and could lead to regulatory investigations, reviews, inquiries, proceedings or other litigation commenced by third parties (including Australian, US or other class actions), and regulatory action in non-Australian jurisdictions where we operate. Any such litigation or proceeding could cause significant financial and reputational damage to us. Reputational damage could result in the loss of customers or restrict the Group’s ability to efficiently access capital markets, which could have a material adverse effect on the Group’s business, reputation, prospects, financial performance and financial condition. Furthermore, any such effect could harm the Group’s credit ratings. Previous enforcement action by AUSTRAC has resulted in a range of outcomes, depending on the nature and severity of the relevant conduct and its consequences, including substantial financial penalties, restrictions and other regulator-imposed conditions.
Climate change may have adverse effects on our businessWe, our customers, external suppliers and communities in which we operate, may be adversely affected by the physical risks of climate change, including increases in temperatures, rising sea levels, and the frequency and severity of adverse climatic events including fires, storms, floods and droughts. These effects, whether acute or chronic in nature, may directly impact us and our customers through, for example, disruptions to business and economic activity or impacts on income and asset values. Adverse impacts on our customers may negatively impact loan serviceability and security values, as well as our profitability.
In addition, Westpac is exposed to risk arising from initiatives and trends associated with climate change mitigation (transition risks). Changes in supervisory expectations of banks, other regulatory changes and changes in investor appetite could directly impact Westpac, for example, by giving rise to higher compliance and/or funding costs. Examples of regulatory change in this space include the commencement by APRA of its Climate Vulnerability Assessment involving major Australian banks including Westpac; the release of APRA’s draft Prudential Practice Guide on climate change financial risks; and the introduction of proposed legislation in New Zealand to require mandatory climate-risk reporting for the financial sector.
Westpac is also exposed to transition risk indirectly through its lending to higher risk sectors or regions. Technological developments, regulatory changes, stakeholder pressure and shifting customer preferences may place additional pressure on certain customer sectors to reduce greenhouse gas emissions, which could in turn result in additional credit risk, or loss of revenues due to changes in markets.
We may be subject, from time to time, to legal and business challenges due to actions instituted by activist shareholders or others. Responding to such actions could be costly and time-consuming, and may create increased attention and disclosure associated with such matters. In addition, there could be heightened litigation risk due to varying shareholder expectations or additional disclosures or commitments made by Westpac to shareholders. Perceived uncertainties as to our future direction as a result of shareholder activism may lead to the perception of a change in the direction of the business or other instability.
Further, any failure or perceived failure by Westpac to proactively manage and disclose climate change risks appropriately may in turn increase the risk of third party and shareholder litigation, or regulatory action against the Group (and/or its customers), with these types of climate-related actions becoming more common in Australia and globally. Further, we expect scrutiny from shareholders and regulators on the climate-related risk management practices and lending policies of banks and other financial institutions to remain high in Australia in coming years.
Westpac is also exposed to broader geopolitical and macro-economic impacts of climate change given its international portfolio. Climate change may remove stability from both domestic and international economic conditions and may impact customer confidence in these markets.
88 WESTPAC GROUP 2021 INTERIM FINANCIAL REPORT
Directors’ report
Failure to effectively manage and disclose direct and indirect climate-related risks, including physical, transition, litigation and shareholder activism risks, could adversely affect our business, prospects, reputation, financial performance or financial condition.
Please refer to Section 2.6 (‘Sustainability performance’) of the Results Announcement for further detail on the identification, assessment and management of risks relating to climate change.
Reputational damage has harmed and could in the future harm our business and prospectsReputational risk arises where there are differences between stakeholders’ current and emerging perceptions, beliefs and expectations and our past, current and planned activities, processes, performance and behaviours.
There are various potential sources of reputational damage. For example, where our actions cause, or are perceived to cause, a negative outcome for customers, shareholders, stakeholders or the community. Reputational damage could also arise from the failure to effectively manage risks, failure to comply with legal and regulatory requirements, enforcement or supervisory action by regulators, adverse findings from regulatory reviews, failure or perceived failure to adequately respond to community, environmental, social and ethical issues, failure of information security systems, technology failures and security breaches and inadequate record keeping, which may prevent Westpac from demonstrating that or determining if a past decision was appropriate at the time it was made. The AUSTRAC proceedings illustrate a number of these risks.
Our reputation could also be adversely affected by the actions of customers, suppliers, joint-venture partners, strategic partners, other counterparties and accredited data recipients that the Group provides customer data to under Australia’s ‘Open Banking’ regime.
Failure, or perceived failure, to address issues that could or do give rise to reputational risk has created, and could in the future create, additional legal risk, subject us to regulatory investigations, regulatory enforcement actions, fines and penalties or litigation or other actions brought by third parties (including class actions), requirements to remediate and compensate customers, remediation and other costs and reputational harm among customers, investors and the market. This could adversely affect our business, prospects, financial performance or financial condition.
We have and could suffer losses due to litigationWestpac and its subsidiaries are, from time to time, involved in legal proceedings (including class actions), regulatory actions or arbitration. Such litigation has been and could in the future be commenced by a range of plaintiffs, such as customers, shareholders, suppliers, counterparties and regulators.
In recent years, there has been an increase in class action proceedings, many of which have resulted in significant monetary settlements. The risk of class actions has been heightened by a number of factors, including regulatory enforcement actions (such as the civil penalty proceedings brought by AUSTRAC), an increase in the number of regulatory investigations and inquiries (such as the Royal Commission), a greater willingness on the part of regulators to commence court proceedings, more intense media scrutiny and the growth of third-party litigation funding. Class actions commenced against a competitor could also lead to similar proceedings against Westpac.
Litigation (including class actions) may, either individually or in aggregate, adversely affect the Group’s business, operations, prospects, reputation or financial condition. This risk is heightened by increases in the severity of penalties for certain breaches of the law. Such matters are subject to many uncertainties and the outcome may not be predicted accurately. Furthermore, the Group’s ability to respond to and defend litigation may be adversely affected by inadequate record keeping.
Depending on the outcome of any litigation, the Group has been and may in the future be required to comply with broad court orders, including compliance orders, enforcement orders or otherwise pay significant damages, fines, penalties or legal costs.
In addition, the case studies considered by the Royal Commission, and the Royal Commission’s findings, have led, and may in the future lead to, regulators commencing investigations and/or enforcement action against the Group.
The Group’s material provisions and contingent liabilities are described in Note 14 to the financial statements in this Interim Financial Report. There is a risk that the actual penalty or damages paid following a settlement or determination by a Court for any legal proceedings may be materially higher or lower than the provision or that any contingent liability may be larger than anticipated. This may occur in a range of situations, for example where the scope of litigation against the Group is expanded by further claims or causes of action. There is also a risk that additional litigation or contingent liabilities arise, all of which could adversely affect our business, prospects, reputation, financial performance or financial condition.
We could suffer losses due to technology failuresMaintaining the reliability, integrity and security of our information and technology is crucial to our business.
While the Group has a number of processes in place to preserve and monitor the availability and recovery of our systems, there is a risk that our information and technology systems might fail to operate properly or become disabled, including from events wholly or partially beyond our control. For example, the COVID-19 pandemic has seen more employees and staff of our third- party contractors work remotely or from alternative sites, which may put additional stress on Westpac’s technology infrastructure and systems.
If we incur a technology failure, we may fail to meet a compliance obligation (such as retaining records and data for a certain period), or our customers may be adversely affected, including through privacy breaches or loss of personal data. This could result in reputational damage, remediation costs and a regulator commencing an investigation and/or taking action against us. The over reliance on legacy systems may heighten the risk of a technology failure.
89WESTPAC GROUP 2021 INTERIM FINANCIAL REPORT
1 1
23
45
67
Directors’ report
We need to regularly renew and enhance our technology to deliver new products and services, comply with regulatory obligations and meet our customers’ and regulators’ obligations. Consequently, we are constantly managing new technology projects. Failure to effectively implement these projects could result in cost overruns, reduced productivity, operational instability, compliance failures, reputational damage and/or the loss of market share. This could place us at a competitive disadvantage and adversely affect our business, prospects, financial performance or financial condition.
We are exposed to adverse funding market conditionsWe rely on deposits, money markets and capital markets to fund our business and source liquidity. Our liquidity and costs of obtaining funding are related to funding market conditions.
Funding markets can experience periods of extreme volatility, disruption and decreased liquidity. Such disruption can be for extended periods and be unpredictable as experienced during the Global Financial Crisis and, more recently, as a result of the COVID-19 pandemic. The main risks we face are damage to market confidence, changes to the access and cost of funding, a slowing in global economic activity or other impacts on customers or counterparties.
As of 31 March 2021, approximately 26% of our total funding originated from domestic and international wholesale markets. Of this, around 53% was sourced outside Australia and New Zealand. Customer deposits provide around 66% of total funding. Customer deposits held by Westpac comprise both term deposits, which can be withdrawn after a certain period and at call deposits, which can be withdrawn at any time.
A shift in investment preferences, or an unwind of the RBA’s quantitative easing measures as the economy continues to improve, could result in deposit withdrawals which could increase our need for funding from other, potentially less stable, or more expensive sources.
If market conditions deteriorate due to economic, financial, political or other reasons (including the COVID-19 pandemic), there may also be a loss of confidence in bank deposits leading to unexpected withdrawals. This could increase funding costs and our liquidity, funding and lending activities may be constrained and our financial solvency threatened.
If our current sources of funding prove to be insufficient, we may need to seek alternatives which will depend on factors such as market conditions, our credit ratings and market capacity. Even if available, these alternatives may be more expensive or on unfavourable terms, which could adversely affect our financial performance, liquidity, capital resources or financial condition.
If Westpac is unable to source appropriate funding, we may be forced to reduce lending or liquidity. This may adversely impact our business, prospects, liquidity, capital resources, financial performance or financial condition. If Westpac is unable to source appropriate funding for an extended period, or if it can no longer realise liquidity, Westpac may not be able to pay its debts as and when they fall due or meet other contractual obligations.
Westpac enters into collateralised derivative obligations, which may require Westpac to post additional collateral based on market movements, which has the potential to adversely affect Westpac’s liquidity or ability to use derivative obligations to hedge its interest rate, currency and other financial instrument risks.
For a more detailed description of liquidity risk, refer to ‘Funding and liquidity risk’ in Note 21 to the financial statements in our 2020 Annual Report.
We could be adversely affected by the risk of inadequate capital levels under stressed conditions The risk of an inadequate level or composition of capital to support normal business activities and to meet regulatory capital requirements under normal operating environments or stressed conditions has been highlighted by the COVID-19 pandemic. Regulatory change will require banks to hold higher capital, specifically for the implementation of future capital and risk-weighted assets regulations coming into effect from 2023. APRA requires banks to operate above the 10.5% unquestionably strong benchmark to prepare for this change although the impact on each bank will be different due to different balance sheet and portfolio mix. Capital distribution constraints apply when an ADI’s Common Equity Tier 1 Capital ratio is within the capital buffer (CB) range (consisting of the capital conservation buffer plus any countercyclical capital buffer). Capital constraints could have an impact on Westpac’s ability to pay future dividends or make capital distributions. Adverse conditions and/or adverse regulatory change could impact Westpac’s capital adequacy and/or trigger capital distribution constraints.
Sovereign risk may destabilise financial markets adverselySovereign risk is the risk that governments will default on their debt obligations or will be unable to refinance their debts as they fall due. Potential sovereign debt defaults and the risk that governments will nationalise parts of their economy including assets of financial institutions such as Westpac could negatively impact the value of our holdings of liquid assets. There may also be a cascading effect to other markets and countries, the consequences of which, while difficult to predict, may be similar to or worse than those experienced during the Global Financial Crisis. Such an event could destabilise global financial markets, adversely affecting our liquidity, financial performance or financial condition.
90 WESTPAC GROUP 2021 INTERIM FINANCIAL REPORT
Directors’ report
We could be adversely affected by the failure to maintain our credit ratingsCredit ratings are independent opinions on our creditworthiness. Our credit ratings can affect the cost and availability of our funding and may be important to certain customers or counterparties when evaluating our products and services.
Credit ratings assigned to us by rating agencies are based on an evaluation of a number of factors, including our financial strength, the quality of our governance, structural considerations regarding the Australian financial system and economy and Australia’s Sovereign credit rating. A rating downgrade could be driven by a downgrade of Australia’s Sovereign credit rating, or one or more of the risks identified in this section or by other events including changes to the methodologies rating agencies use to determine credit ratings.
The economic impacts of the COVID-19 pandemic negatively affected Westpac’s credit ratings. In April 2020, Fitch Ratings downgraded its short-term and long-term ratings for the major Australian banks (including Westpac) by one notch, to A+ (from AA-) and F1 (from F1+) respectively and S&P Global Ratings revised its outlook for Westpac’s long-term issuer credit rating to ‘negative’, mirroring a similar change to its outlook for the Australian Sovereign. In April 2021, Fitch Ratings revised the rating outlook for Westpac from ‘negative’ to ‘stable’ and affirmed its short-term and long-term ratings. While the change in ratings outlook reflects Fitch Ratings’ view of the improved economic prospects in Australia, as the economic impacts from the COVID-19 pandemic continue, it remains uncertain as to whether there may be negative movement in our credit ratings in the future.
A downgrade to our credit ratings could have an adverse effect on our cost of funds, collateral requirements, liquidity, competitive position and our access to capital markets. The extent and nature of these impacts would depend on various factors, including the extent of any rating change, differences across agencies (split ratings) and whether competitors or the sector are also impacted.
We could be adversely affected by a shock to the Australian, New Zealand or other financial systemsThere is a risk that a major systemic shock could occur that adversely impacts the Australian, New Zealand or other financial systems.
In the past decade, the financial services industry and capital markets have been, and may continue to be, adversely affected by volatility, global economic conditions, external events, geopolitical instability (such as global conflicts), and political developments. For example, the impacts from the COVID-19 pandemic have been, and could continue to be, significant for the global economy including Australia and New Zealand.
Market and economic disruptions could adversely affect financial institutions such as Westpac because consumer and business spending may decrease, unemployment may rise and demand for our products and services could decline, thereby reducing our earnings. These conditions may also affect the ability of our borrowers or counterparties to repay their loans or meet their obligations, causing us higher credit losses and affecting investors’ willingness to invest in the Group. These events could also undermine confidence in the financial system, reduce liquidity, impair access to funding and affect our customers and counterparties. If this occurs, our business, prospects, financial performance or financial condition could be adversely affected.
The nature and consequences of any such event are difficult to predict and there is a risk that our response may be ineffective.
Declines in asset markets could adversely affect our operations or profitabilityPotential declines in Australian, New Zealand or other asset markets, including equity, residential and commercial property markets, have adversely affected, and could in the future adversely affect, our operations and profitability.
Declining asset prices could also impact customers and counterparties and the value of security (including residential and commercial property) we hold. This may impact our ability to recover amounts owing to us if customers or counterparties default. It may also affect our impairment charges and provisions, in turn impacting our financial performance and financial condition.
Declining asset prices also impact our wealth management business as its earnings partly depend on fees based on the value of securities and/or assets held or managed.
Our business is substantially dependent on the Australian and New Zealand economiesOur revenues and earnings are dependent on economic activity and the level of financial services our customers require.
Most of our business is conducted in Australia and New Zealand so our performance is influenced by the level and cyclical nature of activity in these countries. These factors are in turn impacted by domestic and international economic conditions (including the COVID-19 pandemic).
Any significant decrease in Australian and New Zealand housing valuations and commercial property valuations could adversely impact our lending activities because borrowers with loans in excess of their property value show a higher propensity to default. If defaults occur, our security may be eroded, causing higher credit losses. The demand for our home lending products may also decline due to adverse economic conditions, changes in tax legislation (such as changes to tax rates, concessions or deductions), regulatory requirements or buyer concerns about decreases in values.
Adverse changes to economic and business conditions in Australia, New Zealand and other countries could also adversely affect our customers. In particular, due to the economic relationship between Australia/New Zealand and China, particularly in the mining, resources and agricultural sectors, a slowdown in China’s economic growth and foreign Government policies (including the adoption of protectionist trade measures) could negatively impact the Australian economy. Changes in commodity prices, Chinese Government policies or China’s economic conditions
91WESTPAC GROUP 2021 INTERIM FINANCIAL REPORT
1 1
23
45
67
Directors’ report
could reduce demand for our products and services and affect the level of economic activity and the ability of our borrowers to repay their loans. If this occurred, it could negatively impact our business, prospects, financial performance or financial condition.
Monetary policy can also significantly affect the Group. Interest rate settings (including low or negative rates) and other actions taken by central banks (such as quantitative easing) may adversely affect our cost of funds, the value of our lending and investments and our margins. Monetary policies also impact economic conditions of the jurisdictions we operate or obtain funding in. These policies could affect demand for our products and services and/or have a negative impact on the Group’s customers and counterparties, potentially increasing the risk that they will default. All these factors could adversely affect our business, prospects, financial performance or financial condition.
An increase in defaults has adversely affected and could further adversely affect our financial performance or financial conditionWe establish provisions for credit impairment based on current information and our expectations. If economic conditions deteriorate beyond our expectations, some customers and/or counterparties could experience higher financial stress, leading to an increase in defaults and write-offs, and higher provisioning. Such events could adversely affect our liquidity, capital resources, financial performance or financial condition.
These risks have been heightened by the COVID-19 pandemic, which has negatively impacted economic activity and caused a range of customers to experience financial stress. While the situation has improved in Australia more recently, in 2020, the pandemic saw many customers cease or substantially reduce their operations for an unknown period. In addition, individuals may have been laid off, been unable to work, or have had fewer work hours. Westpac has received requests for assistance from affected businesses and consumers and has implemented, and will continue to implement, various initiatives to support them, including repayment deferrals and interest capitalisation. These initiatives, and any support that governments or regulators may in the future require banks to provide to customers impacted by the COVID-19 pandemic, may have a negative impact on the Group’s financial performance and may see the Group assume greater risk than it would have under ordinary circumstances.
The long-term impact of the COVID-19 pandemic on customers and the magnitude of defaults or impairments is uncertain. For example, consumers may permanently decrease discretionary spending, which may increase the time it takes certain industries to recover.
Credit risk also arises from certain derivative, clearing and settlement contracts we enter into, and from our dealings in, and holdings of, debt securities issued by other institutions, the financial conditions of which may be affected to varying degrees by economic conditions in global financial markets.
For a discussion of our risk management, including the management of credit risk, refer to ‘Risk management’ section in our 2020 Annual Report and Note 21 to the financial statements in our 2020 Annual Report.
We face intense competition in all aspects of our businessThe financial services industry is highly competitive. We compete with a range of firms, including retail and commercial banks, investment banks, other financial service companies, fintech companies and businesses in other industries with financial services aspirations. This includes those competitors who are not subject to the same capital and regulatory requirements as us, which may allow those competitors to operate more flexibly.
Emerging competitors are increasingly altering the competitive environment by adopting new business models or seeking to use new technologies to disrupt existing business models.
The competitive environment may also change as a result of increased scrutiny by regulators in the sector and legislative reforms such as ‘Open Banking’, which will stimulate competition, improve customer choice and likely give rise to increased competition from new and existing firms.
Competition in the various markets in which we operate has led, and may continue to lead, to a decline in our margins or market share.
Deposits fund a significant portion of our balance sheet and have been a relatively stable source of funding. If we are not able to successfully compete for deposits this could increase our cost of funding, lead us to seek access to other types of funding or result in us reducing our lending.
Our ability to compete depends on our ability to offer products and services that meet evolving customer preferences. Not responding to changes in customer preferences could see us lose customers. This could adversely affect our business, prospects, financial performance or financial condition.
For more detail on how we address competitive pressures refer to ‘Competition’ in Section 1 in our 2020 Annual Report.
We could suffer losses due to market volatilityWe are exposed to market risk due to our financial markets businesses, our defined benefit plan and through asset and liability management (including through volatility in prices of equity securities we hold or are exposed to). Market risk is the risk of an adverse impact on earnings resulting from changes in market factors, such as foreign exchange rates, commodity prices, equity prices, and interest rates (including low or negative interest rates and any resulting pressure placed on the Group’s interest margins). This includes interest rate risk in the banking book due to a mismatch between the duration of assets and liabilities arising from the normal course of business activities.
Changes in markets could be driven by numerous developments. For example, the COVID-19 pandemic has resulted in significant market disruption and price volatility. Changes in central bank policy settings in response to the
92 WESTPAC GROUP 2021 INTERIM FINANCIAL REPORT
Directors’ report
economic recovery from the pandemic period have the potential to influence market liquidity and volatility. We could suffer substantial losses due to market volatility (including changes in the return on, value of or market for securities or other instruments), which may adversely affect our business, prospects, liquidity, capital resources, financial performance or financial condition.
The planned cessation of parts of the London Inter-bank Offered Rate (‘LIBOR’) regime from 1 January 2022, continuation of some U.S. Dollar LIBOR settings until 30 June 2023 and possible pre–cessation events will also continue to impact market pricing. Any future changes in the administration of LIBOR or other market benchmarks could have adverse consequences for the return on, value of and market for securities and other instruments linked to any such benchmark, including securities or other instruments issued by the Group. While we are monitoring our exposure to LIBOR, we remain dependent on market developments in relation to the LIBOR transition, which may have an impact on market pricing for, or valuations of, our LIBOR exposures.
For a discussion of our risk management procedures, including the management of market risk, refer to the ‘Risk management’ section in our 2020 Annual Report.
We have and could suffer losses due to operational risksOperational risk includes, among other things, reputational risk, technology risk, model risk and outsourcing risk, as well as the risk of business disruption due to external events such as natural disasters, or outbreaks of communicable diseases (such as the COVID-19 pandemic), environmental hazards, damage to critical utilities and targeted activism and protest activity. While we have policies, processes and controls in place to manage these risks, these have not always been, or may not be, effective.
Ineffective processes and controls have resulted in, and could result in, adverse outcomes for Westpac’s customers. For example, a process breakdown could result in a customer not receiving a product on the terms, conditions, or pricing they agreed to, potentially to the detriment of the customer. Failed processes could also result in Westpac incurring losses because we cannot enforce our contractual rights. This could occur because Westpac did not correctly document its rights or failed to perfect a security interest. These types of operational failures may also result in customer remediation and/or increased regulatory scrutiny and, depending on the nature of the failure, result in class action proceedings or a regulator commencing an investigation and/or taking other action.
We could incur losses from fraudulent applications for loans or from incorrect or fraudulent payments and settlements. Fraudulent conduct can also arise from external parties seeking to access the bank’s systems or customer accounts. If systems, procedures and protocols for managing fraud fail, or are ineffective, they could lead to losses which could adversely affect our customers, business, prospects, reputation, financial performance or financial condition.
Westpac is also exposed to model risk, being the risk of loss arising from errors or inadequacies in data or a model, or in the control and use of a model.
Financial services entities have been increasingly sharing data with third parties, such as suppliers and regulators, to conduct their business and meet regulatory obligations. Each third party can give rise to a variety of risks, including financial crime compliance, information security, cyber, privacy, regulatory compliance, environmental and business continuity risks. For example, a breakdown in a process or control related to the transfer, storage or protection of data sent to a third party, or the failure of a third party to use and handle this data correctly, could result in the Group failing to meet a compliance obligation (including relevant privacy obligations) and/or have an adverse impact on our customers and the Group.
Westpac also relies on a number of suppliers, both in Australia and overseas, to provide services to it and its customers. The COVID-19 pandemic has disrupted some suppliers and third-party contractors, and these disruptions may occur in the future. Failures by these third-party contractors and suppliers to deliver services as required could disrupt Westpac’s ability to provide its products and services and adversely impact our operations, financial performance or reputation.
Another possible source of disruption to the Group is central banks adopting negative interest rates. If this occurred, the technology systems used by the Group, its counterparties and/or financial infrastructure providers may not operate correctly and this may cause loss or damage to the Group and/or its counterparties.
For a discussion of our risk management procedures, including the management of operational risk, refer to the ‘Risk management’ section in our 2020 Annual Report.
Poor data quality could adversely affect our business and operationsAccurate, complete and reliable data, along with appropriate data control, retention and access frameworks and processes, is critical to Westpac’s business. Data plays a key role in how we provide products and services to customers, our systems, our risk management framework and our decision-making and strategic planning.
In some areas of our business, we are affected by poor data quality. This has occurred and could arise in the future in a number of ways, including through inadequacies in systems, processes and policies, or the ineffective implementation of data management frameworks.
Poor data quality could lead to poor customer service, negative risk management outcomes, and deficiencies in credit systems and processes. Any deficiency in credit systems and processes could, in turn, have a negative impact on Westpac’s decision making in the provision of credit and the terms on which it is provided. Westpac also needs accurate data for financial and other reporting.
93WESTPAC GROUP 2021 INTERIM FINANCIAL REPORT
1 1
23
45
67
Directors’ report
Poor data or poor data retention has affected, currently affects and may in the future continue to affect Westpac’s ability to meet its compliance obligations (including its regulatory reporting obligations) which could lead to a regulator taking action against us. For example, APRA has raised concerns regarding Westpac’s data quality, including missing data and its increasing trend of resubmissions. The RBA and ABS also footnote that they exclude Westpac data from certain economic and financial statistics reports.
Due to the importance of data, the Group has and will likely continue to incur substantial costs and devote significant effort to improving the quality of data and data frameworks and processes and remediating deficiencies where necessary. Some of our efforts to remediate data issues have been disrupted by the COVID-19 pandemic and if these are not fixed in a timely way could result in increased regulatory scrutiny and lead regulators to require the Group to remediate these issues within specific timeframes.
The consequences and effects arising from poor data quality or poor data retention could have an adverse impact on the Group’s business, operations, prospects, reputation, financial performance and/or financial condition.
Breakdowns in processes and procedures have required, and could in the future require, us to undertake remediation activityBreakdowns in Westpac’s processes and procedures have led to, and could in the future lead to, adverse outcomes for customers, employees or other third parties which Westpac is required to remediate.
The Group has, on a number of occasions, incurred significant remediation costs (including compensation payments and costs of correcting the issue), and there is a risk that similar issues will arise in the future that will require remediation.
There are significant challenges and risks involved in remediation activities. Westpac’s ability to investigate the underlying issue could be impeded if the issue is old and occurred beyond our record retention period, or our records are inadequate. It may also be difficult and take significant time to properly quantify and scope a remediation activity.
Determining how to compensate customers, employees or third parties properly and fairly can also be complicated, involving numerous stakeholders. The Group’s proposed approach to a remediation may be affected by a number of events, such as affected customers commencing a class action, or a regulator requiring a remediation to be done in a specific way or within a specific timeframe. These factors could delay Westpac in completing the remediation and may lead to a regulator commencing enforcement action against the Group. In turn, this could result in increased reputational risk, and we could be challenged by regulators, affected customers, the media and other stakeholders.
The significant challenges involved in scoping and executing remediations also create a risk that the remediation costs incurred will be higher than initially estimated. Further, delays in completing a remediation could result in Westpac incurring additional administration costs and making higher remediation payments to customers to reflect the time value of money.
If the Group cannot effectively scope, quantify or implement a remediation activity in a timely way, there could be an adverse impact on our business, prospects, reputation, financial performance or financial condition and could lead to further regulatory action and/or oversight.
Our failure to recruit and retain key executives, employees and Directors may have adverse effects on our businessKey executives, employees and Directors play an integral role in the operation of Westpac’s business and its pursuit of its strategic objectives. The unexpected departure of an individual in a key role, or the Group’s failure to recruit and retain appropriately skilled and qualified persons into these roles, could each have an adverse effect on our business, prospects, reputation, financial performance or financial condition.
We could suffer losses due to environmental factors or external eventsWe and our customers operate businesses and hold assets in a diverse range of geographic locations. Any significant environmental change or external event (including fire, storm, flood, earthquake, outbreaks or pandemics of communicable diseases such as the COVID-19 pandemic, civil unrest, war, heightened tension or terrorism) in any of these locations has the potential to disrupt business activities, damage property, affect asset values and impact our ability to recover amounts owing to us. In addition, such an event could have an adverse impact on economic activity, consumer and investor confidence or the levels of volatility in financial markets, all of which could adversely affect our business, prospects, financial performance or financial condition.
We could suffer losses due to insurance riskInsurance risk is the risk in our licensed regulated insurance entities of lapses being greater than expected, or the costs of claims being greater than expected due to a failure in product design, underwriting, reinsurance arrangements or an increase in the severity and/or frequency of insured events. A pandemic, such as COVID-19, and its economic impacts may lead to increased insurance claims, as well as potentially impact new business, lapses and capital coverage for the Group’s insurance entities. There is also a risk of policyholders or a Court interpreting policy wording differently to the way the Group or the industry has applied it to claims.
In life insurance, risk arises primarily through mortality and morbidity (illness and injury) risks, the costs of claims relating to those risks being greater than was anticipated and policy lapses.
94 WESTPAC GROUP 2021 INTERIM FINANCIAL REPORT
Directors’ report
In general insurance, insurance risk arises mainly through environmental events (including storms, floods and bushfires) and other calamities, such as earthquakes and tsunamis. The frequency and severity of these external events is difficult to predict and it is possible that pricing and reserving may not be adequate to cover the cost of claims that may arise.
In lenders mortgage insurance, insurance risk arises primarily from higher levels of mortgage defaults than expected, mostly from unemployment or other economic factors.
If our reinsurance arrangements are ineffective, this could lead to more retained losses than anticipated. The Group has been unable to, and may in the future be unable to, renew reinsurance arrangements on similar terms, including in relation to the cost, duration and amount of reinsurance cover provided. There is also a risk that we will not be able to obtain and have not obtained appropriate reinsurance or insurance coverage for the risks that the Group may be exposed to.
Changes in critical accounting estimates and judgements could expose the Group to lossesThe Group is required to make estimates, assumptions and judgements when applying accounting policies and preparing its financial statements, particularly in connection with the calculation of provisions (including remediation and expected credit losses) and the determination of the fair value of financial instruments. A change in a critical accounting estimate, assumption and/or judgement resulting from new information or from changes in circumstances or experience could result in the Group incurring losses greater than those anticipated or provided for.
If the Group’s actual and expected credit losses exceed those currently provided for, or if any of its other accounting judgements are found to be incorrect or change in the future, there could be an adverse effect on the Group’s financial performance, financial condition and reputation. The Group’s financial performance and financial condition may also be impacted by changes to accounting standards or to generally accepted accounting principles.
We could suffer losses due to impairment of capitalised software, goodwill and other intangible assets that may adversely affect our business, operations or financial conditionIn certain circumstances Westpac may incur a reduction in the value of intangible assets. At our balance date, Westpac’s intangible assets principally relate to goodwill and brand-names recognised on business acquisitions and capitalised software.
Westpac is required to assess the recoverability of goodwill and other intangible asset balances at least annually or wherever an indicator of impairment exists. For this purpose, Westpac uses a discounted cash flow calculation. Changes in the methodology or assumptions in calculations together with changes in expected cash flows, could materially impact this assessment.
Estimates and assumptions used in assessing the useful life of an asset can also be affected by a range of factors including changes in strategy, changes in technology and regulatory requirements.
In the event that an asset is no longer in use, or its value has been reduced or that its estimated useful life has declined, an impairment will be recorded, adversely impacting the Group’s financial performance.
We could suffer losses if we fail to syndicate or sell down underwritten securitiesAs a financial intermediary, we underwrite listed and unlisted debt and equity securities. We could suffer losses if we fail to syndicate or sell down this risk to others. This risk is more pronounced in times of heightened market volatility, such as during the COVID-19 pandemic.
Certain strategic decisions may have adverse effects on our businessThe Group routinely evaluates and implements strategic decisions and objectives including diversification, innovation, divestment, acquisitions or business expansion initiatives.
The expansion or integration of a new business, or entry into a new business, can be complex and costly.
Westpac also acquires and invests in businesses. These transactions involve a number of risks and costs. For example, a business Westpac invests in may not perform as anticipated or may ultimately prove to have been overvalued when the transaction was entered into.
In addition, we have established the Specialist Business Division to manage (and exit) a number of non-core businesses and assets. There is a risk that we may be unable to successfully divest these businesses and assets, or unable to successfully do so in a timely manner. As a result we may not receive the anticipated positive business results or we may undervalue the divestment, and the Group could otherwise be adversely affected. For example, divestments may cause us reputational damage, or we may experience difficulties in separating businesses, disruptions to operations, diversion of management resources and higher than expected transaction costs.
95WESTPAC GROUP 2021 INTERIM FINANCIAL REPORT
1 1
23
45
67
Directors’ report
Multiple divestments and/or acquisitions at the same time may intensify these risks.
In addition, warranties and other contractual commitments (including transitional services) and claims under indemnities provided by Westpac to counterparties may result in Westpac being liable to such counterparties and APRA may require additional operating risk capital to be held against the risk.
If the Group decides to pursue the demerger of its New Zealand business there is a risk that the demerger does not proceed due to a range of factors including it not being approved by shareholders, regulators or the Court and, if it did occur, a number or risks could arise including that the combined market value of the two entities could be less than the market value of Westpac before the demerger, a loss of diversification benefits, a loss of customers, increased costs from separating the businesses, changes in regulatory capital levels for both the Group and Westpac New Zealand Limited (WNZL) and it is likely that credit ratings for WNZL would be negatively impacted due to the removal of implicit financial support by the Group which could increase borrowing costs and impact liquidity levels.
There are also risks involved in failing to appropriately respond to changes in the business environment (including changes related to economic, geopolitical, regulatory, technological, environmental, social and competitive factors). This could have a range of adverse effects on us, such as being unable to increase or maintain market share and placing pressure on margins and fees.
Any of these risks could have a negative impact on the Group’s business, prospects, reputation, engagement with regulators, financial performance or financial condition.
Rounding of amountsASIC Corporations (Rounding in Financial/Directors’ Reports) Instruments 2016/191 applies to Westpac and in accordance with that Legislative Instrument all amounts have been rounded to the nearest million dollars unless otherwise stated.
96 WESTPAC GROUP 2021 INTERIM FINANCIAL REPORT
Directors’ report
PricewaterhouseCoopers, ABN 52 780 433 757 One International Towers Sydney, Watermans Quay, Barangaroo, GPO BOX 2650, SYDNEY NSW 2001 T: +61 2 8266 0000, F: +61 2 8266 9999, www.pwc.com.au
Liability limited by a scheme approved under Professional Standards Legislation.
Auditor’s independence declaration
97WESTPAC GROUP 2021 INTERIM FINANCIAL REPORT
1 1
23
45
67
Directors’ report
Responsibility statementThe Directors of Westpac Banking Corporation confirm that to the best of their knowledge:
(i) the interim financial statements have been prepared in accordance with AASB 134 Interim Financial Reporting and are in compliance with IAS 34 Interim Financial Reporting issued by the International Accounting Standards Board; and
(ii) the Directors’ Report includes a fair review of the information required by DTR 4.2.7 R of the Disclosure Guidance and Transparency Rules of the United Kingdom Financial Conduct Authority.
Signed in accordance with a resolution of the Board of Directors.
John McFarlane Peter KingChairman Managing Director and Chief Executive OfficerSydney, Australia2 May 2021
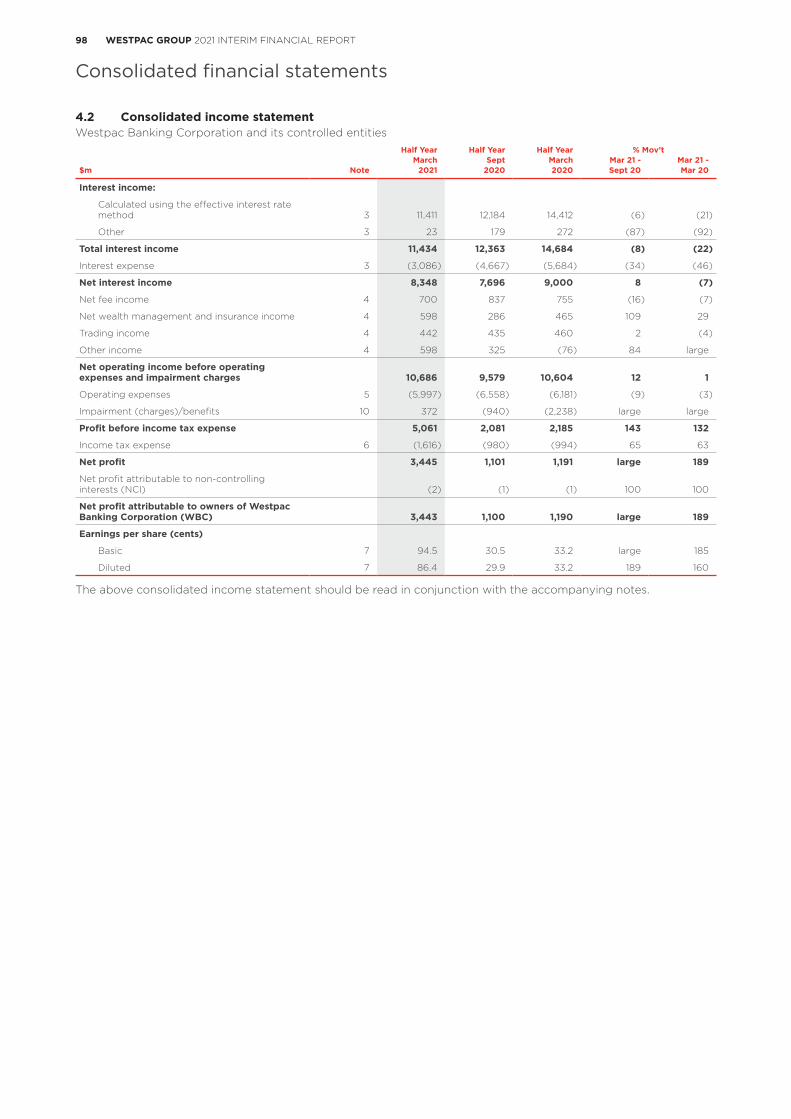
98 WESTPAC GROUP 2021 INTERIM FINANCIAL REPORT
Consolidated financial statements
4.2 Consolidated income statementWestpac Banking Corporation and its controlled entities
Half Year Half Year Half Year % Mov’tMarch Sept March Mar 21 - Mar 21 -
$m Note 2021 2020 2020 Sept 20 Mar 20
Interest income:
Calculated using the effective interest rate method 3 11,411 12,184 14,412 (6) (21)
Other 3 23 179 272 (87) (92)
Total interest income 11,434 12,363 14,684 (8) (22)
Interest expense 3 (3,086) (4,667) (5,684) (34) (46)
Net interest income 8,348 7,696 9,000 8 (7)
Net fee income 4 700 837 755 (16) (7)
Net wealth management and insurance income 4 598 286 465 109 29
Trading income 4 442 435 460 2 (4)
Other income 4 598 325 (76) 84 large
Net operating income before operating expenses and impairment charges 10,686 9,579 10,604 12 1
Operating expenses 5 (5,997) (6,558) (6,181) (9) (3)
Impairment (charges)/benefits 10 372 (940) (2,238) large large
Profit before income tax expense 5,061 2,081 2,185 143 132
Income tax expense 6 (1,616) (980) (994) 65 63
Net profit 3,445 1,101 1,191 large 189
Net profit attributable to non-controlling interests (NCI) (2) (1) (1) 100 100
Net profit attributable to owners of Westpac Banking Corporation (WBC) 3,443 1,100 1,190 large 189
Earnings per share (cents)
Basic 7 94.5 30.5 33.2 large 185
Diluted 7 86.4 29.9 33.2 189 160
The above consolidated income statement should be read in conjunction with the accompanying notes.
Consolidated financial statements
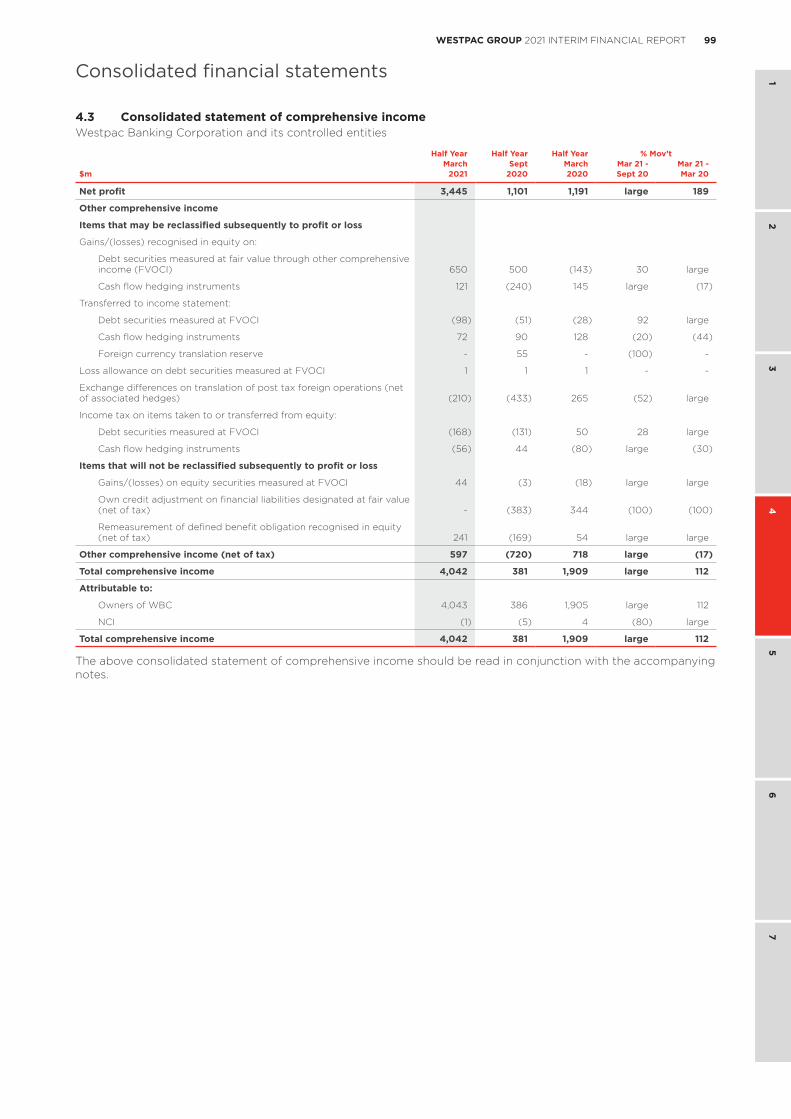
99WESTPAC GROUP 2021 INTERIM FINANCIAL REPORT
1 2
34
56
7
Consolidated financial statements
4.3 Consolidated statement of comprehensive incomeWestpac Banking Corporation and its controlled entities
Half Year Half Year Half Year % Mov’tMarch Sept March Mar 21 - Mar 21 -
$m 2021 2020 2020 Sept 20 Mar 20
Net profit 3,445 1,101 1,191 large 189
Other comprehensive income
Items that may be reclassified subsequently to profit or loss
Gains/(losses) recognised in equity on:
Debt securities measured at fair value through other comprehensive income (FVOCI) 650 500 (143) 30 large
Cash flow hedging instruments 121 (240) 145 large (17)
Transferred to income statement:
Debt securities measured at FVOCI (98) (51) (28) 92 large
Cash flow hedging instruments 72 90 128 (20) (44)
Foreign currency translation reserve - 55 - (100) -
Loss allowance on debt securities measured at FVOCI 1 1 1 - -
Exchange differences on translation of post tax foreign operations (net of associated hedges) (210) (433) 265 (52) large
Income tax on items taken to or transferred from equity:
Debt securities measured at FVOCI (168) (131) 50 28 large
Cash flow hedging instruments (56) 44 (80) large (30)
Items that will not be reclassified subsequently to profit or loss
Gains/(losses) on equity securities measured at FVOCI 44 (3) (18) large large
Own credit adjustment on financial liabilities designated at fair value (net of tax) - (383) 344 (100) (100)
Remeasurement of defined benefit obligation recognised in equity (net of tax) 241 (169) 54 large large
Other comprehensive income (net of tax) 597 (720) 718 large (17)
Total comprehensive income 4,042 381 1,909 large 112
Attributable to:
Owners of WBC 4,043 386 1,905 large 112
NCI (1) (5) 4 (80) large
Total comprehensive income 4,042 381 1,909 large 112
The above consolidated statement of comprehensive income should be read in conjunction with the accompanying notes.
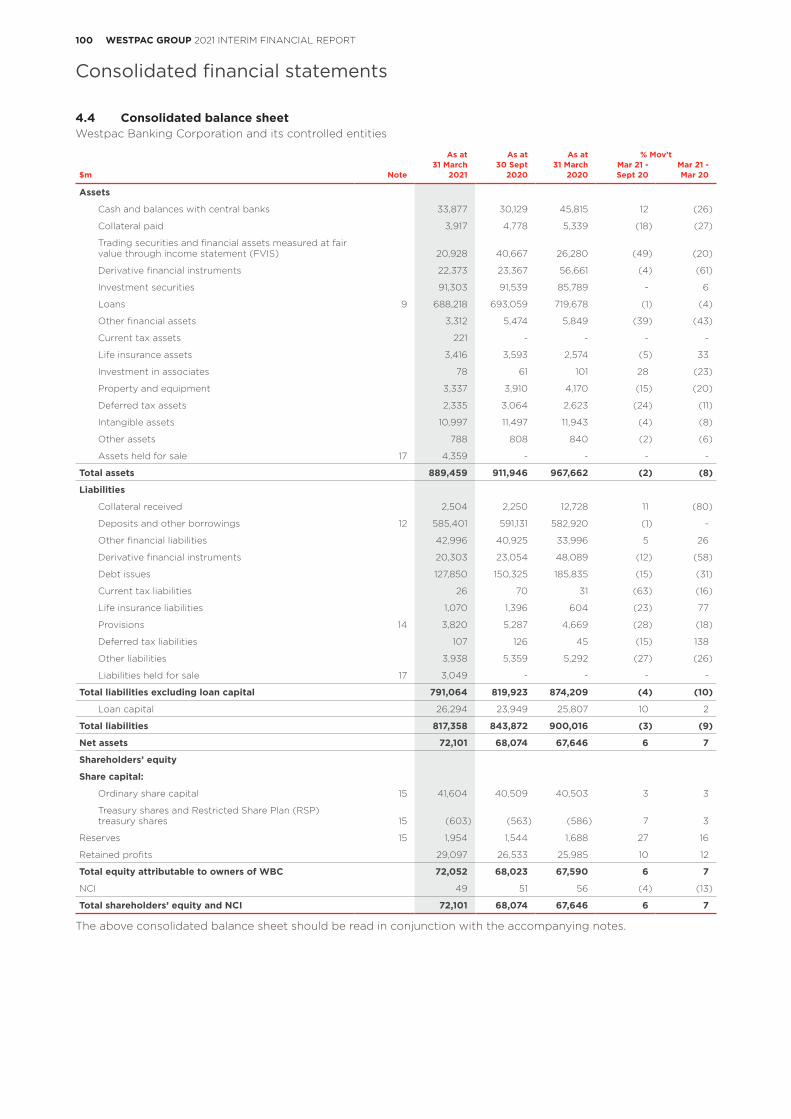
100 WESTPAC GROUP 2021 INTERIM FINANCIAL REPORT
Consolidated financial statements
4.4 Consolidated balance sheetWestpac Banking Corporation and its controlled entities
As at As at As at % Mov’t31 March 30 Sept 31 March Mar 21 - Mar 21 -
$m Note 2021 2020 2020 Sept 20 Mar 20
Assets
Cash and balances with central banks 33,877 30,129 45,815 12 (26)
Collateral paid 3,917 4,778 5,339 (18) (27)
Trading securities and financial assets measured at fair value through income statement (FVIS) 20,928 40,667 26,280 (49) (20)
Derivative financial instruments 22,373 23,367 56,661 (4) (61)
Investment securities 91,303 91,539 85,789 - 6
Loans 9 688,218 693,059 719,678 (1) (4)
Other financial assets 3,312 5,474 5,849 (39) (43)
Current tax assets 221 - - - -
Life insurance assets 3,416 3,593 2,574 (5) 33
Investment in associates 78 61 101 28 (23)
Property and equipment 3,337 3,910 4,170 (15) (20)
Deferred tax assets 2,335 3,064 2,623 (24) (11)
Intangible assets 10,997 11,497 11,943 (4) (8)
Other assets 788 808 840 (2) (6)
Assets held for sale 17 4,359 - - - -
Total assets 889,459 911,946 967,662 (2) (8)
Liabilities
Collateral received 2,504 2,250 12,728 11 (80)
Deposits and other borrowings 12 585,401 591,131 582,920 (1) -
Other financial liabilities 42,996 40,925 33,996 5 26
Derivative financial instruments 20,303 23,054 48,089 (12) (58)
Debt issues 127,850 150,325 185,835 (15) (31)
Current tax liabilities 26 70 31 (63) (16)
Life insurance liabilities 1,070 1,396 604 (23) 77
Provisions 14 3,820 5,287 4,669 (28) (18)
Deferred tax liabilities 107 126 45 (15) 138
Other liabilities 3,938 5,359 5,292 (27) (26)
Liabilities held for sale 17 3,049 - - - -
Total liabilities excluding loan capital 791,064 819,923 874,209 (4) (10)
Loan capital 26,294 23,949 25,807 10 2
Total liabilities 817,358 843,872 900,016 (3) (9)
Net assets 72,101 68,074 67,646 6 7
Shareholders’ equity
Share capital:
Ordinary share capital 15 41,604 40,509 40,503 3 3
Treasury shares and Restricted Share Plan (RSP) treasury shares 15 (603) (563) (586) 7 3
Reserves 15 1,954 1,544 1,688 27 16
Retained profits 29,097 26,533 25,985 10 12
Total equity attributable to owners of WBC 72,052 68,023 67,590 6 7
NCI 49 51 56 (4) (13)
Total shareholders’ equity and NCI 72,101 68,074 67,646 6 7
The above consolidated balance sheet should be read in conjunction with the accompanying notes.
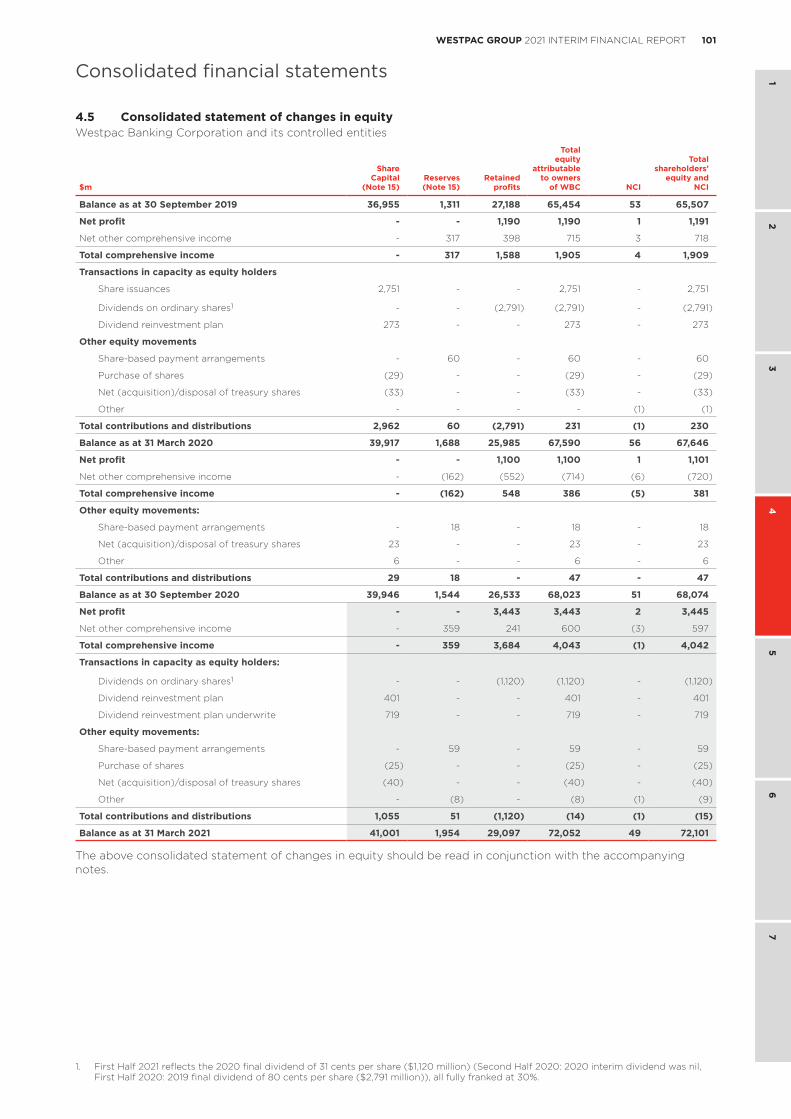
101WESTPAC GROUP 2021 INTERIM FINANCIAL REPORT
1 2
34
56
7
Consolidated financial statements
4.5 Consolidated statement of changes in equityWestpac Banking Corporation and its controlled entities
$m
Share Capital
(Note 15) Reserves (Note 15)
Retained profits
Total equity
attributable to owners
of WBC NCI
Total shareholders’
equity and NCI
Balance as at 30 September 2019 36,955 1,311 27,188 65,454 53 65,507
Net profit - - 1,190 1,190 1 1,191
Net other comprehensive income - 317 398 715 3 718
Total comprehensive income - 317 1,588 1,905 4 1,909
Transactions in capacity as equity holders
Share issuances 2,751 - - 2,751 - 2,751
Dividends on ordinary shares1 - - (2,791) (2,791) - (2,791)
Dividend reinvestment plan 273 - - 273 - 273
Other equity movements
Share-based payment arrangements - 60 - 60 - 60
Purchase of shares (29) - - (29) - (29)
Net (acquisition)/disposal of treasury shares (33) - - (33) - (33)
Other - - - - (1) (1)
Total contributions and distributions 2,962 60 (2,791) 231 (1) 230
Balance as at 31 March 2020 39,917 1,688 25,985 67,590 56 67,646
Net profit - - 1,100 1,100 1 1,101
Net other comprehensive income - (162) (552) (714) (6) (720)
Total comprehensive income - (162) 548 386 (5) 381
Other equity movements:
Share-based payment arrangements - 18 - 18 - 18
Net (acquisition)/disposal of treasury shares 23 - - 23 - 23
Other 6 - - 6 - 6
Total contributions and distributions 29 18 - 47 - 47
Balance as at 30 September 2020 39,946 1,544 26,533 68,023 51 68,074
Net profit - - 3,443 3,443 2 3,445
Net other comprehensive income - 359 241 600 (3) 597
Total comprehensive income - 359 3,684 4,043 (1) 4,042
Transactions in capacity as equity holders:
Dividends on ordinary shares1 - - (1,120) (1,120) - (1,120)
Dividend reinvestment plan 401 - - 401 - 401
Dividend reinvestment plan underwrite 719 - - 719 - 719
Other equity movements:
Share-based payment arrangements - 59 - 59 - 59
Purchase of shares (25) - - (25) - (25)
Net (acquisition)/disposal of treasury shares (40) - - (40) - (40)
Other - (8) - (8) (1) (9)
Total contributions and distributions 1,055 51 (1,120) (14) (1) (15)
Balance as at 31 March 2021 41,001 1,954 29,097 72,052 49 72,101
The above consolidated statement of changes in equity should be read in conjunction with the accompanying notes.
1. First Half 2021 reflects the 2020 final dividend of 31 cents per share ($1,120 million) (Second Half 2020: 2020 interim dividend was nil, First Half 2020: 2019 final dividend of 80 cents per share ($2,791 million)), all fully franked at 30%.
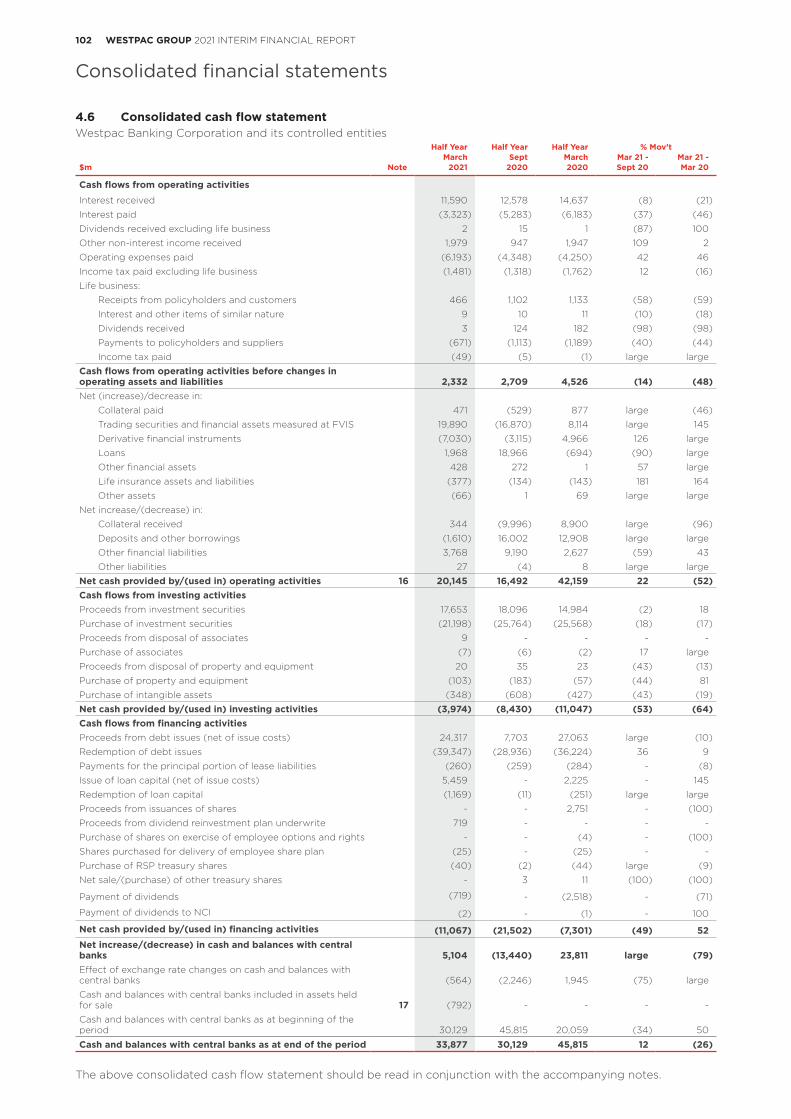
102 WESTPAC GROUP 2021 INTERIM FINANCIAL REPORT
Consolidated financial statements
4.6 Consolidated cash flow statement Westpac Banking Corporation and its controlled entities
Half Year Half Year Half Year % Mov’tMarch Sept March Mar 21 - Mar 21 -
$m Note 2021 2020 2020 Sept 20 Mar 20
Cash flows from operating activities
Interest received 11,590 12,578 14,637 (8) (21)
Interest paid (3,323) (5,283) (6,183) (37) (46)
Dividends received excluding life business 2 15 1 (87) 100
Other non-interest income received 1,979 947 1,947 109 2
Operating expenses paid (6,193) (4,348) (4,250) 42 46
Income tax paid excluding life business (1,481) (1,318) (1,762) 12 (16)
Life business:
Receipts from policyholders and customers 466 1,102 1,133 (58) (59)
Interest and other items of similar nature 9 10 11 (10) (18)
Dividends received 3 124 182 (98) (98)
Payments to policyholders and suppliers (671) (1,113) (1,189) (40) (44)
Income tax paid (49) (5) (1) large large
Cash flows from operating activities before changes in operating assets and liabilities 2,332 2,709 4,526 (14) (48)Net (increase)/decrease in:
Collateral paid 471 (529) 877 large (46)
Trading securities and financial assets measured at FVIS 19,890 (16,870) 8,114 large 145
Derivative financial instruments (7,030) (3,115) 4,966 126 large
Loans 1,968 18,966 (694) (90) large
Other financial assets 428 272 1 57 large
Life insurance assets and liabilities (377) (134) (143) 181 164
Other assets (66) 1 69 large large
Net increase/(decrease) in:
Collateral received 344 (9,996) 8,900 large (96)
Deposits and other borrowings (1,610) 16,002 12,908 large large
Other financial liabilities 3,768 9,190 2,627 (59) 43
Other liabilities 27 (4) 8 large large
Net cash provided by/(used in) operating activities 16 20,145 16,492 42,159 22 (52)Cash flows from investing activitiesProceeds from investment securities 17,653 18,096 14,984 (2) 18
Purchase of investment securities (21,198) (25,764) (25,568) (18) (17)
Proceeds from disposal of associates 9 - - - -
Purchase of associates (7) (6) (2) 17 large
Proceeds from disposal of property and equipment 20 35 23 (43) (13)
Purchase of property and equipment (103) (183) (57) (44) 81
Purchase of intangible assets (348) (608) (427) (43) (19)
Net cash provided by/(used in) investing activities (3,974) (8,430) (11,047) (53) (64)Cash flows from financing activitiesProceeds from debt issues (net of issue costs) 24,317 7,703 27,063 large (10)
Redemption of debt issues (39,347) (28,936) (36,224) 36 9
Payments for the principal portion of lease liabilities (260) (259) (284) - (8)
Issue of loan capital (net of issue costs) 5,459 - 2,225 - 145
Redemption of loan capital (1,169) (11) (251) large large
Proceeds from issuances of shares - - 2,751 - (100)
Proceeds from dividend reinvestment plan underwrite 719 - - - -
Purchase of shares on exercise of employee options and rights - - (4) - (100)
Shares purchased for delivery of employee share plan (25) - (25) - -
Purchase of RSP treasury shares (40) (2) (44) large (9)
Net sale/(purchase) of other treasury shares - 3 11 (100) (100)
Payment of dividends (719) - (2,518) - (71)
Payment of dividends to NCI (2) - (1) - 100
Net cash provided by/(used in) financing activities (11,067) (21,502) (7,301) (49) 52 Net increase/(decrease) in cash and balances with central banks 5,104 (13,440) 23,811 large (79)Effect of exchange rate changes on cash and balances with central banks (564) (2,246) 1,945 (75) large
Cash and balances with central banks included in assets held for sale 17 (792) - - - -
Cash and balances with central banks as at beginning of the period 30,129 45,815 20,059 (34) 50
The above consolidated cash flow statement should be read in conjunction with the accompanying notes.
Cash and balances with central banks as at end of the period 33,877 30,129 45,815 12 (26)
103WESTPAC GROUP 2021 INTERIM FINANCIAL REPORT
1 2
34
56
7
Notes to the consolidated financial statements
4.7 Notes to the consolidated financial statements
Note 1. Financial statements preparationThis general purpose Interim Financial Report for the half year ended 31 March 2021 has been prepared in accordance with Australian Accounting Standard AASB 134 Interim Financial Reporting and the Corporations Act 2001 (Cth) and is also compliant with International Accounting Standard IAS 34 Interim Financial Reporting.
The Interim Financial Report does not include all the notes of the type normally included in an annual financial report. Accordingly, this Interim Financial Report is to be read in conjunction with the Annual Financial Report for the year ended 30 September 2020 and any relevant public announcements made by Westpac during the interim reporting period in accordance with the continuous disclosure requirements of the Corporations Act 2001 (Cth) and the ASX Listing Rules.
The Interim Financial Report complies with current Australian Accounting Standards (AAS) as they relate to interim financial reports.
The Interim Financial Report was authorised for issue by the Board of Directors on 2 May 2021.
All amounts have been rounded in accordance with ASIC Corporations (Rounding in Financial/Directors’ Reports) Instrument 2016/191, to the nearest million dollars, unless otherwise stated.
Accounting policiesThe accounting policies adopted in the preparation of this interim financial report are consistent with those in the Annual Financial Report for the year ended 30 September 2020.
As assets and liabilities held for sale are now a material balance they have been separately presented in the balance sheet and in Note 17. The accounting policy for assets and liabilities held for sale is below:
Assets and liabilities held for sale
Non-current assets or disposal groups are classified as held for sale if they will be recovered primarily through sale rather than through continuing use and a sale is considered highly probable. Non-current assets or disposal groups held for sale are measured at the lower of their existing carrying amount and fair value less costs to sell, except for liabilities and certain assets such as deferred tax assets, financial assets and contractual rights under insurance contracts, which are specifically exempt from this requirement and continue to be recognised at their existing carrying value.
An impairment loss is recognised for any initial or subsequent write-down of the asset (or disposal group) to fair value less costs to sell. A gain is recognised for any subsequent increases in fair value less costs to sell of an asset (or disposal group), but not in excess of any cumulative impairment loss previously recognised. A gain or loss not previously recognised by the date of the sale of the non-current asset (or disposal group) is recognised at the date of derecognition.
Non-current assets are not depreciated or amortised while they are classified as held for sale. Non-current assets classified as held for sale and the assets of a disposal group classified as held for sale are presented separately from the other assets in the balance sheet. The liabilities of a disposal group classified as held for sale are presented separately from other liabilities in the balance sheet.
Refer to Note 17 for further details.
Critical accounting assumptions and estimatesIn preparing the Interim Financial Report, the application of the Group’s accounting policies requires the use of judgement, assumptions and estimates.
The areas of judgement, assumptions and estimates in the Interim Financial Report, including the key sources of estimation uncertainty, are consistent with those in the Annual Financial Report for the year ended 30 September 2020 except for as noted below:
Provisions for expected credit losses (ECL)
Details on specific judgements in relation to the impact of COVID-19 on the calculation of provisions for ECL are included in Note 10.
Compliance, regulation and remediation provisions
Details on specific judgements in relation to material compliance, regulation and remediation provisions are included in Note 14.
Intangible assets - computer software
Effective from 1 October 2020, the Group made a prospective change to computer software capitalisation by increasing the threshold for capitalisation for software development costs from a total project spend of $1 million to a total project spend of $20 million. This does not have a material impact on the Group’s financial statements. This change increased operating expenses and reduced profit before income tax in the period by $93 million.
Amendments to Accounting Standards effective this periodA revised Conceptual Framework (Framework) was adopted by the Group on 1 October 2020. The Framework includes new definitions and recognition criteria for assets, liabilities, income and expenses and other relevant financial reporting concepts. These changes did not have a material impact on the Group.
Notes to the consolidated financial statements
104 WESTPAC GROUP 2021 INTERIM FINANCIAL REPORT
Notes to the consolidated financial statements
Future developments in accounting standardsThe following new standards and interpretations which may have a material impact on the Group have been issued but are not yet effective, and unless otherwise stated, have not been early adopted by the Group:
AASB 17 Insurance Contracts (AASB 17) was issued on 19 July 2017 and will be effective for the 30 September 2022 year end unless early adopted. This will replace AASB 4 Insurance Contracts (AASB 4), AASB 1023 General Insurance Contracts and AASB 1038 Life Insurance Contracts. The main changes under the standard are:
• the scope of the standard may result in some contracts that are currently “unbundled”, i.e. accounted for separately as insurance and investment contracts being required to be “bundled” and accounted for as an insurance contract;
• portfolios of contracts (with similar risks which are managed together) will be required to be disaggregated to a more granular level by both the age of a contract and the likelihood of the contract being onerous in order to determine the recognition of profit over the contract period (i.e. the contractual service margin). The contractual service margin uses a different basis to recognise profit to the current Margin on Services approach for life insurance and therefore the pattern of profit recognition is likely to differ;
• risk adjustments, which reflect uncertainties in the amount and timing of future cash flows, are required for both general and life insurance contracts rather than just general insurance contracts under the current accounting standards;
• the contract boundary, which is the period over which profit is recognised, differs and is determined based on the ability to compel the policyholder to pay premiums or the substantive obligation to provide coverage/ services. For some general insurance contracts (e.g. some lender mortgage insurance and reinsurance contracts) this may result in the contract boundary being longer. For life insurance, in particular term renewable contracts, the contract boundary is expected to be shorter. Both will be impacted by different patterns of profit recognition compared to the current standards;
• a narrower definition of what acquisition costs may be deferred;
• an election to recognise changes in assumptions regarding discount rate in OCI rather than in income statement;
• an election to recognise changes in the fair value of assets supporting policy liabilities in OCI rather than through the income statement;
• reinsurance contracts and the associated liability are to be determined separately to the gross contract liability and may have different contract boundaries; and
• additional disclosure requirements.
The standard is expected to result in a reduction in the level of deferred acquisition costs, however the quantum of this and the income statement impacts to the Group are not yet practicable to determine.
AASB 2020-5 Amendments to Australian Accounting Standards – Insurance Contracts was issued on 30 July 2020. This standard includes a number of amendments to AASB 17. These amendments include:
• deferral of acquisition costs for anticipated renewals outside of the initial contract boundary;
• further clarity on the contractual service margin;
• additional scope exclusion for credit card contracts and similar contracts that provide insurance coverage as well as optional scope exclusion for loan contracts that transfer significant insurance risk;
• ability to recognise a gain in the income statement for reinsurance contracts, to offset losses from onerous contracts on initial recognition;
• simplified presentation requirements; and
• additional transitional relief.
In addition, the effective date of AASB 17 will be deferred by two years to be applicable to the Group for the 30 September 2024 financial year.
On 22 September 2020, the AASB issued AASB 2020-8 Amendments to Australian Accounting Standards – Interest Rate Benchmark Reform – Phase 2 which makes further amendments to AASB 9, AASB 139, and AASB 7 resulting from IBOR reform. Amendments are also made to AASB 4 and AASB 16. The standard is effective for the 30 September 2022 year end unless early adopted. The amendments:
• allow the Group to account for a change in contractual cash flows of a financial instrument or lease liability that result specifically from IBOR reform by updating the effective interest rate rather than recognising a modification gain or loss;
• allow the Group to continue hedge accounting and not trigger a de-designation when the following occurs specific to IBOR reform:
– changes to hedge documentation to update the hedged risk, item and instrument;
– changes to the method of assessing hedge ineffectiveness;
– once the hedge relationship has been converted from LIBOR to ARR the cumulative change in fair value for ineffectiveness testing could be reset to zero if this would improve the retrospective effectiveness test;
Note 1. Financial statements preparation (continued)
105WESTPAC GROUP 2021 INTERIM FINANCIAL REPORT
1 2
34
56
7
Notes to the consolidated financial statements
– this amendment can apply to macro cash flow and fair value hedges where subgroups can be formed within the portfolio of hedges where some are under the existing LIBOR rate and others have already changed to the ARR;
• require additional disclosures including:
– quantitative information regarding all financial instruments linked to LIBOR which have not been yet converted to ARR;
– changes to the entity’s risk management strategy arising from IBOR reform; and
– the management of the Group’s transition to ARR.
The Group is considering whether it will early adopt the amendments in its Annual Financial Report for the year ended 30 September 2021.
Other amendments to existing standards that are not yet effective are not expected to have a material impact to the Group.
Note 2. Segment reportingOperating segments are presented on a basis consistent with information provided internally to Westpac’s key decision makers and reflects the management of the business, rather than the legal structure of the Group.
Internally, Westpac uses ‘cash earnings’ in assessing the financial performance of its divisions. Management believes this allows the Group to:
• more effectively assess current year performance against prior periods;
• compare performance across business divisions; and
• compare performance across peer companies.
Cash earnings is viewed as a measure of the level of profit that is generated by ongoing operations and is therefore typically considered in assessing distributions, including dividends. Cash earnings is neither a measure of cash flow nor net profit determined on a cash accounting basis, as it includes both cash and non-cash adjustments to statutory net profit.
To determine cash earnings, three categories of adjustments are made to statutory results:
• material items that key decision makers at Westpac believe do not reflect ongoing operations;
• items that are not typically considered when dividends are recommended, mainly economic hedging impacts; and
• accounting reclassifications between individual line items that do not impact statutory results.
Reportable operating segmentsWe are one of Australia and New Zealand’s leading providers of financial services, operating under multiple brands, with a small presence in Europe, North America and Asia. We operate through an extensive branch and ATM network, significant online capability, and call centres supported by specialist relationship and product managers. Our operations comprise the following key divisions:• Consumer provides banking products and services to personal customers, including mortgages, credit cards,
personal loans, and savings and deposit products.• Business serves the banking needs of SME and Commercial customers (including Agribusiness) and provides
banking and advisory services to high net worth individuals through Private Wealth.• Westpac Institutional Bank (WIB) provides a broad range of financial products and services to corporate,
institutional and government customers.• Westpac New Zealand provides banking, wealth and insurance products and services for consumer, business
and institutional customers in New Zealand. • Specialist Businesses provides auto finance, Australian life, general and lenders mortgage insurance, investment
product and services (including margin lending and equities broking), superannuation and retirement products as well as wealth administration platforms. It also manages Westpac Pacific which provides a full range of banking services in Fiji and Papua New Guinea. Westpac has announced it has entered into a sales agreement for Westpac Pacific, Westpac Vendor Finance business, Westpac General Insurance, and Westpac Lenders Mortgage Insurance. These sales are expected to finalise in 2021, subject to regulator approvals.
• Group Businesses includes the results of unallocated support functions such as Treasury, Technology and Operations, and Core Support. It also includes Group-wide elimination entries arising on consolidation, centrally raised provisions and other unallocated revenue and expenses.
On 17 March 2021, Westpac announced that it was bringing together the leadership of its Consumer and Business divisions into a new Consumer and Business Banking division. For the 2021 Interim Financial Report there will be no change in how we report our Consumer and Business divisions’ performance as there has been no change to the performance information provided internally to Westpac’s key decision makers.
Note 1. Financial statements preparation (continued)
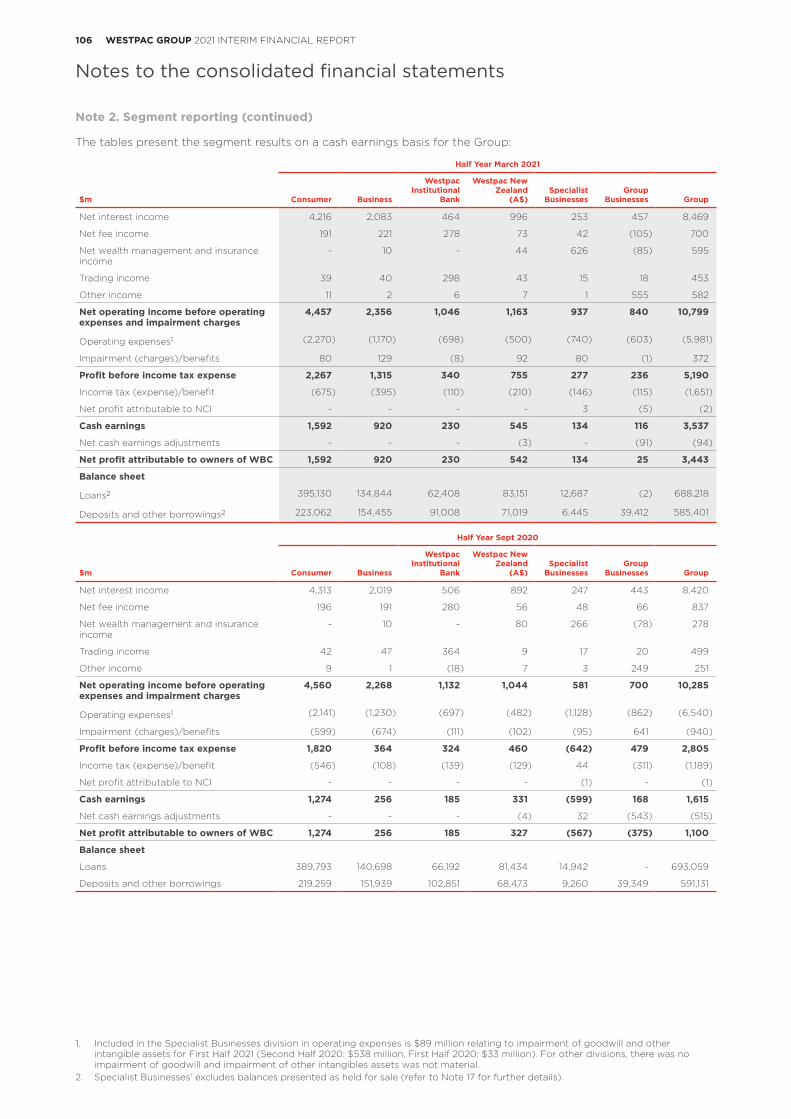
106 WESTPAC GROUP 2021 INTERIM FINANCIAL REPORT
Notes to the consolidated financial statements
The tables present the segment results on a cash earnings basis for the Group:
Half Year March 2021
Consumer Business
Westpac Institutional
Bank
Westpac New Zealand
(A$)Group
Businesses Group$mSpecialist
Businesses
Net interest income 4,216 2,083 464 996 253 457 8,469
Net fee income 191 221 278 73 42 (105) 700
Net wealth management and insurance income
- 10 - 44 626 (85) 595
Trading income 39 40 298 43 15 18 453
Other income 11 2 6 7 1 555 582
Net operating income before operating expenses and impairment charges
4,457 2,356 1,046 1,163 937 840 10,799
Operating expenses1 (2,270) (1,170) (698) (500) (740) (603) (5,981)
Impairment (charges)/benefits 80 129 (8) 92 80 (1) 372
Profit before income tax expense 2,267 1,315 340 755 277 236 5,190
Income tax (expense)/benefit (675) (395) (110) (210) (146) (115) (1,651)
Net profit attributable to NCI - - - - 3 (5) (2)
Cash earnings 1,592 920 230 545 134 116 3,537
Net cash earnings adjustments - - - (3) - (91) (94)
Net profit attributable to owners of WBC 1,592 920 230 542 134 25 3,443
Balance sheet
Loans2 395,130 134,844 62,408 83,151 12,687 (2) 688,218
Deposits and other borrowings2 223,062 154,455 91,008 71,019 6,445 39,412 585,401
Half Year Sept 2020
Consumer Business
Westpac Institutional
Bank
Westpac New Zealand
(A$)Group
Businesses Group$mSpecialist
Businesses
Net interest income 4,313 2,019 506 892 247 443 8,420
Net fee income 196 191 280 56 48 66 837
Net wealth management and insurance income
- 10 - 80 266 (78) 278
Trading income 42 47 364 9 17 20 499
Other income 9 1 (18) 7 3 249 251
Net operating income before operating expenses and impairment charges
4,560 2,268 1,132 1,044 581 700 10,285
Operating expenses1 (2,141) (1,230) (697) (482) (1,128) (862) (6,540)
Impairment (charges)/benefits (599) (674) (111) (102) (95) 641 (940)
Profit before income tax expense 1,820 364 324 460 (642) 479 2,805
Income tax (expense)/benefit (546) (108) (139) (129) 44 (311) (1,189)
Net profit attributable to NCI - - - - (1) - (1)
Cash earnings 1,274 256 185 331 (599) 168 1,615
Net cash earnings adjustments - - - (4) 32 (543) (515)
Net profit attributable to owners of WBC 1,274 256 185 327 (567) (375) 1,100
Balance sheet
Loans 389,793 140,698 66,192 81,434 14,942 - 693,059
Deposits and other borrowings 219,259 151,939 102,851 68,473 9,260 39,349 591,131
Note 2. Segment reporting (continued)
1. Included in the Specialist Businesses division in operating expenses is $89 million relating to impairment of goodwill and other intangible assets for First Half 2021 (Second Half 2020: $538 million, First Half 2020: $33 million). For other divisions, there was no impairment of goodwill and impairment of other intangibles assets was not material.
2. Specialist Businesses’ excludes balances presented as held for sale (refer to Note 17 for further details).
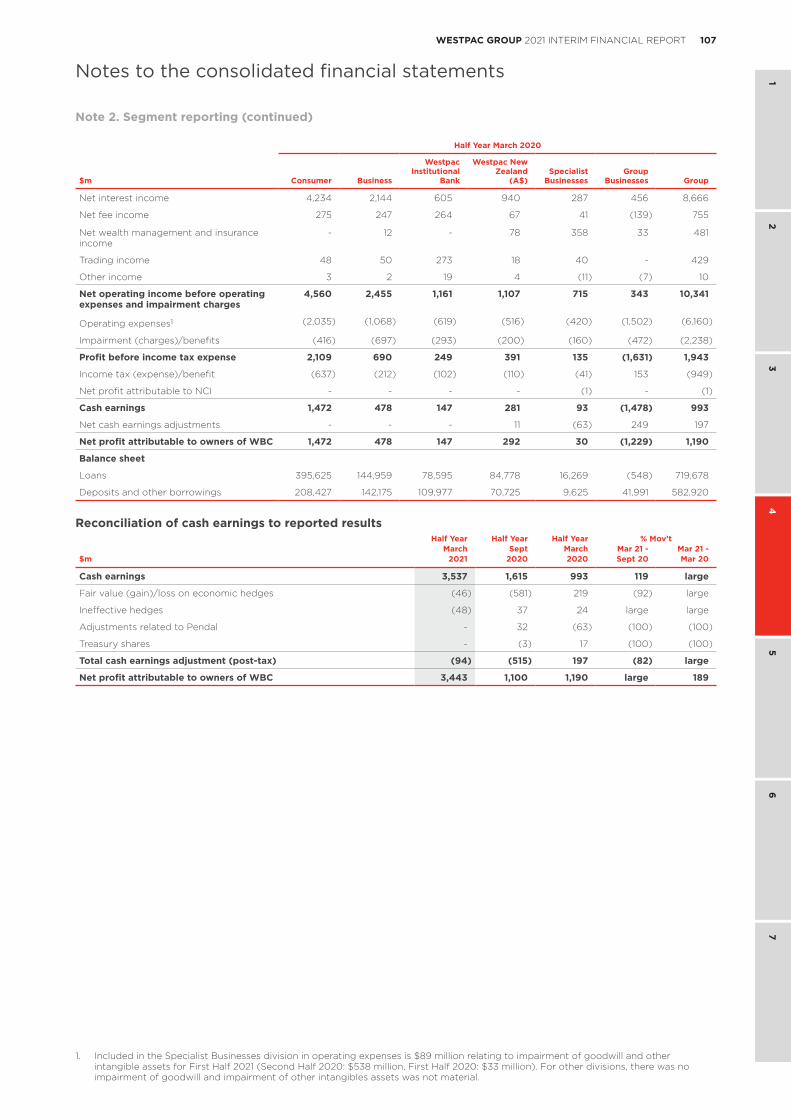
107WESTPAC GROUP 2021 INTERIM FINANCIAL REPORT
1 2
34
56
7
Notes to the consolidated financial statements
Half Year March 2020
Consumer Business
Westpac Institutional
Bank
Westpac New Zealand
(A$)Group
Businesses Group$mSpecialist
Businesses
Net interest income 4,234 2,144 605 940 287 456 8,666
Net fee income 275 247 264 67 41 (139) 755
Net wealth management and insurance income
- 12 - 78 358 33 481
Trading income 48 50 273 18 40 - 429
Other income 3 2 19 4 (11) (7) 10
Net operating income before operating expenses and impairment charges
4,560 2,455 1,161 1,107 715 343 10,341
Operating expenses1 (2,035) (1,068) (619) (516) (420) (1,502) (6,160)
Impairment (charges)/benefits (416) (697) (293) (200) (160) (472) (2,238)
Profit before income tax expense 2,109 690 249 391 135 (1,631) 1,943
Income tax (expense)/benefit (637) (212) (102) (110) (41) 153 (949)
Net profit attributable to NCI - - - - (1) - (1)
Cash earnings 1,472 478 147 281 93 (1,478) 993
Net cash earnings adjustments - - - 11 (63) 249 197
Net profit attributable to owners of WBC 1,472 478 147 292 30 (1,229) 1,190
Balance sheet
Loans 395,625 144,959 78,595 84,778 16,269 (548) 719,678
Deposits and other borrowings 208,427 142,175 109,977 70,725 9,625 41,991 582,920
Reconciliation of cash earnings to reported resultsHalf Year Half Year Half Year % Mov’t
March Sept March Mar 21 - Mar 21 -$m 2021 2020 2020 Sept 20 Mar 20
Cash earnings 3,537 1,615 993 119 large
Fair value (gain)/loss on economic hedges (46) (581) 219 (92) large
Ineffective hedges (48) 37 24 large large
Adjustments related to Pendal - 32 (63) (100) (100)
Treasury shares - (3) 17 (100) (100)
Total cash earnings adjustment (post-tax) (94) (515) 197 (82) large
Net profit attributable to owners of WBC 3,443 1,100 1,190 large 189
Note 2. Segment reporting (continued)
1. Included in the Specialist Businesses division in operating expenses is $89 million relating to impairment of goodwill and other intangible assets for First Half 2021 (Second Half 2020: $538 million, First Half 2020: $33 million). For other divisions, there was no impairment of goodwill and impairment of other intangibles assets was not material.
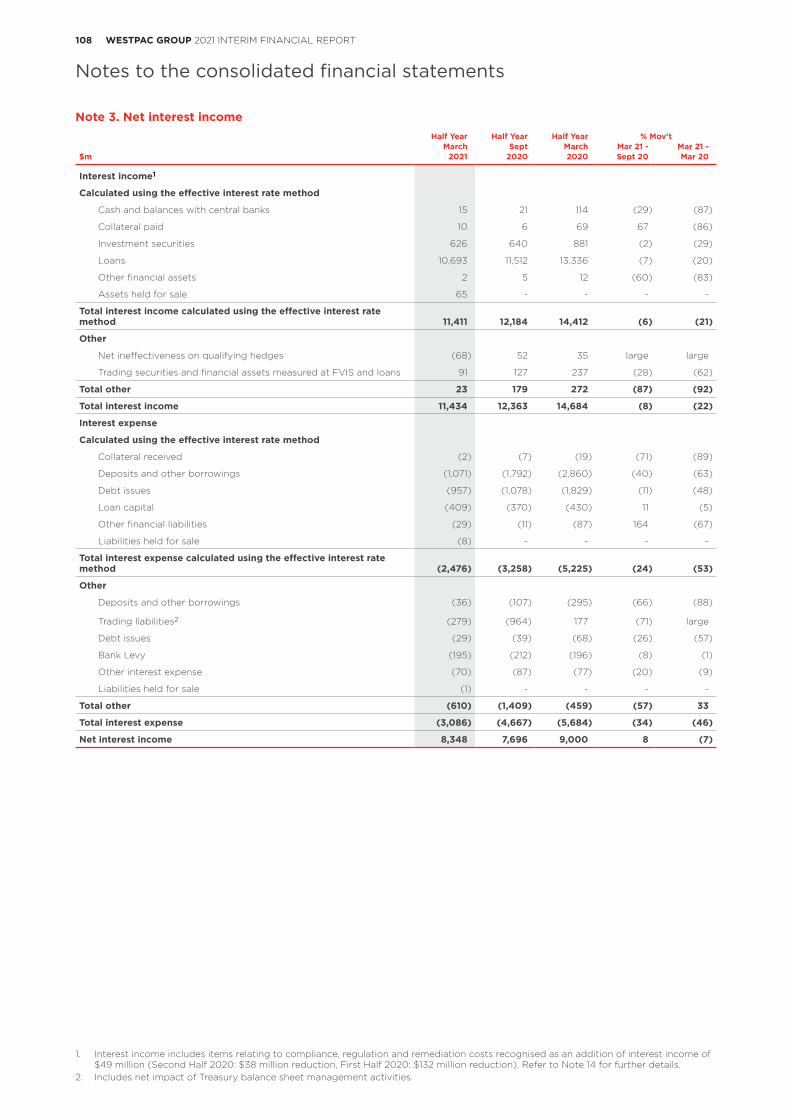
108 WESTPAC GROUP 2021 INTERIM FINANCIAL REPORT
Notes to the consolidated financial statements
Note 3. Net interest income
Half Year Half Year Half Year % Mov’tMarch Sept March Mar 21 - Mar 21 -
$m 2021 2020 2020 Sept 20 Mar 20
Interest income1
Calculated using the effective interest rate method
Cash and balances with central banks 15 21 114 (29) (87)
Collateral paid 10 6 69 67 (86)
Investment securities 626 640 881 (2) (29)
Loans 10,693 11,512 13,336 (7) (20)
Other financial assets 2 5 12 (60) (83)
Assets held for sale 65 - - - -
Total interest income calculated using the effective interest rate method 11,411 12,184 14,412 (6) (21)
Other
Net ineffectiveness on qualifying hedges (68) 52 35 large large
Trading securities and financial assets measured at FVIS and loans 91 127 237 (28) (62)
Total other 23 179 272 (87) (92)
Total interest income 11,434 12,363 14,684 (8) (22)
Interest expense
Calculated using the effective interest rate method
Collateral received (2) (7) (19) (71) (89)
Deposits and other borrowings (1,071) (1,792) (2,860) (40) (63)
Debt issues (957) (1,078) (1,829) (11) (48)
Loan capital (409) (370) (430) 11 (5)
Other financial liabilities (29) (11) (87) 164 (67)
Liabilities held for sale (8) - - - -
Total interest expense calculated using the effective interest rate method (2,476) (3,258) (5,225) (24) (53)
Other
Deposits and other borrowings (36) (107) (295) (66) (88)
Trading liabilities2 (279) (964) 177 (71) large
Debt issues (29) (39) (68) (26) (57)
Bank Levy (195) (212) (196) (8) (1)
Other interest expense (70) (87) (77) (20) (9)
Liabilities held for sale (1) - - - -
Total other (610) (1,409) (459) (57) 33
Total interest expense (3,086) (4,667) (5,684) (34) (46)
Net interest income 8,348 7,696 9,000 8 (7)
1. Interest income includes items relating to compliance, regulation and remediation costs recognised as an addition of interest income of $49 million (Second Half 2020: $38 million reduction, First Half 2020: $132 million reduction). Refer to Note 14 for further details.
2. Includes net impact of Treasury balance sheet management activities.
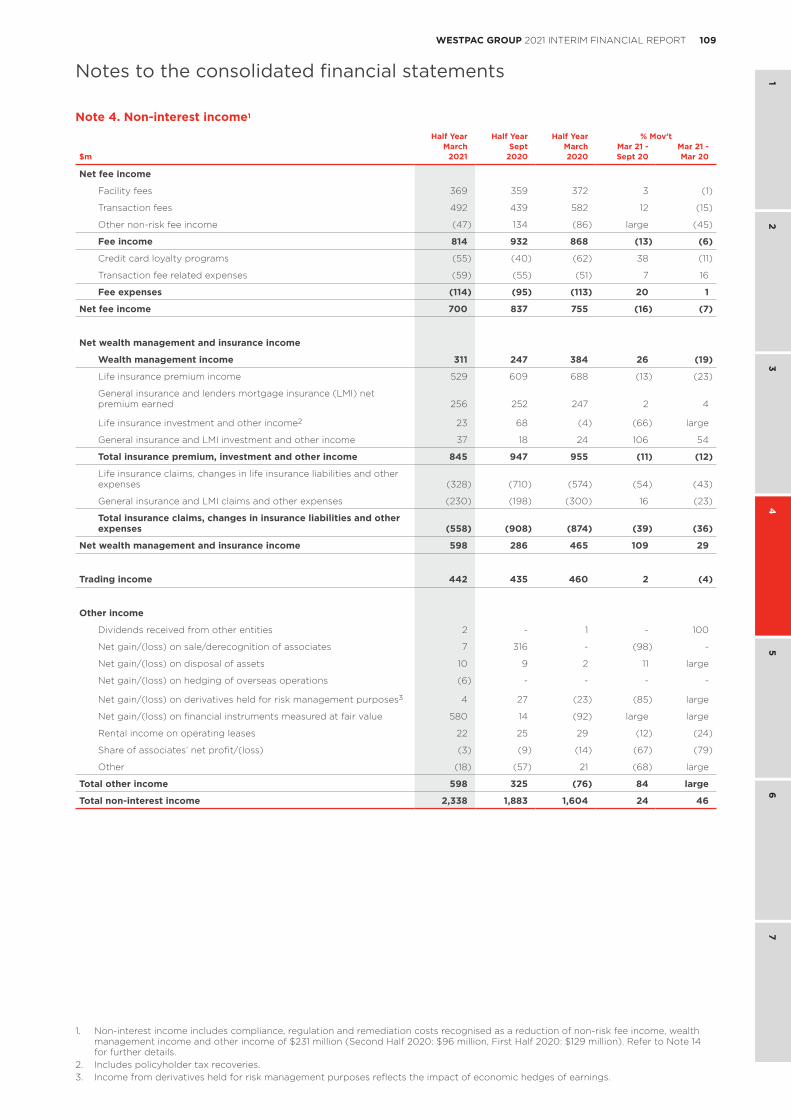
109WESTPAC GROUP 2021 INTERIM FINANCIAL REPORT
1 2
34
56
7
Notes to the consolidated financial statements
Note 4. Non-interest income1
Half Year Half Year Half Year % Mov’tMarch Sept March Mar 21 - Mar 21 -
$m 2021 2020 2020 Sept 20 Mar 20
Net fee income
Facility fees 369 359 372 3 (1)
Transaction fees 492 439 582 12 (15)
Other non-risk fee income (47) 134 (86) large (45)
Fee income 814 932 868 (13) (6)
Credit card loyalty programs (55) (40) (62) 38 (11)
Transaction fee related expenses (59) (55) (51) 7 16
Fee expenses (114) (95) (113) 20 1
Net fee income 700 837 755 (16) (7)
Net wealth management and insurance income
Wealth management income 311 247 384 26 (19)
Life insurance premium income 529 609 688 (13) (23)
General insurance and lenders mortgage insurance (LMI) net premium earned 256 252 247 2 4
Life insurance investment and other income2 23 68 (4) (66) large
General insurance and LMI investment and other income 37 18 24 106 54
Total insurance premium, investment and other income 845 947 955 (11) (12)
Life insurance claims, changes in life insurance liabilities and other expenses (328) (710) (574) (54) (43)
General insurance and LMI claims and other expenses (230) (198) (300) 16 (23)
Total insurance claims, changes in insurance liabilities and other expenses (558) (908) (874) (39) (36)
Net wealth management and insurance income 598 286 465 109 29
Trading income 442 435 460 2 (4)
Other income
Dividends received from other entities 2 - 1 - 100
Net gain/(loss) on sale/derecognition of associates 7 316 - (98) -
Net gain/(loss) on disposal of assets 10 9 2 11 large
Net gain/(loss) on hedging of overseas operations (6) - - - -
Net gain/(loss) on derivatives held for risk management purposes3 4 27 (23) (85) large
Net gain/(loss) on financial instruments measured at fair value 580 14 (92) large large
Rental income on operating leases 22 25 29 (12) (24)
Share of associates’ net profit/(loss) (3) (9) (14) (67) (79)
Other (18) (57) 21 (68) large
Total other income 598 325 (76) 84 large
Total non-interest income 2,338 1,883 1,604 24 46
1. Non-interest income includes compliance, regulation and remediation costs recognised as a reduction of non-risk fee income, wealth management income and other income of $231 million (Second Half 2020: $96 million, First Half 2020: $129 million). Refer to Note 14 for further details.
2. Includes policyholder tax recoveries.3. Income from derivatives held for risk management purposes reflects the impact of economic hedges of earnings.
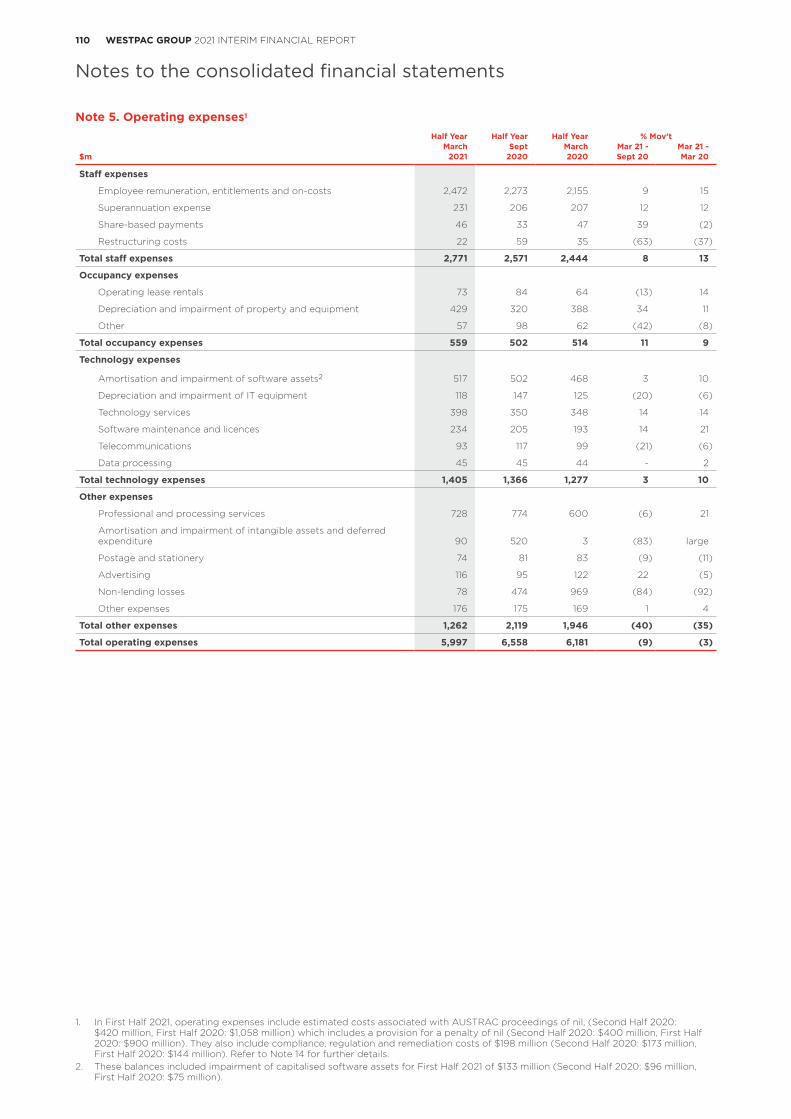
110 WESTPAC GROUP 2021 INTERIM FINANCIAL REPORT
Notes to the consolidated financial statements
Note 5. Operating expenses1
Half Year Half Year Half Year % Mov’tMarch Sept March Mar 21 - Mar 21 -
$m 2021 2020 2020 Sept 20 Mar 20
Staff expenses
Employee remuneration, entitlements and on-costs 2,472 2,273 2,155 9 15
Superannuation expense 231 206 207 12 12
Share-based payments 46 33 47 39 (2)
Restructuring costs 22 59 35 (63) (37)
Total staff expenses 2,771 2,571 2,444 8 13
Occupancy expenses
Operating lease rentals 73 84 64 (13) 14
Depreciation and impairment of property and equipment 429 320 388 34 11
Other 57 98 62 (42) (8)
Total occupancy expenses 559 502 514 11 9
Technology expenses
Amortisation and impairment of software assets2 517 502 468 3 10
Depreciation and impairment of IT equipment 118 147 125 (20) (6)
Technology services 398 350 348 14 14
Software maintenance and licences 234 205 193 14 21
Telecommunications 93 117 99 (21) (6)
Data processing 45 45 44 - 2
Total technology expenses 1,405 1,366 1,277 3 10
Other expenses
Professional and processing services 728 774 600 (6) 21
Amortisation and impairment of intangible assets and deferred expenditure 90 520 3 (83) large
Postage and stationery 74 81 83 (9) (11)
Advertising 116 95 122 22 (5)
Non-lending losses 78 474 969 (84) (92)
Other expenses 176 175 169 1 4
Total other expenses 1,262 2,119 1,946 (40) (35)
Total operating expenses 5,997 6,558 6,181 (9) (3)
1. In First Half 2021, operating expenses include estimated costs associated with AUSTRAC proceedings of nil, (Second Half 2020: $420 million, First Half 2020: $1,058 million) which includes a provision for a penalty of nil (Second Half 2020: $400 million, First Half 2020: $900 million). They also include compliance, regulation and remediation costs of $198 million (Second Half 2020: $173 million, First Half 2020: $144 million). Refer to Note 14 for further details.
2. These balances included impairment of capitalised software assets for First Half 2021 of $133 million (Second Half 2020: $96 million, First Half 2020: $75 million).
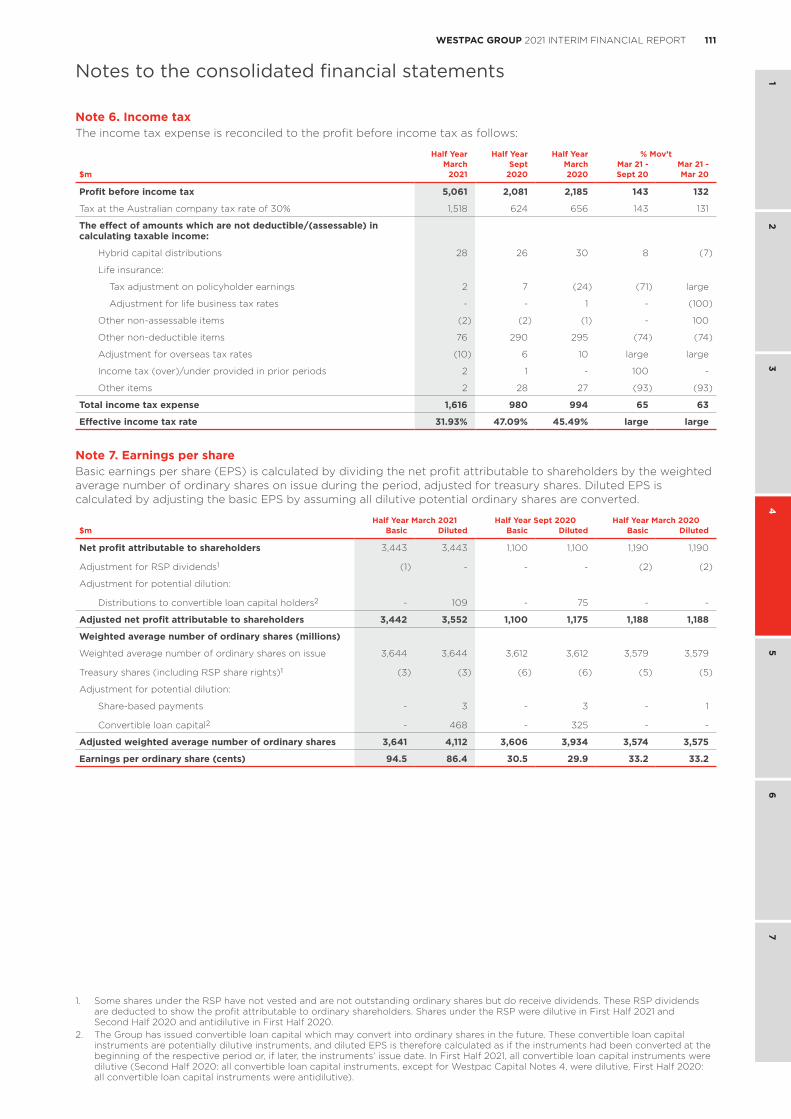
111WESTPAC GROUP 2021 INTERIM FINANCIAL REPORT
1 2
34
56
7
Notes to the consolidated financial statements
Note 6. Income tax The income tax expense is reconciled to the profit before income tax as follows:
Half Year Half Year Half Year % Mov’tMarch Sept March Mar 21 - Mar 21 -
$m 2021 2020 2020 Sept 20 Mar 20
Profit before income tax 5,061 2,081 2,185 143 132
Tax at the Australian company tax rate of 30% 1,518 624 656 143 131
The effect of amounts which are not deductible/(assessable) in calculating taxable income:
Hybrid capital distributions 28 26 30 8 (7)
Life insurance:
Tax adjustment on policyholder earnings 2 7 (24) (71) large
Adjustment for life business tax rates - - 1 - (100)
Other non-assessable items (2) (2) (1) - 100
Other non-deductible items 76 290 295 (74) (74)
Adjustment for overseas tax rates (10) 6 10 large large
Income tax (over)/under provided in prior periods 2 1 - 100 -
Other items 2 28 27 (93) (93)
Total income tax expense 1,616 980 994 65 63
Effective income tax rate 31.93% 47.09% 45.49% large large
Note 7. Earnings per shareBasic earnings per share (EPS) is calculated by dividing the net profit attributable to shareholders by the weighted average number of ordinary shares on issue during the period, adjusted for treasury shares. Diluted EPS is calculated by adjusting the basic EPS by assuming all dilutive potential ordinary shares are converted.
Half Year March 2021 Half Year Sept 2020 Half Year March 2020$m Basic Diluted Basic Diluted Basic Diluted
Net profit attributable to shareholders 3,443 3,443 1,100 1,100 1,190 1,190
Adjustment for RSP dividends1 (1) - - - (2) (2)
Adjustment for potential dilution:
Distributions to convertible loan capital holders2 - 109 - 75 - -
Adjusted net profit attributable to shareholders 3,442 3,552 1,100 1,175 1,188 1,188
Weighted average number of ordinary shares (millions)
Weighted average number of ordinary shares on issue 3,644 3,644 3,612 3,612 3,579 3,579
Treasury shares (including RSP share rights)1 (3) (3) (6) (6) (5) (5)
Adjustment for potential dilution:
Share-based payments - 3 - 3 - 1
Convertible loan capital2 - 468 - 325 - -
Adjusted weighted average number of ordinary shares 3,641 4,112 3,606 3,934 3,574 3,575
Earnings per ordinary share (cents) 94.5 86.4 30.5 29.9 33.2 33.2
1. Some shares under the RSP have not vested and are not outstanding ordinary shares but do receive dividends. These RSP dividends are deducted to show the profit attributable to ordinary shareholders. Shares under the RSP were dilutive in First Half 2021 and Second Half 2020 and antidilutive in First Half 2020.
2. The Group has issued convertible loan capital which may convert into ordinary shares in the future. These convertible loan capital instruments are potentially dilutive instruments, and diluted EPS is therefore calculated as if the instruments had been converted at the beginning of the respective period or, if later, the instruments’ issue date. In First Half 2021, all convertible loan capital instruments were dilutive (Second Half 2020: all convertible loan capital instruments, except for Westpac Capital Notes 4, were dilutive, First Half 2020: all convertible loan capital instruments were antidilutive).
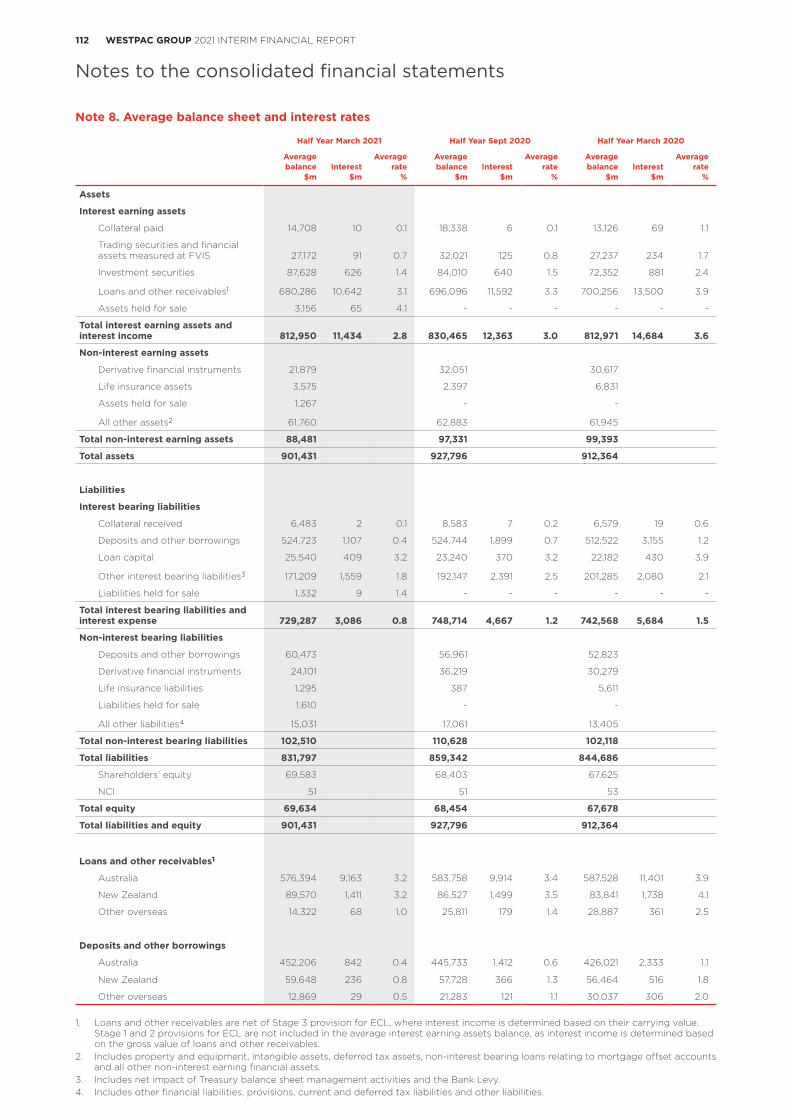
112 WESTPAC GROUP 2021 INTERIM FINANCIAL REPORT
Notes to the consolidated financial statements
Note 8. Average balance sheet and interest rates
Half Year March 2021 Half Year Sept 2020 Half Year March 2020
Average Average Average Average Average Average balance Interest rate balance Interest rate balance Interest rate $m $m % $m $m % $m $m %
Assets
Interest earning assets
Collateral paid 14,708 10 0.1 18,338 6 0.1 13,126 69 1.1
Trading securities and financial assets measured at FVIS 27,172 91 0.7 32,021 125 0.8 27,237 234 1.7
Investment securities 87,628 626 1.4 84,010 640 1.5 72,352 881 2.4
Loans and other receivables1 680,286 10,642 3.1 696,096 11,592 3.3 700,256 13,500 3.9
Assets held for sale 3,156 65 4.1 - - - - - -
Total interest earning assets and interest income 812,950 11,434 2.8 830,465 12,363 3.0 812,971 14,684 3.6
Non-interest earning assets
Derivative financial instruments 21,879 32,051 30,617
Life insurance assets 3,575 2,397 6,831
Assets held for sale 1,267 - -
All other assets2 61,760 62,883 61,945
Total non-interest earning assets 88,481 97,331 99,393
Total assets 901,431 927,796 912,364
Liabilities
Interest bearing liabilities
Collateral received 6,483 2 0.1 8,583 7 0.2 6,579 19 0.6
Deposits and other borrowings 524,723 1,107 0.4 524,744 1,899 0.7 512,522 3,155 1.2
Loan capital 25,540 409 3.2 23,240 370 3.2 22,182 430 3.9
Other interest bearing liabilities3 171,209 1,559 1.8 192,147 2,391 2.5 201,285 2,080 2.1
Liabilities held for sale 1,332 9 1.4 - - - - - -
Total interest bearing liabilities and interest expense 729,287 3,086 0.8 748,714 4,667 1.2 742,568 5,684 1.5
Non-interest bearing liabilities
Deposits and other borrowings 60,473 56,961 52,823
Derivative financial instruments 24,101 36,219 30,279
Life insurance liabilities 1,295 387 5,611
Liabilities held for sale 1,610 - -
All other liabilities4 15,031 17,061 13,405
Total non-interest bearing liabilities 102,510 110,628 102,118
Total liabilities 831,797 859,342 844,686
Shareholders’ equity 69,583 68,403 67,625
NCI 51 51 53
Total equity 69,634 68,454 67,678
Total liabilities and equity 901,431 927,796 912,364
Loans and other receivables1
Australia 576,394 9,163 3.2 583,758 9,914 3.4 587,528 11,401 3.9
New Zealand 89,570 1,411 3.2 86,527 1,499 3.5 83,841 1,738 4.1
Other overseas 14,322 68 1.0 25,811 179 1.4 28,887 361 2.5
Deposits and other borrowings
Australia 452,206 842 0.4 445,733 1,412 0.6 426,021 2,333 1.1
New Zealand 59,648 236 0.8 57,728 366 1.3 56,464 516 1.8
Other overseas 12,869 29 0.5 21,283 121 1.1 30,037 306 2.0
1. Loans and other receivables are net of Stage 3 provision for ECL, where interest income is determined based on their carrying value. Stage 1 and 2 provisions for ECL are not included in the average interest earning assets balance, as interest income is determined based on the gross value of loans and other receivables.
2. Includes property and equipment, intangible assets, deferred tax assets, non-interest bearing loans relating to mortgage offset accounts and all other non-interest earning financial assets.
3. Includes net impact of Treasury balance sheet management activities and the Bank Levy.4. Includes other financial liabilities, provisions, current and deferred tax liabilities and other liabilities.
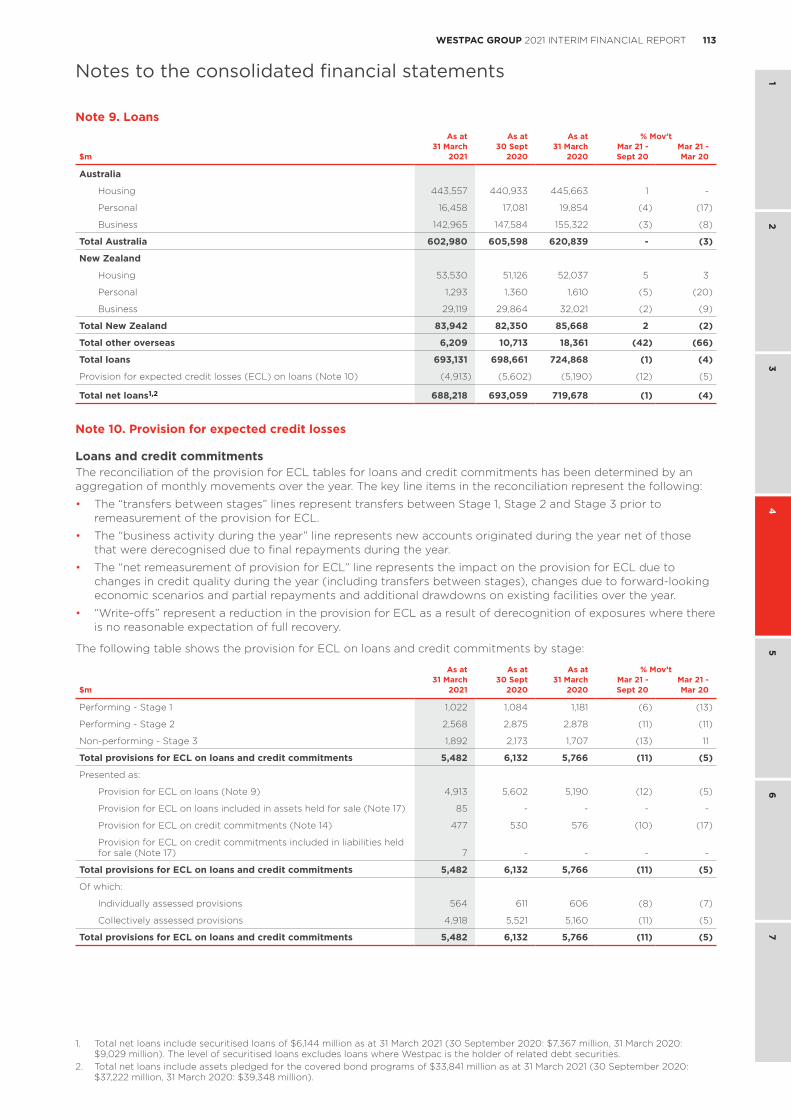
113WESTPAC GROUP 2021 INTERIM FINANCIAL REPORT
1 2
34
56
7
Notes to the consolidated financial statements
Note 9. LoansAs at As at As at % Mov’t
31 March 30 Sept 31 March Mar 21 - Mar 21 -$m 2021 2020 2020 Sept 20 Mar 20
Australia
Housing 443,557 440,933 445,663 1 -
Personal 16,458 17,081 19,854 (4) (17)
Business 142,965 147,584 155,322 (3) (8)
Total Australia 602,980 605,598 620,839 - (3)
New Zealand
Housing 53,530 51,126 52,037 5 3
Personal 1,293 1,360 1,610 (5) (20)
Business 29,119 29,864 32,021 (2) (9)
Total New Zealand 83,942 82,350 85,668 2 (2)
Total other overseas 6,209 10,713 18,361 (42) (66)
Total loans 693,131 698,661 724,868 (1) (4)
Provision for expected credit losses (ECL) on loans (Note 10) (4,913) (5,602) (5,190) (12) (5)
Total net loans1,2 688,218 693,059 719,678 (1) (4)
Note 10. Provision for expected credit losses
Loans and credit commitmentsThe reconciliation of the provision for ECL tables for loans and credit commitments has been determined by an aggregation of monthly movements over the year. The key line items in the reconciliation represent the following:
• The “transfers between stages” lines represent transfers between Stage 1, Stage 2 and Stage 3 prior to remeasurement of the provision for ECL.
• The “business activity during the year” line represents new accounts originated during the year net of those that were derecognised due to final repayments during the year.
• The “net remeasurement of provision for ECL” line represents the impact on the provision for ECL due to changes in credit quality during the year (including transfers between stages), changes due to forward-looking economic scenarios and partial repayments and additional drawdowns on existing facilities over the year.
• “Write-offs” represent a reduction in the provision for ECL as a result of derecognition of exposures where there is no reasonable expectation of full recovery.
The following table shows the provision for ECL on loans and credit commitments by stage:
As at As at As at % Mov’t31 March 30 Sept 31 March Mar 21 - Mar 21 -
$m 2021 2020 2020 Sept 20 Mar 20
Performing - Stage 1 1,022 1,084 1,181 (6) (13)
Performing - Stage 2 2,568 2,875 2,878 (11) (11)
Non-performing - Stage 3 1,892 2,173 1,707 (13) 11
Total provisions for ECL on loans and credit commitments 5,482 6,132 5,766 (11) (5)
Presented as:
Provision for ECL on loans (Note 9) 4,913 5,602 5,190 (12) (5)
Provision for ECL on loans included in assets held for sale (Note 17) 85 - - - -
Provision for ECL on credit commitments (Note 14) 477 530 576 (10) (17)
Provision for ECL on credit commitments included in liabilities held for sale (Note 17) 7 - - - -
Total provisions for ECL on loans and credit commitments 5,482 6,132 5,766 (11) (5)
Of which:
Individually assessed provisions 564 611 606 (8) (7)
Collectively assessed provisions 4,918 5,521 5,160 (11) (5)
Total provisions for ECL on loans and credit commitments 5,482 6,132 5,766 (11) (5)
1. Total net loans include securitised loans of $6,144 million as at 31 March 2021 (30 September 2020: $7,367 million, 31 March 2020: $9,029 million). The level of securitised loans excludes loans where Westpac is the holder of related debt securities.
2. Total net loans include assets pledged for the covered bond programs of $33,841 million as at 31 March 2021 (30 September 2020: $37,222 million, 31 March 2020: $39,348 million).
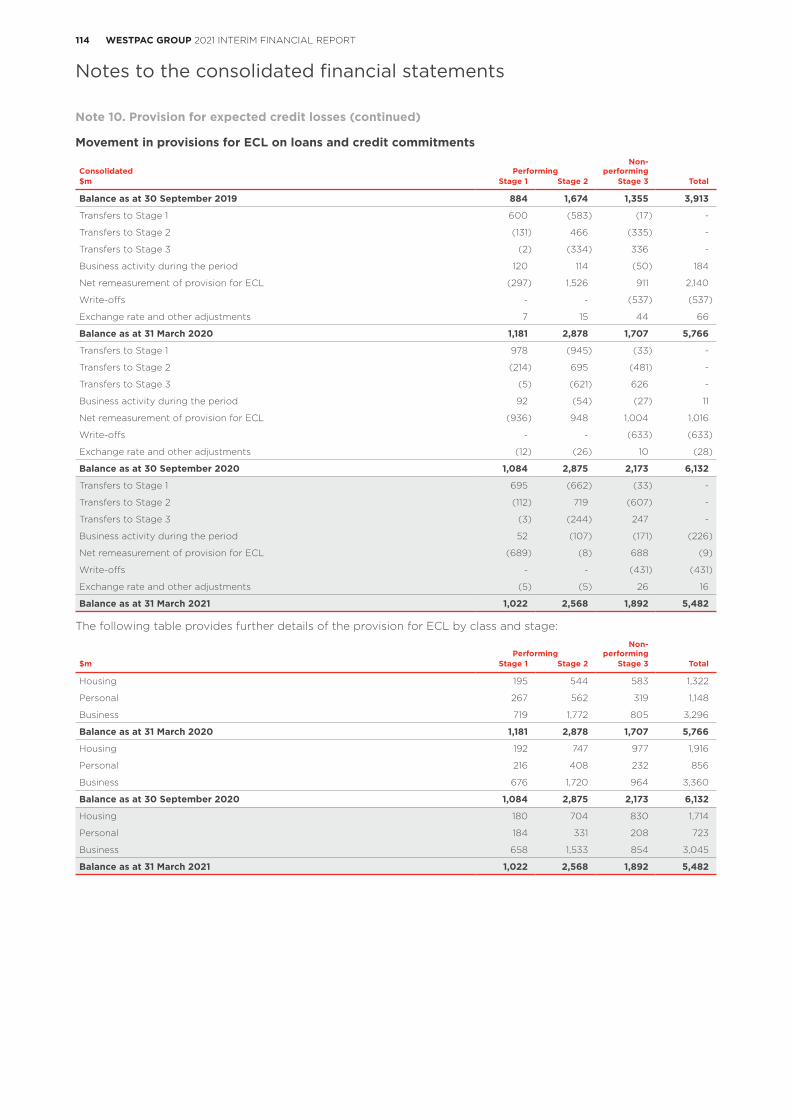
114 WESTPAC GROUP 2021 INTERIM FINANCIAL REPORT
Notes to the consolidated financial statements
Movement in provisions for ECL on loans and credit commitments
Consolidated PerformingNon-
performing$m Stage 1 Stage 2 Stage 3 Total
Balance as at 30 September 2019 884 1,674 1,355 3,913
Transfers to Stage 1 600 (583) (17) -
Transfers to Stage 2 (131) 466 (335) -
Transfers to Stage 3 (2) (334) 336 -
Business activity during the period 120 114 (50) 184
Net remeasurement of provision for ECL (297) 1,526 911 2,140
Write-offs - - (537) (537)
Exchange rate and other adjustments 7 15 44 66
Balance as at 31 March 2020 1,181 2,878 1,707 5,766
Transfers to Stage 1 978 (945) (33) -
Transfers to Stage 2 (214) 695 (481) -
Transfers to Stage 3 (5) (621) 626 -
Business activity during the period 92 (54) (27) 11
Net remeasurement of provision for ECL (936) 948 1,004 1,016
Write-offs - - (633) (633)
Exchange rate and other adjustments (12) (26) 10 (28)
Balance as at 30 September 2020 1,084 2,875 2,173 6,132
Transfers to Stage 1 695 (662) (33) -
Transfers to Stage 2 (112) 719 (607) -
Transfers to Stage 3 (3) (244) 247 -
Business activity during the period 52 (107) (171) (226)
Net remeasurement of provision for ECL (689) (8) 688 (9)
Write-offs - - (431) (431)
Exchange rate and other adjustments (5) (5) 26 16
Balance as at 31 March 2021 1,022 2,568 1,892 5,482
The following table provides further details of the provision for ECL by class and stage:
PerformingNon-
performing$m Stage 1 Stage 2 Stage 3 Total
Housing 195 544 583 1,322
Personal 267 562 319 1,148
Business 719 1,772 805 3,296
Balance as at 31 March 2020 1,181 2,878 1,707 5,766
Housing 192 747 977 1,916
Personal 216 408 232 856
Business 676 1,720 964 3,360
Balance as at 30 September 2020 1,084 2,875 2,173 6,132
Housing 180 704 830 1,714
Personal 184 331 208 723
Business 658 1,533 854 3,045
Balance as at 31 March 2021 1,022 2,568 1,892 5,482
Note 10. Provision for expected credit losses (continued)
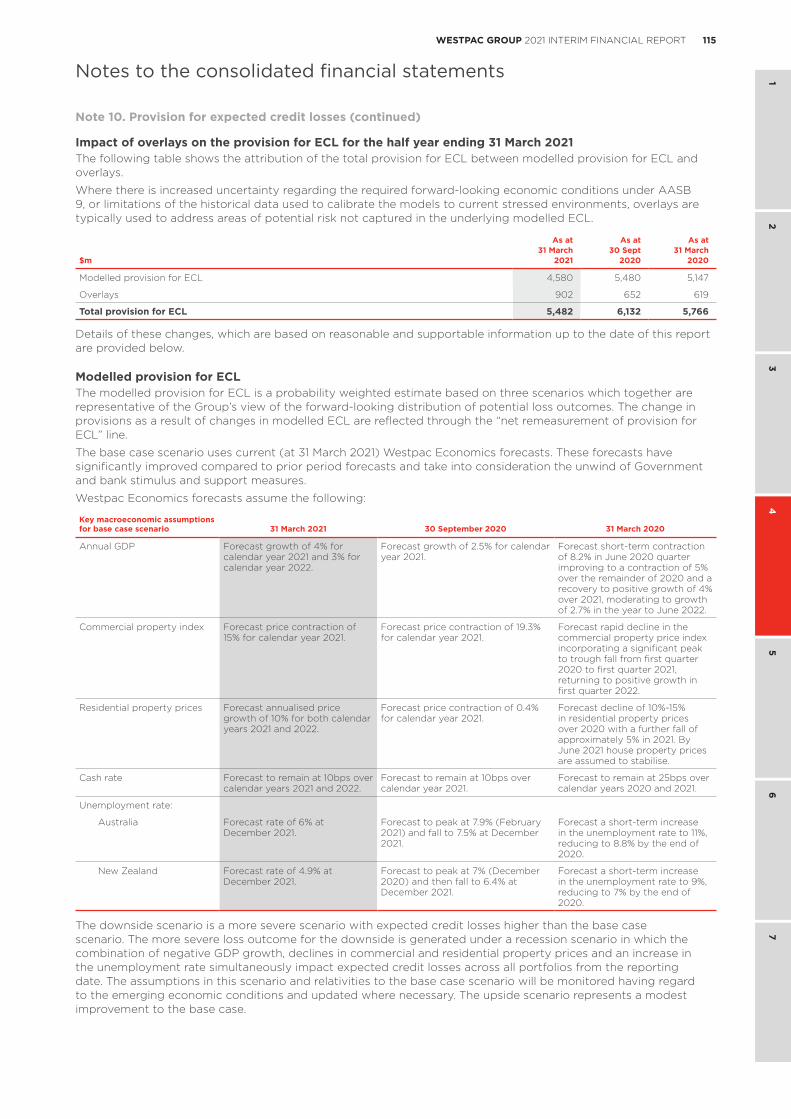
115WESTPAC GROUP 2021 INTERIM FINANCIAL REPORT
1 2
34
56
7
Notes to the consolidated financial statements
Impact of overlays on the provision for ECL for the half year ending 31 March 2021 The following table shows the attribution of the total provision for ECL between modelled provision for ECL and overlays.
Where there is increased uncertainty regarding the required forward-looking economic conditions under AASB 9, or limitations of the historical data used to calibrate the models to current stressed environments, overlays are typically used to address areas of potential risk not captured in the underlying modelled ECL.
As at As at As at31 March 30 Sept 31 March
$m 2021 2020 2020
Modelled provision for ECL 4,580 5,480 5,147
Overlays 902 652 619
Total provision for ECL 5,482 6,132 5,766
Details of these changes, which are based on reasonable and supportable information up to the date of this report are provided below.
Modelled provision for ECL The modelled provision for ECL is a probability weighted estimate based on three scenarios which together are representative of the Group’s view of the forward-looking distribution of potential loss outcomes. The change in provisions as a result of changes in modelled ECL are reflected through the “net remeasurement of provision for ECL” line.
The base case scenario uses current (at 31 March 2021) Westpac Economics forecasts. These forecasts have significantly improved compared to prior period forecasts and take into consideration the unwind of Government and bank stimulus and support measures.
Westpac Economics forecasts assume the following:
Key macroeconomic assumptions for base case scenario 31 March 2021 30 September 2020 31 March 2020
Annual GDP Forecast growth of 4% for calendar year 2021 and 3% for calendar year 2022.
Forecast growth of 2.5% for calendar year 2021.
Forecast short-term contraction of 8.2% in June 2020 quarter improving to a contraction of 5% over the remainder of 2020 and a recovery to positive growth of 4% over 2021, moderating to growth of 2.7% in the year to June 2022.
Commercial property index Forecast price contraction of 15% for calendar year 2021.
Forecast price contraction of 19.3% for calendar year 2021.
Forecast rapid decline in the commercial property price index incorporating a significant peak to trough fall from first quarter 2020 to first quarter 2021, returning to positive growth in first quarter 2022.
Residential property prices Forecast annualised price growth of 10% for both calendar years 2021 and 2022.
Forecast price contraction of 0.4% for calendar year 2021.
Forecast decline of 10%-15% in residential property prices over 2020 with a further fall of approximately 5% in 2021. By June 2021 house property prices are assumed to stabilise.
Cash rate Forecast to remain at 10bps over calendar years 2021 and 2022.
Forecast to remain at 10bps over calendar year 2021.
Forecast to remain at 25bps over calendar years 2020 and 2021.
Unemployment rate:
Australia Forecast rate of 6% at December 2021.
Forecast to peak at 7.9% (February 2021) and fall to 7.5% at December 2021.
Forecast a short-term increase in the unemployment rate to 11%, reducing to 8.8% by the end of 2020.
New Zealand Forecast rate of 4.9% at December 2021.
Forecast to peak at 7% (December 2020) and then fall to 6.4% at December 2021.
Forecast a short-term increase in the unemployment rate to 9%, reducing to 7% by the end of 2020.
The downside scenario is a more severe scenario with expected credit losses higher than the base case scenario. The more severe loss outcome for the downside is generated under a recession scenario in which the combination of negative GDP growth, declines in commercial and residential property prices and an increase in the unemployment rate simultaneously impact expected credit losses across all portfolios from the reporting date. The assumptions in this scenario and relativities to the base case scenario will be monitored having regard to the emerging economic conditions and updated where necessary. The upside scenario represents a modest improvement to the base case.
Note 10. Provision for expected credit losses (continued)
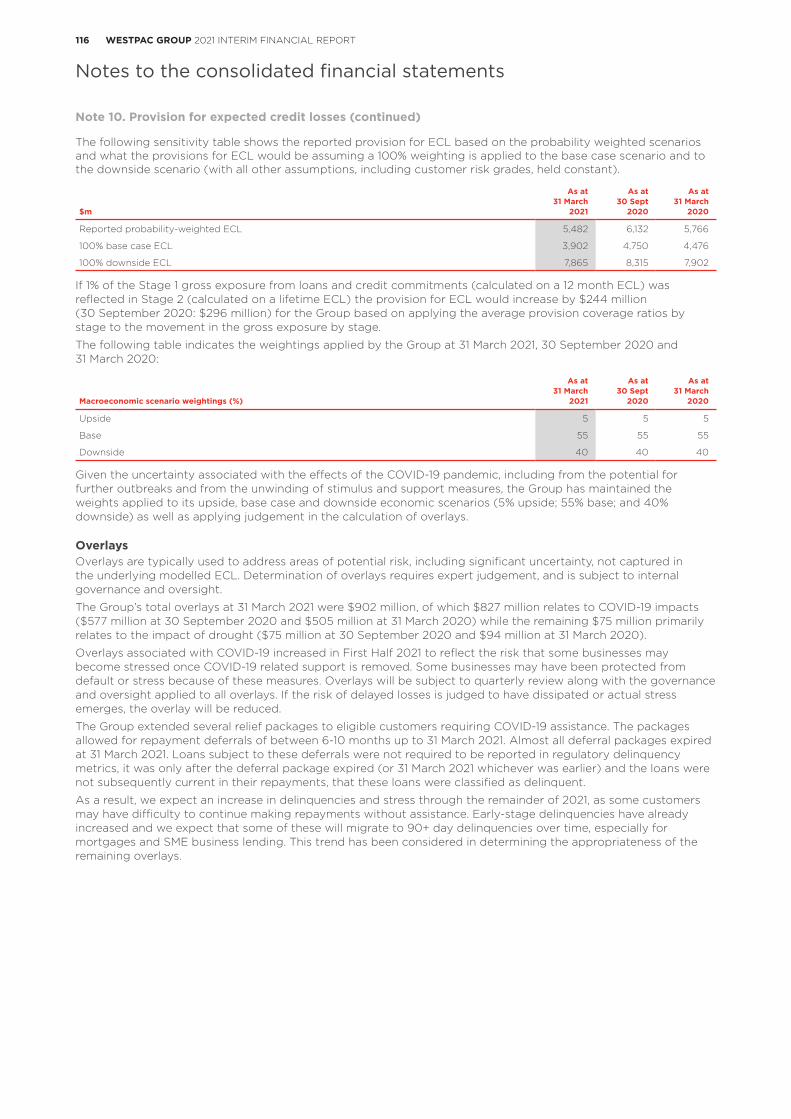
116 WESTPAC GROUP 2021 INTERIM FINANCIAL REPORT
Notes to the consolidated financial statements
The following sensitivity table shows the reported provision for ECL based on the probability weighted scenarios and what the provisions for ECL would be assuming a 100% weighting is applied to the base case scenario and to the downside scenario (with all other assumptions, including customer risk grades, held constant).
As at As at As at31 March 30 Sept 31 March
$m 2021 2020 2020
Reported probability-weighted ECL 5,482 6,132 5,766
100% base case ECL 3,902 4,750 4,476
100% downside ECL 7,865 8,315 7,902
If 1% of the Stage 1 gross exposure from loans and credit commitments (calculated on a 12 month ECL) was reflected in Stage 2 (calculated on a lifetime ECL) the provision for ECL would increase by $244 million (30 September 2020: $296 million) for the Group based on applying the average provision coverage ratios by stage to the movement in the gross exposure by stage.
The following table indicates the weightings applied by the Group at 31 March 2021, 30 September 2020 and 31 March 2020:
As at As at As at31 March 30 Sept 31 March
Macroeconomic scenario weightings (%) 2021 2020 2020
Upside 5 5 5
Base 55 55 55
Downside 40 40 40
Given the uncertainty associated with the effects of the COVID-19 pandemic, including from the potential for further outbreaks and from the unwinding of stimulus and support measures, the Group has maintained the weights applied to its upside, base case and downside economic scenarios (5% upside; 55% base; and 40% downside) as well as applying judgement in the calculation of overlays.
OverlaysOverlays are typically used to address areas of potential risk, including significant uncertainty, not captured in the underlying modelled ECL. Determination of overlays requires expert judgement, and is subject to internal governance and oversight.
The Group’s total overlays at 31 March 2021 were $902 million, of which $827 million relates to COVID-19 impacts ($577 million at 30 September 2020 and $505 million at 31 March 2020) while the remaining $75 million primarily relates to the impact of drought ($75 million at 30 September 2020 and $94 million at 31 March 2020).
Overlays associated with COVID-19 increased in First Half 2021 to reflect the risk that some businesses may become stressed once COVID-19 related support is removed. Some businesses may have been protected from default or stress because of these measures. Overlays will be subject to quarterly review along with the governance and oversight applied to all overlays. If the risk of delayed losses is judged to have dissipated or actual stress emerges, the overlay will be reduced.
The Group extended several relief packages to eligible customers requiring COVID-19 assistance. The packages allowed for repayment deferrals of between 6-10 months up to 31 March 2021. Almost all deferral packages expired at 31 March 2021. Loans subject to these deferrals were not required to be reported in regulatory delinquency metrics, it was only after the deferral package expired (or 31 March 2021 whichever was earlier) and the loans were not subsequently current in their repayments, that these loans were classified as delinquent.
As a result, we expect an increase in delinquencies and stress through the remainder of 2021, as some customers may have difficulty to continue making repayments without assistance. Early-stage delinquencies have already increased and we expect that some of these will migrate to 90+ day delinquencies over time, especially for mortgages and SME business lending. This trend has been considered in determining the appropriateness of the remaining overlays.
Note 10. Provision for expected credit losses (continued)
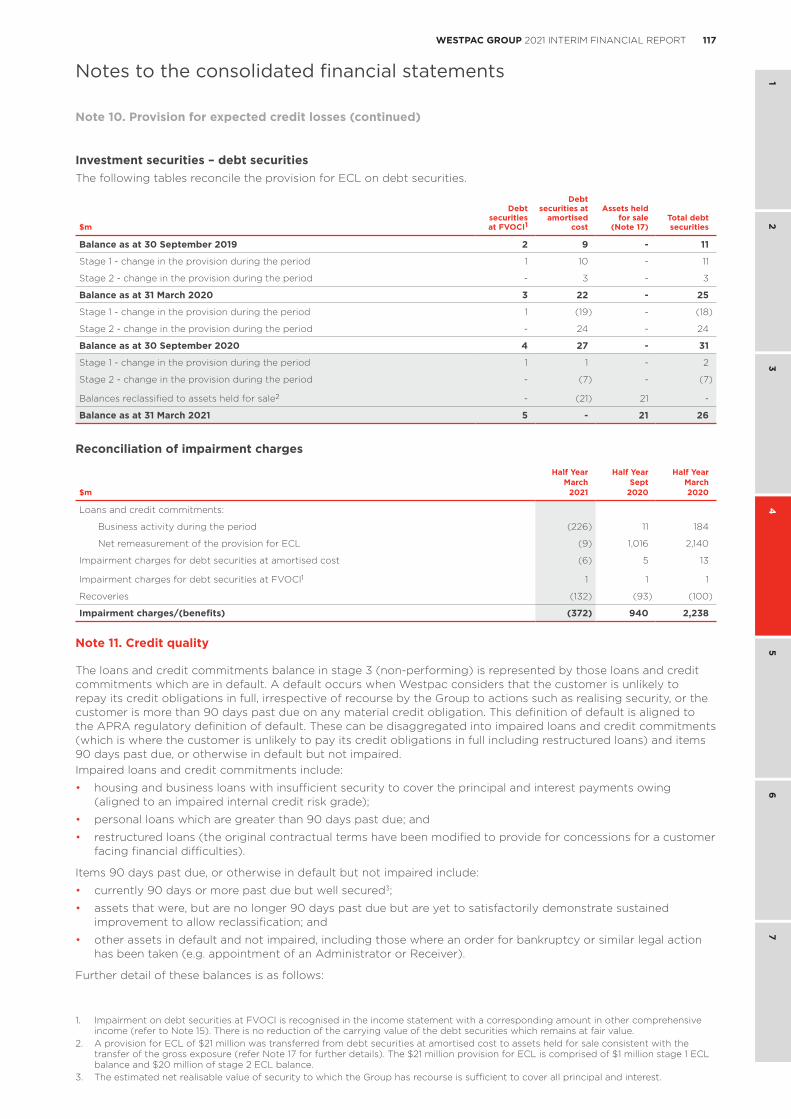
117WESTPAC GROUP 2021 INTERIM FINANCIAL REPORT
1 2
34
56
7
Notes to the consolidated financial statements
Investment securities – debt securitiesThe following tables reconcile the provision for ECL on debt securities.
$m
Debt securities at FVOCI1
Debt securities at
amortised cost
Assets held for sale
(Note 17)Total debt securities
Balance as at 30 September 2019 2 9 - 11
Stage 1 - change in the provision during the period 1 10 - 11
Stage 2 - change in the provision during the period - 3 - 3
Balance as at 31 March 2020 3 22 - 25
Stage 1 - change in the provision during the period 1 (19) - (18)
Stage 2 - change in the provision during the period - 24 - 24
Balance as at 30 September 2020 4 27 - 31
Stage 1 - change in the provision during the period 1 1 - 2
Stage 2 - change in the provision during the period - (7) - (7)
Balances reclassified to assets held for sale2 - (21) 21 -
Balance as at 31 March 2021 5 - 21 26
Reconciliation of impairment charges
Half Year Half Year Half YearMarch Sept March
$m 2021 2020 2020
Loans and credit commitments:
Business activity during the period (226) 11 184
Net remeasurement of the provision for ECL (9) 1,016 2,140
Impairment charges for debt securities at amortised cost (6) 5 13
Impairment charges for debt securities at FVOCI1 1 1 1
Recoveries (132) (93) (100)
Impairment charges/(benefits) (372) 940 2,238
Note 11. Credit quality
The loans and credit commitments balance in stage 3 (non-performing) is represented by those loans and credit commitments which are in default. A default occurs when Westpac considers that the customer is unlikely to repay its credit obligations in full, irrespective of recourse by the Group to actions such as realising security, or the customer is more than 90 days past due on any material credit obligation. This definition of default is aligned to the APRA regulatory definition of default. These can be disaggregated into impaired loans and credit commitments (which is where the customer is unlikely to pay its credit obligations in full including restructured loans) and items 90 days past due, or otherwise in default but not impaired.Impaired loans and credit commitments include:
• housing and business loans with insufficient security to cover the principal and interest payments owing (aligned to an impaired internal credit risk grade);
• personal loans which are greater than 90 days past due; and
• restructured loans (the original contractual terms have been modified to provide for concessions for a customer facing financial difficulties).
Items 90 days past due, or otherwise in default but not impaired include:
• currently 90 days or more past due but well secured3;
• assets that were, but are no longer 90 days past due but are yet to satisfactorily demonstrate sustained improvement to allow reclassification; and
• other assets in default and not impaired, including those where an order for bankruptcy or similar legal action has been taken (e.g. appointment of an Administrator or Receiver).
Further detail of these balances is as follows:
1. Impairment on debt securities at FVOCI is recognised in the income statement with a corresponding amount in other comprehensive income (refer to Note 15). There is no reduction of the carrying value of the debt securities which remains at fair value.
2. A provision for ECL of $21 million was transferred from debt securities at amortised cost to assets held for sale consistent with the transfer of the gross exposure (refer Note 17 for further details). The $21 million provision for ECL is comprised of $1 million stage 1 ECL balance and $20 million of stage 2 ECL balance.
3. The estimated net realisable value of security to which the Group has recourse is sufficient to cover all principal and interest.
Note 10. Provision for expected credit losses (continued)
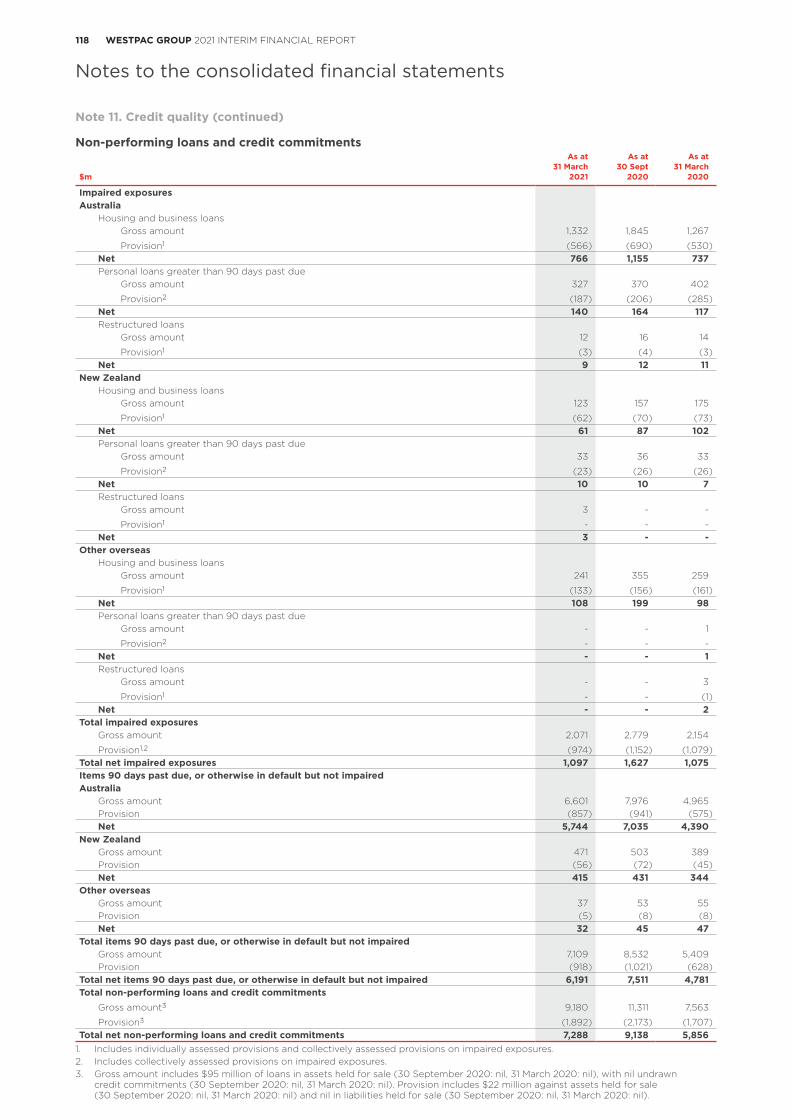
118 WESTPAC GROUP 2021 INTERIM FINANCIAL REPORT
Notes to the consolidated financial statements
As at As at As at31 March 30 Sept 31 March
$m 2021 2020 2020
Impaired exposuresAustralia
Housing and business loansGross amount 1,332 1,845 1,267
Provision1 (566) (690) (530)Net 766 1,155 737 Personal loans greater than 90 days past due
Gross amount 327 370 402
Provision2 (187) (206) (285)Net 140 164 117 Restructured loans
Gross amount 12 16 14
Provision1 (3) (4) (3)Net 9 12 11
New ZealandHousing and business loans
Gross amount 123 157 175
Provision1 (62) (70) (73)Net 61 87 102 Personal loans greater than 90 days past due
Gross amount 33 36 33
Provision2 (23) (26) (26)Net 10 10 7 Restructured loans
Gross amount 3 - -
Provision1 - - - Net 3 - -
Other overseasHousing and business loans
Gross amount 241 355 259
Provision1 (133) (156) (161)Net 108 199 98 Personal loans greater than 90 days past due
Gross amount - - 1
Provision2 - - - Net - - 1 Restructured loans
Gross amount - - 3
Provision1 - - (1)Net - - 2
Total impaired exposuresGross amount 2,071 2,779 2,154
Provision1,2 (974) (1,152) (1,079)Total net impaired exposures 1,097 1,627 1,075 Items 90 days past due, or otherwise in default but not impairedAustralia
Gross amount 6,601 7,976 4,965 Provision (857) (941) (575)Net 5,744 7,035 4,390
New ZealandGross amount 471 503 389 Provision (56) (72) (45)Net 415 431 344
Other overseasGross amount 37 53 55 Provision (5) (8) (8)Net 32 45 47
Total items 90 days past due, or otherwise in default but not impairedGross amount 7,109 8,532 5,409 Provision (918) (1,021) (628)
Total net items 90 days past due, or otherwise in default but not impaired 6,191 7,511 4,781 Total non-performing loans and credit commitments
Gross amount3 9,180 11,311 7,563
Provision3 (1,892) (2,173) (1,707)Total net non-performing loans and credit commitments 7,288 9,138 5,856
Non-performing loans and credit commitments
1. Includes individually assessed provisions and collectively assessed provisions on impaired exposures.2. Includes collectively assessed provisions on impaired exposures.3. Gross amount includes $95 million of loans in assets held for sale (30 September 2020: nil, 31 March 2020: nil), with nil undrawn
credit commitments (30 September 2020: nil, 31 March 2020: nil). Provision includes $22 million against assets held for sale (30 September 2020: nil, 31 March 2020: nil) and nil in liabilities held for sale (30 September 2020: nil, 31 March 2020: nil).
Note 11. Credit quality (continued)
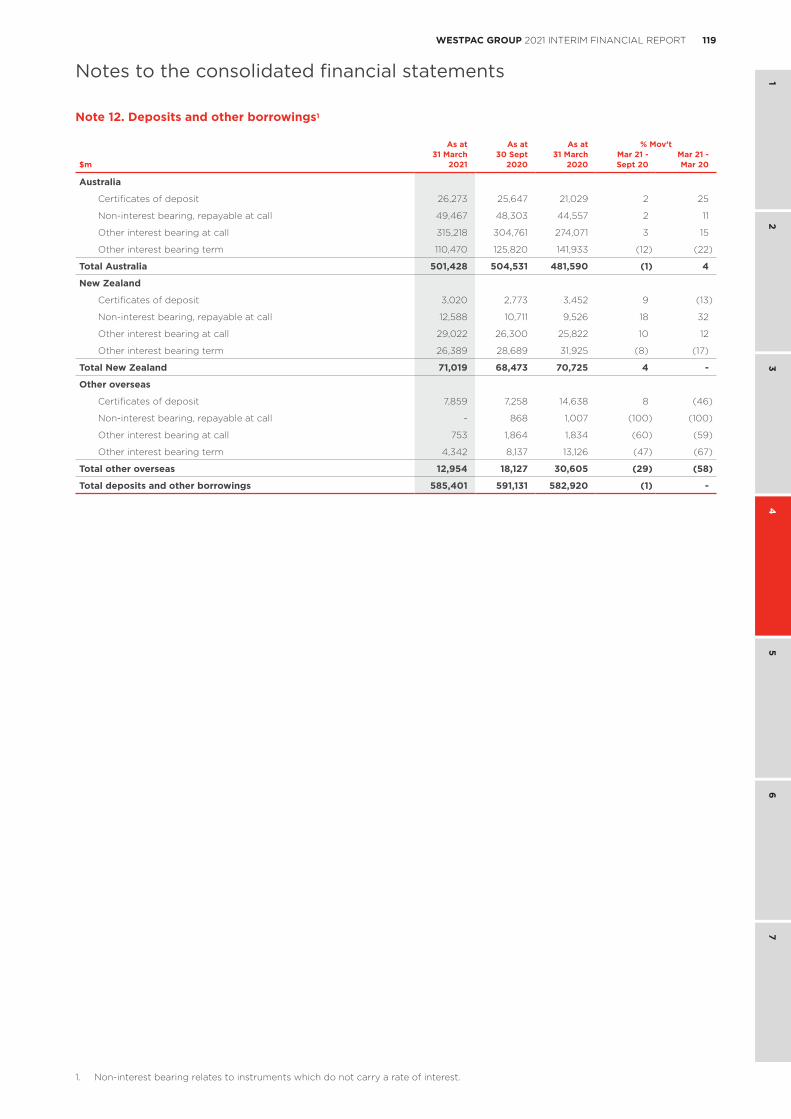
119WESTPAC GROUP 2021 INTERIM FINANCIAL REPORT
1 2
34
56
7
Notes to the consolidated financial statements
As at As at As at % Mov’t31 March 30 Sept 31 March Mar 21 - Mar 21 -
$m 2021 2020 2020 Sept 20 Mar 20
Australia
Certificates of deposit 26,273 25,647 21,029 2 25
Non-interest bearing, repayable at call 49,467 48,303 44,557 2 11
Other interest bearing at call 315,218 304,761 274,071 3 15
Other interest bearing term 110,470 125,820 141,933 (12) (22)
Total Australia 501,428 504,531 481,590 (1) 4
New Zealand
Certificates of deposit 3,020 2,773 3,452 9 (13)
Non-interest bearing, repayable at call 12,588 10,711 9,526 18 32
Other interest bearing at call 29,022 26,300 25,822 10 12
Other interest bearing term 26,389 28,689 31,925 (8) (17)
Total New Zealand 71,019 68,473 70,725 4 -
Other overseas
Certificates of deposit 7,859 7,258 14,638 8 (46)
Non-interest bearing, repayable at call - 868 1,007 (100) (100)
Other interest bearing at call 753 1,864 1,834 (60) (59)
Other interest bearing term 4,342 8,137 13,126 (47) (67)
Total other overseas 12,954 18,127 30,605 (29) (58)
Total deposits and other borrowings 585,401 591,131 582,920 (1) -
Note 12. Deposits and other borrowings1
1. Non-interest bearing relates to instruments which do not carry a rate of interest.
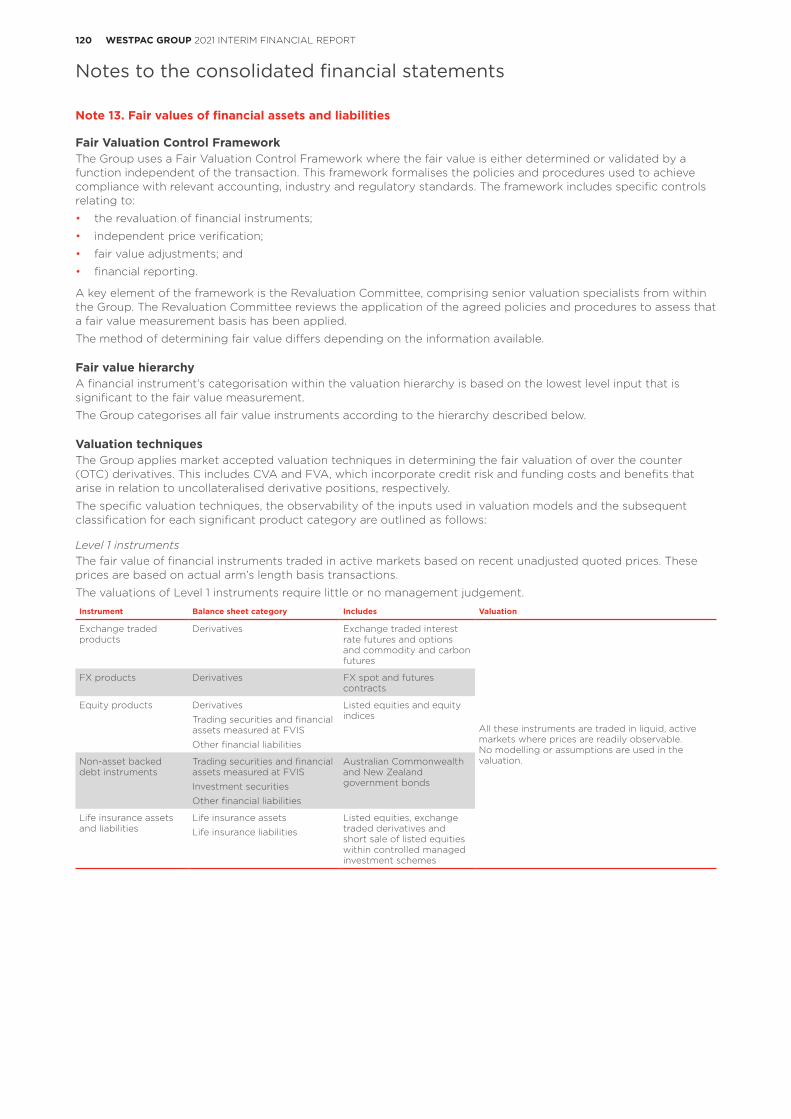
120 WESTPAC GROUP 2021 INTERIM FINANCIAL REPORT
Notes to the consolidated financial statements
Note 13. Fair values of financial assets and liabilities
Fair Valuation Control FrameworkThe Group uses a Fair Valuation Control Framework where the fair value is either determined or validated by a function independent of the transaction. This framework formalises the policies and procedures used to achieve compliance with relevant accounting, industry and regulatory standards. The framework includes specific controls relating to:
• the revaluation of financial instruments;
• independent price verification;
• fair value adjustments; and
• financial reporting.
A key element of the framework is the Revaluation Committee, comprising senior valuation specialists from within the Group. The Revaluation Committee reviews the application of the agreed policies and procedures to assess that a fair value measurement basis has been applied.
The method of determining fair value differs depending on the information available.
Fair value hierarchyA financial instrument’s categorisation within the valuation hierarchy is based on the lowest level input that is significant to the fair value measurement.
The Group categorises all fair value instruments according to the hierarchy described below.
Valuation techniquesThe Group applies market accepted valuation techniques in determining the fair valuation of over the counter (OTC) derivatives. This includes CVA and FVA, which incorporate credit risk and funding costs and benefits that arise in relation to uncollateralised derivative positions, respectively.
The specific valuation techniques, the observability of the inputs used in valuation models and the subsequent classification for each significant product category are outlined as follows:
Level 1 instrumentsThe fair value of financial instruments traded in active markets based on recent unadjusted quoted prices. These prices are based on actual arm’s length basis transactions.
The valuations of Level 1 instruments require little or no management judgement.
Instrument Balance sheet category Includes Valuation
Exchange traded products
Derivatives Exchange traded interest rate futures and options and commodity and carbon futures
All these instruments are traded in liquid, active markets where prices are readily observable. No modelling or assumptions are used in the valuation.
FX products Derivatives FX spot and futures contracts
Equity products Derivatives
Trading securities and financial assets measured at FVIS
Other financial liabilities
Listed equities and equity indices
Non-asset backed debt instruments
Trading securities and financial assets measured at FVIS
Investment securities
Other financial liabilities
Australian Commonwealth and New Zealand government bonds
Life insurance assets and liabilities
Life insurance assets
Life insurance liabilities
Listed equities, exchange traded derivatives and short sale of listed equities within controlled managed investment schemes
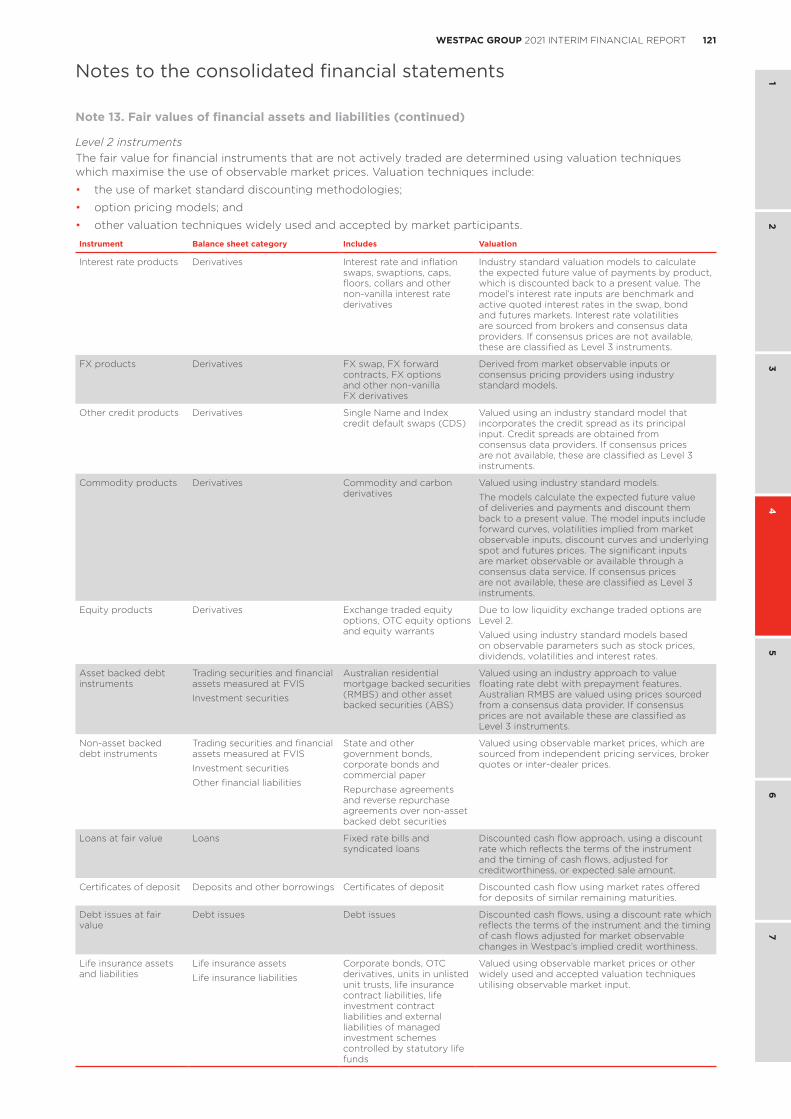
121WESTPAC GROUP 2021 INTERIM FINANCIAL REPORT
1 2
34
56
7
Notes to the consolidated financial statements
Level 2 instrumentsThe fair value for financial instruments that are not actively traded are determined using valuation techniques which maximise the use of observable market prices. Valuation techniques include:
• the use of market standard discounting methodologies;
• option pricing models; and
• other valuation techniques widely used and accepted by market participants.
Instrument Balance sheet category Includes Valuation
Interest rate products Derivatives Interest rate and inflation swaps, swaptions, caps, floors, collars and other non-vanilla interest rate derivatives
Industry standard valuation models to calculate the expected future value of payments by product, which is discounted back to a present value. The model’s interest rate inputs are benchmark and active quoted interest rates in the swap, bond and futures markets. Interest rate volatilities are sourced from brokers and consensus data providers. If consensus prices are not available, these are classified as Level 3 instruments.
FX products Derivatives FX swap, FX forward contracts, FX options and other non-vanilla FX derivatives
Derived from market observable inputs or consensus pricing providers using industry standard models.
Other credit products Derivatives Single Name and Index credit default swaps (CDS)
Valued using an industry standard model that incorporates the credit spread as its principal input. Credit spreads are obtained from consensus data providers. If consensus prices are not available, these are classified as Level 3 instruments.
Commodity products Derivatives Commodity and carbon derivatives
Valued using industry standard models.
The models calculate the expected future value of deliveries and payments and discount them back to a present value. The model inputs include forward curves, volatilities implied from market observable inputs, discount curves and underlying spot and futures prices. The significant inputs are market observable or available through a consensus data service. If consensus prices are not available, these are classified as Level 3 instruments.
Equity products Derivatives Exchange traded equity options, OTC equity options and equity warrants
Due to low liquidity exchange traded options are Level 2.
Valued using industry standard models based on observable parameters such as stock prices, dividends, volatilities and interest rates.
Asset backed debt instruments
Trading securities and financial assets measured at FVIS
Investment securities
Australian residential mortgage backed securities (RMBS) and other asset backed securities (ABS)
Valued using an industry approach to value floating rate debt with prepayment features. Australian RMBS are valued using prices sourced from a consensus data provider. If consensus prices are not available these are classified as Level 3 instruments.
Non-asset backed debt instruments
Trading securities and financial assets measured at FVIS
Investment securities
Other financial liabilities
State and other government bonds, corporate bonds and commercial paper
Repurchase agreements and reverse repurchase agreements over non-asset backed debt securities
Valued using observable market prices, which are sourced from independent pricing services, broker quotes or inter-dealer prices.
Loans at fair value Loans Fixed rate bills and syndicated loans
Discounted cash flow approach, using a discount rate which reflects the terms of the instrument and the timing of cash flows, adjusted for creditworthiness, or expected sale amount.
Certificates of deposit Deposits and other borrowings Certificates of deposit Discounted cash flow using market rates offered for deposits of similar remaining maturities.
Debt issues at fair value
Debt issues Debt issues Discounted cash flows, using a discount rate which reflects the terms of the instrument and the timing of cash flows adjusted for market observable changes in Westpac’s implied credit worthiness.
Life insurance assets and liabilities
Life insurance assets
Life insurance liabilities
Corporate bonds, OTC derivatives, units in unlisted unit trusts, life insurance contract liabilities, life investment contract liabilities and external liabilities of managed investment schemes controlled by statutory life funds
Valued using observable market prices or other widely used and accepted valuation techniques utilising observable market input.
Note 13. Fair values of financial assets and liabilities (continued)
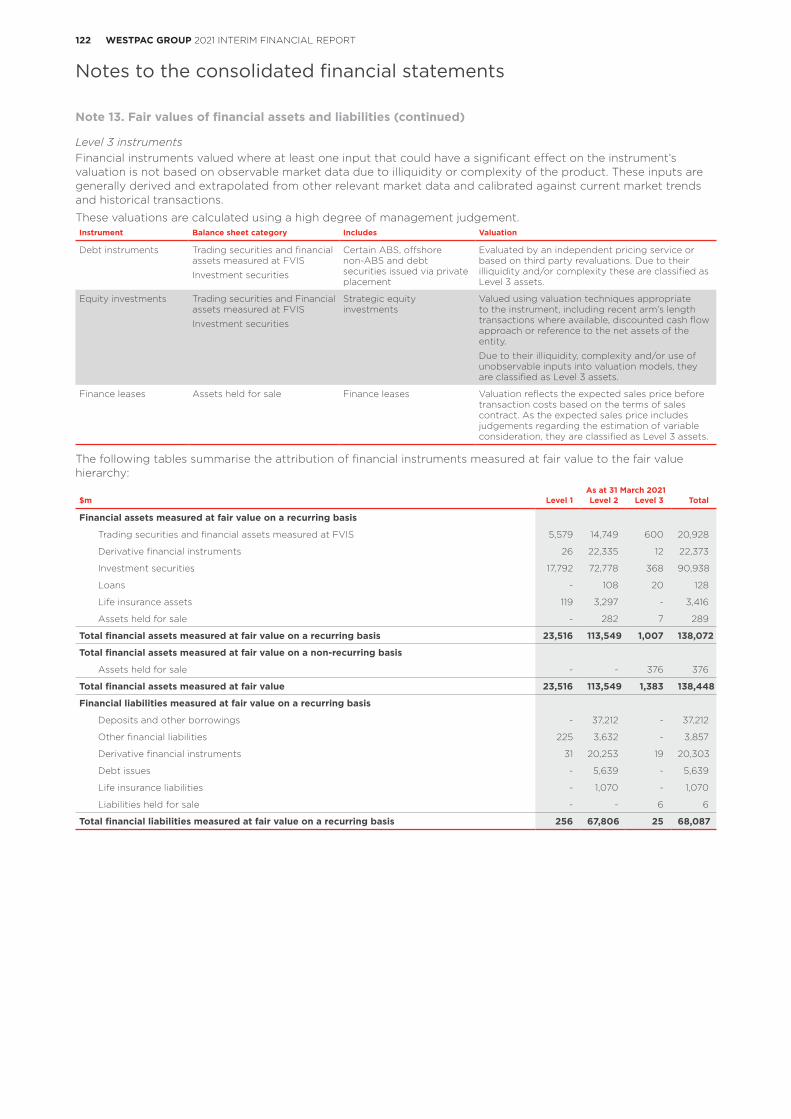
122 WESTPAC GROUP 2021 INTERIM FINANCIAL REPORT
Notes to the consolidated financial statements
Level 3 instrumentsFinancial instruments valued where at least one input that could have a significant effect on the instrument’s valuation is not based on observable market data due to illiquidity or complexity of the product. These inputs are generally derived and extrapolated from other relevant market data and calibrated against current market trends and historical transactions.
These valuations are calculated using a high degree of management judgement.Instrument Balance sheet category Includes Valuation
Debt instruments Trading securities and financial assets measured at FVIS
Investment securities
Certain ABS, offshore non-ABS and debt securities issued via private placement
Evaluated by an independent pricing service or based on third party revaluations. Due to their illiquidity and/or complexity these are classified as Level 3 assets.
Equity investments Trading securities and Financial assets measured at FVIS
Investment securities
Strategic equity investments
Valued using valuation techniques appropriate to the instrument, including recent arm’s length transactions where available, discounted cash flow approach or reference to the net assets of the entity.
Due to their illiquidity, complexity and/or use of unobservable inputs into valuation models, they are classified as Level 3 assets.
Finance leases Assets held for sale Finance leases Valuation reflects the expected sales price before transaction costs based on the terms of sales contract. As the expected sales price includes judgements regarding the estimation of variable consideration, they are classified as Level 3 assets.
The following tables summarise the attribution of financial instruments measured at fair value to the fair value hierarchy:
As at 31 March 2021$m Level 1 Level 2 Level 3 Total
Financial assets measured at fair value on a recurring basis
Trading securities and financial assets measured at FVIS 5,579 14,749 600 20,928
Derivative financial instruments 26 22,335 12 22,373
Investment securities 17,792 72,778 368 90,938
Loans - 108 20 128
Life insurance assets 119 3,297 - 3,416
Assets held for sale - 282 7 289
Total financial assets measured at fair value on a recurring basis 23,516 113,549 1,007 138,072
Total financial assets measured at fair value on a non-recurring basis
Assets held for sale - - 376 376
Total financial assets measured at fair value 23,516 113,549 1,383 138,448
Financial liabilities measured at fair value on a recurring basis
Deposits and other borrowings - 37,212 - 37,212
Other financial liabilities 225 3,632 - 3,857
Derivative financial instruments 31 20,253 19 20,303
Debt issues - 5,639 - 5,639
Life insurance liabilities - 1,070 - 1,070
Liabilities held for sale - - 6 6
Total financial liabilities measured at fair value on a recurring basis 256 67,806 25 68,087
Note 13. Fair values of financial assets and liabilities (continued)
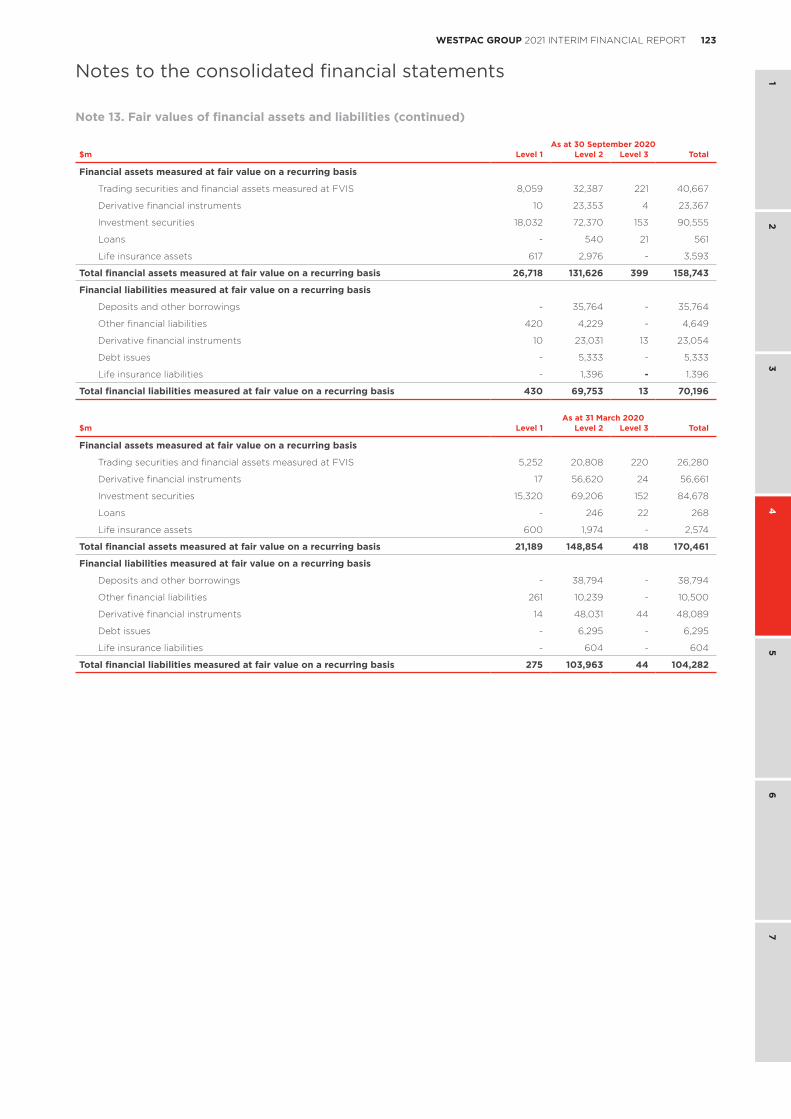
123WESTPAC GROUP 2021 INTERIM FINANCIAL REPORT
1 2
34
56
7
Notes to the consolidated financial statements
As at 30 September 2020$m Level 1 Level 2 Level 3 Total
Financial assets measured at fair value on a recurring basis
Trading securities and financial assets measured at FVIS 8,059 32,387 221 40,667
Derivative financial instruments 10 23,353 4 23,367
Investment securities 18,032 72,370 153 90,555
Loans - 540 21 561
Life insurance assets 617 2,976 - 3,593
Total financial assets measured at fair value on a recurring basis 26,718 131,626 399 158,743
Financial liabilities measured at fair value on a recurring basis
Deposits and other borrowings - 35,764 - 35,764
Other financial liabilities 420 4,229 - 4,649
Derivative financial instruments 10 23,031 13 23,054
Debt issues - 5,333 - 5,333
Life insurance liabilities - 1,396 - 1,396
Total financial liabilities measured at fair value on a recurring basis 430 69,753 13 70,196
As at 31 March 2020$m Level 1 Level 2 Level 3 Total
Financial assets measured at fair value on a recurring basis
Trading securities and financial assets measured at FVIS 5,252 20,808 220 26,280
Derivative financial instruments 17 56,620 24 56,661
Investment securities 15,320 69,206 152 84,678
Loans - 246 22 268
Life insurance assets 600 1,974 - 2,574
Total financial assets measured at fair value on a recurring basis 21,189 148,854 418 170,461
Financial liabilities measured at fair value on a recurring basis
Deposits and other borrowings - 38,794 - 38,794
Other financial liabilities 261 10,239 - 10,500
Derivative financial instruments 14 48,031 44 48,089
Debt issues - 6,295 - 6,295
Life insurance liabilities - 604 - 604
Total financial liabilities measured at fair value on a recurring basis 275 103,963 44 104,282
Note 13. Fair values of financial assets and liabilities (continued)
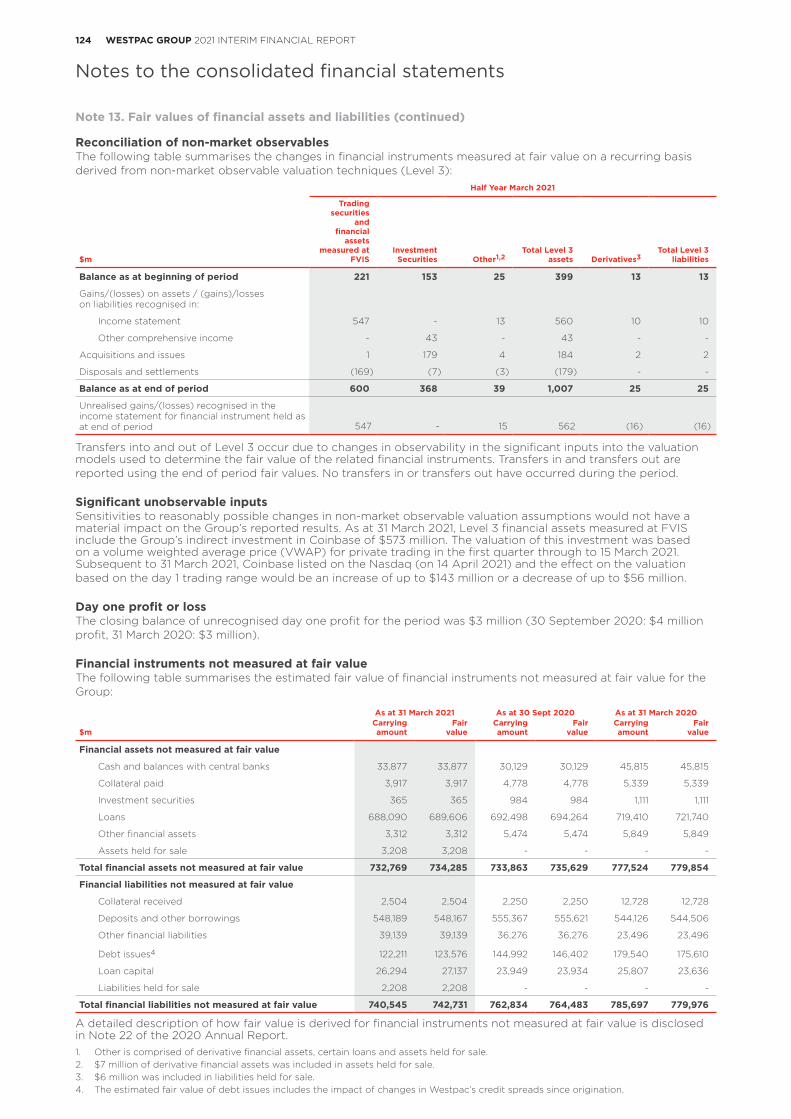
124 WESTPAC GROUP 2021 INTERIM FINANCIAL REPORT
Notes to the consolidated financial statements
Reconciliation of non-market observablesThe following table summarises the changes in financial instruments measured at fair value on a recurring basis derived from non-market observable valuation techniques (Level 3):
Half Year March 2021
$m
Trading securities
and financial
assets measured at
FVIS Investment
Securities Other1,2Total Level 3
assets Derivatives3 Total Level 3
liabilities
Balance as at beginning of period 221 153 25 399 13 13
Gains/(losses) on assets / (gains)/losses on liabilities recognised in:
Income statement 547 - 13 560 10 10
Other comprehensive income - 43 - 43 - -
Acquisitions and issues 1 179 4 184 2 2
Disposals and settlements (169) (7) (3) (179) - -
Balance as at end of period 600 368 39 1,007 25 25
Unrealised gains/(losses) recognised in the income statement for financial instrument held as at end of period 547 - 15 562 (16) (16)
Transfers into and out of Level 3 occur due to changes in observability in the significant inputs into the valuation models used to determine the fair value of the related financial instruments. Transfers in and transfers out are reported using the end of period fair values. No transfers in or transfers out have occurred during the period.
Significant unobservable inputsSensitivities to reasonably possible changes in non-market observable valuation assumptions would not have a material impact on the Group’s reported results. As at 31 March 2021, Level 3 financial assets measured at FVIS include the Group’s indirect investment in Coinbase of $573 million. The valuation of this investment was based on a volume weighted average price (VWAP) for private trading in the first quarter through to 15 March 2021. Subsequent to 31 March 2021, Coinbase listed on the Nasdaq (on 14 April 2021) and the effect on the valuation based on the day 1 trading range would be an increase of up to $143 million or a decrease of up to $56 million.
Day one profit or loss The closing balance of unrecognised day one profit for the period was $3 million (30 September 2020: $4 million profit, 31 March 2020: $3 million).
Financial instruments not measured at fair valueThe following table summarises the estimated fair value of financial instruments not measured at fair value for the Group:
As at 31 March 2021 As at 30 Sept 2020 As at 31 March 2020
$mCarrying amount
Fair value
Carrying amount
Fair value
Carrying amount
Fair value
Financial assets not measured at fair value
Cash and balances with central banks 33,877 33,877 30,129 30,129 45,815 45,815
Collateral paid 3,917 3,917 4,778 4,778 5,339 5,339
Investment securities 365 365 984 984 1,111 1,111
Loans 688,090 689,606 692,498 694,264 719,410 721,740
Other financial assets 3,312 3,312 5,474 5,474 5,849 5,849
Assets held for sale 3,208 3,208 - - - -
Total financial assets not measured at fair value 732,769 734,285 733,863 735,629 777,524 779,854
Financial liabilities not measured at fair value
Collateral received 2,504 2,504 2,250 2,250 12,728 12,728
Deposits and other borrowings 548,189 548,167 555,367 555,621 544,126 544,506
Other financial liabilities 39,139 39,139 36,276 36,276 23,496 23,496
Debt issues4 122,211 123,576 144,992 146,402 179,540 175,610
Loan capital 26,294 27,137 23,949 23,934 25,807 23,636
Liabilities held for sale 2,208 2,208 - - - -
Total financial liabilities not measured at fair value 740,545 742,731 762,834 764,483 785,697 779,976
1. Other is comprised of derivative financial assets, certain loans and assets held for sale.2. $7 million of derivative financial assets was included in assets held for sale.3. $6 million was included in liabilities held for sale.4. The estimated fair value of debt issues includes the impact of changes in Westpac’s credit spreads since origination.
Note 13. Fair values of financial assets and liabilities (continued)
A detailed description of how fair value is derived for financial instruments not measured at fair value is disclosed in Note 22 of the 2020 Annual Report.
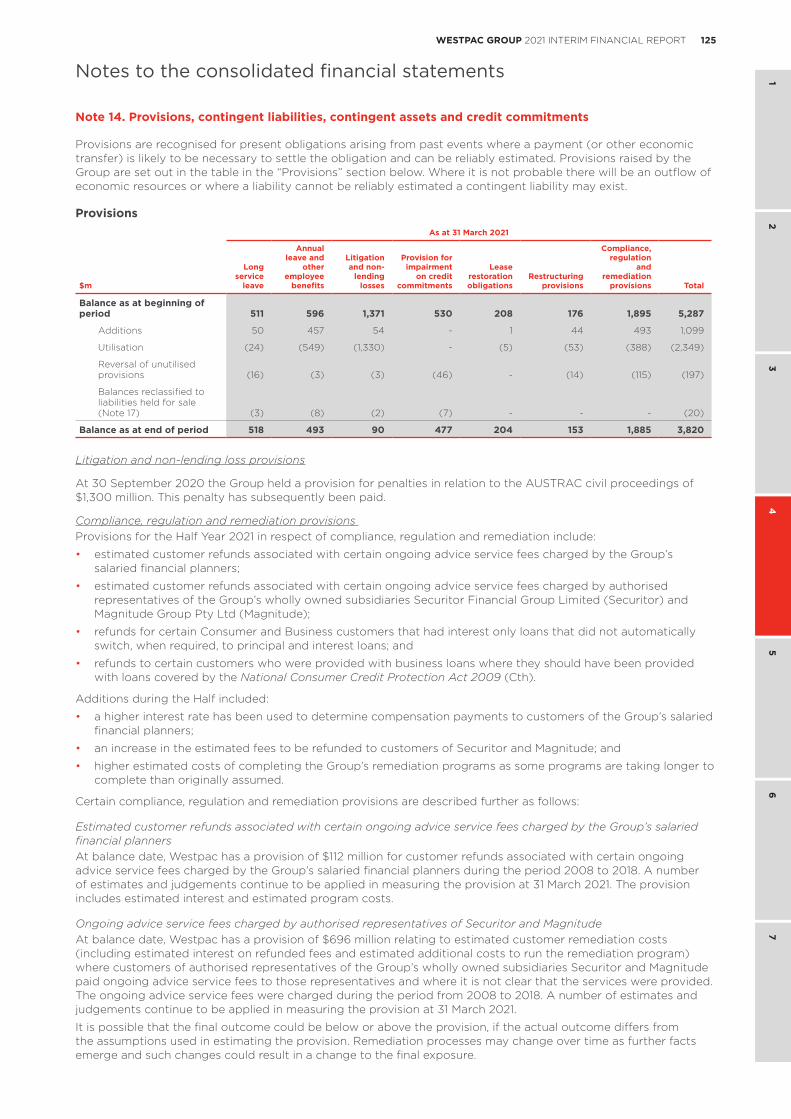
125WESTPAC GROUP 2021 INTERIM FINANCIAL REPORT
1 2
34
56
7
Notes to the consolidated financial statements
Note 14. Provisions, contingent liabilities, contingent assets and credit commitments
Provisions are recognised for present obligations arising from past events where a payment (or other economic transfer) is likely to be necessary to settle the obligation and can be reliably estimated. Provisions raised by the Group are set out in the table in the “Provisions” section below. Where it is not probable there will be an outflow of economic resources or where a liability cannot be reliably estimated a contingent liability may exist.
ProvisionsAs at 31 March 2021
$m
Long service
leave
Annual leave and
other employee
benefits
Litigation and non-
lending losses
Provision for impairment
on credit commitments
Lease restoration obligations
Restructuring provisions
Compliance, regulation
and remediation
provisions Total
Balance as at beginning of period 511 596 1,371 530 208 176 1,895 5,287
Additions 50 457 54 - 1 44 493 1,099
Utilisation (24) (549) (1,330) - (5) (53) (388) (2,349)
Reversal of unutilised provisions (16) (3) (3) (46) - (14) (115) (197)
Balances reclassified to liabilities held for sale (Note 17) (3) (8) (2) (7) - - - (20)
Balance as at end of period 518 493 90 477 204 153 1,885 3,820
Litigation and non-lending loss provisions
At 30 September 2020 the Group held a provision for penalties in relation to the AUSTRAC civil proceedings of $1,300 million. This penalty has subsequently been paid.
Compliance, regulation and remediation provisions Provisions for the Half Year 2021 in respect of compliance, regulation and remediation include:
• estimated customer refunds associated with certain ongoing advice service fees charged by the Group’s salaried financial planners;
• estimated customer refunds associated with certain ongoing advice service fees charged by authorised representatives of the Group’s wholly owned subsidiaries Securitor Financial Group Limited (Securitor) and Magnitude Group Pty Ltd (Magnitude);
• refunds for certain Consumer and Business customers that had interest only loans that did not automatically switch, when required, to principal and interest loans; and
• refunds to certain customers who were provided with business loans where they should have been provided with loans covered by the National Consumer Credit Protection Act 2009 (Cth).
Additions during the Half included:
• a higher interest rate has been used to determine compensation payments to customers of the Group’s salaried financial planners;
• an increase in the estimated fees to be refunded to customers of Securitor and Magnitude; and
• higher estimated costs of completing the Group’s remediation programs as some programs are taking longer to complete than originally assumed.
Certain compliance, regulation and remediation provisions are described further as follows:
Estimated customer refunds associated with certain ongoing advice service fees charged by the Group’s salaried financial plannersAt balance date, Westpac has a provision of $112 million for customer refunds associated with certain ongoing advice service fees charged by the Group’s salaried financial planners during the period 2008 to 2018. A number of estimates and judgements continue to be applied in measuring the provision at 31 March 2021. The provision includes estimated interest and estimated program costs.
Ongoing advice service fees charged by authorised representatives of Securitor and MagnitudeAt balance date, Westpac has a provision of $696 million relating to estimated customer remediation costs (including estimated interest on refunded fees and estimated additional costs to run the remediation program) where customers of authorised representatives of the Group’s wholly owned subsidiaries Securitor and Magnitude paid ongoing advice service fees to those representatives and where it is not clear that the services were provided. The ongoing advice service fees were charged during the period from 2008 to 2018. A number of estimates and judgements continue to be applied in measuring the provision at 31 March 2021.
It is possible that the final outcome could be below or above the provision, if the actual outcome differs from the assumptions used in estimating the provision. Remediation processes may change over time as further facts emerge and such changes could result in a change to the final exposure.
Notes to the consolidated financial statements
126 WESTPAC GROUP 2021 INTERIM FINANCIAL REPORT
Notes to the consolidated financial statements
Restructuring provisionsThe Group carries restructuring provisions in relation to changes in business restructures primarily for separation and redundancy costs.
Lease restoration obligationsThe lease restoration provision reflects an estimate of the cost of making good leasehold premises at the end of the Group’s property leases. The expected make-good cost is treated as an addition to the right-of-use asset and is depreciated over the life of those assets.
Contingent liabilitiesContingent liabilities are possible obligations whose existence will be confirmed only by uncertain future events and present obligations where the transfer of economic resources is not probable or cannot be reliably measured. Contingent liabilities are not recognised on the balance sheet but are disclosed unless the outflow of economic resource is remote.
Regulatory investigations, reviews and inquiriesRegulators, statutory authorities and other bodies routinely conduct investigations, reviews and inquiries involving the financial services sector, both in Australia and overseas. These regulatory actions may consider a range of subject matter, and in Australia, a number of regulatory investigations and reviews are currently considering potential misconduct in credit and financial services.
Domestic regulators such as ASIC, APRA, ACCC, AUSTRAC, the OAIC, the ATO and the Fair Work Ombudsman, as well as certain international regulators such as the Reserve Bank of New Zealand, Financial Markets Authority in New Zealand and Hong Kong Monetary Authority are also currently conducting investigations (some of which are industry-wide) involving the Group. Two specific areas of investigation undertaken by ASIC are:
• Ongoing advice services – A current set of regulatory actions involve investigations by ASIC into alleged ‘fee for no service’ activity. The first relates to ongoing advice services provided by the Group’s former salaried financial planners and by authorised representatives of the Group’s wholly owned subsidiaries Securitor and Magnitude, including whether the corresponding ongoing advice was provided in all circumstances and fee disclosure and renewal obligations were complied with. The second relates to advice service fees charged or deducted from some customer accounts (including platform and superannuation accounts) following the death of the relevant account holder. ASIC’s investigations relate to the periods between 2010 and 2019.
ASIC commenced both of these investigations in 2019 and is examining a range of matters, including whether Westpac had appropriate systems and processes in place to ensure that customers received the advice services that they had paid for, and the processes for ensuring ongoing fees were terminated quickly enough following the death of some members. The Group is continuing to cooperate with ASIC’s investigations and remediate affected accounts where appropriate. To date, ASIC has commenced a number of civil penalty proceedings against other financial entities in relation to fee for no service activity.
• Incorrect interest rates - ASIC is also investigating the sale and assignment of written-off credit card and flexi loan accounts to debt purchasers in relation to certain Westpac and St.George branded debt, where debt purchasers were not provided with correct interest rates. ASIC’s investigation relates to the period between 2008 to 2018.
In addition, there are investigations covering a range of other matters (some of which are industry-wide) that involve or may involve the Group in the future, including:
• the provision of financial advice, including whether personal advice obligations have been complied with and the conduct of financial planners;
• investigations by the OAIC in relation to certain practices and systems for compliance with the Privacy Act 1988 (Cth);
• financial markets conduct, including market activity prior to entering into interest rate swaps with certain customers; Westpac’s practices and processes in relation to deregistered companies, including its engagement with ASIC and rectification of the issue; and the adequacy of fee disclosure charged for our products and services; and
• other areas such as responsible lending, residential mortgages, credit portfolio management, general insurance, the provision of superannuation (including insurance in superannuation), RBNZ liquidity policy and anti-money laundering and counter-terrorism financing processes and procedures.
The Group has not received any indication of what (if any) action regulators will take following the conclusion of the investigations set out above. No provisions have yet been made in relation to any financial penalty that might arise in the event that regulators were to pursue enforcement proceedings, as any potential future liability of that kind cannot be reliably estimated at this time.
Note 14. Provisions, contingent liabilities, contingent assets and credit commitments (continued)
127WESTPAC GROUP 2021 INTERIM FINANCIAL REPORT
1 2
34
56
7
Notes to the consolidated financial statements
These investigations may result in litigation (including class action proceedings and criminal proceedings), significant fines and penalties, infringement notices, enforceable undertakings, referral to the relevant Commonwealth or State Director of Public Prosecutions for consideration for criminal prosecution, imposition of capital or liquidity requirements, licence revocation or variation, or other action being taken by regulators or other parties. Given the size of Westpac, these investigations have in some instances resulted, and could in the future result, in findings of a significant number of breaches of obligations. This in turn could lead to significant financial and other penalties.
LitigationThere are ongoing Court proceedings, claims and possible claims for and against the Group. Contingent liabilities exist in respect of actual and potential claims and proceedings, including those listed below. An assessment of the Group’s likely loss has been made on a case-by-case basis for the purpose of the financial statements but cannot always be reliably estimated, including in relation to those listed below. Except as otherwise stated, no provision has been recognised in relation to the matters below because liability is not certain and cannot be reliably estimated.
Regulatory litigation• On 7 April 2021, ASIC commenced proceedings in the Federal Court against Westpac in relation to the sale
of consumer credit insurance (CCI) products to approximately 384 customers. The proceedings relate to allegations that Westpac supplied CCI to certain customers who had not requested or agreed to acquire this product. ASIC is seeking, among other things, declarations of contraventions of certain civil penalty provisions and unspecified monetary penalties relating to the period from 7 April 2015 to 28 July 2015. Westpac has not sold CCI products since 2019.
Class actions
The Group is currently defending the following four class actions:• On 5 September 2019, a class action against BTFM and WLIS was commenced in the Federal Court of Australia
in relation to aspects of BTFM’s BT Super for Life cash investment option. The claim follows other industry class actions. It is alleged that BTFM failed to adhere to a number of obligations under the general law, the relevant trust deed and the Superannuation Industry (Supervision) Act 1993 (Cth), and that WLIS was knowingly concerned with BTFM’s alleged contraventions. The damages sought are unspecified.
• A class action proceeding was commenced in December 2019 in the Federal Court of Australia on behalf of certain investors who acquired an interest in Westpac securities between 16 December 2013 and 19 November 2019. The proceeding involves allegations relating to market disclosure issues connected to Westpac’s monitoring of financial crime over the relevant period and matters which were the subject of the recent AUSTRAC proceedings. The damages sought are unspecified. However, given the time period in question and the nature of the claims, it is likely that the damages alleged will be significant.
• On 28 February 2020, a class action was commenced against Westpac, Westpac General Insurance Limited and WLIS in the Federal Court of Australia in relation to Westpac’s sale of CCI. The claim follows other industry class actions. It is alleged that the three entities failed to adhere to a number of obligations in selling CCI in conjunction with credit cards, personal loans and flexi loans. The damages sought are unspecified.
• On 16 July 2020, a class action was commenced against Westpac and St George Finance Limited (SGF) in the Supreme Court of Victoria in relation to flex commissions paid to auto dealers from 1 March 2013 to 31 October 2018. This proceeding is one of two class actions commenced against a number of lenders in the auto finance industry. It is alleged that Westpac and SGF are liable for the unfair conduct of dealers acting as credit representatives and engaged in misleading or deceptive conduct. The damages sought are unspecified. Another law firm publicly announced in July 2020 that it is preparing to commence a class action against Westpac entities for similar conduct. Westpac has not been served with a claim from that law firm in relation to such conduct. Westpac has not paid flex commissions since 1 November 2018 following an industry-wide ban issued by ASIC.
Westpac is aware from media reports and other publicly available material that other class actions against Westpac entities are being investigated. In July 2020, a law firm publicly stated that it intends to commence a class action against BTFM alleging that since 2014, BTFM did not act in the best interests of members of certain superannuation funds when obtaining group insurance policies. In August 2020, another law firm announced that it is investigating claims on behalf of persons who in the past 6 years acquired, renewed or continued to hold a financial product (including life insurance) on the advice or recommendation of a financial adviser from Magnitude, Securitor or Westpac. Westpac has not been served with a claim in relation to either of these matters and has no further information about the proposed claims beyond the public statements issued by the law firms involved.
Note 14. Provisions, contingent liabilities, contingent assets and credit commitments (continued)
128 WESTPAC GROUP 2021 INTERIM FINANCIAL REPORT
Notes to the consolidated financial statements
Australian Financial Complaints AuthorityContingent liabilities may also exist in relation to customer complaints brought before the Australian Financial Complaints Authority (AFCA). AFCA has the power to make determinations about complaints and can award compensation up to certain thresholds. AFCA has a broader jurisdiction than previous dispute resolution bodies which it has replaced.
Internal reviews and remediationAs in prior periods, Westpac is continuing to undertake a number of reviews to identify and resolve prior issues that have the potential to impact our customers, employees, other relevant stakeholders and reputation. These internal reviews continue to identify a number of issues in respect of which we are taking steps or will take steps to put things right so that our customers and employees (as applicable) are not at a disadvantage from certain past practices, including making compensation/remediation payments to customers and providing refunds where identified. These issues include, among other things, compliance with lending obligations (including responsible lending) which is an area of industry focus, the provision of credit in accordance with the National Consumer Credit Protection Act 2009 (Cth), the charging of certain Wealth fees, the processing of corporate actions, payroll processes, regulatory reporting and the way some product terms and conditions are operationalised. By undertaking these reviews we can also improve our processes and controls. An assessment of the Group’s likely loss has been made on a case-by-case basis for the purpose of the financial statements but cannot always be reliably estimated. Contingent liabilities may exist in respect of actual or potential claims (which could be brought by customers or regulators), compensation/remediation payments and/or refunds identified as part of these reviews.
Financial Claims Scheme
Under the Financial Claims Scheme (FCS), the Australian Government provides depositors a free guarantee of deposits in eligible ADIs up to and including $250,000. The FCS applies to an eligible ADI if APRA has applied for the winding up of the ADI and the responsible Australian Government minister has declared that the FCS applies to the ADI.
The Financial Claims Scheme (ADIs) Levy Act 2008 (Cth) provides for the imposition of a levy to fund the excess of certain APRA FCS costs connected to an ADI, including payments by APRA to deposit holders in a failed ADI. The levy would be imposed on liabilities of eligible ADIs to their depositors and cannot be more than 0.5% of the amount of those liabilities. A contingent liability may exist in respect of any levy imposed under the FCS.
Contingent tax riskTax and regulatory authorities in Australia and in other jurisdictions are reviewing the taxation treatment of certain transactions (both historical and present-day transactions) undertaken by the Group in the course of normal business activities and the claiming of tax incentives and indirect taxes such as GST. The Group also responds to various notices and requests for information it receives from tax and regulatory authorities.
These reviews, notices and requests may result in additional tax liabilities (including interest and penalties).
The Group has assessed these and other taxation claims arising in Australia and elsewhere, including seeking independent advice.
Settlement riskThe Group is subject to a credit risk exposure in the event that another counterparty fails to settle for its payments clearing activities (including foreign exchange). The Group seeks to minimise credit risk arising from settlement risk in the payments system by aligning our processing method with the legal certainty of settlement in the relevant clearing mechanism.
Parent Entity guarantees and undertakingsThe Parent Entity makes the following guarantees and undertakings to subsidiaries:
• letters of comfort for certain subsidiaries which recognise that Westpac has a responsibility that those subsidiaries continue to meet their obligations; and
• guarantees to certain wholly owned subsidiaries which are Australian financial services or credit licensees to comply with legislative requirements. Each guarantee is capped at $40 million per year and can only be utilised if the entity concerned becomes legally obliged to pay for a claim under the relevant licence. The Parent Entity has a right to recover any funds payable under the guarantees from the relevant subsidiary.
Note 14. Provisions, contingent liabilities, contingent assets and credit commitments (continued)
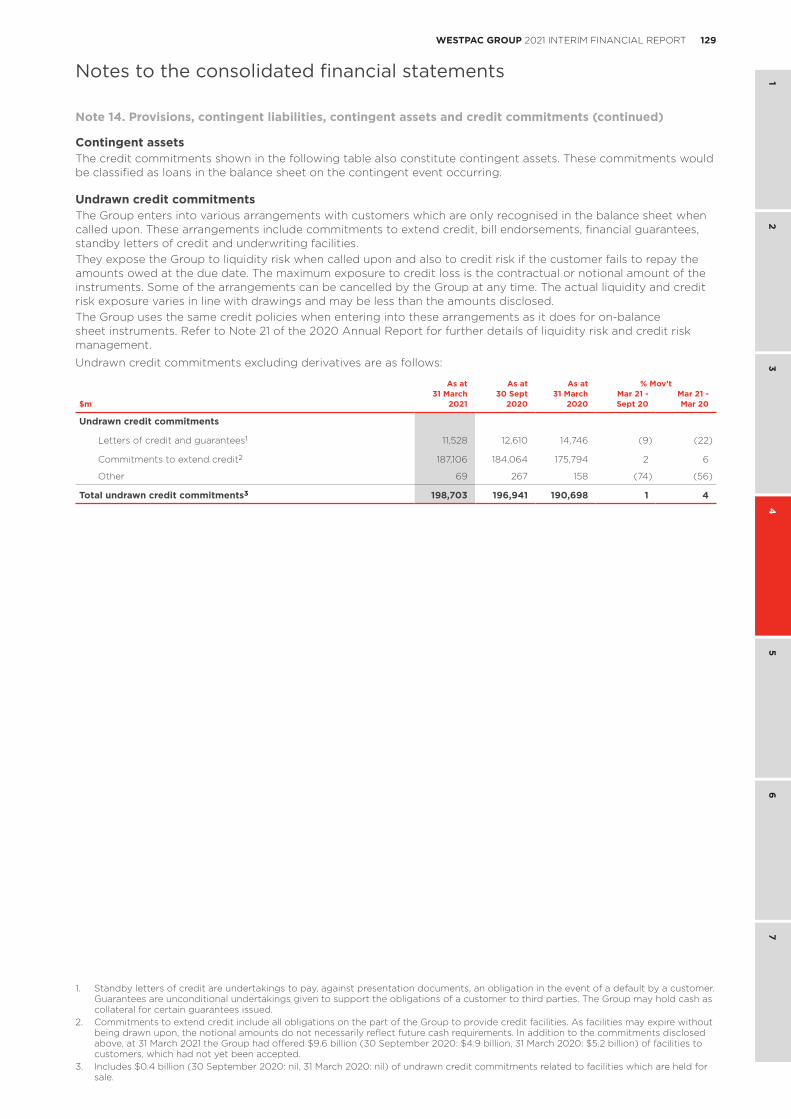
129WESTPAC GROUP 2021 INTERIM FINANCIAL REPORT
1 2
34
56
7
Notes to the consolidated financial statements
Contingent assetsThe credit commitments shown in the following table also constitute contingent assets. These commitments would be classified as loans in the balance sheet on the contingent event occurring.
Undrawn credit commitmentsThe Group enters into various arrangements with customers which are only recognised in the balance sheet when called upon. These arrangements include commitments to extend credit, bill endorsements, financial guarantees, standby letters of credit and underwriting facilities.They expose the Group to liquidity risk when called upon and also to credit risk if the customer fails to repay the amounts owed at the due date. The maximum exposure to credit loss is the contractual or notional amount of the instruments. Some of the arrangements can be cancelled by the Group at any time. The actual liquidity and credit risk exposure varies in line with drawings and may be less than the amounts disclosed.The Group uses the same credit policies when entering into these arrangements as it does for on-balance sheet instruments. Refer to Note 21 of the 2020 Annual Report for further details of liquidity risk and credit risk management.
Undrawn credit commitments excluding derivatives are as follows:
As at As at As at % Mov’t31 March 30 Sept 31 March Mar 21 - Mar 21 -
$m 2021 2020 2020 Sept 20 Mar 20
Undrawn credit commitments
Letters of credit and guarantees1 11,528 12,610 14,746 (9) (22)
Commitments to extend credit2 187,106 184,064 175,794 2 6
Other 69 267 158 (74) (56)
Total undrawn credit commitments3 198,703 196,941 190,698 1 4
1. Standby letters of credit are undertakings to pay, against presentation documents, an obligation in the event of a default by a customer. Guarantees are unconditional undertakings given to support the obligations of a customer to third parties. The Group may hold cash as collateral for certain guarantees issued.
2. Commitments to extend credit include all obligations on the part of the Group to provide credit facilities. As facilities may expire without being drawn upon, the notional amounts do not necessarily reflect future cash requirements. In addition to the commitments disclosed above, at 31 March 2021 the Group had offered $9.6 billion (30 September 2020: $4.9 billion, 31 March 2020: $5.2 billion) of facilities to customers, which had not yet been accepted.
3. Includes $0.4 billion (30 September 2020: nil, 31 March 2020: nil) of undrawn credit commitments related to facilities which are held for sale.
Note 14. Provisions, contingent liabilities, contingent assets and credit commitments (continued)
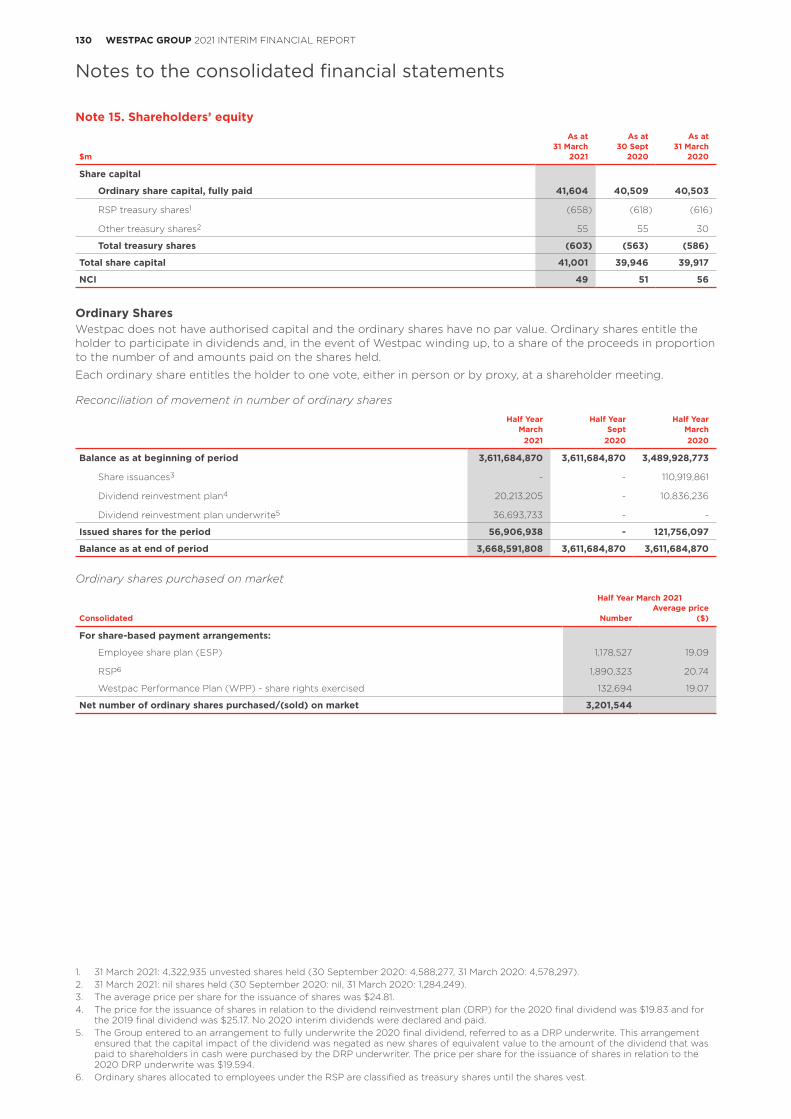
131130 WESTPAC GROUP 2021 INTERIM FINANCIAL REPORT WESTPAC GROUP 2021 INTERIM FINANCIAL REPORT
Notes to the consolidated financial statements
Note 15. Shareholders’ equityAs at As at As at
31 March 30 Sept 31 March$m 2021 2020 2020
Share capital
Ordinary share capital, fully paid 41,604 40,509 40,503
RSP treasury shares1 (658) (618) (616)
Other treasury shares2 55 55 30
Total treasury shares (603) (563) (586)
Total share capital 41,001 39,946 39,917
NCI 49 51 56
Ordinary SharesWestpac does not have authorised capital and the ordinary shares have no par value. Ordinary shares entitle the holder to participate in dividends and, in the event of Westpac winding up, to a share of the proceeds in proportion to the number of and amounts paid on the shares held.
Each ordinary share entitles the holder to one vote, either in person or by proxy, at a shareholder meeting.
Reconciliation of movement in number of ordinary shares
Half Year Half Year Half YearMarch Sept March
2021 2020 2020
Balance as at beginning of period 3,611,684,870 3,611,684,870 3,489,928,773
Share issuances3 - - 110,919,861
Dividend reinvestment plan4 20,213,205 - 10,836,236
Dividend reinvestment plan underwrite5 36,693,733 - -
Issued shares for the period 56,906,938 - 121,756,097
Balance as at end of period 3,668,591,808 3,611,684,870 3,611,684,870
Ordinary shares purchased on market
Half Year March 2021Average price
Consolidated Number ($)
For share-based payment arrangements:
Employee share plan (ESP) 1,178,527 19.09
RSP6 1,890,323 20.74
Westpac Performance Plan (WPP) - share rights exercised 132,694 19.07
Net number of ordinary shares purchased/(sold) on market 3,201,544
1. 31 March 2021: 4,322,935 unvested shares held (30 September 2020: 4,588,277, 31 March 2020: 4,578,297).2. 31 March 2021: nil shares held (30 September 2020: nil, 31 March 2020: 1,284,249).3. The average price per share for the issuance of shares was $24.81.4. The price for the issuance of shares in relation to the dividend reinvestment plan (DRP) for the 2020 final dividend was $19.83 and for
the 2019 final dividend was $25.17. No 2020 interim dividends were declared and paid.5. The Group entered to an arrangement to fully underwrite the 2020 final dividend, referred to as a DRP underwrite. This arrangement
ensured that the capital impact of the dividend was negated as new shares of equivalent value to the amount of the dividend that was paid to shareholders in cash were purchased by the DRP underwriter. The price per share for the issuance of shares in relation to the 2020 DRP underwrite was $19.594.
6. Ordinary shares allocated to employees under the RSP are classified as treasury shares until the shares vest.
Notes to the consolidated financial statements
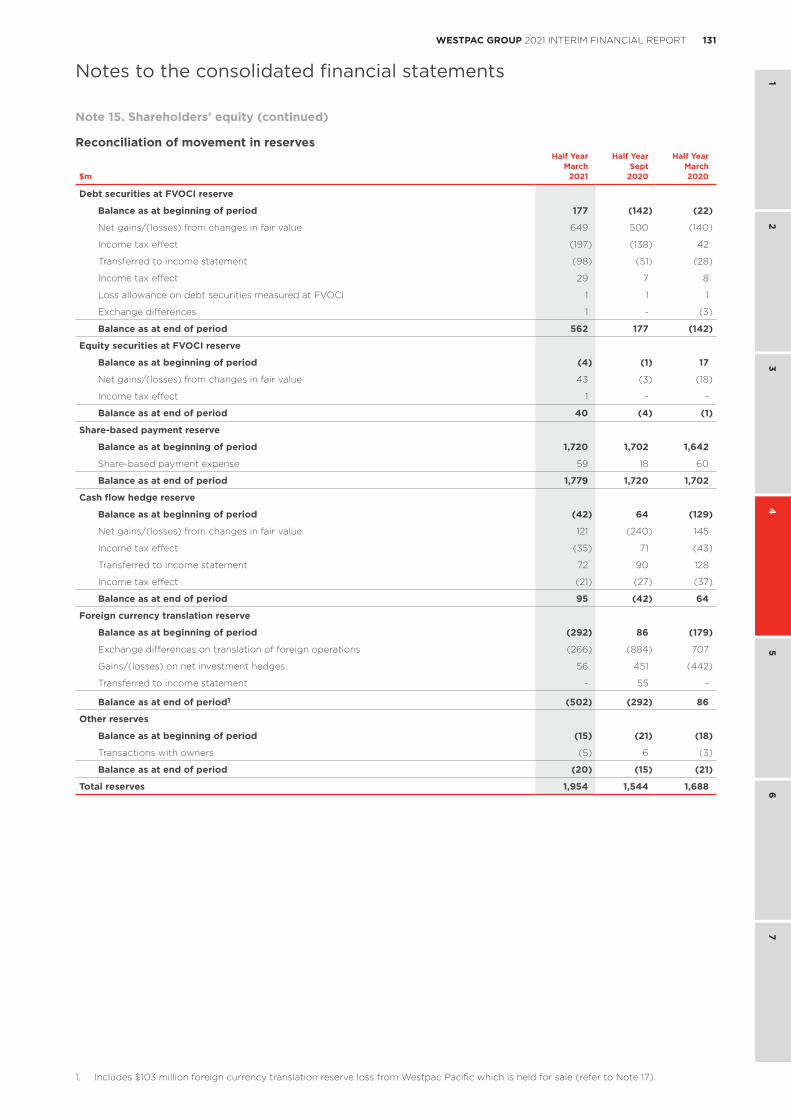
131130 WESTPAC GROUP 2021 INTERIM FINANCIAL REPORT WESTPAC GROUP 2021 INTERIM FINANCIAL REPORT
1 2
34
56
7
Notes to the consolidated financial statements
Reconciliation of movement in reservesHalf Year Half Year Half Year
March Sept March$m 2021 2020 2020
Debt securities at FVOCI reserve
Balance as at beginning of period 177 (142) (22)
Net gains/(losses) from changes in fair value 649 500 (140)
Income tax effect (197) (138) 42
Transferred to income statement (98) (51) (28)
Income tax effect 29 7 8
Loss allowance on debt securities measured at FVOCI 1 1 1
Exchange differences 1 - (3)
Balance as at end of period 562 177 (142)
Equity securities at FVOCI reserve
Balance as at beginning of period (4) (1) 17
Net gains/(losses) from changes in fair value 43 (3) (18)
Income tax effect 1 - -
Balance as at end of period 40 (4) (1)
Share-based payment reserve
Balance as at beginning of period 1,720 1,702 1,642
Share-based payment expense 59 18 60
Balance as at end of period 1,779 1,720 1,702
Cash flow hedge reserve
Balance as at beginning of period (42) 64 (129)
Net gains/(losses) from changes in fair value 121 (240) 145
Income tax effect (35) 71 (43)
Transferred to income statement 72 90 128
Income tax effect (21) (27) (37)
Balance as at end of period 95 (42) 64
Foreign currency translation reserve
Balance as at beginning of period (292) 86 (179)
Exchange differences on translation of foreign operations (266) (884) 707
Gains/(losses) on net investment hedges 56 451 (442)
Transferred to income statement - 55 -
Balance as at end of period1 (502) (292) 86
Other reserves
Balance as at beginning of period (15) (21) (18)
Transactions with owners (5) 6 (3)
Balance as at end of period (20) (15) (21)
Total reserves 1,954 1,544 1,688
Note 15. Shareholders’ equity (continued)
1. Includes $103 million foreign currency translation reserve loss from Westpac Pacific which is held for sale (refer to Note 17).
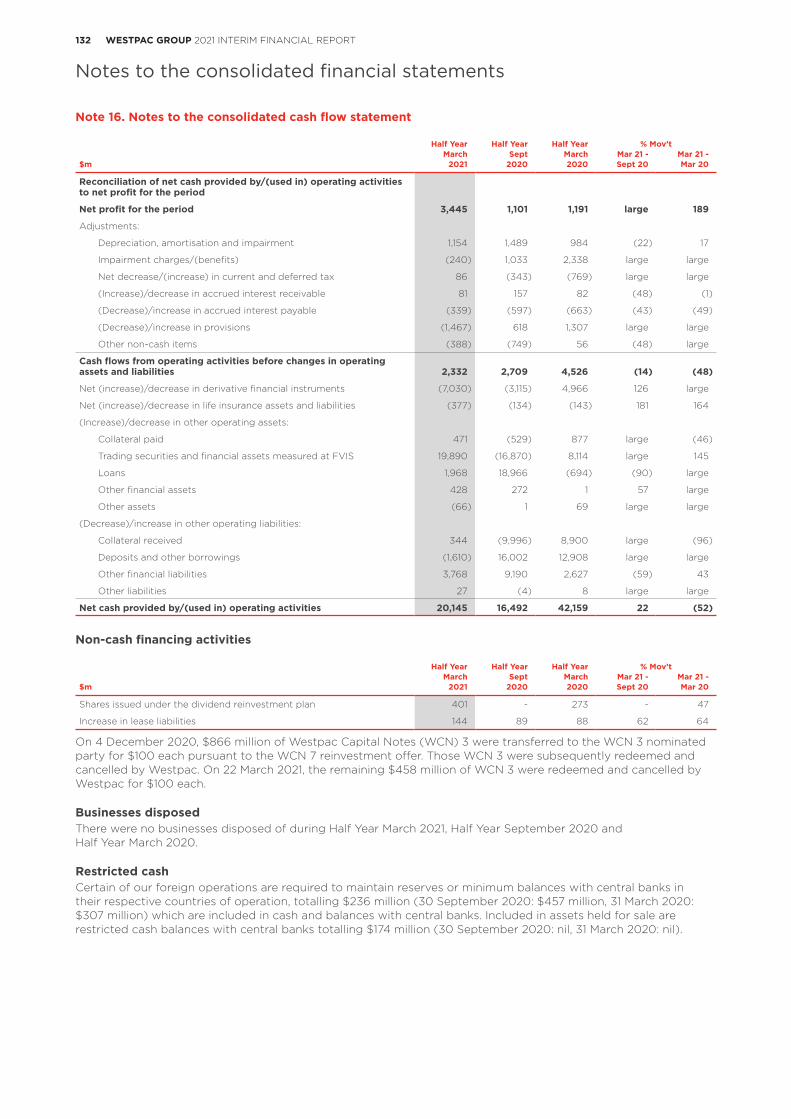
133132 WESTPAC GROUP 2021 INTERIM FINANCIAL REPORT WESTPAC GROUP 2021 INTERIM FINANCIAL REPORT
Notes to the consolidated financial statements
Note 16. Notes to the consolidated cash flow statement
Half Year Half Year Half Year % Mov’tMarch Sept March Mar 21 - Mar 21 -
$m 2021 2020 2020 Sept 20 Mar 20
Reconciliation of net cash provided by/(used in) operating activities to net profit for the period
Net profit for the period 3,445 1,101 1,191 large 189
Adjustments:
Depreciation, amortisation and impairment 1,154 1,489 984 (22) 17
Impairment charges/(benefits) (240) 1,033 2,338 large large
Net decrease/(increase) in current and deferred tax 86 (343) (769) large large
(Increase)/decrease in accrued interest receivable 81 157 82 (48) (1)
(Decrease)/increase in accrued interest payable (339) (597) (663) (43) (49)
(Decrease)/increase in provisions (1,467) 618 1,307 large large
Other non-cash items (388) (749) 56 (48) large
Cash flows from operating activities before changes in operating assets and liabilities 2,332 2,709 4,526 (14) (48)
Net (increase)/decrease in derivative financial instruments (7,030) (3,115) 4,966 126 large
Net (increase)/decrease in life insurance assets and liabilities (377) (134) (143) 181 164
(Increase)/decrease in other operating assets:
Collateral paid 471 (529) 877 large (46)
Trading securities and financial assets measured at FVIS 19,890 (16,870) 8,114 large 145
Loans 1,968 18,966 (694) (90) large
Other financial assets 428 272 1 57 large
Other assets (66) 1 69 large large
(Decrease)/increase in other operating liabilities:
Collateral received 344 (9,996) 8,900 large (96)
Deposits and other borrowings (1,610) 16,002 12,908 large large
Other financial liabilities 3,768 9,190 2,627 (59) 43
Other liabilities 27 (4) 8 large large
Net cash provided by/(used in) operating activities 20,145 16,492 42,159 22 (52)
Non-cash financing activities
Half Year Half Year Half Year % Mov’tMarch Sept March Mar 21 - Mar 21 -
$m 2021 2020 2020 Sept 20 Mar 20
Shares issued under the dividend reinvestment plan 401 - 273 - 47
Increase in lease liabilities 144 89 88 62 64
On 4 December 2020, $866 million of Westpac Capital Notes (WCN) 3 were transferred to the WCN 3 nominated party for $100 each pursuant to the WCN 7 reinvestment offer. Those WCN 3 were subsequently redeemed and cancelled by Westpac. On 22 March 2021, the remaining $458 million of WCN 3 were redeemed and cancelled by Westpac for $100 each.
Businesses disposed There were no businesses disposed of during Half Year March 2021, Half Year September 2020 and Half Year March 2020.
Restricted cashCertain of our foreign operations are required to maintain reserves or minimum balances with central banks in their respective countries of operation, totalling $236 million (30 September 2020: $457 million, 31 March 2020: $307 million) which are included in cash and balances with central banks. Included in assets held for sale are restricted cash balances with central banks totalling $174 million (30 September 2020: nil, 31 March 2020: nil).
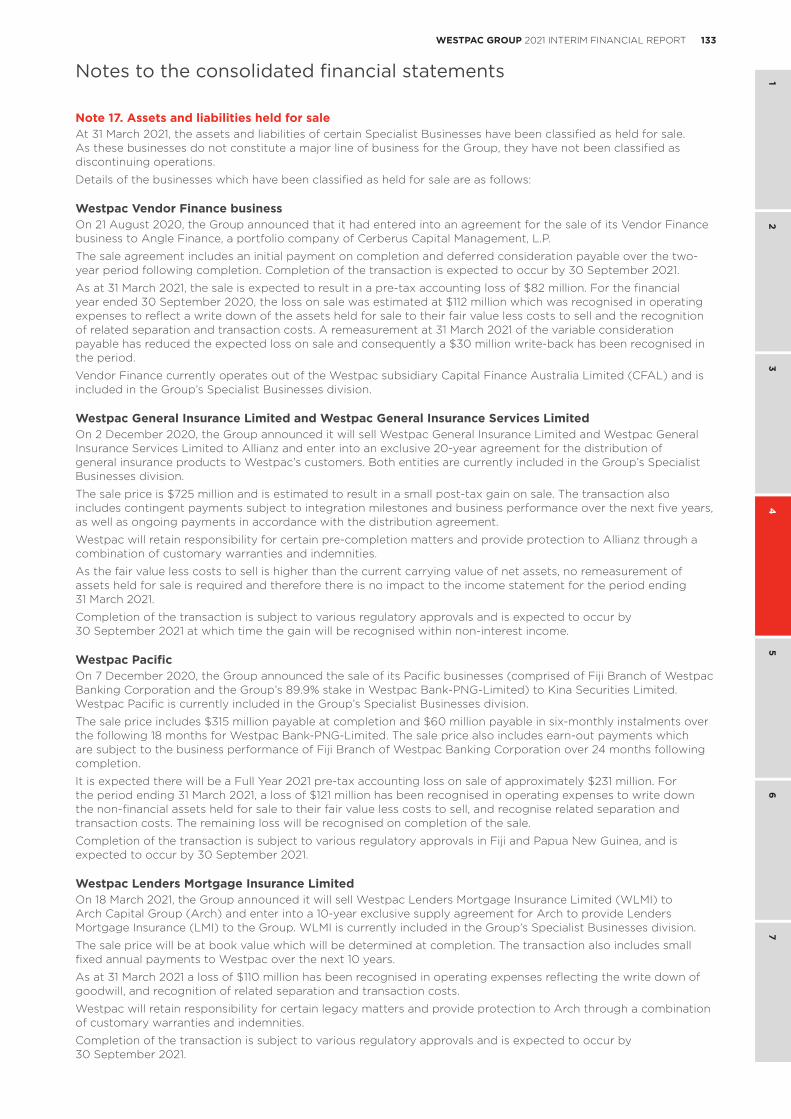
133132 WESTPAC GROUP 2021 INTERIM FINANCIAL REPORT WESTPAC GROUP 2021 INTERIM FINANCIAL REPORT
1 2
34
56
7
Notes to the consolidated financial statements
Note 17. Assets and liabilities held for saleAt 31 March 2021, the assets and liabilities of certain Specialist Businesses have been classified as held for sale. As these businesses do not constitute a major line of business for the Group, they have not been classified as discontinuing operations.
Details of the businesses which have been classified as held for sale are as follows:
Westpac Vendor Finance businessOn 21 August 2020, the Group announced that it had entered into an agreement for the sale of its Vendor Finance business to Angle Finance, a portfolio company of Cerberus Capital Management, L.P.
The sale agreement includes an initial payment on completion and deferred consideration payable over the two-year period following completion. Completion of the transaction is expected to occur by 30 September 2021.
As at 31 March 2021, the sale is expected to result in a pre-tax accounting loss of $82 million. For the financial year ended 30 September 2020, the loss on sale was estimated at $112 million which was recognised in operating expenses to reflect a write down of the assets held for sale to their fair value less costs to sell and the recognition of related separation and transaction costs. A remeasurement at 31 March 2021 of the variable consideration payable has reduced the expected loss on sale and consequently a $30 million write-back has been recognised in the period.
Vendor Finance currently operates out of the Westpac subsidiary Capital Finance Australia Limited (CFAL) and is included in the Group’s Specialist Businesses division.
Westpac General Insurance Limited and Westpac General Insurance Services Limited On 2 December 2020, the Group announced it will sell Westpac General Insurance Limited and Westpac General Insurance Services Limited to Allianz and enter into an exclusive 20-year agreement for the distribution of general insurance products to Westpac’s customers. Both entities are currently included in the Group’s Specialist Businesses division.
The sale price is $725 million and is estimated to result in a small post-tax gain on sale. The transaction also includes contingent payments subject to integration milestones and business performance over the next five years, as well as ongoing payments in accordance with the distribution agreement.
Westpac will retain responsibility for certain pre-completion matters and provide protection to Allianz through a combination of customary warranties and indemnities.
As the fair value less costs to sell is higher than the current carrying value of net assets, no remeasurement of assets held for sale is required and therefore there is no impact to the income statement for the period ending 31 March 2021.
Completion of the transaction is subject to various regulatory approvals and is expected to occur by 30 September 2021 at which time the gain will be recognised within non-interest income.
Westpac PacificOn 7 December 2020, the Group announced the sale of its Pacific businesses (comprised of Fiji Branch of Westpac Banking Corporation and the Group’s 89.9% stake in Westpac Bank-PNG-Limited) to Kina Securities Limited. Westpac Pacific is currently included in the Group’s Specialist Businesses division.
The sale price includes $315 million payable at completion and $60 million payable in six-monthly instalments over the following 18 months for Westpac Bank-PNG-Limited. The sale price also includes earn-out payments which are subject to the business performance of Fiji Branch of Westpac Banking Corporation over 24 months following completion.
It is expected there will be a Full Year 2021 pre-tax accounting loss on sale of approximately $231 million. For the period ending 31 March 2021, a loss of $121 million has been recognised in operating expenses to write down the non-financial assets held for sale to their fair value less costs to sell, and recognise related separation and transaction costs. The remaining loss will be recognised on completion of the sale.
Completion of the transaction is subject to various regulatory approvals in Fiji and Papua New Guinea, and is expected to occur by 30 September 2021.
Westpac Lenders Mortgage Insurance LimitedOn 18 March 2021, the Group announced it will sell Westpac Lenders Mortgage Insurance Limited (WLMI) to Arch Capital Group (Arch) and enter into a 10-year exclusive supply agreement for Arch to provide Lenders Mortgage Insurance (LMI) to the Group. WLMI is currently included in the Group’s Specialist Businesses division.
The sale price will be at book value which will be determined at completion. The transaction also includes small fixed annual payments to Westpac over the next 10 years.
As at 31 March 2021 a loss of $110 million has been recognised in operating expenses reflecting the write down of goodwill, and recognition of related separation and transaction costs.
Westpac will retain responsibility for certain legacy matters and provide protection to Arch through a combination of customary warranties and indemnities.
Completion of the transaction is subject to various regulatory approvals and is expected to occur by 30 September 2021.
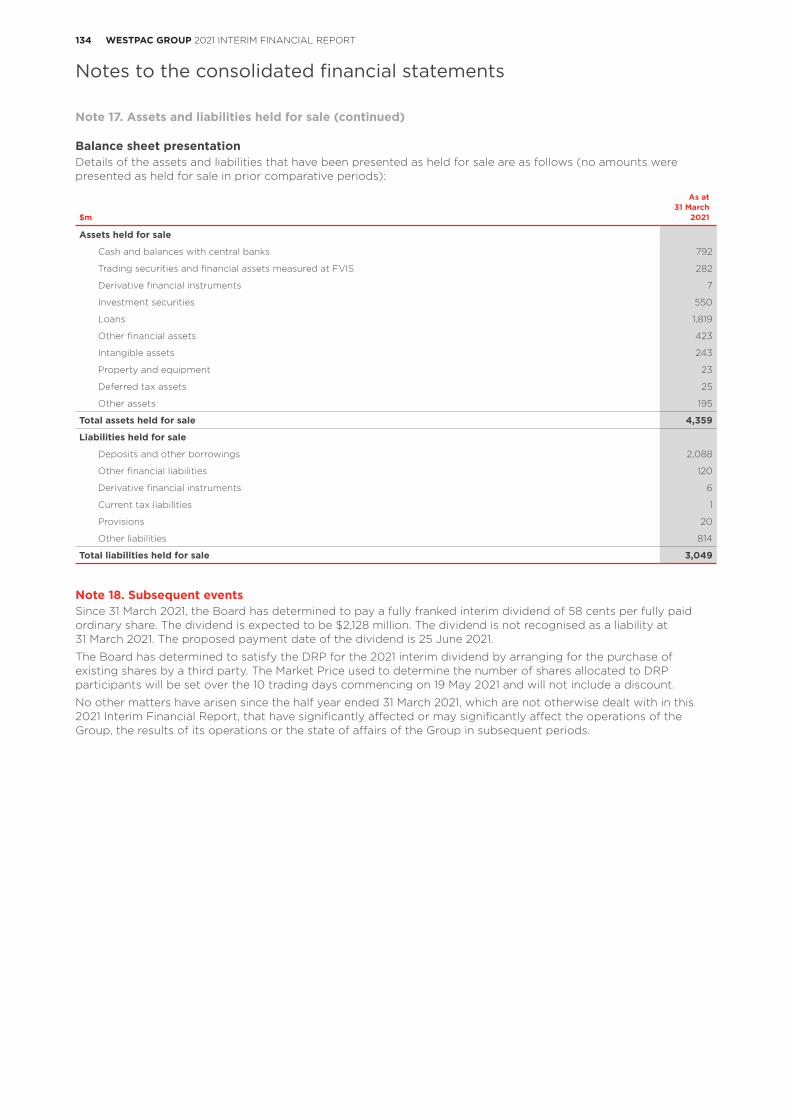
135134 WESTPAC GROUP 2021 INTERIM FINANCIAL REPORT WESTPAC GROUP 2021 INTERIM FINANCIAL REPORT
Notes to the consolidated financial statements
Note 17. Assets and liabilities held for sale (continued)
Balance sheet presentationDetails of the assets and liabilities that have been presented as held for sale are as follows (no amounts were presented as held for sale in prior comparative periods):
Note 18. Subsequent eventsSince 31 March 2021, the Board has determined to pay a fully franked interim dividend of 58 cents per fully paid ordinary share. The dividend is expected to be $2,128 million. The dividend is not recognised as a liability at 31 March 2021. The proposed payment date of the dividend is 25 June 2021.
The Board has determined to satisfy the DRP for the 2021 interim dividend by arranging for the purchase of existing shares by a third party. The Market Price used to determine the number of shares allocated to DRP participants will be set over the 10 trading days commencing on 19 May 2021 and will not include a discount.
No other matters have arisen since the half year ended 31 March 2021, which are not otherwise dealt with in this 2021 Interim Financial Report, that have significantly affected or may significantly affect the operations of the Group, the results of its operations or the state of affairs of the Group in subsequent periods.
As at31 March
$m 2021
Assets held for sale
Cash and balances with central banks 792
Trading securities and financial assets measured at FVIS 282
Derivative financial instruments 7
Investment securities 550
Loans 1,819
Other financial assets 423
Intangible assets 243
Property and equipment 23
Deferred tax assets 25
Other assets 195
Total assets held for sale 4,359
Liabilities held for sale
Deposits and other borrowings 2,088
Other financial liabilities 120
Derivative financial instruments 6
Current tax liabilities 1
Provisions 20
Other liabilities 814
Total liabilities held for sale 3,049
135134 WESTPAC GROUP 2021 INTERIM FINANCIAL REPORT WESTPAC GROUP 2021 INTERIM FINANCIAL REPORT
1 2
34
56
7
Statutory statements
4.8 Statutory statements
Directors’ declarationIn the Directors’ opinion
(i) the interim financial statements and notes set out on pages 98 to 134 are in accordance with the Corporations Act 2001, including that they:
a. comply with Australian Accounting Standards, the Corporations Regulations 2001 and other mandatory professional reporting requirements; and
b. give a true and fair view of the Group’s financial position as at 31 March 2021 and of its performance for the six months ended 31 March 2021; and
(ii) there are reasonable grounds to believe that Westpac will be able to pay its debts as and when they become due and payable.
This declaration is made in accordance with a resolution of the Directors.
For and on behalf of the Board
John McFarlane Peter KingChairman Managing Director and Chief Executive OfficerSydney, Australia2 May 2021
Statutory statements
137136 WESTPAC GROUP 2021 INTERIM FINANCIAL REPORT WESTPAC GROUP 2021 INTERIM FINANCIAL REPORT
Statutory statements
PricewaterhouseCoopers, ABN 52 780 433 757 One International Towers Sydney, Watermans Quay, Barangaroo, GPO BOX 2650, SYDNEY NSW 2001 T: +61 2 8266 0000, F: +61 2 8266 9999, www.pwc.com.au
Liability limited by a scheme approved under Professional Standards Legislation.
137136 WESTPAC GROUP 2021 INTERIM FINANCIAL REPORT WESTPAC GROUP 2021 INTERIM FINANCIAL REPORT
1 2
34
56
7
Statutory statements
138 WESTPAC GROUP 2021 INTERIM FINANCIAL RESULTS
Cash earnings financial information
5.0 Cash earnings financial information
Note 1 Interest spread and margin analysis (cash earnings basis) 139
Note 2 Average balance sheet and interest rates (cash earnings basis) 140
Note 3 Net interest income (cash earnings basis) 141
Note 4 Non-interest income (cash earnings basis) 142
Note 5 Operating expenses (cash earnings basis) 143
Note 6 Deferred expenses 144
Note 7 Earnings per share (cash earnings basis) 144
Note 8 Group earnings reconciliation 145
Note 9 Divisional result and economic profit 148
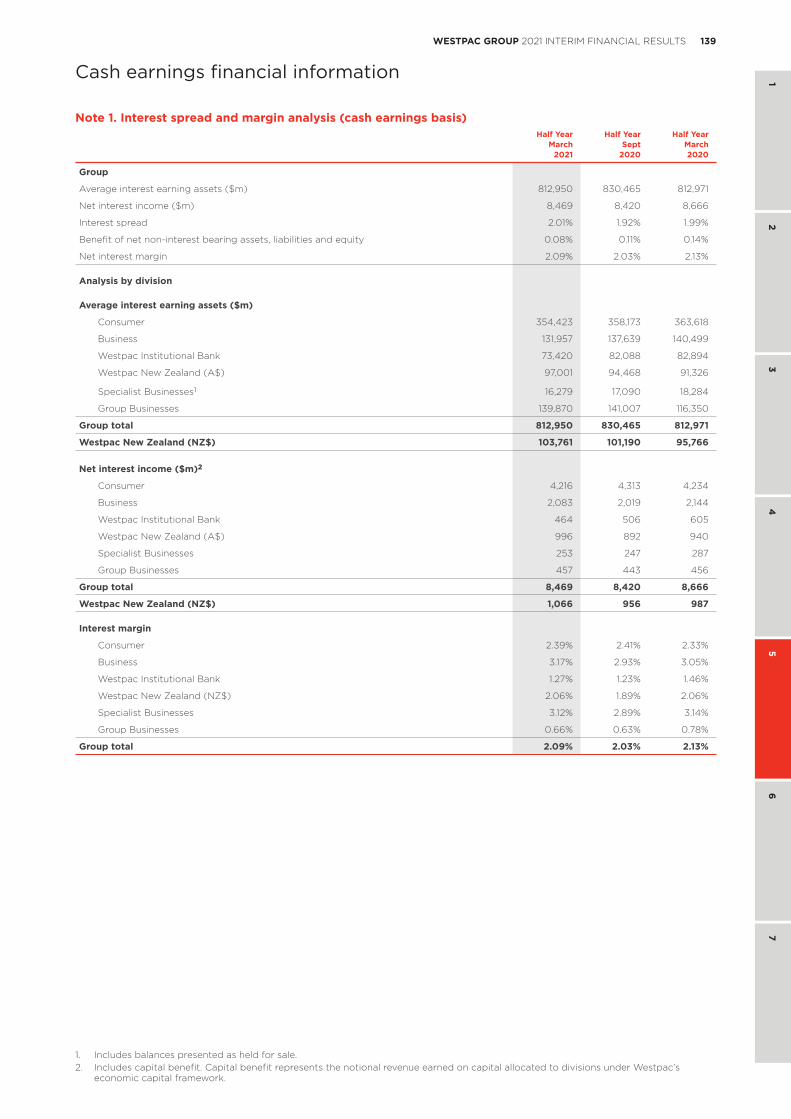
139WESTPAC GROUP 2021 INTERIM FINANCIAL RESULTS
1 2
34
56
7
Cash earnings financial information
Note 1. Interest spread and margin analysis (cash earnings basis)Half Year Half Year Half Year
March Sept March2021 2020 2020
Group
Average interest earning assets ($m) 812,950 830,465 812,971
Net interest income ($m) 8,469 8,420 8,666
Interest spread 2.01% 1.92% 1.99%
Benefit of net non-interest bearing assets, liabilities and equity 0.08% 0.11% 0.14%
Net interest margin 2.09% 2.03% 2.13% Analysis by division Average interest earning assets ($m)
Consumer 354,423 358,173 363,618
Business 131,957 137,639 140,499
Westpac Institutional Bank 73,420 82,088 82,894
Westpac New Zealand (A$) 97,001 94,468 91,326
Specialist Businesses1 16,279 17,090 18,284
Group Businesses 139,870 141,007 116,350
Group total 812,950 830,465 812,971
Westpac New Zealand (NZ$) 103,761 101,190 95,766
Net interest income ($m)2
Consumer 4,216 4,313 4,234
Business 2,083 2,019 2,144
Westpac Institutional Bank 464 506 605
Westpac New Zealand (A$) 996 892 940
Specialist Businesses 253 247 287
Group Businesses 457 443 456
Group total 8,469 8,420 8,666
Westpac New Zealand (NZ$) 1,066 956 987 Interest margin
Consumer 2.39% 2.41% 2.33%
Business 3.17% 2.93% 3.05%
Westpac Institutional Bank 1.27% 1.23% 1.46%
Westpac New Zealand (NZ$) 2.06% 1.89% 2.06%
Specialist Businesses 3.12% 2.89% 3.14%
Group Businesses 0.66% 0.63% 0.78%
Group total 2.09% 2.03% 2.13%
1. Includes balances presented as held for sale.2. Includes capital benefit. Capital benefit represents the notional revenue earned on capital allocated to divisions under Westpac’s
economic capital framework.
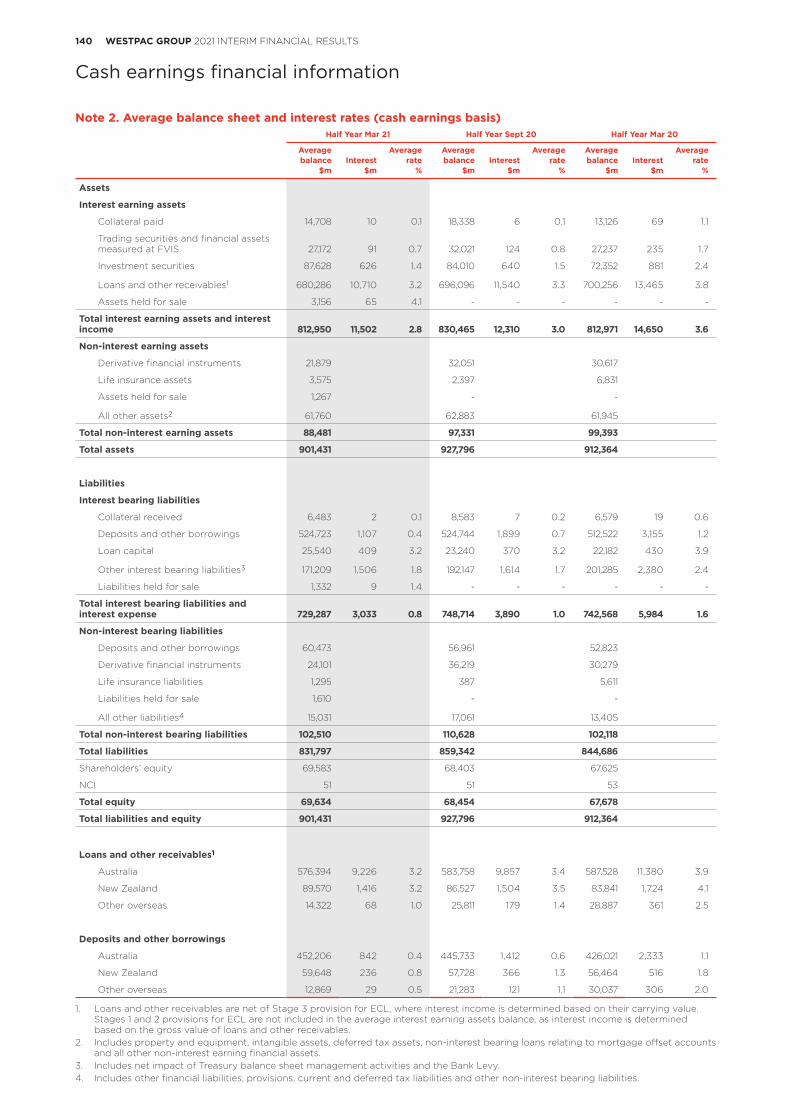
140 WESTPAC GROUP 2021 INTERIM FINANCIAL RESULTS
Cash earnings financial information
Note 2. Average balance sheet and interest rates (cash earnings basis)Half Year Mar 21 Half Year Sept 20 Half Year Mar 20
Average Average Average Average Average Average balance Interest rate balance Interest rate balance Interest rate $m $m % $m $m % $m $m %
Assets
Interest earning assets
Collateral paid 14,708 10 0.1 18,338 6 0.1 13,126 69 1.1
Trading securities and financial assets measured at FVIS 27,172 91 0.7 32,021 124 0.8 27,237 235 1.7
Investment securities 87,628 626 1.4 84,010 640 1.5 72,352 881 2.4
Loans and other receivables1 680,286 10,710 3.2 696,096 11,540 3.3 700,256 13,465 3.8
Assets held for sale 3,156 65 4.1 - - - - - -
Total interest earning assets and interest income 812,950 11,502 2.8 830,465 12,310 3.0 812,971 14,650 3.6
Non-interest earning assets
Derivative financial instruments 21,879 32,051 30,617
Life insurance assets 3,575 2,397 6,831
Assets held for sale 1,267 - -
All other assets2 61,760 62,883 61,945
Total non-interest earning assets 88,481 97,331 99,393
Total assets 901,431 927,796 912,364
Liabilities
Interest bearing liabilities
Collateral received 6,483 2 0.1 8,583 7 0.2 6,579 19 0.6
Deposits and other borrowings 524,723 1,107 0.4 524,744 1,899 0.7 512,522 3,155 1.2
Loan capital 25,540 409 3.2 23,240 370 3.2 22,182 430 3.9
Other interest bearing liabilities3 171,209 1,506 1.8 192,147 1,614 1.7 201,285 2,380 2.4
Liabilities held for sale 1,332 9 1.4 - - - - - -
Total interest bearing liabilities and interest expense 729,287 3,033 0.8 748,714 3,890 1.0 742,568 5,984 1.6
Non-interest bearing liabilities
Deposits and other borrowings 60,473 56,961 52,823
Derivative financial instruments 24,101 36,219 30,279
Life insurance liabilities 1,295 387 5,611
Liabilities held for sale 1,610 - -
All other liabilities4 15,031 17,061 13,405
Total non-interest bearing liabilities 102,510 110,628 102,118
Total liabilities 831,797 859,342 844,686
Shareholders’ equity 69,583 68,403 67,625
NCI 51 51 53
Total equity 69,634 68,454 67,678
Total liabilities and equity 901,431 927,796 912,364
Loans and other receivables1
Australia 576,394 9,226 3.2 583,758 9,857 3.4 587,528 11,380 3.9
New Zealand 89,570 1,416 3.2 86,527 1,504 3.5 83,841 1,724 4.1
Other overseas 14,322 68 1.0 25,811 179 1.4 28,887 361 2.5
Deposits and other borrowings
Australia 452,206 842 0.4 445,733 1,412 0.6 426,021 2,333 1.1
New Zealand 59,648 236 0.8 57,728 366 1.3 56,464 516 1.8
Other overseas 12,869 29 0.5 21,283 121 1.1 30,037 306 2.0
1. Loans and other receivables are net of Stage 3 provision for ECL, where interest income is determined based on their carrying value. Stages 1 and 2 provisions for ECL are not included in the average interest earning assets balance, as interest income is determined based on the gross value of loans and other receivables.
2. Includes property and equipment, intangible assets, deferred tax assets, non-interest bearing loans relating to mortgage offset accounts and all other non-interest earning financial assets.
3. Includes net impact of Treasury balance sheet management activities and the Bank Levy.4. Includes other financial liabilities, provisions, current and deferred tax liabilities and other non-interest bearing liabilities.
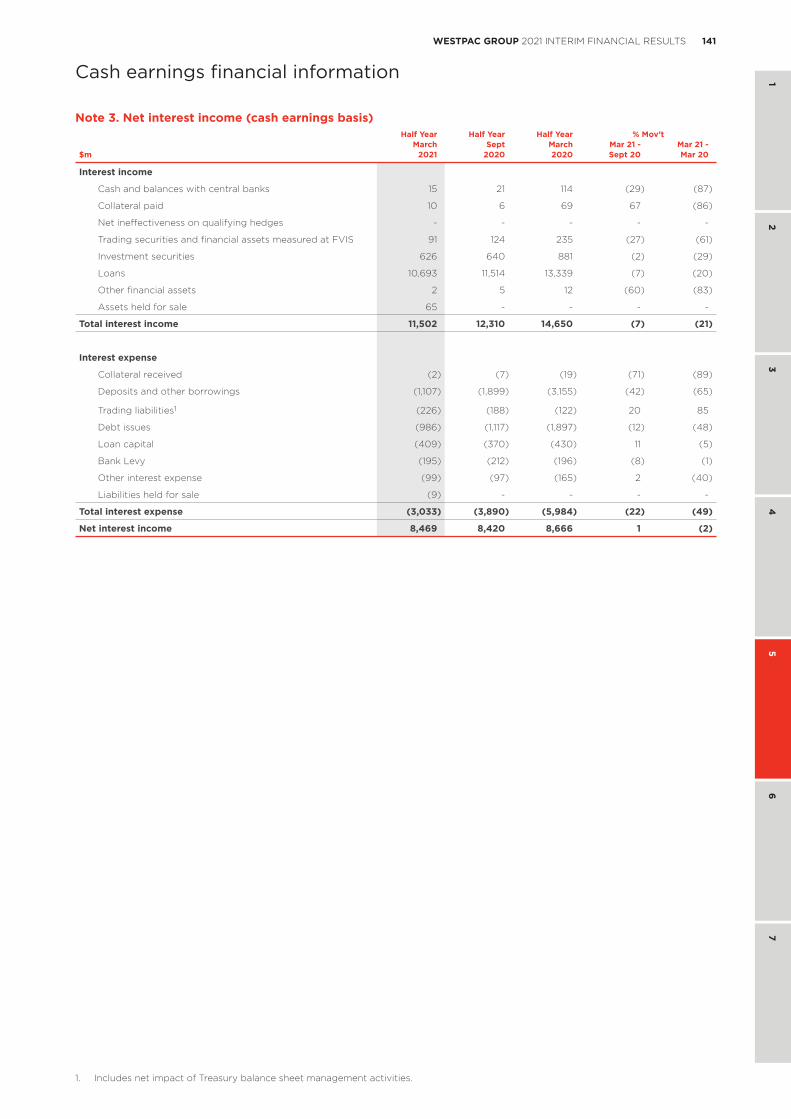
141WESTPAC GROUP 2021 INTERIM FINANCIAL RESULTS
1 2
34
56
7
Cash earnings financial information
Note 3. Net interest income (cash earnings basis)Half Year Half Year Half Year % Mov’t
March Sept March Mar 21 - Mar 21 -$m 2021 2020 2020 Sept 20 Mar 20
Interest income
Cash and balances with central banks 15 21 114 (29) (87)
Collateral paid 10 6 69 67 (86)
Net ineffectiveness on qualifying hedges - - - - -
Trading securities and financial assets measured at FVIS 91 124 235 (27) (61)
Investment securities 626 640 881 (2) (29)
Loans 10,693 11,514 13,339 (7) (20)
Other financial assets 2 5 12 (60) (83)
Assets held for sale 65 - - - -
Total interest income 11,502 12,310 14,650 (7) (21)
Interest expense
Collateral received (2) (7) (19) (71) (89)
Deposits and other borrowings (1,107) (1,899) (3,155) (42) (65)
Trading liabilities1 (226) (188) (122) 20 85
Debt issues (986) (1,117) (1,897) (12) (48)
Loan capital (409) (370) (430) 11 (5)
Bank Levy (195) (212) (196) (8) (1)
Other interest expense (99) (97) (165) 2 (40)
Liabilities held for sale (9) - - - -
Total interest expense (3,033) (3,890) (5,984) (22) (49)
Net interest income 8,469 8,420 8,666 1 (2)
1. Includes net impact of Treasury balance sheet management activities.
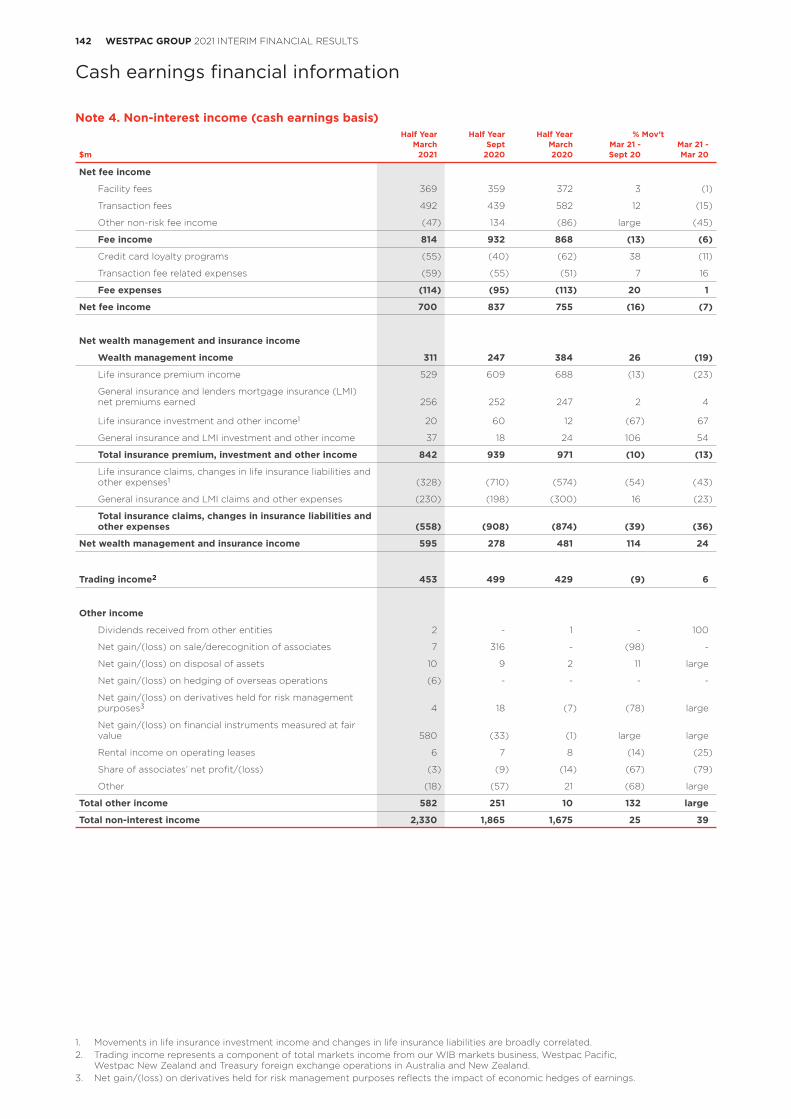
142 WESTPAC GROUP 2021 INTERIM FINANCIAL RESULTS
Cash earnings financial information
Note 4. Non-interest income (cash earnings basis)Half Year Half Year Half Year % Mov’t
March Sept March Mar 21 - Mar 21 -$m 2021 2020 2020 Sept 20 Mar 20
Net fee income
Facility fees 369 359 372 3 (1)
Transaction fees 492 439 582 12 (15)
Other non-risk fee income (47) 134 (86) large (45)
Fee income 814 932 868 (13) (6)
Credit card loyalty programs (55) (40) (62) 38 (11)
Transaction fee related expenses (59) (55) (51) 7 16
Fee expenses (114) (95) (113) 20 1
Net fee income 700 837 755 (16) (7)
Net wealth management and insurance income
Wealth management income 311 247 384 26 (19)
Life insurance premium income 529 609 688 (13) (23)
General insurance and lenders mortgage insurance (LMI) net premiums earned 256 252 247 2 4
Life insurance investment and other income1 20 60 12 (67) 67
General insurance and LMI investment and other income 37 18 24 106 54
Total insurance premium, investment and other income 842 939 971 (10) (13)
Life insurance claims, changes in life insurance liabilities and other expenses1 (328) (710) (574) (54) (43)
General insurance and LMI claims and other expenses (230) (198) (300) 16 (23)
Total insurance claims, changes in insurance liabilities and other expenses (558) (908) (874) (39) (36)
Net wealth management and insurance income 595 278 481 114 24
Trading income2 453 499 429 (9) 6
Other income
Dividends received from other entities 2 - 1 - 100
Net gain/(loss) on sale/derecognition of associates 7 316 - (98) -
Net gain/(loss) on disposal of assets 10 9 2 11 large
Net gain/(loss) on hedging of overseas operations (6) - - - -
Net gain/(loss) on derivatives held for risk management purposes3 4 18 (7) (78) large
Net gain/(loss) on financial instruments measured at fair value 580 (33) (1) large large
Rental income on operating leases 6 7 8 (14) (25)
Share of associates’ net profit/(loss) (3) (9) (14) (67) (79)
Other (18) (57) 21 (68) large
Total other income 582 251 10 132 large
Total non-interest income 2,330 1,865 1,675 25 39
1. Movements in life insurance investment income and changes in life insurance liabilities are broadly correlated.2. Trading income represents a component of total markets income from our WIB markets business, Westpac Pacific,
Westpac New Zealand and Treasury foreign exchange operations in Australia and New Zealand.3. Net gain/(loss) on derivatives held for risk management purposes reflects the impact of economic hedges of earnings.
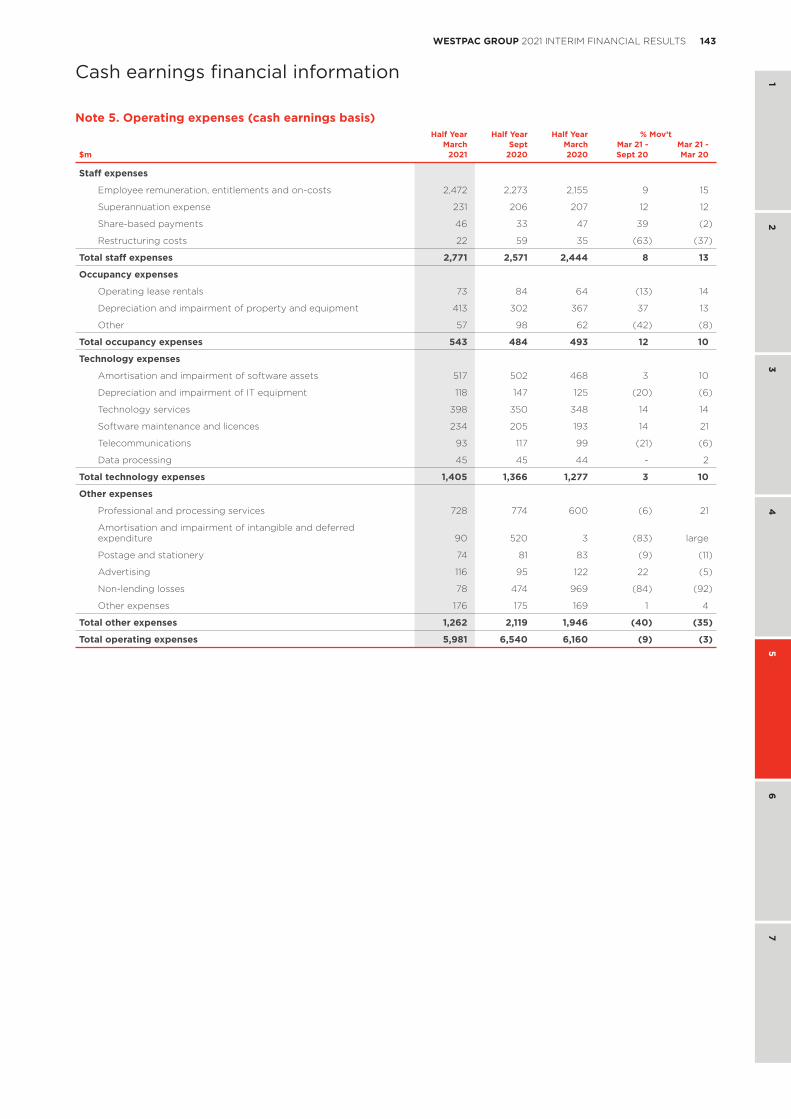
143WESTPAC GROUP 2021 INTERIM FINANCIAL RESULTS
1 2
34
56
7
Cash earnings financial information
Note 5. Operating expenses (cash earnings basis)Half Year Half Year Half Year % Mov’t
March Sept March Mar 21 - Mar 21 -$m 2021 2020 2020 Sept 20 Mar 20
Staff expenses
Employee remuneration, entitlements and on-costs 2,472 2,273 2,155 9 15
Superannuation expense 231 206 207 12 12
Share-based payments 46 33 47 39 (2)
Restructuring costs 22 59 35 (63) (37)
Total staff expenses 2,771 2,571 2,444 8 13
Occupancy expenses
Operating lease rentals 73 84 64 (13) 14
Depreciation and impairment of property and equipment 413 302 367 37 13
Other 57 98 62 (42) (8)
Total occupancy expenses 543 484 493 12 10
Technology expenses
Amortisation and impairment of software assets 517 502 468 3 10
Depreciation and impairment of IT equipment 118 147 125 (20) (6)
Technology services 398 350 348 14 14
Software maintenance and licences 234 205 193 14 21
Telecommunications 93 117 99 (21) (6)
Data processing 45 45 44 - 2
Total technology expenses 1,405 1,366 1,277 3 10
Other expenses
Professional and processing services 728 774 600 (6) 21
Amortisation and impairment of intangible and deferred expenditure 90 520 3 (83) large
Postage and stationery 74 81 83 (9) (11)
Advertising 116 95 122 22 (5)
Non-lending losses 78 474 969 (84) (92)
Other expenses 176 175 169 1 4
Total other expenses 1,262 2,119 1,946 (40) (35)
Total operating expenses 5,981 6,540 6,160 (9) (3)
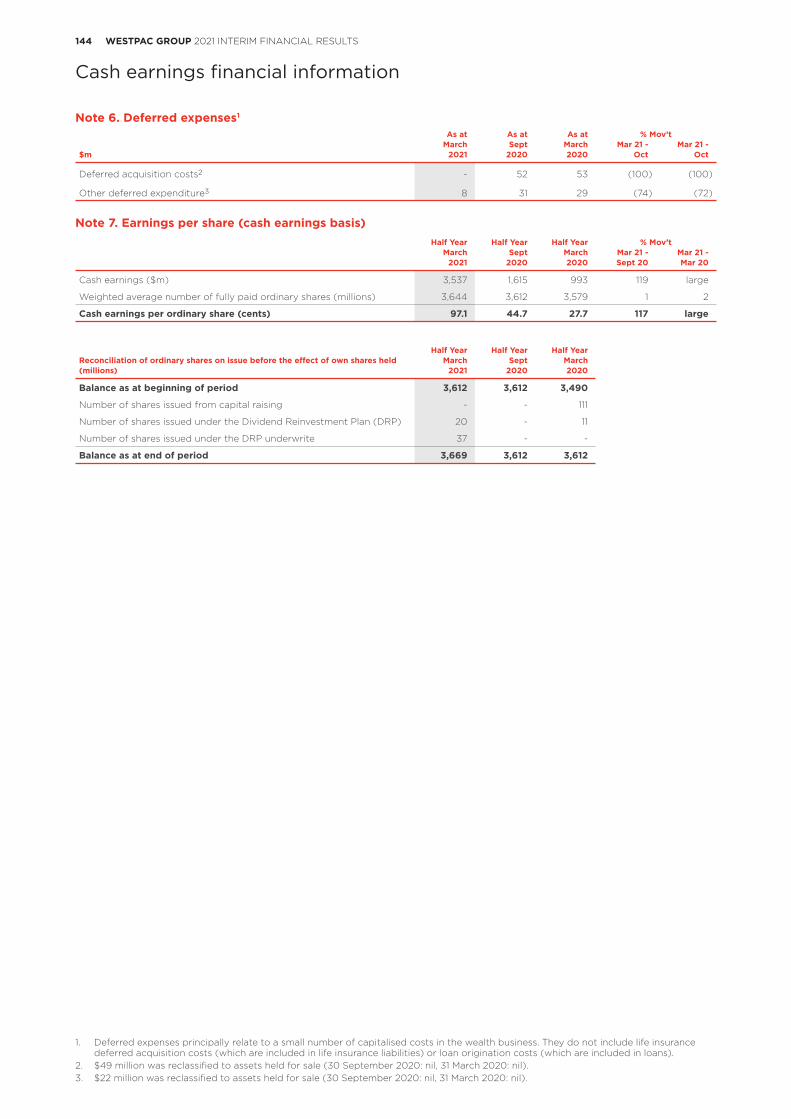
144 WESTPAC GROUP 2021 INTERIM FINANCIAL RESULTS
Cash earnings financial information
Note 6. Deferred expenses1
As at As at As at % Mov’tMarch Sept March Mar 21 - Mar 21 -
$m 2021 2020 2020 Oct Oct
Deferred acquisition costs2 - 52 53 (100) (100)
Other deferred expenditure3 8 31 29 (74) (72)
Note 7. Earnings per share (cash earnings basis)Half Year Half Year Half Year % Mov’t
March Sept March Mar 21 - Mar 21 -2021 2020 2020 Sept 20 Mar 20
Cash earnings ($m) 3,537 1,615 993 119 large
Weighted average number of fully paid ordinary shares (millions) 3,644 3,612 3,579 1 2
Cash earnings per ordinary share (cents) 97.1 44.7 27.7 117 large
Half Year Half Year Half YearReconciliation of ordinary shares on issue before the effect of own shares held March Sept March(millions) 2021 2020 2020
Balance as at beginning of period 3,612 3,612 3,490
Number of shares issued from capital raising - - 111
Number of shares issued under the Dividend Reinvestment Plan (DRP) 20 - 11
Number of shares issued under the DRP underwrite 37 - -
Balance as at end of period 3,669 3,612 3,612
1. Deferred expenses principally relate to a small number of capitalised costs in the wealth business. They do not include life insurance deferred acquisition costs (which are included in life insurance liabilities) or loan origination costs (which are included in loans).
2. $49 million was reclassified to assets held for sale (30 September 2020: nil, 31 March 2020: nil).3. $22 million was reclassified to assets held for sale (30 September 2020: nil, 31 March 2020: nil).
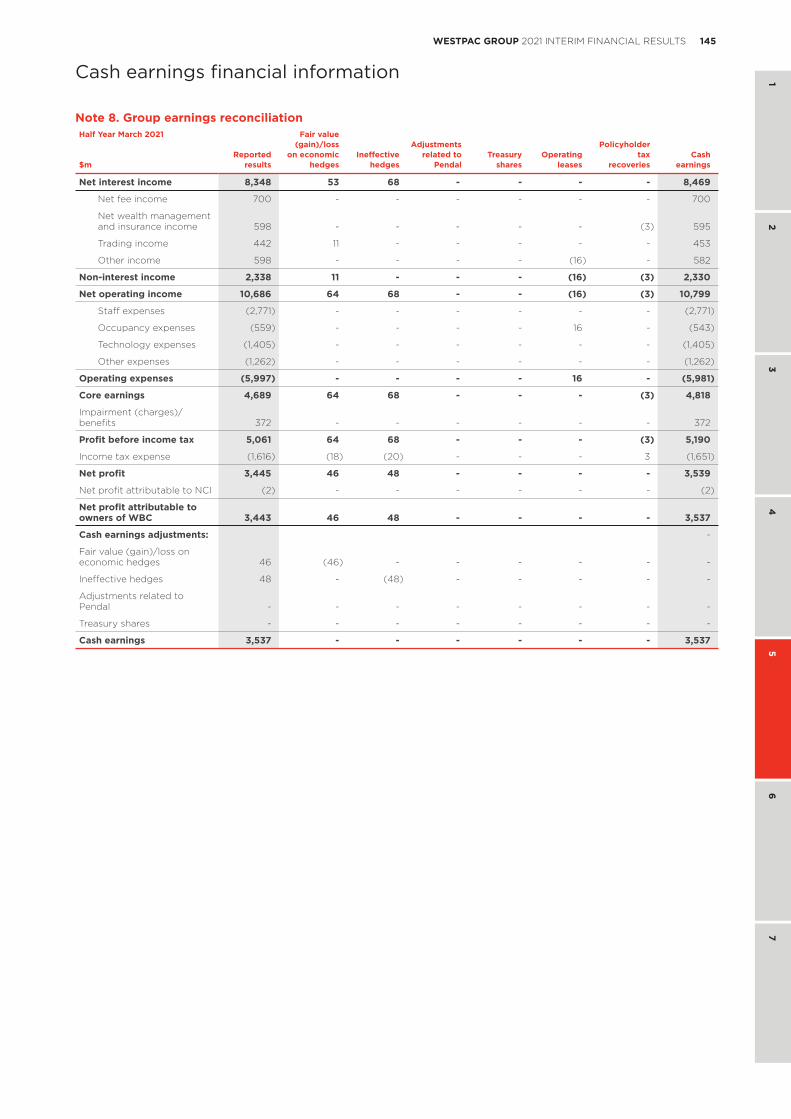
145WESTPAC GROUP 2021 INTERIM FINANCIAL RESULTS
1 2
34
56
7
Cash earnings financial information
Note 8. Group earnings reconciliationHalf Year March 2021 Fair value (gain)/loss Adjustments Policyholder Reported on economic Ineffective related to Treasury Operating tax Cash$m results hedges hedges Pendal shares leases recoveries earnings
Net interest income 8,348 53 68 - - - - 8,469
Net fee income 700 - - - - - - 700
Net wealth management and insurance income 598 - - - - - (3) 595
Trading income 442 11 - - - - - 453
Other income 598 - - - - (16) - 582
Non-interest income 2,338 11 - - - (16) (3) 2,330
Net operating income 10,686 64 68 - - (16) (3) 10,799
Staff expenses (2,771) - - - - - - (2,771)
Occupancy expenses (559) - - - - 16 - (543)
Technology expenses (1,405) - - - - - - (1,405)
Other expenses (1,262) - - - - - - (1,262)
Operating expenses (5,997) - - - - 16 - (5,981)
Core earnings 4,689 64 68 - - - (3) 4,818
Impairment (charges)/benefits 372 - - - - - - 372
Profit before income tax 5,061 64 68 - - - (3) 5,190
Income tax expense (1,616) (18) (20) - - - 3 (1,651)
Net profit 3,445 46 48 - - - - 3,539
Net profit attributable to NCI (2) - - - - - - (2)
Net profit attributable to owners of WBC 3,443 46 48 - - - - 3,537
Cash earnings adjustments: -
Fair value (gain)/loss on economic hedges 46 (46) - - - - - -
Ineffective hedges 48 - (48) - - - - -
Adjustments related to Pendal - - - - - - - -
Treasury shares - - - - - - - -
Cash earnings 3,537 - - - - - - 3,537
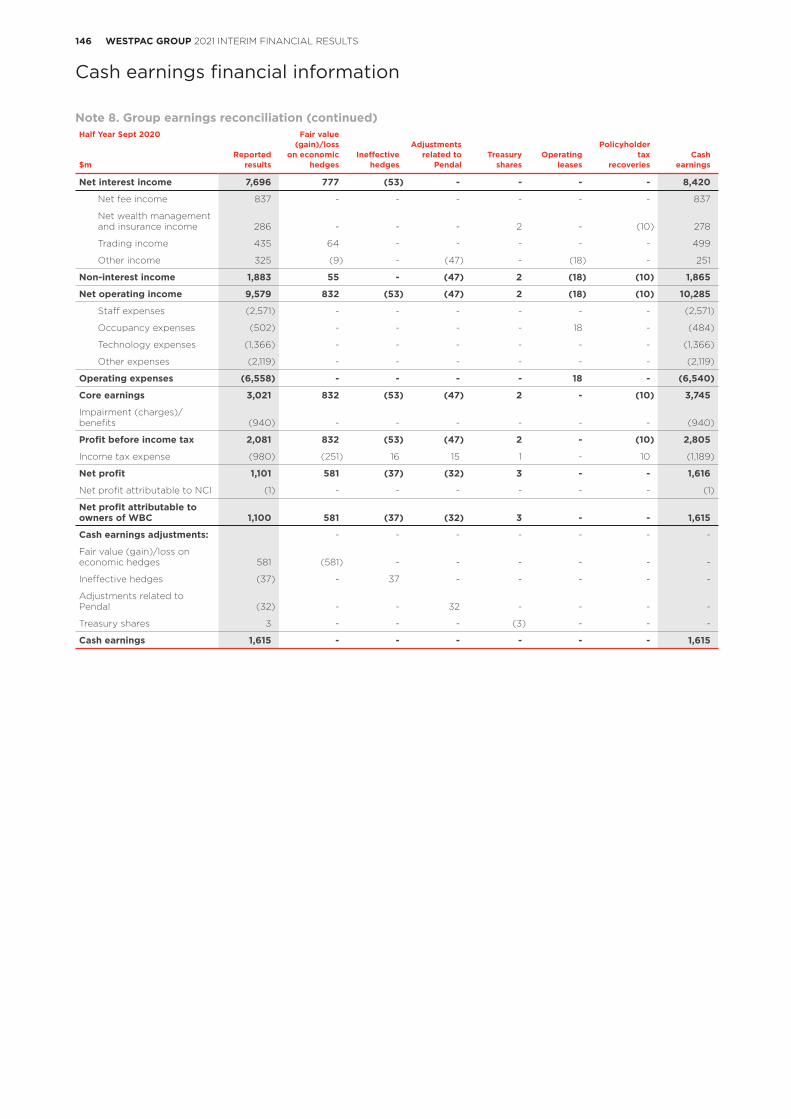
146 WESTPAC GROUP 2021 INTERIM FINANCIAL RESULTS
Cash earnings financial information
Note 8. Group earnings reconciliation (continued)Half Year Sept 2020 Fair value (gain)/loss Adjustments Policyholder Reported on economic Ineffective related to Treasury Operating tax Cash$m results hedges hedges Pendal shares leases recoveries earnings
Net interest income 7,696 777 (53) - - - - 8,420
Net fee income 837 - - - - - - 837
Net wealth management and insurance income 286 - - - 2 - (10) 278
Trading income 435 64 - - - - - 499
Other income 325 (9) - (47) - (18) - 251
Non-interest income 1,883 55 - (47) 2 (18) (10) 1,865
Net operating income 9,579 832 (53) (47) 2 (18) (10) 10,285
Staff expenses (2,571) - - - - - - (2,571)
Occupancy expenses (502) - - - - 18 - (484)
Technology expenses (1,366) - - - - - - (1,366)
Other expenses (2,119) - - - - - - (2,119)
Operating expenses (6,558) - - - - 18 - (6,540)
Core earnings 3,021 832 (53) (47) 2 - (10) 3,745
Impairment (charges)/benefits (940) - - - - - - (940)
Profit before income tax 2,081 832 (53) (47) 2 - (10) 2,805
Income tax expense (980) (251) 16 15 1 - 10 (1,189)
Net profit 1,101 581 (37) (32) 3 - - 1,616
Net profit attributable to NCI (1) - - - - - - (1)
Net profit attributable to owners of WBC 1,100 581 (37) (32) 3 - - 1,615
Cash earnings adjustments: - - - - - - -
Fair value (gain)/loss on economic hedges 581 (581) - - - - - -
Ineffective hedges (37) - 37 - - - - -
Adjustments related to Pendal (32) - - 32 - - - -
Treasury shares 3 - - - (3) - - -
Cash earnings 1,615 - - - - - - 1,615
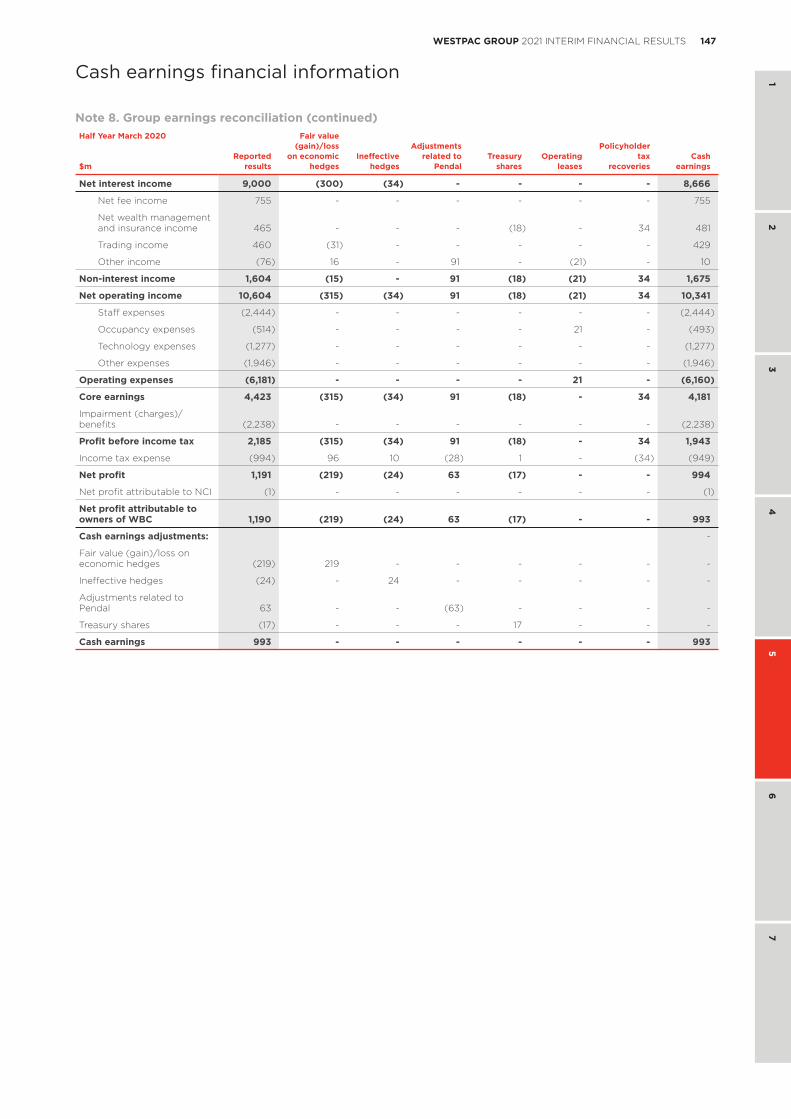
147WESTPAC GROUP 2021 INTERIM FINANCIAL RESULTS
1 2
34
56
7
Cash earnings financial information
Half Year March 2020 Fair value (gain)/loss Adjustments Policyholder Reported on economic Ineffective related to Treasury Operating tax Cash$m results hedges hedges Pendal shares leases recoveries earnings
Net interest income 9,000 (300) (34) - - - - 8,666
Net fee income 755 - - - - - - 755
Net wealth management and insurance income 465 - - - (18) - 34 481
Trading income 460 (31) - - - - - 429
Other income (76) 16 - 91 - (21) - 10
Non-interest income 1,604 (15) - 91 (18) (21) 34 1,675
Net operating income 10,604 (315) (34) 91 (18) (21) 34 10,341
Staff expenses (2,444) - - - - - - (2,444)
Occupancy expenses (514) - - - - 21 - (493)
Technology expenses (1,277) - - - - - - (1,277)
Other expenses (1,946) - - - - - - (1,946)
Operating expenses (6,181) - - - - 21 - (6,160)
Core earnings 4,423 (315) (34) 91 (18) - 34 4,181
Impairment (charges)/benefits (2,238) - - - - - - (2,238)
Profit before income tax 2,185 (315) (34) 91 (18) - 34 1,943
Income tax expense (994) 96 10 (28) 1 - (34) (949)
Net profit 1,191 (219) (24) 63 (17) - - 994
Net profit attributable to NCI (1) - - - - - - (1)
Net profit attributable to owners of WBC 1,190 (219) (24) 63 (17) - - 993
Cash earnings adjustments: -
Fair value (gain)/loss on economic hedges (219) 219 - - - - - -
Ineffective hedges (24) - 24 - - - - -
Adjustments related to Pendal 63 - - (63) - - - -
Treasury shares (17) - - - 17 - - -
Cash earnings 993 - - - - - - 993
Note 8. Group earnings reconciliation (continued)
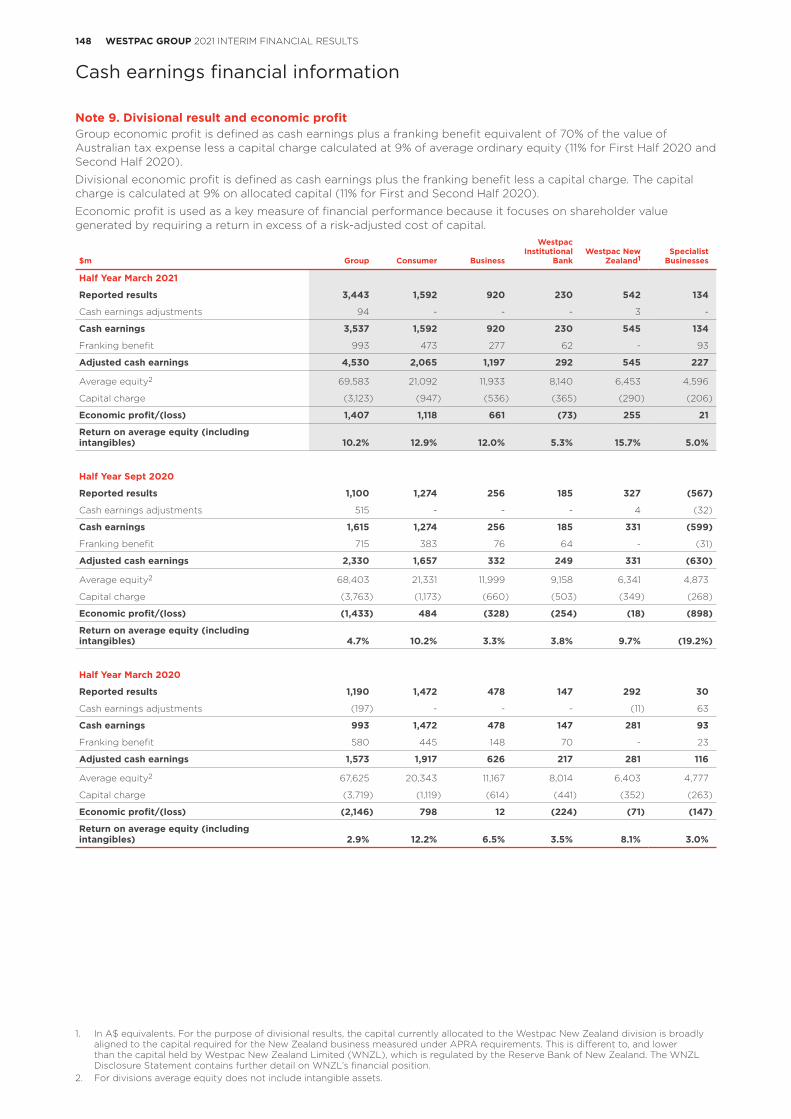
148 WESTPAC GROUP 2021 INTERIM FINANCIAL RESULTS
Cash earnings financial information
Note 9. Divisional result and economic profitGroup economic profit is defined as cash earnings plus a franking benefit equivalent of 70% of the value of Australian tax expense less a capital charge calculated at 9% of average ordinary equity (11% for First Half 2020 and Second Half 2020).
Divisional economic profit is defined as cash earnings plus the franking benefit less a capital charge. The capital charge is calculated at 9% on allocated capital (11% for First and Second Half 2020).
Economic profit is used as a key measure of financial performance because it focuses on shareholder value generated by requiring a return in excess of a risk-adjusted cost of capital.
$m Group Consumer Business
Westpac Institutional
BankWestpac New
Zealand1Specialist
Businesses
Half Year March 2021
Reported results 3,443 1,592 920 230 542 134
Cash earnings adjustments 94 - - - 3 -
Cash earnings 3,537 1,592 920 230 545 134
Franking benefit 993 473 277 62 - 93
Adjusted cash earnings 4,530 2,065 1,197 292 545 227
Average equity2 69,583 21,092 11,933 8,140 6,453 4,596
Capital charge (3,123) (947) (536) (365) (290) (206)
Economic profit/(loss) 1,407 1,118 661 (73) 255 21
Return on average equity (including intangibles) 10.2% 12.9% 12.0% 5.3% 15.7% 5.0%
Half Year Sept 2020
Reported results 1,100 1,274 256 185 327 (567)
Cash earnings adjustments 515 - - - 4 (32)
Cash earnings 1,615 1,274 256 185 331 (599)
Franking benefit 715 383 76 64 - (31)
Adjusted cash earnings 2,330 1,657 332 249 331 (630)
Average equity2 68,403 21,331 11,999 9,158 6,341 4,873
Capital charge (3,763) (1,173) (660) (503) (349) (268)
Economic profit/(loss) (1,433) 484 (328) (254) (18) (898)
Return on average equity (including intangibles) 4.7% 10.2% 3.3% 3.8% 9.7% (19.2%)
Half Year March 2020
Reported results 1,190 1,472 478 147 292 30
Cash earnings adjustments (197) - - - (11) 63
Cash earnings 993 1,472 478 147 281 93
Franking benefit 580 445 148 70 - 23
Adjusted cash earnings 1,573 1,917 626 217 281 116
Average equity2 67,625 20,343 11,167 8,014 6,403 4,777
Capital charge (3,719) (1,119) (614) (441) (352) (263)
Economic profit/(loss) (2,146) 798 12 (224) (71) (147)
Return on average equity (including intangibles) 2.9% 12.2% 6.5% 3.5% 8.1% 3.0%
1. In A$ equivalents. For the purpose of divisional results, the capital currently allocated to the Westpac New Zealand division is broadly aligned to the capital required for the New Zealand business measured under APRA requirements. This is different to, and lower than the capital held by Westpac New Zealand Limited (WNZL), which is regulated by the Reserve Bank of New Zealand. The WNZL Disclosure Statement contains further detail on WNZL’s financial position.
2. For divisions average equity does not include intangible assets.
149PB WESTPAC GROUP 2021 INTERIM FINANCIAL RESULTS WESTPAC GROUP 2021 INTERIM FINANCIAL RESULTS
1 2
34
56
7
Other information
6.0 Other information
6.1 Disclosure regarding forward-looking statementsThis Interim Financial Results Announcement contains statements that constitute ‘forward-looking statements’ within the meaning of Section 21E of the US Securities Exchange Act of 1934.
Forward-looking statements are statements about matters that are not historical facts. Forward-looking statements appear in a number of places in this Interim Financial Results Announcement and include statements regarding Westpac’s intent, belief or current expectations with respect to its business and operations, market conditions, results of operations and financial condition, including, without limitation, future loan loss provisions and financial support to certain borrowers. Words such as ‘will’, ‘may’, ‘expect’, ‘intend’, ‘seek’, ‘would’, ‘should’, ‘could’, ‘continue’, ‘plan’, ‘estimate’, ‘anticipate’, ‘believe’, ‘probability’, ‘risk’, ‘aim’, ‘outlook’ or other similar words are used to identify forward-looking statements. These forward-looking statements reflect Westpac’s current views with respect to future events and are subject to change, certain risks, uncertainties and assumptions which are, in many instances, beyond Westpac’s control, and have been made based upon management’s expectations and beliefs concerning future developments and their potential effect upon Westpac. There can be no assurance that future developments will be in accordance with Westpac’s expectations or that the effect of future developments on Westpac will be those anticipated. Actual results could differ materially from those expected, depending on the outcome of various factors, including, but not limited to:
• information security breaches, including cyberattacks;
• the effect of the global COVID-19 pandemic, which has had, and may continue to have, a negative impact on our business and global economic conditions, adversely affect a wide-range of Westpac’s key suppliers, third-party contractors and customers, create increased volatility in financial markets and result in increased impairments, defaults and write-offs;
• the effect of, and changes in, laws, regulations, taxation or accounting standards or practices and government policy, particularly changes to liquidity, leverage and capital requirements;
• regulatory investigations, reviews and other actions, inquiries, litigation, fines, penalties, restrictions or other regulator imposed conditions, including as a result of our actual or alleged failure to comply with laws (such as financial crime laws), regulations or regulatory policy;
• the effectiveness of Westpac’s risk management policies, including internal processes, systems and employees, and operational risks resulting from ineffective processes and controls, as well as breakdowns in processes and procedures requiring remediation activity;
• the failure to comply with financial crime obligations, which has had, and could further have, adverse effects on our business and reputation;
• the occurrence of environmental change (including as a result of climate change) or external events in countries in which Westpac or its customers or counterparties conduct their operations;
• internal and external events which may adversely impact Westpac’s reputation;
• litigation and other legal proceedings and regulator investigations and enforcement actions;
• reliability and security of Westpac’s technology and risks associated with changes to technology systems;
• the stability of Australian and international financial systems and disruptions to financial markets and any losses or business impacts Westpac or its customers or counterparties may experience as a result;
• market volatility, including uncertain conditions in funding, equity and asset markets;
• an increase in defaults in credit exposures because of a deterioration in economic conditions;
• adverse asset, credit or capital market conditions;
• the incidence of inadequate capital levels under stressed conditions;
• the risk that governments will default on their debt obligations or will be unable to refinance their debts as they fall due;
• changes to Westpac’s credit ratings or the methodology used by credit rating agencies;
• levels of inflation, interest rates (including low or negative interest rates), exchange rates and market and monetary fluctuations and volatility;
• an increase in defaults, write-offs and provisions for credit impairments;
• changes in economic conditions, consumer spending, saving and borrowing habits in Australia, New Zealand and other countries (including as a result of tariffs and other protectionist trade measures) in which Westpac or its customers or counterparties conduct their operations and Westpac’s ability to maintain or to increase market share, margins and fees, and control expenses;
• the effects of competition, including from established providers of financial services and from non-financial services entities, in the geographic and business areas in which Westpac conducts its operations;
• poor data quality or poor data retention;
• the incidence or severity of Westpac-insured events;
• changes to Westpac’s critical accounting estimates and judgements and changes to the value of Westpac’s intangible assets;
Other information

PB150 WESTPAC GROUP 2021 INTERIM FINANCIAL RESULTS WESTPAC GROUP 2021 INTERIM FINANCIAL RESULTS
Other information
• changes in political, social or economic conditions in any of the major markets in which Westpac or its customers or counterparties operate;
• the inability to syndicate or sell down underwritten securities, particularly during times of heightened market volatility;
• strategic decisions including diversification, innovation, divestment, acquisitions or business expansion activity, including the integration of new businesses; and
• various other factors beyond Westpac’s control.
The above list is not exhaustive. For certain other factors that may impact on forward-looking statements made by Westpac, refer to ‘Risk factors’ in the Directors’ report in this Interim Financial Results Announcement. When relying on forward-looking statements to make decisions with respect to Westpac, investors and others should carefully consider the foregoing factors and other uncertainties and events.
Westpac is under no obligation to update any forward-looking statements contained in this Interim Financial Results Announcement, whether as a result of new information, future events or otherwise, after the date of this Interim Financial Results Announcement.
151WESTPAC GROUP 2021 INTERIM FINANCIAL RESULTS
1 2
34
56
7
Other information
6.2 References to websitesInformation contained in or accessible through the websites mentioned in this Results Announcement does not form part of this Results Announcement unless we specifically state that it is incorporated by reference and forms part of this Results Announcement. All references in this Results Announcement to websites are inactive textual references and are for information only.
6.3 Credit ratings1
Rating agency Long Term Outlook Short. Term
Fitch Ratings A+ Negative F1
Moody’s Investor Services Aa3 Stable P-1
S&P Global Ratings AA- Negative A-1+
Note that these are the credit ratings as at 31 March 2021, however, since this date the following rating actions have been taken.
On 12 April 2021, Fitch Ratings revised Westpac Banking Corporation’s (Westpac’s) outlook to Stable from Negative. The revision of the outlook to Stable reflects Australia’s improved economic outlook. At the same time, Fitch Ratings affirmed Westpac’s long term issuer credit rating at A+, and its short term rating at F1.
6.4 Dividend reinvestment planWestpac operates a dividend reinvestment plan (DRP) that is available to holders of fully paid ordinary shares who are resident in, and whose address on the register of shareholders is in Australia or New Zealand. As noted in Section 2.5, the Directors have made certain determinations in relation to the calculation of the market price which will apply to the DRP for the 2021 interim dividend only.
Shareholders who wish to commence participation in the DRP, or to vary their current participation election, must do so by 5.00pm (AEST) on 17 May 2021.
Shareholders can provide these instructions by:
• For shareholders with holdings that have a market value of less than $50,000 (for a single holding) or less than $1,000,000 (per shareholding held within a Link Market Services portfolio), logging into the Westpac share registrar’s website at www.linkmarketservices.com.au and electing the DRP or amending their existing instructions online; or
• Completing and returning a DRP application or Variation form to Westpac’s share registry. Registry contact details are listed in Section 6.6.
6.5 Information on related entities
a. Changes in control of Group entitiesDuring the six months ended 31 March 2021 no controlled entities were acquired, formed, or incorporated.
During the six months ended 31 March 2021 the following controlled entities ceased to be controlled:
• Capital Finance New Zealand Limited (deregistered 30 October 2020)
• SIE-Lease (New Zealand) Pty Ltd (deregistered 30 October 2020)
• Series 2011-3 WST Trust (deregistered 1 March 2021)
b. AssociatesAs at 31 March 2021 Ownership Interest Held (%)
Akahu Technologies Ltd 29.60%
Data Republic Pty Ltd 24.93%
Flare HR Pty Ltd 17.50%
Hey You Pty Ltd (Formerly Beat The Q Holdings Pty Ltd) 23.86%
InDebted Holdings Pty Ltd 23.44%
Lygon 1B Pty Ltd 25.20%
mx51 Group Pty Ltd 22.71%
OpenAgent Pty Ltd 25.92%
PromisePay Pte Ltd 25.71%
Valiant Finance Pty Ltd 20.90%
1. As at 31 March 2021.
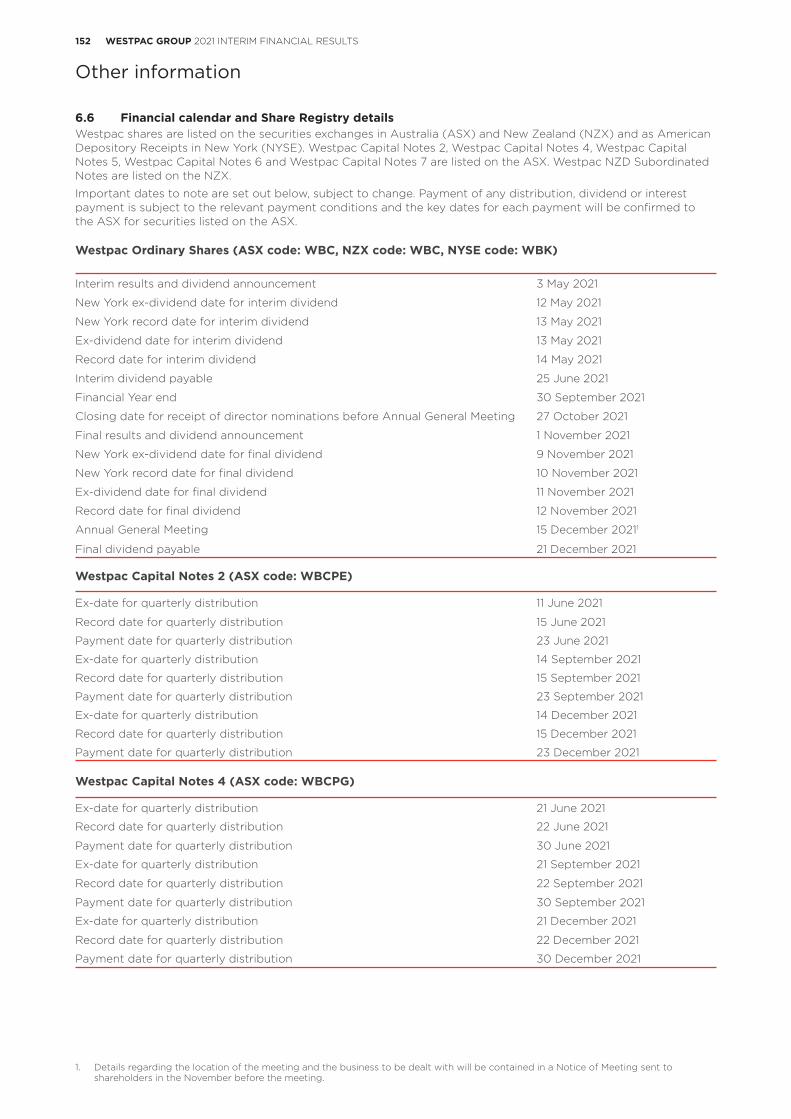
152 WESTPAC GROUP 2021 INTERIM FINANCIAL RESULTS
Other information
6.6 Financial calendar and Share Registry detailsWestpac shares are listed on the securities exchanges in Australia (ASX) and New Zealand (NZX) and as American Depository Receipts in New York (NYSE). Westpac Capital Notes 2, Westpac Capital Notes 4, Westpac Capital Notes 5, Westpac Capital Notes 6 and Westpac Capital Notes 7 are listed on the ASX. Westpac NZD Subordinated Notes are listed on the NZX.
Important dates to note are set out below, subject to change. Payment of any distribution, dividend or interest payment is subject to the relevant payment conditions and the key dates for each payment will be confirmed to the ASX for securities listed on the ASX.
Westpac Ordinary Shares (ASX code: WBC, NZX code: WBC, NYSE code: WBK)
Interim results and dividend announcement 3 May 2021
New York ex-dividend date for interim dividend 12 May 2021
New York record date for interim dividend 13 May 2021
Ex-dividend date for interim dividend 13 May 2021
Record date for interim dividend 14 May 2021
Interim dividend payable 25 June 2021
Financial Year end 30 September 2021
Closing date for receipt of director nominations before Annual General Meeting 27 October 2021
Final results and dividend announcement 1 November 2021
New York ex-dividend date for final dividend 9 November 2021
New York record date for final dividend 10 November 2021
Ex-dividend date for final dividend 11 November 2021
Record date for final dividend 12 November 2021
Annual General Meeting 15 December 20211
Final dividend payable 21 December 2021
Westpac Capital Notes 2 (ASX code: WBCPE)
Ex-date for quarterly distribution 11 June 2021
Record date for quarterly distribution 15 June 2021
Payment date for quarterly distribution 23 June 2021
Ex-date for quarterly distribution 14 September 2021
Record date for quarterly distribution 15 September 2021
Payment date for quarterly distribution 23 September 2021
Ex-date for quarterly distribution 14 December 2021
Record date for quarterly distribution 15 December 2021
Payment date for quarterly distribution 23 December 2021
Westpac Capital Notes 4 (ASX code: WBCPG)
Ex-date for quarterly distribution 21 June 2021
Record date for quarterly distribution 22 June 2021
Payment date for quarterly distribution 30 June 2021
Ex-date for quarterly distribution 21 September 2021
Record date for quarterly distribution 22 September 2021
Payment date for quarterly distribution 30 September 2021
Ex-date for quarterly distribution 21 December 2021
Record date for quarterly distribution 22 December 2021
Payment date for quarterly distribution 30 December 2021
1. Details regarding the location of the meeting and the business to be dealt with will be contained in a Notice of Meeting sent to shareholders in the November before the meeting.
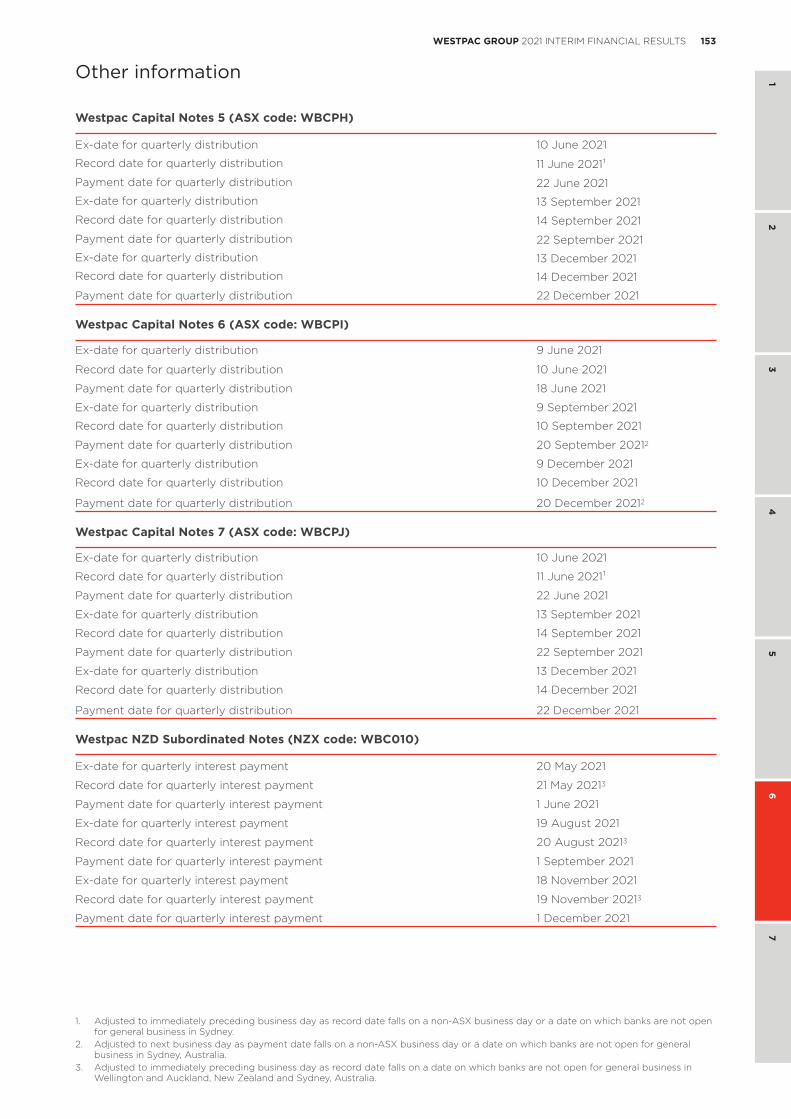
153WESTPAC GROUP 2021 INTERIM FINANCIAL RESULTS
1 2
34
56
7
Other information
Westpac Capital Notes 5 (ASX code: WBCPH)
Ex-date for quarterly distribution 10 June 2021
Record date for quarterly distribution 11 June 20211
Payment date for quarterly distribution 22 June 2021
Ex-date for quarterly distribution 13 September 2021
Record date for quarterly distribution 14 September 2021
Payment date for quarterly distribution 22 September 2021
Ex-date for quarterly distribution 13 December 2021
Record date for quarterly distribution 14 December 2021
Payment date for quarterly distribution 22 December 2021
Westpac Capital Notes 6 (ASX code: WBCPI)
Ex-date for quarterly distribution 9 June 2021
Record date for quarterly distribution 10 June 2021
Payment date for quarterly distribution 18 June 2021
Ex-date for quarterly distribution 9 September 2021
Record date for quarterly distribution 10 September 2021
Payment date for quarterly distribution 20 September 20212
Ex-date for quarterly distribution 9 December 2021
Record date for quarterly distribution 10 December 2021
Payment date for quarterly distribution 20 December 20212
Westpac Capital Notes 7 (ASX code: WBCPJ)
Ex-date for quarterly distribution 10 June 2021
Record date for quarterly distribution 11 June 20211
Payment date for quarterly distribution 22 June 2021
Ex-date for quarterly distribution 13 September 2021
Record date for quarterly distribution 14 September 2021
Payment date for quarterly distribution 22 September 2021
Ex-date for quarterly distribution 13 December 2021
Record date for quarterly distribution 14 December 2021
Payment date for quarterly distribution 22 December 2021
Westpac NZD Subordinated Notes (NZX code: WBC010)
Ex-date for quarterly interest payment 20 May 2021
Record date for quarterly interest payment 21 May 20213
Payment date for quarterly interest payment 1 June 2021
Ex-date for quarterly interest payment 19 August 2021
Record date for quarterly interest payment 20 August 20213
Payment date for quarterly interest payment 1 September 2021
Ex-date for quarterly interest payment 18 November 2021
Record date for quarterly interest payment 19 November 20213
Payment date for quarterly interest payment 1 December 2021
1. Adjusted to immediately preceding business day as record date falls on a non-ASX business day or a date on which banks are not open for general business in Sydney.
2. Adjusted to next business day as payment date falls on a non-ASX business day or a date on which banks are not open for general business in Sydney, Australia.
3. Adjusted to immediately preceding business day as record date falls on a date on which banks are not open for general business in Wellington and Auckland, New Zealand and Sydney, Australia.
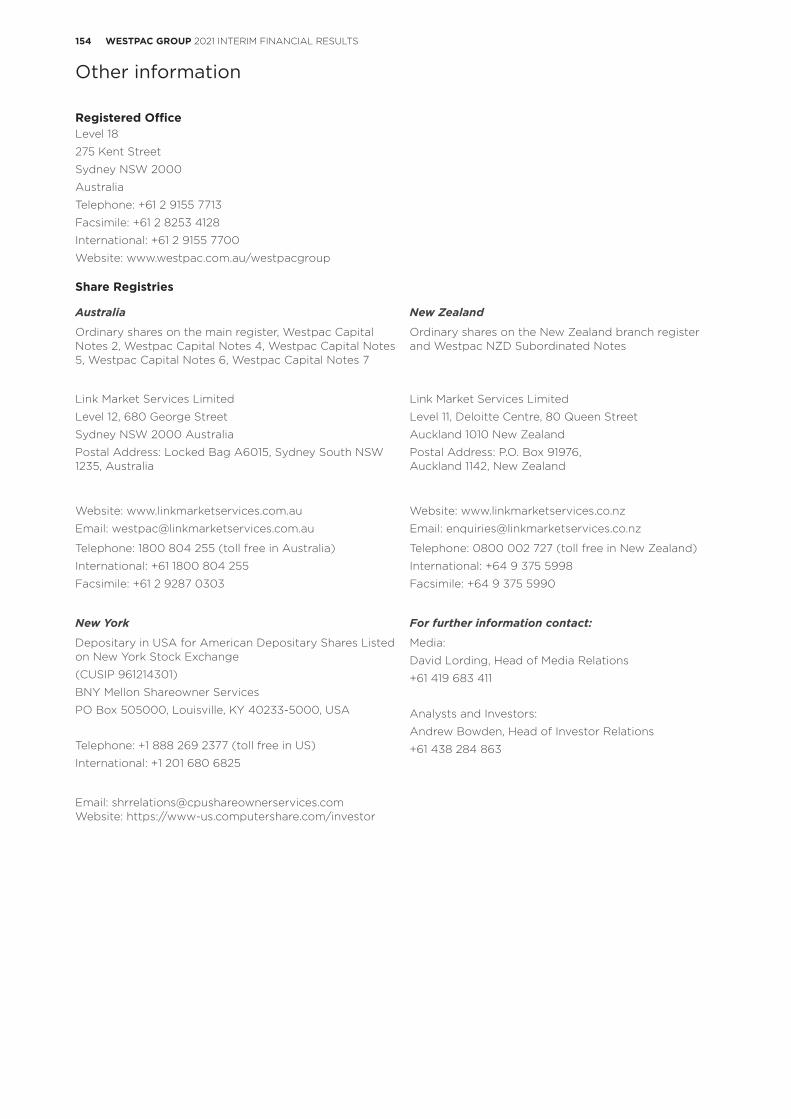
154 WESTPAC GROUP 2021 INTERIM FINANCIAL RESULTS
Other information
Registered OfficeLevel 18
275 Kent Street
Sydney NSW 2000
Australia
Telephone: +61 2 9155 7713
Facsimile: +61 2 8253 4128
International: +61 2 9155 7700
Website: www.westpac.com.au/westpacgroup
Share Registries
Australia New Zealand
Ordinary shares on the main register, Westpac Capital Notes 2, Westpac Capital Notes 4, Westpac Capital Notes 5, Westpac Capital Notes 6, Westpac Capital Notes 7
Ordinary shares on the New Zealand branch register and Westpac NZD Subordinated Notes
Link Market Services Limited
Level 12, 680 George Street
Sydney NSW 2000 Australia
Postal Address: Locked Bag A6015, Sydney South NSW 1235, Australia
Link Market Services Limited
Level 11, Deloitte Centre, 80 Queen Street
Auckland 1010 New Zealand
Postal Address: P.O. Box 91976, Auckland 1142, New Zealand
Website: www.linkmarketservices.com.au
Email: [email protected]
Website: www.linkmarketservices.co.nz
Email: [email protected]
Telephone: 1800 804 255 (toll free in Australia)
International: +61 1800 804 255
Facsimile: +61 2 9287 0303
Telephone: 0800 002 727 (toll free in New Zealand)
International: +64 9 375 5998
Facsimile: +64 9 375 5990
New York For further information contact:
Depositary in USA for American Depositary Shares Listed on New York Stock Exchange
(CUSIP 961214301)
BNY Mellon Shareowner Services
PO Box 505000, Louisville, KY 40233-5000, USA
Telephone: +1 888 269 2377 (toll free in US)
International: +1 201 680 6825
Media:
David Lording, Head of Media Relations
+61 419 683 411
Analysts and Investors:
Andrew Bowden, Head of Investor Relations
+61 438 284 863
Email: [email protected] Website: https://www-us.computershare.com/investor
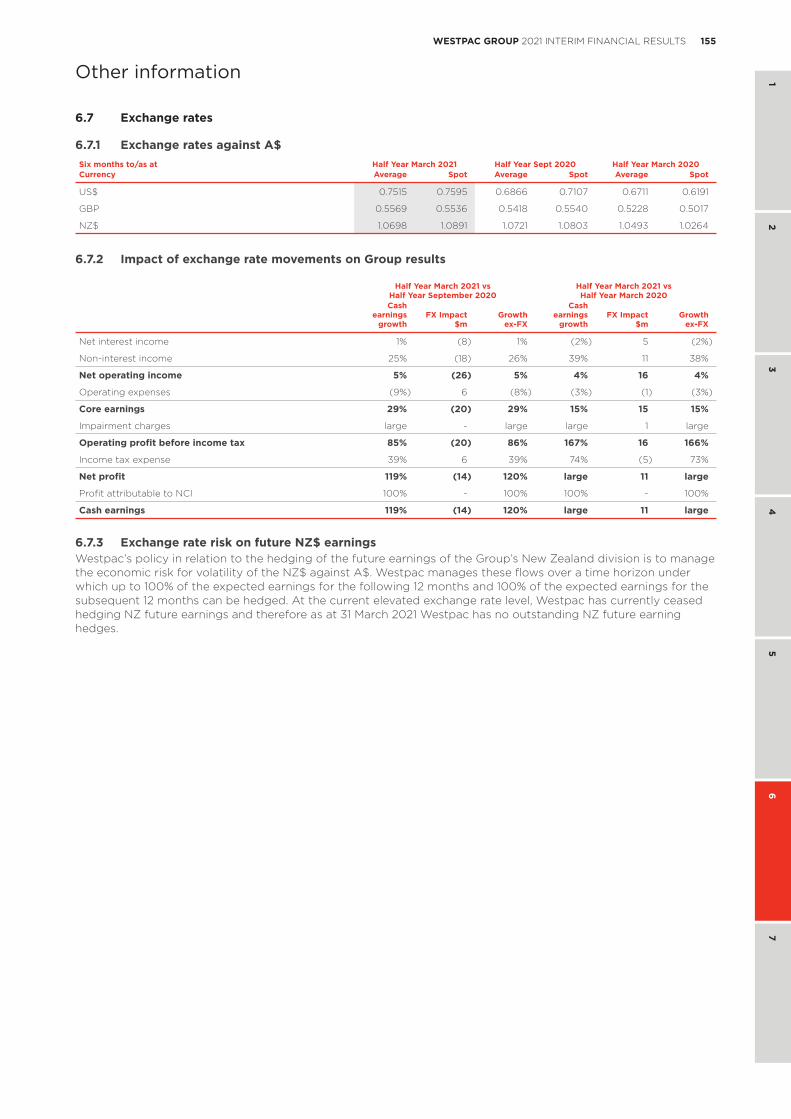
155WESTPAC GROUP 2021 INTERIM FINANCIAL RESULTS
1 2
34
56
7
Other information
6.7 Exchange rates
6.7.1 Exchange rates against A$Six months to/as at Half Year March 2021 Half Year Sept 2020 Half Year March 2020Currency Average Spot Average Spot Average Spot
US$ 0.7515 0.7595 0.6866 0.7107 0.6711 0.6191
GBP 0.5569 0.5536 0.5418 0.5540 0.5228 0.5017
NZ$ 1.0698 1.0891 1.0721 1.0803 1.0493 1.0264
6.7.2 Impact of exchange rate movements on Group results
Half Year March 2021 vsHalf Year September 2020
Half Year March 2021 vs Half Year March 2020
Cash earnings
growthFX Impact
$mGrowth
ex-FX
Cash earnings
growthFX Impact
$mGrowth
ex-FX
Net interest income 1% (8) 1% (2%) 5 (2%)
Non-interest income 25% (18) 26% 39% 11 38%
Net operating income 5% (26) 5% 4% 16 4%
Operating expenses (9%) 6 (8%) (3%) (1) (3%)
Core earnings 29% (20) 29% 15% 15 15%
Impairment charges large - large large 1 large
Operating profit before income tax 85% (20) 86% 167% 16 166%
Income tax expense 39% 6 39% 74% (5) 73%
Net profit 119% (14) 120% large 11 large
Profit attributable to NCI 100% - 100% 100% - 100%
Cash earnings 119% (14) 120% large 11 large
6.7.3 Exchange rate risk on future NZ$ earningsWestpac’s policy in relation to the hedging of the future earnings of the Group’s New Zealand division is to manage the economic risk for volatility of the NZ$ against A$. Westpac manages these flows over a time horizon under which up to 100% of the expected earnings for the following 12 months and 100% of the expected earnings for the subsequent 12 months can be hedged. At the current elevated exchange rate level, Westpac has currently ceased hedging NZ future earnings and therefore as at 31 March 2021 Westpac has no outstanding NZ future earning hedges.
156 WESTPAC GROUP 2021 INTERIM FINANCIAL RESULTS
Glossary
7.0 GlossaryShareholder value
Average ordinary equity Average total equity less average non-controlling interests.
Average tangible ordinary equity Average ordinary equity less average goodwill and other intangible assets (excluding capitalised software).
Cash earnings per ordinary share Cash earnings divided by the weighted average ordinary shares (cash earnings basis).
Cash earnings to average tangibleequity (ROTE)
Cash earnings divided by average tangible ordinary equity.
Cash ROE Cash earnings divided by average ordinary equity.
Dividend payout ratio – cash earnings Ordinary dividend paid/declared calculated on issued shares divided by cash earnings.
Dividend payout ratio – net profit Ordinary dividend paid/declared on issued shares (net of Treasury shares) divided by the net profit attributable to owners of WBC.
Earnings per ordinary share Net profit attributable to the owners of WBC divided by the weighted average ordinary shares (reported).
Economic profit – Divisions Cash earnings less a capital charge calculated at 11% of allocated capital plus 70% of the value of Australian tax expense.
Economic profit – Group Cash earnings less a capital charge calculated at 11% of average ordinary equity plus a value on franking credits calculated as 70% of the Group’s Australian tax expense.
Fully franked dividends per ordinary shares (cents)
Dividends paid out of retained profits which carry a credit for Australian company income tax paid by Westpac.
Net tangible assets per ordinary share Net tangible assets (total equity less goodwill and other intangible assets less minority interests) divided by the number of ordinary shares on issue (less Treasury shares held).
Return on equity (ROE) Net profit attributable to the owners of WBC divided by average ordinary equity.
Weighted average ordinary shares (cash earnings)
Weighted average number of fully paid ordinary shares listed on the ASX for the relevant period.
Weighted average ordinary shares (reported)
Weighted average number of fully paid ordinary shares listed on the ASX for the relevant period less Westpac shares held by the Group (‘Treasury shares’).
Productivity and efficiency
Expense to income ratio Operating expenses divided by net operating income.
Full-time equivalent employees (FTE) A calculation based on the number of hours worked by full and part-time employees as part of their normal duties. For example, the full-time equivalent of one FTE is 76 hours paid work per fortnight.
Revenue per FTE Total operating income divided by the average number of FTE for the period.
Business Performance
Average interest-bearing liabilities The average balance of liabilities owed by the Group that incur an interest expense. Where possible, daily balances are used to calculate the average balance for the period
Average interest-earning assets The average balance of assets held by the Group that generate interest income. Where possible, daily balances are used to calculate the average balance for the period.
Divisional margin Net interest income (including capital benefit) for a division as a percentage of the average interest earning assets for that division.
Interest spread The difference between the average yield on all interest-earning assets and the average rate paid on interest bearing liabilities.
Net interest margin Calculated by dividing net interest income by average interest-earning assets.
Capital Adequacy
APRA leverage ratio Tier 1 capital divided by ‘exposure measure’ and expressed as a percentage. ‘Exposure measure’ is the sum of on-balance sheet exposures, derivative exposures, securities financing transaction exposures and other off- balance sheet exposures.
Common equity tier 1 capital ratio Total common equity capital divided by risk weighted assets, as defined by APRA.
Credit risk weighted assets (Credit RWA)
Credit risk weighted assets represent risk weighted assets (on-balance sheet and off-balance sheet) that relate to credit exposures and therefore exclude market risk, operational risk, interest rate risk in the banking book and other assets.
Internationally comparable capital ratios
Internationally comparable regulatory capital ratios are Westpac’s estimated ratios after adjusting the capital ratios determined under APRA Basel III regulations for various items. Analysis aligns with the APRA study titled “International capital comparison study” dated 13 July 2015.
157WESTPAC GROUP 2021 INTERIM FINANCIAL RESULTS
1 2
34
56
7
Glossary
Capital Adequacy (continued)
Risk weighted assets (RWA) Assets (both on and off-balance sheet) are risk weighted according to each asset’s inherent potential for default and what the likely losses would be in case of default. In the case of non-asset backed risks (i.e. market and operational risk), RWA is determined by multiplying the capital requirements for those risks by 12.5.
Tier 1 capital ratio Total Tier 1 capital divided by risk weighted assets, as defined by APRA.
Total regulatory capital ratio Total regulatory capital divided by risk weighted assets, as defined by APRA.
Funding and liquidity
Committed Liquidity Facility (CLF) The RBA makes available to Australian Authorised Deposit-taking Institutions (ADIs) a CLF that, subject to qualifying conditions, can be accessed to meet LCR requirements under APS210 Liquidity.
Deposit to loan ratio Customer deposits divided by total loans.
High Quality Liquid Assets (HQLA) Assets which meet APRA’s criteria for inclusion as HQLA in the numerator of the LCR.
Liquidity Coverage Ratio (LCR) An APRA requirement to maintain an adequate level of unencumbered high quality liquid assets, to meet liquidity needs for a 30 calendar day period under an APRA-defined severe stress scenario. Absent a situation of financial stress, the value of the LCR must not be less than 100%, effective 1 January 2015. LCR is calculated as the percentage ratio of stock of HQLA and CLF over the total net cash out-flows in a modelled 30 day defined stressed scenario.
Net Stable Funding Ratio (NSFR) The NSFR is defined as the ratio of the amount of available stable funding (ASF) to the amount of required stable funding (RSF) defined by APRA. The amount of ASF is the portion of an ADI’s capital and liabilities expected to be a reliable source of funds over a one year time horizon. The amount of RSF is a function of the liquidity characteristics and residual maturities of an ADI’s assets and off-balance sheet activities. ADI’s must maintain an NSFR of at least 100%.
Term Funding Facility (TFF) A facility established by the RBA to provide 3 year term funding to Australian ADIs via repurchase transactions, subject to qualifying conditions, to help support lending to Australian businesses.
Third party liquid assets HQLA and non LCR qualifying liquid assets, but excludes internally securitised assets that are eligible for a repurchase agreement with the RBA and RBNZ.
Total liquid assets Third party liquid assets and internally securitised assets that are eligible for a repurchase agreement with a central bank.
Asset quality
90 days past due and not impaired Includes facilities where:• contractual payments of interest and / or principal are 90 or more calendar
days overdue, including overdrafts or other revolving facilities that remain continuously outside approved limits by material amounts for 90 or more calendar days (including accounts for customers who have been granted hardship assistance); or
• an order has been sought for the customer’s bankruptcy or similar legal action has been instituted which may avoid or delay repayment of its credit obligations; and
• the estimated net realisable value of assets / security to which Westpac has recourse is sufficient to cover repayment of all principal and interest, or where there are otherwise reasonable grounds to expect payment in full and interest is being taken to profit on an accrual basis.
These facilities, while in default, are not treated as impaired for accounting purposes.
Collectively assessed provisions (CAPs) Collectively assessed provisions for expected credit loss under AASB 9 represent the Expected Credit Loss (ECL) which is collectively assessed in pools of similar assets with similar risk characteristics. This incorporates forward looking information and does not require an actual loss event to have occurred for an impairment provision to be recognised.
Default For accounting purposes, a default occurs when Westpac considers that the customer is unlikely to repay its credit obligations in full, without recourse by the Group to action such as realising security, or the customer is more than 90 days past due on any material credit obligation. This definition of default is aligned to the APRA regulatory definition of default.
158 WESTPAC GROUP 2021 INTERIM FINANCIAL RESULTS
Glossary
Exposure at default (EAD) The estimated outstanding amount of credit exposure at the time of the default.
Impaired exposures Includes exposures that have deteriorated to the point where full collection of interest and principal is in doubt, based on an assessment of the customer’s outlook, cash flow, and the net realisation of value of assets to which recourse is held:
• facilities 90 days or more past due, and full recovery is in doubt: exposures where contractual payments are 90 or more days in arrears and the net realisable value of assets to which recourse is held may not be sufficient to allow full collection of interest and principal, including overdrafts or other revolving facilities that remain continuously outside approved limits by material amounts for 90 or more calendar days;
• non-accrual facilities: exposures with individually assessed impairment provisions held against them, excluding restructured loans;
• restructured facilities: exposures where the original contractual terms have been formally modified to provide for concessions of interest or principal for reasons related to the financial difficulties of the customer;
• other assets acquired through security enforcement (includes other real estate owned): includes the value of any other assets acquired as full or partial settlement of outstanding obligations through the enforcement of security arrangements; and
any other facilities where the full collection of interest and principal is in doubt.
Individually assessed provisions (IAPs) Provisions raised for losses on loans that are known to be impaired and are assessed on an individual basis. The estimated losses on these impaired loans is based on expected future cash flows discounted to their present value and, as this discount unwinds, interest will be recognised in the income statement.
Loss given default (LGD) The loss that is expected to arise in the event of a default.
Non-performing exposures Exposures which are in default.
Performing exposures Exposures which are not in default.
Probability of default (PD) The probability that a counterparty will default.
Provision for expected credit losses (ECL)
Expected credit losses (ECL) are a probability-weighted estimate of the cash shortfalls expected to result from defaults over the relevant timeframe. They are determined by evaluating a range of possible outcomes and taking into account the time value of money, past events, current conditions and forecasts of future economic conditions.
Stage 1: 12 months ECL - performing For financial assets where there has been no significant increase in credit risk since origination a provision for 12 months expected credit losses is recognised. Interest revenue is calculated on the gross carrying amount of the financial asset.
Stage 2: Lifetime ECL - performing For financial assets where there has been a significant increase in credit risk since origination but where the asset is still performing a provision for lifetime expected losses is recognised. Interest revenue is calculated on the gross carrying amount of the financial asset.
Stage 3: Lifetime ECL - non-performing
For financial assets that are non-performing a provision for lifetime expected losses is recognised. Interest revenue is calculated on the carrying amount net of the provision for ECL rather than the gross carrying amount.
Stressed exposures Watchlist and substandard, 90 days past due and not impaired and impaired exposures.
Total committed exposure (TCE) Represents the sum of the committed portion of direct lending (including funds placement overall and deposits placed), contingent and pre-settlement risk plus the committed portion of secondary market trading and underwriting risk.
Watchlist and substandard Loan facilities where customers are experiencing operating weakness and financial difficulty but are not expected to incur loss of interest or principal.
Asset quality (continued)
159WESTPAC GROUP 2021 INTERIM FINANCIAL RESULTS
1 2
34
56
7
Glossary
Other
COVID-19 A viral disease, declared as a pandemic by the World Health Organisation on 12 March 2020.
Credit Value Adjustment (CVA) CVA adjusts the fair value of over-the-counter derivatives for credit risk. CVA is employed on the majority of derivative positions and reflects the market view of the counterparty credit risk. A Debit Valuation Adjustment (DVA) is employed to adjust for our own credit risk.
Divisional results Divisional results are presented on a management reporting basis. Internal charges and transfer pricing adjustments are included in the performance of each division reflecting the management structure rather than the legal entity (these results cannot be compared to results for individual legal entities). Where management reporting structures or accounting classifications have changed, financial results for comparative periods have been restated and may differ from results previously reported. Overhead costs are allocated to revenue generating divisions.The Group’s internal transfer pricing frameworks facilitate risk transfer, profitability measurement, capital allocation and divisional alignment, tailored to the jurisdictions in which the Group operates. Transfer pricing allows the Group to measure the relative contribution of products and divisions to the Group’s interest margin and other dimensions of performance. Key components of the Group’s transfer pricing frameworks are funds transfer pricing for interest rate and liquidity risk and allocation of basis and contingent liquidity costs, including capital allocation.
First Half 2020 Six months ended 31 March 2020.
First Half 2021 Six months ended 31 March 2021.
IFTI International Funds Transfer Instructions
Net Promoter Score (NPS) Net Promoter Score measures the net likelihood of recommendation to others of the customer’s main financial institution for retail or business banking. Net Promoter ScoreSM is a trademark of Bain & Co Inc., Satmetrix Systems, Inc., and Mr Frederick Reichheld.• For retail banking, using a scale of 1 to 10 (1 means ‘extremely unlikely’ and
10 means ‘extremely likely’), the 1-6 raters (detractors) are deducted from the 9-10 raters (promoters); and
• For business banking, using a scale of 0 to 10 (0 means ‘extremely unlikely’ and 10 means ‘extremely likely’), the 0-6 raters (detractors) are deducted from the 9-10 raters (promoters).
Prior corresponding period Refers to the six months ended 31 March 2020.
Prior half / Prior period Refers to the six months ended 30 September 2020.
Run-off Scheduled and unscheduled repayments and debt repayments (from for example property sales and external refinancing), net of redraws.
Second Half 2020 Six months ended 30 September 2020.
SME Small to medium sized enterprises
Women in Leadership Women in Leadership refers to the proportion of women (permanent and maximum term) in leadership roles across the Group. It includes the CEO, Group Executive, General Managers, senior leaders with significant influence on business outcomes (direct reports to General Managers and their direct reports), large (3+) team people leaders three levels below General Manager, and Bank and Assistant Bank Managers.