Embed Size (px)
Citation preview

2021 Municipal State Aid Street
Needs Report
October 2021
PREFACE
Fifty percent of the total apportionment will be distributed on prorated share of each city’s population
Fifty percent of the total apportionment will be based on a prorated share of each city’s Construction Needs (also called Money Needs)
The 2021 Municipal State Aid Street Needs Report is presented to the Municipal Screening Board for use in making their annual construction (money) needs recommendation to the Commissioner of Transportation.
This submittal is required by MN Statute 162.13 and is to be made to the Commissioner on or before November 1st of each year.
The construction (money) needs data contained in this book were compiled after Needs updates were submitted for each municipality. Construction Needs are calculated by applying the unit prices (as determined by the Municipal Screening Board at their spring meeting in May 2021) to the quantities in the appropriate urban ADT group. These ADT groups and explanations for all Needs Calculations are in the resolutions of the Municipal Screening Board.
Population data, from the US Census Bureau, will be combined with the Commissioner's final construction Needs, then the results will be used to determine the total allocations which will be reported in the "2022 Municipal State Aid Apportionment Data" book to be published in January.

January
February
July
March
April
May
June August
September
October
November
December
March 1st Deadlinefor System Revision Requests
Request Pop. Es mates
No fy DSAE’s to schedule prescreening mee ngs
Fall Screening Board Mtg
No fy ci es for Maintenance requests
No fy ci es to update certs.
Start preparing Fall book
FALL PRESCREENING BOARD MEETINGS
January book (on line)
No fy DSAE’s to schedule prescreening mee ngs
NSS mee ng
May 1st HARD deadline for system revisions, CC resolutions & Needs
Updates.
December 15th Maintenance Requests Due
January 15th deadline for Annual Certification
of Mileage
Request Storm Sewer le er/Bridge Data
SPRING PRESCREENING BOARD MEETINGS
Mail out Spring Books
Prepare NSS book
Start preparing Spring book
Mail out Fall books
City tasks (inside calendar)
State Aid tasks (outside calendar)
March 31st Deadlinefor
NeedsUpdates without any
System Revision Requests
Spring Screening Board Mtg
Start preparing Jan. book
Ongoing Processes
Highway User Tax Distribu on Fund
NEEDS RESET 1) Back up current Needs 2) Reset3) No fy ci es to begin upda ng
Send Finance Allotments

The State Aid Program Mission Study
Mission Statement:
The purpose of the state-aid program is to provide resources, from the Highway Users Tax Distribution Fund, to assist local governments with the construction and maintenance of community-interest highways and streets on the state-aid system.
Program Goals:
The goals of the state-aid program are to provide users of secondary highways and streets with:
Safe highways and streets; Adequate mobility and structural capacity on highways and streets; and An integrated transportation network.
Key Program Concepts:
Highways and streets of community interest are those highways and streets that function as an integrated network and provide more than only local access. Secondary highways and streets are those routes of community interest that are not on the Trunk Highway system.
A community interest highway or street may be selected for the state-aid system if it:
A. Is projected to carry a relatively heavier traffic volume or is functionally classified ascollector or arterial
B. Connects towns, communities, shipping points, and markets within a county or inadjacent counties; provides access to rural churches, schools, community meeting halls,industrial areas, state institutions, and recreational areas; serves as a principal rural mailroute and school bus route; or connects the points of major traffic interest, parks,parkways, or recreational areas within an urban municipality.
C. Provides an integrated and coordinated highway and street system affording, withinpractical limits, a state-aid highway network consistent with projected traffic demands.
The function of a road may change over time requiring periodic revisions to the state-aid highway and street network.
State-aid funds are the funds collected by the state according to the constitution and law, distributed from the Highway Users Tax Distribution Fund, apportioned among the counties and cities, and used by the counties and cities for aid in the construction, improvement and maintenance of county state-aid highways and municipal state-aid streets.
The Needs component of the distribution formula estimates the relative cost to build county highways or build and maintain city streets designated as state-aid routes.

TABLE OF CONTENTS
INTRODUCTORY INFORMATION
Maps of Highway Districts and Urban Municipalities.......................................................... 2
2021 Municipal Screening Board & Subcommittees............................................................ 4
Past Municipal Screening Board Representatives .............................................................. 6
Minutes of Spring Screening Board Meeting - May 25th, 2021........................................... 8
UCFS Meeting Minutes - Sept. 21, 2021 ……………………………………………………… 13
POPULATION DATA
Population Data Notes ……………………………………………………………………………. 17
2021 Population Summary ..................................................................................................... 18
Map: State Aid Cities Population Change, 2010 to 2020 ……………………………………… 23
Tentative Population Allocations 2022 ................................................................................ 24
NEEDS DATA
Mileage, Needs, and Apportionment since 1958 .................................................................. 28
Apportionment Per $1,000 Needs: Chart ……………………………………………………… 30
2021 Itemized Tabulation of Needs........................................................................................ 31
Map: Needs Costs per Mile ………………………………………………………………………… 36
Comparison of Needs Between 2020 and 2021.................................................................... 37
2021 Mileage Report................................................................................................................. 38
MSAS Needs Mileage Comparison………………………………………………………………… 43
2021 Construction Needs & 2022 Construction Needs Allocations / explanation .......... 44
Phase In (Restriction) ending.................................................................................................. 45
Map: Potential Restricted Cities 2021 ..………………………………………………………… 46
Sample Restricted Needs for 2022 ….................................................................................... 47
Cities with Restricted Needs since Phase-in started…....................................................... 52
NEEDS ADJUSTMENTS & TENTATIVE NEEDS ALLOCATIONS
Excess Balance Adjustment / Low Balance Incentive......................................................... 54
Right of Way Adjustments ………………………………………………………………………… 60
Retaining Wall Adjustment ..................................................................................................... 64
After the Fact Railroad Crossing & Railroad Bridge Over MSAS Adjustment ................. 65
2021 Adjusted Construction Needs ...................................................................................... 66Letter to the Commissioner / Needs Recommendations……………………………………… 70Tentative 2022 Construction Needs Allocations .................................................................. 73Comparison of 2021 to 2022 Construction Needs Allocations........................................... 76Tentative Total Allocations 2022 ............................................................................................ 79Comparison of 2021 and 2022 Total Allocations ……………………………......................... 82Allocation Rankings ................................................................................................................ 85
OTHER TOPICS
Certification of MSAS System as complete........................................................................... 90History of the Administrative and Research Accounts........................................................ 92Advance Guidelines ……………………………………………………………………………….. 93EMMA Mapping Application ………………………………………………………………………. 95Current Resolutions of the Municipal Screening Board ..................................................... 96

State of Minnesota Metro District & Urban Municipali es (Popula on over 5000) 86 Metro Ci es
N. Branch
Wyoming
St. Francis
Oak Grove
E. Bethel
Ramsey Ham Lake
Andover
Anoka
Coon Rapids
Blaine
Lino Lakes
Circle Pines
Columbia Heights
Fridley
Spring Lake Park
Forest Lake
Hugo
Mahtomedi
Lake Elmo
Oakdale
Woodbury
St. Paul Park
Co age Grove
S llwater
Burnsville
Eagan
Mendota Heights
W. St. Paul
S. St. Paul
Apple Valley
Lakeville
Farmington
Has ngs
Inver Grove Heights
Rosemount Jordan
Shakopee
Belle Plaine
Savage
Prior Lake
Chanhassen
Chaska
Waconia
Victoria Eden Prairie
Minneapolis
Bloomington
Rich eld Edina
Hopkins Minnetonka Shorewood
Minnetrista
Mound
St. Louis Park
Orono
Medina
Corcoran
Rogers
Brooklyn Park
Brooklyn Center
Maple Grove
Champlin
Dayton
Plymouth
Golden Valley
New Hope
Robbinsdale Crystal
Mounds View
New Brighton
Roseville
Li le Canada
Falcon Heights
St. Paul
Arden Hills
White Bear Lake
Vadnais Heights
N. St. Paul
Maplewood
Shoreview
Updated 9/2021
Chisago City
St. Anthony
Credit River
Carver
Credit River
Carver
Circle Pines
a
y
nye
M
ive
New Cities for 2022: Carver and Credit River
2

State of Minnesota MnDOT Districts & Urban Municipalities (Population over 5000)
64 Greater MN Cities
International Falls
Virginia Chisholm
Hibbing
Hermantown Duluth
Grand Rapids
Bemidji
Thief River Falls
Crookston
E. Grand Forks
Cloquet
Moorhead
Detroit Lakes
Fergus Falls
Morris
Alexandria
Brainerd
Baxter
Little Falls
Worthington
Marshall
Redwood Falls
Montevideo Willmar
Hutchinson
Glencoe
Litchfield
Fairmont Albert Lea
Austin
La Crescent
Winona
Lake City
Red Wing
Northfield
Faribault
Stewartville
Rochester Byron
Kasson Owatonna
Waseca
Mankato N. Mankato
St. Peter New Ulm
New Prague
St. Joseph Waite Park
Sartell
Sauk Rapids Cambridge
Isanti Zimmerman
Elk River
St. Cloud
Big Lake
Monticello
Buffalo
Delano
Albertville Otsego
St. Michael
District 1
District 2
District 3 District 4
District 8
District 7
District 6
Metro *see Metro District map
Updated 1/8/14
3

31-Aug-21
Chair Michael Thompson Plymouth (763) 509-5501 Vice Chair Paul Sandy Brainerd (218) 454-3411 Secretary Jen Desrude Burnsville (952) 895-4544
District Years Served Representative City Phone 1 2020-2022 Caleb Peterson Cloquet (218) 879-6758
2 2021-2023 Steve Emery East Grand Forks (218) 773-5626
3 2021-2023 Layne Otteson Big Lake (763) 251-2984
4 2019-2021 Brian Yavarow Fergus Falls (218) 332-5413
Metro-West 2019-2021 Chad Millner Edina (952) 826-0318
6 2019-2021 Kyle Skov Owatonna (507) 444-4350
7 2020-2022 Jeff Domras St. Peter (507) 625-4171
8 2021-2023 Chuck DeWolf Litchfield (320) 231-3956
Metro-East 2020-2022 Brian Erickson Rosemount (651) 322-2025
Cities Permanent Cindy Voigt Duluth (218) 730-5200
of the Permanent Jenifer Hager Minneapolis (612) 673-3625
First Permanent Dillon Dombrovski Rochester (507) 328-2421
Class Permanent Paul Kurtz Saint Paul (651) 266-6203
District Year Beginning City Phone 1 2023 Curt Meyer International Falls (218) 308-2603
2 2024 Craig Gray Bemidji (218) 333-1851
3 2024 Cody Holmes Saint Michael (763) 516-7936
4 2022 Tom Trowbridge Moorhead (218) 299-5393
Metro-West 2022 Will Manchester Minnetonka (952) 939-8232
6 2022 Brandon Theobald Kasson (507) 288-3923
7 2023 Jeff Johnson Mankato (507) 387-8640
8 2024 Mike Amborn Montevideo (320) 269-7695
Metro-East 2023 Zachary Johnson Lakeville (952) 985-4501
* Jeff Johnson or Michael McCarty
** this is a vacated term from 2017 to 2019 being finished out by Brian Erickson. He will resume as member in 2020
Alternates
2021 MUNICIPAL SCREENING BOARD
Officers
Members
4

Steve Lillehaug Marc CulverShakopee Roseville(952) 233-9361 (651) 792-7041Expires after 2021 Expires after 2021
Matt Wegwerth John GorderGrand Rapids Eagan(218) 326-7625 (651) 675-5645 Expires after 2022 Expires after 2022
Jay Owens Justin FemriteRed WIng Elk River(651) 385-3600 (763) 635-1051Expires after 2023 Expires after 2023
2021 SUBCOMMITTEES
Needs Study SubcommitteeUnencumbered Construction Funds
Subcommittee
The Screening Board Chair appoints one city Engineer, who has served on the Screening Board, to serve a three year term on the Needs Study Subcommittee.
The past Chair of the Screening Board is appointed to serve a three year term on the Unencumbered Construction Fund Subcommittee.
N:\MSAS\Books\2021 January Book\Subcommittee Members 2021.xlsx
5

27-Jul-21
DISTRICT DISTRICT DISTRICT DISTRICT METRO DISTRICT DISTRICT DISTRICT METROYEAR 1 2 3 4 WEST 6 7 8 EAST1996 HALTER SANDERS KREKLAU NANSEN BITTLE MALIN READ RODEBERG JESSUP
Champlin Fairmont Woodbury1997 HALTER KILDAHL WOTZKA NANSEN BITTLE MALIN READ SARFF JESSUP
Crookston Sartell Litchfield 1998 SALO KILDAHL WOTZKA SCHOONHOVEN BITTLE OLSON READ SARFF JESSUP
Hermantown Alexandria Albert Lea 1999 SALO KILDAHL WOTZKA SCHOONHOVEN GUSTAFSON OLSON KOEHLER SARFF BURCH
Minnetonka New Ulm White Bear Lk2000 SALO METSO KOSHAK SCHOONHOVEN GUSTAFSON OLSON KOEHLER ODENS BURCH
Bemidji Otsego Willmar2001 SALO SANDERS KOSHAK EDWARDS PEDERSON MURRAY KOEHLER ODENS BURCH
E. Gr. Forks Fergus Falls Bloomington Faribault 2002 SUIHKONEN SANDERS WEISS EDWARDS PEDERSON MURRAY LOOSE ODENS AHL
Hibbing Monticello St. Peter Maplewood2003 SUIHKONEN KILDAHL WEISS EDWARDS PEDERSON MURRAY LOOSE BERRYMAN AHL
Crookston Montevideo2004 SUIHKONEN KILDAHL WEISS KUHN GRAY JOHNSON LOOSE BERRYMAN AHL
Morris Anoka Owatonna2005 PAGEL KILDAHL WEISS KUHN GRAY JOHNSON SALSBURY BERRYMAN BLOOM
Grand Rapids Waseca Roseville2006 PAGEL FREEBURG MAUER KUHN GRAY JOHNSON SALSBURY OLSON BLOOM
Bemidji Elk River Marshall2007 PAGEL FREEBURG MAUER ZIMMERMAN HAUKAAS/KEELY GEHLER-HESS SALSBURY OLSON BLOOM
Moorhead Fridley/Blaine Northfield2008 PRUSAK GRAY MAUER ZIMMERMAN KEELY GEHLER-HESS SAFFERT OLSON MATTHYS
Cloquet Bemidji Blaine Mankato Eagan2009 PRUSAK BOPPRE BOT ZIMMERMAN KEELY GEHLER-HESS RIPPKE EXNER MATTHYS
E Grand Forks St. Michael N. Mankato Hutchinson2010 PRUSAK BOPPRE BOT SCHOONHOVEN MATHISEN STRAUSS RIPPKE EXNER MATTHYS
Alexandria Crystal Stewartville2011 SALO BOPPRE BOT SCHOONHOVEN MATHISEN STRAUSS NEMMERS EXNER GRAHAM
Hermantown Fairmont Vadnais Hts.2012 SALO KILDAHL DEWOLF SCHOONHOVEN MATHISEN STRAUSS NEMMERS RODEBERG GRAHAM
Th River Falls Buffalo Glencoe2013 SALO KILDAHL DEWOLF J. PRATT R. RUE S. LANG NEMMERS RODEBERG GRAHAM
Detroit Lakes Eden Prairie Austin2014 J. STORY R. CLAUSON DEWOLF J. PRATT R. RUE S. LANG J. JOHNSON RODEBERG K. ECKLES
Hibbing Crookston Detroit Lakes Eden Prairie Austin Mankato Glencoe Woodbury2015 J. STORY C. GRAY J. FEMRITE J. PRATT R. RUE S. LANG J. JOHNSON S. CHRISTENSEN K. ECKLES
Hibbing Bemidji Elk River Detroit Lakes Eden Prairie Austin Mankato Willmar Woodbury2016 J. STORY C. GRAY J. FEMRITE J. KUHN S. LILLEHAUG J. OWENS J. JOHNSON S. CHRISTENSEN K. ECKLES
Hibbing Bemidji Elk River Morris Brooklyn Center Red Wing Mankato Willmar Woodbury2017 M. WEGWERTH C. GRAY J. FEMRITE J. KUHN S. LILLEHAUG J. OWENS M. DuCHENE S. CHRISTENSEN M. THOMPSON
Grand Rapids Bemidji Elk River Morris Shakopee Red Wing Waseca Willmar Maplewood2018 M. WEGWERTH R. CLAUSON A. NAFSTAD J. KUHN S. LILLEHAUG J. OWENS C. CAVETT A. KEHREN T. WESOLOWSKI
Grand Rapids Crookston Albertville Morris Shakopee Red Wing New Prague Redwood Falls Shoreview2019 M. WEGWERTH R. CLAUSON A. NAFSTAD B. YAVAROW C. MILLNER K. SKOV C. CAVETT O. TODD B. ERICKSON
Grand Rapids Crookston Albertville Fergus Falls Edina Owatonna New Prague Redwood Falls Rosemount2020 C. PETERSON R. CLAUSON A. NAFSTAD B. YAVAROW C. MILLNER K. SKOV J. DOMRAS O. TODD B. ERICKSON
Cloquet Crookston Albertville Fergus Falls Edina Owatonna St. Peter Redwood Falls Rosemount2021 C. PETERSON S. EMERY L. OTTESON B. YAVAROW C. MILLNER K. SKOV J. DOMRAS C. DeWOLF B. ERICKSON
Cloquet E. Grand Forks Big Lake Fergus Falls Edina Owatonna St. Peter Litchfield Rosemount
MUNICIPAL SCREENING BOARD REPRESENTATIVESDistricts
N:\MSAS\Books\2021 October Book\Past Screening Board Members.xlsx
6

MINNEAPOLIS ST. PAUL DULUTH ROCHESTER CHAIR VICE CHAIR SECRETARY1996 KANNANKUTTY ST MARTIN LARSON SONNENBERG BACHMEIER RODEBERG
BACHMEIER Oakdale Hutchinson1997 KANNANKUTTY WARN BEEMAN BACHMEIER RODEBERG ASHFELD
Oakdale Hutchinson Maple Grove1998 KANNANKUTTY WARN WINSON RODEBERG ASHFELD HALTER
Hutchinson Maple Grove Grand Rapids1999 KANNANKUTTY WARN WINSON RODEBERG VACANT JESSUP
ASHFELD Woodbury2000 KANNANKUTTY WARN BRINK ASHFELD JESSUP DRAKE
SONNENBERG Maple Grove Woodbury Red Wing2001 SONNENBERG WARN METSO JESSUP DRAKE GUSTAFSON
Woodbury Red Wing Minnetonka2002 SONNENBERG WARN METSO DRAKE GUSTAFSON METSO
OGREN KURTZ Red Wing Minnetonka Duluth2003 OGREN KURTZ METSO GUSTAFSON METSO HAGEN
FABRY Minnetonka Duluth St. Louis Park2004 FABRY KURTZ METSO METSO HAGEN GAETZ
Duluth St. Louis Park St.Cloud2005 FABRY KURTZ METSO METSO GAETZ AHL
Duluth St.Cloud Maplewood2006 RAE KURTZ BENNING GAETZ AHL ODENS
VOIGT St. Cloud Maplewood Willmar2007 RAE/ELWOOD KURTZ VOIGT AHL ODENS PEDERSON
Maplewood Willmar Bloomington2008 ELWOOD KURTZ VOIGT ODENS PEDERSON HULSETHER
Willmar Bloomington Brainerd2009 ELWOOD KURTZ VOIGT PEDERSON HULSETHER KEELY
Bloomington Brainerd Blaine2010 ELWOOD KURTZ VOIGT HULSETHER KEELY EXNER
Brainerd Blaine Hutchinson2011 ELWOOD KURTZ VOIGT FREESE KEELY EXNER MOBERG
Blaine Hutchinson Plymouth2012 ELWOOD KURTZ VOIGT FREESE EXNER VACANT BOT
Hutchinson St. Michael2013 ELWOOD KURTZ VOIGT FREESE VACANT BOT ECKLES
St. Michael Woodbury2014 ELWOOD KURTZ VOIGT FREESE BOT ECKLES JOHNSON
St. Michael Woodbury Mankato2015 ELWOOD KURTZ VOIGT FREESE ECKLES JOHNSON CULVER
Woodbury Mankato Roseville2016 ELWOOD KURTZ VOIGT FREESE JOHNSON CULVER OLSON
Mankato Roseville Marshall2017 ELWOOD KURTZ VOIGT FREESE CULVER OLSON GORDER
Roseville Marshall Eagan2018 ELWOOD/HAGER KURTZ VOIGT DOMBROVSKI OLSON GORDER FEMRITE
Marshall Eagan Elk River2019 HAGER KURTZ VOIGT DOMBROVSKI GORDER FEMRITE THOMPSON
Eagan Elk River Maplewood2020 HAGER KURTZ VOIGT DOMBROVSKI FEMRITE THOMPSON SANDY
Elk River Maplewood Brainerd2021 HAGER KURTZ VOIGT DOMBROVSKI THOMPSON SANDY DENSRUDE
Maplewood Brainerd Burnsville
MUNICIPAL SCREENING BOARD REPRESENTATIVESCities of the First Class and Officers
N:\MSAS\Books\2021 October Book\Past Screening Board Members.xlsx
7

MINUTES
MUNICIPAL SCREENING BOARD MEETING May 25th 2021 at 1pm to 4pm (TEAMS Meeting)
I. Call to Order and Welcome by Chair Michael Thompson a. Meeting was called to order at 1:15 PM. b. Introductions of MSB Officers and State Aid Personal
i. Kristine Elwood, MnDOT – State Aid Engineer ii. Chris Kufner, MnDOT – Deputy State Aid Engineer iii. Kim Delarosa, MnDOT – Manager, State Aid Needs Unit iv. Bill Lanoux, MnDOT - Manager, Municipal State Aid Needs v. Steve Lillehaug – Current Chair Needs Study Subcommittee vi. Marc Culver – Current Chair UCFS vii. Paul Sandy, Brainerd – Vice Chair MSB viii. Jen Desrude, Bloomington – Secretary MSB
Roll Call of Screening Board Members
District 1 Caleb Peterson, Cloquet District 2 Steve Emery, East Grand Forks District 3 Layne Otteson, Big Lake District 4 Brian Yavarow, Fergus Falls Metro West Chad Millner, Edina District 6 Kyle Skov, Owatonna District 7 Jeff Domras, St. Peter District 8 Chuck DeWolf, Litchfield Metro East Zach Johnson, Lakeville Duluth Cindy Voigt Minneapolis Jenifer Hager Rochester Dillon Dombrovski St. Paul Paul Kurtz
Also invited
Tom Trowbridge, Moorhead - District 4 Will Manchester, Minnetonka - Metro West Brandon Theobald, Kasson - District 6 Marc Briese - State Aid Programs Engineer Elisa Bottos - State Aid Project Delivery Engineer Krysten Saatela Foster - District 1 State Aid Engineer Brian Ketring - District 2 State Aid Engineer Kelvin Howieson - District 3 State Aid Engineer Nathan Gannon - District 4 State Aid Engineer Fausto Cabral - District 6 State Aid Engineer Lisa Bigham - District 7 State Aid Engineer Todd Broadwell - District 8 State Aid Engineer Dan Erickson - Metro State Aid Engineer Julie Dresel - Assistant Metro State Aid Engineer John Gorder, Eagan - Past Chair MSB Justin Femrite, Elk River - Past Chair MSB
8

Kyle Wallace, Minneapolis Mike Van Beusekom, St. Paul Marc Culver, Roseville - CEAM Legislative Committee Chair
II. Review of the 2021 Municipal Screening Board Data book
a. Review of purpose of the meeting – to review unit cost recommendations from the Needs Study Subcommittee and vote to approve unit costs to be used for 2022 needs.
b. Review October 2020 Screening Board minutes (pages 6-12) i. UCFS recommendation to continue applying lower restriction
adjustment, to continue to monitor the lower restriction with the UCFS meeting in September 2021 to discuss further, and the recommendation to eliminate the upper restriction one year early was unanimously approved at the October 2020 MSB meeting.
ii. Waiving the Excess Unencumbered Construction Balance Adjustment resolution for the 2021 apportionment with request to UCFS to study further and bring a recommendation to the spring 2021 MSB meeting was unanimously approved at the October 2020 MSB meeting. It was noted to expect this recommendation at the Fall 2021 MSB meeting.
iii. Approving the resolution to set aside $1,051,228 (not to exceed ½ of 1% of the 2020 MSAS Apportionment was approved unanimously at the October 2020 MSB meeting.
Motion to approve the minutes by Domras, second by Millner, Motion Carried 13-0.
c. Review of Unit Price Study and Recommendations
i. Every three years, the Municipal State Aid Needs Unit conducts a Unit Price Study based on project costs of system MSAS projects for Grading, Aggregate Base, Bituminous, Sidewalk Construction and Curb and Gutter Construction.
ii. Street lighting is not studied every three years, but can be requested to be studied at any time. Committee recommended no changes.
iii. MnDOT’s hydraulic office provides recommendations for storm sewer construction costs. Going forward the hydraulic office will follow the same three-year cycle as the other unit prices.
iv. Signal average costs are based on projects that are most representative of State Aid System signals.
v. Structures are based on a five-year average of State Aid bridge costs.
vi. In off years, an ENR inflation factor is applied. The NSS noted that some unit costs see big changes after a unit cost study and questioned whether the inflation factor (used in “off years”) is always an adequate measure. In 2022 State Aid will present the NSS with some actual cost data, along with the results of applying an inflation factor.
9

III. Take action on Unit Cost Recommendations a. Unit Price recommendations of the Needs Study Subcommittee are on
page 41 of the Spring 2021 Municipal Screening Board Data, Unit Prices book. Motion to approve the Unit Costs as recommended by the NSS by Voigt, second by Hager, Motion Carried 13-0.
IV. Discuss Traffic Resolution Page 80 a. A Traffic Counting handout was provided to the MSB. b. State Aid is seeking guidance on how to handle traffic counts that
were completed in 2020. Less than one-fourth of the count locations expected to be counted in a normal year were actually counted. Of those counts, most had a decline in AADT. Without direction from the MSB, cities who completed 2020 counts would have them entered into the Needs and it might lead to reduced needs being generated for those cities.
c. Millner indicated cities that did counts in 2020 should not be penalized.
d. Thompson clarified the frequency of required counts and Lanoux indicated federal requirements are every six years, but MSB resolutions require them every four years.
e. Johnson agreed that cities should not be penalized for conducting traffic counts in 2020 and asked if cities that had an increase should have the increase entered into the Needs, but the decrease would revert to 2019 data.
f. Thompson asked if omitting all 2020 counts should be considered even those with increases.
g. Lanoux noted that a decision sooner rather than later is preferred but that the MSB could defer their action until the Fall 2021 MSB meeting.
h. Hager noted that in Minneapolis she has observed that counts were down in 2020, but that they are already coming back in 2021 to pre-pandemic volumes. She supports using 2019 data until traffic counts are cycled through again.
i. Johnson agreed with using 2019 data for 2021 needs study. j. Voigt agreed that using 2019 data makes sense but would not support
changing the count cycle.
Motion to use 2019 traffic count data, used in the 2020 needs, shall be used for the 2021 needs by Voigt, second by Johnson, Further Discussion:
i. Millner asked for how State Aid would handle this action procedurally. Lanoux responded that they are reviewing the traffic volume program’s data right now and would incorporate this action into their review.
ii. Dombrovski asked if this would need to be discussed every year until the 2020 counts cycle through for new counts. Lanoux indicated this might take a few years to work through.
10

iii. Lanoux asked if the motion to remove 2020 traffic counts should pertain to all instances or if State Aid should have discretion to determine which increases are legitimate. Voigt disagreed with selectively choosing which increases to use. Otteson agreed with Voigt that either use all 2020 or none of 2020.
iv. DeWolf asked if cities that were missed in 2020 and 2021 will be prioritized for 2022 and Lanoux indicated that was what he had been told by the Traffic group.
Motion Carried 13-0.
V. Other Discussion items a. Legislative Update- Marc Culver
i. Last week session ended abruptly. They did establish their budget targets before session ended and both sides agreed to some budget numbers. New deadlines were established for omnibus bills.
ii. Goal is for special session to start June 13 or 14 when they vote on Governor’s continued use of emergency powers.
iii. At fall screening board spoke about bridge funding language and the compromised language with transportation committee chairs is in the omnibus bill.
iv. State aid is looking at border roads in the corrections bill, that were not controversial, will be in 2022.
v. City Engineers have been attending County Engineers meetings. City Engineers and County Engineers will meet in advance of next session (the policy session) to get aligned on some issues.
vi. Distribution of Federal COVID funding is still being discussed with additional conversations still being had with State Aid and Met Council.
b. State Aid Report – Chris Kufner i. Proposed statutory changes 162.13
• In 1989, Metro District combined from two districts to one. Statute indicates there is one screening board representative from each district. A housekeeping bill is proposed to allow the Metro District to continue to have two screening board representatives, Metro East and Metro West.
• Kufner asked if this should be a housekeeping item or if CEAM would like to be involved. Thompson indicated that since it’s just a clean-up item, CEAM would not need to be involved in the housekeeping bill, but could serve as a resource if needed.
VI. Last Call for Any Other Discussion Topics
a. Thompson asked if State Aid had determined a location for the Fall
screening board meeting. Lanoux indicated they are moving forward
11

with finding a location to meet in person for a combined City and County screening board meeting, but that work is still in progress.
VII. Closing Remarks from Chair
VIII. Adjourn
Motion to adjourn by Millner, second by Dombrovski, Motion Carried 13-0.
Meeting adjourned at 2:18 PM
Respectfully submitted,
__________________________Jennifer Desrude, PEMunicipal Screening Board SecretaryBurnsville City Engineer
Digitally signed by Jennifer C. DesrudeDN: C=US, [email protected], O=City of Burnsville - Engineering, OU=City Engineer, CN=Jennifer C. DesrudeDate: 2021.05.28 09:27:19-05'00'
12

Unencumbered Construction Funds Subcommittee Meeting Minutes: September 21st, 2021
Attendees Marc Culver, UCFS / Roseville John Gorder, UCFS / Eagan Justin Femrite, UCFS / Elk River Kim Delarosa, State Aid Bill Lanoux, State Aid
Items for Discussion
The UCFS met on Wednesday September 21st, 2021 to discuss two motions from the Municipal Screening Board: #1) is for the committee to assess the ending of the seven‐year Phase‐in Period and see if any further recommendations regarding an extended period to the low restriction are necessary. #2) is for the committee to study the Excess Unencumbered Construction Fund Balance Adjustment and bring back a recommendation for changes to this resolution.
ITEM #1 Phase‐in / Restriction
The seven‐year phase‐in period ended after the January 2021 allocation. If the Screening Board takes no further action, there will no longer be a restriction applied to any city’s 25‐year constructions Needs and each city’s Unadjusted Needs will be the basis of their 2022 allocation. Lanoux presented a report in which State Aid ran the 2021 Needs Calculations with a hypothetical low restriction applied. If the restriction were applied for an extra 8th year, there would still be five cities (of 148) that fall into the Low Restriction: Crookston, Delano, Mound, St. Francis, & Thief River Falls. (it was noted that the Municipal Screening Board eliminated the upper restriction one year early, in 2020).
Using last year’s construction needs distribution amount of $96,505,794 (which is 50% of the total distribution) State Aid ran Tentative 2022 allocations, with & without a restriction applied. The report showed the financial difference was largest for St. Francis (+$30,352) and Crookston (+$24,090), while Delano’s difference was +$8,708. Thief River Falls (+$2,653) and Mound (+$2,031) were minimal in comparison, as these two cities narrowly fell into being restricted and most likely wouldn’t be restricted beyond an 8th year. As for the 143 cities not restricted, they would all give up approximately one‐tenth of 1% of their allocation if the restriction were to be applied again.
With St. Francis and Crookston being the cities most impacted, the committee reviewed the Annual Needs for these two cities, going back to the beginning of the phase‐in period. For the 2015 distribution, Crookston’s Unadjusted Needs and Restricted Needs differed by 47%. For 2022 the difference would be 8.5%, so the phase‐in has been working. For St. Francis, the percent difference was 47% in 2015 and would be 13% in 2022. Lanoux commented that one reason St. Francis phased‐in at a slower rate is that their overall ADT had decreased during the phase‐in. He also added that when cities don’t add mileage during the time they’re being restricted, it might take more years to completely “phase‐in”.
The UCFS felt that when the new system was implemented, the phase‐in period was recommended because of concerns over projected reductions in allocations for some cities. The Needs Study Task Force had considered several options for a phase‐in process, and the MSB approved of the seven‐year
13

option because it was the scenario that best gave these cities enough time to make adjustments to their capital improvement plans. It was always understood that there could be a small number of cities not completely “phased‐in” after 7 years. But with very few restricted cities left today, and little discussion from recent Screening Boards Members on revising the Phase‐in Period, the committee thinks it has worked as planned and doesn’t see a need to continue for additional years. RECOMMENDATION #1: The UCFS has assessed the ending of the 7‐year Phase‐in and does not recommend any changes. As written in current Screening Board resolutions, the UCFS is recommending that the Phase‐in period expired after the January 2021 allocation Motion carried unanimously. --------------------------------------------------------------------------------------------------------------------------------------------------------- ITEM #2 Excess Unencumbered Construction Fund Balance Adjustment The UCFS reviewed recent concerns with this resolution.
In 2020, the Advance status had hit a state of code red due to high projected spending. Several cities that would’ve been subject to this negative adjustment inquired about the penalty. Conveying that if the penalty weren’t applied, perhaps the city could hold off on further payment requests for 2020, which may allow for other cities to advance.
At the 2020 Fall Screening Board Meeting, State Aid presented several options, including waiving the adjustment for 2020, and/or revising the Resolution by raising the balance floor from $1,500,000 to $2,625,000 (which would correspond to an estimated increase in the MnDOT CCI since 2010).
The Municipal Screening Board eventually waived this resolution for the 2021 apportionment, then sent this item to the UCFS and requested the committee make recommendations for changes.
Current Resolution:
“State Aid Payment Requests received before December 1st by the District State Aid Engineer for payment will be considered as being encumbered and the construction balances will be so adjusted.
The December 31 construction fund balance will be compared to the annual construction allotment from January of the same year. If the December 31 construction fund balance exceeds 3 times the January construction allotment, and the construction fund balance is over $1,500,000, then the negative adjustment to the Needs will be 1 times the December 31 construction fund balance. In each consecutive year the December 31 construction fund balance exceeds 3 times the January construction allotment (and the balance is over $1,500,000), the negative adjustment to the Needs will be increased to 2, 3, 4, etc. times the December 31 construction fund balance until such time the Construction Needs are adjusted to zero. If the December 31 construction fund balance drops below 3 times the January construction allotment and subsequently increases to over 3 times, the multipliers will start over with one.”
14

Other than some minor wordsmithing for clarity, this resolution has not changed since October 2009, when the MSB last upped the excess balance floor from $1,000,000 to $1,500,000.
When the MSB first implemented this resolution in 2002, the balance floor of $1,000,000 was set to reflect an estimated cost of a typical one mile of roadway.
The UCFS reviewed several other concerns with this resolution.
‐ The adjustment tends to affect smaller cities, making it difficult for them to build a balance to do big projects. Additionally, some cities may be spending their balance down on a lower priorities to simply not get the negative adjustment.
‐ There is concern with the overall construction fund balance getting too high again, which can lead to scrutiny. The resolution was first put in place years ago to get balances down, but this may not be the issue it once was.
‐ There is no type of appeal process for a city to build up their balance when they have an improvement plan.
The committee agreed that the current floor of 1.5 million is too low for today’s costs. The amount of 2.6 million (presented by State Aid) may work, but costs vary statewide. Additionally, the committee felt that using a set dollar amount again means the resolution would need to be reviewed frequently. Perhaps an inflation factor, or some other wording that reflects overall funds available for the given year would be better.
The UCFS requested to see each city’s Construction Allotment from January 2021 apportionment report and conducted the following analysis:
‐ Total allotments for all cities: $146,115,972
‐ Total allotments for all cities (excluding 1st‐class cities): $116,158,142 (1st cc make up 20%)
‐ Average for all cities: $987,270 (x 3 = $2,961,810)
‐ Average for all cities (excluding first‐class cities): $806,654 (x 3 = $2,419,961)
‐ Median for all cities: $632,394 (x 3 = $1,897,181)
The UCFS preferred an option using real dollars from the State Aid Construction Account over an inflation factor from a Construction Cost Index. This option would be simple / straightforward to administer and would also keep the resolution fluid as allocations change.
The UCFS agreed that the 3‐times average, excluding the larger first‐class cities, produced the best balance floor ($2,419,961). The committee is recommending that 3‐times the “adjusted average construction allotment” shall be the basis of the annual excess balance dollar figure. The committee also agreed that this threshold should not decrease if the construction allotment decreased the following year.
RECOMMENDATION #2: The UCFS is recommending the following proposed new language for this resolution:
The December 31 construction fund balance will be compared to the annual construction allotment from January of the same year. If the December 31 construction fund balance exceeds 3 times the January construction allotment, and the construction fund balance is over 3 times the average construction allotment for all cities excluding cities of the first class (hereinafter referred to as the adjusted average construction allotment), then the negative adjustment to the Needs will be 1 times the December 31 construction fund balance. In each consecutive year the December 31 construction
15

fund balance exceeds 3 times the January construction allotment (and the balance is over 3 times the adjusted average construction allotment) the negative adjustment to the Needs will be increased to 2, 3, 4, etc. times the December 31 construction fund balance until such time the Construction Needs are adjusted to zero. If the December 31 construction fund balance drops below 3 times the January construction allotment and subsequently increases to over 3 times, the multipliers will start over with one. The adjusted average construction allotment used for this purpose shall not decrease in value from one year to the next. (For example, if in year xxxx, 3 times the adjusted average construction allotment is calculated as $3 million but in the following year it is calculated at $2.9 million, the value from year xxxx will continue to be used as the current adjusted average construction allotment.) A City may request an exemption from said construction fund balance in excess of said limits by submitting a City Resolution requesting an exemption based on a programmed or planned improvement. The request and resolution must be provided to and approved by the State Aid Office by December 15. Therefore, for the 2022 distribution, the excess balance penalty shall be applied to any city ending the year with a construction fund balance that exceeds 3 times their January construction allotment and that balance is over $2,419,961. Motion carried unanimously. Respectfully Submitted, Justin Femrite / UCFS Secretary
16
N:\MSAS\Books\2021 October book\Pop notes 2021.docx
NOTES ON POPULATION DATA
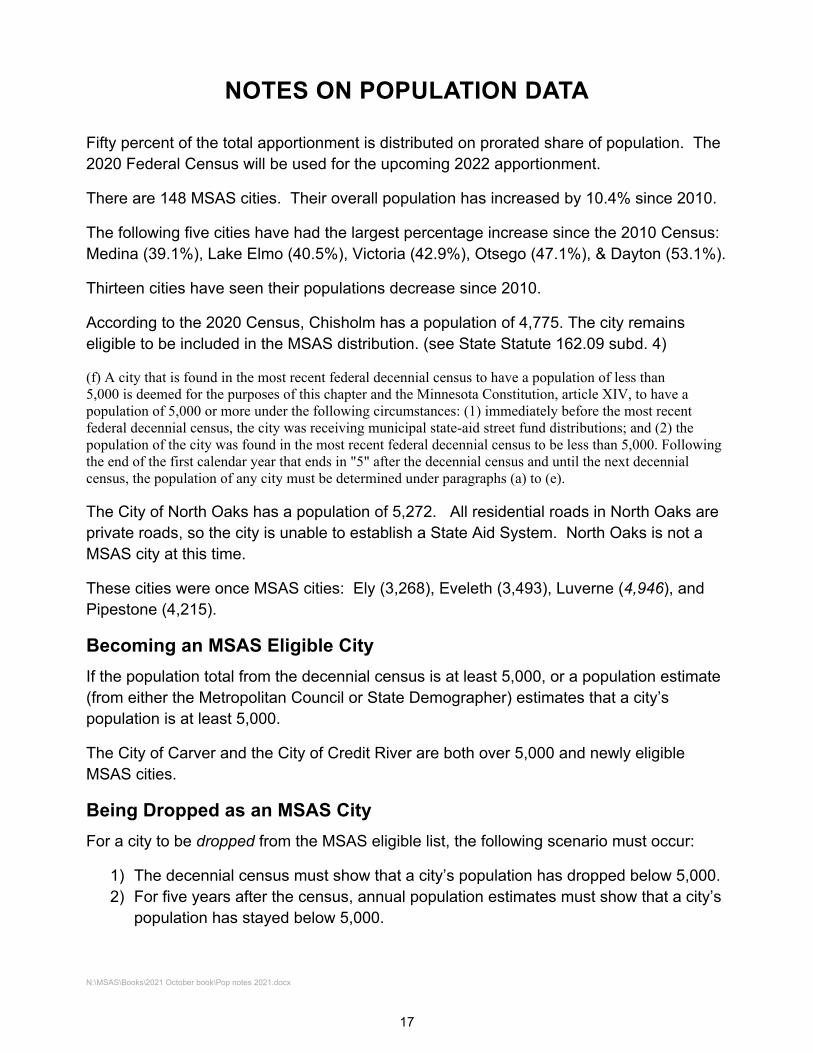
Fifty percent of the total apportionment is distributed on prorated share of population. The 2020 Federal Census will be used for the upcoming 2022 apportionment.
There are 148 MSAS cities. Their overall population has increased by 10.4% since 2010.
The following five cities have had the largest percentage increase since the 2010 Census: Medina (39.1%), Lake Elmo (40.5%), Victoria (42.9%), Otsego (47.1%), & Dayton (53.1%).
Thirteen cities have seen their populations decrease since 2010.
According to the 2020 Census, Chisholm has a population of 4,775. The city remains eligible to be included in the MSAS distribution. (see State Statute 162.09 subd. 4)
(f) A city that is found in the most recent federal decennial census to have a population of less than5,000 is deemed for the purposes of this chapter and the Minnesota Constitution, article XIV, to have apopulation of 5,000 or more under the following circumstances: (1) immediately before the most recentfederal decennial census, the city was receiving municipal state-aid street fund distributions; and (2) thepopulation of the city was found in the most recent federal decennial census to be less than 5,000. Followingthe end of the first calendar year that ends in "5" after the decennial census and until the next decennialcensus, the population of any city must be determined under paragraphs (a) to (e).
The City of North Oaks has a population of 5,272. All residential roads in North Oaks are private roads, so the city is unable to establish a State Aid System. North Oaks is not a MSAS city at this time.
These cities were once MSAS cities: Ely (3,268), Eveleth (3,493), Luverne (4,946), and Pipestone (4,215).
Becoming an MSAS Eligible City
If the population total from the decennial census is at least 5,000, or a population estimate (from either the Metropolitan Council or State Demographer) estimates that a city’s population is at least 5,000.
The City of Carver and the City of Credit River are both over 5,000 and newly eligible MSAS cities.
Being Dropped as an MSAS City
For a city to be dropped from the MSAS eligible list, the following scenario must occur:
1) The decennial census must show that a city’s population has dropped below 5,000.2) For five years after the census, annual population estimates must show that a city’s
population has stayed below 5,000.
17

% Change % Changein Population in Population
2010 2020 from fromMunicipality Census Census 2019 to 2020 2010 to 2020Albert Lea 18,016 18,492 18,132 2.0% 2.6%Albertville 7,044 7,896 7,519 5.0% 12.1%Alexandria 11,074 14,335 14,156 1.3% 29.4%Andover 30,598 32,601 32,882 -0.9% 6.5%Anoka 17,142 17,921 18,728 -4.3% 4.5%Apple Valley 49,084 56,374 54,400 3.6% 14.9%Arden Hills 9,552 9,939 10,008 -0.7% 4.1%Austin 24,721 26,174 25,679 1.9% 5.9%Baxter 7,610 8,612 8,555 0.7% 13.2%Belle Plaine 6,661 7,395 7,250 2.0% 11.0%Bemidji 13,431 14,574 16,318 -10.7% 8.5%Big Lake 10,060 11,686 11,551 1.2% 16.2%Blaine 57,186 70,222 67,939 3.4% 22.8%Bloomington 82,893 89,987 90,271 -0.3% 8.6%Brainerd 13,590 14,395 13,755 4.7% 5.9%Brooklyn Center 30,104 33,782 32,722 3.2% 12.2%Brooklyn Park 75,781 86,478 82,444 4.9% 14.1%Buffalo 15,453 16,168 16,558 -2.4% 4.6%Burnsville 60,306 64,317 62,785 2.4% 6.7%Byron 4,952 6,312 5,945 6.2% 27.5%Cambridge 8,111 9,611 9,249 3.9% 18.5%Champlin 23,089 23,919 24,231 -1.3% 3.6%Chanhassen 22,952 25,947 26,278 -1.3% 13.0%Chaska 23,770 27,810 27,692 0.4% 17.0%Chisago City 4,967 5,558 5,501 1.0% 11.9%Chisholm ** 4,976 4,775 4,925 -3.0% -4.0%Circle Pines 4,922 5,025 5,061 -0.7% 2.1%Cloquet 12,124 12,568 12,374 1.6% 3.7%Columbia Heights 19,496 21,973 21,124 4.0% 12.7%Coon Rapids 61,476 63,599 63,968 -0.6% 3.5%Corcoran 5,379 6,185 5,986 3.3% 15.0%Cottage Grove 34,589 38,839 37,795 2.8% 12.3%Crookston 7,891 7,482 8,019 -6.7% -5.2%Crystal 22,151 23,330 23,262 0.3% 5.3%Dayton 4,743 7,262 6,320 14.9% 53.1%Delano 5,464 6,484 6,282 3.2% 18.7%Detroit Lakes 8,571 9,869 9,744 1.3% 15.1%Duluth 86,265 86,697 87,306 -0.7% 0.5%Eagan 64,206 68,855 69,231 -0.5% 7.2%East Bethel 11,626 11,786 12,184 -3.3% 1.4%
2019 Population Estimates
2021 POPULATION SUMMARYThe populations used for 2022 Allocations are to be based on the 2020 Federal Census
or the most recent State Demographer / Met Council estimates, whichever are greater
N:\MSAS\Books\2021 October Book\Population Spreadsheets for 2022.xlsx 18

% Change % Changein Population in Population
2010 2020 from fromMunicipality Census Census 2019 to 2020 2010 to 2020
2019 Population Estimates
East Grand Forks 8,601 9,176 8,893 3.2% 6.7%Eden Prairie 60,797 64,198 64,567 -0.6% 5.6%Edina 47,941 53,494 53,268 0.4% 11.6%Elk River 22,974 25,835 25,243 2.3% 12.5%Fairmont * 10,666 10,487 10,299 1.8% -1.7%Falcon Heights 5,321 5,369 5,446 -1.4% 0.9%Faribault 23,352 24,453 23,912 2.3% 4.7%Farmington 21,086 23,632 23,123 2.2% 12.1%Fergus Falls 13,140 14,119 13,766 2.6% 7.5%Forest Lake 18,375 20,611 20,798 -0.9% 12.2%Fridley 27,208 29,590 29,374 0.7% 8.8%Glencoe * 5,631 5,744 5,607 2.4% 2.0%Golden Valley 20,371 22,552 22,715 -0.7% 10.7%Grand Rapids 10,869 11,126 11,390 -2.3% 2.4%Ham Lake 15,296 16,464 16,706 -1.4% 7.6%Hastings 22,172 22,154 22,965 -3.5% -0.1%Hermantown 9,414 10,221 9,603 6.4% 8.6%Hibbing * 16,361 16,214 16,310 -0.6% -0.9%Hopkins 17,591 19,079 19,555 -2.4% 8.5%Hugo 13,332 15,766 15,388 2.5% 18.3%Hutchinson 14,180 14,599 14,282 2.2% 3.0%International Falls * 6,424 5,802 6,047 -4.1% -9.7%Inver Grove Heights 33,880 35,801 35,321 1.4% 5.7%Isanti 5,251 6,804 6,233 9.2% 29.6%Jordan 5,470 6,656 6,497 2.4% 21.7%Kasson 5,931 6,851 6,549 4.6% 15.5%LaCrescent 4,883 5,276 5,182 1.8% 8.0%Lake City 5,063 5,252 5,177 1.4% 3.7%Lake Elmo 8,069 11,335 11,105 2.1% 40.5%Lakeville 55,954 69,490 65,831 5.6% 24.2%Lino Lakes 20,216 21,399 21,995 -2.7% 5.9%Litchfield 6,726 6,624 6,786 -2.4% -1.5%Little Canada 9,773 10,819 10,580 2.3% 10.7%Little Falls 8,347 9,140 8,929 2.4% 9.5%Mahtomedi 7,676 8,138 8,021 1.5% 6.0%Mankato 39,313 44,488 44,389 0.2% 13.2%Maple Grove 61,567 70,253 68,101 3.2% 14.1%Maplewood 38,018 42,088 41,738 0.8% 10.7%Marshall 13,680 13,628 13,835 -1.5% -0.4%Medina 4,916 6,837 6,788 0.7% 39.1%Mendota Heights 11,071 11,744 11,747 0.0% 6.1%Minneapolis 382,578 429,954 435,885 -1.4% 12.4%Minnetonka 49,734 53,781 54,141 -0.7% 8.1%Minnetrista 6,384 8,262 8,108 1.9% 29.4%Montevideo * 5,383 5,398 5,246 2.9% 0.3%
N:\MSAS\Books\2021 October Book\Population Spreadsheets for 2022.xlsx 19

% Change % Changein Population in Population
2010 2020 from fromMunicipality Census Census 2019 to 2020 2010 to 2020
2019 Population Estimates
Monticello 12,759 14,455 13,897 4.0% 13.3%Moorhead 38,065 44,505 44,167 0.8% 16.9%Morris 5,286 5,105 5,498 -7.1% -3.4%Mound 9,052 9,398 9,447 -0.5% 3.8%Mounds View 12,155 13,249 13,513 -2.0% 9.0%New Brighton 21,456 23,454 23,427 0.1% 9.3%New Hope 20,339 21,986 22,376 -1.7% 8.1%New Prague 7,321 8,162 8,248 -1.0% 11.5%New Ulm 13,522 14,120 13,562 4.1% 4.4%North Branch 10,125 10,787 10,918 -1.2% 6.5%North Mankato 13,394 14,275 14,114 1.1% 6.6%North St. Paul 11,460 12,364 12,161 1.7% 7.9%Northfield 20,007 20,790 20,494 1.4% 3.9%Oak Grove 8,031 8,929 8,868 0.7% 11.2%Oakdale 27,378 28,303 27,930 1.3% 3.4%Orono 7,437 8,315 8,284 0.4% 11.8%Otsego 13,571 19,966 18,130 10.1% 47.1%Owatonna 25,599 26,420 26,314 0.4% 3.2%Plymouth 70,576 81,026 79,475 2.0% 14.8%Prior Lake 22,796 27,617 27,005 2.3% 21.1%Ramsey 23,668 27,646 27,263 1.4% 16.8%Red Wing * 16,459 16,547 16,443 0.6% 0.5%Redwood Falls * 5,256 5,102 5,236 -2.6% -2.9%Richfield 35,228 36,994 36,993 0.0% 5.0%Robbinsdale 13,953 14,646 14,741 -0.6% 5.0%Rochester 106,750 121,395 119,969 1.2% 13.7%Rogers 11,197 13,295 13,232 0.5% 18.7%Rosemount 21,874 25,650 25,202 1.8% 17.3%Roseville 33,660 36,254 36,644 -1.1% 7.7%Sartell 15,887 19,351 19,107 1.3% 21.8%Sauk Rapids 12,773 13,862 14,244 -2.7% 8.5%Savage 26,911 32,465 32,245 0.7% 20.6%Shakopee 37,076 43,698 41,528 5.2% 17.9%Shoreview 25,043 26,921 26,695 0.8% 7.5%Shorewood 7,307 7,783 7,934 -1.9% 6.5%South St. Paul 20,160 20,759 20,774 -0.1% 3.0%Spring Lake Park 6,412 7,188 6,699 7.3% 12.1%St. Anthony 8,226 9,257 9,020 2.6% 12.5%St. Cloud 65,842 68,881 68,524 0.5% 4.6%St. Francis 7,218 8,142 8,049 1.2% 12.8%St. Joseph 6,534 7,029 7,342 -4.3% 7.6%St. Louis Park 45,250 50,010 49,834 0.4% 10.5%St. Michael 16,399 18,235 18,157 0.4% 11.2%St. Paul 285,068 311,527 315,925 -1.4% 9.3%St. Paul Park 5,279 5,544 5,611 -1.2% 5.0%
N:\MSAS\Books\2021 October Book\Population Spreadsheets for 2022.xlsx 20

% Change % Changein Population in Population
2010 2020 from fromMunicipality Census Census 2019 to 2020 2010 to 2020
2019 Population Estimates
St. Peter 11,196 12,066 12,033 0.3% 7.8%Stewartville 5,916 6,687 6,284 6.4% 13.0%Stillwater 18,225 19,394 19,774 -1.9% 6.4%Thief River Falls 8,573 8,749 9,071 -3.6% 2.1%Vadnais Heights 12,302 12,912 13,338 -3.2% 5.0%Victoria 7,379 10,546 10,585 -0.4% 42.9%Virginia * 8,712 8,421 8,374 0.6% -3.3%Waconia 10,697 13,033 13,277 -1.8% 21.8%Waite Park 6,715 8,341 7,801 6.9% 24.2%Waseca * 9,412 9,229 8,996 2.6% -1.9%West St. Paul 19,540 20,615 21,205 -2.8% 5.5%White Bear Lake 23,797 24,883 25,752 -3.4% 4.6%Willmar 19,610 21,015 20,226 3.9% 7.2%Winona * 27,614 25,948 27,252 -4.8% -6.0%Woodbury 61,961 75,102 71,616 4.9% 21.2%Worthington 12,764 13,947 13,522 3.1% 9.3%Wyoming 7,791 8,032 8,123 -1.1% 3.1%Zimmerman 5,228 6,189 5,876 5.3% 18.4%
Total 3,690,202 4,072,453 4,049,914 0.6% 10.4%* used 2010 census figure for last allocation
** use population of 5,000, which makes adjusted 2020 census total 4,072,678
N:\MSAS\Books\2021 October Book\Population Spreadsheets for 2022.xlsx 21

City Pop 2010 Pop 2020 % Change City Pop 2010 Pop 2020 % Change City Pop 2010 Pop 2020 % Change
ALBERT LEA 18,016 18,492 2.6 FRIDLEY 27,208 29,590 8.8 ORONO 7,437 8,315 11.8ALBERTVILLE 7,044 7,896 12.1 GLENCOE 5,631 5,744 2.0 OTSEGO 13,571 19,966 47.1ALEXANDRIA 11,074 14,335 29.4 GOLDEN VALLEY 20,371 22,552 10.7 OWATONNA 25,599 26,420 3.2ANDOVER 30,598 32,601 6.5 GRAND RAPIDS 10,869 11,126 2.4 PLYMOUTH 70,576 81,026 14.8ANOKA 17,142 17,921 4.5 HAM LAKE 15,296 16,464 7.6 PRIOR LAKE 22,796 27,617 21.1APPLE VALLEY 49,084 56,374 14.9 HASTINGS 22,172 22,154 (0.1) RAMSEY 23,668 27,646 16.8ARDEN HILLS 9,552 9,939 4.1 HERMANTOWN 9,414 10,221 8.6 RED WING 16,459 16,547 0.5AUSTIN 24,721 26,174 5.9 HIBBING 16,361 16,214 (0.9) REDWOOD FALLS 5,256 5,102 (2.9)BAXTER 7,610 8,612 13.2 HOPKINS 17,591 19,079 8.5 RICHFIELD 35,228 36,994 5.0BELLE PLAINE 6,661 7,395 11.0 HUGO 13,332 15,766 18.3 ROBBINSDALE 13,953 14,646 5.0BEMIDJI 13,431 14,574 8.5 HUTCHINSON 14,180 14,599 3.0 ROCHESTER 106,750 121,395 13.7BIG LAKE 10,060 11,686 16.2 INTERNATIONAL FALLS 6,424 5,802 (9.7) ROGERS 11,197 13,295 18.7BLAINE 57,186 70,222 22.8 INVER GROVE HEIGHTS 33,880 35,801 5.7 ROSEMOUNT 21,874 25,650 17.3BLOOMINGTON 82,893 89,987 8.6 ISANTI 5,251 6,804 29.6 ROSEVILLE 33,660 36,254 7.7BRAINERD 13,590 14,395 5.9 JORDAN 5,470 6,656 21.7 SARTELL 15,887 19,351 21.8BROOKLYN CENTER 30,104 33,782 12.2 KASSON 5,931 6,851 15.5 SAUK RAPIDS 12,773 13,862 8.5BROOKLYN PARK 75,781 86,478 14.1 LA CRESCENT 4,883 5,276 8.0 SAVAGE 26,911 32,465 20.6BUFFALO 15,453 16,168 4.6 LAKE CITY 5,063 5,252 3.7 SHAKOPEE 37,076 43,698 17.9BURNSVILLE 60,306 64,317 6.7 LAKE ELMO 8,069 11,335 40.5 SHOREVIEW 25,043 26,921 7.5BYRON 4,952 6,312 27.5 LAKEVILLE 55,954 69,490 24.2 SHOREWOOD 7,307 7,783 6.5CAMBRIDGE 8,111 9,611 18.5 LINO LAKES 20,216 21,399 5.9 SOUTH ST PAUL 20,160 20,759 3.0CHAMPLIN 23,089 23,919 3.6 LITCHFIELD 6,726 6,624 (1.5) SPRING LAKE PARK 6,412 7,188 12.1CHANHASSEN 22,952 25,947 13.0 LITTLE CANADA 9,773 10,819 10.7 ST ANTHONY 8,226 9,257 12.5CHASKA 23,770 27,810 17.0 LITTLE FALLS 8,347 9,140 9.5 ST CLOUD 65,842 68,881 4.6CHISAGO CITY 4,967 5,558 11.9 MAHTOMEDI 7,676 8,138 6.0 ST FRANCIS 7,218 8,142 12.8CHISHOLM 4,976 4,775 (4.0) MANKATO 39,313 44,488 13.2 ST JOSEPH 6,534 7,029 7.6CIRCLE PINES 4,922 5,025 2.1 MAPLE GROVE 61,567 70,253 14.1 ST LOUIS PARK 45,250 50,010 10.5CLOQUET 12,124 12,568 3.7 MAPLEWOOD 38,018 42,088 10.7 ST MICHAEL 16,399 18,235 11.2COLUMBIA HEIGHTS 19,496 21,973 12.7 MARSHALL 13,680 13,628 (0.4) ST PAUL 285,068 311,527 9.3COON RAPIDS 61,476 63,599 3.5 MEDINA 4,916 6,837 39.1 ST PAUL PARK 5,279 5,544 5.0CORCORAN 5,379 6,185 15.0 MENDOTA HEIGHTS 11,071 11,744 6.1 ST PETER 11,196 12,066 7.8COTTAGE GROVE 34,589 38,839 12.3 MINNEAPOLIS 382,578 429,954 12.4 STEWARTVILLE 5,916 6,687 13.0CROOKSTON 7,891 7,482 (5.2) MINNETONKA 49,734 53,781 8.1 STILLWATER 18,225 19,394 6.4CRYSTAL 22,151 23,330 5.3 MINNETRISTA 6,384 8,262 29.4 THIEF RIVER FALLS 8,573 8,749 2.1DAYTON 4,743 7,262 53.1 MONTEVIDEO 5,383 5,398 0.3 VADNAIS HEIGHTS 12,302 12,912 5.0DELANO 5,464 6,484 18.7 MONTICELLO 12,759 14,455 13.3 VICTORIA 7,379 10,546 42.9DETROIT LAKES 8,571 9,869 15.1 MOORHEAD 38,065 44,505 16.9 VIRGINIA 8,712 8,421 (3.3)DULUTH 86,265 86,697 0.5 MORRIS 5,286 5,105 (3.4) WACONIA 10,697 13,033 21.8EAGAN 64,206 68,855 7.2 MOUND 9,052 9,398 3.8 WAITE PARK 6,715 8,341 24.2EAST BETHEL 11,626 11,786 1.4 MOUNDS VIEW 12,155 13,249 9.0 WASECA 9,412 9,229 (1.9)EAST GRAND FORKS 8,601 9,176 6.7 NEW BRIGHTON 21,456 23,454 9.3 WEST ST PAUL 19,540 20,615 5.5EDEN PRAIRIE 60,797 64,198 5.6 NEW HOPE 20,339 21,986 8.1 WHITE BEAR LAKE 23,797 24,883 4.6EDINA 47,941 53,494 11.6 NEW PRAGUE 7,321 8,162 11.5 WILLMAR 19,610 21,015 7.2ELK RIVER 22,974 25,835 12.5 NEW ULM 13,522 14,120 4.4 WINONA 27,614 25,948 (6.0)FAIRMONT 10,666 10,487 (1.7) NORTH BRANCH 10,125 10,787 6.5 WOODBURY 61,961 75,102 21.2FALCON HEIGHTS 5,321 5,369 0.9 NORTH MANKATO 13,394 14,275 6.6 WORTHINGTON 12,764 13,947 9.3FARIBAULT 23,352 24,453 4.7 NORTH ST PAUL 11,460 12,364 7.9 WYOMING 7,791 8,032 3.1FARMINGTON 21,086 23,632 12.1 NORTHFIELD 20,007 20,790 3.9 ZIMMERMAN 5,228 6,189 18.4FERGUS FALLS 13,140 14,119 7.5 OAK GROVE 8,031 8,929 11.2
FOREST LAKE 18,375 20,611 12.2 OAKDALE 27,378 28,303 3.4 Total 3,690,202 4,072,453 10.4
N:\MSAS\BOOKS\2021 OCTOBER BOOK\POP COMPARISON.XLS
POPULATION CHANGEfrom 2010 US Census to 2020 US Census
22

KOOCHICHING
MARSHALL
Stewartville
SAINT LOUIS
LAKE
CASS
ITASCA
POLK
BELTRAMI
PINE
AITKIN
COOK
CLAY
ROSEAU
OTTER TAIL
BECKER
TODD
STEARNS
LYON
POPE
KITTSON
SWIFT
RICE
MORRISON
RENVILLE
HUBBARD
WILKIN
NORMAN
CARLTON
MARTINMOWER
CROW WING
NOBLES
MURRAY
FILLMORE
ROCK
WRIGHT
SIBLEY
GRANT
REDWOOD
LAKE OF THE WOODS
BROWN
MEEKER
JACKSON
CLEARWATER
GOODHUE
KANDIYOHI
WINONA
DOUGLAS
DAKOTA
OLMSTED
FREEBORN
FARIBAULT
ISANTI
STEVENS
LINCOLN
BLUE EARTH
WADENA
MCLEOD
DODGESTEELE
MILLE LACS
HOUSTON
TRAVERSE
KANABEC
SCOTT
CHIPPEWA
WABASHA
LAC QUI PARLE
WASECA
BENTON
MAHNOMEN
LE SUEUR
BIG STONE
NICOLLET
CHISAGO
CARVER
PENNINGTON
COTTONWOOD
RED LAKE
PIPESTONE
YELLOWMEDICINE
SHERBURNE
WATONWAN
Hibbing
Duluth
Rochester
Cloquet
Red Wing
St. Cloud
Winona
Baxter
Hermantown
Virginia
NorthBranch
Moorhead
Mankato
Fairmont Austin
Willmar
GrandRapids
Bemidji
Faribault
Alexandria
AlbertLea
Owatonna
Brainerd
Buffalo
Fergus Falls
Sartell
Marshall
DetroitLakes
NewUlm
BigLake
Monticello
Isanti
Morris
Little Falls
Waite Park
Northfield
Worthington
Waseca
St. Peter
Cambridge
Delano
Litchfield
BellePlaine
Chisholm
SaukRapids
Crookston
Byron
Jordan
Montevideo
Kasson
NorthMankato
St. Joseph
RedwoodFalls
InternationalFalls
East Grand Forks
ThiefRiverFalls
Zimmerman
La Crescent
Waconia
New Prague
Hutchinson
Lake City
Glencoe
Lino Lakes
Mahtomedi
St. Paul
HugoBlaine
Eagan
Elk River
MplsOrono
Otsego
Lakeville
East Bethel
Andover
Corcoran
Medina
Ramsey
Plymouth
Ham Lake
Dayton
Woodbury
Oak Grove
St. Michael
Rosemount
Forest Lake
Bloomington
Shakopee
Eden Prairie
Edina
MapleGrove
Minnetrista
Burnsville
CottageGroveChaska
Minnetonka
Lake Elmo
Savage
St. Francis
Wyoming
Chanhassen
CoonRapids
BrooklynPark
PriorLake
Becker
Frid.
MaplewoodRoseville
Buffalo
AppleValley
Oakdale
FarmingtonHastings
Victoria
Shoreview
RogersAnoka
Champlin
Stillwater
Richfield
St. LouisPark
GV
NorthOaks
Mound
MendotaHgts
Hopkins
IGH
ChisagoCity
AHCrystal
Delano
Waconia
WBLBC NB
VHNewHope
Jordan
Albertville
SSPWSP
LC
MV
St. Paul Park
Robbins-dale NSP
CHSt.
Anthony
CirclePines
FalconHgts
SLP
Norwood Young America
METRO INSET
Legend
less than 10.4%
Data Sources: Met Council / MN State Demographer's OfficeUS Census Bureauhttp://www.dot.state.mn.us/information/disclaimer.htmlMnDOT's Disclaimer on Maps and Related Data can be found @
Percentage Change in Populationfor State Aid Cities, 2010 - 2020 - State Growth: 7.6%
- State Aid Cities only: 10.4%
20.0% or more
(84)(28)10.4 to 13.9%
14.0 to 18.7%(18)(19)
23

N:\MSAS\Books\2021 October Book\Tentative 2022 MSAS Population Allocations.docx
MSAS POPULATION & ALLOCATIONS
Fifty percent of the total apportionment sum is distributed on a prorated share of each city’s population. The U.S. Census Bureau released their decennial population data in August 2021. These figures will be used in determining each city’s share of the 2022 population apportionment.
Any adjustments made to the population figures in this report would be released in December 2021. Those changes would be minor and will be presented in the January 2022 report. These changes could include population adjustments due to annexations, detachments, or any other minor revisions made by the State Demographer.
The distribution amount for the 2021 population apportionment was $96,505,795. Using this same amount for 2022, each city will earn approximately $23.70 per capita. (a 12 cent drop from 2021). This projection will be revised when the actual revenue for the 2022 apportionment becomes available in January.
18-Aug- 21
2020 census
MunicipalityAlbert Lea 18,132 18,492 $431,836 $438,185 $6,349 1.5Albertville 7,519 7,896 179,074 187,103 8,029 4.5Alexandria 14,156 14,335 337,143 339,681 2,538 0.8Andover 32,882 32,601 783,126 772,510 (10,616) (1.4)Anoka 18,728 17,921 446,031 424,654 (21,377) (4.8)Apple Valley 54,400 56,374 1,295,605 1,335,833 40,228 3.1Arden Hills 10,008 9,939 238,353 235,514 (2,839) (1.2)Austin 25,679 26,174 611,578 620,217 8,639 1.4Baxter 8,555 8,612 203,748 204,069 321 0.2Belle Plaine 7,250 7,395 172,668 175,231 2,563 1.5Bemidji 16,318 14,574 388,634 345,344 (43,290) (11.1)Big Lake 11,551 11,686 275,102 276,910 1,808 0.7Blaine 67,939 70,222 1,618,053 1,663,974 45,921 2.8Bloomington 90,271 89,987 2,149,918 2,132,323 (17,595) (0.8)Brainerd 13,755 14,395 327,593 341,103 13,510 4.1Brooklyn Center 32,722 33,782 779,316 800,495 21,179 2.7Brooklyn Park 82,444 86,478 1,963,508 2,049,175 85,667 4.4Buffalo 16,558 16,168 394,350 383,115 (11,235) (2.8)Burnsville 62,785 64,317 1,495,304 1,524,050 28,746 1.9Byron 5,945 6,312 141,588 149,569 7,981 5.6Cambridge 9,249 9,611 220,277 227,741 7,464 3.4Champlin 24,231 23,919 577,092 566,782 (10,310) (1.8)Chanhassen 26,278 25,947 625,844 614,838 (11,006) (1.8)
Allocation % Change
TENTATIVE 2022 POPULATION ALLOCATIONS
Population used for
2021
Population used for
2022
2021 Population Allocations (last year)
2022 Population Allocations (this year)
Difference Between last
two Allocations
24

N:\MSAS\Books\2021 October Book\Tentative 2022 MSAS Population Allocations.docx
MunicipalityChaska 27,692 27,810 $659,520 $658,983 (537) (0.1)Chisago City 5,501 5,558 131,013 131,702 689 0.5Chisholm 5,000 5,000 119,081 118,479 (602) (0.5)Circle Pines 5,061 5,025 120,534 119,072 (1,462) (1.2)Cloquet 12,374 12,568 294,702 297,810 3,108 1.1Columbia Heights 21,124 21,973 503,095 520,670 17,575 3.5Coon Rapids 63,968 63,599 1,523,479 1,507,036 (16,443) (1.1)Corcoran 5,986 6,185 142,564 146,559 3,995 2.8Cottage Grove 37,795 38,839 900,136 920,325 20,189 2.2Crookston 8,019 7,482 190,983 177,293 (13,690) (7.2)Crystal 23,262 23,330 554,014 552,825 (1,189) (0.2)Dayton 6,320 7,262 150,519 172,080 21,561 14.3Delano 6,282 6,484 149,614 153,644 4,030 2.7Detroit Lakes 9,744 9,869 232,066 233,855 1,789 0.8Duluth 87,306 86,697 2,079,302 2,054,364 (24,938) (1.2)Eagan 69,231 68,855 1,648,823 1,631,582 (17,241) (1.0)East Bethel 12,184 11,786 290,177 279,280 (10,897) (3.8)East Grand Forks 8,893 9,176 211,798 217,434 5,636 2.7Eden Prairie 64,567 64,198 1,537,744 1,521,230 (16,514) (1.1)Edina 53,268 53,494 1,268,645 1,267,589 (1,056) (0.1)Elk River 25,243 25,835 601,194 612,184 10,990 1.8Fairmont 10,666 10,487 254,024 248,499 (5,525) (2.2)Falcon Heights 5,446 5,369 129,703 127,223 (2,480) (1.9)Faribault 23,912 24,453 569,494 579,436 9,942 1.7Farmington 23,123 23,632 550,703 559,982 9,279 1.7Fergus Falls 13,766 14,119 327,855 334,562 6,707 2.0Forest Lake 20,798 20,611 495,331 488,396 (6,935) (1.4)Fridley 29,374 29,590 699,579 701,162 1,583 0.2Glencoe 5,631 5,744 134,109 136,109 2,000 1.5Golden Valley 22,715 22,552 540,986 534,390 (6,596) (1.2)Grand Rapids 11,390 11,126 271,267 263,641 (7,626) (2.8)Ham Lake 16,706 16,464 397,874 390,129 (7,745) (1.9)Hastings 22,965 22,154 546,940 524,959 (21,981) (4.0)Hermantown 9,603 10,221 228,708 242,196 13,488 5.9Hibbing 16,361 16,214 389,658 384,205 (5,453) (1.4)Hopkins 19,555 19,079 465,727 452,094 (13,633) (2.9)Hugo 15,388 15,766 366,485 373,590 7,105 1.9Hutchinson 14,282 14,599 340,144 345,937 5,793 1.7International Falls 6,424 5,802 152,996 137,484 (15,512) (10.1)Inver Grove Heights 35,321 35,801 841,214 848,337 7,123 0.8Isanti 6,233 6,804 148,447 161,227 12,780 8.6Jordan 6,497 6,656 154,734 157,720 2,986 1.9Kasson 6,549 6,851 155,973 162,341 6,368 4.1LaCrescent 5,182 5,276 123,416 125,020 1,604 1.3Lake City 5,177 5,252 123,297 124,451 1,154 0.9Lake Elmo 11,105 11,335 264,480 268,593 4,113 1.6
Allocation % Change
Population used for
2021
Population used for
2022
2021 Population Allocations (last year)
2022 Population Allocations (this year)
Difference Between last
two Allocations
25

N:\MSAS\Books\2021 October Book\Tentative 2022 MSAS Population Allocations.docx
MunicipalityLakeville 65,831 69,490 $1,567,848 $1,646,629 78,781 5.0Lino Lakes 21,995 21,399 523,839 507,069 (16,770) (3.2)Litchfield 6,786 6,624 161,617 156,962 (4,655) (2.9)Little Canada 10,580 10,819 251,976 256,366 4,390 1.7Little Falls 8,929 9,140 212,655 216,581 3,926 1.8Mahtomedi 8,021 8,138 191,030 192,837 1,807 0.9Mankato 44,389 44,488 1,057,180 1,054,183 (2,997) (0.3)Maple Grove 68,101 70,253 1,621,911 1,664,708 42,797 2.6Maplewood 41,738 42,088 994,043 997,313 3,270 0.3Marshall 13,835 13,628 329,498 322,928 (6,570) (2.0)Medina 6,788 6,837 161,665 162,009 344 0.2Mendota Heights 11,747 11,744 279,770 278,285 (1,485) (0.5)Minneapolis 435,885 429,954 10,381,149 10,188,149 (193,000) (1.9)Minnetonka 54,141 53,781 1,289,436 1,274,390 (15,046) (1.2)Minnetrista 8,108 8,262 193,102 195,776 2,674 1.4Montevideo 5,383 5,398 128,203 127,911 (292) (0.2)Monticello 13,897 14,455 330,975 342,524 11,549 3.5Moorhead 44,167 44,505 1,051,893 1,054,586 2,693 0.3Morris 5,498 5,105 130,942 120,968 (9,974) (7.6)Mound 9,447 9,398 224,992 222,694 (2,298) (1.0)Mounds View 13,513 13,249 321,829 313,947 (7,882) (2.4)New Brighton 23,427 23,454 557,944 555,764 (2,180) (0.4)New Hope 22,376 21,986 532,913 520,978 (11,935) (2.2)New Prague 8,248 8,162 196,437 193,406 (3,031) (1.5)New Ulm 13,562 14,120 322,996 334,586 11,590 3.6North Branch 10,918 10,787 260,026 255,608 (4,418) (1.7)North Mankato 14,114 14,275 336,143 338,259 2,116 0.6North St. Paul 12,161 12,364 289,630 292,976 3,346 1.2Northfield 20,494 20,790 488,090 492,638 4,548 0.9Oak Grove 8,868 8,929 211,203 211,581 378 0.2Oakdale 27,930 28,303 665,188 670,665 5,477 0.8Orono 8,284 8,315 197,294 197,031 (263) (0.1)Otsego 18,130 19,966 431,789 473,112 41,323 9.6Owatonna 26,314 26,420 626,701 626,046 (655) (0.1)Plymouth 79,475 81,026 1,892,797 1,919,984 27,187 1.4Prior Lake 27,005 27,617 643,158 654,410 11,252 1.7Ramsey 27,263 27,646 649,303 655,097 5,794 0.9Red Wing 16,459 16,547 391,992 392,096 104 0.0Redwood Falls 5,256 5,102 125,178 120,897 (4,281) (3.4)Richfield 36,993 36,994 881,035 876,606 (4,429) (0.5)Robbinsdale 14,741 14,646 351,075 347,050 (4,025) (1.1)Rochester 119,969 121,395 2,857,213 2,876,565 19,352 0.7Rogers 13,232 13,295 315,137 315,037 (100) 0.0Rosemount 25,202 25,650 600,217 607,800 7,583 1.3Roseville 36,644 36,254 872,723 859,071 (13,652) (1.6)Sartell 19,107 19,351 455,057 458,539 3,482 0.8
Allocation % Change
Population used for
2021
Population used for
2022
2021 Population Allocations (last year)
2022 Population Allocations (this year)
Difference Between last
two Allocations
26

N:\MSAS\Books\2021 October Book\Tentative 2022 MSAS Population Allocations.docx
MunicipalitySauk Rapids 14,244 13,862 $339,239 $328,473 (10,766) (3.2)Savage 32,245 32,465 767,955 769,288 1,333 0.2Shakopee 41,528 43,698 989,042 1,035,464 46,422 4.7Shoreview 26,695 26,921 635,775 637,917 2,142 0.3Shorewood 7,934 7,783 188,958 184,425 (4,533) (2.4)South St. Paul 20,774 20,759 494,759 491,903 (2,856) (0.6)Spring Lake Park 6,699 7,188 159,545 170,326 10,781 6.8St. Anthony 9,020 9,257 214,823 219,353 4,530 2.1St. Cloud 68,524 68,881 1,631,985 1,632,198 213 0.0St. Francis 8,049 8,142 191,697 192,932 1,235 0.6St. Joseph 7,342 7,029 174,859 166,559 (8,300) (4.7)St. Louis Park 49,834 50,010 1,186,859 1,185,032 (1,827) (0.2)St. Michael 18,157 18,235 432,432 432,095 (337) (0.1)St. Paul 315,925 311,527 7,524,151 7,381,914 (142,237) (1.9)St. Paul Park 5,611 5,544 133,633 131,370 (2,263) (1.7)St. Peter 12,033 12,066 286,581 285,915 (666) (0.2)Stewartville 6,284 6,687 149,661 158,455 8,794 5.9Stillwater 19,774 19,394 470,943 459,558 (11,385) (2.4)Thief River Falls 9,071 8,749 216,037 207,315 (8,722) (4.0)Vadnais Heights 13,338 12,912 317,661 305,962 (11,699) (3.7)Victoria 10,585 10,546 252,095 249,897 (2,198) (0.9)Virginia 8,712 8,421 207,487 199,543 (7,944) (3.8)Waconia 13,277 13,033 316,208 308,829 (7,379) (2.3)Waite Park 7,801 8,341 185,791 197,648 11,857 6.4Waseca 9,412 9,229 224,159 218,690 (5,469) (2.4)West St. Paul 21,205 20,615 505,024 488,491 (16,533) (3.3)White Bear Lake 25,752 24,883 613,316 589,625 (23,691) (3.9)Willmar 20,226 21,015 481,708 497,969 16,261 3.4Winona 27,614 25,948 657,662 614,861 (42,801) (6.5)Woodbury 71,616 75,102 1,705,624 1,779,609 73,985 4.3Worthington 13,522 13,947 322,043 330,487 8,444 2.6Wyoming 8,123 8,032 193,459 190,326 (3,133) (1.6)Zimmerman 5,876 6,189 139,944 146,654 6,710 4.8Total 4,052,097 4,072,678 $96,505,795 $96,505,795 0 0.0
Allocation % Change
Population used for
2021
Population used for
2022
2021 Population Allocations (last year)
2022 Population Allocations (this year)
Difference Between last
two Allocations
A city's Population Allocation equals total population apportionment divided by the total population multiplied by the city's population used for 2022.
2021 $96,505,795 equals $23.82 per person4,052,097
2022 $96,505,795 equals $23.70 per person4,072,678 $96,505,795
The population increase from 2021 and 2022 for allocation purposes is 20,581 (0.5% increase overall)
77 Cities Increased their population allocation.71 Cities Decreased their population allocation.
27

MILEAGE, NEEDS AND APPORTIONMENT
The cities’ share of the Highway User Tax Distribution Fund will be announced in January when the Commissioner of Transportation makes a determination of the 2022 apportionment. Allocations in this report are tentative and will be based off the 2021 total apportionment amount of $193,011,589. Using last year’s makes for a conservative January forecast and allows us to better see effects of changes in Construction Needs.
System wide mileage increases annually. This is due to the increasing number of eligible cities and to overall growth in local street mileage.
Tentative Maintenance and Construction allocations are not provided in this report. Cities have the option of receiving a minimum of $1,500 per mile or a percentage up to 35% of their total allocation for Maintenance. If a city desires to receive more than the minimum maintenance, or make a change to their future maintenance request, the city should inform the Municipal State Aid Needs Unit prior to December 15th. A memo regarding Maintenance Requests will be sent to each city engineer around November 1st.
MILEAGE NEEDS AND AP P ORT 1958 TO 2016 29- S e p- 21
Total Apportion-Number of Actual Adjusted Apportion- ment Per
of Construc- Total Construc- ment $1000 ofAppt. Munici- Needs tion Apportion- tion Per Needs AdjustedYear palities Mileage Needs ment Needs Mileage Needs1958 58 920.40 $190,373,337 $7,286,074 $190,373,337 $7,916.20 $19.141959 59 938.36 195,749,800 8,108,428 195,749,800 8,641.06 20.711960 59 968.82 214,494,178 8,370,596 197,971,488 8,639.99 21.141961 77 1131.78 233,276,540 9,185,862 233,833,072 8,116.30 19.641962 77 1140.83 223,014,549 9,037,698 225,687,087 7,922.04 20.021963 77 1161.06 221,458,428 9,451,125 222,770,204 8,140.08 21.211964 77 1177.11 218,487,546 10,967,128 221,441,346 9,317.00 24.761965 77 1208.81 218,760,538 11,370,240 221,140,776 9,406.14 25.711966 80 1271.87 221,992,032 11,662,274 218,982,273 9,169.39 26.631967 80 1309.93 213,883,059 12,442,900 213,808,290 9,498.90 29.101968 84 1372.36 215,390,936 14,287,775 215,206,878 10,411.10 33.201969 86 1412.57 209,136,115 15,121,277 210,803,850 10,704.80 35.871970 86 1427.59 205,103,671 16,490,064 206,350,399 11,550.98 39.961971 90 1467.30 204,854,564 18,090,833 204,327,997 12,329.33 44.271972 92 1521.41 217,915,457 18,338,440 217,235,062 12,053.58 42.211973 94 1580.45 311,183,279 18,648,610 309,052,410 11,799.56 30.171974 95 1608.06 324,787,253 21,728,373 321,833,693 13,512.17 33.761975 99 1629.30 422,560,903 22,841,302 418,577,904 14,019.09 27.281976 101 1718.92 449,383,835 22,793,386 444,038,715 13,260.29 25.671977 101 1748.55 488,779,846 27,595,966 483,467,326 15,782.20 28.541978 104 1807.94 494,433,948 27,865,892 490,165,460 15,413.06 28.381979 106 1853.71 529,996,431 30,846,555 523,460,762 16,640.44 29.42
MSAS MILEAGE, NEEDS, AND APPORTIONMENT 1958 to 2021
28

Total Apportion-Number of Actual Adjusted Apportion- ment Per
of Construc- Total Construc- ment $1000 ofAppt. Munici- Needs tion Apportion- tion Per Needs AdjustedYear palities Mileage Needs ment Needs Mileage Needs1980 106 1889.03 $623,880,689 $34,012,618 $609,591,579 $18,005.34 $27.861981 109 1933.64 695,487,179 35,567,962 695,478,283 18,394.30 25.541982 105 1976.17 705,647,888 41,819,275 692,987,088 21,161.78 30.301983 106 2022.37 651,402,395 46,306,272 631,554,858 22,897.03 36.551984 106 2047.23 635,420,700 48,580,190 613,448,456 23,729.72 39.701985 107 2110.52 618,275,930 56,711,674 589,857,835 26,870.95 48.201986 107 2139.42 552,944,830 59,097,819 543,890,225 27,623.29 54.301987 107 2148.07 551,850,149 53,101,745 541,972,837 24,720.68 48.971988 108 2171.89 545,457,364 58,381,022 529,946,820 26,880.28 55.061989 109 2205.05 586,716,169 76,501,442 588,403,918 34,693.74 64.981990 112 2265.64 969,735,729 81,517,107 969,162,426 35,979.73 41.991991 113 2330.30 1,289,813,259 79,773,732 1,240,127,592 34,233.25 32.111992 116 2376.79 1,374,092,030 81,109,752 1,330,349,165 34,125.75 30.411993 116 2410.53 1,458,214,849 82,954,222 1,385,096,428 34,413.27 29.891994 117 2471.04 1,547,661,937 80,787,856 1,502,960,398 32,693.87 26.831995 118 2526.39 1,582,491,280 81,718,700 1,541,396,875 32,346.04 26.461996 119 2614.71 1,652,360,408 90,740,650 1,638,227,013 34,703.91 27.631997 122 2740.46 1,722,973,258 90,608,066 1,738,998,615 33,063.09 25.911998 125 2815.99 1,705,411,076 93,828,258 1,746,270,860 33,319.81 26.731999 126 2859.05 1,927,808,456 97,457,150 1,981,933,166 34,087.25 24.472000 127 2910.87 $2,042,921,321 $103,202,769 $2,084,650,298 $35,454.27 $24.642001 129 2972.16 2,212,783,436 108,558,171 2,228,893,216 36,525.01 24.262002 130 3020.39 2,432,537,238 116,434,082 2,441,083,093 38,549.35 23.772003 131 3080.67 2,677,069,498 108,992,464 2,663,903,876 35,379.47 20.392004 133 3116.44 2,823,888,537 110,890,581 2,898,358,498 35,582.45 19.082005 136 3190.82 2,986,013,788 111,823,549 3,086,369,911 35,045.40 18.072006 138 3291.64 3,272,908,979 111,487,130 3,356,466,332 33,869.78 16.572007 142 3382.28 3,663,172,809 114,419,009 3,760,234,514 33,828.96 15.192008 143 3453.10 3,896,589,388 114,398,269 4,005,371,748 33,129.15 14.292009 144 3504.00 4,277,355,517 121,761,230 4,375,100,368 34,749.21 13.912010 144 3533.22 4,650,919,417 127,315,538 4,764,771,798 36,033.86 13.362011 147 3583.87 4,964,526,370 139,081,139 5,058,978,846 38,807.53 13.752012 142 3572.73 5,175,814,620 144,682,808 5,271,923,162 40,496.43 13.722013 147 3598.04 5,476,951,484 147,468,798 5,593,122,380 40,985.87 13.182014 147 3633.04 5,476,951,484 154,615,011 5,627,313,935 42,558.03 13.742015 148 3682.39 6,244,717,460 170,700,289 *6,442,606,488 46,355.84 13.252016 148 3701.25 6,985,833,869 173,612,036 *7,146,203,608 46,906.33 12.152017 148 3729.86 7,247,080,405 173,218,364 *7,403,345,739 46,440.98 11.702018 148 3752.52 7,478,366,012 192,286,547 *7,583,820,217 51,241.98 12.682019 148 3772.08 7,602,530,318 192,465,830 *7,699,067,462 51,023.79 12.502020 148 3789.02 7,940,156,059 210,245,736 *8,032,517,535 55,488.16 13.092021 148 3812.44 8,134,204,323 193,011,589 *8,239,725,438 50,626.79 11.712022 148^ 3833.78 9,391,873,362 193,011,589 *9,480,164,744 50,344.98 10.18
Figures for 2022 are estimates (total apportionment based on 0.0% change from 2021)* Amounts reflect Adjusted Construction Needs dollars.** Needs were frozen in 2013.
City of Carver & City of Credit River are eligble for 2022 Apportionment. January report will distribute to 150 cities.
29

JANUARY 2018 BOOK\APPORTIONMENT PER $1000 OF NEEDS GRAPH.XLS 9/29/2021
Const. Needs Const. Needs Const. NeedsApport. Apport. Apport. Percent
per $1,000 Percent per $1,000 Percent per $1,000 IncreaseApport. of Adjusted Increase Apport. of Adjusted Increase Apport. of Adjusted (Decrease)
Year Const. Needs from 1958 Year Const. Needs from 1958 Year Const. Needs from 19581958 $19.14 1980 27.86 45.59 2002 23.77 24.211959 20.71 8.23 1981 25.54 33.49 2003 20.39 6.551960 21.14 10.48 1982 30.30 58.33 2004 19.08 (0.29)1961 19.64 2.64 1983 36.55 91.00 2005 18.07 (5.56)1962 20.02 4.63 1984 39.70 107.47 2006 16.57 (13.41)1963 21.21 10.85 1985 48.20 151.87 2007 15.19 (20.62)1964 24.76 29.40 1986 54.30 183.76 2008 14.29 (25.33)1965 25.71 34.34 1987 48.97 155.92 2009 13.91 (27.31)1966 26.63 39.15 1988 55.06 187.72 2010 13.36 (30.18)1967 29.10 52.06 1989 64.98 239.55 2011 13.75 (28.15)1968 33.20 73.47 1990 41.99 119.43 2012 13.72 (28.30)1969 35.87 87.42 1991 32.11 67.77 2013 13.18 (31.13)1970 39.96 108.80 1992 30.41 58.94 2014 13.74 (28.20)1971 44.27 131.34 1993 29.89 56.20 2015 13.25 (30.76)1972 42.21 120.57 1994 26.83 40.20 2016 12.15 (36.51)1973 30.17 57.66 1995 26.46 38.27 2017 11.70 (38.86)1974 33.76 76.40 1996 27.63 44.39 2018 12.68 (33.74)1975 27.28 42.58 1997 25.91 35.40 2019 12.50 (34.68)1976 25.67 34.14 1998 26.73 39.69 2020 13.09 (31.60)1977 28.54 49.14 1999 24.47 27.86 2021 11.71 (38.81)1978 28.38 48.30 2000 24.64 28.76 2022 10.181979 29.42 53.73 2001 24.26 26.77
Minimum of $11.70 in 2017Maximum of $64.98 in 1989
$0
$5
$10
$15
$20
$25
$30
$35
Apportionment Year
APPORTIONMENT PER $1,000 IN NEEDS(ADJUSTED NEEDS)
30

N:\MSAS\Books\2021 October Book\Itemized Tabulation of Needs 2021.docx
2021 ITEMIZED TABULATION OF NEEDS
The 2021 Money Needs continued to increase over the last year. This increase is due to Needs updates, new designations, added mileage, and an increase to most of unit costs in the Needs study. (The unit cost for structures saw a slight decrease in this year’s full unit cost study. See Screening Board Resolutions for all unit prices used in the 2021 Needs computation.)
The “2021 item by item tabulation of Needs” shows all construction items used in the Municipal State Aid Needs Study. (“After the fact” items are discussed later in this report). This tabulation is provided to give each city an opportunity to compare their Needs of the individual construction items to that of other cities.
Most items in the tabulation are traffic based and draw continuous needs for cities. Traffic Signals and Structures (bridges/culverts) draw Needs on a “per item” basis. There are several cities not drawing Needs for these costs because they do not have these items on their Municipal State Aid System.
The average cost per mile is $2,449,768 (up from $2,133,851 last year). East Bethel currently has the lowest cost per mile at $1,623,063 while Minneapolis has the highest cost at $3,307,355 per mile.
The five cities with the highest cost per mile are listed alphabetically as follows: Bloomington, Minneapolis, Moorhead, Rochester and Saint Paul.
The five cities with the lowest cost per mile are listed alphabetically as follows: East Bethel, Dayton, Ham Lake, Minnetrista and Saint Francis.
31

2021 Item By Item Tabulation Of NeedsCITY MUNICIPALITY GRADING / STORM GRAVEL BITUMINOUS CURB & SIDEWALK SIGNALS LIGHTING STRUCTURES ENGINEERING TOTAL NEEDS COST
# EXCAVATION SEWER BASE SURFACE GUTTER NEEDS MILEAGE PER MILE
101 ALBERT LEA $6,092,155 $5,072,201 $7,553,587 $8,209,839 $5,404,608 $9,247,158 $1,217,349 $2,431,000 $2,079,025 $10,407,526 $57,714,448 24.31 $2,374,103
242 ALBERTVILLE 1,835,623 1,588,376 2,227,301 2,487,043 1,685,376 2,905,268 115,938 769,000 0 2,995,062 16,608,987 7.69 2,159,816
102 ALEXANDRIA 8,515,039 6,991,509 10,610,783 11,507,166 7,185,024 12,628,361 2,666,574 3,337,000 67,844 13,972,061 77,481,361 33.37 2,321,887
198 ANDOVER 8,493,168 8,833,004 8,767,255 12,463,987 9,879,936 13,203,675 579,689 4,448,000 498,306 14,776,745 81,943,765 44.48 1,842,261
103 ANOKA 3,985,800 3,434,417 4,698,351 5,807,828 3,626,304 5,827,733 1,101,411 1,656,000 2,432,755 7,165,538 39,736,137 16.56 2,399,525
186 APPLE VALLEY 11,386,501 8,141,677 15,215,584 15,565,994 8,416,320 13,828,692 4,231,732 3,750,000 0 17,718,033 98,254,533 37.50 2,620,121
187 ARDEN HILLS 1,526,469 1,528,304 1,641,751 2,201,023 1,647,360 2,465,653 231,876 764,000 70,927 2,657,021 14,734,384 7.64 1,928,584
104 AUSTIN 7,697,666 6,357,224 9,539,932 10,555,218 6,701,376 11,250,264 3,188,290 3,041,000 4,237,142 13,764,993 76,333,105 30.41 2,510,132
230 BAXTER 4,888,146 3,719,557 6,447,610 6,397,890 4,107,840 6,678,290 811,566 1,747,000 0 7,655,537 42,453,436 17.47 2,430,076
239 BELLE PLAINE 2,046,399 1,856,318 2,407,790 2,816,556 1,921,920 3,184,325 0 910,000 967,239 3,544,322 19,654,869 9.10 2,159,876
105 BEMIDJI 4,889,966 4,218,814 5,863,131 6,760,882 4,300,032 7,322,415 1,159,380 2,036,000 1,908,872 8,461,091 46,920,583 20.36 2,304,547
232 BIG LAKE 2,162,495 2,281,645 2,172,154 3,227,141 2,424,576 3,744,355 115,938 1,148,000 0 3,800,788 21,077,092 11.48 1,835,984
106 BLAINE 14,007,539 10,771,065 18,298,465 18,451,415 13,117,632 18,190,411 3,420,168 5,071,000 743,196 22,455,598 124,526,489 50.71 2,455,659
107 BLOOMINGTON 24,074,956 16,701,787 32,441,369 33,302,952 20,503,296 28,949,453 13,071,984 7,612,000 3,174,863 39,563,183 219,395,843 76.12 2,882,237
108 BRAINERD 4,892,128 4,131,116 5,962,312 6,749,146 4,401,408 7,104,527 1,101,411 1,986,000 3,641,787 8,793,365 48,763,200 19.86 2,455,347
109 BROOKLYN CENTER 6,115,618 4,586,231 8,027,381 8,177,971 5,326,464 8,176,795 2,405,708 2,139,000 1,418,548 10,202,224 56,575,940 21.39 2,644,971
110 BROOKLYN PARK 17,589,301 13,043,274 23,363,511 23,129,379 13,877,952 23,154,214 5,217,200 6,071,000 150,925 27,631,290 153,228,046 60.71 2,523,934
213 BUFFALO 5,041,811 4,073,736 6,422,463 6,627,144 4,262,016 7,419,900 521,721 1,941,000 0 7,988,151 44,297,942 19.41 2,282,223
179 BURNSVILLE 14,129,459 9,836,533 19,037,261 19,478,142 11,675,136 17,123,866 5,970,798 4,489,000 0 22,382,846 124,123,041 44.89 2,765,049
249 BYRON 1,728,561 1,642,815 1,909,883 2,472,261 1,786,752 3,088,757 57,969 808,000 0 2,968,902 16,463,900 8.08 2,037,611
218 CAMBRIDGE 4,337,063 3,547,593 5,451,785 5,749,902 3,603,072 6,305,571 869,535 1,693,000 1,822,707 7,343,651 40,723,879 16.93 2,405,427
193 CHAMPLIN 5,190,423 4,211,267 6,514,212 7,075,253 5,087,808 7,200,095 1,391,251 2,007,000 802,528 8,685,568 48,165,405 20.07 2,399,871
194 CHANHASSEN 6,094,978 4,796,825 7,900,528 8,083,543 5,294,784 8,622,144 1,768,051 2,276,000 957,066 10,074,664 55,868,583 22.76 2,454,683
196 CHASKA 5,569,437 4,745,104 6,842,562 7,544,059 4,925,184 8,098,433 1,130,393 2,294,000 1,905,244 9,471,970 52,526,386 22.94 2,289,729
252 CHISAGO CITY 1,590,990 1,729,165 1,547,762 2,405,722 1,848,000 2,695,018 173,907 875,000 0 2,830,423 15,695,987 8.75 1,793,827
111 CHISHOLM 1,646,391 1,719,520 1,650,623 2,465,969 1,818,432 3,094,490 289,844 861,000 48,252 2,990,797 16,585,318 8.61 1,926,285
244 CIRCLE PINES 691,479 717,693 706,441 1,024,180 768,768 1,244,296 231,876 360,000 0 1,263,843 7,008,576 3.60 1,946,827
112 CLOQUET 4,814,263 4,609,643 5,342,537 6,848,509 4,923,072 7,685,582 927,504 2,278,000 616,760 8,370,092 46,415,962 22.78 2,037,575
113 COLUMBIA HEIGHTS 2,912,664 2,580,969 3,390,092 4,108,538 2,648,448 4,671,362 579,688 1,250,000 0 4,871,188 27,012,949 12.50 2,161,036
114 COON RAPIDS 13,332,713 10,067,063 17,267,156 18,349,421 10,809,216 17,693,461 4,927,357 4,699,000 3,810,125 22,210,222 123,165,734 46.99 2,621,105
215 CORCORAN 2,935,478 3,207,320 2,849,270 4,438,366 3,548,160 4,931,310 57,969 1,626,000 80,505 5,208,362 28,882,740 16.26 1,776,306
180 COTTAGE GROVE 9,678,338 8,033,178 11,774,070 13,722,255 9,440,640 13,444,504 1,565,160 3,842,000 313,459 15,798,991 87,612,595 38.42 2,280,390
115 CROOKSTON 2,513,324 2,355,532 2,836,133 3,548,291 2,445,696 4,151,474 289,845 1,158,000 3,867,448 5,096,460 28,262,203 11.58 2,440,605
116 CRYSTAL 3,692,989 3,564,864 3,923,965 5,629,779 3,868,128 6,294,107 811,564 1,757,000 0 6,499,330 36,041,726 17.57 2,051,322
229 DAYTON 1,805,274 2,073,338 1,661,617 2,782,000 2,392,896 2,893,800 115,938 1,062,000 0 3,253,109 18,039,972 10.62 1,698,679
247 DELANO 1,229,602 1,242,620 1,299,829 1,790,917 1,311,552 2,008,838 231,876 621,000 696,576 2,295,221 12,728,031 6.21 2,049,602
117 DETROIT LAKES 6,115,160 5,327,394 7,297,099 8,453,896 5,442,624 9,736,470 1,043,441 2,577,000 752,447 10,284,018 57,029,549 25.77 2,213,021
118 DULUTH 32,121,498 25,027,309 41,237,369 43,679,213 25,565,760 44,104,621 17,216,763 11,803,000 9,349,849 55,023,194 305,128,576 118.03 2,585,178
195 EAGAN 15,005,150 10,732,650 20,281,997 19,614,577 11,588,544 18,863,214 3,478,138 4,943,000 1,724,026 23,370,882 129,602,178 49.43 2,621,934
32

2021 Item By Item Tabulation Of NeedsCITY MUNICIPALITY GRADING / STORM GRAVEL BITUMINOUS CURB & SIDEWALK SIGNALS LIGHTING STRUCTURES ENGINEERING TOTAL NEEDS COST
# EXCAVATION SEWER BASE SURFACE GUTTER NEEDS MILEAGE PER MILE
203 EAST BETHEL 4,703,890 5,756,260 3,908,353 7,531,017 6,278,976 8,369,843 0 2,973,000 30,838 8,701,480 48,253,657 29.73 1,623,063
119 EAST GRAND FORKS 3,978,210 3,455,977 4,762,758 5,552,821 3,588,288 5,829,648 695,628 1,674,000 6,174,130 7,856,522 43,567,982 16.74 2,602,627
181 EDEN PRAIRIE 15,112,820 10,619,879 20,320,748 20,639,315 12,114,432 18,242,016 5,246,183 4,861,000 1,466,437 23,897,024 132,519,854 48.61 2,726,185
120 EDINA 12,931,697 8,956,667 17,610,142 17,374,805 9,461,760 15,615,813 5,449,078 4,085,000 3,764,776 20,954,943 116,204,681 40.85 2,844,668
204 ELK RIVER 9,826,403 8,214,136 12,078,305 13,446,887 9,068,928 14,423,126 1,970,945 3,939,000 2,198,568 16,536,585 91,702,883 39.39 2,328,075
123 FAIRMONT 4,980,969 4,178,744 6,209,496 6,630,493 4,270,464 7,368,289 1,275,317 2,012,000 1,150,802 8,376,848 46,453,422 20.12 2,308,818
124 FALCON HEIGHTS 669,181 661,164 723,418 964,194 694,848 1,081,828 289,842 329,000 0 1,190,966 6,604,441 3.29 2,007,429
125 FARIBAULT 7,538,957 5,919,240 9,711,089 9,975,849 5,907,264 10,692,154 985,473 2,797,000 5,147,588 12,908,414 71,583,028 27.97 2,559,279
212 FARMINGTON 4,000,856 3,491,172 4,793,945 5,512,136 3,746,688 5,663,360 57,969 1,695,000 930,582 6,576,174 36,467,882 16.95 2,151,497
126 FERGUS FALLS 6,742,632 5,430,779 8,465,156 9,199,893 5,706,624 9,646,629 2,260,788 2,579,000 3,082,168 11,685,009 64,798,678 25.79 2,512,551
214 FOREST LAKE 7,404,427 6,881,204 8,423,096 10,543,259 7,328,640 11,613,423 985,473 3,383,000 0 12,443,757 69,006,279 33.83 2,039,795
127 FRIDLEY 5,604,583 4,747,329 6,880,181 7,599,157 5,197,632 8,226,493 1,159,379 2,287,000 0 9,174,389 50,876,143 22.87 2,224,580
226 GLENCOE 1,910,265 1,720,501 2,232,313 2,645,937 1,771,968 3,069,639 0 839,000 0 3,121,717 17,311,340 8.39 2,063,330
128 GOLDEN VALLEY 6,682,636 5,095,299 8,731,243 8,863,904 5,417,280 9,132,478 3,072,356 2,389,000 988,811 11,082,062 61,455,069 23.89 2,572,418
129 GRAND RAPIDS 5,877,357 5,402,708 6,715,441 8,327,380 5,586,240 9,507,108 1,101,411 2,645,000 1,293,019 10,220,241 56,675,905 26.45 2,142,756
197 HAM LAKE 5,702,181 6,841,909 4,884,086 9,036,096 7,446,912 9,981,122 173,907 3,523,000 203,531 10,514,408 58,307,152 35.23 1,655,043
130 HASTINGS 6,019,806 4,771,269 7,723,445 7,960,041 4,775,232 8,536,133 811,566 2,261,000 1,421,813 9,741,668 54,021,973 22.61 2,389,296
202 HERMANTOWN 4,668,057 3,866,438 5,851,167 6,195,811 3,915,648 6,829,291 753,597 1,854,000 145,120 7,497,408 41,576,537 18.54 2,242,532
131 HIBBING 10,740,260 10,852,197 11,309,526 15,676,424 11,476,608 17,553,931 927,501 5,419,000 35,464 18,478,007 102,468,918 54.19 1,890,919
132 HOPKINS 2,887,662 2,142,131 3,869,054 3,715,108 2,109,888 3,773,028 2,724,539 999,000 0 4,888,492 27,108,902 9.99 2,713,604
224 HUGO 4,350,346 4,503,378 4,452,396 6,440,372 5,191,296 7,538,401 347,814 2,257,000 228,383 7,768,066 43,077,452 22.57 1,908,616
133 HUTCHINSON 5,028,990 4,090,314 6,356,419 6,707,788 4,139,520 7,305,220 637,659 1,952,000 4,047,578 8,858,407 49,123,895 19.52 2,516,593
134 INTERNATIONAL FALLS 1,451,608 1,650,199 1,313,843 2,264,888 1,771,968 2,706,486 347,814 839,000 0 2,716,077 15,061,883 8.39 1,795,218
178 INVER GROVE HEIGHTS 8,531,609 7,310,975 10,335,598 11,726,832 8,371,968 12,622,621 1,333,286 3,529,000 457,128 14,128,182 78,347,199 35.29 2,220,096
245 ISANTI 1,280,796 1,401,017 1,221,266 1,957,288 1,495,296 2,356,704 0 708,000 0 2,292,483 12,712,850 7.08 1,795,600
246 JORDAN 1,278,940 1,233,382 1,407,437 1,828,750 1,288,320 2,136,903 0 610,000 1,421,705 2,465,199 13,670,636 6.10 2,241,088
240 KASSON 1,365,283 1,328,605 1,505,383 1,946,509 1,393,920 2,196,155 0 660,000 453,500 2,386,859 13,236,214 6.60 2,005,487
236 LA CRESCENT 1,029,261 1,152,296 947,671 1,596,430 1,233,408 1,953,407 0 584,000 0 1,869,224 10,365,697 5.84 1,774,948
234 LAKE CITY 1,531,744 1,661,109 1,483,365 2,323,852 1,771,968 2,721,777 173,907 839,000 0 2,751,480 15,258,202 8.39 1,818,618
206 LAKE ELMO 4,340,112 4,229,813 4,663,870 6,296,988 4,532,352 7,895,828 115,938 2,089,000 185,028 7,556,765 41,905,694 20.89 2,006,017
188 LAKEVILLE 19,530,988 15,435,888 25,039,036 25,876,158 16,967,808 27,032,362 2,898,450 7,306,000 201,934 30,863,499 171,152,123 73.06 2,342,624
210 LINO LAKES 4,573,728 4,942,683 4,444,241 6,927,542 5,339,136 8,268,541 231,876 2,495,000 0 8,189,005 45,411,752 24.95 1,820,110
135 LITCHFIELD 1,658,946 1,749,448 1,640,465 2,500,923 1,852,224 3,174,769 289,845 877,000 0 3,023,599 16,767,219 8.77 1,911,884
200 LITTLE CANADA 2,563,125 2,321,044 3,000,103 3,544,222 2,397,120 4,103,691 347,814 1,135,000 73,794 4,286,902 23,772,815 11.35 2,094,521
136 LITTLE FALLS 4,379,012 4,164,182 4,882,723 6,227,576 4,392,960 6,928,683 695,627 2,055,000 0 7,419,666 41,145,429 20.55 2,002,211
219 MAHTOMEDI 1,886,972 1,927,153 1,937,183 2,795,144 2,173,248 3,398,398 115,938 961,000 0 3,342,908 18,537,944 9.61 1,929,026
137 MANKATO 12,977,162 8,992,043 17,459,413 18,008,304 9,571,584 15,527,886 6,811,343 4,094,000 2,096,984 21,018,517 116,557,236 40.94 2,847,026
189 MAPLE GROVE 16,551,085 12,605,977 21,240,023 23,231,116 14,933,952 21,065,100 5,970,796 5,906,000 1,461,504 27,052,422 150,017,975 59.06 2,540,094
138 MAPLEWOOD 9,227,095 7,655,530 11,503,546 12,322,734 8,422,656 13,756,058 1,565,161 3,668,000 1,449,663 15,305,500 84,875,943 36.68 2,313,957
33

2021 Item By Item Tabulation Of NeedsCITY MUNICIPALITY GRADING / STORM GRAVEL BITUMINOUS CURB & SIDEWALK SIGNALS LIGHTING STRUCTURES ENGINEERING TOTAL NEEDS COST
# EXCAVATION SEWER BASE SURFACE GUTTER NEEDS MILEAGE PER MILE
139 MARSHALL 4,562,140 3,935,561 5,574,988 6,149,203 4,631,616 7,154,224 811,566 1,907,000 1,659,991 8,004,986 44,391,275 19.07 2,327,807
250 MEDINA 2,365,490 2,495,779 2,402,331 3,503,134 2,659,008 3,711,864 289,845 1,259,000 0 4,111,020 22,797,471 12.59 1,810,760
140 MENDOTA HEIGHTS 3,327,609 3,087,268 3,812,531 4,656,015 3,294,720 5,403,416 463,752 1,517,000 1,523,760 5,958,933 33,045,004 15.17 2,178,313
141 MINNEAPOLIS 63,781,475 45,075,648 86,012,280 85,392,239 45,346,752 78,790,100 86,315,582 20,669,000 48,942,520 123,271,644 683,597,240 206.69 3,307,355
142 MINNETONKA 13,551,701 10,807,154 17,285,150 18,053,681 11,288,640 19,253,134 4,057,823 5,128,000 148,022 21,906,124 121,479,429 51.28 2,368,944
243 MINNETRISTA 2,264,054 2,549,659 2,107,350 3,484,861 2,741,376 3,836,099 57,969 1,298,000 126,980 4,062,596 22,528,944 12.98 1,735,666
143 MONTEVIDEO 1,822,793 1,807,510 1,946,822 2,648,067 1,896,576 3,230,200 173,907 898,000 0 3,173,256 17,597,131 8.98 1,959,591
222 MONTICELLO 4,073,769 3,133,801 5,333,289 5,258,036 3,165,888 5,468,398 637,659 1,473,000 0 6,279,649 34,823,489 14.73 2,364,120
144 MOORHEAD 14,063,235 10,669,766 18,110,843 19,658,111 12,745,920 18,631,939 6,144,705 4,989,000 17,225,744 26,892,639 149,131,902 49.89 2,989,214
190 MORRIS 1,871,712 1,781,523 2,088,564 2,658,347 1,892,352 3,199,617 115,938 879,000 0 3,187,154 17,674,207 8.79 2,010,718
145 MOUND 1,701,637 1,606,911 1,932,922 2,388,111 1,676,928 2,693,108 115,938 794,000 0 2,840,103 15,749,658 7.94 1,983,584
146 MOUNDS VIEW 2,291,630 2,199,246 2,529,566 3,274,703 2,318,976 3,987,098 405,783 1,086,000 0 3,980,464 22,073,466 10.86 2,032,548
147 NEW BRIGHTON 3,218,226 3,082,504 3,596,462 4,551,041 3,225,024 5,078,483 608,674 1,527,000 106,391 5,498,637 30,492,442 15.27 1,996,886
182 NEW HOPE 3,646,265 2,749,825 4,797,216 4,827,828 2,716,032 4,916,016 1,217,347 1,286,000 0 5,754,435 31,910,964 12.86 2,481,412
237 NEW PRAGUE 2,009,702 1,938,026 2,205,795 2,877,560 2,023,296 3,329,591 115,938 958,000 74,374 3,417,111 18,949,393 9.58 1,978,016
148 NEW ULM 4,254,771 3,709,509 5,152,605 5,767,529 4,124,736 6,680,209 347,814 1,801,000 1,249,483 7,279,294 40,366,950 18.01 2,241,363
225 NORTH BRANCH 5,461,231 5,772,451 5,481,750 8,142,045 6,274,752 8,763,587 115,938 2,907,000 96,360 9,463,328 52,478,442 29.07 1,805,244
150 NORTH MANKATO 4,492,312 3,479,878 5,677,261 6,365,959 3,717,120 6,148,846 1,101,411 1,633,000 0 7,175,474 39,791,261 16.33 2,436,697
151 NORTH ST PAUL 2,508,611 2,318,168 2,889,897 3,496,469 2,437,248 3,912,555 637,658 1,139,000 0 4,254,713 23,594,319 11.39 2,071,494
149 NORTHFIELD 4,068,997 3,525,459 4,898,406 5,581,199 4,063,488 6,108,712 0 1,706,000 1,296,648 6,874,759 38,123,668 17.06 2,234,682
223 OAK GROVE 4,832,612 5,389,544 4,526,140 7,429,209 5,778,432 8,524,665 0 2,736,000 0 8,627,652 47,844,254 27.36 1,748,693
185 OAKDALE 5,662,632 4,154,896 7,633,910 7,235,159 4,194,432 7,381,675 1,217,349 1,931,000 0 8,670,432 48,081,485 19.31 2,489,979
152 ORONO 2,144,873 1,936,762 2,502,384 2,974,343 2,014,848 3,516,903 231,876 945,000 1,030,715 3,805,497 21,103,201 9.45 2,233,143
217 OTSEGO 5,612,625 5,420,193 6,214,724 7,986,840 5,674,944 9,300,680 289,845 2,687,000 0 9,501,111 52,687,962 26.87 1,960,847
153 OWATONNA 9,210,071 7,315,413 11,661,407 12,608,302 7,315,968 13,205,585 1,507,193 3,464,000 2,143,059 15,054,820 83,485,818 34.64 2,410,099
155 PLYMOUTH 20,559,593 14,649,332 27,508,234 27,953,654 15,702,720 25,459,315 2,260,788 6,732,000 4,915,454 32,063,045 177,804,135 67.32 2,641,178
201 PRIOR LAKE 5,053,290 4,872,048 5,550,663 7,237,554 5,822,784 8,776,963 1,043,442 2,408,000 109,203 8,992,269 49,866,216 24.08 2,070,856
199 RAMSEY 7,143,372 7,519,464 7,229,277 10,608,649 8,048,832 12,412,372 1,043,442 3,787,000 684,603 12,864,945 71,341,956 37.87 1,883,865
156 RED WING 6,587,276 5,240,079 8,426,287 8,763,500 5,586,240 9,415,362 521,721 2,486,000 1,970,004 10,779,221 59,775,690 24.86 2,404,493
207 REDWOOD FALLS 1,929,301 2,100,879 1,850,625 2,940,622 2,264,064 3,578,067 173,907 1,061,000 695,034 3,650,573 20,244,072 10.61 1,908,018
157 RICHFIELD 6,966,891 5,281,378 9,021,962 9,563,592 6,418,368 9,413,447 4,347,669 2,469,000 0 11,766,109 65,248,416 24.69 2,642,706
158 ROBBINSDALE 2,391,094 2,077,686 2,855,833 3,325,789 2,204,928 3,675,545 898,517 1,005,000 678,073 4,204,746 23,317,211 10.05 2,320,120
159 ROCHESTER 36,087,883 24,597,816 48,648,890 50,555,974 27,646,080 41,963,905 19,883,308 11,134,000 25,871,262 63,005,615 349,394,733 111.34 3,138,088
238 ROGERS 5,402,287 4,624,222 6,538,299 7,446,639 5,273,664 8,283,832 985,473 2,230,000 0 8,972,574 49,756,990 22.30 2,231,255
208 ROSEMOUNT 7,054,284 6,272,209 8,389,686 9,652,540 6,666,528 10,278,337 521,721 3,057,500 761,880 11,584,032 64,238,717 30.58 2,100,677
160 ROSEVILLE 7,067,775 6,456,542 8,152,642 9,903,125 6,804,864 11,619,154 1,797,036 3,158,000 88,523 12,110,490 67,158,151 31.58 2,126,604
220 SARTELL 5,539,528 4,074,197 7,388,048 7,281,264 4,460,544 7,232,587 521,719 1,892,000 319,075 8,515,972 47,224,934 18.92 2,496,032
191 SAUK RAPIDS 3,566,002 2,994,759 4,352,530 4,952,282 3,412,992 5,493,250 985,473 1,437,000 4,746,150 7,026,893 38,967,331 14.37 2,711,714
211 SAVAGE 7,025,748 5,750,988 8,849,811 9,350,075 6,095,232 9,969,653 579,690 2,750,000 1,015,840 11,305,146 62,692,183 27.50 2,279,716
34

2021 Item By Item Tabulation Of NeedsCITY MUNICIPALITY GRADING / STORM GRAVEL BITUMINOUS CURB & SIDEWALK SIGNALS LIGHTING STRUCTURES ENGINEERING TOTAL NEEDS COST
# EXCAVATION SEWER BASE SURFACE GUTTER NEEDS MILEAGE PER MILE
166 SHAKOPEE 11,018,801 8,682,094 14,025,235 15,067,257 9,438,528 15,348,222 1,449,223 4,105,000 384,568 17,494,169 97,013,097 41.05 2,363,291
167 SHOREVIEW 4,520,361 4,034,898 5,369,836 6,194,315 4,418,304 7,238,323 956,488 1,969,000 0 7,634,336 42,335,861 19.69 2,150,120
216 SHOREWOOD 2,175,517 1,896,176 2,631,101 2,953,282 1,943,040 3,516,904 173,907 920,000 0 3,566,185 19,776,112 9.20 2,149,577
168 SOUTH ST PAUL 5,006,283 4,123,837 6,149,576 6,992,538 4,154,304 7,446,658 637,658 1,967,000 40,860 8,034,115 44,552,829 19.67 2,265,014
183 SPRING LAKE PARK 1,483,452 1,215,484 1,871,021 1,962,560 1,241,856 2,221,001 0 581,000 0 2,326,803 12,903,177 5.81 2,220,857
161 ST ANTHONY 1,682,478 1,269,083 2,231,016 2,198,312 1,322,112 2,177,037 724,610 595,000 700,930 2,838,126 15,738,704 5.95 2,645,160
162 ST CLOUD 19,850,391 14,622,513 25,991,034 27,486,892 16,691,136 24,541,860 10,057,610 6,785,000 6,556,884 33,568,340 186,151,660 67.85 2,743,576
235 ST FRANCIS 2,303,227 2,632,940 2,113,004 3,561,574 2,840,640 3,771,115 0 1,345,000 0 4,084,855 22,652,355 13.45 1,684,190
233 ST JOSEPH 1,709,745 1,801,027 1,736,069 2,532,890 2,141,568 2,832,635 231,876 908,000 0 3,056,640 16,950,450 9.08 1,866,790
163 ST LOUIS PARK 10,465,725 7,303,064 14,038,470 14,562,072 8,078,400 12,636,000 6,231,660 3,333,000 1,076,065 17,099,393 94,823,849 33.33 2,845,000
227 ST MICHAEL 5,160,363 5,030,425 5,614,660 7,426,930 5,928,384 9,019,708 405,783 2,492,000 0 9,037,213 50,115,466 24.92 2,011,054
164 ST PAUL 49,806,356 35,720,796 66,166,079 68,871,268 38,102,592 61,941,443 40,085,473 16,452,000 62,792,018 96,786,373 536,724,398 164.52 3,262,366
184 ST PAUL PARK 1,312,012 1,208,688 1,521,271 1,822,012 1,254,528 2,071,913 0 594,000 1,429,432 2,467,047 13,680,903 5.94 2,303,182
165 ST PETER 3,458,269 3,032,208 4,169,038 4,700,072 3,113,088 5,481,783 231,876 1,474,000 0 5,645,274 31,305,608 14.74 2,123,854
228 STEWARTVILLE 842,907 929,966 797,824 1,290,919 994,752 1,542,468 115,938 471,000 0 1,536,872 8,522,646 4.71 1,809,479
169 STILLWATER 4,583,612 3,920,527 5,486,279 6,456,045 4,335,936 6,917,211 869,534 1,887,000 74,012 7,596,634 42,126,790 18.87 2,232,474
170 THIEF RIVER FALLS 4,014,773 3,508,909 4,808,715 5,502,717 3,605,184 6,198,536 1,043,440 1,701,000 2,791,746 7,298,503 40,473,523 17.01 2,379,396
209 VADNAIS HEIGHTS 2,104,161 1,879,893 2,493,779 2,888,955 1,936,704 3,409,868 463,752 917,000 0 3,540,704 19,634,816 9.17 2,141,201
241 VICTORIA 1,632,170 1,738,104 1,628,947 2,439,188 1,852,224 2,884,244 115,938 877,000 302,938 2,963,568 16,434,321 8.77 1,873,925
171 VIRGINIA 4,337,678 3,451,622 5,549,976 5,702,347 3,455,232 6,125,907 173,907 1,636,000 174,144 6,733,494 37,340,307 16.36 2,282,415
231 WACONIA 3,749,798 3,018,329 4,747,235 5,059,373 3,032,832 5,414,886 869,533 1,436,000 36,280 6,020,139 33,384,405 14.36 2,324,819
221 WAITE PARK 2,221,966 1,668,450 2,852,697 3,154,016 1,695,936 2,614,739 1,130,394 777,000 0 3,545,343 19,660,541 7.77 2,530,314
172 WASECA 1,735,662 1,577,218 2,019,503 2,410,891 1,628,352 2,933,938 115,938 771,000 0 2,902,352 16,094,854 7.71 2,087,530
173 WEST ST PAUL 3,510,840 2,837,685 4,489,557 4,600,766 3,005,376 5,164,495 724,611 1,354,000 0 5,651,210 31,338,540 13.54 2,314,516
174 WHITE BEAR LAKE 4,979,012 4,320,139 6,021,427 6,804,997 4,422,528 7,584,275 985,473 2,094,000 0 8,186,609 45,398,460 20.94 2,168,026
175 WILLMAR 7,523,896 5,956,481 9,473,112 10,476,241 6,703,488 10,606,138 2,028,913 2,815,000 4,041,229 13,117,393 72,741,891 28.15 2,584,081
176 WINONA 6,744,936 4,773,067 9,071,576 9,101,285 4,853,376 8,272,364 2,086,881 2,189,000 827,184 10,542,322 58,461,991 21.89 2,670,717
192 WOODBURY 18,143,102 13,080,049 23,872,333 25,619,176 15,309,888 22,261,606 5,622,985 6,030,000 1,619,539 28,942,912 160,501,590 60.30 2,661,718
177 WORTHINGTON 2,817,054 2,438,381 3,390,893 3,838,326 2,487,936 4,470,675 231,876 1,178,000 297,206 4,653,081 25,803,428 11.78 2,190,444
248 WYOMING 3,440,723 3,255,055 3,877,069 4,857,068 3,391,872 5,713,056 173,907 1,606,000 0 5,789,246 32,103,996 16.06 1,999,003
251 ZIMMERMAN 1,154,142 1,284,595 1,083,643 1,772,067 1,431,936 2,089,116 0 652,000 0 2,082,851 11,550,350 6.52 1,771,526
TOTAL $992,559,574 $805,124,445 $1,238,849,219 $1,370,426,911 $871,126,080 $1,391,323,861 $356,595,622 $383,377,500 $288,873,452 $1,693,616,698 $9,391,873,362 3,833.78 $2,449,768
Percent of Total Needs - 2021 10.57% 8.57% 13.19% 14.59% 9.28% 14.81% 3.80% 4.08% 3.08% 18.03%
35

KOOCHICHING
MARSHALL
Stewartville
SAINT LOUIS
LAKE
CASS
ITASCA
POLK
BELTRAMI
PINE
AITKIN
COOK
CLAY
ROSEAU
OTTER TAIL
BECKER
TODD
STEARNS
LYON
POPE
KITTSON
SWIFT
RICE
MORRISON
RENVILLE
HUBBARD
WILKIN
NORMAN
CARLTON
MARTINMOWER
CROW WING
NOBLES
MURRAY
FILLMORE
ROCK
WRIGHT
SIBLEY
GRANT
REDWOOD
LAKE OF THE WOODS
BROWN
MEEKER
JACKSON
CLEARWATER
GOODHUE
KANDIYOHI
WINONA
DOUGLAS
DAKOTA
OLMSTED
FREEBORN
FARIBAULT
ISANTI
STEVENS
LINCOLN
BLUE EARTH
WADENA
MCLEOD
DODGESTEELE
MILLE LACS
HOUSTON
TRAVERSE
KANABEC
SCOTT
CHIPPEWA
WABASHA
LAC QUI PARLE
WASECA
BENTON
MAHNOMEN
LE SUEUR
BIG STONE
NICOLLET
CHISAGO
CARVER
PENNINGTON
COTTONWOOD
RED LAKE
PIPESTONE
YELLOWMEDICINE
SHERBURNE
WATONWAN
Hibbing
Duluth
Rochester
Cloquet
Red Wing
St. Cloud
Winona
Baxter
Hermantown
Virginia
NorthBranch
Moorhead
Mankato
Fairmont Austin
Willmar
GrandRapids
Bemidji
Faribault
Alexandria
AlbertLea
Owatonna
Brainerd
Buffalo
Fergus Falls
Sartell
Marshall
DetroitLakes
NewUlm
BigLake
Monticello
Isanti
Morris
Little Falls
Waite Park
Northfield
Worthington
Waseca
St. Peter
Cambridge
Delano
Litchfield
BellePlaine
Chisholm
SaukRapids
Crookston
Byron
Jordan
Montevideo
Kasson
NorthMankato
St. Joseph
RedwoodFalls
InternationalFalls
East Grand Forks
ThiefRiverFalls
Zimmerman
La Crescent
Waconia
New Prague
Hutchinson
Lake City
Glencoe
Lino Lakes
Mahtomedi
St. Paul
HugoBlaine
Eagan
Elk River
MplsOrono
Otsego
Lakeville
East Bethel
Andover
Corcoran
Medina
Ramsey
Plymouth
Ham Lake
Dayton
Woodbury
Oak Grove
St. Michael
Rosemount
Forest Lake
Bloomington
Shakopee
Eden Prairie
Edina
MapleGrove
Minnetrista
Burnsville
CottageGroveChaska
Minnetonka
Lake Elmo
Savage
St. Francis
Wyoming
Chanhassen
CoonRapids
BrooklynPark
PriorLake
Becker
Frid.
MaplewoodRoseville
Buffalo
AppleValley
Oakdale
Farmington
Hastings
Victoria
Shoreview
RogersAnoka
Champlin
Stillwater
Richfield
St. LouisPark
GV
NorthOaks
Mound
MendotaHgts
Hopkins
IGH
ChisagoCity
AHCrystalDelano
Waconia
WBLBC NB
VHNewHope
Jordan
Albertville
SSPWSP
LC
MV
St. Paul Park
Robbins-dale NSP
CHSt.
Anthony
CirclePines
FalconHgts
SLP
Norwood Young America
METRO INSET
Source: State Aid.http://www.dot.state.mn.us/information/disclaimer.htmlMnDOT's Disclaimer on Maps and Related Data can be found @
Needs Costs per Milefor State Aid Cities, 2021
State Aid City Avg is $2,449,768
$2,454,683 to $2,559,279
(17)(50)(42)(13)(13)(13)
$2,572,418 to $2,670,719$2,711,714 to $3,307,355
$2,213,021 to $2,440,605$1,835,984 to $2,190,444$1,623,063 to $1,820,110
Legend
o
36

2020 2021 Difference % increase
$883,815,350 $992,559,574 $108,744,224 12.3
713,861,635 805,124,445 91,262,810 12.8
987,921,177 1,238,849,219 250,928,042 25.4
1,252,257,780 1,370,426,911 118,169,131 9.4
720,614,704 871,126,080 150,511,376 20.9
1,100,154,897 1,391,323,861 291,168,964 26.5
324,903,990 356,595,622 31,691,632 9.8
381,243,500 383,377,500 2,134,000 0.6
302,607,584 288,873,452 (13,734,132) (4.5)
1,466,823,706 1,693,616,698 226,792,992 15.5
Total Unadjusted Money Needs $8,134,204,323 $9,391,873,362 $1,257,669,039 15.5
Total Needs Miles 3,812.44 3,833.78 21.34 0.6
ATF Right of Way $81,578,538 $78,902,829 ($2,675,709) (3.3)
ATF Retaining Wall 7,195,352 7,303,173 107,821 1.5
ATF RR Crossing 1,706,696 1,706,696 0 0.0
ATF Bridge over MSAS Route 378,684 378,684 0 0.0
N:\MSAS\Book\2021 October Book\Comparison of Needs.xls
COMPARISON OF NEEDS BETWEEN 2020 and 20212021 Needs are computed for the January 2022 distribution
Grading/Excavation
Total Storm Sewer
Gravel Base
Bituminous Surface
Needs Item
Curb and Gutter
Sidewalk Construction
Engineering
Structures
Street Lighting
Traffic Signals
37

N:\MSAS\Books\2021 October Book\MileageReport2020notes.docx
2021 MILEAGE REPORT
The 2021 Mileage Report shows all categories of mileage used in the Municipal State Aid Needs Study. This report is provided to give cities an opportunity to view various mileage categories. The report can also be used as a reference when reviewing and comparing against your city’s local road inventory.
The Total System Length reflects an overall increase from last year. This increase of 21 miles is due new MSAS designations and to overall system growth.
Forty-one cities made a change to their system mileage in 2021.
‘Total System Length’ and ‘Total Needs Length’ are different in some cities. These categories differ when cities have designations that are “Outside City Limits” or “MSB approved One Way Mileage”.
Total Needs Length for all cities is 3,833.78 miles.
Total System Length for all cities is 3,839.75 miles.
The category ‘Total Needs Coded as Common Boundary’ is for shared MSAS roads on corporate limit boundaries. For these roads, two cities are drawing Needs on half the actual roadway length.
The information on this Mileage Report may also be helpful as you fill out your 2021 Annual Certification of Mileage form (due January 2022). We expect that your “Total Needs Length” from this Mileage Report will match line 13 of the Certification of Mileage. Should there be a discrepancy, we ask that you provide an explanation on the backside of your Annual Certification of Mileage Form.
If a city has an approved system revision that occurred after their Needs were submitted by the spring deadline (but approved by the Commissioner before December 31st) those revisions can also be included on your 2021 certification.
38

2021 Mileage Report MILEAGE CERT LINE 16
MILEAGE CERT LINE
4
MILEAGE CERT LINE
7
MILEAGE CERT LINE
2
MILEAGE CERT LINE
6
MILEAGE CERT
COLUMN XI
MILEAGE CERT
COLUMN X
MILEAGE CERT
COLUMN IXMILEAGE
CERT LINE 13
101 ALBERT LEA 0.28 0.90 1.00 22.13 24.31 24.31 24.31
242 ALBERTVILLE 0.90 7.69 7.69 7.69 7.69
102 ALEXANDRIA 4.77 7.07 0.60 20.93 33.14 0.23 33.37 33.37
198 ANDOVER 0.04 1.71 1.80 42.68 35.79 8.73 44.48 44.52
103 ANOKA 0.05 1.80 1.07 13.69 16.56 16.56 16.56
186 APPLE VALLEY 0.82 36.68 35.26 2.24 37.50 37.50
187 ARDEN HILLS 0.13 1.78 0.24 5.62 6.97 0.67 7.64 7.64
104 AUSTIN 4.71 25.70 30.41 30.41 30.41
230 BAXTER 17.47 17.47 17.47 17.47
239 BELLE PLAINE 9.10 8.58 0.52 9.10 9.10
105 BEMIDJI 2.30 18.06 20.36 20.36 20.36
232 BIG LAKE 11.48 11.30 0.18 11.48 11.48
106 BLAINE 0.17 2.37 48.34 46.47 4.24 50.71 50.71
107 BLOOMINGTON 0.65 0.58 1.54 74.00 76.12 76.12 76.12
108 BRAINERD 0.04 0.70 2.48 16.68 19.10 0.80 19.86 19.90
109 BROOKLYN CENTER 0.94 0.52 20.87 21.39 21.39 21.39
110 BROOKLYN PARK 2.95 1.00 4.48 55.23 60.71 60.71 60.71
213 BUFFALO 0.33 1.16 3.24 15.01 19.74 19.41 19.74
179 BURNSVILLE 44.89 44.70 0.19 44.89 44.89
249 BYRON 1.99 6.09 8.08 8.08 8.08
218 CAMBRIDGE 1.20 0.49 3.83 11.41 16.68 0.25 16.93 16.93
193 CHAMPLIN 2.06 0.14 0.70 19.23 19.77 0.30 20.07 20.07
194 CHANHASSEN 0.50 0.60 22.16 22.35 0.41 22.76 22.76
196 CHASKA 0.11 2.40 20.54 20.20 2.74 22.94 22.94
252 CHISAGO CITY 8.75 8.75 8.75 8.75
111 CHISHOLM 0.20 0.72 7.69 8.61 8.61 8.61
244 CIRCLE PINES 3.60 3.24 0.36 3.60 3.60
112 CLOQUET 1.75 21.03 22.62 0.16 22.78 22.78
113 COLUMBIA HEIGHTS 1.58 0.88 11.62 12.50 12.50 12.50
114 COON RAPIDS 0.69 0.75 0.56 1.44 44.24 46.99 46.99 46.99
215 CORCORAN 0.51 16.26 15.47 0.79 16.26 16.26
180 COTTAGE GROVE 1.29 37.13 32.98 1.09 4.35 38.42 38.42
115 CROOKSTON 1.58 10.00 11.58 11.58 11.58
116 CRYSTAL 1.70 17.57 17.57 17.57 17.57
229 DAYTON 10.62 9.60 1.02 10.62 10.62
247 DELANO 6.21 6.21 6.21 6.21
117 DETROIT LAKES 5.70 3.28 2.11 14.68 25.77 25.77 25.77
118 DULUTH 0.06 28.00 89.97 118.03 118.03 118.03
TOTAL SYSTEM LENGTH
CITY #
TRUNK HWY
TURN- BACK
MSAS MILEAGE EXCLUDE
TB's
IMPROVED MILEAGE
UN- IMPROVED MILEAGE
NON- EXISITNG MILEAGE
TOTAL NEEDS
LENGTH MUNICIPALITY
TOTAL LENGTH OUTSIDE
CITY LIMITS
TOTAL NEEDS LENGTH CODED
AS COMMON BOUNDARY
TOTAL NEEDS LENGTH MSB
APPROVED ONE WAY
CSAH TURN- BACK
COUNTY ROAD TURN- BACK
39

2021 Mileage Report MILEAGE CERT LINE 16
MILEAGE CERT LINE
4
MILEAGE CERT LINE
7
MILEAGE CERT LINE
2
MILEAGE CERT LINE
6
MILEAGE CERT
COLUMN XI
MILEAGE CERT
COLUMN X
MILEAGE CERT
COLUMN IXMILEAGE
CERT LINE 13
TOTAL SYSTEM LENGTH
CITY #
TRUNK HWY
TURN- BACK
MSAS MILEAGE EXCLUDE
TB's
IMPROVED MILEAGE
UN- IMPROVED MILEAGE
NON- EXISITNG MILEAGE
TOTAL NEEDS
LENGTH MUNICIPALITY
TOTAL LENGTH OUTSIDE
CITY LIMITS
TOTAL NEEDS LENGTH CODED
AS COMMON BOUNDARY
TOTAL NEEDS LENGTH MSB
APPROVED ONE WAY
CSAH TURN- BACK
COUNTY ROAD TURN- BACK
195 EAGAN 0.42 0.25 0.76 48.42 49.33 0.10 49.43 49.43
203 EAST BETHEL 2.16 29.73 24.47 5.26 29.73 29.73
119 EAST GRAND FORKS 4.12 2.34 10.28 16.74 16.74 16.74
181 EDEN PRAIRIE 0.78 2.14 46.47 48.61 48.61 48.61
120 EDINA 1.02 40.85 40.85 40.85 40.85
204 ELK RIVER 0.40 0.26 3.53 1.27 34.33 38.21 1.18 39.39 39.39
123 FAIRMONT 5.87 14.25 20.01 0.11 20.12 20.12
124 FALCON HEIGHTS 1.38 0.50 0.25 2.54 3.29 3.29 3.29
125 FARIBAULT 0.32 3.26 2.23 22.48 28.29 27.97 28.29
212 FARMINGTON 0.24 16.71 13.42 3.53 16.95 16.95
126 FERGUS FALLS 6.78 19.01 25.79 25.79 25.79
214 FOREST LAKE 8.51 25.32 32.97 0.86 33.83 33.83
127 FRIDLEY 0.61 22.87 22.87 22.87 22.87
226 GLENCOE 0.74 7.65 8.25 0.14 8.39 8.39
128 GOLDEN VALLEY 23.89 23.89 23.89 23.89
129 GRAND RAPIDS 7.07 19.38 25.76 0.64 0.05 26.45 26.45
197 HAM LAKE 1.67 0.97 34.26 30.11 5.12 35.23 35.23
130 HASTINGS 2.46 20.15 22.61 22.61 22.61
202 HERMANTOWN 0.25 2.87 15.42 18.47 0.07 18.54 18.54
131 HIBBING 5.11 49.08 53.50 0.69 54.19 54.19
132 HOPKINS 0.44 0.35 9.64 9.92 0.07 9.99 9.99
224 HUGO 0.34 22.57 22.21 0.36 22.57 22.57
133 HUTCHINSON 2.77 3.03 0.21 13.51 19.52 19.52 19.52
134 INTERNATIONAL FALLS 8.39 8.39 8.39 8.39
178 INVER GROVE HEIGHTS 0.32 3.57 1.08 30.64 34.70 0.59 35.29 35.29
245 ISANTI 7.08 7.02 0.06 7.08 7.08
246 JORDAN 6.10 6.08 0.02 6.10 6.10
240 KASSON 6.60 6.46 0.14 6.60 6.60
236 LA CRESCENT 5.84 5.84 5.84 5.84
234 LAKE CITY 0.44 7.95 8.39 8.39 8.39
206 LAKE ELMO 0.04 2.64 18.25 20.89 20.89 20.89
188 LAKEVILLE 2.53 7.29 63.24 69.93 1.24 1.89 73.06 73.06
210 LINO LAKES 0.38 0.34 0.98 0.28 23.35 23.47 1.48 24.95 24.95
135 LITCHFIELD 8.77 8.77 8.77 8.77
200 LITTLE CANADA 0.40 1.03 4.03 6.29 11.35 11.35 11.35
136 LITTLE FALLS 2.01 3.13 15.41 19.88 0.67 20.55 20.55
219 MAHTOMEDI 0.02 0.85 0.52 8.24 9.63 9.61 9.63
137 MANKATO 0.87 0.21 1.98 6.55 32.41 41.38 0.64 40.940 42.02
40

2021 Mileage Report MILEAGE CERT LINE 16
MILEAGE CERT LINE
4
MILEAGE CERT LINE
7
MILEAGE CERT LINE
2
MILEAGE CERT LINE
6
MILEAGE CERT
COLUMN XI
MILEAGE CERT
COLUMN X
MILEAGE CERT
COLUMN IXMILEAGE
CERT LINE 13
TOTAL SYSTEM LENGTH
CITY #
TRUNK HWY
TURN- BACK
MSAS MILEAGE EXCLUDE
TB's
IMPROVED MILEAGE
UN- IMPROVED MILEAGE
NON- EXISITNG MILEAGE
TOTAL NEEDS
LENGTH MUNICIPALITY
TOTAL LENGTH OUTSIDE
CITY LIMITS
TOTAL NEEDS LENGTH CODED
AS COMMON BOUNDARY
TOTAL NEEDS LENGTH MSB
APPROVED ONE WAY
CSAH TURN- BACK
COUNTY ROAD TURN- BACK
189 MAPLE GROVE 1.00 0.50 58.56 53.26 5.80 59.06 59.06
138 MAPLEWOOD 1.59 7.95 3.37 25.36 36.68 36.68 36.68
139 MARSHALL 3.51 1.44 14.12 18.45 0.62 19.07 19.07
250 MEDINA 0.94 12.59 12.12 0.47 12.59 12.59
140 MENDOTA HEIGHTS 0.17 0.23 0.65 0.23 14.29 15.34 15.17 15.34
141 MINNEAPOLIS 1.82 9.67 8.84 188.18 205.90 0.79 206.69 206.69
142 MINNETONKA 2.04 51.28 51.28 51.28 51.28
243 MINNETRISTA 0.41 12.98 13.39 12.98 13.39
143 MONTEVIDEO 0.16 8.98 9.14 8.98 9.14
222 MONTICELLO 0.50 0.74 13.49 14.73 14.73 14.73
144 MOORHEAD 0.25 2.10 8.48 2.99 38.42 52.24 49.89 52.24
190 MORRIS 1.78 0.04 6.97 8.79 8.79 8.79
145 MOUND 7.94 7.71 0.23 7.94 7.94
146 MOUNDS VIEW 0.24 1.23 2.10 7.53 10.86 10.86 10.86
147 NEW BRIGHTON 0.38 0.73 0.38 14.16 12.98 2.29 15.27 15.27
182 NEW HOPE 1.53 12.86 12.86 12.86 12.86
237 NEW PRAGUE 0.55 1.00 8.03 9.34 0.10 0.14 9.58 9.58
148 NEW ULM 0.58 17.43 18.01 18.01 18.01
225 NORTH BRANCH 0.94 4.52 23.61 28.77 0.30 29.07 29.07
150 NORTH MANKATO 0.22 1.90 14.21 16.33 16.33 16.33
151 NORTH ST PAUL 1.25 2.73 8.66 11.27 0.12 11.39 11.39
149 NORTHFIELD 1.29 0.80 14.97 16.53 0.53 17.06 17.06
223 OAK GROVE 1.97 1.55 25.81 26.97 0.39 27.36 27.36
185 OAKDALE 0.04 0.60 18.71 19.31 19.31 19.31
152 ORONO 0.41 9.45 9.45 9.45 9.45
217 OTSEGO 1.15 26.87 24.60 2.27 26.87 26.87
153 OWATONNA 7.36 1.31 25.97 34.64 34.64 34.64
155 PLYMOUTH 1.51 1.76 65.56 67.32 67.32 67.32
201 PRIOR LAKE 0.21 0.23 1.20 0.61 22.27 23.80 0.49 24.08 24.29
199 RAMSEY 0.40 1.99 35.88 32.97 4.90 37.87 37.87
156 RED WING 0.50 24.36 24.60 0.26 24.86 24.86
207 REDWOOD FALLS 2.02 0.33 8.26 10.21 0.40 10.61 10.61
157 RICHFIELD 24.69 24.69 24.69 24.69
158 ROBBINSDALE 0.54 0.55 9.50 10.05 10.05 10.05
159 ROCHESTER 0.33 7.68 4.60 5.54 93.52 110.71 0.96 111.34 111.67
238 ROGERS 1.83 20.47 22.30 22.30 22.30
208 ROSEMOUNT 0.175 0.01 6.36 24.205 30.275 0.30 30.575 30.575
160 ROSEVILLE 1.52 3.77 3.94 23.87 31.58 31.58 31.58
41

2021 Mileage Report MILEAGE CERT LINE 16
MILEAGE CERT LINE
4
MILEAGE CERT LINE
7
MILEAGE CERT LINE
2
MILEAGE CERT LINE
6
MILEAGE CERT
COLUMN XI
MILEAGE CERT
COLUMN X
MILEAGE CERT
COLUMN IXMILEAGE
CERT LINE 13
TOTAL SYSTEM LENGTH
CITY #
TRUNK HWY
TURN- BACK
MSAS MILEAGE EXCLUDE
TB's
IMPROVED MILEAGE
UN- IMPROVED MILEAGE
NON- EXISITNG MILEAGE
TOTAL NEEDS
LENGTH MUNICIPALITY
TOTAL LENGTH OUTSIDE
CITY LIMITS
TOTAL NEEDS LENGTH CODED
AS COMMON BOUNDARY
TOTAL NEEDS LENGTH MSB
APPROVED ONE WAY
CSAH TURN- BACK
COUNTY ROAD TURN- BACK
220 SARTELL 1.86 17.06 18.92 18.92 18.92
191 SAUK RAPIDS 0.39 1.02 12.96 14.37 14.37 14.37
211 SAVAGE 1.62 2.71 23.17 25.42 2.08 27.50 27.50
166 SHAKOPEE 0.23 3.15 3.01 0.92 33.97 40.01 1.04 41.05 41.05
167 SHOREVIEW 0.25 3.95 0.76 14.98 18.58 1.11 19.69 19.69
216 SHOREWOOD 0.69 9.20 9.20 9.20 9.20
168 SOUTH ST PAUL 0.07 1.60 0.18 3.01 14.88 19.67 19.67 19.67
183 SPRING LAKE PARK 0.12 0.29 5.52 5.81 5.81 5.81
161 ST ANTHONY 0.65 0.45 5.50 5.95 5.95 5.95
162 ST CLOUD 0.19 5.35 1.60 4.19 56.71 61.20 1.06 5.59 67.85 67.85
235 ST FRANCIS 0.24 1.22 12.23 13.45 13.45 13.45
233 ST JOSEPH 1.13 7.95 8.06 1.02 9.08 9.08
163 ST LOUIS PARK 0.39 3.54 29.79 33.33 33.33 33.33
227 ST MICHAEL 0.50 0.25 0.18 0.55 24.19 25.42 24.92 25.42
164 ST PAUL 1.21 3.45 7.07 154.00 161.18 3.34 164.52 164.52
184 ST PAUL PARK 0.20 5.74 5.94 5.94 5.94
165 ST PETER 1.56 2.12 11.06 14.44 0.30 14.74 14.74
228 STEWARTVILLE 4.71 4.49 0.22 4.71 4.71
169 STILLWATER 18.87 18.35 0.52 18.87 18.87
170 THIEF RIVER FALLS 2.26 1.29 13.46 16.79 0.22 17.01 17.01
209 VADNAIS HEIGHTS 0.57 0.59 8.01 8.90 0.27 9.17 9.17
241 VICTORIA 8.77 7.52 1.25 8.77 8.77
171 VIRGINIA 1.82 4.14 10.40 16.36 16.36 16.36
231 WACONIA 4.35 10.01 14.27 0.09 14.36 14.36
221 WAITE PARK 0.19 0.51 7.26 7.77 7.77 7.77
172 WASECA 7.71 7.71 7.71 7.71
173 WEST ST PAUL 0.96 0.98 0.23 12.33 13.48 0.06 13.54 13.54
174 WHITE BEAR LAKE 0.01 1.98 1.09 17.87 20.95 20.94 20.95
175 WILLMAR 0.94 6.35 20.86 28.15 28.15 28.15
176 WINONA 21.89 21.39 0.50 21.89 21.89
192 WOODBURY 60.30 57.51 2.79 60.30 60.30
177 WORTHINGTON 0.65 0.45 10.68 11.78 11.78 11.78
248 WYOMING 2.36 13.70 15.84 0.22 16.06 16.06
251 ZIMMERMAN 6.52 6.09 0.20 0.23 6.52 6.52TOTAL 3.66 49.42 2.31 141.24 134.06 149.78 3408.70 3742.10 5.58 92.07 3833.78 3839.75
42

City
2020 MSAS Needs
Mileage
2021 MSAS Needs
Mileage
Difference in Mileage
City
2020 MSAS Needs
Mileage
2021 MSAS Needs
Mileage
Difference in Mileage
City
2020 MSAS Needs
Mileage
2021 MSAS Needs
Mileage
Difference in Mileage
ALBERT LEA 24.31 24.31 FRIDLEY 22.87 22.87 ORONO 9.45 9.45ALBERTVILLE 7.69 7.69 GLENCOE 8.39 8.39 OTSEGO 25.22 26.87 1.65ALEXANDRIA 33.37 33.37 GOLDEN VALLEY 23.74 23.89 0.15 OWATONNA 34.64 34.64ANDOVER 43.88 44.48 0.60 GRAND RAPIDS 26.32 26.45 0.13 PLYMOUTH 66.78 67.32 0.54ANOKA 16.56 16.56 HAM LAKE 35.07 35.23 0.16 PRIOR LAKE 23.83 24.08 0.25APPLE VALLEY 37.50 37.50 HASTINGS 22.61 22.61 RAMSEY 37.86 37.87 0.01ARDEN HILLS 7.63 7.64 0.01 HERMANTOWN 18.54 18.54 RED WING 24.86 24.86AUSTIN 30.41 30.41 HIBBING 54.19 54.19 REDWOOD FALLS 10.61 10.61BAXTER 17.46 17.47 0.01 HOPKINS 9.99 9.99 RICHFIELD 24.67 24.69 0.02BELLE PLAINE 9.10 9.10 HUGO 22.57 22.57 ROBBINSDALE 10.05 10.05BEMIDJI 19.01 20.36 1.35 HUTCHINSON 19.52 19.52 ROCHESTER 111.14 111.34 0.20BIG LAKE 11.48 11.48 INTERNATIONAL FALLS 8.39 8.39 ROGERS 21.80 22.30 0.50BLAINE 50.71 50.71 INVER GROVE HEIGHTS 35.29 35.29 ROSEMOUNT 30.575 30.575BLOOMINGTON 76.12 76.12 ISANTI 7.08 7.08 ROSEVILLE 31.58 31.58BRAINERD 19.86 19.86 JORDAN 6.10 6.10 SARTELL 18.92 18.92BROOKLYN CENTER 21.34 21.39 0.05 KASSON 6.60 6.60 SAUK RAPIDS 14.37 14.37BROOKLYN PARK 60.71 60.71 LA CRESCENT 5.84 5.84 SAVAGE 27.29 27.50 0.21BUFFALO 19.13 19.41 0.28 LAKE CITY 8.39 8.39 SHAKOPEE 39.95 41.05 1.10BURNSVILLE 44.77 44.89 0.12 LAKE ELMO 19.12 20.89 1.77 SHOREVIEW 19.69 19.69BYRON 8.08 8.08 LAKEVILLE 69.06 73.06 4.00 SHOREWOOD 9.20 9.20CAMBRIDGE 16.93 16.93 LINO LAKES 24.95 24.95 SOUTH ST PAUL 17.46 19.67 2.21CHAMPLIN 20.07 20.07 LITCHFIELD 8.77 8.77 SPRING LAKE PARK 5.81 5.81CHANHASSEN 22.76 22.76 LITTLE CANADA 11.35 11.35 ST ANTHONY 5.95 5.95CHASKA 22.94 22.94 LITTLE FALLS 21.75 20.55 (1.20) ST CLOUD 67.85 67.85CHISAGO CITY 8.75 8.75 MAHTOMEDI 9.56 9.61 0.05 ST FRANCIS 13.45 13.45CHISHOLM 8.61 8.61 MANKATO 40.680 40.94 0.260 ST JOSEPH 9.08 9.08CIRCLE PINES 3.60 3.60 MAPLE GROVE 59.06 59.06 ST LOUIS PARK 33.14 33.33 0.19CLOQUET 22.78 22.78 MAPLEWOOD 36.68 36.68 ST MICHAEL 23.71 24.92 1.21COLUMBIA HEIGHTS 12.50 12.50 MARSHALL 19.07 19.07 ST PAUL 164.52 164.52COON RAPIDS 46.32 46.99 0.67 MEDINA 12.59 12.59 ST PAUL PARK 5.94 5.94CORCORAN 15.79 16.26 0.47 MENDOTA HEIGHTS 15.17 15.17 ST PETER 14.74 14.74COTTAGE GROVE 38.42 38.42 MINNEAPOLIS 206.78 206.69 (0.09) STEWARTVILLE 4.71 4.71CROOKSTON 11.58 11.58 MINNETONKA 51.23 51.28 0.05 STILLWATER 18.87 18.87CRYSTAL 17.57 17.57 MINNETRISTA 12.98 12.98 THIEF RIVER FALLS 16.99 17.01 0.02DAYTON 10.62 10.62 MONTEVIDEO 8.98 8.98 VADNAIS HEIGHTS 9.17 9.17DELANO 6.21 6.21 MONTICELLO 12.35 14.73 2.38 VICTORIA 8.77 8.77DETROIT LAKES 25.42 25.77 0.35 MOORHEAD 49.89 49.89 VIRGINIA 16.36 16.36DULUTH 118.12 118.03 (0.09) MORRIS 8.79 8.79 WACONIA 14.36 14.36EAGAN 49.43 49.43 MOUND 7.94 7.94 WAITE PARK 7.77 7.77EAST BETHEL 29.73 29.73 MOUNDS VIEW 10.86 10.86 WASECA 7.71 7.71EAST GRAND FORKS 16.74 16.74 NEW BRIGHTON 15.27 15.27 WEST ST PAUL 13.54 13.54EDEN PRAIRIE 48.61 48.61 NEW HOPE 12.86 12.86 WHITE BEAR LAKE 20.94 20.94EDINA 40.85 40.85 NEW PRAGUE 9.58 9.58 WILLMAR 28.15 28.15ELK RIVER 39.23 39.39 0.16 NEW ULM 18.01 18.01 WINONA 21.89 21.89FAIRMONT 20.12 20.12 NORTH BRANCH 28.28 29.07 0.79 WOODBURY 60.15 60.30 0.15FALCON HEIGHTS 3.29 3.29 NORTH MANKATO 15.84 16.33 0.49 WORTHINGTON 11.78 11.78FARIBAULT 27.97 27.97 NORTH ST PAUL 11.39 11.39 WYOMING 16.06 16.06FARMINGTON 16.95 16.95 NORTHFIELD 17.06 17.06 ZIMMERMAN 6.52 6.52FERGUS FALLS 26.40 25.79 (0.61) OAK GROVE 26.59 27.36 0.77
FOREST LAKE 33.83 33.83 OAKDALE 19.31 19.31 Total 3,812.44 3,833.78 21.34
N:\MSAS\BOOKS\2021 OCTOBER BOOK\NEEDS MILEAGE COMPARISON.XLS NOTE: Needs Miles / not Total Miles
MSAS NEEDS MILEAGE COMPARISONfrom 2020 to 2021
43

N:\MSAS\Books\2021 October Book\Const Needs Apport (Tent) 2021.docx
2021 CONSTRUCTION NEEDS & 2022 CONSTRUCTION NEEDS ALLOCATIONS
Fifty percent of the total apportionment is determined on a prorated share that each city's construction Needs bears to the total of all construction needs. The construction Needs in this report are computed from annual Needs Updates submitted by each city. Before determining each city’s allocation, the following Municipal Screening Board mandated adjustments are applied to the “unadjusted” construction Needs.
- Excess Unencumbered Construction Fund Balance Adjustment
- Low Balance Incentive
- After the Fact Right of Way Adjustment
- After the Fact Retaining Wall Adjustment
- After the Fact Railroad Crossing Adjustment
- After the Fact Railroad Bridge over MSAS Adjustment
- Excess Maintenance Account (none for 2021)
By applying these adjustments, the “Adjusted Construction Needs” are calculated for each city. These Needs figures will be used to determine the Construction Needs Allocations. The actual amount of the road user fund for distribution to the Municipal State Aid Account will not be available until January 2022.
The tentative 2022 Needs allocations in this book are based on the 2021 money needs apportionment of $96,505,794.
The Municipal Screening Board will make their Money Needs recommendation by Nov. 1st
The data on the following pages are for the Screening Board's use in determining the Tentative 2021 Construction Needs. These tabulations show the impact of the individual adjustments and the tentative allocations to each city.
44

N:\MSAS\Books\2018 October Book\Phase In Steps.docx
ENDING OF THE PHASE IN PROCESS
In 2014, the Screening Board approved a new method of Needs Calculations referred to as "Continuous Needs". Before these new Needs calculations were to be implemented for the 2015 apportionment, it was known that under this new method some cities would see big changes to their new 25 Year Construction Needs figures. To reduce the impact that the new Needs method would have to the corresponding allocations for these cities, the Screening Board voted to implement a seven-year phase in period. This "phase-in" (or restriction) gave cities several years to adjust to the new Needs Calculations by preventing a city's Needs from varying too significantly from one year to the next. According to MSB Resolutions, the phase-in period was to last 7 years and end with the January 2021 Apportionment. Therefore, the phase-in period has come to an end and a Needs restriction has not been applied in this report. (For a full review of the Needs Study Task Force’s recommendation to move to a new Needs System, please see the Needs Task Force Decision Chronicle on the MSAS home page): http://www.dot.state.mn.us/stateaid/msas.html
The following Screening Board Resolution has expired and will be removed from resolutions. Unless further action from the Screening Board extends the Phase-in period.
Phase In (Restriction) May 2014
The method of computing Needs is to be phased in over a period of seven years. This seven year period will begin with the January 2015 allocation and go through the January 2021 allocation.
The phase in will be reviewed annually by the Municipal Screening Board to determine if the Phase In period should be revised.
During the seven year period the phase in is being applied, a city’s Restricted Needs will be computed using the following steps:
1) Compare the current years Unadjusted Needs to the previous years Restricted Needs. In the first year of the phase in, the current years Unadjusted Needs will be compared to the previous years Unadjusted Needs.
2) Compute the Statewide Average Percent of Change between the two totals. 3) Determine each individual city’s Percent of Change between last years Restricted Needs 4) and this years Unadjusted Needs. 5) If an individual city’s Percent of Change is greater than 5 Percentage Points less than the Statewide
Average Percent of Change, increase this year’s Unadjusted Needs to 5 Percentage Points less than the Statewide Average Percent of Change.
6) If an individual city’s Percent of Change is greater than 10 Percentage Points more than the Statewide Average Percent of Change, decrease this year’s Unadjusted Needs to 10 Percentage Points more than the Statewide Average Percent of Change.
7) If an individual city’s Percent of Change is between 5 Percentage Points less and 10 Percentage Points more than the Statewide Average Percent of Change, no restriction is made and the current year’s Unadjusted Needs will be used as its Restricted Needs.
All Needs adjustments will be applied to the city’s Restricted Needs
45

KOOCHICHING
MARSHALL
Stewartville
SAINT LOUIS
LAKE
CASS
ITASCA
POLK
BELTRAMI
PINE
AITKIN
COOK
CLAY
ROSEAU
OTTER TAIL
BECKER
TODD
STEARNS
LYON
POPE
KITTSON
SWIFT
RICE
MORRISON
RENVILLE
HUBBARD
WILKIN
NORMAN
CARLTON
MARTINMOWER
CROW WING
NOBLES
MURRAY
FILLMORE
ROCK
WRIGHT
SIBLEY
GRANT
REDWOOD
LAKE OF THE WOODS
BROWN
MEEKER
JACKSON
CLEARWATER
GOODHUE
KANDIYOHI
WINONA
DOUGLAS
DAKOTA
OLMSTED
FREEBORN
FARIBAULT
ISANTI
STEVENS
LINCOLN
BLUE EARTH
WADENA
MCLEOD
DODGESTEELE
MILLE LACS
HOUSTON
TRAVERSE
KANABEC
SCOTT
CHIPPEWA
WABASHA
LAC QUI PARLE
WASECA
BENTON
MAHNOMEN
LE SUEUR
BIG STONE
NICOLLET
CHISAGO
CARVER
PENNINGTON
COTTONWOOD
RED LAKE
PIPESTONE
YELLOWMEDICINE
SHERBURNE
WATONWAN
Hibbing
Duluth
Rochester
Cloquet
Red Wing
St. Cloud
Winona
Baxter
Hermantown
Virginia
NorthBranch
Moorhead
Mankato
Fairmont Austin
Willmar
GrandRapids
Bemidji
Faribault
Alexandria
AlbertLea
Owatonna
Brainerd
Buffalo
Fergus Falls
Sartell
Marshall
DetroitLakes
NewUlm
BigLake
Monticello
Isanti
Morris
Little Falls
Waite Park
Northfield
Worthington
Waseca
St. Peter
Cambridge
Delano
Litchfield
BellePlaine
Chisholm
SaukRapids
Crookston
Byron
Jordan
Montevideo
Kasson
NorthMankato
St. Joseph
RedwoodFalls
InternationalFalls
East Grand Forks
ThiefRiverFalls
Zimmerman
La Crescent
Waconia
New Prague
Hutchinson
Lake City
Glencoe
Lino Lakes
Mahtomedi
St. Paul
HugoBlaine
Eagan
Elk River
MplsOrono
Otsego
Lakeville
East Bethel
Andover
Corcoran
Medina
Ramsey
Plymouth
Ham Lake
Dayton
Woodbury
Oak Grove
St. Michael
Rosemount
Forest Lake
Bloomington
Shakopee
Eden Prairie
Edina
MapleGrove
Minnetrista
Burnsville
CottageGroveChaska
Minnetonka
Lake Elmo
Savage
St. Francis
Wyoming
Chanhassen
CoonRapids
BrooklynPark
PriorLake
Becker
Frid.
MaplewoodRoseville
Buffalo
AppleValley
Oak-dale
Farmington
Hastings
Victoria
Shoreview
Rogers
Anoka
Champlin
Stillwater
Richfield
St. LouisPark
GV
NorthOaks
Mound
MendotaHgts
Hopkins
IGH
ChisagoCity
AHCrystal
Delano
Waconia
WBLBC NB
VHNewHope
Jordan
Albertville
SSPWSP
LC
MV
St. Paul Park
Robbins-dale NSP
CH
St.Anthony
CirclePines
FalconHgts
SLP
Norwood Young America
INSET
Legend
lower restrictionupper restrictionno restriction
Source: State Aidhttp://www.dot.state.mn.us/information/disclaimer.htmlMnDOT's Disclaimer on Maps and Related Data can be found @
Restricted Cities, 2021
na (North Oaks)
(5)(0)
(143)(1)
46

5 cities would receive the Low Restriction3 cities would receive the Upper Restriction
140 Cities received No RestrictionN:\MSAS\Books\2015 October Book\TenativeAdjusted Construction Needs 2015 (Old Book File A & B).xls (For sample purposes only. A restriction isn't due to be applied to the 2021 construction Needs)
Albert Lea $50,361,767 $57,714,448 14.60 $0 $0 $57,714,448 $57,714,448Albertville 14,300,947 16,608,987 16.14 0 0 16,608,987 16,608,987Alexandria 66,522,164 77,481,361 16.47 0 0 77,481,361 77,481,361Andover 69,836,181 81,943,765 17.34 0 0 81,943,765 81,943,765Anoka 34,917,501 39,736,137 13.80 0 0 39,736,137 39,736,137Apple Valley 84,896,195 98,254,533 15.73 0 0 98,254,533 98,254,533Arden Hills 12,741,131 14,734,384 15.64 0 0 14,734,384 14,734,384Austin 66,933,983 76,333,105 14.04 0 0 76,333,105 76,333,105Baxter 36,536,636 42,453,436 16.19 0 0 42,453,436 42,453,436Belle Plaine 17,167,634 19,654,869 14.49 0 0 19,654,869 19,654,869Bemidji 39,319,355 46,920,583 19.33 0 0 46,920,583 46,920,583Big Lake 18,215,822 21,077,092 15.71 0 0 21,077,092 21,077,092Blaine 107,280,587 124,526,489 16.08 0 0 124,526,489 124,526,489Bloomington 190,279,258 219,395,843 15.30 0 0 219,395,843 219,395,843Brainerd 42,941,912 48,763,200 13.56 0 0 48,763,200 48,763,200Brooklyn Center 49,120,243 56,575,940 15.18 0 0 56,575,940 56,575,940Brooklyn Park 132,170,289 153,228,046 15.93 0 0 153,228,046 153,228,046Buffalo 37,524,673 44,297,942 18.05 0 0 44,297,942 44,297,942Burnsville 107,146,428 124,123,041 15.84 0 0 124,123,041 124,123,041Byron 14,180,260 16,463,900 16.10 0 0 16,463,900 16,463,900Cambridge 35,539,289 40,723,879 14.59 0 0 40,723,879 40,723,879Champlin 41,746,169 48,165,405 15.38 0 0 48,165,405 48,165,405Chanhassen 48,428,913 55,868,583 15.36 0 0 55,868,583 55,868,583
Needs For Jan. 2022
Distribution
SAMPLE RESTRICTED NEEDS (PHASE IN) for 2022
Low bandwidth is - 5.00% points from the Statewide Average Percent of Change. State Average Percent of Change is +15.25%. (note: +15.25 - 5.00 = +10.25 ) Therefore the current Unadjusted Needs for each city must have a Percentage Change at least +10.25% from their Restricted Needs from January 2021.
Unadjusted Construction
Needs for 2022 Distribution
Percent Change
from 2021 to 2022
Lower Restriction
(10.25%)
Upper Restriction
(25.25%) No Restriction
Restricted Needs used for 2021 Distribution
47

Needs For Jan. 2022
Distribution
Unadjusted Construction
Needs for 2022 Distribution
Percent Change
from 2021 to 2022
Lower Restriction
(10.25%)
Upper Restriction
(25.25%) No Restriction
Restricted Needs used for 2021 Distribution
Chaska $45,610,650 $52,526,386 15.16 $0 $0 $52,526,386 $52,526,386Chisago City 13,585,508 15,695,987 15.53 0 0 15,695,987 15,695,987Chisholm 14,335,604 16,585,318 15.69 0 0 16,585,318 16,585,318Circle Pines 6,061,806 7,008,576 15.62 0 0 7,008,576 7,008,576Cloquet 40,247,373 46,415,962 15.33 0 0 46,415,962 46,415,962Columbia Heights 23,309,042 27,012,949 15.89 0 0 27,012,949 27,012,949Coon Rapids 105,949,279 123,165,734 16.25 0 0 123,165,734 123,165,734Corcoran 24,453,113 28,882,740 18.11 0 0 28,882,740 28,882,740Cottage Grove 75,483,478 87,612,595 16.07 0 0 87,612,595 87,612,595Crookston ** 27,800,884 28,262,203 1.66 30,650,475 0 0 28,262,203Crystal 31,150,598 36,041,726 15.70 0 0 36,041,726 36,041,726Dayton 15,637,338 18,039,972 15.36 0 0 18,039,972 18,039,972Delano ** 12,329,510 12,728,031 3.23 13,593,284 0 0 12,728,031Detroit Lakes 48,792,272 57,029,549 16.88 0 0 57,029,549 57,029,549Duluth 266,202,523 305,128,576 14.62 0 0 305,128,576 305,128,576Eagan 111,735,795 129,602,178 15.99 0 0 129,602,178 129,602,178East Bethel 41,839,343 48,253,657 15.33 0 0 48,253,657 48,253,657East Grand Forks 39,049,051 43,567,982 11.57 0 0 43,567,982 43,567,982Eden Prairie 114,792,335 132,519,854 15.44 0 0 132,519,854 132,519,854Edina 101,204,180 116,204,681 14.82 0 0 116,204,681 116,204,681Elk River 78,443,134 91,702,883 16.90 0 0 91,702,883 91,702,883Fairmont 40,343,425 46,453,422 15.14 0 0 46,453,422 46,453,422Falcon Heights 5,719,159 6,604,441 15.48 0 0 6,604,441 6,604,441Faribault 63,005,986 71,583,028 13.61 0 0 71,583,028 71,583,028Farmington 31,800,231 36,467,882 14.68 0 0 36,467,882 36,467,882Fergus Falls 57,662,793 64,798,678 12.38 0 0 64,798,678 64,798,678Forest Lake 59,580,801 69,006,279 15.82 0 0 69,006,279 69,006,279Fridley 43,886,221 50,876,143 15.93 0 0 50,876,143 50,876,143Glencoe 14,913,285 17,311,340 16.08 0 0 17,311,340 17,311,340Golden Valley 52,338,133 61,455,069 17.42 0 0 61,455,069 61,455,069Grand Rapids 50,413,922 56,675,905 12.42 0 0 56,675,905 56,675,905Ham Lake 50,424,092 58,307,152 15.63 0 0 58,307,152 58,307,152Hastings 46,861,676 54,021,973 15.28 0 0 54,021,973 54,021,973
48

Needs For Jan. 2022
Distribution
Unadjusted Construction
Needs for 2022 Distribution
Percent Change
from 2021 to 2022
Lower Restriction
(10.25%)
Upper Restriction
(25.25%) No Restriction
Restricted Needs used for 2021 Distribution
Hermantown $35,872,915 $41,576,537 15.90 $0 $0 $41,576,537 $41,576,537Hibbing 88,570,479 102,468,918 15.69 0 0 102,468,918 102,468,918Hopkins 23,492,580 27,108,902 15.39 0 0 27,108,902 27,108,902Hugo 37,255,445 43,077,452 15.63 0 0 43,077,452 43,077,452Hutchinson 43,281,149 49,123,895 13.50 0 0 49,123,895 49,123,895International Falls 13,044,022 15,061,883 15.47 0 0 15,061,883 15,061,883Inver Grove Heights 67,789,150 78,347,199 15.57 0 0 78,347,199 78,347,199Isanti 10,983,507 12,712,850 15.74 0 0 12,712,850 12,712,850Jordan 12,123,528 13,670,636 12.76 0 0 13,670,636 13,670,636Kasson 11,529,115 13,236,214 14.81 0 0 13,236,214 13,236,214La Crescent 8,957,014 10,365,697 15.73 0 0 10,365,697 10,365,697Lake City 13,196,805 15,258,202 15.62 0 0 15,258,202 15,258,202Lake Elmo 33,118,921 41,905,694 26.53 0 41,481,449 0 41,905,694Lakeville 141,122,567 171,152,123 21.28 0 0 171,152,123 171,152,123Lino Lakes 39,227,780 45,411,752 15.76 0 0 45,411,752 45,411,752Litchfield 14,893,316 16,767,219 12.58 0 0 16,767,219 16,767,219Little Canada 20,529,647 23,772,815 15.80 0 0 23,772,815 23,772,815Little Falls 37,176,695 41,145,429 10.68 0 0 41,145,429 41,145,429Mahtomedi 15,914,149 18,537,944 16.49 0 0 18,537,944 18,537,944Mankato 100,460,349 116,557,236 16.02 0 0 116,557,236 116,557,236Maple Grove 129,216,199 150,017,975 16.10 0 0 150,017,975 150,017,975Maplewood 74,092,892 84,875,943 14.55 0 0 84,875,943 84,875,943Marshall 38,247,397 44,391,275 16.06 0 0 44,391,275 44,391,275Medina 19,718,827 22,797,471 15.61 0 0 22,797,471 22,797,471Mendota Heights 28,864,859 33,045,004 14.48 0 0 33,045,004 33,045,004Minneapolis 605,447,000 683,597,240 12.91 0 0 683,597,240 683,597,240Minnetonka 104,599,792 121,479,429 16.14 0 0 121,479,429 121,479,429Minnetrista 19,487,569 22,528,944 15.61 0 0 22,528,944 22,528,944Montevideo 15,183,220 17,597,131 15.90 0 0 17,597,131 17,597,131Monticello 25,130,428 34,823,489 38.57 0 31,475,861 0 34,823,489Moorhead 132,460,543 149,131,902 12.59 0 0 149,131,902 149,131,902Morris 15,236,963 17,674,207 16.00 0 0 17,674,207 17,674,207Mound ** 14,476,721 15,749,658 8.79 15,960,585 0 0 15,749,658
49

Needs For Jan. 2022
Distribution
Unadjusted Construction
Needs for 2022 Distribution
Percent Change
from 2021 to 2022
Lower Restriction
(10.25%)
Upper Restriction
(25.25%) No Restriction
Restricted Needs used for 2021 Distribution
Mounds View $19,045,593 $22,073,466 15.90 $0 $0 $22,073,466 $22,073,466New Brighton 26,398,512 30,492,442 15.51 0 0 30,492,442 30,492,442New Hope 27,537,048 31,910,964 15.88 0 0 31,910,964 31,910,964New Prague 16,518,817 18,949,393 14.71 0 0 18,949,393 18,949,393New Ulm 35,059,384 40,366,950 15.14 0 0 40,366,950 40,366,950North Branch 43,735,985 52,478,442 19.99 0 0 52,478,442 52,478,442North Mankato 33,550,171 39,791,261 18.60 0 0 39,791,261 39,791,261North St. Paul 20,248,486 23,594,319 16.52 0 0 23,594,319 23,594,319Northfield 32,849,169 38,123,668 16.06 0 0 38,123,668 38,123,668Oak Grove 39,447,981 47,844,254 21.28 0 0 47,844,254 47,844,254Oakdale 41,425,942 48,081,485 16.07 0 0 48,081,485 48,081,485Orono 18,431,894 21,103,201 14.49 0 0 21,103,201 21,103,201Otsego 42,767,510 52,687,962 23.20 0 0 52,687,962 52,687,962Owatonna 72,563,785 83,485,818 15.05 0 0 83,485,818 83,485,818Plymouth 153,477,977 177,804,135 15.85 0 0 177,804,135 177,804,135Prior Lake 42,738,507 49,866,216 16.68 0 0 49,866,216 49,866,216Ramsey 61,828,403 71,341,956 15.39 0 0 71,341,956 71,341,956Red Wing 51,715,908 59,775,690 15.58 0 0 59,775,690 59,775,690Redwood Falls 17,656,849 20,244,072 14.65 0 0 20,244,072 20,244,072Richfield 56,466,393 65,248,416 15.55 0 0 65,248,416 65,248,416Robbinsdale 20,302,242 23,317,211 14.85 0 0 23,317,211 23,317,211Rochester 306,519,959 349,394,733 13.99 0 0 349,394,733 349,394,733Rogers 42,278,617 49,756,990 17.69 0 0 49,756,990 49,756,990Rosemount 55,603,343 64,238,717 15.53 0 0 64,238,717 64,238,717Roseville 57,984,633 67,158,151 15.82 0 0 67,158,151 67,158,151Sartell 40,729,374 47,224,934 15.95 0 0 47,224,934 47,224,934Sauk Rapids 34,722,287 38,967,331 12.23 0 0 38,967,331 38,967,331Savage 53,766,327 62,692,183 16.60 0 0 62,692,183 62,692,183Shakopee 81,296,338 97,013,097 19.33 0 0 97,013,097 97,013,097Shoreview 36,508,848 42,335,861 15.96 0 0 42,335,861 42,335,861Shorewood 17,029,194 19,776,112 16.13 0 0 19,776,112 19,776,112South St. Paul 32,295,717 44,552,829 37.95 0 40,450,386 0 44,552,829Spring Lake Park 11,100,759 12,903,177 16.24 0 0 12,903,177 12,903,177
50

Needs For Jan. 2022
Distribution
Unadjusted Construction
Needs for 2022 Distribution
Percent Change
from 2021 to 2022
Lower Restriction
(10.25%)
Upper Restriction
(25.25%) No Restriction
Restricted Needs used for 2021 Distribution
St. Anthony $13,757,118 $15,738,704 14.40 $0 $0 $15,738,704 $15,738,704St. Cloud 162,454,324 186,151,660 14.59 0 0 186,151,660 186,151,660St. Francis ** 23,267,443 22,652,355 (2.64) 25,652,356 0 0 22,652,355St. Joseph 14,656,811 16,950,450 15.65 0 0 16,950,450 16,950,450St. Louis Park 81,863,883 94,823,849 15.83 0 0 94,823,849 94,823,849St. Michael 43,868,171 50,115,466 14.24 0 0 50,115,466 50,115,466St. Paul 479,548,529 536,724,398 11.92 0 0 536,724,398 536,724,398St. Paul Park 12,129,581 13,680,903 12.79 0 0 13,680,903 13,680,903St. Peter 26,966,289 31,305,608 16.09 0 0 31,305,608 31,305,608Stewartville 7,372,111 8,522,646 15.61 0 0 8,522,646 8,522,646Stillwater 36,299,757 42,126,790 16.05 0 0 42,126,790 42,126,790Thief River Falls ** 36,974,173 40,473,523 9.46 40,764,026 0 0 40,473,523Vadnais Heights 16,935,480 19,634,816 15.94 0 0 19,634,816 19,634,816Victoria 14,273,001 16,434,321 15.14 0 0 16,434,321 16,434,321Virginia 32,233,704 37,340,307 15.84 0 0 37,340,307 37,340,307Waconia 28,811,037 33,384,405 15.87 0 0 33,384,405 33,384,405Waite Park 17,037,071 19,660,541 15.40 0 0 19,660,541 19,660,541Waseca 13,863,209 16,094,854 16.10 0 0 16,094,854 16,094,854West St. Paul 26,998,803 31,338,540 16.07 0 0 31,338,540 31,338,540White Bear Lake 39,167,500 45,398,460 15.91 0 0 45,398,460 45,398,460Willmar 63,713,567 72,741,891 14.17 0 0 72,741,891 72,741,891Winona 50,583,812 58,461,991 15.57 0 0 58,461,991 58,461,991Woodbury 138,621,920 160,501,590 15.78 0 0 160,501,590 160,501,590Worthington 22,427,741 25,803,428 15.05 0 0 25,803,428 25,803,428Wyoming 27,684,084 32,103,996 15.97 0 0 32,103,996 32,103,996Zimmerman 9,983,677 11,550,350 15.69 0 0 11,550,350 11,550,350Total $8,148,866,168 $9,391,873,362 15.25% $9,391,873,362
* on the upper restriction since Phase-in began (4 cities) 5 3 140 ** on the lower restriction since Phase-in began (5 cities) 1,243,007,194 15.57 ^ was lower restriction last year 0 15.48 ^^ was upper restriction last year
9,391,873,362MSAS\Books\2019 Oct Book\Tent Adjusted Construction Needs 2019 (Old Book File A&B)(PhaseInCalcs).xls
51

CITY
Year 1,
2014‐15
Year 2,
2015‐16
Year 3,
2016‐17
Year 4,
2017‐18
Year 5,
2018‐19
Year 6,
2019‐20
Year 7,
2020‐21
Year 8?,
2021‐22
average
annual
change
Crookston ‐39.0 ‐31.8 ‐23.3 ‐23.5 ‐21.3 ‐17.5 ‐13.8 ‐13.6 ‐3.6
Delano ‐37.2 ‐32.4 ‐26.1 ‐25.2 ‐21.2 ‐18.0 ‐14.2 ‐12.0 ‐3.6
Mound ^ ‐38.5 ‐34.1 ‐27.8 ‐22.3 ‐18.0 ‐15.0 ‐11.0 ‐6.5 ‐4.6
St. Francis ‐39.0 ‐33.3 ‐28.3 ‐22.8 ‐18.4 ‐24.0 ‐20.3 ‐17.9 ‐3.0
Thief River Falls ^ ‐38.6 ‐33.1 ‐27.8 ‐25.0 ‐18.8 ‐14.6 ‐10.1 ‐5.8 ‐4.7
^ Estimated that Mound and Thief River Falls would no longer have restricted Needs after 2021‐22
highlighted = these cities would still be restricted beyond 2021‐22
NOTE: There is no mandated restriction for 2021‐22. Restriction was run for sample purposes.
Cities with Restricted Needs Since Phase‐in started
Lower Restriction Cities, since 2014% points below the State Aid City Average
(% change has to be ‐5.0 % points under state avg for low restriction to apply)
Difference between Unadjusted Needs and Restricted Needs, 2021
CITY
Unadjusted Needs
2021‐22
Restricted Needs
2021‐22 Difference % Difference
$10.17 per
$1000
Crookston $28,262,203 $30,650,475 $2,388,272 8.5 $24,289
Delano $12,728,031 $13,593,284 $865,253 6.8 $8,800
Mound $15,749,658 $15,960,585 $210,927 1.3 $2,145
St. Francis $22,652,355 $25,652,356 $3,000,001 13.2 $30,510
Thief River Falls $40,473,523 $40,764,026 $290,503 0.7 $2,954
52

Adjustments to the Restricted Construction
Needs
53

N:MSAS\Books\2020 October Book\Excess to Low Balance Explanation.docx
EXCESS UNENCUMBERED CONSTRUCTION FUND BALANCE ADJUSTMENT
Screening Board Resolutions state:
The December 31 construction fund balance will be compared to the annual construction allotment from January of the same year. If the December 31 construction fund balance exceeds 3 times the January construction allotment, and the construction fund balance is over $1,500,000, then the negative adjustment to the Needs will be 1 times the December 31 construction fund balance. In each consecutive year the December 31 construction fund balance exceeds 3 times the January construction allotment (and the balance is over $1,500,000), the negative adjustment to the Needs will be increased to 2, 3, 4, etc. times the December 31 construction fund balance until such time the Construction Needs are adjusted to zero.
If the December 31 construction fund balance drops below 3 times the January construction allotment and subsequently increases to over 3 times, the multipliers will start over with one.
LOW BALANCE INCENTIVE
Screening Board Resolutions state:
That the amount of the Excess Unencumbered Construction Fund Balance Adjustment shall be redistributed to the Construction Needs of all municipalities whose December 31 construction fund balance is less than one times their January construction allotment of the same year. This redistribution shall be based on a city’s prorated share of its Unadjusted Construction Needs to the total Unadjusted Construction Needs of all participating cities times the total Excess Balance Adjustment.
The September 9, 2021 balance is used for this report. The final adjustment will be made using the December 31, 2021 construction fund balances.
54

N:MSAS\Books\202 October Book\Excess to Low Balance Explanation.docx
EXCESS UNENCUMBERED CONSTRUCTION FUND BALANCE ADJUSTMENT
Screening Board Resolutions:
The December 31 construction fund balance will be compared to the annual construction allotment from January of the same year. If the December 31, construction fund balance exceeds 3 times the January construction allotment, and the construction fund balance is over $1,500,000, then the negative adjustment to the Needs will be 1 times the December 31 construction fund balance. In each consecutive year the December 31 construction fund balance exceeds 3 times the January construction allotment (and the balance is over $1,500,000), the negative adjustment to the Needs will be increased to 2, 3, 4, etc. times the December 31 construction fund balance until such time the Construction Needs are adjusted to zero.
If the December 31 construction fund balance drops below 3 times the January construction allotment and subsequently increases to over 3 times, the multipliers will start over with one.
EXCESS UNENCUMBERED CONSTRUCTION FUND BALANCE ADJUSTMENT (revision)
UCFS recommendation:
The December 31 construction fund balance will be compared to the annual construction allotment from January of the same year. If the December 31 construction fund balance exceeds 3 times the January construction allotment, and the construction fund balance is over 3 times the average construction allotment for all cities excluding cities of the first class (hereinafter referred to as the adjusted average construction allotment), then the negative adjustment to the Needs will be 1 times the December 31 construction fund balance. In each consecutive year the December 31 construction fund balance exceeds 3 times the January construction allotment (and the balance is over 3 times the adjusted average construction allotment) the negative adjustment to the Needs will be increased to 2, 3, 4, etc. times the December 31 construction fund balance until such time the Construction Needs are adjusted to zero.
If the December 31 construction fund balance drops below 3 times the January construction allotment and subsequently increases to over 3 times, the multipliers will start over with one.
The adjusted average construction allotment used for this purpose shall not decrease in value from one year to the next.
A City may request an exemption from said construction fund balance in excess of said limits by submitting a City Resolution requesting an exemption based on a programmed or planned improvement. The request and resolution must be provided to and approved by the State Aid Office by December 15.
(Therefore, the balance floor for 2021 adjustment is $2,419,961)
55

N:\MSAS\BOOKS\2015 OCTOBER BOOK\TENATIVE ADJUSTED CONSTRUCTION NEEDS 2015 (OLD BOOK FILE A & B).XLSX
as of 9/9/2021
Albert Lea $766,856 $1,463,624 1.909
Albertville 335,035 701,058 2.092
Alexandria 840,940 (859,905) (1.023) $77,481,361 0.0140 $828,642
Andover 1,201,093 (78,916) (0.066) 81,943,765 0.0149 876,366
Anoka 641,245 (2,302,800) (3.591) 39,736,137 0.0072 424,967
Apple Valley 1,717,448 3,645,136 2.122
Arden Hills 290,685 (934,670) (3.215) 14,734,384 0.0027 157,580
Austin 1,300,526 2,992,507 2.301
Baxter 473,756 (493,744) (1.042) 42,453,436 0.0077 454,028
Belle Plaine 268,064 259,452 0.968 19,654,869 0.0036 210,203
Bemidji 636,864 1,270,924 1.996
Big Lake 345,668 (124,562) (0.360) 21,077,092 0.0038 225,414
Blaine 2,203,732 6,031,722 2.737
Bloomington 2,859,939 11,319,590 3.958 1 (11,319,590)
Brainerd 635,963 (2,452,166) (3.856) 48,763,200 0.0088 521,509
Brooklyn Center 1,015,969 0 0.000 56,575,940 0.0103 605,064
Brooklyn Park 2,634,030 3,586,029 1.361
Buffalo 644,191 1,700,608 2.640
Burnsville 2,062,673 3,257,638 1.579
Byron 295,551 379,568 1.284
Cambridge 589,595 0 0.000 40,723,879 0.0074 435,531
Champlin 800,073 (1,143,807) (1.430) 48,165,405 0.0087 515,116
Chanhassen 894,792 1,897,578 2.121
Chaska 897,138 0 0.000 52,526,386 0.0095 561,755
Chisago City 217,597 34,763 0.160 15,695,987 0.0028 167,864
Chisholm 215,237 (756,406) (3.514) 16,585,318 0.0030 177,375
Circle Pines 181,036 101,036 0.558 7,008,576 0.0013 74,955
Cloquet 498,579 498,015 0.999 46,415,962 0.0084 496,406
Columbia Heights 582,073 330,793 0.568 27,012,949 0.0049 288,896
Coon Rapids 2,568,160 (1,098,117) (0.428) 123,165,734 0.0223 1,317,223
Corcoran * 278,827 2,059,910 7.388 1 (2,059,910)
Cottage Grove 1,739,345 (1,056,417) (0.607) 87,612,595 0.0159 936,992
Crookston * 387,445 1,562,577 4.033 1 (1,562,577)
Crystal 689,517 (260,562) (0.378) 36,041,726 0.0065 385,456
Dayton 260,632 (1,091,809) (4.189) 18,039,972 0.0033 192,932
(using balance floor of $1,500,000)
Unadjusted Needs for 2022
Distribution
Low Balance Incentive
FactorLow Balance
Incentive
EXCESS BALANCE ADJUSTMENT REDISTRIBUTED AS LOW BALANCE INCENTIVE
Municipality
January 2021 Construction
Allotment
Unencumbered Balance Available
(90&90p acct)
Ratio between Balance &
Construction Allotment
First Year of Excess Balance
Adjustment Multiplier
Excess Balance
Adjustment
56

as of 9/9/2021
Unadjusted Needs for 2022
Distribution
Low Balance Incentive
FactorLow Balance
Incentive Municipality
January 2021 Construction
Allotment
Unencumbered Balance Available
(90&90p acct)
Ratio between Balance &
Construction Allotment
First Year of Excess Balance
Adjustment Multiplier
Excess Balance
Adjustment
Delano $222,272 ($681,261) (3.065) $12,728,031 0.0023 $136,123
Detroit Lakes 603,103 (599,877) (0.995) 57,029,549 0.0103 609,915
Duluth 3,728,742 0 0.000 $305,128,576 0.0553 3,263,265
Eagan 2,891,636 85,530 0.030 129,602,178 0.0235 1,386,059
East Bethel 591,964 519,125 0.877 48,253,657 0.0087 516,059
East Grand Forks 410,141 925,513 2.257
Eden Prairie 2,398,085 2,885,525 1.203
Edina 1,840,481 2,931,205 1.593
Elk River 1,150,330 3,929,742 3.416 1 (3,929,742)
Fairmont 544,903 (1,455,096) (2.670) 46,453,422 0.0084 496,806
Falcon Heights 147,515 453,626 3.075 No Adjustment / balance under 1.5 million
Faribault 981,853 673,770 0.686 71,583,028 0.0130 765,561
Farmington 600,051 706,092 1.177
Fergus Falls 758,811 1,106,420 1.458
Forest Lake 894,868 173,415 0.194 69,006,279 0.0125 738,003
Fridley 788,831 669,081 0.848 50,876,143 0.0092 544,106
Glencoe 256,802 (655,282) (2.552) 17,311,340 0.0031 185,140
Golden Valley 821,957 2,045,443 2.489
Grand Rapids 621,352 860,744 1.385
Ham Lake 749,888 (621,550) (0.829) 58,307,152 0.0106 623,579
Hastings 821,847 691,800 0.842 54,021,973 0.0098 577,750
Hermantown 584,751 576,262 0.985 41,576,537 0.0075 444,650
Hibbing 1,033,663 0 0.000 102,468,918 0.0186 1,095,877
Hopkins 555,658 0 0.000 27,108,902 0.0049 289,922
Hugo 602,122 602,122 1.000
Hutchinson 817,784 1,664,329 2.035
International Falls 293,186 (2,952) (0.010) 15,061,883 0.0027 161,083
Inver Grove Heights 1,234,774 227,991 0.185 78,347,199 0.0142 837,902
Isanti 207,817 (888,503) (4.275) 12,712,850 0.0023 135,960
Jordan 222,546 (868,740) (3.904) 13,670,636 0.0025 146,204
Kasson 218,961 1,379,062 6.298 No Adjustment / balance under 1.5 million
LaCrescent 171,538 519,555 3.029 No Adjustment / balance under 1.5 million
Lake City 208,396 605,257 2.904
Lake Elmo 491,328 0 0.000 41,905,694 0.0076 448,170
Lakeville 2,966,883 2,704,510 0.912 171,152,123 0.0310 1,830,424
Lino Lakes 739,609 303,964 0.411 45,411,752 0.0082 485,666
Litchfield 252,038 (795,094) (3.155) 16,767,219 0.0030 179,321
Little Canada 369,319 (1,766) (0.005) 23,772,815 0.0043 254,244
Little Falls 628,824 2,718,908 4.324 1 (2,718,908)
57

as of 9/9/2021
Unadjusted Needs for 2022
Distribution
Low Balance Incentive
FactorLow Balance
Incentive Municipality
January 2021 Construction
Allotment
Unencumbered Balance Available
(90&90p acct)
Ratio between Balance &
Construction Allotment
First Year of Excess Balance
Adjustment Multiplier
Excess Balance
Adjustment
Mahtomedi $283,066 $162,846 0.575 $18,537,944 0.0034 198,258
Mankato 1,675,807 0 0.000 $116,557,236 0.0211 $1,246,547
Maple Grove 2,351,494 429,084 0.182 150,017,975 0.0272 1,604,401
Maplewood 1,565,105 0 0.000 84,875,943 0.0154 907,725
Marshall 759,352 (2,915,531) (3.839) 44,391,275 0.0080 474,752
Medina 294,463 547,142 1.858
Mendota Heights 463,576 497,975 1.074
Minneapolis 11,358,374 7,695,555 0.678 683,597,240 0.1239 7,310,883
Minnetonka 1,863,235 1,410,644 0.757 121,479,429 0.0220 1,299,189
Minnetrista 317,285 752,755 2.372
Montevideo 292,323 219,749 0.752 17,597,131 0.0032 188,196
Monticello 471,685 (1,340,748) (2.842) 34,823,489 0.0063 372,428
Moorhead 1,998,704 1,978,129 0.990 149,131,902 0.0270 1,594,924
Morris 232,051 662,480 2.855
Mound 295,910 6,695 0.023 15,749,658 0.0029 168,438
Mounds View 408,790 0 0.000 22,073,466 0.0040 236,070
New Brighton 651,330 148,785 0.228 30,492,442 0.0055 326,108
New Hope 641,860 (778,521) (1.213) 31,910,964 0.0058 341,279
New Prague 292,487 495,718 1.695
New Ulm 706,821 642,533 0.909 40,366,950 0.0073 431,713
North Branch 575,436 2,598 0.005 52,478,442 0.0095 561,242
North Mankato 523,033 (2,325,122) (4.445) 39,791,261 0.0072 425,556
North St. Paul 399,027 (1,797,523) (4.505) 23,594,319 0.0043 252,335
Northfield 654,621 (2,467,340) (3.769) 38,123,668 0.0069 407,722
Oak Grove 510,759 841,564 1.648
Oakdale 876,778 (562,198) (0.641) 48,081,485 0.0087 514,218
Orono 286,943 316,274 1.102
Otsego 713,726 (2,910,929) (4.078) 52,687,962 0.0095 563,483
Owatonna 1,351,087 1,724,932 1.277
Plymouth 2,790,214 87,709 0.031 177,804,135 0.0322 1,901,566
Prior Lake 746,640 161,868 0.217 49,866,216 0.0090 533,305
Ramsey 1,031,914 2,092,398 2.028
Red Wing 652,610 407,012 0.624 59,775,690 0.0108 639,284
Redwood Falls 252,356 360,742 1.429
Richfield 1,173,670 (2,570,571) (2.190) 65,248,416 0.0118 697,814
Robbinsdale * 441,645 1,965,201 4.450 1 (1,965,201)
Rochester 5,271,283 11,937,690 2.265
Rogers * 607,736 2,120,967 3.490 1 (2,120,967)
Rosemount 940,244 1,489,629 1.584
58

as of 9/9/2021
Unadjusted Needs for 2022
Distribution
Low Balance Incentive
FactorLow Balance
Incentive Municipality
January 2021 Construction
Allotment
Unencumbered Balance Available
(90&90p acct)
Ratio between Balance &
Construction Allotment
First Year of Excess Balance
Adjustment Multiplier
Excess Balance
Adjustment
Roseville $1,164,834 $2,250,967 1.932
Sartell 920,248 (4,000,000) (4.347) 47,224,934 0.0086 505,058
Sauk Rapids 729,135 314,968 0.432 38,967,331 0.0071 416,745
Savage 1,359,925 (1,339,457) (0.985) 62,692,183 0.0114 670,476
Shakopee 1,455,904 2,428,247 1.668
Shoreview 797,614 (3,202,386) (4.015) 42,335,861 0.0077 452,770
Shorewood 291,504 997,252 3.421 No Adjustment / balance under 1.5 million
South Saint Paul 654,761 712,667 1.088
Spring Lake Park 217,170 217,170 1.000
St. Anthony 281,962 (1,209,263) (4.289) 15,738,704 0.0029 168,321
St Cloud 2,677,689 5,077 0.002 186,151,660 0.0337 1,990,840
St Francis 348,290 489,305 1.405
St Joseph 261,913 497,834 1.901
St Louis Park 1,247,635 1,031,819 0.827 94,823,849 0.0172 1,014,115
St Michael 709,670 21,261 0.030 50,115,466 0.0091 535,971
St Paul 9,599,431 28,988,585 3.020 1 (28,988,585)
St Paul Park 207,175 207,175 1.000
St Peter 515,090 984,467 1.911
Stewartville 177,004 515,932 2.915
Stillwater 672,071 777,468 1.157
Thief River Falls 496,856 (1,417,583) (2.853) 40,473,523 0.0073 432,853
Vadnais Heights 387,160 601,939 1.555
Victoria 314,448 1,451,127 4.615 No Adjustment / balance under 1.5 million
Virginia 438,762 1,207,846 2.753
Waconia * 490,237 1,971,424 4.021 1 (1,971,424)
Waite Park 383,693 1,213,185 3.162 No Adjustment / balance under 1.5 million
Waseca 291,769 277,318 0.950 16,094,854 0.0029 172,130
West St Paul 617,037 1,078,747 1.748
White Bear Lake 804,042 0 0.000 45,398,460 0.0082 485,524
Willmar 920,953 600,575 0.652 72,741,891 0.0132 777,954
Winona 937,585 1,814,859 1.936
Woodbury 2,505,180 (3,999,820) (1.597) 160,501,590 0.0291 1,716,520
Worthington * 484,722 2,372,745 4.895 1 (2,372,745)
Wyoming 388,421 0 0.000 32,103,996 0.0058 343,343
Zimmerman 247,739 (838,127) (3.383) 11,550,350 0.0021 123,528Total $146,115,972 $112,341,034 ($59,009,649) $5,517,641,819 1.0000 $59,009,649* would not receive negative adjustment if balance floor changed to $2,419,961
N:\MSAS\Books\2021 Oct Book\Adjusted Construction Needs (Old Book File).xlsx
59

(see Screening Board resolution on After the Fact Right-of-Way Adjustments)
19-Jul-21
Total New TotalRight-of-Way Right-of-Way Expired Right-of-WayExpenditures Expenditures Right-of-Way = Expenditures
for 2021 + for 2022 + Expenditures for 2022Municipality Allocations Allocation in 2021 AllocationsAlbert LeaAlbertvilleAlexandria $400,118 $400,118Andover 13,320 13,320AnokaApple Valley Arden HillsAustinBaxterBelle Plaine 1,224,822 1,224,822BemidjiBig LakeBlaine 5,443,699 5,443,699Bloomington * 1,542,986 $3,500 (1,366,671) 179,815Brainerd 1,255,447 (13,128) 1,242,319Brooklyn CenterBrooklyn Park 44,385 44,385Buffalo 1,550,985 (172,863) 1,378,122BurnsvilleByronCambridgeChamplin 62,348 62,348ChanhassenChaska 210,039 210,039Chisago CityChisholmCircle Pines 82,365 82,365CloquetColumbia HeightsCoon Rapids 2,469,664 2,469,664CorcoranCottage Grove 291,317 291,317CrookstonCrystal Dayton 1,181,809 1,181,809Delano 200,000 200,000Detroit Lakes 51,476 51,476Duluth 2,506,670 (37,937) 2,468,733Eagan 4,372,885 4,372,885East Bethel 774,783 (12,571) 762,212East Grand Forks 141,624 141,624Eden Prairie 1,224,689 1,224,689EdinaElk River 1,181,008 1,181,008FairmontFalcon HeightsFaribault 145,310 145,310Farmington 110,282 110,282
NEEDS ADJUSTMENT FOR RIGHT-OF WAY-ACQUISITION
60

Total New TotalRight-of-Way Right-of-Way Expired Right-of-WayExpenditures Expenditures Right-of-Way = Expenditures
for 2021 + for 2022 + Expenditures for 2022Municipality Allocations Allocation in 2021 Allocations
Fergus Falls $318,549 $318,549Forest LakeFridleyGlencoe $157,437 157,437Golden ValleyGrand Rapids 2,333,201 2,333,201Ham Lake 973,082 $231,024 ($12,559) 1,191,547HastingsHermantown 75,976 75,976HibbingHopkinsHugoHutchinsonInternational FallsInver Grove Heights 776,192 776,192IsantiJordanKasson 44,906 44,906La Crescent 25,000 25,000Lake CityLake Elmo 232,821 232,821Lakeville * 985,479 30,325 1,015,804Lino Lakes 244,162 244,162LitchfieldLittle CanadaLittle Falls 1,103,195 (615,890) 487,305MahtomediMankato 52,197 52,197Maple GroveMaplewood 2,056,960 2,056,960Marshall 302,397 302,397MedinaMendota Heights 22,146 (5,310) 16,836Minneapolis * 181,087 (181,087)MinnetonkaMinnetrista 145,293 145,293MontevideoMonticelloMoorhead 4,260,855 322,877 (45,000) 4,538,732MorrisMound Mounds ViewNew Brighton 111,812 111,812New HopeNew Prague 6,287 6,287New UlmNorth Branch 63,910 63,910North Mankato 64,226 64,226North St. Paul * 448,302 (448,302)NorthfieldOak Grove 664,568 (68,028) 596,540Oakdale 1,572,366 1,572,366OronoOtsego 1,617,268 13,799 1,631,067
61

Total New TotalRight-of-Way Right-of-Way Expired Right-of-WayExpenditures Expenditures Right-of-Way = Expenditures
for 2021 + for 2022 + Expenditures for 2022Municipality Allocations Allocation in 2021 Allocations
OwatonnaPlymouth 2,490,023 (15,000) $2,475,023Prior Lake 423,049 423,049Ramsey 207,749 207,749Red WingRedwood Falls 383,850 383,850Richfield 7,794,033 (2,650) 7,791,383RobbinsdaleRochester 2,051,644 2,051,644RogersRosemount 187,950 187,950RosevilleSartell 1,406,000 1,406,000Sauk Rapids 407,639 407,639SavageShakopeeShoreview 9,300 9,300Shorewood 22,486 22,486South St. PaulSpring Lake ParkSt AnthonySt Cloud 3,036,110 3,036,110St Francis 14,990 14,990St Joseph 230,143 230,143St Louis ParkSt MichaelSt Paul * 13,496,986 (502,263) 12,994,723St Paul Park 45,694 (45,694)St Peter 1,804,570 1,804,570StewartvilleStillwaterThief River Falls 467,865 467,865Vadnais Heights 17,096 17,096VictoriaVirginiaWaconiaWaite Park 855,017 855,017Waseca 213,261 213,261West St. PaulWhite Bear LakeWillmarWinonaWoodbury 942,597 942,597WorthingtonWyoming 16,500 16,500ZimmermanTotal $81,578,538 $838,919 ($3,514,628) $78,902,829
* more than one expenditure expired in 2021** more than one new expenditure added for 2022
MSAS\books\2021 Oct Book\Adj Construction Needs(Old Book File) ATF ROW Adj.xls
62

MUNICIPALITY PROJECT AMOUNT
Bloomington 107-130-046 $3,500Farmington 212-102-005 $110,282Glencoe 226-103-002 $157,437Ham Lake 197-124-004 $231,024Moorhead 144-115-016 $322,877Otsego 217-113-001 $13,799
TOTAL $838,919
MUNICIPALITY PROJECT AMOUNT
Bloomington 107-399-027 $1,023,658Bloomington 107-413-008 $82,734Bloomington 107-415-021 / overpayment ($78,439)Bloomington 107-415-022 $338,718Brainerd 108-124-007 $13,128Buffalo 213-117-001 $172,863Duluth 118-160-020 $37,937East Bethel 203-109-001 $12,571Ham Lake 197-107-002 $12,559Lakeville 188-101-007 / overpayment ($24,055)Lakeville 188-110-006 / overpayment ($6,270)Little Falls 136-129-003 $615,890Mendota Heights 140-105-006 $5,310Minneapolis 141-281-011 $79,964Minneapolis 141-332-009 $101,123Moorhead 144-128-010 $45,000North St. Paul 151-251-005 $143,572North St. Paul 151-257-002 $304,730Oak Grove 223-109-002 $68,028Plymouth 155-186-001 $15,000Richfield 157-108-030 $2,650St. Paul 164-128-006 $106,383St. Paul 164-288-002 $395,880St. Paul Park 184-108-001 $45,694
TOTAL $3,514,628
NEW RIGHT-OF-WAY ADJUSTMENTS FOR 2022
EXPIRED RIGHT-OF-WAY ADJUSTMENTS, 2021
63

Municipality
Retaining Wall Expenditures
for 2021 Allocations
New Retaining Wall
Expenditures for 2022
Retaining Wall Expenditures
Expired in 2021
Total Retaining Wall Adjustment
for 2022 Allocations
Albert Lea $67,342 $0 $0 $67,342Alexandria 25,633 0 0 25,633Andover 20,197 0 0 20,197Bloomington 283,112 69,517 0 352,629Brainerd 231,160 0 0 231,160Buffalo 61,252 0 0 61,252Cambridge 28,020 0 0 28,020Cloquet 81,498 0 0 81,498Crystal 42,510 0 0 42,510Detroit Lakes 0 38,304 0 38,304Duluth 3,043,689 0 0 3,043,689Eden Prairie 129,789 0 0 129,789Fergus Falls 110,360 0 0 110,360Grand Rapids 236,876 0 0 236,876Inver Grove Heights 179,003 0 0 179,003Kasson 35,640 0 0 35,640La Crescent 8,624 0 0 8,624Lakeville 118,042 0 0 118,042Marshall 514,325 0 0 514,325Minnetonka 37,913 0 0 37,913Monticello 307,791 0 0 307,791Moorhead 375,667 0 0 375,667Mounds View 13,419 0 0 13,419New Hope 32,400 0 0 32,400Oakdale 20,658 0 0 20,658Plymouth 64,144 0 0 64,144Red Wing 539,025 0 0 539,025Roseville 107,381 0 0 107,381Sartell 6,000 0 0 6,000St. Paul 51,542 0 0 51,542Thief River Falls 296,422 0 0 296,422West St. Paul 125,918 0 0 125,918Total $7,195,352 $107,821 $0 $7,303,173
MunicipalityBloomington 107-407-023 $69,517 $69,517Detroit Lakes 117-102-003 / 117-101-014 38,304 38,304Total $107,821 $107,821
AFTER THE FACT RETAINING WALL ADJUSTMENT(see Screening Board resolution on After the Fact Retaining Wall Adjustment)
Project or Route Amount Total Adjustment
NEW PROJECT LISTING OF RETAINING WALL CONSTRUCTIONrequested in 2021
N:\MSAS\Books\2021 October Book\Adj Ten Constr Needs 2021.xlsx 64

Screening Board Resolution:
Municipality
Buffalo $528,566 2031 $528,566
Cambridge $234,357 2031 $234,357
Fergus Falls $299,555 2029 $299,555
New Ulm $18,433 2030 $18,433
Moorhead $258,980 2032 $258,980
Moorhead $366,805 2032 $366,805
Total $1,706,696 $0 $0 $1,706,696
RR Bridge over MSAS Route Rehabilitation
RR Bridge over MSAS Route Construction/Reconstruction
(One city has this adjustment)
Municipality
Thief River Falls $378,684Construction/
Reconstruction 2049 $378,684Total $378,684 $378,684
Type of Construction
Expired Railroad Crossing
Expenditures
Any Railroad Crossing improvements shall not be included in the Needs Calculations until the project has been completed and the actual cost established. At that time a Construction Needs adjustment shall be made by annually adding the local cost (which is the total cost less county or trunk highway participation) to the annual Construction Needs for a 15 year period. Only State Aid eligible items are allowed to be included in this adjustment, and all Railroad Crossing Needs adjustments must be input by the city and approved by the District State Aid Engineer.
Any structure that has been rehabilitated (Minnesota Administrative Rules, CHAPTER 8820, 8820.0200 DEFINITIONS, Subp. 8. Bridge rehabilitation) shall not be included in the Needs calculations until the rehabilitation project has been completed and the actual cost established. At that time a Construction Needs adjustment shall be made by annually adding the local cost (which is the total cost less county or trunk highway participation) for a 15-year period. Only State Aid eligible items are allowed to be included in this adjustment and all structure rehabilitation Needs adjustments must be input by the city and approved by the DSAE.
Any structure that has been constructed/reconstructed (Minnesota Administrative Rules, CHAPTER 8820, 8820.0200 DEFINITIONS, Subp. 31. Reconstruction) shall not be included in the Needs calculations until the project has been completed and the actual cost established. At that time a Construction Needs adjustment shall be made by annually adding the local cost (which is the total cost less county or trunk highway participation) for a 35-year period. Only State Aid eligible items are allowed to be included in this adjustment and all structure construction/reconstruction Needs adjustments must be input by the city and approved by the District State Aid Engineer
Eligible Railroad Bridge over MSAS
Expenditures
AFTER THE FACT RAILROAD BRIDGE OVER MSAS ADJUSTMENT
New RR Bridge over MSAS
ExpendituresExpire Date
Total RR Bridge over MSAS Adjustment for 2022 Apportionment
AFTER THE FACT RAILROAD CROSSING ADJUSTMENT
Eligible Railroad Crossing
Expenditures
New Railroad Crossing
Expenditures 2021
Expire Date
Total Railroad Crossing Adjustment for 2022
Apportionment
N:\MSAS\Books\2020 January Book\RR Bridge & RR Cross Adj.xlsx
65

N:\MSAS\BOOKS\2015 OCTOBER BOOK\TENATIVE ADJUSTED CONSTRUCTION NEEDS 2015 (Old Book File).XLS
(+) (+) (+) (+)
AdjustedTotal Construction
Municipality Adjustments NeedsAlbert Lea $57,714,448 $67,342 $67,342 $57,781,790Albertville 16,608,987 0 16,608,987Alexandria 77,481,361 828,642 $400,118 25,633 425,751 77,907,112Andover 81,943,765 876,366 13,320 20,197 33,517 81,977,282Anoka 39,736,137 424,967 0 39,736,137Apple Valley 98,254,533 0 98,254,533Arden Hills 14,734,384 157,580 0 14,734,384Austin 76,333,105 0 76,333,105Baxter 42,453,436 454,028 0 42,453,436Belle Plaine 19,654,869 210,203 1,224,822 1,224,822 20,879,691Bemidji 46,920,583 0 46,920,583Big Lake 21,077,092 225,414 0 21,077,092Blaine 124,526,489 5,443,699 5,443,699 129,970,188Bloomington 219,395,843 (11,319,590) 179,815 352,629 532,444 219,928,287Brainerd 48,763,200 521,509 1,242,319 231,160 1,473,479 50,236,679Brooklyn Center 56,575,940 605,064 0 56,575,940Brooklyn Park 153,228,046 44,385 44,385 153,272,431Buffalo 44,297,942 1,378,122 61,252 $528,566 1,967,940 46,265,882Burnsville 124,123,041 0 124,123,041Byron 16,463,900 0 16,463,900Cambridge 40,723,879 435,531 28,020 234,357 262,377 40,986,256Champlin 48,165,405 515,116 62,348 62,348 48,227,753Chanhassen 55,868,583 0 55,868,583Chaska 52,526,386 561,755 210,039 210,039 52,736,425Chisago City 15,695,987 167,864 0 15,695,987Chisholm 16,585,318 177,375 0 16,585,318Circle Pines 7,008,576 74,955 82,365 82,365 7,090,941Cloquet 46,415,962 496,406 81,498 81,498 46,497,460Columbia Heights 27,012,949 288,896 0 27,012,949Coon Rapids 123,165,734 1,317,223 2,469,664 2,469,664 125,635,398Corcoran 28,882,740 (2,059,910) 0 28,882,740Cottage Grove 87,612,595 936,992 291,317 291,317 87,903,912Crookston 28,262,203 (1,562,577) 0 28,262,203Crystal 36,041,726 385,456 42,510 42,510 36,084,236Dayton 18,039,972 192,932 1,181,809 1,181,809 19,221,781Delano 12,728,031 136,123 200,000 200,000 12,928,031Detroit Lakes 57,029,549 609,915 51,476 38,304 89,780 57,119,329Duluth 305,128,576 3,263,265 2,468,733 3,043,689 5,512,422 310,640,998Eagan 129,602,178 1,386,059 4,372,885 4,372,885 133,975,063
After the Fact Retaining Wall
Adjustment
After the Fact Railroad Crossing
Adjustment
2021 ADJUSTED CONSTRUCTION NEEDS for January 2022 apportionment
Unadjusted Needs for Jan. 2022 Distribution
After the Fact Railroad
Bridge over MSAS Route
After the Fact Right of Way Adjustment
* Excess Balance Adjustment
redistributed as Low Balance Incentive
ADJUSTMENTS
66

(+) (+) (+) (+)
AdjustedTotal Construction
Municipality Adjustments Needs
After the Fact Retaining Wall
Adjustment
After the Fact Railroad Crossing
Adjustment
Unadjusted Needs for Jan. 2022 Distribution
After the Fact Railroad
Bridge over MSAS Route
After the Fact Right of Way Adjustment
* Excess Balance Adjustment
redistributed as Low Balance Incentive
East Bethel $48,253,657 $516,059 $762,212 $762,212 $49,015,869East Grand Forks 43,567,982 141,624 141,624 43,709,606Eden Prairie 132,519,854 1,224,689 $129,789 1,354,478 133,874,332Edina 116,204,681 0 116,204,681Elk River 91,702,883 (3,929,742) 1,181,008 1,181,008 92,883,891Fairmont 46,453,422 496,806 0 46,453,422Falcon Heights 6,604,441 0 6,604,441Faribault 71,583,028 765,561 145,310 145,310 71,728,338Farmington 36,467,882 110,282 110,282 36,578,164Fergus Falls 64,798,678 318,549 110,360 $299,555 728,464 65,527,142Forest Lake 69,006,279 738,003 0 69,006,279Fridley 50,876,143 544,106 0 50,876,143Glencoe 17,311,340 185,140 157,437 157,437 17,468,777Golden Valley 61,455,069 0 61,455,069Grand Rapids 56,675,905 2,333,201 $236,876 2,570,077 59,245,982Ham Lake 58,307,152 623,579 1,191,547 1,191,547 59,498,699Hastings 54,021,973 577,750 0 54,021,973Hermantown 41,576,537 444,650 75,976 75,976 41,652,513Hibbing 102,468,918 1,095,877 0 102,468,918Hopkins 27,108,902 289,922 0 27,108,902Hugo 43,077,452 0 43,077,452Hutchinson 49,123,895 0 49,123,895International Falls 15,061,883 161,083 0 15,061,883Inver Grove Heights 78,347,199 837,902 776,192 179,003 955,195 79,302,394Isanti 12,712,850 135,960 0 12,712,850Jordan 13,670,636 146,204 0 13,670,636Kasson 13,236,214 44,906 35,640 80,546 13,316,760La Crescent 10,365,697 25,000 8,624 33,624 10,399,321Lake City 15,258,202 0 15,258,202Lake Elmo 41,905,694 448,170 232,821 232,821 42,138,515Lakeville 171,152,123 1,830,424 1,015,804 118,042 1,133,846 172,285,969Lino Lakes 45,411,752 485,666 244,162 244,162 45,655,914Litchfield 16,767,219 179,321 0 16,767,219Little Canada 23,772,815 254,244 0 23,772,815Little Falls 41,145,429 (2,718,908) 487,305 487,305 41,632,734Mahtomedi 18,537,944 198,258 0 18,537,944Mankato 116,557,236 1,246,547 52,197 52,197 116,609,433Maple Grove 150,017,975 1,604,401 0 150,017,975Maplewood 84,875,943 907,725 2,056,960 2,056,960 86,932,903Marshall 44,391,275 474,752 302,397 514,325 816,722 45,207,997Medina 22,797,471 0 22,797,471Mendota Heights 33,045,004 16,836 16,836 33,061,840Minneapolis 683,597,240 7,310,883 0 683,597,240Minnetonka 121,479,429 1,299,189 37,913 37,913 121,517,342Minnetrista 22,528,944 145,293 145,293 22,674,237
67

(+) (+) (+) (+)
AdjustedTotal Construction
Municipality Adjustments Needs
After the Fact Retaining Wall
Adjustment
After the Fact Railroad Crossing
Adjustment
Unadjusted Needs for Jan. 2022 Distribution
After the Fact Railroad
Bridge over MSAS Route
After the Fact Right of Way Adjustment
* Excess Balance Adjustment
redistributed as Low Balance Incentive
Montevideo $17,597,131 $188,196 $0 $17,597,131Monticello 34,823,489 372,428 307,791 307,791 35,131,280Moorhead 149,131,902 1,594,924 4,538,732 $375,667 $625,785 5,540,184 154,672,086Morris 17,674,207 0 17,674,207Mound 15,749,658 168,438 0 15,749,658Mounds View 22,073,466 236,070 13,419 13,419 22,086,885New Brighton 30,492,442 326,108 111,812 111,812 30,604,254New Hope 31,910,964 341,279 32,400 32,400 31,943,364New Prague 18,949,393 6,287 6,287 18,955,680New Ulm 40,366,950 431,713 18,433 18,433 40,385,383North Branch 52,478,442 561,242 63,910 63,910 52,542,352North Mankato 39,791,261 425,556 64,226 64,226 39,855,487North St. Paul 23,594,319 252,335 0 23,594,319Northfield 38,123,668 407,722 0 38,123,668Oak Grove 47,844,254 596,540 596,540 48,440,794Oakdale 48,081,485 514,218 1,572,366 20,658 1,593,024 49,674,509Orono 21,103,201 0 21,103,201Otsego 52,687,962 563,483 1,631,067 1,631,067 54,319,029Owatonna 83,485,818 0 83,485,818Plymouth 177,804,135 1,901,566 2,475,023 64,144 2,539,167 180,343,302Prior Lake 49,866,216 533,305 423,049 423,049 50,289,265Ramsey 71,341,956 207,749 207,749 71,549,705Red Wing 59,775,690 639,284 539,025 539,025 60,314,715Redwood Falls 20,244,072 383,850 383,850 20,627,922Richfield 65,248,416 697,814 7,791,383 7,791,383 73,039,799Robbinsdale 23,317,211 (1,965,201) 0 23,317,211Rochester 349,394,733 2,051,644 2,051,644 351,446,377Rogers 49,756,990 (2,120,967) 0 49,756,990Rosemount 64,238,717 187,950 187,950 64,426,667Roseville 67,158,151 107,381 107,381 67,265,532Sartell 47,224,934 505,058 1,406,000 6,000 1,412,000 48,636,934Sauk Rapids 38,967,331 416,745 407,639 407,639 39,374,970Savage 62,692,183 670,476 0 62,692,183Shakopee 97,013,097 0 97,013,097Shoreview 42,335,861 452,770 9,300 9,300 42,345,161Shorewood 19,776,112 22,486 22,486 19,798,598South St. Paul 44,552,829 0 44,552,829Spring Lake Park 12,903,177 0 12,903,177St. Anthony 15,738,704 168,321 0 15,738,704St. Cloud 186,151,660 1,990,840 3,036,110 3,036,110 189,187,770St. Francis 22,652,355 14,990 14,990 22,667,345St. Joseph 16,950,450 230,143 230,143 17,180,593St. Louis Park 94,823,849 1,014,115 0 94,823,849St. Michael 50,115,466 535,971 0 50,115,466St. Paul 536,724,398 (28,988,585) 12,994,723 51,542 13,046,265 549,770,663St. Paul Park 13,680,903 0 13,680,903
68

(+) (+) (+) (+)
AdjustedTotal Construction
Municipality Adjustments Needs
After the Fact Retaining Wall
Adjustment
After the Fact Railroad Crossing
Adjustment
Unadjusted Needs for Jan. 2022 Distribution
After the Fact Railroad
Bridge over MSAS Route
After the Fact Right of Way Adjustment
* Excess Balance Adjustment
redistributed as Low Balance Incentive
St. Peter $31,305,608 $1,804,570 $1,804,570 $33,110,178Stewartville 8,522,646 0 8,522,646Stillwater 42,126,790 0 42,126,790Thief River Falls 40,473,523 432,853 $378,684 467,865 $296,422 1,142,971 41,616,494Vadnais Heights 19,634,816 17,096 17,096 19,651,912Victoria 16,434,321 0 16,434,321Virginia 37,340,307 0 37,340,307Waconia 33,384,405 (1,971,424) 0 33,384,405Waite Park 19,660,541 855,017 855,017 20,515,558Waseca 16,094,854 172,130 213,261 213,261 16,308,115West St. Paul 31,338,540 125,918 125,918 31,464,458White Bear Lake 45,398,460 485,524 0 45,398,460Willmar 72,741,891 777,954 0 72,741,891Winona 58,461,991 0 58,461,991Woodbury 160,501,590 1,716,520 942,597 942,597 161,444,187Worthington 25,803,428 (2,372,745) 0 25,803,428Wyoming 32,103,996 343,343 16,500 16,500 32,120,496Zimmerman 11,550,350 123,528 0 11,550,350State Total $9,391,873,362 ($0) $378,684 $78,902,829 $7,303,173 $1,706,696 $88,291,382 $9,480,164,744* adjustments shown as of September 2021, but are not included with total adjustments because cities are continuing to make payment requests.
N: MSAS/Books/2021 Oct Book/Adjusted Construction Needs (Old Book File).xls
69
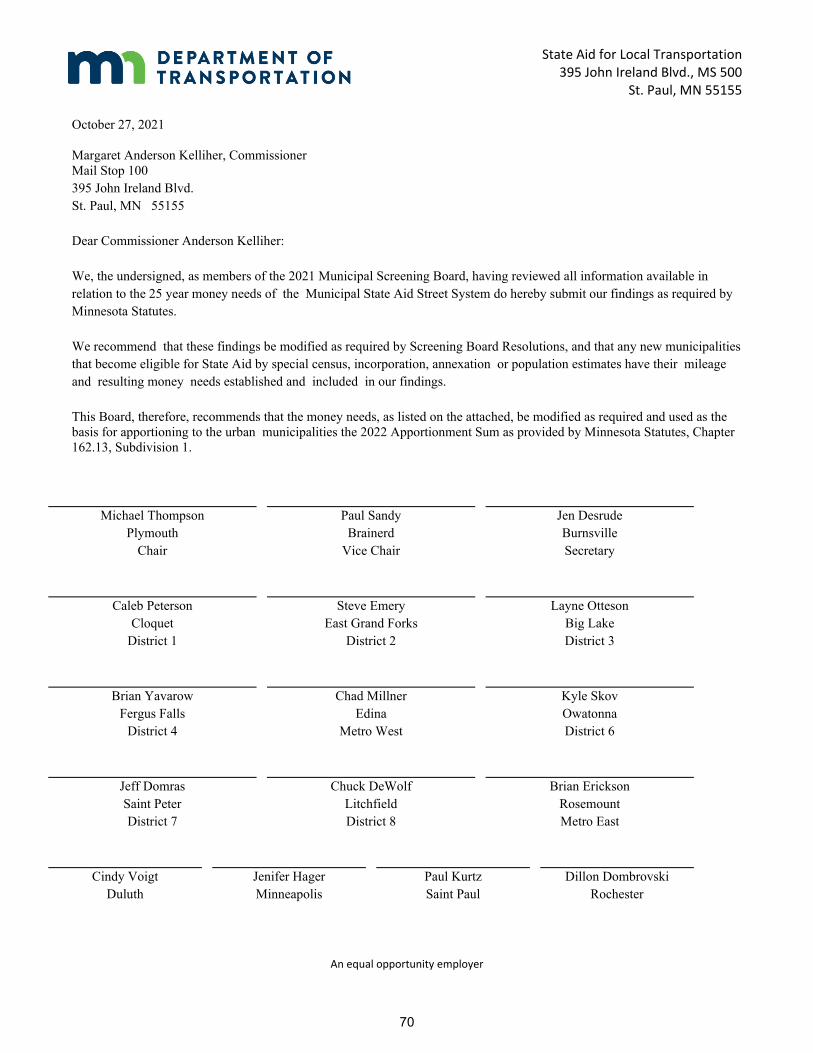
State Aid for Local Transportation 395 John Ireland Blvd., MS 500
St. Paul, MN 55155
An equal opportunity employer
October 27, 2021
Margaret Anderson Kelliher, Commissioner Mail Stop 100 395 John Ireland Blvd. St. Paul, MN 55155
Dear Commissioner Anderson Kelliher:
We, the undersigned, as members of the 2021 Municipal Screening Board, having reviewed all information available in relation to the 25 year money needs of the Municipal State Aid Street System do hereby submit our findings as required by Minnesota Statutes.
We recommend that these findings be modified as required by Screening Board Resolutions, and that any new municipalities that become eligible for State Aid by special census, incorporation, annexation or population estimates have their mileage and resulting money needs established and included in our findings.
This Board, therefore, recommends that the money needs, as listed on the attached, be modified as required and used as the basis for apportioning to the urban municipalities the 2022 Apportionment Sum as provided by Minnesota Statutes, Chapter 162.13, Subdivision 1.
Michael Thompson Plymouth
Chair
Paul Sandy Brainerd
Vice Chair
Jen Desrude Burnsville Secretary
Caleb Peterson Cloquet
District 1
Steve Emery East Grand Forks
District 2
Layne Otteson Big Lake District 3
Brian Yavarow Fergus Falls
District 4
Chad Millner Edina
Metro West
Kyle Skov Owatonna District 6
Jeff Domras Saint Peter District 7
Chuck DeWolf Litchfield District 8
Brian Erickson Rosemount Metro East
Cindy Voigt Duluth
Jenifer Hager Minneapolis
Paul Kurtz Saint Paul
Dillon Dombrovski Rochester
70

Albert Lea $57,781,790 Edina $116,204,681Albertville 16,608,987 Elk River 92,883,891Alexandria 77,907,112 Fairmont 46,453,422Andover 81,977,282 Falcon Heights 6,604,441Anoka 39,736,137 Faribault 71,728,338Apple Valley 98,254,533 Farmington 36,578,164Arden Hills 14,734,384 Fergus Falls 65,527,142Austin 76,333,105 Forest Lake 69,006,279Baxter 42,453,436 Fridley 50,876,143Belle Plaine 20,879,691 Glencoe 17,468,777Bemidji 46,920,583 Golden Valley 61,455,069Big Lake 21,077,092 Grand Rapids 59,245,982Blaine 129,970,188 Ham Lake 59,498,699Bloomington 219,928,287 Hastings 54,021,973Brainerd 50,236,679 Hermantown 41,652,513Brooklyn Center 56,575,940 Hibbing 102,468,918Brooklyn Park 153,272,431 Hopkins 27,108,902Buffalo 46,265,882 Hugo 43,077,452Burnsville 124,123,041 Hutchinson 49,123,895Byron 16,463,900 International Falls 15,061,883Cambridge 40,986,256 Inver Grove Heights 79,302,394Champlin 48,227,753 Isanti 12,712,850Chanhassen 55,868,583 Jordan 13,670,636Chaska 52,736,425 Kasson 13,316,760Chisago City 15,695,987 La Crescent 10,399,321Chisholm 16,585,318 Lake City 15,258,202Circle Pines 7,090,941 Lake Elmo 42,138,515Cloquet 46,497,460 Lakeville 172,285,969Columbia Heights 27,012,949 Lino Lakes 45,655,914Coon Rapids 125,635,398 Litchfield 16,767,219Corcoran 28,882,740 Little Canada 23,772,815Cottage Grove 87,903,912 Little Falls 41,632,734Crookston 28,262,203 Mahtomedi 18,537,944Crystal 36,084,236 Mankato 116,609,433Dayton 19,221,781 Maple Grove 150,017,975Delano 12,928,031 Maplewood 86,932,903Detroit Lakes 57,119,329 Marshall 45,207,997Duluth 310,640,998 Medina 22,797,471Eagan 133,975,063 Mendota Heights 33,061,840East Bethel 49,015,869 Minneapolis 683,597,240East Grand Forks 43,709,606 Minnetonka 121,517,342Eden Prairie 133,874,332 Minnetrista 22,674,237
2021 ADJUSTED CONSTRUCTION NEEDS
for the 2022 Distribution
Adjusted Construction Needs
Adjusted Construction NeedsMunicipality Municipality
71

Adjusted Construction Needs
Adjusted Construction NeedsMunicipality Municipality
Montevideo $17,597,131 Savage $62,692,183Monticello 35,131,280 Shakopee 97,013,097Moorhead 154,672,086 Shoreview 42,345,161Morris 17,674,207 Shorewood 19,798,598Mound 15,749,658 South St. Paul 44,552,829Mounds View 22,086,885 Spring Lake Park 12,903,177New Brighton 30,604,254 St. Anthony 15,738,704New Hope 31,943,364 St. Cloud 189,187,770New Prague 18,955,680 St. Francis 22,667,345New Ulm 40,385,383 St. Joseph 17,180,593North Branch 52,542,352 St. Louis Park 94,823,849North Mankato 39,855,487 St. Michael 50,115,466North St. Paul 23,594,319 St. Paul 549,770,663Northfield 38,123,668 St. Paul Park 13,680,903Oak Grove 48,440,794 St. Peter 33,110,178Oakdale 49,674,509 Stewartville 8,522,646Orono 21,103,201 Stillwater 42,126,790Otsego 54,319,029 Thief River Falls 41,616,494Owatonna 83,485,818 Vadnais Heights 19,651,912Plymouth 180,343,302 Victoria 16,434,321Prior Lake 50,289,265 Virginia 37,340,307Ramsey 71,549,705 Waconia 33,384,405Red Wing 60,314,715 Waite Park 20,515,558Redwood Falls 20,627,922 Waseca 16,308,115Richfield 73,039,799 West St. Paul 31,464,458Robbinsdale 23,317,211 White Bear Lake 45,398,460Rochester 351,446,377 Willmar 72,741,891Rogers 49,756,990 Winona 58,461,991Rosemount 64,426,667 Woodbury 161,444,187Roseville 67,265,532 Worthington 25,803,428Sartell 48,636,934 Wyoming 32,120,496Sauk Rapids 39,374,970 Zimmerman 11,550,350
State Total $9,480,164,744
N:\MSAS\Books\2021 Oct Book\Adj Rest Constr Needs 2020 (Old Book File A & B).xls
72
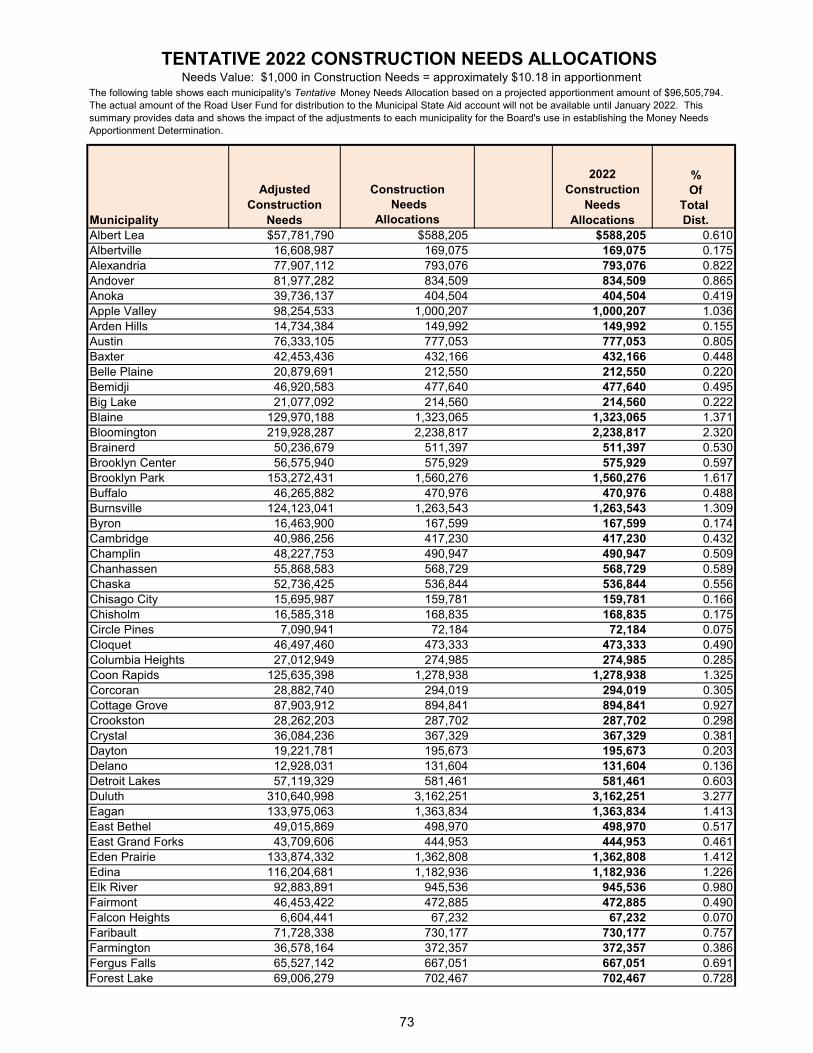
% Construction Of
Needs TotalMunicipality Allocations Dist.Albert Lea $57,781,790 $588,205 $588,205 0.610Albertville 16,608,987 169,075 169,075 0.175Alexandria 77,907,112 793,076 793,076 0.822Andover 81,977,282 834,509 834,509 0.865Anoka 39,736,137 404,504 404,504 0.419Apple Valley 98,254,533 1,000,207 1,000,207 1.036Arden Hills 14,734,384 149,992 149,992 0.155Austin 76,333,105 777,053 777,053 0.805Baxter 42,453,436 432,166 432,166 0.448Belle Plaine 20,879,691 212,550 212,550 0.220Bemidji 46,920,583 477,640 477,640 0.495Big Lake 21,077,092 214,560 214,560 0.222Blaine 129,970,188 1,323,065 1,323,065 1.371Bloomington 219,928,287 2,238,817 2,238,817 2.320Brainerd 50,236,679 511,397 511,397 0.530Brooklyn Center 56,575,940 575,929 575,929 0.597Brooklyn Park 153,272,431 1,560,276 1,560,276 1.617Buffalo 46,265,882 470,976 470,976 0.488Burnsville 124,123,041 1,263,543 1,263,543 1.309Byron 16,463,900 167,599 167,599 0.174Cambridge 40,986,256 417,230 417,230 0.432Champlin 48,227,753 490,947 490,947 0.509Chanhassen 55,868,583 568,729 568,729 0.589Chaska 52,736,425 536,844 536,844 0.556Chisago City 15,695,987 159,781 159,781 0.166Chisholm 16,585,318 168,835 168,835 0.175Circle Pines 7,090,941 72,184 72,184 0.075Cloquet 46,497,460 473,333 473,333 0.490Columbia Heights 27,012,949 274,985 274,985 0.285Coon Rapids 125,635,398 1,278,938 1,278,938 1.325Corcoran 28,882,740 294,019 294,019 0.305Cottage Grove 87,903,912 894,841 894,841 0.927Crookston 28,262,203 287,702 287,702 0.298Crystal 36,084,236 367,329 367,329 0.381Dayton 19,221,781 195,673 195,673 0.203Delano 12,928,031 131,604 131,604 0.136Detroit Lakes 57,119,329 581,461 581,461 0.603Duluth 310,640,998 3,162,251 3,162,251 3.277Eagan 133,975,063 1,363,834 1,363,834 1.413East Bethel 49,015,869 498,970 498,970 0.517East Grand Forks 43,709,606 444,953 444,953 0.461Eden Prairie 133,874,332 1,362,808 1,362,808 1.412Edina 116,204,681 1,182,936 1,182,936 1.226Elk River 92,883,891 945,536 945,536 0.980Fairmont 46,453,422 472,885 472,885 0.490Falcon Heights 6,604,441 67,232 67,232 0.070Faribault 71,728,338 730,177 730,177 0.757Farmington 36,578,164 372,357 372,357 0.386Fergus Falls 65,527,142 667,051 667,051 0.691Forest Lake 69,006,279 702,467 702,467 0.728
TENTATIVE 2022 CONSTRUCTION NEEDS ALLOCATIONS Needs Value: $1,000 in Construction Needs = approximately $10.18 in apportionment
The following table shows each municipality's Tentative Money Needs Allocation based on a projected apportionment amount of $96,505,794. The actual amount of the Road User Fund for distribution to the Municipal State Aid account will not be available until January 2022. This summary provides data and shows the impact of the adjustments to each municipality for the Board's use in establishing the Money Needs Apportionment Determination.
Adjusted Construction
Needs
2022 Construction
Needs Allocations
73

% Construction Of
Needs TotalMunicipality Allocations Dist.
Adjusted Construction
Needs
2022 Construction
Needs Allocations
Fridley $50,876,143 $517,907 $517,907 0.537Glencoe 17,468,777 177,828 177,828 0.184Golden Valley 61,455,069 625,598 625,598 0.648Grand Rapids 59,245,982 603,110 603,110 0.625Ham Lake 59,498,699 605,682 605,682 0.628Hastings 54,021,973 549,930 549,930 0.570Hermantown 41,652,513 424,013 424,013 0.439Hibbing 102,468,918 1,043,109 1,043,109 1.081Hopkins 27,108,902 275,962 275,962 0.286Hugo 43,077,452 438,518 438,518 0.454Hutchinson 49,123,895 500,069 500,069 0.518International Falls 15,061,883 153,326 153,326 0.159Inver Grove Heights 79,302,394 807,279 807,279 0.837Isanti 12,712,850 129,414 129,414 0.134Jordan 13,670,636 139,164 139,164 0.144Kasson 13,316,760 135,561 135,561 0.140La Crescent 10,399,321 105,863 105,863 0.110Lake City 15,258,202 155,325 155,325 0.161Lake Elmo 42,138,515 428,960 428,960 0.444Lakeville 172,285,969 1,753,830 1,753,830 1.817Lino Lakes 45,655,914 464,766 464,766 0.482Litchfield 16,767,219 170,686 170,686 0.177Little Canada 23,772,815 242,002 242,002 0.251Little Falls 41,632,734 423,811 423,811 0.439Mahtomedi 18,537,944 188,712 188,712 0.196Mankato 116,609,433 1,187,056 1,187,056 1.230Maple Grove 150,017,975 1,527,147 1,527,147 1.582Maplewood 86,932,903 884,956 884,956 0.917Marshall 45,207,997 460,207 460,207 0.477Medina 22,797,471 232,073 232,073 0.240Mendota Heights 33,061,840 336,562 336,562 0.349Minneapolis 683,597,240 6,958,855 6,958,855 7.211Minnetonka 121,517,342 1,237,017 1,237,017 1.282Minnetrista 22,674,237 230,818 230,818 0.239Montevideo 17,597,131 179,135 179,135 0.186Monticello 35,131,280 357,628 357,628 0.371Moorhead 154,672,086 1,574,525 1,574,525 1.632Morris 17,674,207 179,919 179,919 0.186Mound 15,749,658 160,328 160,328 0.166Mounds View 22,086,885 224,839 224,839 0.233New Brighton 30,604,254 311,544 311,544 0.323New Hope 31,943,364 325,176 325,176 0.337New Prague 18,955,680 192,964 192,964 0.200New Ulm 40,385,383 411,113 411,113 0.426North Branch 52,542,352 534,868 534,868 0.554North Mankato 39,855,487 405,719 405,719 0.420North St. Paul 23,594,319 240,184 240,184 0.249Northfield 38,123,668 388,090 388,090 0.402Oak Grove 48,440,794 493,116 493,116 0.511Oakdale 49,674,509 505,675 505,675 0.524Orono 21,103,201 214,826 214,826 0.223Otsego 54,319,029 552,955 552,955 0.573Owatonna 83,485,818 849,866 849,866 0.881Plymouth 180,343,302 1,835,851 1,835,851 1.902Prior Lake 50,289,265 511,933 511,933 0.530Ramsey 71,549,705 728,359 728,359 0.755Red Wing 60,314,715 613,989 613,989 0.636Redwood Falls 20,627,922 209,987 209,987 0.218
74

% Construction Of
Needs TotalMunicipality Allocations Dist.
Adjusted Construction
Needs
2022 Construction
Needs Allocations
Richfield $73,039,799 $743,528 $743,528 0.770Robbinsdale 23,317,211 237,364 237,364 0.246Rochester 351,446,377 3,577,639 3,577,639 3.707Rogers 49,756,990 506,514 506,514 0.525Rosemount 64,426,667 655,848 655,848 0.680Roseville 67,265,532 684,747 684,747 0.710Sartell 48,636,934 495,112 495,112 0.513Sauk Rapids 39,374,970 400,828 400,828 0.415Savage 62,692,183 638,191 638,191 0.661Shakopee 97,013,097 987,570 987,570 1.023Shoreview 42,345,161 431,064 431,064 0.447Shorewood 19,798,598 201,545 201,545 0.209South St. Paul 44,552,829 453,537 453,537 0.470Spring Lake Park 12,903,177 131,351 131,351 0.136St. Anthony 15,738,704 160,216 160,216 0.166St. Cloud 189,187,770 1,925,886 1,925,886 1.996St. Francis 22,667,345 230,748 230,748 0.239St. Joseph 17,180,593 174,893 174,893 0.181St. Louis Park 94,823,849 965,284 965,284 1.000St. Michael 50,115,466 510,163 510,163 0.529St. Paul 549,770,663 5,596,533 5,596,533 5.799St. Paul Park 13,680,903 139,268 139,268 0.144St. Peter 33,110,178 337,054 337,054 0.349Stewartville 8,522,646 86,758 86,758 0.090Stillwater 42,126,790 428,841 428,841 0.444Thief River Falls 41,616,494 423,646 423,646 0.439Vadnais Heights 19,651,912 200,052 200,052 0.207Victoria 16,434,321 167,297 167,297 0.173Virginia 37,340,307 380,115 380,115 0.394Waconia 33,384,405 339,845 339,845 0.352Waite Park 20,515,558 208,843 208,843 0.216Waseca 16,308,115 166,013 166,013 0.172West St. Paul 31,464,458 320,301 320,301 0.332White Bear Lake 45,398,460 462,145 462,145 0.479Willmar 72,741,891 740,495 740,495 0.767Winona 58,461,991 595,129 595,129 0.617Woodbury 161,444,187 1,643,463 1,643,463 1.703Worthington 25,803,428 262,673 262,673 0.272Wyoming 32,120,496 326,979 326,979 0.339Zimmerman 11,550,350 117,580 117,580 0.122State Total $9,480,164,744 $96,505,794 $0 $96,505,794 100.0000 Total Money Needs Apportionment = $96,505,794Total Construction Needs = $9,480,164,744Prorate distribution based on $96,505,794 / $9,480,164,744 = 0.010179759
Construction Needs Allocation = 0.010179759 x Construction Needs for each city
NOTE: Last year's Total "Adjusted Restricted Construction Needs" were $8,239,725,438
N:\MSAS\Books\2021 Oct Book\Construction Needs Allocations (Old Book File A & B).xls 96,505,794 100.0000
75

2021 2022 Construction Construction %
Needs Needs Increase IncreaseMunicipality Allocations Allocations (Decrease) (Decrease)Albert Lea $590,639 $588,205 ($2,434) (0.4)Albertville 167,496 169,075 1,579 0.9Alexandria 784,111 793,076 8,965 1.1Andover 818,332 834,509 16,177 2.0Anoka 408,963 404,504 (4,459) (1.1)Apple Valley 994,326 1,000,207 5,881 0.6Arden Hills 149,227 149,992 765 0.5Austin 783,948 777,053 (6,895) (0.9)Baxter 427,927 432,166 4,239 1.0Belle Plaine 215,417 212,550 (2,867) (1.3)Bemidji 460,518 477,640 17,122 3.7Big Lake 213,348 214,560 1,212 0.6Blaine 1,320,256 1,323,065 2,809 0.2Bloomington 2,249,988 2,238,817 (11,171) (0.5)Brainerd 520,358 511,397 (8,961) (1.7)Brooklyn Center 575,309 575,929 620 0.1Brooklyn Park 1,548,532 1,560,276 11,744 0.8Buffalo 464,572 470,976 6,404 1.4Burnsville 1,254,927 1,263,543 8,616 0.7Byron 166,083 167,599 1,516 0.9Cambridge 419,318 417,230 (2,088) (0.5)Champlin 489,672 490,947 1,275 0.3Chanhassen 567,212 568,729 1,517 0.3Chaska 536,664 536,844 180 0.0Chisago City 159,117 159,781 664 0.4Chisholm 167,902 168,835 933 0.6Circle Pines 71,962 72,184 222 0.3Cloquet 472,342 473,333 991 0.2Columbia Heights 273,002 274,985 1,983 0.7Coon Rapids 1,269,831 1,278,938 9,107 0.7Corcoran 286,401 294,019 7,618 2.7Cottage Grove 887,494 894,841 7,347 0.8Crookston 325,611 287,702 (37,909) (11.6)Crystal 365,342 367,329 1,987 0.5Dayton 196,990 195,673 (1,317) (0.7)Delano 146,749 131,604 (15,145) (10.3)Detroit Lakes 572,071 581,461 9,390 1.6Duluth 3,182,840 3,162,251 (20,589) (0.6)Eagan 1,359,895 1,363,834 3,939 0.3East Bethel 499,108 498,970 (138) (0.0)East Grand Forks 459,011 444,953 (14,058) (3.1)Eden Prairie 1,360,341 1,362,808 2,467 0.2Edina 1,185,330 1,182,936 (2,394) (0.2)Elk River 932,579 945,536 12,957 1.4Fairmont 472,513 472,885 372 0.1Falcon Heights 66,984 67,232 248 0.4Faribault 739,644 730,177 (9,467) (1.3)Farmington 372,453 372,357 (96) (0.0)
COMPARISON OF 2021 to 2022CONSTRUCTION NEEDS ALLOCATIONS
Average change for State Aid Cities is 0.0%
76

2021 2022 Construction Construction %
Needs Needs Increase IncreaseMunicipality Allocations Allocations (Decrease) (Decrease)Fergus Falls $683,893 $667,051 ($16,842) (2.5)Forest Lake 697,826 702,467 4,641 0.7Fridley 514,007 517,907 3,900 0.8Glencoe 174,668 177,828 3,160 1.8Golden Valley 612,998 625,598 12,600 2.1Grand Rapids 620,562 603,110 (17,452) (2.8)Ham Lake 601,977 605,682 3,705 0.6Hastings 548,856 549,930 1,074 0.2Hermantown 421,043 424,013 2,970 0.7Hibbing 1,037,360 1,043,109 5,749 0.6Hopkins 275,151 275,962 811 0.3Hugo 436,345 438,518 2,173 0.5Hutchinson 506,920 500,069 (6,851) (1.4)International Falls 152,775 153,326 551 0.4Inver Grove Heights 805,152 807,279 2,127 0.3Isanti 128,642 129,414 772 0.6Jordan 141,994 139,164 (2,830) (2.0)Kasson 135,975 135,561 (414) (0.3)La Crescent 105,301 105,863 562 0.5Lake City 154,564 155,325 761 0.5Lake Elmo 390,624 428,960 38,336 9.8Lakeville 1,665,789 1,753,830 88,041 5.3Lino Lakes 462,306 464,766 2,460 0.5Litchfield 174,434 170,686 (3,748) (2.1)Little Canada 240,449 242,002 1,553 0.6Little Falls 448,344 423,811 (24,533) (5.5)Mahtomedi 186,391 188,712 2,321 1.2Mankato 1,177,229 1,187,056 9,827 0.8Maple Grove 1,513,414 1,527,147 13,733 0.9Maplewood 891,887 884,956 (6,931) (0.8)Marshall 457,529 460,207 2,678 0.6Medina 230,952 232,073 1,121 0.5Mendota Heights 338,332 336,562 (1,770) (0.5)Minneapolis 7,093,273 6,958,855 (134,418) (1.9)Minnetonka 1,225,544 1,237,017 11,473 0.9Minnetrista 229,945 230,818 873 0.4Montevideo 177,830 179,135 1,305 0.7Monticello 297,939 357,628 59,689 20.0Moorhead 1,613,046 1,574,525 (38,521) (2.4)Morris 178,459 179,919 1,460 0.8Mound 169,555 160,328 (9,227) (5.4)Mounds View 223,224 224,839 1,615 0.7New Brighton 310,496 311,544 1,048 0.3New Hope 322,901 325,176 2,275 0.7New Prague 193,546 192,964 (582) (0.3)New Ulm 410,840 411,113 273 0.1North Branch 512,996 534,868 21,872 4.3North Mankato 393,701 405,719 12,018 3.1North Saint Paul 242,406 240,184 (2,222) (0.9)Northfield 384,738 388,090 3,352 0.9Oak Grove 469,809 493,116 23,307 5.0Oakdale 503,849 505,675 1,826 0.4Orono 215,879 214,826 (1,053) (0.5)
77

2021 2022 Construction Construction %
Needs Needs Increase IncreaseMunicipality Allocations Allocations (Decrease) (Decrease)Otsego $519,846 $552,955 $33,109 6.4Owatonna 849,886 849,866 (20) (0.0)Plymouth 1,827,489 1,835,851 8,362 0.5Prior Lake 505,519 511,933 6,414 1.3Ramsey 726,583 728,359 1,776 0.2Red Wing 612,023 613,989 1,966 0.3Redwood Falls 211,297 209,987 (1,310) (0.6)Richfield 752,635 743,528 (9,107) (1.2)Robbinsdale 237,785 237,364 (421) (0.2)Rochester 3,614,070 3,577,639 (36,431) (1.0)Rogers 495,178 506,514 11,336 2.3Rosemount 653,442 655,848 2,406 0.4Roseville 680,389 684,747 4,358 0.6Sartell 493,571 495,112 1,541 0.3Sauk Rapids 411,451 400,828 (10,623) (2.6)Savage 629,725 638,191 8,466 1.3Shakopee 952,164 987,570 35,406 3.7Shoreview 427,710 431,064 3,354 0.8Shorewood 199,714 201,545 1,831 0.9South Saint Paul 378,256 453,537 75,281 19.9Spring Lake Park 130,015 131,351 1,336 1.0Saint Anthony 161,127 160,216 (911) (0.6)Saint Cloud 1,938,267 1,925,886 (12,381) (0.6)Saint Francis 272,690 230,748 (41,942) (15.4)Saint Joseph 174,359 174,893 534 0.3Saint Louis Park 958,811 965,284 6,473 0.7Saint Michael 513,795 510,163 (3,632) (0.7)Saint Paul 5,775,280 5,596,533 (178,747) (3.1)Saint Paul Park 142,600 139,268 (3,332) (2.3)Saint Peter 336,972 337,054 82 0.0Stewartville 86,344 86,758 414 0.5Stillwater 425,152 428,841 3,689 0.9Thief River Falls 446,438 423,646 (22,792) (5.1)Vadnais Heights 198,553 200,052 1,499 0.8Victoria 167,169 167,297 128 0.1Virginia 377,529 380,115 2,586 0.7Waconia 337,442 339,845 2,403 0.7Waite Park 209,557 208,843 (714) (0.3)Waseca 164,867 166,013 1,146 0.7West St. Paul 317,692 320,301 2,609 0.8White Bear Lake 458,740 462,145 3,405 0.7Willmar 746,230 740,495 (5,735) (0.8)Winona 592,451 595,129 2,678 0.5Woodbury 1,634,616 1,643,463 8,847 0.5Worthington 262,679 262,673 (6) (0.0)Wyoming 324,436 326,979 2,543 0.8Zimmerman 116,930 117,580 650 0.6TOTAL $96,505,794 $96,505,794 $0 0.00
10147
N:\MSAS\BOOK\2021 Oct\Adjusted Constr Needs (Old Book File).xlsx
Cities Decrease Their Constuction Needs Allocation Cities Increase Their Constuction Needs Allocation
78

01-Oct-21
MunicipalityAlbert Lea $438,185 $588,205 $1,026,390 0.5318Albertville 187,103 169,075 356,178 0.1845Alexandria 339,681 793,076 1,132,757 0.5869Andover 772,510 834,509 1,607,019 0.8326Anoka 424,654 404,504 829,158 0.4296Apple Valley 1,335,833 1,000,207 2,336,040 1.2103Arden Hills 235,514 149,992 385,506 0.1997Austin 620,217 777,053 1,397,270 0.7239Baxter 204,069 432,166 636,235 0.3296Belle Plaine 175,231 212,550 387,781 0.2009Bemidji 345,344 477,640 822,984 0.4264Big Lake 276,910 214,560 491,470 0.2546Blaine 1,663,974 1,323,065 2,987,039 1.5476Bloomington 2,132,323 2,238,817 4,371,140 2.2647Brainerd 341,103 511,397 852,500 0.4417Brooklyn Center 800,495 575,929 1,376,424 0.7131Brooklyn Park 2,049,175 1,560,276 3,609,451 1.8701Buffalo 383,115 470,976 854,091 0.4425Burnsville 1,524,050 1,263,543 2,787,593 1.4443Byron 149,569 167,599 317,168 0.1643Cambridge 227,741 417,230 644,971 0.3342Champlin 566,782 490,947 1,057,729 0.5480Chanhassen 614,838 568,729 1,183,567 0.6132Chaska 658,983 536,844 1,195,827 0.6196Chisago City 131,702 159,781 291,483 0.1510Chisholm 118,479 168,835 287,314 0.1489Circle Pines 119,072 72,184 191,256 0.0991Cloquet 297,810 473,333 771,143 0.3995Columbia Heights 520,670 274,985 795,655 0.4122Coon Rapids 1,507,036 1,278,938 2,785,974 1.4434Corcoran 146,559 294,019 440,578 0.2283Cottage Grove 920,325 894,841 1,815,166 0.9404Crookston 177,293 287,702 464,995 0.2409Crystal 552,825 367,329 920,154 0.4767Dayton 172,080 195,673 367,753 0.1905Delano 153,644 131,604 285,248 0.1478Detroit Lakes 233,855 581,461 815,316 0.4224Duluth 2,054,364 3,162,251 5,216,615 2.7027Eagan 1,631,582 1,363,834 2,995,416 1.5519East Bethel 279,280 498,970 778,250 0.4032East Grand Forks 217,434 444,953 662,387 0.3432Eden Prairie 1,521,230 1,362,808 2,884,038 1.4942Edina 1,267,589 1,182,936 2,450,525 1.2696Elk River 612,184 945,536 1,557,720 0.8071Fairmont 248,499 472,885 721,384 0.3738
TENTATIVE 2022 MSAS TOTAL ALLOCATIONSAllocations are tentative. The actual revenue will be announced
2022 Construction Needs Allocations
2022 Total Allocations
in January 2022 when the Commissioner of Transportation determines the annual allotments.
2022 Population Allocations
Distribution Percentage
79
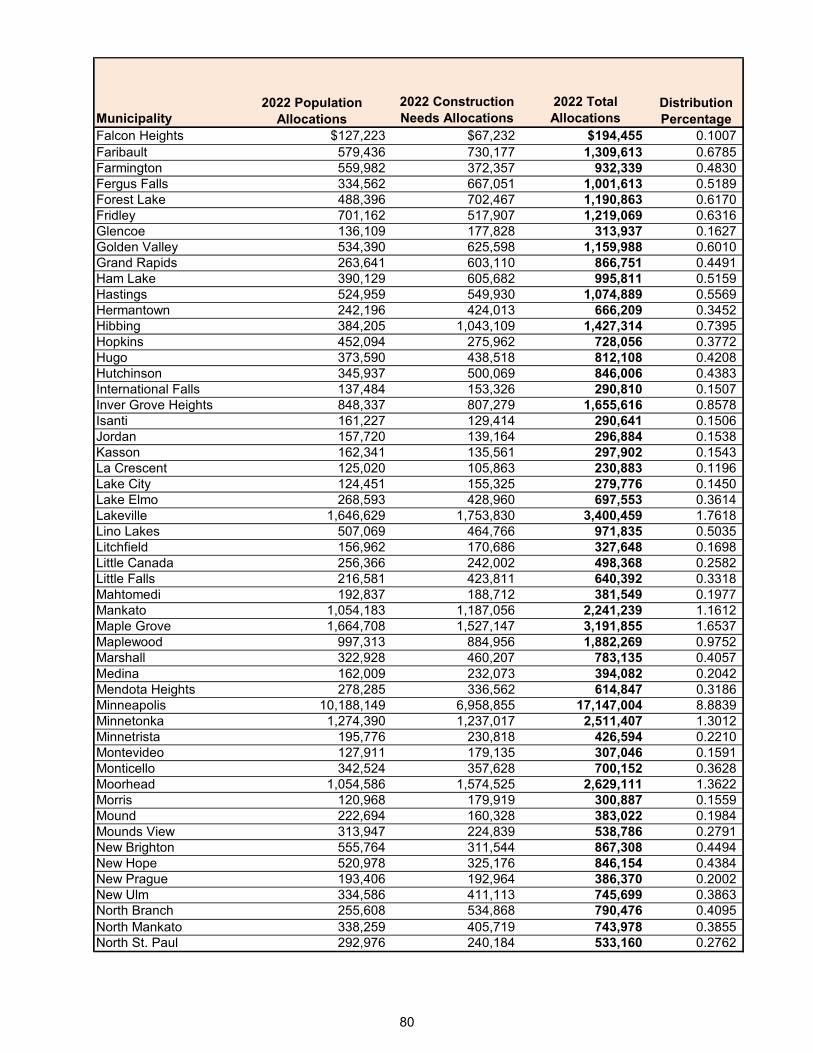
Municipality2022 Construction Needs Allocations
2022 Total Allocations
2022 Population Allocations
Distribution Percentage
Falcon Heights $127,223 $67,232 $194,455 0.1007Faribault 579,436 730,177 1,309,613 0.6785Farmington 559,982 372,357 932,339 0.4830Fergus Falls 334,562 667,051 1,001,613 0.5189Forest Lake 488,396 702,467 1,190,863 0.6170Fridley 701,162 517,907 1,219,069 0.6316Glencoe 136,109 177,828 313,937 0.1627Golden Valley 534,390 625,598 1,159,988 0.6010Grand Rapids 263,641 603,110 866,751 0.4491Ham Lake 390,129 605,682 995,811 0.5159Hastings 524,959 549,930 1,074,889 0.5569Hermantown 242,196 424,013 666,209 0.3452Hibbing 384,205 1,043,109 1,427,314 0.7395Hopkins 452,094 275,962 728,056 0.3772Hugo 373,590 438,518 812,108 0.4208Hutchinson 345,937 500,069 846,006 0.4383International Falls 137,484 153,326 290,810 0.1507Inver Grove Heights 848,337 807,279 1,655,616 0.8578Isanti 161,227 129,414 290,641 0.1506Jordan 157,720 139,164 296,884 0.1538Kasson 162,341 135,561 297,902 0.1543La Crescent 125,020 105,863 230,883 0.1196Lake City 124,451 155,325 279,776 0.1450Lake Elmo 268,593 428,960 697,553 0.3614Lakeville 1,646,629 1,753,830 3,400,459 1.7618Lino Lakes 507,069 464,766 971,835 0.5035Litchfield 156,962 170,686 327,648 0.1698Little Canada 256,366 242,002 498,368 0.2582Little Falls 216,581 423,811 640,392 0.3318Mahtomedi 192,837 188,712 381,549 0.1977Mankato 1,054,183 1,187,056 2,241,239 1.1612Maple Grove 1,664,708 1,527,147 3,191,855 1.6537Maplewood 997,313 884,956 1,882,269 0.9752Marshall 322,928 460,207 783,135 0.4057Medina 162,009 232,073 394,082 0.2042Mendota Heights 278,285 336,562 614,847 0.3186Minneapolis 10,188,149 6,958,855 17,147,004 8.8839Minnetonka 1,274,390 1,237,017 2,511,407 1.3012Minnetrista 195,776 230,818 426,594 0.2210Montevideo 127,911 179,135 307,046 0.1591Monticello 342,524 357,628 700,152 0.3628Moorhead 1,054,586 1,574,525 2,629,111 1.3622Morris 120,968 179,919 300,887 0.1559Mound 222,694 160,328 383,022 0.1984Mounds View 313,947 224,839 538,786 0.2791New Brighton 555,764 311,544 867,308 0.4494New Hope 520,978 325,176 846,154 0.4384New Prague 193,406 192,964 386,370 0.2002New Ulm 334,586 411,113 745,699 0.3863North Branch 255,608 534,868 790,476 0.4095North Mankato 338,259 405,719 743,978 0.3855North St. Paul 292,976 240,184 533,160 0.2762
80

Municipality2022 Construction Needs Allocations
2022 Total Allocations
2022 Population Allocations
Distribution Percentage
Northfield $492,638 $388,090 $880,728 0.4563Oak Grove 211,581 493,116 704,697 0.3651Oakdale 670,665 505,675 1,176,340 0.6095Orono 197,031 214,826 411,857 0.2134Otsego 473,112 552,955 1,026,067 0.5316Owatonna 626,046 849,866 1,475,912 0.7647Plymouth 1,919,984 1,835,851 3,755,835 1.9459Prior Lake 654,410 511,933 1,166,343 0.6043Ramsey 655,097 728,359 1,383,456 0.7168Red Wing 392,096 613,989 1,006,085 0.5213Redwood Falls 120,897 209,987 330,884 0.1714Richfield 876,606 743,528 1,620,134 0.8394Robbinsdale 347,050 237,364 584,414 0.3028Rochester 2,876,565 3,577,639 6,454,204 3.3439Rogers 315,037 506,514 821,551 0.4256Rosemount 607,800 655,848 1,263,648 0.6547Roseville 859,071 684,747 1,543,818 0.7999Sartell 458,539 495,112 953,651 0.4941Sauk Rapids 328,473 400,828 729,301 0.3779Savage 769,288 638,191 1,407,479 0.7292Shakopee 1,035,464 987,570 2,023,034 1.0481Shoreview 637,917 431,064 1,068,981 0.5538Shorewood 184,425 201,545 385,970 0.2000South St. Paul 491,903 453,537 945,440 0.4898Spring Lake Park 170,326 131,351 301,677 0.1563St. Anthony 219,353 160,216 379,569 0.1967St. Cloud 1,632,198 1,925,886 3,558,084 1.8435St. Francis 192,932 230,748 423,680 0.2195St. Joseph 166,559 174,893 341,452 0.1769St. Louis Park 1,185,032 965,284 2,150,316 1.1141St. Michael 432,095 510,163 942,258 0.4882St. Paul 7,381,914 5,596,533 12,978,447 6.7242St. Paul Park 131,370 139,268 270,638 0.1402St. Peter 285,915 337,054 622,969 0.3228Stewartville 158,455 86,758 245,213 0.1270Stillwater 459,558 428,841 888,399 0.4603Thief River Falls 207,315 423,646 630,961 0.3269Vadnais Heights 305,962 200,052 506,014 0.2622Victoria 249,897 167,297 417,194 0.2161Virginia 199,543 380,115 579,658 0.3003Waconia 308,829 339,845 648,674 0.3361Waite Park 197,648 208,843 406,491 0.2106Waseca 218,690 166,013 384,703 0.1993West St. Paul 488,491 320,301 808,792 0.4190White Bear Lake 589,625 462,145 1,051,770 0.5449Willmar 497,969 740,495 1,238,464 0.6417Winona 614,861 595,129 1,209,990 0.6269Woodbury 1,779,609 1,643,463 3,423,072 1.7735Worthington 330,487 262,673 593,160 0.3073Wyoming 190,326 326,979 517,305 0.2680Zimmerman 146,654 117,580 264,234 0.1369Total $96,505,795 $96,505,794 $193,011,589 100.0000N/MSAS/Books/2021 Oct Book/Adjusted Construction Needs (Old Book File A & B).xlsx
81

10/1/2021
Increase %2021 Total 2022 Total (Decrease) Increase
Municipality Allocations Allocations Amount (Decrease)
Albert Lea $1,022,475 $1,026,390 $3,915 0.4Albertville 346,570 356,178 9,608 2.8Alexandria 1,121,254 1,132,757 11,503 1.0Andover 1,601,458 1,607,019 5,561 0.3Anoka 854,994 829,158 (25,836) (3.0)Apple Valley 2,289,931 2,336,040 46,109 2.0Arden Hills 387,580 385,506 (2,074) (0.5)Austin 1,395,526 1,397,270 1,744 0.1Baxter 631,675 636,235 4,560 0.7Belle Plaine 388,085 387,781 (304) (0.1)Bemidji 849,152 822,984 (26,168) (3.1)Big Lake 488,450 491,470 3,020 0.6Blaine 2,938,309 2,987,039 48,730 1.7Bloomington 4,399,906 4,371,140 (28,766) (0.7)Brainerd 847,951 852,500 4,549 0.5Brooklyn Center 1,354,625 1,376,424 21,799 1.6Brooklyn Park 3,512,040 3,609,451 97,411 2.8Buffalo 858,922 854,091 (4,831) (0.6)Burnsville 2,750,231 2,787,593 37,362 1.4Byron 307,671 317,168 9,497 3.1Cambridge 639,595 644,971 5,376 0.8Champlin 1,066,764 1,057,729 (9,035) (0.8)Chanhassen 1,193,056 1,183,567 (9,489) (0.8)Chaska 1,196,184 1,195,827 (357) (0.0)Chisago City 290,130 291,483 1,353 0.5Chisholm 286,983 287,314 331 0.1Circle Pines 192,496 191,256 (1,240) (0.6)Cloquet 767,044 771,143 4,099 0.5Columbia Heights 776,097 795,655 19,558 2.5Coon Rapids 2,793,310 2,785,974 (7,336) (0.3)Corcoran 428,965 440,578 11,613 2.7Cottage Grove 1,787,630 1,815,166 27,536 1.5Crookston 516,594 464,995 (51,599) (10.0)Crystal 919,356 920,154 798 0.1Dayton 347,509 367,753 20,244 5.8Delano 296,363 285,248 (11,115) (3.8)Detroit Lakes 804,137 815,316 11,179 1.4Duluth 5,262,142 5,216,615 (45,527) (0.9)Eagan 3,008,718 2,995,416 (13,302) (0.4)East Bethel 789,285 778,250 (11,035) (1.4)East Grand Forks 670,809 662,387 (8,422) (1.3)Eden Prairie 2,898,085 2,884,038 (14,047) (0.5)Edina 2,453,975 2,450,525 (3,450) (0.1)Elk River 1,533,773 1,557,720 23,947 1.6Fairmont 726,537 721,384 (5,153) (0.7)Falcon Heights 196,687 194,455 (2,232) (1.1)Faribault 1,309,138 1,309,613 475 0.0Farmington 923,156 932,339 9,183 1.0
COMPARISON OF THE 2021 AND2022 TENTATIVE TOTAL ALLOCATIONS
82
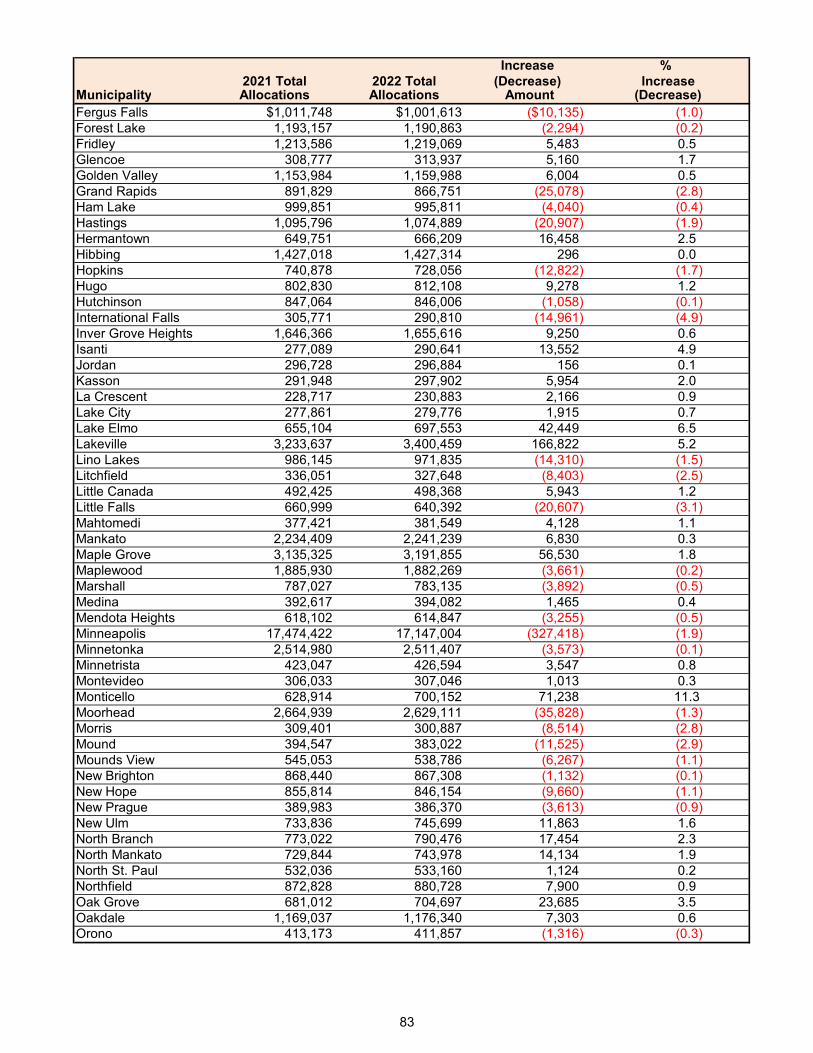
Increase %2021 Total 2022 Total (Decrease) Increase
Municipality Allocations Allocations Amount (Decrease)Fergus Falls $1,011,748 $1,001,613 ($10,135) (1.0)Forest Lake 1,193,157 1,190,863 (2,294) (0.2)Fridley 1,213,586 1,219,069 5,483 0.5Glencoe 308,777 313,937 5,160 1.7Golden Valley 1,153,984 1,159,988 6,004 0.5Grand Rapids 891,829 866,751 (25,078) (2.8)Ham Lake 999,851 995,811 (4,040) (0.4)Hastings 1,095,796 1,074,889 (20,907) (1.9)Hermantown 649,751 666,209 16,458 2.5Hibbing 1,427,018 1,427,314 296 0.0Hopkins 740,878 728,056 (12,822) (1.7)Hugo 802,830 812,108 9,278 1.2Hutchinson 847,064 846,006 (1,058) (0.1)International Falls 305,771 290,810 (14,961) (4.9)Inver Grove Heights 1,646,366 1,655,616 9,250 0.6Isanti 277,089 290,641 13,552 4.9Jordan 296,728 296,884 156 0.1Kasson 291,948 297,902 5,954 2.0La Crescent 228,717 230,883 2,166 0.9Lake City 277,861 279,776 1,915 0.7Lake Elmo 655,104 697,553 42,449 6.5Lakeville 3,233,637 3,400,459 166,822 5.2Lino Lakes 986,145 971,835 (14,310) (1.5)Litchfield 336,051 327,648 (8,403) (2.5)Little Canada 492,425 498,368 5,943 1.2Little Falls 660,999 640,392 (20,607) (3.1)Mahtomedi 377,421 381,549 4,128 1.1Mankato 2,234,409 2,241,239 6,830 0.3Maple Grove 3,135,325 3,191,855 56,530 1.8Maplewood 1,885,930 1,882,269 (3,661) (0.2)Marshall 787,027 783,135 (3,892) (0.5)Medina 392,617 394,082 1,465 0.4Mendota Heights 618,102 614,847 (3,255) (0.5)Minneapolis 17,474,422 17,147,004 (327,418) (1.9)Minnetonka 2,514,980 2,511,407 (3,573) (0.1)Minnetrista 423,047 426,594 3,547 0.8Montevideo 306,033 307,046 1,013 0.3Monticello 628,914 700,152 71,238 11.3Moorhead 2,664,939 2,629,111 (35,828) (1.3)Morris 309,401 300,887 (8,514) (2.8)Mound 394,547 383,022 (11,525) (2.9)Mounds View 545,053 538,786 (6,267) (1.1)New Brighton 868,440 867,308 (1,132) (0.1)New Hope 855,814 846,154 (9,660) (1.1)New Prague 389,983 386,370 (3,613) (0.9)New Ulm 733,836 745,699 11,863 1.6North Branch 773,022 790,476 17,454 2.3North Mankato 729,844 743,978 14,134 1.9North St. Paul 532,036 533,160 1,124 0.2Northfield 872,828 880,728 7,900 0.9Oak Grove 681,012 704,697 23,685 3.5Oakdale 1,169,037 1,176,340 7,303 0.6Orono 413,173 411,857 (1,316) (0.3)
83

Increase %2021 Total 2022 Total (Decrease) Increase
Municipality Allocations Allocations Amount (Decrease)Otsego $951,635 $1,026,067 $74,432 7.8Owatonna 1,476,587 1,475,912 (675) (0.0)Plymouth 3,720,286 3,755,835 35,549 1.0Prior Lake 1,148,677 1,166,343 17,666 1.5Ramsey 1,375,886 1,383,456 7,570 0.6Red Wing 1,004,015 1,006,085 2,070 0.2Redwood Falls 336,475 330,884 (5,591) (1.7)Richfield 1,633,670 1,620,134 (13,536) (0.8)Robbinsdale 588,860 584,414 (4,446) (0.8)Rochester 6,471,283 6,454,204 (17,079) (0.3)Rogers 810,315 821,551 11,236 1.4Rosemount 1,253,659 1,263,648 9,989 0.8Roseville 1,553,112 1,543,818 (9,294) (0.6)Sartell 948,628 953,651 5,023 0.5Sauk Rapids 750,690 729,301 (21,389) (2.8)Savage 1,397,680 1,407,479 9,799 0.7Shakopee 1,941,206 2,023,034 81,828 4.2Shoreview 1,063,485 1,068,981 5,496 0.5Shorewood 388,672 385,970 (2,702) (0.7)South St. Paul 873,015 945,440 72,425 8.3Spring Lake Park 289,560 301,677 12,117 4.2St. Anthony 375,950 379,569 3,619 1.0St. Cloud 3,570,252 3,558,084 (12,168) (0.3)St. Francis 464,387 423,680 (40,707) (8.8)St. Joseph 349,218 341,452 (7,766) (2.2)St. Louis Park 2,145,670 2,150,316 4,646 0.2St. Michael 946,227 942,258 (3,969) (0.4)St. Paul 13,299,431 12,978,447 (320,984) (2.4)St. Paul Park 276,233 270,638 (5,595) (2.0)St. Peter 623,553 622,969 (584) (0.1)Stewartville 236,005 245,213 9,208 3.9Stillwater 896,095 888,399 (7,696) (0.9)Thief River Falls 662,475 630,961 (31,514) (4.8)Vadnais Heights 516,214 506,014 (10,200) (2.0)Victoria 419,264 417,194 (2,070) (0.5)Virginia 585,016 579,658 (5,358) (0.9)Waconia 653,650 648,674 (4,976) (0.8)Waite Park 395,348 406,491 11,143 2.8Waseca 389,026 384,703 (4,323) (1.1)West St. Paul 822,716 808,792 (13,924) (1.7)White Bear Lake 1,072,056 1,051,770 (20,286) (1.9)Willmar 1,227,938 1,238,464 10,526 0.9Winona 1,250,113 1,209,990 (40,123) (3.2)Woodbury 3,340,240 3,423,072 82,832 2.5Worthington 584,722 593,160 8,438 1.4Wyoming 517,895 517,305 (590) (0.1)Zimmerman 256,874 264,234 7,360 2.9Total $193,011,589 $193,011,589 $0 0.0
7771
N:\MSAS\Books\2020 Jan Book\Adjusted Construction Needs (Old Book File A & B).xls
Cities Decreased Their Total AllocationCities Increased Their Total Allocation
84
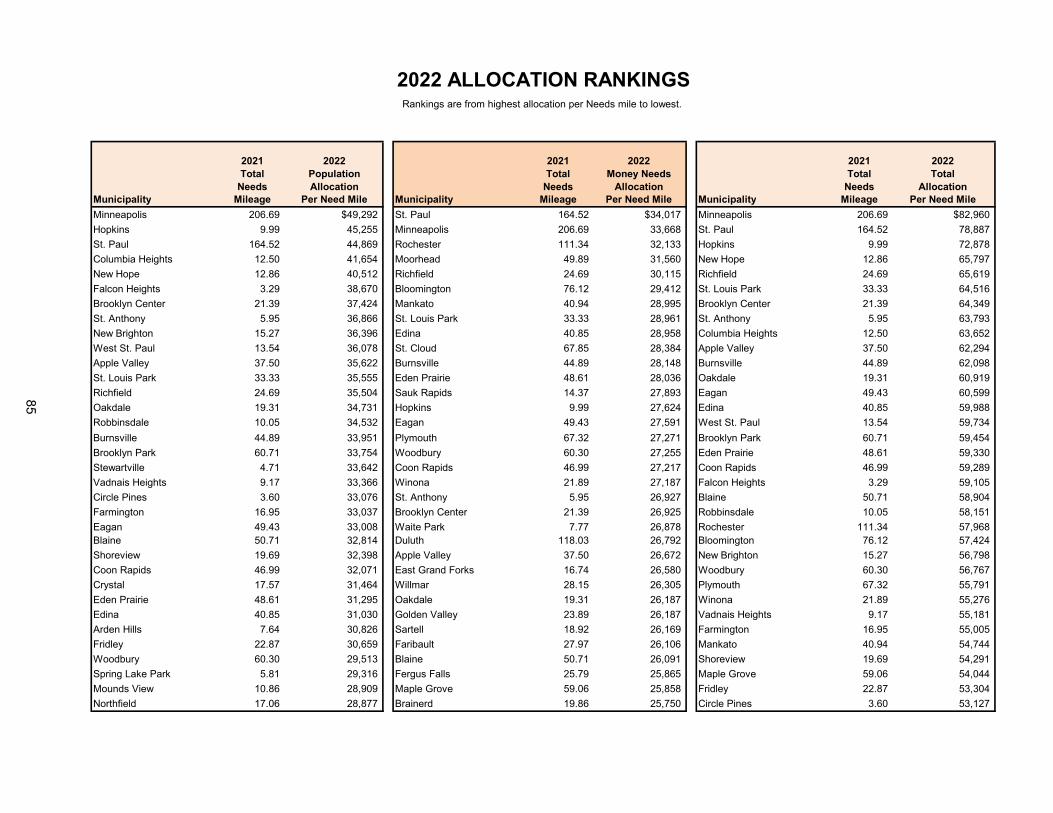
2021 2022 2021 2022 2021 2022Total Population Total Money Needs Total Total
Needs Allocation Needs Allocation Needs AllocationMunicipality Mileage Per Need Mile Municipality Mileage Per Need Mile Municipality Mileage Per Need Mile
Minneapolis 206.69 $49,292 St. Paul 164.52 $34,017 Minneapolis 206.69 $82,960
Hopkins 9.99 45,255 Minneapolis 206.69 33,668 St. Paul 164.52 78,887
St. Paul 164.52 44,869 Rochester 111.34 32,133 Hopkins 9.99 72,878
Columbia Heights 12.50 41,654 Moorhead 49.89 31,560 New Hope 12.86 65,797
New Hope 12.86 40,512 Richfield 24.69 30,115 Richfield 24.69 65,619
Falcon Heights 3.29 38,670 Bloomington 76.12 29,412 St. Louis Park 33.33 64,516
Brooklyn Center 21.39 37,424 Mankato 40.94 28,995 Brooklyn Center 21.39 64,349
St. Anthony 5.95 36,866 St. Louis Park 33.33 28,961 St. Anthony 5.95 63,793
New Brighton 15.27 36,396 Edina 40.85 28,958 Columbia Heights 12.50 63,652
West St. Paul 13.54 36,078 St. Cloud 67.85 28,384 Apple Valley 37.50 62,294
Apple Valley 37.50 35,622 Burnsville 44.89 28,148 Burnsville 44.89 62,098
St. Louis Park 33.33 35,555 Eden Prairie 48.61 28,036 Oakdale 19.31 60,919
Richfield 24.69 35,504 Sauk Rapids 14.37 27,893 Eagan 49.43 60,599
Oakdale 19.31 34,731 Hopkins 9.99 27,624 Edina 40.85 59,988
Robbinsdale 10.05 34,532 Eagan 49.43 27,591 West St. Paul 13.54 59,734
Burnsville 44.89 33,951 Plymouth 67.32 27,271 Brooklyn Park 60.71 59,454
Brooklyn Park 60.71 33,754 Woodbury 60.30 27,255 Eden Prairie 48.61 59,330
Stewartville 4.71 33,642 Coon Rapids 46.99 27,217 Coon Rapids 46.99 59,289
Vadnais Heights 9.17 33,366 Winona 21.89 27,187 Falcon Heights 3.29 59,105
Circle Pines 3.60 33,076 St. Anthony 5.95 26,927 Blaine 50.71 58,904
Farmington 16.95 33,037 Brooklyn Center 21.39 26,925 Robbinsdale 10.05 58,151
Eagan 49.43 33,008 Waite Park 7.77 26,878 Rochester 111.34 57,968Blaine 50.71 32,814 Duluth 118.03 26,792 Bloomington 76.12 57,424
Shoreview 19.69 32,398 Apple Valley 37.50 26,672 New Brighton 15.27 56,798
Coon Rapids 46.99 32,071 East Grand Forks 16.74 26,580 Woodbury 60.30 56,767
Crystal 17.57 31,464 Willmar 28.15 26,305 Plymouth 67.32 55,791
Eden Prairie 48.61 31,295 Oakdale 19.31 26,187 Winona 21.89 55,276
Edina 40.85 31,030 Golden Valley 23.89 26,187 Vadnais Heights 9.17 55,181
Arden Hills 7.64 30,826 Sartell 18.92 26,169 Farmington 16.95 55,005
Fridley 22.87 30,659 Faribault 27.97 26,106 Mankato 40.94 54,744
Woodbury 60.30 29,513 Blaine 50.71 26,091 Shoreview 19.69 54,291
Spring Lake Park 5.81 29,316 Fergus Falls 25.79 25,865 Maple Grove 59.06 54,044
Mounds View 10.86 28,909 Maple Grove 59.06 25,858 Fridley 22.87 53,304
Northfield 17.06 28,877 Brainerd 19.86 25,750 Circle Pines 3.60 53,127
2022 ALLOCATION RANKINGSRankings are from highest allocation per Needs mile to lowest.
85

2021 2022 2021 2022 2021 2022Total Population Total Money Needs Total Total
Needs Allocation Needs Allocation Needs AllocationMunicipality Mileage Per Need Mile Municipality Mileage Per Need Mile Municipality Mileage Per Need Mile
Chaska 22.94 $28,726 Brooklyn Park 60.71 $25,700 Champlin 20.07 $52,702
Plymouth 67.32 28,520 Hutchinson 19.52 25,618 Moorhead 49.89 52,698
Victoria 8.77 28,495 Austin 30.41 25,553 St. Cloud 67.85 52,440
Waseca 7.71 28,364 New Hope 12.86 25,286 Crystal 17.57 52,371
Champlin 20.07 28,240 Chanhassen 22.76 24,988 Waite Park 7.77 52,315
Maple Grove 59.06 28,187 Thief River Falls 17.01 24,906 Chaska 22.94 52,128
White Bear Lake 20.94 28,158 North Mankato 16.33 24,845 Stewartville 4.71 52,062
Winona 21.89 28,089 Crookston 11.58 24,845 Chanhassen 22.76 52,002
Worthington 11.78 28,055 Baxter 17.47 24,738 Spring Lake Park 5.81 51,924
Mound 7.94 28,047 Red Wing 24.86 24,698 Northfield 17.06 51,625
Bloomington 76.12 28,013 Cambridge 16.93 24,644 Maplewood 36.68 51,316
Savage 27.50 27,974 Owatonna 34.64 24,534 Savage 27.50 51,181
Roseville 31.58 27,203 Champlin 20.07 24,462 Sauk Rapids 14.37 50,752
Maplewood 36.68 27,190 Anoka 16.56 24,427 Arden Hills 7.64 50,459
Prior Lake 24.08 27,176 Hastings 22.61 24,322 Sartell 18.92 50,404
Chanhassen 22.76 27,014 Monticello 14.73 24,279 Worthington 11.78 50,353
Jordan 6.10 25,856 Buffalo 19.41 24,265 White Bear Lake 20.94 50,228
Rochester 111.34 25,836 Albert Lea 24.31 24,196 Anoka 16.56 50,070
Mankato 40.94 25,749 Marshall 19.07 24,133 Waseca 7.71 49,897
North St. Paul 11.39 25,722 Maplewood 36.68 24,126 Mounds View 10.86 49,612
Anoka 16.56 25,643 Minnetonka 51.28 24,123 Shakopee 41.05 49,282
Waite Park 7.77 25,437 Shakopee 41.05 24,058 Minnetonka 51.28 48,974
Shakopee 41.05 25,224 Lakeville 73.06 24,005 Roseville 31.58 48,886
South St. Paul 19.67 25,008 Elk River 39.39 24,004 Jordan 6.10 48,670
Minnetonka 51.28 24,852 Alexandria 33.37 23,766 Golden Valley 23.89 48,555
Delano 6.21 24,741 Waconia 14.36 23,666 Prior Lake 24.08 48,436
Kasson 6.60 24,597 West St. Paul 13.54 23,656 Mound 7.94 48,240
Stillwater 18.87 24,354 Robbinsdale 10.05 23,618 South St. Paul 19.67 48,065
Albertville 7.69 24,331 Fairmont 20.12 23,503 Victoria 8.77 47,571
Sartell 18.92 24,236 Bemidji 20.36 23,460 Hastings 22.61 47,540
Big Lake 11.48 24,121 St. Paul Park 5.94 23,446 Monticello 14.73 47,532St. Cloud 67.85 24,056 Chaska 22.94 23,402 Cottage Grove 38.42 47,245
Inver Grove Heights 35.29 24,039 Belle Plaine 9.10 23,357 Stillwater 18.87 47,080
Cottage Grove 38.42 23,954 Cottage Grove 38.42 23,291 Inver Grove Heights 35.29 46,915
Monticello 14.73 23,253 Virginia 16.36 23,234 Faribault 27.97 46,822
Hastings 22.61 23,218 Savage 27.50 23,207 North St. Paul 11.39 46,809
Sauk Rapids 14.37 22,858 South St. Paul 19.67 23,057 Lakeville 73.06 46,543
Isanti 7.08 22,772 Inver Grove Heights 35.29 22,876 Albertville 7.69 46,317
86

2021 2022 2021 2022 2021 2022Total Population Total Money Needs Total Total
Needs Allocation Needs Allocation Needs AllocationMunicipality Mileage Per Need Mile Municipality Mileage Per Need Mile Municipality Mileage Per Need Mile
Little Canada 11.35 $22,587 Hermantown 18.54 $22,870 Austin 30.41 $45,948
Lakeville 73.06 22,538 St. Peter 14.74 22,867 Delano 6.21 45,934
Zimmerman 6.52 22,493 New Ulm 18.01 22,827 St. Paul Park 5.94 45,562
Golden Valley 23.89 22,369 Jordan 6.10 22,814 North Mankato 16.33 45,559
St. Paul Park 5.94 22,116 Grand Rapids 26.45 22,802 Waconia 14.36 45,172
Waconia 14.36 21,506 Northfield 17.06 22,749 Kasson 6.60 45,137
LaCrescent 5.84 21,408 Orono 9.45 22,733 Duluth 118.03 44,197
Moorhead 49.89 21,138 Stillwater 18.87 22,726 Buffalo 19.41 44,003
Orono 9.45 20,850 Rogers 22.30 22,714 Willmar 28.15 43,995
Faribault 27.97 20,716 Fridley 22.87 22,646 Little Canada 11.35 43,909
North Mankato 16.33 20,714 Spring Lake Park 5.81 22,608 Orono 9.45 43,583
Austin 30.41 20,395 Detroit Lakes 25.77 22,563 Hutchinson 19.52 43,340
Lino Lakes 24.95 20,323 Worthington 11.78 22,298 Brainerd 19.86 42,925
New Prague 9.58 20,189 Mendota Heights 15.17 22,186 Big Lake 11.48 42,811
Mahtomedi 9.61 20,066 White Bear Lake 20.94 22,070 Belle Plaine 9.10 42,613
Shorewood 9.20 20,046 Columbia Heights 12.50 21,999 Owatonna 34.64 42,607
Rosemount 30.58 19,876 Albertville 7.69 21,986 St. Peter 14.74 42,264
Buffalo 19.41 19,738 Farmington 16.95 21,968 Albert Lea 24.31 42,221
St. Peter 14.74 19,397 Shorewood 9.20 21,907 Shorewood 9.20 41,953
Belle Plaine 9.10 19,256 Shoreview 19.69 21,893 New Ulm 18.01 41,405
New Ulm 18.01 18,578 Vadnais Heights 9.17 21,816 Rosemount 30.58 41,323
Byron 8.08 18,511 Roseville 31.58 21,683 Marshall 19.07 41,066
Mendota Heights 15.17 18,344 Waseca 7.71 21,532 Isanti 7.08 41,051
St. Joseph 9.08 18,344 Rosemount 30.58 21,447 Mendota Heights 15.17 40,530
Owatonna 34.64 18,073 Little Canada 11.35 21,322 Zimmerman 6.52 40,527
Albert Lea 24.31 18,025 Prior Lake 24.08 21,260 Red Wing 24.86 40,470
Litchfield 8.77 17,898 Glencoe 8.39 21,195 Bemidji 20.36 40,422
Hutchinson 19.52 17,722 Delano 6.21 21,192 New Prague 9.58 40,331
Willmar 28.15 17,690 North St. Paul 11.39 21,087 Crookston 11.58 40,155
Otsego 26.87 17,607 Crystal 17.57 20,907 Mahtomedi 9.61 39,703
Duluth 118.03 17,405 Cloquet 22.78 20,778 East Grand Forks 16.74 39,569
Andover 44.48 17,368 Forest Lake 33.83 20,765 Elk River 39.39 39,546
St. Michael 24.92 17,339 Byron 8.08 20,742 La Crescent 5.84 39,535
Ramsey 37.87 17,299 Mounds View 10.86 20,703 Byron 8.08 39,253
Brainerd 19.86 17,175 Little Falls 20.55 20,623 Lino Lakes 24.95 38,951
Bemidji 20.36 16,962 Otsego 26.87 20,579 Fergus Falls 25.79 38,837
Marshall 19.07 16,934 Kasson 6.60 20,540 Otsego 26.87 38,186
Hugo 22.57 16,553 Lake Elmo 20.89 20,534 Cambridge 16.93 38,096
International Falls 8.39 16,387 St. Michael 24.92 20,472 St. Michael 24.92 37,811
87

2021 2022 2021 2022 2021 2022Total Population Total Money Needs Total Total
Needs Allocation Needs Allocation Needs AllocationMunicipality Mileage Per Need Mile Municipality Mileage Per Need Mile Municipality Mileage Per Need Mile
Glencoe 8.39 $16,223 Morris 8.79 $20,469 St. Joseph 9.08 $37,605
Dayton 10.62 16,203 Falcon Heights 3.29 20,435 Glencoe 8.39 37,418
Red Wing 24.86 15,772 New Brighton 15.27 20,402 Litchfield 8.77 37,360
Elk River 39.39 15,542 Wyoming 16.06 20,360 Thief River Falls 17.01 37,094
Crookston 11.58 15,310 Mound 7.94 20,192 Rogers 22.30 36,841
Minnetrista 12.98 15,083 New Prague 9.58 20,142 Ramsey 37.87 36,532
Chisago City 8.75 15,052 Circle Pines 3.60 20,051 Baxter 17.47 36,419
Lake City 8.39 14,833 Montevideo 8.98 19,948 Andover 44.48 36,129
Forest Lake 33.83 14,437 Redwood Falls 10.61 19,791 Hugo 22.57 35,982
St. Francis 13.45 14,344 Mahtomedi 9.61 19,637 Hermantown 18.54 35,934
Montevideo 8.98 14,244 Arden Hills 7.64 19,632 Fairmont 20.12 35,854
Rogers 22.30 14,127 Chisholm 8.61 19,609 Virginia 16.36 35,431
Morris 8.79 13,762 Litchfield 8.77 19,462 Forest Lake 33.83 35,201
Chisholm 8.61 13,761 Hugo 22.57 19,429 International Falls 8.39 34,662
Cambridge 16.93 13,452 St. Joseph 9.08 19,261 Dayton 10.62 34,628
Cloquet 22.78 13,073 Hibbing 54.19 19,249 Morris 8.79 34,231
Hermantown 18.54 13,063 Ramsey 37.87 19,233 Montevideo 8.98 34,192
East Grand Forks 16.74 12,989 Victoria 8.77 19,076 Alexandria 33.37 33,945
Fergus Falls 25.79 12,973 Andover 44.48 18,761 Cloquet 22.78 33,852
Medina 12.59 12,868 Big Lake 11.48 18,690 Lake Elmo 20.89 33,392
Lake Elmo 20.89 12,857 Lino Lakes 24.95 18,628 Chisholm 8.61 33,370
Fairmont 20.12 12,351 Lake City 8.39 18,513 Lake City 8.39 33,346
Virginia 16.36 12,197 Medina 12.59 18,433 Chisago City 8.75 33,312
Thief River Falls 17.01 12,188 Dayton 10.62 18,425 Minnetrista 12.98 32,865
Wyoming 16.06 11,851 Stewartville 4.71 18,420 Grand Rapids 26.45 32,769
Baxter 17.47 11,681 North Branch 29.07 18,399 Wyoming 16.06 32,211
Redwood Falls 10.61 11,395 Isanti 7.08 18,279 Detroit Lakes 25.77 31,638
Ham Lake 35.23 11,074 International Falls 8.39 18,275 St. Francis 13.45 31,500
Little Falls 20.55 10,539 Chisago City 8.75 18,261 Medina 12.59 31,301
Alexandria 33.37 10,179 La Crescent 5.84 18,127 Redwood Falls 10.61 31,186
Grand Rapids 26.45 9,968 Corcoran 16.26 18,082 Little Falls 20.55 31,163
East Bethel 29.73 9,394 Zimmerman 6.52 18,034 Ham Lake 35.23 28,266
Detroit Lakes 25.77 9,075 Oak Grove 27.36 18,023 North Branch 29.07 27,192
Corcoran 16.26 9,013 Minnetrista 12.98 17,783 Corcoran 16.26 27,096
North Branch 29.07 8,793 Ham Lake 35.23 17,192 Hibbing 54.19 26,339
Oak Grove 27.36 7,733 St. Francis 13.45 17,156 East Bethel 29.73 26,177
Hibbing 54.19 7,090 East Bethel 29.73 16,783 Oak Grove 27.36 25,756
Avg. $22,903 $23,088 $45,992
MSAS\Books\2021 Oct Book\Allocation Rankings
88

OTHER TOPICS
89

CERTIFICATION OF MSAS SYSTEM AS COMPLETE
A Certification of a Municipal State Aid Street System may occur when a City certifies to the Commissioner of Transportation that its state aid routes are improved to state aid standards or have no other needs beyond additional surfacing or shouldering needs as identified in the annual State Aid Needs Report. This authority exists under Minnesota Rules 8820.1800 subpart 2, which reads in part:
When the county board or governing body of an urban municipality desires to use a part of its state aid allocation on local roads or streets not on an approved state aid system, it shall certify to the commissioner that its state aid routes are improved to state aid standards or are in an adequate condition that does not have needs other than additional surfacing or shouldering needs identified in its respective state aid needs report. That portion of the county or city apportionment attributable to needs must not be used on the local system.
When a system is certified as complete, the certification shall be good for two years. The dollar amount eligible for use on local streets will be based on the population portion of the annual construction allocation. The beginning construction account figure for this calculation shall be the amount of the current year’s construction account which is not generated by construction needs. The dollar amount eligible to be spent on local street systems is determined as follows:
Determine what percentage the population allocation is of the total allocation. This percent is then multiplied times the construction allotment. This is the amount of the construction allotment that is generated by the population allocation. Only the construction allotment is used because the city has already received its maintenance allotment.
Population Allocation / Total Allocation * Construction Allotment = Local Amount Available. (see allocation into 90p account on next page) The following five cities are Certified Complete: Columbia Heights, Crookston, Falcon Heights, Fridley, and South St. Paul.
N:\MSAS\Books 2019 January book\Certification of MSAS System as Complete 2018.docx
90
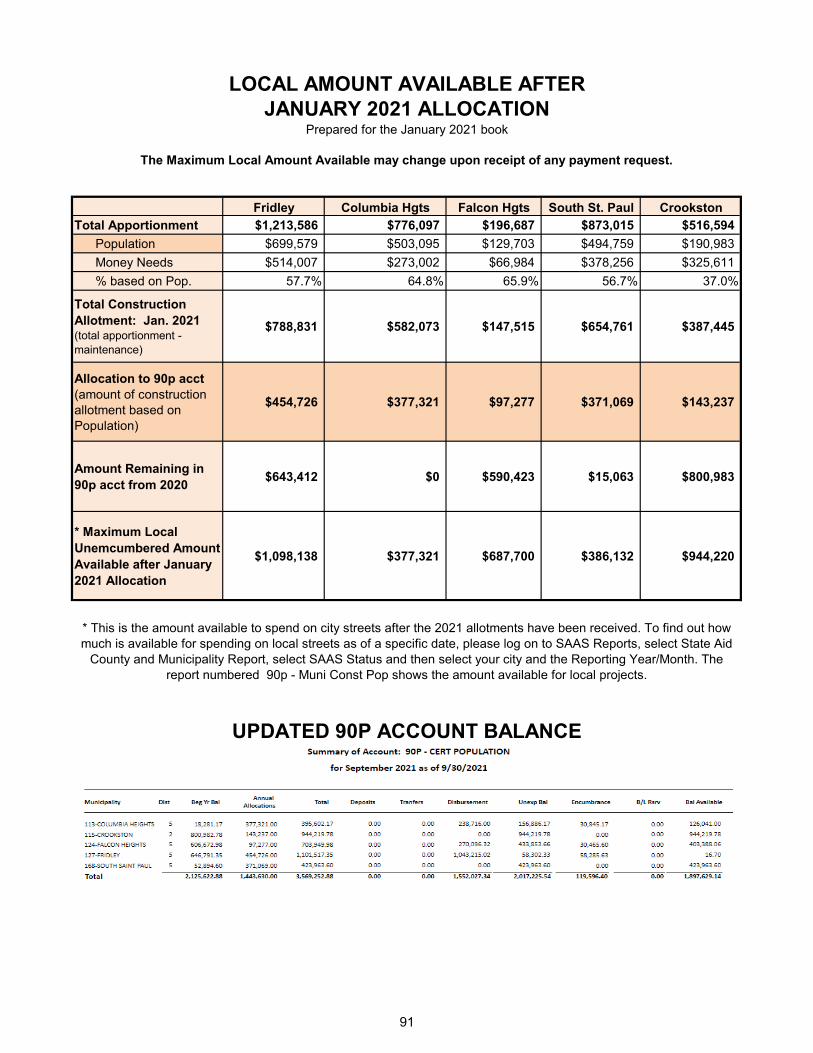
Fridley Columbia Hgts Falcon Hgts South St. Paul CrookstonTotal Apportionment $1,213,586 $776,097 $196,687 $873,015 $516,594
Population $699,579 $503,095 $129,703 $494,759 $190,983
Money Needs $514,007 $273,002 $66,984 $378,256 $325,611
% based on Pop. 57.7% 64.8% 65.9% 56.7% 37.0%
Total Construction Allotment: Jan. 2021 (total apportionment - maintenance)
$788,831 $582,073 $147,515 $654,761 $387,445
Allocation to 90p acct (amount of construction allotment based on Population)
$454,726 $377,321 $97,277 $371,069 $143,237
Amount Remaining in 90p acct from 2020
$643,412 $0 $590,423 $15,063 $800,983
* Maximum Local Unemcumbered Amount Available after January 2021 Allocation
$1,098,138 $377,321 $687,700 $386,132 $944,220
UPDATED 90P ACCOUNT BALANCE
LOCAL AMOUNT AVAILABLE AFTERJANUARY 2021 ALLOCATION
Prepared for the January 2021 book
The Maximum Local Amount Available may change upon receipt of any payment request.
* This is the amount available to spend on city streets after the 2021 allotments have been received. To find out how much is available for spending on local streets as of a specific date, please log on to SAAS Reports, select State Aid
County and Municipality Report, select SAAS Status and then select your city and the Reporting Year/Month. The report numbered 90p - Muni Const Pop shows the amount available for local projects.
91

January Year End January unexpendedAllotment Balance Spent Allotment balance Spent
1958 $113,220 $48,310 $64,910 2013 3,125,654 888,606 2,237,0481970 252,736 147,968 104,768 2014 3,235,357 880,506 2,354,8511980 521,544 171,544 350,000 2015 3,413,892 1,045,899 2,367,9931990 1,248,109 218,586 1,029,523 2016 3,548,041 1,171,781 2,376,2602000 1,583,411 1,230,268 353,143 2017 3,551,701 1,078,127 2,473,5742008 1,750,808 29,487 1,721,321 2018 3,937,329 1,587,167 2,350,1622009 1,866,306 95,764 1,770,542 2019 3,948,897 1,364,462 2,584,4352010 2,614,101 680,404 1,933,697 2020 4,321,254 1,976,567 2,344,6872011 2,858,585 762,419 2,096,166 2021 3,948,622 __________ ___________2012 3,014,118 1,029,649 $1,984,469
Each year the Screening Board, provided for in section 162.13, Subdivision 3, may recommend to the commissioner asum of money that the commissioner shall set aside from the municipal state aid street fund and credit to a researchaccount. The amount so recommended shall not exceed 1/2 of 1% of the preceding apportionment. Any balanceremaining in the research account at the end of each year from sum set aside for the year immediately previous, shall be transferred to the MSAS fund.
Be it resolved that an amount of $965,058 (not to exceed 1/2 of 1% of the 2021 MSAS Apportionment sum of:$193,011,589) shall be set aside from the 2022 Apportionment fund and be credited to the research account.
Year Allotment Spent Year Allotment Spent
1958 $0 $0 2013 $723,414 $723,4141970 37,803 2,151 2014 746,853 746,8531980 77,116 40,764 2015 773,075 773,0751990 191,254 150,294 2016 853,501 853,5012000 487,286 487,286 2017 868,060 868,0602008 572,095 572,095 2018 866,092 866,0922009 571,991 571,991 2019 961,433 961,4332010 608,806 608,806 2020 962,329 962,3292011 636,577 636,577 2021 1,051,229 1,051,2292012 695,405 695,405 2022 965,058
N:MSAS/BOOKS/2021 OCTOBER BOOK/Past History of Administrative & Research Accounts 2021.xlsx
HISTORY OF THE RESEARCH ACCOUNT
HISTORY OF ADMINISTRATIVE ACCOUNT
TWO PERCENT OF THE TOTAL FUNDS AVAILABLE ARE SET ASIDE FOR THE ADMINISTRATION OF STATE AID. THE ACCOUNT IS USED FOR EXPENSES OF SCREENING BOARD MEETINGS, VARIANCE MEETINGS, PRINTING
OF STATE AID MATERIALS, ETC.
Year Year
The unexpended balance of the administration account at the end of the year is transferred back to the MSAS fund and redistributed the following year.
92

������������� �������������� ������ ���������������� �
������������� !�"#$�%�&����$�!��$���!"'��� (��" ��� %!"'��� %����%�%��&& ���)�$" ) ��$*���� !�"!"'��� %�����������������+,-�./�0�-+��������1��2���������������2�3���������1��21�����4���5������������1���6���������1�7�������8������������-96���������������46�����������6����������������60������/0����������:�2���������������1������;�����6��2�46���0�������4�������1�����8�6����8��-96�1��2��������������2����1��������:���0�������0����0�������6�����������������������60������/�7����������������/����42��������6�<,=/===/===����22������6���6������ ������������-96��6���6������0���2������������4��;�����04�6���>?9�6��1@��������?11������������������6��������8A�������6���7��������8A����2�����8-96������������1����������8��������������6�����������:6��6���������0���:-96������������ �������������B������������4�����6�0�8�����8�1�6������2���-���� !�"!"'��� #$" C ' �% #$" DEFG�EHEDEI���������������60�����������:-J?�?KL >M J�LNJ?LO�LP9Q?J #$" RECCSTG(U!DFEFI���������������60��������:V0������������:��2���6�4- �������82���42�4���2����6�����������������-P������4�4���2:���0�����-K�����������W�����-K��������������������0�����4�������0�����������2���- #$" (DEEXGCSTI���������������60���������������0�����������������������������������- �����������������1����N��2�/1����N�����0����:6���1�������������0��-K�����������W�����-Y�86�������4���;���������������V��6�����������-( � &��(��" ��� %Z$&���� !�"[\ " &��!�"!"'��� #$�%�&����$�Q1����4��W����������������1����������2�����6�4��������02�������� �� ������K������������6���]��8�6��������04�6�0����-96��:������2��3_�6�1�����81���6�����4/0����:���J?96����6�1����- �������1����:���0�����������1������2�1���������0�������6�������������������������������:���]���-96������������������2���0�����1�����6��������4������6��������2�������������1�����6���6���>?9���� ��@������ @a:�0��8�-D b� %�%�& c$$"$��)Z$&�d ) �&& b� %� "CST(U!DFEF�EHEDE
93

������������� �������������� ������ ���������������� �
����������� !��"#�$ �%�!&%�'��$�(��")�!"��*+,-*�#�.��'��$/ ���������������0�������1����2�������������1�����������34��2�����50�������������������1��������������65 7������1�0�8�0�0��������0����������1��3 ����������������9��0��8�5���:����������������9���5������3 ������9�����;�����;���������3<9�1����59�����1�5�����;���������1���1�9����=���6�1��������9�����59���1�0�1�5�����60���>?�@������?������ ������7����A��������9����=���6�������6��9���1������2���3B�����������C���;������5=���6������������1������53D�E������$�F��"��%'#�$�.�'��$$�E�����"����������� !��"#�$ �%�!&%�'��$�(��")�!"��*+,-*�#�.��'��$3�0��� ������?�������������?�@������?������7�������6��6������9��0 77��0�G?����������=�6��;�3HI0�����0������9��0�����1�0��7���1��0�1�0��3039���1J�����30�3������KBL���� ��7���������5���K H9�������=3M$!�$!�'N'��� 4������55���0=���6���@������9�1����������������16�����������6���=���������6�������=1��1������O����=3L1���������������������5B���6�����������;�1��������5���3H��1���5=���6���@���������60�����2�������1���K H9����������P�����=��1���1���������3L1�K H=�����60���1���������P�������� QL9��9������������P�����3?�@������1��������������;������0���������0����9���2���1����6�����5�����������9�����;=�����������6��3<���������C�������=15�1����2�����������34������5���2�����������C6����������0����C�����2����=1����;���0����1���0��������1����5R��������������C�����2����=��1��������9���������30��������������9�����;�1���9����0�56�9�����C6����@������KBL���� ����������3S")����T! !���!����������5UV���C��9����������������������WX�3WYC�6�X3���� ��?����UV���C��9���������� ��?����ZZ�[3W\[[C�6�3W[GW[6]4K73���� ������������ ����������0������9�����0���1�0�������������:���������������������0�����_YC[[[C[[[C=1��1����������3 �������0����=���6��������65��5��0��������������;�6��;�����������6��������������50�������3L1���0�����6���0������������5��2�����65�1���KBL�1��97��������B99����3<9�0����������51�����;�����6����������1�������������?��U�����a�1����KBL���� ��7������0�5���6��6������5�1�0����������59���1�������;���56������������3Q�0�������0�56��8�����������9�������������������������������2�������;��00��65�1� L4���1�L<4=1�����������9������������������99������9����3?���50���=���6�0������1���0�9������9����������������31����9������9����9�����6����;��00��C���1����2���]�����������9�1����2���6���������9�������5�����;�6��C�1�������;���5����@���������56��b�1����������������50�������0������5�;������6��=�����KBL���� ������1�0����������5394

Enterprise MnDOT Mapping Application
Step 1: Launch application
Step 2: Enter City to search
Step 3: Click on the layer list icon
and turn on “City Route System” layer.
http://www.dot.state.mn.us/tda/emma.html
95

�
CURRENT RESOLUTIONS OF THE
MUNICIPAL SCREENING BOARD
October 2021
Bolded wording (except headings) are revisions since the last publication of the Resolutions
BE IT RESOLVED: ADMINISTRATION
Appointments to Screening Board - Oct. 1961 (Revised June 1981, May 2011)
The Commissioner of Mn/DOT will annually be requested to appoint three (3) new members, upon recommendation of the City Engineers Association of Minnesota, to serve three (3) year terms as voting members of the Municipal Screening Board. These appointees are selected from the MnDOT State Aid Districts as they exist in 2010, together with one representative from each of the four (4) cities of the first class.
Screening Board Chair, Vice Chair and Secretary- June 1987 (Revised June, 2002)
The Chair Vice Chair, and Secretary, nominated annually at the annual meeting of the City Engineers Association of Minnesota and subsequently appointed by the Commissioner of the Minnesota Department of Transportation will not have a vote in matters before the Screening Board unless they are also the duly appointed Screening Board Representative of a construction District or of a City of the first class.
Appointment to the Needs Study Subcommittee - June 1987 (Revised June 1993)
The Screening Board Chair will annually appoint one city engineer, who has served on the Screening Board, to serve a three year term on the Needs Study Subcommittee. The appointment will be made at the annual winter meeting of the City's Engineers Association. The appointed subcommittee person will serve as chair of the subcommittee in the third year of the appointment. Appointment to Unencumbered Construction Funds Subcommittee – (Revised June 1979, May 2014) The Screening Board past Chair will be appointed to serve a minimum three-year term on the Unencumbered Construction Fund Subcommittee. This appointment will continue to maintain an experienced group to follow a program of accomplishments. The most senior member will serve as chair of the subcommittee.
96

�
Appearance Screening Board - Oct. 1962 (Revised Oct. 1982)
Any individual or delegation having items of concern regarding the study of State Aid Needs or State Aid Apportionment amounts, and wishing to have consideration given to these items, will send such request in writing to the State Aid Engineer. The State Aid Engineer with concurrence of the Chair of the Screening Board will determine which requests are to be referred to the Screening Board for their consideration. This resolution does not abrogate the right of the Screening Board to call any person or persons before the Board for discussion purposes. Screening Board Meeting Dates and Locations - June 1996 The Screening Board Chair, with the assistance of the State Aid Engineer, will determine the dates and locations for Screening Board meetings. Research Account - Oct. 1961 An annual resolution be considered for setting aside up to ½ of 1% of the previous years’ Apportionment fund for the Research Account to continue municipal street research activity. Population Apportionment - October 1994, 1996 Beginning with calendar year 1996, the MSAS population apportionment will be determined using the latest available federal census or population estimates of the State Demographer and/or the Metropolitan Council. However, no population will be decreased below that of the latest available federal census, and no city will be dropped from the MSAS eligible list based on population estimates. Improper Needs Report - Oct. 1961
The State Aid Engineer and the District State Aid Engineer (DSAE) are requested to recommend an adjustment of the Needs reporting whenever there is a reason to believe that said reports have deviated from accepted standards and to submit their recommendations to the Screening Board, with a copy to the municipality involved, or its engineer.
New Cities Needs - Oct. 1983 (Revised June 2005, May 2014) Any new city having determined its eligible mileage, but has not submitted its Needs to the DSAE by December 1, will have its Needs based upon zero ADT assigned to the eligible mileage until the DSAE approves the traffic counts. Certified Complete Cities – May 2014 (Revised October 2014) State Aid Operational Rule 8820.18 subp.2 allows cities to spend the population based portion of their Construction Allotment on non MSAS city streets if its MSAS system has been Certified Complete. At the city’s request, the District State Aid Engineer will review the MSAS system in that city and if the system has been completely built, may certify it complete for a period of two years. The same proportion of a city’s total allocation based on population will be used to compute the population portion of its Construction Allotment.
97

�
If a payment request for a project on the MSAS system is greater than the amount available in the Needs based account, the remainder will come from the population based account, thereby reducing the amount available for non MSAS city streets. A city may carry over any remaining amount in its population based account from year to year. However if a payment request for a project on a non MSAS city street is greater than the amount available in the population based account, the population based account will be reduced to zero and the city will be responsible for the remaining amount. Construction Needs Components – May 2014 For Construction Needs purposes, all roadways on the MSAS system will be considered as being built to Urban standards. All segments on the MSAS system will generate continuous Construction Needs on the following items: Excavation/Grading Gravel Base Bituminous Curb and Gutter Construction Sidewalk Construction Storm Sewer Construction Street Lighting Traffic Signals Engineering Structures Unit Price Study- Oct. 2006 (Revised May, 2014) The Needs Study Subcommittee will annually review the Unit Prices for the Needs components used in the Needs Study. The Subcommittee will make its recommendation to the Municipal Screening board at its annual spring meeting. The Unit Price Study go to a 3 year (or triennial) cycle with the Unit Prices for the two ‘off years’ to be set using the Engineering News Record construction cost index on all items where a Unit Price is not estimated and provided by other MnDOT offices. The Screening Board may request a Unit Price Study on individual items in the ‘off years’ if it is deemed necessary. Unit Costs – May 2014, (Revised January 2015, May 2015) The quantities which the Unit Costs for Excavation/Grading, Gravel Base, and Bituminous are based upon will be determined by using the roadway cross sections and structural sections in each of the ADT groups as determined by the Municipal Screening Board and shown in the following table ‘MSAS Urban ADT Groups for Needs Purposes’.
98
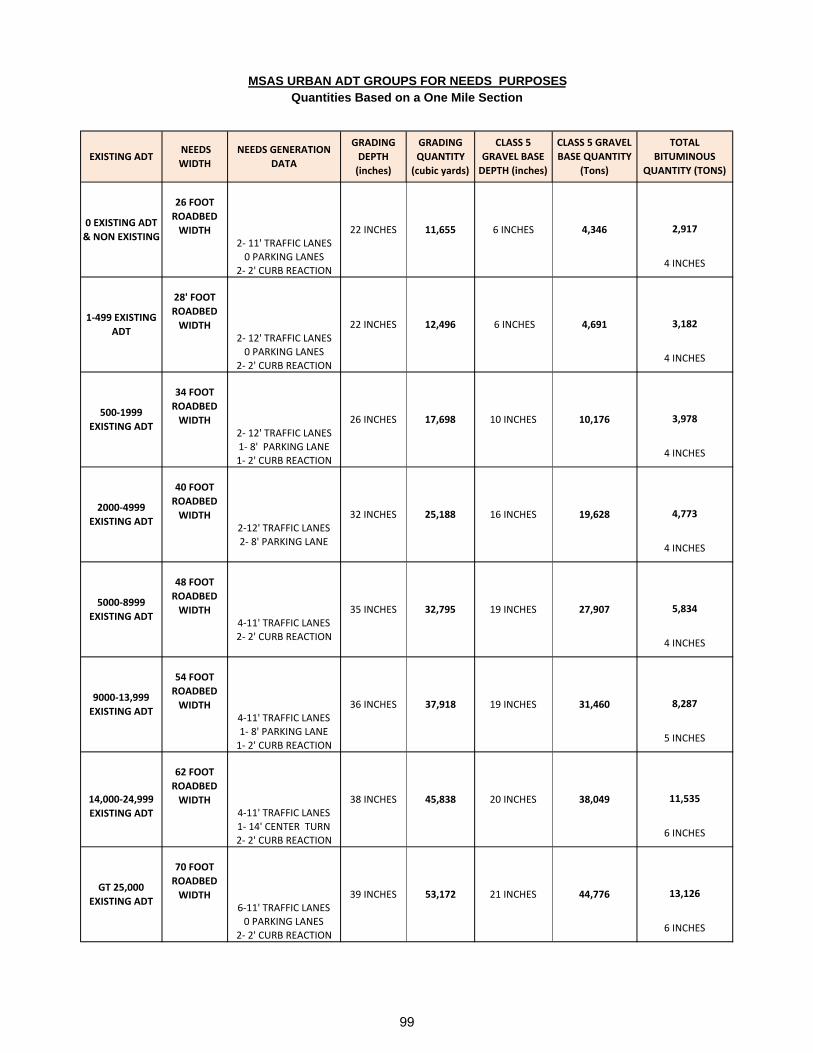
26 FOOT
ROADBED
WIDTH 2,917
2‐ 11' TRAFFIC LANES0 PARKING LANES
2‐ 2' CURB REACTION
28' FOOT
ROADBED
WIDTH 3,182
2‐ 12' TRAFFIC LANES0 PARKING LANES
2‐ 2' CURB REACTION
34 FOOT
ROADBED
WIDTH 3,978
2‐ 12' TRAFFIC LANES1‐ 8' PARKING LANE1‐ 2' CURB REACTION
40 FOOT
ROADBED
WIDTH 4,773
2‐12' TRAFFIC LANES2‐ 8' PARKING LANE
48 FOOT
ROADBED
WIDTH 5,834
4‐11' TRAFFIC LANES2‐ 2' CURB REACTION
54 FOOT
ROADBED
WIDTH 8,287
4‐11' TRAFFIC LANES1‐ 8' PARKING LANE1‐ 2' CURB REACTION
62 FOOT
ROADBED
WIDTH 11,535
4‐11' TRAFFIC LANES1‐ 14' CENTER TURN2‐ 2' CURB REACTION
70 FOOT
ROADBED
WIDTH 13,126
6‐11' TRAFFIC LANES0 PARKING LANES
2‐ 2' CURB REACTION
4,346
4 INCHES
CLASS 5
GRAVEL BASE
DEPTH (inches)
CLASS 5 GRAVEL
BASE QUANTITY
(Tons)
TOTAL
BITUMINOUS
QUANTITY (TONS)
GT 25,000
EXISTING ADT39 INCHES 53,172 21 INCHES 44,776
6 INCHES
5 INCHES
38 INCHES 45,838 20 INCHES 38,049
9000‐13,999
EXISTING ADT36 INCHES 37,918 19 INCHES
14,000‐24,999
EXISTING ADT
6 INCHES
4 INCHES
5000‐8999
EXISTING ADT35 INCHES 32,795 19 INCHES 27,907
4 INCHES
2000‐4999
EXISTING ADT32 INCHES 25,188 16 INCHES 19,628
31,460
500‐1999
EXISTING ADT26 INCHES 17,698 10 INCHES 10,176
4 INCHES
1‐499 EXISTING
ADT22 INCHES 12,496 6 INCHES 4,691
4 INCHES
MSAS URBAN ADT GROUPS FOR NEEDS PURPOSESQuantities Based on a One Mile Section
0 EXISTING ADT
& NON EXISTING22 INCHES 11,655 6 INCHES
EXISTING ADT NEEDS
WIDTH
NEEDS GENERATION
DATA
GRADING
DEPTH
(inches)
GRADING
QUANTITY
(cubic yards)
99
�
The quantity used for Curb and Gutter Construction will be determined by multiplying the segment length times two if it is an undivided roadway and by four if it is divided. This quantity will then be multiplied by the Municipal Screening Board approved Unit Price to determine the Curb and Gutter Construction Needs. The quantity used for Sidewalk Construction will be determined by multiplying the segment length times 26,400 (a five foot wide sidewalk on one side of a mile of roadway) in the lower two ADT groups (less than 500 ADT) and by 52,800 (two five foot wide sidewalks on a mile of roadway) in the upper ADT groups. This quantity will then be multiplied by the Municipal Screening Board approved Unit Price to determine the Sidewalk Construction Needs. The Unit Cost per mile of Storm Sewer for the highest MSAS Urban ADT Group for Needs Purposes will be based on the average costs of all Storm Sewer Construction on the MSAS system in the previous year. To determine the Unit Cost for the highest ADT Group, average costs for Complete Storm Sewer projects and Partial Storm Sewer projects will be provided to State Aid by the MnDOT Hydraulics Office and then added together and divided by two to calculate a statewide average Unit Cost for all Storm Sewer Construction. The Unit Cost per mile for Storm Sewer Construction will be calculated for the highest MSAS Urban ADT Group and be prorated downward for the other ADT Groups. This proration has been determined based upon an engineering study requested by the Municipal Screening Board in 2011 and will be the basis for the Needs calculations. The Unit Cost for Street Lighting will be determined by multiplying the Unit Price per mile by the segment length. This Unit Cost will remain at $100,000 per mile. The Municipal Screening Board may request a study on this item on any year if it is deemed necessary. The Unit Cost for Traffic Signals will be determined by the recommendation by the SALT Program Support Engineer and approved by the MSB. The Unit Cost for traffic signals will be based on a cost per signal leg, and for Needs purposes a signal leg will be defined as ¼ of the signal cost. Only signal legs on designated MSAS routes will be included in the Needs study. Stand-alone pedestrian crossing signals will not be included in the Needs study. The area in square feet used for Structure Needs (Bridges and Box Culverts) will be determined by multiplying the centerline length of the bridge, or the culvert width of the box culvert, times the Needs Width from the appropriate MSAS Urban ADT Group. This quantity will then be multiplied by the Municipal Screening Board Unit Price to determine the Structure Needs. The Unit Price for Structures will be determined by using one-half of the approved unit cost provided by the MnDOT State Aid Bridge Office. The Unit Cost for Engineering will be determined by adding together all other Unit Costs and multiplying them by the MSB approved percentage. The result is added to the other Unit Costs.
100
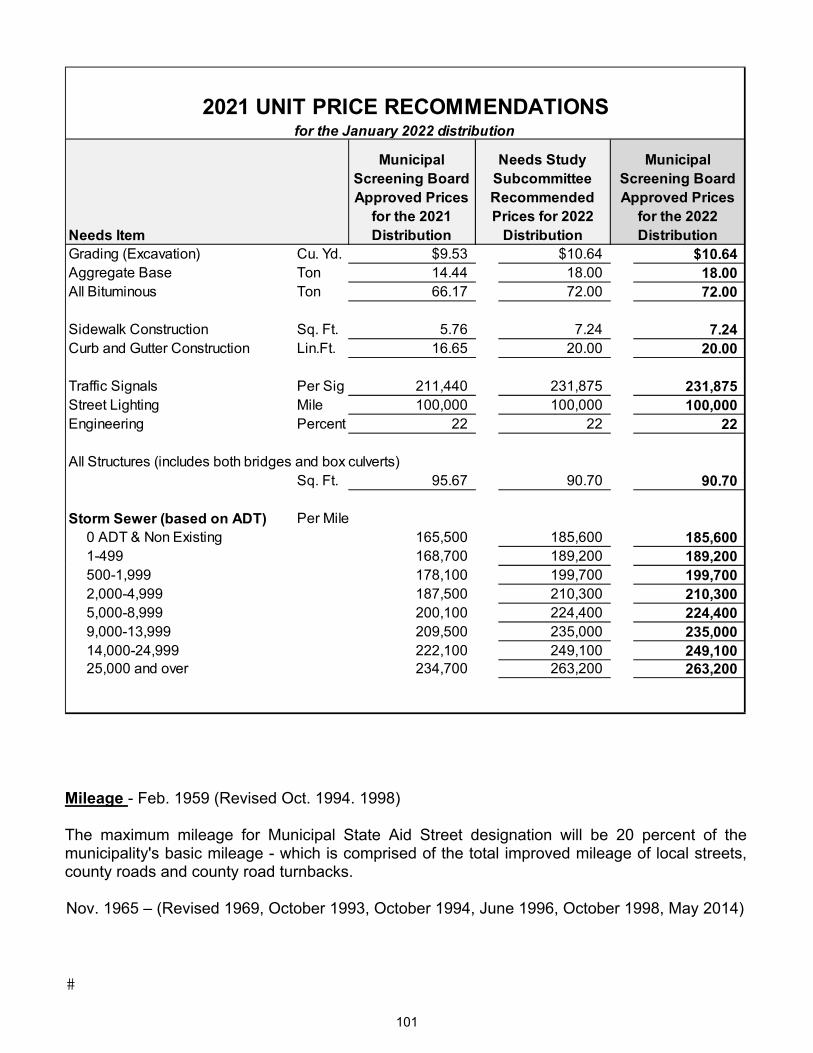
�
Mileage - Feb. 1959 (Revised Oct. 1994. 1998)
The maximum mileage for Municipal State Aid Street designation will be 20 percent of the municipality's basic mileage - which is comprised of the total improved mileage of local streets, county roads and county road turnbacks.
Nov. 1965 – (Revised 1969, October 1993, October 1994, June 1996, October 1998, May 2014)
Needs ItemGrading (Excavation) Cu. Yd. $9.53 $10.64 $10.64Aggregate Base Ton 14.44 18.00 18.00All Bituminous Ton 66.17 72.00 72.00
Sidewalk Construction Sq. Ft. 5.76 7.24 7.24Curb and Gutter Construction Lin.Ft. 16.65 20.00 20.00
Traffic Signals Per Sig 211,440 231,875 231,875Street Lighting Mile 100,000 100,000 100,000Engineering Percent 22 22 22
All Structures (includes both bridges and box culverts)Sq. Ft. 95.67 90.70 90.70
Storm Sewer (based on ADT) Per Mile 0 ADT & Non Existing 165,500 185,600 185,600 1-499 168,700 189,200 189,200 500-1,999 178,100 199,700 199,700 2,000-4,999 187,500 210,300 210,300 5,000-8,999 200,100 224,400 224,400 9,000-13,999 209,500 235,000 235,000 14,000-24,999 222,100 249,100 249,100 25,000 and over 234,700 263,200 263,200
2021 UNIT PRICE RECOMMENDATIONSfor the January 2022 distribution
Municipal Screening Board Approved Prices
for the 2021 Distribution
Needs Study Subcommittee Recommended Prices for 2022
Distribution
Municipal Screening Board Approved Prices
for the 2022 Distribution
101

�
That the maximum mileage for State Aid designation may be exceeded to designate trunk highway turnbacks released to the Municipality after July 1, 1965. The maximum mileage for State Aid designation may also be exceeded to designate both County Road and County State Aid Highways released to the Municipality after May 11th, 1994. Nov. 1965 (Revised 1972, Oct. 1993, 1995, 1998) The maximum mileage for Municipal State Aid Street designation will be based on the Annual Certification of Mileage current as of December 31st of the preceding year. Submittal of a supplementary certification during the year will not be permitted. Frontage roads not designated Trunk Highway, Trunk Highway Turnback or County State Aid Highways will be considered in the computation of the basic street mileage. The total mileage of local streets, county roads and county road turnbacks on corporate limits will be included in the municipality's basic street mileage. Any State Aid Street that is on the boundary of two adjoining urban municipalities will be considered as one-half mileage for each municipality. All mileage on the MSAS system will accrue Needs in accordance with current rules and resolutions. Oct. 1961 (Revised May 1980, Oct. 1982, Oct. 1983, June 1993, June 2003) All requests for revisions to the Municipal State Aid System must be received by the District State Aid Engineer by March first to be included in that years Needs Study. If a system revision has been requested, a City Council resolution approving the system revisions and the Needs Study reporting data must be received by May first, to be included in the current year's Needs Study. If no system revisions are requested, the District State Aid Engineer must receive the Normal Needs Updates by March 31st to be included in that years’ Needs Study. One Way Street Mileage - June 1983 (Revised Oct. 1984, Oct. 1993, June 1994, Oct. 1997) Any one-way streets added to the Municipal State Aid Street system must be reviewed by the Needs Study Sub-Committee, and approved by the Screening Board before any one-way street can be treated as one-half mileage in the Needs Study. All Municipal Screening Board approved one-way streets be treated as one-half of the mileage and allow one-half complete Needs. When Trunk Highway or County Highway Turnback is used as part of a one-way pair, mileage for certification shall only be included as Trunk Highway or County Turnback mileage and not as approved one-way mileage. Needs Adjustments Phase In (Restriction) May 2014 The method of computing Needs is to be phased in over a period of seven years. This seven year period will begin with the January 2015 allocation and go through the January 2021 allocation. The phase in will be reviewed annually by the Municipal Screening Board to determine if the Phase In period should be revised. During the seven year period the phase in is being applied, a city’s Restricted Needs will be
102

�
computed using the following steps: 1) Compare the current years Unadjusted Needs to the previous years Restricted Needs. In
the first year of the phase in, the current years Unadjusted Needs will be compared to the previous years Unadjusted Needs.
2) Compute the Statewide Average Percent of Change between the two totals. 3) Determine each individual city’s Percent of Change between last years Restricted Needs 4) and this years Unadjusted Needs. 5) If an individual city’s Percent of Change is greater than 5 Percentage Points less than the
Statewide Average Percent of Change, increase this year’s Unadjusted Needs to 5 Percentage Points less than the Statewide Average Percent of Change.
6) If an individual city’s Percent of Change is greater than 10 Percentage Points more than the Statewide Average Percent of Change, decrease this year’s Unadjusted Needs to 10 Percentage Points more than the Statewide Average Percent of Change.
7) If an individual city’s Percent of Change is between 5 Percentage Points less and 10 Percentage Points more than the Statewide Average Percent of Change, no restriction is made and the current year’s Unadjusted Needs will be used as its Restricted Needs.
All Needs adjustments will be applied to the city’s Restricted Needs. In the event that an MSAS route earning “After the Fact” Needs is removed from the MSAS system, the “After the Fact” Needs will then be removed from the Needs Study, except if transferred to another state system. No adjustment will be required on Needs earned prior to the revocation. Excess Unencumbered Construction Fund Balance Adjustment – Oct. 2002, (Revised Jan. 2010, May 2014, May 2019) State Aid Payment Requests received before December 1st by the District State Aid Engineer for payment will be considered as being encumbered and the construction balances will be so adjusted. The December 31 construction fund balance will be compared to the annual construction allotment from January of the same year. If the December 31 construction fund balance exceeds 3 times the January construction allotment, and the construction fund balance is over $1,500,000, then the negative adjustment to the Needs will be 1 times the December 31 construction fund balance. In each consecutive year the December 31 construction fund balance exceeds 3 times the January construction allotment (and the balance is over $1,500,000), the negative adjustment to the Needs will be increased to 2, 3, 4, etc. times the December 31 construction fund balance until such time the Construction Needs are adjusted to zero. If the December 31 construction fund balance drops below 3 times the January construction allotment and subsequently increases to over 3 times, the multipliers will start over with one. Low Balance Incentive – Oct. 2003 (Revised May, 2014) The amount of the Excess Unencumbered Construction Fund Balance Adjustment will be redistributed as a positive adjustment to the Construction Needs of all municipalities whose December 31st construction fund balance is less than 1 times their January construction allotment of the same year. This redistribution will be based on a city’s prorated share of its
103

�
Unadjusted Construction Needs to the total Unadjusted Construction Needs of all participating cities times the total Excess Balance Adjustment. After the Fact Right of Way Adjustment - Oct. 1965 (Revised June 1986, 2000, May 2014) Right of Way Needs will not be included in the Needs calculations until the right of way is acquired and the actual cost established. At that time a Construction Needs adjustment will be made by annually adding the local cost (which is the total cost less county or trunk highway participation) for a 15-year period. Only right of way acquisition costs that are eligible for State-Aid funding will be included in the right-of-way Construction Needs adjustment. This Directive is to exclude all Federal or State grants. When "After the Fact" Needs are requested for right-of-way projects that have been funded with local funds, but qualify for State Aid reimbursement, documentation (copies of warrants and description of acquisition) must be submitted to the District State Aid Engineer. The City Engineer will input the data into the Needs Update program and the data will be approved by the DSAE.
After the Fact Railroad Bridge over MSAS Route Adjustment – May 2014
RR Bridge over MSAS Route Rehabilitation Any structure that has been rehabilitated (Minnesota Administrative Rules, CHAPTER 8820, 8820.0200 DEFINITIONS, Subp. 8. Bridge rehabilitation) will not be included in the Needs calculations until the rehabilitation project has been completed and the actual cost established. At that time a Construction Needs adjustment will be made by annually adding the local cost (which is the total cost less county or trunk highway participation) for a 15-year period. Only State Aid eligible items are allowed to be included in this adjustment and all structure rehabilitation Needs adjustments must be input by the city and approved by the DSAE. RR Bridge over MSAS Route Construction/Reconstruction Any structure that has been constructed/reconstructed (Minnesota Administrative Rules, CHAPTER 8820, 8820.0200 DEFINITIONS, Subp. 31. Reconstruction) will not be included in the Needs calculations until the project has been completed and the actual cost established. At that time a Construction Needs adjustment will be made by annually adding the local cost (which is the total cost less county or trunk highway participation) for a 35-year period. Only State Aid eligible items are allowed to be included in this adjustment and all structure construction/reconstruction Needs adjustments must be input by the city and approved by the District State Aid Engineer.
After the Fact Railroad Crossing Adjustment
Any Railroad Crossing improvements will not be included in the Needs Calculations until the project has been completed and the actual cost established. At that time a Construction Needs adjustment will be made by annually adding the local cost (which is the total cost less county or trunk highway participation) to the annual Construction Needs for a 15 year period. Only State
104

�
Aid eligible items are allowed to be included in this adjustment, and all Railroad Crossing Needs adjustments must be input by the city and approved by the District State Aid Engineer. Excess Maintenance Account – June 2006 Any city which requests an annual Maintenance Allocation of more than 35% of their Total Allocation, is granted a variance by the Variance Committee, and subsequently receives the increased Maintenance Allocation will receive a negative Needs adjustment equal to the amount of money over and above the 35% amount transferred from the city’s Construction Account to its Maintenance Account. The Needs adjustment will be calculated for an accumulative period of twenty years, and applied as a single one-year (one time) deduction each year the city receives the maintenance allocation. After the Fact Retaining Wall Adjustment Oct. 2006 (Revised May 2014) Retaining wall Needs will not be included in the Needs study until such time that the retaining wall has been constructed and the actual cost established. At that time a Needs adjustment will be made by annually adding the local cost (which is the total cost less county or trunk highway participation) for a 15 year period. Documentation of the construction of the retaining wall, including eligible costs, must be submitted to your District State Aid Engineer by July 1 to be included in that years Needs study. After the Fact needs on retaining walls will begin effective for all projects awarded after January 1, 2006. All Retaining Wall adjustments must be input by the city and approved by the District State Aid Engineer. TRAFFIC - June 1971 (Revised May 2014) Beginning in 1965 and for all future Municipal State Aid Street Needs Studies, the Needs Study procedure will utilize traffic data developed according the Traffic Forecasting and Analysis web site at http://www.dot.state.mn.us/traffic/data/coll-methods.html#TCS Traffic Counting - Sept. 1973 (Revised June 1987, 1997, 1999, Oct. 2014) Traffic data for State Aid Needs Studies will be developed as follows:
1) The municipalities in the metropolitan area cooperate with the State by agreeing to participate in counting traffic every two or four years at the discretion of the city.
2) The cities in the outstate area may have their traffic counted and maps prepared by State forces every four years, or may elect to continue the present procedure of taking their own counts and have state forces prepare the maps.
3) Any city may count traffic with their own forces every two years at their discretion and expense, unless the municipality has made arrangements with the Mn/DOT district to do the count.
4) On new MSAS routes, the ADT will be determined by the City with the concurrence of the District State Aid Engineer until such time the roadway is counted in the standard MnDOT count rotation.
105