Embed Size (px)
Citation preview
Chapter III - 1
2030 Osage County Comprehensive Plan
CHAPTER 3: BASIS FOR THE 2030 OSAGE COUNTY, OKLAHOMA COMPREHENSIVE PLAN
INTRODUCTION Chapter III describes the basis for the conclusions drawn from the planning study that have become the foundation upon which the 2030 Plan has been built. The basis is a collection of the studies and data collected about the major elements of the Planning Area. Whereas Chapter III presents the resources available to the County at the beginning of the Planning Period, Chapter IV presents the resources and assets to be developed, and in some cases preserved and protected, during the Planning Period in order to achieve the goals, policies and objectives of the 2030 Plan. The Maps referred to in Chapter III are included at the end of the text for this Chapter.
Chapter III is formatted as an inventory of the resources that form the determinants of growth and development of the County during the Planning Period. The most basic of the elements of the inventory is the land area and the County’s cities and towns.
The following is a breakdown of the unincorporated and incorporated geography of the County as shown on the Osage County Planning Area Map and County Commissioners’ Districts - Map 2, which is included in Chapter I:
Planning Area/County Boundary: 2,303.7 square miles or 1,474,368 acres.
Incorporated area of cities and towns within the Planning Area: 33.08 square miles.*
Chapter III - 2
2030 Osage County Comprehensive Plan
Area included within annexation fence lines/unincorporated growth areas:
Sand Springs 78.440 Square Miles
Tulsa 12.524 Square Miles
Skiatook 153.069 Square Miles
Pawhuska 1.039 Square Miles
Sperry 12.675 Square Miles
Total Area within Annexation Fencelines 257.747 Square Miles
Percentage of Total Square Miles 11.19%
* Source: Barbara Gibson, Senior GIS Specialist, INCOG
While the 2030 Plan is focused upon the unincorporated County areas, references are also made to the comprehensive plans of the respective incorporated places for plans that have been adopted by a city or town for the unincorporated annexation fence lines. One of the final recommendations of the 2030 Plan is that it is in the County’s best public interest to officially adopt these city or town plans; each such plan has been incorporated into the 2030 Plan as a Special District as discussed in Chapter IV.
The following major elements of the County and its Planning Area will be discussed below in Chapter III:
The Natural and Built Environment
Trends in Growth and Development
Population and Demographics of Osage County
Summary of the Basis for the 2030 Osage County Comprehensive Plan
Chapter III - 3
2030 Osage County Comprehensive Plan
THE NATURAL AND BUILT ENVIRONMENT
In the County, it is the preeminence of the environmental features that establishes the overall and unique character of County. The environmental features discussed in this section of the 2030 Plan are discussed under the subheadings of those environmental features occurring within the natural environment and the built environment.
THE NATURAL ENVIRONMENT
This section of the 2030 Plan will discuss the following features of the natural environment: Wildlife and Threatened and Endangered Species – Composite Animal
Distributions - Map 3 Flora and Fauna - Major Vegetation Groups - Map 4 Physical and Natural Features – Lakes, Ponds and Nature Preserves - Map 5 Major Geologic Formations - Map 6 Slopes, Contours and Elevations:
o Degree of Slope - Map 7 o Contours - Map 8
Depth to Bedrock - Map 9 Soils:
o Major Soil Formations - Map 10 o Prime Farmland - Map 11 o Soil Limitations on Roads - Map 12 o Non-irrigated Crop Production Capability Map - Map 13 o Soil Limitations on Dwellings and Small Commercial Structures - Map 14 o Soil Limitations on Septic Tanks - Map 15
Major Groundwater Aquifers - Map 16 Drainage Basins and Watersheds - Map 17 Wetlands and Impaired Streams Floodplains - Map 18 Climate and Wind Profiles Air Quality Noise Odor Vibration Sensitive Environmental Sites
Chapter III - 4
2030 Osage County Comprehensive Plan
WILDLIFE AND THREATENED AND ENDANGERED SPECIES
The composite of animal distributions in the County is shown on the Composite of Animal Distributions - Map 3. The Simpson Diversity Index is one of a number of diversity indices, and “… takes into account the number of species present, as well as the relative abundance of each species” (“Simpson Index” – Wikipedia Encyclopedia). These data are to be interpreted to refer to the number of different species likely to be found within an area; therefore, the higher number would be interpreted as a higher “value” shown in the Legend on Map 3, and the higher would be the number of different species found in that particular area. Conversely, the lower the number or “value” the lower the numbers of different species present. These data do not speak to the presence or absence of threatened or endangered species. As shown by the scale of value coloration on Map 3, the more diverse numbers of species are found along the Arkansas River and generally south of SH-20, while the diversity shows an overall decrease from the south to the north and northwest with the northwest being the least diverse. According to the Nature Conservancy, biodiversity threats in this area include habitat fragmentation and loss, current grazing and controlled burning practices, invasive plant species such as sericea lespedeza (a noxious weed) and the eastern red cedar, and stream degradation due to land management practices and soil erosion. (Source: The Nature Conservancy – Oklahoma Preserve – Tallgrass Prairie, 2 pages). Threatened or endangered species that may be present in the County and State are listed on the federally-listed endangered, threatened, proposed and candidate species inventory prepared by the US Fish and Wildlife Service, Oklahoma Ecological Services (Wildlife Service). According to the Wildlife Service, the following species are classified as follows:
American Burying Beetle Endangered American Peregrine Falcon Recovery Eskimo Curlew Endangered, Possibly extinct Interior Least Tern Endangered Whooping Crane
Endangered
Piping Plover
Threatened
Neosho Mucket Mussel Candidate
Source: US Fish and Wildlife Service http://www.fws.gov/southwest/es/oklahoma
Chapter III - 5
2030 Osage County Comprehensive Plan
The American Burying Beetle (Beetle) was added to state and federal endangered species lists in August 1989 (Endangered American Burying Beetle Update, Article by Brett Ratcliff, Curator and Professor, University of Nebraska State Museum, http://www-museum.unl.edu/research/entomology/endanger.htm). The Beetle performs important ecological functions of cleaning up the carcasses of dead animals. Changes in habitat have been cited as a major cause and threat to the extinction of the Beetle. According to an article that appeared in the Daily Oklahoman on April 26, 2009 (Science: New Approach to Save Beetle Tried, Michael Overall), the Beetle has been referred to as after dark “undertakers”. The largest area of undisturbed native grasses left on the Great Plains is the Tallgrass Prairie Preserve in the County, and although this area is famous for its bison herd, it is also a sanctuary for the Beetle. The Beetle can grow to as large as two inches long with bright orange marking on their backs and once stopped road and highway construction projects in their tracks. Under a new “conservation banking approach,” ODOT “deposits” an equivalent sum of money as to what a “beetle survey” would cost (estimated at $2,500 for the first survey and $1,000 for each added survey – each mile of road requires a separate survey) into a conservation bank to protect the Beetle’s habitat at the Tallgrass Prairie Preserve and other places across Oklahoma. FLORA AND FAUNA The flora and fauna present in the County is shown on the Major Vegetation Groups – Map 4. The categories of vegetative groups shown on Map 4 include the following and the descriptions gained from consulting the USGS web pages and in particular at the web site with descriptions as follows (http://www.npwrc.usgs.gov/resource/birds/wiscbird/glossary.html): Woodland or Forested – Forest Land and includes deciduous, evergreen, and
mixed forest land and orchards Warm Season Crops – Any grass or species that reaches its peak growth and
photosynthetic activity typically between June 15 to August 30; these grasses usually flower after July 1 to July 15
Pasture – Pasture/Hay, areas of grasses, legumes or grass-legumes; agricultural land has been defined to include Cropland and Pasture
Lake/Reservoir and Pond – Lakes, reservoirs and ponds Grasslands – Openness of grassland, dominance of herbaceous vegetation in
landscapes characterized by the absence of major woody vegetation and the absence or low density of farmsteads and other major above-ground structures
Residential/Industrial - Developed areas
Chapter III - 6
2030 Osage County Comprehensive Plan
Riverine – Rivers, streams or creeks As shown on Map 4, the predominant categories of vegetative cover in the County appear to be Grasslands generally located west of the alignment of SH-99, and Woodland or Forested located east of SH-99. According to the web page for the Nature Conservancy:
The Oklahoma Tallgrass Prairie is the largest protected remnant of tallgrass prairie left on earth. Originally spanning portions of 14 states from Texas to Minnesota, urban sprawl and conversion to cropland has left less than 10% of this magnificent landscape. Since 1989, the Conservancy has proven successful at restoring this fully-functioning portion of tallgrass prairie ecosystem with the use of about 2,500 free-roaming bison and a “patch-burn” model approach to prescribed burning. Biodiversity threats in the area include habitat fragmentation and loss, current grazing and fire practices, invasive plant species such as sericea lespedeza and eastern red cedar, and stream degradation due to land management and soil erosion. (http://nature.org/wherewework/northamerica/states/oklahoma/preserves/tallgrass.html)
The 39,000 acre Tallgrass Prairie Preserve is home to the following types of important species of grass (http://www.okprairie.com/Grasses.htm):
Big Bluestem – Tallest variety, stem is blue green in color, stem divides into three segments, and can grow to 10’ tall. Little Bluestem – Stem grows up to four clusters, flowers have a feathery appearance and are white in the fall, and can grow 5’ to 8’ tall. Indian Grass (the Oklahoma State Grass) – Important plant eaten by livestock, grows in clumps or single stalks and leaves grow up to 2’ in length. Switch Grass - Bluish green leaves, very nutritious forage crop eaten by livestock, and grows 3’ to 6’ tall, this grass was mentioned as a resource for bio-fuel. Prairie Cord Grass – Can grow to 10’ tall, edges of leaves have short sharp teeth, also known as Slough Grass or Ripgut.
Map 4 shows the very broad category of Residential/Industrial vegetative cover located in those areas overlain by crosshatch for cities and towns. However, Map 4 also shows the cross hatch for the Sand Springs area to be predominantly Grasslands and basically undeveloped. According to an article by Jenk Jones cited earlier in the section on “History”, Mr. Jones prefers to describe major portions of the County as:
Chapter III - 7
2030 Osage County Comprehensive Plan
“THE OSAGE, because its geography and geology, plentiful wildlife and mix of vegetation, rich history and extraordinary cast of characters, stretches far beyond mere legal jurisdiction or tribal legacy, giving it almost a mystical cast. Here live the Osage Indians, once per capita the richest people on earth due to oil. Here is bluestem grass that many call the best grazing land in America. Here the wooded eastern half of the nation fades away as the drier conditions of the west take over, inhibiting tree growth…”
A plant that has become the nemesis of farmers and ranchers in the County is the Eastern Redcedar, which can be described in layman’s terms as perhaps the most prolific of any unwanted species in the County. According to an article that appeared in the Daily Oklahoman (Josh Rabe: 405-475-3260, [email protected]):
“One OSU [Oklahoma State University] study predicts the state [Oklahoma] will suffer more than $400 million in total losses from fire, lost grazing and water if cedars continue to grow at their current rate until 2013. The trees displace animals, especially birds and pose a fire hazard because they contain volatile oils that make them explosive under wildfire situation, Bidwell said. The trees also are adding to the [loss of the] state’s water sources. Just one juniper can take 30 gallons per day, an acre of land crowded [with] about 250 of the trees [can] suck up 55,000 gallons year, Bidwell said. The trees now line thousands of acres along a thundering stream that flows from the Canton reservoir to Oklahoma City.”
The abstract of a study entitled, “Eastern Redcedar Encroachment and Water Cycle in Tallgrass Prairie” (Oklahoma State University, ID 20090K141G) stated as follows:
“…In the Great Plains, tallgrass prairie is rapidly transforming to woodland largely by encroachment of Eastern Redcedar trees. Using Oklahoma as an example, of the 17 million acres of rangeland including prairie, eight million acres are currently overgrown with Eastern Redcedar. That number is increasing at an alarming rate equivalent to 762 acres per day…”
PHYSICAL AND NATURAL FEATURES – LAKES, PONDS AND NATURE PRESERVES The location of lakes and ponds, and parks and nature preserves is shown on the Physical and Natural Features - Map 5. The largest and perhaps best known of these areas is the Tallgrass Prairie Preserve located in the north central part of the County. As discussed above, this 39,000 acre area represents 10% of the total area of such grasses that remain in the US. The Nature Conservancy is constantly restoring the
Chapter III - 8
2030 Osage County Comprehensive Plan
ecosystem to its former natural state. The preserve is open to the public at no charge from dawn to dusk and is accessible by County roads. The Nature Conservancy has reintroduced Bison to the preserve, constructed scenic turnouts, hiking trails and picnic areas are available to visitors. The Tallgrass Prairie Ecological Research Station was completed in 2004 and offers field researchers an opportunity to conduct extended studies and initiate laboratory analysis for rangeland research.
Lakes, large and small, are located within the County and in some cases, as with Keystone, Skiatook, Hulah and Kaw Lakes, have been combined with wildlife management areas and waterfowl refuges. A directory of lakes is available on the web page of the Osage County Tourism Oversight Committee and the information gathered in the sections that follow is from the following other sources:
www.visittheosage.com;
www.owrb.pk.gov/quality/monitoring/bump/pdf/Current/Lakes.pdf;
www.shopoklahoma.org/oklakes;
www.wildlifedepartment.com/kaw.htm; www.wildlifedepartment.com/dahl.htm
Keystone Lake, Keystone Wildlife Management Area and Keystone Waterfowl Refuge: US Corps of Engineers Lake (Corps Lake), largest of County lakes with an area of 23,610 acres and 330 miles of shoreline, Walnut Creek State Park is located on the lake. The lake is a favorite of the catamaran crowd.
Skiatook Lake and Skiatook Wildlife Management Area: Corps Lake with an area of 10,190 acres and 160 miles of shoreline, fishing hotspot, among the most beautiful of the County lakes, located west of Skiatook and includes the Crystal Bay Marina, the CrossTimbers Marina and Resort (marina, dining and hiking), and Tall Chief Cove (RV and tent camping, beach, playground, boat launch and docks, trail and picnic shelters).
Kaw Lake and Kaw Wildlife Management Area: A Corps Lake with an area of 17,000 surface acres and 168 miles of shoreline constructed for flood control, water supply and quality, recreation and fish and wildlife. Kaw Lake and the Arkansas River form portions of the western boundary of the County. The 16,254-acre Kaw Wildlife Management Area joins the upper two-thirds of Kaw Lake in the western area of the County and is a mixture of upland and bottomland forest, tallgrass prairie, cropland and oil fields.
Chapter III - 9
2030 Osage County Comprehensive Plan
Avant Lake: Water supply for the Town of Avant located approximately one-half mile to the west of Avant.
Birch Lake: Birch Lake was built in 1977 and is a 1,137-acre Corps Lake that is located south of Barnsdall and south of SH-11. The Lake serves as a water supply, flood control and recreation area.
Bluestem Lake: Bluestem Lake serves as a secondary municipal water supply for the City of Pawhuska and serves the purposes of flood control and recreation.
Charlotte Lake: A small lake located near Shidler.
Fairfax Lake: A 111-acre reservoir owned and operated by the Town of Fairfax and managed as a water supply and recreational lake.
Hominy Lake: Hominy Lake was constructed in 1940 and is a municipal water supply owned and managed by the City of Hominy.
Hudson Lake: Water supply for Bartlesville and located northwest of Bartlesville in the northeastern portion of the County.
Hulah Lake: A 3,750-acre Corps Lake located in the far northeast corner of the County and borders the 266-acre Wah-Shah-She Reservoir that is located 15 miles north of Bartlesville. The Lake was constructed for flood control, water supply, low-flow regulation and conservation.
Pawhuska Lake: A small, deep City Lake constructed for the purpose of water supply and recreation in 1936 covering 96 acres with 3 miles of shoreline, located west of Pawhuska and south of US-60.
Phillips Lake: Water supply for Shidler located south of Shidler and east of SH-18.
Shell Lake: Shell Lake has an area of 573 acres and was built in 1922. The Lake is located north of Sand Springs and serves as a water supply reservoir for the City of Sand Springs and offers recreational opportunities.
Sunset Lake: Small private lake located between Pawhuska and Bartlesville.
Lake Waxhoma: Lake Waxhoma has an area of 197 acres, was constructed in 1955 and is owned and operated by the City of Barnsdall. The Lake is managed by Barnsdall as a municipal water supply and also offers recreational opportunities.
Chapter III - 10
2030 Osage County Comprehensive Plan
John Dahl Wildlife Management Area: Located approximately one mile east of Foraker and covers 480 acres and provides habitat for a variety of game species (quail, white-tailed deer, cottontail rabbits, coyote, bobcat and raccoon, dove, ducks and squirrel); and nongame species (the Greater Prairie Chicken, Bald Eagle and Upland Sandpiper); the Management area also includes two primitive campsites and fishing (http://www.wildlifedepartment.com/dahl.htm).
Osage Wildlife Management Areas (Rock Creek Unit - 3,722 acres and Western Wall Unit – 5,950 acres) are located 15 miles north of Pawhuska on SH-99 and provide habitat for a variety of game species (quail, white-tailed deer, Rio Grande turkey, cottontail rabbits, coyote, bobcat, raccoon, beaver and fox, dove, very limited waterfowl and Gray Squirrel); and nongame species (Greater Prairie Chicken in low numbers, and Bald Eagles seen occasionally in winter months), and one primitive camp ground on the Rock Creek Unit; fishing and camping are not permitted on the Western Wall Unit (http://www.wildlifedepartment.com/dahl.htm).
Woolaroc Wildlife Preserve, Woolaroc Museum: The Woolaroc Museum and Wildlife Preserve is located on SH-123 north of Barnsdall and was once the ranch and country home of oilman Frank Phillips, founder of the Phillips Petroleum Company. According to the Osage County Tourism Oversight Committee (www.visittheosage.com) the world class Museum features art and artifacts representing the history and culture of the American West. The grounds include the historic Lodge, ranch house and a 3,700-acre wildlife preserve and educational program.
Wah-Shah-She State Park: The 266-acre Wah-Sha-She State Park is located 15 miles north of Bartlesville on the eastern shore of Hulah Lake and includes the 3,750 acre Hulah Lake with 62 miles of shoreline.
Osage Hills State Park: The 1,100-acre Osage Hills State Park is located on Sand Creek approximately three miles east of SH-99 and south of US-60 and includes picnic tables and shelters, RV campsites and cabins, hiking trails and fishing.
Oklahoma Centennial Botanical Gardens: The Oklahoma Centennial Botanical Gardens is described as a “world class” botanical garden located seven miles northwest of downtown Tulsa in the Osage Hills. The master plan can be viewed online at www.oklahomacentennialbotanicalgarden.com/. The 160-acre site includes gnarled oaks, 400 plant species, ancient oak forest, sandstone 400-600 million years old and clay 15 million years old.
Chapter III - 11
2030 Osage County Comprehensive Plan
Keystone Ancient Forest: Located along the east shore of the Arkansas River and straddles the county lines of Osage and Tulsa County, with the majority of the 1,500-acre forest located in Osage County; it is also included with the annexation fenceline of Sand Springs and is owned by Sand Springs. The preserve area and old growth forest includes 300 year old cedars and 500 year old post oaks and represents what the “cross timbers” eco-region of Oklahoma looked like for centuries. The short stout oaks were not suitable for lumber production and the original cross timbers have often survived on the steep terrain that was unsuitable for farming (http://www.ci.sand-springs.ok.us).
John Zink Ranch and Foundation: The John Zink Ranch is located in the south central area of the County. John Zink was renowned for his philanthropic efforts. As chair of the John Zink Foundation, he oversaw the John Zink Ranch, which his father had established near Sand Springs, Oklahoma in 1945. Expanded over several decades to encompass 31,000 acres, the ranch is a private recreation area and game preserve. It also provides camping facilities for boy and girl scouts and features a museum full of Zink's race cars.
As chairman of the John Zink Foundation, Zink oversaw the operation of the Zink Ranch, which includes a 30,000-acre camping facility that hosts more than 10,000 boy scouts and girl scouts from around the world each year. The ranch also hosts hunters, fishermen, gun clubs, and motorcycle and car off-road competitions. Besides his great distinction in racing, he was an avid community benefactor. He served five terms as President of the Indian Nations Council of the Boy Scouts of America, Chairman of the Tulsa River Parks Authority, Oklahoma Wildlife Commission, Oklahoma Department of Wildlife Conservation, Tulsa Area United Way, Hillcrest Medical Center Foundation, Oklahoma Foundation for Excellence, Oklahoma Junior Livestock Auction, Tulsa County Fairgrounds Trust Authority, Young Presidents Organization and The Tulsa Foundation. John Zink passed away on February 5, 2005. MAJOR GEOLOGIC FORMATIONS Map 6 shows the Major Geologic Formations found in the Planning Area. Although the formations shown on Map 6 appear to be somewhat intermixed, the pattern of the formations is predominantly in strips lying adjacent to each other in a north-south pattern. The descriptions of the geological formations included in the text that follows were found at http://search.usgs.gov/geology/state/oklahoma. The most westerly formation east of Kaw Lake and surrounding the McCord area is Alluvium (loose gravel, sand or clay deposited by streams) along the Arkansas River and around Kaw Lake – this formation is overlain with a large area of the Oscar Group (shale with many layers of limestone with sandstone) and patches of Terrace Deposits (Alluvial deposits on one
Chapter III - 12
2030 Osage County Comprehensive Plan
or more terrace levels of unconsolidated gravels, sand, silt and clay). Terrace Deposits also stretch eastward along the Arkansas River to the shoreline of Keystone Lake. A band of the Vanoss Group (the Ada Group is overlain by the alluvial and terrace deposits in some parts) approximately 10 miles wide lies generally along the east side of SH-18. The Ada Formation (Group) (shale, red-brown to gray) lies east of the Vanoss Group bounded on the east by a wide band of the Vamoosa Group or Vamoosa Formation (alternating layers of shale and fine- to coarsely-grained sandstone with some limestone) that lies along the alignment of SH-99. East of the Vamoosa Group is a narrow band of the Tallant Formation (shale, sandstone, and thin limestone) that stretches from Prue on the south to the northeast corner of the County and Hudson and Hulah Lakes. A similar narrow band of the Barnsdall Formation (shale, siltstone, sandstone and thin limestone) lies east of the Tallant Formation followed by the Wann and Lola Formations or Lola Limestone (shale and fine- to medium-grained sandstone with many layers of fossiliferous limestone); the Wann and Lola Formation lie generally to the north and south of Skiatook Lake. The southeast areas of the County include the Nellie Bly Formation and Hogshooter Limestone (shale, limestone and sandstone) and Coffeyville and Checkerboard Formations or Checkerboard Limestone (underlying Checkerboard Limestone is crystalline limestone 2” to 15” thick). As shown on Map 6 and presented above, Limestone type formations or formations that include components of Limestone are the predominant geologic formations in the County as shown in the bolded Limestone term and terminology in the above section. An article cited earlier by Jenk Jones in the section entitled “History” states:
“…The Tallgrass Prairie Preserve, at the southern end of the Flint Hills that range down from Kansas, has rocks dating from 290 to 298 million years old, somewhat older than neighboring areas to the north. Slicing through the Tallgrass' eastern sector is the Cross Timbers, a natural barrier of tangled growth that helped separate Woodland and Plains Indians and a tough wall to breach for soldiers, pioneers and early-day oilmen. Sandstone underpins the eastern areas and helps trap moisture for those hardy trees that are the forest's advance guard; in the western areas, limestone nurtures the lush grasses that signal the beginning of the Great Plains. Both sandstone and limestone intermingle with shale….”
Fault Lines (defined as a surface along which the nearly horizontal sediment layers are broken and offset – http://pubs.usgs.gov/mf-maps) shown on the USGS based Map 6 appear concentrated in the central, south central and the eastern areas of the County. According to the Oklahoma Geological Society, from 1977 to 2005, a total of 1,701 earthquakes occurred in Oklahoma and only five took place in the County – a number that was unchanged for the County from 2000 to 2005. During that time period, the highest number of recorded earthquakes in the State (318) took place in Garvin County,
Chapter III - 13
2030 Osage County Comprehensive Plan
which is located in the far south central part of the State (http://www.okgeosurvey1.gov/level2). SLOPES, CONTOUR AND ELEVATIONS This section discusses slope and contour in terms of the degree of slope, contours of the land and ranges in elevation. Just as knowledge of area drainage basins/watersheds and soils is important to planning, so too is the knowledge of slope and contour, which will aid in site planning, site preparation and final construction by determining the different gradients and contours of a particular area or site.
The degree of slope in the County is shown on the Degree of Slope - Map 7. Map 7 presents the degree of the slope of the land by colors ranging from yellow (0-15 degrees, 0%-27% slope), to green (16-30 degrees, 28-58% slope) and then purple (greater that 30 degrees, greater than 58% slope). The darker purple color is shown to be common in the form of steep rock escarpments as would be found along the shorelines of major County Lakes. On the other hand, the relatively more flat slope shown in the yellow color is common in the more flat and middle areas of the County. Map 7 is useful for presenting and viewing the overall character of the land; however, even the 0-15 degrees (0%-27% slope) classification can include land in the upper range of this category that would in some cases be considered severely sloping for purposes of construction without incorporating very special site planning measures.
A slope of 5% to 10% presents moderate constraints to non-residential land developments. Streets constructed in areas at the upper level of this range presents problems for traffic circulation, particularly in bad weather due to the steepness of the streets, and special construction is required for intersections as well as for private drives. Septic systems may also be affected, particularly in conjunction with shallow soil coverage. Slopes of 11% to 20% can be impracticable for other than lower density residential or certain park and open space activities.
During the planning process, it is important to carefully consider the limitations of areas that have steep slopes with sharp contours and highly erodible soils. Development in these areas requires careful engineering and construction techniques to assure that the development constraints are properly addressed. Areas that include the characteristics of steep slopes and erodible soils should be considered for designation as Development Sensitive and Conservation Areas on the 2030 Plan.
Chapter III - 14
2030 Osage County Comprehensive Plan
The contour of land in the County is shown on the Contours - Map 8. Map 8 shows how the elevation of the County increases from the southeast to the highest elevation (1,116 feet or greater) in the northwest.
In general, slopes ranging from 0% to 5% are considered suitable for all land use activities. Major industrial development with significant horizontal space requirements typically seeks to locate within these areas. Installation of public utilities, including roads and transportation facilities, is easier and less expensive within areas having a 0% to 5% slopes.
The range in elevation of land in the County is shown on the Physical and Natural Features - Map 5. The highest elevation range, 1,116 feet or greater, is shown to be the predominant elevation of the northwest areas of the County stretching along SH-18 from north of US-60 and includes the Kaw Wildlife Management Area and the John Dahl Wildlife Management Area as well as the towns of Webb City, Shidler and Grainola. The range of 985 feet to 1,115 feet is the range commonly found along the ridgelines of the drainage basins of the major creeks that begin in the northwest areas and flow southeasterly. DEPTH TO BEDROCK
The ranges of depth to bedrock found in the County as mapped by the National Resource Conservation Service (NRCS) are shown on the Depth to Bedrock – Map 9. The range in depth in feet on Map 9 is shown as follows:
Greater than 60 inches
40 inches to 60 inches
20 inches to 40 inches
4 inches to 20 inches
Map 9 shows the greatest Depth to Bedrock (no coloration - greater than 60 inches) is found in the area of alluvial soils and bottom lands located along the Arkansas River and south boundary of the County, and also along the major creeks and lowest point of elevation of the watersheds. Depth to Bedrock of from 40 inches to 60 inches is found in the northwestern areas of the County in the vicinities of Grainola, Foraker, Shidler and Webb City. The shallowest Depth to Bedrock range of 4 inches to 20 inches are found
Chapter III - 15
2030 Osage County Comprehensive Plan
in the central and eastern areas of the County along SH-99; it is in these areas that some mining of limestone is taking place as discussed later in this Chapter. SOIL Soil formations are shown on the Major Soil Formations - Map 10. A detailed breakdown of soil characteristics is available in the NRCS Soil Survey of Osage County at http://websoilsurvey.nrcs.usda.gov. Soils are grouped on the basis of soil characteristics, including, but not limited to, permeability, percolation, ponding, drainage conditions, shrink-swell potential, depth to cemented pan, depth to hard/soft bedrock, soil texture, flooding frequency, filtering capacity, topography, seepage, subsistence, and organic content. These characteristics also influence their adaptation to non-agricultural uses for roads, residences and small commercial structures, and septic tank absorption. From viewing Map 10, it can be seen that the major soil formations found across the County appear to be formed in waves from the southwest to the northeast. This is particularly evident when examining the soil formations as they occur west of SH-18, along SH-18 and along SH-99, and as they change between SH-18 and SH-99. The Farmland Classification of soils found in the County classified as “Prime Farmland” and “Not Prime Farmland” is shown on the Prime Farmland - Map 11. As shown on Map 11, the predominant classification of Farmland Soils in the County is as Not Prime Farmland. Map 11 also demonstrates how Prime Farmland is found along the rivers and major creek systems in areas that correspond to a great extent with the 100-year floodplain as shown and discussed below.
Information concerning the different types of soil found in the Planning Area is useful in planning sites for residences, roads and highways, water and sewer systems, and determining the suitability of each soil classification for residential, commercial, industrial, or recreational development. From the data presented, the potential of each soil for specified land uses can be determined and any soil limitations associated with these land uses can be identified and mitigated if construction is to proceed.
The Soil Limitations on Roads - Map 12 shows that the majority of the County has a Very Limited Rating for road construction, the building and maintenance of which is a primary responsibility of the County. Again, this classification does not prohibit road construction, but does suggest that if roads are to be built and stand the test of heavy use and time, measures must be taken during site planning and construction to mitigate the limiting factors of the soils present. Two of the primary measures that will assure that the roads will withstand the test of use and time is the testing of the soils prior to construction and proper preparation of the roadway base.
Chapter III - 16
2030 Osage County Comprehensive Plan
The potential in the County for non-irrigated crop production capability is shown on the Non-irrigated Crop Production Capability - Map 13. The legend in Map 13 classifies crop production capability as follows: few limitations; requires at least some conservation measures; and conservation measures not corrective measures are required. As shown on Map 13, the western areas of the County appear to have the highest potential, although not without qualifications, for non-irrigated crop production potential.
The Soil Limitations on Dwellings and Small Commercial Structures - Map 14 shows that the majority of the County has a Somewhat Limited to Very Limited Rating for construction of dwellings and small commercial structures. This classification does not prohibit construction but does suggest that if construction of dwellings and small commercial structures is to take place, measures must be taken in the site planning and construction of the improvements to mitigate the limiting factors of the soils that are present.
The Soil Limitations on Septic Tank Absorption - Map 15 indicates that the vast majority of the Planning Area has a very limited rating for septic tank absorption and use. In some cases this limitation can be overcome by reducing the density of development and increasing the area of septic fields. However, if that is not possible, then lagoons, aerobic onsite systems and lagoons with or without public wastewater treatment facilities are required. The construction of septic systems is regulated by the Oklahoma Department of Environmental Quality (ODEQ), which is both the permitting and inspection agency for the construction of septic systems. In some areas of the County because of rapid suburban expansion of new homes that do not have access to a public sewage disposal system, the use of septic tanks and private on-site systems has increased greatly. This factor supports the need for additional public sewage disposal systems and any new development in urbanizing areas should utilize a public sewage disposal system. MAJOR GROUNDWATER AQUIFERS The Vamoosa-Ada Groundwater Aquifer (Aquifer) is the major such aquifer in the County and is shown on Major Groundwater – Map 16. This Aquifer begins approximately two miles east of SH-99 and extends west to approximately three miles west of SH-18 and from the Arkansas River on the south to the north boundary of the County and the Kansas State Line. According to US Geological Survey (USGS) Open-File Report 96-444 (Report):

Chapter III - 17
2030 Osage County Comprehensive Plan
“…The Vamoosa-Ada aquifer is an important source of water that underlies about 2,320 square miles of parts of Osage, Pawnee, Payne, Lincoln, Okfuskee, and Seminole Counties [in Oklahoma]. Approximately 75 percent of the water withdrawn from the Vamoosa-Ada aquifer is for municipal use. Rural domestic use and water for stock account for most of the remaining water withdrawn….Vamoosa-Ada aquifer consists of a complex sequence of fine- to very-fine grained sandstone, siltstone, shale, and conglomerate interbedded with very thin limestones….”
The Report goes on to say that the Aquifer stretches from south central Oklahoma through the County and north into Kansas and that the recharge rate is 1.52 inches per year. DRAINAGE BASINS AND WATERSHEDS The Drainage Basins and Watershed - Map 17 shows the major and minor drainage basins and watershed basins located within the Planning Area. The drainage basins and watersheds that flow into the Arkansas River and Keystone Lake, the drainage basins and watersheds that empty into Kaw Lake, the drainage basins and watersheds that flow into Hominy Creek and ultimately into Skiatook Lake and the Caney River that flows into and through Hulah Lake are among the major natural watershed features present in the Planning Area. It is also these rivers and creeks that define the major floodplain areas within the County as shown and discussed in the section below on floodplains. WETLANDS AND IMPAIRED STREAMS
Wetlands are among the most significant natural physical features that can impact any development proposal. According to the US Fish and Wildlife Service:
Wetlands provide a multitude of ecological, economic and social benefits. They provide habitat for fish, wildlife and a variety of plants. Wetlands are nurseries for many saltwater and freshwater fishes and shellfish of commercial and recreational importance. Wetlands are also important landscape features because they hold and slowly release flood water and snow melt, recharge groundwater, act as filters to cleanse water of impurities, recycle nutrients, and provide recreation and wildlife viewing opportunities for people (National Wetlands Inventory. http://www.fws.gov/wetlands).
For purposes of the 2030 Plan, the location of wetland areas should be included in the category of Development Sensitive and Conservation Areas. Regulation of any
Chapter III - 18
2030 Osage County Comprehensive Plan
development in wetland areas is controlled by the Environmental Protection Agency (EPA) and the Oklahoma Water Resources Board (OWRB). The National Wetlands Inventory and mapping would be a first and very preliminary point of contact in the “due diligence” portion of any development or construction activity where wetlands might be expected to be present. Wetlands mapping has been completed for Oklahoma. The Corps will provide some assistance in determination of wetlands being present to private/non-commercial activities. Commercial development proposals require that the developer hire a qualified expert in this area to do a “wetlands determination” for consideration by the Corps and possibly the issuance of the required 404 Permit prior to and as a condition of any approved development. Under some circumstances, development can be approved in wetlands and wetlands may be disturbed if they are restored as a part of the development in accordance with the 404 permit. Impaired streams within the County would be shown on the 303(d) List compiled by the ODEQ and as required by EPA. The “Water Quality in Oklahoma 2008 Integrated Report” listing impaired streams is updated every two years by the ODEQ. According to Richard B. Smith, INCOG Manager of Environmental and Engineering Services, the 303(d) List is a compilation of lakes and streams that are not meeting one or more beneficial uses assigned in the Oklahoma Water Quality Standards, or lakes or streams that might be expected to exceed water quality standards within the next two year period. (Source: Telephone and in person Interviews by Irving Frank with Richard B. Smith, INCOG Manager of Environmental and Engineering Services, December 4 and 8, 2009). Over the past 30 years, the USGS has taken the lead in developing delineations of watersheds. In the early 1980s, the USGS identified and mapped very large basins, and in the late 1980s the large basins were subdivided into several smaller basins. The USGS coding system used for these efforts is the Hydrologic Unit Code (HUC – shown as HUC-11 in the legend on Map 17, with the larger basins being HUC-8, and the smaller basins being HUC-11). From 2000 to 2005, the USGS further divided each HUC-11 into even smaller sub-basins and assembled the results into their National Hydrography Dataset (NHD) program. There are now NHD delineations of land uses as well as delineations of small watersheds, lakes and stream channels.
For water quality planning purposes, Oklahoma agencies began using a different kind of coding system years ago. While the geographic delineations for watersheds, lakes and streams are essentially the same, the numbers in the coding system are not. Oklahoma’s 303(d) List, for example, uses Oklahoma’s Waterbody Identification (WBID) numbering system. The USGS coding system is not used in the 303(d) List.
Chapter III - 19
2030 Osage County Comprehensive Plan
FLOODPLAINS The Floodplains - Map 18, depicts 100-year and 500-year “Special Flood Hazard Areas” as identified by the Federal Emergency Management Agency (FEMA) and shown on the respective Flood Insurance Rate Maps (FIRMs). A “Special Flood Hazard Area” is defined by FEMA as “...that area subject to inundation by the 1% annual chance floods…also known as the base flood…” on Map 18 shows the configuration of the last revision of the County FIRM maps adopted by the County in 2008. In some cases on the new maps the flood prone areas have expanded in definition and in other cases retracted from the previous maps. In several cases the flood study areas have been extended further along the upstream reach of the respective creeks to include areas that were prone to flooding but were not mapped by FEMA and identified as being located in a Special Flood Hazard Area.
Map 18 shows major 100-year floodplains to be located along the north shore of the Arkansas River from west of SH-99 to the where the River leaves Kaw Lake. Other floodplain areas are found along the major creeks such as Spring Creek in the northwest and north of Kaw Lake, Salt Creek that runs the north/south dimension of the County from the County/Kansas State line south to the Arkansas River, Hominy Creek, which starts in the central area of the south County south of US-60 and connects to the north end of Skiatook Lake, Bird Creek that starts northwest of Pawhuska and flows southeast to exit the County north of Skiatook, and Sand Creek that starts west of SH-99 and flows almost due east to exit the County south of Bartlesville. The Caney River also has its start at the County/Kansas State line and flows into Hulah Lake and then southeast to exit the County south of SH-10. The latest revision of the County’s Flood Damage Prevention Regulations was adopted in 2008. The responsibility for floodplain management and prevention is vested in the County’s Emergency Management Department and the official County Floodplain Manager.
Chapter III - 20
2030 Osage County Comprehensive Plan
CLIMATE AND WIND The following facts about the County’s climate were gathered from the Oklahoma Climatological Survey (www.ocs.ou.edu):
Temperature: Average Annual: 60 degrees Average Maximum: 72 degrees Average Minimum: 48 degrees Highest: 116 degrees, Pawhuska, July 18, 1936 Lowest: -26 degrees, Pawhuska, January 22, 1930 Days of 90 Degrees or Higher: 73 days Days of 20 Degrees or Lower: 29 days
Precipitation:
Average Annual: 39.78” Days with Precipitation: 79 Wettest Year: 66.02” in 1985 Driest year: 16.81” in 1956 Greatest Daily Rainfall: 10.42” in Barnsdall, September 29, 1986
Winter Weather: Average Annual Snowfall: 8.7” Days with Snow on the Ground: 7 days Greatest Seasonal Snowfall: 46.5” in 1987-1988 Greatest Daily Snowfall: 16.0” in Bartlesville, March 17, 1970
Spring - Last Freeze: April 6 Autumn - First Freeze: October 27 Growing Season: 202 days Other Facts about Climate:
Average Wind Speed: 9 mph Sunshine: 55-80% of the Year Average Humidity: 69% Thunderstorm Days: 50 days Hail Events: 6 per Year Tornadoes: 66 from 1950 to 2003 Land/Water Area: 97.7% Land and 2.3% Water* Climate Division: 3 - Northeast
*http://climate.mesonet.org/county/osage.html
Chapter III - 21
2030 Osage County Comprehensive Plan
AIR QUALITY The INCOG Region, within which the County and Planning Area are included, is also contained within the Tulsa Air Quality Management Area. Although the predominant nature of the County and its Planning Area would be considered rural/agricultural and perhaps even undeveloped, federal air quality standards, Ozone in particular, do apply to the entire County. Presently, air quality standards for Ozone are set by the EPA and in practice have shown a trend over the years to become more restrictive with each change. High standards and compliance with air quality standards are key elements in preserving the quality of life of all County residents. It is critically important to the health and well being of County residents and to the economic development of the Planning Area that the federal standards for Ozone not be exceeded; management of the overall Tulsa Air Quality program is vested in INCOG. The initiative for the air quality management program was started by INCOG in the 1990’s and the program still relies to a great extent on the voluntary compliance of motorists and industry in maintaining compliance with the Ozone standard. Compliance with the standard is monitored by stations located in the north, south, east and west portions of the metropolitan area. The northern monitor is located in Skiatook just east of the County boundary and the western monitor is located in Sand Springs just south of the County boundary. More detailed information about the Tulsa Air Quality Management Program is available at http://www.ozonealert.com. NOISE Presently no local noise standards have been developed for the County and its Planning Area. The management of noise in the environment typically is concerned with the management of noise beyond what would be expected to take place from the normal course of the events in a given area. For example, the noise from farming operations or the noise from construction activities would be what would be expected in such environments and should not be considered objectionable by persons living or working in such environments. The noise of highway traffic from expressways and major roads can be somewhat attenuated by the distances that habitable improvements, such as residences in particular, are built from such noise generators and by good land use planning such as to not allow such sensitive or incompatible development in high noise areas. In the case of expressways and interstate highways, sound walls may be required by federal standards to protect new and existing residential development from the noise of traffic on the roadways. It is often the case that problems with the generation of noise are related to such noise being a private nuisance, neighbor to
Chapter III - 22
2030 Osage County Comprehensive Plan
neighbor for example, as opposed to a public nuisance where entire areas might be impacted by the noise from a mining, industrial or other such use. ODOR Presently, no local odor standards have been adopted for the Planning Area. The proper control of odor is an important element of the quality of life for all County residents. Problems with odor can occur when the odor from a particular use is not what would be expected to be present in that area, such as odors from a unpermitted commercial use that might be generated in a residential area. The pungent odors from manufacturing operations would be expected in industrial areas but should be controlled by best management practices of the generators to decrease the impact on even the proximate industrial areas as well as to prevent such odors from wafting long distances to less intensely developed areas. The management and impact of odors can also be lessened by the proper transition in land uses as would be included in the locational and intensity land use planning principles of the 2030 Plan. However, if the odor is generated by the presence of hazardous materials, then federal and state standards are in place to control such emissions. VIBRATION Vibration is common and even expected in some environments and therefore acceptable. However, such vibration can become a serious nuisance to adjacent properties in other environments. For example, the areas adjacent to rock quarries and mining operations should expect such vibrations; if such mining and rock quarry operations were located in close to proximity to existing residentially developed land, such factors would become a public nuisance and even threats to the public health and property values; the permitting and local approval process for operations that create vibration which can be felt outside the boundaries of the subject tracts should take such impacts into consideration. In the County and rural/agricultural areas, operations that can create vibrations are a fact of the landscape and incompatible low intense uses should not be allowed to locate in close proximity to such uses. DUST Presently, no federal or state standards have been adopted for dust, which can also be referred to as a form of “particulate matter” in the air. The worst case scenarios in Oklahoma hearken back to the “Dust Bowl Days.” As with noise, odor and vibration, dust is common and even expected, at least on occasion, in or adjacent to industrial or
Chapter III - 23
2030 Osage County Comprehensive Plan
non-industrial land uses. However, the winds common to the County, combined with poor agricultural practices or mining operations, can create major problems with dust and even create as serious of a soil erosion problem as water. Dust can also be generated by large areas being excavated for development. For construction sites, the present regulatory mitigation of erosion comes under the requirements of the EPA as administered by the ODEQ in the form of a stormwater general permit for construction activities. This permit requires filing a Notice of Intent (NOI) to obtain permit coverage. The NOI requires that a Stormwater Pollution Prevention Plan (SWP3) be prepared and adopted by the party disturbing the land that demonstrates what measures will be taken to mitigate erosion (that can also mitigate dust) on the site. An NOI is required when greater than one acre is being disturbed; however, agricultural operations are exempt from the requirements of the general permit. In the case of agricultural operations, consultation with the US Department of Agriculture is available for farmers and ranchers. In the case of non-agricultural operations, consultation and assistance should be sought the National Resource Conservation Service (NRCS). SENSITIVE ENVIRONMENTAL SITES The category of sensitive environmental areas includes such items as landfills and trash mountains, and Brownfields and Superfund Sites. Landfills and Trash Mountains. Landfills and trash mountains can have a particularly negative impact on the surrounding area in appearance and operation; in the County, approval by the Board of Adjustment is required after public hearings that typically generate loud protests from surrounding land owners. Such operations can also result in a “trash mountain” so tall that it is totally out of character and scale with the topography of the surrounding area. In Oklahoma, ODEQ is responsible for permitting landfills and will issue such permits only if the local governing body approves the zoning prior to approval of the State permit. Heavy truck traffic, noise of the equipment required to maintain the dumping operation and blowing papers and debris can result if the operation is poorly managed. In the County, the American Environmental Landfill, Inc. (“Landfill” - operated by American Waste Control, Inc.) is the name of the former Shell Creek Landfill that is located three (3) miles west of Sand Springs on 177th West Avenue. In 2001, American Waste Control bought the former Shell Creek Landfill that was on the brink of being closed by the ODEQ for repeated violations. Today, this operation is said to be a “poster child” of how to run such an operation and is held up by State and local officials as an example of how to operate such a landfill. The operation is a local/family run business and employs 100 persons, has 4,000 customers and serves 3,000 of Tulsa’s
Chapter III - 24
2030 Osage County Comprehensive Plan
approximately 9,000 commercial accounts. American Waste Control is among the nation’s top 100 waste management companies. americanwastecontrol.com/pdf/Tulsa World July 11 2004.pdf; nancy,[email protected] Brownfield and Superfund Sites. Presently, there are no recognized Brownfield or Superfund Sites in the County. The Osage Nation is seeking funding for a railroad right-of-way area on the south side of the Pawhuska Downtown Business District for clean up and reuse as a Brownfield site.
THE BUILT ENVIRONMENT
This section of Chapter III analyzes selected features of the built environment that influence and in some cases constrain development. Specific attention is directed towards the following environmental features of the built environment:
Water/Wastewater Districts and Facilities – Municipal and Rural Water Systems - Map 19
Transportation Systems
Major Streets and Highways and Trails – Map 20
Functional Classification for Highways and Roads – Map 21
WATER AND WASTEWATER DISTRICTS AND FACILITIES – MUNICIPAL AND RURAL WATER DISTRICTS
Water service districts and facilities located in the County are shown on the Municipal and Rural Water System - Map 19. The detailed features shown on Map 19 are described as follows:
Water Well Use: Public; domestic; irrigation and agriculture; commercial, industrial, institutional and mining; monitoring, observation and all other.
Water Facility Type: Pump; standpipe; water tank; water well; and water tower.
Water Providers: Town of Avant, Town of Burbank, Town of Fairfax, Town of Osage, Town of Prue, Town of Skiatook, City of Barnsdall, City of Pawhuska and
Chapter III - 25
2030 Osage County Comprehensive Plan
City of Shidler. In most cases, the systems are operated by public works authorities. It is not uncommon for a city or town to provide service to areas outside and abutting its incorporated area.
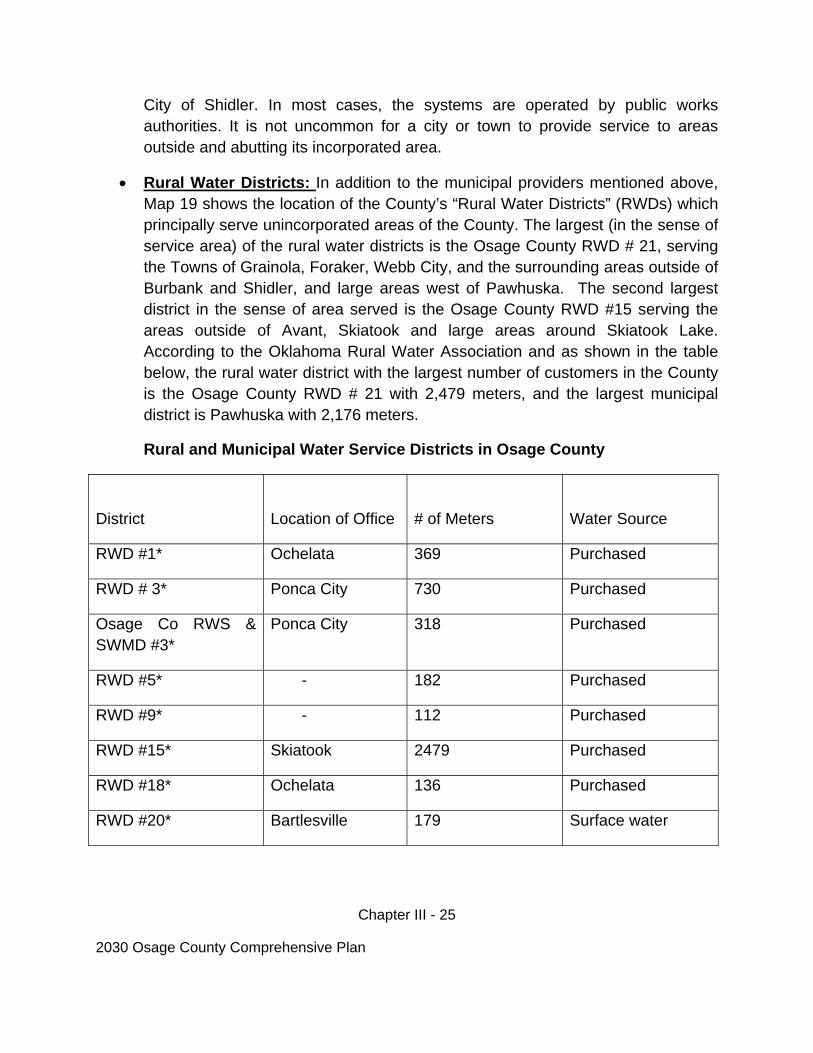
Rural Water Districts: In addition to the municipal providers mentioned above, Map 19 shows the location of the County’s “Rural Water Districts” (RWDs) which principally serve unincorporated areas of the County. The largest (in the sense of service area) of the rural water districts is the Osage County RWD # 21, serving the Towns of Grainola, Foraker, Webb City, and the surrounding areas outside of Burbank and Shidler, and large areas west of Pawhuska. The second largest district in the sense of area served is the Osage County RWD #15 serving the areas outside of Avant, Skiatook and large areas around Skiatook Lake. According to the Oklahoma Rural Water Association and as shown in the table below, the rural water district with the largest number of customers in the County is the Osage County RWD # 21 with 2,479 meters, and the largest municipal district is Pawhuska with 2,176 meters.
Rural and Municipal Water Service Districts in Osage County
District
Location of Office
# of Meters
Water Source
RWD #1* Ochelata 369 Purchased
RWD # 3* Ponca City 730 Purchased
Osage Co RWS & SWMD #3*
Ponca City 318 Purchased
RWD #5* - 182 Purchased
RWD #9* - 112 Purchased
RWD #15* Skiatook 2479 Purchased
RWD #18* Ochelata 136 Purchased
RWD #20* Bartlesville 179 Surface water

Chapter III - 26
2030 Osage County Comprehensive Plan
RWD # 21* Grainola 500 Wells
Avant Utility Authority Avant 170 Surface Water
City of Barnsdall Barnsdall 376 Surface Water
Birch Creek RWD* Pawhuska 22 Wells
Burbank PWA** Burbank 60 Purchased
Fairfax PWA** Fairfax 745 Surface
Grayhorse RWD* Fairfax 80 Purchased
City of Hominy PWA** Hominy 670 Surface Water
New Prue PWA** Prue 189 Wells
Osage PWA** Osage 114 Wells
Pawhuska PWA** Pawhuska 2176 Surface
Shidler PWA** Shidler 152 Surface Water
Skiatook PWA** Skiatook 2083 Purchased
Strike Axe Water Co.* Bartlesville 382 Purchased
Webb City Uses RWD#21
Town of Wynona Wynona 245 Wells
*Rural Water Districts ** Public Works Authority
As discussed above, several of the cities and towns own and manage a lake that serves as the municipal water supply. In many cases these water bodies also serve the joint purpose of recreation for local residents and visitors. The location of recreation opportunities at the lakes in the County may be found on www.visittheosage.com.
Map 19 also shows the locations and identifies the few water districts that have been combined with wastewater districts as is the case for the Osage County RWS and
Chapter III - 27
2030 Osage County Comprehensive Plan
SWMD #3, and the Bressie Water, Incorporated. Bressie is authorized to supply wastewater services, but does not do so at the present time. TRANSPORTATION SYSTEMS The existing network of roads and highways within the County form the basic transportation network for the movement of people and goods both within and through the County. The local roads and highways also provide views and vistas of the pristine beauty of the County. wwwvisittheosage.com
The boundaries of each of the County Commissioners’ Districts, as shown on Map 2, are based on balancing the population; however, road miles maintained by each individual Commissioner is disproportionate to that population as shown below:
Commissioner District* County-maintained Road Miles*
District 1 894.36 Miles
District 2 183.37 Miles
District 3 630.14 Miles
* Mileage numbers are from ODOT.
The Major Street and Highways and Trails - Map 20, shows the designation and network of State (SH) and United States (US) highways within the County, as well as the classification/condition of bridges, the location of airports, and the existing and planned network of trails. The functional classification of roadways and highways within the County is shown on the Functional Classification for Highways and Roads – Map 21.
Within the County, “highways” are designated as either US or SH as shown on Map 20. The “functional classification” of roads within the Planning Area by the ODOT is shown on Map 21 and is as follows:
Principal Arterial: US-60 through Pawhuska and SH-20 through Skiatook
Minor Arterial: SH-18, SH-99, SH-11 and SH-97 and SH-97T
Chapter III - 28
2030 Osage County Comprehensive Plan
Major Collector-Highway: SH-11 West of Shidler, SH-20 West of Skiatook, SH-97 and SH-97T north of Sand Springs, SH-123, and SH-18
Major Collector-County: Numerous Multiple Connections Highway to Highway and Town to Town – Best Example is North 52nd West Avenue serving from Tulsa on the South to Skiatook on the North.
Minor Collector – Extensive Network of County Roads and Highways
Other Roads – Typically Section Line Roads
US-60 forms the major east/west movement across the County and is the only US Highway (Map 20) and Principal Arterial (Map 21) serving the central portions of the County. US-60 connects Bartlesville on the east, to Pawhuska, Burbank, McCord and Ponca City on the west. US-60 also provides connections to SH-99 at Pawhuska and SH-18 east of Burbank. US-60 has been designated as the Osage Nation Heritage Trail Scenic Byway from Bartlesville on the east to Ponca City on the west.
US-412/-64 (locally referred to west of Tulsa as the Sand Springs Expressway and/or the Keystone Expressway) enters the County east of Sand Springs intersecting with SH-97 and then SH-151, and then crossing the Arkansas River into Pawnee County.
Supporting east/west movement is provided by SH-10, -11, and -20. SH-10 connects the most northwesterly areas of Washington County to SH-99 north of Pawhuska. SH-11 travels north from Skiatook at its intersection with SH-20 serving Avant, Wolco, Tallant, Pershing, Barnsdall and connects to SH-99 north of Wynona and south of Pawhuska. The SH-11 designation picks up again on the northwest at Shidler at its intersection with SH-99, serving Webb City to the north and then exiting the County north of Kaw Lake. SH-20 is a major east-west artery within the southern area of the County connecting Skiatook on the east to Hominy and then to SH-18 and the Ralston area south of the Arkansas River in Pawnee County.
Major north/south movement within and through the County is provided by SH-18 and SH-99 and also to some extent by SH-97 and SH-97T and SH-123. SH-18 serves the western areas of the County from its connection to SH-20 on the south in the Ralston area, then north to Fairfax, to its intersection with US-60 just east of Burbank, then north to Shidler, past Webb City and east of Foraker, to Grainola and then north across the County and Kansas State Line. SH-99 enters the County on the south from a bridge across the Arkansas River north of Cleveland and Pawnee County, then travels north to
Chapter III - 29
2030 Osage County Comprehensive Plan
Hominy, Wynona, and intersects with SH-11 south of Pawhuska and then north to the County/Oklahoma State Line and then to Sedan, Kansas on the north. SH-97 travels north from Sand Springs and then north to Skiatook Lake and then Skiatook. SH-123 begins at SH-11 east of Barnsdall and travels north into Bartlesville and Washington County.
The symbology showing the condition of County bridges is shown on Map 20, and attests to the critical need for continuing major improvement programs for County bridges during the Planning Period. Almost every major street or highway shown on Map 20 has a bridge included in one of the following State Classifications:
Not Classified
Structurally Deficient: According to ODOT, a structurally deficient bridge is inadequate to carry legal loads, whether caused by obsolete design standards, structural deterioration, or waterway inadequacy. Structures in this category may include those posted to restrict load limits as well as those closed to all traffic.
Structurally Deficient and Posted Weight Limit: See ODOT definition of structurally deficient above; no bridge will be classified by ODOT as both structurally deficient and functionally obsolete.
Functionally Obsolete: According to ODOT, a functionally obsolete bridge is inadequate to properly accommodate the traffic due to inadequate clearances (either horizontal or vertical), approach roadway alignment, structural condition, or waterway adequacy. Any posted bridge which is not structurally deficient would be included in this category. Structures in this category could include narrow bridges.
Functionally Obsolete and Posted Weight Limit: See ODOT definition of functionally obsolete above.
Several of the necessary bridge improvement projects have been included in the adopted Osage County 5 Year Plan – a five-year plan that will be discussed in detail in Chapter IV. The present and continuing support of the Osage Nation for the County’s road and bridge improvement program has been and will be a key factor in meeting the maintenance and replacement needs of bridges in the Planning Period.
Chapter III - 30
2030 Osage County Comprehensive Plan
Map 20 also includes information on the following classifications of trails within the County:
Existing Multi-Use Trail
Planned Bikeway
Planned Multi-Use Trail
An extensive network of existing and planned multi-use trails is shown in the southeast and most populated areas of the County with a major planned multi-use trail shown from Skiatook north to Avant and then Barnsdall. A major existing multi-use trail is the Osage Prairie Trail, which connects to SH-20 in Skiatook and continues south to Tulsa.
Map 20 also shows the location of the following classifications of airports:
Large Municipal Airport: Bartlesville
Small Municipal Airport: Hominy, Pawhuska, Skiatook and Pogue Airport in Sand Springs
Ranch Airstrip: Several private ranch airstrips are shown scattered across the western/central areas of the County serving the large ranches
OSAGE COUNTY TRANSPORTATION MANAGEMENT AREA (TMA) The boundaries of the INCOG Transportation Management Area (TMA) are shown on the Osage County Transportation Management Area Portion of the Regional Transportation Plan – Map 22. According to INCOG, the County portion of the TMA has an area of 256.63 square miles, which is only 8.99% of the total County area. However, the TMA also includes the most populated areas of the County including portions of Skiatook, Sand Springs and Tulsa. The symbology in the legend on Map 22 shows the following classifications of roads and highways:
Expressway 4-lane, Existing: Osage/Tisdale Expressway in Tulsa
Expressway 4-lane, Planned: Gilcrease Expressway in the County and Tulsa
Arterial 4-lane, Existing: SH-20
Chapter III - 31
2030 Osage County Comprehensive Plan
Arterial 4-lane, Planned: N. 52nd West Avenue
Arterial 2-lane, Existing: A network of arterials that includes but is not limited to New Prue Road, West 43rd Street North west of N. 52nd, SH-97 and SH-97T, Rock School Road, Shell Creek Road and Ranchland Road
Arterial 2-lane, Planned: Extension of SH-97 to connect to Lake Road and SH-20; extension of 43rd Street North to connect to a planned extension of SH-97, and a connection from Shell Creek Road west to N. 177th Street West
Collector 2-lane, Existing: SH-97 south of Rock School Road north of Sand Springs
Proposed Corridor Beyond 2030: Extension of the Osage Expressway from the planned Expressway to Skiatook and SH-20
The TMA includes the most rapidly growing of all of the areas in the County and of the parts of the County that have been incorporated into Sand Springs, Skiatook and Tulsa. Key projects necessary to support the present and continuing growth of the County and this portion of the TMA are the extension of SH-97 to the north to Skiatook, SH-20 and the Skiatook Lake area, extension and relocation of SH-97 from north of Sand Springs to Skiatook and the Skiatook Lake area, and completion of the Gilcrease Expressway from the Osage Expressway on the east and then west and south across the Arkansas River to connect to West 41st Street South and I-44 south of Sand Springs. The Gilcrease Expressway has been in the planning stages since 1961; in 2010 HB 3220 was signed into law authorizing the Oklahoma Turnpike Authority to conduct a feasibility study for completion of the Expressway. If the feasibility study determines that construction of the Gilcrease Expressway is feasible as a toll road, then construction could be completed within 10 to 12 years. However, if it is determined to not be feasible to construct a toll road, then the expected time for completion would be 2052.
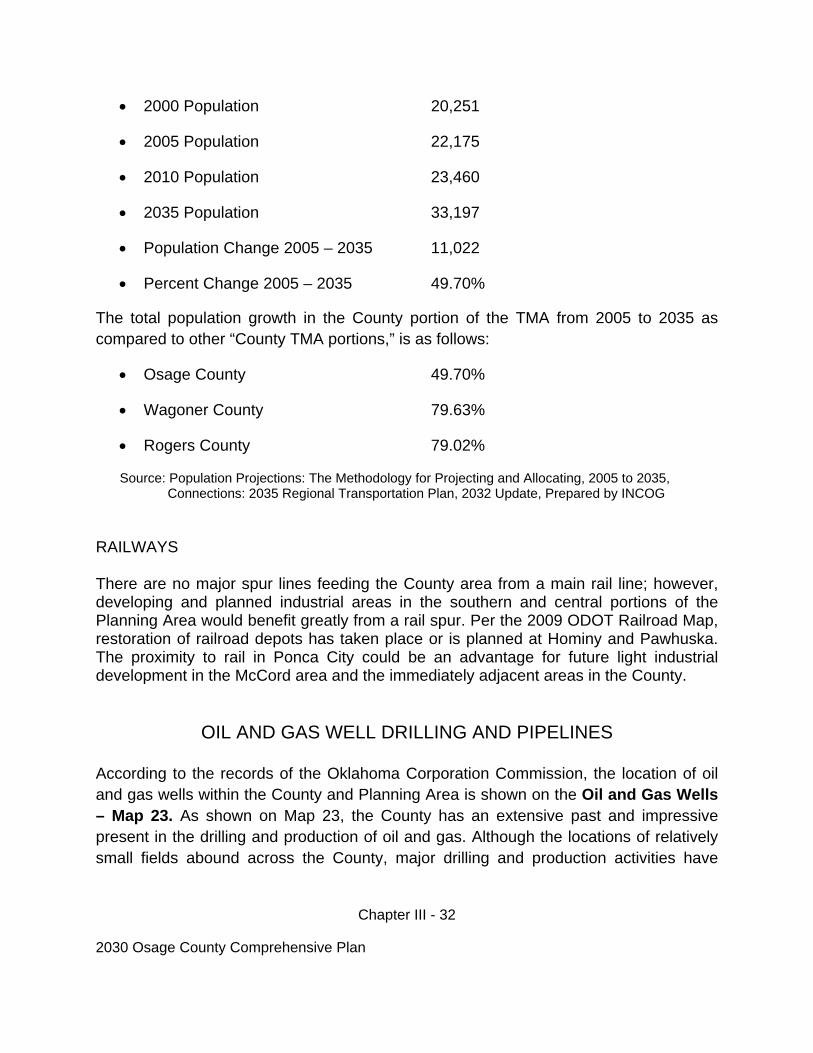
According to population data in the 2035 INCOG Long Range Transportation Plan update, the population of the County portion of the TMA was projected to grow as follows:
Chapter III - 32
2030 Osage County Comprehensive Plan
2000 Population 20,251
2005 Population 22,175
2010 Population 23,460
2035 Population 33,197
Population Change 2005 – 2035 11,022
Percent Change 2005 – 2035 49.70%
The total population growth in the County portion of the TMA from 2005 to 2035 as compared to other “County TMA portions,” is as follows:
Osage County 49.70%
Wagoner County 79.63%
Rogers County 79.02%
Source: Population Projections: The Methodology for Projecting and Allocating, 2005 to 2035, Connections: 2035 Regional Transportation Plan, 2032 Update, Prepared by INCOG
RAILWAYS There are no major spur lines feeding the County area from a main rail line; however, developing and planned industrial areas in the southern and central portions of the Planning Area would benefit greatly from a rail spur. Per the 2009 ODOT Railroad Map, restoration of railroad depots has taken place or is planned at Hominy and Pawhuska. The proximity to rail in Ponca City could be an advantage for future light industrial development in the McCord area and the immediately adjacent areas in the County.
OIL AND GAS WELL DRILLING AND PIPELINES
According to the records of the Oklahoma Corporation Commission, the location of oil and gas wells within the County and Planning Area is shown on the Oil and Gas Wells – Map 23. As shown on Map 23, the County has an extensive past and impressive present in the drilling and production of oil and gas. Although the locations of relatively small fields abound across the County, major drilling and production activities have
Chapter III - 33
2030 Osage County Comprehensive Plan
taken place in and around Webb City, Shidler and south almost to SH-20. Major drilling and production has also taken place in the far southeastern portions of the County to the north of the areas incorporated into Tulsa. The Osage Nation has retained its ownership of the subsurface mineral rights and this fact alone has brought the Osage Nation and other non-Osage people great wealth and economic prosperity over the years. As pointed out by Jenk Jones in the preceding section on History, the oil barons were one of the “Four pillars of the Osage.” Names such as Frank Phillips, L.E. and Waite Phillips, J. Paul Getty, E.W. Marland, Harry Sinclair, W. G. “Bill” Skelly, H.V. Foster, Josh Cosden, Tulsa's Zarrow family and Alf Landon were among the many who struck success in the oil industry.
Today, the location of active oil and gas wells and pipelines, and especially the wells never documented or long taken out of production are major determinants of the uses that can be made of the surface of such lands.
The location of oil and gas pipelines is shown on the Oil and Gas Pipeline System – Map 24. The pipelines shown on Map 24 are classified as Gas Transmission Lines or Hazardous Liquid Transmission Lines. The materials transported in the various pipelines include crude oil, natural gas and anhydrous ammonia. As shown on Map 24, the area just north of Barnsdall is the location of the convergence of several major gas pipelines located within the County.
Due to national and homeland security concerns, the exact routing of such facilities is not generally widely published and such information is determined only based on an inquiry (such as for development or excavation) about a specific site and for stated purposes. The concern for the location of oil and gas wells for development or the building of roads also extends to the locations of pipelines. In general, the location of pipelines is well documented if such activity took place after the Oklahoma Corporation Commission began their system of record keeping in the early 1900’s. These locations can also be gained from inquiries to subsurface records agencies, such as Call Okie; however, based on the extensive and early County history of drilling, and the construction of pipelines and collection systems large and small, great care and attention must be paid to pipelines as a determinant of development and just local construction and excavation.
Chapter III - 34
2030 Osage County Comprehensive Plan
MINING ACTIVITIES
According to the State of Oklahoma Department of Mines, the location of mines within the County is shown on the Currently Permitted Mining Operations – Map 25. It appears from Map 25, that no mining operations of any type have been permitted west of SH-18 and only scattered such operations are shown west of SH-99 except south of Pawhuska.
The classification of the scale and type of mining activities shown on Map 25 is as follows:
Coalbed Methane Wells
Small Scale Operations
Large Scale Operations
The materials shown to be mined within the County include the following:
Coalbed Methane Wells: Coalbed Methane Well locations are shown to be widely dispersed across the eastern portion of the County with concentrations of activity shown south of Pawhuska, west of Skiatook Lake, in the vicinity of Prue, and in the Sand Springs area.
Limestone: Two Small Scale Limestone mining operations are shown on Map 25: one is located just east of Burbank and the intersection of SH-18 and SH-60; and the second is located southwest of Skiatook Lake. The only Large Scale Limestone mining operation is shown in the vicinity of Pawhuska Lake and Bluestem Lake.
Clay and Shale: The only Small Scale Clay and Shale mining operation is shown north of the Bartlesville Municipal Airport.
Sand and Gravel: Only Small Scale Sand and Gravel operations are shown west of Sand Springs and along the Arkansas River.
Sand: The only Small Scale Sand mining operation shown on Map 25 is located west of Sand Springs and along the Arkansas River, in proximity with the locations shown for the Sand and Gravel mining.

Chapter III - 35
2030 Osage County Comprehensive Plan
SCHOOL DISTRICTS AND CAREER TECHNICAL SCHOOL DISTRICTS
The major elements of the inventory of the 2030 Plan discussed in this section of Chapter III include school districts and career technical school districts. The boundaries of such areas and could be described as “man-made geography.” However arbitrary these boundaries might seem, each often becomes the basis of the formation of some type of local identity, school districts in particular.
School Districts
The boundaries of the school districts located within the Planning Area are shown on the School Districts – Map 26. In most cases the boundaries of the district reflect the names of the city or town they serve such as McCord, Bowring, Hominy, Wynona, Pawhuska, Barnsdall, Avant, Prue, Skiatook, Sand Springs, Sperry and Tulsa. Map 26 also shows how district boundaries extend beyond city and even the County boundaries such as the cases of Ponca City, Bartlesville, Tulsa and Cleveland.
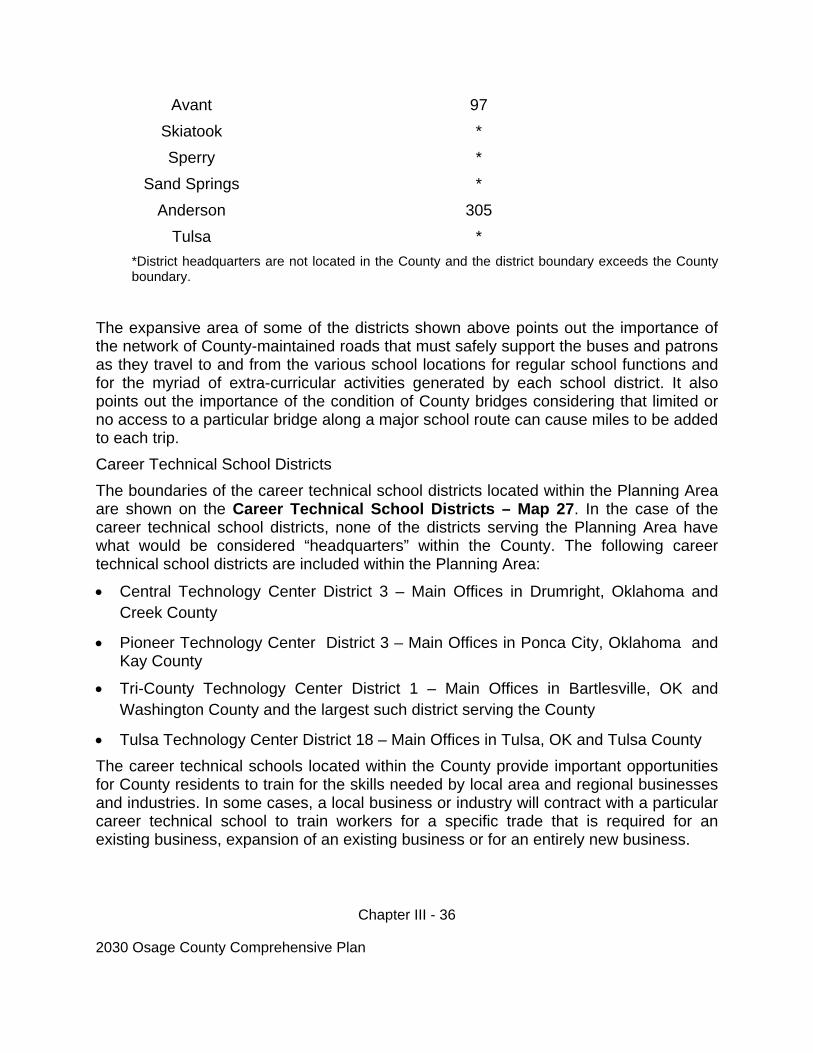
The district name and number of students in the various school districts contained totally within the Planning Area is as follows:
District Name Number of Students
Shidler 786
McCord 237
Woodland 880
Pawhuska 1812
Hominy 274
Cleveland *
Wynona 130
Prue 290
Bowring 69
Dewey *
Bartlesville *
Osage Hills 190
Barnsdall 451
Caney Valley *
Chapter III - 36
2030 Osage County Comprehensive Plan
Avant 97
Skiatook *
Sperry *
Sand Springs *
Anderson 305
Tulsa *
*District headquarters are not located in the County and the district boundary exceeds the County boundary.
The expansive area of some of the districts shown above points out the importance of the network of County-maintained roads that must safely support the buses and patrons as they travel to and from the various school locations for regular school functions and for the myriad of extra-curricular activities generated by each school district. It also points out the importance of the condition of County bridges considering that limited or no access to a particular bridge along a major school route can cause miles to be added to each trip.
Career Technical School Districts
The boundaries of the career technical school districts located within the Planning Area are shown on the Career Technical School Districts – Map 27. In the case of the career technical school districts, none of the districts serving the Planning Area have what would be considered “headquarters” within the County. The following career technical school districts are included within the Planning Area:
Central Technology Center District 3 – Main Offices in Drumright, Oklahoma and Creek County
Pioneer Technology Center District 3 – Main Offices in Ponca City, Oklahoma and Kay County
Tri-County Technology Center District 1 – Main Offices in Bartlesville, OK and Washington County and the largest such district serving the County
Tulsa Technology Center District 18 – Main Offices in Tulsa, OK and Tulsa County
The career technical schools located within the County provide important opportunities for County residents to train for the skills needed by local area and regional businesses and industries. In some cases, a local business or industry will contract with a particular career technical school to train workers for a specific trade that is required for an existing business, expansion of an existing business or for an entirely new business.
Chapter III - 37
2030 Osage County Comprehensive Plan
As shown on Map 27, the Tri-County Technical District 1 is the largest of such districts that serve the County. The formation of technical districts must be approved by a vote of the people; districts are funded by an ad valorem property tax, which can vary by district. Technology Centers offer a variety of classes for different populations including high school student day courses, trade courses such as welding, auto collision repair, and curriculums with degrees such as nursing, as well as community education activities such as short courses on photography, computer skills, and entrepreneurship.
ZIP CODE TABULATION AREAS
Postal names and zip code tabulation numbers are also significant sources of identity and local post offices are often particular icons of identity. Zip code tabulation areas located within the Planning Area are shown on the Zip Code Tabulation Areas Map – Map 28. Zip code tabulation names and areas often extend well beyond the corporate boundaries and may also extend from the County into an abutting county or vice versa. The majority of the County’s cities and towns, however small, are typically home to a local post office. The following is a numerical list of the zip code tabulation areas and the names of the respective post offices as shown on Map 28:
Zip Code Tabulation Number Post Office Name/County – Area Served
74604 Ponca City/Kay and Osage – McCord
74633 Burbank/Osage County
74650 Ralston/Pawnee – Southwest
74637 Fairfax/Osage County
74652 Shidler/Osage County
74056 Pawhuska/Osage
74084 Wynona/Osage County
74035 Hominy/Osage County
74020 Cleveland/Pawnee County – Osage County
74054 Osage Town/Osage
74022 Copan/Osage and Washington – Osage County
74003 Bartlesville/Washington and Osage – Northeast
Osage County
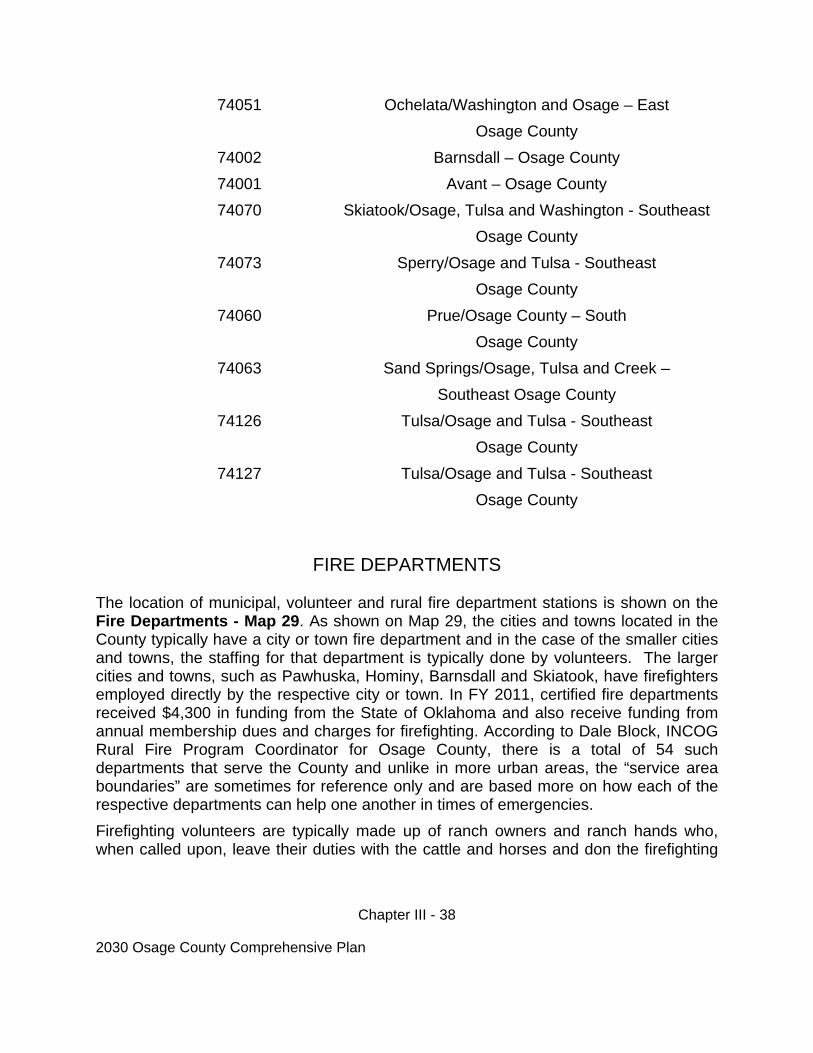
Chapter III - 38
2030 Osage County Comprehensive Plan
74051 Ochelata/Washington and Osage – East
Osage County
74002 Barnsdall – Osage County
74001 Avant – Osage County
74070 Skiatook/Osage, Tulsa and Washington - Southeast
Osage County
74073 Sperry/Osage and Tulsa - Southeast
Osage County
74060 Prue/Osage County – South
Osage County
74063 Sand Springs/Osage, Tulsa and Creek –
Southeast Osage County
74126 Tulsa/Osage and Tulsa - Southeast
Osage County
74127 Tulsa/Osage and Tulsa - Southeast
Osage County
FIRE DEPARTMENTS
The location of municipal, volunteer and rural fire department stations is shown on the Fire Departments - Map 29. As shown on Map 29, the cities and towns located in the County typically have a city or town fire department and in the case of the smaller cities and towns, the staffing for that department is typically done by volunteers. The larger cities and towns, such as Pawhuska, Hominy, Barnsdall and Skiatook, have firefighters employed directly by the respective city or town. In FY 2011, certified fire departments received $4,300 in funding from the State of Oklahoma and also receive funding from annual membership dues and charges for firefighting. According to Dale Block, INCOG Rural Fire Program Coordinator for Osage County, there is a total of 54 such departments that serve the County and unlike in more urban areas, the “service area boundaries” are sometimes for reference only and are based more on how each of the respective departments can help one another in times of emergencies.
Firefighting volunteers are typically made up of ranch owners and ranch hands who, when called upon, leave their duties with the cattle and horses and don the firefighting

Chapter III - 39
2030 Osage County Comprehensive Plan
gear whenever and as long as they are needed. As shown on Map 29, the respective fire departments are often named for the headquarters city or town (Pawhuska, McCord, Grainola or Avant), but are also named based on the name of the geographical area they serve (Grayhorse Indian Village, Little Chief, Buck Creek, or Frontier Shores). The naming of these local departments is also a factor that reinforces the local identity of the area residents.
ELECTRICAL SYSTEMS AND WIND ENERGY
The Electrical System - Map 30 shows the service areas for the electrical supply companies located within the County. Electrical power is provided within the County by municipalities and by electric coops. Pawhuska and Hominy are municipal power cities, and only Pawhuska has the capacity for backup power generation. The boundaries of the service districts are determined by the Oklahoma Corporation Commission and only on rare and agreed to cases does a rural coop agree to allow its customers to be served by a municipal or other power company. In 1995 the Pawhuska City Power Plant was repowered after the Oklahoma Municipal Power Association (OMPA) and Pawhuska signed an agreement to repower one of the two existing steam units through the construction of a gas turbine. The repowered unit is capable of producing a combined output of approximately 62 megawatts. This project represents OMPA’s first fully-owned and initiated power supply projects. In 2003, OMPA installed another gas turbine at the Pawhuska power plant, which is rated at more than 42 megawatts of net output.
According to the website www.OKisWindEnergy.com the American Wind Energy Association (AWEA), Oklahoma has the ability to increase the amount of wind-generated electricity it produces by as much as 20% and ranked Oklahoma 12th in the nation in capacity for generating electricity from wind. Oklahoma’s central location gives it the capacity to deliver and receive wind energy components from nearly 20 states with its three (3) in-state waterway ports – the closest such port to the County is the Tulsa-Rogers County Port of Catoosa located in Rogers County on the McClellan-Kerr Arkansas River Navigational System. The Oklahoma Wind Power Initiative (Wind Initiative), a joint project of Oklahoma State University and the University of Oklahoma, expects Oklahoma to be the second-largest generator of wind power in the nation by 2030.
At this time Oklahoma’s major electric utilities offer power from wind energy. Presently, three (3) test sites for Wind Energy System Towers have been approved to the west of Pawhuska.
Chapter III - 40
2030 Osage County Comprehensive Plan
TRENDS IN GROWTH AND DEVELOPMENT: HISTORICAL AND PROJECTED
This section of Chapter III discusses the historical and projected trends in the growth and development of the County in terms of the following factors:
Population and Residential Growth
Existing Land Use
Large Land Holdings
Mixed Use Development
Attractiveness of the County in Terms of Employment and Industrial Growth
Attractiveness of the County in Terms of Residential Growth
Growth in Net Assessed Valuation from 2000 to 2010
Population and Demographics of Osage County
POPULATION AND RESIDENTIAL GROWTH
According to projections by the Oklahoma Department of Commerce (ODOC) the population of the County will experience steady growth during the Planning Period from 44,437 in 2000 to 53,400 in 2030 or 20.17%. Data provided by the County Planning Department showed that from 2003 to 2010, 26 new residential subdivisions were approved with a total of 592 lots. A significant portion of this growth is taking place in the areas north of Sand Springs and west of Skiatook.
Another measure of growth trends is the issuance of Land Use Permits – the County equivalent of a building permit. Land Use Permits are voluntary and issued only upon request for such things as new construction or renovation of existing structures, storage buildings, mobile homes, or barns.
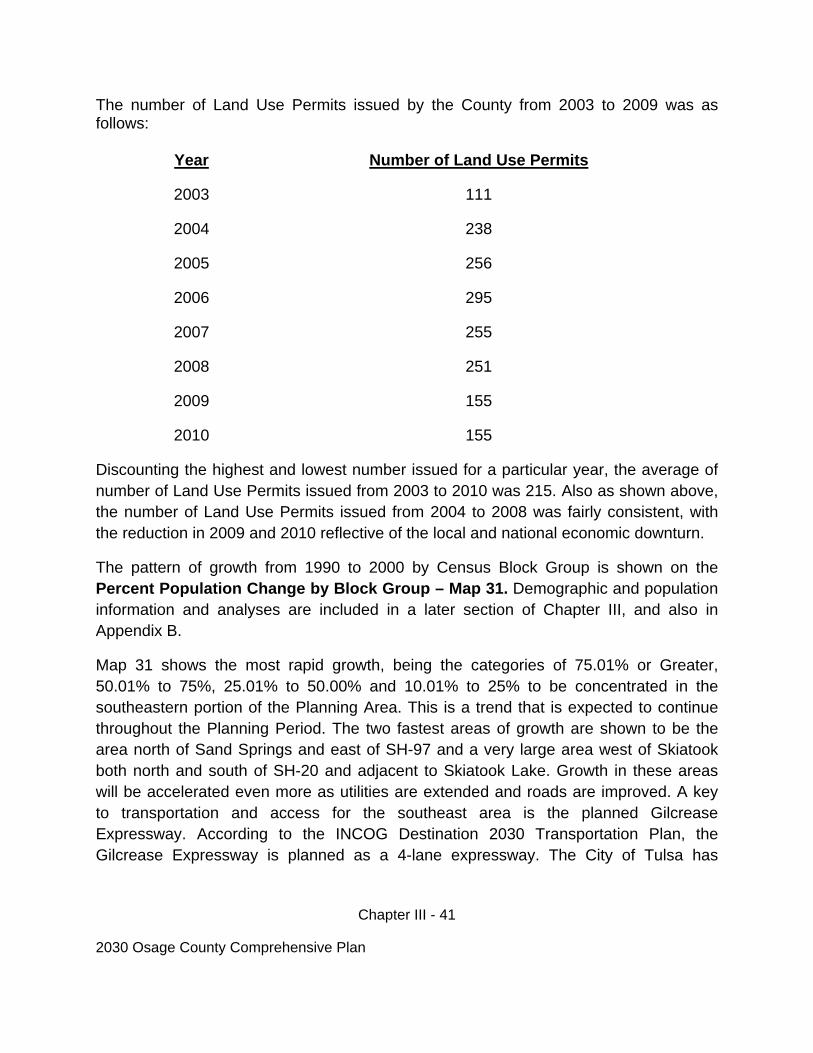
Chapter III - 41
2030 Osage County Comprehensive Plan
The number of Land Use Permits issued by the County from 2003 to 2009 was as follows: Year Number of Land Use Permits
2003 111
2004 238
2005 256
2006 295
2007 255
2008 251
2009 155
2010 155
Discounting the highest and lowest number issued for a particular year, the average of number of Land Use Permits issued from 2003 to 2010 was 215. Also as shown above, the number of Land Use Permits issued from 2004 to 2008 was fairly consistent, with the reduction in 2009 and 2010 reflective of the local and national economic downturn.
The pattern of growth from 1990 to 2000 by Census Block Group is shown on the Percent Population Change by Block Group – Map 31. Demographic and population information and analyses are included in a later section of Chapter III, and also in Appendix B.
Map 31 shows the most rapid growth, being the categories of 75.01% or Greater, 50.01% to 75%, 25.01% to 50.00% and 10.01% to 25% to be concentrated in the southeastern portion of the Planning Area. This is a trend that is expected to continue throughout the Planning Period. The two fastest areas of growth are shown to be the area north of Sand Springs and east of SH-97 and a very large area west of Skiatook both north and south of SH-20 and adjacent to Skiatook Lake. Growth in these areas will be accelerated even more as utilities are extended and roads are improved. A key to transportation and access for the southeast area is the planned Gilcrease Expressway. According to the INCOG Destination 2030 Transportation Plan, the Gilcrease Expressway is planned as a 4-lane expressway. The City of Tulsa has

Chapter III - 42
2030 Osage County Comprehensive Plan
designated the expressway corridor from the Osage/Tisdale Expressway to the Sand Springs Expressway, and has committed funding to construct an initial 2-lane facility from the Osage/Tisdale Expressway to North 41st West Avenue. Within the corridor for the Gilcrease Expressway, the City of Tulsa comprehensive plan, PlaniTulsa, includes plans for new neighborhoods, neighborhood centers, mixed-use corridors and the Gilcrease Museum View Shed.
The 2000 County population of 44,437 grew 6.83% to 47,474 in 2010. Growth in the County population was steady from 1980 to 1990 to 2000 to 2010 with an overall growth from the 1980 County population of from 39,327 to the 2010 population of 47,474 – a growth of 11.57%. Growth was experienced from 2000 to 2010 in the County’s towns as follows: Prue from 433 to 465; Skiatook (part) from 3720 to 5,267; and Tulsa (part) from 5,630 to 6,136. In some cases overall losses were small in number, but great in percentages, such as in Foraker with a population 34 in 1980 and 19 in 2010, being a 44.11% loss caused by a loss of only 15 persons over 30 years.
A first look at the 2010 US Census and comparing that to the 2000 population number, would indicates almost across the board losses of population in numbers for Osage County cities and towns. However, in at least one major case in Hominy, the 2010 population of 3,565, although being less than the 2000 population of 3,795, is considerably greater than the 1980 population of 3,130 – 12.20% greater. Grainola is the only County town that showed no change in the population of 31 persons from 2000 to 2010. The greatest growth in numbers of persons from 1980 to 2010 took place in the Skiatook (part) from 1,816 in 1980 to 5,267 – a positive 65.52%.
Map 31 shows major areas to the north and south of Pawhuska to have experienced growth from 0.01% to 10.00%. From 1980 to 2000 for the County and cities and towns in the County, only the County (0.65%), Hominy (1.06%), Skiatook (County part – 5.24%), Tulsa (County part – 0.14%), showed a positive average annual growth rate. Contrary to the overall picture of population pattern of change, the area in the extreme western part of the County, basically south of SH-60 and southeast of McCord, shows positive growth of 10.01% to 25.00%. Particularly in the cases of Sand Springs and Skiatook, it is expected that as the areas closest to their incorporated boundaries within their annexation fenceline develop and utilities are extended, these areas would be annexed into the respective cities if they are developed to the minimum city standards for roads, utilities and drainage.
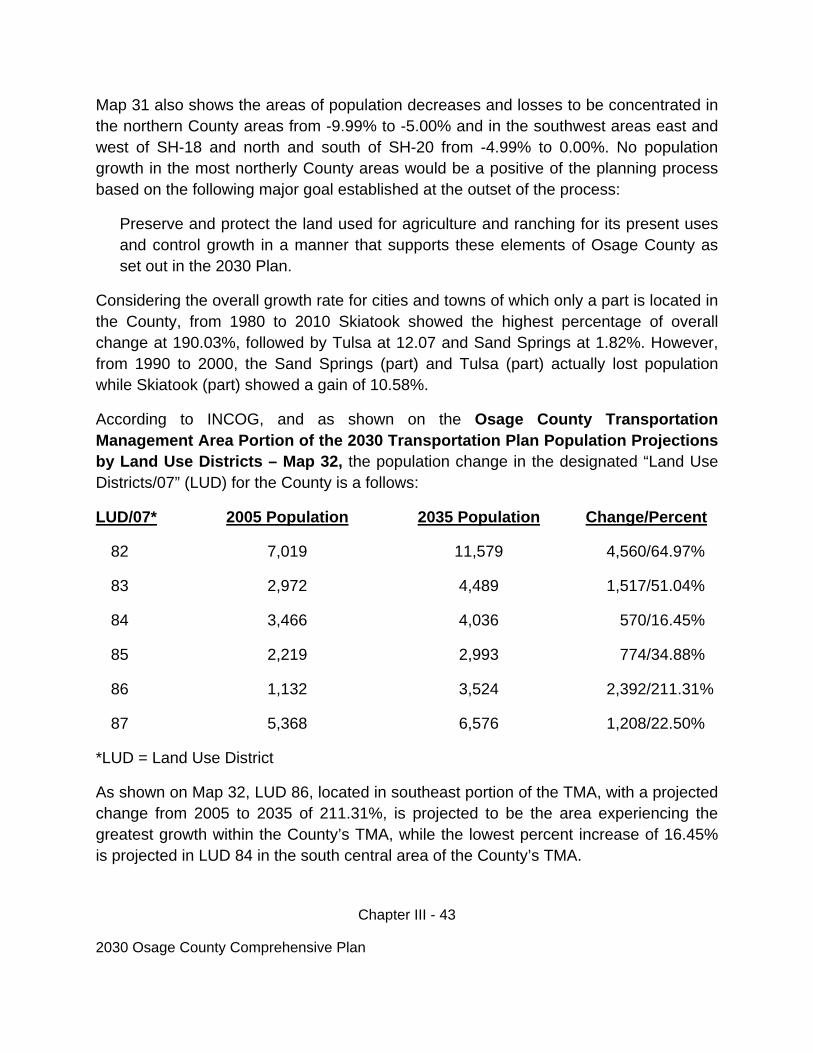
Chapter III - 43
2030 Osage County Comprehensive Plan
Map 31 also shows the areas of population decreases and losses to be concentrated in the northern County areas from -9.99% to -5.00% and in the southwest areas east and west of SH-18 and north and south of SH-20 from -4.99% to 0.00%. No population growth in the most northerly County areas would be a positive of the planning process based on the following major goal established at the outset of the process:
Preserve and protect the land used for agriculture and ranching for its present uses and control growth in a manner that supports these elements of Osage County as set out in the 2030 Plan.
Considering the overall growth rate for cities and towns of which only a part is located in the County, from 1980 to 2010 Skiatook showed the highest percentage of overall change at 190.03%, followed by Tulsa at 12.07 and Sand Springs at 1.82%. However, from 1990 to 2000, the Sand Springs (part) and Tulsa (part) actually lost population while Skiatook (part) showed a gain of 10.58%.
According to INCOG, and as shown on the Osage County Transportation Management Area Portion of the 2030 Transportation Plan Population Projections by Land Use Districts – Map 32, the population change in the designated “Land Use Districts/07” (LUD) for the County is a follows:
LUD/07* 2005 Population 2035 Population Change/Percent
82 7,019 11,579 4,560/64.97%
83 2,972 4,489 1,517/51.04%
84 3,466 4,036 570/16.45%
85 2,219 2,993 774/34.88%
86 1,132 3,524 2,392/211.31%
87 5,368 6,576 1,208/22.50%
*LUD = Land Use District
As shown on Map 32, LUD 86, located in southeast portion of the TMA, with a projected change from 2005 to 2035 of 211.31%, is projected to be the area experiencing the greatest growth within the County’s TMA, while the lowest percent increase of 16.45% is projected in LUD 84 in the south central area of the County’s TMA.
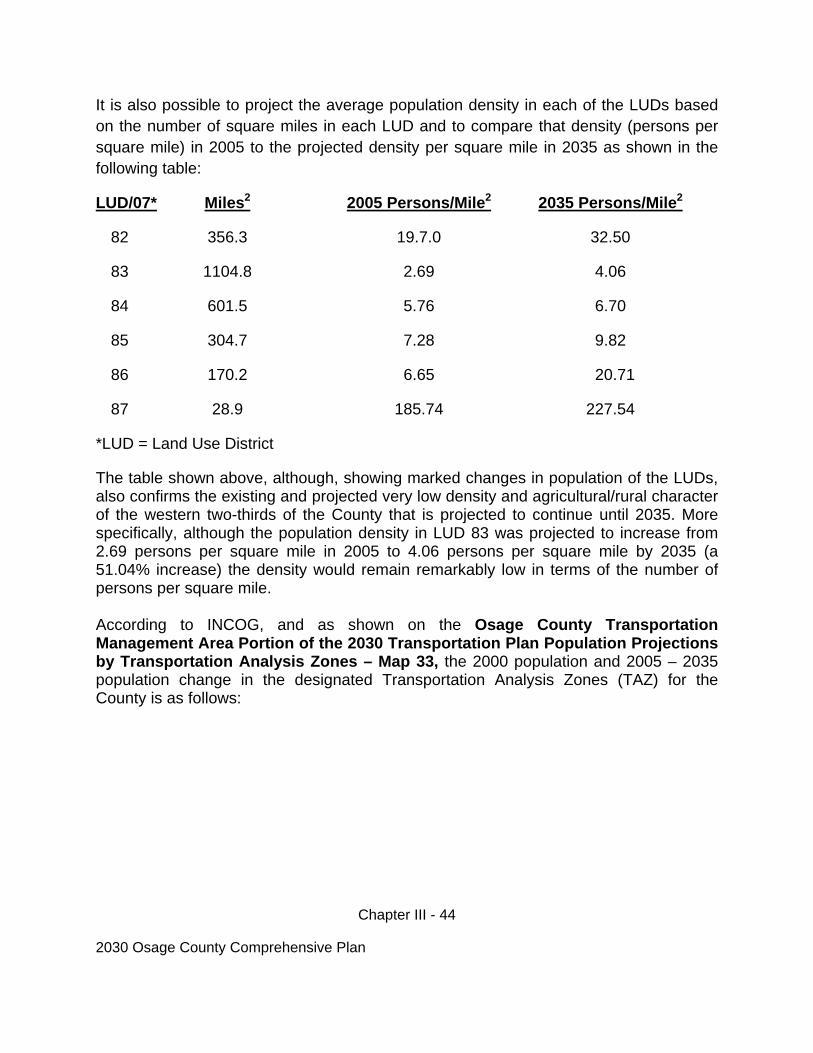
Chapter III - 44
2030 Osage County Comprehensive Plan
It is also possible to project the average population density in each of the LUDs based on the number of square miles in each LUD and to compare that density (persons per square mile) in 2005 to the projected density per square mile in 2035 as shown in the following table:
LUD/07* Miles2 2005 Persons/Mile2 2035 Persons/Mile2
82 356.3 19.7.0 32.50
83 1104.8 2.69 4.06
84 601.5 5.76 6.70
85 304.7 7.28 9.82
86 170.2 6.65 20.71
87 28.9 185.74 227.54
*LUD = Land Use District
The table shown above, although, showing marked changes in population of the LUDs, also confirms the existing and projected very low density and agricultural/rural character of the western two-thirds of the County that is projected to continue until 2035. More specifically, although the population density in LUD 83 was projected to increase from 2.69 persons per square mile in 2005 to 4.06 persons per square mile by 2035 (a 51.04% increase) the density would remain remarkably low in terms of the number of persons per square mile. According to INCOG, and as shown on the Osage County Transportation Management Area Portion of the 2030 Transportation Plan Population Projections by Transportation Analysis Zones – Map 33, the 2000 population and 2005 – 2035 population change in the designated Transportation Analysis Zones (TAZ) for the County is as follows:
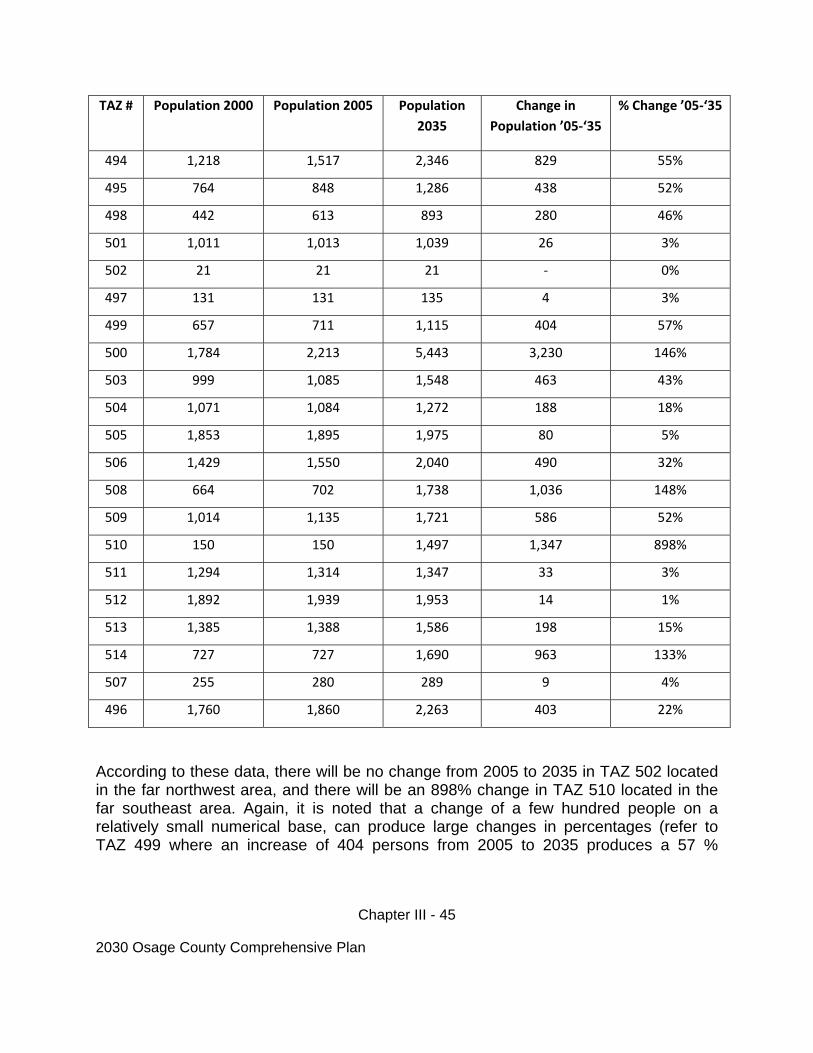
Chapter III - 45
2030 Osage County Comprehensive Plan
TAZ # Population 2000 Population 2005 Population
2035
Change in
Population ’05‐‘35
% Change ’05‐‘35
494 1,218 1,517 2,346 829 55%
495 764 848 1,286 438 52%
498 442 613 893 280 46%
501 1,011 1,013 1,039 26 3%
502 21 21 21 ‐ 0%
497 131 131 135 4 3%
499 657 711 1,115 404 57%
500 1,784 2,213 5,443 3,230 146%
503 999 1,085 1,548 463 43%
504 1,071 1,084 1,272 188 18%
505 1,853 1,895 1,975 80 5%
506 1,429 1,550 2,040 490 32%
508 664 702 1,738 1,036 148%
509 1,014 1,135 1,721 586 52%
510 150 150 1,497 1,347 898%
511 1,294 1,314 1,347 33 3%
512 1,892 1,939 1,953 14 1%
513 1,385 1,388 1,586 198 15%
514 727 727 1,690 963 133%
507 255 280 289 9 4%
496 1,760 1,860 2,263 403 22%
According to these data, there will be no change from 2005 to 2035 in TAZ 502 located in the far northwest area, and there will be an 898% change in TAZ 510 located in the far southeast area. Again, it is noted that a change of a few hundred people on a relatively small numerical base, can produce large changes in percentages (refer to TAZ 499 where an increase of 404 persons from 2005 to 2035 produces a 57 %
Chapter III - 46
2030 Osage County Comprehensive Plan
change). The categories of population ranges on the legend on Map 33 show the range of the projected population of the respective TAZs in 2035.
EXISTING LAND USE
The Generalized Land Use – Map 34, provides a snapshot according to the records of the County Assessor of the developed and undeveloped land in the County. The major land assessment categories utilized by the County Assessor shown on Map 34 are as follows:
Agriculture: Urban (City or Town) and Rural (Unincorporated County)
Residential: Urban (City or Town) and Rural (Unincorporated County)
Commercial: Urban (City or Town) and Rural (Unincorporated County)
Industrial: Rural Industrial
Utilities: Public Utilities
Government: Federal and Tribal, State, County, City, School and Rural Fire Departments
Tax Exempt: Public, Tribal Land and Churches and Foundations
Other Uses: Miscellaneous, Unknown or Missing Data Based on information received from the Osage County Assessor’s Office (Wendy Brown, June 22, 2010) the number of acres in each of the above major land assessment categories is as follows:
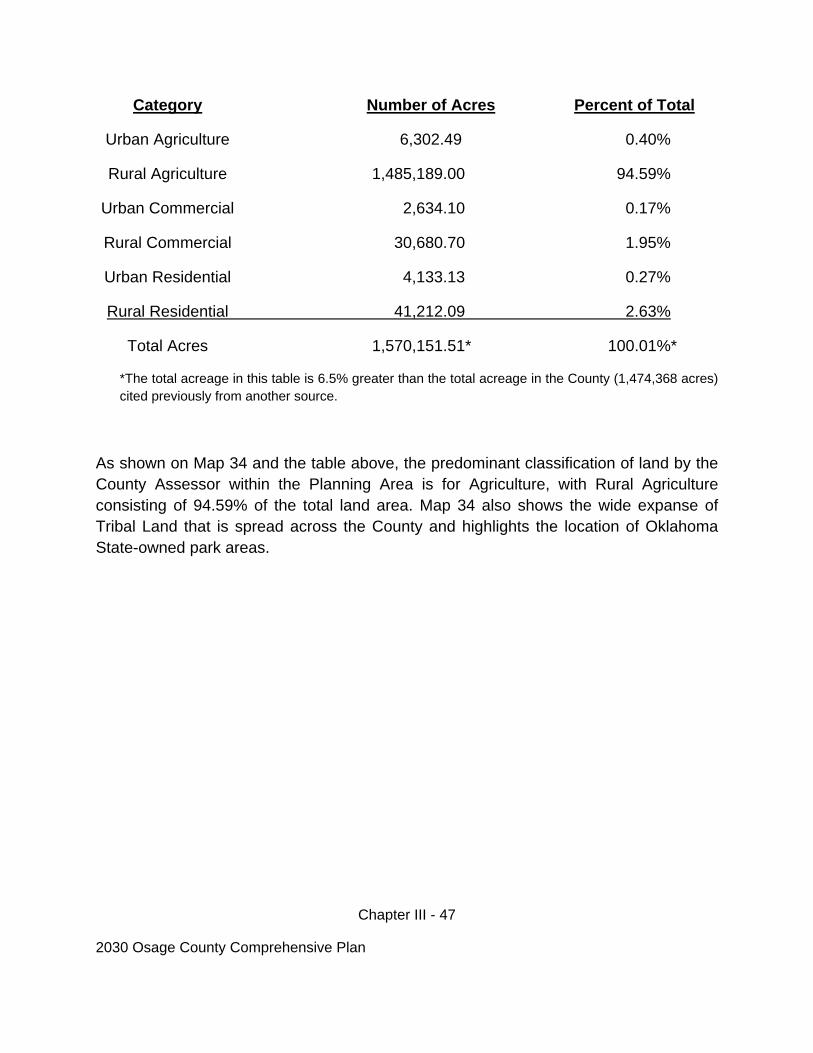
Chapter III - 47
2030 Osage County Comprehensive Plan
Category Number of Acres Percent of Total
Urban Agriculture 6,302.49 0.40%
Rural Agriculture 1,485,189.00 94.59%
Urban Commercial 2,634.10 0.17%
Rural Commercial 30,680.70 1.95%
Urban Residential 4,133.13 0.27%
Rural Residential 41,212.09 2.63%
Total Acres 1,570,151.51* 100.01%*
*The total acreage in this table is 6.5% greater than the total acreage in the County (1,474,368 acres) cited previously from another source.
As shown on Map 34 and the table above, the predominant classification of land by the County Assessor within the Planning Area is for Agriculture, with Rural Agriculture consisting of 94.59% of the total land area. Map 34 also shows the wide expanse of Tribal Land that is spread across the County and highlights the location of Oklahoma State-owned park areas.
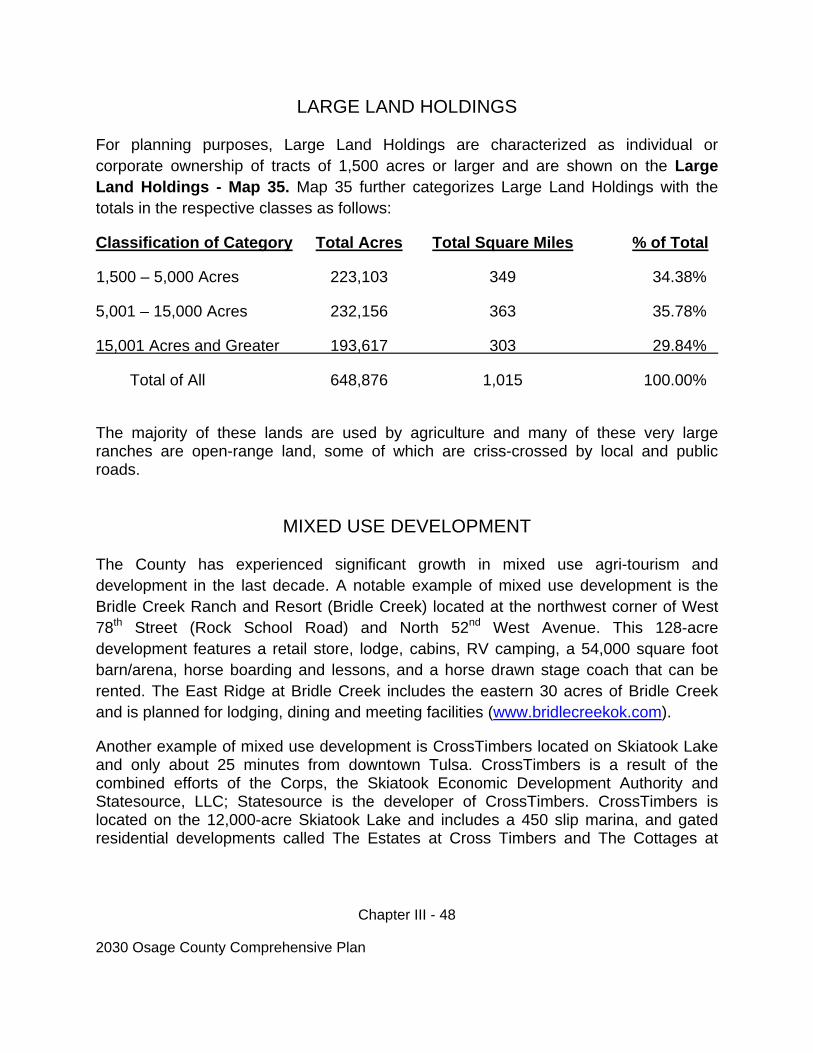
Chapter III - 48
2030 Osage County Comprehensive Plan
LARGE LAND HOLDINGS
For planning purposes, Large Land Holdings are characterized as individual or corporate ownership of tracts of 1,500 acres or larger and are shown on the Large Land Holdings - Map 35. Map 35 further categorizes Large Land Holdings with the totals in the respective classes as follows:
Classification of Category Total Acres Total Square Miles % of Total
1,500 – 5,000 Acres 223,103 349 34.38%
5,001 – 15,000 Acres 232,156 363 35.78%
15,001 Acres and Greater 193,617 303 29.84%
Total of All 648,876 1,015 100.00%
The majority of these lands are used by agriculture and many of these very large ranches are open-range land, some of which are criss-crossed by local and public roads.
MIXED USE DEVELOPMENT
The County has experienced significant growth in mixed use agri-tourism and development in the last decade. A notable example of mixed use development is the Bridle Creek Ranch and Resort (Bridle Creek) located at the northwest corner of West 78th Street (Rock School Road) and North 52nd West Avenue. This 128-acre development features a retail store, lodge, cabins, RV camping, a 54,000 square foot barn/arena, horse boarding and lessons, and a horse drawn stage coach that can be rented. The East Ridge at Bridle Creek includes the eastern 30 acres of Bridle Creek and is planned for lodging, dining and meeting facilities (www.bridlecreekok.com).
Another example of mixed use development is CrossTimbers located on Skiatook Lake and only about 25 minutes from downtown Tulsa. CrossTimbers is a result of the combined efforts of the Corps, the Skiatook Economic Development Authority and Statesource, LLC; Statesource is the developer of CrossTimbers. CrossTimbers is located on the 12,000-acre Skiatook Lake and includes a 450 slip marina, and gated residential developments called The Estates at Cross Timbers and The Cottages at

Chapter III - 49
2030 Osage County Comprehensive Plan
CrossTimbers. These residential developments feature greenbelts, walking trails along Skiatook Lake, golf cart trails, and horseback riding (http://www.crosstimbersok.com).
ATTRACTIVENESS OF THE COUNTY IN TERMS OF EMPLOYMENT
AND INDUSTRIAL DEVELOPMENT
As a tool of regional transportation planning, INCOG utilizes an analytical methodology for determining the “Employment Attractiveness” of a particular area, thus projecting where growth is expected to occur within the INCOG Region. According to the INCOG model, employment growth is a function of available land for development and the attractiveness or desirability of the land for industrial development. Employment Attractiveness can also be considered with “Residential Attractiveness” (as discussed below) to add to the comprehensiveness of the growth projection process. The elements of Employment Attractiveness are as follows:
Transportation and Facility Factors:
Highways Railroads Wastewater Service Water Service Electrical Service
Environmental Factors:
Steep Slopes Floodplains Prime Farmlands
Policy Issues:
Industrial Areas Industrial Zoning Ultimate Buildout – Identified as being for high or moderate uses in comprehensive plans
The results of the Employment Attractiveness analyses are shown on the Osage County Transportation Management Area Portion of the Regional Transportation Plan Employment Attractiveness Index – Map 36. Map 36 shows that areas of Skiatook and Tulsa in the County rank “High” in Employment Attractiveness and also shows how the gradient of Employment Attractiveness declines (as in the case of Tulsa) as it moves to the north and west. Significantly, this very area of incorporated Tulsa and
Chapter III - 50
2030 Osage County Comprehensive Plan
the adjacent unincorporated areas of the County will be well-served by the completion of the Gilcrease Expressway. This area also includes an Osage Nation Casino and the Airpark. The Airpark is now owned by the Osage Nation and is in the early stages of planning for redevelopment. Although ranked “Low” overall, Map 36 shows the impact of major roadway and highway corridors such as along New Prue Road, along N. 177th West Avenue, and along SH-97 and SH-20. Map 36 also shows that the overwhelming majority of the County is ranked “Very Low in Employment Attractiveness”; this area is characterized by areas of Large Land Holdings and would be expected to remain that way throughout the Planning Period.
ATTRACTIVENESS OF THE COUNTY IN TERMS OF
RESIDENTIAL GROWTH
As a companion element to Employment Attractiveness as discussed above, INCOG utilizes a category called “Residential Attractiveness” as shown on the Osage County Transportation Management Area Portion of the Regional Transportation Plan Residential Attractiveness Index – Map 37. Residential Attractiveness indices can be considered along with Employment Attractiveness to add to the comprehensiveness of the expected growth projection process. According to Map 37, residential growth within the County’s TMA will be a function of the following factors:
Availability of Facilities and Services: Proximity to Highways Proximity to Railroads Availability of Wastewater Service Availability of Water Service Availability of Electrical Service
Environmental Factors: Slopes Parkland Floodplains Prime Farmland
Public Policy Issues: Not in Industrial Areas Not-industrial Zoning Ultimate Buildout School Districts
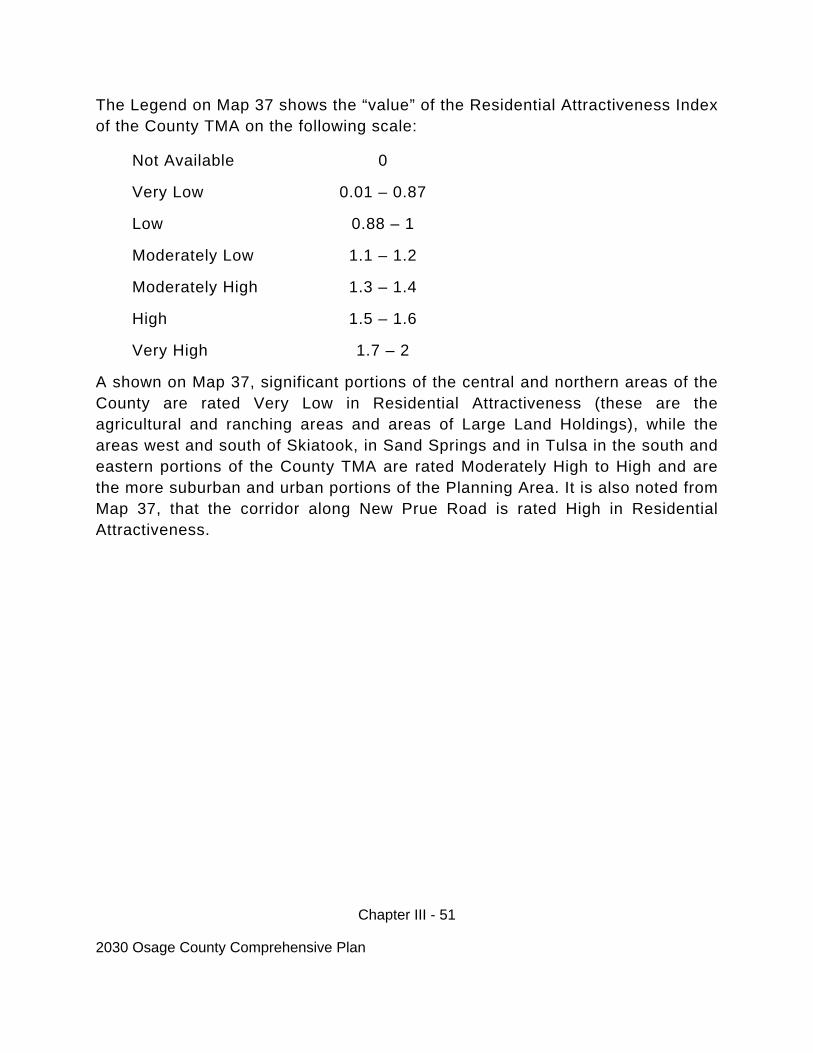
Chapter III - 51
2030 Osage County Comprehensive Plan
The Legend on Map 37 shows the “value” of the Residential Attractiveness Index of the County TMA on the following scale:
Not Available 0
Very Low 0.01 – 0.87
Low 0.88 – 1
Moderately Low 1.1 – 1.2
Moderately High 1.3 – 1.4
High 1.5 – 1.6
Very High 1.7 – 2
A shown on Map 37, significant portions of the central and northern areas of the County are rated Very Low in Residential Attractiveness (these are the agricultural and ranching areas and areas of Large Land Holdings), while the areas west and south of Skiatook, in Sand Springs and in Tulsa in the south and eastern portions of the County TMA are rated Moderately High to High and are the more suburban and urban portions of the Planning Area. It is also noted from Map 37, that the corridor along New Prue Road is rated High in Residential Attractiveness.
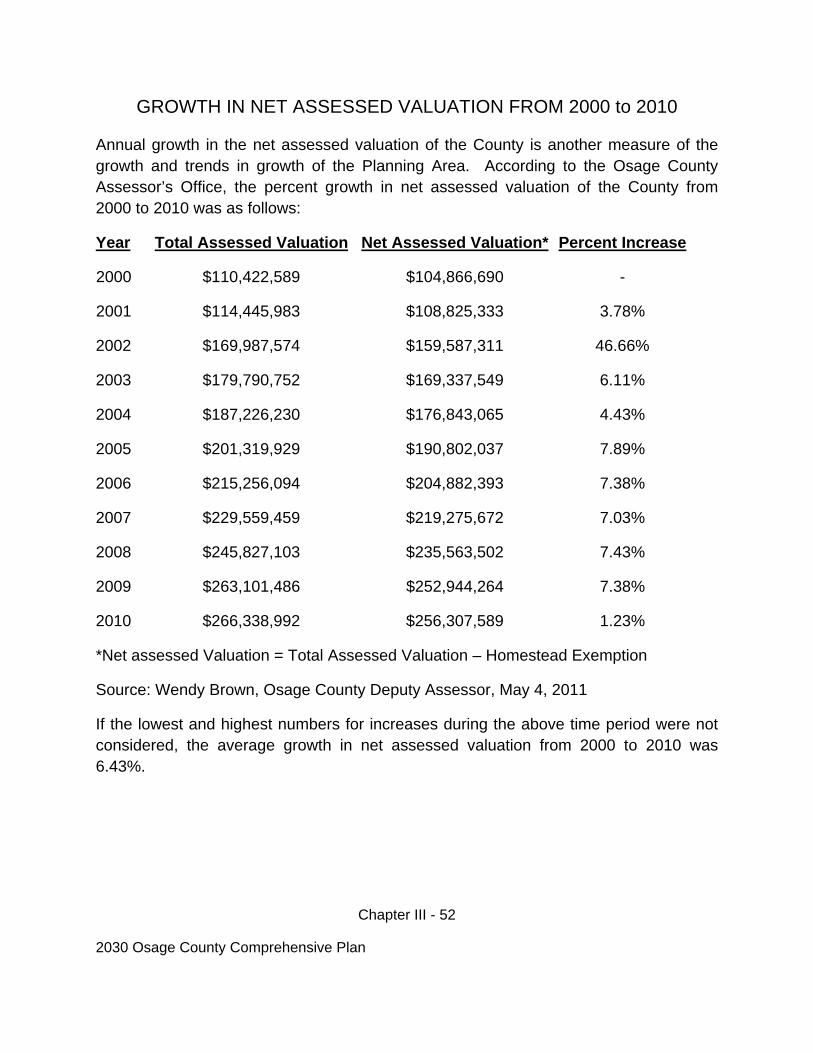
Chapter III - 52
2030 Osage County Comprehensive Plan
GROWTH IN NET ASSESSED VALUATION FROM 2000 to 2010
Annual growth in the net assessed valuation of the County is another measure of the growth and trends in growth of the Planning Area. According to the Osage County Assessor’s Office, the percent growth in net assessed valuation of the County from 2000 to 2010 was as follows:
Year Total Assessed Valuation Net Assessed Valuation* Percent Increase
2000 $110,422,589 $104,866,690 -
2001 $114,445,983 $108,825,333 3.78%
2002 $169,987,574 $159,587,311 46.66%
2003 $179,790,752 $169,337,549 6.11%
2004 $187,226,230 $176,843,065 4.43%
2005 $201,319,929 $190,802,037 7.89%
2006 $215,256,094 $204,882,393 7.38%
2007 $229,559,459 $219,275,672 7.03%
2008 $245,827,103 $235,563,502 7.43%
2009 $263,101,486 $252,944,264 7.38%
2010 $266,338,992 $256,307,589 1.23%
*Net assessed Valuation = Total Assessed Valuation – Homestead Exemption
Source: Wendy Brown, Osage County Deputy Assessor, May 4, 2011
If the lowest and highest numbers for increases during the above time period were not considered, the average growth in net assessed valuation from 2000 to 2010 was 6.43%.
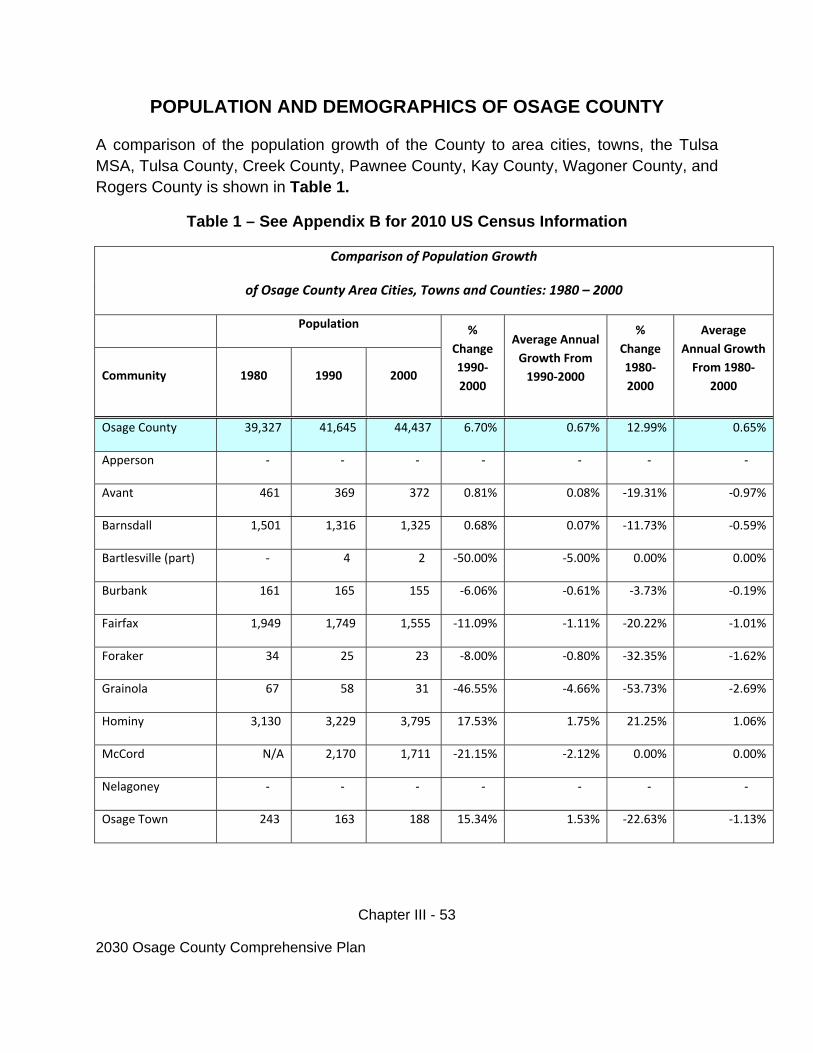
Chapter III - 53
2030 Osage County Comprehensive Plan
POPULATION AND DEMOGRAPHICS OF OSAGE COUNTY A comparison of the population growth of the County to area cities, towns, the Tulsa MSA, Tulsa County, Creek County, Pawnee County, Kay County, Wagoner County, and Rogers County is shown in Table 1.
Table 1 – See Appendix B for 2010 US Census Information
Comparison of Population Growth
of Osage County Area Cities, Towns and Counties: 1980 – 2000
Population %
Change
1990‐
2000
Average Annual
Growth From
1990‐2000
%
Change
1980‐
2000
Average
Annual Growth
From 1980‐
2000 Community 1980 1990 2000
Osage County 39,327 41,645 44,437 6.70% 0.67% 12.99% 0.65%
Apperson ‐ ‐ ‐ ‐ ‐ ‐ ‐
Avant 461 369 372 0.81% 0.08% ‐19.31% ‐0.97%
Barnsdall 1,501 1,316 1,325 0.68% 0.07% ‐11.73% ‐0.59%
Bartlesville (part) ‐ 4 2 ‐50.00% ‐5.00% 0.00% 0.00%
Burbank 161 165 155 ‐6.06% ‐0.61% ‐3.73% ‐0.19%
Fairfax 1,949 1,749 1,555 ‐11.09% ‐1.11% ‐20.22% ‐1.01%
Foraker 34 25 23 ‐8.00% ‐0.80% ‐32.35% ‐1.62%
Grainola 67 58 31 ‐46.55% ‐4.66% ‐53.73% ‐2.69%
Hominy 3,130 3,229 3,795 17.53% 1.75% 21.25% 1.06%
McCord N/A 2,170 1,711 ‐21.15% ‐2.12% 0.00% 0.00%
Nelagoney ‐ ‐ ‐ ‐ ‐ ‐ ‐
Osage Town 243 163 188 15.34% 1.53% ‐22.63% ‐1.13%
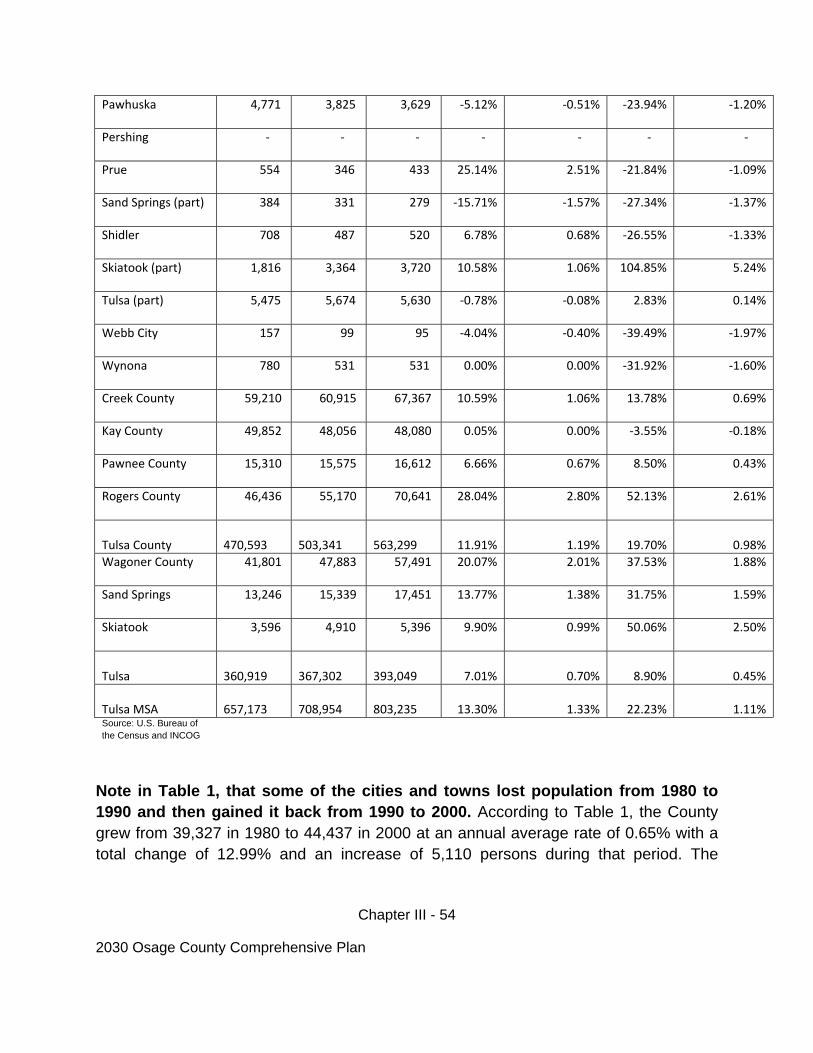
Chapter III - 54
2030 Osage County Comprehensive Plan
Pawhuska 4,771 3,825 3,629 ‐5.12% ‐0.51% ‐23.94% ‐1.20%
Pershing ‐ ‐ ‐ ‐ ‐ ‐ ‐
Prue 554 346 433 25.14% 2.51% ‐21.84% ‐1.09%
Sand Springs (part) 384 331 279 ‐15.71% ‐1.57% ‐27.34% ‐1.37%
Shidler 708 487 520 6.78% 0.68% ‐26.55% ‐1.33%
Skiatook (part) 1,816 3,364 3,720 10.58% 1.06% 104.85% 5.24%
Tulsa (part) 5,475 5,674 5,630 ‐0.78% ‐0.08% 2.83% 0.14%
Webb City 157 99 95 ‐4.04% ‐0.40% ‐39.49% ‐1.97%
Wynona 780 531 531 0.00% 0.00% ‐31.92% ‐1.60%
Creek County 59,210 60,915 67,367 10.59% 1.06% 13.78% 0.69%
Kay County 49,852 48,056 48,080 0.05% 0.00% ‐3.55% ‐0.18%
Pawnee County 15,310 15,575 16,612 6.66% 0.67% 8.50% 0.43%
Rogers County 46,436 55,170 70,641 28.04% 2.80% 52.13% 2.61%
Tulsa County 470,593
503,341
563,299 11.91% 1.19% 19.70% 0.98%
Wagoner County 41,801 47,883 57,491 20.07% 2.01% 37.53% 1.88%
Sand Springs 13,246 15,339 17,451 13.77% 1.38% 31.75% 1.59%
Skiatook 3,596 4,910 5,396 9.90% 0.99% 50.06% 2.50%
Tulsa 360,919
367,302
393,049 7.01% 0.70% 8.90% 0.45%
Tulsa MSA 657,173
708,954
803,235 13.30% 1.33% 22.23% 1.11%
Source: U.S. Bureau of the Census and INCOG
Note in Table 1, that some of the cities and towns lost population from 1980 to 1990 and then gained it back from 1990 to 2000. According to Table 1, the County grew from 39,327 in 1980 to 44,437 in 2000 at an annual average rate of 0.65% with a total change of 12.99% and an increase of 5,110 persons during that period. The
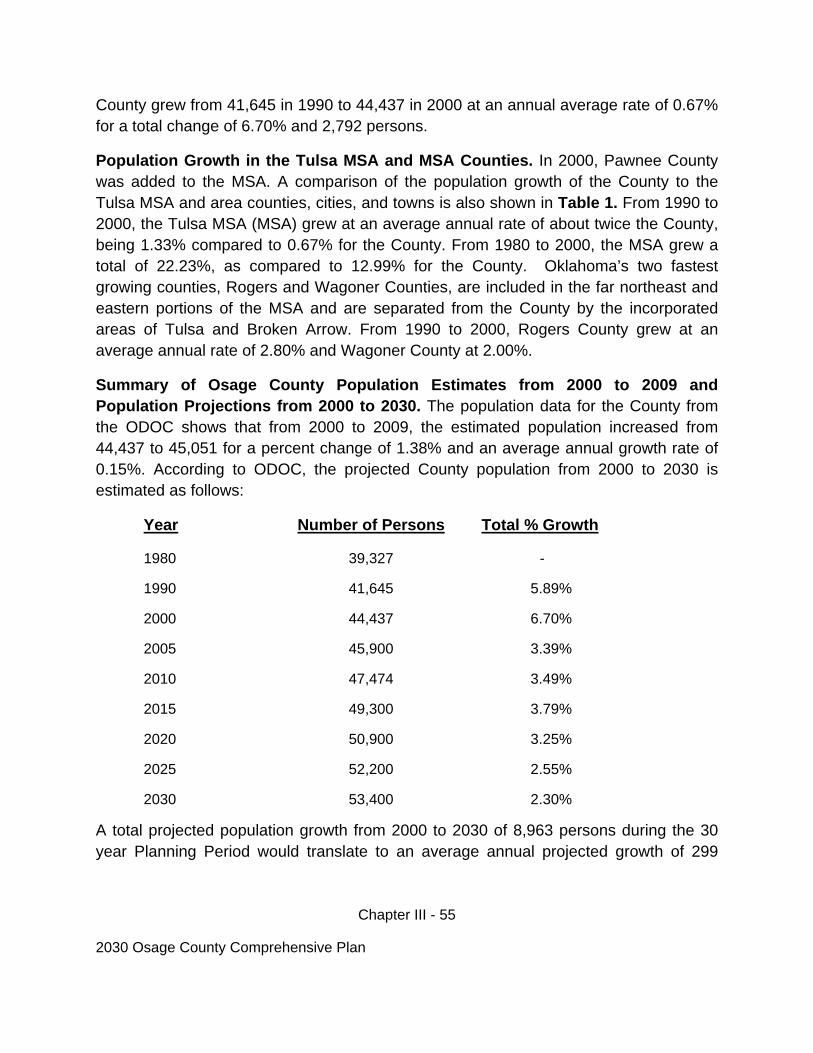
Chapter III - 55
2030 Osage County Comprehensive Plan
County grew from 41,645 in 1990 to 44,437 in 2000 at an annual average rate of 0.67% for a total change of 6.70% and 2,792 persons.
Population Growth in the Tulsa MSA and MSA Counties. In 2000, Pawnee County was added to the MSA. A comparison of the population growth of the County to the Tulsa MSA and area counties, cities, and towns is also shown in Table 1. From 1990 to 2000, the Tulsa MSA (MSA) grew at an average annual rate of about twice the County, being 1.33% compared to 0.67% for the County. From 1980 to 2000, the MSA grew a total of 22.23%, as compared to 12.99% for the County. Oklahoma’s two fastest growing counties, Rogers and Wagoner Counties, are included in the far northeast and eastern portions of the MSA and are separated from the County by the incorporated areas of Tulsa and Broken Arrow. From 1990 to 2000, Rogers County grew at an average annual rate of 2.80% and Wagoner County at 2.00%.
Summary of Osage County Population Estimates from 2000 to 2009 and Population Projections from 2000 to 2030. The population data for the County from the ODOC shows that from 2000 to 2009, the estimated population increased from 44,437 to 45,051 for a percent change of 1.38% and an average annual growth rate of 0.15%. According to ODOC, the projected County population from 2000 to 2030 is estimated as follows:
Year Number of Persons Total % Growth
1980 39,327 -
1990 41,645 5.89%
2000 44,437 6.70%
2005 45,900 3.39%
2010 47,474 3.49%
2015 49,300 3.79%
2020 50,900 3.25%
2025 52,200 2.55%
2030 53,400 2.30%
A total projected population growth from 2000 to 2030 of 8,963 persons during the 30 year Planning Period would translate to an average annual projected growth of 299
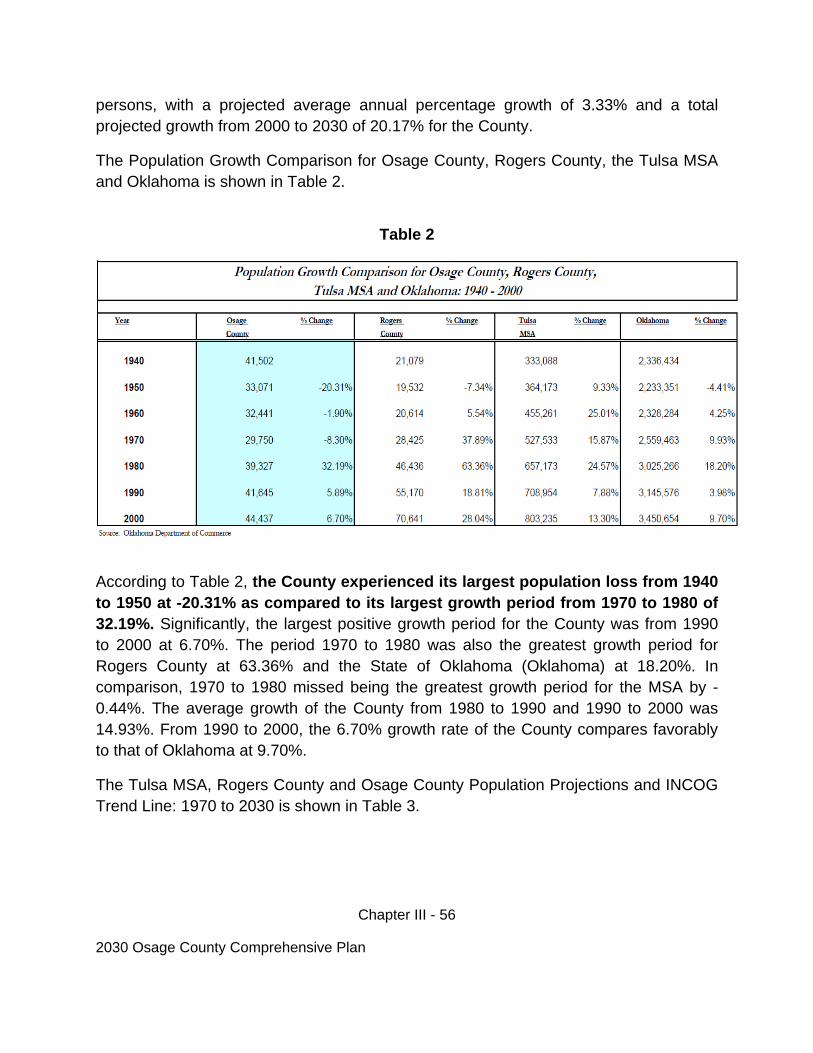
Chapter III - 56
2030 Osage County Comprehensive Plan
persons, with a projected average annual percentage growth of 3.33% and a total projected growth from 2000 to 2030 of 20.17% for the County.
The Population Growth Comparison for Osage County, Rogers County, the Tulsa MSA and Oklahoma is shown in Table 2.
Table 2
According to Table 2, the County experienced its largest population loss from 1940 to 1950 at -20.31% as compared to its largest growth period from 1970 to 1980 of 32.19%. Significantly, the largest positive growth period for the County was from 1990 to 2000 at 6.70%. The period 1970 to 1980 was also the greatest growth period for Rogers County at 63.36% and the State of Oklahoma (Oklahoma) at 18.20%. In comparison, 1970 to 1980 missed being the greatest growth period for the MSA by -0.44%. The average growth of the County from 1980 to 1990 and 1990 to 2000 was 14.93%. From 1990 to 2000, the 6.70% growth rate of the County compares favorably to that of Oklahoma at 9.70%.
The Tulsa MSA, Rogers County and Osage County Population Projections and INCOG Trend Line: 1970 to 2030 is shown in Table 3.
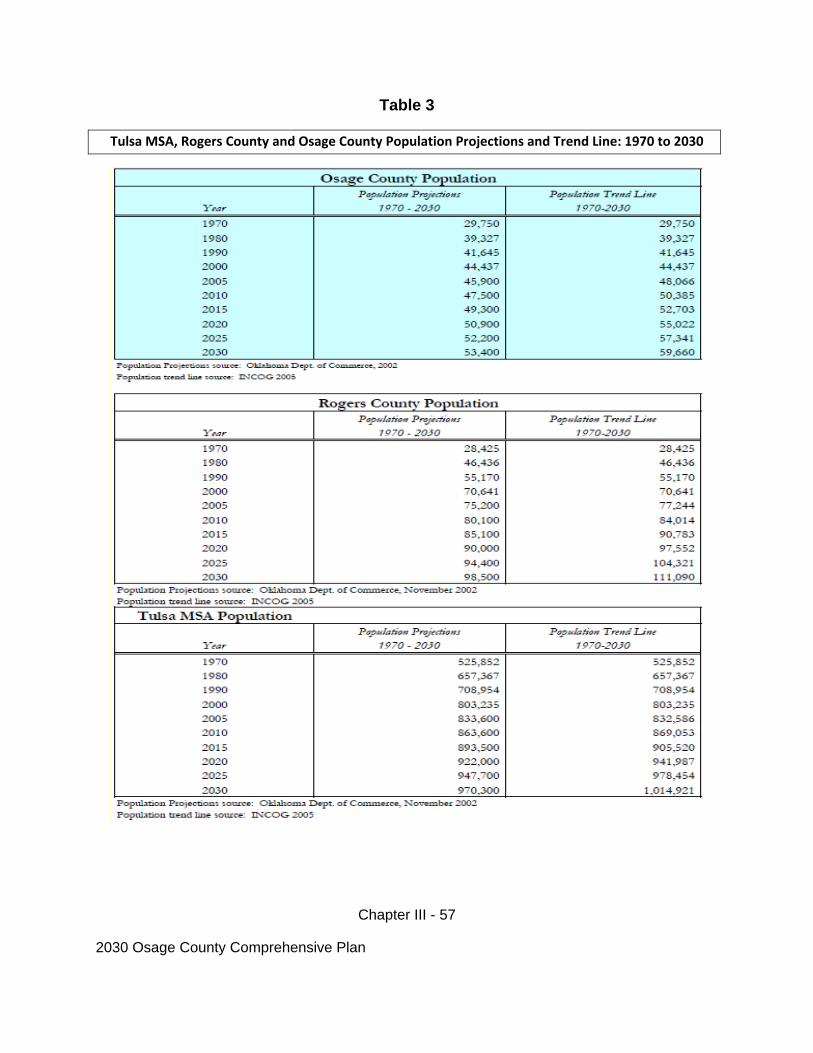
Chapter III - 57
2030 Osage County Comprehensive Plan
Table 3
Tulsa MSA, Rogers County and Osage County Population Projections and Trend Line: 1970 to 2030
Chapter III - 58
2030 Osage County Comprehensive Plan
Each of the selected entities shows positive population growth/projections from 1970 to 2030. While showing steady growth, the INCOG Trend Line of each growth rate shows the greatest increase in rate to be from 1970 to 2000, and then a somewhat slower increase in rate from 2000 to 2030. Comparison of the population projections in the Trend Line graphs shows that the INCOG projections are slightly higher than the projections by ODOC. For the County, the 2000 population of 44,437 is shown by ODOC to increase to 2030 to 54,300 (22.20%) by 2030 and by INCOG to 59,660 (34.12%). The average annual increase in population by ODOC and INCOG from 2000 to 2030 for the County was 0.74% and 1.12% respectively. The ODOC estimated population for the overall County in 2008 is 45,489, which shows an overall decrease from the 2000 population of 44,552 or -0.02%. From 2000 to 2008, the County population showed an up and down trend from year to year as follows: increases shown from 2000 to 2001, 2004 to 2005, 2005 to 2006, 2006 to 2007, and 2007 to 2008, and decreases shown from 2001 to 2002, 2002 to 2003, and 2003 to 2004. The ODOC estimated population for the “Balance of County” and unincorporated part in 2008 was 22,733, which represents a growth of 601 persons from the 2000 population of 22,132 representing a total 2.72% increase and an average annual increase of 0.34%.
From 2000 to 2030, the MSA population of 803,235 is projected to increase to 970,300 (20.80%) by ODOC, and to 1,014,921 (26.35%) by INCOG. The average annual increase in population by ODOC and INCOG from 2000 to 2030 was 0.69% and 0.89% respectively.
The Osage County Population Pyramid for 1980 to 2000 is shown in the graphs and bar charts in Table 4.
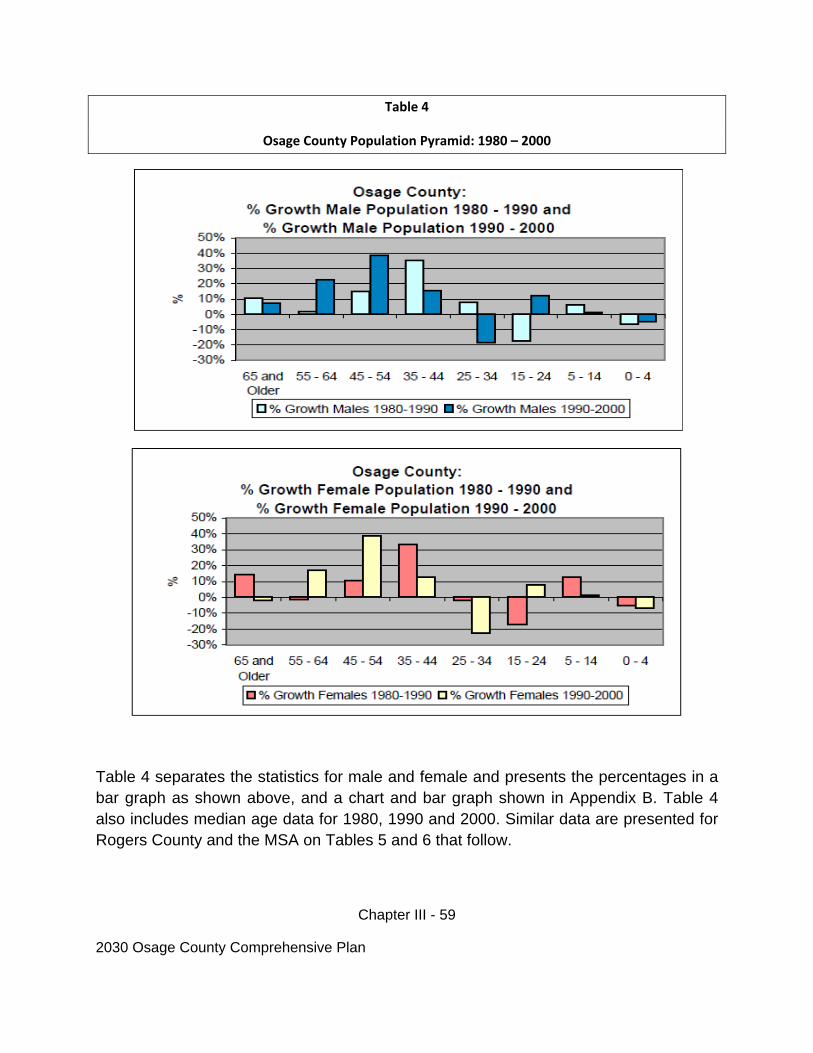
Chapter III - 59
2030 Osage County Comprehensive Plan
Table 4
Osage County Population Pyramid: 1980 – 2000
Table 4 separates the statistics for male and female and presents the percentages in a bar graph as shown above, and a chart and bar graph shown in Appendix B. Table 4 also includes median age data for 1980, 1990 and 2000. Similar data are presented for Rogers County and the MSA on Tables 5 and 6 that follow.
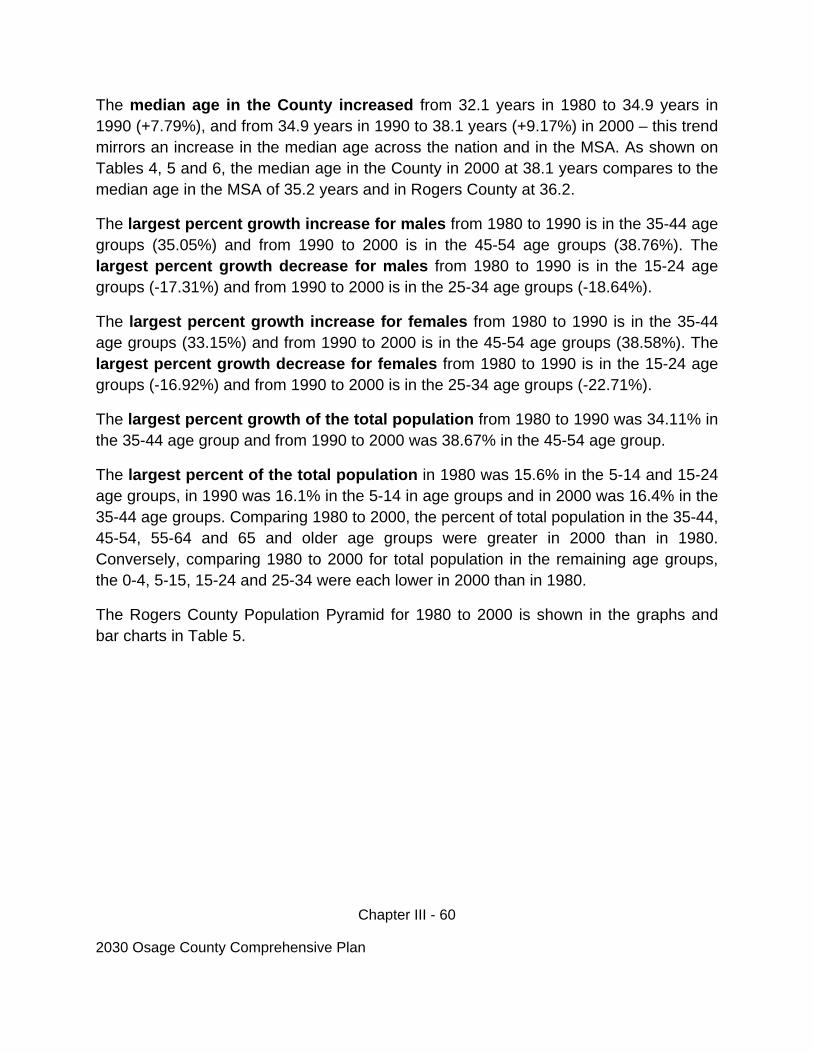
Chapter III - 60
2030 Osage County Comprehensive Plan
The median age in the County increased from 32.1 years in 1980 to 34.9 years in 1990 (+7.79%), and from 34.9 years in 1990 to 38.1 years (+9.17%) in 2000 – this trend mirrors an increase in the median age across the nation and in the MSA. As shown on Tables 4, 5 and 6, the median age in the County in 2000 at 38.1 years compares to the median age in the MSA of 35.2 years and in Rogers County at 36.2.
The largest percent growth increase for males from 1980 to 1990 is in the 35-44 age groups (35.05%) and from 1990 to 2000 is in the 45-54 age groups (38.76%). The largest percent growth decrease for males from 1980 to 1990 is in the 15-24 age groups (-17.31%) and from 1990 to 2000 is in the 25-34 age groups (-18.64%).
The largest percent growth increase for females from 1980 to 1990 is in the 35-44 age groups (33.15%) and from 1990 to 2000 is in the 45-54 age groups (38.58%). The largest percent growth decrease for females from 1980 to 1990 is in the 15-24 age groups (-16.92%) and from 1990 to 2000 is in the 25-34 age groups (-22.71%).
The largest percent growth of the total population from 1980 to 1990 was 34.11% in the 35-44 age group and from 1990 to 2000 was 38.67% in the 45-54 age group.
The largest percent of the total population in 1980 was 15.6% in the 5-14 and 15-24 age groups, in 1990 was 16.1% in the 5-14 in age groups and in 2000 was 16.4% in the 35-44 age groups. Comparing 1980 to 2000, the percent of total population in the 35-44, 45-54, 55-64 and 65 and older age groups were greater in 2000 than in 1980. Conversely, comparing 1980 to 2000 for total population in the remaining age groups, the 0-4, 5-15, 15-24 and 25-34 were each lower in 2000 than in 1980.
The Rogers County Population Pyramid for 1980 to 2000 is shown in the graphs and bar charts in Table 5.
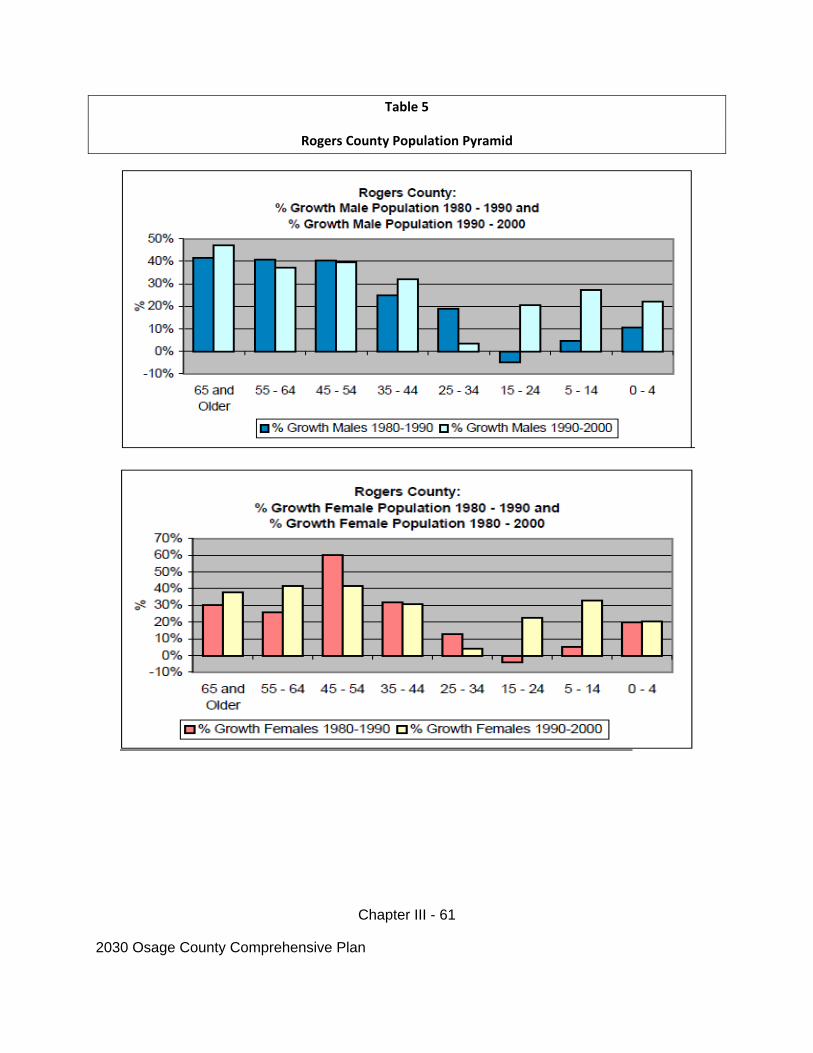
Chapter III - 61
2030 Osage County Comprehensive Plan
Table 5
Rogers County Population Pyramid
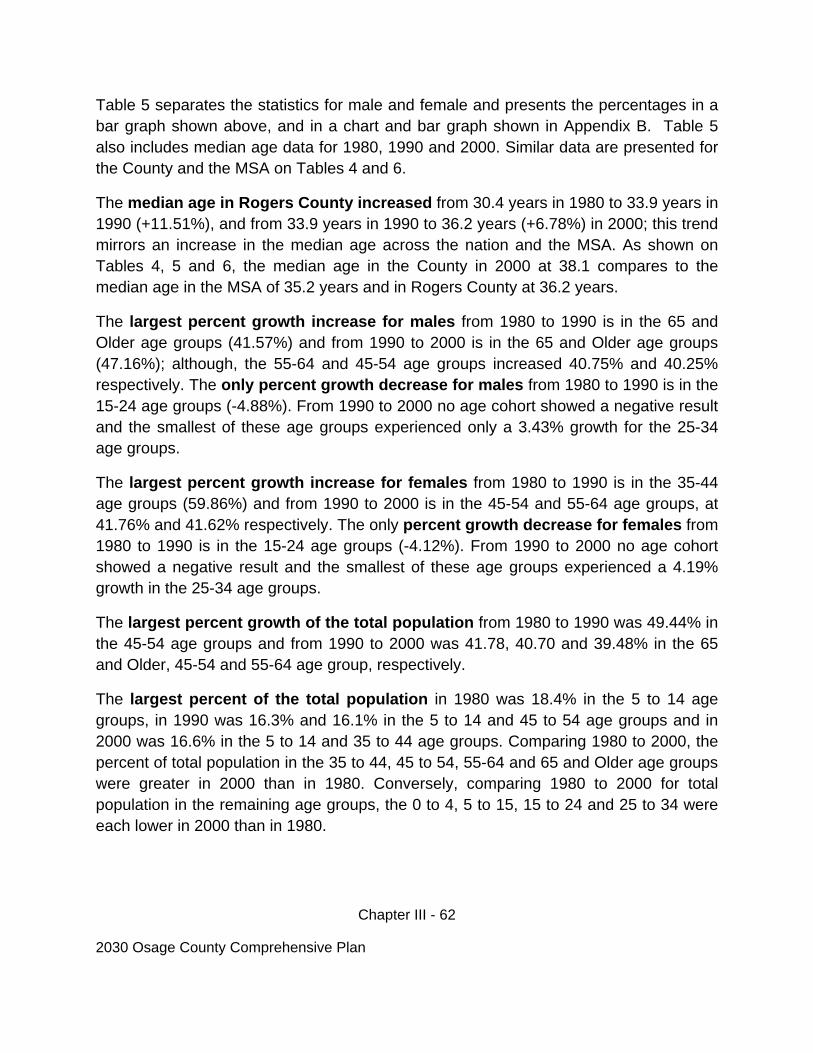
Chapter III - 62
2030 Osage County Comprehensive Plan
Table 5 separates the statistics for male and female and presents the percentages in a bar graph shown above, and in a chart and bar graph shown in Appendix B. Table 5 also includes median age data for 1980, 1990 and 2000. Similar data are presented for the County and the MSA on Tables 4 and 6.
The median age in Rogers County increased from 30.4 years in 1980 to 33.9 years in 1990 (+11.51%), and from 33.9 years in 1990 to 36.2 years (+6.78%) in 2000; this trend mirrors an increase in the median age across the nation and the MSA. As shown on Tables 4, 5 and 6, the median age in the County in 2000 at 38.1 compares to the median age in the MSA of 35.2 years and in Rogers County at 36.2 years.
The largest percent growth increase for males from 1980 to 1990 is in the 65 and Older age groups (41.57%) and from 1990 to 2000 is in the 65 and Older age groups (47.16%); although, the 55-64 and 45-54 age groups increased 40.75% and 40.25% respectively. The only percent growth decrease for males from 1980 to 1990 is in the 15-24 age groups (-4.88%). From 1990 to 2000 no age cohort showed a negative result and the smallest of these age groups experienced only a 3.43% growth for the 25-34 age groups.
The largest percent growth increase for females from 1980 to 1990 is in the 35-44 age groups (59.86%) and from 1990 to 2000 is in the 45-54 and 55-64 age groups, at 41.76% and 41.62% respectively. The only percent growth decrease for females from 1980 to 1990 is in the 15-24 age groups (-4.12%). From 1990 to 2000 no age cohort showed a negative result and the smallest of these age groups experienced a 4.19% growth in the 25-34 age groups.
The largest percent growth of the total population from 1980 to 1990 was 49.44% in the 45-54 age groups and from 1990 to 2000 was 41.78, 40.70 and 39.48% in the 65 and Older, 45-54 and 55-64 age group, respectively.
The largest percent of the total population in 1980 was 18.4% in the 5 to 14 age groups, in 1990 was 16.3% and 16.1% in the 5 to 14 and 45 to 54 age groups and in 2000 was 16.6% in the 5 to 14 and 35 to 44 age groups. Comparing 1980 to 2000, the percent of total population in the 35 to 44, 45 to 54, 55-64 and 65 and Older age groups were greater in 2000 than in 1980. Conversely, comparing 1980 to 2000 for total population in the remaining age groups, the 0 to 4, 5 to 15, 15 to 24 and 25 to 34 were each lower in 2000 than in 1980.
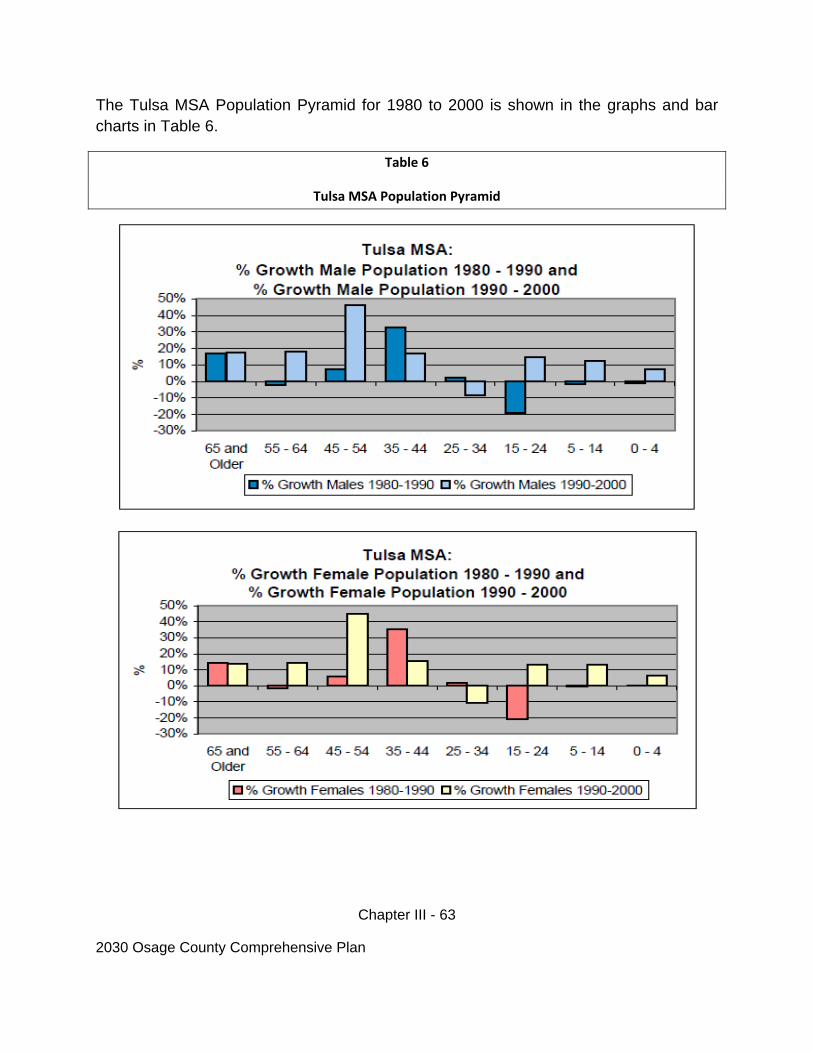
Chapter III - 63
2030 Osage County Comprehensive Plan
The Tulsa MSA Population Pyramid for 1980 to 2000 is shown in the graphs and bar charts in Table 6.
Table 6
Tulsa MSA Population Pyramid
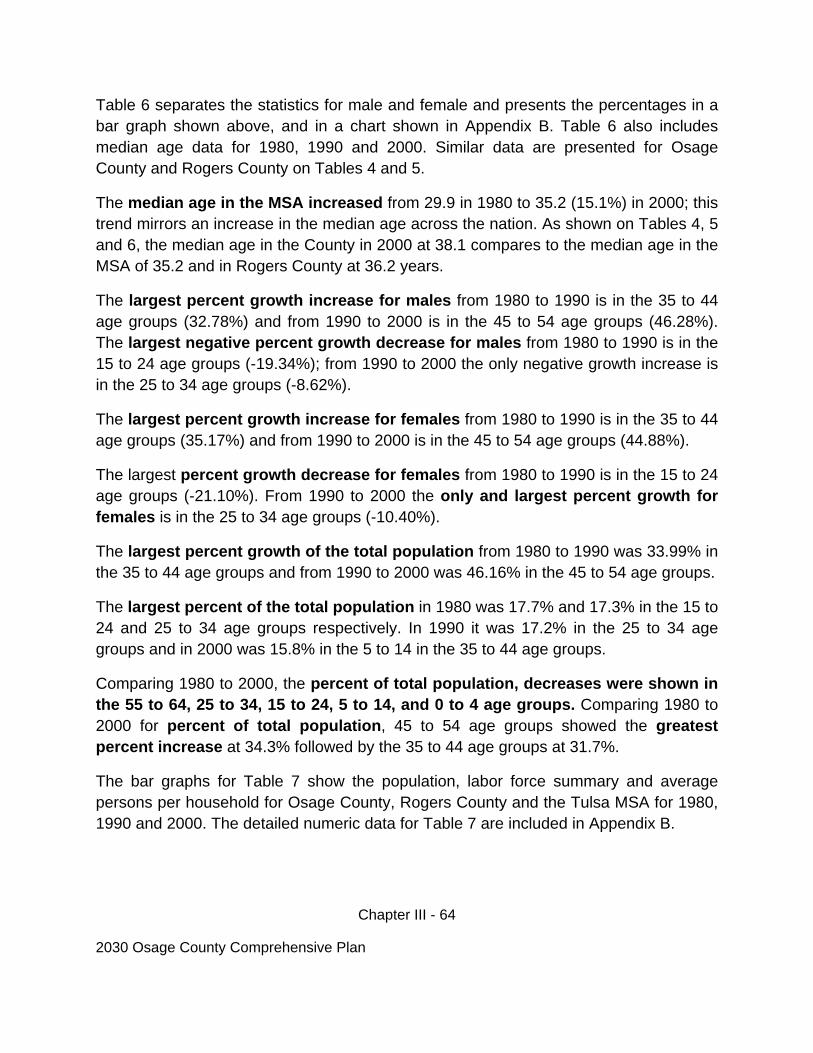
Chapter III - 64
2030 Osage County Comprehensive Plan
Table 6 separates the statistics for male and female and presents the percentages in a bar graph shown above, and in a chart shown in Appendix B. Table 6 also includes median age data for 1980, 1990 and 2000. Similar data are presented for Osage County and Rogers County on Tables 4 and 5.
The median age in the MSA increased from 29.9 in 1980 to 35.2 (15.1%) in 2000; this trend mirrors an increase in the median age across the nation. As shown on Tables 4, 5 and 6, the median age in the County in 2000 at 38.1 compares to the median age in the MSA of 35.2 and in Rogers County at 36.2 years.
The largest percent growth increase for males from 1980 to 1990 is in the 35 to 44 age groups (32.78%) and from 1990 to 2000 is in the 45 to 54 age groups (46.28%). The largest negative percent growth decrease for males from 1980 to 1990 is in the 15 to 24 age groups (-19.34%); from 1990 to 2000 the only negative growth increase is in the 25 to 34 age groups (-8.62%).
The largest percent growth increase for females from 1980 to 1990 is in the 35 to 44 age groups (35.17%) and from 1990 to 2000 is in the 45 to 54 age groups (44.88%).
The largest percent growth decrease for females from 1980 to 1990 is in the 15 to 24 age groups (-21.10%). From 1990 to 2000 the only and largest percent growth for females is in the 25 to 34 age groups (-10.40%).
The largest percent growth of the total population from 1980 to 1990 was 33.99% in the 35 to 44 age groups and from 1990 to 2000 was 46.16% in the 45 to 54 age groups.
The largest percent of the total population in 1980 was 17.7% and 17.3% in the 15 to 24 and 25 to 34 age groups respectively. In 1990 it was 17.2% in the 25 to 34 age groups and in 2000 was 15.8% in the 5 to 14 in the 35 to 44 age groups.
Comparing 1980 to 2000, the percent of total population, decreases were shown in the 55 to 64, 25 to 34, 15 to 24, 5 to 14, and 0 to 4 age groups. Comparing 1980 to 2000 for percent of total population, 45 to 54 age groups showed the greatest percent increase at 34.3% followed by the 35 to 44 age groups at 31.7%.
The bar graphs for Table 7 show the population, labor force summary and average persons per household for Osage County, Rogers County and the Tulsa MSA for 1980, 1990 and 2000. The detailed numeric data for Table 7 are included in Appendix B.
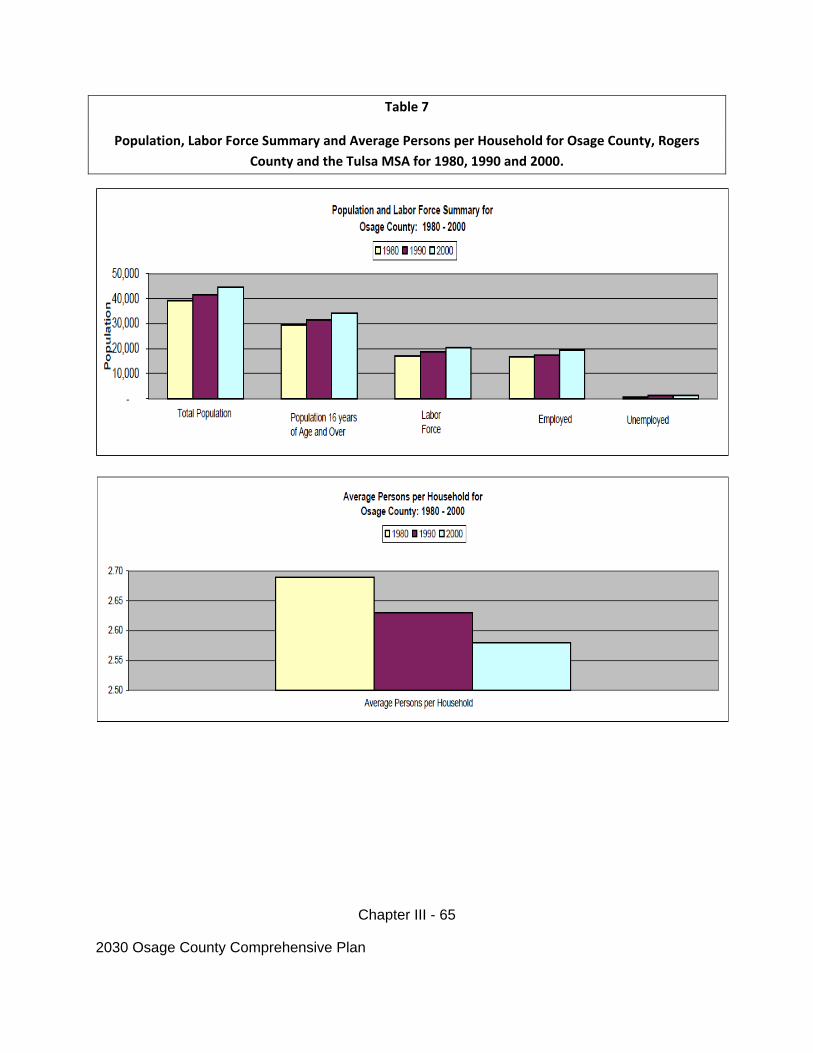
Chapter III - 65
2030 Osage County Comprehensive Plan
Table 7
Population, Labor Force Summary and Average Persons per Household for Osage County, Rogers
County and the Tulsa MSA for 1980, 1990 and 2000.
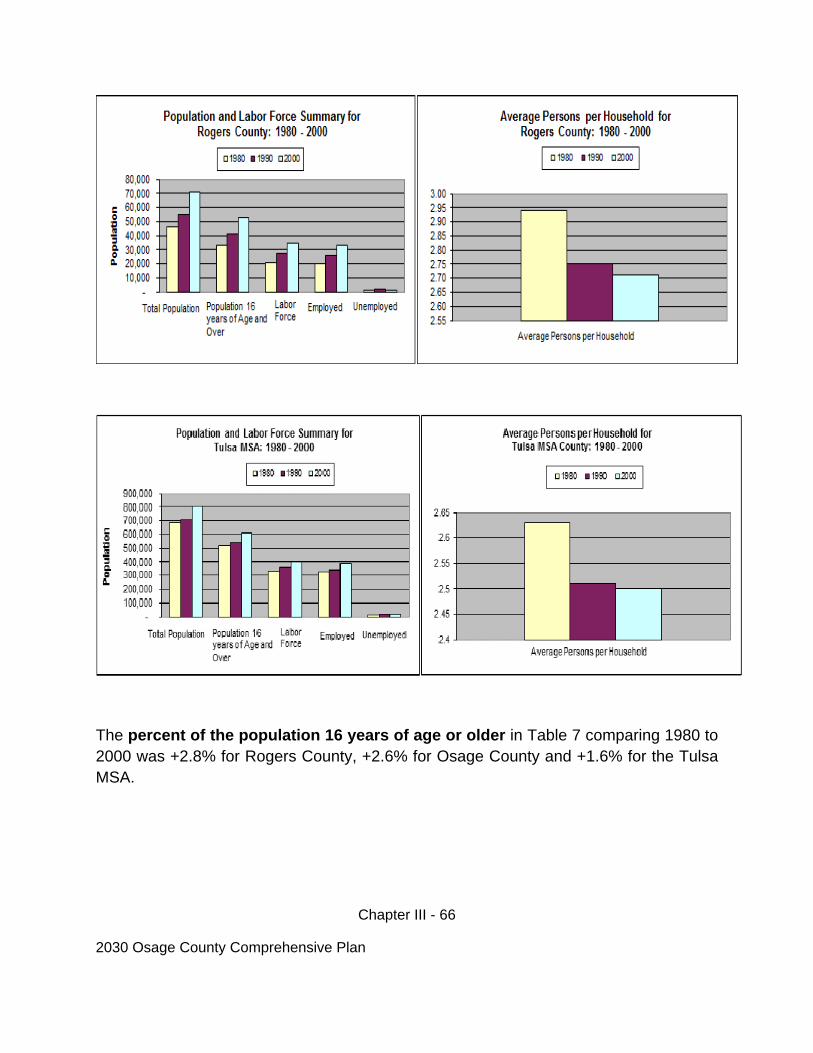
Chapter III - 66
2030 Osage County Comprehensive Plan
The percent of the population 16 years of age or older in Table 7 comparing 1980 to 2000 was +2.8% for Rogers County, +2.6% for Osage County and +1.6% for the Tulsa MSA.
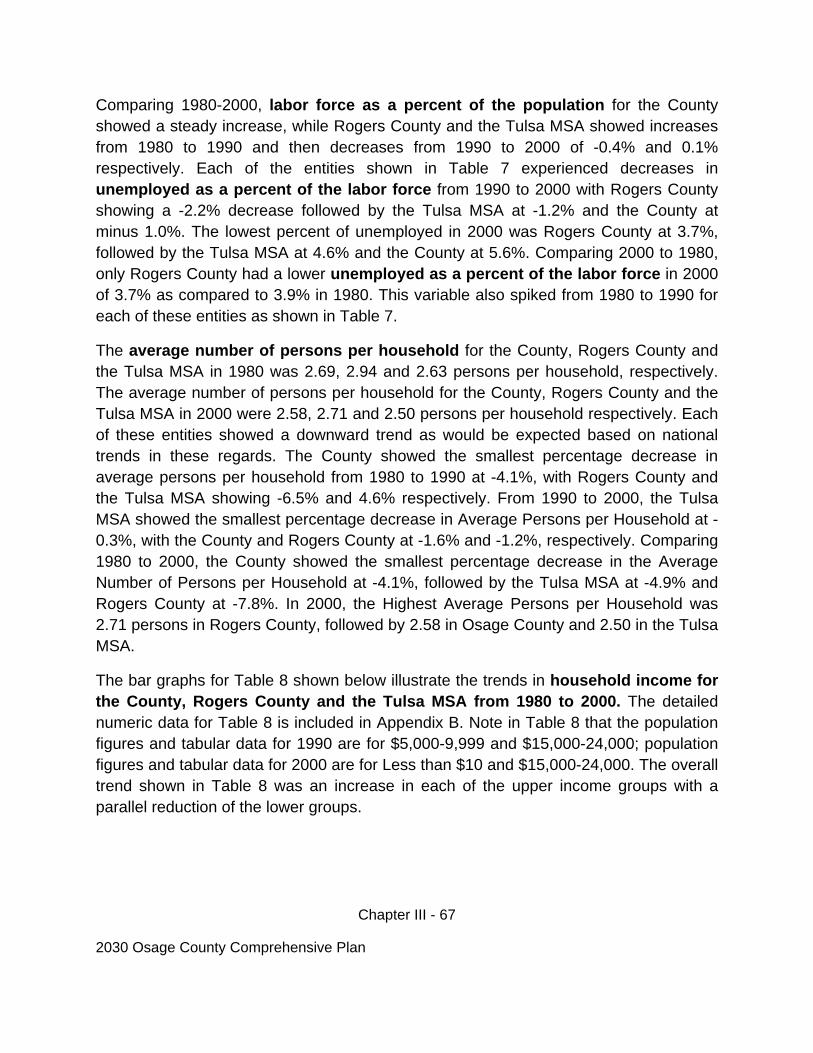
Chapter III - 67
2030 Osage County Comprehensive Plan
Comparing 1980-2000, labor force as a percent of the population for the County showed a steady increase, while Rogers County and the Tulsa MSA showed increases from 1980 to 1990 and then decreases from 1990 to 2000 of -0.4% and 0.1% respectively. Each of the entities shown in Table 7 experienced decreases in unemployed as a percent of the labor force from 1990 to 2000 with Rogers County showing a -2.2% decrease followed by the Tulsa MSA at -1.2% and the County at minus 1.0%. The lowest percent of unemployed in 2000 was Rogers County at 3.7%, followed by the Tulsa MSA at 4.6% and the County at 5.6%. Comparing 2000 to 1980, only Rogers County had a lower unemployed as a percent of the labor force in 2000 of 3.7% as compared to 3.9% in 1980. This variable also spiked from 1980 to 1990 for each of these entities as shown in Table 7.
The average number of persons per household for the County, Rogers County and the Tulsa MSA in 1980 was 2.69, 2.94 and 2.63 persons per household, respectively. The average number of persons per household for the County, Rogers County and the Tulsa MSA in 2000 were 2.58, 2.71 and 2.50 persons per household respectively. Each of these entities showed a downward trend as would be expected based on national trends in these regards. The County showed the smallest percentage decrease in average persons per household from 1980 to 1990 at -4.1%, with Rogers County and the Tulsa MSA showing -6.5% and 4.6% respectively. From 1990 to 2000, the Tulsa MSA showed the smallest percentage decrease in Average Persons per Household at -0.3%, with the County and Rogers County at -1.6% and -1.2%, respectively. Comparing 1980 to 2000, the County showed the smallest percentage decrease in the Average Number of Persons per Household at -4.1%, followed by the Tulsa MSA at -4.9% and Rogers County at -7.8%. In 2000, the Highest Average Persons per Household was 2.71 persons in Rogers County, followed by 2.58 in Osage County and 2.50 in the Tulsa MSA.
The bar graphs for Table 8 shown below illustrate the trends in household income for the County, Rogers County and the Tulsa MSA from 1980 to 2000. The detailed numeric data for Table 8 is included in Appendix B. Note in Table 8 that the population figures and tabular data for 1990 are for $5,000-9,999 and $15,000-24,000; population figures and tabular data for 2000 are for Less than $10 and $15,000-24,000. The overall trend shown in Table 8 was an increase in each of the upper income groups with a parallel reduction of the lower groups.

Chapter III - 68
2030 Osage County Comprehensive Plan
Table 8
Household Income for Osage County, Rogers County and the Tulsa MSA: 1980‐2000
The income group of $35,000-$49,999 for the County showed steady increases of the percentage of population from 1980 to 1990 and 1990 to 2000; the largest percent increase for these periods was from 1980 to 1990 and from 6.80% to 15.26%. In Rogers County from 1980 to 1990 the largest percent increase was in the $35,000-$49,999 income group from 9.89% to 19.50% and in the Tulsa MSA from 1980 to 1990 also in the $35,000-$49,999 income group from 8.53% to 16.99%.

Chapter III - 69
2030 Osage County Comprehensive Plan
The income group of $50,000 or More for the County increased from 15.26% to 18.51% to 1980-1990. In Rogers County the $50,000 or More income group showed a slight decrease from 19.50% to 17.20%; however, this income group showed an increase from 20.5% to 43.8% from 1990 to 2000 making Rogers County the entity in Table 8 showing the largest increase in percent of persons in this income group in 2000. Significantly, the County percent of population in the $50,000 or More income group in 1990 almost doubled from 16.24% to 30.30% in 2000. In Rogers County in the $50,000 or More income group in 1990 compared to 2000 doubled from 20.5% to 43.8%. In the Tulsa MSA in the $50,000 or More income group in 1990 compared to 2000, the percent increase was from 20.8% to 36.94%, respectively.
In 2000, the County showed the Lowest Median Household Income in Table 8 to be $34,477, with Rogers County at the highest with $44,471 and the Tulsa MSA with $38,261.
Recalling Table 7 in 2000, the Highest Average Household Size was 2.71 persons in Rogers County, followed by 2.58 in the County and 2.50 in the Tulsa MSA. When comparing the Average Household Size in Table 7 in 2000 to the Median Household Income in 2000 in Table 8, the dollars per person in the Average Household Size compared to Median Household Size is as follows: Rogers County at $16,409.96; the Tulsa MSA at $15,304.40; and the County at $13,363.18 dollars per person.
The bar graphs for Table 9 shown below illustrate the trends in educational attainment for the County, Rogers County and the Tulsa MSA from 1980 to 2000. The detailed numeric data for Table 9 are included in Appendix B. Note in Table 9 that an overall increasing trend is shown for each of the entities for the upper levels of educational attainment.
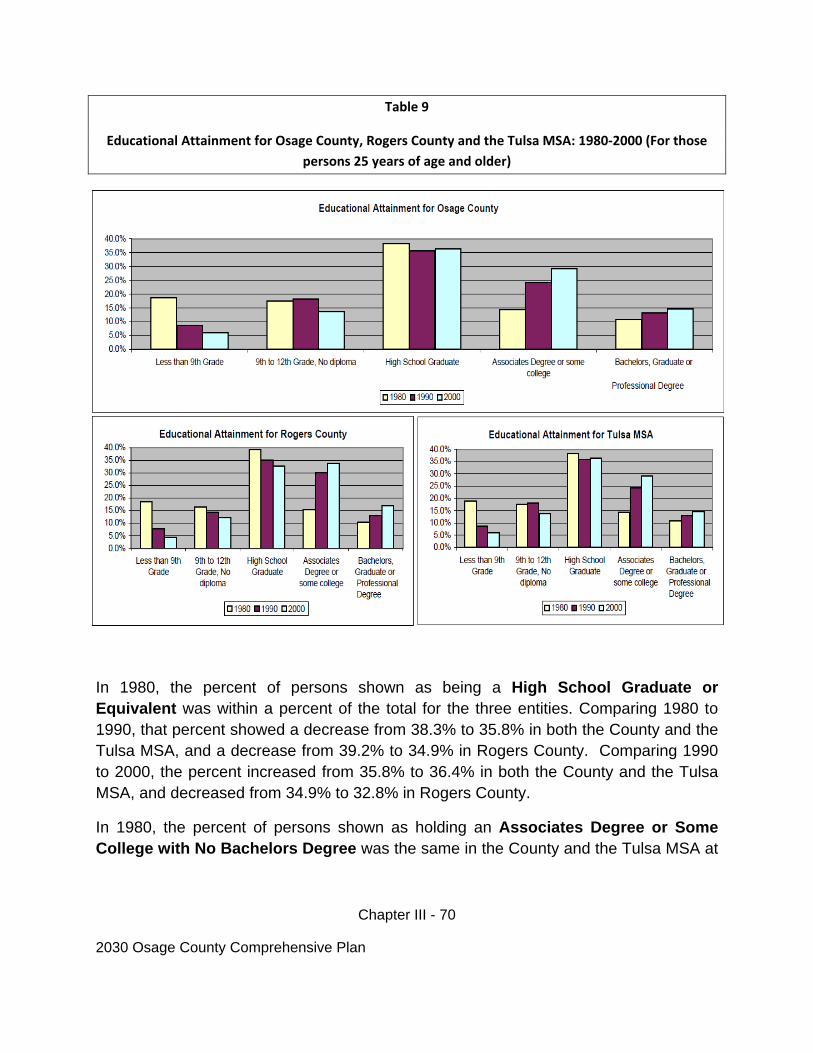
Chapter III - 70
2030 Osage County Comprehensive Plan
Table 9
Educational Attainment for Osage County, Rogers County and the Tulsa MSA: 1980‐2000 (For those
persons 25 years of age and older)
In 1980, the percent of persons shown as being a High School Graduate or Equivalent was within a percent of the total for the three entities. Comparing 1980 to 1990, that percent showed a decrease from 38.3% to 35.8% in both the County and the Tulsa MSA, and a decrease from 39.2% to 34.9% in Rogers County. Comparing 1990 to 2000, the percent increased from 35.8% to 36.4% in both the County and the Tulsa MSA, and decreased from 34.9% to 32.8% in Rogers County.
In 1980, the percent of persons shown as holding an Associates Degree or Some College with No Bachelors Degree was the same in the County and the Tulsa MSA at
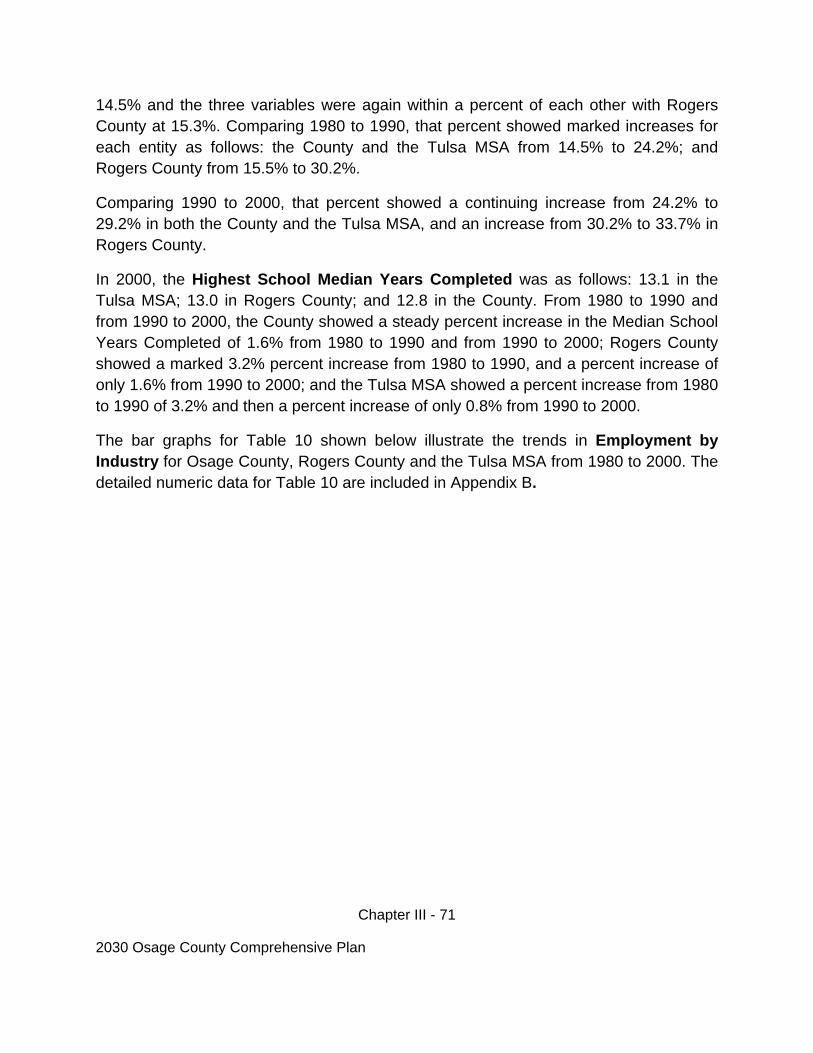
Chapter III - 71
2030 Osage County Comprehensive Plan
14.5% and the three variables were again within a percent of each other with Rogers County at 15.3%. Comparing 1980 to 1990, that percent showed marked increases for each entity as follows: the County and the Tulsa MSA from 14.5% to 24.2%; and Rogers County from 15.5% to 30.2%.
Comparing 1990 to 2000, that percent showed a continuing increase from 24.2% to 29.2% in both the County and the Tulsa MSA, and an increase from 30.2% to 33.7% in Rogers County.
In 2000, the Highest School Median Years Completed was as follows: 13.1 in the Tulsa MSA; 13.0 in Rogers County; and 12.8 in the County. From 1980 to 1990 and from 1990 to 2000, the County showed a steady percent increase in the Median School Years Completed of 1.6% from 1980 to 1990 and from 1990 to 2000; Rogers County showed a marked 3.2% percent increase from 1980 to 1990, and a percent increase of only 1.6% from 1990 to 2000; and the Tulsa MSA showed a percent increase from 1980 to 1990 of 3.2% and then a percent increase of only 0.8% from 1990 to 2000.
The bar graphs for Table 10 shown below illustrate the trends in Employment by Industry for Osage County, Rogers County and the Tulsa MSA from 1980 to 2000. The detailed numeric data for Table 10 are included in Appendix B.
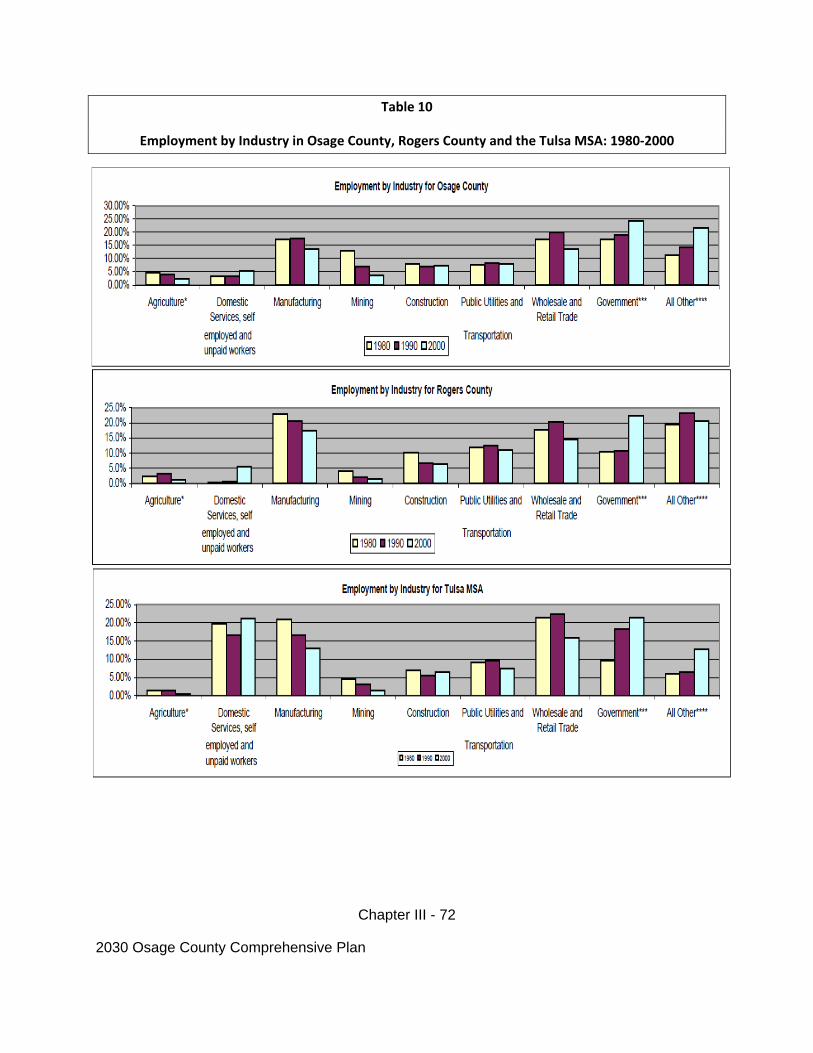
Chapter III - 72
2030 Osage County Comprehensive Plan
Table 10
Employment by Industry in Osage County, Rogers County and the Tulsa MSA: 1980‐2000
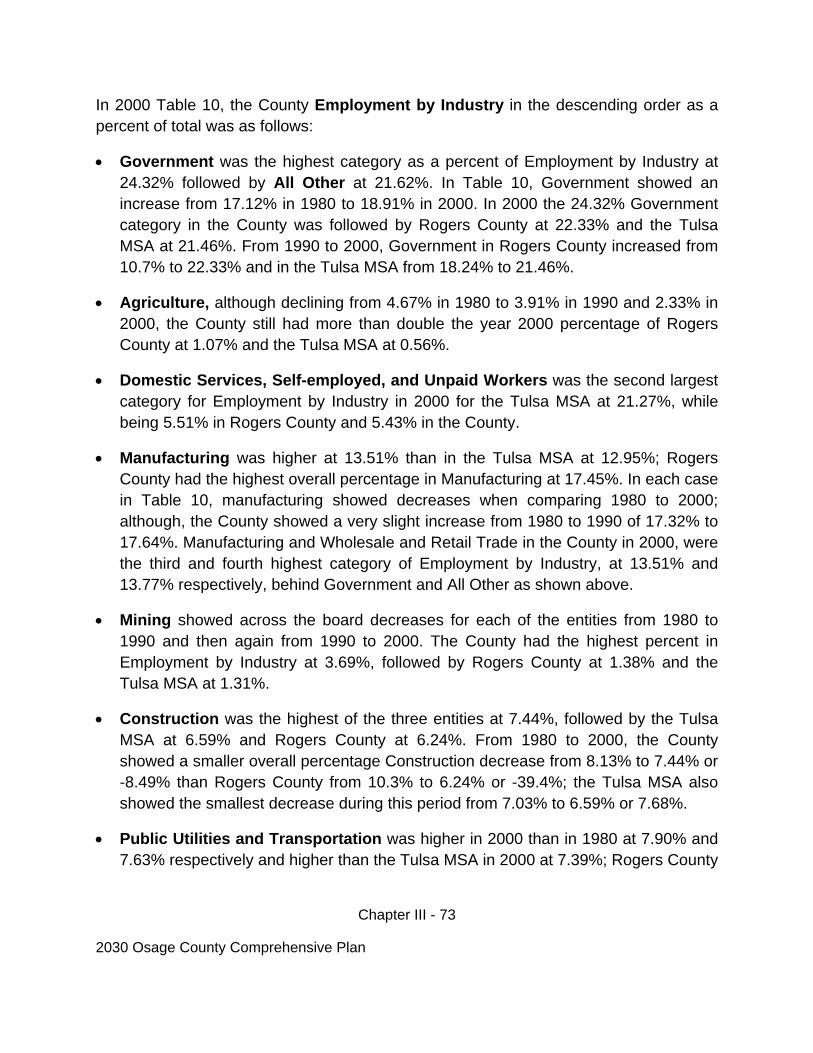
Chapter III - 73
2030 Osage County Comprehensive Plan
In 2000 Table 10, the County Employment by Industry in the descending order as a percent of total was as follows:
Government was the highest category as a percent of Employment by Industry at 24.32% followed by All Other at 21.62%. In Table 10, Government showed an increase from 17.12% in 1980 to 18.91% in 2000. In 2000 the 24.32% Government category in the County was followed by Rogers County at 22.33% and the Tulsa MSA at 21.46%. From 1990 to 2000, Government in Rogers County increased from 10.7% to 22.33% and in the Tulsa MSA from 18.24% to 21.46%.
Agriculture, although declining from 4.67% in 1980 to 3.91% in 1990 and 2.33% in 2000, the County still had more than double the year 2000 percentage of Rogers County at 1.07% and the Tulsa MSA at 0.56%.
Domestic Services, Self-employed, and Unpaid Workers was the second largest category for Employment by Industry in 2000 for the Tulsa MSA at 21.27%, while being 5.51% in Rogers County and 5.43% in the County.
Manufacturing was higher at 13.51% than in the Tulsa MSA at 12.95%; Rogers County had the highest overall percentage in Manufacturing at 17.45%. In each case in Table 10, manufacturing showed decreases when comparing 1980 to 2000; although, the County showed a very slight increase from 1980 to 1990 of 17.32% to 17.64%. Manufacturing and Wholesale and Retail Trade in the County in 2000, were the third and fourth highest category of Employment by Industry, at 13.51% and 13.77% respectively, behind Government and All Other as shown above.
Mining showed across the board decreases for each of the entities from 1980 to 1990 and then again from 1990 to 2000. The County had the highest percent in Employment by Industry at 3.69%, followed by Rogers County at 1.38% and the Tulsa MSA at 1.31%.
Construction was the highest of the three entities at 7.44%, followed by the Tulsa MSA at 6.59% and Rogers County at 6.24%. From 1980 to 2000, the County showed a smaller overall percentage Construction decrease from 8.13% to 7.44% or -8.49% than Rogers County from 10.3% to 6.24% or -39.4%; the Tulsa MSA also showed the smallest decrease during this period from 7.03% to 6.59% or 7.68%.
Public Utilities and Transportation was higher in 2000 than in 1980 at 7.90% and 7.63% respectively and higher than the Tulsa MSA in 2000 at 7.39%; Rogers County

Chapter III - 74
2030 Osage County Comprehensive Plan
was the highest in this category at 10.93% in 2000. Comparing 1990 to 2000, Table 10 shows that employment in this category increased from 1980 to 1990 and then decreased from 1990 to 2000 across the board.
Wholesale and Retail Trade decreased to 13.77% in 2000 from 17.29% in 1980 after increasing from 17.29% in 1980 to 19.97% in 1990. Similar up and down trends are shown in Table 10 for Rogers County and the Tulsa MSA.
The bar graphs for Table 11 shown below illustrate the trends in Occupational Structure Trends for the County, Rogers County and the Tulsa MSA from 1980 to 1990. The detailed numeric data for Table 11 are included in Appendix B. Refer to Table 12 for the 2000 Occupational Structure Trends data.
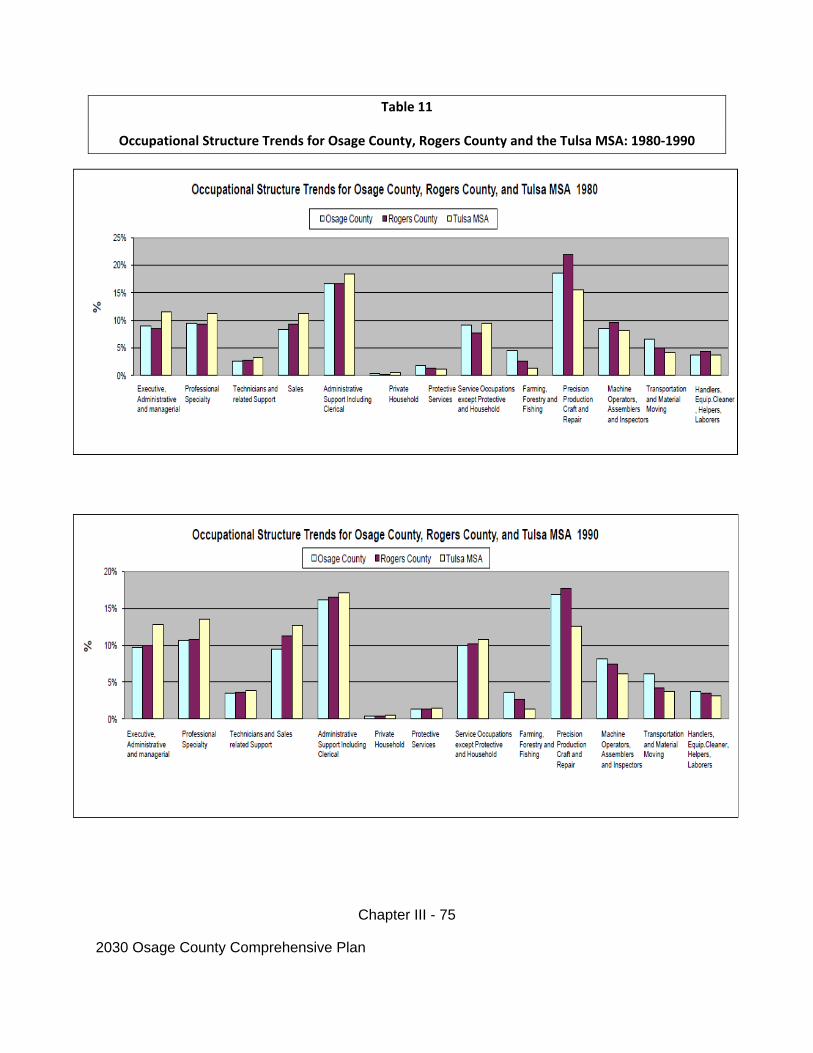
Chapter III - 75
2030 Osage County Comprehensive Plan
Table 11
Occupational Structure Trends for Osage County, Rogers County and the Tulsa MSA: 1980‐1990
Chapter III - 76
2030 Osage County Comprehensive Plan
In 1990, Occupational Structure Trends in the County in descending order as a percent of total were as follows:
Category Year 1990
Precision Production Craft and Repair 16.92%
Administrative Support Including Clerical 16.13%
Professional Specialty Occupations 10.67%
Service Occupations except Protective and Household 10.00%
Executive, Administrative and Managerial 9.73%
Sales Occupations 9.46%
Machine Operators Assemblers and Inspectors 8.19%
Transportation and Material Moving Occupations 6.14%
Handlers, Equipment Cleaners, Helpers and Laborers 3.75%
Farming, Forestry and Fishing Operations 3.64%
Technicians and Related Support Occupations 3.55%
Protective Services 1.36%
Private Households 0.45%
From 1980 to 1990, the following categories of Occupational Structure Trends showed increases in the County:
Category 1980 to 1990
Professional Specialty Occupations 9.53% to 10.67%
Service Occupations except Protective and Household 9.18% to 10.00%
Executive, Administrative and Managerial 8.97% to 9.73%
Chapter III - 77
2030 Osage County Comprehensive Plan
Sales Occupations 8.40% to 9.46%
Technicians and Related Support Occupations 2.71% to 3.55%
Private Households 0.42% to 0.45%
From 1980 to 1990, the following categories of Occupational Structure Trends showed decreases, in most cases less than 1%, in the County:
Category 1980 to 1990
Precision Production Craft and Repair 18.56% to 16.92%
Administrative Support Including Clerical 16.73% to 16.13%
Machine Operators Assemblers and Inspectors 8.58 to 8.19%
Transportation and Material Moving Occupations 6.67% to 6.14%
Handlers, Equipment Cleaners, Helpers and Laborers 3.77% to 3.75%
Farming, Forestry and Fishing Operations 4.58% to 3.64%
Protective Services 1.89% to 1.36%
From 1980 to 1990, across the board increases were shown in the following Occupational Structures by the County, Rogers County and the Tulsa MSA:
Executive, Administrative and Managerial
Professional Specialty Occupations
Technicians and Related Support Occupations
Sales Occupations
Service Occupations except Protective and Household
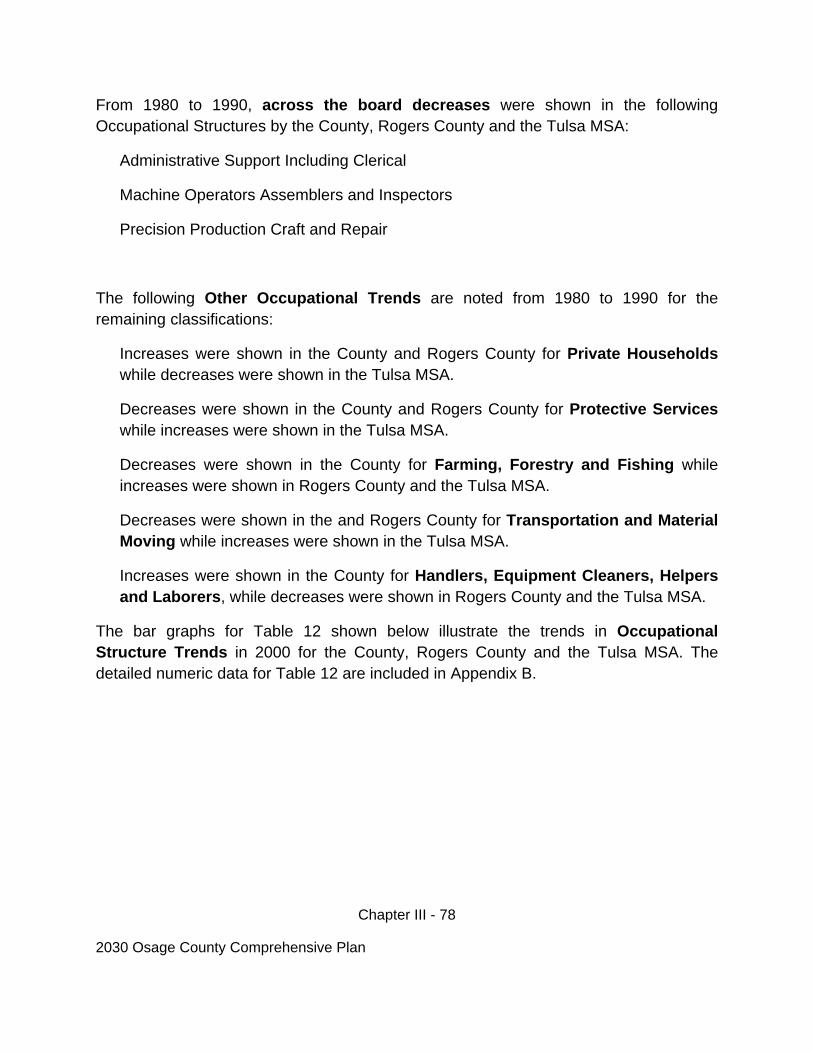
Chapter III - 78
2030 Osage County Comprehensive Plan
From 1980 to 1990, across the board decreases were shown in the following Occupational Structures by the County, Rogers County and the Tulsa MSA:
Administrative Support Including Clerical
Machine Operators Assemblers and Inspectors
Precision Production Craft and Repair
The following Other Occupational Trends are noted from 1980 to 1990 for the remaining classifications:
Increases were shown in the County and Rogers County for Private Households while decreases were shown in the Tulsa MSA.
Decreases were shown in the County and Rogers County for Protective Services while increases were shown in the Tulsa MSA.
Decreases were shown in the County for Farming, Forestry and Fishing while increases were shown in Rogers County and the Tulsa MSA.
Decreases were shown in the and Rogers County for Transportation and Material Moving while increases were shown in the Tulsa MSA.
Increases were shown in the County for Handlers, Equipment Cleaners, Helpers and Laborers, while decreases were shown in Rogers County and the Tulsa MSA.
The bar graphs for Table 12 shown below illustrate the trends in Occupational Structure Trends in 2000 for the County, Rogers County and the Tulsa MSA. The detailed numeric data for Table 12 are included in Appendix B.
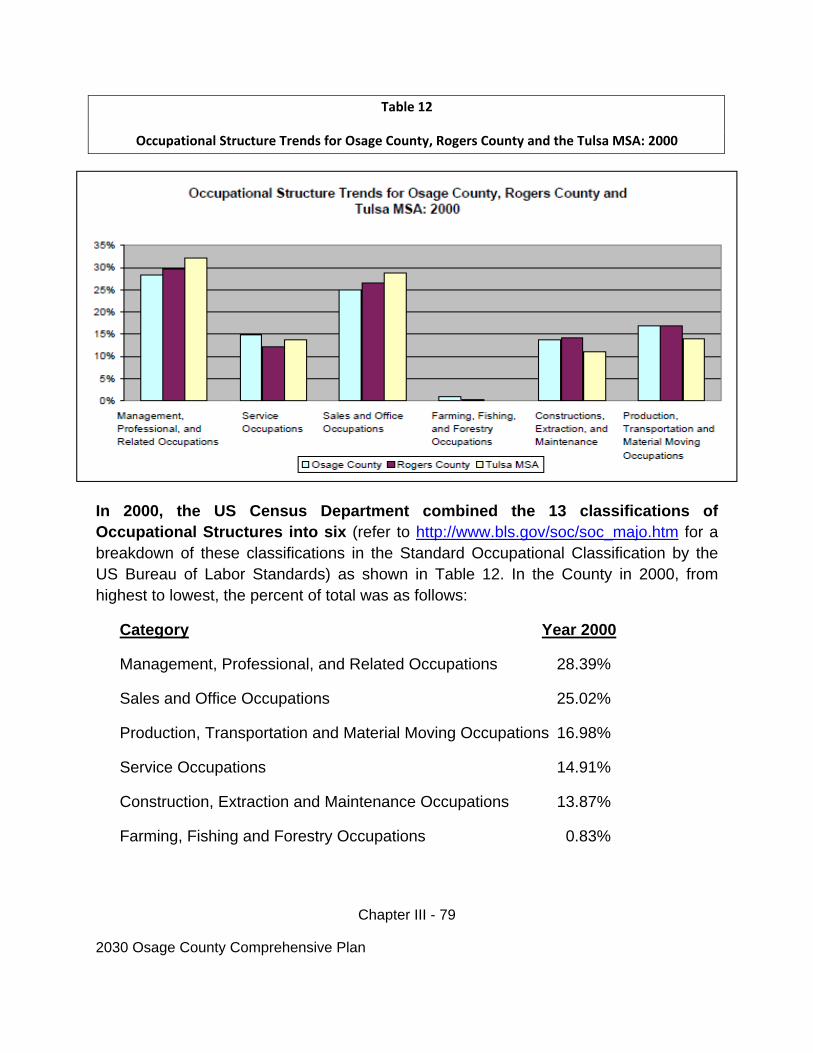
Chapter III - 79
2030 Osage County Comprehensive Plan
Table 12
Occupational Structure Trends for Osage County, Rogers County and the Tulsa MSA: 2000
In 2000, the US Census Department combined the 13 classifications of Occupational Structures into six (refer to http://www.bls.gov/soc/soc_majo.htm for a breakdown of these classifications in the Standard Occupational Classification by the US Bureau of Labor Standards) as shown in Table 12. In the County in 2000, from highest to lowest, the percent of total was as follows:
Category Year 2000
Management, Professional, and Related Occupations 28.39%
Sales and Office Occupations 25.02%
Production, Transportation and Material Moving Occupations 16.98%
Service Occupations 14.91%
Construction, Extraction and Maintenance Occupations 13.87%
Farming, Fishing and Forestry Occupations 0.83%
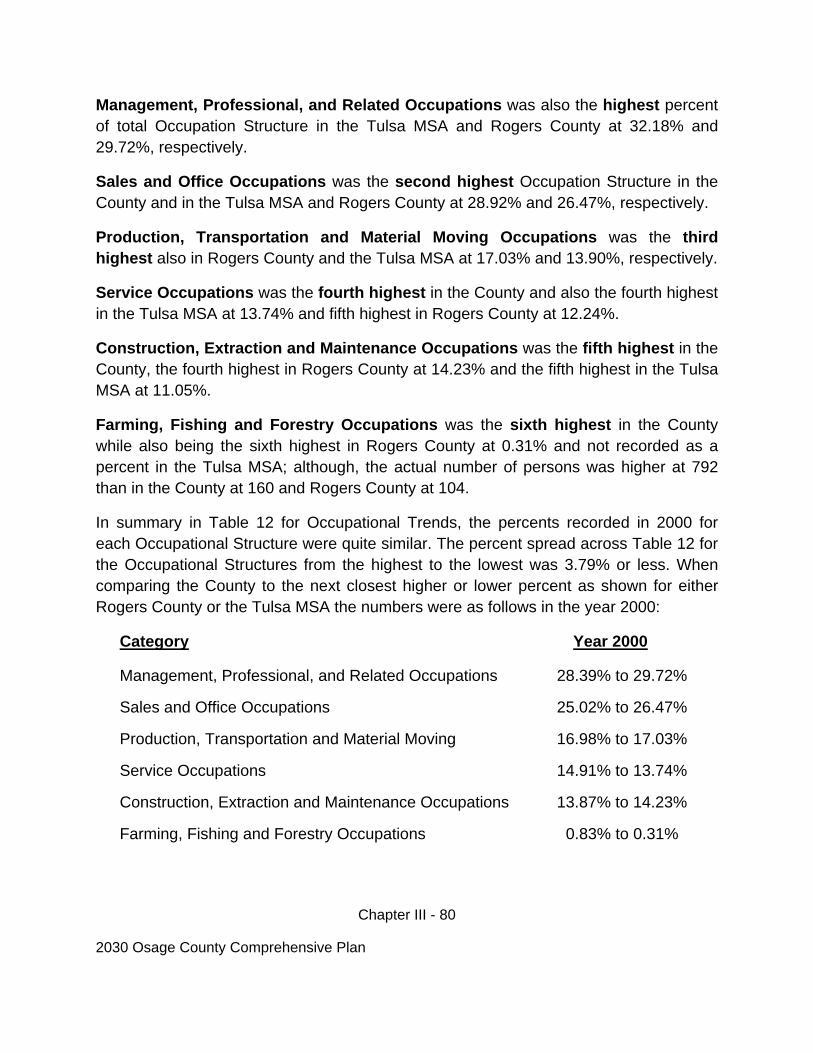
Chapter III - 80
2030 Osage County Comprehensive Plan
Management, Professional, and Related Occupations was also the highest percent of total Occupation Structure in the Tulsa MSA and Rogers County at 32.18% and 29.72%, respectively.
Sales and Office Occupations was the second highest Occupation Structure in the County and in the Tulsa MSA and Rogers County at 28.92% and 26.47%, respectively.
Production, Transportation and Material Moving Occupations was the third highest also in Rogers County and the Tulsa MSA at 17.03% and 13.90%, respectively.
Service Occupations was the fourth highest in the County and also the fourth highest in the Tulsa MSA at 13.74% and fifth highest in Rogers County at 12.24%.
Construction, Extraction and Maintenance Occupations was the fifth highest in the County, the fourth highest in Rogers County at 14.23% and the fifth highest in the Tulsa MSA at 11.05%.
Farming, Fishing and Forestry Occupations was the sixth highest in the County while also being the sixth highest in Rogers County at 0.31% and not recorded as a percent in the Tulsa MSA; although, the actual number of persons was higher at 792 than in the County at 160 and Rogers County at 104.
In summary in Table 12 for Occupational Trends, the percents recorded in 2000 for each Occupational Structure were quite similar. The percent spread across Table 12 for the Occupational Structures from the highest to the lowest was 3.79% or less. When comparing the County to the next closest higher or lower percent as shown for either Rogers County or the Tulsa MSA the numbers were as follows in the year 2000:
Category Year 2000
Management, Professional, and Related Occupations 28.39% to 29.72%
Sales and Office Occupations 25.02% to 26.47%
Production, Transportation and Material Moving 16.98% to 17.03%
Service Occupations 14.91% to 13.74%
Construction, Extraction and Maintenance Occupations 13.87% to 14.23%
Farming, Fishing and Forestry Occupations 0.83% to 0.31%
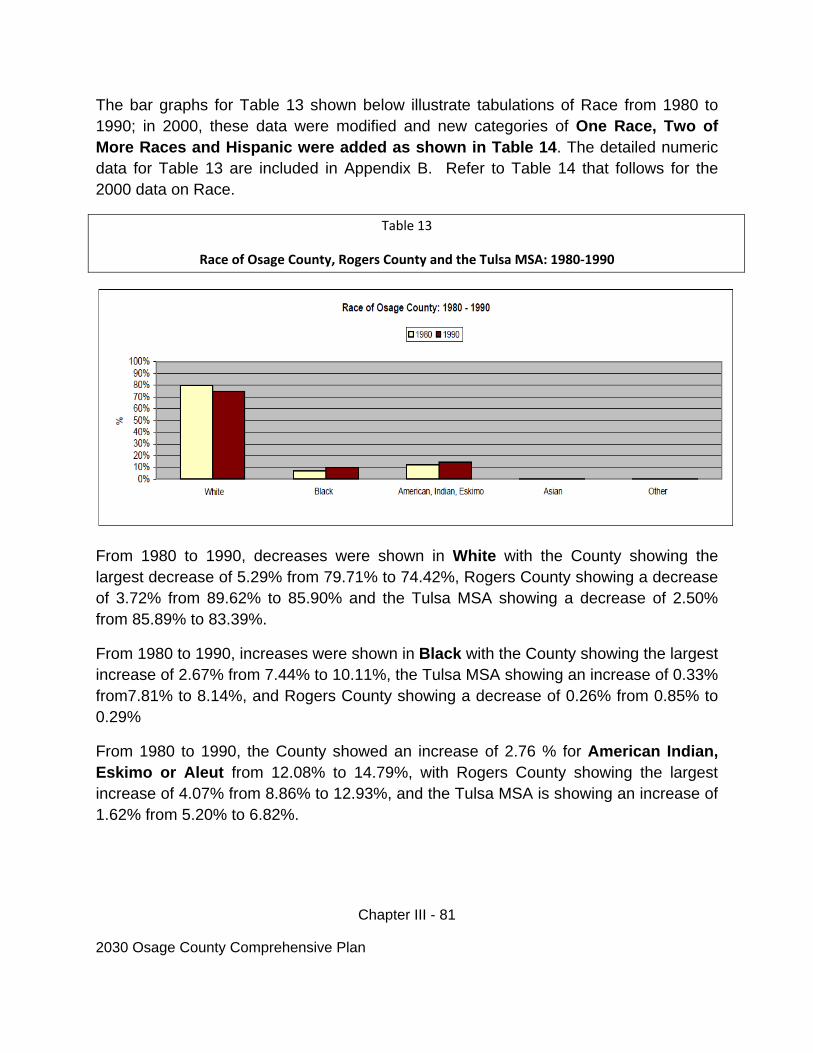
Chapter III - 81
2030 Osage County Comprehensive Plan
The bar graphs for Table 13 shown below illustrate tabulations of Race from 1980 to 1990; in 2000, these data were modified and new categories of One Race, Two of More Races and Hispanic were added as shown in Table 14. The detailed numeric data for Table 13 are included in Appendix B. Refer to Table 14 that follows for the 2000 data on Race.
Table 13
Race of Osage County, Rogers County and the Tulsa MSA: 1980‐1990
From 1980 to 1990, decreases were shown in White with the County showing the largest decrease of 5.29% from 79.71% to 74.42%, Rogers County showing a decrease of 3.72% from 89.62% to 85.90% and the Tulsa MSA showing a decrease of 2.50% from 85.89% to 83.39%.
From 1980 to 1990, increases were shown in Black with the County showing the largest increase of 2.67% from 7.44% to 10.11%, the Tulsa MSA showing an increase of 0.33% from7.81% to 8.14%, and Rogers County showing a decrease of 0.26% from 0.85% to 0.29%
From 1980 to 1990, the County showed an increase of 2.76 % for American Indian, Eskimo or Aleut from 12.08% to 14.79%, with Rogers County showing the largest increase of 4.07% from 8.86% to 12.93%, and the Tulsa MSA is showing an increase of 1.62% from 5.20% to 6.82%.
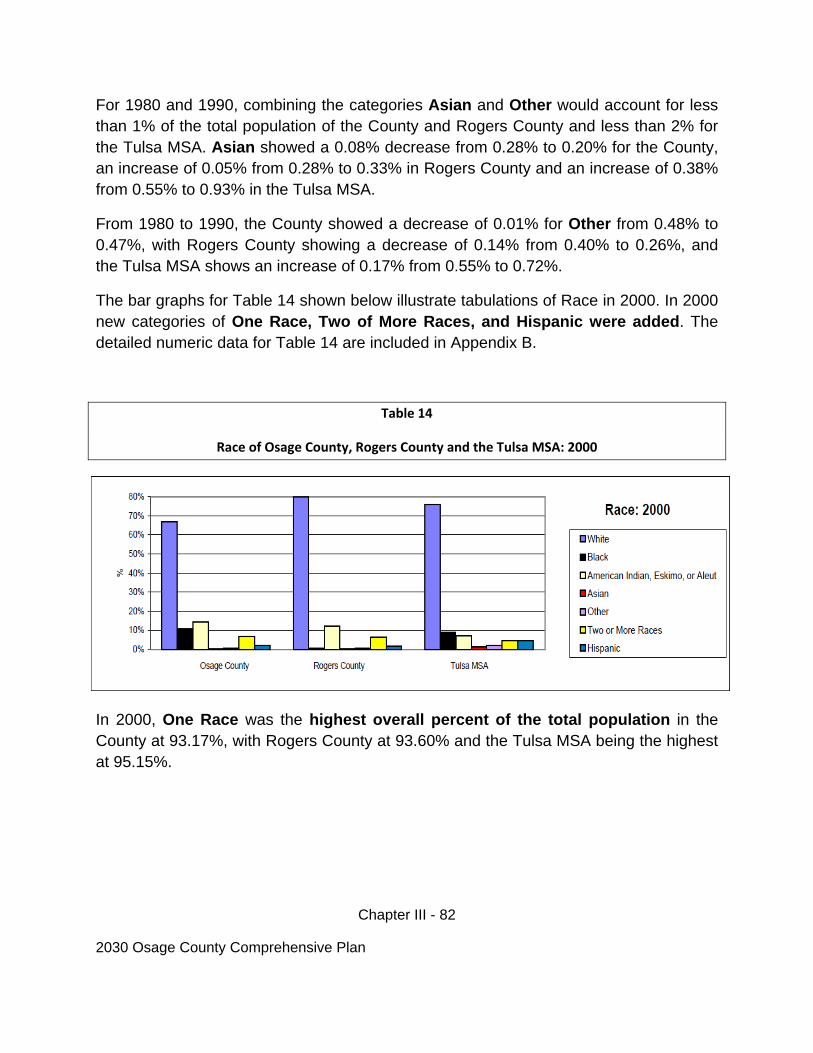
Chapter III - 82
2030 Osage County Comprehensive Plan
For 1980 and 1990, combining the categories Asian and Other would account for less than 1% of the total population of the County and Rogers County and less than 2% for the Tulsa MSA. Asian showed a 0.08% decrease from 0.28% to 0.20% for the County, an increase of 0.05% from 0.28% to 0.33% in Rogers County and an increase of 0.38% from 0.55% to 0.93% in the Tulsa MSA.
From 1980 to 1990, the County showed a decrease of 0.01% for Other from 0.48% to 0.47%, with Rogers County showing a decrease of 0.14% from 0.40% to 0.26%, and the Tulsa MSA shows an increase of 0.17% from 0.55% to 0.72%.
The bar graphs for Table 14 shown below illustrate tabulations of Race in 2000. In 2000 new categories of One Race, Two of More Races, and Hispanic were added. The detailed numeric data for Table 14 are included in Appendix B.
Table 14
Race of Osage County, Rogers County and the Tulsa MSA: 2000
In 2000, One Race was the highest overall percent of the total population in the County at 93.17%, with Rogers County at 93.60% and the Tulsa MSA being the highest at 95.15%.
Chapter III - 83
2030 Osage County Comprehensive Plan
In 2000, the County had the highest percent of the total population in the categories Black, American Indian, Eskimo or Aleut, and Two or More Races as follows:
Black population in was 10.84%, followed by the Tulsa MSA 8.82% and Rogers County at 0.72%
American Indian, Eskimo or Aleut was 14.42%, followed by Rogers County at 12.11% and the Tulsa MSA at 6.98%
Two or More Races was 6.83%, followed by Rogers County at 6.40% and the Tulsa MSA at 4.85%.
In 2000, the County had the second highest percent of the total population in the categories of Other and Hispanic as follows:
Other population was 0.66%, with the Tulsa MSA being the highest at 2.14% and Rogers County third at 0.56%
Hispanic population was 2.12%, with the Tulsa MSA being the highest at 4.80% and Rogers County third at 1.83%
In 2000, Osage County had the lowest percentage of the total population in the categories of One Race, White, and Asian as follows:
One Race in the County was 93.17%, with the Tulsa MSA being the highest at 95.15% and Rogers County second at 93.60%
White in the County was 67.01%, with Rogers County being the highest at 79.88% and the Tulsa MSA being the second highest at 75.97%.
Asian in the County was 0.23%, with the Tulsa MSA being the highest at 1.24% followed by Rogers County at 0.32%
Chapter III - 84
2030 Osage County Comprehensive Plan
SUMMARY OF THE BASIS FOR THE 2030 OSAGE COUNTY COMPREHENSIVE PLAN
The elements and sub-elements of the natural and built environment, trends in growth and development and the data on population and demographics of the Planning Area discussed above each contribute to the basis for the 2030 Plan. Each must be considered and accounted for in the present as well as being given consideration of during and at the end of the Planning Period. The elements and sub-elements of the County’s natural and built environment, trends in growth and development, and the population and demographics are each unique resources as well as determinants of growth and development. Therefore, in some cases these resources should be built upon and incorporated into development plans and in others these resources must be preserved and conserved in the face of growth and development during the Planning Period. In summary, the basis of the 2030 Plan and Planning Process is the History, Mission and Vision as presented in Chapter I, the Goals/Policies and Objectives as adopted in Chapter II, and now the basis of the 2030 Plan as presented in Chapter III – each will be melded into the land use and action plans as presented in Chapter IV and the 2030 Plan.