Embed Size (px)
Citation preview

CENTER FOR DRUG EVALUATION AND RESEARCH
APPLICATION NUMBER:
203214Orig1s000
CLINICAL PHARMACOLOGY AND BIOPHARMACEUTICS REVIEW(S)

CLINICAL PHARMACOLOGY REVIEW
NDA 203214
Submission Date 10/21/2011
Brand Name TBD
Generic Name Tofacitinib
Clinical Pharmacology Reviewer Lokesh Jain, Ph.D.
Pharmacometrics Reviewer Lokesh Jain, Ph.D. and Atul Bhattaram, Ph.D.
Pharmacogenomics Reviewer Jeffrey Kraft, Ph.D.
Pharmacometrics Team Leader Atul Bhattaram, Ph.D.
Pharmacogenomics Team Leader Michael Pacanowski, Pharm.D., M.P.H.
Clinical Pharmacology Team Leader
Suresh Doddapaneni, Ph.D.
OCP Division Clinical Pharmacology II
OND Division Division of Pulmonary, Allergy, and Rheumatology Products
Sponsor/Authorized Applicant Pfizer, Inc.
Submission Type; Code 505(b)(1); standard review
Formulation; Strength(s) Tablet ; 5 mg and 10 mg
Indication Rheumatoid Arthritis
Dosage Regimen 5 mg BID; some patients may benefit from an increase to 10 mg BID based on clinical response
1. Executive Summary ..............................................................................4 1.1 Recommendations........................................................................................................................ 4 1.2 Phase IV Commitments ............................................................................................................... 4 1.3 Summary of Clinical Pharmacology and Biopharmaceutics Findings ..................................... 4
2. Question Based Review ........................................................................8 2.1 List the in vitro and in vivo Clinical Pharmacology and Biopharmaceutics studies and the clinical
studies with PK and/or PD information submitted in the NDA or BLA....................................... 8 2.2 General Attributes of the Drug ............................................................................................... 10
2.2.1 What are the highlights of the chemistry and physical-chemical properties of the drug substance and the formulation of the drug product? ............................................................... 10
2.2.2 What are the proposed mechanism of action and therapeutic indications? ............................. 11 2.2.3 What are the proposed dosages and routes of administration?................................................ 12 2.2.4 What drugs (substances, products) indicated for the same indication are approved in the US?
................................................................................................................................................ 12 2.3 General Clinical Pharmacology............................................................................................... 13
Reference ID: 3149379

2.3.1 What are the design features of the clinical pharmacology and biopharmaceutics studies and the clinical studies used to support dosing or claims?............................................................. 13
2.3.2 What is the basis for selecting the response endpoints and how are they measured in clinical pharmacology studies? ............................................................................................................ 13
2.3.3 Are the active moieties in plasma and clinically relevant tissues appropriately identified and measured to assess pharmacokinetic parameters and exposure response relationships?......... 13
2.4 Exposure-Response................................................................................................................... 13 2.4.1 What are the characteristics of the exposure-response relationship for effectiveness? ........... 13 2.4.2 What are the characteristics of the exposure-response relationships for safety?................... 14 2.4.3 Does this drug prolong QT/QTc Interval? .............................................................................. 14 2.4.4 Is the dose and dosing regimen selected consistent with the known E-R relationship? .......... 14
2.5 What are the PK characteristics of the drug? ...................................................................... 14 2.5.1 What are the single and multiple dose PK parameters of parent drug and relevant metabolites
in healthy adults? .................................................................................................................... 14 2.5.2 How does the PK of the drug and its relevant metabolites in healthy adults compare to that in
patients with the target disease? .............................................................................................. 17 2.5.3 What is the inter- and intra-subject variability of the PK parameters in volunteers and patients
with the target disease? ........................................................................................................... 17 2.5.4 What are the characteristics of drug absorption? .................................................................... 18 2.5.5 What are the characteristics of drug distribution?................................................................... 18 2.5.6 Does the mass balance study suggest renal or hepatic as the major route of elimination?...... 18 2.5.7 What is the percentage of total radioactivity in plasma identified as parent drug and
metabolites? ............................................................................................................................ 19 2.5.8 What are the characteristics of drug metabolism?................................................................... 20 2.5.9 Is there evidence for excretion of parent drug and/or metabolites into bile? .......................... 21 2.5.10 Is there evidence for enterohepatic recirculation for parent and/or metabolites?.................... 22 2.5.11 What are the characteristics of drug excretion in urine? ......................................................... 22 2.5.12 Based on PK parameters, what is the degree of the proportionality of the dose-concentration
relationship?............................................................................................................................ 22 2.5.13 How do the PK parameters change with time following chronic dosing? .............................. 23 2.5.14 Is there evidence for a circadian rhythm of the PK? ............................................................... 24
2.6 Intrinsic Factors........................................................................................................................ 24 2.6.1 What are the major intrinsic factors responsible for the inter-subject variability in exposure
(AUC, Cmax, Cmin) in patients with the target disease and how much of the variability is explained by the identified covariates? ................................................................................... 24
2.6.2 Based upon what is known about E-R relationships in the target population and their variability, what dosage regimen adjustments are recommended for each group? ................. 24
2.6.3 Does genetic variation impact exposure and/or response?...................................................... 31 2.7 Extrinsic Factors...................................................................................................................... 31
2.7.1 Is there an in vitro basis to suspect in vivo drug-drug interactions? ....................................... 31 2.7.2 Is the drug a substrate of CYP enzymes? ................................................................................ 31 2.7.3 Is the drug an inhibitor and/or an inducer of enzymes? ........................................................... 31 2.7.4 Is the drug a substrate, an inhibitor and/or an inducer of transporter processes? .................... 32 2.7.5 Are there other metabolic/transporter pathways that may be important?................................ 33 2.7.6 What extrinsic factors influence exposure and/or response, and what is the impact of any
differences in exposure on effectiveness or safety responses?................................................ 33 2.7.7 What are the drug-drug interactions? ...................................................................................... 33 2.7.8 Does the label specify coadministration of another drug? ...................................................... 37 2.7.9 What other co-medications are likely to be administered to the target population?................ 37 2.7.10 Is there a known mechanistic basis for pharmacodynamic drug-drug interactions? ............... 38
2.8 General Biopharmaceutics ....................................................................................................... 38 2.8.1 Based on the biopharmaceutic classification system principles, in what class is this drug and
formulation? What solubility, permeability and dissolution data support this classification? 38 2.8.2 How is the proposed to-be-marketed formulation linked to the clinical service formulation?
................................................................................................................................................ 38 2.8.3 What is the effect of food on the bioavailability of the drug when administered as solution or
NDA203214 Clinical Pharmacology Review_NDA203214.doc
Page 2 of 158
Reference ID: 3149379
2.8.4 Was the bioequivalence of the different strengths of the to be marketed formulation tested? If so were they bioequivalent or not?.......................................................................................... 41
2.9 Analytical Section ..................................................................................................................... 41 2.9.1 How are parent drug and relevant metabolites identified and what are the analytical methods
used to measure them in plasma and other matrices?.............................................................. 41 2.9.2 Which mtabolites have been selected for analysis and why?.................................................. 42 2.9.3 For all moieties measured, is free, bound, or total measured? ................................................ 42 2.9.4 What bioanalytical methods are used to assess concentrations of the measured moieties? .... 43 2.9.5 What is the range of the standard curve? How does it relate to the requirements for clinical
studies? What curve fitting techniques were used?................................................................. 43 2.9 Detailed Labeling Recommendations...................................................................................... 45
PHARMACOMETRIC REVIEW................................................................................................................ 46 1. SUMMARY OF FINDINGS...................................................................................................... 46 1.1. Key Review Questions ............................................................................................................... 46 The purpose of this review is to address the following key questions.......................................................... 46 1.1.1. Are the proposed labeling statements based on population pharmacokinetic analysis acceptable? 46 1.1.2. What are the characteristics of the exposure-response relationship for effectiveness?............... 46 1.1.3. What are the characteristics of the exposure-response relationship for safety?.......................... 48 1.1.4. Is the dose and dosing regimen selected consistent with the known Exposure- Response relationship? ................................................................................................................................................. 53 1.1.5. What are the characteristics of the exposure-response relationship for pharmacodynamic markers? 59 1.2. Recommendations ...................................................................................................................... 68 1.3. Label Statements......................................................................................................................... 68 2. PERTINENT REGULATORY BACKGROUND ..................................................................... 71 3. RESULTS OF SPONSOR’S ANALYSIS.................................................................................. 71 4. REVIEWER’S ANALYSIS ....................................................................................................... 85 4.1. Introduction ................................................................................................................................ 85 4.2. Objectives ................................................................................................................................... 85 4.3. Methods ...................................................................................................................................... 86 4.3.1. Data Sets..................................................................................................................................... 86 4.3.2. Software...................................................................................................................................... 86 4.3.3. Models ........................................................................................................................................ 86 4.4. Results ........................................................................................................................................ 86 LISTING OF ANALYSES CODES AND OUTPUT FILES....................................................................... 88 GENOMICS REVIEW................................................................................................................................. 95 INDIVIDUAL STUDY REVIEW................................................................................................................ 98
NDA203214 Clinical Pharmacology Review_NDA203214.doc
Page 3 of 158
Reference ID: 3149379

1. Executive Summary 1.1 Recommendations The Office of Clinical Pharmacology finds NDA 203214 acceptable 1.2 Phase IV Commitments None
1.3 Summary of Clinical Pharmacology and Biopharmaceutics Findings Pfizer, Inc. has submitted NDA 203214 seeking marketing approval for tofacitinib. Tofacitinib is an orally administered Janus kinase (JAK) inhibitor with preferential activity against JAK1 and/or JAK3 over JAK2. If approved, it will be the first JAK inhibitor for treatment of rheumatoid arthritis. Sponsor supported this NDA submission with 21 phase 1 studies, 5 phase 2 studies, 5 phase 3 studies (to support efficacy and safety), and 12 population based modeling analyses.
Pre-Clinical Support for Dose Selection Data from mouse collagen-induced arthritis (CIA) model demonstrated that effective modulation of the inflammatory response through JAK1/3 inhibition may not require continuous coverage of tofacitinib (i.e., plasma tofacitinib concentrations in excess of IC50). ED50 in animal models for BID vs. QD dosing regimen were 6-12.8 mg/kg and 33.5-40.5 mg/kg, respectively, and BID was anticipated to inhibit JAK1/3 signaling for longer duration than QD. Based on results from preclinical studies, sponsor designed the clinical program to optimize the BID dosing regimen. Dose-Response
A trend of increase in ACR20, ACR70, ACR90 and DAS28-3 response at week 12 was observed with increase in dose from 1 to 15 mg for treatment with tofacitinib monotherapy. When tofacitinib (from 3 mg BID to 15 mg BID and 20 mg QD) was administered in background of methotrexate, dose related changes in ACR 20, ACR50, ACR70 and DAS 28 were not observed.
A trend of decrease in neutrophil counts and increase in LDLC, HDLC, total cholesterol and serum creatinine was observed with increase in dose for tofacitinib monotherapy. A similar dose-response relationship for lipid endpoints was also observed when tofacitinib was administered in background of methotrexate
A trend of increase in hemoglobin was seen for lower doses up to 5 mg following which a decline was observed (i.e., an inverted U-shape relationship) with tofacitinib monotherapy. A similar dose-response relationship for hemoglobin was also observed when tofacitinib was administered in background of methotrexate
NDA203214 Clinical Pharmacology Review_NDA203214.doc
Page 4 of 158
Reference ID: 3149379

Selection of dose was based on probability of achieving the target effect with respect to both efficacy (defined as placebo-adjusted response rate of at least 20% for ACR20, 20% for ACR50, and 15% for ACR70 at week 12) and safety (no more than 5% placebo-adjusted incidences of anemia through 24 weeks). 5 and 10 mg bid doses had approximately 50% probability of achieving the target effect
ACR20, ACR50 and ACR90 responses observed in Phase 3 clinical trials were in similar range as observed in Phase 2 studies
Trends for safety endpoints between 5 and 10 mg dose in Phase 3 trials were similar to that observed in Phase 2 studies
Changes in CD3+, CD4+ and CD8+ cell counts were not dose dependent following tofacitinib treatment up to 24 weeks
There was a trend of increase in Natural Killer cell (CD16+/56+ cell) counts with increase in dose
There was a trend of decline in B cell (CD19+ cell) counts with increase in dose A decline was observed in IgG, IgM, and IgA levels following treatment with
tofacitinib for 24 weeks compared to placebo; however, these changes were small and not dose-dependent
Pharmacokinetics Rheumatoid Arthritis vs. Healthy
Population PK analysis showed 43% lower apparent clearance (CL/F) in a typical RA patient relative to a healthy adult Absorption
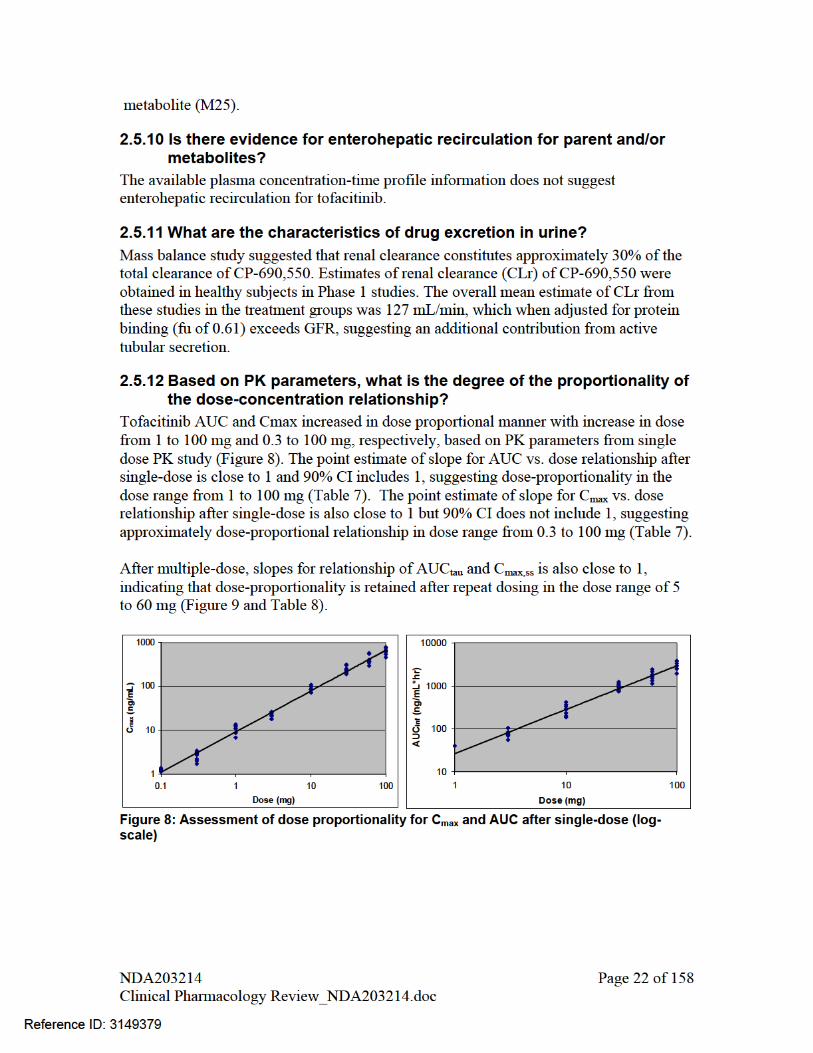
The absolute bioavailability of tofacitinb at 10 mg dose was 74% Systemic exposure (AUC0-∞) and peak plasma concentration (Cmax) increased in
proportion to the dose in the dose range of 1 to 100 mg. Tmax was reached by approximately 0.5-1 hours following oral administration Coadministration with food had no significant effect on the extent of absorption
(AUC0-∞) but rate of absorption (Cmax) was reduced by 32%. Upon multiple dosing, steady-state was reached by 24-48 hours with negligible
accumulation Tofacitinib is a substrate of P-gp transporter
Distribution
Tofacitinib has a total plasma protein binding of approximately 39%. Tofacitinib binds moderately to albumin and does not bind to alpha-1 acid glycoprotein.
Steady-state volume of distribution (Vdss) for tofacitinib following iv infusion administration was 87 L, suggesting distribution into tissues. Metabolism and Transporters
Tofacitinib was extensively metabolized, primarily by CYP3A4 enzyme with minor contribution from CYP2C19
All metabolites have less than <8% of total drug exposure and their potency was reported to be 10% of the potency of tofacitinib for JAK1/3 inhibition.
NDA203214 Clinical Pharmacology Review_NDA203214.doc
Page 5 of 158
Reference ID: 3149379
Based on in vitro studies, tofacitinib is not a substrate of BCRP transporter. Based on in vitro studies, at therapeutic concentrations, tofacitinib has low potential
for induction or inhibition of CYP1A2, 2B6, 2C8, 2C9, 2C19, 2D6, 3A4 metabolic enzymes and low potential of inhibition for P-gp, OCT2, OATP1B1, OATP1B3 Elimination
Of the 94% drug recovered following oral administration in a mass balance study, approximately 29% and 51% was recovered in urine as parent drug and metabolites, respectively. In feces, proportion of parent and metabolites recovered was approximately 1% and 13%.
The terminal elimination half-life of tofacitinb was approximately 3 hours after single- or multiple-dose
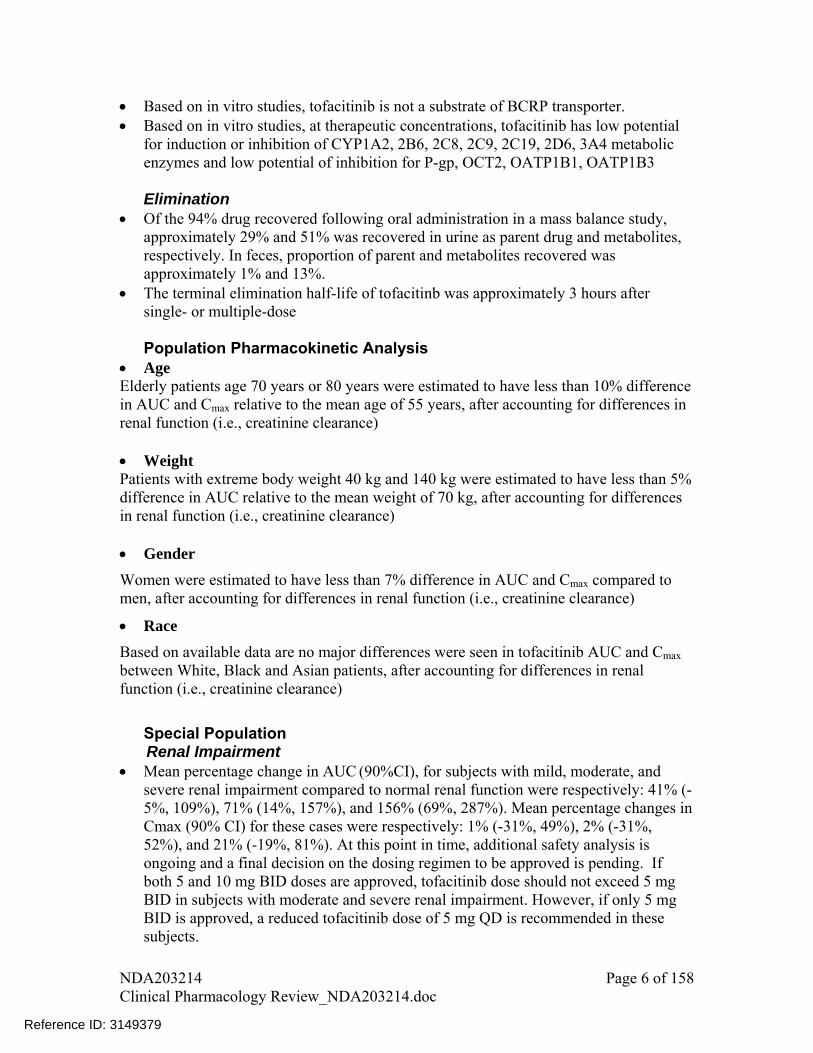
Population Pharmacokinetic Analysis
Age Elderly patients age 70 years or 80 years were estimated to have less than 10% difference in AUC and Cmax relative to the mean age of 55 years, after accounting for differences in renal function (i.e., creatinine clearance) Weight Patients with extreme body weight 40 kg and 140 kg were estimated to have less than 5% difference in AUC relative to the mean weight of 70 kg, after accounting for differences in renal function (i.e., creatinine clearance) Gender
Women were estimated to have less than 7% difference in AUC and Cmax compared to men, after accounting for differences in renal function (i.e., creatinine clearance)
Race
Based on available data are no major differences were seen in tofacitinib AUC and Cmax between White, Black and Asian patients, after accounting for differences in renal function (i.e., creatinine clearance)
Special Population
Renal Impairment Mean percentage change in AUC (90%CI), for subjects with mild, moderate, and
severe renal impairment compared to normal renal function were respectively: 41% (-5%, 109%), 71% (14%, 157%), and 156% (69%, 287%). Mean percentage changes in Cmax (90% CI) for these cases were respectively: 1% (-31%, 49%), 2% (-31%, 52%), and 21% (-19%, 81%). At this point in time, additional safety analysis is ongoing and a final decision on the dosing regimen to be approved is pending. If both 5 and 10 mg BID doses are approved, tofacitinib dose should not exceed 5 mg BID in subjects with moderate and severe renal impairment. However, if only 5 mg BID is approved, a reduced tofacitinib dose of 5 mg QD is recommended in these subjects.
NDA203214 Clinical Pharmacology Review_NDA203214.doc
Page 6 of 158
Reference ID: 3149379
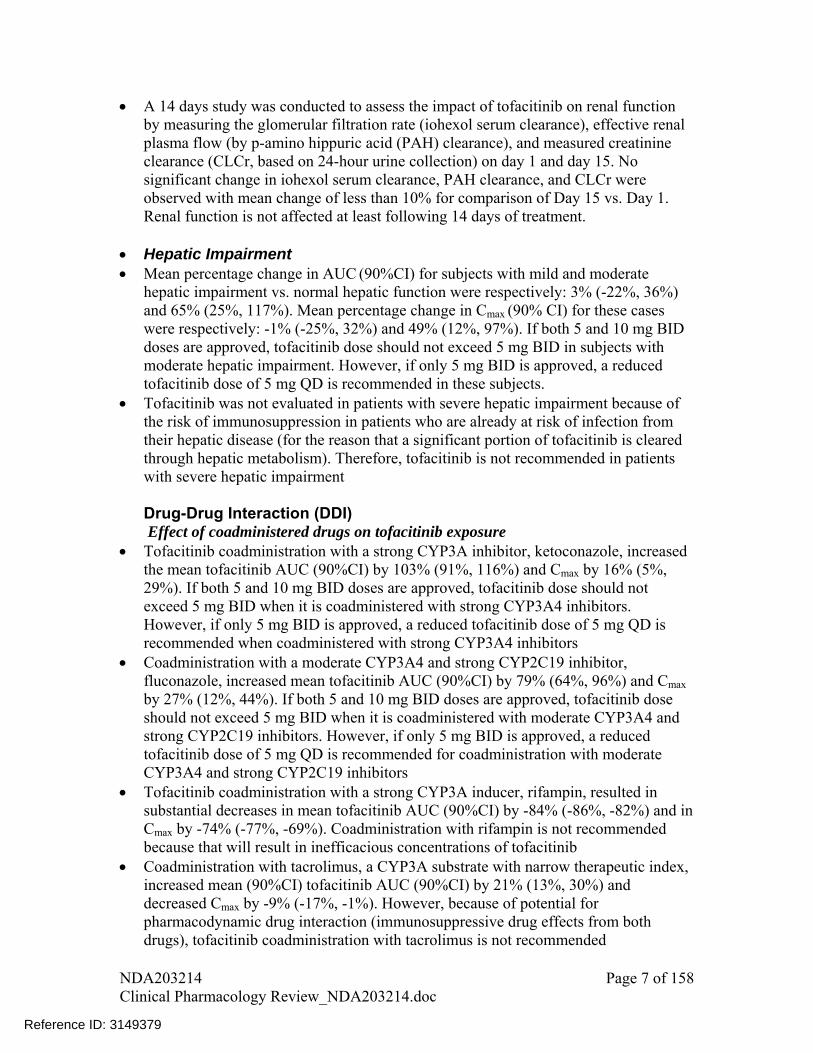
A 14 days study was conducted to assess the impact of tofacitinib on renal function by measuring the glomerular filtration rate (iohexol serum clearance), effective renal plasma flow (by p-amino hippuric acid (PAH) clearance), and measured creatinine clearance (CLCr, based on 24-hour urine collection) on day 1 and day 15. No significant change in iohexol serum clearance, PAH clearance, and CLCr were observed with mean change of less than 10% for comparison of Day 15 vs. Day 1. Renal function is not affected at least following 14 days of treatment.
Hepatic Impairment Mean percentage change in AUC (90%CI) for subjects with mild and moderate
hepatic impairment vs. normal hepatic function were respectively: 3% (-22%, 36%) and 65% (25%, 117%). Mean percentage change in Cmax (90% CI) for these cases were respectively: -1% (-25%, 32%) and 49% (12%, 97%). If both 5 and 10 mg BID doses are approved, tofacitinib dose should not exceed 5 mg BID in subjects with moderate hepatic impairment. However, if only 5 mg BID is approved, a reduced tofacitinib dose of 5 mg QD is recommended in these subjects.
Tofacitinib was not evaluated in patients with severe hepatic impairment because of the risk of immunosuppression in patients who are already at risk of infection from their hepatic disease (for the reason that a significant portion of tofacitinib is cleared through hepatic metabolism). Therefore, tofacitinib is not recommended in patients with severe hepatic impairment
Drug-Drug Interaction (DDI) Effect of coadministered drugs on tofacitinib exposure
Tofacitinib coadministration with a strong CYP3A inhibitor, ketoconazole, increased the mean tofacitinib AUC (90%CI) by 103% (91%, 116%) and Cmax by 16% (5%, 29%). If both 5 and 10 mg BID doses are approved, tofacitinib dose should not exceed 5 mg BID when it is coadministered with strong CYP3A4 inhibitors. However, if only 5 mg BID is approved, a reduced tofacitinib dose of 5 mg QD is recommended when coadministered with strong CYP3A4 inhibitors
Coadministration with a moderate CYP3A4 and strong CYP2C19 inhibitor, fluconazole, increased mean tofacitinib AUC (90%CI) by 79% (64%, 96%) and Cmax by 27% (12%, 44%). If both 5 and 10 mg BID doses are approved, tofacitinib dose should not exceed 5 mg BID when it is coadministered with moderate CYP3A4 and strong CYP2C19 inhibitors. However, if only 5 mg BID is approved, a reduced tofacitinib dose of 5 mg QD is recommended for coadministration with moderate CYP3A4 and strong CYP2C19 inhibitors
Tofacitinib coadministration with a strong CYP3A inducer, rifampin, resulted in substantial decreases in mean tofacitinib AUC (90%CI) by -84% (-86%, -82%) and in Cmax by -74% (-77%, -69%). Coadministration with rifampin is not recommended because that will result in inefficacious concentrations of tofacitinib
Coadministration with tacrolimus, a CYP3A substrate with narrow therapeutic index, increased mean (90%CI) tofacitinib AUC (90%CI) by 21% (13%, 30%) and decreased Cmax by -9% (-17%, -1%). However, because of potential for pharmacodynamic drug interaction (immunosuppressive drug effects from both drugs), tofacitinib coadministration with tacrolimus is not recommended
NDA203214 Clinical Pharmacology Review_NDA203214.doc
Page 7 of 158
Reference ID: 3149379

Coadministration with cyclosporine, a CYP3A substrate with narrow therapeutic index and also an inhibitor of P-gp increased mean (90%CI) tofacitinib AUC (90%CI) by 73% (62%, 85%) and decreased Cmax by -17% (-29%, -3%). However, because of potential for pharmacodynamic drug interaction (immunosuppressive drug effects from both drugs), tofacitinib coadministration with cyclosporine is not recommended
Coadministration with methotrexate, had no significant effect on mean (90%CI) tofacitinib exposure with geometric mean ratio and 90% CI for AUC of 103% (99%, 107%) and for Cmax of 103% (94%, 112%). No dose adjustment recommended for tofacitinib when coadministered with methotrexate
Effect of tofacitinib on exposure of coadministered drugs
Concomitant use of oral contraceptives (OC) with tofacitinib did not have any significant effect on plasma levels of ethinyloestradiol with geometric mean ratio (90%CI) for comparison with vs. without tofacitinib were, for AUC, 107% (99%, 115%), and for Cmax, 90% (82%, 98%), and on plasma levels of levonorgestrel with geometric mean ratio (90%CI) for comparison of with vs. without tofacitinib were for AUC of 101% (95%, 107%) and for Cmax of 112% (105%, 120%). No dose adjustment recommended for OC when coadministered with tofacitinib
Concomitant use with tofacitinib had no substantial effect on the exposure of midazolam, a sensitive CYP3A substrate, with geometric mean ratio (90%CI) with vs. without tofacitinib were for AUC of 104% (96%, 113%) and for Cmax of 102% (96%, 109%). No dose adjustment recommended for CYP3A substrates when coadministered with tofacitinib
Concomitant use of tofacitinib and methotrexate, decreases mean (90% CI) methotrexate AUC by -10% (-23%, 4%) and Cmax by -13% (-24%, 0%). No dose adjustment recommended for methotrexate when coadministered with tofacitinib
2. Question Based Review
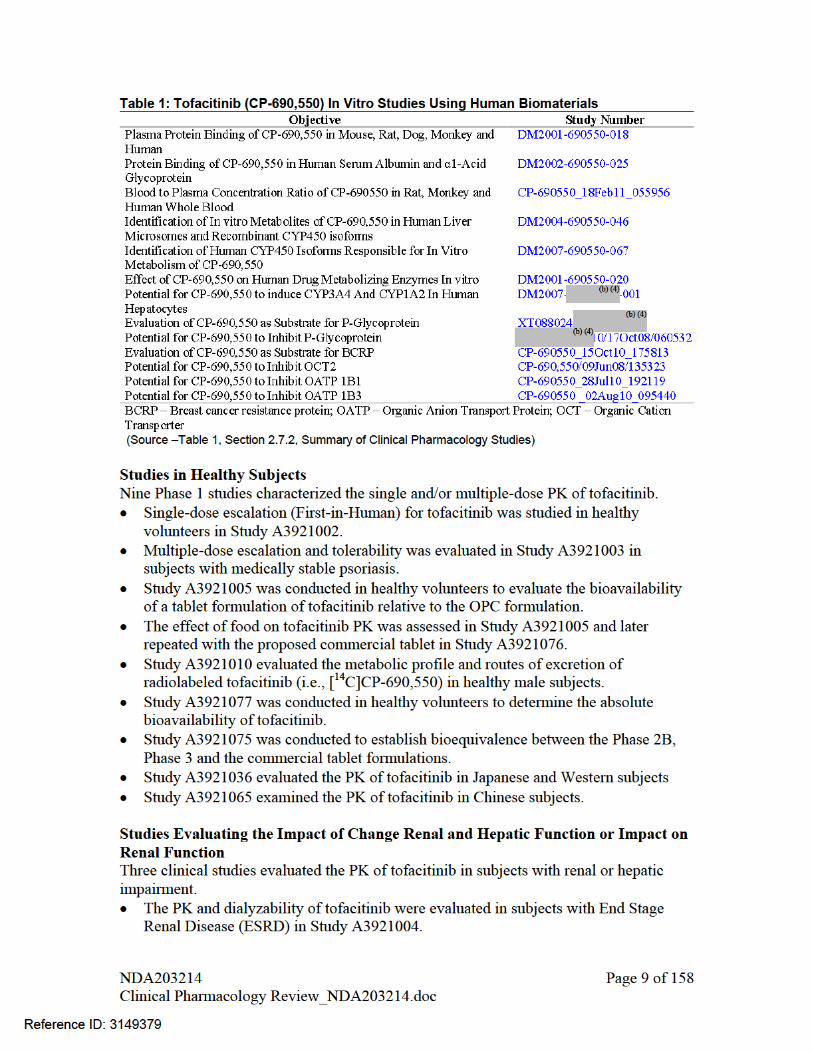
2.1 List the in vitro and in vivo Clinical Pharmacology and Biopharmaceutics studies and the clinical studies with PK and/or PD information submitted in the NDA or BLA
Thirteen in vitro studies using human biomaterials were conducted and are listed Table 1.
NDA203214 Clinical Pharmacology Review_NDA203214.doc
Page 8 of 158
Reference ID: 3149379

Study A3921006 investigated the PK of tofacitinib in subjects with mild, moderate and severe renal impairment.
Study A3921033 evaluated the effect of 14 days treatment with tofacitinib on renal function (glomerular filtration rate (GFR)) in healthy volunteers
Study A3921015 examined the PK of tofacitinib in subjects with mild and moderate hepatic impairment. Subjects with severe hepatic impairment were not evaluated.
Studies of Drug-Drug Interactions Seven clinical studies evaluated drug-drug interactions with tofacitinib. The effect of other drugs on the PK of tofacitinib was evaluated in the following
studies: methotrexate (A3921013), fluconazole (A3921014), tacrolimus and cyclosporine (A3921020), ketoconazole (A3921054) and rifampin (A3921056).
The effect of tofacitinib on the PK of other drugs was evaluated in the following studies: midazolam (A3921059), oral contraceptives (A3921071) and methotrexate (A3921013).
Phase 2 Dose-Ranging Studies Five dose ranging studies evaluated more than one dose levels of tofacitinib. Global studies Study A3921019 was a 6-week, double-blind, placebo-controlled, parallel group,
monotherapy study Study A3921025 was a 24-week, double-blind, placebo-controlled, parallel group
study in patients receiving background methotrexate Study A3921035 was a 24-week, double-blind, placebo- and active-controlled,
parallel group, monotherapy study Studies in Japanese Patients Study A3921039 was a 12-week, double-blind, placebo-controlled, parallel group,
study in Japanese patients receiving background methotrexate Study A3921040 was a 12-week, double-blind, placebo-controlled, parallel group,
monotherapy study in Japanese patients Population Pharmacokinetic Studies Population pharmacokinetic analysis used tofacitinib plasma concentration-time data from five Phase 2 studies in RA patients. Phase 3 Study Trough concentrations were collected over 12 months in the Phase 3 study A3921064
2.2 General Attributes of the Drug
2.2.1 What are the highlights of the chemistry and physical-chemical properties of the drug substance and the formulation of the drug product? Tofacitinib is a small molecule drug. Its structure is shown in Figure 1 and physico-chemical properties are listed in Table 2.
NDA203214 Clinical Pharmacology Review_NDA203214.doc
Page 10 of 158
Reference ID: 3149379

Figure 1: Molecular structure of tofacitinib
Table 2: Tofacitinib physical chemical properties Molecular Formula C16H20N6O•C6H8O7 Molecular Weight 504.5 g/mol (312.4 g/mol as free base) Physical State Powder Polymorphism There is only of CP-690,550-10 designated
as Dissociation Constants
pKa = 5.07
Solubility Water: 2.9 mg/mL (freely soluble in water) 3.48 - >28 mg/mL in aqueous solution of pH 1 – 3.9 0.20 – 0.59 mg/mL in aqueous solution of pH 4.53 – >8 Solubility decreases with increase in pH
Partition Coefficient Log P=1.15 of the neutral form (free base) Average partition coefficient = 14.3 at pH 7.3
Drug Product Tofacitinib is supplied for oral administration in two strengths: 5 mg white to off-white round and 10 mg blue round immediate-release film-coated tablets. The to-be-marketed formulation is different from the formulation tested in Phase 3 clinical trials with respect to the amount of excipients and coating (see 2.8.2 for more details).
2.2.2 What are the proposed mechanism of action and therapeutic indications?
Tofacitinib is proposed to act as an inhibitor of the JAK family of kinases with a high degree of selectivity against other kinases in the human genome. In kinase assays, tofacitinib, inhibits JAK1, JAK2, JAK3, and to a lesser extent TyK2. In cell assays, tofacitinib preferentially inhibits JAK1 and/or JAK3 mediated signaling. Inhibition of JAK1 and JAK3 by tofacitinib may potentially block signaling through cytokines such as IL-2, IL-4, IL-7, IL-9, IL-15 and IL-21, which in turn may suppress the immune system (Figure 2). Tofacitinib is also being evaluated in other diseases in which lymphocyte activation/proliferation plays a pathogenic role.
NDA203214 Clinical Pharmacology Review_NDA203214.doc
Page 11 of 158
Reference ID: 3149379
(b) (4)
(b) (4)

The proposed indication is treatment of rheumatoid arthritis in patients with moderate to severe disease who have an inadequate response to one or more disease modifying anti-rheumatic drugs (DMARDs).
JAK=Janus kinase; P=phosphate; STAT=signal transducer and activator of transcription. • Tofacitinib binds in the catalytic cleft in the kinase domain of JAKs • Tofacitinib modulates the JAK signaling pathways at the point of JAK, preventing the phosphorylation and activation of signal transducer and activators of transcription (STAT). • Inhibition of JAK1/JAK3 is expected to block signaling through the common γc -containing cytokine receptors, including those for
IL-2, IL-4, IL-7, IL-9, IL-15, and IL-21; these cytokines are integral to lymphocyte activation, proliferation and function and may thus result in modulation of multiple aspects of the immune response.
• In addition, inhibition of JAK1 may lead to some modulation of additional cytokine receptor signaling, including IFN-α, IFN-β and IL-6
Figure 2: Tofacitinib mechanism of action (Source – Figure 1, Pfizer Advisory Committee Meeting Briefing Package)
2.2.3 What are the proposed dosages and routes of administration?
The proposed starting dose is 5 mg BID to be given orally. In some patients, doses can be increased to 10 mg BID based on clinical response.
2.2.4 What drugs (substances, products) indicated for the same indication are approved in the US?
The drugs which are approved for treatment of RA in the US can be classified into three general classes:
(a) Nonsteroidal anti-inflammatory drugs (NSAIDs) -improves symptoms
Salicylates: acetyl salicylic acid, diflunisal, magnesium salicylate Arylalkanoic acids: diclofenac, indomethacin, etodolac, sulindac, tolmetin 2-Arylpropionic acids: ibuprofen, naproxen, ketoprofen, oxaprozin
NDA203214 Clinical Pharmacology Review_NDA203214.doc
Page 12 of 158
Reference ID: 3149379

N-Arylanthranilic acids: mefenamic acid, flufenamic acid, meclofenamic acid Pyrazolidine derivatives: phenylbutazone, metamizole, phenazone Oxicams: piroxicam, meloxicam Sulfonilides: nimesulide (b) Corticosteroids
-Combination of low-dose glucocorticoids with disease modifying anti-rheumatic drugs (DMARDs) increases efficacy, including slowing of structural damage, and treatment-related toxicity
(c) DMARDs (Non-biologic and Biologic) -improves symptoms and reduces or prevents joint structural damage
Non-biologic: Methotrexate, Leflunomide, Cyclosporine A, Azathioprine etc. Biologic
o TNF-inhibitors: Adalimumab, Certolizumab, Golimumab, Infliximab, Etanercept etc. o Mechanisms other than TNF-inhibitors: Abatacept, Rituximab, Tocilizumab, Anakinra
etc.
2.3 General Clinical Pharmacology
2.3.1 What are the design features of the clinical pharmacology and biopharmaceutics studies and the clinical studies used to support dosing or claims?
The clinical pharmacology and biopharmaceutics studies supporting this NDA and their design features are listed under section 2.1.
2.3.2 What is the basis for selecting the response endpoints and how are they measured in clinical pharmacology studies?
Sponsor has used ACR20, ACR50, ACR70 and DAS28-3(CRP) as the primary endpoints for signs and symptoms in all key efficacy studies. Use of ACR and DAS28 as indicators of improvement in signs and symptoms is widely accepted and is recommended by the American College of Rheumatology (ACR). These endpoints have also been used by the FDA for approval of other drugs in Rheumatology.
Among clinical pharmacology studies, these endpoints were measured in the 5 dose-ranging studies conducted by the sponsor.
2.3.3 Are the active moieties in plasma and clinically relevant tissues appropriately identified and measured to assess pharmacokinetic parameters and exposure response relationships?
Yes. In all relevant studies only tofacitinib concentrations were measured. No metabolites were quantified because exposure of each metabolite was <8% of total tofacitinib exposure and their potency for JAK1/JAK3 inhibition was reported to be 10% compared to parent.
2.4 Exposure-Response
2.4.1 What are the characteristics of the exposure-response relationship
NDA203214 Clinical Pharmacology Review_NDA203214.doc
Page 13 of 158
Reference ID: 3149379

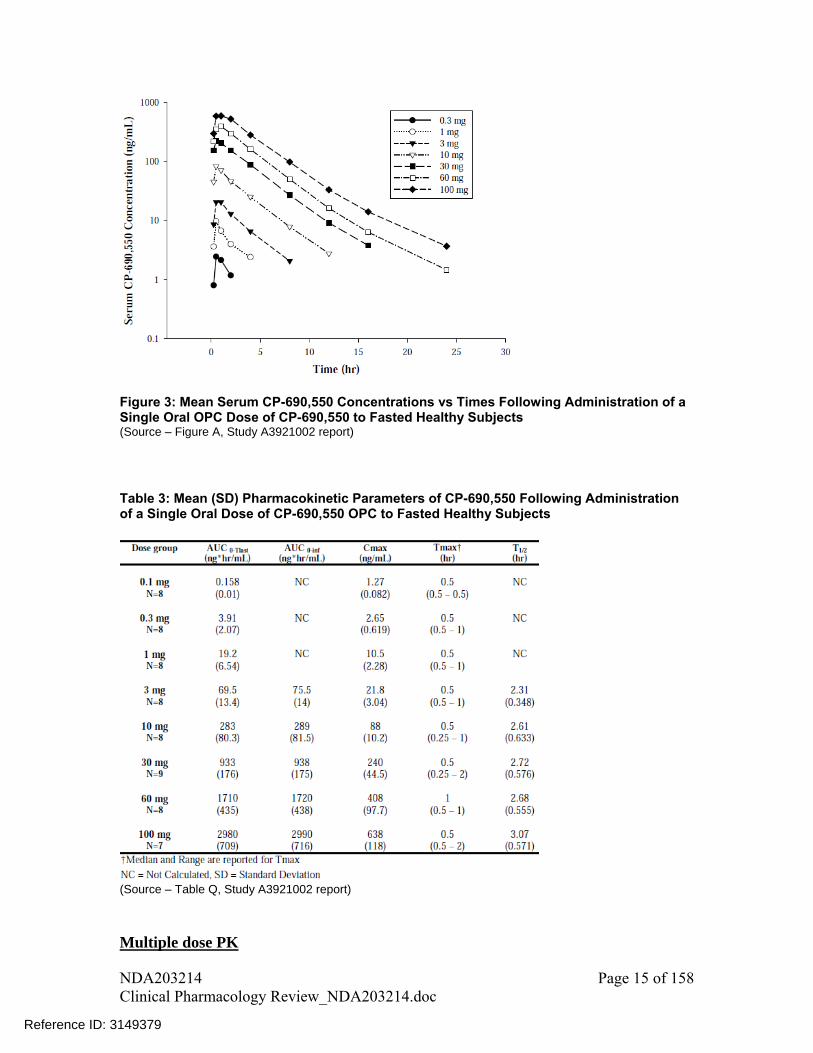
Figure 3: Mean Serum CP-690,550 Concentrations vs Times Following Administration of a Single Oral OPC Dose of CP-690,550 to Fasted Healthy Subjects (Source – Figure A, Study A3921002 report)
Table 3: Mean (SD) Pharmacokinetic Parameters of CP-690,550 Following Administration of a Single Oral Dose of CP-690,550 OPC to Fasted Healthy Subjects
(Source – Table Q, Study A3921002 report)
Multiple dose PK
NDA203214 Clinical Pharmacology Review_NDA203214.doc
Page 15 of 158
Reference ID: 3149379

Multiple dose PK of tofacitinib was characterized in medically stable subjects with psoriasis. Tofacitinib PK after multiple doses was consistent with the single dose PK. Tmax was reached within 0.5-1 hr, mean apparent terminal t1/2 ranged from 2.3 – 4.3 hrs. Accumulation after multiple doses was minimal. Except for 30mg dose, mean accumulation ratio for all other doses ranged from 0.98 to 1.22, which was as expected based on short half-life and BID dosing regimen. Mean plasma PK profiles are shown in Figure 4 and summary PK parameters are listed in Table 4. From other studies, measurement of trough concentrations indicated that steady-state was achieved within 24-48 hrs after initiating repeat dosing.
Figure 4: Mean Serum CP-690,550 Concentrations Versus Time on Day 14 Following Multiple Oral Dosing with CP-690,550 in Medically Stable Subjects with Psoriasis (Source – Figure 1, Study A3921003 report)
Table 4: Arithmetic Mean (SD) CP-690,550 Serum Pharmacokinetic Parameters on Days 1 and 14 Following Multiple Oral Dosing with CP-690,550 in Medically Stable Subjects with Psoriasis
(Source – Table 19, Study A3921003 report)
NDA203214 Clinical Pharmacology Review_NDA203214.doc
Page 16 of 158
Reference ID: 3149379

2.5.2 How does the PK of the drug and its relevant metabolites in healthy adults compare to that in patients with the target disease?
In a sponsor reported meta-analysis of non-compartmental PK parameters from healthy subjects across 16 Phase 1 studies, the pooled geometric mean estimate of CL/F was 34.9 L/h. While the mean CL/F estimate, calculated based on population PK analysis, for a typical RA patient was 18.4 L/h. Although derived using different methods, clearance in RA patients was approximately 43% lower relative to healthy subjects. This may be attributed to down-regulation of cytochrome P450 enzymes in RA patients by inflammation stimuli including cytokines such as IL-6 and TNF-alpha1. Geometric mean estimate of half-life in healthy subjects based on sponsor reported pooled meta-analysis was approximately 3 hrs and the mean half-life in a typical RA patient based on population PK analysis was approximately 3.6 hrs.
2.5.3 What is the inter- and intra-subject variability of the PK parameters in volunteers and patients with the target disease?
Summary of inter- and intra-subject variability as reported by the sponsor is presented in Table 5. Tofacitinib exhibits moderate inter- and intra-subject variability with similar or slightly higher inter-subject variability in RA patients compared to healthy subjects. Observed intra-subject variability in AUC and Cmax was similar between healthy subjects (i.e., 5-7%) and RA patients from DDI study (i.e., 5.5%), but the variability in AUC projected based on intra-occasion variability in bioavailability in the population PK analysis was relatively higher (i.e., 23%). Sponsor reported plot of percent deviation of individual AUC and Cmax values from group means in Phase 1 studies (Figure 5) show that majority of AUC and Cmax values deviate less than 50% from individual study group means. Table 5: Variability Estimates (%CV) for Tofacitinib Exposure in Healthy Subjects and RA Patients
(Source –Table 35, Section 2.7.2, Summary of Clinical Pharmacology Studies)
1 Aitken, A.E., Richardson, T.A. & Morgan, E.T. Regulation of drug-metabolizing enzymes and transporters in inflammation. Annu. Rev. Pharmacol. Toxicol. 46, 123–149 (2006). Kulmatycki, K.M. & Jamali, F. Drug disease interactions: role of inflammatory mediators in disease and variability in drug response. J. Pharm. Pharm. Sci. 8, 602–625 (2005)
NDA203214 Clinical Pharmacology Review_NDA203214.doc
Page 17 of 158
Reference ID: 3149379

Figure 5: Percent deviation of individual tofacitinib AUC and Cmax values from group means following oral administration in healthy subjects (Source – Figure 20, Section 2.7.2, Summary of Clinical Pharmacology Studies)
2.5.4 What are the characteristics of drug absorption? Tofacitinib absolute oral bioavailability following oral administration was ~74%. In single- and multiple-dose studies, maximum plasma concentrations were reached within 0.5-1 hr after oral administration. In-vitro studies using transfected MDCK cells, demonstrated that tofacitinib is a substrate of P-gp (ABCB1), but not the BCRP (ABCG2) efflux transporter (see sections 2.7.3 and 2.7.4). However, because of high oral bioavailability, inhibition of P-gp will likely have a minimal effect on the extent of oral absorption. The rate of absorption was reduced when tofacitinib was given with food (median tmax increased from 0.5 to 2 hours and Cmax was reduced by about 32% (95% CI: 23.4 to 41.6%)), but there was no effect of food on the extent of absorption (see section 2.8.3).
2.5.5 What are the characteristics of drug distribution? Following IV dosing, the apparent steady-state volume of distribution (Vss) of tofacitinib was estimated to be 87 L, suggesting distribution into tissues. In vitro studies determined low to moderate plasma protein binding for tofacitinib with the fraction unbound to (fu) in humans to be 0.61. Tofacitinib was shown to bind moderately to human serum albumin (fu = 0.51) but does not bind to alpha1-acid glycoprotein (fu~1). In vitro studies indicated relatively equal distribution of tofacitinib between red blood cells and plasma with blood-to-plasma concentration ratio of 1.2 at 1 M concentration.
2.5.6 Does the mass balance study suggest renal or hepatic as the major route of elimination?
NDA203214 Clinical Pharmacology Review_NDA203214.doc
Page 18 of 158
Reference ID: 3149379

Majority of the orally administered drug was recovered in urine; however, only 29% is recovered in form of parent drug and rest was in form of metabolites. Therefore, hepatic metabolism is the major route of elimination for tofacitinib. Scheme showing disposition of tofacitinib following oral administration based on mass balance study and absolute bioavailability study is shown in Figure 6.
Table 6: Percentage of Dose Excreted in Urine and Feces over 192 Hours by Male Subjects Following Oral Administration of a Single 50 mg Dose of [14C]CP-690,550
(Source – Table 7, Study A3921010 report)
Figure 6: Mass Balance Model for Tofacitinib Following Oral Administration based on Mass Balance and Absolute Bioavailability Study (Source – Figure 18, Section 2.7.2, Summary of Clinical Pharmacology Studies)
2.5.7 What is the percentage of total radioactivity in plasma identified as parent drug and metabolites?
In plasma, approximately 69% of the total circulating radioactivity was accounted for by unchanged drug (CP-690,550 in Table 7) with the rest circulating in form of metabolites, each accounting for less than 8% of total radioactivity (Table 7).
NDA203214 Clinical Pharmacology Review_NDA203214.doc
Page 19 of 158
Reference ID: 3149379
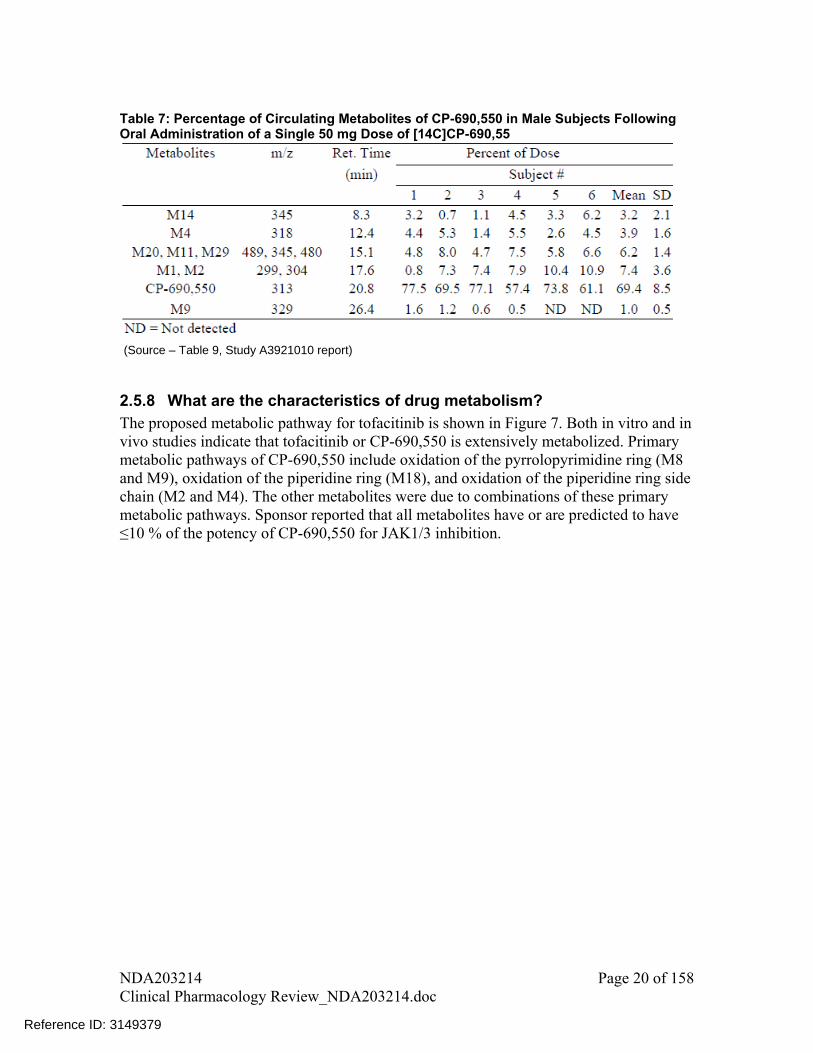
Table 7: Percentage of Circulating Metabolites of CP-690,550 in Male Subjects Following Oral Administration of a Single 50 mg Dose of [14C]CP-690,55
(Source – Table 9, Study A3921010 report)
2.5.8 What are the characteristics of drug metabolism? The proposed metabolic pathway for tofacitinib is shown in Figure 7. Both in vitro and in vivo studies indicate that tofacitinib or CP-690,550 is extensively metabolized. Primary metabolic pathways of CP-690,550 include oxidation of the pyrrolopyrimidine ring (M8 and M9), oxidation of the piperidine ring (M18), and oxidation of the piperidine ring side chain (M2 and M4). The other metabolites were due to combinations of these primary metabolic pathways. Sponsor reported that all metabolites have or are predicted to have ≤10 % of the potency of CP-690,550 for JAK1/3 inhibition.
NDA203214 Clinical Pharmacology Review_NDA203214.doc
Page 20 of 158
Reference ID: 3149379

(H)-Human; (M)-Monkey; (R) –Rat Note – Not all of the metabolites from biotransformation of tofacitinib in rat and monkey are shown in the figure. Only the metabolites which are common with humans are shown.
Figure 7: Proposed Biotransformation Pathways for CP-690,550 in Human (H) Plasma, Urine and Feces (Source – adapted from Figure 3, Section 2.6.4, Written Summary of Non-Clinical Pharmacokinetics)
2.5.9 Is there evidence for excretion of parent drug and/or metabolites into bile?
In vitro studies determined that tofacitinib is not a substrate of BCRP. In a preclinical study in bile duct cannulated male monkeys, about 25% of the total administered drug was recovered in bile. Unchanged drug accounted for only 0.3% of the dose in bile and the rest was recovered in form of glucuronide metabolites (M23, M26, M29) and other
NDA203214 Clinical Pharmacology Review_NDA203214.doc
Page 21 of 158
Reference ID: 3149379


2.5.14 Is there evidence for a circadian rhythm of the PK? In clinical PK studies tofacitinib was given in two times a day dosing regimen (possibly 12 hours apart). It was observed that PK after single-dose was comparable with PK after multiple-dose, which may suggest that circadian rhythm may not have any effect on tofacitinib PK.
2.6 Intrinsic Factors
2.6.1 What are the major intrinsic factors responsible for the inter-subject variability in exposure (AUC, Cmax, Cmin) in patients with the target disease and how much of the variability is explained by the identified covariates?
Effect of intrinsic factors on exposure of tofacitinib was assessed in population PK analysis. Please see discussion under heading “assessment of impact of covariates on AUCss and Cmax,ss metrics” in section 3 of pharmacometrics review, Figure 44.
2.6.2 Based upon what is known about E-R relationships in the target population and their variability, what dosage regimen adjustments are recommended for each group?
Please see pharmacometrics review as stated in response 2.6.1.
2.6.2.1 Severity of Disease State
Not assessed.
2.6.2.2 Body Weight
Please see pharmacometrics review as stated in response 2.6.1.
2.6.2.3 Elderly Please see pharmacometrics review as stated in response 2.6.1.
2.6.2.4 Pediatric Patients Safety and effectiveness of tofacitinib in pediatric patients has not been evaluated. A waiver for < 2 years age and a deferral for age 2 to 17 years 11 months is to be discussed in PeRC on June 20, 2012. Evaluation in age 2 to 17 years 11 months is deferred until complete evaluation of safety and benefit-risk profile. However, sponsor’s proposal for age 2 to 17 years 11 months includes a PK study and 3 efficacy and safety studies.
2.6.2.5 Race/Ethnicity
Please see pharmacometrics review as stated in response 2.6.1. In addition, PK between Western and Japanese subjects was compared in a dedicated study. There was no clinically meaningful difference in single-dose PK between these two ethnic groups (Figure 10 and Table 10). PK for Japanese subjects after single-dose or multiple-dose was similar.
NDA203214 Clinical Pharmacology Review_NDA203214.doc
Page 24 of 158
Reference ID: 3149379
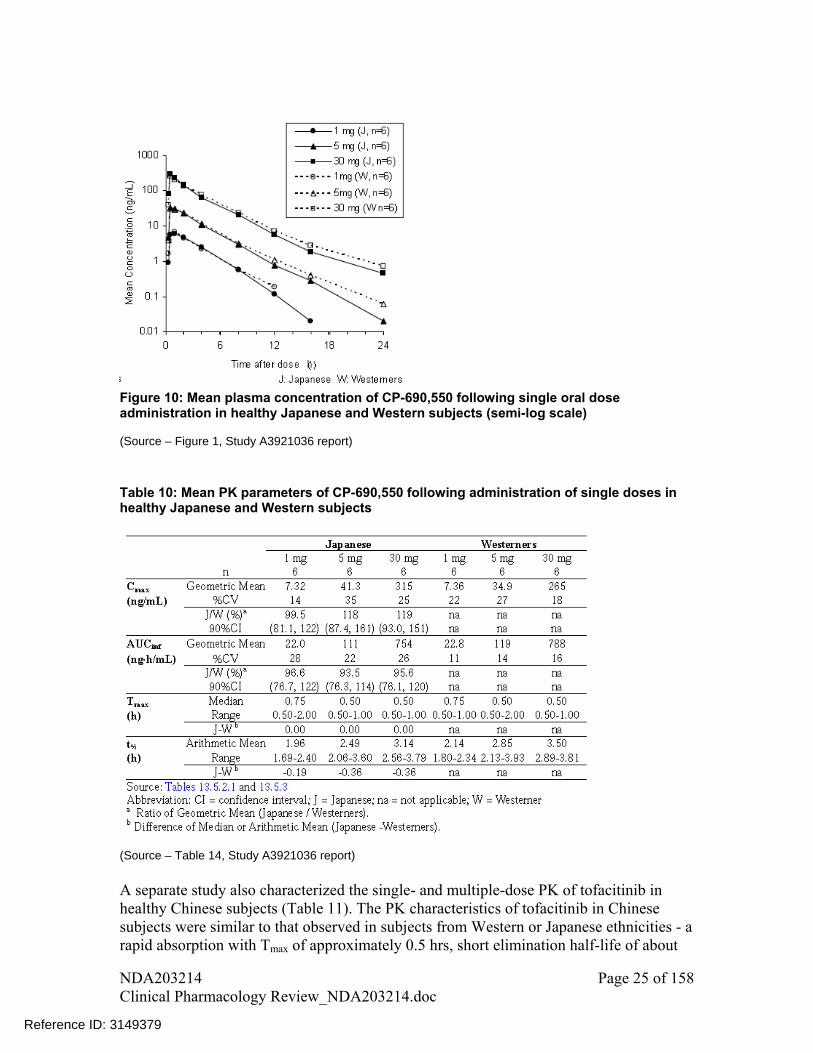
Figure 10: Mean plasma concentration of CP-690,550 following single oral dose administration in healthy Japanese and Western subjects (semi-log scale) (Source – Figure 1, Study A3921036 report)
Table 10: Mean PK parameters of CP-690,550 following administration of single doses in healthy Japanese and Western subjects
(Source – Table 14, Study A3921036 report)
A separate study also characterized the single- and multiple-dose PK of tofacitinib in healthy Chinese subjects (Table 11). The PK characteristics of tofacitinib in Chinese subjects were similar to that observed in subjects from Western or Japanese ethnicities - a rapid absorption with Tmax of approximately 0.5 hrs, short elimination half-life of about
NDA203214 Clinical Pharmacology Review_NDA203214.doc
Page 25 of 158
Reference ID: 3149379

Table 11: Summary of PK parameters in Chinese subjects
(Source – Table 13, Study A3921065 report)
2.6.2.6 Renal Impairment Renal function affected tofacitinib exposure as shown in Figure 11Error! Reference source not found. based on a single dose PK study, such that exposure increased with decline in renal function. Subjects with mild, moderate, and severe renal impairment had 41% (-5%, 109%), 71% (14%, 157%), and 156% (69%, 287%) respective increase in AUC compared to subjects with normal renal function (Table 12Error! Reference source not found.). Terminal half-life also increased with decrease in renal function; median value for normal renal function was 2.48 hrs, for mild renal impairment was 2.52 hrs, for moderate renal impairment was 2.68 hrs and for severe renal impairment was 3.77 hrs.
Figure 11: Individual AUC0-inf vs. calculated creatinine clearances following a single 10 mg
NDA203214 Clinical Pharmacology Review_NDA203214.doc
Page 26 of 158
Reference ID: 3149379
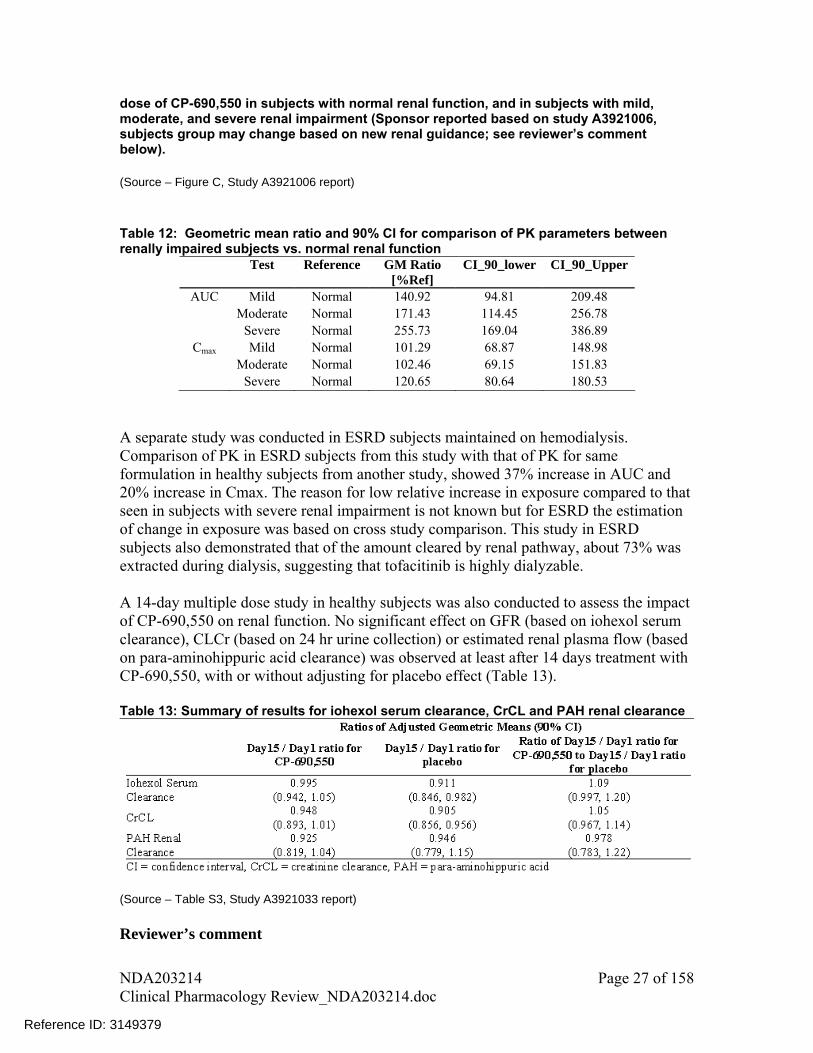
dose of CP-690,550 in subjects with normal renal function, and in subjects with mild, moderate, and severe renal impairment (Sponsor reported based on study A3921006, subjects group may change based on new renal guidance; see reviewer’s comment below). (Source – Figure C, Study A3921006 report) Table 12: Geometric mean ratio and 90% CI for comparison of PK parameters between renally impaired subjects vs. normal renal function
Test Reference GM Ratio [%Ref]
CI_90_lower CI_90_Upper
AUC Mild Normal 140.92 94.81 209.48 Moderate Normal 171.43 114.45 256.78 Severe Normal 255.73 169.04 386.89
Cmax Mild Normal 101.29 68.87 148.98 Moderate Normal 102.46 69.15 151.83 Severe Normal 120.65 80.64 180.53
A separate study was conducted in ESRD subjects maintained on hemodialysis. Comparison of PK in ESRD subjects from this study with that of PK for same formulation in healthy subjects from another study, showed 37% increase in AUC and 20% increase in Cmax. The reason for low relative increase in exposure compared to that seen in subjects with severe renal impairment is not known but for ESRD the estimation of change in exposure was based on cross study comparison. This study in ESRD subjects also demonstrated that of the amount cleared by renal pathway, about 73% was extracted during dialysis, suggesting that tofacitinib is highly dialyzable. A 14-day multiple dose study in healthy subjects was also conducted to assess the impact of CP-690,550 on renal function. No significant effect on GFR (based on iohexol serum clearance), CLCr (based on 24 hr urine collection) or estimated renal plasma flow (based on para-aminohippuric acid clearance) was observed at least after 14 days treatment with CP-690,550, with or without adjusting for placebo effect (Table 13). Table 13: Summary of results for iohexol serum clearance, CrCL and PAH renal clearance
(Source – Table S3, Study A3921033 report) Reviewer’s comment
NDA203214 Clinical Pharmacology Review_NDA203214.doc
Page 27 of 158
Reference ID: 3149379

1. Note that the above reported percent change in tofacitinib pharmacokinetics based on varying renal function are calculated based on classification of patients as per new FDA renal guidance: creatinine clearance for Normal subjects - 90 mL/min, Mild renal impairment- 60-89 mL/min, Moderate renal impairment- 30-59 mL/min and severe renal impairment- 15-29 mL/min. Creatinine clearance cut-offs used by the sponsor for the respective groups were: >80 mL/min, >50 and 80 mL/min, 30 and 50 mL/min and <30 mL/min.
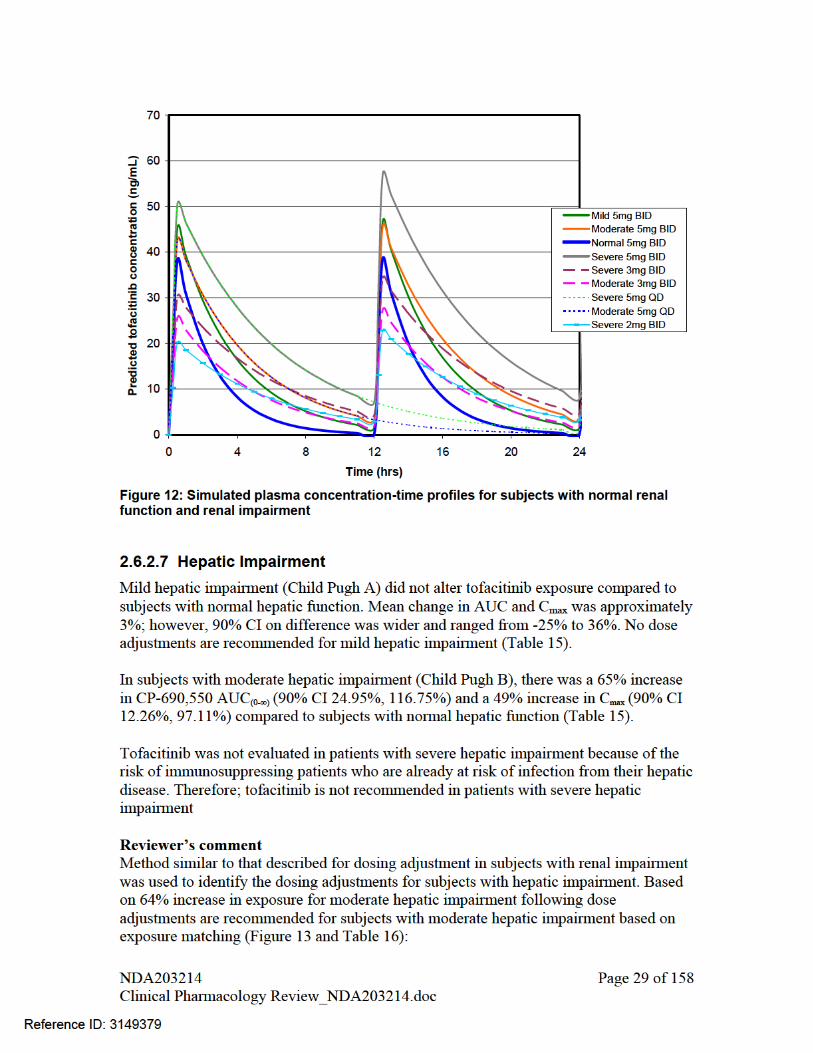
2. Observed mean plasma concentration – time profile data for subjects with moderate and severe renal impairment were modeled using WinNonlin version 5.2.1. The parameters obtained were then used to simulate plasma concentration – time profiles for different dosing regimens (Figure 12). These simulated concentration – time profiles for alternative dosing regimens were used to guide dosing recommendations by matching the exposure (AUC calculated by non-compartmental analysis) with that obtained for 5 mg tofacitinib dose in subjects with normal renal function. Calculated PK parameters for alternative dosing regimens are listed in Table 14. Based on exposure matching, the recommended dose for moderate and severe renal impairment subjects is:
if both 5 and 10 mg BID dose are approved, tofacitinib dose should not exceed 5
mg BID if only 5 mg BID is approved, a reduced tofacitinib dose of 5 mg QD is
recommended For subjects with mild renal impairment, no dose adjustments are recommended. Table 14: Steady-state PK parameters calculated based on simulated profiles Population Dose AUC48-72 T1/2 Cmax
Dosing
Regimen ng/mL*hr hr ng/mL Normal 5 mg BID 197 1.58 38.56 10 mg BID 394 1.58 77.13
3 mg BID 203 2.39 28.05 Mild Renal Impairment 5 mg BID 338 2.39 46.75 5 mg QD 169 2.39 45.35
3 mg BID 244 3.12 27.51 Moderate Renal Impairment 5 mg BID 407 3.12 45.85 5 mg QD 204 3.12 42.86
2 mg BID 249 4.08 23.24 Severe Renal Impairment 3 mg BID 373 4.08 34.85 5 mg BID 621 4.08 58.09 5 mg QD 311 4.08 51.40
NDA203214 Clinical Pharmacology Review_NDA203214.doc
Page 28 of 158
Reference ID: 3149379
if both 5 and 10 mg BID dose are approved, tofacitinib dose should not exceed 5 mg BID
if only 5 mg BID is approved, a reduced tofacitinib dose of 5 mg QD is recommended
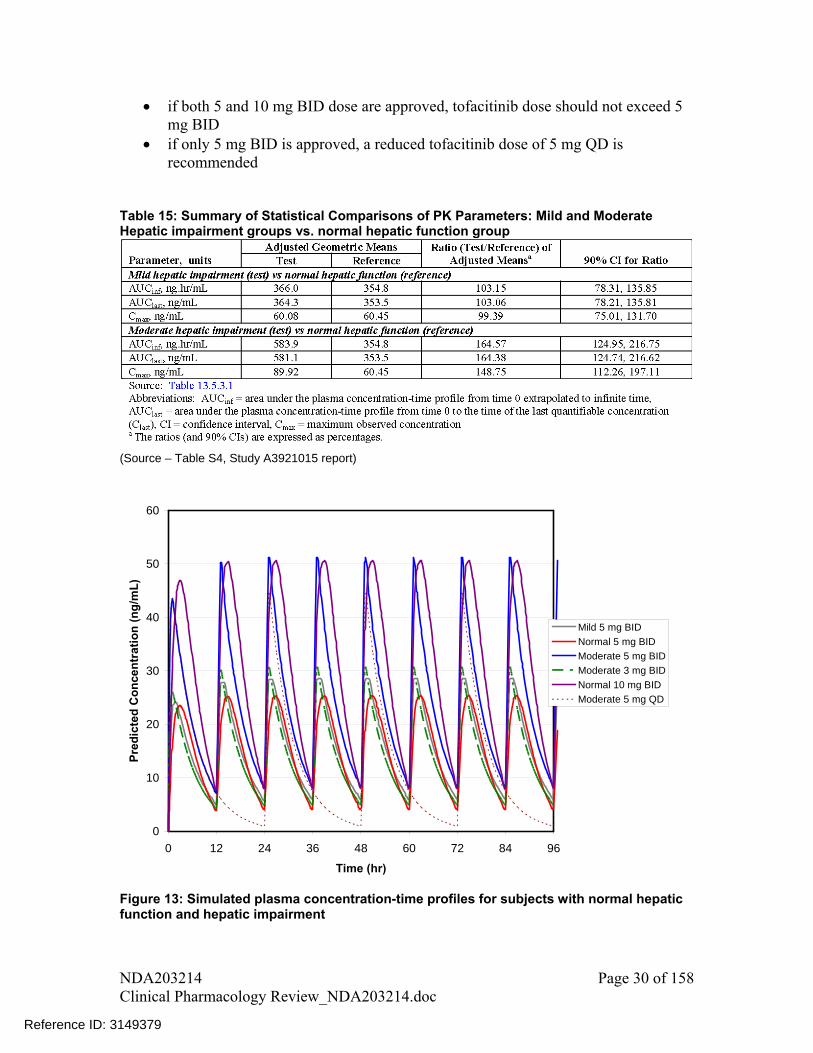
Table 15: Summary of Statistical Comparisons of PK Parameters: Mild and Moderate Hepatic impairment groups vs. normal hepatic function group
(Source – Table S4, Study A3921015 report)
0
10
20
30
40
50
60
0 12 24 36 48 60 72 84 96
Time (hr)
Pre
dic
ted
Co
nce
ntr
atio
n (
ng
/mL
)
Mild 5 mg BID
Normal 5 mg BID
Moderate 5 mg BID
Moderate 3 mg BID
Normal 10 mg BID
Moderate 5 mg QD
Figure 13: Simulated plasma concentration-time profiles for subjects with normal hepatic function and hepatic impairment
NDA203214 Clinical Pharmacology Review_NDA203214.doc
Page 30 of 158
Reference ID: 3149379

Table 16: Steady-state PK parameters calculated based on simulated profiles for subjects with normal hepatic function or hepatic impairment
Population Dose Dosing Regimen AUC48-72 T1/2 Cmax Normal 5 mg BID 362 2.66 25.29 10 mg BID 723 2.66 50.58 Mild Hepatic Impairment 5 mg BID 387 4.36 28.52
5 mg BID 590 4.16 50.61 Moderate Hepatic Impairment 3 mg BID 354 4.16 30.37
5 mg QD 295 4.16 44.33
2.6.3 Does genetic variation impact exposure and/or response? The in-vitro and mass-balance suggest that tofacitinib is metabolized by CYP3A4 and to a lesser extent by CYP2C19. The sponsor recommends dose adjustment for patients receiving drug(s) that inhibit both CYP3A4 and CYP2C19 (e.g., fluconazole) because of an approximate two-fold increase in exposure. However, tofacitinib dose adjustment is not warranted when coadministered with a CYP2C19 inhibitor. The pharmacogenetic analysis conducted by the sponsor suggests that CYP2C19 metabolic status has little effect on tofacitinib PK. Therefore, dosing recommendations based on genotype alone do not appear to be indicated. Please see Genomics review by Dr. Jeffrey Kraft for assessment of the impact of genetic variation on tofacitinib exposure.
2.7 Extrinsic Factors
2.7.1 Is there an in vitro basis to suspect in vivo drug-drug interactions? The potential for drug-drug interaction because of induction or inhibition of CYP enzymes by tofacitinib is less likely at therapeutic concentrations. Please see sections 2.7.2 and 2.7.4 for further details.
2.7.2 Is the drug a substrate of CYP enzymes? Yes, metabolism is a major pathway of clearance for tofacitinib. In vitro studies using human recombinant CYP450 isoforms indicated that CP-690,550 is primarily metabolized by CYP3A4 and CYP2C19 with minimal metabolism from CYP1A1, CYP1A2, CYP2A6, CYP2B6, CYP2C8, CYP2C9, CYP2C18, CYP2D6, CYP2E1, and CYP3A5. In vitro and in vivo studies with ketoconazole showed that CYP3A4 was primarily responsible for metabolism of tofacitinib.
2.7.3 Is the drug an inhibitor and/or an inducer of enzymes?
NDA203214 Clinical Pharmacology Review_NDA203214.doc
Page 31 of 158
Reference ID: 3149379

In vitro studies demonstrated little or no inhibition of CYP1A2, CYP2B6, CYP2C8, CYP2C9, CYP2C19, CYP2D6 or CYP3A activities. IC50 values could not be calculated since tofacitinib did not inhibit any enzyme activity more than 27% for the tested concentrations of up to 30 μM. Given a steady state unbound Cmax of approximately ~310 nM2 or 0.31 M for a dose of 10 mg BID, the Cmax/IC50 ratios are <0.01, suggest a low potential for tofacitinib to influence the metabolism of coadministered drugs that are metabolized by CYP450 enzymes (Table 17). At clinically relevant concentrations (i.e., steady-state concentrations for 10 mg bid=~310 nM or 0.31 M2), no induction of CYP3A4 and CYP1A2 enzymes was seen in in vitro studies. Table 17: IC50 values for inhibition of metabolic enzymes and transporters by tofacitinib
CYPs/Transporters IC50 [I] / IC50 [I2] / IC50 M
CYP1A2, 2B6, 2C8, 2C9, 2C19,2D6 >30 ~0.01 4.27 P-gp 311 0.000990 0.41 OCT 150 0.002053 0.85 OATP1B1 55.3 0.005569 2.31 OATP1B3 ND
ND – Not determined because for OATP1B3 no inhibition was observed up to tested concentration of 100 M [I] = maximum total inhibitor concentration in plasma = Cmax value for the to-be-marketed formulation from the pivotal bioequivalence study (96.4 ng/mL=0.31M) [I2] = For inhibitors which are dosed orally it is equal to (Molar Dose/250 mL) (For tofacitinib [I2] is equal to 128 M)
2.7.4 Is the drug a substrate, an inhibitor and/or an inducer of transporter processes?
In vitro permeability assessments indicated that tofacitinib is a substrate for P-gp, but not a substrate of BCRP. Tofacitinib has low potential to inhibit P-gp with an estimated IC50 value of 311 μM. At a steady-state unbound Cmax of ~ 310 nM and projected gut concentration of ~128 μM using a gut dilution factor of 250 mL) following a 10 mg BID dose, the systemic [I]/IC50 ratio is ~0.001 and the gut [I]/IC50 ratio is ~0.4 (Table 17). Both of these ratios are significantly below the level where a digoxin interaction study would be warranted, i.e., >0.1 and >10, respectively.
Tofacitinib also has low potential to inhibit hOCT2 and OATP1B1 at clinically relevant concentrations based on in vitro assessment in hOCT2-transfected human embryonic kidney (HEK)-293 cells. Systemic [I]/IC50 and [I2]/IC50 were below the threshold at which further in vivo evaluation would be warranted (Table 17). Tofacitinib was not an inhibitor of OATP1B3.
2 Cmax of approximately ~310 nM or 0.31 M is equal to the Cmax of the to-be-marketed formulation (i.e., 96.2 ng/mL), which is taken from bioequivalence study bridging the commercial formulation with the clinical formulation (section 2.8.2). Note that tofacitinib PK after single-dose and multiple-dose are similar
NDA203214 Clinical Pharmacology Review_NDA203214.doc
Page 32 of 158
Reference ID: 3149379

2.7.5 Are there other metabolic/transporter pathways that may be important?
No other metabolic enzyme or transported pathway is known to be important for disposition of tofacitinib in addition to those already discussed in sections 2.7.2 and 2.7.4
2.7.6 What extrinsic factors influence exposure and/or response, and what is the impact of any differences in exposure on effectiveness or safety responses?
Among extrinsic factors only the effect of coadministration with other drugs on tofacitinib exposure has been evaluated, which is discussed under section 2.7.7. Other extrinsic factors such as effect of comorbidities on drug exposure have not been evaluated.
2.7.7 What are the drug-drug interactions? Drug interaction was evaluated as follows and the results are summarized in Table 18 and Table 21:
Effect of tofacitinib on PK of coadministered drugs Effect of coadministered drugs on tofacitinib PK
Table 18: Effect of tofacitinib on coadministered drugs
GMR (90% CI) Tofacitinib Regimen Substrate AUC Cmax
Microgynon® (30 g ethinylestradiol (EE) + 150 g levonorgestrel (LNG)) (test arm: coadministration with tofacitinib on day 10; reference arm: monotherapy on day 1)
EE 106.55 (98.9-114.8)
89.6 (82-98)
Tofacitinib 30 mg BID (coadministered with Microgynon® on days 10-11)
LNG 100.9 (94.7-107.4)
112.2 (105.3-119.5)
Tofacitinib 30 mg BID (coadministered with midazolam on days 6-7)
Midazolam† (CYP3A4 substrate) (test arm: coadministration with tofacitinib on day 7; reference arm: monotherapy 2 mg oral syrup on day 1)
104 (95.6-113.1)
102.2 (96-108.9)
Tofacitinib 30 mg BID (monotherapy on days 3-6 and coadministered with methotrexate on day 7)
Methotrexate (test arm: coadministration with tofacitinib on day 7 ; reference arm: monotherapy on day 1)
89.5 (77.4-103.6)
87.3 (76-100.1)
Reviewer’s comments 1. No dose adjustments are recommended for oral contraceptive (Microgynon),
midazolam and methotrexate when coadministered with tofacitinib
NDA203214 Clinical Pharmacology Review_NDA203214.doc
Page 33 of 158
Reference ID: 3149379

Table 19: Effect of coadministered drugs on tofacitinib
GMR (90% CI) Coadministered drug Tofacitinib AUC Cmax
Ketoconazole (potent P-gp and CYP3A4 inhibitor) 400 mg QD (monotherapy: days 1 and 2, with tofacitinib on day 3)
Tofacitinib 10 mg (test arm: coadministered with ketoconazole on day 3; reference arm: single-dose on day 1)
203.2 (191-216.3)
116.2 (104.6-129.2)
Fluconazole (moderate inhibitor of CYP3A4 and potent inhibitor of CYP2C19) (400 mg QD loading dose on day 1, followed by 200 mg QD from days 2 to 7)
Tofacitinib 30 mg (test arm: coadministered with fluconazole on day 5; reference arm: single-dose on day 1)
179.3 (163.8-196.2)
126.7 (111.8-143.7)
Rifampin† (potent P-gp and CYP3A4 inducer) 600 mg QD (monotherapy on days 1 to 7)
Tofacitinib 30 mg QD (test arm: on day 8 following 7 days of rifampin administration; reference arm: single-dose on day 1)
16.1 (14.2-18.2)
26.3 (22.6-30.6)
Methotrexate –individualized single-dose (15-25 mg/week)
Tofacitinib 30 mg BID (test arm: coadministration with methotrexate on day 7; reference arm: monotherapy on days 3-6)
103.1 (99-107.3)
102.7 (93.8-112.5)
Tacrolimus –5 mg BID or adjusted dose to achieve pre-set concentration on days 1 to 7 as monotheapy and on day 8 with tofacitinib.
Tofacitinib 10 mg (test arm - coadministration with tacrolimus on day 8; reference arm: monotherapy on day 1)
121.1 (113.2-129.6)
90.8 (83.6-99)
Cyclosporine –200 mg BID or adjusted dose to achieve pre-set concentration on days 1 to 5 as monotheapy and on day 6 with tofacitinib.
Tofacitinib 10 mg (test arm - coadministration with cyclosporine on day 6; reference arm: monotherapy on day 1)
173.1 (161.8-185.3)
83.2 (71.4-97)
Reviewer’s comments 1. No significant change in exposure of tofacitinib was observed following
coadministration with methotrexate; therefore, no dose adjustments are recommended.
2. Following coadministration with tacrolimus, tofacitinib AUC increased by 21% and Cmax reduced by 10%. However, both tofacitinib and tacrolimus are immunosuppresants and have not been studied together. Therefore, because of potential for pharmacodynamic drug-drug interaction coadministration of tofacitinib with tacrolimus is not recommended.
3. Following coadministration with cyclosporine, tofacitinib AUC increased by 73% and Cmax reduced by 17%. However, both tofacitinib and cyclosporine are immunosuppresants and have not been studied together. Therefore, because of
NDA203214 Clinical Pharmacology Review_NDA203214.doc
Page 34 of 158
Reference ID: 3149379

potential for pharmacodynamic drug-drug interaction coadministration of tofacitinib with cyclosporine is not recommended.
4. Coadministration with rifampin significantly reduced AUC and Cmax of tofacitinib by 84% and 74%, respectively. These lower exposures will result in inefficacious concentrations; therefore, coadministration with rifampin or other strong CYP3A inducers is not recommended.
5. A significant increase in tofacitinib exposure was observed following coadministration with ketoconazole and fluconazole. The steps taken to identify a suitable dosing regimen for these cases are outline below:
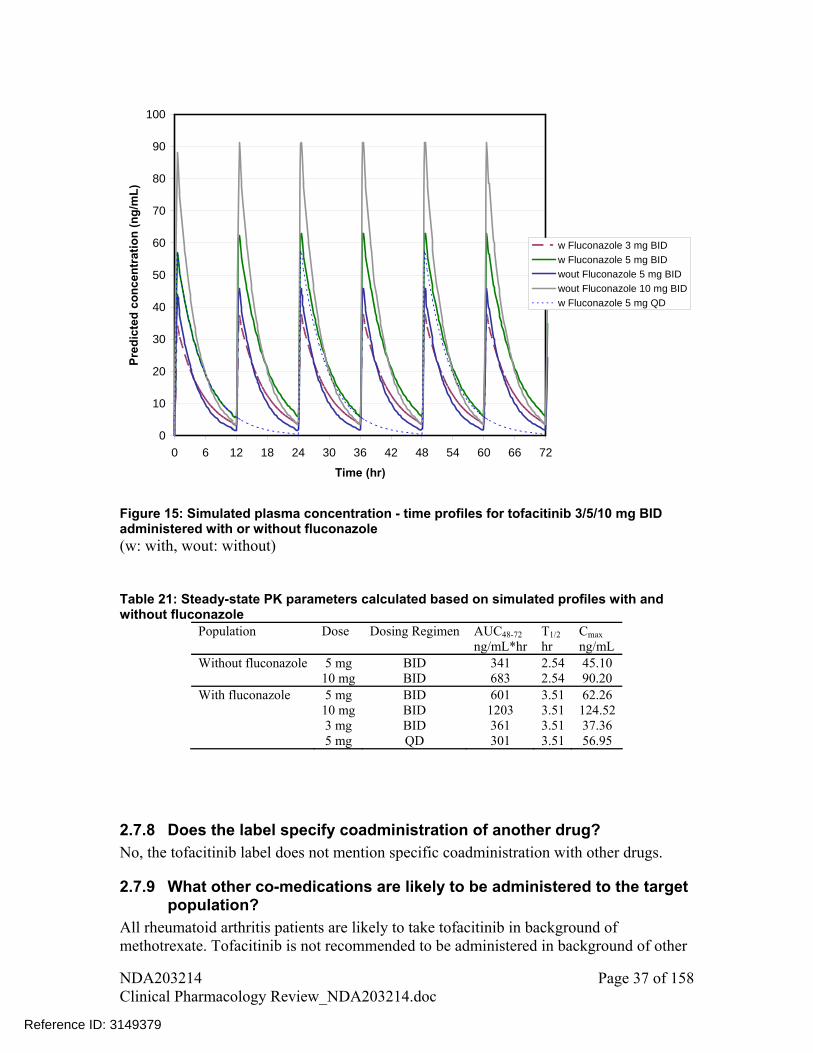
i. Observed mean plasma concentration – time profile data from DDI studies for ketoconazole and fluconazole were modeled using WinNonlin version 5.2.1. The parameters obtained were then used to simulate plasma concentration – time profiles for different dosing regimens (Figure 14 and Figure 15, respectively for ketoconazole and fluconazole).
ii. These simulated concentration – time profiles for alternative dosing regimens were used to guide dosing recommendations. AUC and Cmax for simulated profiles were calculated by non-compartmental analysis and were taken into account while identifying an alternative dosing regimen. Doses were adjusted to match the exposures (AUCs) to that obtained after administration of 5 mg BID (if only 5 mg BID dose is approved) or 10 mg BID (if both 5 mg BID and 10 mg BID doses are approved) tofacitinib as single therapy.
iii. To confirm that simulated profiles were representative of the observed data, AUC and Cmax values from simulated concentration-time profiles were compared with the mean values reported in the sponsor reports. These values were comparable for both scenarios- ketoconazole and fluconazole.
6. Based on steps outlined in point 4, tofacitinib dosing recommendations for coadministration with ketoconazole and fluconazole is:
a. if both 5 and 10 mg BID dose are approved, tofacitinib dose should not exceed 5 mg BID
b. if only 5 mg BID is approved, a reduced tofacitinib dose of 5 mg QD is recommended
7. The plasma concentration-time profiles for 5 mg QD and other dosing regimens are shown in Figure 14 and Figure 15. Calculated PK parameters based on these simulated plasma concentration – time profiles are listed in Table 20 and Table 21.
NDA203214 Clinical Pharmacology Review_NDA203214.doc
Page 35 of 158
Reference ID: 3149379

0
10
20
30
40
50
60
70
80
0 12 24 36 48 60 72
Time (hr)
Pre
dic
ted
Co
nce
ntr
atio
n (
ng
/mL
)
w Keto 3 mg BID
w Keto 5 mg BID
wout Keto 5 mg BID
wout Keto 10 mg BID
w Keto 5 mg QD
Figure 14: Simulated plasma concentration - time profiles for tofacitinib 3/5/10 mg BID administered with or without ketoconazole (w: with, wout: without, keto: ketoconazole) Table 20: Steady-state PK parameters calculated based on simulated profiles with and without ketoconazole
Population Dose Dosing Regimen AUC48-72 T1/2 Cmax ng/mL*hr hr ng/mL Without ketoconazole 5 mg BID 235 1.99 37.83 10 mg BID 470 1.99 75.67 With ketoconazole 5 mg BID 506 3.96 48.19 10 mg BID 1012 3.96 96.38 3 mg BID 304 3.96 28.91 5 mg QD 253 3.96 42.93
NDA203214 Clinical Pharmacology Review_NDA203214.doc
Page 36 of 158
Reference ID: 3149379
0
10
20
30
40
50
60
70
80
90
100
0 6 12 18 24 30 36 42 48 54 60 66 72
Time (hr)
Pre
dic
ted
co
nce
ntr
atio
n (
ng
/mL
)
w Fluconazole 3 mg BID
w Fluconazole 5 mg BID
wout Fluconazole 5 mg BID
wout Fluconazole 10 mg BID
w Fluconazole 5 mg QD
Figure 15: Simulated plasma concentration - time profiles for tofacitinib 3/5/10 mg BID administered with or without fluconazole (w: with, wout: without) Table 21: Steady-state PK parameters calculated based on simulated profiles with and without fluconazole
Population Dose Dosing Regimen AUC48-72 T1/2 Cmax ng/mL*hr hr ng/mL Without fluconazole 5 mg BID 341 2.54 45.10 10 mg BID 683 2.54 90.20 With fluconazole 5 mg BID 601 3.51 62.26 10 mg BID 1203 3.51 124.52 3 mg BID 361 3.51 37.36 5 mg QD 301 3.51 56.95
2.7.8 Does the label specify coadministration of another drug? No, the tofacitinib label does not mention specific coadministration with other drugs.
2.7.9 What other co-medications are likely to be administered to the target population?
All rheumatoid arthritis patients are likely to take tofacitinib in background of methotrexate. Tofacitinib is not recommended to be administered in background of other
NDA203214 Clinical Pharmacology Review_NDA203214.doc
Page 37 of 158
Reference ID: 3149379
biologics disease modifying anti-rheumatic drugs (DMARDs), but it has a potential to be administered with other anti-rheumatic drugs as listed in section 2.2.4 (excluding biologic DMARDs). Rheumatoid arthritis is more likely to occur in old age patients; therefore, there is a potential for other drugs such as anti-hypertensives, anti-diabetic, anti-hyperlipidemic etc. to be administered with tofacitinib.
2.7.10 Is there a known mechanistic basis for pharmacodynamic drug-drug interactions?
Potential for pharmacodynamic drug-drug interactions with tacrolimus and cyclosporine is discussed under 2.7.7. Theoretically there is also a possibility that other immunosuppressive drugs which act by JAK kinase or other pathways, if coadministered, may affect the safety profile of tofacitinib.
2.8 General Biopharmaceutics
2.8.1 Based on the biopharmaceutic classification system principles, in what class is this drug and formulation? What solubility, permeability and dissolution data support this classification?
Tofacitinib can be considered a BCS class 3 drug because of high aqueous solubility and moderate permeability. The aqueous pH solubility of tofacitinib (the citrate salt) was determined to be >0.04 mg/mL, which is the concentration obtained from dissolving the highest dose strength of 10 mg tablet in 250 mL solution. Thus the CP-690,550-10 solubility profile meets the high solubility criteria set forth based on the BCS principles. The human oral bioavailability study showed that the mean absolute oral bioavailability of the commercial tofacitinib tablet was 74%, which is less than the 90% criterion described in the BCS guidance for a Class I agent. In the human mass balance study, the mean total percentage of administered radioactive dose recovered was 94%, with 80% in the urine and 13.8% in the feces, which did not conclusively show that the fraction of dose absorbed was greater than 90%. In vitro permeability assessments also showed that apparent permeability (Papp) values of tofacitinib at concentrations 1x, 0.1x, and 0.001x of clinical dose (10 mg in 250 mL) were lower than that of metoprolol, which is a highly permeable compound and was used as the reference. Based on available data, tofacitinib appears to have low permeability based on BCS principles.
2.8.2 How is the proposed to-be-marketed formulation linked to the clinical service formulation?
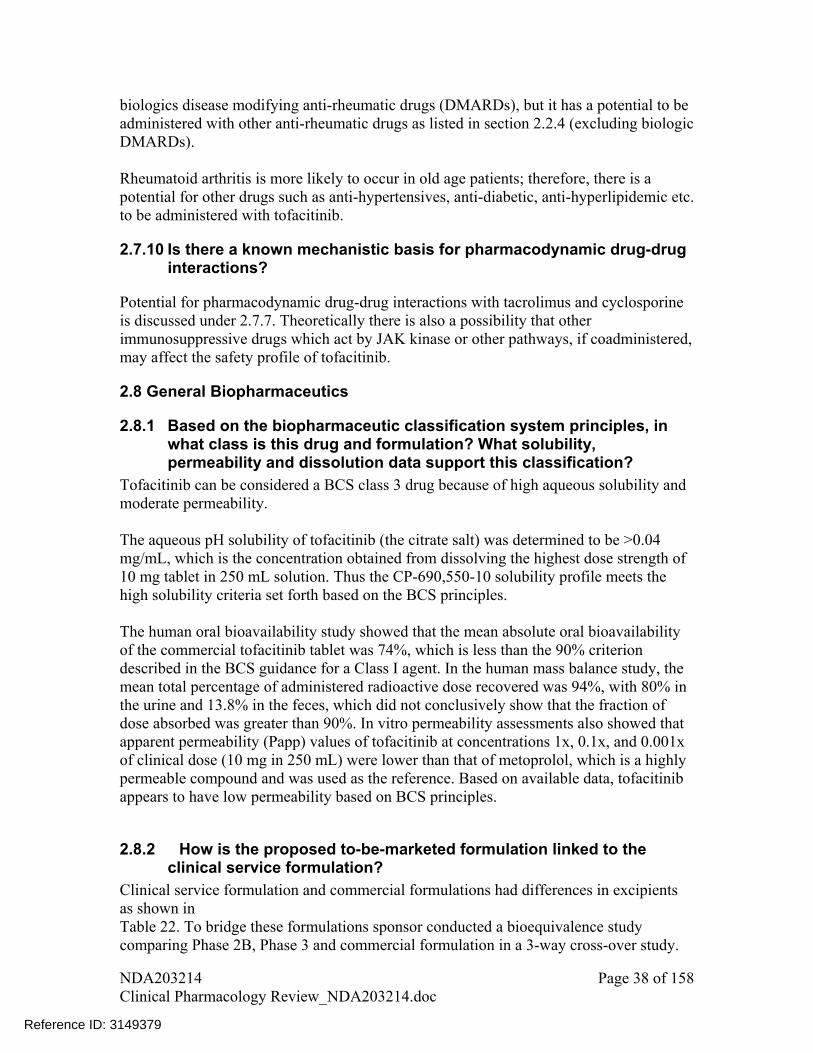
Clinical service formulation and commercial formulations had differences in excipients as shown in Table 22. To bridge these formulations sponsor conducted a bioequivalence study comparing Phase 2B, Phase 3 and commercial formulation in a 3-way cross-over study.
NDA203214 Clinical Pharmacology Review_NDA203214.doc
Page 38 of 158
Reference ID: 3149379

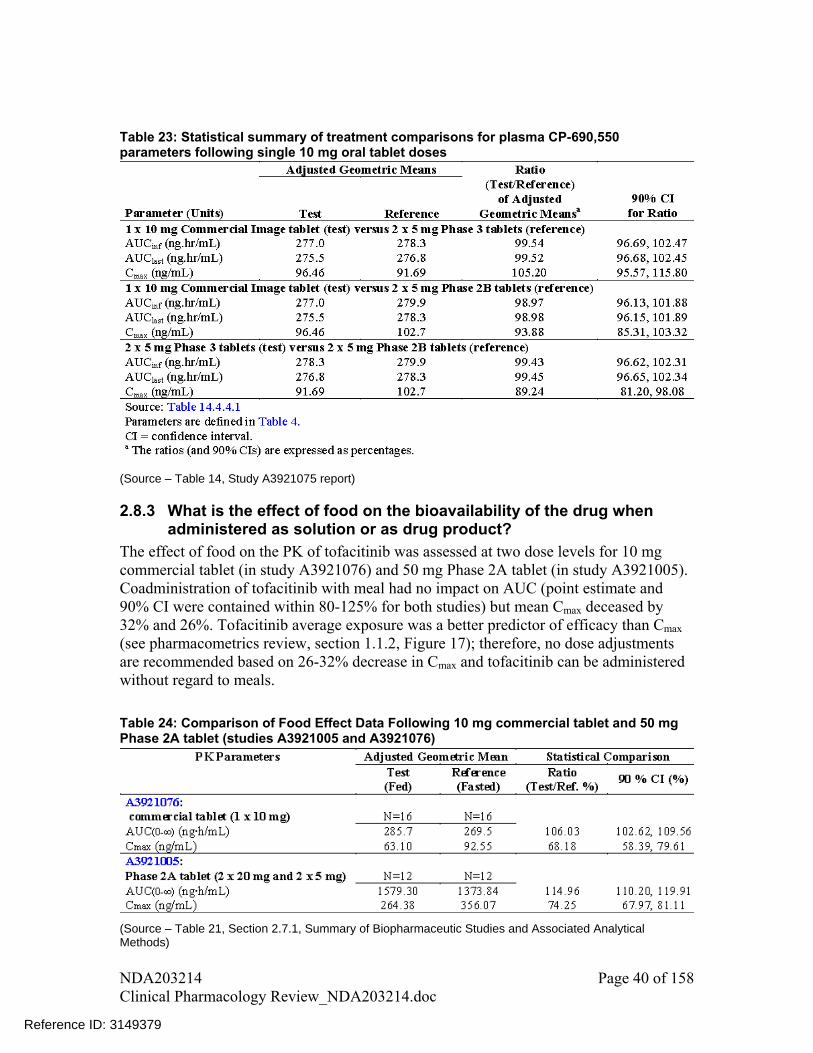
Table 23: Statistical summary of treatment comparisons for plasma CP-690,550 parameters following single 10 mg oral tablet doses
(Source – Table 14, Study A3921075 report)
2.8.3 What is the effect of food on the bioavailability of the drug when administered as solution or as drug product?
The effect of food on the PK of tofacitinib was assessed at two dose levels for 10 mg commercial tablet (in study A3921076) and 50 mg Phase 2A tablet (in study A3921005). Coadministration of tofacitinib with meal had no impact on AUC (point estimate and 90% CI were contained within 80-125% for both studies) but mean Cmax deceased by 32% and 26%. Tofacitinib average exposure was a better predictor of efficacy than Cmax (see pharmacometrics review, section 1.1.2, Figure 17); therefore, no dose adjustments are recommended based on 26-32% decrease in Cmax and tofacitinib can be administered without regard to meals.
Table 24: Comparison of Food Effect Data Following 10 mg commercial tablet and 50 mg Phase 2A tablet (studies A3921005 and A3921076)
(Source – Table 21, Section 2.7.1, Summary of Biopharmaceutic Studies and Associated Analytical Methods)
NDA203214 Clinical Pharmacology Review_NDA203214.doc
Page 40 of 158
Reference ID: 3149379

2.8.4 Was the bioequivalence of the different strengths of the to be marketed formulation tested? If so were they bioequivalent or not?
No, bioequivalence was only tested for the 10 mg dose level of the to-be-marketed formulation and not for the 5 mg dose level. Bioequivalence was tested for 10 mg strength of the commercial formulation. Sponsor stated that the lower strength of 5 mg commercial tablet shares the same manufacturing process. Please refer to review by Office of New Drug Quality Assessment (ONDQA) reviewer for further details on compositional proportionality of the 5 mg dose strength of the commercial tablet.
2.9 Analytical Section
2.9.1 How are parent drug and relevant metabolites identified and what are the analytical methods used to measure them in plasma and other matrices?
Analytical methods used to measure the parent drug in different studies are listed in Table 25. Two of the methods, which were used in most of the studies for analysis of tofacitinib in heparinized plasma, are summarized below.
Analytical method report # A3929008 Tofacitinib was extracted from human sodium heparinized plasma by 96-well solid phase extraction (Phenomenex Strata-XC 10mg plate). Before the extraction, radiolabeled tofacitinib (i.e., [13C,15N] CP-690,550) was added as an internal standard. The samples were eluted with 13% ammonium hydroxide (NH4OH) in methanol, evaporated to dryness, and reconstituted with 50% methanol in water. The reconstituted sample was injected into an LC/MS/MS system using a Phenomenex Synergi Polar RP 4 column with a mobile phase of 40% 10mM ammonium acetate and 60% methanol (with 0.05% formic acid). The lower limit of quantitation (LLOQ) for tofacitinib in human plasma was 1 ng/mL, with linearity demonstrable to 100 ng/mL, using a sample volume of 300 L. Analytical method report # A3929011 The bioanalytical methods to measure tofacitinib in human plasma PK samples were developed and validated at Tofacitinib was extracted from sodium heparinized human plasma by 96-well solid phase extraction. Before the extraction, radiolabeled tofacitinib (i.e., [13C,15N] CP-690,550) was added as an internal standard. The samples were eluted with 13% NH4OH in methanol, evaporated to dryness, and reconstituted with 50% methanol in water. The reconstituted sample was injected into an LC/MS/MS system using a Synergi Polar-RP column with a mobile phase of 40% 10 mM ammonium acetate and 60% methanol (with 0.05% formic acid). The lower limit of quantitation (LLOQ) for CP-690,550 in human plasma was 0.100 ng/mL, with linearity demonstrable to 350 ng/mL, using a sample volume of 300 L.
NDA203214 Clinical Pharmacology Review_NDA203214.doc
Page 41 of 158
Reference ID: 3149379
(b) (4)
(b) (4)


Total (bound + unbound) concentrations were measured in plasma PK samples.
2.9.4 What bioanalytical methods are used to assess concentrations of the measured moieties?
Table 25 presents a summary of analytical methods used for quantification of tofacitinib and lists out the respective validation report numbers. Details of the main bioanalytical methods are discussed in section 2.9.1.
2.9.5 What is the range of the standard curve? How does it relate to the requirements for clinical studies? What curve fitting techniques were used?
The standard curve for tofacitinib’s analysis in plasma using method A3923011 ranged from 0.100 to 350 ng/mL. A quadratic regression model, with weighting factor of 1/concentration2
was used for the curve fitting for tofacitinib. For the analytical method A3929008, standard curve range was from 1 to 100 ng/mL. The calibration curves were obtained by using a 1/concentration2
weighting factor in a linear regression model of peak area ratio vs. concentration.
2.9.5.1 What are the lower and upper limits of quantitation? LLOQ and ULOQ for A3929008 analytical method were 1 ng/mL and 100 ng/mL, respectively. Ten fold dilution factor was also validated for concentrations above 100 ng/mL.
LLOQ and ULOQ for A3929011 analytical method were 0.1 ng/mL and 350 ng/mL, respectively. For concentrations above 350 ng/mL, a 10-fold dilution factor was validated for 700 ng/mL concentration.
2.9.5.2 What are the accuracy, precision, and selectivity at these limits? The accuracy and precision of analytical methods A3929008 and A3929011 are listed in Table 26 and
Table 27, respectively. For both analytical methods bias and imprecision for 10 fold dilution factor was less 6%.
Table 26: Accuracy and Precision of Tofacitinib Analytical LC/MS/MS Assay (Validation Report # A3929008)
(Source – Table 6, Section 2.7.1, Summary of Biopharmaceutic Studies and Associated Analytical Methods)
NDA203214 Clinical Pharmacology Review_NDA203214.doc
Page 43 of 158
Reference ID: 3149379
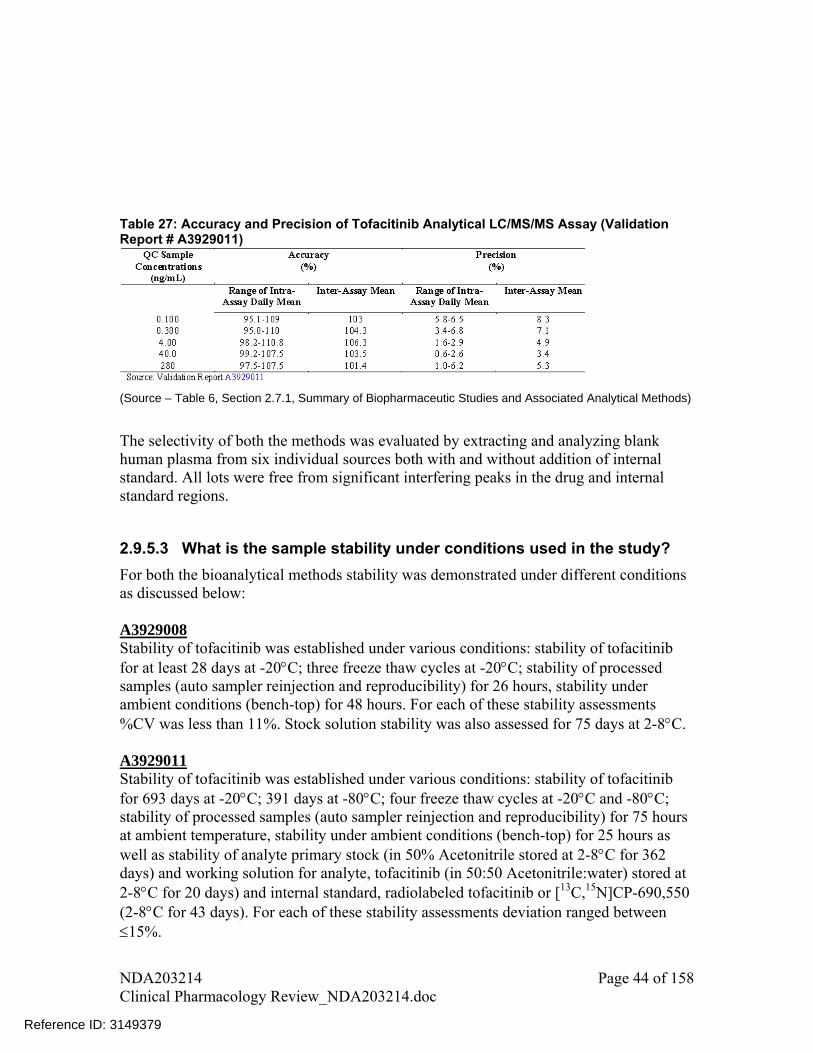
Table 27: Accuracy and Precision of Tofacitinib Analytical LC/MS/MS Assay (Validation Report # A3929011)
(Source – Table 6, Section 2.7.1, Summary of Biopharmaceutic Studies and Associated Analytical Methods)
The selectivity of both the methods was evaluated by extracting and analyzing blank human plasma from six individual sources both with and without addition of internal standard. All lots were free from significant interfering peaks in the drug and internal standard regions.
2.9.5.3 What is the sample stability under conditions used in the study?
For both the bioanalytical methods stability was demonstrated under different conditions as discussed below: A3929008 Stability of tofacitinib was established under various conditions: stability of tofacitinib for at least 28 days at -20C; three freeze thaw cycles at -20C; stability of processed samples (auto sampler reinjection and reproducibility) for 26 hours, stability under ambient conditions (bench-top) for 48 hours. For each of these stability assessments %CV was less than 11%. Stock solution stability was also assessed for 75 days at 2-8C. A3929011 Stability of tofacitinib was established under various conditions: stability of tofacitinib for 693 days at -20C; 391 days at -80C; four freeze thaw cycles at -20C and -80C; stability of processed samples (auto sampler reinjection and reproducibility) for 75 hours at ambient temperature, stability under ambient conditions (bench-top) for 25 hours as well as stability of analyte primary stock (in 50% Acetonitrile stored at 2-8C for 362 days) and working solution for analyte, tofacitinib (in 50:50 Acetonitrile:water) stored at 2-8C for 20 days) and internal standard, radiolabeled tofacitinib or [13C,15N]CP-690,550 (2-8C for 43 days). For each of these stability assessments deviation ranged between 15%.
NDA203214 Clinical Pharmacology Review_NDA203214.doc
Page 44 of 158
Reference ID: 3149379

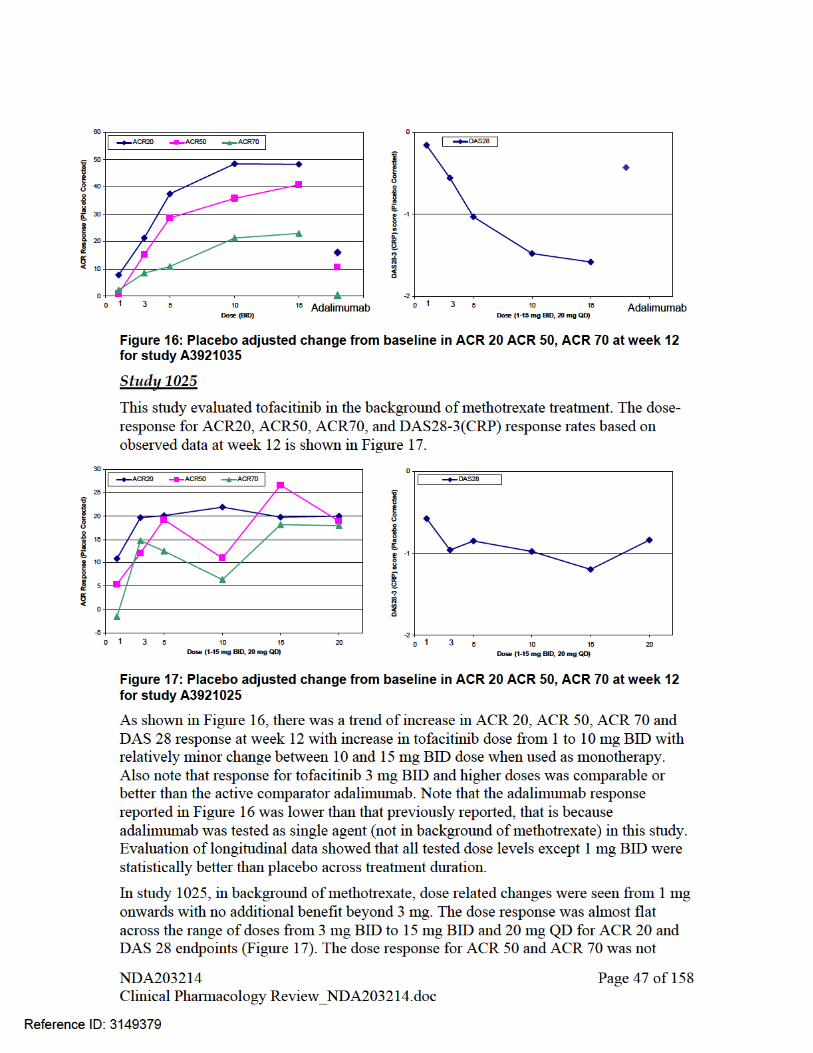
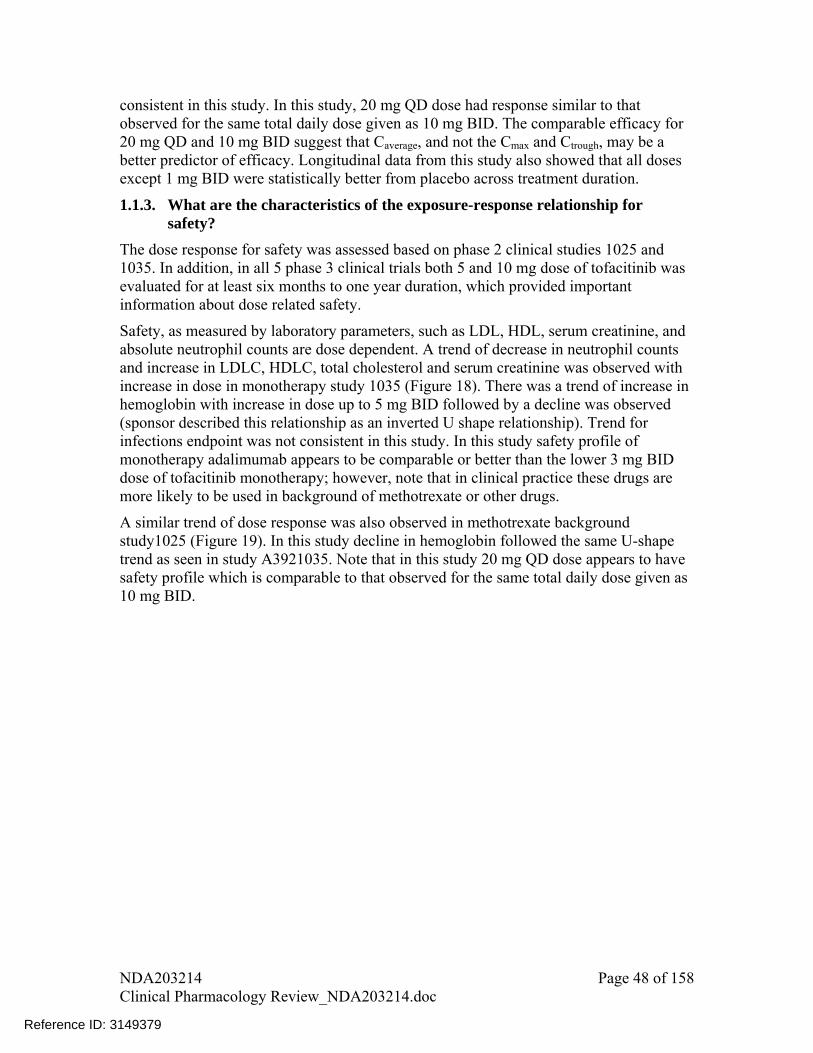
consistent in this study. In this study, 20 mg QD dose had response similar to that observed for the same total daily dose given as 10 mg BID. The comparable efficacy for 20 mg QD and 10 mg BID suggest that Caverage, and not the Cmax and Ctrough, may be a better predictor of efficacy. Longitudinal data from this study also showed that all doses except 1 mg BID were statistically better from placebo across treatment duration.
1.1.3. What are the characteristics of the exposure-response relationship for safety?
The dose response for safety was assessed based on phase 2 clinical studies 1025 and 1035. In addition, in all 5 phase 3 clinical trials both 5 and 10 mg dose of tofacitinib was evaluated for at least six months to one year duration, which provided important information about dose related safety.
Safety, as measured by laboratory parameters, such as LDL, HDL, serum creatinine, and absolute neutrophil counts are dose dependent. A trend of decrease in neutrophil counts and increase in LDLC, HDLC, total cholesterol and serum creatinine was observed with increase in dose in monotherapy study 1035 (Figure 18). There was a trend of increase in hemoglobin with increase in dose up to 5 mg BID followed by a decline was observed (sponsor described this relationship as an inverted U shape relationship). Trend for infections endpoint was not consistent in this study. In this study safety profile of monotherapy adalimumab appears to be comparable or better than the lower 3 mg BID dose of tofacitinib monotherapy; however, note that in clinical practice these drugs are more likely to be used in background of methotrexate or other drugs.
A similar trend of dose response was also observed in methotrexate background study1025 (Figure 19). In this study decline in hemoglobin followed the same U-shape trend as seen in study A3921035. Note that in this study 20 mg QD dose appears to have safety profile which is comparable to that observed for the same total daily dose given as 10 mg BID.
NDA203214 Page 48 of 158 Clinical Pharmacology Review_NDA203214.doc
Reference ID: 3149379


Figure 19: Dose-response relationship for safety endpoints from study 1025. Except infections all other endpoints are shown as placebo adjusted change from baseline to week 12 (delta baseline). Infections are reported as percent incidence at week 12. Except 20 mg QD all other doses were given in BID regimen
The longitudinal changes in key laboratory endpoints between 0 to 12 months duration based on data from all phase 3 trials are shown in Figure 20, Figure 21, Figure 22, Figure 23, Figure 24 and Figure 25. Similar to phase 2 studies dose dependent increase was observed for LDL, HDL, serum creatinine and dose dependent decrease was observed for neutrophil counts. Maximum changes in these laboratory endpoints occurred by weeks 2 to 4, which then remained almost stable for the complete duration of treatment (i.e., up to 12 months). For hemoglobin levels, increase was observed for both 5 mg BID and 10 mg BID dose compared to placebo; however, increase in hemoglobin for 5 mg dose was relatively higher than 10 mg dose, indicating to an inconsistent dose response behavior. Note that this trend was similar to that observed in Phase 2 studies A3921025 and A3921035. For lymphocytes, levels increased initially followed by decline for both 5 and 10 mg BID dose with less separation between two dose levels.
NDA203214 Page 50 of 158 Clinical Pharmacology Review_NDA203214.doc
Reference ID: 3149379

Figure 20: Mean (SE) Percent Change From Baseline LDL-c (mg/dL) per Visit – All Phase 3 Studies (Overall 0 to 12 Months)
(Source: Figure 48, Pfizer Tofacitinib Advisory Committee Meeting Briefing Document, Dated May 9, 2012)
Figure 21: Mean (SE) Percent Change From Baseline HDL-c (mg/dL) per Visit – All Phase 3 Studies (Overall 0 to 12 Months)
(Source: Figure 49, Pfizer Tofacitinib Advisory Committee Meeting Briefing Document, Dated May 9, 2012)
NDA203214 Page 51 of 158 Clinical Pharmacology Review_NDA203214.doc
Reference ID: 3149379
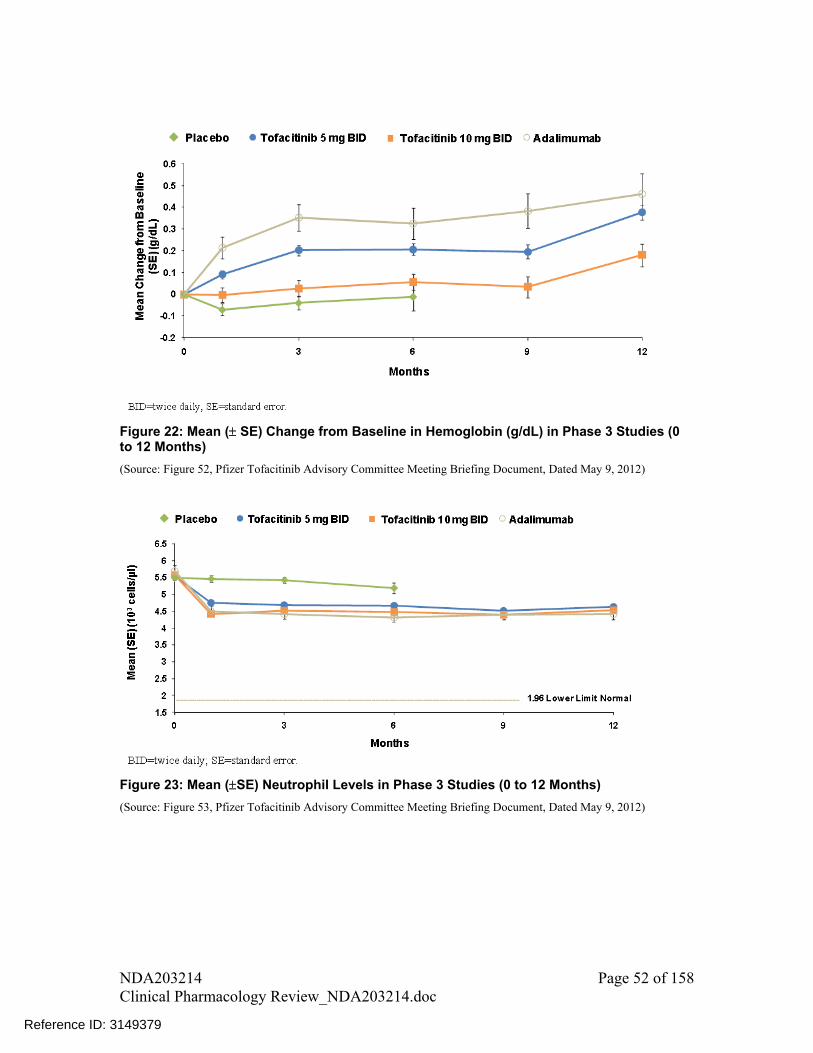
Figure 22: Mean ( SE) Change from Baseline in Hemoglobin (g/dL) in Phase 3 Studies (0 to 12 Months)
(Source: Figure 52, Pfizer Tofacitinib Advisory Committee Meeting Briefing Document, Dated May 9, 2012)
Figure 23: Mean (SE) Neutrophil Levels in Phase 3 Studies (0 to 12 Months)
(Source: Figure 53, Pfizer Tofacitinib Advisory Committee Meeting Briefing Document, Dated May 9, 2012)
NDA203214 Page 52 of 158 Clinical Pharmacology Review_NDA203214.doc
Reference ID: 3149379
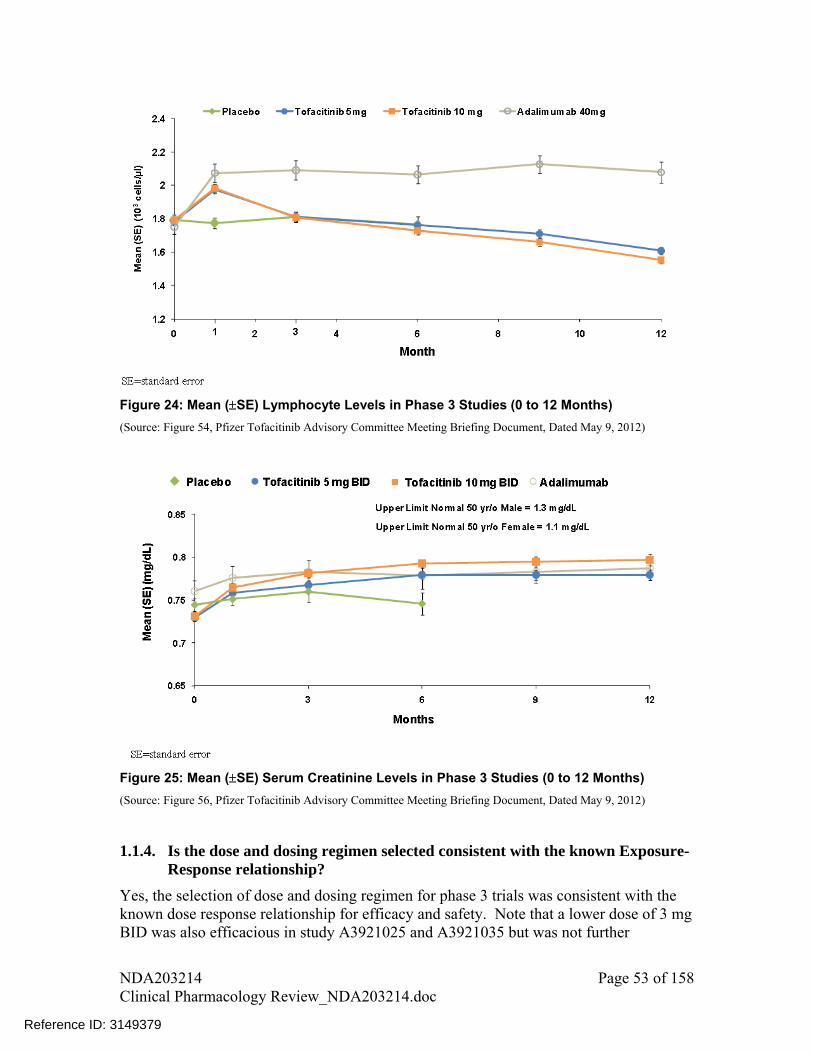
Figure 24: Mean (SE) Lymphocyte Levels in Phase 3 Studies (0 to 12 Months)
(Source: Figure 54, Pfizer Tofacitinib Advisory Committee Meeting Briefing Document, Dated May 9, 2012)
Figure 25: Mean (SE) Serum Creatinine Levels in Phase 3 Studies (0 to 12 Months)
(Source: Figure 56, Pfizer Tofacitinib Advisory Committee Meeting Briefing Document, Dated May 9, 2012)
1.1.4. Is the dose and dosing regimen selected consistent with the known Exposure- Response relationship?
Yes, the selection of dose and dosing regimen for phase 3 trials was consistent with the known dose response relationship for efficacy and safety. Note that a lower dose of 3 mg BID was also efficacious in study A3921025 and A3921035 but was not further
NDA203214 Page 53 of 158 Clinical Pharmacology Review_NDA203214.doc
Reference ID: 3149379

evaluated in Phase 3 clinical trials. The preclinical and clinical data used to support the dose selection and mechanistic reasoning in support of use of hemoglobin as safety marker in dose selection are discussed below:
A. Preclinical basis
Sponsor selected BID dosing regimen for optimization in clinical program; selection of which was based on preclinical studies in mouse collagen-induced arthritis (CIA) model. In this model QD and BID dosing regimen were tested. Comparison of efficacious concentrations with whole blood IC50 estimates for inhibition of various JAK dependent cytokines suggested that effective modulation of the inflammatory response through JAK1/3 did not require continuous coverage (i.e., plasma tofacitinib concentrations in excess of IC50) of the target over the day. In these studies, the predicted tofacitinib dose to achieve 50% effectiveness (ED50) in animal models for BID vs. QD dosing regimen were 6-12.8 mg/kg and 33.5-40.5 mg/kg, respectively. BID dosing was anticipated to provide concentrations higher than the IC50 for JAK1/3 inhibition for 12-13 hrs while this duration was 8.5-11 hrs for QD dosing. These data appears to be the basis for selection of BID dosing regimen for further optimization in clinical program. However, note that while it is logical to select the doses and dosing regimen based on preclinical information, it may not necessarily translate into a clinically relevant dosing. Also this preclinical information does not provide any information about safety of tofacitinib.
B. Clinical basis
Based on results from preclinical studies, sponsor designed the clinical program to optimize the BID dosing regimen. A total of 5 Phase 2 dose ranging studies were conducted, each of which evaluated more than one dose levels of tofacitinib in RA patients ranging from 1 to 30 mg for duration of 6 to 24-weeks. However, dose selection for Phase 3 studies was primarily based on study 1025, because design of this study was close to the anticipated real life use scenario for tofacitinib (i.e., use with background methotrexate treatment) and data were available from a relatively longer duration.
Sponsor analyzed the data from study 1025 to evaluate the probability of achieving the target efficacy and safety events. In terms of efficacy, dose selection was aimed at optimizing the response for ACR20, ACR50, and ACR70 endpoints by targeting placebo adjusted response rates at week 12 of at least 20%, 20%, and 15%, respectively. In terms of safety, only hemoglobin levels were considered in making the decision about dose based on data from study 1025, with target event of interest defined as <5% placebo adjusted incidence rate of severe anemia through 24 weeks. Where, severe anemia was defined as >2 g/dL decrease in hemoglobin from baseline or an absolute hemoglobin level of <8 g/dL. Other laboratory markers were not considered because of lack of consistency in dose-response relationship, as shown in Figure 4, with an exception for lipid parameters. Changes in lipid levels were not considered for dose selection because management of them would require individual patient specific considerations.
Probabilities of achieving the target effects are shown in Error! Reference source not found.. As shown in this figure, maximum probability of ACR20 target effect was reached by approximately 10 mg BID dose and an additional benefit was observed by
NDA203214 Page 54 of 158 Clinical Pharmacology Review_NDA203214.doc
Reference ID: 3149379
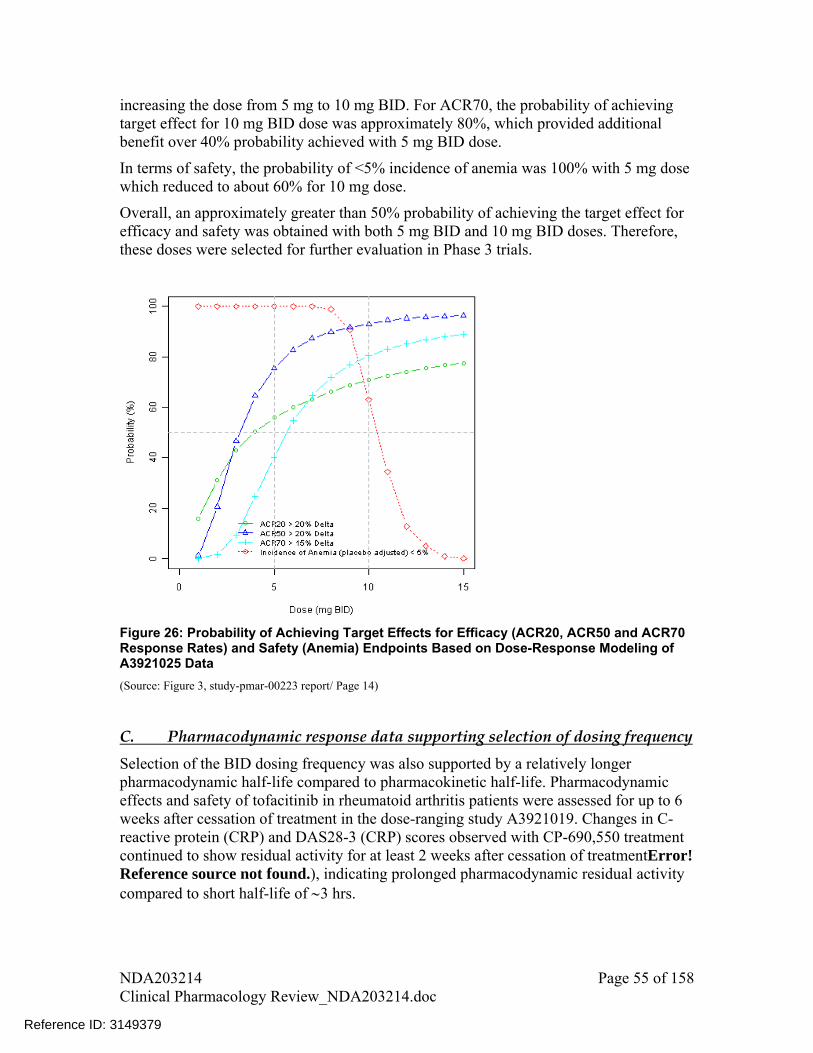
increasing the dose from 5 mg to 10 mg BID. For ACR70, the probability of achieving target effect for 10 mg BID dose was approximately 80%, which provided additional benefit over 40% probability achieved with 5 mg BID dose.
In terms of safety, the probability of <5% incidence of anemia was 100% with 5 mg dose which reduced to about 60% for 10 mg dose.
Overall, an approximately greater than 50% probability of achieving the target effect for efficacy and safety was obtained with both 5 mg BID and 10 mg BID doses. Therefore, these doses were selected for further evaluation in Phase 3 trials.
Figure 26: Probability of Achieving Target Effects for Efficacy (ACR20, ACR50 and ACR70 Response Rates) and Safety (Anemia) Endpoints Based on Dose-Response Modeling of A3921025 Data
(Source: Figure 3, study-pmar-00223 report/ Page 14)
C. Pharmacodynamic response data supporting selection of dosing frequency
Selection of the BID dosing frequency was also supported by a relatively longer pharmacodynamic half-life compared to pharmacokinetic half-life. Pharmacodynamic effects and safety of tofacitinib in rheumatoid arthritis patients were assessed for up to 6 weeks after cessation of treatment in the dose-ranging study A3921019. Changes in C-reactive protein (CRP) and DAS28-3 (CRP) scores observed with CP-690,550 treatment continued to show residual activity for at least 2 weeks after cessation of treatmentError! Reference source not found.), indicating prolonged pharmacodynamic residual activity compared to short half-life of 3 hrs.
NDA203214 Page 55 of 158 Clinical Pharmacology Review_NDA203214.doc
Reference ID: 3149379

DA
S28
-3 (
CR
P)
mea
n ch
ange
fro
m b
asel
ine
CR
P m
ean
chan
ge f
rom
bas
elin
e
Week Week Figure 27: Time Course of Changes in CRP and DAS28-3(CRP) in Study A3921019
(Source: Figure 2, study-pmar-00223 report/page 12)
D. Mechanistic reasoning for selection of safety markers to support dose selection
If we evaluate the mechanistic rational for use of hemoglobin levels to support dose selection, based on available data about mechanism of action, tofacitinib’s effect on hematopoiesis or hemoglobin levels is an outcome of off-target effect on JAK2 protein.
A more direct indicator of tofacitinib’s activity on JAK1/3 proteins is the effect on CD4+ cells, which is also thought to be the mechanism of action for tofacitinib’s activity in rheumatoid arthritis3. However, no dose-dependent changes in CD4+ cell counts were observed in data collected from two Phase 2 studies A3921019 and A3921035 after 6-week and 24-week treatment with tofacitinib, respectively (Figure 32). Therefore, changes in CD4+ counts, although mechanistically appear to be a better marker of tofacitinib activity, could not be used to support dose selection.
E. Comparability of Phase 2 and Phase 3 results
The results of Phase 3 clinical trials confirmed that both 5 mg BID and 10 mg BID dose were indeed better than placebo for ACR20, ACR50, and ACR70 endpoints, and durability of effect was seen for at least one year. To check how results from Phase 2 trials, which were used to select doses for Phase 3 studies, panned out in Phase 3 trials,
3 Keisuke Maeshima et al. The JAK Inhibitor Tofacitinib Regulates Synovitis Through Inhibition of Interferon-_ and Interleukin-17 Production by Human CD4+ T Cells. Arthritis and Rheumatism. Vol 64, No 6, June 2012, pp 1790-1798
NDA203214 Page 56 of 158 Clinical Pharmacology Review_NDA203214.doc
Reference ID: 3149379
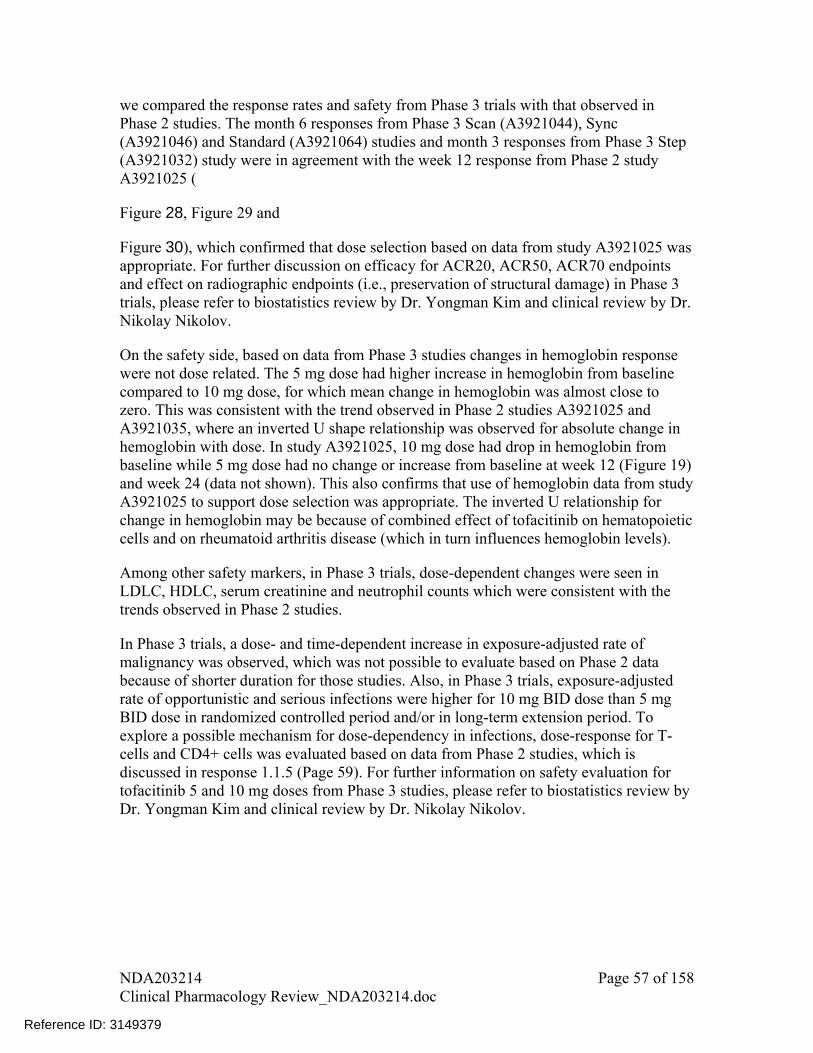
we compared the response rates and safety from Phase 3 trials with that observed in Phase 2 studies. The month 6 responses from Phase 3 Scan (A3921044), Sync (A3921046) and Standard (A3921064) studies and month 3 responses from Phase 3 Step (A3921032) study were in agreement with the week 12 response from Phase 2 study A3921025 (
Figure 28, Figure 29 and
Figure 30), which confirmed that dose selection based on data from study A3921025 was appropriate. For further discussion on efficacy for ACR20, ACR50, ACR70 endpoints and effect on radiographic endpoints (i.e., preservation of structural damage) in Phase 3 trials, please refer to biostatistics review by Dr. Yongman Kim and clinical review by Dr. Nikolay Nikolov.
On the safety side, based on data from Phase 3 studies changes in hemoglobin response were not dose related. The 5 mg dose had higher increase in hemoglobin from baseline compared to 10 mg dose, for which mean change in hemoglobin was almost close to zero. This was consistent with the trend observed in Phase 2 studies A3921025 and A3921035, where an inverted U shape relationship was observed for absolute change in hemoglobin with dose. In study A3921025, 10 mg dose had drop in hemoglobin from baseline while 5 mg dose had no change or increase from baseline at week 12 (Figure 19) and week 24 (data not shown). This also confirms that use of hemoglobin data from study A3921025 to support dose selection was appropriate. The inverted U relationship for change in hemoglobin may be because of combined effect of tofacitinib on hematopoietic cells and on rheumatoid arthritis disease (which in turn influences hemoglobin levels).
Among other safety markers, in Phase 3 trials, dose-dependent changes were seen in LDLC, HDLC, serum creatinine and neutrophil counts which were consistent with the trends observed in Phase 2 studies.
In Phase 3 trials, a dose- and time-dependent increase in exposure-adjusted rate of malignancy was observed, which was not possible to evaluate based on Phase 2 data because of shorter duration for those studies. Also, in Phase 3 trials, exposure-adjusted rate of opportunistic and serious infections were higher for 10 mg BID dose than 5 mg BID dose in randomized controlled period and/or in long-term extension period. To explore a possible mechanism for dose-dependency in infections, dose-response for T-cells and CD4+ cells was evaluated based on data from Phase 2 studies, which is discussed in response 1.1.5 (Page 59). For further information on safety evaluation for tofacitinib 5 and 10 mg doses from Phase 3 studies, please refer to biostatistics review by Dr. Yongman Kim and clinical review by Dr. Nikolay Nikolov.
NDA203214 Page 57 of 158 Clinical Pharmacology Review_NDA203214.doc
Reference ID: 3149379
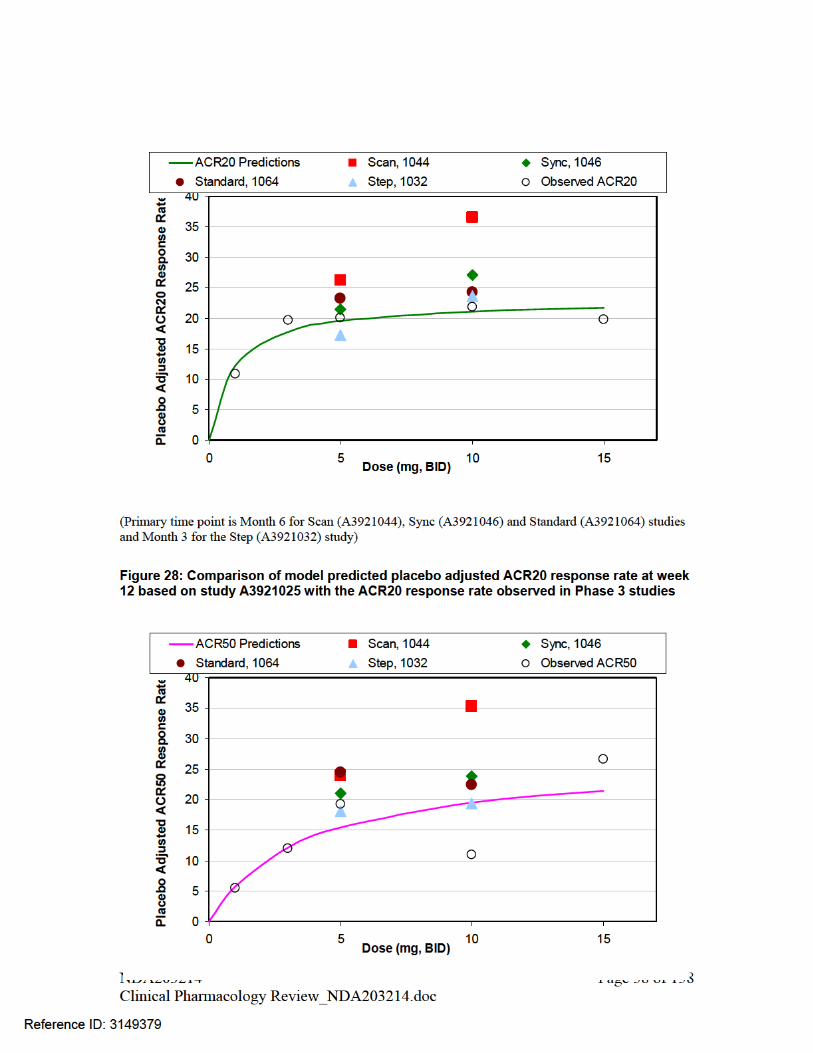

JAK1/JAK3 inhibitory effect. CD4+ T cell counts were chosen because the pattern of infections was similar to the acquired T-cell immunodeficiency, which is manifested by deficiency in CD4+ cell counts. Dose-response relationships were visually assessed via box plots of percent change from baseline in cell counts at the end of the treatment period.
CD3+ cell counts were measured in three Phase 2 studies, A3921019, A3921025 and A3921035. No trend of dose-dependency was observed for % change from baseline in CD3+ cell counts across doses ranging from 0 to 30 mg (Figure 31).
Figure 31: Percent change from baseline in CD3+ counts in RA patients
(Source: Figure S1, study report-pmar-00187/Page 6)
CD4+ cell counts were only collected in two Phase 2 studies, A3921019 and A3921035. Change from baseline in CD4+ cell counts across different dose levels following 6 weeks and 24 weeks treatment with tofacitinib are shown in Figure 32. No trend of dose-dependent change in CD4+ counts from baseline was observed, suggesting that CD4+ counts may not be used to discriminate between doses and support dose selection. In fact visual comparison of spread from trial A3921035 shows that the percent decline from baseline in CD4+ cell count was larger for 5 mg BID dose group than the 10 mg BID dose group, which is opposite to the trend observed for opportunistic infections. These results indicate a functional rather than cytotoxic effect of tofacitinib on CD4+ T cells and also do not support the laboratory monitoring of CD4+ cell counts in clinical setting.
NDA203214 Page 60 of 158 Clinical Pharmacology Review_NDA203214.doc
Reference ID: 3149379
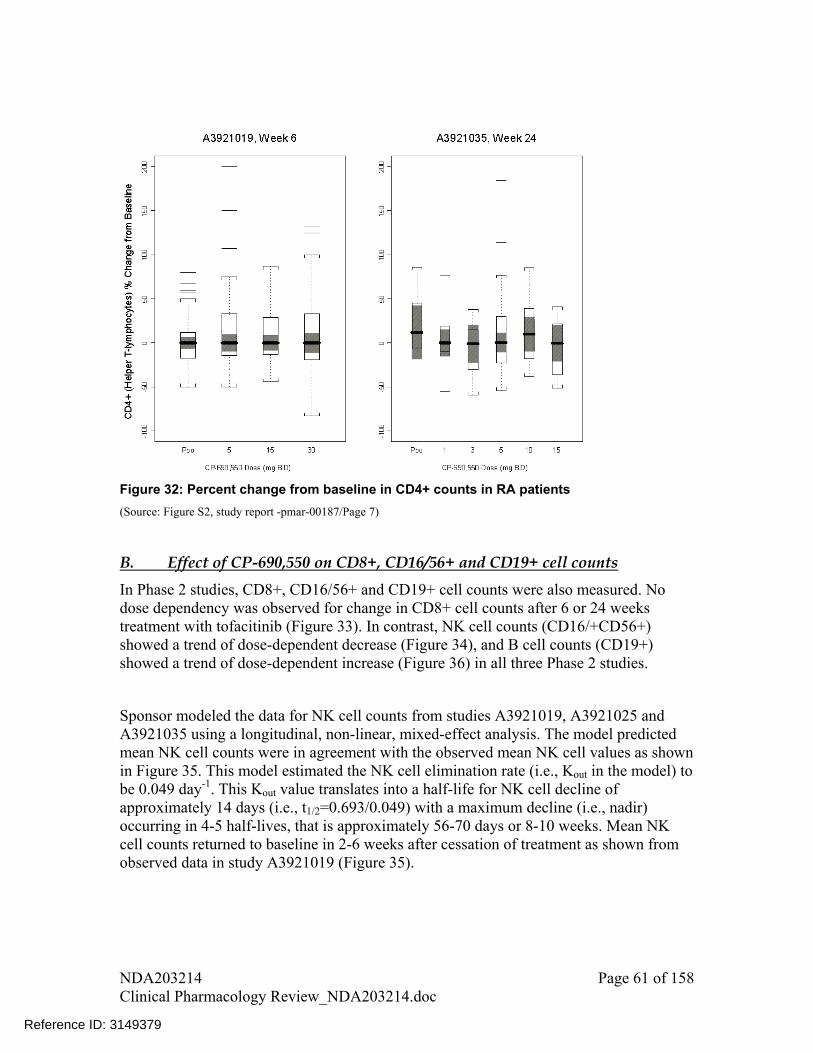
Figure 32: Percent change from baseline in CD4+ counts in RA patients
(Source: Figure S2, study report -pmar-00187/Page 7)
B. Effect of CP-690,550 on CD8+, CD16/56+ and CD19+ cell counts
In Phase 2 studies, CD8+, CD16/56+ and CD19+ cell counts were also measured. No dose dependency was observed for change in CD8+ cell counts after 6 or 24 weeks treatment with tofacitinib (Figure 33). In contrast, NK cell counts (CD16/+CD56+) showed a trend of dose-dependent decrease (Figure 34), and B cell counts (CD19+) showed a trend of dose-dependent increase (Figure 36) in all three Phase 2 studies.
Sponsor modeled the data for NK cell counts from studies A3921019, A3921025 and A3921035 using a longitudinal, non-linear, mixed-effect analysis. The model predicted mean NK cell counts were in agreement with the observed mean NK cell values as shown in Figure 35. This model estimated the NK cell elimination rate (i.e., Kout in the model) to be 0.049 day-1. This Kout value translates into a half-life for NK cell decline of approximately 14 days (i.e., t1/2=0.693/0.049) with a maximum decline (i.e., nadir) occurring in 4-5 half-lives, that is approximately 56-70 days or 8-10 weeks. Mean NK cell counts returned to baseline in 2-6 weeks after cessation of treatment as shown from observed data in study A3921019 (Figure 35).
NDA203214 Page 61 of 158 Clinical Pharmacology Review_NDA203214.doc
Reference ID: 3149379
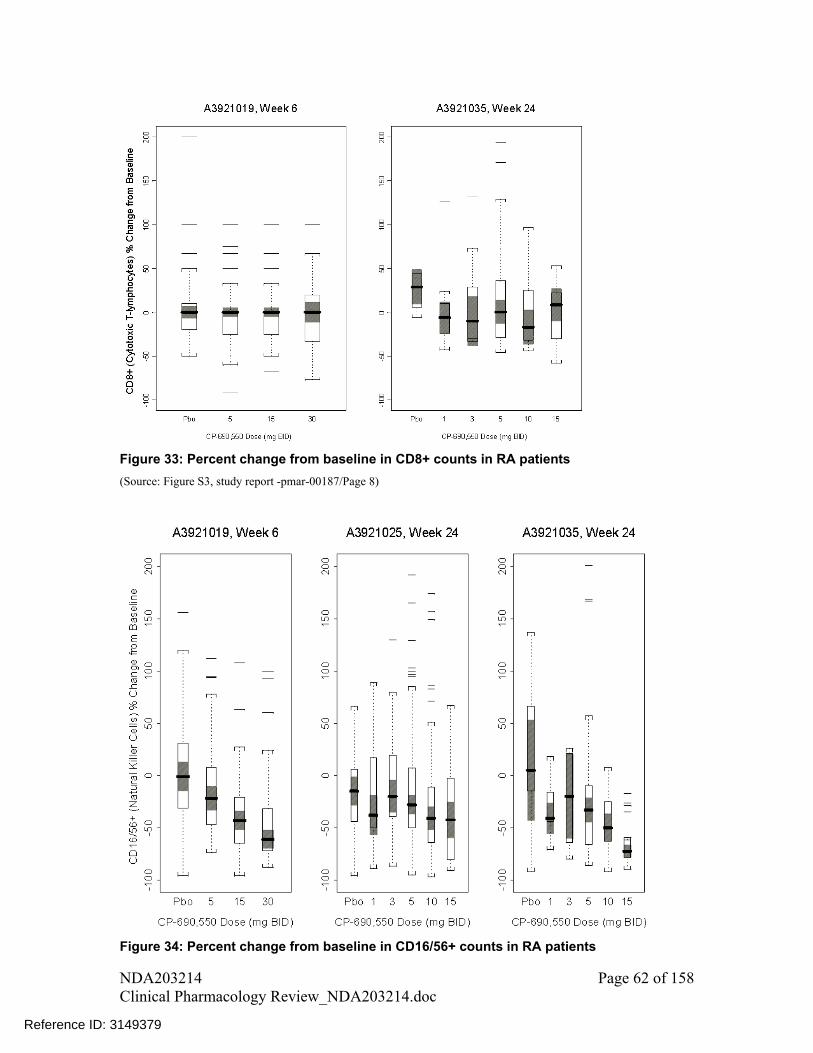
Figure 33: Percent change from baseline in CD8+ counts in RA patients
(Source: Figure S3, study report -pmar-00187/Page 8)
Figure 34: Percent change from baseline in CD16/56+ counts in RA patients
NDA203214 Page 62 of 158 Clinical Pharmacology Review_NDA203214.doc
Reference ID: 3149379
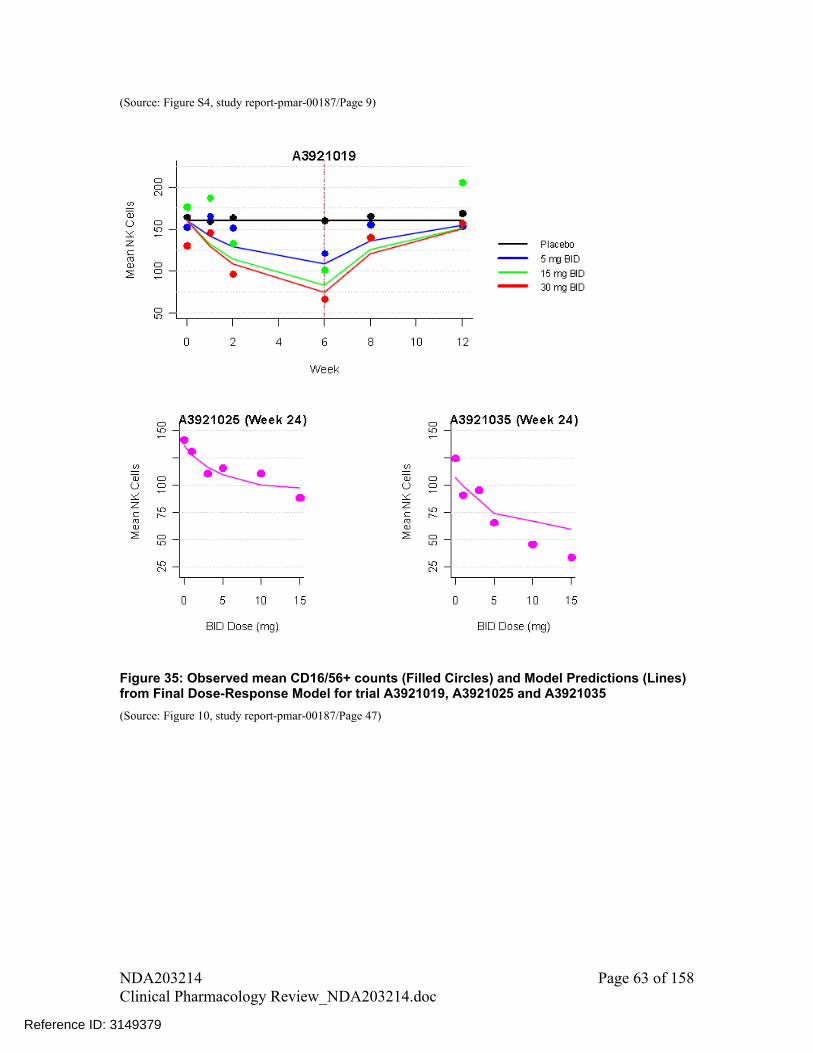
(Source: Figure S4, study report-pmar-00187/Page 9)
Figure 35: Observed mean CD16/56+ counts (Filled Circles) and Model Predictions (Lines) from Final Dose-Response Model for trial A3921019, A3921025 and A3921035
(Source: Figure 10, study report-pmar-00187/Page 47)
NDA203214 Page 63 of 158 Clinical Pharmacology Review_NDA203214.doc
Reference ID: 3149379
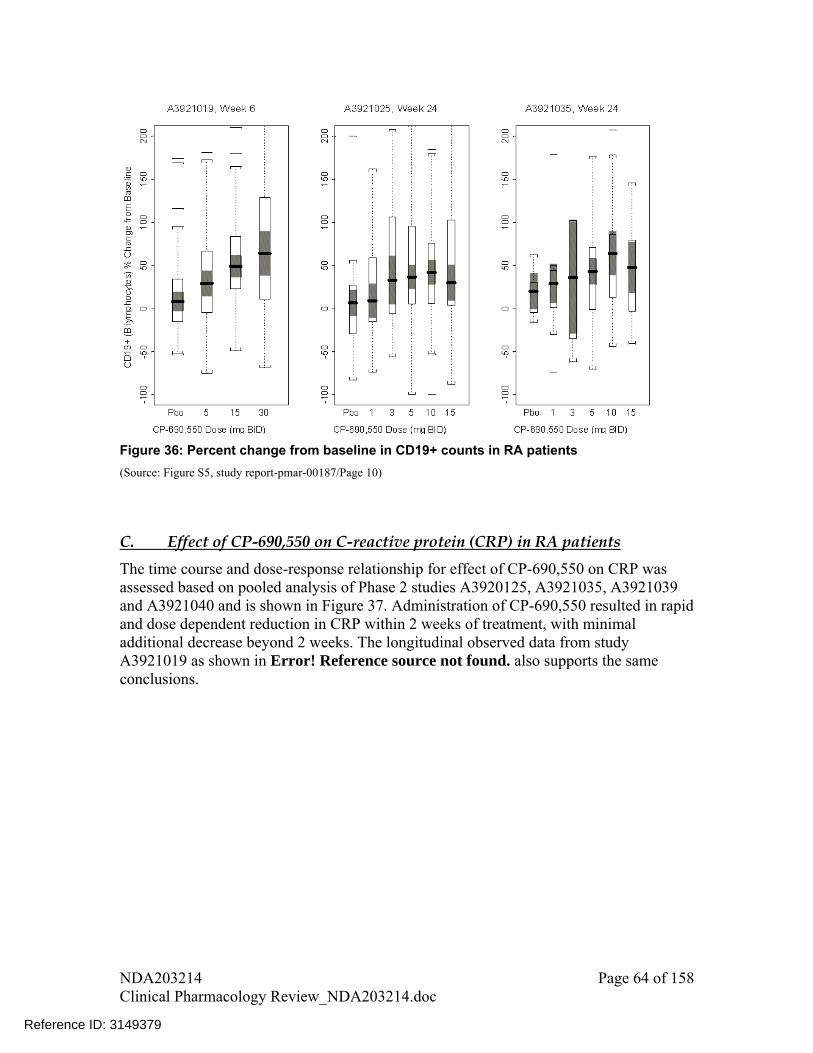
Figure 36: Percent change from baseline in CD19+ counts in RA patients
(Source: Figure S5, study report-pmar-00187/Page 10)
C. Effect of CP-690,550 on C-reactive protein (CRP) in RA patients
The time course and dose-response relationship for effect of CP-690,550 on CRP was assessed based on pooled analysis of Phase 2 studies A3920125, A3921035, A3921039 and A3921040 and is shown in Figure 37. Administration of CP-690,550 resulted in rapid and dose dependent reduction in CRP within 2 weeks of treatment, with minimal additional decrease beyond 2 weeks. The longitudinal observed data from study A3921019 as shown in Error! Reference source not found. also supports the same conclusions.
NDA203214 Page 64 of 158 Clinical Pharmacology Review_NDA203214.doc
Reference ID: 3149379

Figure 37: Effect of CP-690,550 on CRP in RA Patients Based on Pooled Analysis of Phase 2 Studies A3920125, A3921035, A3921039 and A3921040
(Source: Figure 1, study report-pmar-00223/Appendix 10/Page 110)
D. Effect of CP-690,550 on serum IgG, IgM, IgA antibodies in RA patients
A decline was observed in serum antibodies, IgG, IgM, and IgA, following treatment with tofacitinib for 24 weeks compared to placebo in study A3921025; however, these changes were small and not dose-dependent (Figure 38, Figure 39, Figure 40).
NDA203214 Page 65 of 158 Clinical Pharmacology Review_NDA203214.doc
Reference ID: 3149379
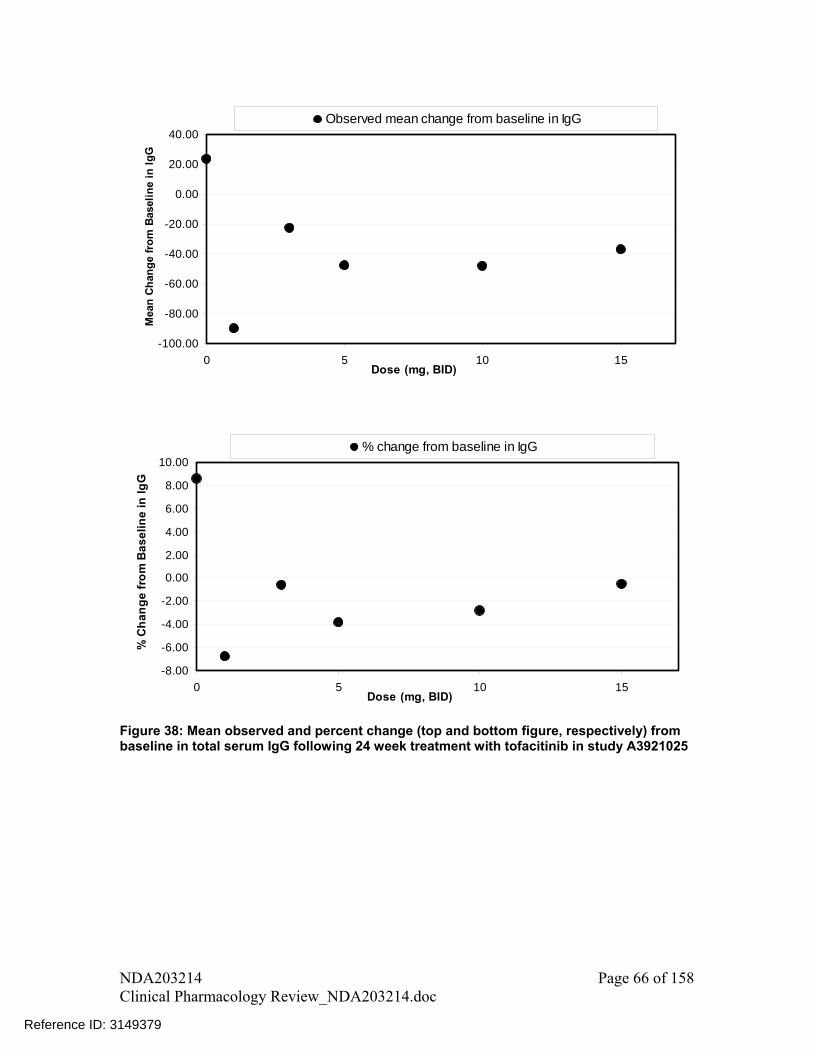
-100.00
-80.00
-60.00
-40.00
-20.00
0.00
20.00
40.00
0 5 10 15Dose (mg, BID)
Mea
n C
han
ge
fro
m B
asel
ine
in I
gG
Observed mean change from baseline in IgG
-8.00
-6.00
-4.00
-2.00
0.00
2.00
4.00
6.00
8.00
10.00
0 5 10 15Dose (mg, BID)
% C
ha
ng
e f
rom
Ba
se
lin
e i
n I
gG
% change from baseline in IgG
Figure 38: Mean observed and percent change (top and bottom figure, respectively) from baseline in total serum IgG following 24 week treatment with tofacitinib in study A3921025
NDA203214 Page 66 of 158 Clinical Pharmacology Review_NDA203214.doc
Reference ID: 3149379

-20.00
-15.00
-10.00
-5.00
0.00
5.00
0 5 10 15Dose (mg, BID)
Mea
n C
han
ge
fro
m B
asel
ine
in I
gM
Observed mean change from baseline in IgM
-8.00
-6.00
-4.00
-2.00
0.00
2.00
4.00
6.00
8.00
0 5 10 15Dose (mg, BID)
% C
han
ge
fro
m B
asel
ine
in I
gM
% change from baseline in IgM
Figure 39: Mean observed and percent change (top and bottom figure, respectively) from baseline in total serum IgM following 24 week treatment with tofacitinib in study A3921025
NDA203214 Page 67 of 158 Clinical Pharmacology Review_NDA203214.doc
Reference ID: 3149379

-50.00
-45.00
-40.00
-35.00
-30.00
-25.00
-20.00
-15.00
-10.00
-5.00
0.00
0 5 10 15Dose (mg, BID)
Mea
n C
han
ge
fro
m B
asel
ine
in I
gA
Observed mean change from baseline in IgA
-15.00
-10.00
-5.00
0.00
5.00
10.00
0 5 10 15Dose (mg, BID)
% C
han
ge
fro
m B
asel
ine
in I
gA
% change from baseline in IgA
Figure 40: Mean observed and percent change (top and bottom figure, respectively) from baseline in total serum IgA following 24 week treatment with tofacitinib in study A3921025
1.2. Recommendations
NA
1.3. Label Statements
Following labeling statements are proposed in the label based on dose-response information. Labeling statements to be removed are shown in red strikethrough font and suggested labeling to be included is shown in underline blue font.
NDA203214 Page 68 of 158 Clinical Pharmacology Review_NDA203214.doc
Reference ID: 31493792 Pages Of Draft Labeling Have Been Withheld In Full As b4 (CCI/TS) Immediately
Following This Page

2. PERTINENT REGULATORY BACKGROUND
CP-690,550 is an oral, potent, selective inhibitor of the Janus kinase (JAK) family of kinases (JAK1, JAK2, JAK3, and tyrosine kinase2) with a high degree of selectivity against other kinases in the human genome.
3. RESULTS OF SPONSOR’S ANALYSIS
The objectives of sponsor’s population pharmacokinetic analysis were
• To characterize CP-690,550 PK in patients with RA.
• To identify any covariates that are important determinants of CP-690,550 exposure.
The overview of studies included in the population pharmacokinetic analysis is shown in Table 28 below.
The population pharmacokinetic analysis considered the 5 studies which comprised the Phase 2 program and included 6039 observations from 1070 patients. Doses ranged from 1 to 30 mg BID and 20 mg QD. The studies included 3 monotherapy studies (A3921019, A3921035 and A3921040) and 2 background methotrexate (MTX) studies (A3921025 and A3921039). The study population consisted of 183 males and 887 females with ages ranging from 18 to 81 years and weights ranging from 31.4 to 147 kg. There were 543 Caucasian, 19 African American, 386 Asian (360 Japanese), 107 Hispanic, and 15 subjects of Other race.
Table 28. Overview of Phase 2 Studies Used for Population PK Analysis
Source: Table 1 on page 16 in study-pmar-00178.pdf
NDA203214 Page 71 of 158 Clinical Pharmacology Review_NDA203214.doc
Reference ID: 3149379

The analysis was performed using nonlinear mixed effects modeling methodology as implemented in NONMEM® Version 7.1.2 (ICON Development Solutions, Ellicott City, MD). Models were developed on a computer grid with multiple compute nodes. Each node runs the Mac OS X operating system and utilizes the Intel® Fortran Compiler, version 11.1. Due to lack of adequate samples in the absorption phase, sponsor analyzed the data using the NONMEM subroutine ADVAN1 TRANS2 with the inclusion of a zero-order absorption duration (D1) parameter. Figure 41 Error! Reference source not found.shows the observed concentrations versus time stratified by dose for four of five studies. Plasma concentrations were sampled at various times throughout the dosing interval, with a majority of data points observed within 4 hours of dosing and another large grouping of sampling times between 10 and 14 hours
NDA203214 Page 72 of 158 Clinical Pharmacology Review_NDA203214.doc
Reference ID: 3149379

Figure 41: Observed CP-690,550 Concentrations versus Actual Time After Dose. Plots are presented for each study, stratified by CP-690,550 dose (mg)
(Source: adapted from Figure 1 on page 27 from study-pmar-00178.pdf)
NDA203214 Page 73 of 158 Clinical Pharmacology Review_NDA203214.doc
Reference ID: 3149379

The base one-compartment model provided an adequate description of the data, as judged by visual inspection of diagnostic plots. The base model structural parameter estimates, presented in Table 29, were relatively precise. The typical estimates of CL/F and V/F from the base model were 20.6 L/h and 90.2 L with relative standard errors of < 2%. The zero-order absorption duration was 0.339 h with a relative standard error of 13.5%. Between-patient variability estimates for CL/F and V/F were 30.8% and 30.1% (coefficient of variation), respectively. Inter-occasion (or within-patient) variability in F was 22.9%. Residual variability in pre-dose and non-pre-dose concentrations were estimated to be 68.3% and 34.4%, respectively. Shrinkage estimates from the base model were 24.4% for CL/F and 31.4% for V/F random effects.
Table 29. Parameter Estimates from CP690,550 Base Population Pharmacokinetic Model (Run 500)
Source: Table 6 on page 28 from study-pmar-00178.pdf
After the base model was developed, a separate model was constructed using the base model as a starting point with a separate CL/F term estimated for each study occasion. This was conducted to determine if CP-690,550 CL/F is time-dependent (e.g., auto-induction or inhibition of CL/F). CL/F estimates by study week are shown in Figure 42. Although some variation in CL/F is evident across study weeks, CL/F estimates were generally equivalent over time within each study. CL/F estimates were also consistent
NDA203214 Page 74 of 158 Clinical Pharmacology Review_NDA203214.doc
Reference ID: 3149379
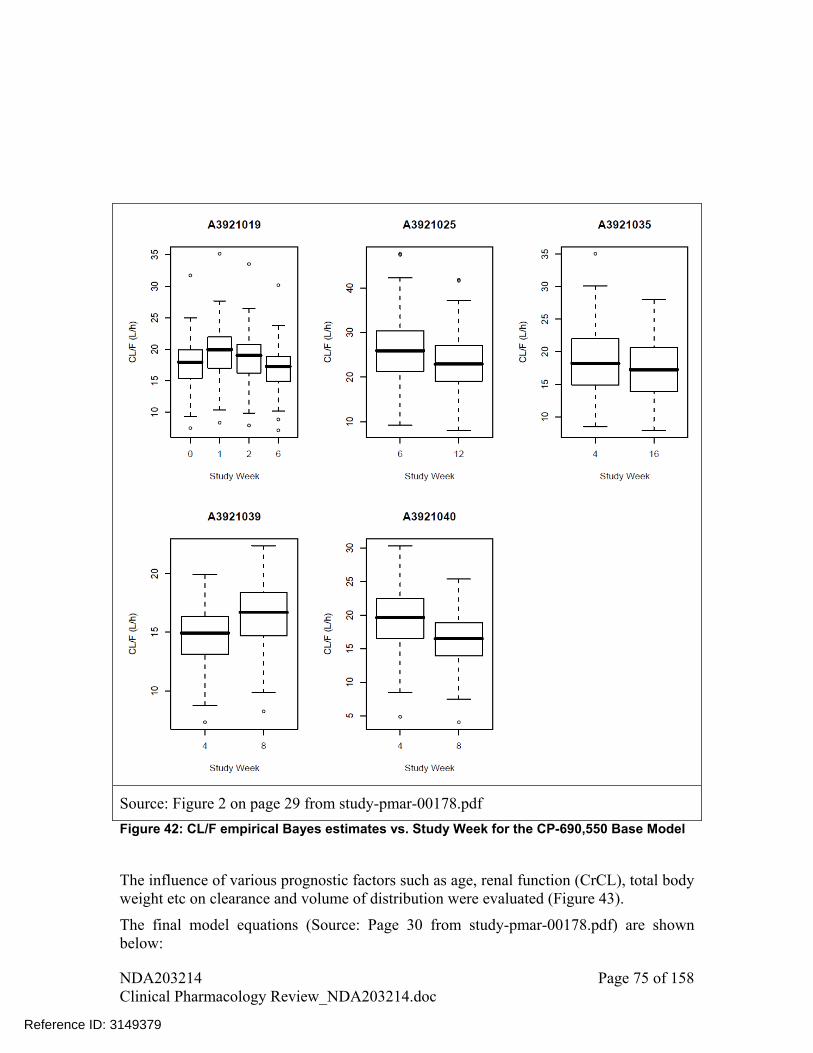
Source: Figure 2 on page 29 from study-pmar-00178.pdf
Figure 42: CL/F empirical Bayes estimates vs. Study Week for the CP-690,550 Base Model
The influence of various prognostic factors such as age, renal function (CrCL), total body weight etc on clearance and volume of distribution were evaluated (Figure 43).
The final model equations (Source: Page 30 from study-pmar-00178.pdf) are shown below:
NDA203214 Page 75 of 158 Clinical Pharmacology Review_NDA203214.doc
Reference ID: 3149379

Parameter estimates from the final model are presented in Table 30. The typical estimates (90% CI) of PK model parameters for the reference covariate effects (Caucasian, Male, 70 kg, 55 years, CRCL ≥ 80 mL/min, non-study A3921025) were 18.4 (16.1, 23.0) L/h, 96.0 (92.4, 101) L and 0.352 (0.267, 0.408) h, for CL/F, V/F, and D1, respectively. Inter-individual variability (% CV) was reduced for CL/F (26.6%)) and V/F (26.0%) in the final model compared to the base model CL/F (30.8%) and V/F (30.1%) variance estimates.
NDA203214 Page 76 of 158 Clinical Pharmacology Review_NDA203214.doc
Reference ID: 3149379

Table 30. Parameter Estimates from CP690,550 Final Population Pharmacokinetic Model (Run 502)
Source: Table 7 on page 32 from study-pmar-00178.pdf
The covariate parameter estimates are shown in Table 31. The 90% CI’s for body weight, age, gender, and race (African American, Hispanic, and Asian) effects on CL/F were not distinguishable from the null value.
Table 31. Covariate Parameter Estimates from the CP-690,550 Full Population Pharmacokinetic Model (Run 502).
Source: Table 8 on page 35 from study-pmar-00178.pdf
NDA203214 Page 77 of 158 Clinical Pharmacology Review_NDA203214.doc
Reference ID: 3149379
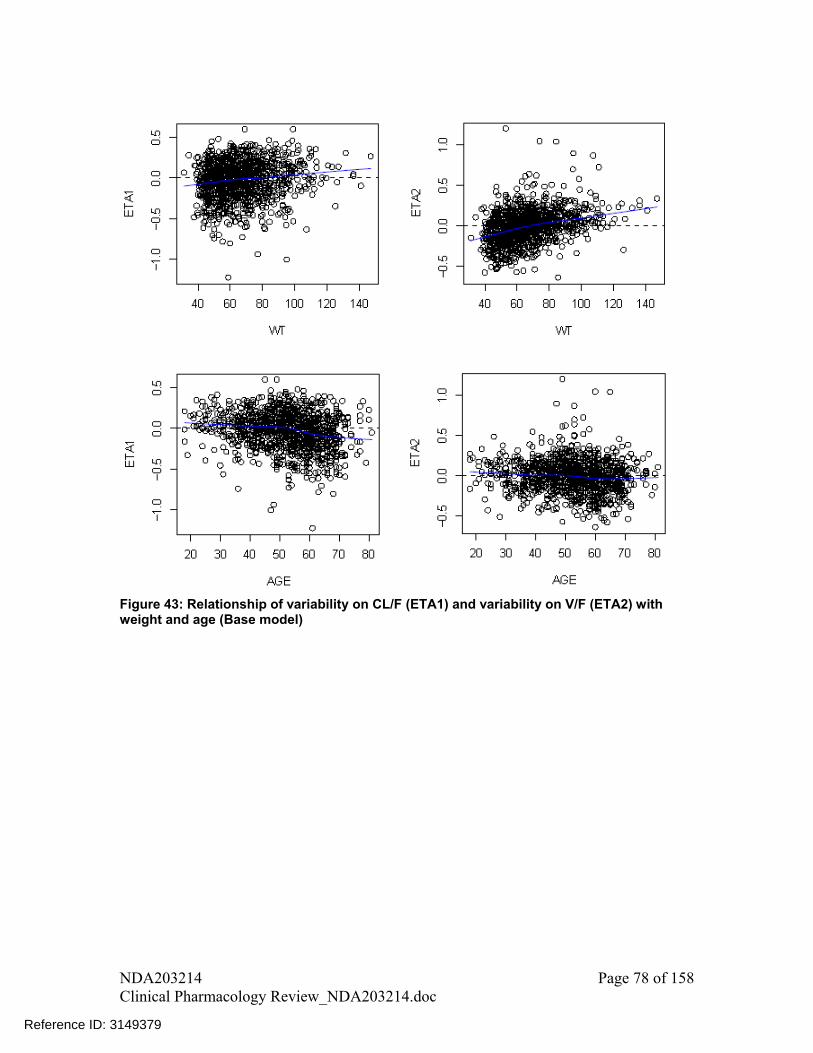
Figure 43: Relationship of variability on CL/F (ETA1) and variability on V/F (ETA2) with weight and age (Base model)
NDA203214 Page 78 of 158 Clinical Pharmacology Review_NDA203214.doc
Reference ID: 3149379
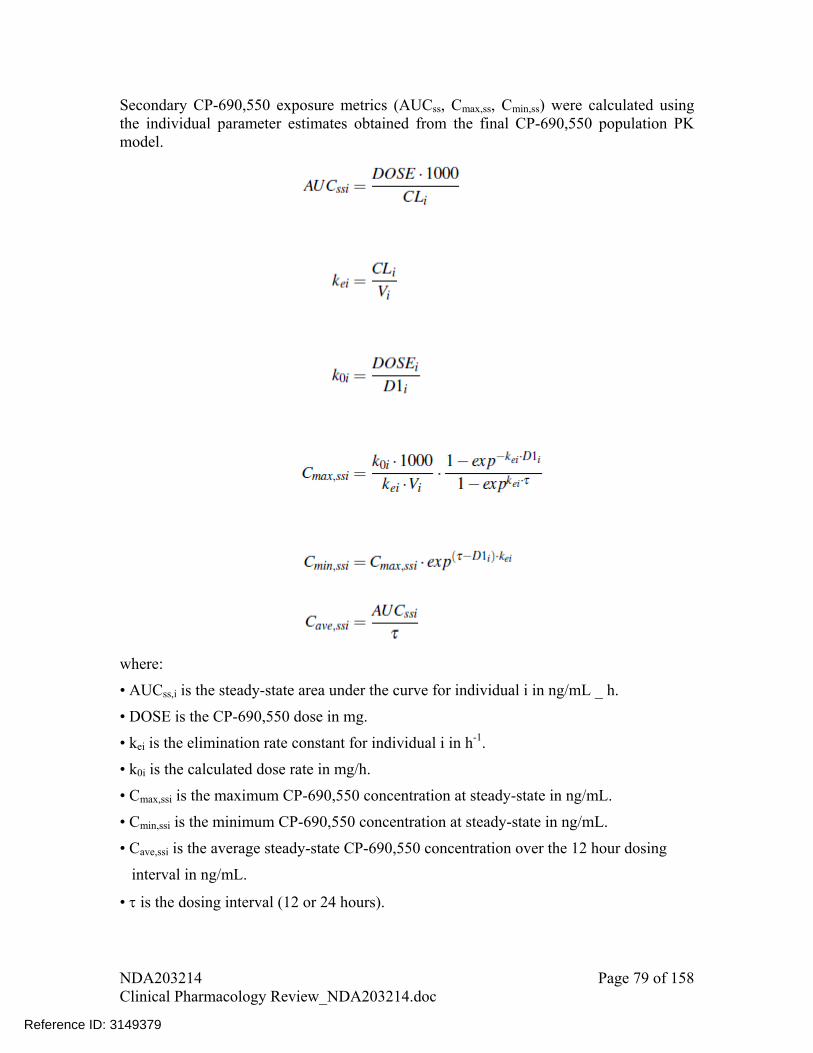
Secondary CP-690,550 exposure metrics (AUCss, Cmax,ss, Cmin,ss) were calculated using the individual parameter estimates obtained from the final CP-690,550 population PK model.
where:
• AUCss,i is the steady-state area under the curve for individual i in ng/mL _ h.
• DOSE is the CP-690,550 dose in mg.
• kei is the elimination rate constant for individual i in h-1.
• k0i is the calculated dose rate in mg/h.
• Cmax,ssi is the maximum CP-690,550 concentration at steady-state in ng/mL.
• Cmin,ssi is the minimum CP-690,550 concentration at steady-state in ng/mL.
• Cave,ssi is the average steady-state CP-690,550 concentration over the 12 hour dosing
interval in ng/mL.
• is the dosing interval (12 or 24 hours).
NDA203214 Page 79 of 158 Clinical Pharmacology Review_NDA203214.doc
Reference ID: 3149379
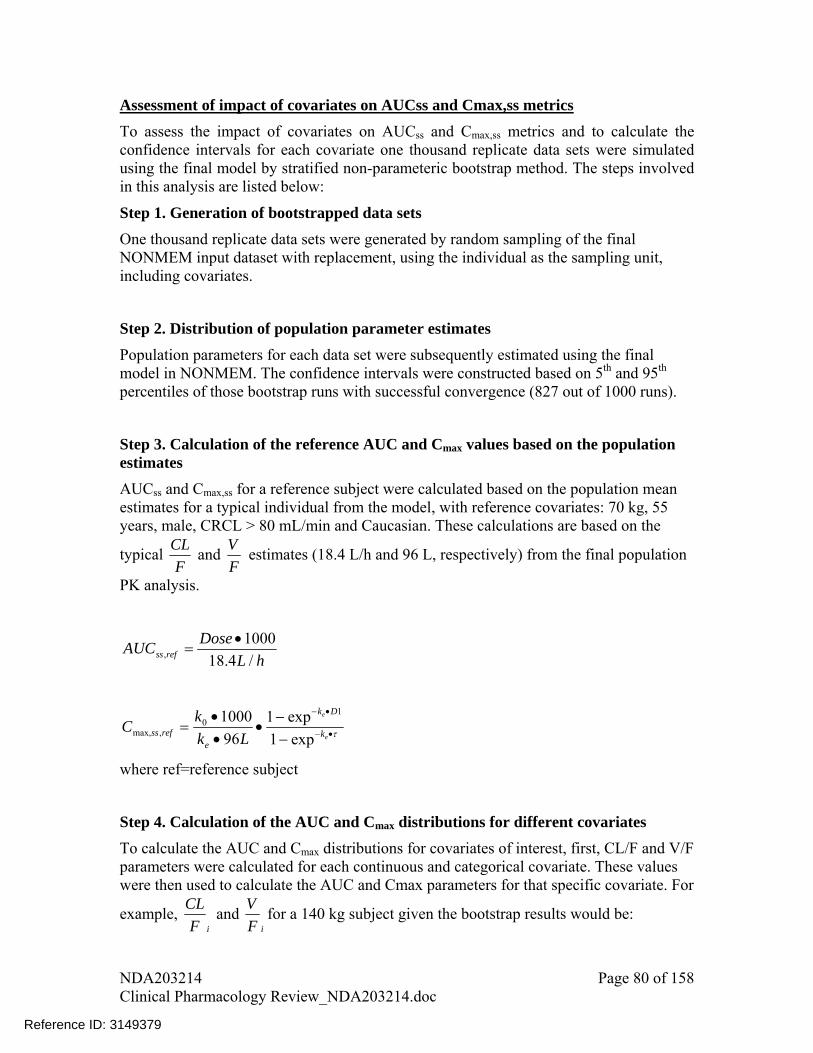
Assessment of impact of covariates on AUCss and Cmax,ss metrics
To assess the impact of covariates on AUCss and Cmax,ss metrics and to calculate the confidence intervals for each covariate one thousand replicate data sets were simulated using the final model by stratified non-parameteric bootstrap method. The steps involved in this analysis are listed below:
Step 1. Generation of bootstrapped data sets
One thousand replicate data sets were generated by random sampling of the final NONMEM input dataset with replacement, using the individual as the sampling unit, including covariates.
Step 2. Distribution of population parameter estimates
Population parameters for each data set were subsequently estimated using the final model in NONMEM. The confidence intervals were constructed based on 5th and 95th percentiles of those bootstrap runs with successful convergence (827 out of 1000 runs).
Step 3. Calculation of the reference AUC and Cmax values based on the population estimates
AUCss and Cmax,ss for a reference subject were calculated based on the population mean estimates for a typical individual from the model, with reference covariates: 70 kg, 55 years, male, CRCL > 80 mL/min and Caucasian. These calculations are based on the
typical F
CL and
F
V estimates (18.4 L/h and 96 L, respectively) from the final population
PK analysis.
hL
DoseAUC refss /4.18
1000,
e
e
k
Dk
erefss Lk
kC
exp1
exp1
96
1000 10
,max,
where ref=reference subject
Step 4. Calculation of the AUC and Cmax distributions for different covariates
To calculate the AUC and Cmax distributions for covariates of interest, first, CL/F and V/F parameters were calculated for each continuous and categorical covariate. These values were then used to calculate the AUC and Cmax parameters for that specific covariate. For
example, iF
CL and
iF
Vfor a 140 kg subject given the bootstrap results would be:
NDA203214 Page 80 of 158 Clinical Pharmacology Review_NDA203214.doc
Reference ID: 3149379

iCL
kg
kg
F
CL
F
CL
iikg
,
70
140
,140
iV
kg
kg
F
V
F
V
iikg
,
70
140
,140
These ikgF
CL
,140
and ikgF
V
,140
were then used to calculate AUC and Cmax parameters for
that specific covariate.
AUCss, 140kg, i = Dose • 1000
ikgF
CL
,140
Cmax,ss, 140kg, i = k0 • 1000 • 1- exp-ke•D1
ke • ikgF
V
,140
1- exp-ke•
For categorical covariates (e.g. gender), the parameter values were simply calculated using the effect coefficient () as shown below.
femaleiCL
iifemale F
CL
F
CL,
,
femaleiCL
iifemale F
V
F
V,
,
These ifemaleF
CL
,
and ifemaleF
V
,
were then used to calculate AUC and Cmax parameters for
that specific covariate.
NDA203214 Page 81 of 158 Clinical Pharmacology Review_NDA203214.doc
Reference ID: 3149379
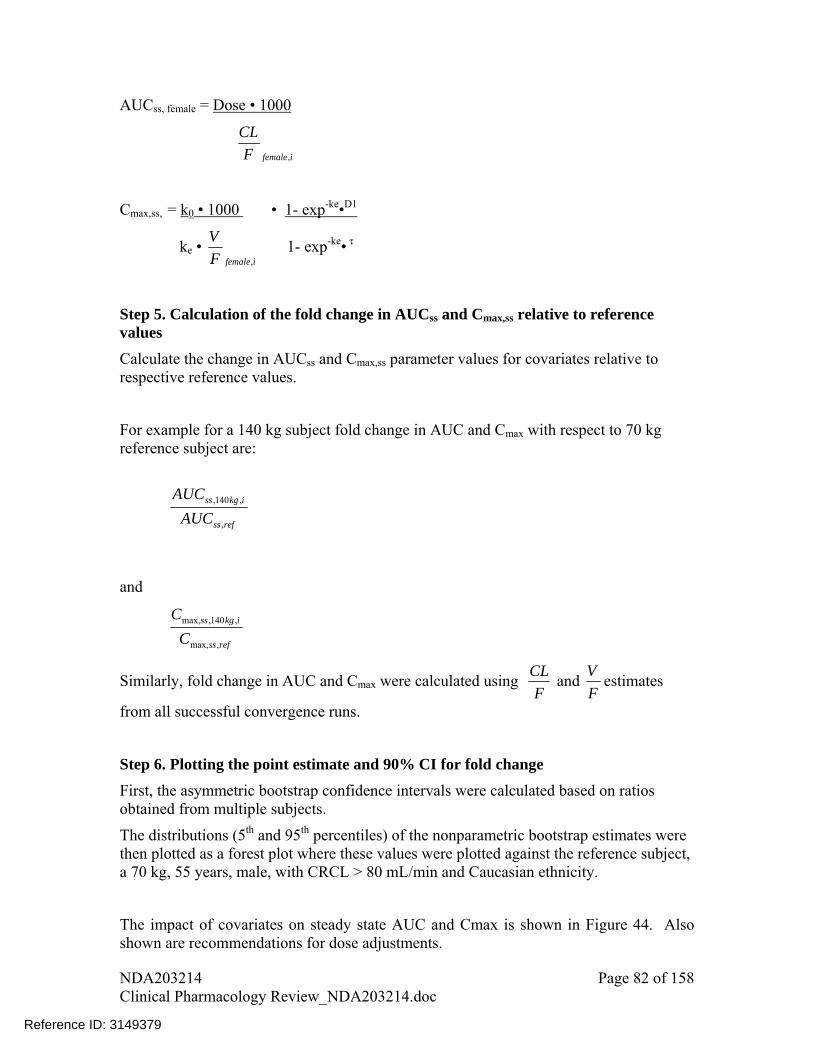
AUCss, female = Dose • 1000
ifemaleF
CL
,
Cmax,ss, = k0 • 1000 • 1- exp-ke•D1
ke • ifemaleF
V
,
1- exp-ke•
Step 5. Calculation of the fold change in AUCss and Cmax,ss relative to reference values
Calculate the change in AUCss and Cmax,ss parameter values for covariates relative to respective reference values.
For example for a 140 kg subject fold change in AUC and Cmax with respect to 70 kg reference subject are:
refss
ikgss
AUC
AUC
,
,140,
and
refss
ikgss
C
C
,max,
,140,max,
Similarly, fold change in AUC and Cmax were calculated using F
CL and
F
Vestimates
from all successful convergence runs.
Step 6. Plotting the point estimate and 90% CI for fold change
First, the asymmetric bootstrap confidence intervals were calculated based on ratios obtained from multiple subjects.
The distributions (5th and 95th percentiles) of the nonparametric bootstrap estimates were then plotted as a forest plot where these values were plotted against the reference subject, a 70 kg, 55 years, male, with CRCL > 80 mL/min and Caucasian ethnicity.
The impact of covariates on steady state AUC and Cmax is shown in Figure 44. Also shown are recommendations for dose adjustments.
NDA203214 Page 82 of 158 Clinical Pharmacology Review_NDA203214.doc
Reference ID: 3149379

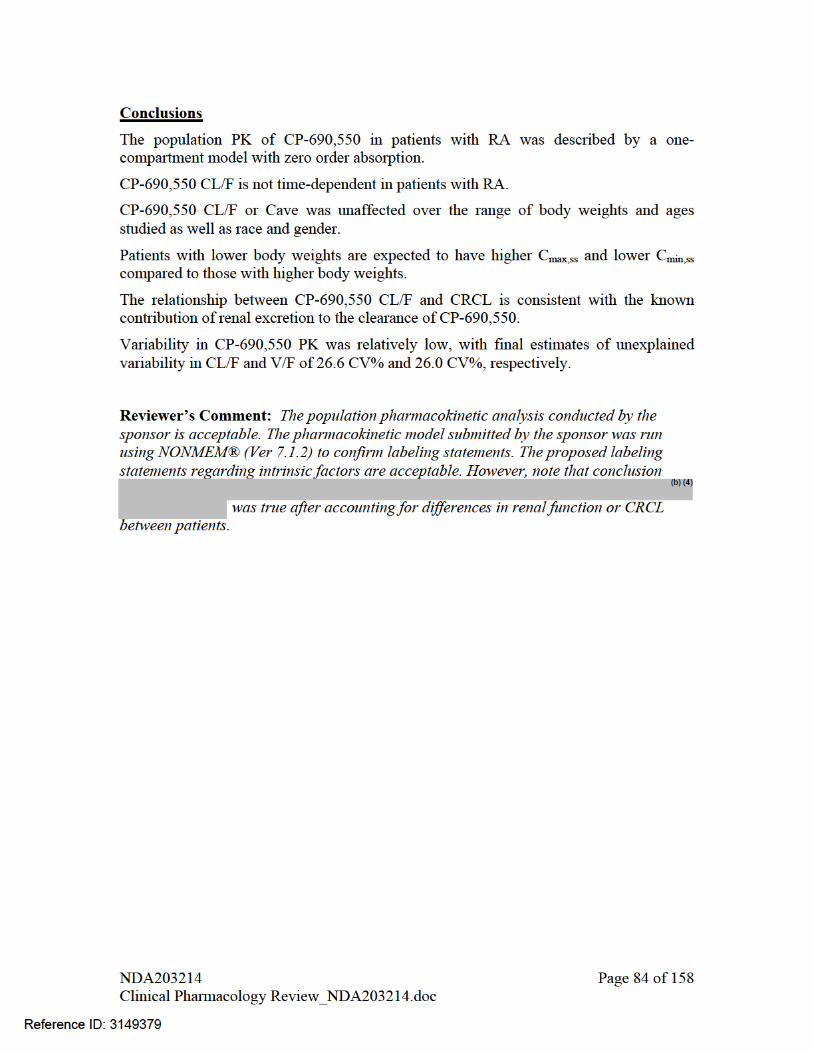
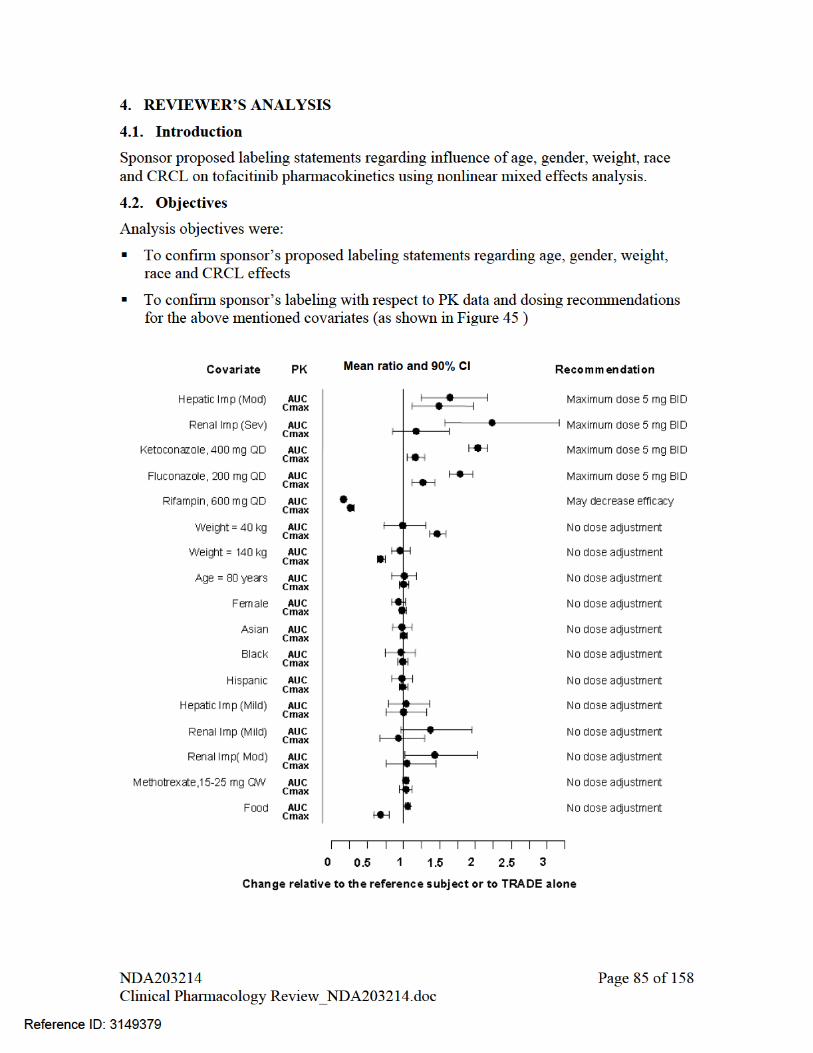
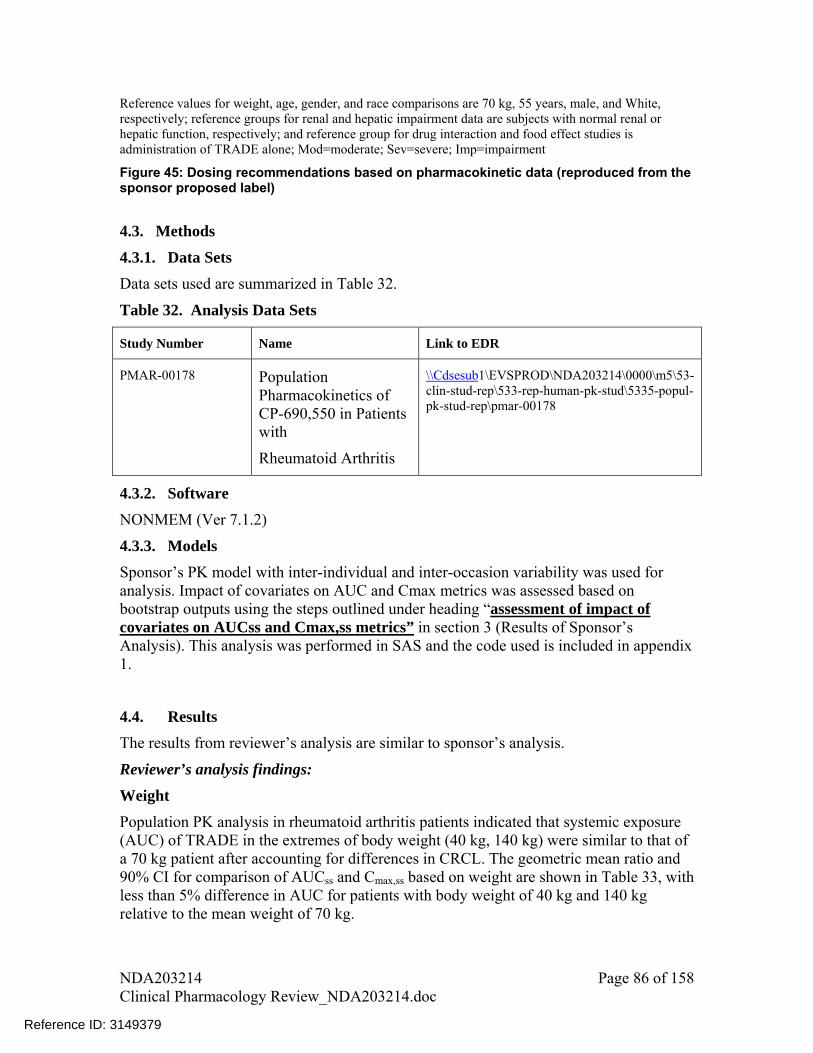
Reference values for weight, age, gender, and race comparisons are 70 kg, 55 years, male, and White, respectively; reference groups for renal and hepatic impairment data are subjects with normal renal or hepatic function, respectively; and reference group for drug interaction and food effect studies is administration of TRADE alone; Mod=moderate; Sev=severe; Imp=impairment
Figure 45: Dosing recommendations based on pharmacokinetic data (reproduced from the sponsor proposed label)
4.3. Methods
4.3.1. Data Sets
Data sets used are summarized in Table 32.
Table 32. Analysis Data Sets
Study Number Name Link to EDR
Population Pharmacokinetics of CP-690,550 in Patients with
PMAR-00178 \\Cdsesub1\EVSPROD\NDA203214\0000\m5\53-clin-stud-rep\533-rep-human-pk-stud\5335-popul-pk-stud-rep\pmar-00178
Rheumatoid Arthritis
4.3.2. Software
NONMEM (Ver 7.1.2)
4.3.3. Models
Sponsor’s PK model with inter-individual and inter-occasion variability was used for analysis. Impact of covariates on AUC and Cmax metrics was assessed based on bootstrap outputs using the steps outlined under heading “assessment of impact of covariates on AUCss and Cmax,ss metrics” in section 3 (Results of Sponsor’s Analysis). This analysis was performed in SAS and the code used is included in appendix 1.
4.4. Results
The results from reviewer’s analysis are similar to sponsor’s analysis.
Reviewer’s analysis findings:
Weight
Population PK analysis in rheumatoid arthritis patients indicated that systemic exposure (AUC) of TRADE in the extremes of body weight (40 kg, 140 kg) were similar to that of a 70 kg patient after accounting for differences in CRCL. The geometric mean ratio and 90% CI for comparison of AUCss and Cmax,ss based on weight are shown in Table 33, with less than 5% difference in AUC for patients with body weight of 40 kg and 140 kg relative to the mean weight of 70 kg.
NDA203214 Page 86 of 158 Clinical Pharmacology Review_NDA203214.doc
Reference ID: 3149379

An approximately linear relationship between body weight and volume of distribution was observed (Figure 43), which would result in higher peak (Cmax) and lower trough (Cmin) concentrations in lighter patients. Mean Cmax for a 40 kg patient was 46% higher and for a 140 kg patient 31% lower than that of a 70 kg patient. However, these differences in Cmax were not considered important, given that 10 mg BID and 20 mg QD had similar efficacy in study A3921025. With respect to safety, safety profile for double the dose (i.e., 10 mg dose) with approximately 100% higher Cmax is known.
Age
Elderly patients age 70 years and 80 years were estimated to have <10% difference in AUC and Cmax relative to the mean age of 55 years after accounting for differences in CRCL. The geometric mean ratio and 90% CI for comparison of AUCss and Cmax,ss based on age are shown in Table 33.
Gender
Women were estimated to have 7% lower mean AUC and 2% lower mean Cmax compared to men after accounting for differences in CRCL. The geometric mean ratio and 90% CI for comparison of AUCss and Cmax,ss based on gender are shown in Table 33.
Race
The available data have also shown that there are no major differences in tofacitinib AUC and Cmax between White, Black and Asian patients after accounting for differences in CRCL. The geometric mean ratio and 90% CI for comparison of AUCss and Cmax,ss based on race are shown in Table 33.
Variability estimate for AUC
Interindividual variability (% CV) estimates from the final model was 26.6% for CL/F which would result in approximately 27% variability in AUC of tofacitinib.
Table 33: Assessment of impact of covariates on AUCss and Cmax,ss based on output from bootstrap analysis
Covariate comparison AUCss Cmax,ss
(Test vs. Reference) GMR 90%CI GMR 90% CI
Weight 140 kg vs. 70 kg 0.97 0.83-1.09 0.69 0.64-0.74
Weight 40 kg vs. 70 kg 1.01 0.73-1.30 1.46 1.36-1.57
Age 70 years vs. 55 years 0.99 0.83-1.16 1.05 0.98-1.11
NDA203214 Page 87 of 158 Clinical Pharmacology Review_NDA203214.doc
Reference ID: 3149379

Age 80 years vs. 55 years 1.00 0.83-1.18 1.08 1.01-1.15
Female vs. Male 0.93 0.83-1.02 0.98 0.93-1.03
African American vs. White 0.96 0.74-1.16 0.99 0.92-1.05
Asian vs. White 0.98 0.85-1.12 0.99 0.95-1.04
Hispanic vs. White 0.97 0.83-1.12 0.99 0.95-1.05
CRCL 40 mL/min vs. 80 mL/min 1.32 1.08-1.59 1.10 1.01-1.20
Sponsor’s analysis findings
Population PK analysis in rheumatoid arthritis patients indicated that systemic exposure (AUC) of TRADE in the extremes of body weight (40 kg, 140 kg) were similar to that of a 70 kg patient. Elderly patients 80 years of age were estimated to have less than 5% higher AUC relative to the mean age of 55 years. Women were estimated to have 7% lower AUC compared to men. The available data have also shown that there are no major differences (<5%) in TRADE AUC between White, Black and Asian patients. An approximately linear relationship between body weight and volume of distribution was observed, resulting in higher peak (Cmax) and lower trough (Cmin) concentrations in lighter patients. However, this difference is not considered to be clinically relevant. The between-subject variability (% coefficient of variation) in AUC of TRADE is estimated to be approximately 27%.
Reviewer’s comment
The labeling statement, as proposed by sponsor, regarding age, weight, gender and race effects on tofacitinib pharmacokinetics are acceptable
LISTING OF ANALYSES CODES AND OUTPUT FILES
File Name Description Location in \\cdsnas\pharmacometrics\
502mod.ctl
tasocomb.csv
502mod.lst
PK model and data set used by reviewer
P:\Reviews\Ongoing PM Reviews\Tofacitinib_NDA203214_VAB\PPK Analyses\Final Model
Output file P:\Reviews\Ongoing PM Reviews\Tofacitinib_NDA203214_VAB\PPK Analyses\Final Model\502mod nm7
NDA203214 Page 88 of 158 Clinical Pharmacology Review_NDA203214.doc
Reference ID: 3149379
Appendix 1
/* SAS Code to calculate the fold change in AUC and Cmax based on output from Bootstrap Analysis for Tofacitinib*/
NDA203214 Page 89 of 158 Clinical Pharmacology Review_NDA203214.doc
Reference ID: 3149379
(b) (4)
5 Pages Have Been Withheld In Full As b4 (CCI/TS) Immediately Following This Page

OFFICE OF CLINICAL PHARMACOLOGY GENOMICS GROUP REVIEW
NDA/BLA Number 203214 Submission Date 10/21/2011 Applicant Name Pfizer Generic Name Tofacitinib Proposed Indication Rheumatoid Arthritis Primary Reviewer Jeffrey Kraft, PhD Secondary Reviewer Mike Pacanowski, PharmD, MPH 1 Background The current submission is for tofacitinib, a potent inhibitor of JAK kinases, to be indicated for the treatment of adult patients with moderately to severely active rheumatoid arthritis who have had an inadequate response to one or more disease-modifying anti-rheumatic drugs. Tofacitinib is cleared mainly via hepatic metabolism (~70%) by CYP3A4 (primary) and CYP2C19 (secondary). The sponsor submitted summary results from a study in healthy subjects (A3921028) in which the impact of CYP2C19 genetic variation on tofacitinib exposure and clearance was investigated. The purpose of this review is to determine genetic variation within CYP2C19 have a clinically relevant impact on tofacitinib clearance. 2 Submission Contents Related to Genomics 2.1 Contents The sponsor submitted summary level data for CYP2C19 genotyping performed in a healthy volunteer study (A3921028; n=60) in order to investigate the effect of CYP2C19 variation on the exposure and clearance of tofacitinib. Subject-level genotype data were not included in the current submission. No labeling claims related to CYP2C19 genotype have been proposed. Comment: DNA was collected in Phase 2/3 clinical trials on a voluntary basis allowing for additional pharmacogenetic studies if indicated on the basis of tofacitinib’s efficacy and safety. 2.2 Methods CYP2C19 genotype and pharmacokinetic data were available from 60 healthy subjects who received a single 100 mg dose of tofacitinib as part of a QT study. Samples were processed and analyzed by Pfizer. The sponsor genotyped for the *2, *3, *4, *5, and *17 alleles of the CYP2C19 gene. The sponsor classified each subject’s metabolizer status based on genotype as follows: poor metabolizers (PMs) – *2/*2, *2/*3, or *3/*3 alleles; ultra-rapid metabolizers (UMs) – *17/*17; or extensive metabolizers (EMs) – all other
NDA203214 Page 95 of 158 Clinical Pharmacology Review_NDA203214.doc
Reference ID: 3149379
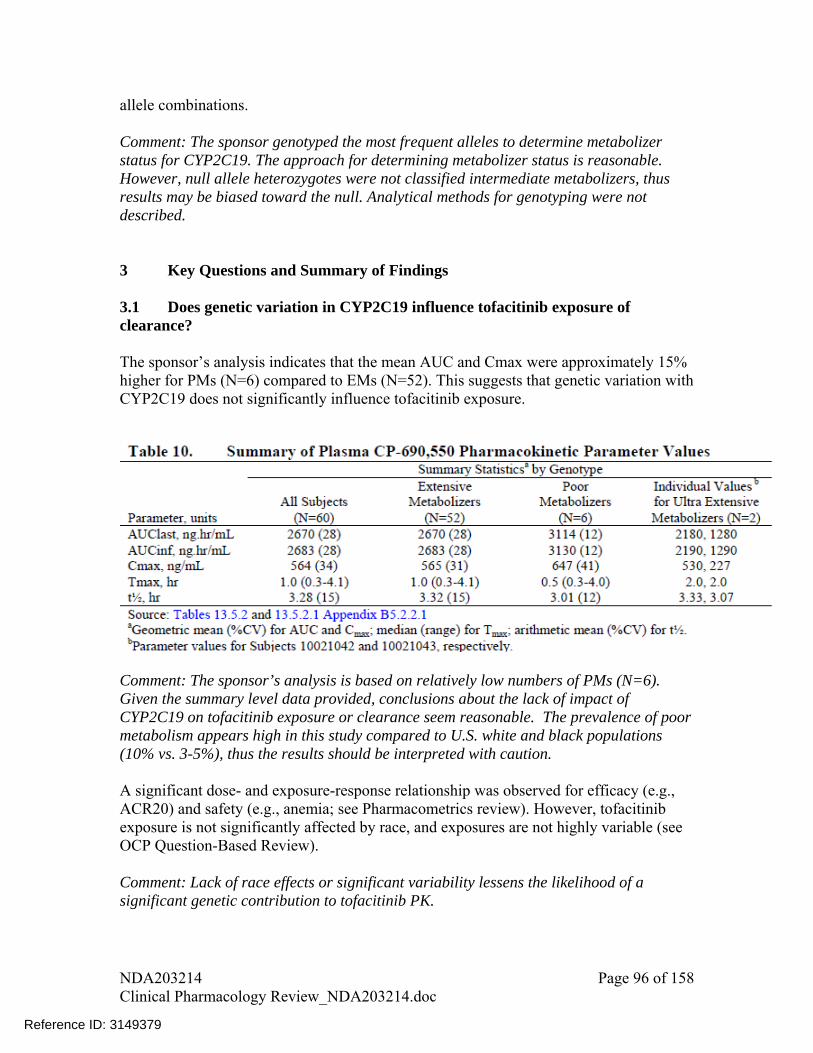
allele combinations. Comment: The sponsor genotyped the most frequent alleles to determine metabolizer status for CYP2C19. The approach for determining metabolizer status is reasonable. However, null allele heterozygotes were not classified intermediate metabolizers, thus results may be biased toward the null. Analytical methods for genotyping were not described. 3 Key Questions and Summary of Findings 3.1 Does genetic variation in CYP2C19 influence tofacitinib exposure of clearance? The sponsor’s analysis indicates that the mean AUC and Cmax were approximately 15% higher for PMs (N=6) compared to EMs (N=52). This suggests that genetic variation with CYP2C19 does not significantly influence tofacitinib exposure.
Comment: The sponsor’s analysis is based on relatively low numbers of PMs (N=6). Given the summary level data provided, conclusions about the lack of impact of CYP2C19 on tofacitinib exposure or clearance seem reasonable. The prevalence of poor metabolism appears high in this study compared to U.S. white and black populations (10% vs. 3-5%), thus the results should be interpreted with caution. A significant dose- and exposure-response relationship was observed for efficacy (e.g., ACR20) and safety (e.g., anemia; see Pharmacometrics review). However, tofacitinib exposure is not significantly affected by race, and exposures are not highly variable (see OCP Question-Based Review). Comment: Lack of race effects or significant variability lessens the likelihood of a significant genetic contribution to tofacitinib PK.
NDA203214 Page 96 of 158 Clinical Pharmacology Review_NDA203214.doc
Reference ID: 3149379

4 Summary and Conclusions Dose and plasma concentrations are associated with clinical response (see Pharmacometrics review). The in-vitro and mass-balance suggest that tofacitinib is metabolized by CYP3A4 and to a lesser extent by CYP2C19. The sponsor recommends dose adjustment for patients receiving drug(s) that inhibit both CYP3A4 and CYP2C19 (e.g., fluconazole) because of an approximate two-fold increase in exposure. However, tofacitinib dose adjustment is not warranted when coadministered with a CYP2C19 inhibitor. The pharmacogenetic analysis conducted by the sponsor suggests that CYP2C19 metabolic status has little effect on tofacitinib PK. Therefore, dosing recommendations based on genotype alone do not appear to be indicated. Dose adjustment may be indicated in patients who CYP2C19 poor metabolizers also receiving a CYP3A4 inhibitor given that the exposure level expected in this scenario is similar to that observed with fluconazole. 5 Recommendation The submitted data suggest a limited role of CYP2C19 genotype on the pharmacokinetics of tofacitinib. No additional action is indicated. 5.1 Post marketing studies None. 5.2 Labeling None.
NDA203214 Page 97 of 158 Clinical Pharmacology Review_NDA203214.doc
Reference ID: 3149379

INDIVIDUAL STUDY REVIEW
NDA 203214
Submission Date 10/21/2011
Brand Name TBD
Generic Name Tofacitinib
Clinical Pharmacology Reviewer Lokesh Jain, Ph.D.
Pharmacometrics Reviewer Lokesh Jain, Ph.D. and Atul Bhattaram, Ph.D.
Pharmacogenomics Reviewer Jeffrey Kraft, Ph.D.
Pharmacometrics Team Leader Atul Bhattaram, Ph.D.
Pharmacogenomics Team Leader Michael Pacanowski, Pharm.D., M.P.H.
Clinical Pharmacology Team Leader
Suresh Doddapaneni, Ph.D.
OCP Division Clinical Pharmacology II
OND Division Division of Pulmonary, Allergy, and Rheumatology Products
Sponsor/Authorized Applicant Pfizer, Inc.
Submission Type; Code 505(b)(1); standard review
Formulation; Strength(s) Tablet ; 5 mg and 10 mg
Indication Rheumatoid Arthritis
Dosage Regimen 5 mg BID; some patients may benefit from an increase to 10 mg BID based on clinical response
Note –
In this review, early development names and CP-690,550 are also used to refer to tofacitinib
ADME In-Vitro STUDIES ........................................................................................................... 100
1 Absorption and Transporters.............................................................................................. 100
2 Distribution......................................................................................................................... 106
3 In vitro Metabolism............................................................................................................. 109
4 In vitro Enzyme Inhibition .................................................................................................. 111
5 In vitro Enzyme Induction................................................................................................... 112
NDA203214 Page 98 of 158 Clinical Pharmacology Review_NDA203214.doc
Reference ID: 3149379
(b) (4)
PHARMACOKINETICS .............................................................................................................. 112
1 Mass Balance Study............................................................................................................ 112
2 Single Rising Dose (Oral)................................................................................................... 115
3 Multiple Rising Dose (12 days) .......................................................................................... 117
SPECIFIC POPULATION .......................................................................................................... 119
4 Renal impairment (PK study) ............................................................................................. 119
5 PK in ESRD ........................................................................................................................ 122
6 Measured GFR.................................................................................................................... 124
7 Hepatic Impairment ............................................................................................................ 126
DRUG-DRUG INTERACTIONS ................................................................................................. 129
8 DDI with Ketoconazole....................................................................................................... 129
9 DDI Fluconazole ................................................................................................................ 132
10 DDI with Rifampin............................................................................................................. 135
11 DDI with Methotrexate ...................................................................................................... 136
12 DDI with Tacrolimus and Cyclosporine............................................................................ 139
13 DDI with Midazolam ......................................................................................................... 143
14 DDI with Oral Contraceptives........................................................................................... 146
BIOPHARMACEUTICS .............................................................................................................. 149
15 Absolute Bioavailability .................................................................................................... 149
16 Preliminary Relative Bioavailability and Food Effect ...................................................... 150
17 Food Effect on Final Formulation..................................................................................... 152
18 Pivotal Bioequivalence ...................................................................................................... 153
PK IN JAPANESE AND CHINESE SUBJECTS.......................................................................... 155
19 PK in Japanese and Western Subjects............................................................................... 155
20 PK in Chinese Subjects...................................................................................................... 157
NDA203214 Page 99 of 158 Clinical Pharmacology Review_NDA203214.doc
Reference ID: 3149379


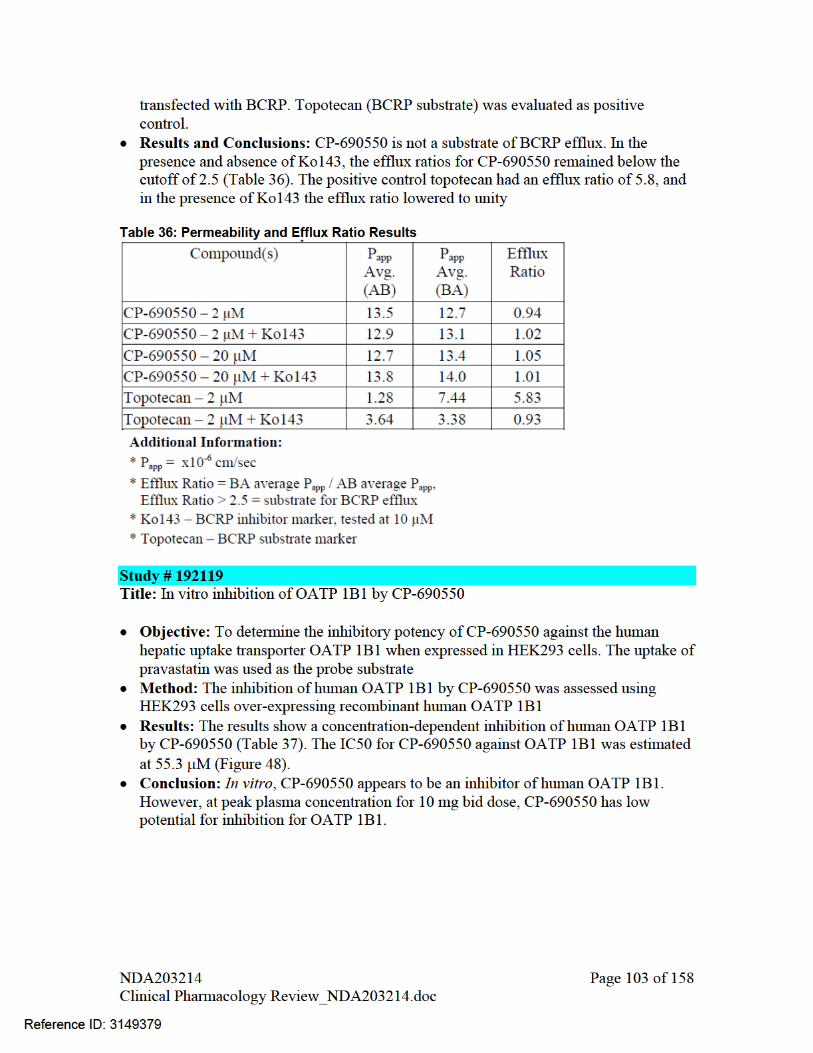
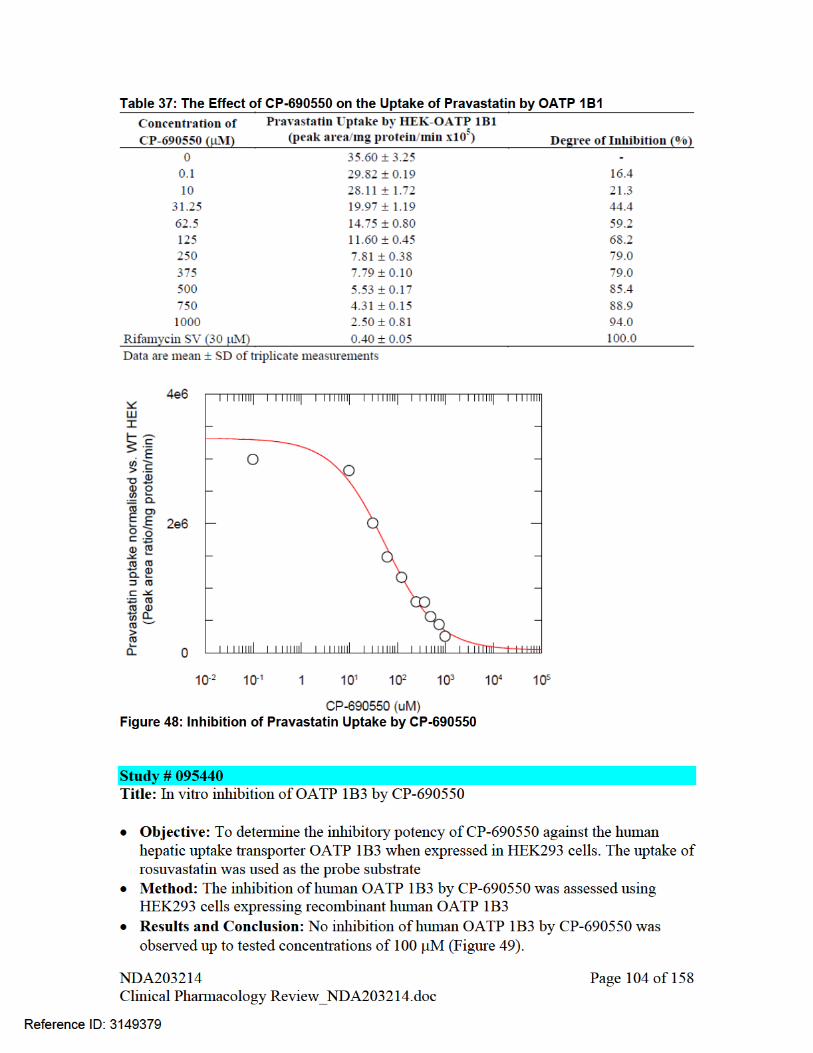
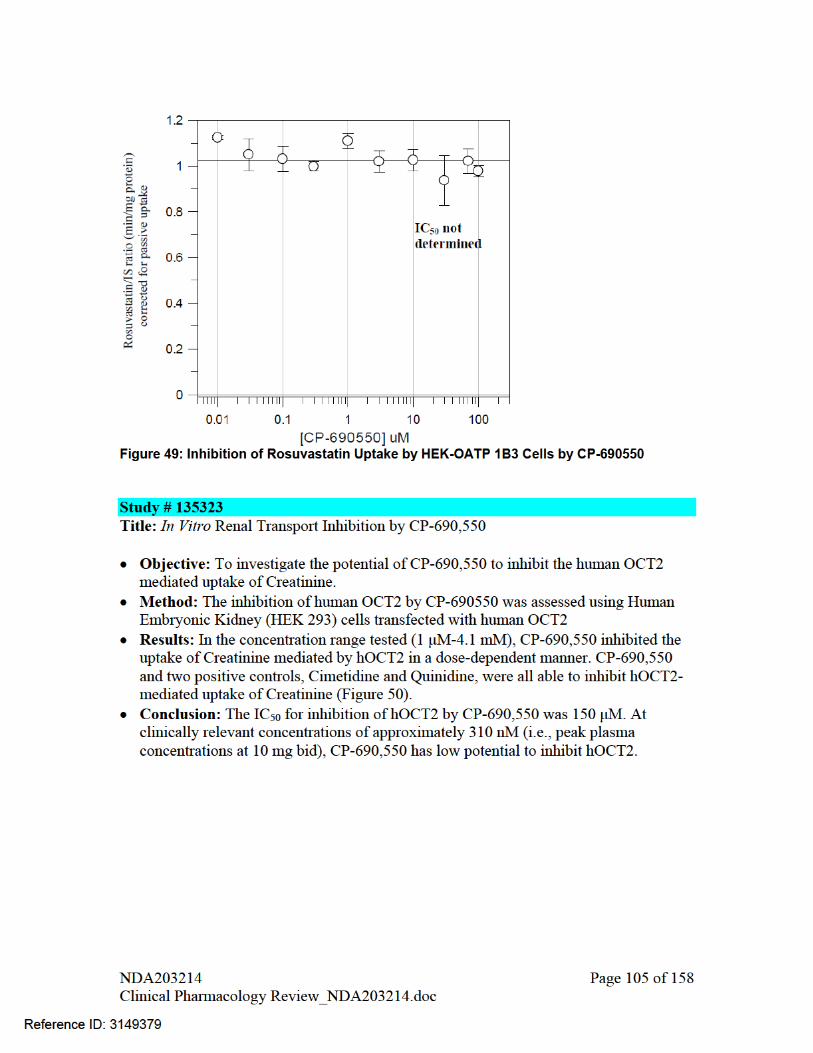


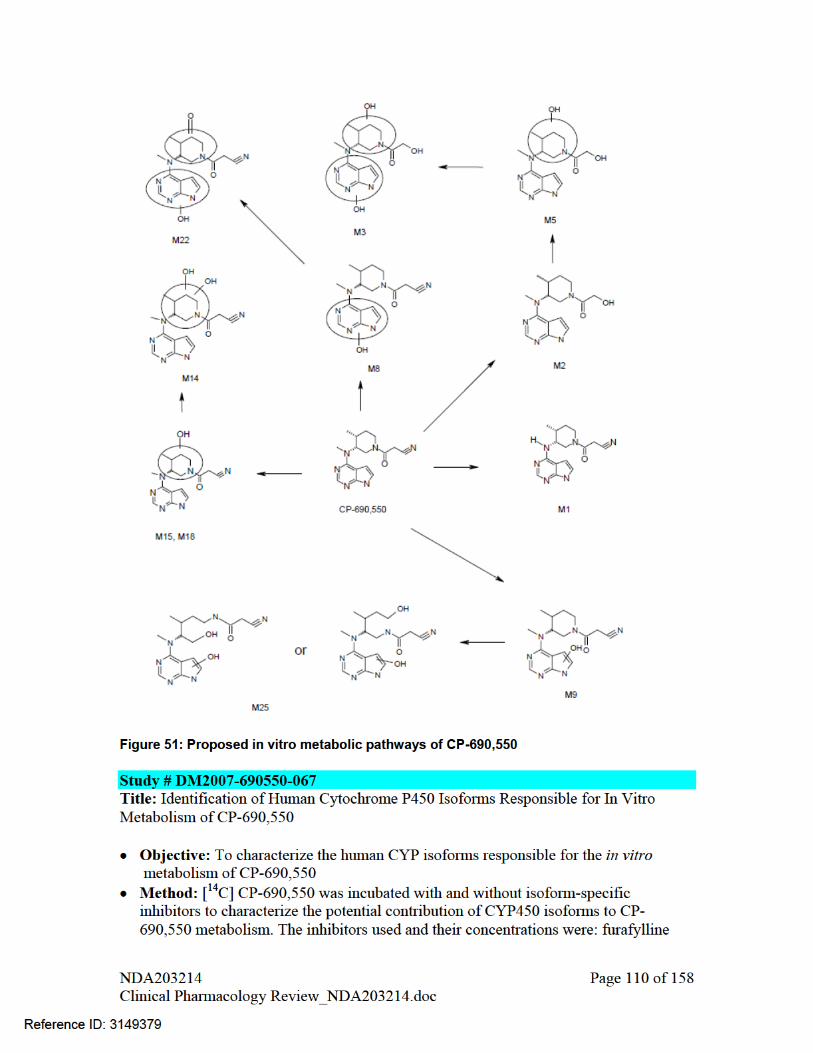


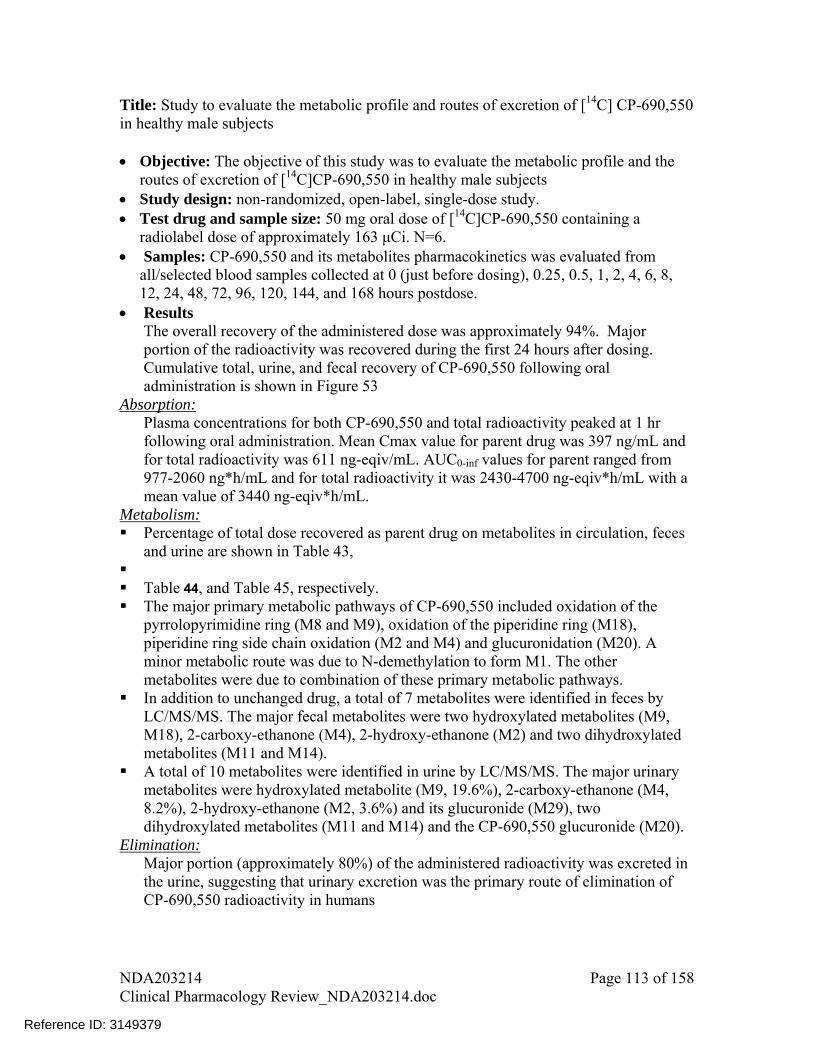
Title: Study to evaluate the metabolic profile and routes of excretion of [14C] CP-690,550 in healthy male subjects Objective: The objective of this study was to evaluate the metabolic profile and the
routes of excretion of [14C]CP-690,550 in healthy male subjects Study design: non-randomized, open-label, single-dose study. Test drug and sample size: 50 mg oral dose of [14C]CP-690,550 containing a
radiolabel dose of approximately 163 μCi. N=6. Samples: CP-690,550 and its metabolites pharmacokinetics was evaluated from
all/selected blood samples collected at 0 (just before dosing), 0.25, 0.5, 1, 2, 4, 6, 8, 12, 24, 48, 72, 96, 120, 144, and 168 hours postdose.
Results The overall recovery of the administered dose was approximately 94%. Major portion of the radioactivity was recovered during the first 24 hours after dosing. Cumulative total, urine, and fecal recovery of CP-690,550 following oral administration is shown in Figure 53
Absorption: Plasma concentrations for both CP-690,550 and total radioactivity peaked at 1 hr following oral administration. Mean Cmax value for parent drug was 397 ng/mL and for total radioactivity was 611 ng-eqiv/mL. AUC0-inf values for parent ranged from 977-2060 ng*h/mL and for total radioactivity it was 2430-4700 ng-eqiv*h/mL with a mean value of 3440 ng-eqiv*h/mL.
Metabolism: Percentage of total dose recovered as parent drug on metabolites in circulation, feces
and urine are shown in Table 43, Table 44, and Table 45, respectively. The major primary metabolic pathways of CP-690,550 included oxidation of the
pyrrolopyrimidine ring (M8 and M9), oxidation of the piperidine ring (M18), piperidine ring side chain oxidation (M2 and M4) and glucuronidation (M20). A minor metabolic route was due to N-demethylation to form M1. The other metabolites were due to combination of these primary metabolic pathways.
In addition to unchanged drug, a total of 7 metabolites were identified in feces by LC/MS/MS. The major fecal metabolites were two hydroxylated metabolites (M9, M18), 2-carboxy-ethanone (M4), 2-hydroxy-ethanone (M2) and two dihydroxylated metabolites (M11 and M14).
A total of 10 metabolites were identified in urine by LC/MS/MS. The major urinary metabolites were hydroxylated metabolite (M9, 19.6%), 2-carboxy-ethanone (M4, 8.2%), 2-hydroxy-ethanone (M2, 3.6%) and its glucuronide (M29), two dihydroxylated metabolites (M11 and M14) and the CP-690,550 glucuronide (M20).
Elimination: Major portion (approximately 80%) of the administered radioactivity was excreted in the urine, suggesting that urinary excretion was the primary route of elimination of CP-690,550 radioactivity in humans
NDA203214 Page 113 of 158 Clinical Pharmacology Review_NDA203214.doc
Reference ID: 3149379
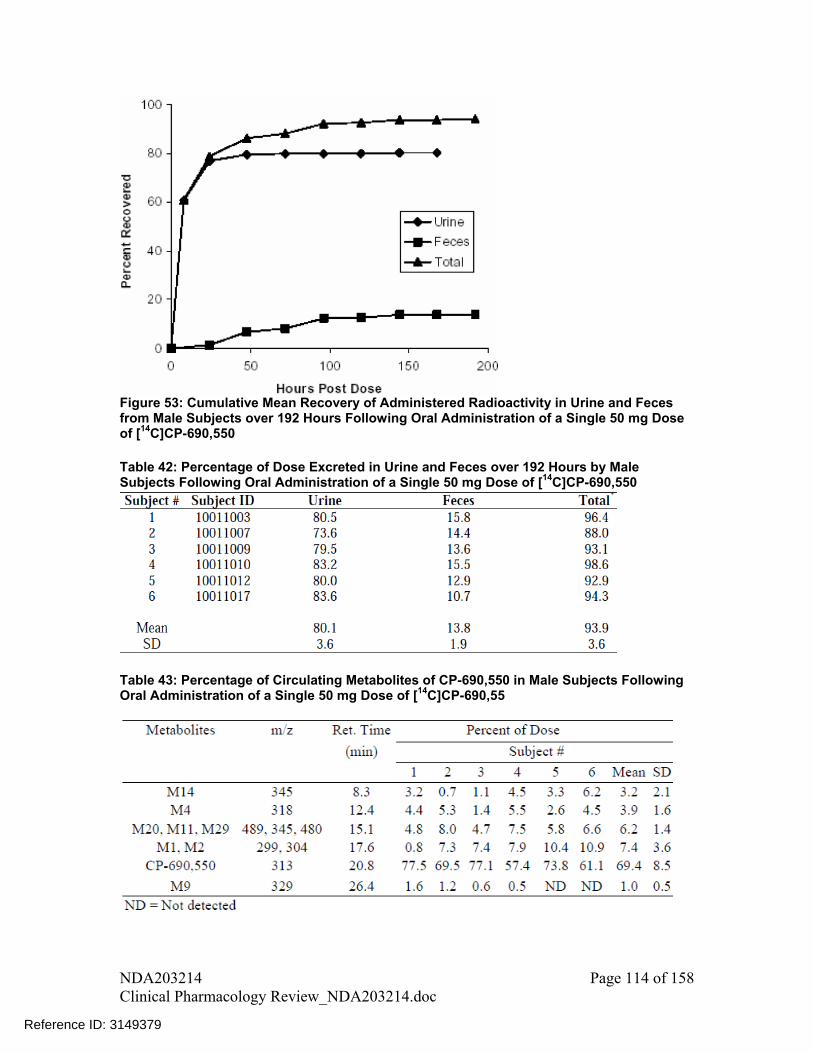
Figure 53: Cumulative Mean Recovery of Administered Radioactivity in Urine and Feces from Male Subjects over 192 Hours Following Oral Administration of a Single 50 mg Dose of [14C]CP-690,550 Table 42: Percentage of Dose Excreted in Urine and Feces over 192 Hours by Male Subjects Following Oral Administration of a Single 50 mg Dose of [14C]CP-690,550
Table 43: Percentage of Circulating Metabolites of CP-690,550 in Male Subjects Following Oral Administration of a Single 50 mg Dose of [14C]CP-690,55
NDA203214 Page 114 of 158 Clinical Pharmacology Review_NDA203214.doc
Reference ID: 3149379
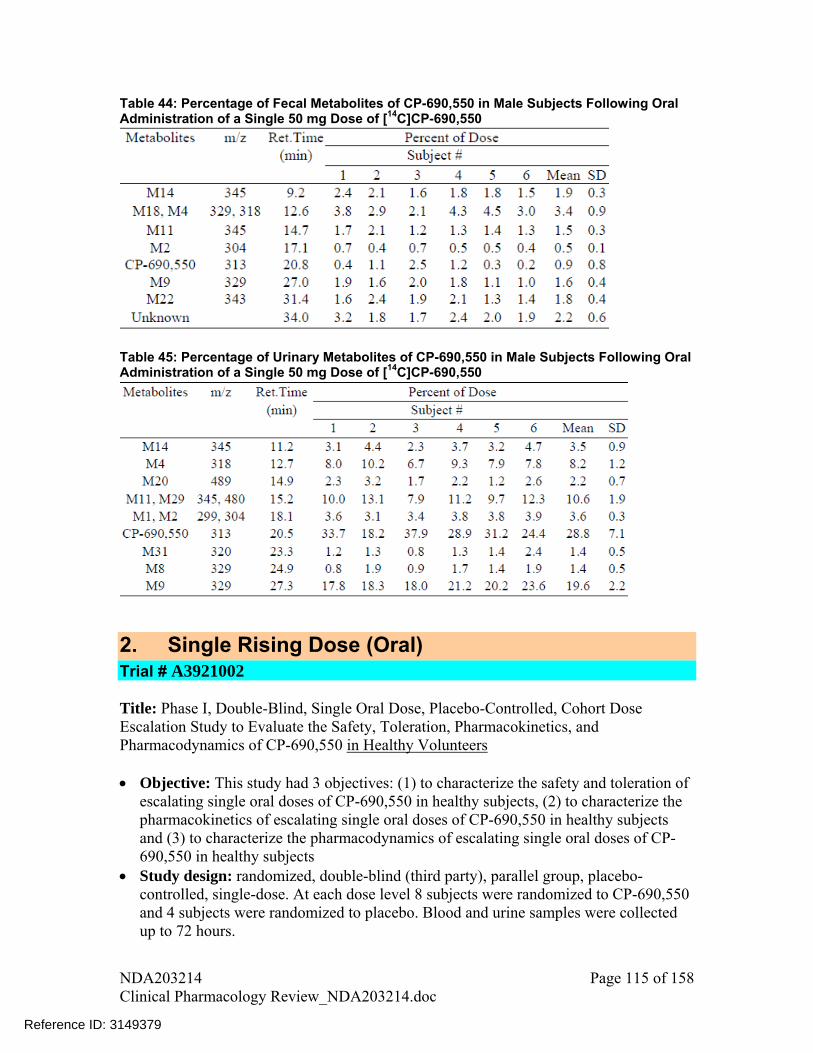
Table 44: Percentage of Fecal Metabolites of CP-690,550 in Male Subjects Following Oral Administration of a Single 50 mg Dose of [14C]CP-690,550
Table 45: Percentage of Urinary Metabolites of CP-690,550 in Male Subjects Following Oral Administration of a Single 50 mg Dose of [14C]CP-690,550
2. Single Rising Dose (Oral) Trial # A3921002 Title: Phase I, Double-Blind, Single Oral Dose, Placebo-Controlled, Cohort Dose Escalation Study to Evaluate the Safety, Toleration, Pharmacokinetics, and Pharmacodynamics of CP-690,550 in Healthy Volunteers Objective: This study had 3 objectives: (1) to characterize the safety and toleration of
escalating single oral doses of CP-690,550 in healthy subjects, (2) to characterize the pharmacokinetics of escalating single oral doses of CP-690,550 in healthy subjects and (3) to characterize the pharmacodynamics of escalating single oral doses of CP-690,550 in healthy subjects
Study design: randomized, double-blind (third party), parallel group, placebo-controlled, single-dose. At each dose level 8 subjects were randomized to CP-690,550 and 4 subjects were randomized to placebo. Blood and urine samples were collected up to 72 hours.
NDA203214 Page 115 of 158 Clinical Pharmacology Review_NDA203214.doc
Reference ID: 3149379

Test drug: CP-690,550 in oral powder for constitution dosage form at doses 0.1, 0.3, 1, 3, 10, 30, 60, and 100 mg
Results: Mean serum CP-690,550 concentration vs. time profiles are shown in Figure 54.
Tmax was reached by 0.5 to 1 hour. CP-690,550 appears to follow mono-exponential disposition kinetics with parallel terminal phase for all tested dose levels. PK parameters for different dose levels are listed in Table 46. Terminal half-life of CP-690,550 was approximately 3 hours.
Systemic exposure of CP-690,550 increased with dose in a dose proportional manner resulting in approximately similar dose-normalized AUC0-inf values across tested dose levels (Figure 55), indicating linear pharmacokinetics.
Average renal clearance was about 136 mL/min and was slightly higher than the creatinine clearance, suggesting some active tubular secretion.
Figure 54: Mean Serum CP-690,550 Concentrations vs Times Following Administration of a Single Oral OPC Dose of CP-690,550 to Fasted Healthy Subjects
NDA203214 Page 116 of 158 Clinical Pharmacology Review_NDA203214.doc
Reference ID: 3149379
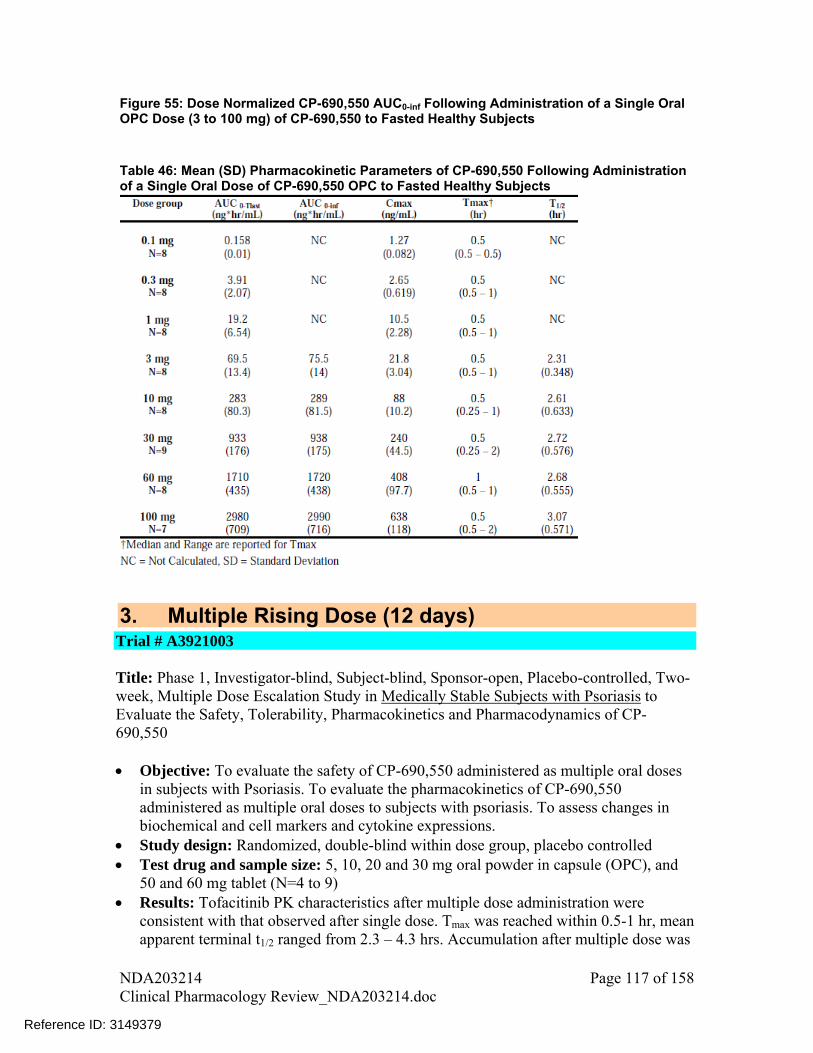
Figure 55: Dose Normalized CP-690,550 AUC0-inf Following Administration of a Single Oral OPC Dose (3 to 100 mg) of CP-690,550 to Fasted Healthy Subjects Table 46: Mean (SD) Pharmacokinetic Parameters of CP-690,550 Following Administration of a Single Oral Dose of CP-690,550 OPC to Fasted Healthy Subjects
3. Multiple Rising Dose (12 days) Trial # A3921003
Title: Phase 1, Investigator-blind, Subject-blind, Sponsor-open, Placebo-controlled, Two-week, Multiple Dose Escalation Study in Medically Stable Subjects with Psoriasis to Evaluate the Safety, Tolerability, Pharmacokinetics and Pharmacodynamics of CP-690,550 Objective: To evaluate the safety of CP-690,550 administered as multiple oral doses
in subjects with Psoriasis. To evaluate the pharmacokinetics of CP-690,550 administered as multiple oral doses to subjects with psoriasis. To assess changes in biochemical and cell markers and cytokine expressions.
Study design: Randomized, double-blind within dose group, placebo controlled Test drug and sample size: 5, 10, 20 and 30 mg oral powder in capsule (OPC), and
50 and 60 mg tablet (N=4 to 9) Results: Tofacitinib PK characteristics after multiple dose administration were
consistent with that observed after single dose. Tmax was reached within 0.5-1 hr, mean apparent terminal t1/2 ranged from 2.3 – 4.3 hrs. Accumulation after multiple dose was
NDA203214 Page 117 of 158 Clinical Pharmacology Review_NDA203214.doc
Reference ID: 3149379
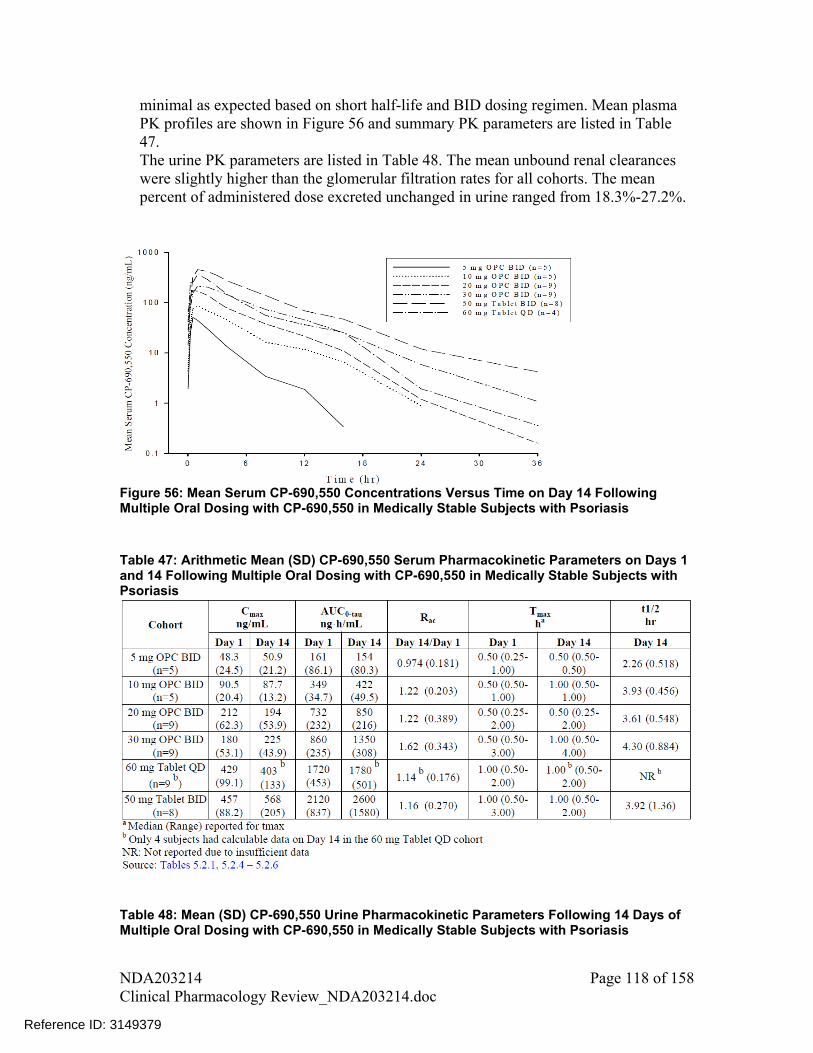
minimal as expected based on short half-life and BID dosing regimen. Mean plasma PK profiles are shown in Figure 56 and summary PK parameters are listed in Table 47. The urine PK parameters are listed in Table 48. The mean unbound renal clearances were slightly higher than the glomerular filtration rates for all cohorts. The mean percent of administered dose excreted unchanged in urine ranged from 18.3%-27.2%.
Figure 56: Mean Serum CP-690,550 Concentrations Versus Time on Day 14 Following Multiple Oral Dosing with CP-690,550 in Medically Stable Subjects with Psoriasis Table 47: Arithmetic Mean (SD) CP-690,550 Serum Pharmacokinetic Parameters on Days 1 and 14 Following Multiple Oral Dosing with CP-690,550 in Medically Stable Subjects with Psoriasis
Table 48: Mean (SD) CP-690,550 Urine Pharmacokinetic Parameters Following 14 Days of Multiple Oral Dosing with CP-690,550 in Medically Stable Subjects with Psoriasis
NDA203214 Page 118 of 158 Clinical Pharmacology Review_NDA203214.doc
Reference ID: 3149379
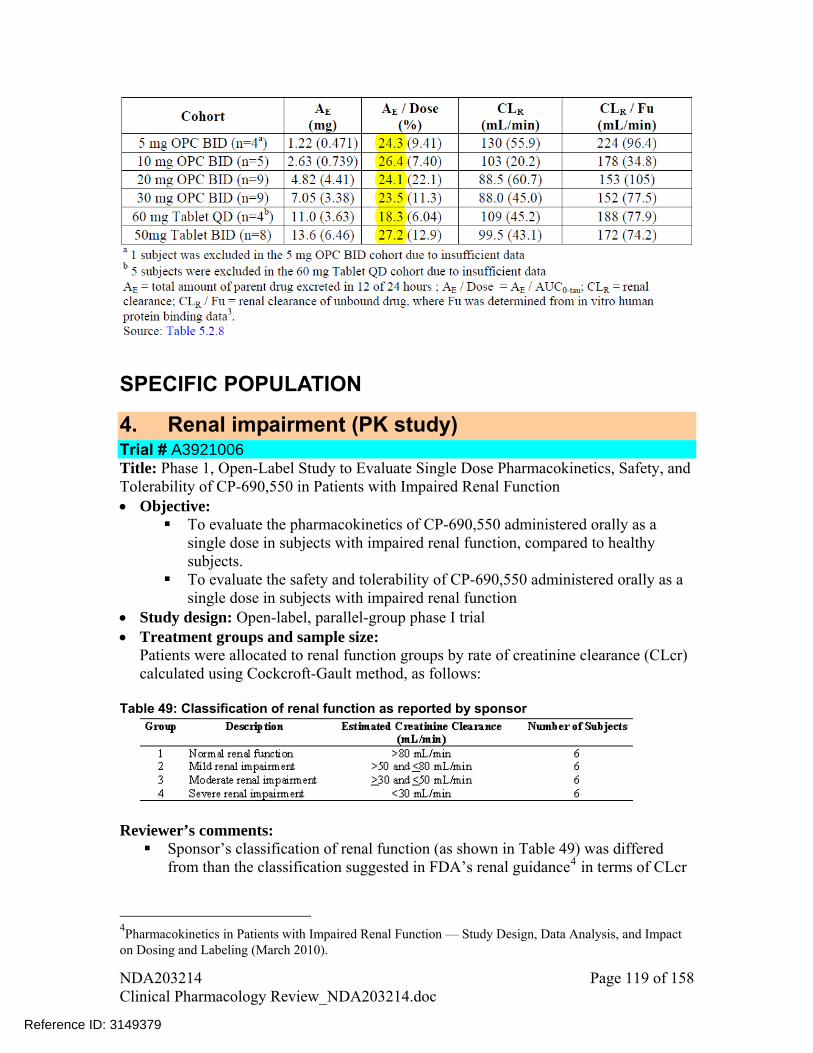
SPECIFIC POPULATION
4. Renal impairment (PK study) Trial # A3921006 Title: Phase 1, Open-Label Study to Evaluate Single Dose Pharmacokinetics, Safety, and Tolerability of CP-690,550 in Patients with Impaired Renal Function Objective:
To evaluate the pharmacokinetics of CP-690,550 administered orally as a single dose in subjects with impaired renal function, compared to healthy subjects.
To evaluate the safety and tolerability of CP-690,550 administered orally as a single dose in subjects with impaired renal function
Study design: Open-label, parallel-group phase I trial Treatment groups and sample size:
Patients were allocated to renal function groups by rate of creatinine clearance (CLcr) calculated using Cockcroft-Gault method, as follows:
Table 49: Classification of renal function as reported by sponsor
Reviewer’s comments: Sponsor’s classification of renal function (as shown in Table 49) was differed
from than the classification suggested in FDA’s renal guidance4 in terms of CLcr
4Pharmacokinetics in Patients with Impaired Renal Function — Study Design, Data Analysis, and Impact on Dosing and Labeling (March 2010).
NDA203214 Page 119 of 158 Clinical Pharmacology Review_NDA203214.doc
Reference ID: 3149379

cut-offs. FDA’s guidance indicate CLcr 90 mL/min as normal renal function, between 60-89 as mild renal impairment, between 30-59 as moderate renal impairment, between 15-29 as severe renal impairment and <15 not requiring dialysis or requiring dialysis as end stage renal disease (ESRD). For the results discussed below, patients were re-grouped based on FDA guidance.
In calculation of CLcr using Cockcroft-Gault method sponsor used ideal body weight instead of actual body weight. It is acceptable given that there were some obese study subjects (mean BMI across groups ranged from 24.2 – 41.1 kg/m2). However, there is no consensus on whether ideal body weight is the right parameter to replace actual body weight in this situation.
Duration of Treatment: Single Dose PK Sampling Schedule Blood – Day 1 at 0 (just prior to dosing), 0.5, 1, 1.5, 2, 4, 8, 10, 12, 16, 24 and 48
hours after dosing Urine – for 24 hours starting on Day 1 at the time of dosing and ending on Day 2,
24 hours after Day 1 dosing Results:
o Following re-grouping of patients based on FDA’s classification of renal function, there were 3 subjects in normal function, 8 subjects in mild, 7 subjects in moderate, and 6 subjects in severe renal impairment group.
o The geometric mean ratio and 95% CI for comparison of PK parameters for renally impaired subjects vs. normal renal function are shown in Table 50.
o Mean percentage change in AUC (90%CI), for subjects with mild, moderate, and severe renal impairment compared to normal renal function were respectively: 41% (-5%, 109%), 71% (14%, 157%), and 156% (69%, 287%). Mean percentage changes in Cmax (90% CI) for these cases were respectively: 1% (-31%, 49%), 2% (-31%, 52%), and 21% (-19%, 81%).
o On continuous scale of CLcr, there was an increase in AUCinf with decline in renal function (Figure 57)
o Measured unbound renal clearance for almost all subjects was greater than the individual estimated CLcr (Figure 58), suggesting that active tubular secretion may be playing some role in renal excretion of CP-690,550.
Reviewer’s comments o Mean plasma concentration data for different renal function groups were modeled
using WinNonlin and simulations were performed to identify the optimum dosing based on exposure matching for each renal function group. For details on the dosing recommendations please check the Clinical Pharmacology review.
http://www fda.gov/downloads/Drugs/GuidanceComplianceRegulatoryInformation/Guidances/UCM204959.pdf
NDA203214 Page 120 of 158 Clinical Pharmacology Review_NDA203214.doc
Reference ID: 3149379

Table 50: Geometric mean ratio and 90% CI for comparison of PK parameters between renally impaired subjects vs. normal renal function
Test Reference GM Ratio [%Ref]
CI_90_lower CI_90_Upper
AUC Mild Normal 140.92 94.81 209.48 Moderate Normal 171.43 114.45 256.78 Severe Normal 255.73 169.04 386.89
Cmax Mild Normal 101.29 68.87 148.98 Moderate Normal 102.46 69.15 151.83 Severe Normal 120.65 80.64 180.53
Figure 57: Individual AUC0-inf vs. estimated creatinine clearances following a single 10 mg dose of CP-690,550 in subjects with normal renal function, and in subjects with mild, moderate, and severe renal impairment (Sponsor reported).
Figure 58: Individual CP-690,550 Unbound Renal Clearance (CLR/Fu) Levels Versus Estimated Creatinine Clearances Following A Single 10 mg Oral Dose of CP 690,550 in
NDA203214 Page 121 of 158 Clinical Pharmacology Review_NDA203214.doc
Reference ID: 3149379

subjects with normal renal function, and in subjects with mild, moderate, and severe renal impairment Conclusions: No dose adjustment recommended for subjects with mild renal impairment. Check clinical pharmacology review for dosing recommendations in subjects with moderate and severe renal impairment.
5. PK in ESRD Trial # A3921004 Title: Phase 1, Open-Label Study of the Pharmacokinetics, Non-Renal Clearance and Dialyzability of CP-690,550 in Subjects with End-Stage Renal Disease Undergoing Hemodialysis Objective:
To evaluate the pharmacokinetics and non-renal clearance of CP-690,550 administered as a single oral dose in subjects with end stage renal disease (ESRD) undergoing hemodialysis
To assess the degree to which CP-690,550 is dialyzable To evaluate the safety of CP-690,550 administered as a single oral dose in
subjects with ESRD undergoing hemodialysis Study design: Open-label, 2-period phase I study Treatment groups: Period 1 (N=12): 10 mg of CP-690,550 oral powder for constitution (OPC)
administered as a single oral dose 1 to 2 hours after completion of hemodialysis; Period 2 (N=11): 10 mg of CP-690,550 OPC administered as a single oral dose
approximately 4 hours prior to hemodialysis. Duration of Treatment: Single Dose PK Sampling Schedule Blood – Period 1 - Days 1-2: 0 (just prior to dosing), 0.25, 0.5, 1, 2, 3, 4, 8, 12, 16, and 24
hours after dosing; Day 3: 48 hours after dosing (before hemodialysis), and then paired arteriovenous samples at the mid-point of each 1-hour dialysate sampling period (during hemodialysis), at the end of hemodialysis, and at 2 and 4 hours after the end of hemodialysis
Period 2 – Day 1: Before dosing, before hemodialysis, and then paired arteriovenous samples at the mid-point of each 1-hour dialysate sampling period (during hemodialysis), at the end of hemodialysis, and at 2 and 4 hours after the end of hemodialysis; Day 2: 24 hours after dosing; Day 3: 48 hours after dosing
Results: The plasma concentration time profile of CP-690,550 from first stage in ESRD subjects is shown in Figure 59. Rapid absorption and elimination of CP-690,550 were observed in ESRD subjects, suggesting extensive non-renal clearance. The terminal half-life was approximately 3.5 hours. The AUC and Cmax in ESRD subjects were 37% and 20% higher than that observed for the same OPC formulation in study A3921002 (Table 46).
NDA203214 Page 122 of 158 Clinical Pharmacology Review_NDA203214.doc
Reference ID: 3149379

Data from second period, in which CP-690,550 was administered 4 hours prior to dialysis, were used to measure the dialyzability of CP-690,550. CP-690,550 was highly dialyzable during hemodialysis based on observed dialyzer clearance and efficiency in ESRD subjects. A substantial amount of CP-690,550, i.e., about 73% of the amount that was excreted through renal pathway, was extracted into the dialysate (Table 52). The dialyzer clearance of CP-690,550 remained consistent within each subject over the duration of the hemodialysis session (Figure 60). However, there was considerable inter-subject variability in dialyzer clearance, ranging from 174 to 527 mL/min (Figure 60).
Figure 59: Mean Plasma CP-690,550 Concentrations Over Time Following administration of single dose of 10 mg CP-690,550 in end stage renal disease patients (period 1) Table 51: Arithmetic Mean (SD) of Plasma CP-690,550 Pharmacokinetic Parameters in subjects with ESRD (period 1)
NDA203214 Page 123 of 158 Clinical Pharmacology Review_NDA203214.doc
Reference ID: 3149379

Figure 60: Individual Dialyzer Clearance of CP-690,550 over Dialysate Collection Intervals Following Administration of a Single Dose of 10 mg CP-690,550 OPC 4 Hours Prior to hemodialysis in subjects with ESRD (Period 2) Table 52: Arithmetic Mean (SD) of CP-690,550 Pharmacokinetic parameters in subjects with ESRD (period 2)
CLHD – dialyzer clearance in each dialysate collection period Qb – blood flow entering dialyzer E – dialyzer efficiency (CLHD/Qb) Conclusions: Substantial proportion of CP-690,550 is cleared through non-renal pathway. Of the amount that is cleared through renal pathway, about 73% is extracted during dialysis.
6. Measured GFR Trial # A3921033
NDA203214 Page 124 of 158 Clinical Pharmacology Review_NDA203214.doc
Reference ID: 3149379
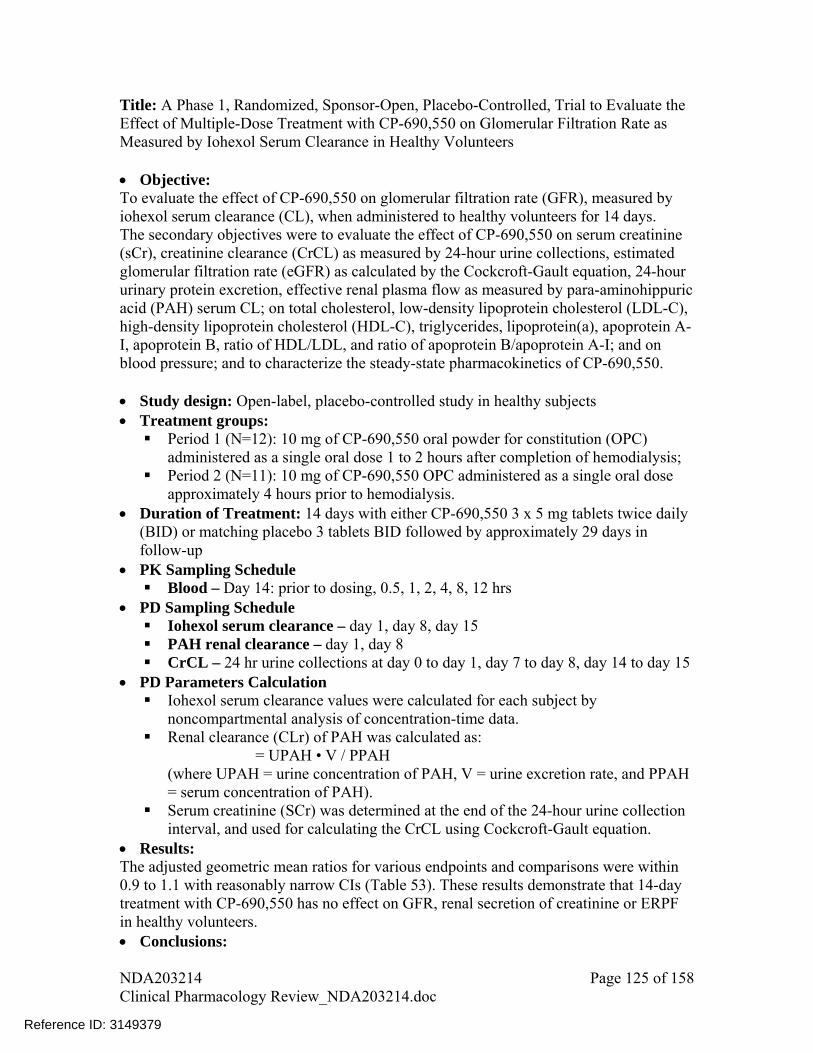
Title: A Phase 1, Randomized, Sponsor-Open, Placebo-Controlled, Trial to Evaluate the Effect of Multiple-Dose Treatment with CP-690,550 on Glomerular Filtration Rate as Measured by Iohexol Serum Clearance in Healthy Volunteers Objective: To evaluate the effect of CP-690,550 on glomerular filtration rate (GFR), measured by iohexol serum clearance (CL), when administered to healthy volunteers for 14 days. The secondary objectives were to evaluate the effect of CP-690,550 on serum creatinine (sCr), creatinine clearance (CrCL) as measured by 24-hour urine collections, estimated glomerular filtration rate (eGFR) as calculated by the Cockcroft-Gault equation, 24-hour urinary protein excretion, effective renal plasma flow as measured by para-aminohippuric acid (PAH) serum CL; on total cholesterol, low-density lipoprotein cholesterol (LDL-C), high-density lipoprotein cholesterol (HDL-C), triglycerides, lipoprotein(a), apoprotein A-I, apoprotein B, ratio of HDL/LDL, and ratio of apoprotein B/apoprotein A-I; and on blood pressure; and to characterize the steady-state pharmacokinetics of CP-690,550. Study design: Open-label, placebo-controlled study in healthy subjects Treatment groups: Period 1 (N=12): 10 mg of CP-690,550 oral powder for constitution (OPC)
administered as a single oral dose 1 to 2 hours after completion of hemodialysis; Period 2 (N=11): 10 mg of CP-690,550 OPC administered as a single oral dose
approximately 4 hours prior to hemodialysis. Duration of Treatment: 14 days with either CP-690,550 3 x 5 mg tablets twice daily
(BID) or matching placebo 3 tablets BID followed by approximately 29 days in follow-up
PK Sampling Schedule Blood – Day 14: prior to dosing, 0.5, 1, 2, 4, 8, 12 hrs
PD Sampling Schedule Iohexol serum clearance – day 1, day 8, day 15 PAH renal clearance – day 1, day 8 CrCL – 24 hr urine collections at day 0 to day 1, day 7 to day 8, day 14 to day 15
PD Parameters Calculation Iohexol serum clearance values were calculated for each subject by
noncompartmental analysis of concentration-time data. Renal clearance (CLr) of PAH was calculated as:
= UPAH • V / PPAH (where UPAH = urine concentration of PAH, V = urine excretion rate, and PPAH = serum concentration of PAH).
Serum creatinine (SCr) was determined at the end of the 24-hour urine collection interval, and used for calculating the CrCL using Cockcroft-Gault equation.
Results: The adjusted geometric mean ratios for various endpoints and comparisons were within 0.9 to 1.1 with reasonably narrow CIs (Table 53). These results demonstrate that 14-day treatment with CP-690,550 has no effect on GFR, renal secretion of creatinine or ERPF in healthy volunteers. Conclusions:
NDA203214 Page 125 of 158 Clinical Pharmacology Review_NDA203214.doc
Reference ID: 3149379
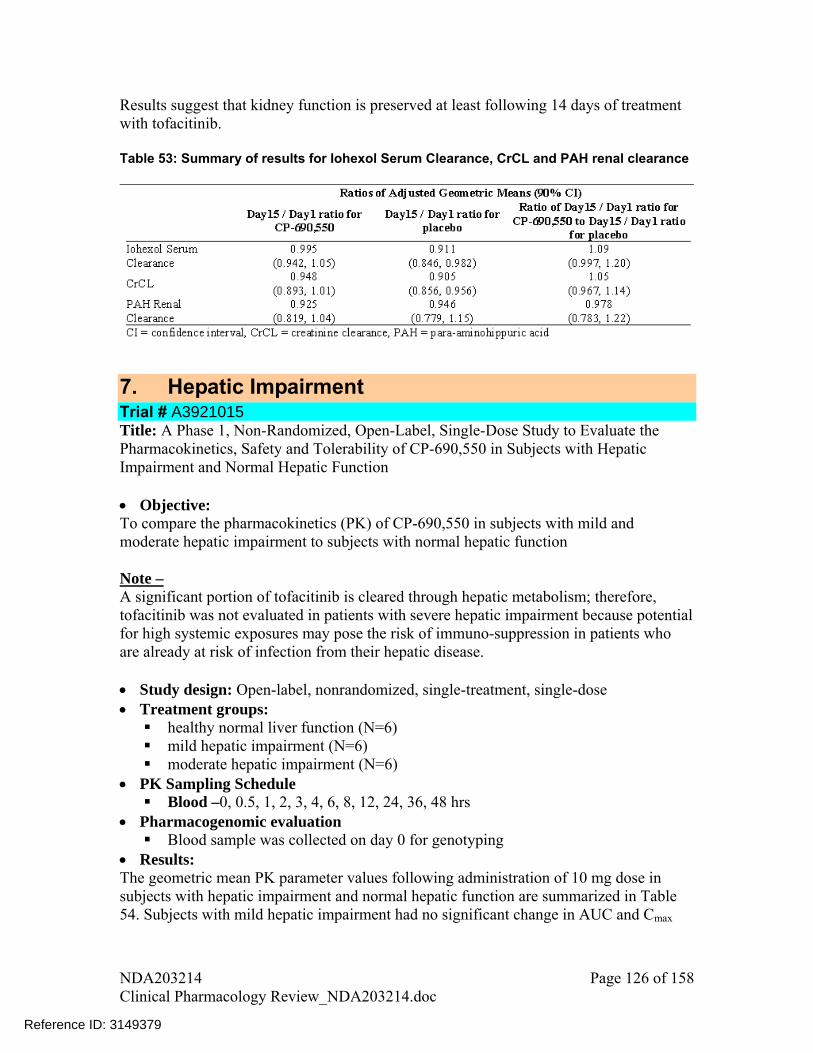
Results suggest that kidney function is preserved at least following 14 days of treatment with tofacitinib. Table 53: Summary of results for Iohexol Serum Clearance, CrCL and PAH renal clearance
7. Hepatic Impairment Trial # A3921015 Title: A Phase 1, Non-Randomized, Open-Label, Single-Dose Study to Evaluate the Pharmacokinetics, Safety and Tolerability of CP-690,550 in Subjects with Hepatic Impairment and Normal Hepatic Function Objective: To compare the pharmacokinetics (PK) of CP-690,550 in subjects with mild and moderate hepatic impairment to subjects with normal hepatic function Note – A significant portion of tofacitinib is cleared through hepatic metabolism; therefore, tofacitinib was not evaluated in patients with severe hepatic impairment because potential for high systemic exposures may pose the risk of immuno-suppression in patients who are already at risk of infection from their hepatic disease. Study design: Open-label, nonrandomized, single-treatment, single-dose Treatment groups: healthy normal liver function (N=6) mild hepatic impairment (N=6) moderate hepatic impairment (N=6)
PK Sampling Schedule Blood –0, 0.5, 1, 2, 3, 4, 6, 8, 12, 24, 36, 48 hrs
Pharmacogenomic evaluation Blood sample was collected on day 0 for genotyping
Results: The geometric mean PK parameter values following administration of 10 mg dose in subjects with hepatic impairment and normal hepatic function are summarized in Table 54. Subjects with mild hepatic impairment had no significant change in AUC and Cmax
NDA203214 Page 126 of 158 Clinical Pharmacology Review_NDA203214.doc
Reference ID: 3149379
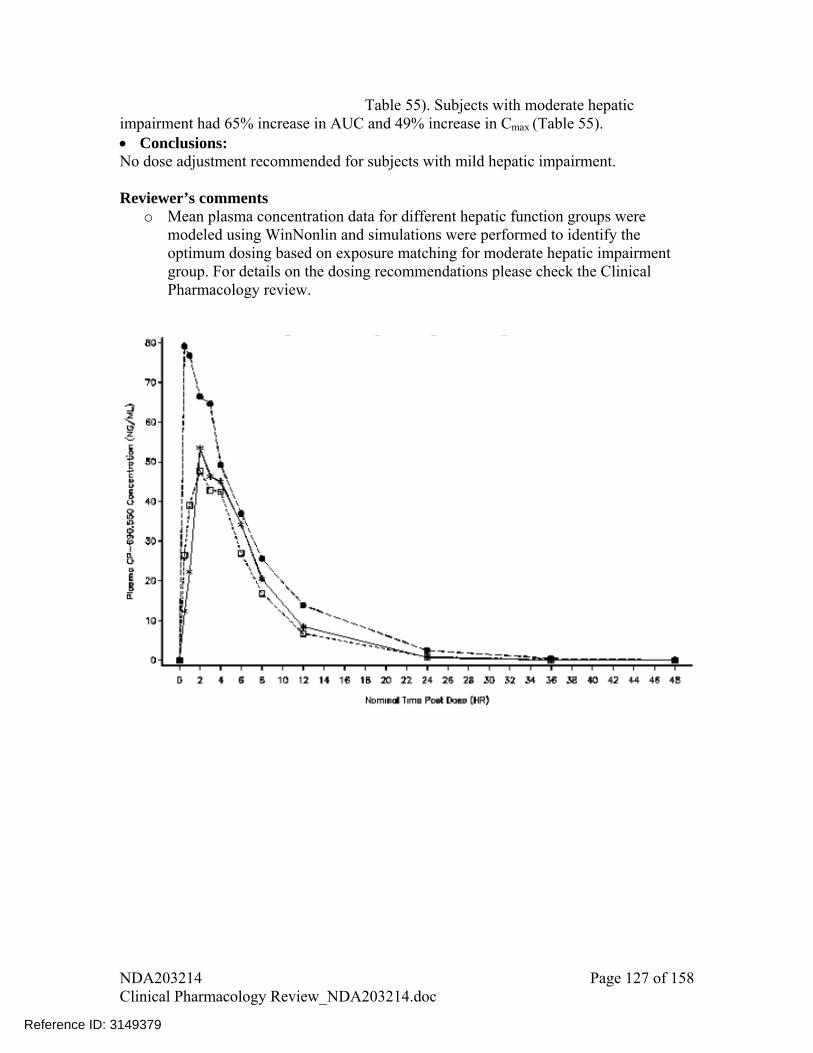
Table 55). Subjects with moderate hepatic impairment had 65% increase in AUC and 49% increase in Cmax (Table 55). Conclusions: No dose adjustment recommended for subjects with mild hepatic impairment. Reviewer’s comments
o Mean plasma concentration data for different hepatic function groups were modeled using WinNonlin and simulations were performed to identify the optimum dosing based on exposure matching for moderate hepatic impairment group. For details on the dosing recommendations please check the Clinical Pharmacology review.
NDA203214 Page 127 of 158 Clinical Pharmacology Review_NDA203214.doc
Reference ID: 3149379

Figure 61: Median Plasma CP-690,550 Concentration-Time Profiles by Hepatic function group following a single 10 mg oral dose Table 54: Descriptive Summary of Plasma CP-690,550 Pharmacokinetic Parameter values following a single 10 mg oral dose
NDA203214 Page 128 of 158 Clinical Pharmacology Review_NDA203214.doc
Reference ID: 3149379

Table 55: Summary of Statistical Comparisons: Mild and Moderate Hepatic impairment groups vs. normal hepatic function group
DRUG-DRUG INTERACTIONS
8. DDI with Ketoconazole Trial # A3921054 Title: A Phase 1, Open Label, Fixed-Sequence Study to Estimate the Effect of Ketoconazole on the Pharmacokinetics of Tasocitinib (CP-690,550) in Healthy Volunteers Objective: To estimate the effect of ketoconazole oral administration on the PK of a single 10 mg oral dose of CP-690,550 Study design and treatment schedule: Open-label, single fixed sequence, 2-period
design (N=12) (see Table 56) Table 56: Study design for A3921054
Reviewer’s comment: Tofacitinib’s half-life is 3 hrs, which is comparable or shorter than the half-life of ketoconazole, i.e., 3-5 hrs; therefore, the given schedule of ketoconazole 400 mg QD is sufficient (and perhaps better than 200 mg BID) in achieving the inhibition of CYP3A4
NDA203214 Page 129 of 158 Clinical Pharmacology Review_NDA203214.doc
Reference ID: 3149379
enzymes in liver and intestine5. Moreover, since single-dose of ketoconazole is likely to maintain more than 50% inhibition of intrinsic clearance of both organs for up to 10 hours2, it would cover the majority of the elimination phase of tofacitinib.
PK Sampling Schedule Blood –0, 0.5, 1, 2, 4, 6, 8, 12, 16, and 24 hrs in Periods 1 (Days 1) and 2 (Days 3 and 4)
Results: Coadministration with ketoconazole increased Cmax and slowed down the clearance (increased terminal half-life) of CP-690,550 (Figure 62). CP-690,550 AUC increased by 103% and Cmax increased by 16% following coadministration with ketoconazole (Table 57). Conclusions: When coadministered with ketoconazole, tofacitinib exposure increased by ~103%. Reviewer’s Comments:
o Mean plasma concentration data for tofacitinib with and without ketoconazole were modeled using WinNonlin and simulations were performed to identify the optimum dosing based on exposure matching for tofacitinib coadministration with ketoconazole. For details on the dosing recommendations please check the Clinical Pharmacology review.
5 Ping Zhao et al. Quantitative Evaluation of Pharmacokinetic Inhibition of CYP3A Substrates by Ketoconazole: A Simulation Study. Journal of Clinical Pharmacology. 2009;49:351-359
NDA203214 Page 130 of 158 Clinical Pharmacology Review_NDA203214.doc
Reference ID: 3149379
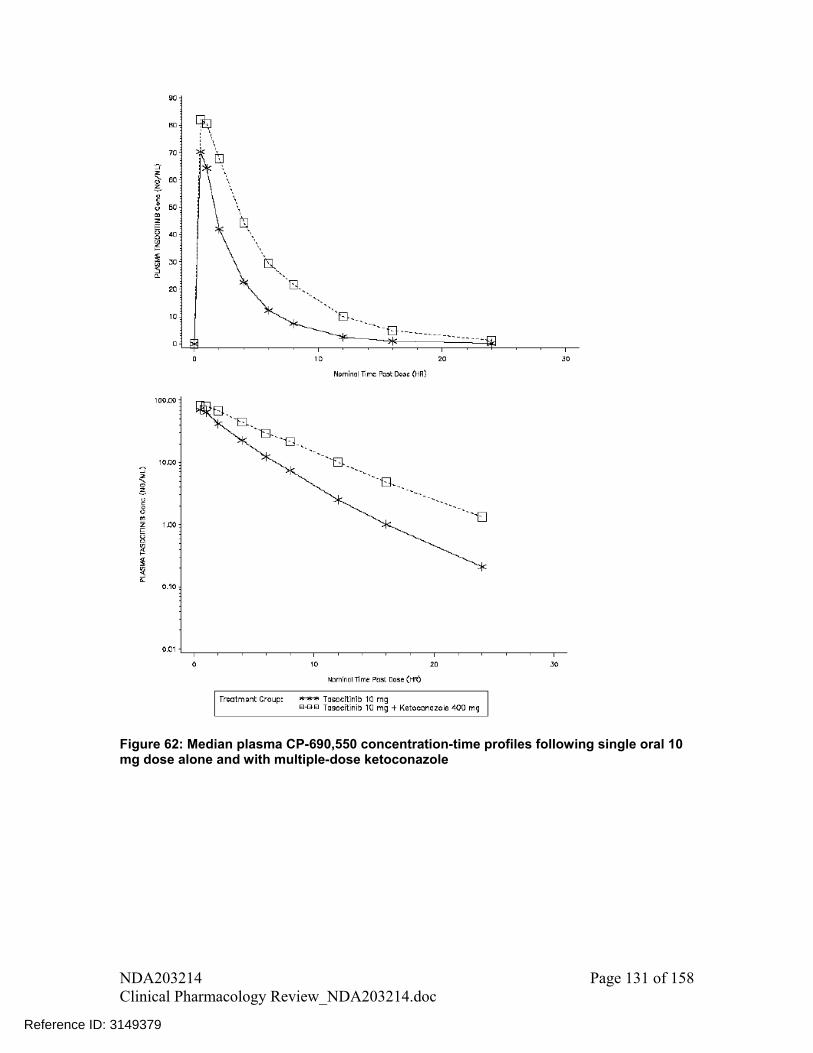
Figure 62: Median plasma CP-690,550 concentration-time profiles following single oral 10 mg dose alone and with multiple-dose ketoconazole
NDA203214 Page 131 of 158 Clinical Pharmacology Review_NDA203214.doc
Reference ID: 3149379
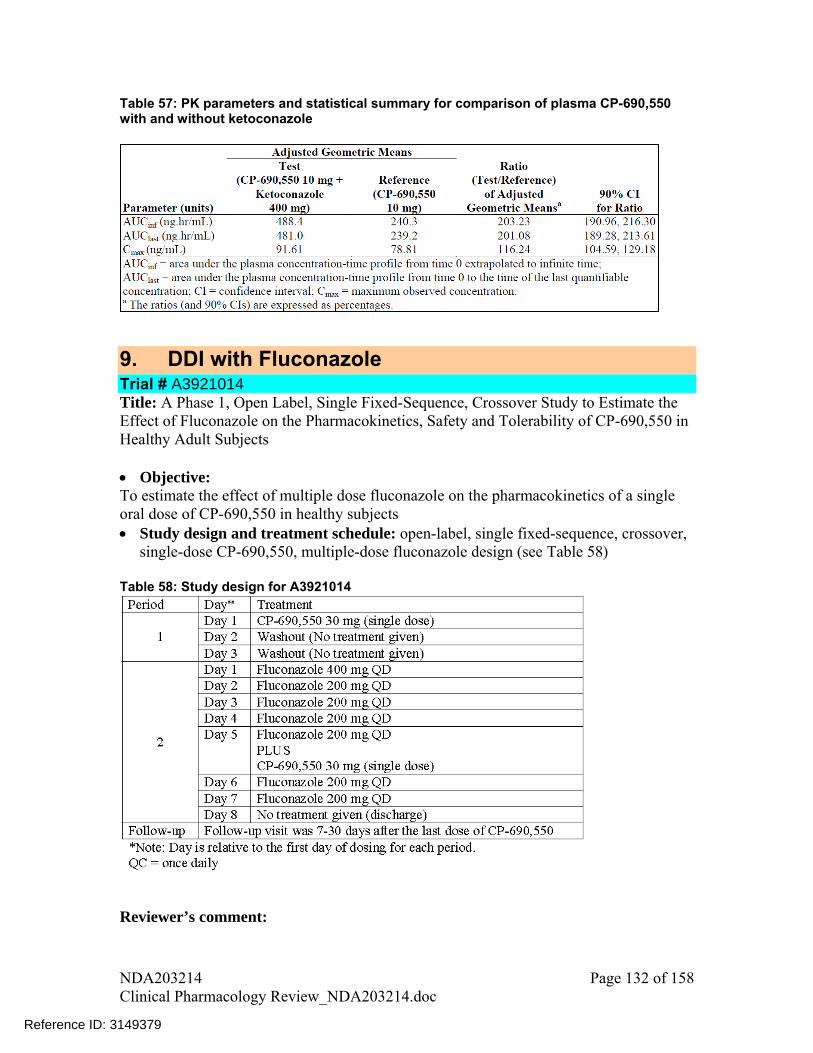
Table 57: PK parameters and statistical summary for comparison of plasma CP-690,550 with and without ketoconazole
9. DDI with Fluconazole Trial # A3921014 Title: A Phase 1, Open Label, Single Fixed-Sequence, Crossover Study to Estimate the Effect of Fluconazole on the Pharmacokinetics, Safety and Tolerability of CP-690,550 in Healthy Adult Subjects Objective: To estimate the effect of multiple dose fluconazole on the pharmacokinetics of a single oral dose of CP-690,550 in healthy subjects Study design and treatment schedule: open-label, single fixed-sequence, crossover,
single-dose CP-690,550, multiple-dose fluconazole design (see Table 58) Table 58: Study design for A3921014
Reviewer’s comment:
NDA203214 Page 132 of 158 Clinical Pharmacology Review_NDA203214.doc
Reference ID: 3149379


Plasma- 0, 0.25, 0.5, 1, 2, 3, 4, 8, 12, 24, 48 and 72 hours after dosing in Period 1 (Days 1) and Period 2 (Day5)
Results: Coadministration with fluconazole increased Cmax and AUC and slowed down the clearance (increased terminal half-life) of CP-690,550 (Figure 64). CP-690,550 AUC increased by 79% and Cmax increased by 27% following coadministration with fluconazole (Table 59). Conclusions: When coadministered with fluconazole, tofacitinib exposure increased by ~79%. Reviewer’s Comments:
o Mean plasma concentration data for tofacitinib with and without fluconazole were modeled using WinNonlin and simulations were performed to identify the optimum dosing based on exposure matching for tofacitinib coadministration with fluconazole. For details on the dosing recommendations please check the Clinical Pharmacology review.
Figure 64: Plasma concentration -time profiles for CP-690,550 following a single 30 mg dose of CP-690,550 alone or in combination with fluconazole (fluconazole at steady-state)
NDA203214 Page 134 of 158 Clinical Pharmacology Review_NDA203214.doc
Reference ID: 3149379
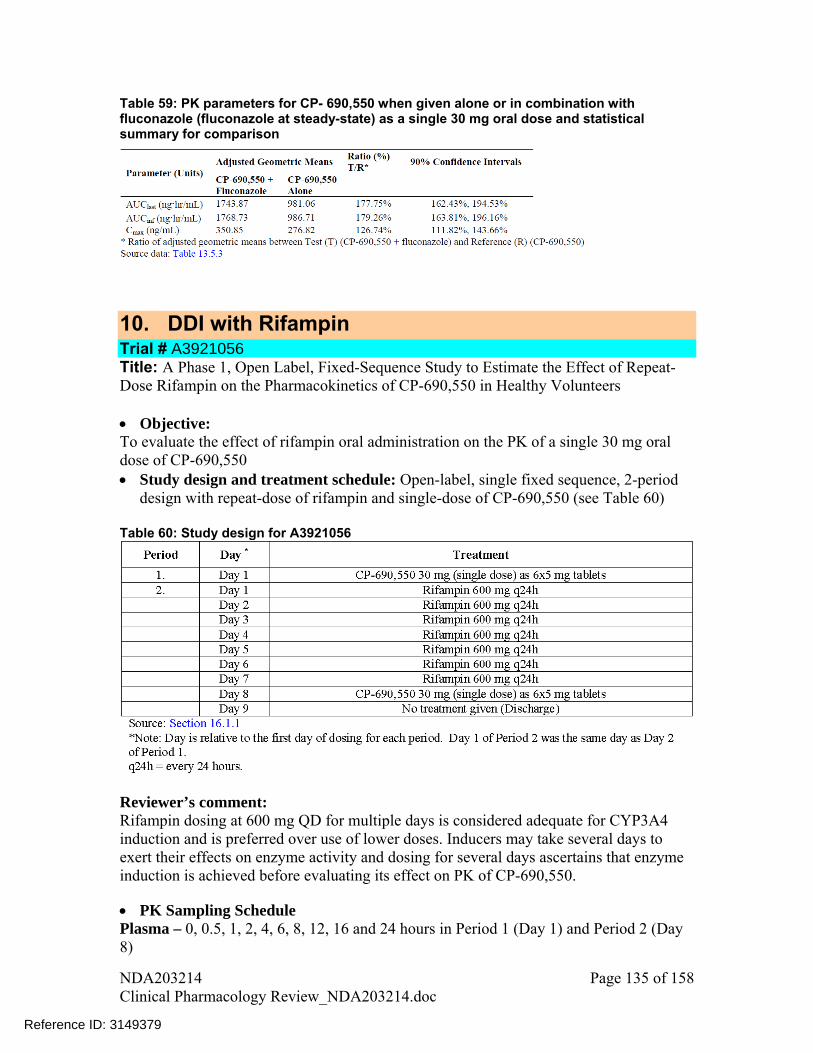
Table 59: PK parameters for CP- 690,550 when given alone or in combination with fluconazole (fluconazole at steady-state) as a single 30 mg oral dose and statistical summary for comparison
10. DDI with Rifampin Trial # A3921056 Title: A Phase 1, Open Label, Fixed-Sequence Study to Estimate the Effect of Repeat-Dose Rifampin on the Pharmacokinetics of CP-690,550 in Healthy Volunteers Objective: To evaluate the effect of rifampin oral administration on the PK of a single 30 mg oral dose of CP-690,550 Study design and treatment schedule: Open-label, single fixed sequence, 2-period
design with repeat-dose of rifampin and single-dose of CP-690,550 (see Table 60) Table 60: Study design for A3921056
Reviewer’s comment: Rifampin dosing at 600 mg QD for multiple days is considered adequate for CYP3A4 induction and is preferred over use of lower doses. Inducers may take several days to exert their effects on enzyme activity and dosing for several days ascertains that enzyme induction is achieved before evaluating its effect on PK of CP-690,550.
PK Sampling Schedule Plasma – 0, 0.5, 1, 2, 4, 6, 8, 12, 16 and 24 hours in Period 1 (Day 1) and Period 2 (Day 8)
NDA203214 Page 135 of 158 Clinical Pharmacology Review_NDA203214.doc
Reference ID: 3149379

Results and Conclusions: Coadministration with rifampin significantly decreased AUC by 84% and Cmax by 74%.
low exposures may not be efficacious therefore coadministration of CP-90,550 with rifampin is not recommended.
(Figure 65 and Table 61). These6
Figure 65: Median CP-690,550 Plasma Concentration-Time Profiles Following
dministration of CP-690,550 alone or post 7 days of rifampin 6 0 mg QD
d without fampin and statistical summary for treatment comparisons
a 0
able 61: PK parameters for CP-690,550 following coadministration with anTri
11. DDI with Methotrexate Trial A3921013 Title: Phase 1, Open Label Study of the P
# A harmacokinetics of Multiple Doses of Oral
le Doses of Oral Methotrexate in Rheumatoid Arthritis Subjects CP-690,550 and Sing
NDA203214 Page 136 of 158 Clinical Pharmacology Review_NDA203214.doc
Reference ID: 3149379
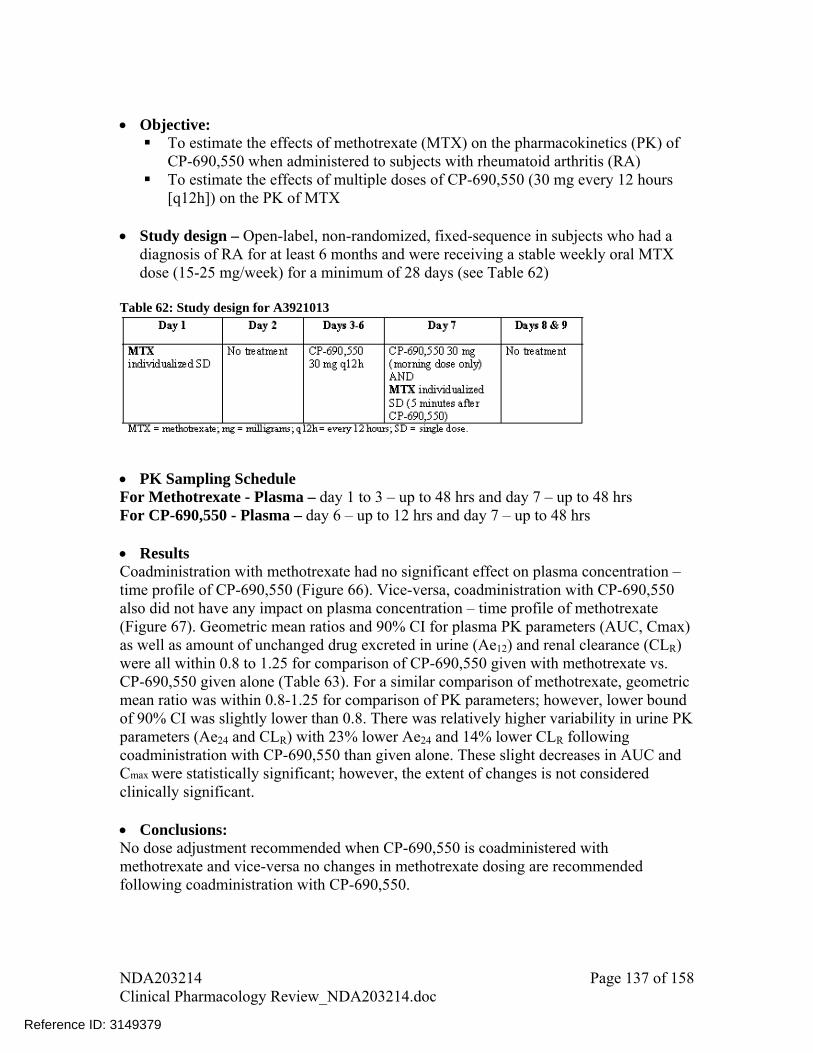
Objective: To estimate the effects of methotrexate (MTX) on the pharmacokinetics (PK) of
50 when administered to subjects with rheumatoid arthritis (RA)
Stud -randomized, fixed-sequence in subjects who had a
diagnosis of RA for at least 6 months and were receiving a stable weekly oral MTX
Tab
CP-690,5 To estimate the effects of multiple doses of CP-690,550 (30 mg every 12 hours
[q12h]) on the PK of MTX
y design – Open-label, non
dose (15-25 mg/week) for a minimum of 28 days (see Table 62)
le 62: Study design for A3921013
PK Sampling Schedule or Methotrexate - Plasma – day 1 to 3 – up to 48 hrs and day 7 – up to 48 hrs
day 6 – up to 12 hrs and day 7 – up to 48 hrs
oadministration with methotrexate had no significant effect on plasma concentration – of CP-690,550 (Figure 66). Vice-versa, coadministration with CP-690,550
) R)
d
d
o dose adjustment recommended when CP-690,550 is coadministered with ice-versa no changes in methotrexate dosing are recommended
FFor CP-690,550 - Plasma – Results Ctime profile also did not have any impact on plasma concentration – time profile of methotrexate (Figure 67). Geometric mean ratios and 90% CI for plasma PK parameters (AUC, Cmaxas well as amount of unchanged drug excreted in urine (Ae12) and renal clearance (CLwere all within 0.8 to 1.25 for comparison of CP-690,550 given with methotrexate vs. CP-690,550 given alone (Table 63). For a similar comparison of methotrexate, geometricmean ratio was within 0.8-1.25 for comparison of PK parameters; however, lower bounof 90% CI was slightly lower than 0.8. There was relatively higher variability in urine PK parameters (Ae24 and CLR) with 23% lower Ae24 and 14% lower CLR following coadministration with CP-690,550 than given alone. These slight decreases in AUC and Cmax were statistically significant; however, the extent of changes is not considereclinically significant. Conclusions: Nmethotrexate and vfollowing coadministration with CP-690,550.
NDA203214 Page 137 of 158 Clinical Pharmacology Review_NDA203214.doc
Reference ID: 3149379
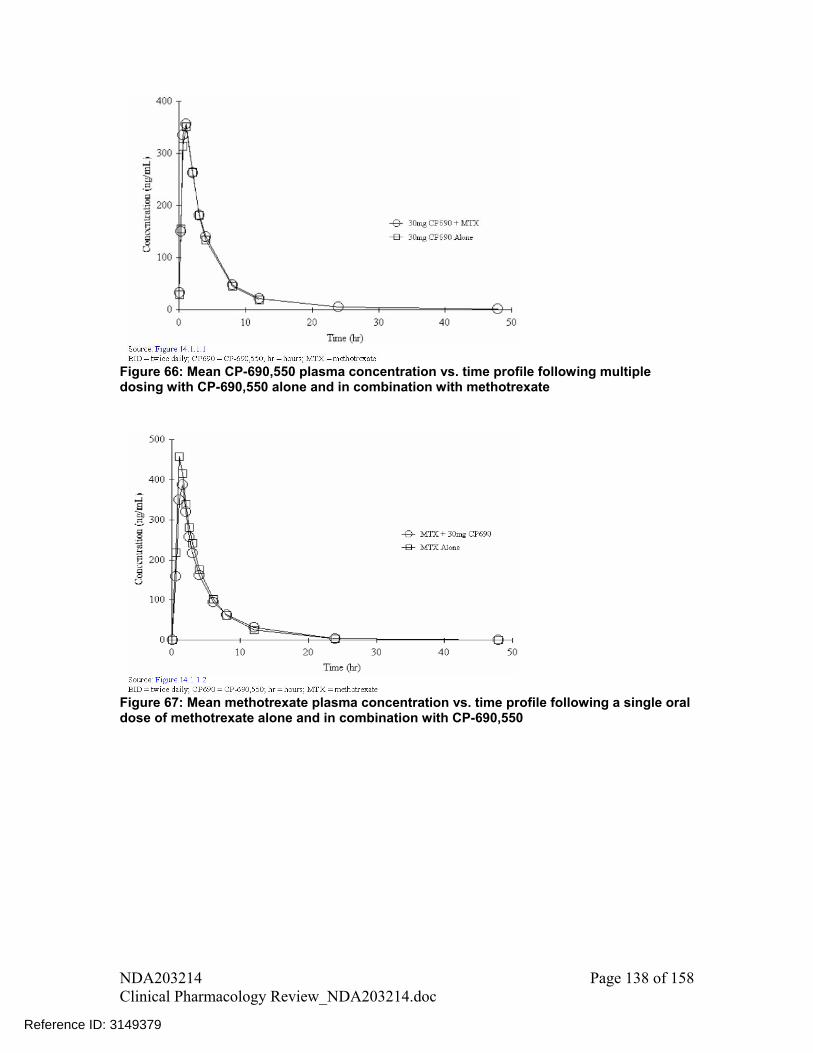
Figure 66: Mean CP-690,550 plasma concentration vs. time profile following multiple dosing with CP-690,550 alone and in combination with methotrexate
Figure 67: Mean methotrexate plasma concentration vs. time profile following a single oral dose of methotrexate alone and in combination with CP-690,550
NDA203214 Page 138 of 158 Clinical Pharmacology Review_NDA203214.doc
Reference ID: 3149379
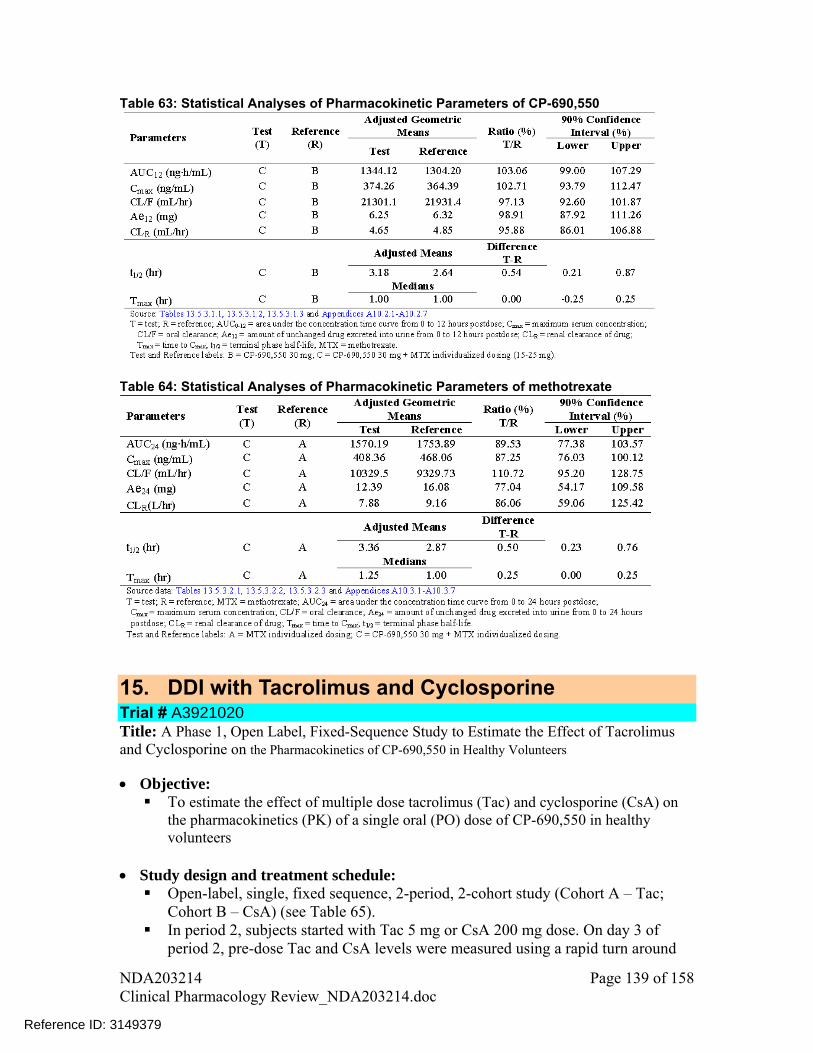
Table 63: Statistical Analyses of Pharmacokinetic Parameters of CP-690,550
Table 64: Statistical Analyses of Pharmacokinetic Parameters of methotrexate
15. DDI with Tacrolimus and Cyclosporine Trial # A3921020 Title: A Phase 1, Open Label, Fixed-Sequence Study to Estimate the Effect of Tacrolimus and Cyclosporine on the Pharmacokinetics of CP-690,550 in Healthy Volunteers
Objective: To estimate the effect of multiple dose tacrolimus (Tac) and cyclosporine (CsA) on
the pharmacokinetics (PK) of a single oral (PO) dose of CP-690,550 in healthy volunteers
Study design and treatment schedule: Open-label, single, fixed sequence, 2-period, 2-cohort study (Cohort A – Tac;
Cohort B – CsA) (see Table 65). In period 2, subjects started with Tac 5 mg or CsA 200 mg dose. On day 3 of
period 2, pre-dose Tac and CsA levels were measured using a rapid turn around
NDA203214 Page 139 of 158 Clinical Pharmacology Review_NDA203214.doc
Reference ID: 3149379
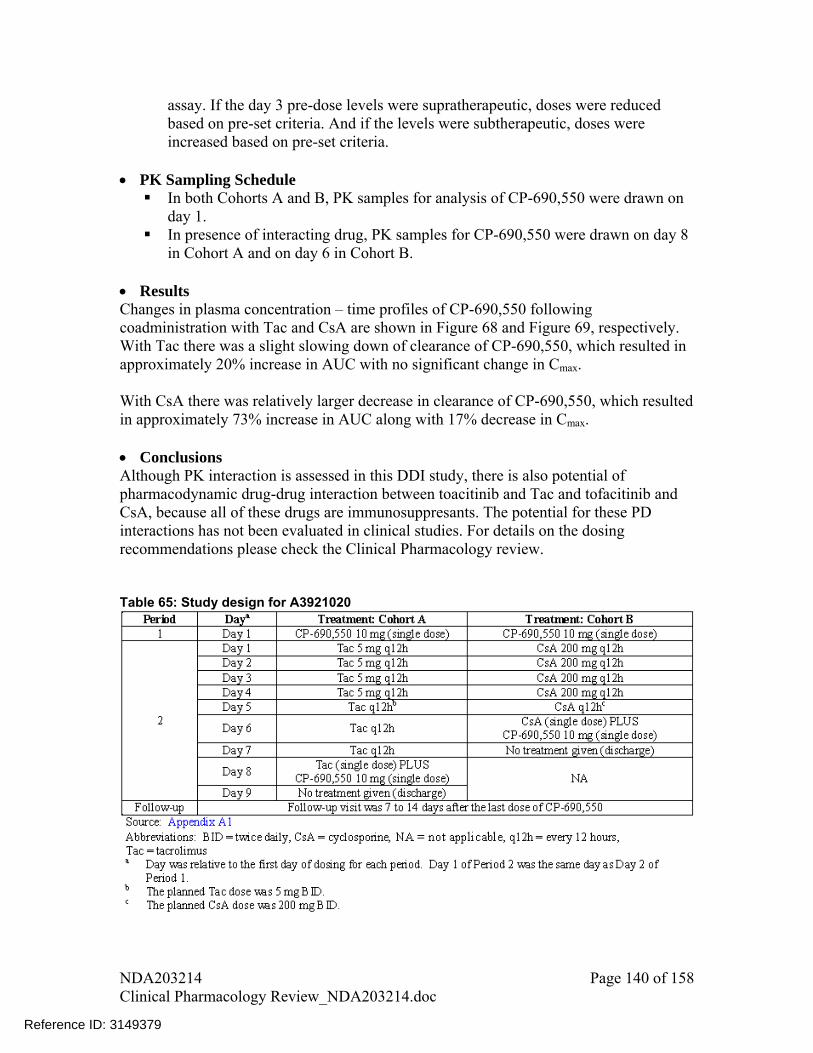
assay. If the day 3 pre-dose levels were supratherapeutic, doses were reduced based on pre-set criteria. And if the levels were subtherapeutic, doses were increased based on pre-set criteria.
Sampling Schedule PK In both Cohorts A and B, PK samples for analysis of CP-690,550 were drawn on
rt A and on day 6 in Cohort B. Res
hanges in plasma concentration – time profiles of CP-690,550 following tion with Tac and CsA are shown in Figure 68 and Figure 69, respectively.
ch resulted in
which resulted approximately 73% increase in AUC along with 17% decrease in Cmax.
lthough PK interaction is assessed in this DDI study, there is also potential of c drug-drug interaction between toacitinib and Tac and tofacitinib and
D
able 65: Study design for A3921020
day 1. In presence of interacting drug, PK samples for CP-690,550 were drawn on day 8
in Coho
ults CcoadministraWith Tac there was a slight slowing down of clearance of CP-690,550, whiapproximately 20% increase in AUC with no significant change in Cmax. With CsA there was relatively larger decrease in clearance of CP-690,550,in Conclusions ApharmacodynamiCsA, because all of these drugs are immunosuppresants. The potential for these Pinteractions has not been evaluated in clinical studies. For details on the dosing recommendations please check the Clinical Pharmacology review. T
NDA203214 Page 140 of 158 Clinical Pharmacology Review_NDA203214.doc
Reference ID: 3149379

igure 68: Median plasma CP-690,550 concentration - time profiles following single 10 mg ral dose alone and with multiple dose tacrolimus
Fo
NDA203214 Page 141 of 158 Clinical Pharmacology Review_NDA203214.doc
Reference ID: 3149379
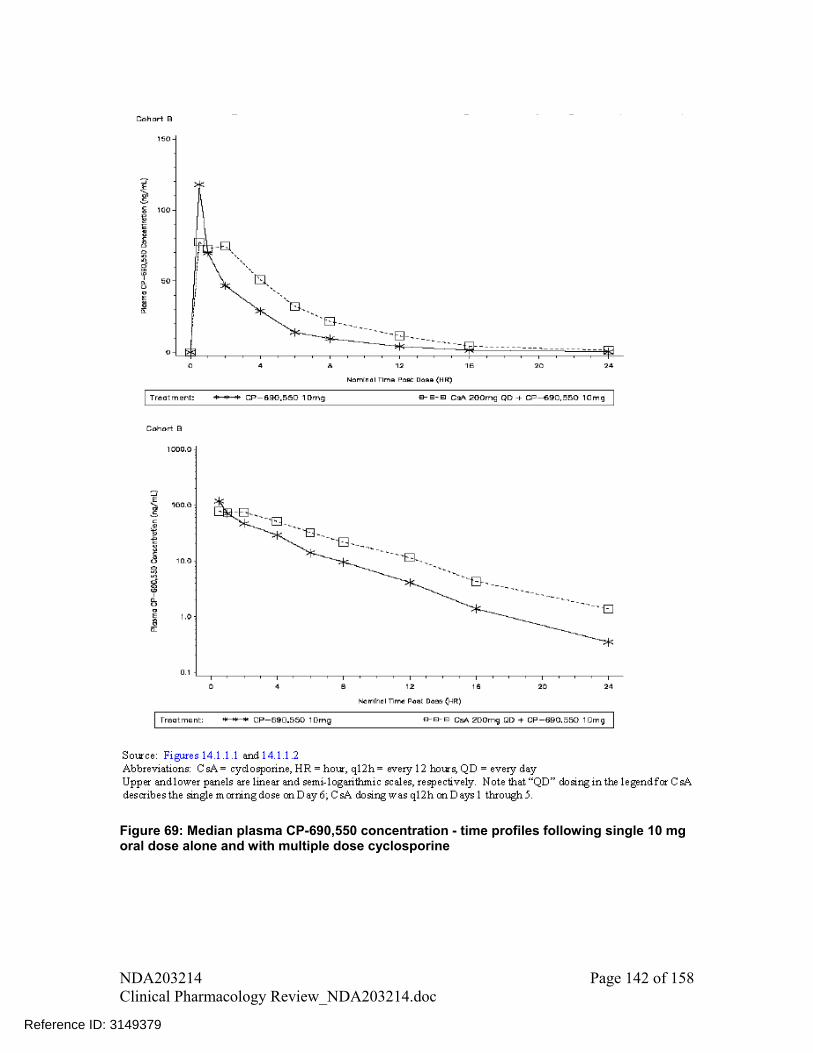
Figure 69: Median plasma CP-690,550 concentration - time profiles following single 10 mg
ral dose alone and with multiple dose cyclosporine o
NDA203214 Page 142 of 158 Clinical Pharmacology Review_NDA203214.doc
Reference ID: 3149379

Table 66: Statistical summary of treatment comparison for CP-690,550 alone and with
ultiple dose Tac m
Table 67: Statistical summary of treatment comparison for CP-690,550 alone and with
ultiple dose CsA m
15. DDI with Midazolam Trial A3921059 Title: Phase 1, Randomized, 2-Way C
# A rossover, Multiple Dose, Open Label Study of
,550 on Midazolam Pharmacokinetics in Healthy Volunteers
To demonstrate the lack of effect of multiple-dose CP-690,550 on the okinetics (PK) of a single, oral dose of midazolam in healthy volunteers
d
able 68).
blood samples were collected before dosing and at 0.5, 1, 2, 3, 4, 6, 8, ostdose in Periods 1 and 2
the Effect of CP-690 Objective:
pharmacStu y design and treatment schedule:
Randomized, 2-way crossover, multiple-dose, open-label study (see T
PK Sampling Schedule Midazolam PK 10, 12, 16, and 24 hours p
NDA203214 Page 143 of 158 Clinical Pharmacology Review_NDA203214.doc
Reference ID: 3149379

Table 68: Treatment sequence for study A3921059
Results There was no significant change in plasma concentration – time profiles of midazolam ollowing administration with and without CP-690,550 (Figure 70). There was no
fference in AUC and Cmax parameters following coadministration of
idazolam llowing coadministration with CP-690,550. Therefore, no dose adjustments are
CYP3A4 substrates when coadministered with CP-690,550.
fstatistical dimidazolam and CP-690,550 compared to midazolam alone (Table 69). Conclusions There was no significant effect on PK of sensitive CYP3A4 substrate mforecommended for
NDA203214 Page 144 of 158 Clinical Pharmacology Review_NDA203214.doc
Reference ID: 3149379

Figure 70: Median plasma midazolam concentration - time profiles following single 2 mg oral syrup dose alone and with multiple dose CP-690,550
NDA203214 Page 145 of 158 Clinical Pharmacology Review_NDA203214.doc
Reference ID: 3149379
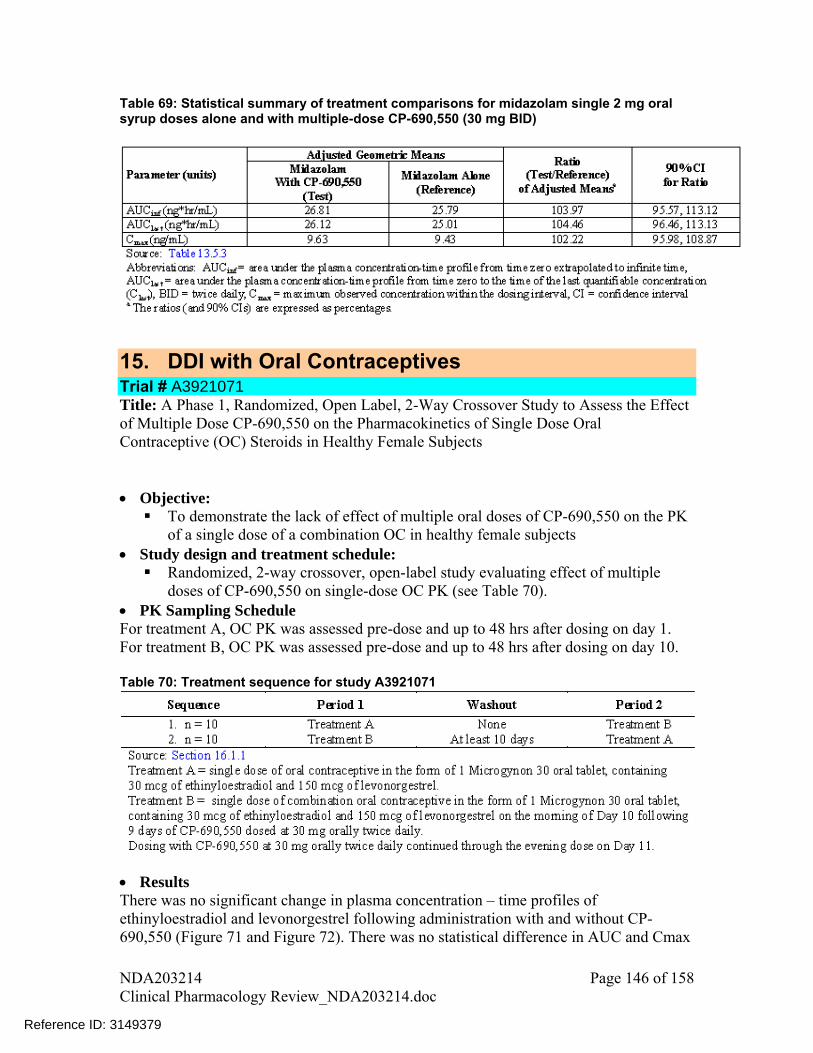
Table 69: Statistical summary of treatment comparisons for midazolam single 2 mg oral syrup doses alone and with multiple-dose CP-690,550 (30 mg BID)
15. DDI with Oral Contraceptives Trial # A3921071 Title: A Phase 1, Randomized, Open Label, 2-Way Crossover Study to Assess the Effect of Multiple Dose CP-690,550 on the Pharmacokinetics of Single Dose Oral Contraceptive (OC) Steroids in Healthy Female Subjects Objective: To demonstrate the lack of effect of multiple oral doses of CP-690,550 on the PK
of a single dose of a combination OC in healthy female subjects Study design and treatment schedule: Randomized, 2-way crossover, open-label study evaluating effect of multiple
doses of CP-690,550 on single-dose OC PK (see Table 70). PK Sampling Schedule For treatment A, OC PK was assessed pre-dose and up to 48 hrs after dosing on day 1. For treatment B, OC PK was assessed pre-dose and up to 48 hrs after dosing on day 10. Table 70: Treatment sequence for study A3921071
Results There was no significant change in plasma concentration – time profiles of ethinyloestradiol and levonorgestrel following administration with and without CP-690,550 (Figure 71 and Figure 72). There was no statistical difference in AUC and Cmax
NDA203214 Page 146 of 158 Clinical Pharmacology Review_NDA203214.doc
Reference ID: 3149379
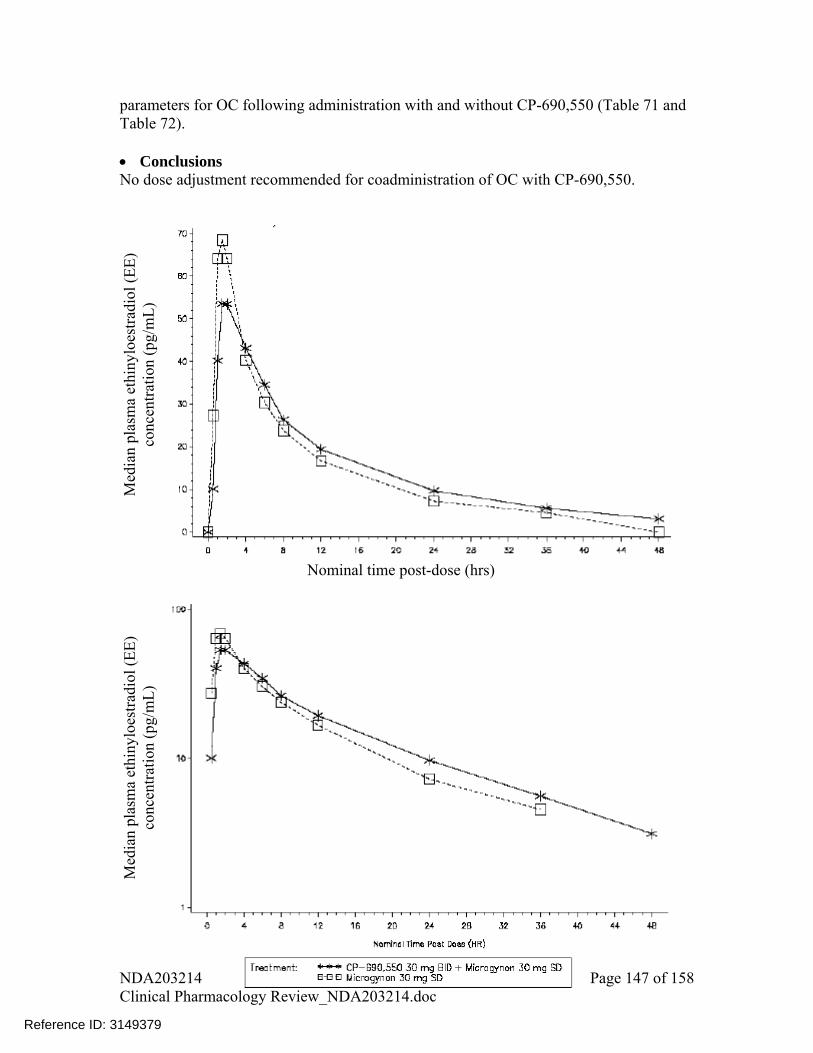
parameters for OC following administration with and without CP-690,550 (Table 71 and Table 72). Conclusions No dose adjustment recommended for coadministration of OC with CP-690,550.
Nominal time post-dose (hrs)
Med
ian
plas
ma
ethi
nylo
estr
adio
l (E
E)
conc
entr
atio
n (p
g/m
L)
Med
ian
plas
ma
ethi
nylo
estr
adio
l (E
E)
conc
entr
atio
n (p
g/m
L)
NDA203214 Page 147 of 158 Clinical Pharmacology Review_NDA203214.doc
Reference ID: 3149379

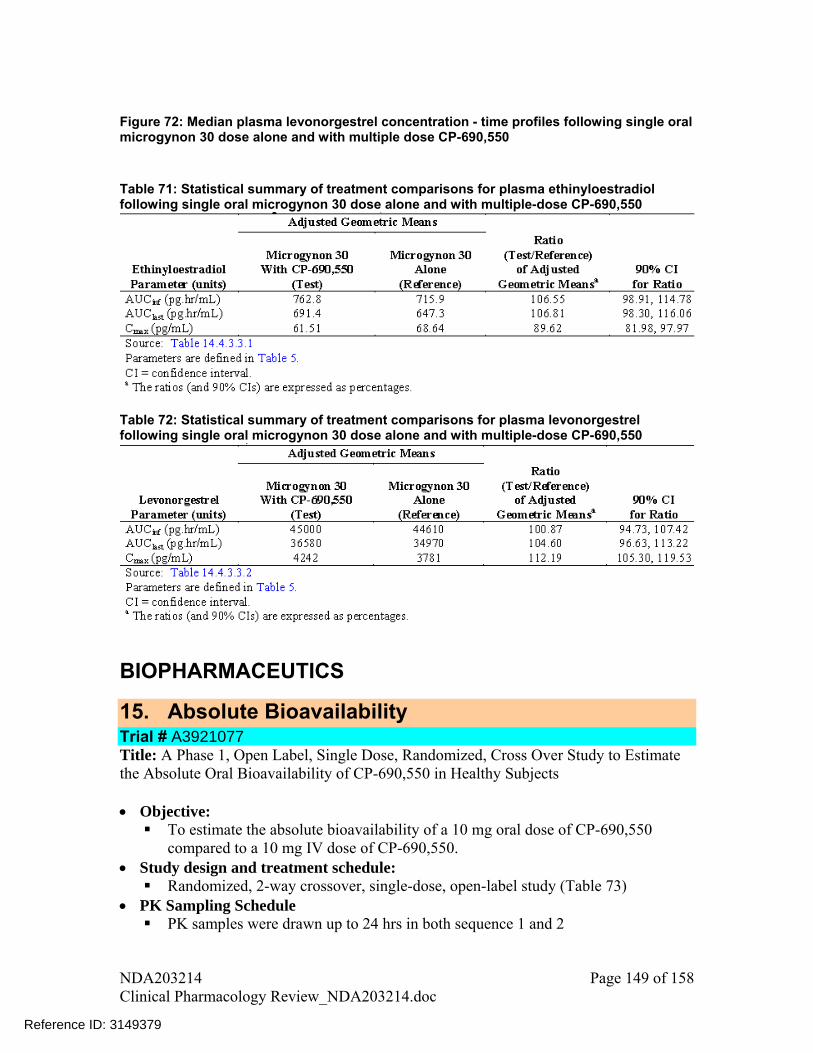
Figure 72: Median plasma levonorgestrel concentration - time profiles following single oral microgynon 30 dose alone and with multiple dose CP-690,550 Table 71: Statistical summary of treatment comparisons for plasma ethinyloestradiol following single oral microgynon 30 dose alone and with multiple-dose CP-690,550
Table 72: Statistical summary of treatment comparisons for plasma levonorgestrel following single oral microgynon 30 dose alone and with multiple-dose CP-690,550
BIOPHARMACEUTICS
15. Absolute Bioavailability Trial # A3921077 Title: A Phase 1, Open Label, Single Dose, Randomized, Cross Over Study to Estimate the Absolute Oral Bioavailability of CP-690,550 in Healthy Subjects Objective: To estimate the absolute bioavailability of a 10 mg oral dose of CP-690,550
compared to a 10 mg IV dose of CP-690,550. Study design and treatment schedule: Randomized, 2-way crossover, single-dose, open-label study (Table 73)
PK Sampling Schedule PK samples were drawn up to 24 hrs in both sequence 1 and 2
NDA203214 Page 149 of 158 Clinical Pharmacology Review_NDA203214.doc
Reference ID: 3149379
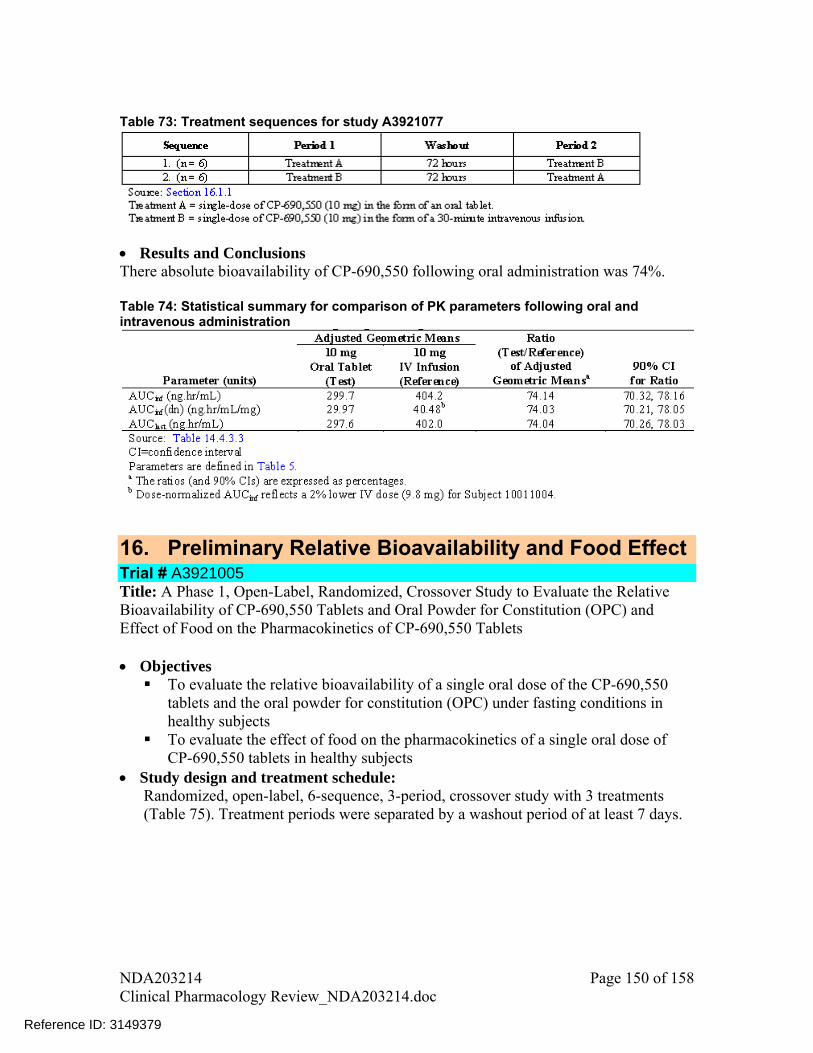
Table 73: Treatment sequences for study A3921077
Results and Conclusions There absolute bioavailability of CP-690,550 following oral administration was 74%. Table 74: Statistical summary for comparison of PK parameters following oral and intravenous administration
16. Preliminary Relative Bioavailability and Food Effect Trial # A3921005 Title: A Phase 1, Open-Label, Randomized, Crossover Study to Evaluate the Relative Bioavailability of CP-690,550 Tablets and Oral Powder for Constitution (OPC) and Effect of Food on the Pharmacokinetics of CP-690,550 Tablets
Objectives To evaluate the relative bioavailability of a single oral dose of the CP-690,550
tablets and the oral powder for constitution (OPC) under fasting conditions in healthy subjects
To evaluate the effect of food on the pharmacokinetics of a single oral dose of CP-690,550 tablets in healthy subjects
Study design and treatment schedule: Randomized, open-label, 6-sequence, 3-period, crossover study with 3 treatments (Table 75). Treatment periods were separated by a washout period of at least 7 days.
NDA203214 Page 150 of 158 Clinical Pharmacology Review_NDA203214.doc
Reference ID: 3149379
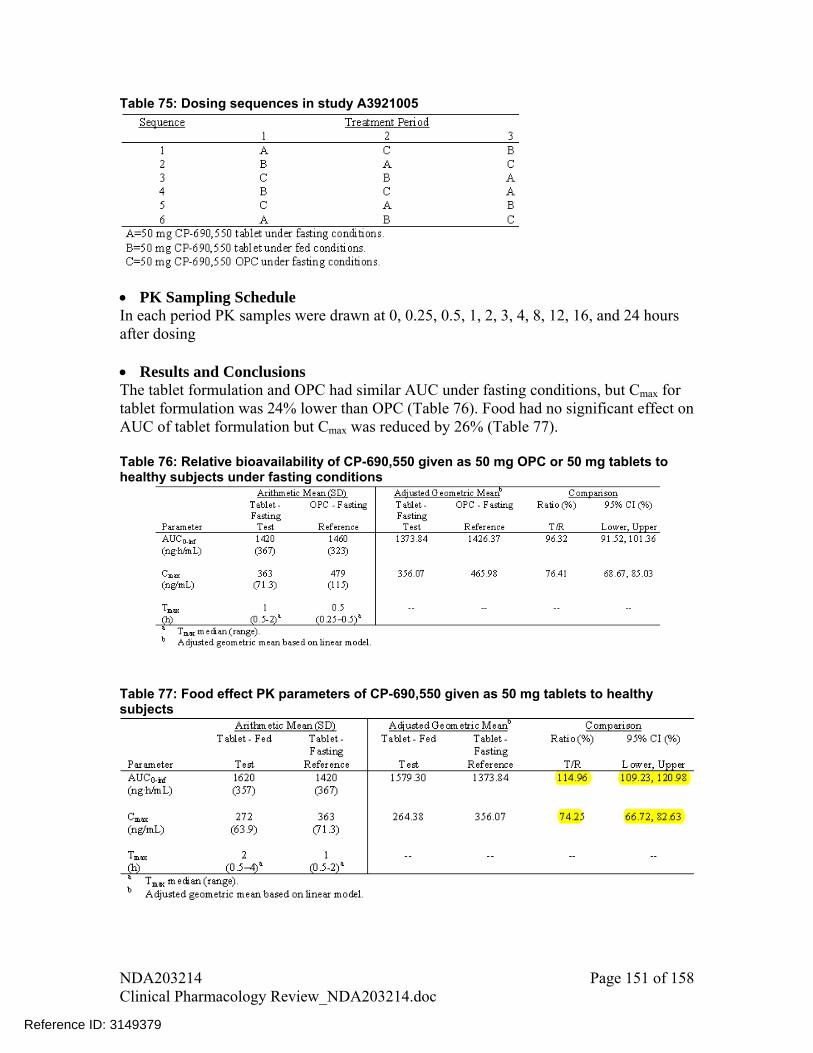
Table 75: Dosing sequences in study A3921005
PK Sampling Schedule In each period PK samples were drawn at 0, 0.25, 0.5, 1, 2, 3, 4, 8, 12, 16, and 24 hours after dosing Results and Conclusions The tablet formulation and OPC had similar AUC under fasting conditions, but Cmax for tablet formulation was 24% lower than OPC (Table 76). Food had no significant effect on AUC of tablet formulation but Cmax was reduced by 26% (Table 77). Table 76: Relative bioavailability of CP-690,550 given as 50 mg OPC or 50 mg tablets to healthy subjects under fasting conditions
Table 77: Food effect PK parameters of CP-690,550 given as 50 mg tablets to healthy subjects
NDA203214 Page 151 of 158 Clinical Pharmacology Review_NDA203214.doc
Reference ID: 3149379
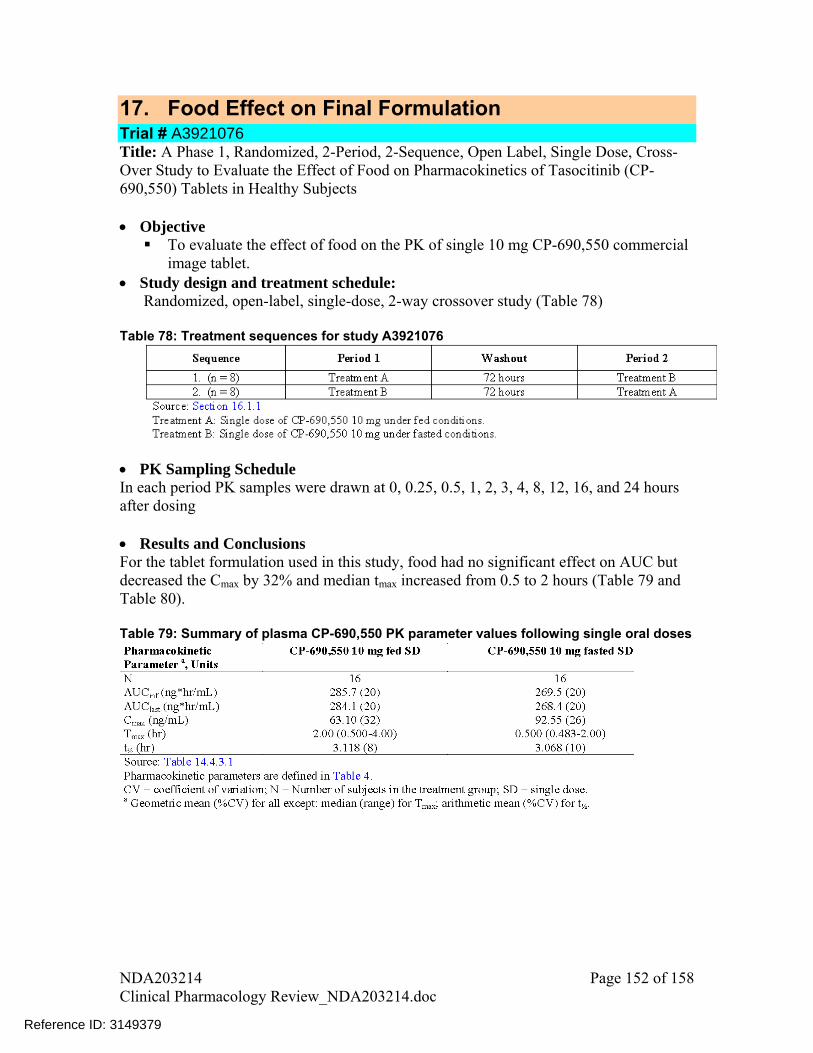
17. Food Effect on Final Formulation Trial # A3921076 Title: A Phase 1, Randomized, 2-Period, 2-Sequence, Open Label, Single Dose, Cross-Over Study to Evaluate the Effect of Food on Pharmacokinetics of Tasocitinib (CP-690,550) Tablets in Healthy Subjects
Objective To evaluate the effect of food on the PK of single 10 mg CP-690,550 commercial
image tablet. Study design and treatment schedule:
Randomized, open-label, single-dose, 2-way crossover study (Table 78)
Table 78: Treatment sequences for study A3921076
PK Sampling Schedule In each period PK samples were drawn at 0, 0.25, 0.5, 1, 2, 3, 4, 8, 12, 16, and 24 hours after dosing Results and Conclusions For the tablet formulation used in this study, food had no significant effect on AUC but decreased the Cmax by 32% and median tmax increased from 0.5 to 2 hours (Table 79 and Table 80). Table 79: Summary of plasma CP-690,550 PK parameter values following single oral doses
NDA203214 Page 152 of 158 Clinical Pharmacology Review_NDA203214.doc
Reference ID: 3149379

Table 80: Statistical summary of treatment comparison under fed and fasted conditions
18. Pivotal Bioequivalence Trial # A3921075 Title: Phase 1, Open-Label, Randomized, Single Dose, 3-Treatment, 3-Period, Cross-Over, Bioequivalence Study Comparing Phase 2B, Phase 3 and Commercial Image Tablet Formulations of Tasocitinib (CP-690,550) under Fasted Conditions
Objectives To determine the bioequivalence of commercial image tablet to Phase 3 tablet
under fasting conditions To determine the bioequivalence of commercial image tablet to Phase 2B tablet
under fasting conditions Study design and treatment schedule: Randomized, 3-way cross-over, single-dose, open-label study in which subjects were randomized to one of the six sequences (Table 81) Table 81: Treatment sequences for study A3921075
PK Sampling Schedule In each period PK samples were drawn at 0, 0.25, 0.5, 1, 2, 4, 8, 12, 16, and 24 hours after dosing Results CP-690,550 plasma concentration – time profiles for all three dosage forms were almost
NDA203214 Page 153 of 158 Clinical Pharmacology Review_NDA203214.doc
Reference ID: 3149379
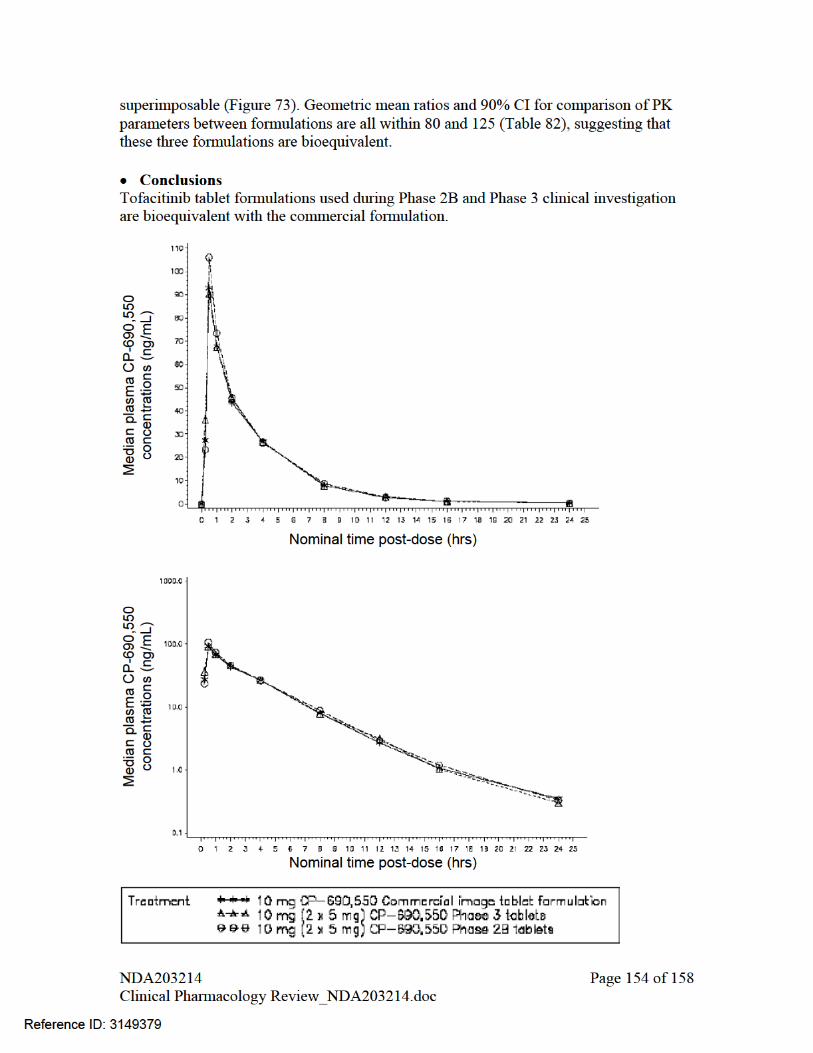
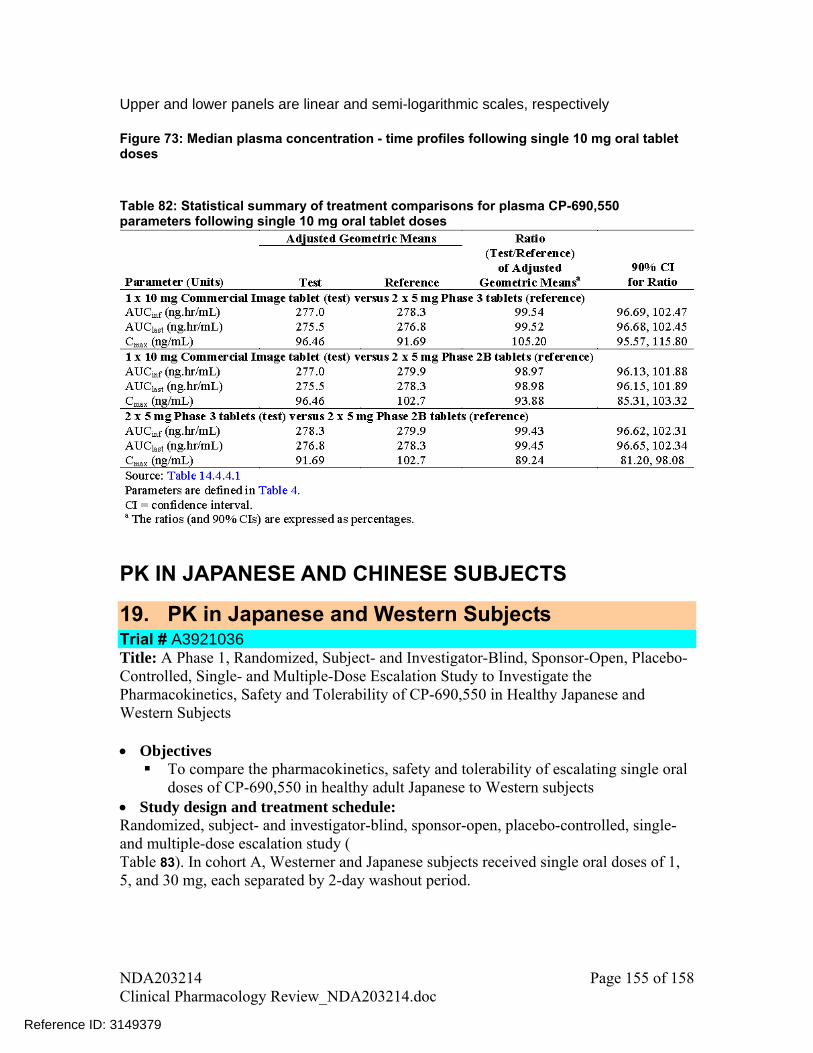
Upper and lower panels are linear and semi-logarithmic scales, respectively Figure 73: Median plasma concentration - time profiles following single 10 mg oral tablet doses Table 82: Statistical summary of treatment comparisons for plasma CP-690,550 parameters following single 10 mg oral tablet doses
PK IN JAPANESE AND CHINESE SUBJECTS
19. PK in Japanese and Western Subjects Trial # A3921036 Title: A Phase 1, Randomized, Subject- and Investigator-Blind, Sponsor-Open, Placebo-Controlled, Single- and Multiple-Dose Escalation Study to Investigate the Pharmacokinetics, Safety and Tolerability of CP-690,550 in Healthy Japanese and Western Subjects
Objectives To compare the pharmacokinetics, safety and tolerability of escalating single oral
doses of CP-690,550 in healthy adult Japanese to Western subjects Study design and treatment schedule: Randomized, subject- and investigator-blind, sponsor-open, placebo-controlled, single- and multiple-dose escalation study ( Table 83). In cohort A, Westerner and Japanese subjects received single oral doses of 1, 5, and 30 mg, each separated by 2-day washout period.
NDA203214 Page 155 of 158 Clinical Pharmacology Review_NDA203214.doc
Reference ID: 3149379

Table 83: Treatment cohorts in study A3921036
PK Sampling Schedule
or PK analysis were collected at 0 hour and 0.25, 0.5, 1, 2, 4,
Results plasma concentration – time profiles between Western and Japanese subjects
he PK profile in Japanese subjects after single and multiple dose were also comparable
In cohort A, blood samples f8, 12, 16, 24 and 48 hours after dosing CP-690,550 are comparable at all three studied dose levels, 1mg, 5mg, and 30 mg (Figure 74). The geometric mean ratios for comparison of PK parameters between two populations are close to 1 (Table 84), suggesting that PK parameters are comparable. T(Figure 75) with observed accumulation ratio of 1.15 (range: 0.997 to 1.31), which is approximately similar to the accumulation ratio observed in multiple dose study A3921003 (Table 47).
igure 74: Mean plasma concentration of CP-690,550 following single oral dose Fadministration in healthy Japanese and Western subjects
NDA203214 Page 156 of 158 Clinical Pharmacology Review_NDA203214.doc
Reference ID: 3149379

Table 84: Mean PK parameters of CP-690,550 following administration of single doses in healthy Japanese and Western subjects
Figure 75: Mean (+SD) plasma concentration of CP-690,550 following a mi r tion of a
Conclusions nib is comparable between subjects with Japanese and Western
d nist asinge oral dose of 15 mg and multiple oral doses of 15 mg BID for 5 days in Japanese healthy subjects The PK of tofacitiethnicity.
20. PK in Chinese Subjects Trial # A3921065 Title: An Open Label, Single and Multiple Dose Study to Investigate the PK, Safety and
NDA203214 Page 157 of 158 Clinical Pharmacology Review_NDA203214.doc
Reference ID: 3149379

NDA203214 Page 158 of 158 Clinical Pharmacology Review_NDA203214.doc
ive
racterize the PK of single and multiple oral doses of CP-690,550 in healthy
Study design and treatment schedule: dy in healthy adult male and female Chinese
able 85: Dosing sequence for study A3921065
Tolerability of CP-690,550 in Healthy Chinese Subjects
Object To cha
adult Chinese subjects
Open-label, single- and multiple-dose PK stusubjects T
Results
acteristics of tofacitinib in Chinese subjects were similar to that observed in
3.3
able 86: Summary of PK in Chinese subjects
The PK charsubjects from Western or Japanese ethnicities. These PK characteristics were: a rapid absorption with Tmax of approximately 0.5 hrs, short elimination half-life of about 2.5-hrs, attainment of steady-state by 24 hours and negligible accumulation after multiple doses (Table 86). T
Reference ID: 3149379
---------------------------------------------------------------------------------------------------------This is a representation of an electronic record that was signedelectronically and this page is the manifestation of the electronicsignature.---------------------------------------------------------------------------------------------------------/s/----------------------------------------------------
LOKESH JAIN06/22/2012
VENKATESH A BHATTARAM06/23/2012
JEFFREY B KRAFT06/25/2012
MICHAEL A PACANOWSKI06/25/2012
SURESH DODDAPANENI06/25/2012
Reference ID: 3149379

2
RECOMMENDATION: From the Biopharmaceutics perspective, NDA 203-214 for ® (tofacitinib citrate) Tablets is recommended for approval. _______________________________________ _________________ John Duan, Ph.D. Date Reviewer ONDQA Biopharmaceutics _______________________________________________ ____________________ Angelica Dorantes, Ph.D. Date ONDQA Biopharmaceutics Team Leader cc: NDA 203-214 Darrts
Reference ID: 3147922
(b) (4)
4
method to discriminate against deviations in formulation or manufacturing conditions using aberrant formulations.
• Dissolution does not change with storage time. There were no trends observed in the dissolution values at 15 minutes for samples stored under long term stability conditions at 25°C/60% RH and 30°C/75% RH for 12 months, and under accelerated conditions at 40°C/75% RH for 6 months.
3. Setting the acceptance criterion for the disintegration test Based on the provided data the acceptance criterion for the disintegration test should be set at , due to the following reasons:
• The maximum disintegration time in all the studies, including DOE and the study using aberrant tablets, is .
• The relationship between dissolution and disintegration time beyond is not clear.
• One of the advantages of using the disintegration method is that it is more discriminating than the dissolution method. Inadequate control of disintegration test will lose this advantage.
• The stability batches showed less than disintegration time under various conditions up to 12 months as shown in the following figures.
Batch-Strength-Container-Condi ion
Reference ID: 3147922
(b) (4)
(b) (4)
(b) (4)
(b) (4)
(b) (4)
5
Disintegration Time for Stability Batches after 3 Months
Batch-Strength-Container-Condi ion
Disintegration Time for Stability Batches after 6 Months
Batch-Strength-Container-Condi ion
Reference ID: 3147922
(b) (4)
(b) (4)

6
Disintegration Time for Stability Batches after 9 Months
Batch-Strength-Container-Condi ion
Batch-Strength-Container-Condi ion
It is recommended that the acceptance criterion of for the disintegration test be implemented and a revised specification table for their drug product be provided. This recommendation was conveyed to the Applicant*.
Reference ID: 3147922
(b) (4)
(b) (4)
(b) (4)
7
On 6/1/12, the Applicant provided additional information/data clarifying that all DOE and aberrant tablets data were generated on uncoated tablet cores as part of the process understanding studies. An acceptance criterion of was proposed for the disintegration test. Based on the evaluation of these data and on the expected in vivo performance of the drug product, the Applicant’s proposal is acceptable. All DOE and aberrant tablet studies showed rapid dissolution with a maximum disintegration time of . However, all these studies were conducted using uncoated tablet cores and the disintegration times of the coated tablets are approximately higher than for the uncoated cores (see Appendix III). Therefore, an acceptance criterion of for disintegration testing is reasonable. *Note; There were several communications between FDA and Applicant addressing the disintegration acceptance criterion issue [i.e., 1) FDA’s IR Letters dated 3/16/12 and 6/1/12; 2) a TCON held on 5/30/12; and 3) Applicant’s responses dated 4/30/12 and 6/1/12].
The Applicant agreed to keep the disintegration testing in the specifications of the drug product.
Reference ID: 3147922
(b) (4)
(b) (4)
(b) (4)
(b) (4)
(b) (4)


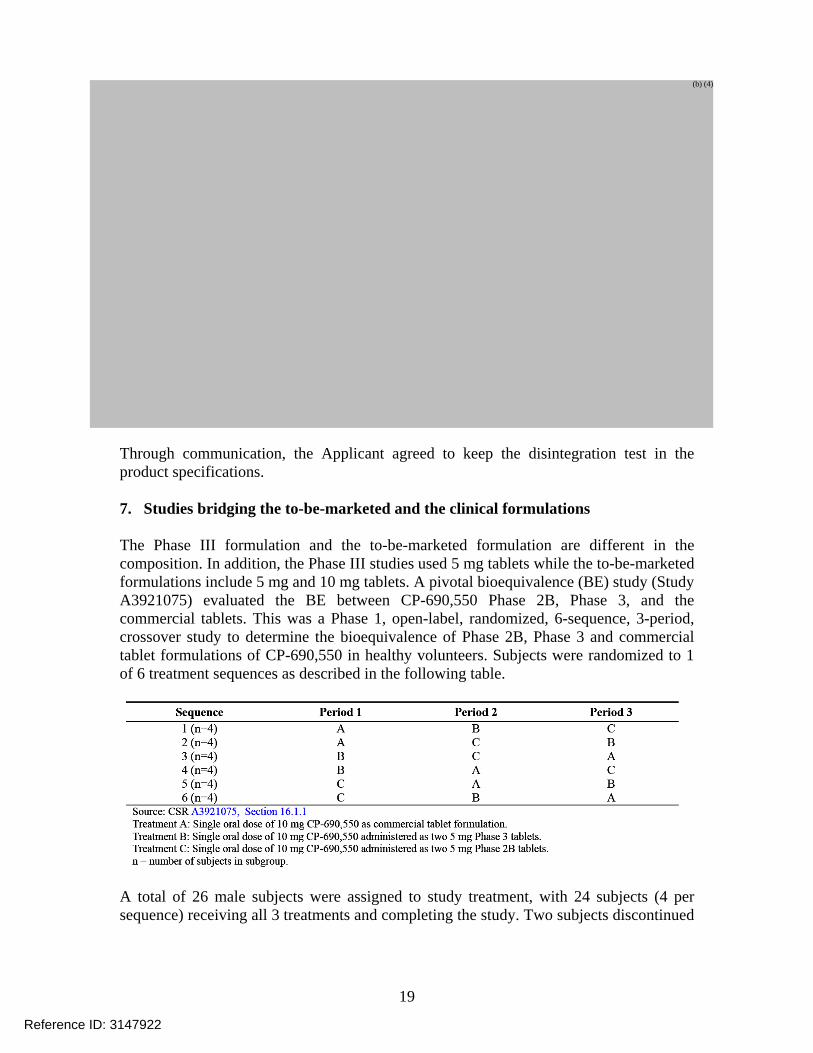
19
Through communication, the Applicant agreed to keep the disintegration test in the product specifications. 7. Studies bridging the to-be-marketed and the clinical formulations The Phase III formulation and the to-be-marketed formulation are different in the composition. In addition, the Phase III studies used 5 mg tablets while the to-be-marketed formulations include 5 mg and 10 mg tablets. A pivotal bioequivalence (BE) study (Study A3921075) evaluated the BE between CP-690,550 Phase 2B, Phase 3, and the commercial tablets. This was a Phase 1, open-label, randomized, 6-sequence, 3-period, crossover study to determine the bioequivalence of Phase 2B, Phase 3 and commercial tablet formulations of CP-690,550 in healthy volunteers. Subjects were randomized to 1 of 6 treatment sequences as described in the following table.
A total of 26 male subjects were assigned to study treatment, with 24 subjects (4 per sequence) receiving all 3 treatments and completing the study. Two subjects discontinued
Reference ID: 3147922
(b) (4)


22
of less than should be implemented for the disintegration test of your product. Provide the revised specifications table for your drug product and update your application accordingly. However, if you do not agree with our recommendation, justify your proposal with adequate supportive data.
4. The Applicant submitted responses to the above IR on 6/8/2012, in which the following explanations were provided.
• All DOE and aberrant tablet data were generated on uncoated tablet cores as part of the process understanding studies. Data showed that the disintegration times of the coated tablets are approximately greater than for the uncoated cores as shown in the following table.
Lab Scale Development Batch Disintegration Data (Minute: Second)
• For these studies average (mean) disintegration times were reported, in contrast to
the maximum disintegration times that are reported for the release testing of the coated tablets.
The Applicant proposed an updated specification of NMT for the disintegration test used for the evaluation of this product.
Reference ID: 3147922
(b) (4)
(b) (4)
(b) (4)
(b) (4)

---------------------------------------------------------------------------------------------------------This is a representation of an electronic record that was signedelectronically and this page is the manifestation of the electronicsignature.---------------------------------------------------------------------------------------------------------/s/----------------------------------------------------
JOHN Z DUAN06/19/2012
ANGELICA DORANTES06/19/2012
Reference ID: 3147922

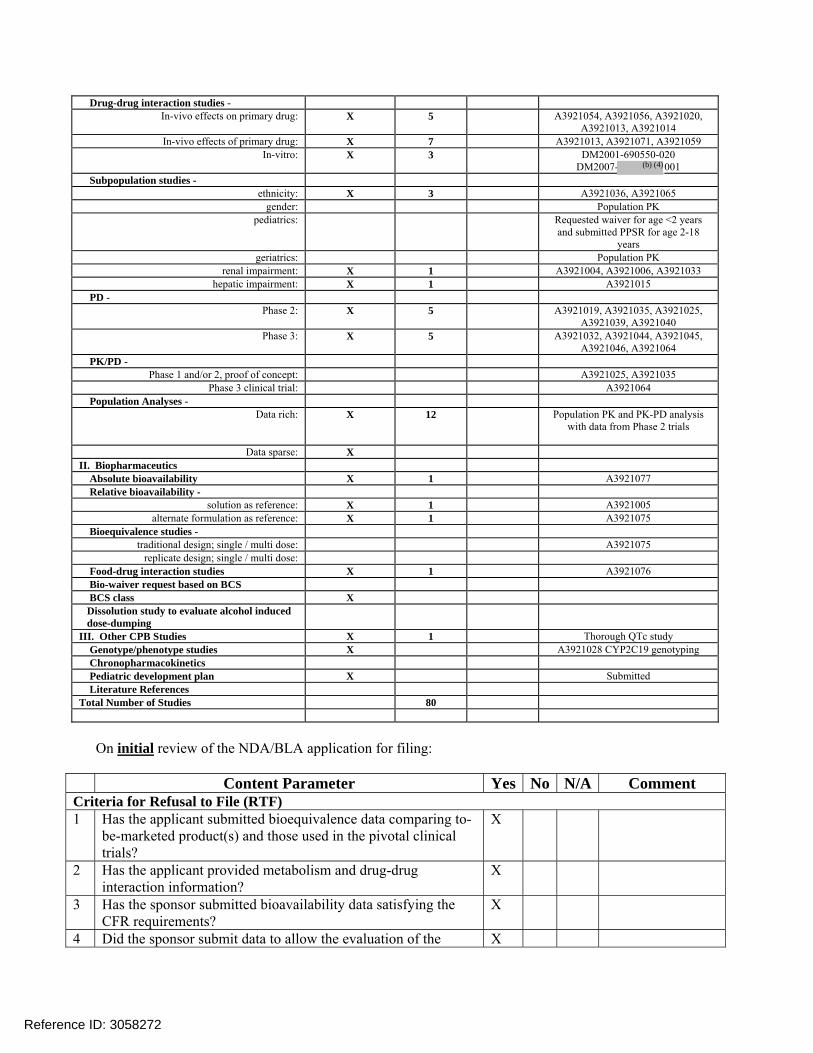
Drug-drug interaction studies - In-vivo effects on primary drug: X 5 A3921054, A3921056, A3921020,
A3921013, A3921014 In-vivo effects of primary drug: X 7 A3921013, A3921071, A3921059
In-vitro: X 3 DM2001-690550-020 DM2007- 001
Subpopulation studies - ethnicity: X 3 A3921036, A3921065
gender: Population PK pediatrics: Requested waiver for age <2 years
and submitted PPSR for age 2-18 years
geriatrics: Population PK renal impairment: X 1 A3921004, A3921006, A3921033
hepatic impairment: X 1 A3921015 PD -
Phase 2: X 5 A3921019, A3921035, A3921025, A3921039, A3921040
Phase 3: X 5 A3921032, A3921044, A3921045, A3921046, A3921064
PK/PD - Phase 1 and/or 2, proof of concept: A3921025, A3921035
Phase 3 clinical trial: A3921064 Population Analyses -
Data rich: X 12 Population PK and PK-PD analysis with data from Phase 2 trials
Data sparse: X
II. Biopharmaceutics Absolute bioavailability X 1 A3921077 Relative bioavailability -
solution as reference: X 1 A3921005 alternate formulation as reference: X 1 A3921075
Bioequivalence studies - traditional design; single / multi dose: A3921075
replicate design; single / multi dose: Food-drug interaction studies X 1 A3921076 Bio-waiver request based on BCS BCS class X Dissolution study to evaluate alcohol induced dose-dumping
III. Other CPB Studies X 1 Thorough QTc study Genotype/phenotype studies X A3921028 CYP2C19 genotyping Chronopharmacokinetics Pediatric development plan X Submitted Literature References Total Number of Studies 80
On initial review of the NDA/BLA application for filing:
Content Parameter Yes No N/A Comment Criteria for Refusal to File (RTF) 1 Has the applicant submitted bioequivalence data comparing to-
be-marketed product(s) and those used in the pivotal clinical trials?
X
2 Has the applicant provided metabolism and drug-drug interaction information?
X
3 Has the sponsor submitted bioavailability data satisfying the CFR requirements?
X
4 Did the sponsor submit data to allow the evaluation of the X
Reference ID: 3058272
(b) (4)

validity of the analytical assay? 5 Has a rationale for dose selection been submitted? X Dose was selected based
on results of trials 1218.25 and 1218.35
6 Is the clinical pharmacology and biopharmaceutics section of the NDA organized, indexed and paginated in a manner to allow substantive review to begin?
X
7 Is the clinical pharmacology and biopharmaceutics section of the NDA legible so that a substantive review can begin?
X
8 Is the electronic submission searchable, does it have appropriate hyperlinks and do the hyperlinks work?
X
Criteria for Assessing Quality of an NDA (Preliminary Assessment of Quality) Data 9 Are the data sets, as requested during pre-submission
discussions, submitted in the appropriate format (e.g., CDISC)? X
10 If applicable, are the pharmacogenomic data sets submitted in the appropriate format?
X
Studies and Analyses 11 Is the appropriate pharmacokinetic information submitted? X 12 Has the applicant made an appropriate attempt to determine
reasonable dose individualization strategies for this product (i.e., appropriately designed and analyzed dose-ranging or pivotal studies)?
X
13 Are the appropriate exposure-response (for desired and undesired effects) analyses conducted and submitted as described in the Exposure-Response guidance?
X
14 Is there an adequate attempt by the applicant to use exposure-response relationships in order to assess the need for dose adjustments for intrinsic/extrinsic factors that might affect the pharmacokinetic or pharmacodynamics?
X
15 Are the pediatric exclusivity studies adequately designed to demonstrate effectiveness, if the drug is indeed effective?
X
16 Did the applicant submit all the pediatric exclusivity data, as described in the WR?
X
17 Is there adequate information on the pharmacokinetics and exposure-response in the clinical pharmacology section of the label?
X
General 18 Are the clinical pharmacology and biopharmaceutics studies of
appropriate design and breadth of investigation to meet basic requirements for approvability of this product?
X
19 Was the translation (of study reports or other study information) from another language needed and provided in this submission?
X
IS THE CLINICAL PHARMACOLOGY SECTION OF THE APPLICATION FILEABLE? ______Yes__ If the NDA/BLA is not fileable from the clinical pharmacology perspective, state the reasons and provide comments to be sent to the Applicant.
Reference ID: 3058272

Please identify and list any potential review issues to be forwarded to the Applicant for the 74-day letter. - None Lokesh Jain 08/02/10 Reviewing Clinical Pharmacologist Date Suresh Doddapaneni 08/02/10 Team Leader/Supervisor Date Submission in brief: Indication and mechanism of action Pfizer, Inc. has submitted the NDA 203214 seeking the marketing approval for Tofacitinib, to be used as monotherapy or in combination with methotrexate or other nonbiologic disease modifying anti-rheumatic drugs (DMARDs), for the treatment of patients with moderately to severely active rheumatoid arthritis (RA) who have had an inadequate response to one or more DMARDs. The recommended dose is 5 mg twice-daily (BID) with an increase to 10 mg BID in some patients based on clinical response. Tofacitinib is an orally administered Janus kinase (JAK) inhibitor. In kinase assays, tofacitinib inhibits JAK1, JAK2, JAK3, and to a lesser extent tyrosine kinase 2 (TyK2). In cellular settings where JAK kinases signal in pairs, tofacitinib preferentially inhibits signaling by heterodimers containing JAK3 and/or JAK1 with functional selectivity over JAK2 homodimer signaling. Inhibition of JAK1 and JAK3 by tofacitinib supposedly blocks signaling through the common gamma chain containing receptors for several cytokines, including IL-2, -4,-7,-9, -15 and -21. These cytokines are integral to lymphocyte activation, proliferation, and function and inhibition of their signaling may thus result in modulation of multiple aspects of the immune response. In addition, inhibition of JAK1 will also likely results in attenuation of signaling by additional proinflammatory cytokines, such as IL-6 and interferon (IFN) γ. At higher exposures, inhibition of erythropoietin signaling could also occur via inhibition of JAK2 homodimer signaling. Summary of information submitted NDA 203214 consists of 13 in vitro studies with human materials, 21 Phase 1 studies, 8 Phase 2 studies (6 completed, 2 ongoing), 6 Phase 3 studies (4 completed, 2 ongoing, data from 5 trials are used to support efficacy and safety), and 12 population based modeling analyses. The clinical pharmacology information for Tofacitinib is mainly derived from Phase 1 studies as well as in vitro studies evaluating permeability, plasma protein binding, role of transporters, and potential for CYP 450 metabolic enzymes inhibition and induction. Population based modeling analyses including population pharmacokinetics analysis were performed to assess the effect of covariates and to understand the time course of effect and toxicities and their association with dose or exposure. In addition, 24 bioanalytical reports have been submitted to measure the levels of parent compound, main metabolites, co-administered drugs such as methotrexate, and PD markers such as CRP.
Reference ID: 3058272


Summary of population based modeling analysis Sponsor conducted population pharmacokinetic analysis, and several other population based modeling analysis for pharmacodynamic markers based on mechanism of action (such as C - reactive protein and lymphocyte counts) and for safety endpoints (such as hemoglobin, LDLc, neutrophils, ALT, serum creatinine, and blood pressure). Sponsor reported findings from these modeling based analyses are summarized in Table 1.
Reference ID: 3058272

Table 1. Summary of Findings from Population Based Modeling Analyses
Endpoint Dose range Relationship Mechanism of action based PD endpoints CRP 1-15 mg BID • Dose-dependent reductions within 2 weeks with minimal additional decrease beyond 2
weeks • Median %reduction from baseline for 5 and 10 mg BID: 75-80%
Pan T-lymphocytes
1-30 mg BID No consistent pattern
Helper T-lymphocytes with MHC-II
1-30 mg BID No consistent pattern
Cytotoxic T-lymphocytes with MHC-I
1-30 mg BID No consistent pattern
Natural Killer (NK) Cells
1-30 mg BID • Dose-dependent decrease • nadir 8-10 wk • at nadir 36% & 47% reductions in NK cells from baseline for 5 and 10 mg dose • return to baseline within 4-wk of cessation of therapy • No clear association of lower NK cells with increased incidences of serious infection,
herpes zoster, and malignancies B-lymphocytes 1-30 mg BID Dose-dependent increase Safety endpoints Neutrophils 5-30 mg BID • Dose-dependent reduction
• stabilization of mean ANC by 6-8 weeks with no progressive decline thereafter, fortreatment duration lasting over 2 years
• 10 mg BID dose have 1.4 and 1.6 times increased risk of mild/moderate and severeneutropenia, relative to 5 mg BID
Reference ID: 3058272

LDL 1-30 mg • Dose-dependent increase, plateaus at 15 mg BID • patients with higher • baseline LDL-c levels showed smaller fractional increases relative to patients with lower
baseline LDL-c concentrations • 13.4% and 18.1% increase from baseline for 5 and 10 mg BID dose
ALT 1-30 mg • Dose dependent increase • background MTX had higher baseline and post-treatment ALT values than those without
MTX usage • <1% of >3xULN increase at 5 and 10 mg doses
SCr 1-30 mg • Similar increase for 5 & 10 mg dose • At wk 24: Non-Asian: 8.2-8.9%; Asian: 9.6-10.5% • From Phase 3 studies increase was 0.06 and 0.08 mg/dL for 5 and 10 mg BID,
respectively, over 12 months • Study A3921033 in healthy subjects showed no effect on mGFR (iohexol serum
clearance), CLCr, and renal plasma flow (PAH renal clearance) after 14 days of treatment• Study A3921152 planned for evaluation of effect of tofacitinib (42 days treatment) on
mGFR in patients with active RA BP 0.1-100 mg
Phase 1; 1-30 mg Phase 2
• No dose-response • SBP increase of 0.3 and 0.6 mmHg for 5 and 10 mg BID over placebo, respectively • No differences in DBP
Serious infection & Malignancy
1-30 mg • Serious infection: 1.3-1.9 times greater likelihood with 10 mg BID vs. 5 mg BID • Malignancy: no association with dose
Reference ID: 3058272

Summary of drug-interaction studies Effect of other drugs on Tofacitinib Effect of co-administration of ketoconazole, fluconazole, rifampin, cyclosporine A, tacrolimus, and methotrexate on tofacitinib exposure (AUC) and Cmax was evaluated. When given with ketoconazole (a potent CYP3A4 and P-gp inhibitor) tofacitinib AUC and Cmax increased by 103% and 16%, respectively. With fluconazole (a CYP3A4 and CYP2C19 inhibitor) AUC and Cmax increased by ~79% and ~30%, respectively. Sponsor recommended keeping the maximum dose to 5 mg bid in cases of co-administration with these drugs. For co-administration with rifampin (a potent CYP3A4 inducer), AUC and Cmax decreased to 26% and 16% of that for the reference product, respectively. Co-administration with cyclosporine A, tacrolimus, and methotrexate did not have any significant effect on tofacitinib AUC and Cmax. Effect of Tofacitinib on other drugs Effect of tofacitinib co-administration on midazolam, methotrexate, and ethinylestradiol AUC and Cmax was evaluated. No significant change in AUC and Cmax was observed for any of the studied drug. Mid-Cycle Deliverables Following are the Mid-Cycle Deliverables; • Any approvability issues • Dose Selection • Exposure-Response Evaluation for Efficacy and Safety • Drug-drug Interaction and Extrinsic/Intrinsic Factors • Labeling
Reference ID: 3058272
---------------------------------------------------------------------------------------------------------This is a representation of an electronic record that was signedelectronically and this page is the manifestation of the electronicsignature.---------------------------------------------------------------------------------------------------------/s/----------------------------------------------------
LOKESH JAIN12/14/2011
SURESH DODDAPANENI12/14/2011
Reference ID: 3058272