Embed Size (px)
Citation preview

204 VOLUME 18W E A T H E R A N D F O R E C A S T I N G
q 2003 American Meteorological Society
Annular Hurricanes
JOHN A. KNAFF AND JAMES P. KOSSIN
Cooperative Institute for Research in the Atmosphere, Colorado State University, Fort Collins, Colorado
MARK DEMARIA
NOAA/NESDIS, Fort Collins, Colorado
(Manuscript received 15 January 2002, in final form 15 October 2002)
ABSTRACT
This study introduces and examines a symmetric category of tropical cyclone, which the authors call annularhurricanes. The structural characteristics and formation of this type of hurricane are examined and documentedusing satellite and aircraft reconnaissance data. The formation is shown to be systematic, resulting from whatappears to be asymmetric mixing of eye and eyewall components of the storms involving either one or twopossible mesovortices. Flight-level thermodynamic data support this contention, displaying uniform values ofequivalent potential temperature in the eye, while the flight-level wind observations within annular hurricanesshow evidence that mixing inside the radius of maximum wind likely continues. Intensity tendencies of annularhurricanes indicate that these storms maintain their intensities longer than the average hurricane, resulting inlarger-than-average intensity forecast errors and thus a significant intensity forecasting challenge. In addition,these storms are found to exist in a specific set of environmental conditions, which are only found 3% and 0.8%of the time in the east Pacific and Atlantic tropical cyclone basins during 1989–99, respectively. With forecastingissues in mind, two methods of objectively identifying these storms are also developed and discussed.
1. Introduction
The satellite appearance of tropical cyclones can varywidely from case to case and from day to day. Thisstudy introduces a category of tropical cyclone, termedannular hurricanes. When compared with the greaterpopulation of tropical cyclones in an archive of infrared(IR) tropical cyclone imagery, these storms are distinct-ly more axisymmetric with circular eyes surrounded bya nearly uniform ring of deep convection and a curiouslack of deep convective features outside this ring. Be-cause of this symmetry, these storms have also beenreferred to as truck tires and doughnuts. This appearancein satellite imagery can persist for days. Accompanyingthis structure is a nearly constant intensity1 with an av-erage of 107.6 kt (1 kt 5 0.514 m s21). This charac-teristic represents a potential source for large intensityforecasting errors, which may be reduced by better iden-tification of annular hurricanes. For this reason, a com-
1 Because the maximum winds for tropical cyclones are forecastand archived (Davis et al. 1984; Jarvinen et al. 1984) in knots, knotsare the units used for intensity throughout this paper.
Corresponding author address: John A. Knaff, NOAA CooperativeInstitute for Research in the Atmosphere, Colorado State University,Fort Collins, CO 80523-1375.E-mail: [email protected]
parison of the intensity evolution of annular hurricanesin the context of intensity forecasting will be examinedin this paper.
The rather persistent structural appearance displayedin annular hurricanes suggests that there are special cir-cumstances related to their formation and persistence.Based on modeling and theoretical studies (Jones 1995;Bender 1997; Frank and Ritchie 1999, 2001) environ-mental wind shear should be intimately related to thesymmetry of these systems. Using environmental data,this paper will document the vertical shear and otherenvironmental conditions that are associated with an-nular hurricane occurrences and how they differ froma large sample of tropical cyclones.
The lack of in situ wind and radar observations is anunfortunate reality that is common when studying trop-ical cyclones; however, animated IR satellite imagerycombined with aircraft reconnaissance, when available,can be used to infer the dynamics and thermodynamicsassociated with annular hurricanes and their formation.This methodology will be pursued in the context of anumber of recent studies (Schubert et al. 1999; Kossinet al. 2000; Montgomery et al. 2000; Kossin and Schu-bert 2001) that have considered the role that barotropicinstability and asymmetric potential vorticity (PV) mix-ing processes might play in the region of the hurricaneinner core. Using aircraft flight-level data from hurri-

APRIL 2003 205K N A F F E T A L .
canes, Kossin and Eastin (2001) showed that radial pro-files of vorticity and equivalent potential temperature(ue) often undergo rapid and dramatic changes from abarotropically unstable regime (i.e., ]2y/]r2 . 0 and]ue/]r . 0), which they refer to as regime 1, to a bar-otropically stable regime (i.e., ]2y/]r2 # 0 and ]ue/]rù 0), or regime 2, and they hypothesized that thesechanges may result from horizontal mixing processes.
The current study concentrates upon six annular hur-ricanes that have been observed in the Atlantic (1995–99) and eastern North Pacific (1997–99) tropical cyclonebasins. A factor in determining the number and locationof storms investigated in this study is the availabilityof a tropical cyclone IR satellite dataset, which existsfor 1995–2001 in the Atlantic and 1997–2001 in theeastern Pacific. Additionally, uniform measurements ofenvironmental conditions calculated for the purpose ofintensity forecasting are available from 1989 to 1999.We know that annular hurricane have occurred in othertropical cyclone basins; however, neither of these da-tasets is readably available in other tropical cyclone ba-sins. It is the desire to perform quantitative analysisinvolving both the environmental conditions and the IRbrightness temperatures that excludes annular hurri-canes in other basins and earlier times from this study.In addition to the IR imagery and the environmentalconditions, a variety of other datasets is also used toinvestigate these axisymmetric storms.
The structural and intensity characteristics of annularhurricanes suggest methods to objectively identify themmay be both possible and useful. The identification ofannular hurricanes, especially in a real-time forecast set-ting, may possibly be utilized to improve intensity es-timations and forecasts. For this reason objective iden-tification techniques, which use structural and environ-mental characteristics found during the course of thisstudy, will also be explored.
To begin the examination of annular hurricanes, sec-tion 2 offers descriptions of the various datasets that areused in this study. Following this brief discussion ofdatasets, the features of annular hurricanes, includingtheir axisymmetry, intensity characteristics and forecasterrors, formation, and associated environmental con-ditions, will be shown in section 3. Using the evolu-tionary, structural, and environmental characteristics ofthese storms detailed in section 3, section 4 discussesthe development of objective techniques to better iden-tify these hurricanes in a real-time forecasting setting.The final section will present a summary of this studyalong with a few concluding remarks and relevant ob-servations.
2. Datasets
Several datasets are used to study annular hurricanes.Half-hourly Geostationary Operational EnvironmentalSatellite (GOES) images are used to examine cloudstructures. These images have a 4-km horizontal reso-
lution after being remapped to a Mercator projection.This IR dataset includes all storms for the period 1995–2001 in the Atlantic, and 1997–2001 in the eastern Pa-cific, for this reason in this study we concentrate onannular hurricanes that occurred after 1995. The datasetis part of a tropical cyclone IR image archive maintainedat the National Oceanic and Atmospheric Administra-tion’s (NOAA) Cooperative Institute for Research in theAtmosphere (Zehr 2000).
The track and intensity of each storm come from dig-ital databases of best-track information discussed in Da-vis et al. (1984) and Jarvinen et al. (1984), which aremaintained at the National Hurricane Center (NHC).The Atlantic best-track dataset starts in 1870 and theeast Pacific best-track dataset starts in 1945. Anotherdataset referred to as the extended Atlantic best-trackdataset exists for the years 1988–2001 and contains ad-ditional storm-scale information including radii of sig-nificant (maximum, and 34, 50, and 64 kt) winds, andeye size. The extended Atlantic best-track data (De-Maria et al. 2001) are used to discuss structural differ-ences between annular hurricanes and the Atlantic mean,since reliable estimates of these structural quantities,namely wind radii and eye size, often do not exist forother basins, where routine reconnaissance is unavail-able. For these comparison purposes, eye sizes of an-nular hurricanes were estimated using the IR imagery.
To compare the life cycle of tropical cyclones withintensities greater than 64 kt with the life cycle of an-nular hurricanes, we rely upon the past work of Emanuel(2000) who showed that the life cycles of Atlantic hur-ricanes and west Pacific typhoons are remarkably sim-ilar. Unfortunately, Emanuel (2000) did not examineeast Pacific hurricanes explicitly; however, the remark-able similarity between the intensity evolutions in thesetwo quite different basins suggest, that the intensity evo-lution in the eastern Pacific is likely similar.
The rate at which tropical cyclones weaken is also ofinterest. To determine standard weakening rates, twomethods are used: one from empirics and another fromtheory. The weakening of tropical cyclones is a fun-damental aspect of the Dvorak method for tropical cy-clone intensity analysis (Dvorak 1984). The rate ofweakening is given in terms of T numbers, which arerelated to current intensities. The rules associated withthis method limit the number of T numbers that is al-lowed to change in a 24-h period, which is a maximumfilling rate. These same rules give guidelines for averageand slower than average weakening rates. These em-pirically derived rates are compared to those createdusing the theory of Eliassen and Lystad (1977), whichhas been applied to tropical cyclones in Montgomeryet al. (2001). In this theory vortex spindown is con-trolled by the toroidal circulations (u, w) forced by theEkman layer, and offers a maximum weakening rateunder the assumption that inertial toroidal oscillationsare neglected.
Two sorties of flight-level data are available for ex-

206 VOLUME 18W E A T H E R A N D F O R E C A S T I N G
amining annular hurricanes. These are the periods con-taining 0000 UTC 4 September 1995 for Hurricane Luisand 0600 UTC 15 August 1999 for Hurricane Dora.These aircraft reconnaissance data were collected by theFifty-third Weather Reconnaissance Squadron and areavailable in a 10-s temporal resolution. Each sortie con-tained three transects of the storm.
Environmental conditions associated with annularhurricanes are obtained using the predictors calculatedfor the Statistical Hurricane Intensity Prediction Scheme(SHIPS), which are available at 12-h increments(DeMaria and Kaplan 1994a, 1999). The SHIPS at-mospheric information is derived from National Centersfor Environmental Prediction (NCEP) global modelanalyses through 1999. In this process the storm cir-culation is removed using a Laplacian filter, which per-forms a linear interpolation across a circular area en-compassed by radius R and effectively removes thestorm-scale circulation from the environmental flow.This filter is applied to the original model as describedin DeMaria and Kaplan (1999) and the data were savedin a 28 latitude–longitude grid (2.58 prior to 1996). Inthis filtering process R 5 800 km at 1000 hPa anddecreases linearly to R 5 500 km at 100 hPa. Once thisfilter has been applied to the analyses, which effectivelyremoves the storm-scale circulation from the environ-mental flow, average environmental factors are calcu-lated within 1000 km of the storm center, except forvertical wind shear, which is averaged within a distanceof 600 km. Since the current formulation of SHIPS nolonger uses the Laplacian filter to create area-averagepredictors, our analysis is limited to storms that formedprior to 1999.
Environmental factors calculated for the SHIPS mod-el include temperature, zonal wind, relative eddy mo-mentum flux convergence (REFC) and divergence at200 hPa, vorticity at 850 hPa, and vertical wind shearbetween 200 and 850 hPa and 500 and 850 hPa. TheREFC is calculated from
]22 2REFC 5 2r (r U9V9), (1)L L]r
where r is the radius from storm center, U is the radialwind, V is the tangential wind, the overbar representsan azimuthal average with respect to the storm center,the primes represent deviations from that average, andthe subscript L indicates a coordinate system movingwith the storm. If not calculated in a motion-followingcoordinate, storm motion would result in a positiveREFC. Point values of SST used by SHIPS are derivedfrom weekly SST fields described in Reynolds andSmith (1994). Since the environments of tropical cy-clones has been well examined in the literature wechoose to use a combined Atlantic and east Pacific trop-ical cyclone climatology for the purposes of identifyingthe characteristic environments associated with the av-erage annular hurricane. In doing so the authors rec-ognize that some biases may be introduced into the re-sults of this study.
The authors also recognize that the operational anal-yses carry with them a host of errors and uncertainties.However, as described in Molinari et al. (1992), theseanalyses possess sufficient quality to deduce large-scaleenvironmental factors such as vertical wind shear andfluxes of angular momentum. Further proof of the use-fulness of these analyses with respect to tropical cyclonestudies comes from the ability of SHIPS to provide skill-ful hurricane intensity predictions using data derivedfrom these analyses (DeMaria and Kaplan 1999).
3. Features of annular hurricanes
Before the features associated with annular hurricanescan be examined, annular hurricane cases must be iden-tified. The IR imagery is the visual means by which wedetermine whether a storm is an annular hurricane. Anannular hurricane is identified if the hurricane persistsfor at least 3 h in an axisymmetric state defined by thefollowing: 1) the hurricane has a normal-to-large-sizedcircular eye surrounded by a single band of deep con-vection containing the inner-core region and 2) the hur-ricane has little or no convective activity beyond thisannulus of convection. The use of digital IR data alsoallows for the development of an objective technique ofidentifying storms with these characteristics, which willbe addressed in section 4. Note that a hurricane is con-sidered an annular hurricane only when these conditionsare met; before and after the annular phase, the hurricaneis considered an asymmetric storm. The six hurricanesthat meet these subjective criteria during our period ofstudy are listed in Table 1 along with ranges of satelliteestimates of the range of eye sizes and best-track-deter-mined intensities. Further details on the characteristics ofthese storms are described in sections 4a–d.
a. Axisymmetry
The first feature that separates annular hurricanesfrom the general population of hurricanes is the degreeof axisymmetry displayed in IR imagery. Figure 1shows IR images of each of the annular hurricanes listedin Table 1. Many of the defining attributes of an annularhurricane are displayed in this figure. First, annular hur-ricanes have nearly circular eyes and these eyes havelarger radii (see Table 1) than the Atlantic average of23 km (sample size 5 415, standard deviation 5 5.3km), as determined from the extended Atlantic best trackfor storms with intensities greater than 85 kt. The secondfeature that all annular hurricanes have is a nearly sym-metric annulus of deep convection (IR brightness tem-peratures) surrounding the circular eye, although somesmall asymmetries in cloud-top temperature within thisannulus still exist as shown in the enhanced imagesshown in Fig. 1. This result is confirmed by quantitativeanalysis that shows that the standard deviation of bright-ness temperature relative to the symmetric mean is muchsmaller than that of the typical hurricane for radii within

APRIL 2003 207K N A F F E T A L .
TABLE 1. A list of annular hurricanes, the basin in which they occurred, the dates (calendar and yearday) during which they exhibitedannular hurricane characteristics, and the number of hours they exhibited annular hurricane characteristics. Also listed for reference are theeye size range and the intensity range these storms experienced during each annular phase.
Stormand year Basin
Annular period(calendar)
Annular period(yearday) Hours
Eye sizerange (km)
Intensity range(kt)
Luis, 1995 Atlantic 1800 UTC 3 Sep–0400 UTC 4 Sep
246.75–247.14 10 62–64 120–125
Edouard, 1996 Atlantic 0000 UTC 25 Aug–0000 UTC 26 Aug
238.00–239.00 24 32–35 120–125
Darby, 1998 East Pacific 1200 UTC 26 Jul–1800 UTC 27 Jul
207.50–208.75 30 41–43 90–100
Howard, 1998 East Pacific 1800 UTC 24 Aug–0300 UTC 27 Aug
236.75–239.13 57 44–54 115–85
Beatriz, 1999 East Pacific 1800 UTC 12 Jul–1800 UTC 13 Jul
193.75–194.75 24 41–44 100–105
Dora, 1999 East Pacific 1800 UTC 10 Aug–0300 UTC 12 Aug
222.75–224.13 33 36–38 115–120
0300 UTC 15 Aug–0300 UTC 16 Aug
227.13–228.13 24 36–39 80–95
the eyewall region. The final feature that is most specificto annular hurricanes is the general lack of deep con-vective features, including spiral bands, beyond the an-nulus of deep convection surrounding the eye. Somespiral-shaped features do appear in Fig. 1. However,most of these show characteristics of thick cirrus bandsassociated with upper-level outflow jets as indicated bythe scallops along their edges and the transverse bandingseen at cloud top (see Bader et al. 1995, chapter 3), andare likely not associated with near-surface-based, deepconvection. The use of IR brightness temperatures inthis study however, results in the possibility that spiralbands not visible in IR imagery do exist under the cirruscanopy. The existence of spiral bands is best examinedusing radar data, which are not available. Passive mi-crowave data could have been utilized for this study,providing single images during the annular phases, butwere not. There is at least one example where there isthe existence of a spiral band under the cirrus canopy;however, spiral bands are still generally lacking whencompared to other intense tropical cyclones.
The annular nature of these storms usually occursonly during a short period of their life cycle. Figure 2shows time versus radius plots of the azimuthal meanIR brightness temperatures for the Atlantic and easternPacific annular hurricanes, with the two Atlantic cases,Luis and Edouard, at the top. Horizontal lines indicatethe beginning (earliest) and end (latest) of each annularphase. Also note that Hurricane Dora had two separateannular periods. There are several interesting featuresin these figures that relate to the shape and behavior ofthe azimuthal mean brightness temperatures. In the At-lantic (east Pacific) cases, the cold cloud area (,2108C,shaded in Fig. 2) expands (contracts) as the storms movewestward. This is likely related to the SST gradients,where SSTs increase to the west in the Atlantic anddecrease to the west in the east Pacific. It is also inter-esting that the Atlantic storms seem to experience theirannular state earlier in their life cycle and have their
maximum intensity later, while the eastern Pacificstorms transition to an annular state after reaching max-imum intensity. However, this interesting observation isfar from a conclusion being based upon just six cases.These observations suggest that the environment (i.e.,SSTs, vertical wind shear) is likely playing a role indetermining the location and frequency of annular hur-ricanes.
In most of these storms, a strong, diurnal signal inthe outward-flowing cirrus canopies occurs in the 200–400-km radial regions, as is documented in Kossin(2002). These diurnal oscillations, examples of whichare indicated in Fig. 2 by the letter Ds, appear to sud-denly diminish in radial extent in many of these stormsduring the period when these storms become annularhurricanes. The interesting radial contraction of theseoscillations associated with the annular phase of thesestorms is particularly evident in Howard, Beatriz, andDora. These oscillations are observed to expand togreater radii following the times that annular charac-teristics were observed in Luis, Edouard, and Dora andcontract with the first eye formation in Darby, Howard,and Beatriz. The transitions both to and from this an-nular state are rather abrupt. Most evident are the rel-atively large eye features and the notable decrease incold cloud features, indicated by brightness tempera-tures (Bt) between 2108 and 2608C, beyond the annulusof deep convection (Bt # 2608C) surrounding the eyein the region where spiral banding is most often ob-served in the IR.
b. Intensity characteristics
Typically, hurricanes in the Atlantic experience theirpeak intensity for very short periods, and then with timefill rather rapidly (Emanuel 2000). In contrast, annularhurricanes subsequent to maximum intensity fill moreslowly. In Fig. 3, the time series of intensity, normalizedby peak intensity, for typical hurricanes unaffected by

208 VOLUME 18W E A T H E R A N D F O R E C A S T I N G
FIG. 1. Color-enhanced IR images of (top left) Hurricane Luis at 2015 UTC 3 Sep, (top right) Hurricane Edouard at 1345 UTC 25 Aug,(middle left) Hurricane Darby at 1530 UTC 25 Jul, (middle right) Hurricane Howard at 0000 UTC 25 Aug, (bottom left) Hurricane Beatrizat 1830 UTC 12 Jul, and (bottom right) Hurricane Dora at 0830 UTC 11 Aug during the period in which they were annular hurricanes.Each image projection is Mercator and has been magnified by a factor of 2 to a 2-km resolution. The resulting spatial scale is 1280 km 3960 km for each panel. The temperature scale for the color enhancement used on the imagery is shown at the bottom.

APRIL 2003 209K N A F F E T A L .
FIG. 2. Time vs radius of azimuthally averaged IR brightness temperature for the entire life cycles of the annularhurricanes listed in Table 1. The top panels display results from the Atlantic annular hurricanes (left) Luis and (right)Edouard. The middle panels display (left) Darby and (right) Howard. The bottom panel shows (left) Beatriz and(right) Dora. The diurnal oscillations discussed in the text, which are located in the 200–400-km radial band, areindicated by a series of Ds at the daily maxima. Horizontal lines indicate the beginning and end of annular periods(see Table 1). Notice that Hurricane Dora had two annular periods and that the timescale is different for each storm.
land or cold water in the Atlantic from Emanuel (2000)is compared with the average time series of intensity ofthe eastern Pacific and Atlantic annular hurricanes listedin Table 1. Unlike the typical Atlantic hurricane (Eman-uel 2000), Fig. 3 shows that annular hurricanes tend to
experience a long period of intensity steadiness with arelatively slowly decreasing intensity following theirmaximum intensity.
The Dvorak (1984) method provides estimates ofmaximum, average, and slow 24-h weakening rates for

210 VOLUME 18W E A T H E R A N D F O R E C A S T I N G
FIG. 3. Composite time series of the intensity (normalized by peakintensity) associated with average Atlantic hurricanes that did notencounter cold water or make landfall (56 cases) as reported by Eman-uel (2000) and annular hurricanes (6 cases), normalized by meanmaximum intensity. Compositing was done relative to the time ofmaximum intensity.
TABLE 2. Forecast biases and errors associated with the 1995–99 hurricane seasons in the Atlantic and eastern Pacific as compared withthose of the annular hurricanes. Values are represented in knots.
Forecast length (h) 12 24 36 48 72
Forecast biasesAnnular cases (SHIPS)Annular cases (NHC)No. of forecasts (annular)1995–99 (SHIPS)1995–99 (NHC official)No. of forecasts (1995–99)
24.022.5110
0.120.3
1544
29.226.0980.1
20.81399
214.8210.8
8620.821.7
1247
220.8217.1
7422.122.7
1100
224.1218.9
5023.722.3867
Forecast errorsAnnual cases (SHIPS)Annular cases (NHC)1995–99 (SHIPS)1995–99 (NHC)
9.37.58.16.7
15.013.012.511.1
19.617.015.613.8
23.221.818.216.4
26.722.120.719.1
storms with similar intensities as the annular hurricanesin this study. The maximum rate of weakening is 1.5 Tnumbers per day, which corresponds to an approxi-mately 40-kt decrease of intensity per day for stormswith similar intensities as annular hurricanes. The av-erage (slow) weakening that this method uses is 1 (0.5)T numbers per day, which corresponds to approximately20 kt (12 kt) per day for these same intensities. Forinstance, for a storm with a maximum intensity of 90kt, these weakening rates would correspond to 0.61 formaximum weakening, 0.72 for average weakening, and0.85 for slow weakening at 24 h after maximum inten-sity in Fig. 3. Note the mean maximum intensity of thesample in Emanuel (2000) is 88.6 kt and the 24-h weak-ening is 14.7 kt, corresponding to a value of 0.86 inFig. 3—or slowly weakening. Using the theory dis-
cussed in Montgomery et al. (2001) to estimate maxi-mum weakening rates was interesting, producing resultsremarkably similar to those of Dvorak (1984) (the stormwas assumed to have a depth of 15.5 km, the boundarylayer was 0.5 km deep, the reduction factor was 0.8,and the drag coefficient was set equal to 2.0 3 1023).Using this method a 90-kt storm would weaken nearly23 kt in 24 h, which in Fig. 3 would correspond to avalue of 0.74 at 24 h after maximum intensity. Clearly,annular hurricanes fall in the category of weakeningvery slowly.
Because the intensity evolution of annular hurricanesis different than that found by Emanuel (2000), the fore-cast error characteristics are also different. Table 2shows the average forecast intensity biases and errorsfor all the cases during the years 1995–99 in the Atlanticand eastern Pacific, along with corresponding biases anderrors associated with the annular hurricanes. Resultsare shown from the SHIPS model and the official NHCforecast at 12, 24, 36, 48, and 72 h. The verification forthe Atlantic and eastern Pacific annular hurricanes wasperformed by restricting the best track to cases 24 hbefore and 48 h after the annular periods identified inTable 1. The large negative forecast biases associatedwith these annular hurricanes are shown in both theSHIPS and NHC official forecast verification. The bi-ases range from 10 to 3 times greater than those for the1995–99 sample. The associated forecast errors are also10%–40% greater, depending on forecast period. It isalso notable that the forecasters (NHC) make remark-ably better intensity forecasts than the SHIPS guidancein these cases, apparently by forecasting greater futureintensities for these storms. The comparably better NHCforecasts also suggest that an objective technique foridentifying annular hurricanes, and conditions associ-ated with their formation, may improve statisticallybased intensity models such as SHIPS.
c. Annular hurricane formation
Figure 4 shows a sequence of IR images from Hur-ricane Howard (1998) that depicts one example of an-

APRIL 2003 211K N A F F E T A L .
nular hurricane formation. An eye became evident inthe IR imagery during 22 August and persisted for morethan a day. During this period, the eye was ;12–16 kmin diameter (Fig. 4a). At 0630 UTC 24 August, a massof relatively cloud-free air was observed to intrude intothe storm center (Fig. 4b) and subsequently consolidateto form a new, and larger, eye (Fig. 4c). After this time,and during the remainder of 24 August, a rapid anddramatic rearrangement of the IR pattern in Howard’sinner core was observed to occur (Figs. 4d–k). At 1530UTC, the eye–eyewall interface became highly asym-metric as the cold clouds associated with the eyewallappeared to mix inward, and at 1630 UTC, there ap-peared to be two possible mesovortices rotating togethercyclonically around the eye. The nature of mesovorticesembedded in a vortex is to act as ‘‘mixmasters’’; thatis, they efficiently mix the air in their near surroundings.In a nondivergent barotropic framework discussed inSchubert et al. (1999) recently formed mesovortices sur-rounding the eye mix low potential vorticity located inthe eye into the high potential vorticity region associatedwith the eyewall. One could speculate that this appearedto be occurring during 1700–1900 UTC, as the meso-vortices were apparently advecting eyewall air into theeye while orbiting each other in the eye. At the end ofthis dramatic event (Fig. 4k), the IR pattern was indic-ative of an annular hurricane, as discussed in section1a. It is remarkable that in less than 24 h, the diameterof Howard’s eye increased by a factor of more than 4as the eye diameter increased from ;12 to ;88 km.
Another example of annular hurricane formation isoffered in Fig. 5, which shows the transition of Hurri-cane Luis (1995) into an annular hurricane. The tran-sition of Luis is less dramatic, but has several similar-ities to Howard. In Fig. 5a Luis has a nearly circulareye and one major spiral band to its north and northeast.There also appears to be an undulation along the innereyewall of the storm in Fig. 5a, possibly indicating theexistence of a mesovortex. An hour latter (Fig. 5b), thereis an elongated region of warmer cloud-top temperaturesto the north and northeast of the eyewall that appearsassociated with aforementioned mesovortex feature thathas now rotated to the northeast inner eyewall. In Fig.5c the warm cloud tops are associated with a noticeablebreak in the eyewall, which over the next 4 h (0915–1315 UTC; Figs. 5d–i) rotates around the storm center,displaying at times what could be described as a bandedeye structure. An hour latter (1415 UTC; Fig. 5j), alarge area of cold cloud appears in the inner southeastregion of the eyewall, which dissipates as it rotatesaround the eye, as shown in Fig. 5k, 3 h later. Over thenext 3 h the eye expands to have a diameter of ;120km, increasing by a factor of approximately 2.
Although the specific details can vary between theannular cases, rearrangements involving possible me-sovortices were observed in all of the other annularhurricanes considered in this study with storms under-going a similar succession of events with one or two
possible mesovortices transforming a smaller eye intoa larger eye. Luis, Edouard, and Dora had one possiblemesovortex associated with their transition while How-ard, Darby, and Beatriz had two of these features thatwere associated with their transition to an annular hur-ricane. The transition timescales of these cases werequite similar with most transitions taking ;24 h. Thestorms that had two possible mesovortices appeared toundergo transition in a more dramatic fashion in the IRimagery while transitions involving one mesovortex ap-peared to be less abrupt.
All of these transitions could be viewed as an eyewallreplacement process (i.e., a smaller eyewall is replacedby a larger eyewall). While the formation of concentriceyewalls is likely a symmetric process (e.g., Willoughbyet al. 1982), and the mechanisms that cause the for-mation of concentric rings of convection and tangentialwinds are still in dispute, the dissipation of the primaryeyewall once the outer eyewall has become dominanthas been has been modeled using simple 2D barotropicdynamics (Kossin et al. 2000). The results of this mod-eling effort show that the existence of a secondary ringof elevated vorticity (secondary eyewall) along with itsstrength and proximity to the inner vorticity maximum(primary eyewall) affects the details of the dissipationof the primary eyewall. Several long-lived structuralconfigurations can result, including long-lived vorticityrings (i.e., eyewalls) near the radii of the initial sec-ondary vorticity maximum.
Radial profiles of vorticity and ue from HurricanesLuis and Dora, the only storms with reconnaissance dataavailable during their annular phase, are rather intrigu-ing. Figure 6 shows the tangential wind, angular veloc-ity, ue, and vorticity for Hurricane Luis for the radiallegs occurring between 2230 and 2308 UTC 3 Septem-ber. These profiles are very similar to those of HurricaneDora (not shown for brevity), nothing that Dora was asmaller and weaker annular hurricane when observedby reconnaissance aircraft on 15 August. The tangentialwind (y) has a U-shaped profile (i.e., ]2y/]r2 . 0) witha number of visible steplike features as the profile tran-sitions from the middle of the eye to the radius of max-imum wind with a very steep transition occurring justinside the radius of maximum wind. In the angular ve-locity and vorticity fields, the steplike features in thetangential winds appear as local maxima and thus theRayleigh necessary condition for barotropic instabilityis satisfied. The ue indicates that the eyewall is generallywell mixed with respect to this conserved variable, withlocal maxima and minima roughly corresponding to thelocal minima and maxima in the angular velocity field.These steplike features in the tangential winds may beevidence of PV filamentation (e.g., Ritchie and Holland1993). In the context of a recent paper by Kossin andEastin (2001), the annular hurricanes seem to be neitherin regime 1 (barotropically unstable) nor in regime 2(barotropically stable), but rather in between these re-gimes. Evidence that a dramatic PV mixing event has

212 VOLUME 18W E A T H E R A N D F O R E C A S T I N G
FIG. 4. The transition of Hurricane Howard from a hurricane with a small eye (;12 km diameter) to an annularhurricane. Times on the individual panels are shown in the upper left of each panel and the temperature enhancementused in all the images is shown in the upper-right panel of this figure. Description of the evolution is given inthe text.
→
FIG. 5. The transition of Hurricane Luis to an annular hurricane. Times are shown in the bottom center of each panel and the temperatureenhancement used in all the images is shown at the bottom of this figure. Description of the evolution is given in the text.

APRIL 2003 213K N A F F E T A L .

214 VOLUME 18W E A T H E R A N D F O R E C A S T I N G
FIG. 6. Cross sections of (a) tangential wind, (b) angular velocity,(c) ue, and (d) vorticity calculated from flight-level (10 000 ft) re-connaissance data of Hurricane Luis for 2230–2308 UTC 3 Sep 1995.
occurred is shown by the nearly uniform eye ue values.However, a U-shaped tangential wind field is evidencethat the possibility for barotropic instability still exists.The existence of this wind profile coupled with the ob-servation of the relatively long-lived nature of annularhurricanes allows us to speculate that as the vorticity iscontinuously being increased in association with theconvection near the eyewall, it also may be being mixedcontemporaneously into the eye by possible PV fila-mentation as indicated in the radial profiles.
This limited evidence produces more questions thanit answers. Though some of the dynamic and thermo-dynamic structure of annular hurricanes can be observedusing reconnaissance data, the three-dimensional detailsof the formation of annular hurricanes are well beyondboth the scope of this paper and the quality of the pres-ently available data. The existing evidence suggests thatannular hurricane formation is likely preceded by a dra-matic horizontal mixing event as shown in Figs. 4 and5. The mixing probably results in fairly uniform radialprofiles of ue in the larger than average eye of an annularhurricane. It also appears as if the mixing process is ongoing as indicated by the local maxima and minima inthe angular velocity and vorticity fields. Interestingly,the evidence of continued mixing may help to explainthe nearly steady intensities associated with annular hur-ricanes, but the existing observations do not containenough quantitative detail to further investigate theseprocesses. We also know that all storms that developbarotropic instability do not become annular hurricanes,which implies that in addition to barotropic instability,other conditions must be satisfied. With this in mind,the next section discusses environmental conditions as-sociated with annular hurricanes.
d. Typical environmental conditions
The environmental conditions associated with the an-nular phase of each of the hurricanes listed in Table 1are examined using 12-hourly data derived from NCEPoperational atmospheric and oceanic analyses as de-scribed in section 2. Specifically, they include SST, 200-hPa zonal winds, 200-hPa temperatures, vertical windshear in a deep layer (200–850 hPa) and a shallow layer(500–850 hPa), 850-hPa vorticity, 200-hPa divergencesand 200-hPa REFC. Also calculated for this study arethe maximum potential intensity (MPI)2 of the hurricanebased upon SST [method of DeMaria and Kaplan(1994b)], storm intensity, and intensity as a percentageof MPI. All environmental values, except SST and ver-tical wind shear, are area averaged within a 1000-kmcircle. Wind shear calculations are averaged within a600-km circular area and SST values are calculated at
2 Note that the values for MPI in the 25.48–28.58C temperaturerange are not much different (1–6 kt greater) from values obtainedusing the method of Whitney and Hobgood (1997), developed spe-cifically for the eastern Pacific.
APRIL 2003 215K N A F F E T A L .
TA
BL
E3.
Ave
rage
envi
ronm
enta
lco
ndit
ions
asso
ciat
edw
ith
the
indi
vidu
alca
ses
ofA
tlan
tic
and
east
ern
Pac
ific
annu
lar
hurr
ican
esal
ong
wit
hth
e19
95–9
9sa
mpl
em
ean
valu
es.
Lis
ted
are
tem
pera
ture
s,w
ind
spee
ds,t
wo
laye
rsof
tota
lzon
alan
dm
erid
iona
lver
tica
lwin
dsh
ears
,max
imum
pote
ntia
lint
ensi
ty(M
PI)
,int
ensi
ty,s
torm
RE
FC
,850
-hP
avo
rtic
ity,
and
200-
hPa
dive
rgen
ce.
Uni
tsof
thes
equ
anti
ties
are
list
edin
the
colu
mn
head
ings
.‘‘
Dee
p’’
and
‘‘sh
allo
w’’
inth
eta
ble
refe
rto
valu
esof
win
dsh
ears
betw
een
leve
ls20
0an
d85
0an
d50
0an
d85
0hP
a,re
spec
tive
ly.
Bol
dfac
eit
alic
indi
cate
sst
atis
tica
lsi
gnifi
canc
e.
SS
T(8
C)
200-
hPa
U(m
s21)
200-
hPa
T(8
C)
Dee
psh
ear
(ms2
1)
Dee
pU
(ms2
1)
Dee
pV
(ms2
1)
Sha
llow
shea
r(m
s21)
Sha
llow
U(m
s21)
Sha
llow
V(m
s21)
200-
hPa
RE
FC
(ms2
1da
y21)
200-
hPa
dive
rgen
ce(1
026
s21)
850-
hPa
vort
icit
y(1
026
s21)
MP
I(k
t)In
tens
ity
(kt)
%M
PI
Ann
ular
hurr
ican
es(s
ampl
esi
ze5
25)
Mea
nS
tdde
vM
axM
in
26.9 0.8
28.5
25.4
25.
01.
22
2.9
26.
9
255
.7 0.5
254
.52
56.5
2.7
1.9
7.4
0.8
22.
62.
31.
22
6.4
0.7
2.1
5.9
22.
6
2.8
1.2
4.8
0.8
22.
61.
20.
12
4.7
1.0
1.1
3.1
20.
7
0.0
0.4
1.0
21.
0
22 25 752
20
41 38 101
230
128.
98.
914
8.9
113.
2
107.
612
.012
5 90
83.5 7.6
95.9
66.0
1995
–99
sam
ple
mea
n(s
ampl
esi
ze5
1516
)M
ean
27.6
0.9
255
.37.
12.
42
0.1
3.2
0.2
0.2
1.1
24.6
2913
9.3
58.3
42.5
Std
dev
Max
Min
1.8
30.8
19.1
6.6
26.9
214
.9
1.0
252
.72
60.3
4.1
24.4 0.1
6.7
24.4
217
.0
4.1
16.5
213
.8
1.8
0.1
12.1
3.2
11.3
29.
6
1.7
7.6
25.
5
3.3
20.0
216
.0
23.4
126
239
45 190
211
1
19.2
616
5.0
81.5
1
28.3
155.
020
.0
20.7
97.4
12.6
the storm center. For interpretation purposes, positive200-hPa REFC indicates that the storm-relative asym-metric radial and tangential winds, resulting from thestorm interacting with the environment, are negativelycorrelated resulting in a positive tangential wind ten-dency at 200 hPa (e.g., REFC is positive and large whenthe storm moves toward an upper-level trough).
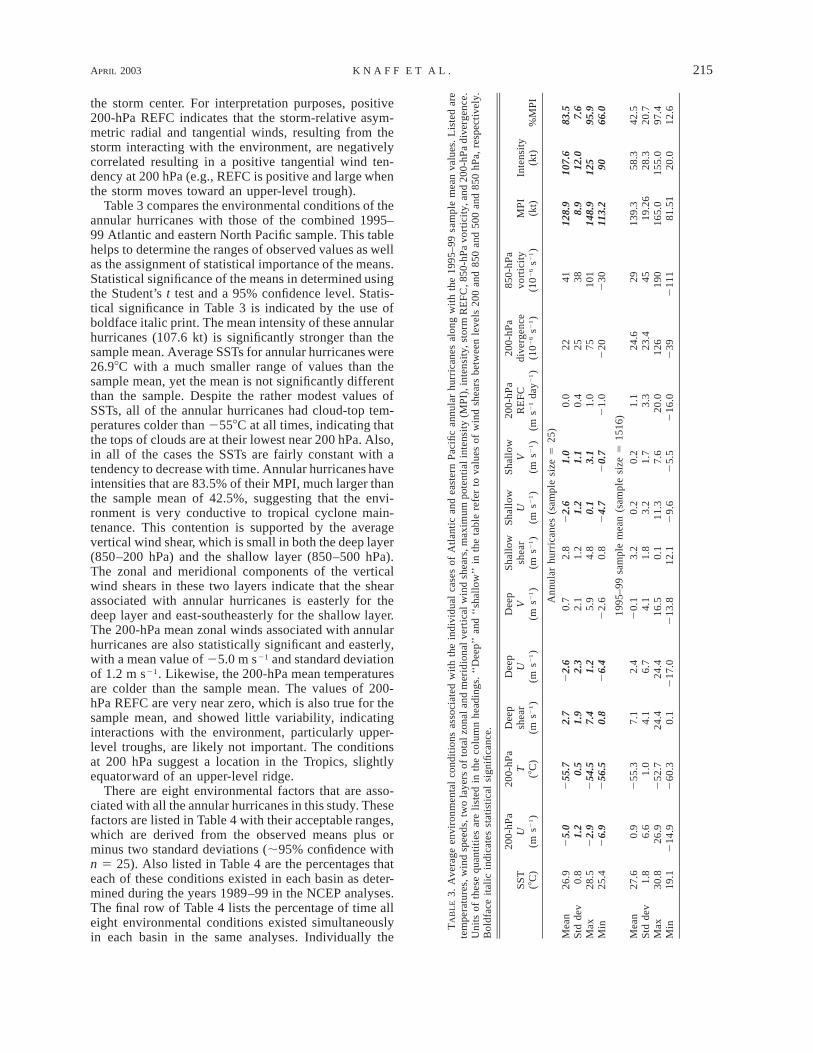
Table 3 compares the environmental conditions of theannular hurricanes with those of the combined 1995–99 Atlantic and eastern North Pacific sample. This tablehelps to determine the ranges of observed values as wellas the assignment of statistical importance of the means.Statistical significance of the means in determined usingthe Student’s t test and a 95% confidence level. Statis-tical significance in Table 3 is indicated by the use ofboldface italic print. The mean intensity of these annularhurricanes (107.6 kt) is significantly stronger than thesample mean. Average SSTs for annular hurricanes were26.98C with a much smaller range of values than thesample mean, yet the mean is not significantly differentthan the sample. Despite the rather modest values ofSSTs, all of the annular hurricanes had cloud-top tem-peratures colder than 2558C at all times, indicating thatthe tops of clouds are at their lowest near 200 hPa. Also,in all of the cases the SSTs are fairly constant with atendency to decrease with time. Annular hurricanes haveintensities that are 83.5% of their MPI, much larger thanthe sample mean of 42.5%, suggesting that the envi-ronment is very conductive to tropical cyclone main-tenance. This contention is supported by the averagevertical wind shear, which is small in both the deep layer(850–200 hPa) and the shallow layer (850–500 hPa).The zonal and meridional components of the verticalwind shears in these two layers indicate that the shearassociated with annular hurricanes is easterly for thedeep layer and east-southeasterly for the shallow layer.The 200-hPa mean zonal winds associated with annularhurricanes are also statistically significant and easterly,with a mean value of 25.0 m s21 and standard deviationof 1.2 m s21. Likewise, the 200-hPa mean temperaturesare colder than the sample mean. The values of 200-hPa REFC are very near zero, which is also true for thesample mean, and showed little variability, indicatinginteractions with the environment, particularly upper-level troughs, are likely not important. The conditionsat 200 hPa suggest a location in the Tropics, slightlyequatorward of an upper-level ridge.
There are eight environmental factors that are asso-ciated with all the annular hurricanes in this study. Thesefactors are listed in Table 4 with their acceptable ranges,which are derived from the observed means plus orminus two standard deviations (;95% confidence withn 5 25). Also listed in Table 4 are the percentages thateach of these conditions existed in each basin as deter-mined during the years 1989–99 in the NCEP analyses.The final row of Table 4 lists the percentage of time alleight environmental conditions existed simultaneouslyin each basin in the same analyses. Individually the

216 VOLUME 18W E A T H E R A N D F O R E C A S T I N G
TABLE 4. List of the eight environmental conditions derived fromthe 1989–99 NCEP analyses associated with annular hurricanes. List-ed is the condition on the left followed by the percentage of occur-rence in association with tropical cyclones in each basin. The numberof 12-hourly cases that existed in each basin during this 12-yr periodis given in parentheses. Ranges for the environmental conditions aredetermined from Table 3 (the means plus or minus two standarddeviations). The last category (all) refers to the percentage of timeall eight of the factors existed at the same time, as is the case withthe six annular hurricanes examined in this study. The all categoryrepresents the percentage of time that environmental conditions con-ducive to the formation of annular hurricanes have existed in eachbasin.
ParameterAtlantic
(1424) (%)East Pacific(1876) (%)
1) Weak vertical wind shear,deep shear , 6.5 m s21
and shallow shear , 5.2 ms21 41.5 67.5
2) Easterly 200-hPa U, 2.5 . U. 27.4 m s21 13.1 42.9
3) 200-hPa T, 254.7 . T .256.78C 70.8 64.9
4) Environmental interaction,|REFC| , 2 m s21 day21 46.9 76.8
5) SSTs, 25.2 . SST . 28.68C 63.6 50.86) Easterly deep shear 2 . U .
7.2 m s21 25.0 67.57) Southeast shallow shear,
20.2 . U . 25.0 m s21,3.2 . V . 21.2 m s21 13.5 51.7
8) Intensity VMAX . 85 kt 16.5 21.1All (1–8) 0.8 3.0
conditions associated with annular hurricanes are quitecommon, with the most limiting overall factor beingintensity. However, the simultaneous combination of theenvironmental conditions shown to be associated withannular hurricanes is quite rare in both basins duringthe 1989–99 period, with 0.8% and 3.0% of the casesexhibiting these conditions in the Atlantic and easternPacific basins, respectively. It is interesting to note thatthe percentages of easterly 200-hPa zonal wind as wellas easterly shear are about three times higher in theeastern Pacific than in the Atlantic. This climatologicaldifference coupled with a greater number of storms oc-curring annually in the east Pacific likely would explainthe greater possibility of annular hurricane occurrencein that basin.
Using the 36-h period following the annular phasesof these six hurricanes, seven periods in all (since Doraexperienced two annular periods) were examined to de-termine what environmental factors changed that pos-sibly caused the demise of each annular phase. Usingthe eight factors and the ranges for each listed in Table4, Table 5 was constructed. For the 36-h period follow-ing each annular hurricane’s demise the NCEP analysesare examined to determine if the eight environmentalfactors are within the ranges expected for annular hur-ricanes. If an environmental factor is out of range, anX is placed in the table for that factor. Dora I and DoraII refer to the first and second annular periods for Hur-
ricane Dora. In most case the directional component ofeither or both of the 200–850-or the 500–850-hPa shearwas related to the demise of these annular hurricanesincluding Luis, Edouard, Beatriz, Howard, and Dora (Iand II). In the case of Luis, Edouard, and Dora II, west-erly 200-hPa winds accompanied these changes. In thecase of Dora I, 200-hPa winds became too easterly.Howard became asymmetric as it encountered modestnortheast wind shear in the 500–850-hPa layer as it alsoencountered colder water. Beatriz, during its encounterwith colder water, slowed and was sheared too stronglyfrom the east in the 500–850-hPa layer. Dora I lost itsannular characteristics when it experienced a period ofsoutherly shear, while the demise of Darby appears tobe solely related to that storm encountering cold water.As anticipated the vertical wind shear direction andmagnitude appears to play a roll in the demise of annularhurricanes while the SST seems to also be a factor, toowarm in Luis and too cold in Howard, Beatriz, andDarby.
According to these observations, the typical annularhurricane has an intensity of approximately 85% of itsempirically derived MPI and exists in a favorable hur-ricane environment characterized by 1) weak easterlyor southeasterly vertical wind shear, 2) easterly flow andrelatively cold temperatures at 200 hPa, 3) occurrencewithin a narrow range (25.48–28.58C) of SSTs that arenearly constant, and 4) a lack of 200-hPa relative eddyflux convergence caused by the environment. Further-more, as the environment changes and the environmen-tal factors listed in Table 4 are no longer satisfied, par-ticularly the vertical wind shear (direction and magni-tude), and to a lesser degree the SST, these storms losstheir annular characteristics.
4. Objective identification techniques
The annular hurricane cases listed in Table 1 weredetermined by the visual inspection and qualitative eval-uation of the IR imagery. Because annular hurricaneshave intensities greater than 85 kt and display intensitychange characteristics that are different from the averagehurricane resulting in significant intensity forecast er-rors, their identification in an operational setting wouldlikely be useful for improving intensity forecasts. Whilethe subjective identification method used in this studyis adequate for the purposes of describing annular hur-ricanes and their environments in a postanalysis setting,there is a need for a systematic and objective techniquefor identifying these storms. Building on the character-istics of annular hurricanes discussed in section 3, thedevelopment of two objective identification techniquesis explored in this section.
The first approach is to use the digital values of theIR imagery to create an index. Figure 2 shows that theradial extent of the cirrus canopy, indicated by the coldvalues of azimuthally averaged IR temperatures, is muchsmaller and that there is evidence of a warm eye feature

APRIL 2003 217K N A F F E T A L .
TABLE 5. Table illustrating what factors were related to the demise of each annular phase of the six annular hurricanes listed in Table 1.Listed across the top are the eight environmental conditions, labeled 1–8, which correspond to the same labels in Table 4, that are found tobe consistently present during the annular phases of these storms. Listed are the three 12-hourly analyses following each annular period. AnX in a column indicates that the condition associated with that column is no longer being satisfied; see Table 4 for explanation of theconditions associated with each column.
Hours
1
Shearmagnitude
2
U200
3
200-hPatemp
4
REFC
5
SST
6Easterly
200–850-hPa shear
7Southeast500–850-hPa shear
8
Intensity
Luis112124136 X X X X
XXX
XXX
Edouard112124136 X
XXX X
Darby112124136
XXX X
Howard112124136
XXX
XX
XXX
XX
Beatriz112124136
XX X
XXX
Dora I112124136
XX
XXX
Dora II112124136
XX
XXX
XXX
during the annular hurricane periods (see Table 1 forexact times). Using the information shown visually inFig. 2, a simple index can be created by comparing theazimuthally averaged radial profiles of IR brightnesstemperature with the average profiles of the annular hur-ricanes. Since annular hurricanes have different sizesand have different ranges of IR temperatures associatedwith their cloud tops as shown in Fig. 2, the profiles ofazimuthally averaged IR temperature need to be nor-malized to a common size and a common average cloud-top temperature. The brightness temperatures are nor-malized by subtracting the r 5 0 to r 5 444 km radialaverage of the azimuthally averaged brightness tem-perature ( ) from the azimuthally averaged brightness^B &ttemperature at each radii (^Bt(r)&), creating an anomalyvalue (bt):
b 5 ^B (r)& 2 ^B &. (2)t t t
The normalized radius (R) is created by subtracting theradius of the coldest azimuthally averaged brightness
temperature within 600 km of the radius (rBt min) fromthe physical radius (r) and dividing by the rBt min:
r 2 rBt minR 5 . (3)1 2rBt min
These procedures result in a normalized radial profileof normalized brightness temperature where the coldestnormalized brightness temperature is located at the or-igin of normalized radius (R 5 0). The averaged nor-malized radial profile of normalized brightness temper-ature (i.e., R versus bt) along with the normalized radialprofiles of normalized brightness temperature of the sixannular hurricanes that make up the average are shownin Fig. 7.
In order to compare a given azimuthally averagedbrightness temperature profile to the average one shownin Fig. 7, referred to as the mean profile, an identicalnormalization procedure must be performed on the az-imuthally averaged IR brightness temperature profile of

218 VOLUME 18W E A T H E R A N D F O R E C A S T I N G
FIG. 7. Average normalized radial profiles of normalized brightness temperatures for eachannular hurricane along with the six-storm average indicated by the thick dark line. See text forthe radius and temperature normalization procedures.
the tropical cyclone image under consideration or thetest profile. The comparison is accomplished by 1) com-puting the amount of the variance the test profile ex-plains in the mean profile, 2) calculating the mean ab-solute temperature difference between the mean and testprofiles, and 3) testing for a large warm eye in the im-agery. Using dependent data from the six annular hur-ricanes involved in this study, it was found that a valueof 50% of explained variance and a mean absolute dif-ference of 148C did a proficient job of distinguishingthe annular phase of these hurricanes from the rest oftheir life cycle. Using the imagery of the storms listedin Table 1, it was also found that a large warm eye couldbe distinguished using the radial profile of azimuthallyaveraged brightness temperature. The existence of alarge warm eye requires that the radius of the coldestazimuthally averaged brightness temperature (rBt min) begreater than 54 km and that the warmest brightness tem-perature inside rBt min be warmer than 08C. In evaluatingthe imagery, the annular hurricane index was set to avalue of 1.0 if all of these requirements were met for a3-h period of time and otherwise assigned a value of0.0.
Figure 8 shows time series plots of this simple indexalong with the times listed in Table 1 (dark horizontalbar) for the six hurricanes discussed in this study. Thismethod proved dependable in identifying the annularhurricane phases of the six storms that made up thedependent sample included in this study, particularlythose occurring in the eastern Pacific basin, noting thatthe IR datasets for Luis and Edouard were of a slightlypoorer quality. Although the times where the index was
positive did not exactly line up with the subjective times,the index did identify each storm. This objective methodwas also evaluated on all of the storms in the IR tropicalcyclone archive through 1999. The storms that wereidentified by this method as being annular are listed inTable 6 along with the number of hours they were iden-tified as having annular characteristics. In these diag-nostic trials, 17 storms were identified as having annularcharacteristics out of a possible 63 hurricanes and only6 were subjectively identified as being annular hurri-canes (i.e., Table 1). This evaluation indicates that thismethod correctly classifies hurricanes as being annularor not 52 out of 63 times (83% of the time). The exacttime of annular occurrence however proved more dif-ficult to predict with a success rate of approximately25%. Reviewing the imagery associated with these 17storms, most of the false alarms are associated with twofactors: 1) large warm eyes with ragged edges that ap-pear in the azimuthal average as symmetric (i.e., Felix,Hortense, Nora, Kay, Cindy, and Gert) and 2) very in-tense hurricanes (i.e., Guillermo, Mitch, and Floyd). In-teresting is the observation that these storms, whileclearly not annular hurricanes, experiences rather steadyintensities during these times. On the other hand, Georg-es was considered when the storms in the IR archivewere being subjectively evaluated, and had many of thecharacteristics of an annular hurricane, but it was notselected because its eye was a little smaller than averageand was continuously contracting during the period itdisplayed an annular ring of convection with little spiralband activity.
The second approach to creating an objective method

APRIL 2003 219K N A F F E T A L .
FIG. 8. Results of the objective annular hurricane indices are shown along with the annularhurricane periods determined from a subjective analysis of IR data. A thick horizontal bar indicatesthe subjectively determined time periods for each annular hurricane (i.e., those in Table 1). Thevertical bars indicate the results from the objective IR annular hurricane index, where a value of1 indicates that an annular hurricane exists according to the rules of this index. Also shown arethe 12-hourly results of the environmental annular hurricane index, which are indicated by asterisksat each 12-h point where the environmental conditions were found favorable for annular hurricanes.Thin lines connect the asterisks if these conditions last longer than one 12-h period.
for identifying annular hurricanes is to inspect the en-vironmental conditions for times when the environmen-tal conditions associated with annular hurricanes exist.Table 4 lists the required environmental conditions for
annular hurricanes along their expected ranges, asshown in Table 3.
Using the same 1989–99 data, a search for time pe-riods during which all of these environmental factors

220 VOLUME 18W E A T H E R A N D F O R E C A S T I N G
TABLE 6. A list of storms identified as annular using the digital IR values in the imagery. Listed is the year, the storm name, the basin,the dates and times of identification, and the number of hours contained in each period.
Year Storm Basin Dates Hours
1995 Felix Atlantic 0600 UTC 20 Aug–1000 UTC 20 Aug 51995 Luis Atlantic 1800 UTC 31 Aug–0400 UTC 1 Sep
0300 UTC 3 Sep–0500 UTC 3 Sep2200 UTC 3 Sep–1100 UTC 4 Sep1700 UTC 4 Sep–1900 UTC 4 Sep
113
143
19961996
EdouardHortense
AtlanticAtlantic
2300 UTC 24 Aug–2200 UTC 25 Aug2200 UTC 12 Sep–0100 UTC 13 Sep
244
1997 Guillermo East Pacific 1400 UTC 5 Aug–1500 UTC 5 Aug1900 UTC 5 Aug–2000 UTC 5 Aug
22
19971998199819981998
NoraGeorgesMitchDarbyGeorgette
East PacificAtlanticAtlanticEast PacificEast Pacific
0200 UTC 22 Sep–1500 UTC 22 Sep1300 UTC 19 Sep–0900 UTC 20 Sep1600 UTC 26 Oct–0100 UTC 27 Oct1700 UTC 17 Jul–1900 UTC 18 Jul1300 UTC 14 Aug–2100 UTC 14 Aug
14211026
91998 Howard East Pacific 0200 UTC 25 Aug–1900 UTC 25 Aug
0500 UTC 26 Aug–2300 UTC 26 Aug0800 UTC 27 Aug–1000 UTC 27 Aug
1819
319981999
KayCindy
East PacificAtlantic
0500 UTC 15 Oct–1000 UTC 15 Oct2300 UTC 27 Aug–1700 UTC 28 Aug
619
1999 Floyd Atlantic 0000 UTC 13 Sep–0400 UTC 13 Sep1300 UTC 14 Sep–1700 UTC 14 Sep
55
1999 Gert Atlantic 1600 UT 18 Sep–0400 UTC 19 Sep 131999 Beatriz East Pacific 1900 UTC 12 Jul–0300 UTC 13 Jul
0700 UTC 13 Jul–2100 UTC 13 Jul0100 UTC 14 Jul–1700 UTC 14 Jul
91517
1999 Dora East Pacific 1700 UTC 10 Aug–0200 UTC 12 Aug0800 UTC 12 Aug–1200 UTC 12 Aug1500 UTC 12 Aug–1200 UTC 13 Aug0800 UTC 15 Aug–2200 UTC 15 Aug0900 UTC 16 Aug–1100 UTC 16 Aug
355
2215
3
TABLE 7. A list of annular hurricanes identified by the simultaneousexistence of all of the environmental conditions associated with an-nular hurricanes, which are listed in Table 4. Listed are the year, thestorm’s name, and the number of 12-h periods for which these con-ditions existed in the environment.
Year Storm No. of 12-h periods
1989 IsmaelOctaveRaymond
113
1990 HernanIselleMarieOdile
2421
1992 FrankGeorgetteOrlene
341
1993 JovaKennethLidia
212
1995 BarbaraLuis
67
1996 DouglasEdouard
14
1998 Darby 4Howard 3
1999 BeatrizDoraEugene
591
are occurring simultaneously forms the basis of an ob-jective technique for identifying annular hurricanes. Us-ing this environmental index for the years 1989–99, 22storms were identified as having environmental condi-tions similar to annular hurricanes, 20 of which occurredin the eastern Pacific, as shown in Table 7. In the At-lantic, the only storms identified where Luis andEdouard. It also appears that there are certain years whenthe environment is conducive to annular hurricane for-mation. An interesting sidebar is the observation thatannular hurricanes in the eastern Pacific are more likelyto occur in years when the eastern and central equatorialPacific have negative SST anomalies.
Unfortunately, it is impossible to verify this methodsince the IR archive does not exist prior to 1995 in theAtlantic and 1997 in the east Pacific. It is, however,noteworthy that during the period when IR data wereavailable that of the 63 hurricane cases, only 1 case wasmisidentified (Eugene 1999), suggesting this method isdependable. Figure 8 illustrates the periods identifiedusing this method as asterisks for each 12-hourly pos-itive index values. If more than one consecutive 12-hour period is identified, the asterisks are connected witha thin line. Results from this index show that the en-vironmental conditions seem to lead the formation ofannular hurricanes as determined subjectively (i.e., Ta-

APRIL 2003 221K N A F F E T A L .
ble 1) and by the objective (IR) method (i.e., Table 4).This observation is consistent with recent theoreticalwork (e.g., Jones 1995; Bender 1997; Frank and Ritchie1999, 2001) that show that wind shear is not only themajor modulator of asymmetric and axisymmetric con-vective structure in hurricanes, but also that the struc-tural changes lag the onset of the shear or lack thereof.
Two methods of objectively identifying annular hur-ricanes were developed and discussed in this section.These results, while preliminary, suggest that the iden-tification of annular hurricanes is a possibility in a real-time operational setting using either of these methods.These encouraging results coupled with the intensityforecasting biases occurring with these storms, dis-cussed in section 3b, suggest that future research isneeded to determine if the identification of annular hur-ricanes is useful in improving intensity forecasts.
5. Summary and concluding remarks
The appearance of tropical cyclones in IR imagerydiffers greatly from case to case and over time. Themain focus of this study discusses a category of tropicalcyclone, termed annular hurricanes. When annular hur-ricanes are compared with the greater population oftropical cyclones, as observed in an infrared (IR) dataarchive of tropical cyclones, they appear distinctly sym-metric about their center. Their appearance in IR im-agery is characterized by large circular eye features sur-rounded by a nearly uniform ring of deep convectionand a distinct lack of deep convective features (i.e.,spiral bands) outside this ring.
During 1995–99 six hurricanes (two Atlantic and foureastern Pacific) were subjectively determined to be an-nular hurricanes (Fig. 1). It was found that these stormshave several features in addition to axisymmetry thatseparate them from other storms, including systematicformation characteristics, steady intensities, and theirexistence in only specific environmental conditions.
The evidence presented here suggests that annularhurricane formation is preceded by a dramatic asym-metric mixing event in which possible mesovortices mixeyewall air into the eye and vice versa, as shown in Fig.4, culminating in the formation of the axisymmetricstorms with large eyes (i.e., annular hurricanes). Theobserved thermodynamic structures of two storms sam-pled by aircraft (Luis and Dora) as characterized bymore uniformly distributed values of ue in the eye sug-gest that a dramatic horizontal mixing event had recentlyoccurred. At the same time the observed wind field sug-gests that some eye-to-eyewall mixing is still occurring,as shown by the steplike features in the tangential windthat are associated with local vorticity and angular ve-locity peaks.
Once annular hurricanes have formed, they can main-tain their annular shape for days if specific environ-mental conditions (see Table 4) are maintained. Annularhurricanes are also rather intense, averaging 108 kt,
which corresponds to roughly 85% of their MPI withrespect to SST. As a result, annular hurricanes pose aninteresting challenge when forecasting intensity change.Unlike typical tropical cyclones of hurricane strength,annular hurricanes tend to experience a long period ofnearly steady intensities with a relatively slowly de-creasing intensity following their maximum intensity asshown in Fig. 3. As a result of this intensity changecharacteristic, intensity forecast errors are larger forthese storms than for the 1995–99 mean, with largenegative biases, suggesting that the forecasts overesti-mate the future rate of filling (see Table 2).
Composite analysis reveals that the typical annularhurricane exists in a very favorable hurricane environ-ment. Such an environment is characterized by the com-bination of 1) weak easterly or southeasterly verticalwind shear, 2) easterly flow and relatively cold tem-peratures at 200 hPa, 3) a narrow range (25.48–28.58C)of SSTs that are nearly constant, and 4) a lack of 200-hPa relative eddy flux convergence due to environmen-tal interactions (see Tables 3 and 4 for details). Theseindividual characteristics are quite commonly observed,but the combination of these factors is quite rare oc-curring 0.8% and 3.0% of the time in the Atlantic andeastern Pacific tropical cyclone basins, respectively.
A secondary topic of this paper was the objectiveidentification of annular hurricanes. Two approacheswere discussed. The first approach utilizes the digitalbrightness temperature information contained in the IRimagery. Once azimuthal means of brightness temper-ature were created, they were normalized to a commonsize and mean brightness temperature, and then com-pared to the mean normalized radial brightness tem-perature profile of annular hurricanes to form an index.The second approach used the environmental conditionsto determine whether an annular hurricane could exist.This required that all of the eight factors listed in Table4 had to be satisfied. Both techniques seem to workwell, suggesting that such information could be exam-ined for possible improvements to intensity forecasting.
Although the main purpose of this paper was the doc-umentation of annular hurricanes, several questionsabout these storms remain. The striking symmetry inIR imagery raises the question, What caused the sym-metry? One possibility is the weak and southeasterlyvertical wind shear associate with these systems. It hasbeen shown that vertical wind shear leads to systematicasymmetries in vertical motion, precipitation, and con-vection (Bender 1997; Frank and Ritchie 1999; Wil-loughby et al. 1984). Annular hurricanes show littleevidence of convective asymmetries. Furthermore,Bender’s (1997) modeling study shows that verticalwind shear can be caused by the differential advectionof planetary vorticity by the baroclinic hurricane vortex.This shear, which is due to the b effect, has similarmagnitude but opposite direction to the large-scale en-vironmental vertical shear associated with the annularhurricanes. In this study the environmental wind has

222 VOLUME 18W E A T H E R A N D F O R E C A S T I N G
been filtered to remove the storm-scale circulation with-in 600-km radius but not all of the effects of the b gyres.However, the filtering reduces the magnitude of b gyresby about a factor of 2 for an average-sized hurricanethat has b gyres extending to 800–1000 km. Further-more, even if the storm-scale circulations were not ef-fectively eliminated through this filtering process, theb-gyre-induced vertical wind shear would likely bepoorly sampled at the grid spacing (28–2.58 latitude) ofthe NCEP analysis data (Franklin et al. 1996). Basedupon these observations one could speculate that theenvironmental vertical wind shear associated with an-nular hurricanes (weak southeasterly) is compensatingfor vertical wind shear resulting from tropical cycloneb gyres weakening with height, and thus allowing forgreater storm axisymmetry.
Other questions arise from this study that are not soeasily answered and that are beyond the scope of thisstudy. Why is there a relative reduction of prominentouter bands? And, why do these storms display slowerfilling rates than other hurricanes? The observations dis-cussed in this paper simply cannot answer these rathercomplicated questions. The role of dynamics and ther-modynamics in hurricanes and their interwoven naturesuggests that these questions as they relate to annularhurricanes are likely better answered by simple diag-nostic modeling studies.
In summary, nature produces a nearly symmetric hur-ricane referred to as annular hurricanes in this study.The documentation of these annular hurricanes showshow they are similar to and different than the generalpopulation of tropical cyclones. Using the observationspresented here, particularly the environmental condi-tions associated with these storms, modeling studiesspecifically designed to focus on the formation and evo-lutionary characteristics of these storms can be designedand, hopefully, will lead to even greater physical un-derstanding. The differences between annular hurricanesand the greater population of hurricanes have also beenused to classify these systems both subjectively and ob-jectively. While the ultimate usefulness of such dis-crimination is beyond the scope of this study, it doessuggest a future research topic answering the question,Does the identification of annular hurricanes lead tobetter intensity forecasts?
Acknowledgments. The authors thank Kerry Emanuelfor supplying his portion of the data for Fig. 3, WayneSchubert for his very helpful comments, Ray Zehr forcontinuing to maintain and improve the CIRA/NESDIStropical cyclone IR archive, and the three anonymousreviewers whose helpful comments greatly improved themanuscript. National Oceanic and Atmospheric Admin-istration Grant NA67RJ0152 supported the research ef-forts of J. Knaff and J. Kossin.
REFERENCES
Bader, M. J., G. S. Forbes, J. R. Grant, R. B. E. Lilley, and A. J.Waters, 1995: Images in Weather Forecasting: A Practical Guide
for Interpreting Satellite and Radar Imagery. Cambridge Uni-versity Press, 499 pp.
Bender, M. A., 1997: The effects of relative flow on asymmetricstructures in hurricanes. J. Atmos. Sci., 54, 703–724.
Davis, M. A. S., G. M. Brown, and P. Leftwich, 1984: A tropicalcyclone data tape for the eastern and central North Pacific basins,1949–1983. NOAA Tech. Memo. NWS NHC 25, 15 pp.
DeMaria, M., and J. Kaplan, 1994a: A statistical hurricane intensityprediction scheme (SHIPS) for the Atlantic basin. Wea. Fore-casting, 9, 209–220.
——, and ——, 1994b: Sea surface temperature and the maximumintensity of Atlantic tropical cyclones. J. Climate, 7, 1324–1334.
——, and ——, 1999: An updated statistical hurricane intensity pre-diction scheme (SHIPS) for the Atlantic and eastern North Pa-cific basins. Wea. Forecasting, 14, 326–337.
——, J. Demuth, and J. A. Knaff, 2001: Validation of an AdvancedMicrowave Sounder Unit (AMSU) tropical cyclone intensity andsize estimation algorithm. Preprints, 11th Conf. on Satellite Me-teorology and Oceanography, Madison, WI, Amer. Meteor. Soc.,300–303.
Dvorak, V. F., 1984: Tropical cyclone intensity analysis using satellitedata. NOAA Tech. Rep. NESDIS 11, Washington, DC, 47 pp.[Available from National Technical Information Service, 5285Port Royal Rd., Springfield, VA 22161.]
Eliassen, A., and M. Lystad, 1977: The Ekman layer of a circularvortex: A numerical and theoretical study. Geophys. Norv., 31,1–16.
Emanuel, K., 2000: A statistical analysis of tropical cyclone intensity.Mon. Wea. Rev., 128, 1139–1152.
Frank, W. M., and E. A. Ritchie, 1999: Effects of environmental flowupon tropical cyclone structure. Mon. Wea. Rev., 127, 2044–2061.
——, and ——, 2001: Effects of vertical wind shear on the intensityand structure of numerically simulated hurricanes. Mon. Wea.Rev., 129, 2249–2269.
Franklin, J. L., S. E. Feuer, J. Kaplan, and S. D. Aberson, 1996:Tropical cyclone motion and surrounding flow relationships:Searching for beta gyres in Omega dropwindsonde datasets.Mon. Wea. Rev., 124, 64–84.
Jarvinen, B. R., C. J. Neumann, and M. A. S. Davis, 1984: A tropicalcyclone data tape for the North Atlantic basin, 1886–1983: Con-tents, limitations, and uses. NOAA Tech. Memo. NWS NHC 22,Coral Gables, FL, 21 pp.
Jones, S. C., 1995: The evolution of vortices in a vertical shear. PartI: Initially barotropic vortices. Quart. J. Roy. Meteor. Soc., 121,821–851.
Kossin, J. P., 2002: Daily hurricane variability inferred from GOESinfrared imagery. Mon. Wea. Rev., 130, 2260–2270.
——, and M. D. Eastin, 2001: Two distinct regimes in the kinematicand thermodynamic structure of the hurricane eye and eyewall.J. Atmos. Sci., 58, 1079–1090.
——, and W. H. Schubert, 2001: Mesovortices, polygonal flow pat-terns, and rapid pressure falls in hurricane-like vortices. J. Atmos.Sci., 58, 2196–2209.
——, ——, and M. T. Montgomery, 2000: Unstable interactions be-tween a hurricane’s primary eyewall and a secondary ring ofenhanced vorticity. J. Atmos. Sci., 57, 3893–3917.
Molinari, J., D. Vollaro, and F. Robasky, 1992: Use of ECMWFoperational analyses for studies of the tropical cyclone environ-ment. Meteor. Atmos. Phys., 47 (2–4), 127–144.
Montgomery, M. T., J. M. Hidalgo, and P. D. Reasor, 2000: A semi-spectral numerical method for modeling the vorticity dynamicsof the near-core of hurricane-like vortices. Atmospheric SciencePaper 695, Dept. of Atmospheric Science, Colorado State Uni-versity, 56 pp. [Available from Dept. of Atmospheric Science,Colorado State University, Fort Collins, CO 80523.]
——, H. D. Snell, and Z. Yang, 2001: Axisymmetric spindown dy-namics of hurricane-like vortices. J. Atmos. Sci., 58, 421–435.
Reynolds, R. W., and T. M. Smith, 1994: Improved global sea surface

APRIL 2003 223K N A F F E T A L .
temperature analyses using optimum interpolation. J. Climate,7, 929–948.
Ritchie, E., and G. J. Holland, 1993: On the interaction of tropicalcyclone scale vortices. Part II: Discrete vortex patches. Quart.J. Roy. Meteor. Soc., 119, 1363–1379.
Schubert, W. H., M. T. Montgomery, R. K. Taft, T. A. Guinn, S. R.Fulton, J. P. Kossin, and J. P. Edwards, 1999: Polygonal eyewalls,asymmetric eye contraction, and potential vorticity mixing inhurricanes. J. Atmos. Sci., 56, 1197–1223.
Whitney, L. D., and J. S. Hobgood, 1997: The relationship betweensea surface temperatures and maximum intensities of tropical
cyclones in the eastern North Pacific Ocean. J. Climate, 10,2921–2930.
Willoughby, H. E., J. A. Clos, and M. G. Shoreibah, 1982: Concentriceye walls, secondary wind maxima, and the evolution of thehurricane vortex. J. Atmos. Sci., 39, 395–411.
——, F. D. Marks Jr., and R. J. Feinberg, 1984: Stationary and movingconvective bands in hurricanes. J. Atmos. Sci., 41, 3189–3211.
Zehr, R. M., 2000: Tropical cyclone research using large infraredimage data sets. Preprints, 24th Conf. on Hurricanes and Trop-ical Meteorology, Fort Lauderdale, FL, Amer. Meteor. Soc., 486–487.