Embed Size (px)
Citation preview

Jim Hansom1, Alistair Rennie2, James Fitton1, Kat Ball3, Alistair Cargill3, Mairi Davies4
(University of Glasgow1, SG / SNH 2 , SEPA3, HES4) www.dynamiccoast.com
21st Century Coastal Adaptation - Can Scotland Deliver?
Present day significant erosion in ScotlandMore than 10m of erosion or faster than 0.5m/yr

Climate Change Act (2009)
Places a duty on Scottish Government to address the risks in UK CCRA via the Climate Change Adaptation Programme
“Clear leadership …. and clear duties!”
Flood Risk Management Act (2009)
2
(Scottish
Cabinet)
2

What do we anticipate?
• That rising sea levels, increased coastal erosion and erosion-enhanced flooding will progressively impact Scotland’s
soft coastlines, its assets and communities. Science uncertainties gap.
• Magnitude of future coastal change cannot be accommodated within the present littoral. Acceptance gap 1.
• Strategies that fix the shoreline (rather than allow shifts) are increasingly unsustainable. Acceptance gap 2.
• Need to know the extents and rates of erosion, past, present and future, along with risk assessment of the coastal
assets and communities impacted (economic, natural, cultural heritage, social disadvantage). Knowledge gap.
• Need for policy and strategic levers to cope with “slow-burn” pressures: slow short term impact but rapid medium
term pick-up. Policy implementation gap.
• Need to put in place Adaptive Policies and Measures to deliver a sustainable coast. Policy gap.
3

Reduced sediment supply Increased “management”
Sea level rise
Key drivers of coastal erosion and flooding in Scotland
Enhanced storm impact
Reduced sediment supply

5
Is sea level an issue?2016 Global Mean Sea Level
http://sealevel.colorado.edu/content/2016rel4-global-mean-sea-level-time-series-seasonal-signals-removed
CU: 3.4 ± 0.4 mm/yrAVISO: 3.4 ± 0.6 mm/yrCSIRO: 3.3 ± 0.4 mm/yrNASA GSFC: 3.4 ± 0.4 mm/yrNOAA: 3.2 ± 0.4 mm/yr (w/ GIA)
Rennie, AF & Hansom, JD (2011) Geomorphology
Is sea level an issue in Scotland?
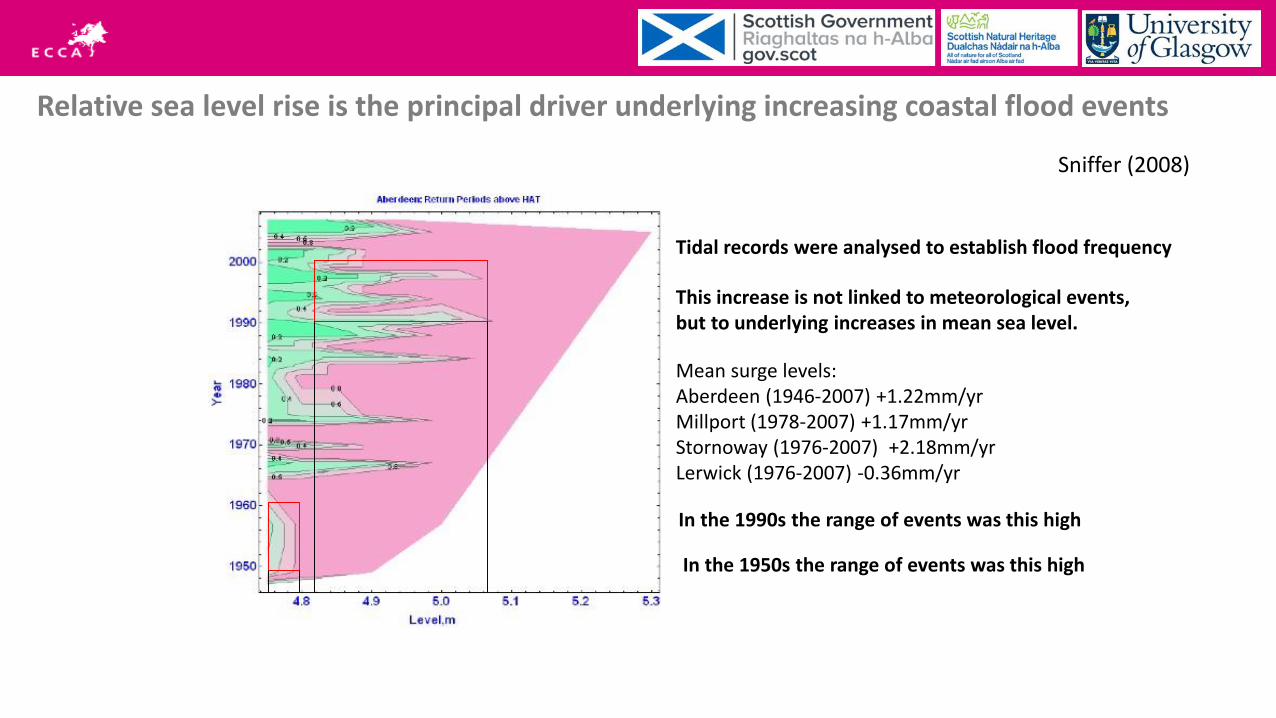
Relative sea level rise is the principal driver underlying increasing coastal flood events
Sniffer (2008)
Tidal records were analysed to establish flood frequency
In the 1950s the range of events was this high
In the 1990s the range of events was this high
This increase is not linked to meteorological events, but to underlying increases in mean sea level.
Mean surge levels:Aberdeen (1946-2007) +1.22mm/yrMillport (1978-2007) +1.17mm/yrStornoway (1976-2007) +2.18mm/yrLerwick (1976-2007) -0.36mm/yr

Is storminess (storm waves) an issue?
Wave height (Hs) Increase rate Season Period Source
NE Atlantic
NE Atlantic
NE Atlantic
0.022 m/yr
0.027 m/yr
0.025 m/yr (min)
Annual 1960-90
Annual 1960-88
Annual 1955-94
Bacon & Carter, 1991
Bouws et al., 1996
Gunther et al., 1998
NW Atlantic
NW Atlantic
NW Atlantic
0.023 m/yr
0.024 m/yr
0.032 m/yr
Annual 1960-88
Annual 1976-06
Winter 1976-06
Bouws et al., 1996
Komar et al., 2010
Komar et al., 2010
NW Atlantic
(Hurricanes)
0.277 m/yr Summer 1996-05
33%inc=7.5-10m
Allen & Komar, 2009
NOTE: Table shows trend in Hs (highest 33% of all waves)
Maximum wave height (Hmax) is higher and mean wave height is lower than Hs.

Is sediment supply an Issue?Most Scottish beaches display chronic sediment deficits
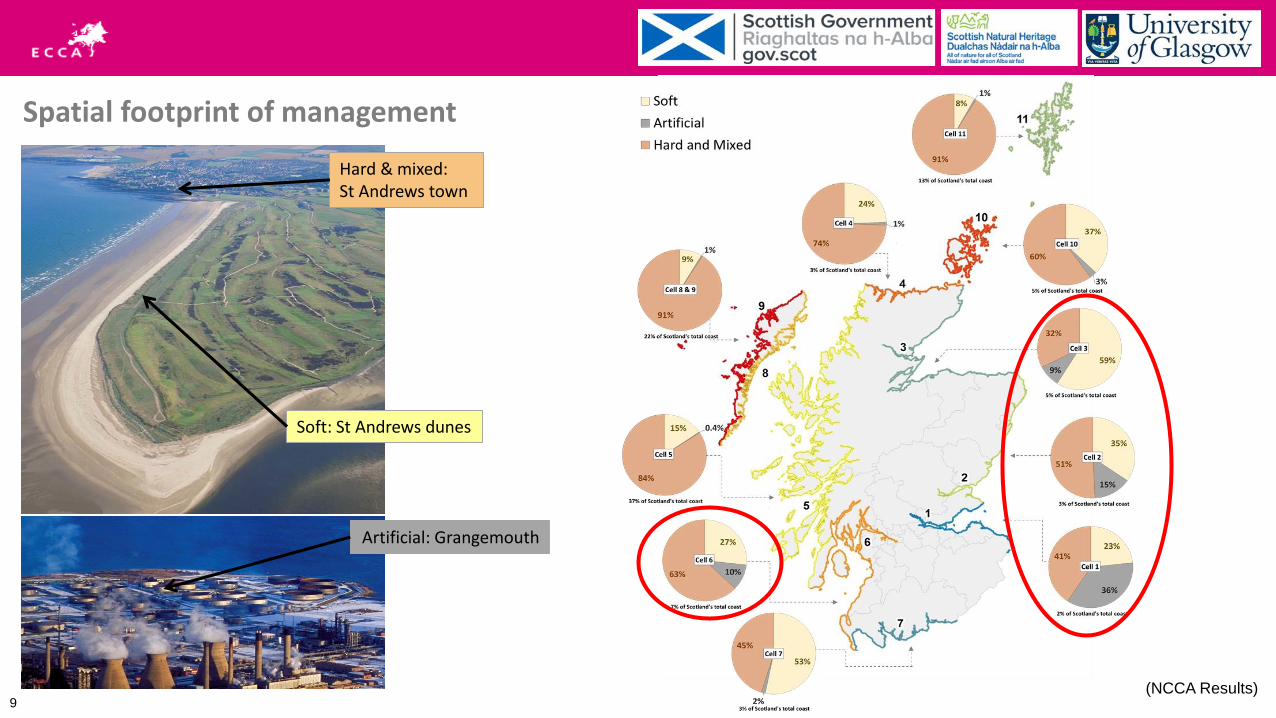
Spatial footprint of management
9(NCCA Results)
Hard & mixed: St Andrews town
Soft: St Andrews dunes
Artificial: Grangemouth

Addressing the knowledge gap

11
NCCA Results
Generally: 75% soft coast dynamic stability25% directional changes
Before the 1970s: (normalised for time period)8% extent of erosion14% extent of accretion
Since the 1970s: 39% ↑ in extent of erosion 22% ↓ in extent of accretion
+ Doubling of erosion & accretion rates
But: National picture dilutes more significant changes and patterns.
Recent Period (1970-Modern)37 years
Future Period? (Modern – 2050)37 years
Historical Period (1890-1970)37 years

Natural Susceptibility to Coastal Erosion
model
• ‘coasts inherently susceptible to erosion’
• surface altitude, • rock head altitude, • coastal proximity, • wave exposure, • sediment supply,• coastal defences.
• Available on SEPA’s website:• http://map.sepa.org.uk/floodmap/map.htm
• For more info see poster
12Fitton JM, Hansom JD, Rennie AF, 2016. Ocean and Coastal Management.
Flood Risk Management Maps http://map.sepa.org.uk/floodmap/map.htm

13
Asset Vulnerability
What lies behind recently eroding areas?
If recent erosion rates continue to 2050: 50 buildings 5.2 km of roads1.6 km of railway2.4 km of water pipes… expected to be eroded
But this assumes…Spatially limited analysis (red only)No increase in rateNo change in managementNo change due to climate change
Almost certainly under estimated.
14
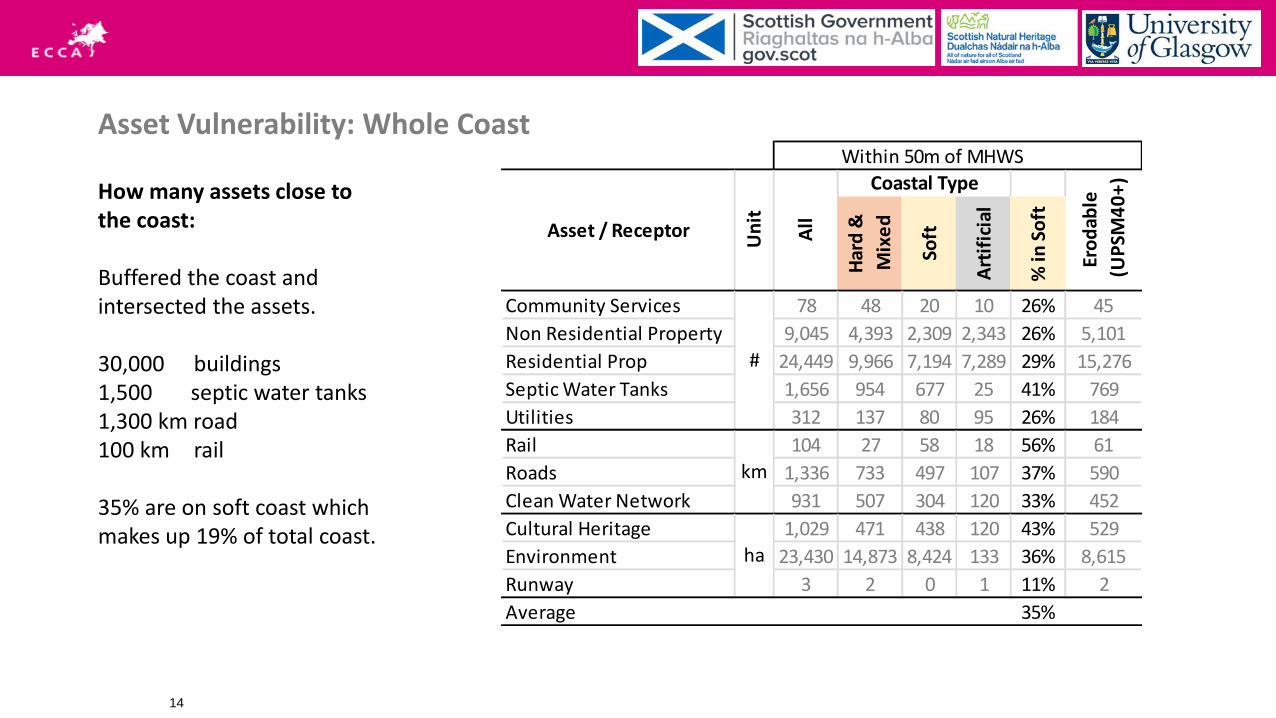
Asset Vulnerability: Whole Coast
How many assets close to the coast:
Buffered the coast and intersected the assets.
30,000 buildings1,500 septic water tanks1,300 km road100 km rail
35% are on soft coast which makes up 19% of total coast.
Within 50m of MHWS
Har
d &
Mix
ed
Soft
Art
ific
ial
% in
So
ft
Community Services 78 48 20 10 26% 45
Non Residential Property 9,045 4,393 2,309 2,343 26% 5,101
Residential Prop 24,449 9,966 7,194 7,289 29% 15,276
Septic Water Tanks 1,656 954 677 25 41% 769
Utilities 312 137 80 95 26% 184
Rail 104 27 58 18 56% 61
Roads 1,336 733 497 107 37% 590
Clean Water Network 931 507 304 120 33% 452
Cultural Heritage 1,029 471 438 120 43% 529
Environment 23,430 14,873 8,424 133 36% 8,615
Runway 3 2 0 1 11% 2
Average 35%
Ero
dab
le
(UP
SM4
0+
)
All
Coastal Type
ha
Asset / Receptor
Un
it
#
km

15
Asset Vulnerability: Whole Coast
How many assets close to the coast
Asset distribution by cell and type.
Interpretation:East coast contains bulk of coastal assets
East coast contains bulk of artificial coast100% of which protects assets.
These assets depend on upkeep/renewal of existing protection or insertion of new.
BUT: No asset type is immuneAll cells have erodible assetsCondition of artificial coast is currently variable.
15
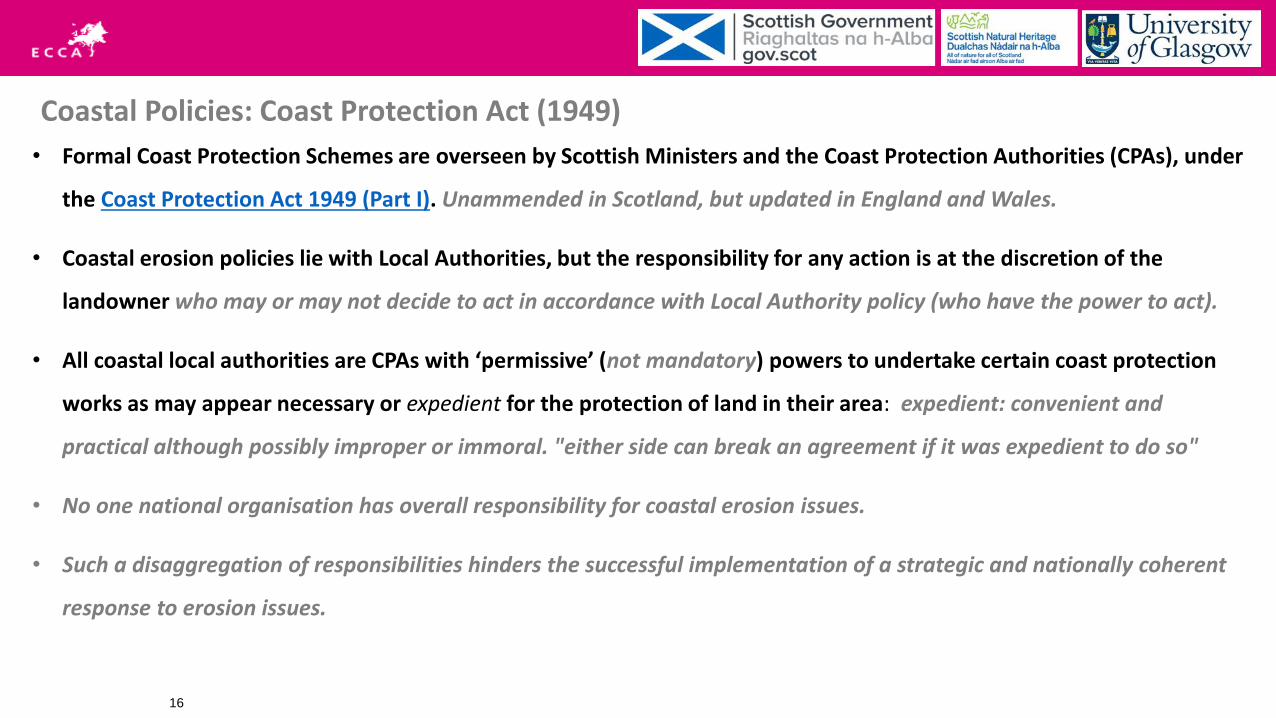
• Formal Coast Protection Schemes are overseen by Scottish Ministers and the Coast Protection Authorities (CPAs), under
the Coast Protection Act 1949 (Part I). Unammended in Scotland, but updated in England and Wales.
• Coastal erosion policies lie with Local Authorities, but the responsibility for any action is at the discretion of the
landowner who may or may not decide to act in accordance with Local Authority policy (who have the power to act).
• All coastal local authorities are CPAs with ‘permissive’ (not mandatory) powers to undertake certain coast protection
works as may appear necessary or expedient for the protection of land in their area: expedient: convenient and
practical although possibly improper or immoral. "either side can break an agreement if it was expedient to do so"
• No one national organisation has overall responsibility for coastal erosion issues.
• Such a disaggregation of responsibilities hinders the successful implementation of a strategic and nationally coherent
response to erosion issues.
16
Coastal Policies: Coast Protection Act (1949)

• The Flood Risk Management Act (2009) does not refer to coastal erosion.
• Coastal flood risk cannot be appreciated without coastal erosion context, but this is implicit and relies on an
interpretation of the Act, not an explicit requirement of it. Interpretation: explicit requirements are prioritized
ahead of those that are implicit.
• “NFRA: take account as far as possible issues such as the position and general geomorphological characteristics of
coastal and transitional waters” as far as possible.
• For each flood risk district, SEPA to prepare maps of artificial structures and natural features, whose removal would
significantly increase flood risk (and indicate whether constructed as flood protection scheme under the 2009 or
1961 Act). Interpretation: Reads SEPA not required to identify any other structures, limits Act use outwith flood
protection schemes and Potentially Vulnerable Areas (PVAs) that are affected by coastal erosion related flooding.
• Explicit requirements of the 2009 Act obscures the Implicit need for consideration of the wider coastal context and
hinders integrated aspects of sustainability and broader coastal land use, such as ICZM.17
Coastal Policies: Flood Risk Management Act (2009)

18
Several national policies in Scotland acknowledge the importance of coastal erosion incorporation into regional plansand local planning decisions along with climate change. Examples include Scottish Planning Policy (SPP), NationalPlanning Framework 3 and the National Marine Plan.
Implementation of these national level strategic policies may prove problematic as they appear to be contradictory inplaces. SNH’s working ‘with natural processes’ may contradict Historic Environment Scotland's ‘care and protect role’“Protection” suggests fixing the coast via structures, working with natural processes suggests allowing flexibility anddynamism.
Terrestrial development plans expect new developments to avoid coastal erosion or flooding risk (SPP para 88).Where SMPs exist and erosion is anticipated, the policy approach adopted is clear. Where no SMP exists it is unclearthe extent to which robust audits of the shoreline are undertaken to inform planning decisions.
In addition, whereas some LAs undertake routine reviews of coastal defences, SPP states that an up-to date audit ofgreen infrastructure should inform planning (SPP para 222). It remains unclear how this is being undertaken and theextent to which natural coastal defences are identified, included and by whom.
Only 4 (+2 in development) of 25 LAs have an SMP (9 % (1,232 km). 4 LAs rely on national level policies with nocoastal erosion policies of their own and 5 5 have a regional policy. 4,183 km of coast (22 %) have no apparent policystatus reported.
Coastal Policies:

19
• SPP guidance on coastal erosion risk : new development should avoid potentially erosional (and or flood risk) areas and develop plans that take account of these risks: existing developments use SMPs as the main policy tool; where no SMP exists erosion policy and actions are ad hoc.
• NPF3 (2014) Scotland’s Third National Planning Framework – adaptation strategies are expected on both the developed and undeveloped coast but say little on how this might be achieved. Unwritten assumption that new development might be allowed within existing developed areas that are currently protected, rather than directing new development to risk-free areas.
• National Marine Plan (NMP) (and developing Regional Marine Plans?) identify erosion risk areas that new development should avoid, but say little on how this can be achieved. Again, assumption that new development might be allowed within existing developed areas that are currently protected.
• All national level strategies, carry direct or oblique reference to the need for authorities to consider adaptation strategies to reduce coastal erosion risk. However, lack of definition about what adaptation means:
• One extreme: adaptation may involve removal of houses, infrastructure, communities to more resilient locations. Other extreme: adaptation might mean raising sea walls or maintaining or extending defences at present levels.
• The permissive nature of coastal erosion policies within legislation is noted across the UK (ref DEFRA FECRM). Unclear if this ‘optionality’ is conducive to developments being built in areas which are known to be erosional, although anecdotal evidence suggests this may be an issue.
Coastal Policies:

20
Addressing the policy implementation gap
• Coastal erosion is a shared problem across government, its public bodies, private sector, and communities and its solution needs to be shared across all those actors.
• Coastal erosion and coastal flooding are interlinked and need to be considered jointly.
• The wording in the Coast Protection Act 1949 and the FRM Act 2009 require adjustment, particularly in the light of climate change, and a broader need for an integrated approach.
• Scottish Government leadership is clear (Climate Change Act, Scottish Climate Change Adaptation Programme as an overarching mechanism), but where the strategic ownership lies for delivery throughout the public sector is unclear. One route may be via identified senior “coastal champions” within each organisation.
• There is an urgent need for the resources to make adaptation planning happen and provisioned to grow into the longer-term as the need increases.
• Such an approach may find greater traction if contained within a Scottish Coastal Adaptation Plan.
• There is a lack of well-developed polices for the large sections of the Scottish coast with no SMP. Develop targeted SMPs of key vulnerable areas, rather than the whole coast. Revision of National Flood Risk Assessment and Flood Risk Management Strategies to embrace more coastal erosion provision may provide an alternative statutorymechanism to non-statutory SMPs for sustainable coastal management.
• Flood Risk Management Strategies (FRMS) focus on reducing vulnerability on developed coasts and may underestimate important undeveloped coasts vulnerable to flooding. Work needed to establish linkages between social disadvantage and coastal erosion and flooding vulnerability, especially across the urban-rural divide.

Benbecula, Western Isles, New house (2011) built on reinstated land after
land was eroded and original house destroyed on the same site in 2005 storm.
Acceptance gap, policy gap

Adaptation is all about fixing the roof while the sun shines
• Climate change shows a need for coastal erosion and flooding to be considered together: both are set to worsen in the near future.
• Magnitude of future coastal change cannot be accommodated within the confines of the present littoral.
• Before these trends accelerate we have a window of opportunity now to plan, mitigate and adapt in advance.
• We have the policies in place (OK, some need adjustment) but the key is fostering widespread cross sector buy-in for integrated adaptation and mitigation planning at the coast.
• Better alignment of terrestrial land-use planning and marine-based planning is needed to deliver a truly sustainable coastal zone.

On behalf of
Jim Hansom, James Fitton, Ali Rennie & the NCCA Steering Committee
Thanks for listening
Questions ?
www.dynamiccoast.com 23