Embed Size (px)
Citation preview
2. Literature review on platinum-group minerals
2.1. Platinum-group element mineralogy
2.1.1. Introduction
The distribution of PGEs (platinum-group elements) in an ore is directly related to the
type of ore, which in turn, dictates the mineralogical constitution. PGE ores can be
divided into the following main classes (Stribrny et al., 2000):
• Alluvial ores: These ores contain almost no sulphide and are composed of
individual particles of rock and liberated minerals: an example is the
Colombian deposit.
• Layered intrusions (e.g. Bushveld, Stillwater, Great Dyke)
• Magmatic nickel sulphide deposits (e.g. Noril’sk-Talnakh, Sudbury)
The layered intrusion ores contain by the far the world’s largest reserves of PGE. The
mineralization and occurrence of the PGEs are of utmost importance considering the
very low concentrations of these elements in the ores (1-15 g/t).
PGE deposits can be divided into two categories: discrete platinum-group minerals
(PGMs), and those hosted as “impurities” within other minerals. The latter category
also includes the so-called “invisible” portion of the precious-metal distribution
(Oberthür et al., 2002a). The reason for the “invisibility” is not always known but can
be twofold in nature: PGEs are present in submicroscopic particles or they occur as a
dilute solid-solution. The understanding of the PGE associations is of utmost
importance in order to construct mineralogical balances.
2.1.2. Hosted platinum-group elements
The PGE distribution between and content of the base-metal sulphides,
sulpharsenides, oxides, and silicates are largely speculative, without substantial
experimental evidence. However, the invention of the electron microprobe has led to
3
UUnniivveerrssiittyy ooff PPrreettoorriiaa eettdd –– VVeerrmmaaaakk,, MM KK GG ((22000055))
an explosion in the number of discrete PGM species being identified. It has also
contributed to the understanding of the PGE distributions within other minerals as
indicated by the results of the studies given below.
2.1.2.1. PGEs hosted in sulphides
There is little doubt at this stage that sulphides are a major repository of PGEs and
these minerals can contain PGEs in variable amounts up to a few percent (by mass).
2.1.2.1.1. Pentlandite (Fe,Ni)9S8.
The best known carrier of PGEs is pentlandite (which can contain up to 12.1 wt% Pd).
Pentlandite from Stillwater contains between 8.6-12.1 % Pd (Cabri, 1992). Reported
maximum levels of Pd in pentlandite in (ppmw) (ppmw refers to parts per million by
weight) are: J-M reef (46000), Platreef (20000), Lac des Iles (6500), Medvezhy Creek
(2540), Great Dyke (1990), Penikat (1800) and Merensky reef (1164) (Cabri, 1992).
Strirny et al. (2000) reported Pd and Rh partioning up to 2236 and 259 ppmw,
respectively, in pentlandite from the Hartley Mine in the Great Dyke. In addition to
this Prendergast (1990) reported a maximum of around 0.2 wt% Pd in pentlandite and
that these low Pd concentrations could not account for the “missing Pd”. “Missing”
PGMs were also reported by Oberthür et al. (1998) from the Hartley Mine in the
Great Dyke.
Lidsay et al. (1988) reported that the Pt content of the pentlandite from the Merensky
reef is usually less than 36 ppmw and has a mean content of around 10-13 ppmw.
Pentlandite from the Hartley Mine in the Great Dyke has a mean content of around
8.5 ppmw Pt. In contrast to this Prendergast (1988a) reported no association of Pt with
pentlandite from samples taken at Mimosa Mine in the Great Dyke. The maximum
reported solubilities of Pd, Rh and Ru in pentlandite are 12.5%, 12.4% and 12.9%,
respectively, but no Pt could be detected at the analytical sensitivity value of 0.05%
(Makovicky, 1986). This clearly indicates that pentlandite is mainly a Pd carrier and
that high pentlandite recoveries are essential to optimise the Pd recoveries.
4
UUnniivveerrssiittyy ooff PPrreettoorriiaa eettdd –– VVeerrmmaaaakk,, MM KK GG ((22000055))
2.1.2.1.2. Pyrrhotite (Fe1-xS)
Pyrrhotite can accommodate considerable quantities of PGE in solid solution at
elevated temperatures, up to 11% Pd, 1.3 % Ru, 10.5% Rh and 2.2 %Pt, but upon
cooling most of these PGM are expelled. A higher Fe content in the pyrrhotite is also
detrimental to the solubility limit of PGMs in the mineral. Cabri (1988) reported a
maximum of 47 ppmw Pd in pyrrhotite from the J-M reef. The contents of the rest of
the PGEs in pyrrhotite from the most important PGE deposits are usually lower than
20 ppmw. The detection limit of many of the PGMs is of the order of 10 ppmw. These
results indicate that pyrrhotite contains PGEs very close to the detection limit; indeed
Oberthür et al. (1997) reported that pyrrhotite usually contains PGEs at concentrations
close to or lower than the detection limit. Another important aspect is the occurrence
of pentlandite as flame-shaped exsolutions in pyrrhotite (typical in ore from Mimosa
Mine, Great Dyke). Hence the flotation characteristics of pyrrhotite will impact on the
recovery of the PGEs, largely due to the occurrence of pentlandite within pyrrhotite.
2.1.2.1.3. Pyrite (FeS2)
Pyrite does not accommodate appreciable quantities of PGM as shown by the
experimental work performed by Makovicky (1986). However, Strirny et al. (2000)
reported that pyrite from the Hartley Mine in the Great Dyke can contain on average
about 36 ppmw Pt (range from 0.4 to 244; mean of 35.5 ppmw).
2.1.2.1.4. Chalcopyrite (CuFeS2)
Chalcopyrite usually contains PGE at concentrations lower than the detection limit
[(Oberthür et al., 1997) and (Cabri, 1992)]. In addition to this, experimental studies
also indicate the low solubility of PGMs in Cu-Fe sulphides (Lindsay et al., 1988).
5
UUnniivveerrssiittyy ooff PPrreettoorriiaa eettdd –– VVeerrmmaaaakk,, MM KK GG ((22000055))
2.1.2.2. PGEs hosted in oxides
The most important oxides currently under investigation are chromite (FeCr2O4) and
magnetite (Fe3O4). Cabri (1981) reported the presence of Pt in magnetite, but this
needs verification (Cabri, 1981), since magnetite can be associated with Pt-Fe alloys.
Parry (1984) reported PGE values of typically less than 1 ppmw for mixtures of
magnetite and ilmenite.
2.1.2.3. PGEs hosted in silicates
There is little information on the PGE content of silicates. Michell et al. (1987)
reported values less than 5 ppb and typically of the order of 1ppb. It is postulated that
the Sudbury ores contains a significant portion of minute PGMs, which occur
interstitially in silicates (Sizgoric, 1984) and that the Merensky reef contains PGMs in
solid solution within oxides and silicates (Kinloch, 1982; Peyerl, 1983). It remains
difficult to assess whether large or small quantities of PGEs are associated with the
silicates.
2.1.2.4. PGEs hosted in sulpharsenides, arsenides and tellurides
These groups of minerals can contain appreciable levels of PGE. For example
cobaltite (CoAsS) contains up to 600 ppmw Pt, 2800 ppmw Pd, 25000 ppmw Rh and
2600 ppm Ir (Cabri, 1981).
2.1.3. Platinum-group minerals
2.1.3.1. Platinum-group element mineralogy of the Merensky Reef, UG-2 Reef
and the Great Dyke of Zimbabwe
Microbeam techniques enable the investigator to analyse the PGMs quantitatively to
understand better the platinum-group element (PGE) distribution between discrete
PGMs. As stated earlier, the number of identified PGMs exploded after the
development of the microprobe. Broadly, PGMs can be grouped into metals,
intermetallic compounds and alloys especially with Sn, Fe, Pb, Hg, Cu and Ni. The
6
UUnniivveerrssiittyy ooff PPrreettoorriiaa eettdd –– VVeerrmmaaaakk,, MM KK GG ((22000055))
remaining PGMs are formed with Bi, Te, As, Sb and S. The latter group of PGMs and
compounds is of great interest and this study focused on characterising the flotation
behaviour of two members of this group. Usually it is believed that the most common
PGMs are the sulphides, arsenides and tellurides. The proportions and textures of
these minerals vary considerably locally and regionally. Very informative surveys on
PGMs and PGEs, covering all aspects of identification, composition, properties and
recoveries may be found in Cabri (1981).
Table 1 and 2 list the most common Pt and Pd minerals in alphabetical order. The lists
represent estimates of PGMs bearing Pt and Pd on a world basis, taking into
consideration amounts produced from different deposits (Cabri, 1994). Although these
lists are not intended to be highly accurate (Cabri, 1994), they do give a good account
of the most common PGMs of Pt and Pd found in the world, with their ideal
compositions and common substitutions in these PGMs. According to Cabri (1994)
sperrylite is the most common PGM worldwide, and it can be found in every type of
geological environment.
Table 1: Most common Pt minerals (Cabri, 1994).
Mineral Ideal formula Common substitutions
Braggite (Pt,Pd)S Ni
Cooperite PtS Pd, Ni
Isoferroplatinum Pt3Fe Ru, Rh, Ir, Pd, Os, Cu, Ni
Moncheite PtTe2 Pd, Ni, Sb
Sperrylite PtAs2 Rh, Ir, Sb, S
Unknown, UG2 Pt-Cu-S Rh, Ir, Pb
7
UUnniivveerrssiittyy ooff PPrreettoorriiaa eettdd –– VVeerrmmaaaakk,, MM KK GG ((22000055))
Table 2: Most common Pd minerals (Cabri, 1994).
Mineral Ideal formula Common substitutions
Braggite (Pt,Pd)S Ni
Cabriite Pd2SnCu Pt, Ag, Sb
Isomertieite Pd11As2Sb2 Te
Kotulskite PdTe Pt, Ni, Bi, Sb
Merenskyite PdTe2 Pt, Ni, Bi, Sb
Michenerite PdBiTe Pt, Ni, Sb
Plumbopalladinite Pd3Pb2 Ag, Cu, Bi, Sn, Sb
Polarite Pd(Bi,Pb) Pt
Stannopalladinite Pd5Sn2Cu Pt
Sudburyite PdSb Ni, Te, Bi, As
Taimyrite Pd9Sn4Cu3 Pt
Vysotskite PdS Pt, Ni
In general the dominant platinum-group minerals (with their proportions by number)
of the Merensky reef are the Pt-Pd sulphides (braggite, cooperite) at 60% (braggite
and cooperite at 30% each), PGE tellurides (11%) and arsenides and sperrylite (6%)
(the balance is mostly PGE alloys and Au/Ag phases) (Wilson, 1998). An average
distribution of PGM for the Rustenburg facies (reef associated with potholes) is: PGE
sulphides, 36%, Pt- and Pd-bearing bismuthotellurides, 32%, Ru phases, 15%, PGE
alloys, 7%, and PGE arsenides 7% and Au/Ag phases 3% (Wilson, 1998). Potholes
comprise about 15% of the total reef area. These areas are generally highly disturbed
and represent areas of reef loss. UG-2 ores contain in general more PGE – sulphides
such as braggite, cooperite, malanite and laurite. In sharp contrast to this the principal
platinum-group mineral phases found in the Wedza-Mimosa platinum deposit in the
Great Dyke of Zimbabwe are, in order of decreasing abundance, sperrylite (PtAs2), Pt-
and Pd-bearing bismuthotellurides (moncheite and merenskyite, respectively) and
hollingworthite (RhAsS) (Prendergast, 1990). These results were obtained from 47
precious-metal mineral grains and groups (i.e. grains close together or clearly
associated), or 111 individual grains in total. In contrast to this Weiser et al. (1998)
suggested Pt- and Pd-bearing bismuthotellurides (michenerite, merenskyite,
8
UUnniivveerrssiittyy ooff PPrreettoorriiaa eettdd –– VVeerrmmaaaakk,, MM KK GG ((22000055))
moncheite and kotulskite) to be the most frequent PGM whereas sperrylite is
subordinate. However no indication was given of the number of samples analysed.
The proportions given in Table 3 for Mimosa Mine (data from Oberthür et al., 2002a)
are mostly in agreement with mineralogical investigations performed by Mintek (Van
Wouw, 2000). The Mintek investigations showed that the most common PGMs are
the Pt-Pd-Bi-Te minerals - including Pd-Bi-Te, Pt-Pd-Bi-Te and Pt-Bi-Te (probably
michenerite, merenskyite, moncheite and kotulskite) - and sperrylite (PtAs2) (Van
Wouw, 2000). PGE sulpharsenides, cooperite (PtS), braggite ((Pt,Pd,Ni)S) and Au-Ag
compounds were also detected (Van Wouw, 2000). Platinum occurs predominantly as
PtAs2, Pt-Bi-Te, Pt-Pd-Bi-Te and PGM sulpharsenides. In addition to occurring as
bismuthotellurides of Pt and Pd, Pd also occurs in variable amounts in solid solution
in pentlandite.
For these deposits, the Pd-bearing bismuthotellurides and to a lesser extent the Pt-
bearing bismuthotellurides are the only PGMs containing appreciable amounts of
palladium.
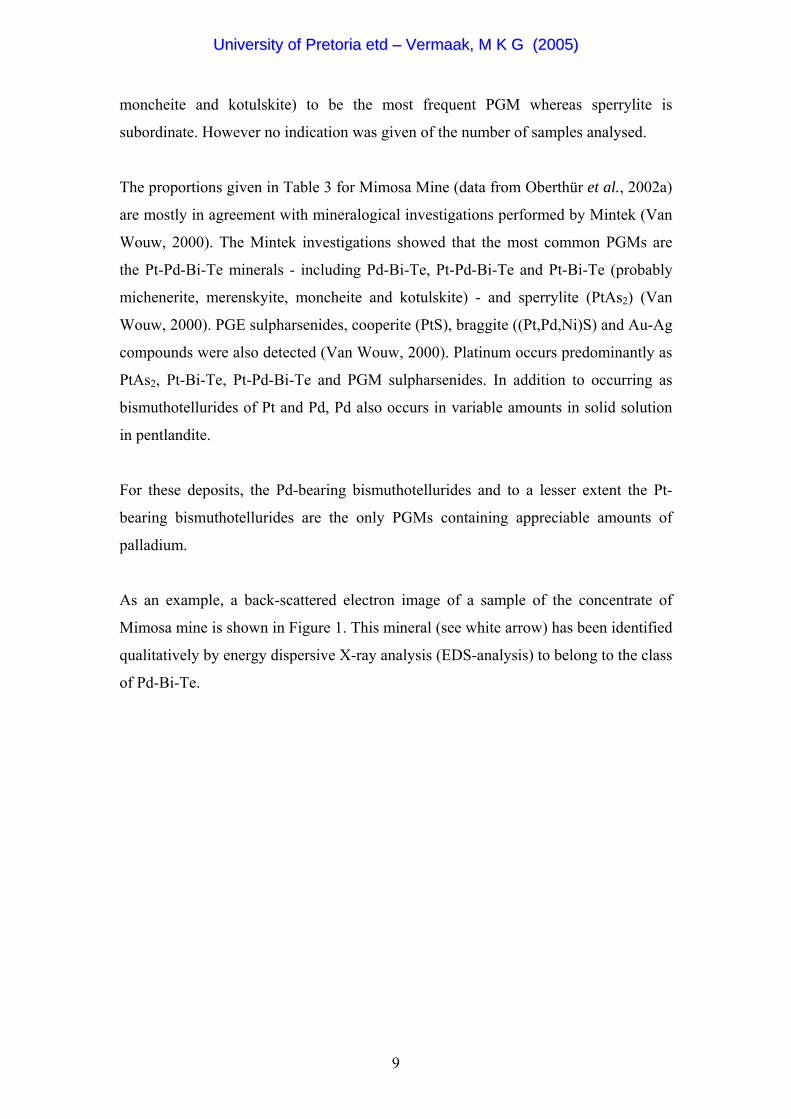
As an example, a back-scattered electron image of a sample of the concentrate of
Mimosa mine is shown in Figure 1. This mineral (see white arrow) has been identified
qualitatively by energy dispersive X-ray analysis (EDS-analysis) to belong to the class
of Pd-Bi-Te.
9
UUnniivveerrssiittyy ooff PPrreettoorriiaa eettdd –– VVeerrmmaaaakk,, MM KK GG ((22000055))
9 µm9 µm
Figure 1: Back-scattered electron image (25kV) of a small liberated Pd-Bi-Te particle
(arrowed) in the concentrator effluent stream of Mimosa platinum (Great Dyke,
Zimbabwe).
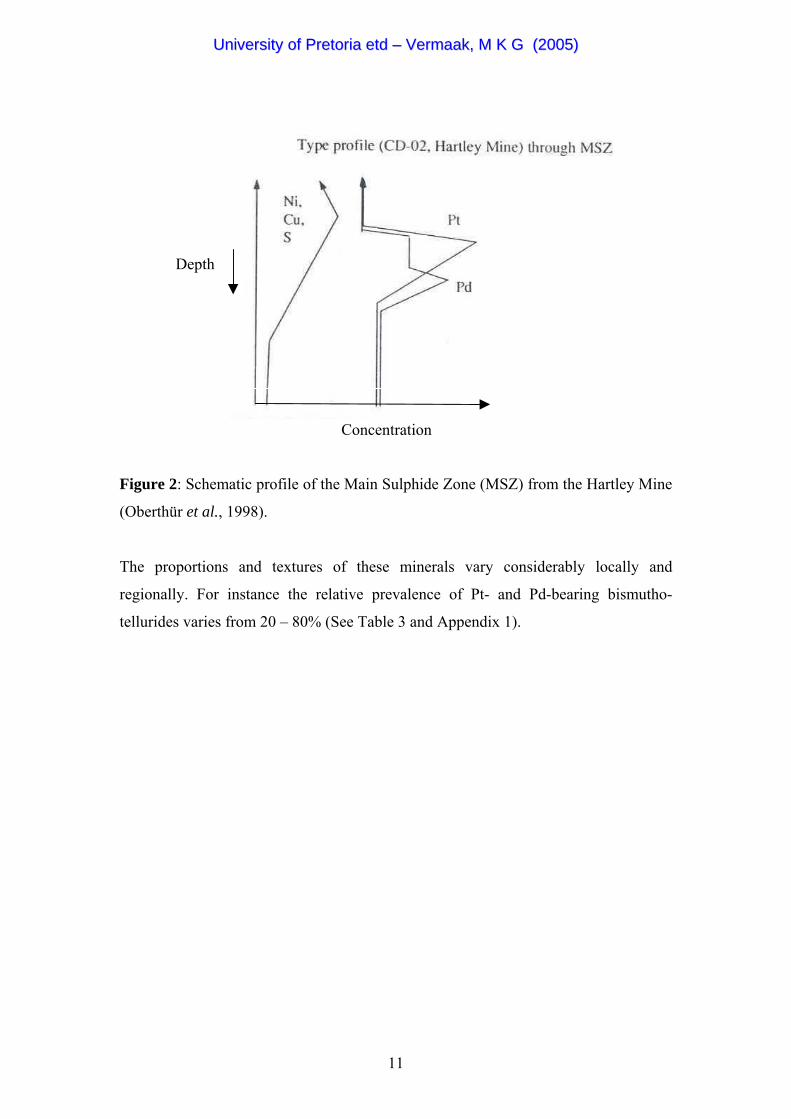
The palladium recovery is on average about 5% lower than that of platinum (for the
Mimosa Mine in Wedza-Mimosa platinum deposit) (Van Wouw, 2004). It seems,
therefore, that the platinum and palladium recoveries are decoupled, which reflects
differences in mineralisation. There is also a physical separation of the minerals in the
ore deposit: Weiser et al. (1998) reported that the platinum peak lies 50-60 cm below
the top of the reef profile whereas Pd peak lies 50-70 cm below the Pt peak. Similar
profiles have been reported by Oberthür et al. (1998) for the Hartley mine (see Figure
2) and more generally on the Great Dyke (Oberthür, 2002b).
10
UUnniivveerrssiittyy ooff PPrreettoorriiaa eettdd –– VVeerrmmaaaakk,, MM KK GG ((22000055))
Depth
Concentration
Figure 2: Schematic profile of the Main Sulphide Zone (MSZ) from the Hartley Mine
(Oberthür et al., 1998).
The proportions and textures of these minerals vary considerably locally and
regionally. For instance the relative prevalence of Pt- and Pd-bearing bismutho-
tellurides varies from 20 – 80% (See Table 3 and Appendix 1).
11
UUnniivveerrssiittyy ooff PPrreettoorriiaa eettdd –– VVeerrmmaaaakk,, MM KK GG ((22000055))
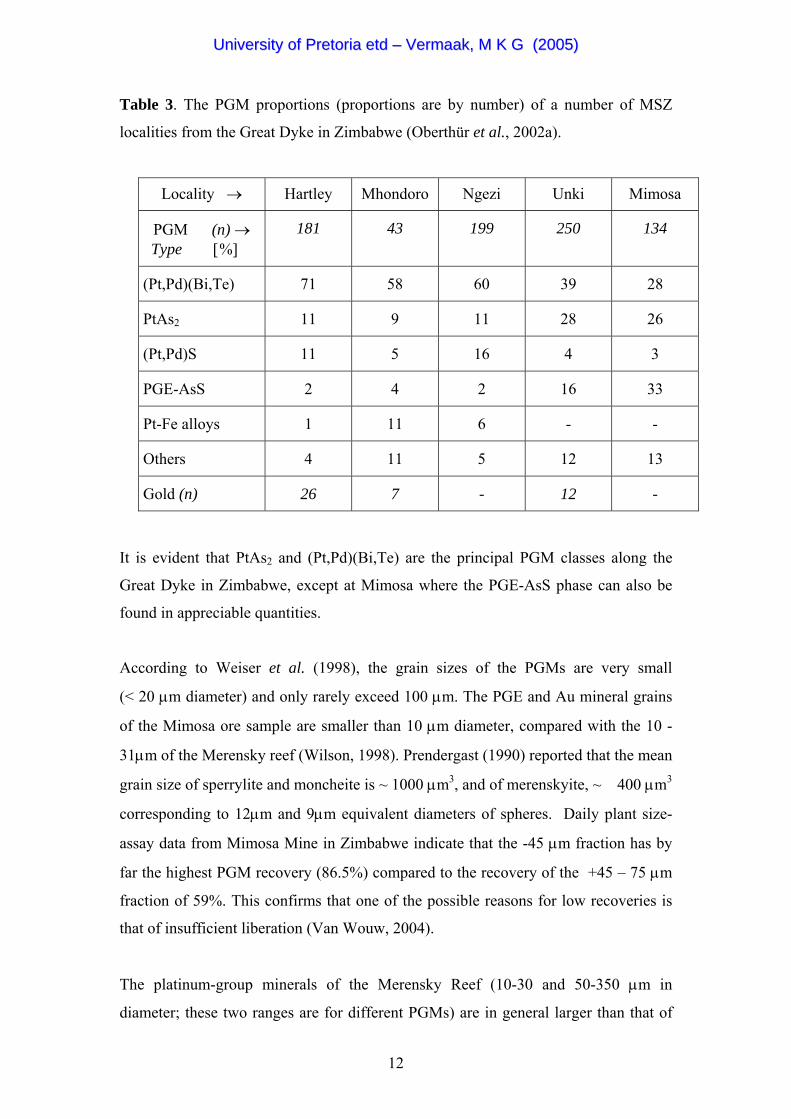
Table 3. The PGM proportions (proportions are by number) of a number of MSZ
localities from the Great Dyke in Zimbabwe (Oberthür et al., 2002a).
Locality → Hartley Mhondoro Ngezi Unki Mimosa
PGM (n) → Type [%]
181 43 199 250 134
(Pt,Pd)(Bi,Te) 71 58 60 39 28
PtAs2 11 9 11 28 26
(Pt,Pd)S 11 5 16 4 3
PGE-AsS 2 4 2 16 33
Pt-Fe alloys 1 11 6 - -
Others 4 11 5 12 13
Gold (n) 26 7 - 12 -
It is evident that PtAs2 and (Pt,Pd)(Bi,Te) are the principal PGM classes along the
Great Dyke in Zimbabwe, except at Mimosa where the PGE-AsS phase can also be
found in appreciable quantities.
According to Weiser et al. (1998), the grain sizes of the PGMs are very small
(< 20 µm diameter) and only rarely exceed 100 µm. The PGE and Au mineral grains
of the Mimosa ore sample are smaller than 10 µm diameter, compared with the 10 -
31µm of the Merensky reef (Wilson, 1998). Prendergast (1990) reported that the mean
grain size of sperrylite and moncheite is ~ 1000 µm3, and of merenskyite, ~ 400 µm3
corresponding to 12µm and 9µm equivalent diameters of spheres. Daily plant size-
assay data from Mimosa Mine in Zimbabwe indicate that the -45 µm fraction has by
far the highest PGM recovery (86.5%) compared to the recovery of the +45 – 75 µm
fraction of 59%. This confirms that one of the possible reasons for low recoveries is
that of insufficient liberation (Van Wouw, 2004).
The platinum-group minerals of the Merensky Reef (10-30 and 50-350 µm in
diameter; these two ranges are for different PGMs) are in general larger than that of
12
UUnniivveerrssiittyy ooff PPrreettoorriiaa eettdd –– VVeerrmmaaaakk,, MM KK GG ((22000055))
the UG-2 Reef (6-10 µm in diameter) and Great Dyke (less than 10 µm). The textural
association of the PGM will greatly influence their recovery potential during flotation.
Good associations of base metal sulphides with PGMs are evident for the Merensky
and UG-2 reefs. In contrast to this, ores from the Great Dyke show poorer association
with the base metal sulphides and a significant portion is associated with the silicate
minerals (Van Wouw, 2000). Regrinding of the ore is the only option to avoid
significant losses to the tailings.
According to Weiser et al. (1998) and Prendergast (1990) the PGMs occur as
inclusions in the base-metal sulphides, as irregular grains on the sulphide-silicate (also
hydrosilicate) boundary, and interstitially in silicate minerals. No statistical indication
was given of the number of grains analysed (for the Mimosa Mine sample) and the
occurrence distributions. All the gold grains were located within the hydrosilicates. A
mineralogical investigation of the Mimosa flotation feed samples showed that the
major modes of occurrence in order of decreasing abundance, are as liberated grains,
at the grain contact of base-metal sulphides and silicates, and at the grain contact of
silicates (Van Wouw, 2003). A very small fraction of the PGMs is locked in the base-
metal sulphides. Unfortunately, only about 86 grains were analysed during this
investigation. Literally hundreds of PGM grains would have to be investigated to
reduce the statistical uncertainty to acceptable levels (Merkle, 2004).
In addition to this, investigations performed by Mintek on the Mimosa Mine tailings
indicated that the vast majority (70%) of the (unrecovered) PGMs are Pt-Pd-
bismuthotellurides. Knowing that the PGMs belong to the class, the next question that
should be answered is the textural association of these minerals in the tailings sample.
Unfortunately, the results of the textural association of these minerals in the tailings
are rather inconclusive and contradictory. One report stated that no liberated PGMs
could be found in the tailings sample. In sharp contrast to this, investigations
performed on the rougher and cleaner tailings indicated the presence of large
quantities of liberated PGMs. The – 45µm fraction of the rougher and cleaner tailings
contained respectively 33% and 15% liberated PGMs (expressed as percentages of
total number of PGMs identified). The –10µm fraction of the cleaner tailings
contained as much as 80 % liberated PGMs. The PGM assemblage of both the
13
UUnniivveerrssiittyy ooff PPrreettoorriiaa eettdd –– VVeerrmmaaaakk,, MM KK GG ((22000055))
rougher and cleaner tailings consisted mostly of Pt-Pd-Bi-Te and sperrylite. No
indication was given of the number of PGMs analysed in each case (Van Wouw,
2000).
Given the inconclusive nature of the results a follow-up mineralogical investigation
was conducted on the flotation tailings of Mimosa mine (Van Wouw, 2003). The
following streams were subjected to the investigations: primary rougher (PRT) and
cleaner tailings (PCT), secondary rougher (SRT) and cleaner tailings (SCT) and the
combined recleaner tailings (RCT). The primary rougher and cleaner tailings, and the
combined recleaner tailings are reground in the secondary mill, while the secondary
rougher and cleaner tailings are discarded. All of these streams contained appreciable
amounts of PGMs. The lowest quantity of PGE was found in the secondary rougher
tailings (0.8 - 1.0 g/t PGE) while the largest concentration was found in the primary
cleaner tailings (2 – 3 g/t PGE). The quantities found in the secondary rougher and
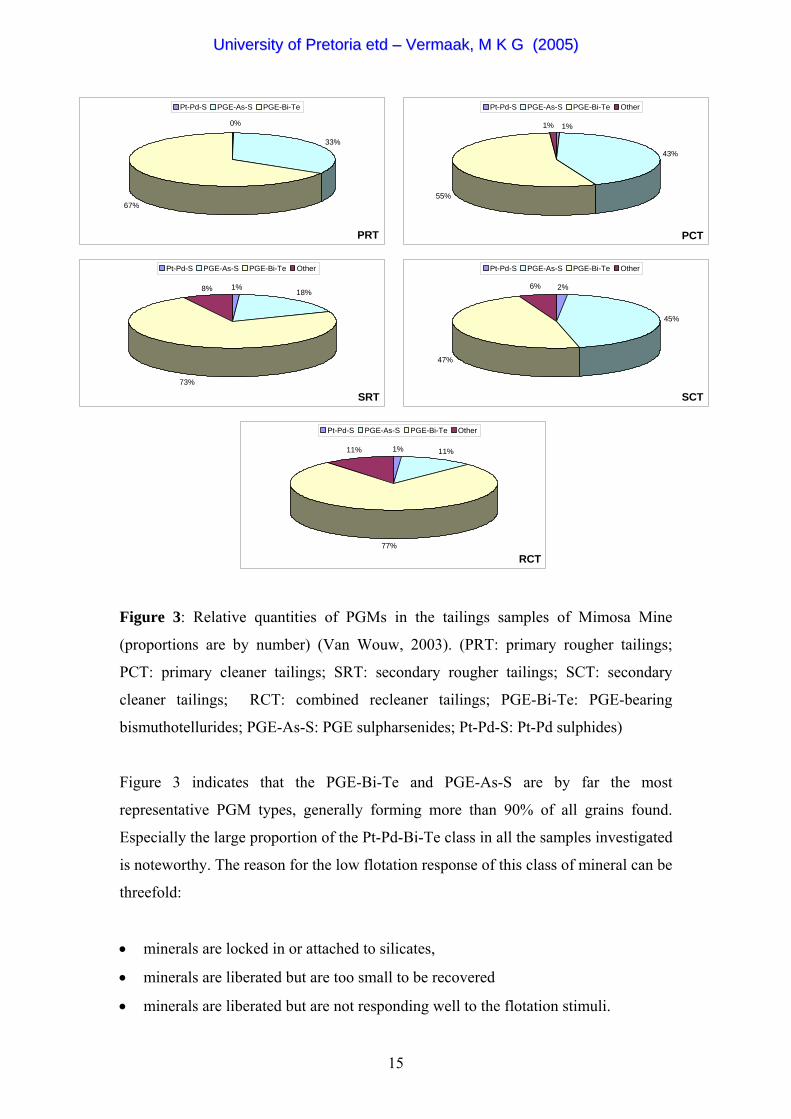
cleaner tailings are indicative of the low recoveries that are obtained. Figure 3
indicates the relative amounts of PGM found in the different tailings samples (Van
Wouw, 2003). Data on the liberation are discussed below.
14
UUnniivveerrssiittyy ooff PPrreettoorriiaa eettdd –– VVeerrmmaaaakk,, MM KK GG ((22000055))
PRT
33%
67%
0%
Pt-Pd-S PGE-As-S PGE-Bi-Te
PCT
43%
55%
1% 1%
Pt-Pd-S PGE-As-S PGE-Bi-Te Other
SRT
1%18%
73%
8%
Pt-Pd-S PGE-As-S PGE-Bi-Te Other
SCT
2%
45%
47%
6%
Pt-Pd-S PGE-As-S PGE-Bi-Te Other
RCT
1% 11%
77%
11%
Pt-Pd-S PGE-As-S PGE-Bi-Te Other
Figure 3: Relative quantities of PGMs in the tailings samples of Mimosa Mine
(proportions are by number) (Van Wouw, 2003). (PRT: primary rougher tailings;
PCT: primary cleaner tailings; SRT: secondary rougher tailings; SCT: secondary
cleaner tailings; RCT: combined recleaner tailings; PGE-Bi-Te: PGE-bearing
bismuthotellurides; PGE-As-S: PGE sulpharsenides; Pt-Pd-S: Pt-Pd sulphides)
Figure 3 indicates that the PGE-Bi-Te and PGE-As-S are by far the most
representative PGM types, generally forming more than 90% of all grains found.
Especially the large proportion of the Pt-Pd-Bi-Te class in all the samples investigated
is noteworthy. The reason for the low flotation response of this class of mineral can be
threefold:
• minerals are locked in or attached to silicates,
• minerals are liberated but are too small to be recovered
• minerals are liberated but are not responding well to the flotation stimuli.
15
UUnniivveerrssiittyy ooff PPrreettoorriiaa eettdd –– VVeerrmmaaaakk,, MM KK GG ((22000055))
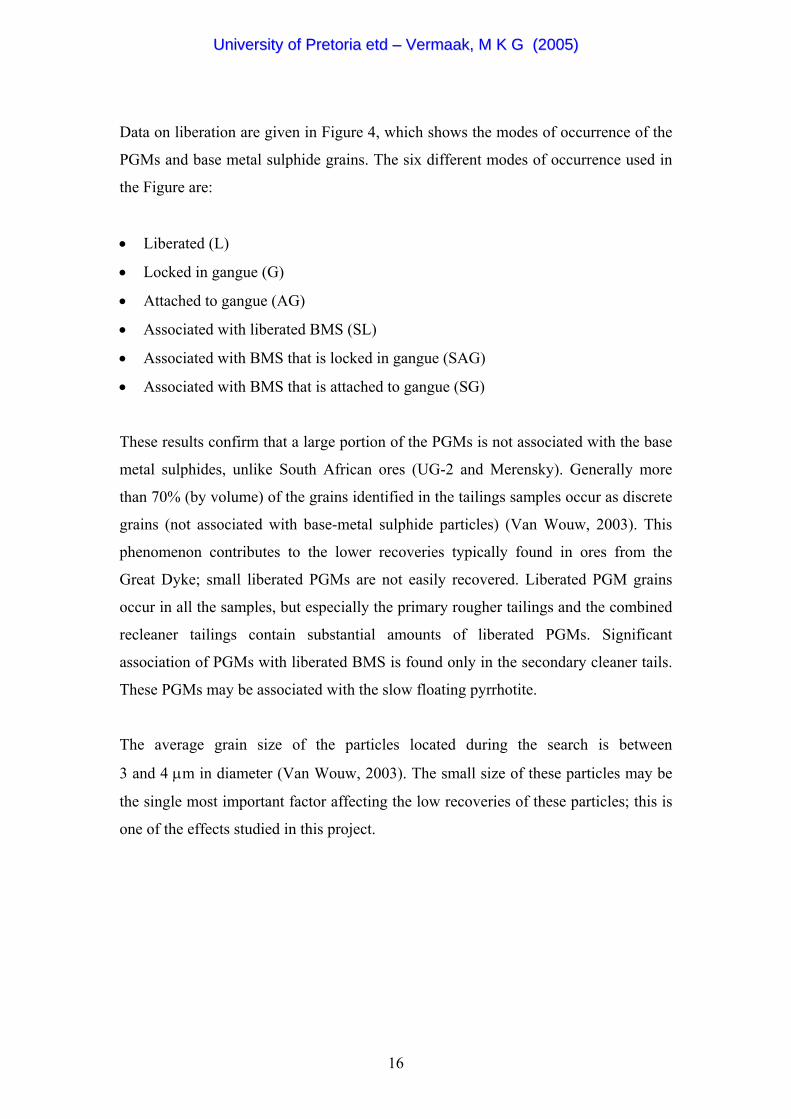
Data on liberation are given in Figure 4, which shows the modes of occurrence of the
PGMs and base metal sulphide grains. The six different modes of occurrence used in
the Figure are:
• Liberated (L)
• Locked in gangue (G)
• Attached to gangue (AG)
• Associated with liberated BMS (SL)
• Associated with BMS that is locked in gangue (SAG)
• Associated with BMS that is attached to gangue (SG)
These results confirm that a large portion of the PGMs is not associated with the base
metal sulphides, unlike South African ores (UG-2 and Merensky). Generally more
than 70% (by volume) of the grains identified in the tailings samples occur as discrete
grains (not associated with base-metal sulphide particles) (Van Wouw, 2003). This
phenomenon contributes to the lower recoveries typically found in ores from the
Great Dyke; small liberated PGMs are not easily recovered. Liberated PGM grains
occur in all the samples, but especially the primary rougher tailings and the combined
recleaner tailings contain substantial amounts of liberated PGMs. Significant
association of PGMs with liberated BMS is found only in the secondary cleaner tails.
These PGMs may be associated with the slow floating pyrrhotite.
The average grain size of the particles located during the search is between
3 and 4 µm in diameter (Van Wouw, 2003). The small size of these particles may be
the single most important factor affecting the low recoveries of these particles; this is
one of the effects studied in this project.
16
UUnniivveerrssiittyy ooff PPrreettoorriiaa eettdd –– VVeerrmmaaaakk,, MM KK GG ((22000055))
PRT
46%
12%
28%
0%
3% 11%
L AG G SL SAG SG
PCT
22%
42%
25%0%
2%
9%
L AG G SL SAG SG
SRT
8%
17%
46%
3%
20%
6%
L AG G SL SAG SG
RCT
31%
6%41%
8%
13% 1%
L AG G SL SAG SG
SCT
16%
41%11%
14%
16%2%
L AG G SL SAG SG
Figure 4: Modes of occurrence of PGM grains (proportions are by number) (Van
Wouw, 2003) (L: liberated; G: locked in gangue; AG: attached to gangue; SL:
associated with liberated BMS; SAG: associated with BMS that is locked in gangue;
SG: associated with BMS that is attached to gangue).
2.1.3.2. Microprobe analysis of platinum-group minerals from Mimosa Mine
(Great Dyke)
Although this has not been demonstrated, it is proposed that the Te and Bismuth
contents of the Pd-Pt-Bi-Te class will affect the flotation behaviour of these particles.
It is therefore important to establish the major types of PGMs in this class for the
purpose of synthesis of samples used in experimental work.
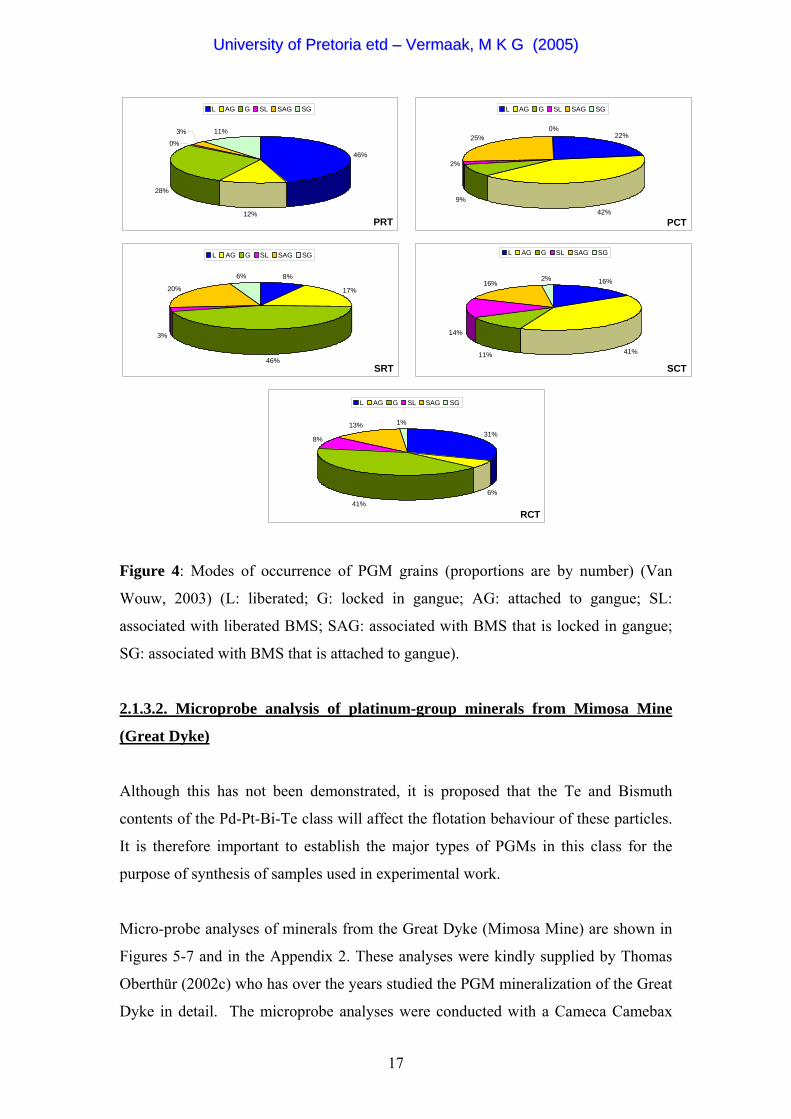
Micro-probe analyses of minerals from the Great Dyke (Mimosa Mine) are shown in
Figures 5-7 and in the Appendix 2. These analyses were kindly supplied by Thomas
Oberthür (2002c) who has over the years studied the PGM mineralization of the Great
Dyke in detail. The microprobe analyses were conducted with a Cameca Camebax
17
UUnniivveerrssiittyy ooff PPrreettoorriiaa eettdd –– VVeerrmmaaaakk,, MM KK GG ((22000055))
instrument (15kV, 20nA and 1µm to 2 µm spot size). Natural and synthetic standards
were used for calibration.
igure 5: Composition (at %) of natural Pd-Pt-Bi-Te minerals from Mimosa Mine in
Te
Pd+Pt+Fe+Ni+Cu Bi + Sb
Merenskyite (PdTe2)
Kotulskite (PdTe)
Michenerite (PdBiTe)
F
the Great Dyke of Zimbabwe (Oberthür, 2002c). The curved lines enclose the
compositional fields of the respective minerals reported in the literature
(Wilson et al., 1993).
18
UUnniivveerrssiittyy ooff PPrreettoorriiaa eettdd –– VVeerrmmaaaakk,, MM KK GG ((22000055))
Te
Pt+Pd+Fe+Ni+Cu Bi + Sb
Moncheite PtTe2
MaslovitePtBiTe
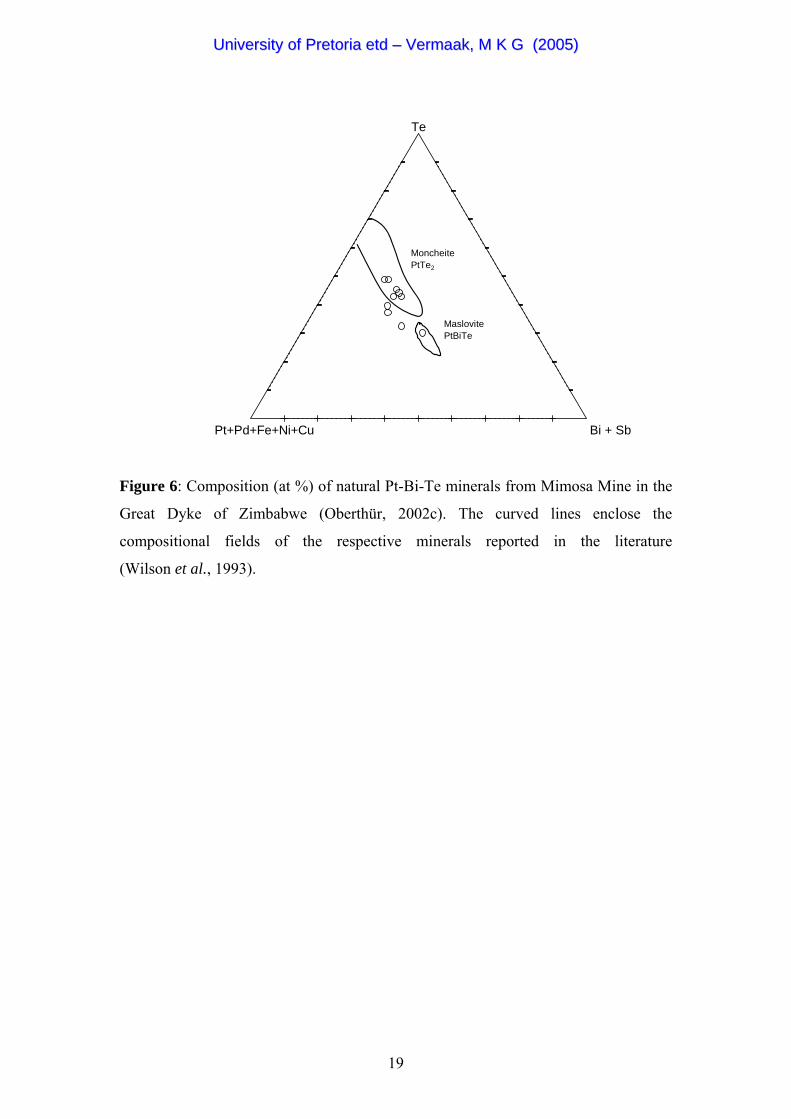
Figure 6: Composition (at %) of natural Pt-Bi-Te minerals from Mimosa Mine in the
Great Dyke of Zimbabwe (Oberthür, 2002c). The curved lines enclose the
compositional fields of the respective minerals reported in the literature
(Wilson et al., 1993).
19
UUnniivveerrssiittyy ooff PPrreettoorriiaa eettdd –– VVeerrmmaaaakk,, MM KK GG ((22000055))
Pt
As S
Sperrylite PtAs2
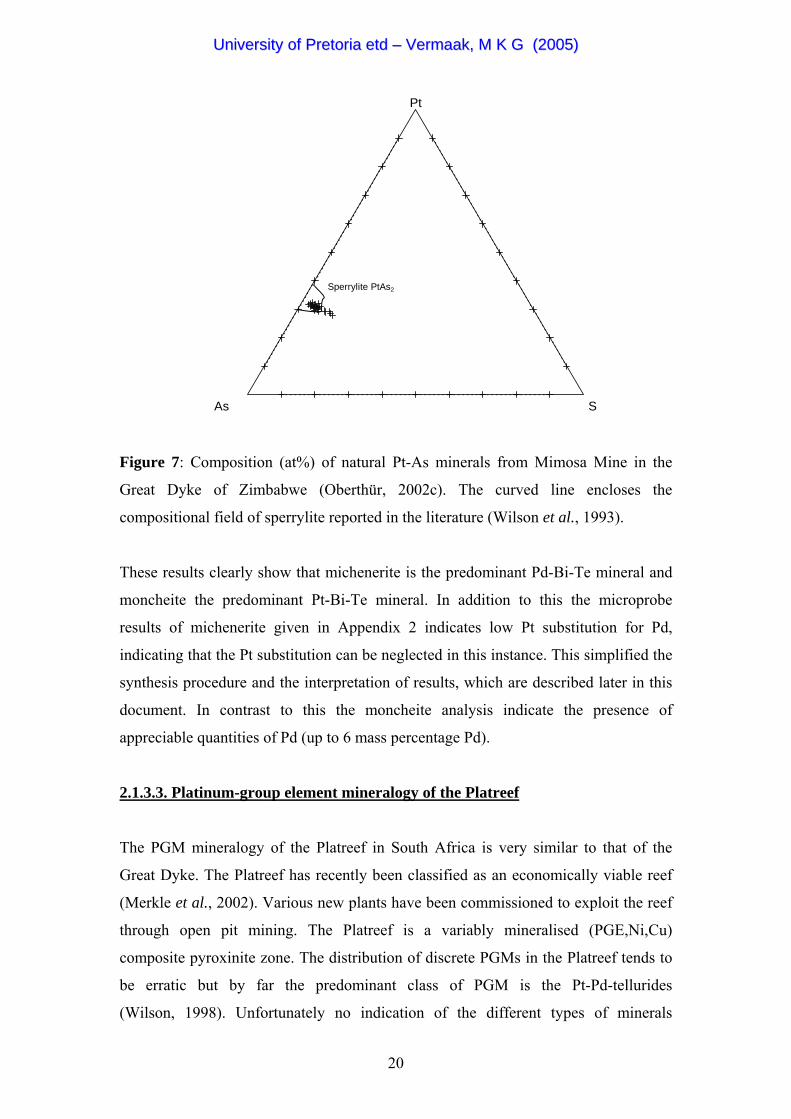
Figure 7: Composition (at%) of natural Pt-As minerals from Mimosa Mine in the
Great Dyke of Zimbabwe (Oberthür, 2002c). The curved line encloses the
compositional field of sperrylite reported in the literature (Wilson et al., 1993).
These results clearly show that michenerite is the predominant Pd-Bi-Te mineral and
moncheite the predominant Pt-Bi-Te mineral. In addition to this the microprobe
results of michenerite given in Appendix 2 indicates low Pt substitution for Pd,
indicating that the Pt substitution can be neglected in this instance. This simplified the
synthesis procedure and the interpretation of results, which are described later in this
document. In contrast to this the moncheite analysis indicate the presence of
appreciable quantities of Pd (up to 6 mass percentage Pd).
2.1.3.3. Platinum-group element mineralogy of the Platreef
The PGM mineralogy of the Platreef in South Africa is very similar to that of the
Great Dyke. The Platreef has recently been classified as an economically viable reef
(Merkle et al., 2002). Various new plants have been commissioned to exploit the reef
through open pit mining. The Platreef is a variably mineralised (PGE,Ni,Cu)
composite pyroxinite zone. The distribution of discrete PGMs in the Platreef tends to
be erratic but by far the predominant class of PGM is the Pt-Pd-tellurides
(Wilson, 1998). Unfortunately no indication of the different types of minerals
20
UUnniivveerrssiittyy ooff PPrreettoorriiaa eettdd –– VVeerrmmaaaakk,, MM KK GG ((22000055))
constituting the Pt-Pd-tellurides class was given. The PGE-telluride content (given as
fractions of the total number of PGM grains) can vary from 80% near Drenthe in the
extreme north (see map in the Appendix 3) to 90% near Tweefontein Hill, to 30% at
Swartfontein (Wilson, 1998). (The map in Appendix 3 also indicates the location of
future pits along the Platreef).
The three other important classes of PGMs (in order of decreasing abundance) are
PGE arsenides (21%), alloys and sulphides. The PGMs are on average coarser than
those found in the Merensky, UG-2 and Great Dyke ores. Interestingly enough the
tellurides and arsenides are predominantly enclosed in the silicate gangue. According
to Wilson (1998) up to 62% of the PGMs can be associated with the silica gangue and
38% by volume with BMSs, hence high base-metal sulphide abundances do not
necessarily indicate high PGM contents. It is been found that up to 70% of the
Platreef PGMs can be liberated during the milling process (Dippenaar, 2002). Given
the encapsulation by silica, liberation of these particles is therefore a prerequisite for
good recoveries; this confirms the importance of the flotation behaviour of the
liberated minerals.
2.1.3.4. Platinum-group element mineralogy of the oxidised MSZ of the Great
Dyke of Zimbabwe
Oxidised MSZ ores that occur close to the surface differ from the deeper sulphide ores
in both their physical state and precious metal content. The term oxidised refers to the
alteration of the pyroxinites to form hydroxy-species such as magnesium silicate
hydroxides (talc) and calcium magnesium iron silicate hydroxides. The brownish
colour of the ore is a result of the formation of the iron hydroxides.
The average head grade of Pt in the oxidised reserve compares well to that of the
pristine (unweathered) ore. In contrast, the Pd content of the oxidised ore is
significantly lower than that of the pristine ore due to the weathering of the bismuth-
tellurides, which is the most important Pd-carrying PGM (Prendergast, 1990); the Pt-
Pd-bismuthotellurides are susceptible to chemical dissolution. Table 4 shows the PGE
distribution of the Main Sulphide Zone (MSZ) and the oxidised ores from various
21
UUnniivveerrssiittyy ooff PPrreettoorriiaa eettdd –– VVeerrmmaaaakk,, MM KK GG ((22000055))
localities, including the Hartley Mine, Ngezi project, Unki mine and the Old Wedza
mine near Mimosa Mine (Oberthür et al., 2002d).
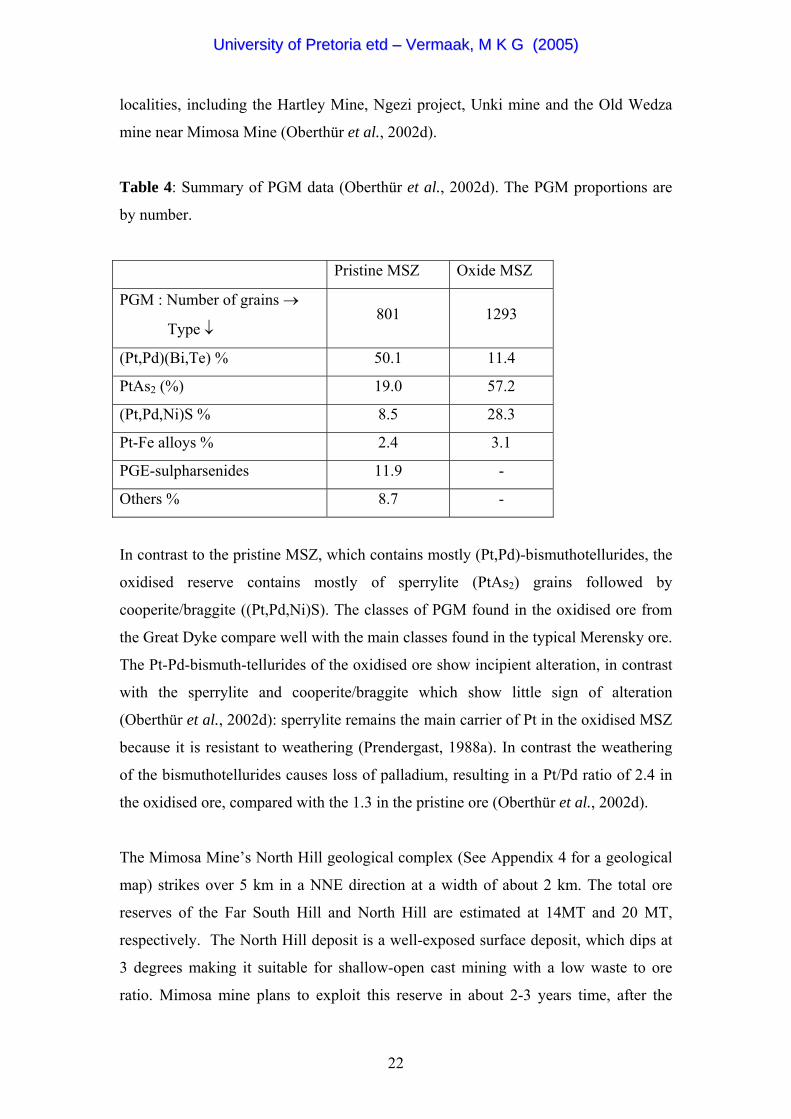
Table 4: Summary of PGM data (Oberthür et al., 2002d). The PGM proportions are
by number.
Pristine MSZ Oxide MSZ
PGM : Number of grains →
Type ↓ 801 1293
(Pt,Pd)(Bi,Te) % 50.1 11.4
PtAs2 (%) 19.0 57.2
(Pt,Pd,Ni)S % 8.5 28.3
Pt-Fe alloys % 2.4 3.1
PGE-sulpharsenides 11.9 -
Others % 8.7 -
In contrast to the pristine MSZ, which contains mostly (Pt,Pd)-bismuthotellurides, the
oxidised reserve contains mostly of sperrylite (PtAs2) grains followed by
cooperite/braggite ((Pt,Pd,Ni)S). The classes of PGM found in the oxidised ore from
the Great Dyke compare well with the main classes found in the typical Merensky ore.
The Pt-Pd-bismuth-tellurides of the oxidised ore show incipient alteration, in contrast
with the sperrylite and cooperite/braggite which show little sign of alteration
(Oberthür et al., 2002d): sperrylite remains the main carrier of Pt in the oxidised MSZ
because it is resistant to weathering (Prendergast, 1988a). In contrast the weathering
of the bismuthotellurides causes loss of palladium, resulting in a Pt/Pd ratio of 2.4 in
the oxidised ore, compared with the 1.3 in the pristine ore (Oberthür et al., 2002d).
The Mimosa Mine’s North Hill geological complex (See Appendix 4 for a geological
map) strikes over 5 km in a NNE direction at a width of about 2 km. The total ore
reserves of the Far South Hill and North Hill are estimated at 14MT and 20 MT,
respectively. The North Hill deposit is a well-exposed surface deposit, which dips at
3 degrees making it suitable for shallow-open cast mining with a low waste to ore
ratio. Mimosa mine plans to exploit this reserve in about 2-3 years time, after the
22
UUnniivveerrssiittyy ooff PPrreettoorriiaa eettdd –– VVeerrmmaaaakk,, MM KK GG ((22000055))
completion of the expansion projects which are currently underway. Economic ways
have to be found to exploit this reserve; there have been unsuccessful attempts
previously. A thorough understanding of the mechanisms governing the flotation of
the PGMs found in the oxidised reserve will be of great value to the company once it
is decided to extract PGEs from this reserve.
2.2. Phases and phase relations of the platinum-group elements
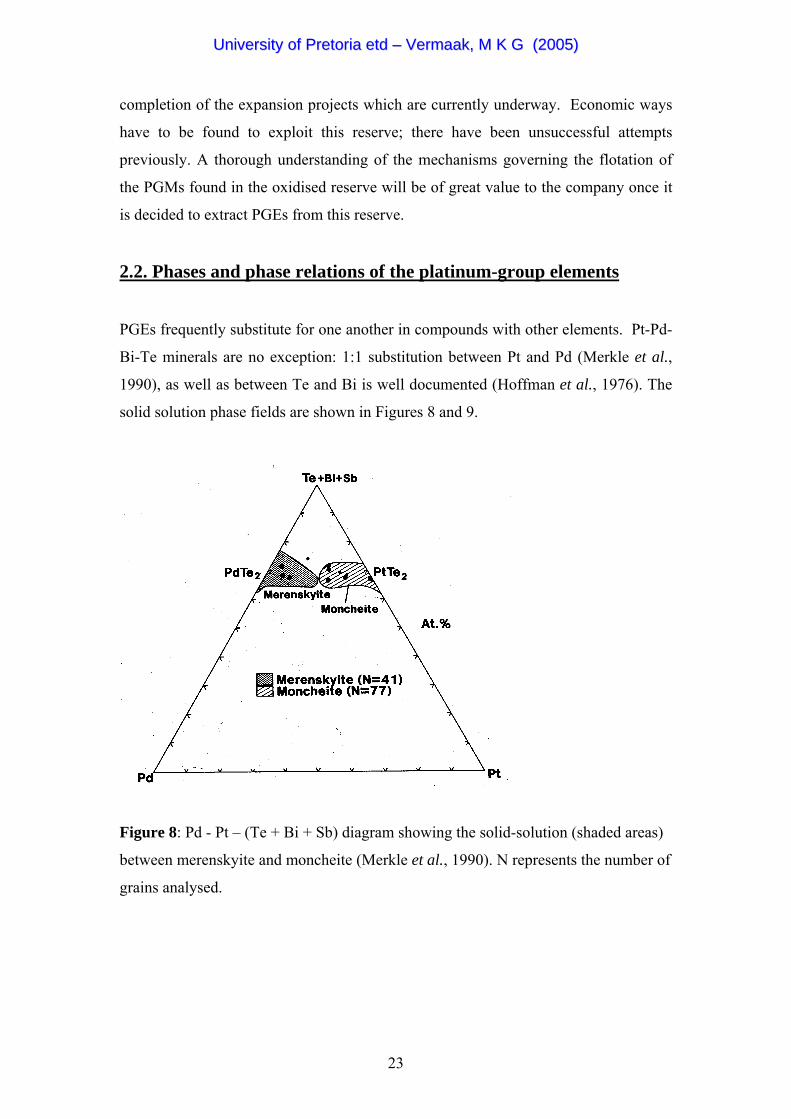
PGEs frequently substitute for one another in compounds with other elements. Pt-Pd-
Bi-Te minerals are no exception: 1:1 substitution between Pt and Pd (Merkle et al.,
1990), as well as between Te and Bi is well documented (Hoffman et al., 1976). The
solid solution phase fields are shown in Figures 8 and 9.
Figure 8: Pd - Pt – (Te + Bi + Sb) diagram showing the solid-solution (shaded areas)
between merenskyite and moncheite (Merkle et al., 1990). N represents the number of
grains analysed.
23
UUnniivveerrssiittyy ooff PPrreettoorriiaa eettdd –– VVeerrmmaaaakk,, MM KK GG ((22000055))
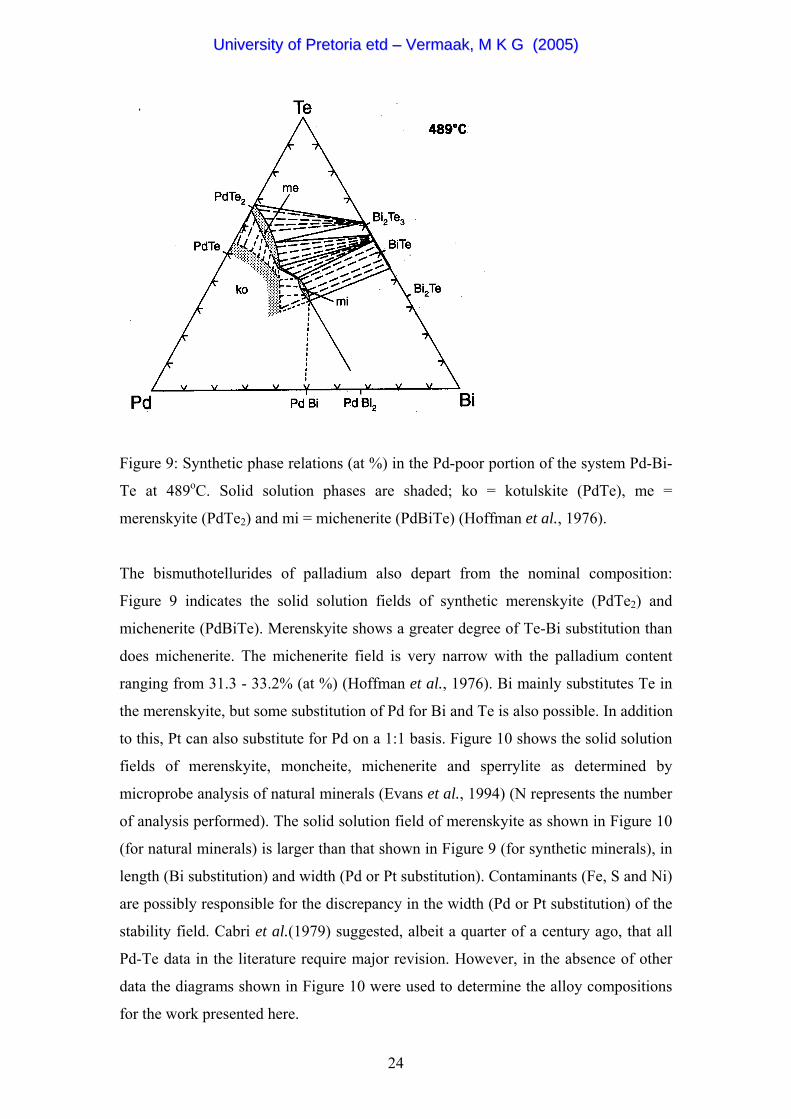
Figure 9: Synthetic phase relations (at %) in the Pd-poor portion of the system Pd-Bi-
Te at 489oC. Solid solution phases are shaded; ko = kotulskite (PdTe), me =
merenskyite (PdTe2) and mi = michenerite (PdBiTe) (Hoffman et al., 1976).
The bismuthotellurides of palladium also depart from the nominal composition:
Figure 9 indicates the solid solution fields of synthetic merenskyite (PdTe2) and
michenerite (PdBiTe). Merenskyite shows a greater degree of Te-Bi substitution than
does michenerite. The michenerite field is very narrow with the palladium content
ranging from 31.3 - 33.2% (at %) (Hoffman et al., 1976). Bi mainly substitutes Te in
the merenskyite, but some substitution of Pd for Bi and Te is also possible. In addition
to this, Pt can also substitute for Pd on a 1:1 basis. Figure 10 shows the solid solution
fields of merenskyite, moncheite, michenerite and sperrylite as determined by
microprobe analysis of natural minerals (Evans et al., 1994) (N represents the number
of analysis performed). The solid solution field of merenskyite as shown in Figure 10
(for natural minerals) is larger than that shown in Figure 9 (for synthetic minerals), in
length (Bi substitution) and width (Pd or Pt substitution). Contaminants (Fe, S and Ni)
are possibly responsible for the discrepancy in the width (Pd or Pt substitution) of the
stability field. Cabri et al.(1979) suggested, albeit a quarter of a century ago, that all
Pd-Te data in the literature require major revision. However, in the absence of other
data the diagrams shown in Figure 10 were used to determine the alloy compositions
for the work presented here.
24
UUnniivveerrssiittyy ooff PPrreettoorriiaa eettdd –– VVeerrmmaaaakk,, MM KK GG ((22000055))
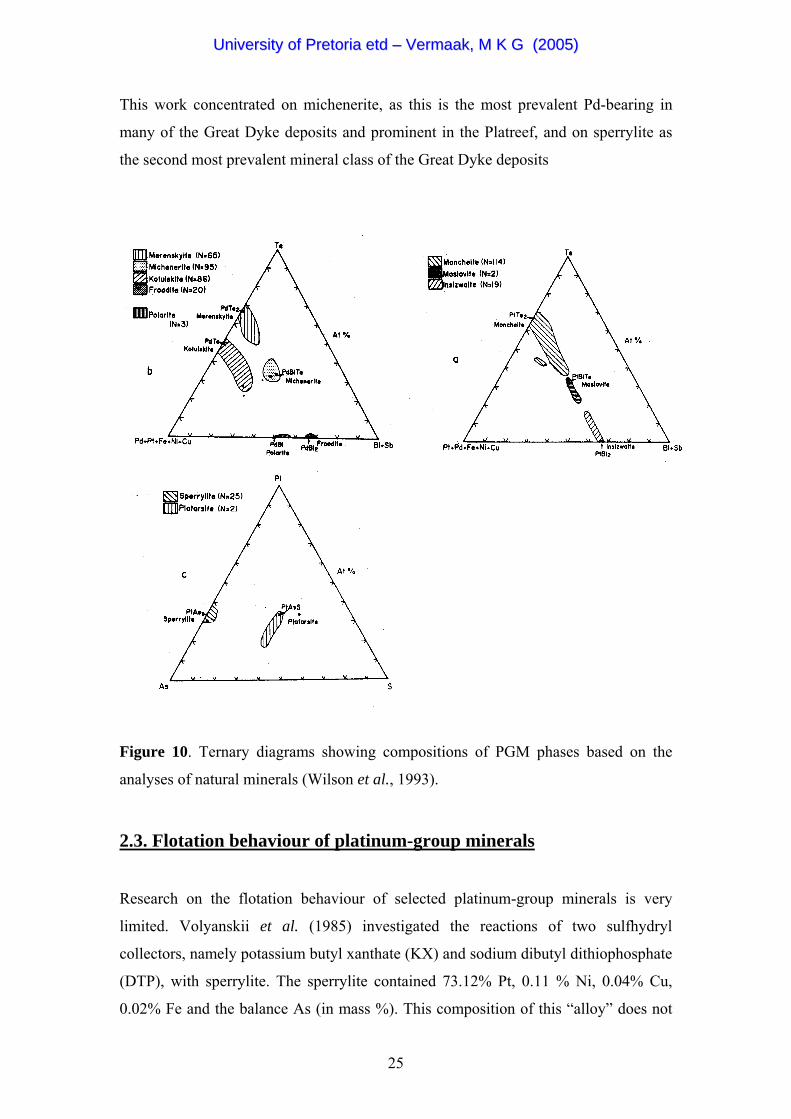
This work concentrated on michenerite, as this is the most prevalent Pd-bearing in
many of the Great Dyke deposits and prominent in the Platreef, and on sperrylite as
the second most prevalent mineral class of the Great Dyke deposits
Figure 10. Ternary diagrams showing compositions of PGM phases based on the
analyses of natural minerals (Wilson et al., 1993).
2.3. Flotation behaviour of platinum-group minerals
Research on the flotation behaviour of selected platinum-group minerals is very
limited. Volyanskii et al. (1985) investigated the reactions of two sulfhydryl
collectors, namely potassium butyl xanthate (KX) and sodium dibutyl dithiophosphate
(DTP), with sperrylite. The sperrylite contained 73.12% Pt, 0.11 % Ni, 0.04% Cu,
0.02% Fe and the balance As (in mass %). This composition of this “alloy” does not
25
UUnniivveerrssiittyy ooff PPrreettoorriiaa eettdd –– VVeerrmmaaaakk,, MM KK GG ((22000055))
correspond with the chemical composition of stoichiometric sperrylite, which contains
57% Pt by weight. No indication was given on whether this “sperrylite” was
synthetically prepared or whether a natural sample was used. Nevertheless, the mass
(1g) and particle size (+ 0.074 –0.44 mm) suggest that a synthetic sperrylite sample
was employed.
The investigations were performed by employing electrochemical and
spectrophotometric techniques. The organic species were extracted from the liquid
phase of the pulp and were washed off the solid surface using n-hexane. The
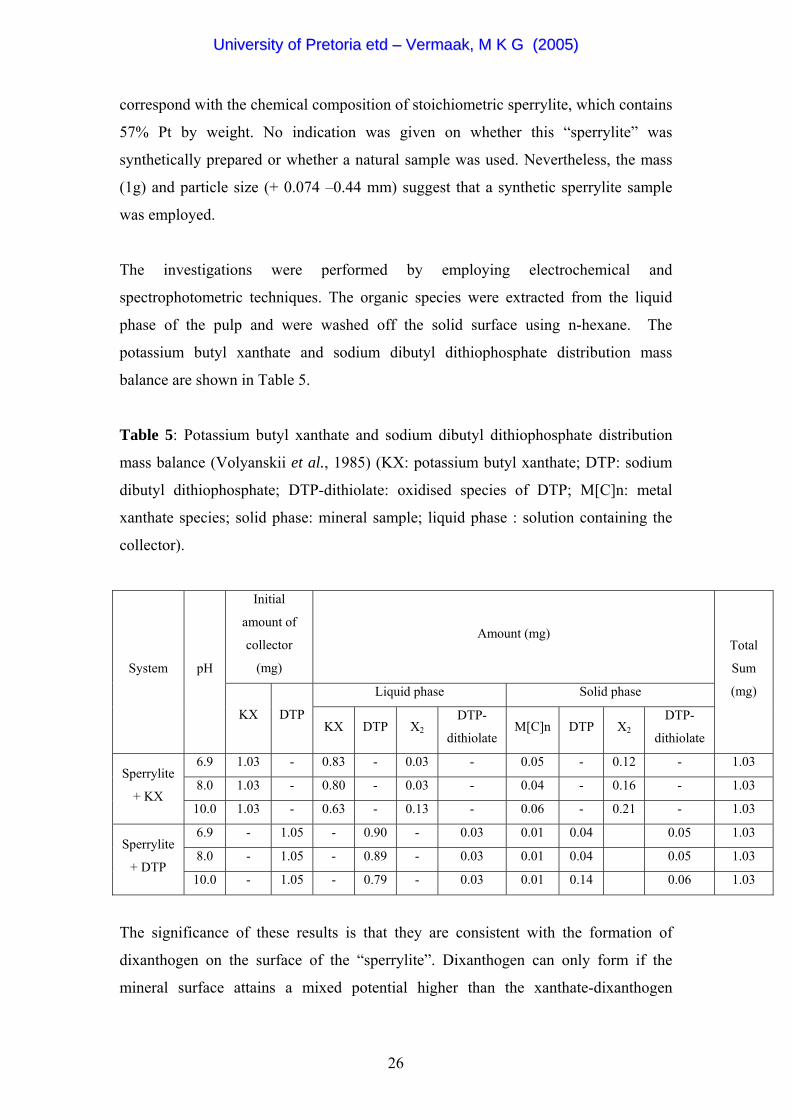
potassium butyl xanthate and sodium dibutyl dithiophosphate distribution mass
balance are shown in Table 5.
Table 5: Potassium butyl xanthate and sodium dibutyl dithiophosphate distribution
mass balance (Volyanskii et al., 1985) (KX: potassium butyl xanthate; DTP: sodium
dibutyl dithiophosphate; DTP-dithiolate: oxidised species of DTP; M[C]n: metal
xanthate species; solid phase: mineral sample; liquid phase : solution containing the
collector).
Initial
amount of
collector
(mg)
Amount (mg)
Liquid phase Solid phase
System pH
KX DTP KX DTP X2
DTP-
dithiolate M[C]n DTP X2
DTP-
dithiolate
Total
Sum
(mg)
6.9 1.03 - 0.83 - 0.03 - 0.05 - 0.12 - 1.03
8.0 1.03 - 0.80 - 0.03 - 0.04 - 0.16 - 1.03 Sperrylite
+ KX 10.0 1.03 - 0.63 - 0.13 - 0.06 - 0.21 - 1.03
6.9 - 1.05 - 0.90 - 0.03 0.01 0.04 0.05 1.03
8.0 - 1.05 - 0.89 - 0.03 0.01 0.04 0.05 1.03 Sperrylite
+ DTP 10.0 - 1.05 - 0.79 - 0.03 0.01 0.14 0.06 1.03
The significance of these results is that they are consistent with the formation of
dixanthogen on the surface of the “sperrylite”. Dixanthogen can only form if the
mineral surface attains a mixed potential higher than the xanthate-dixanthogen
26
UUnniivveerrssiittyy ooff PPrreettoorriiaa eettdd –– VVeerrmmaaaakk,, MM KK GG ((22000055))
equilibrium value. From the results given in Table 5 it appears that the metal xanthate
species (M[C]n) can also exist on the surface of the “sperrylite”. The authors of this
study also mentioned the formation of platinum xanthate species as a result of the
interaction of the “sperrylite” with the collector. Table 5 shows further that the pH has
a definite effect of adsorption properties of the dixanthogen (more alkaline pH being
favourable for X2 formation). While these are interesting results, there are several
discrepancies in the paper, including apparently erroneous interpretation of UV
spectra. It hence seems warranted to re-investigate the flotation behaviour of
sperrylite.
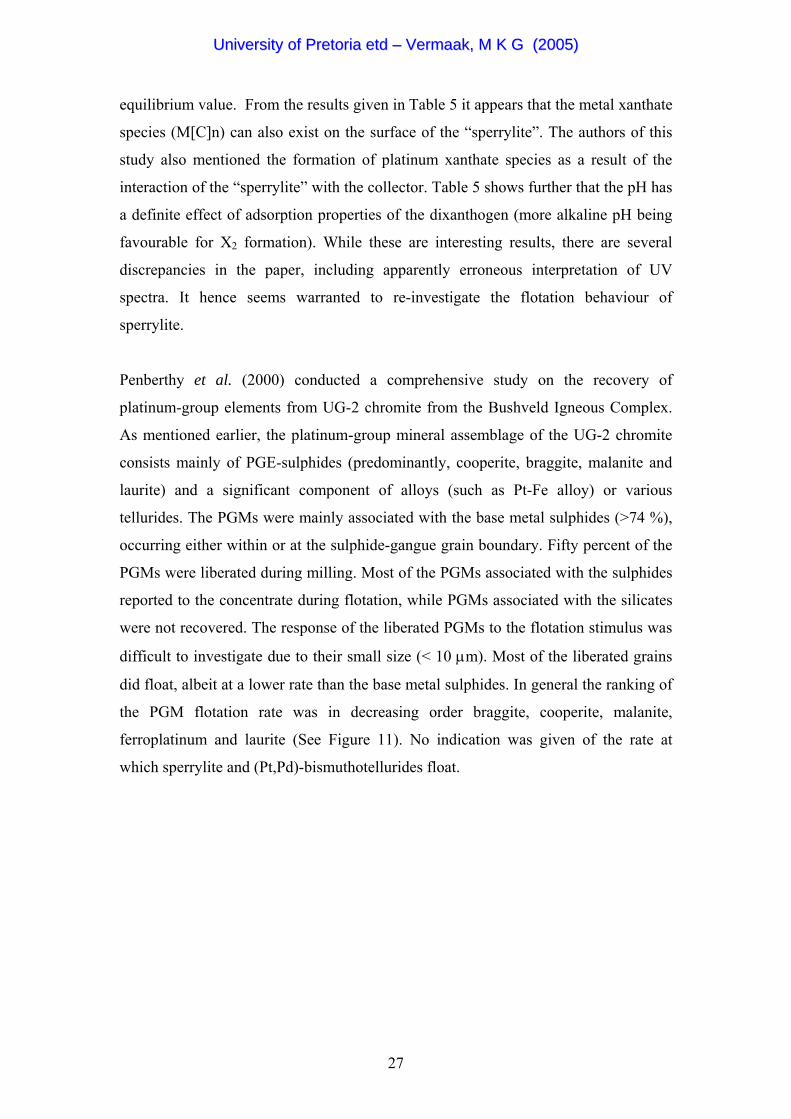
Penberthy et al. (2000) conducted a comprehensive study on the recovery of
platinum-group elements from UG-2 chromite from the Bushveld Igneous Complex.
As mentioned earlier, the platinum-group mineral assemblage of the UG-2 chromite
consists mainly of PGE-sulphides (predominantly, cooperite, braggite, malanite and
laurite) and a significant component of alloys (such as Pt-Fe alloy) or various
tellurides. The PGMs were mainly associated with the base metal sulphides (>74 %),
occurring either within or at the sulphide-gangue grain boundary. Fifty percent of the
PGMs were liberated during milling. Most of the PGMs associated with the sulphides
reported to the concentrate during flotation, while PGMs associated with the silicates
were not recovered. The response of the liberated PGMs to the flotation stimulus was
difficult to investigate due to their small size (< 10 µm). Most of the liberated grains
did float, albeit at a lower rate than the base metal sulphides. In general the ranking of
the PGM flotation rate was in decreasing order braggite, cooperite, malanite,
ferroplatinum and laurite (See Figure 11). No indication was given of the rate at
which sperrylite and (Pt,Pd)-bismuthotellurides float.
27
UUnniivveerrssiittyy ooff PPrreettoorriiaa eettdd –– VVeerrmmaaaakk,, MM KK GG ((22000055))
Time (minutes)
0 5 10 15 20
Cum
ulat
ive
% re
cove
ry
70
80
90
100
Braggite Malanite Cooperite Laurite Ferroplatinum
Figure 11: The recovery for selected liberated PGMs (redrawn from Penberthy et al.,
2000) in batch flotation tests.
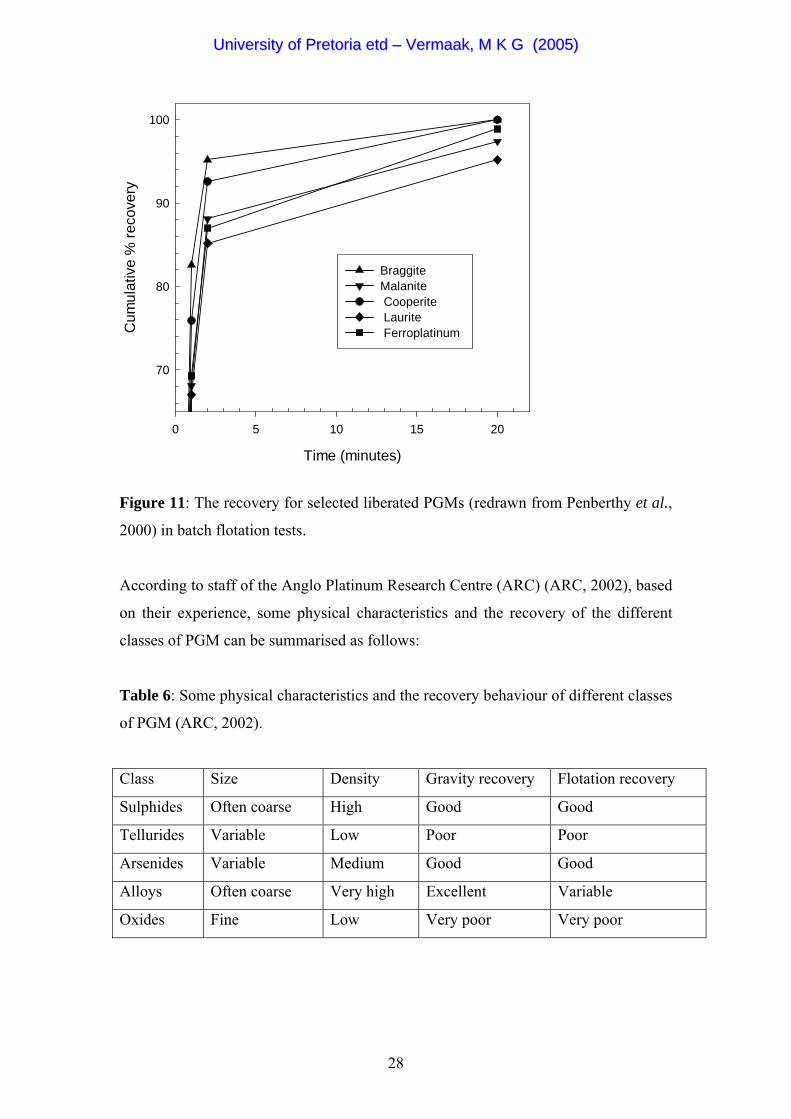
According to staff of the Anglo Platinum Research Centre (ARC) (ARC, 2002), based
on their experience, some physical characteristics and the recovery of the different
classes of PGM can be summarised as follows:
Table 6: Some physical characteristics and the recovery behaviour of different classes
of PGM (ARC, 2002).
Class Size Density Gravity recovery Flotation recovery
Sulphides Often coarse High Good Good
Tellurides Variable Low Poor Poor
Arsenides Variable Medium Good Good
Alloys Often coarse Very high Excellent Variable
Oxides Fine Low Very poor Very poor
28
UUnniivveerrssiittyy ooff PPrreettoorriiaa eettdd –– VVeerrmmaaaakk,, MM KK GG ((22000055))
The inherent assumption of Table 6 is that all the minerals are liberated. This table
underlines the importance of a good understanding of the flotation behaviour of the
tellurides with the main aim to optimise the recovery of these minerals.
2.3.1. Platinum-group element recovery from the oxidised MSZ of the Great
Dyke of Zimbabwe
Sperrylite is the principal platinum carrier in the oxidised MSZ of Mimosa mine
(formerly known as Wedza mine) and previous attempts, which included flotation and
gravity concentration, did not achieve better than 50% Pt recovery
(Prendergast, 1988b). Metallurgical test work performed by Zimplats on the their
oxidised ores only achieved recoveries of between 15-30% (Oberthür et al., 2002d).
Evans (1994) reported that PGE-bearing minerals in the weathered ore are
predominantly platinum-iron alloys of variable composition containing variable
amounts of bismuth, palladium and tellurium. Evans et al. (1994) suggested that the
bismuthotellurides and Pt-Pd-sulphides have been altered in situ by the leaching of the
sulphur, tellurium and bismuth. This hypothesis was not supported by Stribrny et al.
(2000). However, Oberthür et al. (2002d) have shown the existence of ill defined
“PGE-oxides or hydroxides “ around altered (Pt,Pd)-bismuthotellurides. Preliminary
results show the loss of Te and Bi and the increase in Pt and Pd contents from the
oxides or hydroxides. The fact that these phases contain oxygen was verified by
micro-probe analysis and corresponds to the work published by Evans et al. (2000).
In addition to the formation of these PGE oxides or hydroxides, it was suggested by
Stribrny et al. (2000) and Oberthür (2002d) that the PGEs are dispersed in the iron
hydroxides or smectites. The weathering of the sulphides to goethite or limonite
minerals, and the alteration of the pyroxenites, prevent the efficient concentration of
precious metals by sulphide flotation (Prendergast, 1990). The textural association of
the PGMs with the altered sulphides is not well known at this stage, but electron
micro-probe investigations have revealed that the PGMs in the oxidised deposit are
located at the goethite-limonite patches after the interstitial sulphides
(Evans et al., 1994; Oberthür, 2002b).
The possibility of applying an oxidic float to recover the altered sulphides is currently
being tested at General Metallurgical Research and Services (GMRS). Prendergast
29
UUnniivveerrssiittyy ooff PPrreettoorriiaa eettdd –– VVeerrmmaaaakk,, MM KK GG ((22000055))
(1988) proposed the recovery of the PGM by fine grinding and flotation by altering
the flotation conditions.
2.4. Chemical stability of Michenerite
All three elements in Michenerite (PdBiTe) are fairly noble, concerning the
considerable overlap of their stability areas with that of water (See Figures 12 - 14)
(Pourbaix, 1974). All the relevant reaction equations can be found in Pourbaix (1974).
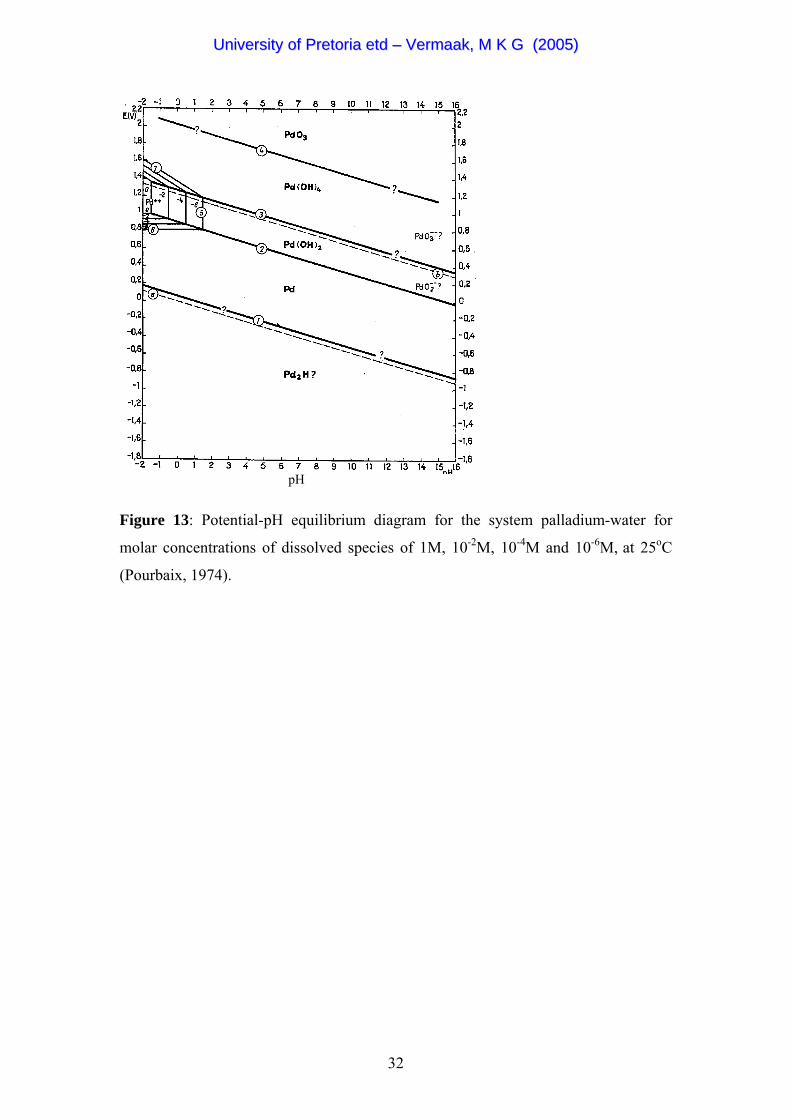
Palladium is thermodynamically stable in the presence of aqueous solutions free from
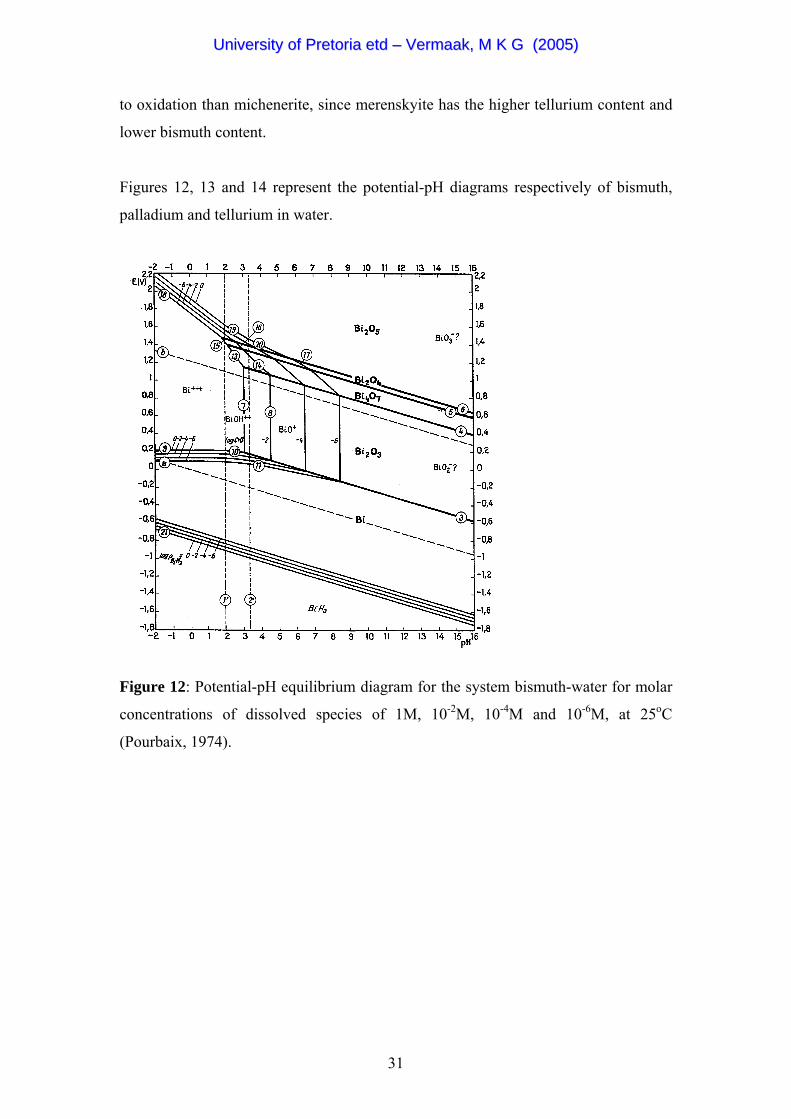
strongly oxidising conditions at low pH values. Both Te and Bi oxidise in the
bismuth-telluride minerals despite the fact that these elements do not oxidise readily,
in their pure state, in air. Aerated water attacks bismuth to form Bi2O3, which is in
turn very soluble in dilute acids. TeO2 is formed in aerated water and forms a non-
protective film if the TeO2 is freshly precipitated. The kinetics of the oxidation in
solution is not very well understood, but if oxidation proceeds at a high enough rate,
oxidation could impact negatively on the flotation process.
The majority of sulphide flotation plants operate at pulp potentials (using air as carrier
gas) between 200 mV (SHE) and 300 mV (SHE) (Ralston, 1991). Ores from the
Merensky and UG2 reefs have a natural buffer capacity ensuring pH levels between 8
and 9 (Buswell et al., 2002; Ekmekçi et al., 2003). Considering the typical values of
the pulp potential and pH (assuming the same values for the Great Dyke of
Zimbabwe) Te and Bi are likely to be oxidised in industrial flotation circuits if the
oxidation proceeds at a higher rate than competing reactions (possibly the oxidation of
the collector).
Elvy et al. (1996) reported the incongruent oxidation (the migration of some metal
atoms to the surface to form an overlayer of a metal-oxygen species) of minerals in
the Pd-Te-Bi system leading to the formation of layer of tellurium and/or bismuth
oxide covering the palladium-rich substrate The reactivity of the minerals increased in
the order of: PdTe < PdTeBi < PdBi. This is in the same order as the reactivities of
Pd, Te and Bi in the pure form. This implies that merenskyite should be more resistant
30
UUnniivveerrssiittyy ooff PPrreettoorriiaa eettdd –– VVeerrmmaaaakk,, MM KK GG ((22000055))
to oxidation than michenerite, since merenskyite has the higher tellurium content and
lower bismuth content.
Figures 12, 13 and 14 represent the potential-pH diagrams respectively of bismuth,
palladium and tellurium in water.
igure 12: Potential-pH equilibrium diagram for the system bismuth-water for molar
F
concentrations of dissolved species of 1M, 10-2M, 10-4M and 10-6M, at 25oC
(Pourbaix, 1974).
31
UUnniivveerrssiittyy ooff PPrreettoorriiaa eettdd –– VVeerrmmaaaakk,, MM KK GG ((22000055))
pH
Figure 13: Potential-pH equilibrium diagram for the system palladium-water for
molar concentrations of dissolved species of 1M, 10-2M, 10-4M and 10-6M, at 25oC
(Pourbaix, 1974).
32
UUnniivveerrssiittyy ooff PPrreettoorriiaa eettdd –– VVeerrmmaaaakk,, MM KK GG ((22000055))
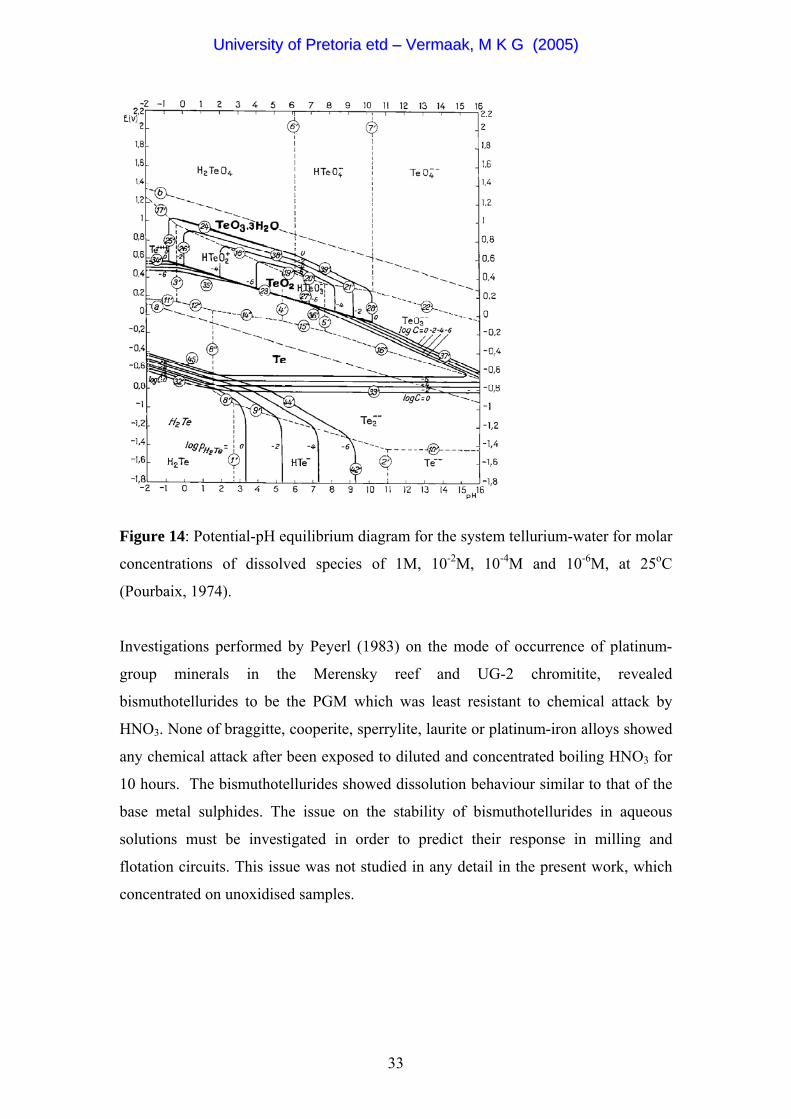
Figure 14: Potential-pH equilibrium diagram for the system tellurium-water for molar
concentrations of dissolved species of 1M, 10-2M, 10-4M and 10-6M, at 25oC
(Pourbaix, 1974).
Investigations performed by Peyerl (1983) on the mode of occurrence of platinum-
group minerals in the Merensky reef and UG-2 chromitite, revealed
bismuthotellurides to be the PGM which was least resistant to chemical attack by
HNO3. None of braggitte, cooperite, sperrylite, laurite or platinum-iron alloys showed
any chemical attack after been exposed to diluted and concentrated boiling HNO3 for
10 hours. The bismuthotellurides showed dissolution behaviour similar to that of the
base metal sulphides. The issue on the stability of bismuthotellurides in aqueous
solutions must be investigated in order to predict their response in milling and
flotation circuits. This issue was not studied in any detail in the present work, which
concentrated on unoxidised samples.
33
UUnniivveerrssiittyy ooff PPrreettoorriiaa eettdd –– VVeerrmmaaaakk,, MM KK GG ((22000055))
2.5. Interaction of Thiols with metals
It was proposed that the interaction of thiols with metals (platinum, gold and copper)
involves an electrochemical mechanism, with anodic oxidation of the collector
supported by a cathodic (reduction) reaction (e.g. reduction of oxygen)
(Woods et al., 1974):
2X- = X2 + 2e- (1)
0.5O2(ads) + H2O + 2e- = 2OH- (2)
In these equations X- indicates the xanthate ion and X2 dixanthogen.
Woods et al. (1974) further proposed that reaction 1 proceeds via an initial
chemisorption step and that the multi-layers of dixanthogen product are bound to the
chemisorbed monolayer xanthate by the interaction of the hydrocarbon parts of the
molecule. The main experimental advantage of the electrochemical nature of these
reactions is that the reactions can be tracked by electrochemical techniques
(potentiodynamic measurements and impedance measurements).
The possible oxidation of dithiocarbonate collectors was hence studied through
potentiodynamic measurements in the present work; anodic and cathodic polarization
diagrams were drawn for synthetic Pd-Bi-Te and PtAs2 working electrodes, to
investigate the anodic oxidation and oxygen reduction reactions. The possibility of the
formation of a surface layer of the collector was determined through impedance
measurements. Impedance measurements allow in situ detection of the formation of
surface layers (of collector), by a decrease in the circuit capacitance.
Impedance measurements are based on the modelling of an electrode in solution as an
electronic circuit containing resistors, capacitors and inductors. A simplified version
of such a circuit is shown in Figure 15. The equivalent circuit contains a resistor in
series with a parallel circuit containing a capacitor and resistor.
34
UUnniivveerrssiittyy ooff PPrreettoorriiaa eettdd –– VVeerrmmaaaakk,, MM KK GG ((22000055))
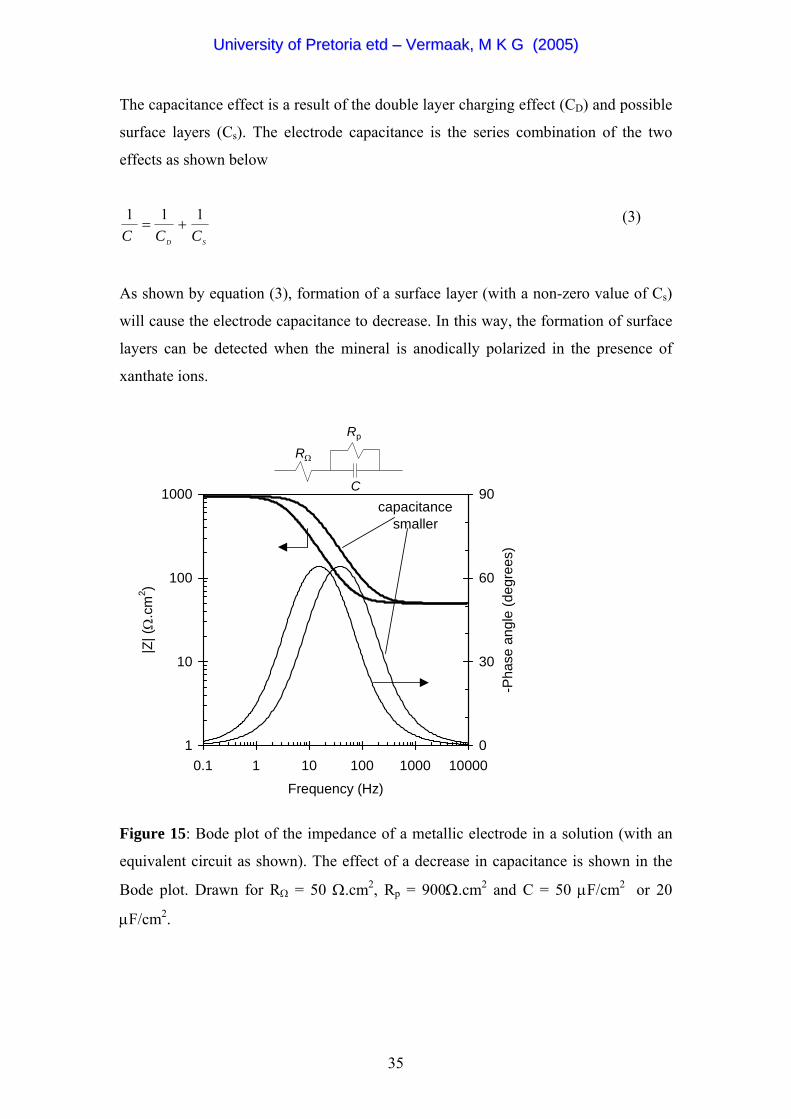
The capacitance effect is a result of the double layer charging effect (CD) and possible
surface layers (Cs). The electrode capacitance is the series combination of the two
effects as shown below
SD CCC111
+= (3)
As shown by equation (3), formation of a surface layer (with a non-zero value of Cs)
will cause the electrode capacitance to decrease. In this way, the formation of surface
layers can be detected when the mineral is anodically polarized in the presence of
xanthate ions.
1
10
100
1000
0.1 1 10 100 1000 10000
Frequency (Hz)
|Z| (
Ω.c
m2 )
0
30
60
90-P
hase
ang
le (d
egre
es)
capacitancesmaller
RΩ
Rp
C
Figure 15: Bode plot of the impedance of a metallic electrode in a solution (with an
equivalent circuit as shown). The effect of a decrease in capacitance is shown in the
Bode plot. Drawn for RΩ = 50 Ω.cm2, Rp = 900Ω.cm2 and C = 50 µF/cm2 or 20
µF/cm2.
35
UUnniivveerrssiittyy ooff PPrreettoorriiaa eettdd –– VVeerrmmaaaakk,, MM KK GG ((22000055))