Embed Size (px)
Citation preview

211 9,8 211 190Fr
esen
ius
SE
& C
o. K
GaA
· A
nnua
l Rep
ort
2014
ANNUAL REPORT
2 To our shareholders
6 Summary of the fiscal year
8 Fresenius share
11 Corporate governance declaration
and report
36 Business segments
36 Fresenius Medical Care
38 Fresenius Kabi
40 Fresenius Helios
42 Fresenius Vamed
44 Management report
(see detailed register on page 44)
45 Fundamental information about
the Group
45 The Group’s business model
48 Goals and strategy
49 Corporate performance
criteria
50 Research and development
52 Employees
53 Procurement
54 Quality management
55 Responsibility, environmental
management, sustainability
58 Report on economic position
58 Health care industry
62 Overall business development
64 Results of operations, financial
position, assets and liabilities
76 Subsequent events
76 Overall assessment of the
business situation
76 Outlook
76 General and mid-term
outlook
78 Future markets
78 Health care sector and
markets
80 Group sales and earnings
80 Sales and earnings by
business segment
81 Financing
81 Investments
82 Procurement
82 Research and development
82 Planned changes in
human resources and
the social area
82 Dividend
83 Opportunities and risk report
83 Opportunities management
83 Risk management
84 Risk areas
91 Assessment of overall risk
92 Consolidated financial statements
93 Consolidated statement of income
93 Consolidated statement of
comprehensive income
94 Consolidated statement of
financial position
95 Consolidated statement of cash flows
96 Consolidated statement of
changes in equity
98 Consolidated segment reporting
100 Notes
(see detailed register on page 100)
101 General notes
118 Notes on the consolidated
statement of income
122 Notes on the consolidated
statement of financial position
152 Other notes
180 Notes in accordance with the
German Commercial Code
(HGB)
183 Auditor’s report
184 Report of the Supervisory Board
190 Boards
190 Supervisory Board
Fresenius SE & Co. KGaA
192 Management Board
Fresenius Management SE
193 Supervisory Board
Fresenius Management SE
194 Glossary
197 Index
TABLE OF CONTENTS
2014

211 9,8 211 190
Fres
eniu
s S
E &
Co
. KG
aA ·
Ann
ual R
epor
t 20
14
ANNUAL REPORT
2 To our shareholders
6 Summary of the fiscal year
8 Fresenius share
11 Corporate governance declaration
and report
36 Business segments
36 Fresenius Medical Care
38 Fresenius Kabi
40 Fresenius Helios
42 Fresenius Vamed
44 Management report
(see detailed register on page 44)
45 Fundamental information about
the Group
45 The Group’s business model
48 Goals and strategy
49 Corporate performance
criteria
50 Research and development
52 Employees
53 Procurement
54 Quality management
55 Responsibility, environmental
management, sustainability
58 Report on economic position
58 Health care industry
62 Overall business development
64 Results of operations, financial
position, assets and liabilities
76 Subsequent events
76 Overall assessment of the
business situation
76 Outlook
76 General and mid-term
outlook
78 Future markets
78 Health care sector and
markets
80 Group sales and earnings
80 Sales and earnings by
business segment
81 Financing
81 Investments
82 Procurement
82 Research and development
82 Planned changes in
human resources and
the social area
82 Dividend
83 Opportunities and risk report
83 Opportunities management
83 Risk management
84 Risk areas
91 Assessment of overall risk
92 Consolidated financial statements
93 Consolidated statement of income
93 Consolidated statement of
comprehensive income
94 Consolidated statement of
financial position
95 Consolidated statement of cash flows
96 Consolidated statement of
changes in equity
98 Consolidated segment reporting
100 Notes
(see detailed register on page 100)
101 General notes
118 Notes on the consolidated
statement of income
122 Notes on the consolidated
statement of financial position
152 Other notes
180 Notes in accordance with the
German Commercial Code
(HGB)
183 Auditor’s report
184 Report of the Supervisory Board
190 Boards
190 Supervisory Board
Fresenius SE & Co. KGaA
192 Management Board
Fresenius Management SE
193 Supervisory Board
Fresenius Management SE
194 Glossary
197 Index
TABLE OF CONTENTS
2014

190 211 9,8 211
FRESENIUS MEDICAL CARE
FRESENIUS HELIOS
FRESENIUS KABI
FRESENIUS VAMED
DIALYSIS PRODUCTS,
HEALTH CARE SERVICES
(DIALYSIS SERVICES
AND CARE COORDINATION)
HOSPITAL OPERATION
IV DRUGS, CLINICAL NUTRITION,
INFUSION THERAPY, MEDICAL DEVICES /
TRANSFUSION TECHNOLOGY
PROjECTS AND SERVICES
FOR HOSPITALS AND
OTHER HEALTH CARE FACILITIES
1 Before special items2 Net income attributable to the parent company of the respective business segment
For a detailed overview of 2013 – 2014 special items please see the reconciliation table on page 66.
2014US$ in millions
2013US$ in millions Change
2014€ in millions
2013€ in millions Change
Sales 15,832 14,610 8% 5,146 4,996 3%
EBIT 2,255 2,256 0% 873 1 926 1 - 6%
Net income 2 1,045 1,110 - 6% 468 1 487 1 - 4%
Operating cash flow 1,861 2,035 - 9% 641 488 31%
Capital expenditure / acquisitions 2,919 1,311 123% 479 448 7%
R & D expenses 122 126 - 3% 276 1 250 1 10%
Employees (December 31) 105,917 95,637 11% 32,899 31,961 3%
2014€ in millions
2013€ in millions Change
2014€ in millions
2013€ in millions Change
Sales 5,244 3,393 55% 1,042 1,020 2%
EBIT 553 1 390 42% 59 55 7%
Net income 2 400 1 275 45% 41 37 11%
Operating cash flow 558 258 116% - 9 31 - 129%
Capital expenditure /acquisitions 1,090 2,357 - 54% 22 27 - 19%
Order intake n / a n / a 840 744 13%
Employees (December 31) 68,852 42,913 60% 7,746 7,010 10%
Key
fig
ures
of
the
busi
ness
seg
men
ts
<
FINANCIAL CALENDAR
Report on 1st quarter 2015 Conference call, live webcast April 30, 2015
Annual General Meeting, Frankfurt am Main, Germany May 20, 2015
Payment of dividend 1 May 21, 2015
Report on 2nd quarter 2015 Conference call, live webcast july 30, 2015
Report on 3rd quarter 2015 Conference call, live webcast October 29, 2015
1 Subject to prior approval by the Annual General Meeting
FRESENIUS GROUP IN FIGURES (U.S. GAAP)
€ in millions 2014 2013 2012 2011 2010
Sales and Earnings
Sales 23,231 20,331 19,290 16,361 1 15,972
EBITDA 2 4,095 3,888 3,851 3,237 3,057
EBIT 2 3,158 3,045 3,075 2,563 2,418
Net income (before special items) 3 1,086 1,051 938 770 660
Depreciation and amortization 937 843 776 674 639
Earnings per share in € (before special items) 3 2.01 1.96 4 1.81 4 1.58 4 1.36 4
Cash flow and Balance sheet
Operating cash flow 2,585 2,320 2,438 1,689 1,911
Operating cash flow in % of sales 11.1% 11.4% 12.6% 10.3% 12.0%
Total assets 39,897 32,758 30,664 26,321 23,577
Non-current assets 29,869 24,786 22,551 19,170 17,142
Equity 5 15,483 13,260 12,758 10,577 8,844
Equity ratio 5 39% 41% 42% 40% 38%
Net debt 14,279 11,940 10,143 9,164 8,015
Net debt / EBITDA 6 3.41 2.51 2.56 2.83 2.62
Investments 7 3,795 3,827 4,179 2,395 1,402
Profitability
EBIT margin 2 13.6% 15.0% 15.9% 15.7% 15.1%
Return on equity after taxes (ROE) 3 11.6% 12.8% 12.3% 12.9% 13.3%
Return on operating assets (ROOA) 6 9.1% 10.6% 11.0% 10.9% 11.6%
Return on invested capital (ROIC) 6 7.5% 8.8% 9.0% 8.8% 8.9%
Dividend per share in € 0.44 8 0.42 4 0.37 4 0.32 4 0.29 4
Employees (December 31) 216,275 178,337 169,324 149,351 137,552
1 2011 sales were adjusted by - € 161 million according to a U.S. GAAP accounting change; this solely relates to Fresenius Medical Care North America.2 2013 – 2014 before special items; 2012 before one-time costs (€ 6 million) related to the offer to the shareholders of Rhön-Klinikum AG
as well as other one-time costs (€ 86 million) at Fresenius Medical Care3 Net income attributable to shareholders of Fresenius SE & Co. KGaA; 2013 – 2014 before special items; 2012 before a non-taxable
investment gain (€ 34 million) and other one-time costs (€ 17 million) at Fresenius Medical Care as well as one-time costs (€ 29 million) related to the offer to the shareholders of Rhön-Klinikum AG; 2010 – 2011 before the effects of the mark-to-market accounting of the MEB and the CVR
4 Adjusted for 1 : 3 share split5 Including noncontrolling interest6 2012 – 2014 before special items; 2014 pro forma acquisitions; 2013 pro forma excluding advances made in the amount of € 2.18 billion under a fiduciary
agreement for the acquisition of hospitals and outpatient facilities of Rhön-Klinikum AG and before integration costs of Fenwal (€ 54 million); 2012 pro forma acquisitions
7 Investments in property, plant and equipment, and intangible assets, acquisitions8 Proposal
You will find a 10-year overview on our website: www.fresenius.com under “Investor Relations.”
FRESENIUS SHARE / ADR
CONTACT
Ordinary share ADR
Securities identification no. 578 560 CUSIP 35804M105
Ticker symbol FRE Ticker symbol FSNUY
ISIN DE0005785604 ISIN US35804M1053
Bloomberg symbol FRE GR Structure Sponsored Level 1 ADR
Reuters symbol FREG.de Ratio 4 ADR = 1 share 1
Main trading location Frankfurt / Xetra Trading platform OTCQX
1 As of August 4, 2014, the ADR ratio was changed in conjunction with the company’s stock split (previous ratio: 8 ADR = 1 share).
Corporate HeadquartersElse-Kröner-Straße 1Bad Homburg v. d. H.Germany
Postal addressFresenius SE & Co. KGaA
61346 Bad Homburg v. d. H.Germany
Contact for shareholdersInvestor RelationsTelephone: ++ 49 61 72 6 08-26 37Telefax: ++ 49 61 72 6 08-24 88E-mail: [email protected]
Contact for journalistsCorporate CommunicationsTelephone: ++ 49 61 72 6 08-23 02Telefax: ++ 49 61 72 6 08-22 94E-mail: [email protected]

Fresenius is a global health care group providing products and services for dialysis,
hospitals, and outpatient medical care. In addition, Fresenius focuses on hospital
operations. We also manage projects and provide services for hospitals and other health
care facilities. More than 216,000 employees have dedicated themselves to the service
of health in about 100 countries worldwide.

To Our S
hareholders
To Our Shareholders2
Dear Fresenius Investor:
At Fresenius, growth means more than increasing sales and
profits. It is a commitment to improving our business and
strengthening our connection to patients each and every day.
Last May, I experienced this commitment first-hand. Shortly
after our acquisition of 41 hospitals from Rhön-Klinikum,
hospital managers, medical directors and care personnel from
both the existing and newly acquired HELIOS hospitals met
for the first time. There was a great deal of energy and enthu-
siasm among the attendees at the conference, with everyone
eager to learn from each other’s successes and past mistakes.
This spirit fostered lively discussions about how to further
improve patient care in all of our hospitals. We debated how
to combine exceptional treatment with efficiency, and dis-
cussed ways to increase the transparency of medical quality
reports.
In one of the many memorable discussions, the medical
director and chief physician of a newly acquired Rhön-Klinikum
hospital described the procedures and capabilities of its
renowned interdisciplinary emergency room. The facility is
so well managed and tailored to meet patient needs that
other HELIOS hospitals are now considering adopting the best
practices he shared with us. The session proved to me that
the conference would achieve its purpose: making the hospi-
tals “Better Together.”
The open and frank discussions we had that day in Berlin and
our professionals’ desire to learn from others reminded me
why Fresenius is uniquely positioned to deliver world-class
healthcare more effectively and efficiently than ever.
Getting closer to patientsAfter two decades of steady investment in our strategy, we
have transformed Fresenius from a pure product supplier
into an integrated care company. The growth of our services
businesses best illustrates our progress: during the last
10 years, sales revenue from services has more than tripled
from 4.5 billion euros to 15.5 billion euros, and increased as
a percentage of total sales to nearly 70 percent. We expect
those numbers to continue to grow.

To O
ur S
hare
hold
ers
To Our Shareholders 3
Last year was no exception. We achieved our growth objec-
tives once again and got even closer to our patients.
Our acquisition of the Rhön-Klinikum hospitals was a major
step in our transformation: today, a HELIOS facility is within
an hour of nearly every person in Germany. This extensive
healthcare platform enables us to develop innovative, compre-
hensive care offerings and deliver them efficiently. HELIOS
was a founding partner in a new venture launched last year,
called Kliniknetzwerk für Qualitätsmedizin, a hospital network.
This is open to all German hospitals that maintain clearly
defined standards of care. Our initiative is to offer additional
hospital services in cooperation with an insurer. Companies
can then provide this benefit to their employees, giving them
access to a level of service not covered by standard public
health insurance.
» We remain committed to our ›Closer to Patients‹ strategy. «
By bundling expertise in specialist centers, we will be better
positioned to address patients’ unique needs. Outpatient,
acute and rehabilitative care will be better integrated to avoid
redundant examinations and reduce wait times. We see the
hospital network as an innovative partnership model for the
future of German healthcare, with patients as the greatest
beneficiaries. We think our efforts will mark the beginning of
more efficient, more closely coordinated healthcare – a win-
win for patients and providers.
More than just dialysis Fresenius Medical Care is also moving closer to patients
through its newly created Care Coordination business. Our goal
is to integrate specialists into coordinated disease manage-
ment teams for each patient. For example, many renal patients
also suffer from diabetes or circulatory diseases, which have
traditionally been treated by individual specialists. In the
future, we intend to offer these patients medical services tar-
geted to their needs and managed by coordinated specialists,
whether delivered in a dialysis clinic, in an outpatient care
setting or during a hospital stay. Such Care Coordination can
also help to shorten hospital visits. Our aim is to both improve
medical outcomes and make care more efficient.
We are convinced there is substantial patient benefit in Care
Coordination and want to significantly grow in this segment
from last year’s revenue level of more than 1 billion U.S. dol-
lars. As part of this effort, Fresenius Medical Care made several
At the “Better Together” conference participants discussed
ways to improve patient care.

To Our S
hareholders
To Our Shareholders4
acquisitions in the U.S. We gained a network of clinical phy-
sicians through the acquisition of Sound Inpatient Physicians
and our acquisition of National Cardiovascular Partners helped
us grow into a leading provider of outpatient cardiovascular
treatment. Both acquisitions strengthened our Care Coordina-
tion business and moved Fresenius Medical Care closer to
patients.
Reaching new patients in emerging marketsWe are bringing our products and services closer to more
patients around the world by continually moving into new mar-
kets, especially in developing countries in Asia and Latin Amer-
ica. Last June, for example, I visited a major new Fresenius
Kabi production facility in the early stages of construction in
Beijing. It will come online by the end of this year and signif-
icantly expand our capacity to serve the increasing demand
in Asian markets from a local base. On the flight home, I could
not stop thinking about how our employees in the region
are seizing the opportunities in this rapidly evolving market.
Their dedication and entrepreneurial spirit serves as an inspi-
ration to everyone at Fresenius.
Growth opportunities for generic drugsHealthcare costs around the world are under close scrutiny,
and even in emerging markets, pricing will play a bigger role
in care decisions. For us, that will create opportunities for
further growth and new customers. Consider, for example,
generics, which are safe, effective, and much cheaper than
branded products. Fresenius Kabi offers a large variety of
intravenously administered (IV) drugs. Demand for generics
is growing much faster in the emerging markets than in
the U.S. and Europe, where we now make 82 percent of our
IV drug sales. In China, the market for generic IV drugs is
growing by more than 10 percent per year, yet so far IV drugs
are only a small part of our business there. To take advantage
of this growth opportunity, we have opened a development
center for oncological generics in Wuhan that will enable us
to respond more quickly to the needs of this key market. We
plan to file a large number of drug approval applications with
Chinese regulators in the coming years, and will produce the
drugs in the country. Chinese patients, the local healthcare
community and Fresenius will all benefit.
2014 – A successful yearOur financial results for 2014 provide evidence of our steady
progress. Group sales increased 16 percent to 23.2 billion
euros and Group net income before special items rose 4 per-
cent to 1.1 billion euros, both in constant currency.
These results were not easy to achieve. At this time last year,
I highlighted the challenges facing us in 2014 – price declines
in China, restrictions on using our blood volume substitutes,
A new Fresenius Kabi production facility under
construction in Beijing

To O
ur S
hare
hold
ers
To Our Shareholders 5
and, in the U.S., increased supply from competitors in the
IV drug market and dialysis reimbursement reductions. Team
Fresenius has responded with focus, discipline and dedica-
tion on the way to overcoming these challenges.
Better medicine for more peopleAround the world, healthcare costs and funding are in flux,
and the economic outlook remains uncertain. To successfully
navigate these challenges, we will rely on our proven strengths:
a strong focus on patients and customers, medical and tech-
nical innovation, quality and cost leadership. In short, we want
better medicine for more people.
We must also acknowledge and be prepared to take advan-
tage of the forces shaping our industry. Demand for health-
care services continues to increase globally for two primary
reasons: aging populations are increasingly in need of care,
and more people are gaining access to healthcare. Fresenius
is meeting this demand with products and services that make
quality healthcare more accessible around the world and will
continue to pursue new opportunities aggressively and with
entrepreneurial energy.
Steady future growthLooking ahead, we are optimistic about our growth prospects
in 2015. We expect Group sales growth of 7 to 10 percent
and a 9 to 12 percent increase in Group net income before
special items, both in constant currency. These are important
milestones on our way to the ambitious mid-term financial
goals we established: in 2017, we are targeting Group sales of
approximately 30 billion euros and Group net income between
1.4 and 1.5 billion euros. Achieving these goals will require
average annual growth of 9 percent in sales and 9 to 11 percent
in net income.
These are ambitious but realistic targets. To achieve them,
we will build on our strengths, benefit from our position at the
intersection of global healthcare trends, and remain commit-
ted to our “Closer to Patients” strategy. As an integrated care
company, we will continue to focus on creating a holistic
approach to delivering healthcare.
» In 2017, we are targeting Group sales of approximately 30 billion euros and Group net income between 1.4 and 1.5 billion euros. «
I thank you for being a part of our journey so far and encour-
age you to remain by our side as we continue to grow
Fresenius and increase access to quality healthcare around
the world.
Dr. Ulf M. Schneider
Chairman of the Management Board

Sum
mary
Summary6
SUMMARY OF THE FISCAL YEAR
SALES. Group sales increased by 14% to € 23,231 million (2013: € 20,331 million). Organic sales growth was 4%. Currency translation had a negative effect of 2%. Acquisitions contributed 12%. Divestitures had a marginal effect on sales growth.
EARNINGS. Group EBIT 1 reached an all-time high of € 3,158 million. The EBIT margin 1 was 13.6%. Group net income 1, 2 increased by 3% to € 1,086 million. Growth in constant currency was 4%.
1 Before special items2 Net income attributable to the shareholders of Fresenius SE & Co. KGaA
For a detailed overview of special items please see the reconciliation table on page 66.
SALES BY REGION
Latin America and other regions 7%
Asia-Pacific 9%
North America 40%
Europe 44%
2014: € 23.2 billion
Druckerei Ziegler:
Bitte beachten: hier Papierwechsel. Linke Seite (6) wird
auf 120 g/m gedruckt, rechte Seite (7) auf 70 g/m. Danke.
EARNINGS DEVELOPMENT
EBIT Net income EBIT margin
2,4182,563
3,075 1 3,045 13,158 1
770 2938 1, 2
1,051 1, 2 1,086 1, 2
660 2
€ in millions 2010 2011 2012 2013 2014
15.9%
15.0%
13.6%
15.1%15.7%

Sum
mar
y
Summary 7
CASH FLOW. Operating cash flow in-creased to € 2,585 million. It was influ-enced by the payment for the W.R. Grace bankruptcy settlement 3 at Fresenius Medical Care. The cash flow margin was 11.1%. Free cash flow before acquisitions and dividends was € 1,262 million.
BALANCE SHEET. Total assets increased by 22% to € 39,897 million mainly due to acquisitions. Total shareholders’ equity, including non controlling interest, increased by 17% to € 15,483 million. As of Decem-ber 31, 2014, the net debt / EBITDA ratio was 3.41 4 (December 31, 2013: 2.51 5).
3 Payment for the W.R. Grace bankruptcy settlement of US$ 115 million4 Pro forma acquisitions; before special items; 3.26 at 2014 average exchange rates for both net debt and EBITDA5 Pro forma excluding advances made in the amount of € 2.18 billion under a fiduciary agreement for the acquisition of hospitals
and outpatient facilities of Rhön-Klinikum AG; before special items
Druckerei Ziegler:
Bitte beachten: hier Papierwechsel. Linke Seite (6) wird
auf 120 g/m gedruckt, rechte Seite (7) auf 70 g/m. Danke.
ASSETS EQUITY AND LIABILITIES
€ in millions
Non-current assets
Trade accounts receivable
Other current assets
Equity and noncontrolling interest
Debt
Other liabilities
14% 15%
22%20%10% 10%
39%39%
76% 75% 39%41%
32,758 32,75839,897 39,897
Dec. 31, 2013 Dec. 31, 2013Dec. 31, 2014 Dec. 31, 2014
OPERATING CASH FLOW
1,911
1,689
2,4382,320
2,585
€ in millions 2010 2011 2012 2013 2014
Operating cash flow Operating cash flow margin
12.0%10.3%
12.6%
11.4%11.1%

Fresenius Share
Fresenius Share8
STOCK MARKETS AnD DEvElOpMEnT Of ThE fRESEniuS ShAREAfter a strong start to the year on stock markets, geopolitical
risks and economic uncertainties increased, beginning in
mid-2014, before monetary policy measures restored confi-
dence and an early year-end rally began in November.
The DAX increased by 3%; the Euro Stoxx 50 gained
1% for the year. The European Dow Jones Stoxx 600 index
ended the year up by 4%. In this index, the health care
sector gained 18%. The leading U.S. indices also performed
well: The S & p 500 closed with a gain of 11%, while the Dow
Jones industrial Average gained 8%.
The Fresenius share continued its impressive develop-
ment: The closing price for the Fresenius share on Decem-
ber 31, 2014 was € 43.16. This represents a gain of 16% over
the closing price 1 of 2013, which means that the Fresenius
share was the fourth-strongest in the DAX.
In a comparison over five years, the Fresenius share
outperformed its benchmark DAX by 133 percentage points.
While the DAX rose by 65% over this period, the Fresenius
share gained 198%.
FRESENIUS SHARE. Fresenius shares continued their excellent performance in 2014, reaching a record high of € 44.12 in December. With an increase of 16%, Fresenius significantly out-performed the DAX.
1 Adjusted for share split
RELATIVE SHARE PRICE PERFORMANCE 2009 – 2014
FRESENIUS SHARE VS. DAX
400
350
300
250
200
150
100
50
0
%
50
45
40
35
30
25
20
15
10
€
30.12.2009 30.12.201130.12.2010 30.12.2012 30.12.2013 30.12.2014
Fresenius share in % DAX in % Fresenius high and low in € Fresenius share Monthly price range
ABSOLUTE SHARE PRICE PERFORMANCE 2014
FRESENIUS SHARE IN €
48.00
46.00
44.00
42.00
40.00
38.00
36.00
34.00
32.00
30.00
Dec. 13 Feb. 14 Apr. 14 Jun. 14 Aug. 14 Oct. 14 Dec. 14

Fres
eniu
s S
hare
Fresenius Share 9
The market capitalization of Fresenius was € 23.4 billion
as of December 31, 2014, an increase of 17% compared to
the previous year. The average daily trading volume on Xetra
decreased by 9% to 1,153,022 Fresenius shares compared
to the previous year (2013 adjusted for share split: 1,269,192).
DAX trading volume decreased by 17% in the same time
period.
In the United States, Fresenius has a Sponsored Level I
American Depositary Receipt (ADR) program. In this program,
four Fresenius ADRs correspond to one Fresenius share
(before share split the ratio was 8 : 1). The ADRs are traded in
the OTCQX International Premier market segment.
ShARE SpliT AnD CApiTAl inCREASE fROM COMpAnY funDSThe price of Fresenius shares was significantly over € 100 in
the middle of the year 2014. In order to promote trading in
the stock and to make it even more appealing to broad groups
of investors, on May 16, 2014, the Annual General Meeting
approved a capital increase from Company funds by issuing
new shares. The conversion of capital reserves tripled the
subscribed capital and 360,341,088 new shares were issued.
Each shareholder received two additional shares for every
Fresenius share held with no additional payment required
(share split). The share split reduced the share price without
affecting the overall value for shareholders and took place
on August 1, 2014 (see the Corporate Governance Report,
page 12).
The total number of issued shares at the end of 2014 was
541,532,600 (December 31, 2013 adjusted for share split:
539,084,487 shares).
KEY DATA OF THE FRESENIUS SHARE
2014 2013 2012 2011 2010
Number of shares 541,532,600 539,084,487 4 534,564,780 4 489,712,008 4 487,350,270 4
Stock exchange quotation 1 in €
High 44.12 37.31 4 32.12 4 25.20 4 22.53 4
Low 35.00 27.30 4 24.02 4 19.96 4 13.93 4
Year-end quotation 43.16 37.20 4 29.03 4 23.82 4 20.91 4
Market capitalization 2 in million € 23,373 20,054 15,520 11,668 10,301
Total dividend distribution in million € 238.3 3 224.6 196.0 155.1 139.7
Dividend per share in € 0.44 3 0.42 4 0.37 4 0.32 4 0.29 4
Earnings per share in € 2.01 5 1.96 4, 5 1.81 4, 5 1.58 4, 6 1.36 4, 6
1 Xetra closing price on the Frankfurt Stock Exchange 2 Total number of ordinary shares multiplied by the respective Xetra year-end quotation on the Frankfurt Stock Exchange (ordinary and preference shares until January 28, 2011)3 Proposal4 Adjusted for share split 5 Net income attributable to shareholders of Fresenius SE & Co. KGaA; 2013 – 2014 before special items; 2012 before a non-taxable investment gain (€ 34 million)
and other one-time costs (€ 17 million) at Fresenius Medical Care as well as one-time costs (€ 29 million) related to the offer to the shareholders of Rhön-Klinikum AG6 Before effects of mark-to-market accounting of the Mandatory Exchangeable Bonds (MEB) and Contingent Value Rights (CVR) relating to the acquisition
of APP Pharmaceuticals
In addition to the share split, the number of shares increased
through the exercise of options under stock option plans.
Information on stock option plans can be found on pages 171
to 179 of the Notes to this Annual Report.
DiviDEnDIn 2014, Fresenius again delivered excellent financial results.
For the 22nd consecutive year, we are proposing to our share-
holders to increase the dividend by 6% per share, to € 0.44
(2013 adjusted for share split: € 0.42; pre split: € 1.25). The
DEVELOPMENT OF DIVIDENDS IN € 1
2005 2006 2007 2008 2009 2010 2011 2012 2013 2014 2
0.16
0.19
0.220.23
0.25
0.29
0.32
0.37
0.42
0.44
1 2005 – 2013 adjusted for share split2 Proposal

Fresenius Share
Fresenius Share10
total proposed dividend distribution will be € 238.3 million,
equivalent to 22% of Group net income before special items.
Based on the proposed dividend and the closing price at the
end of 2014, the dividend yield is 1.0%.
Fresenius shares are an attractive investment. Anyone who
invested € 1,000 five years ago and reinvested the dividends
would have increased their capital to € 3,337 as of Decem-
ber 31, 2014. That is an average annual return of 27% (before
expenses and taxes).
ShAREhOlDER STRuCTuREThe charts show the shareholder structure by the end of 2014.
The Else Kröner-Fresenius Foundation was the largest share-
holder of Fresenius SE & Co. KGaA, with 26.72% of the shares.
As of November 28, 2014, according to a notification under
the German Securities Trading Act (WpHG), BlackRock Inc.
held 5.95% of the shares. For further information on these
notifications, please see pages 147 f. of the Notes.
As of December 31, 2014, a shareholder survey identified
the ownership of about 93% of our subscribed capital. The
shareholder base of Fresenius is solid: a total of 587 institu-
tional investors held about 331.2 million shares or 61% of sub-
scribed capital; 24.6 million shares were identified as retail
holdings. The top-ten investors held about 22% of the share
capital. Our shares were mostly held by investors in Germany,
the United States, and Great Britain.
AnAlYST RECOMMEnDATiOnS The recommendations published by financial analysts are an
important guide for institutional as well as private investors
when making investment decisions. According to our survey, as
of February 24, 2015, we were rated with 15 “buy,” 9 “hold,”
and 0 “sell” recommendations.
The list of banks that provide regular analyst coverage of
Fresenius and their latest recommendations can be found
at www.fresenius.com.
invESTOR RElATiOnSOur Investor Relations activities are in accordance with the
transparency rules of the German Corporate Governance Code.
We communicate comprehensively, promptly, and openly
with private and institutional investors as well as financial ana-
lysts. The equal treatment of all market actors is very impor-
tant to us.
We intensified our dialog with the capital markets in
2014. In addition to its quarterly conference calls and web-
casts, Fresenius gave presentations in all the major European
and U.S. financial markets. We expanded our contacts with
institutional investors and analysts at 27 international inves-
tor conferences, 20 roadshows, and numerous one-on-one
meetings. We also organized field trips with banks, giving
investors and analysts the opportunity to discuss matters with
the Management Board.
We also continued the dialog with our private investors,
especially via the Internet. Our private shareholders can follow
live webcasts of the conference calls and can use our continu-
ously increased information offer on our website.
If you would like to contact us or find out about our 2015
financial calendar, please take a look at the last page of this
report or visit us at www.fresenius.com.
SHAREHOLDER STRUCTURE BY REGION
Other regions 4%
Rest of Europe 13%
Great Britain 15%
USA 17%
Not identified 7%
Germany 44%
SHAREHOLDER STRUCTURE BY INVESTORS
Retail holdings 5%
Else Kröner-Fresenius Foundation 27%
Not identified 7%
Institutional
investors 61%

Cor
pora
te G
over
nanc
e
Corporate Governance Corporate Governance Declaration 11
In this Corporate Governance Declaration, the Supervisory
Board of Fresenius SE & Co. KGaA and the Management
Board of the general partner of Fresenius SE & Co. KGaA,
Fresenius Management SE (Management Board), report,
pursuant to Section 289a of the German Commercial Code
(HGB), on corporate management and, pursuant to number
3.10 of the German Corporate Govern ance Code, on the
Corporate Governance at the Company (Corporate Gover
nance Report). The Corporate Governance Declaration
and the Corporate Governance Report are published on the
website at www.fresenius.com.
Corporate GovernanCe
DeClaration
GroUp ManaGeMent anD SUperviSion StrUCtUre anD Corporate BoDieS
GroUp ManaGeMent anD SUperviSion
StrUCtUre
The Company has the legal form of a KGaA (Kommanditgesell
schaft auf Aktien – partnership limited by shares). The annual
General Meeting, the Supervisory Board, and the general
partner Fresenius Management SE are the legal corporate
bodies. There have been no changes in the Group manage
ment and the super vision structure in the reporting period.
The chart on the following page provides an overview of the
Group structure.
The articles of association of Fresenius SE & Co. KGaA,
which, in addition to legal provisions, further define the respon
sibilities of the individual corporate bodies, can be down
loaded from our website www.fresenius.com.
ShareholDerS
The shareholders uphold their rights at the Annual General
Meeting, where they exercise their voting rights. Every ordi
nary share of Fresenius SE & Co. KGaA confers one vote.
None of the shares carry multiple or preferential voting rights.
We report in detail on our investor relations activities
on page 22 and in the section “Fresenius share” on page 10.
annUal General MeetinG
Our Annual General Meeting (AGM) was held on May 16,
2014, in Frankfurt / Main. Approximately 74% of the share
capital was represented.
During the AGM, the shareholders voted with a majority
of more than 99% of the votes cast for the proposal made by
the general partner and the Supervisory Board to increase
CORpORATE GOvERNANCE DEClARATIONAND REpORT. The Supervisory Board and the Management Board are committed to responsible management that is focused on achieving a sus-tainable increase in the value of the Company. Long-term corporate strategies, solid financial man-agement, strict adherence to legal and ethical business standards, and transparency in corporate communication are key factors.

Corporate G
overnance
Corporate Governance12
the 2013 dividend by 14% to € 1.25 per ordinary share. With
a majority of approximately 99% they approved a capital
increase from company funds by issuing new shares. The con
version of capital reserves tripled the subscribed capital from
company funds. Each shareholder received two additional
shares for each Fresenius share held with no additional pay
ment required (share split). In connection with the share split,
the shareholders approved the amendment of various exist
ing authorizations, including with regard to authorized capital,
the issue of option bearer bonds and / or convertible bonds,
and the purchase and use of own shares. The resolutions on
the approval of the Company’s annual financial statements,
on the approval of the adaptation of existing enterprise agree
ments, the resolution on a capital increase from Company
funds with issue of new shares, the adaptation of the autho
rized capital, the adaptation of the authorization to issue option
bonds and / or convertible bonds, the adaptation of the autho
rization to purchase and use own shares, as well as the autho
rization to use equity derivatives to purchase own shares
required the approval of the general partner, which was duly
given.
With regard to certain subject matters, legally required voting
right exclusions exist for the general partner and in some
instances for its sole shareholder, the Else Kröner Fresenius
Stiftung. These pertain, for example, to the appointment of
the Supervisory Board of Fresenius SE & Co. KGaA, the approval
of the actions of the general partner and the members of
the Supervisory Board, and the selection of the auditor. This
guarantees that the remaining shareholders retain the sole
authority to decide on these matters, especially those that per
tain to the super vision of management.
Documents and information on the Annual General Meet
ing as well as the voting results are available on our website
at www.fresenius.com.
ManaGeMent BoarD anD SUperviSorY
BoarD proCeDUreS
The responsibilities are distributed as follows in Fresenius
SE & Co. KGaA: The Management Board of the general partner
is responsible for conducting the business of Fresenius SE &
Co. KGaA. The Supervisory Board of Fresenius SE & Co. KGaA
supervises the management of the Company’s business by
the general partner.
STRuCTuRE FRESENIuS SE & CO. KGAA
Else KrönerFreseniusStiftung
Fresenius Management Se (general partner)
Fresenius Se & Co. KGaa
Annual General Meeting Fresenius Management SE
Annual General Meeting Fresenius SE & Co. KGaA
Supervisory Board Fresenius Management SE
Supervisory Board Fresenius SE & Co. KGaA
Free float
100%
reduced voting power 1
manages
73%27%
elects elects
supervises / appoints board
supervises management
1 For selected items no voting power, e. g., election of Supervisory Board Fresenius SE & Co. KGaA, discharge of general partner and Supervisory Board of Fresenius SE & Co. KGaA, election of the auditor

Cor
pora
te G
over
nanc
e
Corporate Governance Corporate Governance Declaration 13
General partner – Management and Supervisory BoardsThe general partner Fresenius Management SE, represented
by its Management Board, manages Fresenius SE & Co. KGaA
at its own responsibility and conducts its business. The Man
agement Board formulates the Company’s strategy, discusses
it with the Supervisory Boards of Fresenius Management SE
and of Fresenius SE & Co. KGaA, and oversees its implemen
tation. Its actions and decisions are aligned with the best
interests of Fresenius SE & Co. KGaA. The Management Board
is committed to increasing the value of the Company on a
sustainable basis. The rules of procedure for the Management
Board were established by the Supervisory Board of Fresenius
Management SE. They define the activities within the board
more specifically, especially with regard to the individual duties
and responsibilities of the members, matters reserved for the
full Management Board, and resolutions to be passed by the
full Management Board. The meetings of the Management
Board are convened as required, but at least once a month,
and are chaired by the Chairman of the Management Board
or, if he is incapacitated, by the Chief Financial Officer or, if
he is also incapacitated, by the Management Board member
present who is most senior in age. However, Management
Board meetings are usually held twice a month. The person
chairing the meeting decides the order in which the items on
the agenda are dealt with and the form in which the voting
is conducted. The Management Board passes its resolutions by
a simple majority of the votes cast or, outside its meetings,
by a simple majority of its members, except in cases where
mandatory provisions of law impose stricter requirements.
The Chairman of the Management Board has the casting vote
if a vote is tied. If the Chairman is incapacitated or absent,
the motion is deemed rejected if a vote is tied. The rules of
procedure for the Management Board also govern the rela
tions between the Management Board and the Supervisory
Board of the general partner as well as between the general
partner and the Supervisory Board of Fresenius SE & Co. KGaA,
and also matters that require approval of the general part
ner’s Supervisory Board.
The Management Board consists of seven members: the
Chairman, the Chief Financial Officer, the Chief legal and
Compliance Officer and labor Relations Director, as well as the
chief executive officers of the four business segments. This
ensures that the full Management Board is kept constantly
informed about important events, plans, developments, and
measures within the business segments. There are no Man
agement Board committees owing to Fresenius SE & Co. KGaA’s
role as an operating holding company. The Management Board
is listed on page 192 of the Annual Report.
As a European company (SE – Societas Europaea),
Fresenius Management SE has its own Supervisory Board.
It consists of six members, and its Chairman is Dr. Gerd
Krick. The Super visory Board appoints the members of the
Management Board of Fresenius Management SE and super
vises and advises the Management Board by conducting
the business. It established its rules of procedure following
the recommendation in number 5.1.3 of the Code.
The Supervisory Board members of Fresenius Manage
ment SE can be found on page 193 of the Annual Report.
the Supervisory Board of Fresenius Se & Co. KGaa
The Supervisory Board of Fresenius SE & Co. KGaA supervises
the management of the Company’s business by the general
partner. It supervises business operations to ensure that corpo
rate decisions are compliant, suitable, and financially sound.
The members of the Management Board of the general partner
are appointed by the Supervisory Board of Fresenius Man
agement SE, not – as already explained – by the Super visory
Board of Fresenius SE & Co. KGaA.
The Supervisory Board of Fresenius SE & Co. KGaA consists
of twelve members. Half of its members are elected by the
AGM. The proposals for the members of the Supervisory Board
primarily take account of the knowledge, ability, and expert
experience required to perform the tasks. The election pro
posal provided by the Supervisory Board will take into account
the Company’s international activities, potential conflicts of
interest, the number of independent members of the Super
visory Board within the meaning of number 5.4.2 of the Code,
and diversity. This also includes the aim to establish appro
priate female representation on a longterm basis. It is not in
the Company’s interest to generally limit the selection of quali
fied candidates. However, in the Company’s interest not to
limit the selection of qualified candidates in a general way, the
Supervisory Board confines itself to a general declaration of
intent and particularly refrains from an age limit. The statuto
rily required declaration of conformity concerning the Code

Corporate G
overnance
Corporate Governance14
accordingly includes a justified limitation. A Nomination Com
mittee has been instituted for election proposals for the
shareholders’ representatives. Its activities are aligned with
the provisions of law and the Code. The European works
council elects the employee representatives to the Super
visory Board of Fresenius SE & Co. KGaA.
The Supervisory Board includes what it deems to be an
appropriate number of independent members who do not
have any business or personal relationship with the Company,
its corporate bodies, a controlling shareholder, or a party
related to the latter that may give grounds for a material and
not merely temporary conflict of interest. The articles of
association of Fresenius SE & Co. KGaA regulate the details
with regard to the Supervisory Board’s election, constitution,
term of office, meetings and resolutions, and rights and duties.
They are published on our website at www.fresenius.com.
The Supervisory Board of Fresenius SE & Co. KGaA has
established its rules of procedure in accordance with number
5.1.3 of the Code. The Chairman of the Supervisory Board is
responsible for coordinating the activities of the Supervisory
Board, chairing the meetings, and representing its interests
externally. The Supervisory Board should convene once each
calendar quarter, and must convene twice each calendar half
year. The meetings are convened and chaired by the Chair
man or, if he is incapacitated, by a chairperson named by the
Chairman. The person chairing the meeting decides the order
in which the items on the agenda are dealt with and the form
in which the voting is conducted. unless other majorities are
mandatory by law, the Supervisory Board passes its resolu
tions by a simple majority of the votes submitted in the voting.
If a vote is tied, the Chairman has the casting vote or, if he
does not take part in the voting, the matter is decided by the
vote of the Deputy Chairman, who is a shareholder repre
sentative.
The Supervisory Board of Fresenius SE & Co. KGaA con
ducts its business in accordance with the provisions of law,
the articles of association of Fresenius SE & Co. KGaA, and its
rules of procedure. The Management Board of the general
partner Fresenius Management SE continuously informs the
Supervisory Board of the corporate development, planning,
and strategy. The Supervisory Board supervises the Company’s
management and, taking into account the auditor’s reports,
reviews the Group’s annual financial statements. Another im
portant part of the Supervisory Board’s activities is the work
conducted within the committees formed in accord ance with
the requirements of the German Stock Corporation Act and
the recommendations of the Code.
The members of the Supervisory Board keep themselves
regularly informed, through internal and external sources,
about the latest requirements with regard to their supervisory
activ ities. With the support of the Company, the Supervisory
Board at all times ensures that its members are suitably quali
fied, keep their professional knowledge up to date, and further
develop their judgment and expertise to the extent necessary
for the proper performance of their duties, including those
of the Supervisory Board committees. various external experts
as well as experts from the Company provide information
about important developments, for example about the strate
gic orientation of the Company in growth markets, relevant
new laws and precedents, or changes in the u.S. GAAp and
IFRS accounting and auditing standards.
The members of the Supervisory Board of Fresenius SE &
Co. KGaA can be found on pages 190 to 191 of the Annual
Report. On pages 184 to 189 of the Annual Report, the Super
visory Board reports on the main focuses of its activities and
those of its committees in 2014.
Supervisory Board efficiency evaluationThe Supervisory Board of Fresenius SE & Co. KGaA deliber
ated on the efficiency evaluation in accordance with number
5.6 of the Code at its meeting in March 2014.
It reviewed the efficiency of its activities through an open
discussion within the full Supervisory Board. A company-
specific questionnaire covering the salient points for a self
evaluation served as the basis for the discussion. Among
other things, this included the organization and structuring of
the meetings, the amount of information, and how this infor
mation was provided. The selfevaluation showed that the
Supervisory Board assesses its organization as well as its work
as efficient.
Cooperation between general partner and Supervisory Board of Fresenius Se & Co. KGaa
Good corporate governance requires trusting and efficient
cooperation between the Management and the Supervisory
Board. The Management Board of the general partner and the
Supervisory Board of Fresenius SE & Co. KGaA closely coop
erate for the benefit of the Company. Open communication is

Cor
pora
te G
over
nanc
e
Corporate Governance Corporate Governance Declaration 15
essential. The common goal is to sustainably increase the
company value in line with the corporate govern ance and com
pliance principles. The Management Board of the general
partner and the Supervisory Board of Fresenius SE & Co. KGaA
coordinate with each other, especially with regard to the
Company’s strategic focus. As the monitoring body, the Super
visory Board of Fresenius SE & Co. KGaA also needs to be
fully informed about operating performance and corporate
planning, as well as the risk situation, risk management, and
compliance. The Management Board of the general partner
provided this information in full and in compliance with its
duties.
CoMpoSition anD proCeDUreS oF the
SUperviSorY BoarD CoMMitteeS
The Supervisory Board of Fresenius SE & Co. KGaA forms two
permanent committees from among its members: the Audit
Committee, consisting of five members, and the Nomination
Committee, consisting of three members. The committee
members were elected for the duration of their term as a mem
ber of the Supervisory Board of Fresenius SE & Co. KGaA. In
accordance with the articles of association of Fresenius SE &
Co. KGaA, only members of the Audit Committee receive addi
tional compensation (Section 13 (2)). There is no personnel
Committee in the KGaA because the Supervisory Board of
Fresenius SE & Co. KGaA is not responsible for appointing mem
bers of the Management Board of the general partner or for
their contracts. Responsibility for these personnel matters lies
with the Supervisory Board of the general partner.
The provisions for the Supervisory Board of Fresenius SE &
Co. KGaA apply analogously to the committees. The commit
tees hold meetings as required. The meetings are convened by
the committee chairmen. They report during the following
Supervisory Board meeting about the work of the respective
committee. The rules of procedure for the committees are
regulated in the rules of procedure of the Supervisory Board
of Fresenius SE & Co. KGaA. The committees do not have their
own rules of procedure.
The members of the Supervisory Board’s committees are
listed on page 191 of the Annual Report.
audit Committeeprof. Dr. h. c. Roland Berger is the Chairman of the Audit
Committee. He has the required expertise in the fields of
accounting and auditing stated in Section 100 (5) of the Ger
man Stock Corporation Act (AktG). The Committee’s func
tion is, among other things, to prepare the Supervisory Board’s
approval of the financial statements – and the consolidated
financial statements – and the Supervisory Board’s proposal
to the AGM on the appointment of the auditor for the finan
cial statements, and to make a preliminary review of the pro
posal on the allocation of distributable profits. It also reviews
the quarterly reports before they are published and – follow
ing discussions with the Management Board – engages the
auditor for the financial statements (and concludes the agree
ment on the auditor’s fees), determines the main focuses of
the audit, and defines the auditor’s reporting duties in relation
to the Supervisory Board of Fresenius SE & Co. KGaA. Other
matters within its remit are to review the effectiveness of the
internal controls system, of the risk management system, of
the internal audit system, and of the compliance.
The Audit Committee consists of prof. Dr. h. c. Roland
Berger (Chairman), Konrad Kölbl, Dr. Gerd Krick, Gerhard
Roggemann, and Rainer Stein.
nomination CommitteeThe Nomination Committee proposes suitable candidates to
the Supervisory Board for the nominations it makes to the
AGM for the election of Supervisory Board members on the
shareholders’ side. It consists solely of shareholder represen
tatives. In making its proposals, the Nomination Committee
is guided by the requirements of the Code.
The Nomination Committee consists of Dr. Gerd Krick
(Chairman) and prof. Dr. h. c. Roland Berger. Dr. Gerhard
Rupprecht, who was killed in an accident in August 2014, was
also a member of the Nomination Committee.
Mediation CommitteeFresenius SE & Co. KGaA does not have a Mediation Commit
tee because the provisions of the German CoDetermination
Act that require such a committee do not apply to a partner
ship limited by shares and because the Code also does not
require such a committee.

Corporate G
overnance
Corporate Governance16
Joint CommitteeFor some matters, which are defined in further detail in Sec
tion 13c (1) of the articles of association of Fresenius SE &
Co. KGaA, the general partner requires the approval of the
Joint Committee if 40% of the consolidated sales, the consol
idated balance sheet total, and the consolidated profit are
affected by the matter. These include, for example, the dives
titure and acquisition of large investments and business units
or the divestiture of large business units from the assets
of Fresenius SE & Co. KGaA or a wholly owned company. The
approval of the Joint Committee is also required for certain
legal transactions between Fresenius SE & Co. KGaA or its affil
iates and the Else KrönerFreseniusStiftung.
Dr. Gerd Krick is a member of the Joint Committee.
Dr. Gerhard Rupprecht, who was killed in an accident in
August 2014, was a member until August 2014. Other
members are Dr. Dieter Schenk (Chairman) and Dr. Karl
Schneider, who were appointed by the general partner.
The Joint Committee did not meet in 2014.
Information on positions held by committee members on stat
utorily required supervisory boards and comparable domes
tic and foreign control bodies of other business enterprises can
be found on pages 190 to 193 of the Annual Report.
relevant DiSCloSUreS on Corporate GovernanCe praCtiCeSThe general partner, represented by its Management Board,
manages the Company’s business with the due care and dili
gence of a prudent and conscientious company director in
compliance with the provisions of the law, the articles of asso
ciation, the rules of procedure for the Management Board,
the resolutions passed by the full Management Board, and the
Supervisory Board of the general partner. Corporate gover
nance practices extending beyond the requirements of law are
defined in the Fresenius Code of Conduct. This Code of Con
duct contains the key principles and rules for our conduct
within the Company and in our relations with external partners
and with the public. We have published the Fresenius Code
of Conduct on our website at www.fresenius.com. The Code
of Conduct is binding for all Company employees and must
be complied with regarding any type of business relationship.
Our executives regard ensuring compliance with the princi
ples of the Code of Conduct as part of their managerial respon
sibilities.
CoMplianCe
Our “Forward Thinking Healthcare” model is the maxim for
corporate governance at Fresenius, determines our corporate
culture, and is an integral part of our daytoday work. It is
the basis for our corporate values reflected in the Fresenius
Code of Conduct. In this Code of Conduct, the Management
Board commits itself without limitation to binding principles
and rules for conduct within the Company and in its course
of the business. These include professionalism, honesty, and
integrity in relations with our patients, customers, suppliers,
employees, and shareholders. Furthermore, in its Code of Con
duct, Fresenius commits itself to fair competition and to deal
ing honestly with business partners and officials. Fresenius
expects all of its employees to comply with all applicable prin
ciples, laws, and regulations. Breaches will not be tolerated
and will be pursued.
Company guidelines and rules of procedure provide
specific details regarding the regulations included in the
Fresenius Code of Conduct. Their purpose is to help our
employees make the right decisions in their daytoday work.
The Fresenius Code of Conduct is complemented by the
codes of conduct and compliance programs of the Company’s
business segments. The latter comply with the requirements
that arise from their specific activities and are generally not
interfered with as long as they are not in conflict with the
Fresenius Code of Conduct. The Fresenius Code of Conduct
accordingly applies to all employees of the Fresenius Group.
Employees are obliged to report any noncompliance with
the Code, or if they become aware of a potential noncompli
ance, to their superiors or a compliance manager. The Code
of Conduct explicitly rules that no employee may incur any
disadvantage as a result of reporting a potential breach of the
Code. That is why breaches of the Code of Conduct may also
be reported anonymously to an email address set up for this
purpose. In various business segments breaches may also be
reported via a whistleblower hotline.

Cor
pora
te G
over
nanc
e
Corporate Governance Corporate Governance Declaration 17
Regular training, for example on the Code of Conduct in
general or on specific topics, such as anticorruption and cartel
law, helps our employees to comply with the Fresenius Code
of Conduct, the Company guidelines, and our rules of pro
cedure. Fresenius gives top priority to this training, which is
obligatory for all employees, including management. The
aim is to make participants aware of potential breaches of com
pliance and for them to learn to recognize and avoid risks
and conflicts of interest at an early stage. Since 2012, besides
participating in person, it has been possible to do the train
ing online.
The internal audit division audits business segments and
Group companies also in regard to compliancerelevant
issues. It discusses potential areas of risk prior to, and takes
account of them in, its audit. If the results of an audit reveal
any potential for improvement, this will be implemented jointly
with the Corporate Compliance department at Fresenius SE &
Co. KGaA.
Monitoring compliance is a central duty of management
at all levels. The Corporate Compliance department reports
to the Chief Compliance officer – the member of the Manage
ment Board responsible for legal Affairs, Compliance, and
Human Resources. It supports him in developing and imple
menting guidelines and procedures aimed at ensuring com
pliance with statutory regulations and the requirements of the
Fresenius Compliance program.
Each business segment has initiated compliance activities
and guidelines, and appointed a Chief Compliance Officer.
This officer is in charge of introducing, developing, and mon
itoring compliance. Depending on the organizational and
business structures, the Chief Compliance Officer is assisted by
additional compliance officers. The employees at the Cor
porate Compliance department similarly support and advise
the compliance officers of the business segments, as well as
at the regional and local levels.
The Compliance Steering Committee is the central com
mittee for discussing compliance issues. It comprises the
Chief Compliance Officer, the Chief Financial Officer, and the
heads of legal Affairs, Internal Audit, and the Corporate
Compliance department. It deals with the status of major proj
ects and discusses procedures concerning recognized risks
and the steps to be taken to identify breaches of compliance.
It also specifies procedures for dealing with any breach.
The supervisory bodies at Fresenius SE & Co. KGaA as well
as the general partner, Fresenius Management SE, are regu
larly informed – no less than once a year – about compliance
within the Group.
riSK ManaGeMent anD Control SYSteM
In our view, the responsible handling of risks is an element
of good corporate governance. Fresenius has a systematic
risk management and control system that allows the Manage
ment Board to make early identifications of risks and market
trends and to react promptly to relevant changes in our risk
profile. Our risk management and control system and efficiently
designed processes help to enhance the Company’s perfor
mance. Our risk management is reviewed as part of the annual
audit of the financial statements. The control system is regu
larly reviewed by the Management Board and the Internal
Audit division. Further information can be found on pages 83
to 84 of the Management Report.
The Internal Audit division supports the Management
Board as an independent function outside the Company’s day
today operations. The division assesses internal processes
from an objective viewpoint and with the necessary distance.
Our goal is to create added value for Fresenius, and thus to
help achieve organizational goals through improved internal
controls, optimized business processes, cost reduction, and
efficiency increases, as well as the prevention of corruption.
Fresenius Medical Care AG & Co. KGaA has its own inter
nal risk management and control system.
GerMan Corporate GovernanCe anD DeClaration oF ConForMitYThe German Corporate Governance Code aims to provide more
transparency for investors with regard to existing regula
tions covering the management and monitoring of companies.
Our valueenhancing strategies, as well as the majority of
the guidelines, recommendations, and suggestions for respon-
sible management contained in the Code, have been basic
components of our activities for many years. Corporate gover
nance. Extensive information can be found on our website
at www.fresenius.com.

Corporate G
overnance
Corporate Governance18
The Management Board of the general partner of Fresenius
SE & Co. KGaA, Fresenius Management SE, and the Supervi
sory Board of Fresenius SE & Co. KGaA have issued the required
Declaration of Conformity pursuant to Section 161 of the
German Stock Corporate Act (AktG) and have made it available
to shareholders on the website of the Company:
“Declaration by the Management Board of the general
partner of Fresenius Se & Co. KGaa, Fresenius Manage-
ment Se, and by the Supervisory Board of Fresenius Se &
Co. KGaa on the German Corporate Governance Code
pursuant to Section 161 German Stock Corporation act
(aktiengesetz).
The Management Board of the general partner of Fresenius
SE & Co. KGaA, Fresenius Management SE, (hereafter the Man
agement Board) and the Supervisory Board of Fresenius SE &
Co. KGaA declare that since the issuance of the previous dec
laration of conformity in December 2013, the recommenda
tions of the “Government Commission on the German Cor
porate Governance Code” published by the Federal Ministry
of Justice (Justizministerium) in the official section of the
Federal Gazette (Bundesanzeiger) (hereafter the Code) in the
version of May 13, 2013 as well as in the version of June 24,
2014 since its publication in the Federal Gazette have been
met and that the recommendations of the Code in the version
of June 24, 2014 will also be met in the future. Only the follow
ing recommendations of the Code in the versions of May 13,
2013 and June 24, 2014 have not been and will not be met:
▶ Code number 4.2.3 paragraph 2 sentence 6:
Caps regarding specific compensation amounts
pursuant to Code number 4.2.3 paragraph 2 sentence 6,
the amount of compensation for Management Board
members shall be capped, both overall and for variable
compensation components.
This recommendation is not met. The service agree
ments with members of the Management Board do not
provide for caps regarding specific amounts for all com
pensation components and accordingly not for caps
regarding specific amounts for the overall compensation.
The performanceoriented shortterm compensation
(the variable bonus) is capped. As regards stock options
and phantom stocks as compensation components with
longterm incentives, the service agreements with mem
bers of the Management Board do provide for a possibility
of limitation but not for caps regarding specific amounts.
Introducing caps regarding specific amounts in relation
to such stockbased compensation components would con
tradict the basic idea of the members of the Manage
ment Board participating appropriately in the economic
risks and opportunities of the company. Instead of that,
Fresenius pursues a flexible concept considering each
individual case. In situations of extraordinary developments
in relation to the stockbased compensation which are
not related to the performance of the Management Board,
the Supervisory Board may cap the stockbased com
pensation.
▶ Code number 4.2.3 paragraph 4: Severance payment cap
pursuant to Code number 4.2.3 paragraph 4, in conclud
ing Management Board contracts, care shall be taken to
ensure that payments made to a Management Board
member on premature termination of his / her contract, in
cluding fringe benefits, do not exceed the value of two
years’ compensation (severance payment cap) and com
pensate no more than the remaining term of the service
agreement. The severance payment cap shall be calculated
on the basis of the total compensation for the past full
financial year and if appropriate also the expected total
compensation for the current financial year.
These recommendations are not met insofar as the ser
vice agreements of the members of the Management
Board do not contain severance payment arrangements for
the case of premature termination of the contract and
consequently do not contain a limitation of any severance
payment amount to this extent. uniform severance pay
ment arrangements of this kind would contradict the con
cept practiced by Fresenius in accordance with the Ger
man Stock Corporation Act (Aktiengesetz) according to
which service agreements of the members of the Manage
ment Board are, in principle, concluded for the period
of their appointment. They would also not allow for a well
balanced assessment of the individual case.
▶ Code number 4.2.5 paragraph 3: presentation in the
compensation report
pursuant to Code number 4.2.5 paragraph 3, the presenta
tion of the compensation for each individual member of
the Management Board in the compensation report shall
present the maximum and minimum achievable com
pensation for variable compensation components by using
corresponding model tables. The presentation of the

Cor
pora
te G
over
nanc
e
Corporate Governance Corporate Governance Declaration 19
compensation granted pursuant to the description for
model table 1 shall also specify the target value or a com
parable value of an “average probability scenario” for
the oneyear variable compensation and for the deferrable
portions from oneyear variable compensations (deferrals).
Fresenius, in deviation from Code number 4.2.3 para
graph 2 sentence 6, does not provide for caps regarding
specific amounts for all variable compensation compo
nents and, therefore, does not provide for caps regarding
specific amounts for the overall compensation. There
are no target values or comparable values for the oneyear
variable compensation and for the deferrable portions
from oneyear variable compensations (deferrals). The one
year variable compensation is determined on the basis
of bonus curves applicable to several years. In this respect,
the compensation report cannot meet the recommenda
tions of the Code. Irrespective thereof, Fresenius will con
tinue to present its compensation system and the amounts
paid to members of the Management Board in its com
pensation report in a comprehensive and transparent man
ner. The compensation report will include tables relating
to the value of the benefits granted as well as to the allo
cation in the year under review which follow the structure
and largely also the specifications of the model tables.
▶ Code number 5.1.2 paragraph 2 sentence 3: age limit
for members of the Management Board
pursuant to Code number 5.1.2 paragraph 2 sentence 3,
an age limit shall be specified for members of the Man
agement Board. As in the past, Fresenius will refrain from
determining an age limit for members of the Manage
ment Board in the future. Complying with this recommen
dation would unduly limit the selection of qualified can
didates.
▶ Code number 5.3.2 sentence 3: independence of the
Chairman of the audit Committee
pursuant to Code number 5.3.2 sentence 3, the Chairman
of the Audit Committee shall be independent. pursuant
to Code number 5.4.2 sentence 2, a Supervisory Board
member is not to be considered independent in particular
if he / she has personal or business relations with the
company, its executive bodies, a controlling shareholder
or an enterprise associated with the latter which may
cause a substantial and not merely temporary conflict of
interests.
The Chairman of the Audit Committee of Fresenius SE &
Co. KGaA, prof. Dr. h. c. Roland Berger, is at the same
time a shareholder of Roland Berger Strategy Consultants
Holding GmbH and the Honorary Chairman of the Super
visory Board of Roland Berger Strategy Consultants Hold
ing GmbH. During the course of the 2014 financial year
(as in previous years), the Fresenius Group has made use
of consultancy services provided by Roland Berger Strategy
Consultants GmbH, an affiliated enterprise of the man
agement consultancy Roland Berger Strategy Consultants
Holding GmbH. The Management Board and Supervi
sory Board believe that these business relations neither
constitute a substantial or longterm conflict of interest,
nor do they interfere with the tasks of the Chairman of the
Audit Committee. As a precaution, however, a deviation
from Code number 5.3.2 sentence 3 is being declared,
given the legal views taken with regards to the question of
independence.
▶ Code number 5.4.1 paragraph 2 and paragraph 3:
Specification of concrete objectives regarding the
composition of the Supervisory Board and their
consideration when making recommendations to
the competent election bodies
pursuant to code number 5.4.1 paragraph 2 and paragraph
3, the Supervisory Board shall specify concrete objectives
regarding its composition and, when making recommen
dations to the competent election bodies, take these objec
tives into account. The objectives specified by the Super
visory Board and the status of the implementation shall be
published in the Corporate Governance Report. These
recommendations are not met. The composition of the
Supervisory Board needs to be aligned to the enterprise’s
interest and has to ensure the effective supervision and
consultation of the Management Board. Hence, it is a mat
ter of principle and of prime importance that each mem
ber is suitably qualified. When discussing its recommenda
tions to the competent election bodies, the Supervisory
Board will take into account the international activities of
the enterprise, potential conflicts of interest, the number
of independent Supervisory Board members within the

Corporate G
overnance
Corporate Governance20
FUrther inForMation on
Corporate GovernanCe
DiverSitYThe Management Board takes diversity into account when
filling executive positions. An appropriate degree of female
representation is especially important when selecting equally
qualified candidates. The commitment to diversity within
the Fresenius Group is underlined by the fact that 30% of our
executive officers are women.
Further information on diversity as well as personnel
development and personnel management are included in the
Group Management Report on pages 52 f.
leGal relationShipS with MeMBerS oF the Corporate BoDieSThe general partner and the Supervisory Board of Fresenius
SE & Co. KGaA have a duty to act in the best interests of the
Company. In performing their activities, they do not pursue
personal interests or bestow unjustified benefits on others.
Any sideline activities or transactions with the Company by
members of the corporate bodies must be reported to, and
approved by, the Supervisory Board. The Supervisory Board
of Fresenius SE & Co. KGaA reports to the AGM on any con
flicts of interest and how they are dealt with.
Fresenius SE & Co. KGaA reports the following relation
ships existing between Fresenius group companies and
companies in which members of the Supervisory Board of
Fresenius SE & Co. KGaA or members of the Supervisory
or Management Board of Fresenius Management SE held an
executive or other function in 2014.
prof. Dr. med. D. Michael Albrecht is a member of the
Supervisory Board of Fresenius SE & Co. KGaA and medical
director and spokesman for the management board of the
university Hospital Carl Gustav Carus Dresden, as well as a
member of the supervisory board of the university Hospital
in Aachen and he was a member of the supervisory boards
of the university Hospitals in Magdeburg and Rostock. The
Fresenius Group maintains business relations with these hos
pitals in the ordinary course of business under customary
conditions.
meaning of Code number 5.4.2, and diversity. This includes
the aim to establish an appropriate female representation
on a longterm basis.
In the enterprise’s interest not to limit the selection of
qualified candidates in a general way, the Supervisory
Board, however, confines itself to a general declaration of
intent and particularly refrains from an age limit.
▶ Code number 5.4.6 paragraph 2 sentence 2: a perfor-
mance-related compensation of the members of the
Supervisory Board oriented toward sustainable growth
of the enterprise
pursuant to Code number 5.4.6 paragraph 2 sentence 2,
a performancerelated compensation, if promised to the
members of the Supervisory Board, shall be oriented
toward sustainable growth of the enterprise. The variable
compensation of the Supervisory Board members of
Fresenius SE & Co. KGaA does not have a calculation basis
of several years and is, therefore, not oriented, in this
sense, toward the sustainable growth of the enterprise.
Instead, the Supervisory Board receives a performance
related compensation which depends on the dividend pur
suant to Section 13 paragraph 1 of the Articles of Asso
ciation of Fresenius SE & Co. KGaA. This compensation
model has been in existence since the year 1995. It con
tinues to bring forth an adequate compensation of the
Supervisory Board in line with the law and with the inter
ests of the shareholders.
Bad Homburg, December 2014
Management Board of the general partner of
Fresenius SE & Co. KGaA, Fresenius Management SE,
and Supervisory Board of Fresenius SE & Co. KGaA”
In accordance with Section 161 para. 2 AktG and number 3.10
sentence 3 of the Code, this declaration and all past decla
rations are published on our website at www.fresenius.com.

Cor
pora
te G
over
nanc
e
Corporate Governance Further information on Corporate Governance 21
Klauspeter Müller is a member of the Supervisory Boards
of Fresenius Management SE and of Fresenius SE & Co. KGaA
and the Chairman of the Supervisory Board of Commerz
bank AG, with which the Fresenius Group maintains business
relationships under customary conditions. In 2014, the
Fresenius Group paid € 1.1 million in total to Commerzbank AG
for cap ital market financing and for carrying out the share
split. Dr. Gerhard Rupprecht was a member of the Supervisory
Boards of Fresenius Management SE and Fresenius SE &
Co. KGaA and of the supervisory board of Allianz France SA. In
2014, the Fresenius Group paid € 11.6 million for insurance
premiums to Allianz under customary conditions.
Consultancy or other service relationships between mem
bers of the Supervisory Board and the Company existed with
regard to Dr. Dieter Schenk, Deputy Chairman of the Super
visory Board of Fresenius Management SE. Dr. Schenk is a
partner in the law firm Noerr llp. The entities of the interna
tionally acting law firm Noerr provided legal advice to the
Fresenius Group in 2014. In 2014, the Fresenius Group paid
or processed for payment in December a total of about € 1.8
million to the law firm Noerr (2013: € 1.5 million). This cor
responds to 1% of the total amount paid by the Fresenius
Group for services and legal advice in 2014 (2013: 1%). Not
included in the amount paid or processed for payment are such
payments made in 2014 that had already been processed for
payment in 2013 and have therefore already been reported for
the 2013 fiscal year. Of the total amount for fiscal year 2014,
about € 0.7 million were attributable to services for Group com
panies not related to the business segment Fresenius Medi
cal Care. The services rendered for Group companies of the
business segment Fresenius Medical Care require a sepa
rate approval by the Supervisory Boards of Fresenius Medical
Care Management AG and Fresenius Medical Care AG & Co.
KGaA. The Supervisory Board of Fresenius Management SE
has examined the mandate closely, and has approved this
mandate. Dr. Schenk did not take part in the voting. The ap
proval was made on the basis of a written submission to the
Supervisory Board, which listed all individual mandates and
their corresponding individual invoices. In 2014, the invoices
were paid after the Supervisory Board gave its approval. The
Supervisory Board of Fresenius SE & Co. KGaA dealt with the
amounts for legal services paid to the law firm Noerr in rela
tion to the amounts paid to other law firms.
Further consulting or service contracts between Super
visory Board members and the Company existed in the case
of prof. Dr. h. c. Roland Berger, who is both a member of
the Supervisory Boards of Fresenius Management SE and of
Fresenius SE & Co. KGaA, and is at the same time a partner
in the management consultancy firm Roland Berger Strategy
Consultants Holding GmbH. The Fresenius Group paid € 3.1
million to Roland Berger Group companies affiliated with this
company for services rendered in 2014 (2013: € 2.9 million).
The Super visory Boards of Fresenius Management SE and
Fresenius SE & Co. KGaA closely examined this mandate in the
2013 fiscal year. Both Supervisory Boards approved this
mandate. prof. Dr. h. c. Berger abstained from each voting. The
respective approvals were made on the basis of a written
submission to the Supervisory Board and prior to the payment
of the invoices for the services. Work on this mandate given
in the 2013 fiscal year was completed in the fiscal year 2014.
The payments mentioned in the above section “legal
relationships with members of the corporate bodies” are net
amounts. In addition, vAT was paid.
There are no other consulting or service contracts – neither
directly nor indirectly – between Supervisory Board members
and the Company.
Fresenius has disclosed the information on related parties
in its 2014 quarterly reports and on page 179 of the Annual
Report.
DiSCloSUreS on DireCtorS’ DealinGS anD ShareholDinGS in 2014Members of the Management and Supervisory Boards of
the general partner, members of the Supervisory Board of
Fresenius SE & Co. KGaA, other executive officers, and per
sons closely related to them are required, pursuant to Section
15a of the German Securities Trading Act (WpHG), to dis
close purchases and sales of Fresenius SE & Co. KGaA’s shares

Corporate G
overnance
Corporate Governance22
and financial instruments based on them (directors’ deal
ings). Directors’ dealings in 2014 are disclosed in the table
above.
pursuant to number 6.3 of the Code, ownership of shares
of the Company and financial instruments based on them
must be disclosed by Management Board and Supervisory
Board members if more than 1% of the shares issued by the
Company are held either directly or indirectly. None of the
Management or Supervisory Board members of the general
partner or of the Supervisory Board of Fresenius SE & Co.
KGaA directly or indirectly holds more than 1% of the shares
issued by Fresenius or any related financial instruments.
The members of the Management and Supervisory Boards
of Fresenius Management SE and the members of the Super
visory Board of Fresenius SE & Co. KGaA together hold 0.90%
of the shares of Fresenius SE & Co. KGaA outstanding as of
December 31, 2014, in the form of shares or related financial
instruments and stock options under the Fresenius SE & Co.
KGaA stock option plans. 0.43% are held by members of the
Management Board of Fresenius Management SE, 0.47%
by members of the Supervisory Board of Fresenius Manage
ment SE, and 0.46% by members of the Supervisory Board
of Fresenius SE & Co. KGaA. Due to the fact that some persons
are members of both Supervisory Boards, the amount of
shares or related financial instruments and stock options held
by the Boards of Fresenius SE & Co. KGaA and Fresenius
Management SE in total is smaller than the cumulative hold
ings of the three Boards as reported herein.
There were no notifications that the shareholdings of
members of the Management and Supervisory Boards had
reached, exceeded, or fallen below the reporting thresholds
stipulated in the German Securities Trading Act.
tranSparenCY anD CoMMUniCationFresenius adheres to all recommendations under number 6 of
the Code. Transparency is guaranteed by continuous com
munication with the public. In that way we are able to validate
and deepen the trust given to us. Of particular importance
to us is the equal treatment of all recipients. To ensure that
all market participants receive the same information at the
same time, we post all important publications on our website
at www.fresenius.com. We report in detail on investor rela
tions activities on page 10 of the Annual Report.
FinanCial aCCoUntinG anD reportinGFresenius prepares its consolidated financial statements in
accordance with the united States Generally Accepted
Accounting principles (u.S. GAAp). Fresenius, as a publicly
traded company based in a member country of the European
union, is required to prepare and publish its consolidated
financial statements in accord ance with International Finan
cial Reporting Standards (IFRS) pursuant to Section 315a of
the German Commercial Code (HGB). Our largest subsidiary,
Fresenius Medical Care, prepares its financial statements in
accordance with u.S. GAAp. We therefore publish our consol
idated financial statements in accordance with u.S. GAAp
and our statutory consolidated financial statements in accor
dance with IFRS. This enables us to disclose our financial
results to all our shareholders in a comparable and transpar
ent manner.
DIRECTORS’ DEAlINGS
2014 Name position Quantity price in € 1Total volume
in € Type of transaction
September 8 Dr. u. M. Schneider Management Board 66,580 19.21 1,278,836.48 Stock option exercise 2
September 2 Dr. u. M. Schneider Management Board 65,000 18.60 1,208,896.59 Stock option exercise 2
August 5 R. Berger Supervisory Board 101,703 37.01 3,764,170.41 Sale
June 20 Dr. u. M. Schneider Management Board 12,900 75.77 977,423.51 Stock option exercise 2
June 6 Dr. u. M. Schneider Management Board 12,900 76.55 987,499.30 Stock option exercise 2
June 3 S. Sturm Management Board 25,800 76.23 1,966,828.75 Stock option exercise 2
May 28 S. Sturm Management Board 21,930 69.45 1,523,047.01 Stock option exercise 2
May 27 Dr. u. M. Schneider Management Board 12,900 75.77 977,416.69 Stock option exercise 2
May 21 Dr. u. M. Schneider Management Board 12,900 74.84 965,423.90 Stock option exercise 2
March 18 Dr. G. Krick Supervisory Board 1 100,000.00 100,000.00purchase of Convertible Bond
of Fresenius SE & Co. KGaA
February 28 Dr. K. Schneider Supervisory Board 3 5,000 111.05 555,230.00 Sale
1 price rounded to two decimals2 Exercise of stock options on Fresenius shares of the stock option plan and sale of the shares (cash settlement)3 Fresenius Management SE

Cor
pora
te G
over
nanc
e
Corporate Governance Further information on Corporate Governance 23
Compensation RepoRtThe compensation report summarizes the main elements of the
compensation system for the members of the Management
Board of Fresenius Management SE as the general partner of
Fresenius SE & Co. KGaA, and in this regard notably explains
the amounts and structure of the compensation paid to the
Management Board as well as the principles for determining
the compensation of the Supervisory Board and the amounts
of the compensation. The compensation report is part of the
Management Report of the annual financial statements and
the annual consolidated financial statements of Fresenius SE &
Co. KGaA. The compensation report is prepared on the basis
of the recommendations of the German Corporate Governance
Code as well as under consideration of the declaration of
conformity of Fresenius SE & Co. KGaA of December 2014, and
also includes the disclosures as required pursuant to the
applicable statutory regulations, notably in accordance with
the German Commercial Code.
Compensation of the manaGement BoaRd
The entire Supervisory Board of Fresenius Management SE
is responsible for determining the compensation of the Man-
agement Board. The Supervisory Board is assisted in this
task by a personnel committee. In the fiscal year 2014, the
acting personnel committee was composed of Dr. Gerd Krick,
Dr. Dieter Schenk, and Dr. Karl Schneider.
The objective of the compensation system is to enable the
members of the Management Board to participate reason-
ably in the sustainable development of the Company’s business
and to reward them based on their duties and performance
as well as their successes in managing the Company’s eco-
nomic and financial position giving due regard to the peer
environment.
The compensation of the Management Board is, as a
whole, performance-based and was composed of three ele-
ments in the fiscal year 2014:
▶ non-performance-based compensation (fixed compensa-
tion and fringe benefits)
▶ short-term performance-based compensation (one-year
variable compensation)
▶ components with long-term incentive effects (several-
year variable compensation comprising stock options,
share-based compensation with cash settlement (phan-
tom stocks), and postponed payments of the one-year
variable compensation)
In addition, there are pension commitments for the seven
members of the Management Board.
The design of the individual components is based on the
following criteria:
The fixed compensation was paid in 12 monthly install-
ments in the fiscal year 2014. Mr. Rice Powell was paid a part
of his fixed compensation from Fresenius Medical Care North
America in 24 installments. Moreover, the members of the
Management Board received additional benefits consisting
mainly of insurance premiums, the private use of a company
car, special payments such as rent supplements and reim-
bursement of certain other charges, tuition fees, as well as con-
tributions to pension and health insurance.
The performance-based compensation will also be granted
for the fiscal year 2014 as a short-term cash component (one-
year variable compensation) and as a compensation component
with long-term incentive effects (stock options, share-based
compensation with cash settlement (phantom stocks), and
postponed payments of the one-year variable compensation).
The amount of the one-year variable compensation in each
case is dependent on certain target parameters oriented on the
net income attributable to Fresenius SE & Co. KGaA and / or
to the relevant business segments being achieved. In the case
of the members of the Management Board with functional
responsibility for the entire Group – such members being
Dr. Schneider, Mr. Sturm, and Dr. Götz – the amount of the one-
year variable compensation is based in its entirety on the
respective net income attributable to Fresenius SE & Co. KGaA
(after deduction of noncontrolling interest). For Mr. Henriksson
and Dr. De Meo, approximately half of the amount of the
one-year variable compensation depends on the development
of the net income attributable to Fresenius SE & Co. KGaA
and for the remainder on the development of the net income of
the business segment (in each case after deduction of non-
controlling interest) for which the respective member of the
Management Board is responsible. Approximately half of the
amount of the one-year variable compensation of Dr. Wastler
is oriented on the net income attributable to Fresenius SE &
Co. KGaA (after deduction of non controlling interest) as well
as on the net income before tax and extraordinary income /
expenditures of the VAMED group. Mr. Rice Powell receives
his compensation exclusively from Fresenius Medical Care.
Furthermore, the Supervisory Board may grant members of
the Management Board a discretionary bonus for extraordi-
nary performance.
For the fiscal year 2014, the Supervisory Board of
Fresenius Medical Care Management AG has granted such
discretionary bonus to Mr. Rice Powell in the total amount
of € 376 thousand.

Corporate G
overnance
Corporate Governance24
For the fiscal years 2014 and 2013, the amount of cash payment of the Management Board of the general partner of
Fresenius SE & Co. KGaA consisted of the following:
Non-performance-basedcompensation
Performance-basedcompensation
Cash compensation(without long-term
incentive components)
Salary Other 2 Bonus
€ in thousands 2014 2013 2014 2013 2014 2013 2014 2013
Dr. Ulf M. Schneider 990 990 92 64 1,454 1,402 2,536 2,456
Dr. Francesco De Meo 550 550 19 19 1,015 998 1,584 1,567
Dr. Jürgen Götz 415 415 35 34 697 690 1,147 1,139
Mats Henriksson 550 550 175 217 943 956 1,668 1,723
Rice Powell 1 941 941 151 169 737 3 373 1,829 1,483
Stephan Sturm 550 550 41 40 929 921 1,520 1,511
Dr. Ernst Wastler 470 470 37 35 671 660 1,178 1,165
total 4,466 4,466 550 578 6,446 6,000 11,462 11,044
1 Mr. Rice Powell received his compensation only from Fresenius Medical Care, of which Fresenius SE & Co. KGaA held around 31% of the total subscribed capital. As member of the Management Board of Fresenius Management SE, his compensation has to be included in the compensation report of the Fresenius Group.
2 Includes insurance premiums, private use of a company car, contributions to pension and health insurance, as well as other benefits3 Includes a discretionary bonus for fiscal year 2014 granted to Mr. Rice Powell in the amount of € 376 thousand
In the fiscal year 2014, the one-year variable compensation,
excluding the payment to Mr. Rice Powell, amounted to € 5,709
thousand. This equals 95% of the total one-year variable
compensation of € 5,980 thousand. The remaining part in an
amount of € 271 thousand was converted into a component
based on a multi-year assessment and the payment was post-
poned by two years.
To ensure that the overall system of compensation of the
members of the Management Board is oriented towards
long-term and sustained corporate development, the compen-
sation system provides that the share of long-term variable
compensation components is at least equal in its amount to
half of the total variable compensation components granted
to the respective member of the Management Board. As a
means of ensuring this minimum ratio in favor of the compen-
sation components oriented towards the long term, it is
expressly provided that the Supervisory Board may determine
that the one-year variable compensation to be paid as a rule
annually is converted (pro rata) into a variable compensation
com ponent based on a multi-year assessment, in order to
also take account of any negative developments within the
assessment period. This is done in such a way that the matu-
rity of the yearly one-year variable compensation earned
on a variable basis is postponed at the discretion of the Super-
visory Board, either on a pro rata basis or in its entirety, by
two years. At the same time, it is ensured that any payment is
made to the member of the Management Board after expiration
of such multi-year period only if (i) no subsequent adjustment
of the decisive (i. e., adjusted by extraordinary effects) net
income attributable to Fresenius SE & Co. KGaA (after deduc-
tion of noncontrolling interest) beyond an amount equal to
a tolerance range of 10% is made, and (ii) the amount of net
income attributable to Fresenius SE & Co. KGaA (adjusted
for extraordinary effects) in the two relevant sub sequent years
is not substantially less than the net income attributable to
Fresenius SE & Co. KGaA (adjusted by extra ordinary effects,
after deduction of noncontrolling interest) of the respective
preceding fiscal years. In the event of the aforementioned con-
ditions for payment being missed only to a minor and / or
partial extent, the Supervisory Board may resolve on a corre-
sponding pro rata payment of the converted portion of the
one-year variable compensation. No interest is payable on the
converted one-year variable compensation claim from the
time when it first arises until the time of its effective payment.
In this way, the one-year variable compensation can be con-
verted pro rata or in its entirety into a genuine variable com-
pensation component on a multi-year assessment basis, which
also participates in any negative developments during the
relevant assessment period.
In the fiscal year 2014, benefits under LTIP 2013 of
Fresenius SE & Co. KGaA, and for Mr. Rice Powell, benefits
under LTIP 2011 of Fresenius Medical Care AG & Co. KGaA,
were granted as another component with long-term incentive
effect. Such benefits consist, on the one hand, of share-
based compensation with cash settlement (phantom stocks)
and, on the other hand, of stock options on the basis of

Cor
pora
te G
over
nanc
e
Corporate Governance Further information on Corporate Governance 25
the Stock Option Plan 2013 of Fresenius SE & Co. KGaA and,
for Mr. Rice Powell, on the basis of the Stock Option Plan
2011 of Fresenius Medical Care AG & Co. KGaA. The LTIP 2013
is available both for members of the Management Board
and other executives. In accordance with the division of pow-
ers under stock corporation law, grants to members of the
Management Board are made by the Supervisory Board of
Fresenius Management SE, and grants to other executives
are made by the Management Board. The number of stock
options and phantom stocks for Management Board mem-
bers to be granted is determined by the Supervisory Board
at the Supervisory Board’s own discretion, provided that gen-
erally all Management Board members receive the same
amount of stock options and phantom stocks, with the excep-
tion of the Chairman of the Management Board who receives
double the respective amount of stock options and phan-
tom stocks. At the time of the grant, the participants in LTIP
2013 may elect whether they wish to receive stock options
and phantom stocks in a ratio of 75 : 25, or in a ratio of 50 : 50.
Exercise of the stock options and the phantom stocks
granted under LTIP 2013 of Fresenius SE & Co. KGaA is subject
to several conditions, such as expiry of a four-year waiting
period, observance of vesting periods, achievement of the
specified performance target, and continuance of the service
or employment relationship. The vested stock options can
be exercised within a period of four years. The vested phantom
stocks are settled on March 1 of the year following the end
of the waiting period.
The amount of the cash settlement pursuant to the Phan-
tom Stock Plan 2013 is based on the volume-weighted average
market price of the share of Fresenius SE & Co. KGaA during
the three months preceding the exercise date.
The respective performance target has been reached if
the adjusted consolidated net income of the Company (net
income attributable to the shareholders of the Company) has
increased by a minimum of 8% per year in com parison to
the previous year within the waiting period, after adjustment
for foreign currency effects. The performance target has also
been achieved if the average annual growth rate of the adjusted
consolidated net income of the Company during the four-year
waiting period is at least 8%, adjusted for foreign-currency
effects. If, with respect to one or more of the four reference
periods within the waiting period, neither the adjusted con-
solidated net income of the Company has increased by a mini-
mum of 8% per year in comparison to the previous year,
after adjustment for foreign currency effects, nor the average
annual growth rate of the adjusted consolidated net income
of the Company during the four-year waiting period is at
least 8%, adjusted for foreign-currency effects, the respective
granted stock options and phantom stocks are forfeited on
a pro-rata basis according to the proportion of the perfor-
mance target that has not been achieved within the waiting
period, i. e., by one fourth, by two fourths, by three fourths,
or completely.
The principles of LTIP 2013 of Fresenius SE & Co. KGaA
and of LTIP 2011 of Fresenius Medical Care AG & Co. KGaA
are described in more detail in note 33 of the notes of the
Fresenius Group, Stock options.
The previous share-based compensation component with
cash settlement (performance shares) has been combined
with the current share-based compensation component with
cash settlement (phantom stocks). The members of the Man-
agement Board, with the exception of Mr. Rice Powell, were
granted an entitlement to further share-based compensation
with cash settlement (further phantom stocks, previously per-
formance shares) in the equivalent value of € 100 thousand
per Management Board member in the fiscal year 2014. With
regard to the performance target and waiting period, the
same conditions that pertain to the phantom stocks granted
under LTIP 2013 apply to them.
For the fiscal years 2014 and 2013, the number and value
of stock options issued, the value of the share-based com-
pensation with cash settlement (phantom stocks), and the
value of the postponed performance-based compensation is
shown in the following table. For the statements on stock
options, the stock split 2014 was reflected with a ratio of 1 : 3.
The stated values of the stock options granted to mem-
bers of the Management Board in the fiscal year 2014 corre-
spond to their fair value at the time of grant, namely a value
of € 8.28 (2013: € 9.08) per stock option of Fresenius SE & Co.
KGaA and € 9.01 (2013: € 8.92) per stock option of Fresenius
Medical Care AG & Co. KGaA. The exercise price of the granted
stock options of Fresenius SE & Co. KGaA was € 36.92 (2013:
€ 33.10).
The fair value of the phantom stocks granted to members
of the Management Board in the fiscal year 2014 corre-
sponds to a value at the time of grant of € 34.18 (2014: € 32.65)
per phantom stock of Fresenius SE & Co. KGaA and € 46.26
(2013: € 44.93) per phantom stock of Fresenius Medical Care
AG & Co. KGaA.

Corporate G
overnance
Corporate Governance26
At the end of the fiscal year 2014, subsequent to the stock
split, the members of the Management Board held a total of
2,345,904 (2013: 2,460,474) stock options and convertible
bonds (together referred to as stock options) of Fresenius SE &
Co. KGaA and 407,737 (2013: 361,050) of Fresenius Medical
Care AG & Co. KGaA.
LONG-TERM INCENTIVE COMPONENTS
Stock options 1
Postponed payment of the
one-year variable compensation
Share-based compensation with
cash settlement (phantom stocks) Total
Number Value, € in thousands Value, € in thousands Value, € in thousands Value, € in thousands
2014 2013 2014 2013 2014 2013 2014 2013 2014 2013
Dr. Ulf M. Schneider 90,000 90,000 745 817 0 0 897 864 1,642 1,681
Dr. Francesco De Meo 45,000 45,000 373 409 143 108 499 482 1,015 999
Dr. Jürgen Götz 45,000 45,000 373 409 0 0 499 482 872 891
Mats Henriksson 45,000 45,000 373 409 71 65 499 482 943 956
Rice Powell 74,700 74,700 673 666 0 0 351 358 1,024 1,024
Stephan Sturm 45,000 45,000 373 409 57 30 499 482 929 921
Dr. Ernst Wastler 45,000 45,000 373 409 0 0 499 482 872 891
total 389,700 389,700 3,283 3,528 271 203 3,743 3,632 7,297 7,363
1 Stock options that were granted in 2014 and 2013 under the Fresenius SE & Co. KGaA stock option plan. Mr. Rice Powell received stock options under the Fresenius Medical Care stock option plan.
The development and the status of the stock options of the Management Board in the fiscal year 2014
are shown in the following table:
Dr. Ulf M.Schneider
Dr. FrancescoDe Meo
Dr. JürgenGötz
MatsHenriksson
RicePowell 1
StephanSturm
Dr. ErnstWastler total 2
Options outstanding on January 1, 2014
number 887,220 340,854 215,280 175,800 361,050 509,400 331,920 2,460,474
average exercise price in € 21.16 23.55 26.64 25.39 45.47 20.17 23.67 22.40
Options granted during fiscal year
number 90,000 45,000 45,000 45,000 74,700 45,000 45,000 315,000
exercise price in € 36.92 36.92 36.92 36.92 49.93 36.92 36.92 36.92
Options exercised during fiscal year
number 286,380 0 0 0 0 143,190 0 429,570
average exercise price in € 14.89 12.30 14.03
average stock price in € 37.22 36.67 37.04
Options forfeited during fiscal year
number 0 0 0 0 28,013 0 0 0
average exercise price in € 52.48
Options outstanding on December 31, 2014
number 690,840 385,854 260,280 220,800 407,737 411,210 376,920 2,345,904
average exercise price in € 25.81 25.11 28.42 27.74 45.80 24.74 25.25 25.89
average remaining life in years 4.5 4.3 5.1 5.1 4.4 4.2 4.3 4.5
range of exercise prices in €
17.83 to 36.92
17.83 to 36.92
23.76 to 36.92
17.83 to 36.92
31.97 to 57.30
17.83 to 36.92
17.83 to 36.92
17.83 to 36.92
Exercisable options on December 31, 2014
number 340,560 210,714 85,140 82,800 174,300 236,070 201,780 1,157,064
average exercise price in € 20.80 20.48 23.76 20.80 37.57 20.33 20.54 20.82
1 Mr. Rice Powell holds stock options under the Fresenius Medical Care stock option plan.2 Only stock options of Fresenius SE & Co. KGaA, excluding stock options of Mr. Rice Powell

Cor
pora
te G
over
nanc
e
Corporate Governance Further information on Corporate Governance 27
The following table shows the total compensation of the Management Board of the general partner of
Fresenius SE & Co. KGaA for the years 2014 and 2013:
Cash compensation (without long-term
incentive components)Long-term
incentive components
Total compensation (including long-term
incentive components)
€ in thousands 2014 2013 2014 2013 2014 2013
Dr. Ulf M. Schneider 2,536 2,456 1,642 1,681 4,178 4,137
Dr. Francesco De Meo 1,584 1,567 1,015 999 2,599 2,566
Dr. Jürgen Götz 1,147 1,139 872 891 2,019 2,030
Mats Henriksson 1,668 1,723 943 956 2,611 2,679
Rice Powell 1,829 1,483 1,024 1,024 2,853 2,507
Stephan Sturm 1,520 1,511 929 921 2,449 2,432
Dr. Ernst Wastler 1,178 1,165 872 891 2,050 2,056
total 11,462 11,044 7,297 7,363 18,759 18,407
The stock options and the entitlement to a share-based com-
pensation (phantom stocks) can be exercised only after the
expiry of minimum terms (vesting periods). Their value is
recognized over the vesting period as expense in the respec-
tive fiscal year. The expenses attributable to the fiscal years
2014 and 2013 are stated in the following table.
ExPENSES FOR LONG-TERM INCENTIVE COMPONENTS
Stock options
Share-based compensation with cash settlement
(phantom stocks)Total expenses for
share-based compensation
€ in thousands 2014 2013 2014 2013 2014 2013
Dr. Ulf M. Schneider 864 902 518 94 1,382 996
Dr. Francesco De Meo 432 451 334 86 766 537
Dr. Jürgen Götz 432 451 334 86 766 537
Mats Henriksson 298 239 228 11 526 250
Rice Powell 176 325 435 441 611 766
Stephan Sturm 432 451 334 86 766 537
Dr. Ernst Wastler 432 451 334 86 766 537
total 3,066 3,270 2,517 890 5,583 4,160
The short-term performance-based compensation is limited
in its amount. As regards stock options and phantom stocks,
there are contractually agreed limitation possibilities. This
makes it possible to adequately take account in particular of
those extraordinary developments that are not in any relevant
proportion to the performance of the Management Board.
Under the compensation system, the amount of the fixed
and the total compensation of the members of the Manage-
ment Board was, and will be, assessed giving particular regard
to the relevant comparison values of other DAx companies
and similar companies of comparable size and performance
from the relevant industrial sector.
Commitments to memBeRs of the
manaGement BoaRd in the event of the
teRmination of theiR appointment
There are individual contractual pension commitments for
the Management Board members Dr. Ulf M. Schneider,
Dr. Francesco De Meo, Dr. Jürgen Götz, and Mr. Stephan Sturm
based on their serv ice agreements with the general partner
of Fresenius SE & Co. KGaA. The Management Board member
Dr. Ernst Wastler has a pension commitment of VAMED AG,
Vienna. The Management Board member Mats Henriksson has
a pension commitment of Fresenius Kabi AG. The Manage-
ment Board member Mr. Rice Powell has received an individ-
ual contractual pension commitment from Fresenius Medical
Care Management AG. Furthermore, he has acquired non-
forfeitable entitlements from participating in pension plans

Corporate G
overnance
Corporate Governance28
for employees of Fresenius Medical Care North America, and
during the fiscal year 2014, he participated in the U.S.-based
401(k) Savings Plan. This plan generally enables employees
in the United States to invest part of their gross income into
retirement plans. With regard to these pension commitments,
the Fresenius Group had pension obligations of € 24,381
thousand as of December 31, 2014 (2013: € 15,963 thou-
sand). The additions to pension liability in the fiscal year
2014 amounted to € 8,418 thousand (2013: € 3,277 thou-
sand).
The pension commitments are as follows:
€ in thousandsAs of
January 1, 2014 Additionsas of
december 31, 2014
Dr. Ulf M. Schneider 2,812 1,482 4,294
Dr. Francesco De Meo 1,195 717 1,912
Dr. Jürgen Götz 1,090 592 1,682
Mats Henriksson 1,752 1,841 3,593
Rice Powell 4,493 2,161 6,654
Stephan Sturm 1,640 837 2,477
Dr. Ernst Wastler 2,981 788 3,769
total 15,963 8,418 24,381
Each of the pension commitments provides for a pension and
survivor benefit, depending on the amount of the most recent
fixed compensation, from the 63rd year of life (or 65th year
for Mr. Rice Powell), or, in the case of termination because of
professional or occupational incapacity, from the time of end-
ing active work.
The pension’s starting percentage of 30% of the last fixed
compensation increases with every full year of service as a
Management Board member by 1.5 percentage points, 45%
being the attainable maximum.
Current pensions increase according to legal requirements
(Section 16 of the German law to improve company pension
plans, BetrAVG).
Thirty percent of the gross amount of any post-retirement
income from an occupation of the Management Board mem-
ber is offset against the pension for professional or occupa-
tional incapacity.
In the event of the death of one of the Management Board
members, the widow receives a pension equivalent to 60%
of the pension entitlement accruing at the time of death. In
addition, own legitimate children, respectively, in the individ-
ual case, own children of the deceased Management Board
member’s wife who have been adopted by the deceased Man-
agement Board member, receive an orphan’s pension equiv-
alent to 20% of the pension entitlement accruing at the time
of death until completion of their vocational training, but at
the most until the age of 25 years. However, all orphans’ pen-
sions and the widow’s pension are capped at an aggregate
90% of the Management Board member’s pension entitlement.
If a Management Board member’s service as a member
of the Management Board of Fresenius Management SE ends
before the age of 63 years (or 65 years for Mr. Rice Powell)
for reasons other than professional or occupational incapacity,
the rights to the said pension ben efits vest, but the pension
payable upon the occurrence of a pensionable event is reduced
pro rata according to the actual length of service as a Man-
agement Board member compared to the potential length of
service until the age of 63 years (or 65 years for Mr. Rice
Powell).
The pension commitment for Dr. Ernst Wastler provides
for a normal pension, an early retirement pension, a profes-
sional incapacity pension, and a widow’s and orphan’s pen-
sion. The normal pension is payable at the earliest at the age
of 60 years and the early retirement pension at the earliest
at the age of 55 years. The pension benefits are equivalent to
1.2% per year of service based on the last fixed compensa-
tion, with a cap of 40%. The widow’s pension (60%) and the
orphan’s pension (20% each) are capped in aggregate at
not more than Dr. Ernst Wastler’s pension entitlement at the
time of death. Pensions, retirement, and other benefits from
third parties are set off against the pension benefit.
The Management Board member Mr. Mats Henriksson
has solely a pension commitment of Fresenius Kabi AG from
the period of his previous service. This pension commitment

Cor
pora
te G
over
nanc
e
Corporate Governance Further information on Corporate Governance 29
remained unaffected by the service agreement with Fresenius
Management SE, beginning on January 1, 2013. It is based
on the pension policy of the Fresenius companies from Janu-
ary 1, 1988, and provides for retirement, incapacity, and wid-
ow’s and orphan’s pensions. It does not set forth any deduction
of other income or pension benefits. The widow’s pension
amounts to 60% of the incapacity or retirement pension to be
granted at the time of death; the orphan’s pension amounts
to 10% (half-orphans) or 20% (orphans) of the incapacity or
retirement pension to be granted at the time of death. The
total entitlements of widows and orphans are limited to 100%
of Mr. Mats Henriksson’s pension entitlements.
A post-employment non-competition covenant was agreed
upon for all Management Board members. If such a cove-
nant becomes applicable, the Management Board members
receive a waiting allowance that is generally equivalent to
half of the respective annual fixed compensation for each year
of respective application of the non-competition covenant,
up to a maximum of two years.
The service agreements of the Management Board mem-
bers do not contain any explicit provision for the event of a
change of control.
misCellaneous
All members of the Management Board have received individ-
ual contractual commitments for the continuation of their
compensation in the event of sickness for a maximum period
of 12 months, provided that, after six months of sickness-
related absence, any insurance benefits that may be paid are
to be deducted from such continued compensation. In the
event of death of a member of the Management Board, the
surviving dependents will receive three monthly payments
after the month during which the death occurred, at maxi-
mum, however, until the expiry of the respective employment
agreement.
During the fiscal year 2014, no loans or advance pay-
ment on future compensation components were granted to
any member of the Management Board of Fresenius Man-
agement SE.
Fresenius SE & Co. KGaA undertook to indemnify the Manage-
ment Board members, to the legally permitted extent, against
any claim that may be asserted against them due to their ser-
vice for the Company and its affiliated Group com panies to the
extent that such claims exceed their liability under German
law. To cover such obligations, the Company purchased a
directors & officers insurance, the deductible complying with
the requirements of stock corporation law. The indemnifica-
tion covers the period during which the respective member of
the Management Board holds office as well as any claim in
this connection after termination of the service on the Manage-
ment Board.
Based on pension commitments to former members of the
Management Board, € 1,049 thousand were paid in the fiscal
year 2014 (2013: € 1,064 thousand) and € 494 thousand (2013:
€ 550 thousand) were paid to Dr. Ben Lipps as a result of a
consultancy agreement entered into with Fresenius Medical
Care Management AG. The benefit obligation for these per-
sons amounted to € 18,465 thousand (2013: € 17,389 thou-
sand).
taBles displayinG the value of Benefits GRanted and alloCationsThe German Corporate Governance Code provides that com-
pensation reports for fiscal years beginning after Decem-
ber 31, 2013, shall include information for each member of the
Management Board on the benefits granted and allocations
made, as well as on the pension expenses for the year under
report. The model tables provided in the appendix to the
German Corporate Governance Code shall be used to present
the information.
The following tables include information on the value of
benefits granted as well as on the allocations made. They
adhere to the structure and, to a large extent, the standards
of the model tables of the German Corporate Governance
Code:

Corporate G
overnance
Corporate Governance30
Benefits grantedValue € in thousands
dr. ulf m. schneiderChairman of the Management Board
Board member since May 28, 2003
dr. franceso de meoCEO Fresenius Helios
Board member since January 1, 2008
dr. Jürgen GötzChief Legal and Compliance Officer,
and Labor Relations DirectorBoard member since July 1, 2007
mats henrikssonCEO Fresenius Kabi
Board member since January 1, 2013
Rice powellCEO Fresenius Medical Care
Board member since January 1, 2013
stephan sturmChief Financial Officer
Board member since January 1, 2005
dr. ernst WastlerCEO Fresenius Vamed
Board member since January 1, 2008
20142014min.
2014max. 2013 2014
2014min.
2014max. 2013 2014
2014min.
2014max. 2013 2014
2014min.
2014max. 2013 2014
2014min.
2014max. 2013 2014
2014min.
2014max. 2013 2014
2014min.
2014max. 2013
non-performance-based compensation
Fixed compensation 990 990 990 990 550 550 550 550 415 415 415 415 550 550 550 550 941 941 941 941 550 550 550 550 470 470 470 470
Fringe benefits 92 92 92 64 19 19 19 19 35 35 35 34 175 175 175 175 151 151 151 169 41 41 41 40 37 37 37 37
total non-performance-based compensation 1,082 0 0 1,054 569 0 0 569 450 0 0 449 725 0 0 767 1,092 1,092 1,092 1,110 591 0 0 590 507 0 0 505
performance-based compensation
One-year variable compensation 2 1,454 1,200 1,750 1,402 1,015 750 1,250 998 697 250 750 690 943 750 1,250 956 1,929 3 212 2,239 3 1,553 929 850 1,150 921 671 350 750 660
Multi-year variable compensation / components with long-term incentive effect
Postponed one-year variable compensation 0 0 n / a 143 0 n / a 108 0 0 n / a 71 0 n / a 65 57 0 n / a 30 0 0 n / a
Stock Option Plan 2013 (part of LTIP 2013) (5-year term) 745 0 n / a 817 373 0 n / a 409 373 0 n / a 409 373 0 n / a 409 373 0 n / a 409 373 0 n / a 409
Phantom stocks (part of LTIP 2013) (5-year term) 797 0 n / a 764 399 0 n / a 382 399 0 n / a 382 399 0 n / a 382 399 0 n / a 382 399 0 n / a 382
Further phantom stocks 100 100 100 100 100 100 100 100 100 100 100 100
Components with long-term incentive effect 1,642 0 n / a 1,681 1,015 0 n / a 999 872 0 n / a 891 943 0 n / a 956 1,024 1 71 n / a 1,024 929 0 n / a 921 872 0 n / a 891
total non-performance-based and performance-based compensation 4,178 2,282 n / a 4,137 2,599 1,319 n / a 2,566 2,019 700 n / a 2,030 2,611 1,475 n / a 2,679 4,045 1,375 n / a 3,687 2,449 1,441 n / a 2,432 2,050 857 n / a 2,056
Service cost 234 234 234 201 201 201 201 176 136 136 136 118 120 120 120 84 429 429 429 405 182 182 182 159 92 92 92 83
value of benefits granted 4,412 2,516 n / a 4,338 2,800 1,520 n / a 2,742 2,155 836 n / a 2,148 2,731 1,595 n / a 2,763 4,474 1,804 n / a 4,092 2,631 1,623 n / a 2,591 2,142 949 n / a 2,139
1 Mr. Rice Powell was granted stock options and phantom stocks from the stock option program of Fresenius Medical Care as follows: in 2014: € 120 thousand from the Share Based Award – New Incentive Bonus Plan 2010, € 673 thousand from the Long Term Incentive Program 2011 – Stock Option Plan 2011; in 2013: € 124 thousand from the Share Based Award – New Incentive Bonus Plan 2010, € 666 thousand from the Long Term Incentive Program 2011 – Stock Option Plan and € 234 thousand from the Long Term Incentive Program 2011 – Phantom Stock Plan 2011.
2 For the one-year variable compensation, there are no target values or comparable values. The one-year variable compensation is determined on the basis of bonus curves applicable for several years. For this reason, the allocation from the one-year variable remuneration is stated.
3 Includes a discretionary bonus for fiscal year 2014 granted to Mr. Rice Powell in the amount of € 376 thousand

Cor
pora
te G
over
nanc
e
Corporate Governance Further information on Corporate Governance 31
Benefits grantedValue € in thousands
dr. ulf m. schneiderChairman of the Management Board
Board member since May 28, 2003
dr. franceso de meoCEO Fresenius Helios
Board member since January 1, 2008
dr. Jürgen GötzChief Legal and Compliance Officer,
and Labor Relations DirectorBoard member since July 1, 2007
mats henrikssonCEO Fresenius Kabi
Board member since January 1, 2013
Rice powellCEO Fresenius Medical Care
Board member since January 1, 2013
stephan sturmChief Financial Officer
Board member since January 1, 2005
dr. ernst WastlerCEO Fresenius Vamed
Board member since January 1, 2008
20142014min.
2014max. 2013 2014
2014min.
2014max. 2013 2014
2014min.
2014max. 2013 2014
2014min.
2014max. 2013 2014
2014min.
2014max. 2013 2014
2014min.
2014max. 2013 2014
2014min.
2014max. 2013
non-performance-based compensation
Fixed compensation 990 990 990 990 550 550 550 550 415 415 415 415 550 550 550 550 941 941 941 941 550 550 550 550 470 470 470 470
Fringe benefits 92 92 92 64 19 19 19 19 35 35 35 34 175 175 175 175 151 151 151 169 41 41 41 40 37 37 37 37
total non-performance-based compensation 1,082 0 0 1,054 569 0 0 569 450 0 0 449 725 0 0 767 1,092 1,092 1,092 1,110 591 0 0 590 507 0 0 505
performance-based compensation
One-year variable compensation 2 1,454 1,200 1,750 1,402 1,015 750 1,250 998 697 250 750 690 943 750 1,250 956 1,929 3 212 2,239 3 1,553 929 850 1,150 921 671 350 750 660
Multi-year variable compensation / components with long-term incentive effect
Postponed one-year variable compensation 0 0 n / a 143 0 n / a 108 0 0 n / a 71 0 n / a 65 57 0 n / a 30 0 0 n / a
Stock Option Plan 2013 (part of LTIP 2013) (5-year term) 745 0 n / a 817 373 0 n / a 409 373 0 n / a 409 373 0 n / a 409 373 0 n / a 409 373 0 n / a 409
Phantom stocks (part of LTIP 2013) (5-year term) 797 0 n / a 764 399 0 n / a 382 399 0 n / a 382 399 0 n / a 382 399 0 n / a 382 399 0 n / a 382
Further phantom stocks 100 100 100 100 100 100 100 100 100 100 100 100
Components with long-term incentive effect 1,642 0 n / a 1,681 1,015 0 n / a 999 872 0 n / a 891 943 0 n / a 956 1,024 1 71 n / a 1,024 929 0 n / a 921 872 0 n / a 891
total non-performance-based and performance-based compensation 4,178 2,282 n / a 4,137 2,599 1,319 n / a 2,566 2,019 700 n / a 2,030 2,611 1,475 n / a 2,679 4,045 1,375 n / a 3,687 2,449 1,441 n / a 2,432 2,050 857 n / a 2,056
Service cost 234 234 234 201 201 201 201 176 136 136 136 118 120 120 120 84 429 429 429 405 182 182 182 159 92 92 92 83
value of benefits granted 4,412 2,516 n / a 4,338 2,800 1,520 n / a 2,742 2,155 836 n / a 2,148 2,731 1,595 n / a 2,763 4,474 1,804 n / a 4,092 2,631 1,623 n / a 2,591 2,142 949 n / a 2,139
1 Mr. Rice Powell was granted stock options and phantom stocks from the stock option program of Fresenius Medical Care as follows: in 2014: € 120 thousand from the Share Based Award – New Incentive Bonus Plan 2010, € 673 thousand from the Long Term Incentive Program 2011 – Stock Option Plan 2011; in 2013: € 124 thousand from the Share Based Award – New Incentive Bonus Plan 2010, € 666 thousand from the Long Term Incentive Program 2011 – Stock Option Plan and € 234 thousand from the Long Term Incentive Program 2011 – Phantom Stock Plan 2011.
2 For the one-year variable compensation, there are no target values or comparable values. The one-year variable compensation is determined on the basis of bonus curves applicable for several years. For this reason, the allocation from the one-year variable remuneration is stated.
3 Includes a discretionary bonus for fiscal year 2014 granted to Mr. Rice Powell in the amount of € 376 thousand

Corporate G
overnance
Corporate Governance32
Allocations Value € in thousands
dr. ulf m. schneiderChairman of the Management Board
Board member since May 28, 2003
dr. franceso de meoCEO Fresenius Helios
Board member since January 1, 2008
dr. Jürgen GötzChief Legal and Compliance Officer,
and Labor Relations DirectorBoard member since July 1, 2007
mats henrikssonCEO Fresenius Kabi
Board member since January 1, 2013
Rice powellCEO Fresenius Medical Care
Board member since January 1, 2013
stephan sturmChief Financial Officer
Board member since January 1, 2005
dr. ernst WastlerCEO Fresenius Vamed
Board member since January 1, 2008
2014 2013 2014 2013 2014 2013 2014 2013 2014 2013 2014 2013 2014 2013
non-performance-based compensation
Fixed compensation 990 990 550 550 415 415 550 550 941 941 550 550 470 470
Fringe benefits 92 64 19 19 35 34 175 217 151 169 41 40 37 35
total non-performance-based compensation 1,082 1,054 569 569 450 449 725 767 1,092 1,110 591 590 507 505
performance-based compensation
One-year variable compensation 2 1,454 1,402 1,015 998 697 690 943 956 737 2 373 929 921 671 660
Multi-year variable compensation / components with long-term incentive effect
Postponed one-year variable compensation 0 174 29 131 0 98 0 0 0 0 79 208 0 95
Stock Option Plan 2003 (5-year term)
Issue 2005 3,008 443
Issue 2006 1,503 805 1,523 650
Issue 2007 2,488 56 288
Stock Option Plan 2008 (5-year term)
Issue 2008 1,246 1,019 1,086 1,164 1,084
Issue 2009 3,907 1,558 1,625 871 1,967 1,771
Issue 2010 1,405
total multi-year variable com-pensation / components with long-term incentive effect 6,395 2,749 29 3,438 0 4,404 0 871 399 1 1,172 3,569 4,172 0 3,948
Other 0 0 0 0 0 0 0 0 0 0 0 0 0 0
total non-performance-based and performance-based compensation 8,931 5,205 1,613 5,005 1,147 5,543 1,668 2,594 2,228 2,655 5,089 5,683 1,178 5,113
Service cost 234 201 201 176 136 118 120 84 429 405 182 159 92 83
allocation 9,165 5,406 1,814 5,181 1,283 5,661 1,788 2,678 2,657 3,060 5,271 5,842 1,270 5,196
1 Mr. Rice Powell had this allocation from stock options from the Fresenius Medical Care Stock Option Program: in 2014: € 399 thousand from the Share Based Award – New Incentive Bonus Plan 2010 issue 2010; in 2013: € 317 thousand from the Share Based Award – New Incentive Bonus Plan 2009 issue 2009 and € 855 thousand from the stock option plan 2006, issue 2007.
2 Includes a discretionary bonus for fiscal year 2014 granted to Mr. Rice Powell in the amount of € 376 thousand

Cor
pora
te G
over
nanc
e
Corporate Governance Further information on Corporate Governance 33
Allocations Value € in thousands
dr. ulf m. schneiderChairman of the Management Board
Board member since May 28, 2003
dr. franceso de meoCEO Fresenius Helios
Board member since January 1, 2008
dr. Jürgen GötzChief Legal and Compliance Officer,
and Labor Relations DirectorBoard member since July 1, 2007
mats henrikssonCEO Fresenius Kabi
Board member since January 1, 2013
Rice powellCEO Fresenius Medical Care
Board member since January 1, 2013
stephan sturmChief Financial Officer
Board member since January 1, 2005
dr. ernst WastlerCEO Fresenius Vamed
Board member since January 1, 2008
2014 2013 2014 2013 2014 2013 2014 2013 2014 2013 2014 2013 2014 2013
non-performance-based compensation
Fixed compensation 990 990 550 550 415 415 550 550 941 941 550 550 470 470
Fringe benefits 92 64 19 19 35 34 175 217 151 169 41 40 37 35
total non-performance-based compensation 1,082 1,054 569 569 450 449 725 767 1,092 1,110 591 590 507 505
performance-based compensation
One-year variable compensation 2 1,454 1,402 1,015 998 697 690 943 956 737 2 373 929 921 671 660
Multi-year variable compensation / components with long-term incentive effect
Postponed one-year variable compensation 0 174 29 131 0 98 0 0 0 0 79 208 0 95
Stock Option Plan 2003 (5-year term)
Issue 2005 3,008 443
Issue 2006 1,503 805 1,523 650
Issue 2007 2,488 56 288
Stock Option Plan 2008 (5-year term)
Issue 2008 1,246 1,019 1,086 1,164 1,084
Issue 2009 3,907 1,558 1,625 871 1,967 1,771
Issue 2010 1,405
total multi-year variable com-pensation / components with long-term incentive effect 6,395 2,749 29 3,438 0 4,404 0 871 399 1 1,172 3,569 4,172 0 3,948
Other 0 0 0 0 0 0 0 0 0 0 0 0 0 0
total non-performance-based and performance-based compensation 8,931 5,205 1,613 5,005 1,147 5,543 1,668 2,594 2,228 2,655 5,089 5,683 1,178 5,113
Service cost 234 201 201 176 136 118 120 84 429 405 182 159 92 83
allocation 9,165 5,406 1,814 5,181 1,283 5,661 1,788 2,678 2,657 3,060 5,271 5,842 1,270 5,196
1 Mr. Rice Powell had this allocation from stock options from the Fresenius Medical Care Stock Option Program: in 2014: € 399 thousand from the Share Based Award – New Incentive Bonus Plan 2010 issue 2010; in 2013: € 317 thousand from the Share Based Award – New Incentive Bonus Plan 2009 issue 2009 and € 855 thousand from the stock option plan 2006, issue 2007.
2 Includes a discretionary bonus for fiscal year 2014 granted to Mr. Rice Powell in the amount of € 376 thousand

Corporate G
overnance
Corporate Governance34
Compensation of the supeRvisoRy BoaRd
The compensation of the Supervisory Board is determined
by the Annual General Meeting and is subject to the provi-
sions contained in Section 13 of the articles of association of
Fresenius SE & Co. KGaA. Each member of the Supervisory
Board shall receive a fixed compensation of € 13 thousand.
The members of the Audit Committee of Fresenius SE &
Co. KGaA receive an additional € 10 thousand each and the
Chairman of the committee a further € 10 thousand. For each
full fiscal year, the remuneration increases by 10% for each
percentage point that three times the dividend (or the dividend
up to registration of the capital increase from company’s
funds on August 1, 2014) paid on each ordinary share for that
year (gross dividend according to the resolution of the Annual
General Meeting) exceeds 3.6% of the amount equal to the
subscribed capital divided by the number of non-par value
shares; residual amounts are interpolated. The Chairman re-
ceives twice this amount and the deputies to the Chairman
one and a half times the amount of a Supervisory Board mem-
ber. All members of the Supervisory Board receive appro-
priate compensation for costs of travel and accommodation
incurred in connection with their duties as members of the
Supervisory Board. Fresenius SE & Co. KGaA provides to the
members of the Supervisory Board insurance coverage in
an adequate amount (relating to their function) with an excess
equal to those of the Management Board.
If a member of the Supervisory Board of Fresenius SE & Co.
KGaA is, at the same time, a member of the Supervisory
Board of the general partner Fresenius Management SE and
receives remuneration for his service on the Supervisory
Board for Fresenius Management SE, the remuneration shall
be reduced by half. The same applies with respect to the
additional part of the remuneration for the Chairman or one of
his deputies if they are, at the same time, the Chairman or one
of his deputies on the Supervisory Board of Fresenius Man-
agement SE. If the deputy of the Chairman of the Super visory
Board of Fresenius SE & Co. KGaA is, at the same time, the
Chairman of the Supervisory Board of Fresenius Manage-
ment SE, he shall not receive remuneration for his service as
Deputy Chairman of the Supervisory Board of Fresenius SE &
Co. KGaA. According to Section 7 of the articles of associa-
tion of Fresenius SE & Co. KGaA, the remuneration of the Super-
visory Board of Fresenius Management SE was charged to
Fresenius SE & Co. KGaA.
For the years 2014 and 2013, the compensation for the
members of the Supervisory Boards of Fresenius SE & Co.
KGaA and Fresenius Management SE, including compensa-
tion for committee services, was as follows:

Cor
pora
te G
over
nanc
e
Corporate Governance Further information on Corporate Governance 35
Fixed compensationCompensation for
committee servicesVariable
compensationTotal
compensation
Fresenius SE & Co. KGaA
Fresenius Management SE
Fresenius SE & Co. KGaA
Fresenius Management SE
Fresenius SE & Co. KGaA
Fresenius Management SE
€ in thousands 2014 2013 2014 2013 2014 2013 2014 2013 2014 2013 2014 2013 2014 2013
Dr. Gerd Krick 13 13 13 13 10 10 20 20 167 158 167 158 390 372
Dr. Dieter Schenk 0 0 19 19 0 0 10 10 0 0 250 237 279 266
Niko Stumpfögger 19 19 0 0 0 0 0 0 250 237 0 0 269 256
Prof. Dr. med. D. Michael Albrecht 13 13 0 0 0 0 0 0 167 158 0 0 180 171
Prof. Dr. h. c. Roland Berger 7 7 6 6 20 20 0 0 83 79 84 79 200 191
Dario Ilossi 13 13 0 0 0 0 0 0 167 158 0 0 180 171
Konrad Kölbl 13 13 0 0 10 10 0 0 167 158 0 0 190 181
Klaus-Peter Müller 7 7 6 6 0 0 0 0 83 79 84 79 180 171
Dieter Reuß 13 13 0 0 0 0 0 0 167 158 0 0 180 171
Gerhard Roggemann 13 13 0 0 10 10 0 0 167 158 0 0 190 181
Dr. Gerhard Rupprecht († August 8, 2014) 8 13 4 6 0 0 0 0 101 158 50 79 163 256
Dr. Karl Schneider 0 0 13 13 0 0 10 10 0 0 167 158 190 181
Stefan Schubert 13 13 0 0 0 0 0 0 167 158 0 0 180 171
Rainer Stein 13 13 0 0 10 10 0 0 167 158 0 0 190 181
total 145 150 61 63 60 60 40 40 1,853 1,817 802 790 2,961 2,920
diReCtoRs & offiCeRs insuRanCe Fresenius SE & Co. KGaA has concluded a consequential loss
liability insurance policy (D & O insurance), on an excess
amount basis, for the members of the Management Board and
the Super visory Board of the general partner of Fresenius SE &
Co. KGaA and for the Supervisory Board of Fresenius SE &
Co. KGaA as well as for all representative bodies of affiliates
in Germany and elsewhere. The D & O policy applies through-
out the world and runs until the end of June 2015. The policy
covers the legal defense costs of a member of a representative
body when a claim is made and, where relevant, any dam-
ages to be paid that are covered by the policy.

Business S
egments
Business Segments36
Fresenius medical care. In 2014, Fresenius Medical Care again achieved strong organic sales growth of 5%. We have significantly expanded our portfolio with acquisitions in the field of Care Coordination.
Fresenius medical care is the world’s leading provider of
dialysis products and services. When the kidney function of
patients with this disease fails, dialysis takes over the vital
task of cleansing the blood from toxins and surplus water. in
dialysis, two treatment methods are distinguished: hemodial
ysis (Hd) and peritoneal dialysis (Pd). With Hd, the patient’s
blood is cleansed with a dialyzer, or artificial kidney, a pro
cess that is controlled by a hemodialysis machine. in the case
of Pd, the patient’s peritoneum is used as a filter to cleanse
the blood.
as a vertically integrated company, Fresenius medical care
offers services and dialysis products along the entire dialysis
value chain in over 120 countries. Fresenius medical care
has a worldwide network of 40 production sites. We further
expanded our leading market position in 2014: We treated
286,312 patients at 3,361 dialysis clinics worldwide and the
number of treatments increased by 6% to 42.7 million.
BUSINESS DEVELOPMENTFresenius medical care increased sales by 8% to us$ 15,832
million in 2014 (2013: us$ 14,610 million). Organic sales
growth was 5%. acquisitions contributed 5%, divestitures
had no effect on sales. adverse currency effects reduced
sales by 2%.
eBiT was us$ 2,255 million (2013: us$ 2,256 million). The
eBiT margin was 14.2% (2013: 15.4%). The margin decrease
is mainly due to the rebasing of medicare’s reimbursement
rate in the united states.
net income 1 was us$ 1,045 million (2013: us$ 1,110
million).
NOrTh AMErIcA
north america remained Fresenius medical care’s largest
business region. in 2014, sales grew by 9% to us$ 10,500 mil
lion compared to us$ 9,606 million in 2013. Organic sales
growth was 5%. acquisitions contributed 5%, divestitures
had no effect on sales.
1 net income attributable to shareholders of Fresenius medical care aG & co. KGaa
sales BY reGiOn
us$ in millions 2014 2013 change
currency translation
effects
% of total Fresenius
medical caresales
north america 10,500 9,606 9% 0% 66%
europe / middle east / africa 3,072 3,023 2% 2% 20%
asiaPacific 1,357 1,104 23% 3% 9%
latin america 836 843 1% 17% 5%
corporate 67 34 97% 0% 0%
Total 15,832 14,610 8% 2% 100%

Bus
ines
s S
egm
ents
Business Segments Fresenius medical care 37
eBiT was us$ 1,643 million (2013: us$ 1,623 million). The
eBiT margin was 15.6% (2013: 16.9%). in 2014, the average
revenue per treatment in the united states was us$ 368 com
pared to us$ 359 in 2013. The average cost per treatment in
the united states increased from us$ 293 in 2013 to us$ 303
in 2014.
INTErNATIONAL
in 2014, the international segment, comprising the business
regions Europe / Middle East / Africa, Asia-Pacific, and Latin
America, achieved excellent results. sales in the interna
tional segment increased by 6% to us$ 5,265 million (2013:
us$ 4,970 million). Organic sales growth was 6%. acquisi
tions con tributed 6%, divestitures reduced sales growth by
1%, while currency translation had a negative effect of 5%.
eBiT in the international segment was us$ 970 million (2013:
us$ 897 million). The eBiT margin was 18.4% (2013: 18.1%).
AcQUISITIONSin 2014, Fresenius medical care expanded its care coordina
tion activities. care coordination is an expansion of the com
pany’s renal services for its patients and includes, e. g. vascular
care and the coordination of outpatient and inpatient treat
ments, as well as intensive care by specialized doctors. With
the acquisition of a majority stake of sound inpatient Physi
cians and cogent Healthcare, as well as the acquisition of med
spring urgent care centers and national cardiovascular Part
ners, the company made important steps in 2014.
TrEATMENT QUALITyin 2014, physicians and dialysis clinical staff again offered
our patients the highestquality treatment based on clinical
quality parameters as shown in the table below. Please see
page 54 of the management report for further details on
treatment quality.
Please refer to page 80 f. of the management report for the
2015 financial outlook of Fresenius medical care. For further
information, please see Fresenius medical care’s annual report
2014 or visit the website at www.freseniusmedicalcare.com.
north america
europe / middle east /
africa latin america asiaPacificTotal2014
change2014 / 2013
dialysis clinics (december 31) 2,162 635 247 317 3,361 3%
dialysis patients (december 31) 176,203 52,848 31,983 25,278 286,312 6%
Treatments (in millions) 26.61 8.05 4.82 3.27 42.74 6%
Fresenius medical care BY reGiOn
us$ in millions 2014 2013 change
north america
Health care services 1 9,655 8,772 10%
dialysis products 845 834 1%
Total 10,500 9,606 9%
international
Health care services 1 2,595 2,358 10%
dialysis products 2,670 2,612 2%
Total 5,265 4,970 6%
Worldwide
Health care services 1 12,250 11,130 10%
dialysis products 2 3,582 3,480 3%
Total 15,832 14,610 8%
1 sales from dialysis services and care coordination2 including sales generated by corporate functions of us$ 67 million in 2014 and
us$ 34 million in 2013
sales BY seGmenT
QualiTY ParameTers OF Fresenius medical care PaTienTs 1
usa emea asiaPacific
2014 2013 2014 2013 2014 2013
Kt / V ≥ 1.2 96% 97% 95% 95% 97% 96%
Hemoglobin = 10 – 12 g / dl 74% 75% 76% 73% 60% 59%
Hemoglobin = 10 – 13 g / dl 80% 81% 77% 75% 69% 68%
albumin ≥ 3.5 g / dl 2 83% 86% 92% 90% 91% 91%
Phosphate ≤ 5.5 mg / dl 2 64% 66% 79% 76% 70% 70%
Hospitalization days 9.1 9.4 9.4 9.4 4.3 4.2
1 data refer to the last quarter.2 international standard Bcr crm470
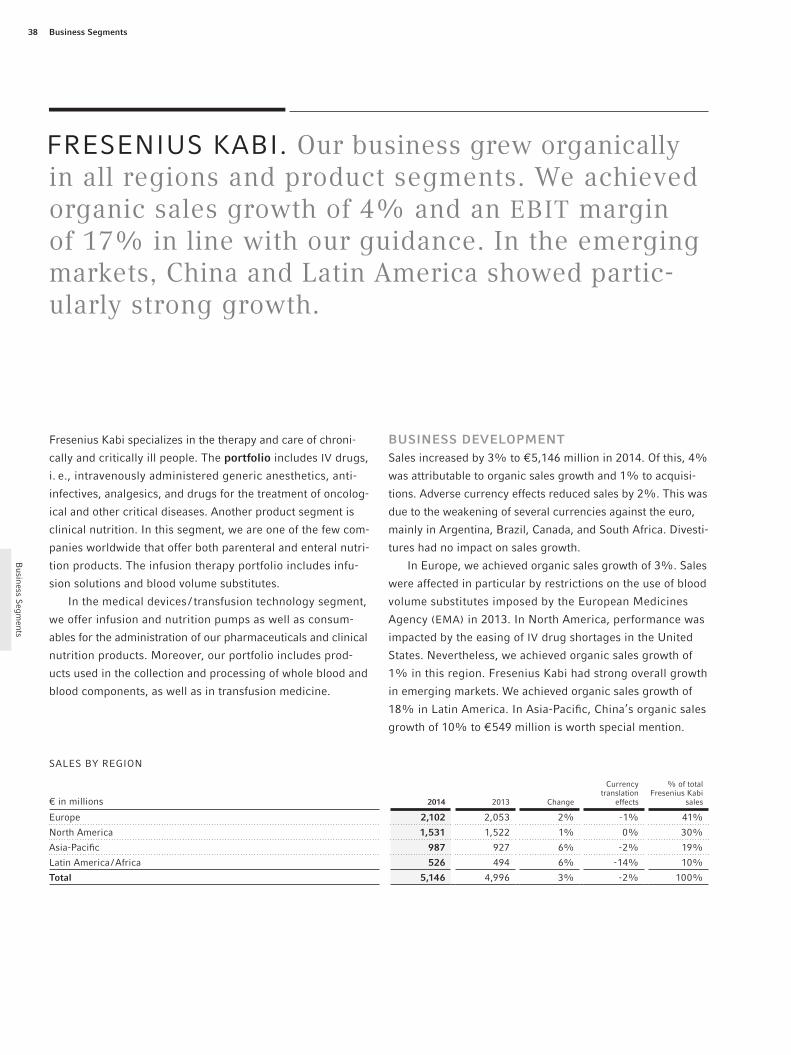
Business S
egments
Business Segments38
Fresenius KaBi. Our business grew organically in all regions and product segments. We achieved organic sales growth of 4% and an EBIT margin of 17% in line with our guidance. In the emerging markets, China and Latin America showed particularly strong growth.
Fresenius Kabi specializes in the therapy and care of chroni
cally and critically ill people. The portfolio includes iV drugs,
i. e., intravenously administered generic anesthetics, anti
infectives, analgesics, and drugs for the treatment of oncolog
ical and other critical diseases. another product segment is
clinical nutrition. in this segment, we are one of the few com
panies worldwide that offer both parenteral and enteral nutri
tion products. The infusion therapy portfolio includes infu
sion solutions and blood volume substitutes.
in the medical devices / transfusion technology segment,
we offer infusion and nutrition pumps as well as consum
ables for the administration of our pharmaceuticals and clinical
nutrition products. moreover, our portfolio includes prod
ucts used in the collection and processing of whole blood and
blood components, as well as in transfusion medicine.
BUSINESS DEVELOPMENTsales increased by 3% to € 5,146 million in 2014. Of this, 4%
was attributable to organic sales growth and 1% to acquisi
tions. adverse currency effects reduced sales by 2%. This was
due to the weakening of several currencies against the euro,
mainly in argentina, Brazil, canada, and south africa. divesti
tures had no impact on sales growth.
in europe, we achieved organic sales growth of 3%. sales
were affected in particular by restrictions on the use of blood
volume substitutes imposed by the european medicines
agency (ema) in 2013. in north america, performance was
impacted by the easing of iV drug shortages in the united
states. nevertheless, we achieved organic sales growth of
1% in this region. Fresenius Kabi had strong overall growth
in emerging markets. We achieved organic sales growth of
18% in latin america. in asiaPacific, china’s organic sales
growth of 10% to € 549 million is worth special mention.
€ in millions 2014 2013 change
currency translation
effects
% of total Fresenius Kabi
sales
europe 2,102 2,053 2% 1% 41%
north america 1,531 1,522 1% 0% 30%
asiaPacific 987 927 6% 2% 19%
latin america / africa 526 494 6% 14% 10%
Total 5,146 4,996 3% 2% 100%
sales BY reGiOn
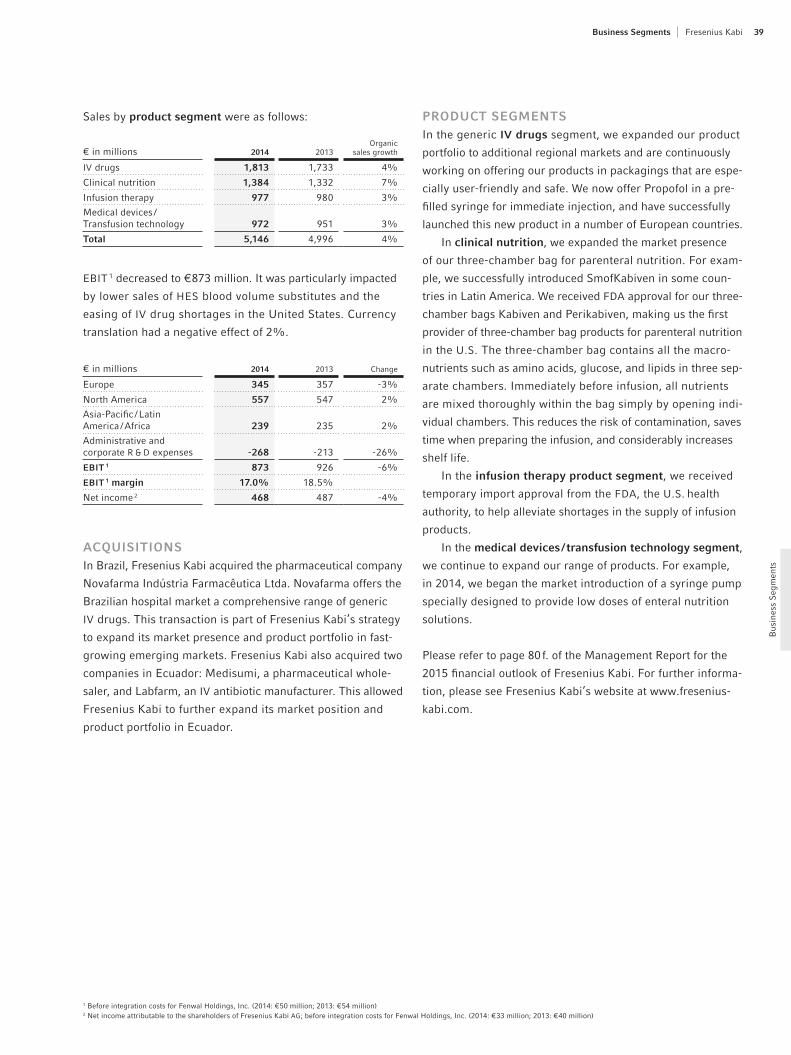
Bus
ines
s s
egm
ents
Business Segments Fresenius Kabi 39
sales by product segment were as follows:
eBiT 1 decreased to € 873 million. it was particularly impacted
by lower sales of Hes blood volume substitutes and the
easing of iV drug shortages in the united states. currency
translation had a negative effect of 2%.
AcQUISITIONSin Brazil, Fresenius Kabi acquired the pharmaceutical company
novafarma indústria Farmacêutica ltda. novafarma offers the
Brazilian hospital market a comprehensive range of generic
iV drugs. This transaction is part of Fresenius Kabi’s strategy
to expand its market presence and product portfolio in fast
growing emerging markets. Fresenius Kabi also acquired two
companies in ecuador: medisumi, a pharmaceutical whole
saler, and labfarm, an iV antibiotic manufacturer. This allowed
Fresenius Kabi to further expand its market position and
product portfolio in ecuador.
€ in millions 2014 2013Organic
sales growth
iV drugs 1,813 1,733 4%
clinical nutrition 1,384 1,332 7%
infusion therapy 977 980 3%
medical devices / Transfusion technology 972 951 3%
Total 5,146 4,996 4%
€ in millions 2014 2013 change
europe 345 357 3%
north america 557 547 2%
asiaPacific / latin america / africa 239 235 2%
administrative and corporate r & d expenses - 268 213 26%
EBIT 1 873 926 6%
EBIT 1 margin 17.0% 18.5%
net income 2 468 487 4%
PrODUcT SEgMENTSin the generic IV drugs segment, we expanded our product
portfolio to additional regional markets and are continuously
working on offering our products in packagings that are espe
cially userfriendly and safe. We now offer Propofol in a pre
filled syringe for immediate injection, and have successfully
launched this new product in a number of european countries.
in clinical nutrition, we expanded the market presence
of our threechamber bag for parenteral nutrition. For exam
ple, we successfully introduced smofKabiven in some coun
tries in latin america. We received Fda approval for our three
chamber bags Kabiven and Perikabiven, making us the first
provider of threechamber bag products for parenteral nutrition
in the u.s. The threechamber bag contains all the macro
nutrients such as amino acids, glucose, and lipids in three sep
arate chambers. immediately before infusion, all nutrients
are mixed thoroughly within the bag simply by opening indi
vidual chambers. This reduces the risk of contamination, saves
time when preparing the infusion, and considerably increases
shelf life.
in the infusion therapy product segment, we received
temporary import approval from the Fda, the u.s. health
authority, to help alleviate shortages in the supply of infusion
products.
in the medical devices / transfusion technology segment,
we continue to expand our range of products. For example,
in 2014, we began the market introduction of a syringe pump
specially designed to provide low doses of enteral nutrition
solutions.
Please refer to page 80 f. of the management report for the
2015 financial outlook of Fresenius Kabi. For further informa
tion, please see Fresenius Kabi’s website at www.fresenius
kabi.com.
1 Before integration costs for Fenwal Holdings, inc. (2014: € 50 million; 2013: € 54 million)2 net income attributable to the shareholders of Fresenius Kabi aG; before integration costs for Fenwal Holdings, inc. (2014: € 33 million; 2013: € 40 million)

Business S
egments
Business Segments40
Fresenius HeliOs. The year 2014 was marked by the successful completion of the acquisition of 41 hospitals from RhönKlinikum AG. We achieved the sales target of ~ € 1.8 billion for these hospitals, and recorded first EBIT margin increases. With organic sales growth of 4%, the established business also developed excellently.
at the end of 2014, the HeliOs Group operated 110 hospitals:
86 acute care hospitals, including 7 maximum care hospi
tals in BerlinBuch, duisburg, erfurt, Krefeld, schwerin, Wies
baden, and Wuppertal, as well as 24 postacute care clinics.
in addition, it also operated 47 outpatient clinics, 5 outpatient
postacute care centers, 11 prevention centers, and 15 nurs
ing homes. The Group has more than 34,000 beds and treats
over 4.2 million patients – including more than 1.2 million
inpatients – each year.
BUSINESS DEVELOPMENTin 2014, Fresenius Helios increased sales by 55% to € 5,244
million (2013: € 3,393 million). The hospitals acquired from
rhönKlinikum aG contributed € 1,791 million to sales. Organic
sales growth was 4%. divestitures reduced sales by 2%.
The acute care hospitals accounted for 90% of sales
(2013: 88%), while the postacute care hospitals accounted
for 7% (2013: 9%). 3% was attributable to other revenues
(2013: 3%).
Fresenius Helios increased eBiT 1 by 42% to € 553 million
(2013: € 390 million). The eBiT margin 1 was 10.5% (2013:
11.5%). The decrease is due to the firsttime consolidation of
the hospitals acquired from rhönKlinikum aG. net income 2
increased by 45% to € 400 million (2013: € 275 million).
sales of the established hospitals (consolidation > 1 year)
grew by 4% to € 3,453 million (2013 3: € 3,306 million). eBiT 1
increased by 5% to € 395 million (2013 3: € 376 million).
The eBiT margin 1 was 11.4% (2013 3: 11.4%).
The acquired hospitals achieved eBiT 1 of € 158 million
with an eBiT margin 1 of 8.8%.
We have established a sixyear development plan for
acute care and postacute care hospitals acquired. The devel
opment plan provides for the eBiT margin to improve by
two percentage points each year. The current status is shown
in the table beside.
€ in millions 2014 2013 change
sales 5,244 3,393 55%
thereof acute care 4,736 2,996 58%
thereof postacute care 344 293 17%
eBiT 1 553 390 42%
eBiT margin 1 in % 10.5 11.5
net income 2 400 275 45%
1 2014 before special items2 net income attributable to HeliOs Kliniken GmbH, 2014 before special items
1 2014 before special items2 net income attributable to HeliOs Kliniken GmbH, 2014 before special items3 2013 adjusted for divestitures

Bus
ines
s s
egm
ents
Business Segments Fresenius Helios 41
AcQUISITIONSin 2014, Fresenius Helios successfully completed the acqui
sition of 41 hospitals from rhönKlinikum aG and is now the
largest hospital operator in Germany, present in nearly the
whole of the country.
as of January 1, 2014, Fresenius Helios consolidated
approximately 70% of the acquired business, and as of
march 1, 2014, another 20%. The acquisition of HsK dr. Horst
schmidt Kliniken in Wiesbaden was concluded on schedule
on June 30, 2014. With 1,027 beds, this is the seventh maxi
mum care hospital in the HeliOs Group. HeliOs also took
over the 265bed hospital in cuxhaven from rhönKlinikum aG
on July 31, 2014.
The integration of the hospitals is proceeding according
to plan. in 2014, they were incorporated into the expanded
regional HeliOs structure and the brand integration was
largely implemented. Purchasing as well as various services
were bundled and iT integration completed.
hOSPITAL ADMISSIONS AND TrEATMENTSdue to the firsttime consolidation of the acquired hospitals –
but also due to the broad range of services and high treat
ment quality of HeliOs – the number of inpatients and out
patients treated increased in 2014:
2014 2013 change
inpatient and semi inpatient admissions 1,207,195 807,178 50%
acute care hospitals 1,148,473 754,703 52%
Postacute care clinics 58,722 52,475 12%
Outpatient admissions 3,362,292 2,373,781 42%
Key structural data and performance indicators developed
as follows:
2014 2013 change
acute care hospitals 86 51 69%
Beds 29,068 18,885 54%
length of stay (days) 6.6 6.6 0%
Postacute care clinics 24 23 4%
Beds 5,120 4,617 11%
length of stay (days) 26.5 26.5 0%
Occupancy 83% 83%
INVESTMENTSFresenius Helios invested a total of € 1,185 million (2013:
€ 2,443 million). Of this amount, € 824 million accounted for
acquisitions and € 361 million primarily for new buildings and
the modernization of the hospitals in northeim, schleswig,
and Krefeld. Own investments were € 266 million, about 5%
of sales.
Please refer to page 80 f. of the management report for
the 2015 financial outlook of Fresenius Helios. For further
information, please see Fresenius Helios’ website at
www.helioskliniken.de.
€ in millions 2014 2013 change
investments 1,185 2,443 51%
Own investments (property, plant and equipment) 266 172 55%
subsidies 1 (property, plant and equipment) 95 86 10%
acquisitions 824 2,185 62%
1 Total of purposerelated public investment subsidies according to section 9 of the Hospital Funding act (KHG)
years in portfolio
< 1 1 2 3 4 1 5 6 > 6 Total 1
number of clinics – 12 3 40 – 6 49 110
sales in million € – 401 160 1,799 – 205 2,515 5,080
Target
eBiT margin in % 2.0 4.0 6.0 8.0 10.0 12.0 12.0 – 15.0
eBiT in million € – 16.0 9.6 143.9 – 24.6 301.8 495.9
reported
eBiT margin in % – 8.1 4.8 7.9 – 8.8 13.5 10.6
eBiT in million € – 32.4 7.7 141.2 – 18.0 338.3 537.6
number of clinics > target – 8 1 19 – 2 22 52
number of clinics < target – 4 2 21 – 4 27 58
reported figures according to iFrs
1 includes all hospitals acquired from rhönKlinikum aG; eBiT includes € 29 million integration costs allocated to individual hospitals
clinic deVelOPmenT Plan acuTe and POsTacuTe care HOsPiTals 2014

Business S
egments
Business Segments42
Fresenius Vamed. In a challenging market environment, Fresenius Vamed again achieved sales and EBIT growth. The order backlog increased significantly and order intake reached an alltime high. This is an excellent basis for future growth.
Fresenius Vamed manages projects and provides services
for hospitals and other health care facilities worldwide. Our
portfolio ranges along the entire value chain: from project
development, planning, and turnkey construction, via mainte
nance and technical management, to total operational man
agement, as illustrated in the chart on page 43. This range of
competencies enables us to support complex health care
facilities efficiently and successfully at each stage of their life
cycle. as a specialist provider of a full spectrum of services
and being active worldwide, Vamed holds a unique position.
We have successfully completed more than 710 projects in
77 countries.
BUSINESS DEVELOPMENTSales in 2014 increased to € 1,042 million (2013: € 1,020 mil
lion). Organic growth of 0% was mainly influenced by proj
ect delays in russia and ukraine. acquisitions contributed 2%
to sales growth.
The table shows the sales development by activity:
EBIT increased by 7% to € 59 million (2013: € 55 million). The
eBiT margin was 5.7% (2013: 5.4%). in the project busi
ness, eBiT was € 27 million (2013: € 27 million), and in the
service business increased to € 32 million (2013: € 28 mil
lion). net income 1 improved to € 41 million, an increase of
11% (2013: € 37 million).
Our business has a low capital intensity. This is reflected
in the share of property, plant and equipment in the bal
ance sheet of 19% and the pretax return on equity of 20.4%
(2013: 19.8%).
€ in millions 2014 2013 change% of total
sales
Project business 558 583 4% 54%
service business 484 437 11% 46%
1 net income attributable to Vamed aG
€ in millions 2014 2013 change
% of total Fresenius
Vamed sales
europe 807 770 5% 78%
africa 117 117 0% 11%
asiaPacific 85 84 1% 8%
latin america 33 49 33% 3%
Total 1,042 1,020 2% 100%
sales BY reGiOn

Bus
ines
s s
egm
ents
Business Segments Fresenius Vamed 43
Vamed Value cHain
Project Development Planning Project Management and construction
Services ▶ Technical▶ commercial▶ infrastructural
Operational Management▶ Technical management▶ Total Operational
management
Project Business service Business
PrOJEcT BUSINESSThe project business comprises the consulting, project devel
opment, planning, turnkey construction, and financing man
agement of projects. Vamed responds flexibly to the local
needs of clients, providing customtailored solutions all from
one source. We also carry out projects in cooperation with
partners. among public clients there is growing interest in
publicprivate partnership (PPP) models. Vamed is a pioneer
in this market segment. up to the end of 2014, 23 of these
models had been or are currently being implemented.
Germany is one of our key countries within Europe. Thus,
Vamed was awarded the contract for the modernization of
the university Hospital of schleswigHolstein, in a consortium
with the construction company Bam. The project is due to
be completed in 2021. in addition, the consortium will also
provide longterm operation and maintenance of the hospital
building. With a total volume of around € 1.7 billion, the project
is the largest PPP model in the German health care system.
in Berlin, Vamed was commissioned to renovate the 21storey
inpatient building at the charité Hospital, and to build new
intensive care units, operating rooms, and an emergency de
partment. in Bosnia, Vamed obtained a major contract for
the modernization and expansion of a university hospital. in
Africa, Vamed built five turnkey polyclinics in Ghana. Ten
more will follow by 2017. We also carried out projects in Gabon
and nigeria. in Latin America, we began building and equip
ping the Point Fortin Hospital in Trinidad and Tobago. in
china, we started to supply medical equipment for the 1,800
bed hospital of Beijing university. in Papua New guinea,
Vamed secured the contract to build a diagnostic and surgi
cal center.
SErVIcE BUSINESSVamed offers a full range of facility management services for
health care facilities. modular in design, our service offering
encompasses every aspect of technical, commercial, and infra
structural facility management. This ranges from building
and equipment maintenance, medical technology manage
ment, and technical management through to the operational
management. Our integrated port folio of services is aimed
at the optimal operation of a health care facility.
Vamed was responsible for the total operational manage
ment of 51 health care facilities on four continents with
approximately 6,700 beds in 2014. Worldwide, Vamed pro
vides technical operation services to more than 510 hospi
tals with about 130,000 beds.
in Austria, Vamed continued its partnership with Vienna’s
General Hospital and university Hospital (aKH), one of the
largest hospitals in europe. in addition, our eleven facilities
make us the largest private rehabilitation provider in austria.
in Switzerland, we operate two wellknown rehabilitation
facilities. in germany, a consortium led by Vamed has been
responsible for all technical and infrastructural services at
Berlin’s charité Hospital since 2006. in gabon, Vamed is
responsible for the overall management of seven regional hos
pitals and for the technical management of three hospitals
in libreville.
VAMED VITALITy WOrLDVamed Vitality World’s thermal spa and wellness resorts have
succeeded in bridging the gap between preventive medicine
and health care tourism. With approximately 2.5 million visi
tors annually in eight thermal spas and wellness resorts,
we are the market leader in austria. With the aquaworld resort
in Budapest, Vamed took over the operational management
outside austria for the first time.
Please refer to pages 80 f. of the management report for the
2015 financial outlook of Fresenius Vamed. For further infor
mation on Vamed, please see Fresenius Vamed’s website at
www.vamed.com.
€ in millions 2014 2013 change
Order intake 840 744 13%
Order backlog (december 31) 1,398 1,139 23%
Order inTaKe and Order BacKlOG FOr PrOJecTs

Managem
ent Report
44 Management Report
45 Fundamental information about the Group
45 The Group’s business model
46 Important markets and competitive position
46 Legal and economic factors
46 Management and control
47 Capital, shareholders, articles of association
48 Goals and strategy
49 Corporate performance criteria
50 Research and development
52 Employees
53 Procurement
54 Quality management
55 Responsibility, environmental management, sustainability
58 Report on economic position
58 Health care industry
59 The dialysis market
60 The market for generic IV drugs, clinical nutrition,
infusion therapy, and medical devices /
transfusion technology
61 The German hospital market
62 The market for projects and services for hospitals and
other health care facilities
62 Overall business development
62 The Management Board’s assessment of the effect
of general economic developments and those in the
health care sector for Fresenius
62 The Management Board’s assessment of the
business results and significant factors affecting
operating performance
63 Comparison of the actual business results with
the forecasts
64 Results of operations, financial position, assets and liabilities
64 Results of operations
68 Financial position
73 Assets and liabilities
75 Corporate rating
76 Subsequent events
76 Overall assessment of the business situation
76 Outlook
76 General and mid-term outlook
78 Future markets
78 Health care sector and markets
80 Group sales and earnings
80 Sales and earnings by business segment
81 Financing
81 Investments
82 Procurement
82 Research and development
82 Planned changes in human resources and the social area
82 Dividend
83 Opportunities and risk report
83 Opportunities management
83 Risk management
84 Risk areas
91 Assessment of overall risk
TABLE OF CONTENTS MANAGEMENT REPORT

Man
agem
ent
Rep
ort
Management Report Fundamental information about the Group 45
FundaMental inFoRMation about
the gRoup
the gRoup’s business ModelFresenius is a global health care group in the legal form of
an SE & Co. KGaA (a partnership limited by shares). We offer
products and services for dialysis, hospitals, and outpatient
medical care. In addition, Fresenius focuses on hospital oper-
ations. We also manage projects and provide services for
hospitals and other health care facilities worldwide.
The operating business comprises four business segments,
all of which are legally independent entities managed by the
operating parent company Fresenius SE & Co. KGaA. The busi-
ness segments have a regional and decentralized structure.
▶ Fresenius Medical Care offers services and products for
patients with chronic kidney failure. As of December 31,
2014, Fresenius Medical Care treated 286,312 patients at
3,361 dialysis clinics. Dialyzers, dialysis machines, and
renal pharmaceuticals are among the most important
product lines. In addition, Fresenius Medical Care offers
dialysis-related services, among others in the field of Care
Coordination.
▶ Fresenius Kabi specializes in intra venously adminis-
tered generic drugs (IV drugs), clinical nutrition, and infu-
sion therapies. The company is also a supplier of medi-
cal devices and products of transfusion technology. The
company sells its products mainly to hospitals.
▶ Fresenius helios is the largest hospital operator in Ger-
many. At the end of 2014, Fresenius Helios operated a
total of 110 hospitals with more than 34,000 beds in Ger-
many. In addition to 86 acute care hospitals, including
seven maximum care hospitals in Berlin-Buch, Duisburg,
Erfurt, Krefeld, Schwerin, Wiesbaden, and Wuppertal, the
HELIOS Group has 24 post-acute care clinics.
▶ Fresenius Vamed manages projects and provides services
for hospitals and other health care facilities worldwide.
The portfolio ranges along the entire value chain – from
project development, planning, and turnkey construction,
via maintenance, and technical management, to total
operational management.
▶ The segment Corporate / other comprises the holding
activities of Fresenius SE & Co. KGaA and the IT service
provider Fresenius Netcare, which operates mainly for
Group companies. In addition, Corporate / Other includes
the consolidation measures conducted among the busi-
ness segments.
GROuP STRuCTuRE
Fresenius SE & Co. KGaA
31% 100% 100% 77%
Fresenius Medical Care
Fresenius Kabi
Fresenius Helios
Fresenius Vamed
MANAGEMENT REPORT. 2014 was a successful year for Fresenius. We fully met our guidance, exceeding € 23.2 billion in sales and achieving € 1.1 billion in net income. Operating cash flow margin was 11.1%.

Managem
ent Report
46 Management Report
Fresenius has an international sales network and maintains
approximately 90 production sites. Large production sites
are located in the united States, China, Japan, Germany, and
Sweden. Production plants are also located in other Euro-
pean countries and in Latin America, Asia-Pacific, and South
Africa.
iMpoRtant MaRKets and CoMpetitiVe
position
Fresenius operates in about 80 countries through its subsid-
iaries. The main markets are North America and Europe with
40% and 44% of sales, respectively.
Fresenius Medical Care holds the leading position world-
wide in dialysis care as it serves about 11% of all dialysis
patients, as well as in dialysis products, with a market share
of about 35%. Fresenius Kabi holds leading market positions
in Europe and has significant market shares in the growth
markets of Asia-Pacific and Latin America. In the united States,
Fresenius Kabi is one of the leading suppliers of generic
IV drugs. Fresenius helios is the largest hospital operator in
Germany. Fresenius Vamed is one of the world’s leading
companies in its field.
legal and eConoMiC FaCtoRs
Overall, the legal and economic factors for the Fresenius Group
were largely unchanged. The life-saving and life-sustaining
products and therapies that the Group offers are of intrinsic
importance for people worldwide. Therefore, our markets are
fundamentally stable and relatively independent of economic
cycles. For detailed information on our markets, please see
pages 59 ff.
Furthermore, the diversification across four business
segments and our global reach provide additional stability
for the Group.
The statement of income and the balance sheet can be
influenced by currency translation effects as a result of
exchange rate fluctuations, especially in the rate between
the u.S. dollar and the euro. In 2014, the average annual
exchange rate between the u.S. dollar and the euro of 1.33
was unchanged compared to 2013, and had therefore no effect
on the income statement. The changed spot rate of 1.21 as
of December 31, 2014 – compared to 1.38 as of December 31,
2013 – had a significant effect on the balance sheet.
There were no legal aspects that significantly affected
business performance in 2014.
ManageMent and ContRol
In the legal form of a KGaA, the Company’s corporate bodies
are the General Meeting, the Supervisory Board, and the
general partner, Fresenius Management SE. Fresenius Man-
agement SE is wholly owned by Else Kröner-Fresenius-
Stiftung. The KGaA has a two-tier management system –
management and control are strictly separated.
The general partner, represented by its Management
board, conducts the business and represents the Company in
dealings with third parties. The Management Board has seven
members. According to the Management Board’s rules of
procedure, each member is accountable for his or her own area
of responsibility. However, the members have joint responsi-
bility for the management of the Group. In addition to the
Supervisory Board of Fresenius SE & Co. KGaA, Fresenius Man-
agement SE has its own Supervisory Board. The Manage-
ment Board is required to report to the Supervisory Board of
Fresenius Management SE regularly, in particular on its
corporate policy and strategies, business profitability, current
operations, and any other matters that could be of signifi-
cance for the Company’s profitability and liquidity. The Super-
visory Board of Fresenius Management SE also advises and
supervises the Management Board in its management of
the Company. It is prohibited from managing the Company
directly. However, the Management Board’s rules of proce-
dure require it to obtain the approval of the Supervisory Board
of Fresenius Management SE for specific activities.
The members of the Management Board are appointed
and dismissed by the Supervisory Board of Fresenius Manage-
ment SE. Appointment and dismissal is in accordance with
Article 39 of the SE Regulation. The articles of association of
Fresenius Management SE also provide that deputy members
of the Management Board may be appointed.
The supervisory board of Fresenius se & Co. Kgaa
advises and supervises the management of the Company’s
business by the general partner, reviews the annual financial
statements and the consolidated financial statements, and
performs the other functions assigned to it by law and the
Company’s articles of association. It is involved in corporate
planning and strategy, and in all matters of fundamental
importance for the Company. The Supervisory Board of
Fresenius SE & Co. KGaA has six shareholder representatives

Man
agem
ent
Rep
ort
Management Report Fundamental information about the Group 47
and six employee representatives. A Nomination Committee
of the Supervisory Board of Fresenius SE & Co. KGaA has
been instituted for election proposals for the shareholder
representatives. Its activities are aligned with the provisions
of law and the Corporate Governance Code. The share-
holder representatives are elected by the general Meeting
of Fresenius se & Co. Kgaa. The European works council
elects the employee representatives to the Super visory Board
of Fresenius SE & Co. KGaA.
The Supervisory Board must meet at least twice per calen-
dar half-year. The Supervisory Board of Fresenius SE & Co.
KGaA has two permanent committees: the Audit Committee,
consisting of five members, and the Nomination Committee,
consisting of three members. The members of the committees
are listed on page 191 of this Annual Report. The Company’s
annual corporate governance declaration describes the proce-
dures of the Supervisory Board’s committees. The declara-
tion can be found on pages 11 to 35 of the Annual Report and
on the website www.fresenius.com.
The description of both the compensation system and
individual amounts paid to the Management Board and Super-
visory Board of Fresenius Management SE, and the Super-
visory Board of Fresenius SE & Co. KGaA, are included in the
Compensation Report on pages 23 to 35 of the annual report.
The Compensation Report is part of the Group’s Manage-
ment Report.
Capital, shaReholdeRs, aRtiCles oF
assoCiation
The subscribed capital of Fresenius SE & Co. KGaA amounted
to 541,532,600 ordinary shares as of December 31, 2014
(December 31, 2013: 179,694,829). On May 16, 2014, the
Annual General Meeting approved the issuance of new shares
(stock split) through the conversion of capital reserves from
company funds. In accordance with the proposed stock split,
various authorizations were adjusted accordingly. These res-
olutions were recorded in the commercial register on August
1, 2014. The subscribed capital and the number of shares
were tripled. Every shareholder has received two additional
shares for each share held (three-for-one stock split). The
stock exchange listing was converted on August 4, 2014.
The shares of Fresenius SE & Co. KGaA are non-par-value
bearer shares. Each share represents € 1.00 of the capital
stock. Shareholders’ rights are regulated by the German Stock
Corporation Act (AktG – Aktiengesetz).
Fresenius Management SE, as general partner, is author ized,
subject to the consent of the Supervisory Board of Fresenius
SE & Co. KGaA:
▶ to increase the subscribed capital of Fresenius SE & Co.
KGaA by a total amount of up to € 120.96 million, until
May 15, 2019, through a single or multiple issuance
of new bearer ordinary shares against cash contributions
and / or contributions in kind (authorized Capital i).
Shareholders’ pre-emptive rights of subscription can be
excluded.
In addition, there are the following Conditional Capitals, of
which the Conditional Capitals I and II are adjusted for stock
options that have been exercised in the meantime:
▶ The subscribed capital is conditionally increased by up to
€ 5,773,056.00 through the issuance of new bearer ordi-
nary shares (Conditional Capital i). The conditional capi-
tal increase will only be executed to the extent that con-
vertible bonds for ordinary shares have been issued under
the 2003 Stock Option Plan and the holders of these con-
vertible bonds exercise their conversion rights.
▶ The subscribed capital is conditionally increased by up
to € 10,901,188.00 through the issuance of new bearer
ordinary shares (Conditional Capital ii). The conditional
capital increase will only be executed to the extent that
subscription rights have been issued under the 2008 Stock
Option Plan, the holders of these subscription rights exer-
cise their rights, and the Company does not use its own
shares to service the subscription rights or does not exer-
cise its right to make payment in cash.
▶ The general partner is authorized, with the approval of
the Supervisory Board, until May 15, 2019, to issue option
bearer bonds and / or convertible bearer bonds, once or
several times, for a total nominal amount of up to € 2.5 bil-
lion. To fulfill the granted subscription rights, the sub-
scribed capital of Fresenius SE & Co. KGaA was increased
conditionally by up to € 48,971,202.00 through issuance
of new bearer ordinary shares (Conditional Capital iii).
The conditional capital increase shall only be implemented
to the extent that the holders of convertible bonds issued
for cash, or of warrants from option bonds issued for
cash, exercise their conversion or option rights and as long
as no other forms of settlement are used.

Managem
ent Report
48 Management Report
▶ The share capital is conditionally increased by up to
€ 25,200,000.00 by the issuance of new ordinary bearer
shares (Conditional Capital iV). The conditional capital
increase will only be implemented to the extent that
subscription rights have been, or will be, issued in accor-
dance with the Stock Option Program 2013 and the
holders of subscription rights exercise their rights, and
the Company does not grant own shares to satisfy the
subscription rights.
The Company is author ized, until May 15, 2019, to purchase
and use its own shares up to a maximum amount of 10%
of the subscribed capital. In addition, when purchasing own
shares, the Company is authorized to use equity derivatives
with possible exclusion of any tender right. The Company had
not utilized these author izations as of December 31, 2014.
direct and indirect ownership interests in Fresenius SE &
Co. KGaA are listed on pages 147 f. of the Notes. As the larg-
est shareholder, Else Kröner-Fresenius-Stiftung informed the
Company on December 16, 2014, that it held 144,695,094
ordi nary shares of Fresenius SE & Co. KGaA. This corresponds
to an equity interest of 26.72% as of December 31, 2014.
amendments to the articles of association are made in
accordance with Section 278 (3), Section 179 (2) of the Ger-
man Stock Corporation Act (AktG) in conjunction with Sec-
tion 17 (3) of the articles of association of Fresenius SE & Co.
KGaA. unless mandatory legal provisions require otherwise,
amendments of the articles of association require a simple
majority of the subscribed capital represented in the resolution.
If the voting results in a tie, a motion is deemed rejected.
Furthermore, in accordance with Section 285 (2) sentence 1 of
the German Stock Corporation Act (AktG), amendments to
the articles of association require the consent of the general
partner, Fresenius Management SE. The Supervisory Board
is entitled to make such amendments to the articles of associ-
ation that only concern their wording without a resolution of
the General Meeting.
under certain circumstances, a change of control as the
result of a takeover bid could impact some of our long-term
financing agreements, which contain customary change of con-
trol provisions that grant creditors the right to terminate
agreements early or to request early repayments of outstand-
ing amounts in case of a change of control. These termina-
tion rights partly become effective if the change of control
is followed by a decline of the Company’s rating or of the
respective financing instruments.
goals and stRategYOur goal is to strengthen the position of Fresenius as a lead-
ing global provider of products and therapies for critically
and chronically ill people. With our four business segments,
we are concentrating on a limited number of health care
areas. Thanks to this clear focus, we have developed unique
competencies. We are following our long-term strategies
consistently and are seizing our oppor tunities.
The key elements of Fresenius Group’s strategy and goals
are to:
▶ expand market position and worldwide presence:
Fresenius seeks to ensure and expand its long-term posi-
tion as a leading international provider of products and
services in the health care industry. To this end, and to geo-
graphically expand our business, we plan to grow organi-
cally as well as through selective small and medium-sized
acquisitions, complementing our existing portfolio. We
focus on markets with strong growth rates. Fresenius Kabi,
for example, has strengthened its IV business through
an acquisition in Brazil.
Fresenius Medical Care is the worldwide leader in
dialysis, with a strong market position in the united States.
Future opportunities in dialysis will arise from further
international expansion in dialysis care and products and
in renal pharmaceuticals, as well as the expansion in the
field of Care Coordination. In this area, Fresenius Medical
Care offers additional services for dialysis patients. These
include, e. g., laboratory and vascular care services. In
2014, Fresenius Medical Care has significantly strength-
ened this area through several acquisitions. By expanding
its business, the company addresses a growing need for
integrated patient care.
Fresenius Kabi is the market leader in infusion therapy
and clinical nutrition in Europe and in the key markets
in Asia-Pacific and Latin America. In the united States,
Fresenius Kabi is one of the leading players in the market
for generic IV drugs. In addition, Fresenius Kabi is one
of the most important providers of transfusion technology.
Fresenius Kabi plans to roll out products from its existing

Man
agem
ent
Rep
ort
Management Report Fundamental information about the Group 49
portfolio to the growth markets and to launch existing
products in the united States. In 2014, Fresenius Kabi
was granted uS approval for products in the fields of clin-
ical nutrition and medical devices. Market share is to
be expanded further through the launch of new products
in the field of IV drugs and medical devices for infusion
therapy and clinical nutrition, as well as in transfusion
technology.
Including the 41 hospitals acquired from Rhön-Klini-
kum AG, Fresenius Helios is operating in nearly the whole
of Germany. Building on this, Fresenius Helios is now in
the position to develop new patient care models and take
advantage of further growth opportunities arising from the
privatization process in the German hospital market.
Fresenius Vamed will further expand its position as a
global specialist for pro jects and services for hospitals
and other health care facilities.
▶ strengthen innovation: Fresenius’ strategy is to continue
building on its strength in technology, its competence
and quality in patient care, and its ability to manufacture
cost-effectively. We want to develop products and systems
that provide a high level of safety and user-friendliness
and enable tailoring to individual patient needs. We intend
to continue to meet our requirements of best-in-class
medi cal standards by developing and offering more effec-
tive products and treatment methods for the critically and
chronically ill. The goal of Fresenius Helios is to system-
atically foster interdisciplinary knowledge sharing and to
use innovation to develop the best health care services and
innovative therapies for our patients. Fresenius Vamed’s
goal is to realize further projects in integrated health care
services and to support patient-oriented health care sys-
tems more efficiently.
▶ enhance profitability: Last but not least, it is our goal to
improve Group profitability. To contain costs, we are con-
centrating particularly on making our production plants
more efficient, exploiting economies of scale, leveraging
the existing marketing and distribution infrastructure
more intensively, and practicing strict cost control. By
focusing on our operating cash flow and employing effi-
cient working capital management, we will increase our
investment flexibility and improve our balance sheet ratios.
Another goal is to optimize our weighted average cost of
capital (WACC) by deliberately employing a balanced mix
of equity and debt funding. In the present capital market
conditions, we optimize our cost of capital if we hold the
net debt / EBITDA ratio within a range of 2.5 to 3.0. Please
see pages 50, 64 and, 75 for more details.
We report on our goals in detail in the Outlook section on
pages 76 to 82.
CoRpoRate peRFoRManCe CRiteRiaThe Management Board controls the business segments by
setting strategic and operating targets and through financial
ratios. The most important ratios are explained below:
In line with our growth strategy, sales growth (in con-
stant currency) of the Group and, in our business segments,
in particular organic sales growth is of central importance.
ebit and the ebit margin, respectively, are useful yardsticks
for measuring the profitability of the business segments. At
Group level, we primarily use net income to this end.
At Group level, operating cash flow and the cash flow
margin are also used as key performance figures. With regard
to the operating cash flow contributions of our business seg-
ments, we also analyze the key performance indicators days
sales outstanding (DSO) and scope of inventory (SOI).
Our investments are controlled using a detailed coordi-
nation and evaluation process. As a first step, the Manage-
ment Board sets the Group’s investment targets and the bud-
get based on investment proposals. In a second step, the
respective business segments and the internal Acquisition &
Investment Council (AIC) determine the proposed projects
and measures while taking into account the overall strategy,
the total investment budget, and the required and potential
return on investment. The investment projects are evaluated
based on commonly used processes, such as the internal
rate of return (IRR) and net present value (NPV). Graduated
according to investment volume, a project is submitted for
approval to the executive committees or respective manage-
ments of the business segments, or to the Management Board
of Fresenius Management SE or its Supervisory Board.

Managem
ent Report
50 Management Report
Another key performance indicator at the Group level is the
debt ratio, which is the ratio of net debt to EBITDA. This mea-
sure indicates how far a company is in a position to meet its
payment obligations. Our business segments usually hold lead-
ing positions in growing and mostly non-cyclical markets.
They generate mainly stable, predictable cash flows since the
majority of our customers are of high credit quality. The Group
is therefore able to finance its growth with a high proportion
of debt compared to companies in other industries.
At Group level, we use return on operating assets (Rooa)
and return on invested capital (RoiC) as benchmarks for
evaluating our business.
ReseaRCh and deVelopMentProduct and process development as well as the improvement
of therapies are at the core of our growth strategy. Fresenius
focuses its R & D efforts on its core competencies in the fol-
lowing areas:
▶ Dialysis
▶ Infusion and nutrition therapies
▶ Generic IV drugs
▶ Medical devices
Apart from new products, we are concentrating on develop-
ing optimized or completely new therapies, treatment methods,
and services.
Research and development expenses were € 369 million
(2013: € 348 million), approximately 4.8% of our product sales
(2013: 4.6%). Fresenius Medical Care decreased its R & D
spending by 3%, Fresenius Kabi increased its R & D spending
by 10%. Detailed figures are included in the segment report-
ing on pages 98 f.
As of December 31, 2014, there were 2,107 employees in
research and development (2013: 1,969). Of that number,
628 were employed at Fresenius Medical Care (2013: 583)
and 1,479 at Fresenius Kabi (2013: 1,386).
Our main research sites are in Europe, the united States,
and India. Product-related development activities are also
carried out in China. Our R & D projects are mainly conducted
in-house; external research is commissioned only on a lim-
ited scale.
FResenius MediCal CaRe
The complex interactions and side effects that lead to kidney
failure are better explored today than ever before. Techno-
logical advances develop in parallel with medical insights to
improve the possibilities for treating patients. Our R & D activ-
ities at Fresenius Medical Care aim to translate new insights
into novel or improved developments and to bring them to mar-
ket as quickly as possible, and thus make an important con-
tribution towards rendering the treatment of patients increas-
ingly comfortable, safe, and individualized.
With our global R & d portfolio management, we seek to
standardize basic functions and single components of our
therapy systems internationally and to standardize process and
control structures. At the same time, it allows us to address
local requirements, to reduce development time, and to pool
our resources.
In 2014, we moved forward with the development of our
products and have introduced several innovative products
onto the markets in which we are active. This includes the new
devices Sleepsafe Harmony and Liberty PDx for peritoneal
dialysis. Both machines feature improved user interfaces and
expanded therapy options. In hemodialysis, we introduced a
new version of our Critline system, which automatically admin-
isters the liquid draw according to a doctor’s specification.
With the market introduction of an automatic sodium balanc-
ing system during dialysis treatment, we are contributing to
improvements in this area.
R & D EXPENSES BY SEGMENT
Fresenius Medical Care 25%
Fresenius Kabi 75%
2014: € 369 million

Man
agem
ent
Rep
ort
Management Report Fundamental information about the Group 51
In 2014, we also pushed the development of the portable arti-
ficial kidney (PAK). The product is scheduled for introduction
in the united States in 2015. Major advantages of PAK are
the miniaturization and portability, as well as the significant
reduction of water usage per treatment from an average of
120 to between six and ten liters.
Going forward, we want to strengthen our development
pipeline and focus on growth markets. We plan to introduce
basic therapy systems specifically designed for the Chinese
market. In order to do so, we laid the foundation for a develop-
ment center in Shanghai.
FResenius Kabi
Fresenius Kabi’s research and development activities concen-
trate on products for the therapy and care of critically and
chronically ill patients. Our products help to support medi-
cal advancements in acute and post-acute care and improve
the patients’ quality of life. Our development expertise
includes all the related components, such as the drug raw
material, the pharmaceutical formulation, the primary pack-
aging, the medical device needed for application, and the
production technology.
In the area of iV drugs, we are developing an extensive
port folio of active drugs that are expected to come on the mar-
ket in the next few years. In 2014, we worked on more than
120 development projects for generic drugs. Worldwide, many
of our drugs were approved in 2014. We develop generic drug
formulations ready to launch at the time of market formation
as well as new formulations for non-patented drugs.
In an ongoing development effort, we aim to provide ready-
to-use solutions for IV drugs, which currently exist only in
lyophilized or powder form. In addition, we are working on
offering our IV drugs in our innovative primary packagings,
which are especially user-friendly and safe, e. g., freeflex
infusion bags.
In clinical nutrition, our focus is on nutrition products
that improve the therapy of patients in hospitals and innova-
tive containers, e. g., multi-chamber bags that allow maximum
application safety and convenience in everyday use.
Among other things, our efforts have focused on the early
and correct use of parenteral nutrition in order to avoid mal-
nutrition and its consequences. One focus is on the clinical
benefits of individual nutrients. For example, a cooperative
research effort conclusively established that a supplementation
of omega-3 fatty acids is associated with a significant reduc-
tion in infection rate and length of hospital stay for critically
ill patients. 1 In enteral nutrition, we focus on products for
malnourished – often geriatric – patients and on therapeutic
products for dysphagia (difficulties in swallowing), diabetes,
oncology, and critical illness.
In the development of our medical devices / transfusion
technology, we focus on the application of IV drugs and
infusion therapies as well as enteral and parenteral nutrition
products. Our medical devices significantly contribute to
the safe and effective application of infusion solutions and clin-
ical nutrition. In 2014, we worked on the technical enhance-
ment of our Agilia infusion pumps and plan to introduce the
latest generation in 2015. In addition, we have been work-
ing on the development of a new infusion pump, specifically
designed for the demands of hospitals and health care facili-
ties in emerging markets, which we plan to introduce during
2015. In transfusion technology our R & D focus is on medical
devices and disposables to support the secure, user-friendly,
and efficient production of blood products.
2014 2013 2012 2011 2010
R & D expenses, € in millions 369 348 305 267 244
as % of product sales 4.8 4.6 4.4 4.3 4.2
R & D employees 2,107 1,969 1,903 1,592 1,449
KEY FIGuRES RESEARCH AND DEVELOPMENT
1 Pradelli L et al. Cost-effectiveness of omega-3 fatty acid supplements in parenteral nutrition therapy in hospitals: a discrete event simulation model. Clinical Nutrition 2014;33(5):785-92.
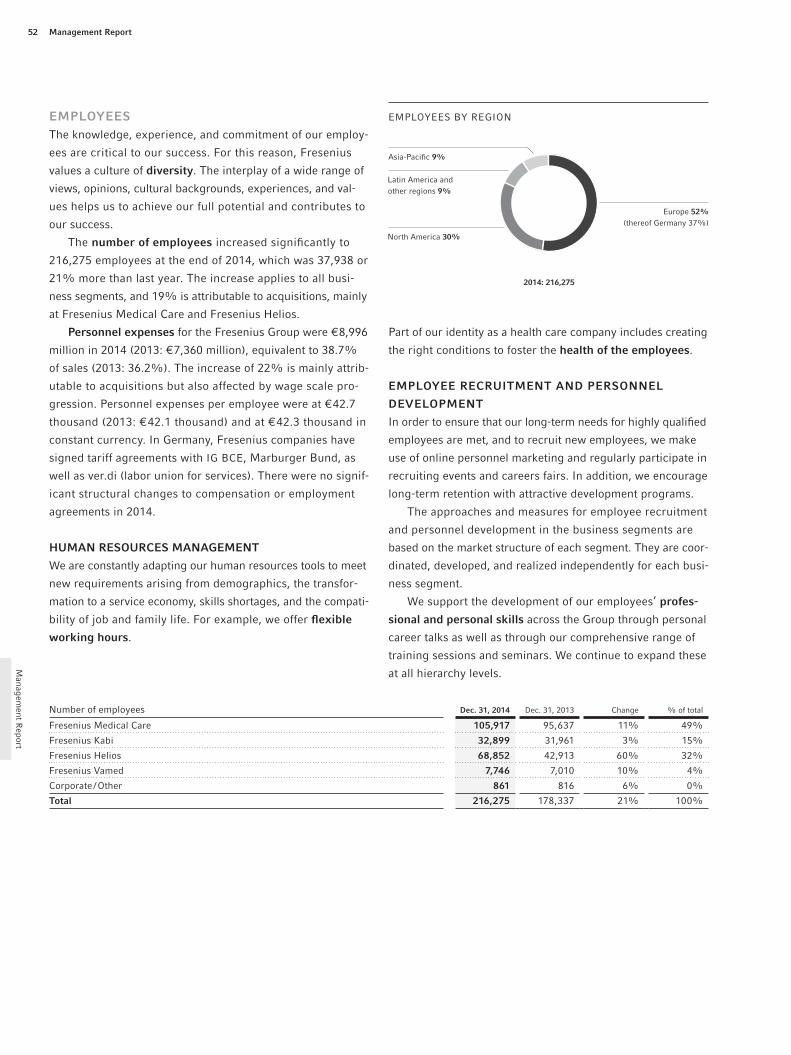
Managem
ent Report
52 Management Report
eMploYeesThe knowledge, experience, and commitment of our employ-
ees are critical to our success. For this reason, Fresenius
values a culture of diversity. The interplay of a wide range of
views, opinions, cultural backgrounds, experiences, and val-
ues helps us to achieve our full potential and contributes to
our success.
The number of employees increased significantly to
216,275 employees at the end of 2014, which was 37,938 or
21% more than last year. The increase applies to all busi-
ness segments, and 19% is attributable to acquisitions, mainly
at Fresenius Medical Care and Fresenius Helios.
personnel expenses for the Fresenius Group were € 8,996
million in 2014 (2013: € 7,360 million), equivalent to 38.7%
of sales (2013: 36.2%). The increase of 22% is mainly attrib-
utable to acquisitions but also affected by wage scale pro-
gression. Personnel expenses per employee were at € 42.7
thousand (2013: € 42.1 thousand) and at € 42.3 thousand in
constant currency. In Germany, Fresenius companies have
signed tariff agreements with IG BCE, Marburger Bund, as
well as ver.di (labor union for services). There were no signif-
icant structural changes to compensation or employment
agreements in 2014.
huMan ResouRCes ManageMent
We are constantly adapting our human resources tools to meet
new requirements arising from demographics, the transfor-
mation to a service economy, skills shortages, and the compati-
bility of job and family life. For example, we offer flexible
working hours.
Part of our identity as a health care company includes creating
the right conditions to foster the health of the employees.
eMploYee ReCRuitMent and peRsonnel
deVelopMent
In order to ensure that our long-term needs for highly qualified
employees are met, and to recruit new employees, we make
use of online personnel marketing and regularly participate in
recruiting events and careers fairs. In addition, we encourage
long-term retention with attractive development programs.
The approaches and measures for employee recruitment
and personnel development in the business segments are
based on the market structure of each segment. They are coor-
dinated, developed, and realized independently for each busi-
ness segment.
We support the development of our employees’ profes-
sional and personal skills across the Group through personal
career talks as well as through our comprehensive range of
training sessions and seminars. We continue to expand these
at all hierarchy levels.
EMPLOYEES BY REGION
Asia-Pacific 9%
Latin America and other regions 9%
North America 30%
Europe 52% (thereof Germany 37%)
2014: 216,275
Number of employees dec. 31, 2014 Dec. 31, 2013 Change % of total
Fresenius Medical Care 105,917 95,637 11% 49%
Fresenius Kabi 32,899 31,961 3% 15%
Fresenius Helios 68,852 42,913 60% 32%
Fresenius Vamed 7,746 7,010 10% 4%
Corporate / Other 861 816 6% 0%
total 216,275 178,337 21% 100%

Man
agem
ent
Rep
ort
Management Report Fundamental information about the Group 53
Fresenius promotes the long-term, sustainable advancement
of women, to derive greater benefit from their strengths and
abilities now and in the future. However, we do not set any
fixed quotas for management positions. At Fresenius, qualifi-
cations are the only thing that matters in the selection of
personnel. Consequently, at Fresenius women and men with
comparable qualifications will continue to have the same
career opportunities. As of December 31, 2014, the propor-
tion of female employees within the Fresenius Group was
68%. Women also held 30% of senior management positions,
based on the number of worldwide participants in the stock
option plans.
The Fresenius Group devotes a lot of attention to voca-
tional training. We trained more than 3,650 young people
in 49 different occupations at our German locations in 2014,
and also put more than 70 university students through 12
degree programs in cooper ation with dual institutions of
higher learning. Alongside the traditional channel of direct
job entry, Fresenius offers trainee programs for university
graduates.
You can visit our award-winning careers portal at
www.fresenius.com in the “Career” section.
pRoFit-shaRing sCheMe and stoCK
option plan
For many years, we have paid a stock-based profit-sharing
bonus that is tied to the annual operating profit (EBIT) of
Fresenius Group. The table below shows the development in
the profit-sharing bonus over the last several years.
With our long term incentive program 2013, we have
a global compensation instrument linking management’s
entrepreneurial responsibility to future opportunities and risks.
It comprises the Stock Option Plan 2013, as well as the Phan-
tom Stock Plan 2013, and combines the granting of stock
options with the granting of phantom stock awards. For further
information on stock options, please see pages 171 ff. of this
Annual Report.
pRoCuReMentIn 2014, the cost of raw materials and supplies and of pur-
chased components and services was € 7,053 million (2013:
€ 6,385 million). The cost of raw materials and supplies were
10% above the previous year’s level. The increase was mainly
due to higher sales volume.
€ in millions 2014 2013
Cost of raw materials and supplies 6,079 5,566
Cost of purchased components and services 974 819
total 7,053 6,385
An efficient value chain is important for our profitability. In an
environment characterized by ongoing cost-containment pres-
sure from health insurers as well as price pressure, security
and quality of supply play a crucial role. Within each business
segment of the Fresenius Group, procurement processes are
coordinated centrally, enabling us to bundle similar require-
ments and negotiate global framework agreements.
COST OF MATERIAL BY BuSINESS SEGMENT 1
Fresenius Vamed 8%
Fresenius Helios 15%
Fresenius Kabi 26%
1 Before consolidation
Fresenius Medical Care 51%
2014: € 7,053 million
2013 2012 2011 2010 2009
Profit-sharing bonus 1 in € 2,134 2,164 2,036 2,000 1,749
Eligible employees 2 2,155 2,313 2,220 1,790 1,710
1 The profit-sharing bonus is paid retroactively for the respective fiscal year. It forms part of compensation in some German Group companies. 2 Without eligible employees of Fresenius Medical Care AG & Co. KGaA
PROFIT-SHARING BONuS

Managem
ent Report
54 Management Report
QualitY ManageMentThe quality of our products, services, and therapies is the
basis for optimal medical care. All processes are subject to
the highest quality and safety standards, for the benefit of
the patients and to protect our employees. Our quality man-
agement has the following three main objectives:
▶ to identify value-enhancing processes oriented toward
efficiency and the needs of our customers
▶ to monitor and manage these processes on the basis of
performance indicators
▶ to improve procedures
FResenius MediCal CaRe
Fresenius Medical Care has established quality management
systems at all production sites and dialysis centers and we
commission regular external audits on their use. In Europe,
this is performed by the German technical certification orga-
nization TÜV. These conformance and certification experts
audit our clinical organizations annually to verify their compli-
ance with ISO 9001 for quality management and ISO 14001
for environmental management. In the united States, our clin-
ics are monitored by the Centers for Medicare and Medicaid
Services (CMS), a public health care authority. We also regu-
larly review our quality management systems through inter-
nal audits.
Our ultraCare brand in North America and our NephroCare
brand in the other regions are part of an integrated therapy
concept that sets quality standards in our clinics as well as for
home dialysis. The nephroCare excellence program defines
mid- and long-term operating and quality goals. These goals
pertain to medical quality, but also relate to the effective use of
staff and staff development, enhancing efficiency, standardiz-
ing processes, and the sustainable use of natural resources.
We measure and compare our quality performance in
our clinics using certain performance indicators. In addition
to industry-specific clinical benchmarks, they include our
own quality targets, i. e., linked to the services and advice we
provide. Fresenius Medical Care uses quality parameters
that are generally recognized in the dialysis industry, e. g., the
hemoglobin value.
FResenius Kabi
The global quality management system at Fresenius Kabi
is based on the internationally recognized ISO 9001 standard,
which takes into account many national and international
regulations governing product and services development, man-
ufacturing, and marketing. These include, for example, Good
Clinical Practice (GCP), Good Manufacturing Practice (GMP),
Good Distribution Practice (GDP), the Code of Federal Regula-
tions (CFR) of the u.S. Food and Drug Administration (FDA),
as well as the ISO 13485 quality management standard for
medical devices. The global quality management system is cer-
tified by TÜV Süd and annually audited on an international
basis. Our quality management comprises:
▶ global processes and standards: Specialist teams develop
enterprise-wide standards and guidelines. Those apply to
all production sites of Fresenius Kabi.
▶ early warning system: We have established reporting
processes for standard procedures and unforeseen events,
which are evaluated against key performance indicators,
e. g., complaint rates.
▶ integrated global crisis management: Safety officers
respond immediately when we are informed of a problem
with quality of patient safety. They manage product
recalls centrally.
At Fresenius Kabi, inspections by regulatory authorities and
audits by independent organizations and customers are per-
formed along the entire value chain.
However, our quality management system does not just
extend to internal processes. It also covers the application of
our products and services by customers. In order to be able to
receive information about their problems in a timely manner
and deal with them appropriately, Fresenius Kabi has set up a
global monitoring and reporting system (vigilance system).
The responsible regulatory authorities monitor this system and
keep an increasingly close eye on it in the interests of patient
safety.
In 2014, we migrated the customer complaint management
process to new web-based technology. In addition, we have
strengthened our quality management organization with new
employees.

Man
agem
ent
Rep
ort
Management Report Fundamental information about the Group 55
FResenius helios
The helios quality management system has been further
expanded and implemented at all hospitals acquired from
Rhön-Klinikum AG. HELIOS has developed a method that
combines the use of quality indicators with internal quality
management measures. The quality of medical outcomes
resulting from the different treatments is measured using key
indicators compiled from administrative data and then made
transparent on the basis of g-iQi quality indicators (German
Inpatient Quality Indicators). The results are continuously
monitored, and should statistical abnormalities arise, HELIOS
examines these in a peer review process using patient data.
We have defined specific targets for 46 of the G-IQI qual-
ity indicators. These targets are set at a level above the national
average for Germany. In 2014, we achieved this target for
42 1 quality indicators, a success rate of 91% 1 (2013: 91%).
If targets are not met, HELIOS analyzes the cases in the hospi-
tals concerned in order to identify opportunities for improve-
ment and to implement appropriate measures for all HELIOS
hospitals.
In addition, HELIOS is involved in the initiative of Quality
Medicine (iQM). The members of this initiative have a share of
approximately 19% for acute care in Germany. The 250 IQM
members are committed to observing three principles: quality
measurement with administrative data, publication of results,
and peer review processes.
HELIOS provides full transparency for all quality data.
For each acute care hospital, the results for medical treatment
quality as well as the occurrence of the 17 most common
infectious agents are published on the website www.helios-
kliniken.de. Helios exceeds mandatory legal requirements.
A new national quality institute is intended to further
increase the focus on quality of care in German hospitals.
With its own quality management system, HELIOS is well
prepared.
FResenius VaMed
In the planning and construction of hospitals, Fresenius Vamed
sets high quality standards. In particular, these are aimed at
optimizing processes by care level, and ensuring maximum
flexibility in the use of buildings and wards.
Internally, Fresenius Vamed designs its processes for effi-
ciency and sustainability, using interdisciplinary quality stan-
dards. These standards are mostly based on ISO 9001:2008
and ISO 13485:2003 standards, as well as the standards of the
European Foundation for Quality Management (EFQM).
In the hospital area, VAMED uses the certification model
JCi (Joint Commission international). In 2014, this certifica-
tion was awarded to a facility in Austria for the fourth time. In
total, four facilities managed by VAMED in the Czech Republic
and Austria received this certification. These hospitals were
certified to have the highest level of quality, firstly regarding
patient care, secondly regarding hygiene and safety, and thirdly
regarding patient and employee satisfaction.
ResponsibilitY, enViRonMental ManageMent, sustainabilitYWe orient our activities within the Fresenius Group to long-
term goals, and thus ensure that our work is aligned to the
needs of patients and employees, as well as shareholders and
business partners, in a sustainable manner. Our responsibil-
ity as a health care group goes beyond our business opera-
tions. We are committed to protecting nature as the basis
of life and using its resources responsibly. It is our mission to
constantly improve our performance in the areas of environ-
mental protection, occupational health and technical safety,
and product responsibility and logistics, and to comply with
legal requirements.
Indications / standardized mortality ratio (SMR 2) 2014 sMR 2013 SMR 3
Chronic obstructive pulmonary disease (COPD) 0.63 0.72
Acute myocardial infarction (AMI) 0.74 0.77
Heart failure 0.53 0.65
Ischemic stroke 0.81 0.91
Pneumonia 0.66 0.73
Hip fracture 0.88 0.81
1 Excluding acquired Rhön hospitals2 SMR 1 corresponds to the German average.
SMR < 1 = means that mortality is below the German average.3 Adjusted for the current reference value of the German Federal Statistical Office,
excluding hospitals divested in 2014
More information can be found at: http: // www.helios-kliniken.de / medizin / qualitaetsmanagement
HELIOS QuALITY PERFORMANCE INDICATORS (EXTRACT) 1
1 Excluding acquired Rhön hospitals
Managem
ent Report
56 Management Report
The international ISO Standard 14001 is an important bench-
mark for environmental management in the corporate sector.
Among other things, it stresses the need for continuous assess-
ment of a production site’s impact on the environment, for
example with respect to emissions and waste. This interna-
tional standard is implemented at our various production
plants and most of our dialysis clinics. Key environmental per-
formance indicators are, for instance, not only energy and
water consumption, but also the volumes of waste and recy-
cling rates at our locations.
In Europe, our production sites are subject to the eu reg-
ulation ReaCh (Registration, Evaluation, and Authorization of
CHemicals). The aim of REACH is to protect human health
and the environment against hazards and risks from chemical
substances.
FResenius MediCal CaRe
We work on designing our products and processes to be as
environmentally compatible as possible by employing new
materials with improved environmental properties, pushing
the development of new technologies that further reduce
the resource consumption of our dialysis machines, and, not
least, by using energy and raw materials efficiently in pro-
duction.
In Europe, the Middle East, and Africa (EMEA), TÜV-certi-
fied environmental management is part of the integrated
management system. At the end of 2014, nine European pro-
duction sites (2013: eight) and our medical device develop-
ment department were certified according to ISO 14001.
We further implemented our environmental program in
Europe and Latin America, with the aim of improving environ-
mental awareness and environmentally responsible behavior,
enhancing knowledge relating to strategic and operational
environmental issues, improving our eco-efficiency, reinforcing
measures to control environmental risks, and ensuring that
environmental regulations are complied with. Those goals are
measured by a number of environmental objectives for the
individual stages of the value chain, e. g., R & D, logistics, or
at our dialysis clinics. We set environmental improvement
targets for production sites. For example, in the EMEA region
we aim to recycle or thermally recover at least 85% of pro-
duction waste by 2015. In 2014, we exceeded our targets for
reducing electricity consumption and minimizing waste ahead
of schedule.
We developed key performance indicators for energy use and
consumption of raw materials in order to demonstrate the
eco-efficiency of our production processes. This has allowed
us to identify further potential in an already largely optimized
production process. We use an energy management system
as per ISO 50001 at our German production sites in St. Wendel
and Schweinfurt.
One of our central concerns is to further reduce the envi-
ronmental effects of dialysis treatments in a resource- and cost-
efficient manner. We are succeeding in doing so by using
environmentally sound dialysis products and by building eco-
friendly dialysis centers. We gather data on our eco-efficiency,
such as our water and energy consumption, and on waste
disposal in 501 (2013: 497) of our European, and 168 (2013:
126) of our Latin American dialysis clinics. Our goal over
time is to establish a comprehensive environmental data
management system. We are able to compare the ecological
efficiency of clinics on a monthly basis, and quickly identify
potential for improvement. In the united States, the energy
and water consumption of our dialysis clinics is documented
within our environmental management and analyzed using
key performance indicators such as greenhouse gas emissions
and climate balance.
FResenius Kabi
An integral component of the quality management of Fresenius
Kabi is an environmental management system that com-
plies with the international standard ISO 14001. We are also
pursuing the implementation of the occupational health and
safety assessment system OHSAS 18001.
We continued to implement measures at our german pro-
duction sites to reduce energy consumption, Co2 emissions,
and the consumption of raw materials: In July 2014, we
installed a combined heat and power plant at our Friedberg
location in Germany. This plant allows us to produce energy
significantly more efficiently and to reduce CO2 emissions by
approximately 30% compared to conventional combustion
power plants.
At the site in Graz, in austria, we were able to keep energy
consumption at the previous year’s level despite the growth
in production area. We were able to reduce natural gas con-
sumption by 3% and steam consumption by 30% by introduc-
ing new production technologies. Additional recycling and
the implementation of technical measures, such as the reuse
of cooling water, minimizes waste and waste water volumes,

Man
agem
ent
Rep
ort
Management Report Fundamental information about the Group 57
and will continue to do so in the future even with rising pro-
duction volumes. The recycling rate remained stable at
above 80%.
At our production sites in uppsala and Brunna, in sweden,
our waste tonnage was 5,646 t (2013: 5,253 t), and our total
recycling rate was 97.0% (2013: 98.4%). The percentage of
waste used to generate energy was on previous year’s level
of 37%. Approximately 41% of the energy needed is provided
by renewable energies. Water consumption was 286,043 m3
(2013: 282,000 m3).
We also expanded our environmental activities outside
of Europe. At our Brazilian production site for infusion bags
we implemented a polyethylene regranulation system, which
recycles 85% of the scrap generated.
Fresenius Kabi also integrates standardized requirements
for health, safety, and environmental protection into its
quality management system. In the manufacturing of pharma-
ceuticals, the employees of Fresenius Kabi sometimes have
to work with toxic substances. Consequently, protecting the
environment and ensuring the health and safety of our employ-
ees is of utmost importance. New requirements relating to
occupational health and safety are integrated into our quality
management.
FResenius helios
Hospitals require a great deal of energy and water. In order
to create awareness for the economical use of resources, we
intensified the environmental campaign within HELIOS and
extended it to the new HELIOS hospitals.
The structural condition of a hospital building has an
important influence on energy consumption. All new construc-
tion projects and modernizations conform to the latest stan-
dards of efficient heat insulation pursuant to the currently
valid energy savings regulations. In addition to the environ-
mental campaign, HELIOS has introduced a controlling sys-
tem for its facility management. Results are released on a
monthly basis and allow for timely analysis of targets against
figures achieved, and corresponding optimization measures.
In 2014, HELIOS has installed combined heat and power
plants and gas turbines in 30 hospitals, doubling the Com-
pany’s number of heat and power plants. In addition, HELIOS
is successively switching the heating of its hospitals over to
renewable energies, for instance wood pellets. This form of
heating is CO2-neutral and therefore more environmentally
friendly than gas or oil heating. Thanks to the steps taken, we
generated approximately 34,500 t (2013: 13,100 t) less CO2
in 2014. We surpassed our energy savings target by 10,000 t
of CO2 in 2014.
Water consumption 1 in all HELIOS hospitals was
4,152,704 m3 (2013: 2,805,000 m3). The majority of all water
is consumed for sterilization processes, process cooling,
and water recycling plants. To reduce consumption, some
hospitals are using well water, for instance for the cooling
towers of air-conditioning systems.
Proper waste disposal is of great importance to hospitals.
HELIOS views waste disposal management as a process. It
starts with avoiding any future waste, and ends with the con-
sistent recycling or environmentally friendly disposal of the
same. Requirements pertaining to environmental protection,
occupational health and safety, as well as infection protec-
tion and hospital hygiene are taken into account. That relates
particularly to major waste groups such as clinical waste,
i. e., from the diagnosis and treatment of human diseases. In
2014, the total amount of waste 1 generated in all HELIOS
hospitals was 21,125 t (2013: 12,845 t).
FResenius VaMed
In our project business, we already integrate national environ-
mental standards and regulations into the planning and con-
struction of a hospital or other health care facility. VAMED’s
extensive expertise in environmental management is an impor-
tant success factor, especially in growth markets in Africa
and Asia. For instance, VAMED built and now operates a hos-
pital in Gabon, which features a modern sewage treatment
plant and a high-temperature incineration plant designed to
European standards.
We also achieved success in the service business in
the area of environmental protection. VAMED, for instance,
has been responsible for the technical management of the
Vienna General Hospital and university Hospital AKH for over
25 years. During the period, energy and water consumption
were significantly reduced: energy consumption decreased by
13%, demand for long-distance heat by 22%, and drinking
water consumption by 40%. The volume of waste classified as
hazardous medical waste at AKH fell by about 70%.
1 The increase is primarily due to the acquisition of 41 hospitals from Rhön-Klinikum AG.

Managem
ent Report
Management Report58
RepoRt on economic position
HeALtH cARe inDUstRYThe health care sector is one of the world’s largest industries.
It is relatively insensitive to economic fluctuations compared
to other sectors and has posted above-average growth over
the past several years.
The main growth factors are:
▶ rising medical needs deriving from aging populations
▶ the growing number of chronically ill and multimorbid
patients
▶ stronger demand for innovative products and therapies
▶ advances in medical technology
▶ the growing health consciousness, which increases the
demand for health care services and facilities.
In the emerging countries, drivers are:
▶ expanding availability and correspondingly greater
demand for basic health care
▶ increasing national incomes and hence higher spending
on health care.
At the same time, the cost of health care is rising and claim-
ing an ever-increasing share of national income. Health care
spending averaged 9.3% of GDP in the OECD countries in
2012, with an average of US$ 3,484 spent per capita.
As in previous years, the United States had the highest per
capita spending (US$ 8,745). Germany ranked sixth among the
OECD countries with per capita spending of US$ 4,811.
In Germany, 77% of health spending was funded by pub-
lic sources in 2012, above the average of 72% in the OECD
countries.
Most of the OECD countries have enjoyed large gains in
life expectancy over the past decades, thanks to improved
living standards, public health interventions, and progress in
medical care. In 2012, average life expectancy in the OECD
countries was 80.2 years.
Health care structures are being reviewed and cost-cutting
potential identified in order to contain the steadily rising
health care expenditures. However, such measures cannot
compensate for the cost pressure. Market-based elements
are increasingly being introduced into the health care system
to create incentives for cost- and quality-conscious behavior.
Overall treatment costs will be reduced through improved
quality standards. In addition, ever-greater importance is being
placed on disease prevention and innovative reimbursement
models linked to treatment quality standards.
Our most important markets developed as follows:
HEALTH CARE SPENDING AS % OF GDP
Sources: OECD Health Data 2014
in % 2012 2000 1990 1980 1970
USA 16.9 13.1 11.9 8.7 6.8
France 11.6 10.1 8.4 7.0 5.4
Germany 11.3 10.4 8.3 8.4 6.0
Switzerland 11.4 9.9 8.0 7.2 5.3
Source: OECD Health Data 2014

Man
agem
ent
Rep
ort
management Report Report on economic position 59
tHe DiALYsis mARket
In 2014, the global dialysis market (products and services)
was worth approximately US$ 77 billion. In constant currency,
the global dialysis market grew by 4%.
The number of dialysis patients worldwide increased by
about 6% to approximately 2.7 million in 2014. Of these,
about 89% were treated with hemodialy sis and approximately
11% with peritoneal dialysis. The major growth driver is the
growing number of patients suffering from diabetes and high
blood pressure, two diseases that often precede the onset of
chronic kidney failure.
The United States, Japan, and Western and Central Europe
recorded below-average growth in the number of patients
in 2014. In economically weaker regions, growth was above
average.
The prevalence rate, which is the number of people with
terminal kidney failure treated per million population, differs
widely from region to region. In developing countries it can
be well below 100. It averages just over 1,100 in the countries
of the European Union. Prevalence is very high in countries
such as Japan and the United States, being well over 2,000.
The significant divergence in prevalence rates is due, on the
one hand, to differences in age demographics, incidence of
renal risk factors, and genetic pre-disposition and cultural
habit, such as nutrition. On the other hand, access to dialysis
treatment is still limited in many countries. A great many
individuals with terminal kidney failure do not receive treat-
ment and are therefore not included in the prevalence
statistics.
Dialysis careIn 2014, the global dialysis care market (including renal
pharmaceuticals) was worth approximately US$ 63 billion.
11% of worldwide dialysis patients were treated by
Fresenius Medical Care. With 3,361 dialysis clinics and 286,312
dialysis patients in over 45 countries, Fresenius Medical Care
operates by far the largest and most international network
of hospitals. In the United States, Fresenius Medical Care
maintained its market-leading position of approximately 37%
(~ 171,000) dialysis patients in 2014. The market for dialysis
care in the United States is already highly consolidated. Taken
together, Fresenius Medical Care and the second-largest pro-
vider of dialysis care − DaVita − treat over 70% of all U.S. dial-
ysis patients.
Outside the United States, the market for dialysis care is
much more fragmented. Here, Fresenius Medical Care com-
petes mainly with independent clinics and with clinics that are
affiliated with hospitals.
Dialysis reimbursement systems differ from country to
country and often vary even within individual countries. The
public health care programs, the Centers for Medicare &
Medicaid Services (CMS), cover the medical services for the
majority of all dialysis patients in the United States.
Dialysis productsIn 2014, the global dialysis products market was worth
approximately US$ 14 billion.
Fresenius Medical Care is the leading provider of dialysis
products in the world, with a market share of about 34%,
followed by its largest competitor, Baxter, with 29%. Each of
the other competitors, mainly from Japan, held a single-digit
percentage market share.
Fresenius Medical Care is the leading supplier worldwide
of hemodialysis products with a market share of 38%. With
a market share of 21%, Fresenius Medical Care is the second-
largest provider worldwide of products for peritoneal dialysis
after Baxter. In the United States, Fresenius Medical Care’s
share of the peritoneal dialysis market is 43%.
DIALYSIS PATIENTS BY REGION
Latin America 10%
North America 22%
Europe / Middle East / Africa 25%
Asia-Pacific 43%
2014: 2,665,000 patients

Managem
ent Report
Management Report60
tHe mARket foR geneRic iv DRUgs, cLinicAL
nUtRition, infUsion tHeRApY, AnD meDicAL
Devices / tRAnsfUsion tecHnoLogY 1
The global market for generic IV drugs, clinical nutrition,
infusion therapy and medical devices / transfusion technology
was worth about € 29 billion in 2014.
Thereof, the global market for generic iv drugs was
worth about € 13 billion. In Europe and the United States, the
market grew by about 5% to 6%. Growth is mainly achieved
through new generics that are brought to market when the
original drug goes off-patent. The market is characterized by
moderate volume growth, steady price erosion, and fierce
competition. In the United States, the most important market
for Fresenius Kabi, the company is one of the leading suppli-
ers. Competitors include Hospira, Sandoz, and Teva Pharma-
ceutical Industries.
The global market for clinical nutrition was worth about
€ 6 billion in 2014. In Europe, the market for clinical nutrition
grew by about 3%. In the emerging markets of Asia-Pacific,
Latin America, and Africa, the clinical nutrition market saw
growth of up to 10%. Growth potential is offered by the often
insufficient administration of nutrition therapies within patient
care – although studies have demonstrated the medical and
economical benefit. In cases of health or age-induced nutri-
tional deficiencies, for example, the administration of clinical
nutrition can reduce hospital costs through shorter stays
and less nursing care. Estimates regarding the European Union
situation indicate that as many as 20 million individuals are
at risk for malnutrition. In the market for clinical nutrition,
Fresenius Kabi is one of the leading companies worldwide. In
parenteral nutrition, the company is the leading supplier
worldwide. In the market for enteral nutrition, Fresenius Kabi
is one of the leading suppliers in Europe. In parenteral nutri-
tion, competitors include Baxter and B. Braun. In the market
for enteral nutrition, Fresenius Kabi competes with, among
others, Abbott, Danone, and Nestlé.
Fresenius Kabi considers its global market for infusion ther-
apy to have been worth about € 5 billion in 2014. In Europe,
the market remained at the prior year’s level in 2014. Growth
in the standard solutions business could not fully offset the
sales decline in blood volume substitutes. In the regions Asia-
Pacific, Latin America, and Africa, the market grew by 4%.
Infusion therapies, such as electrolytes, are standard medical
products to hospitals worldwide. Market growth is mainly
driven by increasing product demand in the emerging markets.
Fresenius Kabi is the market leader in infusion therapy in
Europe. Competitors include Baxter and B. Braun.
We estimate that the global market for medical devices /
transfusion technology to have been worth about € 5 billion
in 2014, including about € 3 billion for medical devices and
about € 2 billion for transfusion technology. The market for
medical devices worldwide grew by about 4% in 2014, while
the market for transfusion technology showed growth of about
1% to 2%. In the medical devices market, the main growth
drivers are technical innovations that focus on application
safety and therapy efficiency. In the transfusion technology
market, growth is driven by increased demand in emerging
markets. Moreover, growth is driven by the growing demand
for plasma-collection devices. Reduced demand for blood bags
and related price reductions have a negative effect. In the
medical devices segment, Fresenius Kabi ranks among the
leading suppliers worldwide. International competitors include
Baxter, B. Braun, CareFusion, and Hospira. In transfusion
technology, Fresenius Kabi is one of the world’s leading com-
panies. Competitors include Haemonetics and Terumo. In all
product segments, Fresenius Kabi also competes with smaller
local providers.
1 Market data refer to Fresenius Kabi’s relevant and addressable markets. Those are subject to annual volatility due to currency fluctuations and patent expiries of original drugs in the IV drug market, among other things.
Sources: Company research, German Society for Nutritional Medicine (DGEM) 2009; Ljungqvist O., Clin Nutr 2010, 29:149-150

Man
agem
ent
Rep
ort
management Report Report on economic position 61
HOSPITAL BEDS BY OPERATOR
Private hospitals 18%
Independent non-profit hospitals 34%
Public hospitals 48%
2013: 500,671
Source: German Federal Statistical Office 2014
KEY FIGURES FOR INPATIENT CARE IN GERMANY
2013 2012 2011 2010 2009Change
2013 / 2012
Hospitals 1,996 2,017 2,045 2,064 2,084 - 1.0%
Beds 500,671 501,475 502,029 502,749 503,341 - 0.2%
Beds per 1,000 population 6.21 6.24 6.26 6.15 6.15 - 0.5%
Length of stay (days) 7.5 7.6 7.7 7.9 8.0 - 1.3%
Number of admissions (millions) 18.79 18.62 18.34 18.03 17.82 0.9%
Average costs per admission in € 1 4,792 4,663 4,547 4,432 4,327 2.8%
1 Total costs, gross
Source: German Federal Statistical Office 2014
tHe geRmAn HospitAL mARket
In 2013 1, the market of acute care hospitals in Germany was
about € 87 billion 2. Personnel costs accounted for about 61%
of hospital costs, and material costs for 38%. Personnel and
material costs each rose by approximately 4%.
Through the increase in admissions, the organic growth of
the acute care hospital market was around 1%. In addition,
potential for growth for private hospital operators arises from
hospital acquisitions or privatization.
The financial situation at hospitals in Germany remained
difficult in 2013, despite a slight easing. 42% of all hospitals
reported a loss at year-end (2012: 51%). The difficult eco-
nomic and financial situation is often accompanied by signifi-
cant investment needs. This is due, in large part, to an invest-
ment backlog that has accumulated because, in the past,
the federal states failed to meet their statutory obligation to
finance necessary investments and major maintenance mea-
sures sufficiently due to budget constraints. At the same time,
investment needs are driven by technological advances, higher
quality requirements, and necessary modernizations. The
Rheinisch-Westfälisches Institut für Wirtschaftsforschung (RWI)
estimates that the investment gap at German hospitals is
about € 37 billion.
The number of hospitals in 2013 was 1,996 and the
number of beds was 500,671. For further figures on the Ger-
man hospital market please see the table below.
Fresenius Helios is the leading hospital operator in Ger-
many, with a market share of about 6%. The hospitals of
Fresenius Helios compete mainly with individual hospitals or
local and regional hospital associations. Among private hospi-
tal chains, our main competitors are Asklepios, Rhön-Klinikum,
and Sana Kliniken.
For the increase in reimbursements of hospital treat-
ments the so-called change in value figure is relevant. It is
used to compensate for rising costs in the hospital market,
particularly with regard to personnel and material costs. The
change in value figure is determined each year again for the
following year. For the year 2014 it was 2.81%.
In 2013, the post-acute care market in Germany com-
prised of 1,187 clinics with a total of 166,889 beds. Of these,
nearly two-thirds (65.2%) were in private preventive or post-
acute care clinics, 16.3% were in independent non-profit
clinics, and 18.5% in public clinics. The number of treated
patients decreased nationwide by about 11,000 to 1.95 mil-
lion. The average length of stay declined slightly and was
25.3 days (2012: 25.5 days).
1 Most recent data available on the German hospital market from German Federal Statistical Office 2 Total costs, gross of the German hospitals less academic research and teaching
Sources: German Federal Statistical Office 2014; German Hospital Institute (DKI), Krankenhaus Barometer 2014; OECD Health Data 2014; Rheinisch-Westfälisches Institut für Wirtschaftsforschung (RWI), Krankenhaus Rating Report 2014

Managem
ent Report
Management Report62
tHe mARket foR pRojects AnD seRvices foR
HospitALs AnD otHeR HeALtH cARe fAciLities
The market for projects and services for hospitals and other
health care facilities is very fragmented. Therefore, an over-
all market size cannot be determined. The market is country-
specific and depends, to a large extent, on factors such as
public health care policies, government regulation, levels of
privatization, economic conditions, and demographics.
In markets with established health care systems and
mounting cost pressure, the challenge for hospitals and other
health care facilities is to increase their efficiency. Here,
demand is especially high for sustainable planning and
energy-efficient construction, optimized hospital processes,
and the outsourcing of medical-technical support services
to external specialists. This enables hospitals to concentrate
on their core competency − treating patients. In emerging
markets, the focus is on building and developing infrastruc-
ture and improving the level of health care.
Fresenius Vamed is one of the world’s leading companies
in this market. The company has no competitors that cover
its comprehensive portfolio of services across the entire life
cycle worldwide. Competitors offer only parts of Fresenius
Vamed’s service portfolio. Depending on the service, the com-
pany competes with international companies and consortia
as well as with smaller local providers.
oveRALL BUsiness DeveLopment
tHe mAnAgement BoARD’s Assessment of tHe
effect of geneRAL economic DeveLopments
AnD tHose in tHe HeALtH cARe sectoR foR
fReseniUs
Overall, the development of the world economy had an only
negligible impact on our industry in 2014. On the whole,
the health care sector, both in mature and growth markets,
developed positively, with continued increasing demand for
health services. This had a positive effect on our business
development.
tHe mAnAgement BoARD’s Assessment of tHe
BUsiness ResULts AnD significAnt fActoRs
Affecting opeRAting peRfoRmAnce
The Management Board is of the opinion that the Fresenius
Group’s performance in 2014 was successful. Fresenius
Medical Care achieved organic sales growth of 5%. Despite
the rebasing of Medicare’s reimbursement rate in the United
States, Fresenius Medical Care’s EBIT was at the previous
year’s level. Fresenius Kabi achieved organic sales growth of
4% and EBIT 1 of € 873 million. EBIT 1 was influenced by
the lower sales of HES blood volume substitutes as well as
by the easing of IV drug shortages in the United States.
Fresenius Helios increased sales by 55%. The strong increase
was mainly due to the first-time consolidation of the acquired
hospitals from Rhön-Klinikum AG. The integration of the
acquired hospitals is progressing as planned. Organic sales
growth of Fresenius Helios was 4%. The company increased
EBIT 2 significantly by 42% to € 553 million. Fresenius
Vamed increased sales slightly by 2%. Due to project delays
in Russia and Ukraine organic sales growth was flat. EBIT
grew by 7% to € 59 million.
1 Before special items2 2014 before special items
For a detailed overview of special items please see the reconciliation table on page 66. The special items are reported in the Group Corporate / Other segment.

Man
agem
ent
Rep
ort
management Report Report on economic position 63
compARison of tHe ActUAL BUsiness ResULts
WitH tHe foRecAsts
For 2014, we had assumed that strong demand for our prod-
ucts and services would continue despite ongoing cost-
containment efforts in the health care sector. This proved to
be the case.
The table below shows our initial guidance for 2014 as
communicated in February 2014. In May, we provided more
details on the outlook for Fresenius Kabi. In July, we were
able to increase the forecast for Group sales based on acqui-
sitions at Fresenius Medical Care. In addition, we forecast
that the newly acquired hospitals would make a contribution
to sales at Fresenius Helios of € 1.8 billion. In addition, EBIT 1
including the acquired hospitals of € 540 to € 560 million
was expected for Fresenius Helios. In November, we adjusted
the forecast for organic sales growth of Fresenius Vamed
due to project delays in Russia and Ukraine. The outlook for
the EBIT margin 2 at Fresenius Kabi was set at around 17%
at this time.
The forecast for the currency-adjusted sales growth of
14% to 16% was achieved by Fresenius Group. At 16%, this
was at the upper end of the target range. net income (before
special items) 3 increased by 4% in constant currency and
was fully within the targeted range of 2% to 5%.
ACHIEVED GROUP TARGETS 2014
Targets for 2014 announced
in February 2014
Guidance announced
in May 2014
Guidance announced in July 2014
Guidance announced
in November 2014Achieved in
2014
Group
Sales (growth, in constant currency) 12% – 15% 1 14% – 16% 2 16%
Net income 3 (growth, in constant currency) 2% – 5% 4%
Fresenius Medical Care 4
Sales ~ US$ 15.2 bn US$ 15.8 bn 6
Net income 5 US$ 1.0 bn – US$ 1.05 bn US$ 1.05 bn 7
Fresenius Kabi 8
Sales (growth, organic) 3% – 7% 4% – 6% 4%
EBIT margin 16% – 18% 16.5% – 18% ~ 17% 17%
Fresenius Helios 9
Sales (growth, organic) 3% – 5% 4%
Sales contribution acquired hospitals ~ € 1.8 bn € 1.8 bn
EBIT € 390 m – € 410 m 10 € 540 m – € 560 m 11 € 553 m 11
Fresenius Vamed
Sales (growth, organic) 5% – 10% 0% 0%
EBIT (growth) 5% – 10% 7%
1 Includes acquisition of hospitals from Rhön-Klinikum AG 2 Includes acquisition of hospitals from Rhön-Klinikum AG and acquisitions at Fresenius Medical Care 3 Net income attributable to shareholders of Fresenius SE & Co. KGaA; 2014 before integration costs (hospitals of Rhön-Klinikum AG € 41 million;
Fenwal € 33 million) and disposal gains (two HELIOS hospitals € 21 million; Rhön stake € 34 million); 2013 before integration costs for Fenwal (€ 40 million). 4 This outlook excludes sales of approximately US$ 500 million from acquisitions.
Potential cost savings before income taxes of up to US$ 60 million are not included in the outlook for 2014. 5 Net income attributable to the shareholders of Fresenius Medical Care AG & Co. KGaA 6 Including acquisitions 7 Including cost savings from the global efficiency program 8 Before integration costs for Fenwal (2014: € 50 million; 2013: € 54 million). 9 Before integration costs (hospitals of Rhön-Klinikum AG € 51 million) and disposal gains (two HELIOS hospitals € 22 million).10 Excluding acquired Rhön hospitals 11 Including acquired Rhön hospitals
1 2014 before special items2 Before special items3 Net income attributable to the shareholders of Fresenius SE & Co. KGaA
For a detailed overview of special items please see the reconciliation table on page 66. The special items are reported in the Group Corporate / Other segment.

Managem
ent Report
Management Report64
Fresenius invested € 1,345 million in property, plant and
equipment (2013: € 1,073 million). That was well in line with
the budgeted level of about 6% as percentage of sales.
operating cash flow was € 2,585 million (2013: € 2,320
million). The cash flow margin was 11.1% (2013: 11.4%)
and hence slightly above our expectations. We had expected
to achieve a cash flow margin between 9% and 11%.
Group net debt / eBitDA was 3.41 1 (3.26 1 at 2014 aver-
age exchange rates for both net debt and EBITDA) and thus
above the targeted range of 3.0 to 3.25, mainly due to the
acquisitions at Fresenius Medical Care in the fourth quarter
of 2014.
Group ROIC was 7.5% 1 (2013: 8.8% 2), and Group ROOA
was 9.1% 1 (2013: 10.6% 2) and hence as expected below the
level of 2013.
ResULts of opeRAtions, finAnciAL position, Assets AnD LiABiLities
ResULts of opeRAtions
salesIn 2014, we increased Group sales by 16% in constant cur-
rency and by 14% at actual rates to € 23,231 million (2013:
€ 20,331 million). The chart on the right shows the various
influences on Fresenius’ Group sales.
In 2014, the main effects of changes in product mix took
place in the first half of the year at Fresenius Kabi as a result
of lower sales of blood volume substitutes based on hydroxy-
ethyl starch (HES).
price effects were seen at Fresenius Medical Care. Medi-
care reimbursement rates decreased slightly in 2014. In addi-
tion, price cuts made in China in February 2013 continued to
have an impact at Fresenius Kabi in the first quarter of 2014.
In 2015, we expect no significant effects from changes in
product mix. However, we expect pricing effects for Fresenius
Kabi and Fresenius Medical Care. The Medicare reimburse-
ment rate in the United States will also remain virtually
unchanged in 2015.
sales growth by region was as follows:
The most important regions in the Group are North Amer-
ica and Europe, contributing 40% and 44% of total sales,
respectively, followed by Asia-Pacific with 9%, and Latin Amer-
ica and Africa with 5% and 2%, respectively. Germany con-
tributed 27% to Group sales.
In North America, organic sales growth was 4%. In con-
stant currency, sales increased by 8%. In Europe, organic sales
growth was 3% (24% in constant currency). In the Asia-Pacific
region, organic sales growth was 6% (16% in constant cur-
rency). Strong organic sales growth of 10% was achieved in
Latin America (15% in constant currency). In Africa organic
sales growth was 2% (2% in constant currency).
SALES BY REGION
€ in millions 2014 2013 ChangeOrganic
sales growth
Currency translation
effectsAcquisitions /
divestitures% of total
sales
North America 9,307 8,620 8% 4% 0% 4% 40%
Europe 10,162 8,216 24% 3% 0% 21% 44%
Asia-Pacific 2,205 1,945 13% 6% - 3% 10% 9%
Latin America 1,186 1,174 1% 10% - 14% 5% 5%
Africa 371 376 - 1% 2% - 3% 0% 2%
total 23,231 20,331 14% 4% - 2% 12% 100%
1 Pro forma acquisitions; before special items2 Pro forma excluding advances made in the amount of € 2.18 billion under a fiduciary agreement for the acquisition of hospitals
and outpatient facilities of Rhön-Klinikum AG; before special items
14%
SALES GROWTH ANALYSIS
4%
12% 0% - 2%
Organic sales growth
Acquisitions Divestitures Currency Total sales growth

Man
agem
ent
Rep
ort
management Report Report on economic position 65
sales growth in the business segments was as follows:
▶ Fresenius Medical Care achieved sales of € 11,917 million
in 2014 (2013: € 11,000 million). Organic sales growth
was 5%, while acquisitions contributed 5%. Divestitures
had no effect on sales growth. Currency translation had
a negative effect of 2%.
▶ Fresenius Kabi increased sales by 3% to € 5,146 million
(2013: € 4,996 million). Sales growth was affected by
lower sales of HES blood volume substitutes as well as by
easing of IV drug shortages in the United States. The
company achieved organic sales growth of 4%. Acquisi-
tions contributed 1% to sales growth. Divestitures had no
effect. Currency translation had a negative effect of 2%.
▶ Fresenius Helios increased sales by 55% to € 5,244 mil-
lion (2013: € 3,393 million). The strong increase is due
to the first-time consolidation of the acquired hospitals
from Rhön-Klinikum AG contributing € 1,791 million. An
increase in admissions and price increases for hospital
services contributed to organic sales growth of 4%. Dives-
titures reduced sales growth by 2%.
▶ Fresenius Vamed increased sales by 2% to € 1,042 mil-
lion (2013: € 1,020 million). Due to project delays in Rus-
sia and Ukraine organic sales growth was flat. Acquisi-
tions contributed 2% to sales growth. Sales in the project
business decreased by 4% to € 558 million (2013: € 583
million). Sales in the service business grew by 11% to
€ 484 million (2013: € 437 million). order intake in the
project business again developed well; it increased by
13% to € 840 million (2013: € 744 million), mainly driven
by the modernization contract with the University Hos-
pital Schleswig-Holstein in Germany. Fresenius Vamed
increased its order backlog by 23% to € 1,398 million
(December 31, 2013: € 1,139 million). Fresenius Vamed
is the only business segment within the Fresenius Group
whose business is significantly determined by order
intake and order backlog.
earnings structuregroup net income (before special items) 1 rose by 3% to
€ 1,086 million (2013: € 1,051 million). Growth in constant
currency was 4%. earnings per share (before special
items) 1 rose to € 2.01 (2013: € 1.96 2). This represents an
SALES BY BUSINESS SEGMENT
€ in millions 2014 2013 Change
Organic sales
growth
Currency translation
effectsAcquisitions /
divestitures% of total
sales
Fresenius Medical Care 11,917 11,000 8% 5% - 2% 5% 51%
Fresenius Kabi 5,146 4,996 3% 4% - 2% 1% 22%
Fresenius Helios 5,244 3,393 55% 4% 0% 51% 23%
Fresenius Vamed 1,042 1,020 2 % 0% 0% 2% 4%
ORDER INTAKE AND ORDER BACKLOG − FRESENIUS VAMED
€ in millions 2014 2013 2012 2011 2010
Order intake 840 744 657 604 625
Order backlog (December 31) 1,398 1,139 987 845 801
1 Net income attributable to shareholders of Fresenius SE & Co. KGaA2 Adjusted for 1 : 3 share split in 2014
For a detailed overview of special items please see the reconciliation table on page 66. The special items are reported in the Group Corporate / Other segment.

Managem
ent Report
Management Report66
increase of 3% at actual rates and of 3% in constant currency.
The weighted average number of shares was 540.3 million.
Including special items, Group net income attributable to
shareholders of Fresenius SE & Co. KGaA increased by 6%
to € 1,067 million (2013: € 1,011 million). Earnings per share
increased by 4% to € 1.97 (2013: € 1.89 1).
Inflation had no significant effect on results of operations
in 2014.
group eBitDA 2 increased by 5% to € 4,095 million (2013:
€ 3,888 million). This corresponds to an increase of 6% in con-
stant currency. group eBit 2 increased by 4% to € 3,158 mil-
lion (2013: € 3,045 million). This corresponds to an increase
of 4% in constant currency.
eBit development by business segment was as follows:
▶ Fresenius Medical Care’s EBIT was € 1,697 million (2013:
€ 1,699 million) and hence on previous year’s level (con-
stant currency: 0%). The EBIT margin was 14.2% (2013:
15.4%). The decrease of the margin is mainly due to the
rebasing of Medicare’s reimbursement rate in the United
States.
▶ Fresenius Kabi’s EBIT 2 decreased to € 873 million (2013:
€ 926 million). Lower sales of HES blood volume substi-
tutes and the easing of IV drug shortages in the United
States had an adverse effect. Currency translation had
a negative effect of 2%. The EBIT 2 margin was 17.0%
(2013: 18.5%).
▶ Fresenius Helios increased EBIT 3 by 42% to € 553 million
(2013: € 390 million). The strong increase is due, among
other reasons, to the first-time consolidation of the acquired
hospitals from Rhön-Klinikum AG. The EBIT 3 margin was
10.5% (2013: 11.5%). The EBIT 3 margin decline is due to
the newly acquired hospitals.
▶ Fresenius Vamed increased EBIT by 7% to € 59 million
(2013: € 55 million). The EBIT margin was 5.7% (2013:
5.4%).
Reconciliation to group net incomeThe Group’s U.S. GAAP financial results as of December 31,
2014 and as of December 31, 2013 comprise special items.
Net income attributable to shareholders of Fresenius SE & Co.
KGaA was adjusted for these special items. The table below
shows the special items and the reconciliation from net income
(before special items) to earnings according to U.S. GAAP.
RECONCILIATION
1 Adjusted for 1 : 3 share split in 20142 Before special items3 2014 before special items
For a detailed overview of special items please see the reconciliation table on this page. The special items are reported in the Group Corporate / Other segment.
€ in millions
Q1 – 4 / 2014 (before special items)
Fenwal integration
costs
Integra tion costs for acquired
Rhön hospitals
Disposal gain from two
HELIOS hospitals
Disposal gain from Rhön-
stake 1
Q1 – 4 / 2014 according to
U.s. gAAp (incl. special
items)
Q1 – 4 / 2013 (before special items)
Fenwal integration
costs
Q1 – 4 / 2013 according to
U.S. GAAP (incl. special
items)
sales 23,231 23,231 20,331 20,331
eBit 3,158 - 50 - 51 22 35 3,114 3,045 - 54 2,991
Interest result - 602 - 602 - 584 - 584
net income before taxes 2,556 - 50 - 51 22 35 2,512 2,461 - 54 2,407
Income taxes - 725 17 10 - 1 - 1 - 700 - 683 14 - 669
net income 1,831 - 33 - 41 21 34 1,812 1,778 - 40 1,738
Less noncontrolling interest - 745 - 745 - 727 - 727
net income 2 1,086 - 33 - 41 21 34 1,067 1,051 - 40 1,011
1 Fresenius sold its 5% stake in Rhön-Klinikum AG in June 2014. Fresenius acquired the stake in 2012 as part of its takeover bid for Rhön-Klinikum AG.2 Net income attributable to the shareholders of Fresenius SE & Co. KGaA
The costs are reported in the Group Corporate / Other segment.

Man
agem
ent
Rep
ort
management Report Report on economic position 67
Development of other major items in the statement of incomegroup gross profit rose to € 6,842 million, exceeding the pre-
vious year’s gross profit of € 6,383 million by 7% (8% in con-
stant currency). The increase is primarily due to the first-time
consolidation of hospitals acquired from Rhön-Klinikum AG
and acquisitions at Fresenius Medical Care. The gross margin
was 29.5% (2013: 31.4%). The cost of sales rose by 18% to
€ 16,389 million (2013: € 13,948 million). Cost of sales as a
percentage of Group sales increased to 70.5% in 2014, com-
pared to 68.6% in 2013. selling, general, and administrative
expenses consisted prima rily of personnel costs, marketing
and distribution costs, and depreciation and amortization.
These expenses rose by 10% to € 3,359 million (2013: € 3,044
million), mainly due to the first-time consolidation of acquisi-
tions. Their ratio as a percentage of Group sales decreased
to 14.5% (2013: 15.0%). R & D expenses remained nearly
unchanged at € 369 million (2013: € 348 million). With 5% they
are within the targeted range of approximately 4% to 5%
of our product sales. Depreciation and amortization was
€ 937 million (2013: € 843 million). The ratio as a percentage
of sales was 4.0% (2013: 4.1%). Group personnel costs
increased to € 8,996 million (2013: € 7,360 million). The
personnel cost ratio was 38.7% (2013: 36.2%). The chart
above shows the earnings structure in 2014.
group net interest increased to - € 602 million (2013:
- € 584 million). This was due to higher incremental debt for
the full year due to acquisitions. Favorable financing condi-
tions had a positive effect on Group net interest.
STATEMENT OF INCOME (SUMMARY)
€ in millions 2014 2013 ChangeChange in
constant currency
sales 23,231 20,331 14% 16%
Cost of goods sold - 16,389 - 13,948 - 18% - 19%
Gross profit 6,842 6,383 7% 8%
Selling, general, and administrative expenses - 3,359 - 3,044 - 10% - 12%
Research and development expenses - 369 - 348 - 6% - 7%
EBIT (operating result) 3,114 2,991 4% 5%
Net interest - 602 - 584 - 3% - 4%
Income taxes - 700 - 669 - 5% - 6%
Noncontrolling interest in profit - 745 - 727 - 2% - 3%
net income (before special items) 1 1,086 1,051 3% 4%
Net income 1 1,067 1,011 6% 6%
Earnings per ordinary share in € (before special items) 1 2.01 1.96 2 3% 3%
Earnings per ordinary share in € 1 1.97 1.89 2 4% 5%
EBITDA 4,051 3,834 6% 6%
Depreciation and amortization 937 843 11% 12%
1 Net income attributable to the shareholders of Fresenius SE & Co. KGaA2 Adjusted for 1 : 3 share split in 2014
For a detailed overview of special items please see the reconciliation table on page 66. The special items are reported in the Group Corporate / Other segment.
EARNINGS STRUCTURE (BEFORE SPECIAL ITEMS)
100% 70.4%
16.0%29.6% Group gross profit margin
13.6% EBIT margin
Sales Cost of sales
Operating expenses

Managem
ent Report
Management Report68
The group tax rate (before special items) was 28.4% and
above the prior-year level (2013: 27.8%). The Group tax rate of
2014 was impacted by special tax effects at Fresenius Medical
Care. On the one hand, the tax rate was increased by the rever-
sal of an original tax benefit following a financial court ruling
issued against another company. On the other hand, the tax
rate was favorably influenced by the resolution of challenged
deductions for civil settlement payments taken in prior years.
The Group tax rate of 2013 was positively influenced by the
nearly entirely tax exempted disposal gain of Calea France.
noncontrolling interest increased to € 745 million (2013:
€ 727 million). Of this, 94% was attributable to the noncon-
trolling interest in Fresenius Medical Care.
The table below shows the profit margin development
in 2014.
finAnciAL position
financial management policies and goalsThe financing strategy of the Fresenius Group has the follow-
ing main objectives:
▶ Ensure financial flexibility
▶ Optimize the weighted-average cost of capital
Ensuring financial flexibility is key to the financing strategy of
the Fresenius Group. This is achieved through a broad spec-
trum of financing instruments, taking market capacity, investor
diversification, utilization flexibility, credit covenants, and
the current maturity profile into consideration. The Group’s
maturity profile is characterized by a broad spread of maturi-
ties with a large proportion of mid- to long-term financing.
We also take into account the currency in which our earnings
and cash flows are generated when selecting the financing
instruments, and match them with appropriate debt structures
in the respective currencies. The Group’s main debt financing
instruments are illustrated in the chart on page 69.
Sufficient financial cushion is assured for the Fresenius
Group by unused syndicated and bilateral credit lines. In addi-
tion, Fresenius SE & Co. KGaA has a commercial paper pro-
gram. The Fresenius Medical Care receivable securitization
program offers additional financing options.
Another main objective of Fresenius Group’s financing
strategy is to optimize the weighted-average cost of capital
by employing a balanced mix of equity and debt. Due to the
Company’s diversification within the health care sector and
the strong market positions of the business segments in global,
growing, and non-cyclical markets, predictable and sustain-
able cash flows are generated. These allow for a reasonable
proportion of debt, i. e., the use of a comprehensive mix of
financial instruments. A capital increase may also be consid-
ered in exceptional cases to ensure long-term growth, for
example to finance a major acquisition.
In line with the Group’s structure, financing for Fresenius
Medical Care and the rest of the Fresenius Group is con-
ducted separately. There are no joint financing facilities and
in % 2014 2013 2012 2011 2 2010
EBITDA margin 1 17.6 19.1 20.0 19.8 19.1
EBIT margin 1 13.6 15.0 15.9 15.7 15.1
Return on sales (before taxes and noncontrolling interest) 3 11.0 12.1 12.5 12.4 11.6
1 2013 – 2014 before special items; 2012 before one-time costs (€ 6 million) related to the offer to the shareholders of Rhön-Klinikum AG as well as other one-time costs (€ 86 million) at Fresenius Medical Care
2 2011 sales were adjusted by - € 161 million according to a U.S. GAAP accounting change; this solely relates to Fresenius Medical Care North America.3 2013 – 2014 before special items; 2012 before a non-taxable investment gain (€ 109 million) and other one-time costs (€ 86 million) at Fresenius Medical Care
as well as one-time costs (€ 41 million) related to the offer to the shareholders of Rhön-Klinikum AG; 2009 – 2011 before the effects of mark-to-market accounting of the Mandatory Exchangeable Bonds and the Contingent Value Rights
For a detailed overview of special items please see the reconciliation table on page 66. The special items are reported in the Group Corporate / Other segment.

Man
agem
ent
Rep
ort
management Report Report on economic position 69
no mutual guarantees. The Fresenius Kabi, Fresenius Helios,
and Fresenius Vamed business segments are financed pri-
ma rily through Fresenius SE & Co. KGaA, in order to avoid any
structural subordination.
financingFresenius meets its financing needs through a combination
of operating cash flows generated in the business segments
and short-, mid-, and long-term debt. In addition to bank
loans, important financing instruments include the issuance
of Senior Notes, Euro Notes, a commercial paper program,
and a receivable securitization program.
financing activities during the past fiscal year were
mainly related to the acquisition of hospitals from Rhön-Klini-
kum AG and acquisitions at Fresenius Medical Care. In addi-
tion, financing measures were implemented to increase our
financial flexibility, to further impove terms and conditions as
well as to extend the Company’s maturity profile.
▶ In January 2014, Fresenius Finance B.V. placed Senior
Notes in the amount of € 750 million. The coupon of
the € 300 million tranche due in 2019 was 2.375% at an
issue price of 99.647%. The € 450 million tranche due
in 2021 had a coupon of 3.00% and was issued at a price
of 98.751%. Also in January 2014, Fresenius issued
Senior Notes in the amount of € 300 million with a matu-
rity of 10 years and a coupon of 4.00% at par. These were
increased by € 150 million in February 2014 at a price
of 102%.
▶ In February 2014, Senior Notes in the amount of US$ 300
million with a maturity of 7 years were issued. The notes
have a coupon of 4.25% and were issued at par. The net
proceeds of the Senior Notes issued in January and Febru-
ary 2014 were used to repay a Bridge Financing Facility
that had been entered into in connection with the acquisi-
tion of hospitals from Rhön-Klinikum AG.
▶ Also in February 2014, the incremental facilities under
the 2013 credit agreement in the amount of € 1.2 billion
were disbursed. These had been agreed on in November
2013 and were also used to finance the acquisition of
hospitals from Rhön-Klinikum AG.
▶ In March 2014, Fresenius SE & Co. KGaA issued € 500 mil-
lion of equity-neutral convertible bonds due in 2019. The
bonds were issued at par. The coupon is 0%. The initial
conversion price has been set at a premium of 35% above
the reference price of the Fresenius shares. The conver-
sion price was adjusted after the dividend payment in May
and the capital increase carried out in August from com-
pany funds and amounts to € 49.7249. To fully cover the
financial risks of the conversion right embedded in the con-
vertible bonds, the company simultaneously purchased
call options on its shares. The net proceeds were used to
finance the acquisition of hospitals from Rhön-Klinikum AG.
▶ In April and July 2014, Fresenius SE & Co. KGaA issued
Euro Notes totalling € 500 million in various tranches with
fixed and variable interest rates. The proceeds were used
primarily to refinance maturing Euro Notes.
FINANCING MIx OF THE FRESENIUS GROUP
Equity-neutral convertible bonds 5%
Other financial liabilities 6%
Euro Notes 7%
Syndicated loans 32%
Senior Notes 50%
Dec. 31, 2014: € 15,454 million

Managem
ent Report
Management Report70
▶ In September 2014, Fresenius Medical Care AG & Co. KGaA
issued equity-neutral convertible bonds in the amount of
€ 400 million maturing in 2020. The issue was made at
par. The coupon is 1.125%. The initial conversion price has
been set at a premium of 35% above the reference price
of the shares of Fresenius Medical Care AG & Co. KGaA and
amounts to € 73.6448. To fully cover the financial risks
of the conversion right embedded in the convertible bonds,
Fresenius Medical Care simultaneously purchased call
options on its shares. The net proceeds were used for gen-
eral corporate purposes.
▶ In October 2014, Fresenius Medical Care US Finance II,
Inc. placed US$ 900 million of Senior Notes. The coupon
for the US$ 500 million tranche due in 2020 is 4.125%,
and the coupon for the US$ 400 million tranche due in
2024 is 4.75%. Both tranches were issued at par. The net
proceeds were used to repay a short-term loan from the
Fresenius Medical Care 2012 Credit Agreement and other
short-term debt as well as for acquisitions and general
corporate purposes.
▶ In November 2014, Fresenius Medical Care AG & Co. KGaA
extended the 2012 syndicated credit facility by two years
and expanded it to a facility of approximately US$ 4.4 bil-
lion. It matures in October 2019 and includes revolving
credit facilities amounting to US$ 1 billion and € 400 mil-
lion and loans of US$ 2.5 billion and € 300 million. As
part of an amendment to the agreement, its terms were
improved and certain loan covenants for Fresenius Medical
Care were simplified. The increased credit facility will be
used to finance general corporate purposes, among other
things.
▶ In addition, in November 2014, Fresenius Medical Care
extended the maturity of its receivables securitization pro-
gram in the amount of US$ 800 million to November 2017.
At the same time, its terms were improved. This transac-
tion, coupled with amendment of Fresenius Medical Care’s
2012 credit agreement, contributed to the extension of
the company’s debt maturity profile.
The chart above shows the maturity profile of the Fresenius
Group.
Fresenius SE & Co. KGaA has a commercial paper pro-
gram under which up to € 1 billion in short-term notes can be
issued. As of December 31, 2014, the commercial paper pro-
gram was not utilized.
FINANCIAL POSITION – FIVE-YEAR OVERVIEW
€ in millions 2014 2013 2012 2011 2010
Operating cash flow 2,585 2,320 2,438 1,689 1,911
as % of sales 11.1 11.4 12.6 10.3 12.0
Working capital 1 5,448 4,571 4,470 4,067 3,577
as % of sales 23.5 22.5 23.2 24.9 22.4
Investments in property, plant and equipment, net 1,323 1,047 952 758 733
Cash flow before acquisitions and dividends 1,262 1,273 1,486 931 1,178
as % of sales 5.4 6.3 7.7 5.7 7.4
1 Trade accounts receivable and inventories, less trade accounts payable and payments received on accounts
MATURITY PROFILE OF THE FRESENIUS GROUP
FINANCING FACILITIES 1
€ in millions
1 As of December 31, 2014, major long-term financing instruments; pro forma incl. amended 2013 Credit Agreement in February 2015
2015 2016 2017 2018 2019 2020 2021 2022 2023 2024
4,800
4,400
4,000
3,600
3,200
2,800
2,400
2,000
1,600
1,200
800
400
0

Man
agem
ent
Rep
ort
management Report Report on economic position 71
The Fresenius Group has drawn about € 5.5 billion of bilat-
eral and syndicated credit lines. In addition, as of December
31, 2014, the Group had approximately € 3.3 billion in unused
credit lines available (including committed credit lines of
about € 2.6 billion). These credit facilities are generally used
for covering working capital needs and – with the exception
of the syndicated credit agreements of Fresenius SE & Co. KGaA
and Fresenius Medical Care − are usually unsecured.
As of December 31, 2014, both Fresenius SE & Co. KGaA
and Fresenius Medical Care AG & Co. KGaA, including all
subsidiaries, complied with the covenants under its debt
arrangements.
Detailed information on the Fresenius Group’s financing
can be found on pages 129 to 139 of the Notes. Further infor-
mation on financing requirements in 2015 is included in the
outlook section on page 81.
effect of off-balance-sheet financing instruments on our financial position and liabilitiesFresenius is not involved in any off-balance-sheet transactions
that could, or will, have a significant impact on its financial
position, expenses or income, results of operations, liquidity,
investments, assets and liabilities, or capitalization.
Liquidity analysisIn 2014, key sources of liquidity were operating cash flows
and short-, mid-, and long-term debt. Cash flow from oper-
ations is influenced by the profitability of the business of
Fresenius and by net working capital, especially accounts
CASH FLOW STATEMENT (SUMMARY)
€ in millions 2014 2013 Change margin
Earnings after tax 1,812 1,738 4%
Depreciation and amortization 937 843 11%
Change in pension provisions 93 27 --
cash flow 2,842 2,608 9% 12.2%
Change in working capital - 257 - 288 11%
operating cash flow 2,585 2,320 11% 11.1%
Property, plant and equipment - 1,345 - 1,071 - 26%
Proceeds from the sale of property, plant and equipment 22 24 - 8%
cash flow before acquisitions and dividends 1,262 1,273 - 1% 5.4%
Cash used for acquisitions / proceeds from disposals - 2,028 - 2,556 21%
Dividends - 582 - 491 - 19%
cash flow after acquisitions and dividends - 1,348 - 1,774 24%
Cash provided by / used for financing activities (without dividends paid) 1,625 1,796 - 10%
Effect of exchange rate changes on cash and cash equivalents 34 - 43 179%
change in cash and cash equivalents 311 - 21 --
The detailed cash flow statement is shown in the consolidated financial statements.
CASH FLOW IN € MILLIONS
Cash flow Change in working capital
Operating cash flow
Capex, net Cash flow (before acqs. +
dividends)
Acquisitions + dividends
Cash flow (after acqs. + dividends)
2,842 - 257
2,585 - 1,323
- 2,610
- 1,348
1,262

Managem
ent Report
Management Report72
receivable. Cash flow can be generated from short-term bor-
rowings through the sale of receivables under the Fresenius
Medical Care accounts receivable securitization program, by
using the commercial paper program, and by drawing on
bilateral bank credit agreements. Mid- and long-term fund-
ing are mostly provided by the syndicated credit facilities of
Fresenius SE & Co. KGaA and Fresenius Medical Care, and by
Senior Notes. Fresenius is convinced that its existing credit
facilities, inflows from Senior Note issuances, as well as the
operating cash flows and additional sources of short-term
funding, are sufficient to meet the Company’s foreseeable
liquidity needs.
DividendThe general partner and the Supervisory Board will propose a
dividend increase to the Annual General Meeting. For 2014,
a dividend of € 0.44 per share is proposed. This is an increase
of about 6%. The total dividend distribution will increase by
about 6% to € 238.3 million (2013: € 224.6 million).
cash flow analysis Cash flow was € 2,842 million (2013: € 2,608 million). The
change in working capital was - € 257 million (2013: - € 288 mil-
lion), mainly due to business expansion and acquisitions.
operating cash flow was € 2,585 million in 2014 (2013:
€ 2,320 million). The cash flow margin was 11.1% (2013:
11.4%). The decrease relates primarily to the payment for the
W.R. Grace bankruptcy settlement of US$ 115 million. Oper-
ating cash flow was more than sufficient to meet all financing
needs for investing activities excluding acquisitions, whereby
cash used for capital expenditure was € 1,345 million, and
proceeds from the sale of property, plant and equipment were
€ 22 million (2013: € 1,071 million and € 24 million, respec-
tively).
cash flow before acquisitions and dividends was € 1,262
million (2013: € 1,273 million). This was sufficient to finance
the Group dividends of € 582 million. Group dividends con-
sisted of dividend payments of € 225 million to the sharehold-
ers of Fresenius SE & Co. KGaA, payments of € 232 million
by Fresenius Medical Care to its shareholders, and dividends
paid to third parties of € 198 million (primarily relating to
Fresenius Medical Care). These payments were offset by
the dividend of € 73 million, which Fresenius SE & Co. KGaA
received as a shareholder of Fresenius Medical Care. Net
acquisition expenditures of € 2,028 million were financed by
cash flow and by debt.
The cash inflow from financing activities (without dividend
payments) was € 1,625 million (2013: € 1,796 million). In
2014, it was predominantly characterized by debt financing
of acquisitions of Fresenius Helios and Fresenius Medical
Care and refinancing measures. Cash and cash equivalents as
of December 31, 2014 were € 1,175 million (December 31,
2013: € 864 million).
investments and acquisitionsIn 2014, the Fresenius Group continued its growth path and
invested € 3,795 million (2013: € 3,827 million). investments
in property, plant and equipment increased to € 1,345 million
(2013: € 1,073 million). At 5.8% of sales (2013: 5.3%), this
was well above the depreciation level of € 937 million and
serves as the basis for enabling expansion and preserving the
Company’s value over the long term. A total of € 2,450 million
was invested in acquisitions (2013: € 2,754 million). Of the
total capital expenditure in 2014, 35% was invested in prop-
erty, plant and equipment, 65% was spent on acquisitions.
INVESTMENTS, OPERATING CASH FLOW, DEPRECIATION AND
AMORTIZATION IN € MILLIONS – FIVE-YEAR OVERVIEW
758
639644
1,9111,689
3,172
2,754
2,450
674776
843937
1,0071,073
1,3451,612
783
2,438 2,320
2,585
2010 2011 2012 2013 2014
investments Acquisitions operating cash flow Depreciation and amortization

Man
agem
ent
Rep
ort
management Report Report on economic position 73
The table below shows the distribution of investments by
business segment. The chart on the right shows the regional
breakdown.
The cash outflows for acquisitions is primarily related to
the following business segments:
Fresenius Medical Care invested primarily in the acquisi-
tion of companies to expand the business in medical services
related to dialysis.
Fresenius Kabi acquired a pharmaceutical company in
Brazil, among others, to expand its business in generic
IV drugs.
Fresenius Helios acquired 41 hospitals from Rhön-Klini-
kum AG.
The main investments in property, plant and equipment were
as follows:
▶ optimization and expansion of production facilities, pri-
marily in North America and Europe for Fresenius Medical
Care, and for Fresenius Kabi, primarily in Europe, the
United States, and Asia
▶ modernization of existing, and equipping of new, dialysis
clinics at Fresenius Medical Care
▶ new building and modernization of hospitals at Fresenius
Helios. The most significant individual projects were the
hospitals in Northeim, Schleswig, and Krefeld
Investments in property, plant and equipment of € 227 million
will be made in 2015, to continue with major ongoing invest-
ment projects on the reporting date. These are investment
obligations mainly for hospitals at Fresenius Helios as well as
investments to expand and optimize production facilities for
Fresenius Medical Care and Fresenius Kabi. These projects
will be financed from operating cash flow.
Assets AnD LiABiLities
Asset and liability structureThe total assets of the Group rose by 22% to € 39,897 million
(Dec. 31, 2013: € 32,758 million). In constant currency, this
was an increase of 15%. This increase is mainly attributable
to the first-time consolidation of hospitals acquired from
Rhön-Klinikum AG, acquisitions at Fresenius Medical Care,
and currency effects. Inflation had no significant impact on
the assets of Fresenius in 2014.
INVESTMENTS BY BUSINESS SEGMENT
€ in millions 2014 2013
Thereof property, plant and
equipmentThereof
acquisitions Change % of total
Fresenius Medical Care 2,196 987 701 1,495 122% 58%
Fresenius Kabi 479 448 361 118 7% 12%
Fresenius Helios 1,090 2,357 266 824 - 54% 29%
Fresenius Vamed 22 27 10 12 - 19% 1%
Corporate / Other 8 8 7 1 0% 0%
total 3,795 3,827 1,345 2,450 - 1% 100%
€ in millions 2014 2013 Change
Investment in property, plant and equipment 1,345 1,073 25%
thereof maintenance 42% 49%
thereof expansion 58% 51%
Investment in property, plant and equipment as % of sales 5.8 5.3
Acquisitions 2,450 2,754 - 11%
total investments and acquisitions 3,795 3,827 - 1%
INVESTMENTS AND ACQUISITIONS
INVESTMENTS BY REGION
Other regions 7%
North America 34%
Asia-Pacific 9%
Europe 50%
2014: € 1,345 million

Managem
ent Report
Management Report74
current assets increased to € 10,028 million (Dec. 31, 2013:
€ 7,972 million). The increase is mainly due to acquisitions.
Within current assets, trade accounts receivable increased
by 22% to € 4,235 million (Dec. 31, 2013: € 3,474 million).
At 65 days, average days sales outstanding was slightly above
the previous year’s level of 63 days.
inventories rose by 16% to € 2,333 million (Dec. 31, 2013:
€ 2,014 million). The scope of inventory in 2014 decreased
to 52 days (Dec. 31, 2013: 53 days). The ratio of inventories to
total assets decreased to 5.8% (Dec. 31, 2013: 6.1%).
non-current assets increased by 21% to € 29,869 million
(Dec. 31, 2013: € 24,786 million). In constant currency, the
increase was 13%. Additions to property, plant and equipment,
and acquisitions (especially the first-time consolidation of
hospitals acquired from Rhön-Klinikum AG) had an effect. The
goodwill in the amount of € 19,868 million (Dec. 31, 2013:
€ 14,826 million) has proven sustainable. The goodwill from
acquisitions was € 3,650 million as of December 31, 2014.
Please see page 125 ff. of the Notes for further information.
shareholders’ equity, including noncontrolling interest,
rose by 17% to € 15,483 million (Dec. 31, 2013: € 13,260 mil-
lion). In constant currency shareholders’ equity, including
noncontrolling interest rose by 10%. group net income attrib-
utable to Fresenius SE & Co. KGaA increased shareholders’
equity by € 1,067 million. The equity ratio, including noncon-
trolling interest, was 38.8% as of December 31, 2014 (Dec. 31,
2013: 40.5%).
The liabilities and equity side of the balance sheet shows
a solid financing structure. Total shareholders’ equity, includ-
ing noncontrolling interest, covers 52% of non-current assets
(Dec. 31, 2013: 53%). Shareholders’ equity, noncontrolling
interest, and long-term liabilities cover all non-current assets
and 96% of inventories.
Long-term liabilities increased by 28% to € 16,629 mil-
lion as of December 31, 2014 (Dec. 31, 2013: € 13,003 million).
short-term liabilities increased by 18% to € 7,104 million
(Dec. 31, 2013: € 6,023 million).
The Group has no accruals that are of material signifi-
cance as individual items. The largest single accrual (US$ 115
million), for the W.R. Grace settlement payment relating to
the NMC transaction in 1996, was utilized in the first quar-
ter of 2014. Please see page 152 f. of the Notes for further
information.
group debt rose by 21% to € 15,454 million (Dec. 31,
2013: € 12,804 million). In constant currency, the increase was
13%. The increase is mainly due to the hospitals acquired
from Rhön-Klinikum AG, the acquisitions at Fresenius Medical
Care, as well as to currency effects. Its relative weight in
the balance sheet was 39% (Dec. 31, 2013: 39%). Approxi-
mately 48% of the Group’s debt is in U.S. dollars. Liabilities
due in less than 1 year were € 1,668 million (Dec. 31, 2013:
€ 1,820 million), while liabilities with a remaining term of 1 to
5 years and over 5 years were € 13,786 million (Dec. 31, 2013:
€ 10,984 million).
The net debt to equity ratio including noncontrolling
interest (gearing) is 92% (Dec. 31, 2013: 74% 1). The return
on equity after taxes (equity attributable to shareholders of
Fresenius SE & Co. KGaA) was 11.6% 2 (Dec. 31, 2013: 12.8% 2).
The return on total assets after taxes and before noncontrol-
ling interest decreased to 4.6% (2013: 5.8%).
ASSETS AND LIABILITIES – FIVE-YEAR OVERVIEW
€ in millions 2014 2013 2012 2011 2010
Total assets 39,897 32,758 30,664 26,321 23,577
Shareholders’ equity 1 15,483 13,260 12,758 10,577 8,844
as % of total assets 1 39 41 42 40 38
Shareholders’ equity 1 / non-current assets, in % 52 53 57 55 52
Debt 15,454 12,804 11,028 9,799 8,784
as % of total assets 39 39 36 37 37
Gearing in % 92 74 2 80 87 91
1 Including noncontrolling interest2 Pro forma excluding advances made in the amount of € 2.18 billion under a fiduciary arrangement for the acquisition
of hospitals and outpatient facilities of Rhön-Klinikum AG
1 Pro forma excluding advances made in the amount of € 2.18 billion under a fiduciary agreement for the acquisition of hospitals and outpatient facilities of Rhön-Klinikum AG
2 Before special items

Man
agem
ent
Rep
ort
management Report Report on economic position 75
Group ROIC was 7.5% 1 (2013: 8.8% 2), and Group ROOA was
9.1% 1 (2013: 10.6% 2). The earnings growth corresponds
with an increase in total assets. This increase is a result of the
expansion of the existing business and acquisitions. Within
the position invested capital, the goodwill of € 19.9 billion
had a significant effect on the calculation of ROIC. It is impor-
tant to take into account that approximately 60% of the good-
will is attributable to the strategically significant acquisi-
tions of National Medical Care in 1996, Renal Care Group
and HELIOS Kliniken in 2006, APP Pharmaceuticals in 2008,
Liberty Dialysis Holdings in 2012, and hospitals of Rhön-
Klinikum AG in 2014. Those have significantly strengthened
the competitive position of the Fresenius Group.
The summary shows ROIC and ROOA by business segment:
In 2014, the Fresenius Group delivered a return on invested
capital (ROIC) of 7.5%, substantially exceeding our cost
of capital. The WACC (weighted average cost of capital) of
Fresenius Medical Care was 6.0%, the WACC of the other
business segments was 4.9%.
The return on assets for 2014 was calculated before spe-
cial items.
Roic RooA
in % 2014 2013 2014 2013
Fresenius Medical Care 1 6.8 7.7 9.7 10.5
Fresenius Kabi 2 8.6 9.9 10.5 11.9
Fresenius Helios 3 7.0 9.0 7.4 9.3
Fresenius Vamed 4 – – 11.2 11.6
Group 2, 3 7.5 8.8 9.1 10.6
1 2014 pro forma acquisitions2 Before special items3 2014 pro forma acquisitions, before special items; 2013 pro forma excluding advances
made in the amount of € 2.18 billion under a fiduciary arrangement for the acquisition of hospitals and outpatient facilities of Rhön-Klinikum AG
4 ROIC: Invested capital is insignificant due to prepayments, cash and cash equivalents.
currency and interest risk managementThe nominal value of all foreign currency hedging contracts
was € 2,061 million as of December 31, 2014. These con-
tracts had a market value of - € 50 million. The nominal value
of interest rate hedging contracts was € 691 million. These
contracts had a market value of - € 7 million. Please see the
Risk Report on pages 89 f. and the Notes on pages 160 to 167
for further details.
coRpoRAte RAting
The credit quality of Fresenius is assessed and regularly
reviewed by the leading rating agencies Moody’s, Standard &
Poor’s, and Fitch.
The table shows the company rating of Fresenius SE & Co.
KGaA as well as the rating actions of Standard & Poor’s und
Moody’s from January 2015.
RATING OF FRESENIUS SE & CO. KGAA
feb. 24, 2015 Dec. 31, 2014 Dec. 31, 2013
Standard & Poor’s
Corporate Credit Rating BBB - BB + BB +
Outlook stable positive positive
Moody’s
Corporate Credit Rating Ba1 Ba1 Ba1
Outlook stable negative negative
Fitch
Corporate Credit Rating BB + BB + BB +
Outlook positive positive watch
evolving
Dec. 31, 2014 2 Dec. 31, 2013 1 Dec. 31, 2012 2 Dec. 31, 2011 Dec. 31, 2010
Debt / EBITDA 3.7 2.7 2.8 3.0 2.9
Net debt / EBITDA 3.4 2.5 2.6 2.8 2.6
EBITDA / interest ratio 6.8 6.7 5.8 6.1 5.4
1 Pro forma excluding advances made in the amount of € 2.18 billion under a fiduciary arrangement for the acquisition of hospitals and outpatient facilities of Rhön-Klinikum AG; before special items
2 Pro forma acquisitions; before special items
1 Pro forma acquisitions, before special items2 Pro forma excluding advances made in the amount of € 2.18 billion under a fiduciary arrangement for the acquisition
of hospitals and outpatient facilities of Rhön-Klinikum AG

Managem
ent Report
Management Report76
SUBSEQUENT EVENTS
Fresenius announced on January 12, 2015, that its pharma-
ceutical manufacturing facility in Grand Island, N.Y., has
achieved the upgraded status of “voluntary action indicated”
(VAI) following an inspection in October 2014. The status
change is an improvement from the “official action indicated”
status the facility had been operating under. The new VAI
classification permits FDA approval of new Fresenius Kabi
products at the plant.
On January 16, 2015, Standard & Poor’s upgraded the cor-
porate credit rating of Fresenius from BB + to BBB - with a
stable outlook. The upgrade reflects Fresenius’ enhanced sta-
bility – derived from overall critical mass coupled with sound
diversification and leading positions in non-cyclical markets –
rather than a shift in its financial policy.
On February 12, 2015, Fresenius SE & Co. KGaA refinanced
the revolving credit facilities and the term loan A tranches
under the 2013 Senior Credit Agreement in a total amount of
approximately € 3 billion. The maturity was extended by two
years to June 28, 2020.
On February 16, 2015, Fresenius Kabi has sold its German
subsidiary CFL GmbH to NewCo Pharma GmbH. Fresenius
Kabi will remain active in compounding. In Germany the focus
will be on parenteral nutrition products. In 2014, CFL had
sales of € 77 million. The transaction did not result in a mate-
rial book gain or loss.
Besides the items mentioned, there were no significant
changes in the Fresenius Group’s operating environment fol-
lowing the close of fiscal year 2014. No other events of mate-
rial importance on the assets and liabilities, financial position,
and results of operations of the Group have occurred after
the close of the year.
OVERALL ASSESSMENT OF THE
BUSINESS SITUATION
At the time this Group Management Report was prepared,
the Management Board continued to assess the development
of the Fresenius Group as positive. Demand for our prod-
ucts and serv ices continues to grow steadily around the world.
Operating performance in the first weeks of 2015 has been
in line with our expectations.
OUTLOOK
This Management Report contains forward-looking statements,
including statements on future sales, expenses, and invest-
ments, as well as potential changes in the health care sector,
our competitive environment, and our financial situation.
These statements were made on the basis of the expectations
and assessments of the Management Board regarding events
that could affect the Company in the future, and on the basis
of our mid-term planning. Such forward-looking statements are
subject, as a matter of course, to risks, uncertainties, assump-
tions, and other factors, so that the actual results, including
the financial position and profitability of Fresenius, could
therefore differ materially – positively or negatively – from
those expressly or implicitly assumed or described in these
statements. For further information, please see our Opportu-
nities and Risk Report on pages 83 ff.
GENERAL AND MID-TERM OUTLOOKThe outlook for the Fresenius Group for the coming years con-
tinues to be positive. We are continuously striving to optimize
our costs, to adjust our capacities to be able to treat patients
and supply customers reliably, and to improve our product mix
as well as to expand our products and services business. We
expect these efforts to increase our earnings in the coming
years. In addition, good growth opportunities for Fresenius
are, above all, presented by the following factors:
▶ The sustained growth of the markets in which we oper-
ate: Fresenius sees still very good opportunities to benefit
from the growing health care needs arising from aging
populations and technical advances, but driven also by the
still insufficient access to health care in the developing
and emerging countries. There are above-average growth
opportunities for us not only in the markets of Asia and
Latin America, but also in Eastern Europe. Efficient health

Man
agem
ent
Rep
ort
77Management Report Subsequent events / Overall assessment of the business situation / Outlook
care systems with appropriate reimbursement structures
will evolve over time in these countries, as economic con-
ditions improve. We will strengthen our activities in these
regions and introduce further products from our portfolio
into these markets successively.
▶ The expansion of our regional presence: The fast-grow-
ing markets in Asia-Pacific, Latin America, and Eastern
Europe especially offer further potential for increasing our
market shares. China, for instance, offers excellent growth
opportunities over the long term, not only in infusion
and nutrition therapies, IV drugs, and medical devices for
Fresenius Kabi, but also for Fresenius Medical Care in
dialysis. We plan to further roll out products and therapies
from our existing portfolio in countries where we do not
yet offer a comprehensive range.
▶ The broadening of our services business: For Fresenius
Medical Care, opportunities to extend into new markets or
to expand its market share arise if a country opens up
to private dialysis providers or allows cooperation between
public and private providers through public private-part-
nerships. Whether or not private companies can offer dial-
ysis treatment, and in what form, depends on the health
care system of the country in which they operate and its
legal framework. We see developments in this regard in
Germany, China, and India, among other countries. In
addition to dialysis products and the treatment of dialysis
patients, Fresenius Medical Care sees significant growth
potential in the future in medical services related to dialysis
and in expanding the coordination of care. This includes
laboratory services, the supply of the necessary vascular
access devices, and in-patient care of dialysis patients,
among other things. Comprehensive integrated care from
a single provider should ensure better-coordinated and
controlled treatment steps and minimize complications,
thus helping prevent additional hospitalization to the great-
est degree possible. The goal, then, is to further increase
the quality of care and to reduce the overall cost of treat-
ment. With the acquisition of hospitals from Rhön-Klinikum
AG, Fresenius Helios has an extensive nationwide hospital
network. Based on this platform, Fresenius Helios aims
to develop and offer innovative, integrated care offerings.
▶ The broadening of our products business: At Fresenius
Medical Care, we see renal pharmaceuticals as growth
drivers. They complement our dialysis portfolio and add
to the horizontal expansion of our portfolio. They offer
further growth potential in line with our strategic goals and
the growing trend to offering more integrated care. At
Fresenius Kabi, we plan to expand our IV drugs product
business. We develop generic drug formulations that are
ready to launch at the time of market formation, directly
after the patents of the branded products expire.
▶ The development of innovative products and therapies:
These will create the potential to further expand our
market position in the regions. In addition to innovation,
best-in-class quality, reliability, and the convenience of
our products and therapies are key factors here. In our dial-
ysis business, we expect home therapies to gain further
importance, leading to growth potential for Fresenius
Medical Care. Home dialysis and the corresponding tech-
nologies and products will continue to be a major focus
of our R & D activities. In addition, Fresenius Kabi is devel-
oping new dosage forms for its products.
▶ Selective acquisitions: Besides retaining organic sales
growth as the basis for our business, we will continue to
utilize oppor tunities to grow by making small and mid-
sized acquisitions that expand our product portfolio and
strengthen our regional presence.
We are also exploiting any opportunities for tapping poten-
tial within our operations for cost-management and effi-
ciency-enhancement measures. These include plans for cost-
efficient production and a further-optimized procurement
process. Thus, Fresenius Medical Care launched a global effi-
ciency program in 2014. This program is intended to increase

Managem
ent Report
Management Report78
the efficiency of the entire organization and enhance compet-
itiveness and investment capacity. The program is expected
to produce cost savings of US$ 300 million per year by 2017.
The outlook takes account of all events known at the time
the annual financial statements were prepared that could
influence our operating performance in 2015 and beyond. Sig-
nificant risks are discussed in the Risk Report. As in the past,
we will do our utmost to achieve and – if possible – exceed
our targets.
FUTURE MARKETSWe expect the consolidation process to continue among com-
petitors in our markets in Europe, Asia-Pacific, and Latin
America. Consequently, we expect that there will be opportu-
nities for us to penetrate new markets, both by expanding
our regional presence and by extending our product portfolio.
New markets will open up as Fresenius Medical Care
successively rolls out its product and services portfolio, espe-
cially in emerging countries. In addition, Fresenius Medical
Care continues to expand its Care Coordination business with
services related to dialysis. With Care Coordination, Fresenius
Medical Care can address the needs of dialysis patients even
more comprehensively.
Fresenius Kabi plans to introduce products already
offered outside the United States into that country as well. It
also aims to further roll out its product portfolio interna-
tionally, especially in the fast-growing markets of Asia-Pacific
and Latin America.
With its extended hospital network across Germany,
Fresenius Helios is now able to develop new patient care
models. In addition, the company expects that there will
be further growth opportunities arising from privatizations
in the German hospital market.
Fresenius Vamed is expecting to grow in the life cycle
and PPP project areas, both with regard to the project and
the services business. Moreover, the company intends to fur-
ther expand its position with follow-up orders, as well as to
enter new target markets.
HEALTH CARE SECTOR AND MARKETSThe health care sector is considered to be widely indepen-
dent of economic cycles. The demand, especially for life-
saving and life-sustaining products and services, is expected
to increase, given that they are medically needed and the
population is aging. Moreover, medical advances and the large
number of diseases that are still difficult to cure – or are
incurable – are expected to remain growth drivers.
In the emerging countries, the availability of basic health
care and the growing demand for high-quality medical treat-
ment is increasing. As per-capita income increases, individu-
als increasingly have to cope with the illnesses associated
with lifestyle diseases.
On the other hand, experts estimate that further financial
constraints in the public sector could result in more pricing
pressure and a slowdown in revenue for companies in the
health care industry. Some countries are experiencing signifi-
cant financing problems in the health care sector due to the
strained public finance situation. Especially in the industrial-
ized countries, increased pressure to encourage saving can
be expected as health care costs constitute a large portion of
the budget.
It will be increasingly important for companies to increase
patient benefit, to improve treatment quality, and to offer
preventive therapies. In addition, especially those products and
therapies that are not only medically but also economically
advantageous will be of increasing importance.
Industry experts believe that, despite of the challenges, the
sector will also see a comparatively solid financial perfor-
mance in the foreseeable future.
THE DIALYSIS MARKET
The global dialysis market is expected to growth by about
4% at constant exchange rates, to approximately US$ 80 bil-
lion in 2015.
The number of dialysis patients worldwide is expected
to rise by approximately 6% in 2015, although significant
regional differences will remain. For the United States, Japan,
and the countries of Central and Western Europe, where
prevalence is already relatively high, we forecast patient
growth in the region of 1% to 4%. In economically weaker
Source: Bank research

Man
agem
ent
Rep
ort
79Management Report Outlook
regions, the growth rates are even higher with values of up to
10%, and in some countries even more. We expect a higher
proportion of dialysis patients in Asia, Latin America, Eastern
Europe, the Middle East, and Africa. The fact that more than
80% of the world’s population lives in these regions under-
scores the strong growth potential for the entire spectrum of
dialysis services and products.
Factors such as aging populations and the growing number
of people suffering from diabetes and hypertension, which
are ailments often preceding terminal kidney failure, are con-
tributing toward continued growth of the dialysis markets.
The age expectancy of dialysis patients is also rising thanks to
ongoing advances in treatment quality and the rising stan-
dard of living, especially in the emerging countries. Therefore,
a continuing increase in the worldwide prevalence can be
expected.
Further information is provided on pages 59 ff. of the
Management Report.
THE MARKET FOR GENERIC IV DRUGS, CLINICAL
NUTRITION, INFUSION THERAPY, AND MEDICAL
DEVICES / TRANSFUSION TECHNOLOGY 1
We expect the global market for generic IV drugs, clinical
nutrition, infusion therapy, and medical devices / transfusion
technology to grow by approximately 4% in 2015.
The market for generic IV drugs in Europe and the
United States is expected to grow by about 5% in 2015. The
demand for generic drugs is likely to grow because of their
significantly lower price. The growth dynamic will continue to
be driven by originator drugs going off-patent. A factor work-
ing in the opposite direction is the price erosion for generic
drugs that are already in the market.
Growth of about 3% is expected for the clinical nutrition
market in Europe in 2015. However, given the financial con-
straints in these countries, the efforts to contain costs in the
health care sector are being pursued undiminished. Contin-
ued high growth potential is projected in Asia-Pacific, Latin
America, and Africa. We expect growth of up to 10% in
selected regions.
We expect the market for infusion therapy in Europe to
remain at the prior year’s level in 2015. Besides a stagnat-
ing blood volume substitutes market due to restrictions
imposed on the use of these products, continuous price pres-
sure in the tender-driven standard-solutions business is
expected to affect growth. Outside Europe, growth of up to
4% is expected.
The worldwide market for medical devices / transfusion
technology is expected to grow by up to 3% in 2015.
THE GERMAN HOSPITAL MARKET
We expect the acute care hospital market in Germany to again
grow slightly in 2015. Admissions are forecast to increase
by approximately 1%.
For the increase in reimbursements of hospital treat-
ments the so-called change in value figure is relevant. For 2015
it was set at 2.53%. In addition, the hospital funding system
provides for various increases and reductions for acute hospi-
tals. For example, a reduction of 25% had to be accepted
for surplus services previously agreed upon with the health
insurance companies. A reduction of 65% applies to surplus
services not agreed upon. To compensate the reduction, a
0.8% extra charge on invoiced hospital treatments is provided.
We expect the effect of the compensations, reduced by the
reductions for extra services, to have a slightly positive effect
on the result of HELIOS in 2015.
In December 2014, a benchmark paper for a hospital
reform was presented. It stipulates that in the future, planning
and compensation in the hospital sector should be geared
more toward the quality of medicine, among other factors. So
far, however, no specifics regarding this reform have been
determined. Thanks to its clear focus on the quality and trans-
parency of medical results, the HELIOS Group would be well
prepared for such a development.
Despite higher revenues, the expectations of the hospitals
are rather pessimistic with respect to their economic situa-
tion in 2015. According to the Krankenhaus-Barometer 2014
1 Market data refer to Fresenius Kabi’s relevant and addressable markets. Those are subject to annual volatility due to currency fluctuations and patent expiries of original drugs in the IV drug market, among other things.
Source: Company research

Managem
ent Report
Management Report80
survey by the German Hospital Institute (DKI), almost 40%
of the hospitals expect their economic situation to worsen.
Specifically personnel costs will be a burden due to tariff in-
creases. Moreover, investment needs are growing while gov-
ernment support is declining. The Rheinisch-Westfälisches
Institut für Wirtschaftsforschung (RWI) forecasts that more
hospitals will respond to economic pressures by joining
together into networks and bundling their services. Networks
offer opportunities for individual hospitals to reduce costs,
for example in purchasing.
We therefore anticipate that privatization and consolida-
tion will continue in the German hospital market.
THE MARKET FOR PROjECTS AND SERVICES
FOR HOSPITALS AND OTHER HEALTH CARE
FACILITIES
For 2015, we expect the worldwide demand for projects
and services for hospitals and other health care facilities to
grow at a low single-digit rate.
In the Central European markets with established health
care systems, we expect solid growth. The demand for proj-
ects and services for hospitals and other health care facilities
will continue to grow due to demographic changes and the
rising investment and modernization needs of public health
facilities. The focus is on services ranging from the mainte-
nance and repair of medical and hospital equipment, facility
management, and technical operation, through to total oper-
ational management and infrastructure process optimization –
especially within the framework of public-private partnership
(PPP) models. Additional growth opportunities are presented
by an increasing number of non-medical services, which are
outsourced from public facilities to private service providers.
In the emerging markets we anticipate an overall dynamic
development. Growth in markets such as Africa, Latin America,
and southeast Asia will initially be driven by the demand for
efficient, needs-oriented medical care. In China and the Middle
East, growth will be driven by the development of infrastruc-
ture and the creation of new care services, as well as research
and training facilities.
GROUP SALES AND EARNINGSIn 2015, we expect to increase Group sales by 7% to 10% in
constant currency. Besides organic sales growth, sales growth
will be driven by the full-year consolidation of the acquired
hospitals from Rhön-Klinikum AG and the acquisitions by
Fresenius Medical Care in 2014. We expect to increase
Group net income 1 by 9% to 12% in constant currency.
GROUP FINANCIAL TARGETS
SALES AND EARNINGS BY BUSINESS SEGMENTIn 2015, we expect sales and earnings development in our
business segments as shown below:
FINANCIAL TARGETS BY BUSINESS SEGMENT
Targets 2015 Fiscal year 2014
Fresenius Medical Care
Sales growth 1 5% – 7% US$ 15.832 bn
Net income 1, 2 growth 0% – 5% US$ 1.045 bn
Fresenius Kabi
Sales growth (organic) 3% – 5% € 5,146 m
EBIT growth(in constant currency) 4% – 6% € 873 m
Fresenius Helios
Sales growth (organic) 3% – 5% € 5,244 m
EBIT € 630 – 650 m € 553 m
Fresenius Vamed
Sales growth (organic) Single-digit % € 1,042 m
EBIT growth 5% – 10% € 59 m
1 Savings from the global efficiency program and further operating cost investments within the Care Coordination business are included, while potential acquisitions are not taken into account.
2 Net income attributable to the shareholders of Fresenius Medical Care AG & Co. KGaA
Targets 2015 Fiscal year 2014
Sales growth (in constant currency) 7% – 10% € 23,231 m
Net income 1 growth (in constant currency) 9% – 12% € 1,086 m
Capital expenditure ~ 6% of sales € 1,345 m
DividendProfit-driven
dividend policyProposal
+ 6% per share
1 Net income attributable to shareholders of Fresenius SE & Co. KGaA; 2015 before integration costs (~ € 10 million before tax for hospitals acquired from Rhön-Klinikum AG), before costs for the efficiency program at Fresenius Kabi (~ € 100 million before tax) and before the gain from the divestment of two HELIOS hospitals (€ 34 million before tax); 2014 before special items
1 Net income attributable to shareholders of Fresenius SE & Co. KGaA; 2015 before integration costs (~ € 10 million before tax for hospitals acquired from Rhön-Klinikum AG), before costs for the efficiency program at Fresenius Kabi (~ € 100 million before tax) and before the gain from the divestment of two HELIOS hospitals (€ 34 million before tax); 2014 before special items
Source: Rheinisch-Westfälisches Institut für Wirtschaftsforschung (RWI), Krankenhaus Rating Report 2013

Man
agem
ent
Rep
ort
81Management Report Outlook
For 2015, Fresenius Medical Care expects sales to grow by
5% to 7%, and expects moderate EBIT growth. Net income
attributable to shareholders of Fresenius Medical Care AG &
Co. KGaA is expected to increase 0% to 5%. Savings from
the global efficiency program for 2015 and further operating
cost investments within the Care Coordination business
are included, while potential acquisitions are not taken into
account. The outlook is based on the exchange rates prevail-
ing at the beginning of 2015.
Fresenius Kabi expects organic sales growth of 3% to 5%
for 2015. In addition, the business segment is forecasting
an EBIT growth in constant currency of 4% to 6%. Fresenius
Kabi initiated a program designed to increase production
efficiency and streamline administrative structures. The com-
pany expects costs of approximately € 100 million before
tax in 2015. The program is expected to lead to cost savings of
approximately € 10 million in 2015. Fresenius Kabi’s guid-
ance excludes the costs for the efficiency program (approxi-
mately € 100 million before tax). For segment reporting pur-
poses, these costs will not be reported in the Fresenius Kabi
segment but as special items in the Group segment Corpo-
rate / Other.
Fresenius Helios projects organic sales growth of 3% to
5% for 2015. EBIT is expected to increase to € 630 to € 650
million. The outlook for Fresenius Helios is excluding integra-
tion costs for the hospitals acquired from Rhön-Klinikum AG
(approximately € 10 million before tax) and gains from the
divestment of two HELIOS hospitals (€ 34 million before tax).
For segment reporting purposes, these costs will not be re-
ported in the Fresenius Helios segment but as special items in
the Group segment Corporate / Other.
For 2015, Fresenius Vamed expects to achieve single-
digit organic sales growth and EBIT growth of 5% to 10%.
FINANCINGFor 2015, we expect continued strong cash flow with a cash
flow margin between 9% and 11%.
In addition, unused credit lines under syndicated or
bilateral credit facilities from banks will generally provide us
with a sufficient financial cushion.
In 2015, the financing activities will predominantly
involve the refinancing of the Fresenius US Finance II, Inc.
US$ 500 million and € 275 million Senior Notes, which will
be due in July 2015.
At the end of 2015, we expect Group net debt / EBITDA
to be at approximately 3.0 (calculated at expected annual
average exchange rates, on the basis of current exchange
rates, for both net debt and EBITDA; without major acquisi-
tions; before special items).
INVESTMENTSIn 2015, we expect to invest about 6% of sales in property,
plant and equipment. About 50% of the capital expenditure
planned will be invested at Fresenius Medical Care, about
25% at Fresenius Kabi, and about 25% at Fresenius Helios.
At Fresenius Medical Care, investments will primarily be
used for the expansion of production capacity, optimizing pro-
duction costs, and the establishment of new dialysis clinics.
Fresenius Kabi will primarily invest in expanding and main-
taining production facilities as well as in introducing new
manufacturing technologies. At Fresenius Helios, we will pri-
marily be investing in the new building, the modernizing and
equipping of existing hospitals, and in the hospitals acquired
during the fiscal year from Rhön-Klinikum AG.
The regional focus of the Group’s investment spending
will be on Europe and North America, which will account for
about 55% and 30%, respectively. The remainder will be
invested in Asia, Latin America, and Africa. About 40% of total
funds will be invested in Germany.
We assume that the return on operating assets (ROOA)
and the return on invested capital (ROIC) will be approximately
above the level of 2014.

Managem
ent Report
Management Report82
PROCUREMENTWe will continue optimizing our procurement management
in 2015; prices, terms, and especially quality are key factors
for securing further earnings growth.
Based on the developments in the financial and the real
markets, we assume that price fluctuations will continue
despite tension easing in the commodities markets in the
short and medium terms.
RESEARCH AND DEVELOPMENT Our R & D activities will continue to play a key role in secur-
ing the Group’s long-term growth through innovations and
new therapies.
We plan to increase the Group’s R & D spending in 2015.
About 4% to 5% of our product sales will be reinvested in
research and development.
Market-oriented research and development with strict
time-to-market management processes is crucial for the suc-
cess of new products. We continually review our R & D results
using clearly defined milestones. Innovative ideas, product
development, and therapies with a high level of quality will
continue to provide the basis for future market-leading posi-
tions. Given the continued cost-containment efforts in the
health care sector, cost-efficiency combined with a strong qual-
ity focus is acquiring ever-greater importance in product
development, and in the improvement of treatment concepts.
At Fresenius Medical Care we will continue to expand
our global R & D product platform. Home dialysis as well as
associated technologies and products will be a focal point of
our activities. One major aim is to significantly reduce water
consumption for home hemodialysis in order to give dialysis
patients the greatest-possible independence and mobility
with a resource-efficient and flexible device. We will continue
to expand our range of innovative products and technolo-
gies in the future to react to growth opportunities – also with
the aim of best meeting demand for integrated care.
Infusion and nutrition therapies and generic parenteral prod-
ucts are primary focus areas of development at Fresenius
Kabi. In particular, we are concentrating on being in a posi-
tion to offer the corresponding generic drug formu lation
promptly upon the expiration of patents for originator drugs.
We are also working to expand our portfolio to include addi-
tional ready-to-use IV drugs.
The Fresenius Kabi portfolio of medical devices makes a
contribution to the safe and effective application of infusion
solutions and clinical nutrition. We will continue to develop
new products and improve on existing ones in this segment.
In transfusion technology, we are focusing our development
work on devices and disposables that enable the safe, efficient,
and user-friendly production of blood products and the treat-
ment of specific diseases, including autoimmune diseases.
PLANNED CHANGES IN HUMAN RESOURCES AND THE SOCIAL AREAThe number of employees in the Group will continue to rise
in the future, as a result of the expected expansion. We antic-
ipate that the number of employees will increase to more
than 220,000 (December 31, 2014: 216,275). The number of
employees is expected to increase in all business segments.
The regional distribution of our employees will remain almost
unchanged – approximately 50% will be located in Europe,
approximately 30% in North America, and approximately
20% in Asia-Pacific, Latin America, and Africa.
DIVIDENDThe dividend increases provided by Fresenius in the last
21 years show impressive continuity. Our dividend policy
aims to align dividends with earnings per share growth
(before special items) and thus broadly maintains a pay-out
ratio of 20% to 25%. Based on our positive earnings fore-
cast, we expect to offer our shareholders an earnings-linked
dividend.

Man
agem
ent
Rep
ort
Management Report Opportunities and risk report 83
OPPORTUNITIES AND RISK REPORT
The Fresenius Group is exposed to a number of risks due to
the complexity and the dynamics of its business. These risks
are inevitable consequences of entrepreneurial activities. The
willingness to take risks has to be accommodated if opportu-
nities are to be exploited.
As a provider of products and services for the severely and
chronically ill, we are relatively independent of economic
cycles. The diversification into four business segments, which
operate in different segments of the health care market, and
the global footprint further minimize the Group’s risk profile.
Our experience, as well as our strong market positions, serve
as a solid basis for a reliable assessment of risks.
At the same time, we will continue to take advantage of
the wide-ranging opportunities for sustainable growth and
expansion that the health care market offers to the Fresenius
Group.
OPPORTUNITIES MANAGEMENT Managing opportunities is an ongoing, integral part of corpo-
rate activity aimed at securing the Company’s long-term suc-
cess. In this way, we can explore new prospects and consoli-
date and improve on what we have already achieved. The
Group’s decentralized and regional organizational and man-
agement structure enables the early identification and analysis
of trends, requirements, and opportunities in our often frag-
mented markets; and we can respond to them flexibly and in
line with local market needs. Furthermore, we maintain regu-
lar contact and dialogue with research groups and scientific
institutions, and keep a close watch on markets and com-
petitors in order to identify opportunities. Within the Group,
opportunities and synergies can be exploited through con-
tinuous communication involving the exchange of information
and know-how between the business segments. Anticipated
future opportunities for the Fresenius Group are discussed in
the Outlook starting on page 76.
RISK MANAGEMENTThe risk management is also a continuous process. Identifying,
controlling, and managing risks are key tools of solid corpo-
rate governance. The Fresenius risk management system is
closely linked to the corporate strategy. Opportunities are not
recognized in the risk management system.
Responsibilities for the processes and monitoring risks in the
business segments have been assigned as follows:
▶ Using standardized processes, risk situations are evalu-
ated regularly and compared with specified requirements.
If negative developments emerge, responses can be initi-
ated at an early stage.
▶ The managers responsible are required to report any
relevant changes in the risk profile to the Management
Board without delay.
▶ Markets are kept under constant observation and close
contact is maintained with customers, suppliers, and insti-
tutions. These policies allow us to swiftly identify and
react to changes in our business environment.
The risk management system is supported both at Group level
and in the business segments by our risk controlling mea-
sures and our management information system. Detailed
monthly and quarterly reports are used to identify and ana-
lyze deviations of the actual compared to the planned busi-
ness development. In addition, the risk management system
comprises a control system that oversees organizational
processes and measures, as well as internal controls and
audits, with which we can identify significant risks at an early
stage and counteract each one individually.
The functionality and effectiveness of our risk manage-
ment system is reviewed regularly by the Management Board
and the internal auditing department. Conclusions arising
from the audits are taken into account in the ongoing refine-
ment of the system, to allow prompt reaction to changes in
our environment. This system has thus far proved effective.
The control system is also regularly reviewed by the Manage-
ment Board and the internal auditing department. Moreover,
the external auditor reviews whether the control system set
up by the Management Board is suitable for the early identi-
fication of risks that would put the continued exist ence of the
Company in danger. The insights gained from the audit
regarding the internal financial reporting controls are taken
into account in the continued development of the system.
Fresenius has ensured that the scope and focus of the
organizational structure and systems for identifying, assessing,
and controlling risks, and for developing countermeasures
and for the avoidance of risks, are aligned suitably with the
Company-specific requirements and that they are properly
functional. However, there can be no absolute certainty that
this will enable all risks to be fully identified and controlled.

Managem
ent Report
Management Report84
INTERNAL FINANCIAL REPORTING CONTROLS
Numerous measures and internal controls assure the correct-
ness and reliability of accounting processes and financial
reporting, and thus preparation of annual financial statements,
consolidated financial statements, and management reports
in compliance with applicable principles. Our four-tier report-
ing process especially promotes intensive discussion and
ensures control of the financial results. At each reporting level,
▶ local entity
▶ region
▶ business segment
▶ Group
financial data and key figures are reported, discussed, and
compared on a regular monthly basis with the prior-year
figures, budget, and latest forecast. In addition, all parame-
ters, assumptions, and estimates that are of relevance for
the externally reported Group and segment results are dis-
cussed intensively with the department responsible for prepar-
ing the Group’s consolidated financial statements. These
matters are also reviewed and discussed quarterly by the
Supervisory Board’s Audit Committee.
Control mechanisms, such as automated and manual rec-
onciliation procedures, are further precautions put in place
to assure that financial reporting is reliable and that transac-
tions are correctly accounted for. All consolidated entities
report according to Group-wide standards, which are deter-
mined at the head office. These are regularly adjusted to
allow for changes made to the accounting regulations. The
consolidation proposals are supported by the IT system. In
this context, reference is made to the comprehensive consoli-
dation of internal Group balances. To prevent abuse, we take
care to maintain a strict separation of functions. Management
control and evaluations also help to ensure that risks having
a direct impact on financial reporting are identified and that
controls are in place to minimize them. Moreover, changes
in accounting principles are monitored and employees involved
in financial reporting are instructed regularly and compre-
hensively. External experts and specialists are engaged if nec-
essary. The Treasury, Tax, Controlling, and Legal departments
are involved in supporting the preparation of the financial
statements. Finally, the information provided is verified once
again by the department responsible for preparing the con-
solidated financial statements.
Fresenius Medical Care is subject to the controls of Section
404 of the Sarbanes-Oxley Act.
RISK AREASThe main risk areas for the operations of the Fresenius Group
are as follows:
GENERAL ECONOMIC RISKS AND RISKS IN THE
GENERAL OPERATING FRAMEWORK
At present, the development of the global economy exhibits
no significant risk to the Fresenius Group. In 2015, we
largely expect overall economic growth to continue. More-
over, Fresenius is affected only to a small extent by general
economic fluctuations. We expect demand for our life-saving
and life-sustaining products and services to continue to
grow. Furthermore, Fresenius is striving for the firm balance
of its business in the main regions and between established
and emerging markets.
RISK MANAGEMENT
Audit Committee of Supervisory Board
Risk management / risk controlling / control systems of business segments and Group segment
Management Board
Risk management information system (status reports)
Group Controlling
Ad-hoc reporting – relevant changes of risk profile and new risks
Supervisory Board

Man
agem
ent
Rep
ort
Management Report Opportunities and risk report 85
The risk situation for each business segment also depends
on the development of its markets. Country-specific political,
legal, and financial conditions are therefore monitored and
evaluated carefully, particularly in the current macro-economic
environment. This applies, for example, to countries with
budget problems as a result of the sovereign debt crisis, in par-
ticular with regard to our accounts receivables.
RISKS IN THE HEALTH CARE SECTOR
Risks related to changes in the health care market are of
major importance to the Fresenius Group. The main risks are
the development of new products and therapies and increased
product availability at competitors, the financing of health
care systems, and reimbursement in the health care sector.
In our largely regulated business environment, changes
in the law – also with respect to reimbursement – can have
decisive consequences for our business progress. This applies
especially in the United States where a large portion of our
sales are generated, and where changes in the reimbursement
system, for example, could have a considerable impact on
our business. Furthermore, a portion of our dialysis care busi-
ness in the United States is currently reimbursed by private
insurers or managed care organizations. If these organizations
enforce reductions in the reimbursement, it would significantly
reduce the revenues and earnings for the products and ser-
vices of Fresenius Medical Care.
The same applies to the hospital market in Germany, where
the DRG system (Diagnosis Related Groups) is intended to
increase the efficiency of hospitals while reducing health care
spending. The Company constantly monitors legis lative devel-
opments as well as discussions about ending dual financing
in the hospital sector. Patients are largely assigned to hospi-
tals by the public health and pension insurers. It is therefore
important for Fresenius Helios that the contracts between its
hospitals and the insurers and health care institutions are
maintained. We not only monitor legislative changes continu-
ally, but also work together with governmental health care
institutions.
Reductions in health care spending could also negatively
affect the pricing of Fresenius Kabi products.
Generally, our aim is to counter possible regulatory risks
through enhanced performance and cost reductions.
In the United States, almost all Fresenius Kabi injectable
pharmaceutical products are sold to customers through
arrangements with group purchasing organizations (GPOs)
and distributors. The majority of hospitals undertake con-
tracts with the GPO of their choice for their purchasing needs.
Currently, fewer than five GPOs control a large majority of
sales in the United States to hospital customers. Fresenius Kabi
currently derives a large percentage of its revenue in the
United States through a small number of GPOs, and expects
to continue to do so in the future. Fresenius Kabi has pur-
chasing agreements with the major GPOs. To maintain these
business relationships, Fresenius Kabi believes it needs to
be a reliable supplier, offer a comprehensive high-quality
product line, remain price-competitive, and comply with the
regulations of the U.S. Food and Drug Administration (FDA).
The GPOs also have purchasing agreements with other man-
ufacturers and the bidding process for products is highly
competitive. Most of the agreements Fresenius has with GPOs
in the United States can be terminated at short- or mid-term
notice. The main customers in the area of transfusion technol-
ogy are plasma companies and blood centers. There are four
major plasma companies serving the United States. Blood
centers in the United States are consolidating in response to
blood-conservation efforts at hospitals, which is having an
effect on pricing.
Cooperation with medical doctors and scientists allows
us to identify and support relevant technological innovations
and to keep abreast of developments in alternative treatment
methods. These enable us to evaluate and adjust our corpo-
rate strategy if necessary.
OPERATING RISKS
Our business and operations around the world are exposed
to a number of risks and to extensive regulation, which
include, among others:
▶ the quality, safety, and efficacy of medical and pharma-
ceutical products, supplies, and therapies
▶ the operation of hospitals, manufacturing facilities, and
laboratories
▶ the construction and management of health care facilities

Managem
ent Report
Management Report86
▶ the rate of, and accurate reporting and billing for, govern-
ment and third-party reimbursement
▶ compensation of medical directors and other financial
arrangements with physicians and other referral sources.
If Fresenius fails to comply with laws or regulations, this
may give rise to a number of legal consequences, including
monetary and administrative penalties, increased compli-
ance costs, complete or partial exclusion from governmental
programs, or a complete or partial curtailment of our autho-
rization to conduct business. Any of these consequences could
have a material adverse effect on our business, financial
condition, or results of operations.
In the following, the main risks for the Fresenius Group are
described.
Production, products, and servicesCompliance with product and manufacturing regulations is
ensured by our quality management systems in accordance
with the internationally recognized quality standard ISO 9001,
reflecting a large number of national and international regu-
lations. Application is ensured by internal standards such as
quality and work procedure manuals. Regular internal and
external audits are carried out at the Group’s production sites,
distribution companies, and dialysis clinics. These audits
test compliance with regulations in all areas – from manage-
ment and administration to production and clinical services
and patient satisfaction. Our production facilities comply with
the Good Manufacturing Practice (GMP) of the markets they
supply. Our facilities are audited by the FDA and other public
authorities. If observations are filed, the Company is required
to remedy these issues immediately, as during the inspec-
tions of our U.S. production facility in Grand Island or our pro-
duction facility in Kalyani, India, for example.
Non-compliance with the requirements of these author-
ities in our production facilities or at our suppliers could
lead to regulatory actions such as warnings, product recalls,
production interruptions, monetary sanctions, or delays in
new product approvals. Any of these regulatory actions could
adversely affect our ability to generate sales and result in
significant expenses.
Potential risks, such as those arising from the start-up of
new production sites or the introduction of new technolo-
gies, are countered through careful planning, regular analy-
sis, and continual progress reviews. Production capacities at
some of our manufacturing plants could be adversely affected
by events such as technical failures, natural disasters, regu-
latory rulings, or supply disruptions, e. g., of raw materials.
We counter the risk of poor-quality purchased raw materi-
als, semifinished products, and components mainly by requir-
ing our suppliers to meet strict quality standards. Besides
certification by external institutes and regular supplier audits,
this includes an exhaustive evaluation of advance samples
and regular quality controls. We only purchase high-quality
products with proven safety and suitability from qualified
suppliers that conform to our specifications and standards.
Performing medical treatments on patients in our hospi-
tals, rehabilitation clinics, and dialysis clinics presents inher-
ent risks. For example, disruptions to processes involve risks
for patients and the clinic. In addition, there are operational
risks, for example regarding hygiene and sterile conditions.
We counteract these risks with strict operating procedures,
continuous personnel training, and patient-oriented working
procedures. Furthermore, we are constantly striving to
improve the standard of patient treatment through our quality
management systems.
Further risks arise from increasing pressure on our prod-
uct prices, for example in tender businesses. On the pro-
curement side, we counter risks – which mainly involve pos-
sible price increases and the availability of raw materials
and goods – by appropriately selecting and working together
with our suppliers through long-term framework agreements
in certain purchasing segments and by bundling volumes
within the Group.
Under the Medicare bundled reimbursement system, pay-
ment for Erythropoietin stimulating agents (ESA) is gener-
ally included in the bundled rate. An interruption of supply or
material increases in the utilization or acquisition costs for
ESAs could materially affect sales and profitability adversely.

Man
agem
ent
Rep
ort
Management Report Opportunities and risk report 87
Growing competition, among other things induced by the
re-entry of competitors in the US market for generic IV drugs
after production halts, could materially affect the future pric-
ing and sale of our products and services adversely. The intro-
duction of new products and services, or the development
of new technologies by competitors, could render one or more
of our products and services less competitive or even obso-
lete, and thus have a significant negative impact on future
sales, the prices of products, and our range of services. This
includes the introduction of generic or patented drugs by
competitors, which may have an impact on sales and opera-
tional results.
Generally, the health care markets are characterized by
price pressure, competition, and efforts to contain costs.
These could result in lower sales and adversely affect our busi-
ness, our financial position, and our operational results.
We counter the risks associated with Fresenius Vamed’s
project business through professional project management
and control, and with a proven system tailored to each busi-
ness activity for identifying, evaluating, and minimizing these
risks. This system consists of organizational measures, such
as standards for pricing-in risks already when preparing quo-
tations, risk assessment before accepting orders, regular
project controlling, and continual risk assessment updates. To
avert the risk of default, financial measures are taken, such
as checking creditworthiness and, usually, prepayments, let-
ters of credit, and secured credits.
Our operations are subject to strict governmental regula-
tory demands and controls. We must comply with these rules
and regulations, which monitor particularly the safety and
effectiveness of our medical products and services. Therefore,
it is of special importance to us that our compliance pro-
grams and guidelines are adhered to. Through compliance, we
aim to meet our own expectations and those of our partners,
and to orient our business activities to generally accepted stan-
dards and local laws and regulations.
The Corporate Compliance department reports to the Chief
Compliance Officer, who is the Management Board member
for Legal Affairs, Compliance, and Human Resources, and is
accountable for establishing and implementing guidelines
and procedures. A compliance officer has been appointed in
each business segment. He or she is supported by additional
compliance officers appointed based on organizational and
business structures. The Corporate Compliance department
supports the compliance officers at the business segment,
regional, and country levels.
These compliance programs and guidelines set binding
rules of conduct for our employees. We believe that we have
taken adequate measures to ensure that national and interna-
tional rules are observed and complied with.
Government reimbursement paymentsFresenius is subject to comprehensive government regula-
tion in nearly all countries. This is especially true in the
United States and Germany. In addition, Fresenius must com-
ply with general rules of law, which differ from country to
country. There could be far-reaching legal repercussions
should Fresenius fail to comply with these laws or regulations.
A large part of Group revenue derives from government
reimbursement programs. In 2014, approximately 31% of
Fresenius Medical Care’s sales were attributable to U.S. fed-
eral health care benefit programs, such as Medicare and
Medicaid (CMS). A reduction of reimbursement rates or reim-
bursed services could result in significantly lower sales and
operational results.
Effective 2011, Medicare implemented an end stage renal
disease (ESRD) prospective payment system (ESRD PPS),
which expanded the scope of the products and services cov-
ered by a bundled rate and resulted in lower reimbursement
per treatment than under the reimbursement system in place.
ESRD-related drugs with only an oral form are expected to
be reimbursed under the ESRD PPS starting in January 2016
with an adjusted payment amount to be determined by the
Secretary of Health and Human Services to reflect the addi-
tional cost to dialysis facilities of providing these medications.
The ESRD PPS payment amount is subject to annual adjust-
ment based on increases in the costs of a “market basket” of
certain health care items and services less a produc tivity
adjustment. The centers for Medicare and Medicaid Services,
however, did not increase ESRD PPS base rates for 2015.

Managem
ent Report
Management Report88
The American Taxpayer Relief Act of 2012 (ATRA) directed
CMS to reduce the ESRD PPS payment rate, effective January
1, 2014, to account for changes in the utilization of certain
drugs and biologicals that are included in the ESRD PPS. In
making such a reduction, the law requires CMS to use the most
recently available pricing data for such drugs and biologicals.
In November 2013, CMS issued the final rule regarding the
2014 ESRD PPS payment rate. CMS decided to split the settled
reduction of the ESRD PPS payment rate (US$ 29.93 reduc-
tion) over a period between three and four years (2014 – 2017).
In November 2014, CMS announced that the ESRD PPS pay-
ment rates for 2015 will amount to US$ 239.43 showing a
small increase of 0.2% compared to 2014.
The ESRD PPS’s quality incentive program (QIP) affects
Medicare payments based on the performance of each facil-
ity on a set of quality measures. Dialysis facilities that fail to
achieve the established quality standards have payments for
a particular year reduced by up to 2% based on a year’s per-
formance. For the 2014 payment year, CMS has adopted addi-
tional measures to determine whether dialysis patients are
receiving high-quality care. For the years 2015 and 2016, addi-
tional quality measures will be established. In October 2014,
CMS announced the requirements for the years 2017 and
2018, including further adjustments on the measures. A mate-
rial failure by Fresenius Medical Care to achieve the mini-
mum client quality standards under the QIP could materially
and adversely affect its business, financial condition, and
results of operations.
Fresenius Medical Care mitigated the impact of the ESRD
PPS and the other legislative initiatives referenced above
with two broad measures. First, it worked with medical direc-
tors and treating physicians to make clinical protocol changes
used in treating patients consistent with the QIP and good
clinical practices, and it negotiated pharmaceutical acquisition
cost savings. In addition, Fresenius Medical Care achieved
greater efficiencies and better patient outcomes by introducing
new initiatives to improve patient care upon initiation of dial-
ysis, increasing the percentage of patients using home thera-
pies, and achieving additional cost reductions in its clinics.
Working with health care provider groups, also known as ESRD
Seamless Care Organizations (ESCOs), CMS plans to test a
new Comprehensive ESRD Care Model, for payment and care
delivery that seeks to deliver better health outcomes for
ESRD patients while lowering CMS’s costs. ESCOs that achieve
the program’s minimum quality thresholds and generate
reductions in CMS’s cost of care above certain thresholds for
the ESRD patients covered by the ESCO will receive a share
of the cost savings. ESCOs that include dialysis chains with
more than 200 facilities are required to share in the risk of
cost increases and reimburse CMS a share of any such in-
creases. Applications must be approved by CMS to participate
in the program.
Changes in the law or the reimbursement method could
affect the scope of payments for services as well as for insur-
ance coverage and the product business. This could have a
significant adverse impact on the assets and liabilities, finan-
cial position, and results of operations.
Research and developmentThe development of new products and therapies always car-
ries the risk that the ultimate goal might not be achieved,
or might take longer than planned. Regulatory approval of
new products requires comprehensive, cost-intensive pre-
clinical and clinical studies. Furthermore, there is a risk that
regulatory authorities either do not grant, or delay, product
approval. In addition, adverse effects of our products that
may be discovered after regulatory approval or registration
may lead to a partial or complete withdrawal from the mar-
ket, due either to regulatory actions or our voluntary decision
to stop marketing a product. The Fresenius Group spreads
its risk widely by conducting development activities in various
product segments. We also counteract risks from research
and development projects by regularly analyzing and assess-
ing development trends and examining the progress of
research projects. We also strictly comply with the legal reg-
ulations for clinical and chemical-pharmaceutical research
and development. With IV drugs, it is also crucial that new

Man
agem
ent
Rep
ort
Management Report Opportunities and risk report 89
products are continually brought to the market in a timely
manner. The product development process can be controlled
on the basis of detailed project roadmaps and a tight focus
on the achievement of specific milestones. If the defined tar-
gets are not achieved, countermeasures can be initiated.
Risks from the integration of acquisitionsThe acquisition and integration of companies carries risks
that can adversely affect the assets and liabilities, financial
position, and results of operations of Fresenius. Following an
acquisition, the acquired company’s structure must be inte-
grated while clarifying legal questions and contractual obliga-
tions. Marketing, patient services, and logistics must also
be unified. During the integration phase, key managers can
leave the company and both the course of ongoing business
processes and relationships with customers can be harmed.
In addition, change-of-control clauses may be claimed. The
integration process may prove to be more difficult and cost-
intensive, or last longer than expected. Risks can arise from
the operations of the newly acquired company that Fresenius
regarded as insignificant or was unaware of. An acquisition
may also prove to be less beneficial than initially expected.
Future acquisitions may be a strain on the finances and man-
agement of our business. Moreover, as a consequence of an
acquisition, Fresenius may become directly or indirectly liable
toward third parties, or claims against third parties may turn
out to be non-assertable.
We counter risks from acquisitions through detailed inte-
gration roadmaps and strict integration and project manage-
ment, so that countermeasures can be initiated in good time
if there are deviations from the expected development.
Personnel risksThe Company addresses potential shortages of qualified per-
sonnel externally by utilizing personnel marketing measures,
and internally by offering comprehensive personnel devel-
opment programs. We also seek to retain our employees by
introducing life-work time accounts in various areas. Further-
more, employees are entitled to attractive fringe benefits and,
in part, bonuses. By using target group-specific measures,
Fresenius addresses the overall shortage of specialized hospi-
tal personnel. We thereby recruit qualified, dedicated, and
specialized personnel, thus ensuring our high standard of treat-
ment quality. At the same time, by supporting the training
of young employees, we thereby seek their commitment to
Fresenius. As a result of these measures, risks in personnel
marketing are not considered to be significant.
Financial risksThe international operations of the Fresenius Group expose us
to a variety of currency risks. In addition, the financing of
the business exposes us to certain interest rate risks. We use
derivative financial instruments as part of our risk manage-
ment to avoid any possible negative impacts of these risks.
However, we limit ourselves to non-exchange-traded, mar-
ketable instruments, used exclusively to hedge our operations
and not for trading or speculative purposes. All transactions
are conducted with banks that have a high rating.
The Fresenius Group’s foreign exchange risk manage-
ment is based on a policy approved by the Management Board
that defines the targets, organization, and handling of the risk
management processes. In particular, the guidelines assign
responsibilities for risk determination, the execution of hedg-
ing transactions, and the regular reporting of risk manage-
ment. These responsibilities are coordinated with the manage-
ment structures in the residual business processes of the
Group. Decisions on the use of derivative financial instruments
in interest rate management are taken in close consultation
with the Management Board. Hedging transactions using
derivatives are carried out by the Corporate Treasury depart-
ment of the Fresenius Group – apart from a few exceptions
in order to adhere to foreign currency regulations. These trans-
actions are subject to stringent internal controls. This policy
ensures that the Management Board is fully informed of all
significant risks and current hedging activities.
The Fresenius Group is protected, to a large extent, against
currency and interest rate risks. As of December 31, 2014,
approximately 63% of the Fresenius Group’s debt was pro-
tected against increases in interest rates either by fixed-rate
financing arrangements or by interest rate hedges; 37%, or

Managem
ent Report
Management Report90
€ 5,718 million, was exposed to interest rate risks. A sensitivity
analysis shows that a rise of 0.5% in the reference rates
relevant for Fresenius would have a less than 1.5% impact on
Group net income.
As a global company, Fresenius is widely exposed to
trans lation effects due to foreign exchange rate fluctuations.
The exchange rate of the U.S. dollar to the euro is of partic-
ular importance because of our extensive operations in the
United States. Translation risks are not hedged. A sensitivity
analysis shows that a one cent change in the exchange rate
of the U.S. dollar to the euro would have an annualized effect
of about € 90 million on Group sales, about € 16 million on
EBIT, and about € 3 million on Group net income.
As a globally active company, we have production facilities
in all the main currency areas. In the service businesses,
our revenue and cost base largely coincide. The Fresenius
Group uses a Cash-Flow-at-Risk (CFaR) model in order to esti-
mate and quantify such transaction risks from foreign cur-
rencies. The foreign currency cash flows that are reasonably
expected to arise within the following twelve months, less
any hedges, form the basis for the analysis of the currency risk.
As of December 31, 2014, the Fresenius Group’s cash flow
at risk was € 50 million. Hence, with a probability of 95%, a
potential loss in relation to the forecasted foreign exchange
cash flows of the next twelve months will not be higher than
€ 50 million. Further details on financial risks can be found on
pages 161 to 167 in the Notes.
Financial risks that could arise from acquisitions, invest-
ments in property, plant and equipment, and in intangible
assets are assessed through careful and in-depth reviews of
the projects, sometimes assisted by external consultants.
Goodwill and other intangible assets with an indefinite useful
life carried in the Group’s consolidated balance sheet are
tested for impairment each year. Further information can be
found on pages 125 ff. of the Notes.
By normally assessing the creditworthiness of new custom-
ers, we limit the risk of late payment and defaults by cus-
tomers. We also conduct follow-up assessments and review
credit lines on an ongoing basis. Receivables outstanding
from existing customers are monitored, and the risk of defaults
is assessed. This particularly applies to countries with bud-
getary problems and countries exposed to political risks. In
2014, we again worked on our receivables, taking certain
measures such as factoring.
As a global corporation, Fresenius is subject to numerous
tax codes and regulations. The Fresenius Group’s compa-
nies are subject to regular tax audits. Any changes in tax reg-
ulations or resulting from tax audits could lead to higher
tax payments. Information on the status of the tax audits can
be found on pages 119 to 121 of the Notes.
Fresenius’ debt was € 15,454 million as of December 31,
2014. The debt could limit the ability to pay dividends,
arrange refinancing, be in compliance with its credit cove-
nants, or implement the corporate strategy. Other financing
risks could arise for Fresenius in the case of an ongoing
general financial market crisis. We reduce these risks through
a high proportion of mid- and long-term funding with a
balanced maturity profile. Our financing agreements contain
covenants requiring us to comply with certain financial
ratios and additional financial criteria. Non-compliance with
these covenants could result in a default and acceleration
of the debt under the agreements.
Additional information on conditions and maturities can
be found on pages 129 ff. of the Notes and on pages 69 ff. of
the Management Report.
Legal risksRisks that arise from legal disputes are continually identified,
analyzed, and communicated within the Company. Companies
in the health care industry are regularly exposed to actions
for breach of their duties of due care, product liability, breach
of warranty obligations, patent infringements, treatment errors,
and other claims. This can result in high claims for damages
and substantial costs for legal defense, regardless of whether
a claim for damages is actually justified. Legal disputes can
also result in an inability to insure against risks of this kind at
acceptable terms in future. Products from the health care
industry can also be subject to recall actions. This could have
a negative effect on the assets and liabilities, financial posi-
tion, and results of operations of the Group.
Information regarding legal matters and an ongoing inter-
nal compliance review at Fresenius Medical Care can be
found on pages 152 to 159 of the Notes.

Man
agem
ent
Rep
ort
Management Report Opportunities and risk report 91
The Fresenius Group is also involved in various legal issues
resulting from business operations. Although it is not possible
to predict the outcome of these disputes, none is expected to
have a significant adverse impact on the assets and liabilities,
financial position, and results of operations of the Group.
Other risksOther risks, such as environmental risks and risks involving
management and control systems, or our IT systems, were
not considered to be significant. IT risks are countered
through security measures, controls, and monitoring. In addi-
tion, we counter these risks with constant investment in
hardware and software, as well as by improving our system
know-how. Potential risks are covered by a detailed contin-
gency plan, which is continuously improved and tested. Redun-
dant systems are maintained for all key systems, such as IT
systems or communications infrastructure. A password system
is in place to minimize organizational risks, such as manipu-
lation and unauthorized access. In addition, there are Com-
pany guidelines regulating the granting of access authoriza-
tion, and compliance with these rules is monitored. We also
conduct operational and security-related audits.
Risks with effect on the 1-year forecast periodThe chart beside shows the significant risks that could lead
to deviations from the expected business performance within
the 1-year forecast period.
Change of risk assessment compared to previous yearIn 2014, the Company’s risk assessment did not change
compared to the previous year. The chart beside continues
to be valid.
ASSESSMENT OF OVERALL RISK The basis for evaluating overall risk is the risk management
that is regularly audited by management. Potential risks for the
Group include factors beyond its control, such as the evolution
of economies, which are constantly monitored by Fresenius.
Risks also include factors immediately within its control, such
as operating risks, which the Company anticipates and reacts
to appropriately, as required. There are currently no recogniz-
able risks regarding future performance that appear to pre-
sent a long-term and material threat to the Group’s assets and
liabilities, financial position, and results of operations. We
have created organizational structures that provide all the con-
ditions needed to rapidly alert us to possible risk situations
and to be able to take suitable counteraction.
RISKS AFFECTING THE 1-YEAR FORECAST PERIOD
hig
h ▶ Currencies and interest rates
med
ium
▶ Regulatory environment
▶ Quality
▶ Reimbursement rates and prices
low
▶ Procurement
▶ Litigations
▶ Tax
low medium high
Potential impact
Pro
babi
lity

Financial S
tatements
Consolidated Financial Statements92
93 Consolidated statement of income
93 Consolidated statement of comprehensive income
94 Consolidated statement of financial position
95 Consolidated statement of cash flows
96 Consolidated statement of changes in equity
98 Consolidated segment reporting
100 Notes
Table of CoNTeNTs CoNsolidaTed fiNaNCial sTaTemeNTs

Fin
anci
al S
tate
men
ts
93Consolidated Financial Statements Consolidated statement of income / Consolidated statement of comprehensive income
FreSeniuS Se & Co. KGaa
ConSolidated Statement oF inCome
FreSeniuS Se & Co. KGaa
ConSolidated Statement oF ComprehenSive inCome
€ in millions Note 2014 2013
sales 4 23,231 20,331
Cost of sales 5 - 16,389 - 13,948
Gross profit 6,842 6,383
selling, general and administrative expenses 8 - 3,359 - 3,044
Research and development expenses - 369 - 348
operating income (eBit) 3,114 2,991
interest income 9 128 50
interest expenses 9 - 730 - 634
income before income taxes 2,512 2,407
income taxes 10 - 700 - 669
net income 1,812 1,738
less noncontrolling interest 11 745 727
net income attributable to shareholders of Fresenius Se & Co. KGaa 1,067 1,011
earnings per ordinary share in € (after stock split 1 : 3) 12 1.97 1.89
fully diluted earnings per ordinary share in € (after stock split 1 : 3) 12 1.96 1.87
The following notes are an integral part of the consolidated financial statements.
€ in millions Note 2014 2013
net income 1,812 1,738
other comprehensive income (loss)
foreign currency translation 27, 29 953 - 581
Cash flow hedges 27, 29 1 35
Change of fair value of available for sale financial assets 27, 29 - 23 41
actuarial gains / losses on defined benefit pension plans 24, 27 - 340 37
income taxes related to components of other comprehensive income (loss) 27 85 - 23
other comprehensive income (loss), net 676 - 491
total comprehensive income 2,488 1,247
Comprehensive income attributable to noncontrolling interest subject to put provisions 171 65
Comprehensive income attributable to noncontrolling interest not subject to put provisions 1,018 394
Comprehensive income attributable to shareholders of Fresenius Se & Co. KGaa 1,299 788
The following notes are an integral part of the consolidated financial statements.

Financial S
tatements
Consolidated Financial Statements94
FreSeniuS Se & Co. KGaa
ConSolidated Statement oF FinanCial poSition
as of december 31, € in millions Note 2014 2013
Cash and cash equivalents 13 1,175 864
Trade accounts receivable, less allowance for doubtful accounts 14 4,235 3,474
accounts receivable from and loans to related parties 36 28
inventories 15 2,333 2,014
other current assets 16 1,843 1,261
deferred taxes 10 406 331
i. total current assets 10,028 7,972
Property, plant and equipment 17 6,776 5,082
Goodwill 18 19,868 14,826
other intangible assets 18 1,446 1,241
other non-current assets 16 1,458 3,433
deferred taxes 10 321 204
ii. total non-current assets 29,869 24,786
total assets 39,897 32,758
as of december 31, € in millions Note 2014 2013
Trade accounts payable 1,052 885
short-term accounts payable to related parties 5 2
short-term accrued expenses and other short-term liabilities 19, 20 4,164 3,057
short-term debt 21 230 959
short-term loans from related parties 3 6
Current portion of long-term debt and capital lease obligations 21 753 855
Current portion of senior Notes 22 682 0
short-term accruals for income taxes 161 211
deferred taxes 10 54 48
a. total short-term liabilities 7,104 6,023
long-term debt and capital lease obligations, less current portion 21 5,977 5,871
senior Notes, less current portion 22 6,977 5,113
Convertible bonds 23 832 0
long-term accrued expenses and other long-term liabilities 19, 20 661 434
Pension liabilities 24 1,099 714
long-term accruals for income taxes 216 180
deferred taxes 10 867 691
B. total long-term liabilities 16,629 13,003
i. total liabilities 23,733 19,026
ii. noncontrolling interest subject to put provisions 25 681 472
a. noncontrolling interest not subject to put provisions 25 6,148 5,065
subscribed capital 26 542 539
Capital reserve 26 3,018 2,955
other reserves 26 5,894 5,052
accumulated other comprehensive loss 27 - 119 - 351
B. total Fresenius Se & Co. KGaa shareholders’ equity 9,335 8,195
iii. total shareholders’ equity 15,483 13,260
total liabilities and shareholders’ equity 39,897 32,758
The following notes are an integral part of the consolidated financial statements.
asseTs
liabiliTies aNd shaReholdeRs’ equiTy

Fin
anci
al S
tate
men
ts
95Consolidated Financial Statements Consolidated statement of financial position / Consolidated statement of cash flows
FreSeniuS Se & Co. KGaa
ConSolidated Statement oF CaSh FlowS
January 1 to december 31, € in millions Note 2014 2013
operating activities
Net income 1,812 1,738
adjustments to reconcile net income to cash and cash equivalents provided by operating activities
depreciation and amortization 16, 17, 18 937 843
Gain on sale of investments and divestitures 2 - 66 - 55
Change in deferred taxes 10 60 2
Gain / loss on sale of fixed assets 7 - 14
Changes in assets and liabilities, net of amounts from businesses acquired or disposed of
Trade accounts receivable, net 14 - 204 18
inventories 15 - 134 - 268
other current and non-current assets 16 - 5 78
accounts receivable from / payable to related parties - 8 - 8
Trade accounts payable, accrued expenses and other short-term and long-term liabilities 19, 20 246 48
accruals for income taxes - 60 - 62
net cash provided by operating activities 2,585 2,320
investing activities
Purchase of property, plant and equipment 17 - 1,345 - 1,071
Proceeds from sales of property, plant and equipment 22 24
acquisitions and investments, net of cash acquired and net purchases of intangible assets 2, 31 - 2,214 - 2,703
Proceeds from sale of investments and divestitures 2 186 147
net cash used in investing activities - 3,351 - 3,603
Financing activities
Proceeds from short-term loans 21 202 1,088
Repayments of short-term loans 21 - 933 - 319
Proceeds from short-term loans from related parties – –
Repayments of short-term loans from related parties – –
Proceeds from long-term debt and capital lease obligations 21 2,541 3,810
Repayments of long-term debt and capital lease obligations 21 - 3,299 - 2,042
Proceeds from the issuance of senior Notes 22 2,094 500
Repayments of liabilities from senior Notes 22 0 - 1,150
Proceeds from the issuance of convertible bonds 23 900 0
Payments for the share buy-back program of fresenius medical Care 26 0 - 385
Changes of accounts receivable securitization program 21 - 7 142
Proceeds from the exercise of stock options 33 125 152
dividends paid - 582 - 491
Change in noncontrolling interest 25 – - 2
exchange rate effect due to corporate financing 2 2
net cash provided by financing activities 1,043 1,305
effect of exchange rate changes on cash and cash equivalents 34 - 43
net increase / decrease in cash and cash equivalents 311 - 21
Cash and cash equivalents at the beginning of the reporting period 13 864 885
Cash and cash equivalents at the end of the reporting period 13 1,175 864
The following notes are an integral part of the consolidated financial statements.

Financial S
tatements
Consolidated Financial Statements96
FreSeniuS Se & Co. KGaa
ConSolidated Statement oF ChanGeS in equity
subscribed Capital Reserves
Note
Number of ordinary shares
in thousand 1amount
€ in thousandsamount
€ in millions
Capital reserve
€ in millions
other reserves
€ in millions
as of december 31, 2012 534,564 534,564 535 2,868 4,358
Proceeds from the exercise of stock options 33 4,521 4,521 4 91
Compensation expense related to stock options 33 21
dividends paid 26 - 196
Purchase of noncontrolling interest not subject to put provisions 25
share buy-back program of fresenius medical Care aG & Co. KGaa 26 - 121
Change in fair value of noncontrolling interest subject to put provisions 25 - 25
Comprehensive income (loss)
Net income 1,011
other comprehensive income (loss)
Cash flow hedges 27, 29
Change of fair value of available for sale financial assets 27, 29
foreign currency translation 27, 29
actuarial gains / losses on defined benefit pension plans 24, 27
Comprehensive income (loss) 1,011
as of december 31, 2013 539,085 539,085 539 2,955 5,052
Proceeds from the exercise of stock options 33 2,448 2,448 3 67
Compensation expense related to stock options 33 19
dividends paid 26 - 225
Purchase of noncontrolling interest not subject to put provisions 25
Change in fair value of noncontrolling interest subject to put provisions 25 - 23
Comprehensive income (loss)
Net income 1,067
other comprehensive income (loss)
Cash flow hedges 27, 29
Change of fair value of available for sale financial assets 27, 29
foreign currency translation 27, 29
actuarial losses on defined benefit pension plans 24, 27
Comprehensive income 1,067
as of december 31, 2014 541,533 541,533 542 3,018 5,894
1 Prior year figures were adjusted due to the stock split in 2014.

Fin
anci
al S
tate
men
ts
97Consolidated Financial Statements Consolidated statement of changes in equity
Note
accumulated other com-prehensive
income (loss) € in millions
Total fresenius se & Co. KGaa shareholders’
equity € in millions
Non controlling interest not
subject to put provisions
€ in millions
Total shareholders’
equity € in millions
as of december 31, 2012 - 128 7,633 5,125 12,758
Proceeds from the exercise of stock options 33 95 57 152
Compensation expense related to stock options 33 21 7 28
dividends paid 26 - 196 - 206 - 402
Purchase of noncontrolling interest not subject to put provisions 25 0 6 6
share buy-back program of fresenius medical Care aG & Co. KGaa 26 - 121 - 264 - 385
Change in fair value of noncontrolling interest subject to put provisions 25 - 25 - 54 - 79
Comprehensive income (loss)
Net income 1,011 645 1,656
other comprehensive income (loss)
Cash flow hedges 27, 29 15 15 12 27
Change of fair value of available for sale financial assets 27, 29 34 34 – 34
foreign currency translation 27, 29 - 267 - 267 - 286 - 553
actuarial gains / losses on defined benefit pension plans 24, 27 - 5 - 5 23 18
Comprehensive income (loss) - 223 788 394 1,182
as of december 31, 2013 - 351 8,195 5,065 13,260
Proceeds from the exercise of stock options 33 70 55 125
Compensation expense related to stock options 33 19 4 23
dividends paid 26 - 225 - 240 - 465
Purchase of noncontrolling interest not subject to put provisions 25 0 297 297
Change in fair value of noncontrolling interest subject to put provisions 25 - 23 - 51 - 74
Comprehensive income (loss)
Net income 1,067 635 1,702
other comprehensive income (loss)
Cash flow hedges 27, 29 - 2 - 2 2 –
Change of fair value of available for sale financial assets 27, 29 - 16 - 16 – - 16
foreign currency translation 27, 29 393 393 470 863
actuarial losses on defined benefit pension plans 24, 27 - 143 - 143 - 89 - 232
Comprehensive income 232 1,299 1,018 2,317
as of december 31, 2014 - 119 9,335 6,148 15,483
The following notes are an integral part of the consolidated financial statements.

Financial S
tatements
Consolidated Financial Statements98
FreSeniuS Se & Co. KGaa
ConSolidated SeGment reportinG
fresenius medical Care fresenius Kabi fresenius helios fresenius Vamed Corporate / other fresenius Group
€ in millions 2014 2013 Change 2014 1 2013 1 Change 2014 2 2013 Change 2014 2013 Change 2014 4 2013 3 Change 2014 2013 Change
sales 11,917 11,000 8% 5,146 4,996 3% 5,244 3,393 55% 1,042 1,020 2% - 118 - 78 - 51% 23,231 20,331 14%
thereof contribution to consolidated sales 11,869 10,978 8% 5,104 4,956 3% 5,244 3,393 55% 1,009 987 2% 5 17 - 71% 23,231 20,331 14%
thereof intercompany sales 48 22 118% 42 40 5% 0 0 33 33 0% - 123 - 95 - 29% 0 0
contribution to consolidated sales 51% 54% 22% 24% 23% 17% 4% 5% 0% 0% 100% 100%
ebiTda 2,223 2,187 2% 1,084 1,143 - 5% 732 508 44% 71 65 9% - 59 - 69 14% 4,051 3,834 6%
depreciation and amortization 526 488 8% 211 217 - 3% 179 118 52% 12 10 20% 9 10 - 10% 937 843 11%
ebiT 1,697 1,699 0% 873 926 - 6% 553 390 42% 59 55 7% - 68 - 79 14% 3,114 2,991 4%
Net interest - 310 - 308 - 1% - 196 - 236 17% - 56 - 48 - 17% - 1 - 3 67% - 39 11 -- - 602 - 584 - 3%
income taxes - 440 - 446 1% - 189 - 178 - 6% - 86 - 60 - 43% - 16 - 14 - 14% 31 29 7% - 700 - 669 - 5%
Net income attributable to shareholders of fresenius se & Co. KGaa 786 836 - 6% 468 487 - 4% 400 275 45% 41 37 11% - 628 - 624 - 1% 1,067 1,011 6%
operating cash flow 1,401 1,532 - 9% 641 488 31% 558 258 116% - 9 31 - 129% - 6 11 - 155% 2,585 2,320 11%
Cash flow before acquisitions and dividends 709 984 - 28% 289 177 63% 295 91 -- - 18 20 - 190% - 13 1 -- 1,262 1,273 - 1%
Total assets 20,960 16,764 25% 9,655 8,598 12% 8,352 6,597 27% 891 726 23% 39 73 - 47% 39,897 32,758 22%
debt 7,851 6,103 29% 5,205 4,735 10% 1,394 3,538 - 61% 159 117 36% 845 - 1,689 150% 15,454 12,804 21%
Capital expenditure, gross 701 563 25% 361 317 14% 266 172 55% 10 11 - 9% 7 10 - 30% 1,345 1,073 25%
acquisitions, gross / investments 1,495 424 -- 118 131 - 10% 824 2,185 - 62% 12 16 - 25% 1 - 2 150% 2,450 2,754 - 11%
Research and development expenses 92 95 - 3% 276 250 10% – – -- 0 0 1 3 - 67% 369 348 6%
employees (per capita on balance sheet date) 105,917 95,637 11% 32,899 31,961 3% 68,852 42,913 60% 7,746 7,010 10% 861 816 6% 216,275 178,337 21%
Key figures
ebiTda margin 18.7% 19.9% 21.1% 22.9% 14.0% 15.0% 6.8% 6.4% 17.6% 2 19.1% 1
ebiT margin 14.2% 15.4% 17.0% 18.5% 10.5% 11.5% 5.7% 5.4% 13.6% 2 15.0% 1
depreciation and amortization in % of sales 4.4% 4.4% 4.1% 4.3% 3.4% 3.5% 1.2% 1.0% 4.0% 4.1%
operating cash flow in % of sales 11.8% 13.9% 12.5% 9.8% 10.6% 7.6% - 0.9% 3.0% 11.1% 11.4%
Rooa 9.7% 10.5% 10.5% 11.9% 7.4% 9.3% 11.2% 11.6% 9.1% 5 10.6% 6
1 before integration costs2 before integration costs and disposal gains (two helios hospitals)3 after integration costs4 after integration costs and disposal gains (two helios hospitals, Rhön stake)5 The underlying pro forma ebiT does not include integration costs and disposal gains
(two helios hospitals, Rhön stake).6 The underlying pro forma ebiT does not include integration costs.
The consolidated segment reporting by business segment is an integral part of the notes.The following notes are an integral part of the consolidated financial statements.
by busiNess seGmeNT
by ReGioNeurope North america asia-Pacific latin america africa fresenius Group
€ in millions 2014 2013 Change 2014 2013 Change 2014 2013 Change 2014 2013 Change 2014 2013 Change 2014 2013 Change
sales 10,162 8,216 24% 9,307 8,620 8% 2,205 1,945 13% 1,186 1,174 1% 371 376 - 1% 23,231 20,331 14%
contribution to consolidated sales 44% 40% 40% 42% 9% 10% 5% 6% 2% 2% 100% 100%
ebiT 865 823 5% 1,684 1,667 1% 392 296 32% 131 159 - 18% 42 46 - 9% 3,114 2,991 4%
depreciation and amortization 432 370 17% 398 377 6% 65 56 16% 36 35 3% 6 5 20% 937 843 11%
Total assets 15,701 13,529 16% 19,798 15,833 25% 2,960 2,305 28% 1,273 950 34% 165 141 17% 39,897 32,758 22%
Capital expenditure, gross 670 519 29% 451 372 21% 124 111 12% 92 62 48% 8 9 - 11% 1,345 1,073 25%
acquisitions, gross / investments 879 2,257 - 61% 1,233 347 -- 208 126 65% 130 21 -- 0 3 - 100% 2,450 2,754 - 11%
employees (per capita on balance sheet date) 112,829 85,706 32% 65,817 60,600 9% 19,690 15,859 24% 16,136 14,474 11% 1,803 1,698 6% 216,275 178,337 21%
The consolidated segment reporting by region is an integral part of the notes.The following notes are an integral part of the consolidated financial statements.

Fin
anci
al S
tate
men
ts
99Consolidated Financial Statements Consolidated segment reporting
fresenius medical Care fresenius Kabi fresenius helios fresenius Vamed Corporate / other fresenius Group
€ in millions 2014 2013 Change 2014 1 2013 1 Change 2014 2 2013 Change 2014 2013 Change 2014 4 2013 3 Change 2014 2013 Change
sales 11,917 11,000 8% 5,146 4,996 3% 5,244 3,393 55% 1,042 1,020 2% - 118 - 78 - 51% 23,231 20,331 14%
thereof contribution to consolidated sales 11,869 10,978 8% 5,104 4,956 3% 5,244 3,393 55% 1,009 987 2% 5 17 - 71% 23,231 20,331 14%
thereof intercompany sales 48 22 118% 42 40 5% 0 0 33 33 0% - 123 - 95 - 29% 0 0
contribution to consolidated sales 51% 54% 22% 24% 23% 17% 4% 5% 0% 0% 100% 100%
ebiTda 2,223 2,187 2% 1,084 1,143 - 5% 732 508 44% 71 65 9% - 59 - 69 14% 4,051 3,834 6%
depreciation and amortization 526 488 8% 211 217 - 3% 179 118 52% 12 10 20% 9 10 - 10% 937 843 11%
ebiT 1,697 1,699 0% 873 926 - 6% 553 390 42% 59 55 7% - 68 - 79 14% 3,114 2,991 4%
Net interest - 310 - 308 - 1% - 196 - 236 17% - 56 - 48 - 17% - 1 - 3 67% - 39 11 -- - 602 - 584 - 3%
income taxes - 440 - 446 1% - 189 - 178 - 6% - 86 - 60 - 43% - 16 - 14 - 14% 31 29 7% - 700 - 669 - 5%
Net income attributable to shareholders of fresenius se & Co. KGaa 786 836 - 6% 468 487 - 4% 400 275 45% 41 37 11% - 628 - 624 - 1% 1,067 1,011 6%
operating cash flow 1,401 1,532 - 9% 641 488 31% 558 258 116% - 9 31 - 129% - 6 11 - 155% 2,585 2,320 11%
Cash flow before acquisitions and dividends 709 984 - 28% 289 177 63% 295 91 -- - 18 20 - 190% - 13 1 -- 1,262 1,273 - 1%
Total assets 20,960 16,764 25% 9,655 8,598 12% 8,352 6,597 27% 891 726 23% 39 73 - 47% 39,897 32,758 22%
debt 7,851 6,103 29% 5,205 4,735 10% 1,394 3,538 - 61% 159 117 36% 845 - 1,689 150% 15,454 12,804 21%
Capital expenditure, gross 701 563 25% 361 317 14% 266 172 55% 10 11 - 9% 7 10 - 30% 1,345 1,073 25%
acquisitions, gross / investments 1,495 424 -- 118 131 - 10% 824 2,185 - 62% 12 16 - 25% 1 - 2 150% 2,450 2,754 - 11%
Research and development expenses 92 95 - 3% 276 250 10% – – -- 0 0 1 3 - 67% 369 348 6%
employees (per capita on balance sheet date) 105,917 95,637 11% 32,899 31,961 3% 68,852 42,913 60% 7,746 7,010 10% 861 816 6% 216,275 178,337 21%
Key figures
ebiTda margin 18.7% 19.9% 21.1% 22.9% 14.0% 15.0% 6.8% 6.4% 17.6% 2 19.1% 1
ebiT margin 14.2% 15.4% 17.0% 18.5% 10.5% 11.5% 5.7% 5.4% 13.6% 2 15.0% 1
depreciation and amortization in % of sales 4.4% 4.4% 4.1% 4.3% 3.4% 3.5% 1.2% 1.0% 4.0% 4.1%
operating cash flow in % of sales 11.8% 13.9% 12.5% 9.8% 10.6% 7.6% - 0.9% 3.0% 11.1% 11.4%
Rooa 9.7% 10.5% 10.5% 11.9% 7.4% 9.3% 11.2% 11.6% 9.1% 5 10.6% 6
1 before integration costs2 before integration costs and disposal gains (two helios hospitals)3 after integration costs4 after integration costs and disposal gains (two helios hospitals, Rhön stake)5 The underlying pro forma ebiT does not include integration costs and disposal gains
(two helios hospitals, Rhön stake).6 The underlying pro forma ebiT does not include integration costs.
The consolidated segment reporting by business segment is an integral part of the notes.The following notes are an integral part of the consolidated financial statements.
europe North america asia-Pacific latin america africa fresenius Group
€ in millions 2014 2013 Change 2014 2013 Change 2014 2013 Change 2014 2013 Change 2014 2013 Change 2014 2013 Change
sales 10,162 8,216 24% 9,307 8,620 8% 2,205 1,945 13% 1,186 1,174 1% 371 376 - 1% 23,231 20,331 14%
contribution to consolidated sales 44% 40% 40% 42% 9% 10% 5% 6% 2% 2% 100% 100%
ebiT 865 823 5% 1,684 1,667 1% 392 296 32% 131 159 - 18% 42 46 - 9% 3,114 2,991 4%
depreciation and amortization 432 370 17% 398 377 6% 65 56 16% 36 35 3% 6 5 20% 937 843 11%
Total assets 15,701 13,529 16% 19,798 15,833 25% 2,960 2,305 28% 1,273 950 34% 165 141 17% 39,897 32,758 22%
Capital expenditure, gross 670 519 29% 451 372 21% 124 111 12% 92 62 48% 8 9 - 11% 1,345 1,073 25%
acquisitions, gross / investments 879 2,257 - 61% 1,233 347 -- 208 126 65% 130 21 -- 0 3 - 100% 2,450 2,754 - 11%
employees (per capita on balance sheet date) 112,829 85,706 32% 65,817 60,600 9% 19,690 15,859 24% 16,136 14,474 11% 1,803 1,698 6% 216,275 178,337 21%
The consolidated segment reporting by region is an integral part of the notes.The following notes are an integral part of the consolidated financial statements.

Consolidated Financial Statements100
Financial S
tatements
101 General notes
101 1. Principles
101 I. Group structure
101 II. Basis of presentation
102 III. Summary of significant accounting policies
113 IV. Critical accounting policies
114 2. Acquisitions, divestitures and investments
118 Notes on the consolidated statement of income
118 3. Special items
118 4. Sales
118 5. Cost of sales
118 6. Cost of materials
118 7. Personnel expenses
119 8. Selling, general and administrative expenses
119 9. Net interest
119 10. Taxes
121 11. Noncontrolling interest
121 12. Earnings per share
122 Notes on the consolidated statement of financial position
122 13. Cash and cash equivalents
122 14. Trade accounts receivable
122 15. Inventories
123 16. Other current and non-current assets
124 17. Property, plant and equipment
125 18. Goodwill and other intangible assets
128 19. Accrued expenses
129 20. Other liabilities
130 21. Debt and capital lease obligations
137 22. Senior Notes
138 23. Convertible bonds
139 24. Pensions and similar obligations
145 25. Noncontrolling interest
146 26. Fresenius SE & Co. KGaA shareholders’ equity
150 27. Other comprehensive income (loss)
152 Other notes
152 28. Commitments and contingent liabilities
160 29. Financial instruments
167 30. Supplementary information on capital management
168 31. Supplementary information on the consolidated
statement of cash flows
169 32. Notes on the consolidated segment reporting
171 33. Stock options
179 34. Related party transactions
179 35. Subsequent events
180 Notes in accordance with the German Commercial Code (HGB)
180 36. Compensation of the Management Board and
the Supervisory Board
181 37. Auditor’s fees
181 38. Corporate Governance
181 39. Proposal for the distribution of earnings
182 40. Responsibility statement
TABlE OF CONTENTS NOTES

Consolidated Financial Statements General notes 101
Fin
anci
al S
tate
men
ts
General noteS
1. PrinCiPleS
i. GrouP StruCture
Fresenius is a global health care group with products and ser-
vices for dialysis, hospitals and outpatient medical care. In
addition, the Fresenius Group focuses on hospi tal operations
and also manages projects and provides services for hospi-
tals and other health care facilities worldwide. Besides the
activities of the parent company Fresenius SE & Co. KGaA,
Bad Homburg v. d. H., the operating activities were split into
the following legally independent business segments in the
fiscal year 2014:
▶ Fresenius Medical Care
▶ Fresenius Kabi
▶ Fresenius Helios
▶ Fresenius Vamed
Fresenius Medical Care is the world’s leading provider of ser-
vices and products for patients with chronic kidney failure.
As of December 31, 2014, Fresenius Medical Care was treat-
ing 286,312 patients in 3,361 dialysis clinics.
Fresenius Kabi offers infusion therapies, intravenously
administered generic drugs and clinical nutrition for seriously
and chronically ill patients in the hospital and outpatient
environments. The company is also a leading supplier of medi-
cal devices and transfusion technology products.
Fresenius Helios is Germany’s largest hospital operator.
At the end of 2014, the HElIOS Group operated 110 hospitals:
86 acute care hospitals, including 7 maximum care clinics
in Berlin-Buch, Duisburg, Erfurt, Krefeld, Schwerin, Wies-
baden and Wuppertal as well as 24 post-acute care hospitals.
Fresenius Helios has more than 34,000 beds and treats over
4.2 million patients – including more than 1.2 million inpa-
tients – each year.
Fresenius Vamed manages projects and provides services
for hospitals and other health care facilities worldwide.
Fresenius SE & Co. KGaA owned 31.09% of the subscribed
capital of Fresenius Medical Care AG & Co. KGaA (FMC-AG &
Co. KGaA) at the end of the fiscal year 2014. Fresenius Medical
Care Management AG, the general partner of FMC-AG & Co.
KGaA, is a wholly owned subsidiary of Fresenius SE & Co. KGaA.
Through this structure, Fresenius SE & Co. KGaA has rights
that give Fresenius SE & Co. KGaA the ability to direct the rele-
vant activities and, hence, the earnings of FMC-AG & Co.
KGaA. Therefore, FMC-AG & Co. KGaA is fully consolidated in
the consolidated financial statements of the Fresenius Group.
Fresenius SE & Co. KGaA continued to hold 100% of the
management companies of the business segments Fresenius
Kabi ( Fresenius Kabi AG) as well as Fresenius Helios and
Fresenius Vamed (both held through Fresenius ProServe
GmbH) on December 31, 2014. Through Fresenius ProServe
GmbH, Fresenius SE & Co. KGaA holds 100% in HElIOS
Kliniken GmbH and a 77% stake in VAMED AG. In addition,
Fresenius SE & Co. KGaA holds interests in com panies with
holding functions regarding real estate, financing and insur-
ance, as well as in Fresenius Netcare GmbH which offers
services in the field of information technology.
The reporting currency in the Fresenius Group is the
euro. In order to make the presentation clearer, amounts are
mostly shown in million euros. Amounts under € 1 million
after rounding are marked with “–”.
ii. BaSiS oF PreSentation
The accompanying consolidated financial statements have
been prepared in accordance with the United States Generally
Accepted Accounting Principles (U.S. GAAP).
Fresenius SE & Co. KGaA, as a stock exchange listed com-
pany with a domicile in a member state of the European
Union, fulfills the obligation to prepare and publish the consol-
idated financial statements in accordance with the Interna-
tional Financial Reporting Standards (IFRS) applying Section
315a of the German Commercial Code (HGB). Simultaneously,
the Fresenius Group voluntarily prepares and publishes
the consolidated financial statements in accordance with
U.S. GAAP.
In order to improve readability, various items are aggre-
gated in the consolidated statement of financial position and
in the consolidated statement of income. These items are
shown separately in the notes to provide useful information
to the readers of the consolidated financial statements.

Consolidated Financial Statements102
Financial S
tatements
The consolidated statement of financial position is classified on
the basis of the maturity of assets and liabilities; the con-
solidated statement of income is classified using the cost-of-
sales accounting format.
iii. Summary oF SiGniFiCant aCCountinG
PoliCieS
a) Principles of consolidationThe financial statements of consolidated entities have been
prepared using uniform accounting methods. The acquisi-
tions of companies are accounted for applying the purchase
method.
Capital consolidation is performed by offsetting invest-
ments in subsidiaries against the underlying revaluated equity
at the date of acquisition. The identifiable assets and liabili-
ties of subsidiaries as well as the noncontrolling interest are
recognized at their fair values. Any remaining debit balance
between the investments in subsidiaries plus the noncontrol-
ling interest and the revaluated equity is recognized as good-
will and is tested at least once a year for impairment.
All significant intercompany sales, expenses, income,
receivables and payables are eliminated. Profits and losses on
items of property, plant and equipment and inventory acquired
from other Group entities are also eliminated. Deferred tax
assets and liabilities are recognized on temporary differences
resulting from consolidation procedures.
Noncontrolling interest subject to put provisions is recog-
nized between liabilities and equity in the consolidated state-
ment of financial position. Noncontrolling interest not subject
to put provisions is comprised of the interest of non controlling
shareholders in the consolidated equity of Group entities.
Profits and losses attributable to the non controlling sharehold-
ers are separately disclosed in the consolidated statement of
income. Noncontrolling interest not subject to put provisions
of acquired entities is valuated at fair value.
Associated companies, over which Fresenius SE & Co.
KGaA has significant exercisable influence (generally it holds
more than 20% and less than 50% of the voting rights),
are con solidated using the equity method. Investments that
are not classified as in associated companies are recorded
at acqui sition costs or at fair value, respectively.
b) Composition of the GroupThe consolidated financial statements include all material
companies in which Fresenius SE & Co. KGaA has legal or
effective control. This includes variable interest entities
(VIEs) for which the Fresenius Group is deemed the primary
beneficiary.
Fresenius Medical Care has entered into various arrange-
ments with certain legal entities whereby the entities’ investors
own disproportionate equity ownership interests in relation
to the risks and rewards they retain for these arrangements or
the entities are unable to provide their own funding for their
operations. In these arrangements, the entities are VIEs, in
which Fresenius Medical Care has been determined to be the
primary beneficiary and which therefore have been fully con-
solidated. Fresenius Medical Care has provided some or all of
the following services to these VIEs: management, financing
or product supply. They generated approximately € 402 million
(US$ 534 million) and € 153 million (US$ 203 million) in sales
in 2014 and 2013, respectively. Fresenius Medical Care pro-
vided funding to these VIEs through loans and accounts
receivable of € 246 million (US$ 299 million) and € 109 million
(US$ 150 million) in 2014 and 2013, respectively. Relating to
the VIEs, in 2014, Fresenius Medical Care consolidated assets
in an amount of € 432 million (US$ 525 million), liabilities in
an amount of € 423 million (US$ 514 million) and € 9 million
(US$ 11 million) in equity. In 2013, € 160 million (US$ 221 mil-
lion) assets, € 107 million (US$ 147 million) liabilities and
€ 54 million (US$ 74 million) equity were consolidated. The
interest held by the other shareholders in the consolidated
VIEs is reported as noncontrolling interest in the consolidated
statement of financial position.
Fresenius Vamed participates in project entities which
are set up for long-term defined periods of time and for the
specific purpose of constructing and operating thermal cen-
ters. Some of these project entities qualify as VIEs, in which
Fresenius Vamed is not the primary beneficiary based on
the cash flow analysis of the involved parties. The project enti-
ties generated approximately € 98 million in sales in 2014
(2013: € 88 million). The VIEs finance themselves mainly
through debt, profit participation rights and investment grants.
Assets and liabilities relating to the VIEs are not material.

Consolidated Financial Statements General notes 103
Fin
anci
al S
tate
men
ts
Fresenius Vamed made no payments to the VIEs other than
contractually stipulated. From today’s perspective and due to
the contractual situation, Fresenius Vamed is not exposed to
any material risk of loss from these VIEs.
The consolidated financial statements of 2014 included,
in addition to Fresenius SE & Co. KGaA, 2,168 fully consolidated
companies and 29 companies were accounted for under the
equity method. In 2014, there were no material changes in the
scope of consolidated entities, except for those mentioned
in note 2, Acquisitions, divestitures and investments.
The complete list of the investments of Fresenius SE & Co.
KGaA, registered office in 61352 Bad Homburg v. d. H., Else-
Kröner-Straße 1, will be submitted to the electronic Federal
Gazette and the electronic companies register.
In 2014, the following fully consolidated German subsid-
iaries of the Fresenius Group applied the exemption provided
in Sections 264 (3) and 264b, respectively, of the German
Commercial Code (HGB):
Name of the company Registered office
Corporate / other
Fresenius Biotech Beteiligungs GmbH Bad Homburg v. d. H.
Fresenius Immobilien-Verwaltungs-GmbH & Co. Objekt Friedberg KG Bad Homburg v. d. H.
Fresenius Immobilien-Verwaltungs-GmbH & Co. Objekt St. Wendel KG Bad Homburg v. d. H.
Fresenius Immobilien-Verwaltungs-GmbH & Co. Objekt Schweinfurt KG Bad Homburg v. d. H.
Fresenius Netcare GmbH Bad Homburg v. d. H.
Fresenius ProServe GmbH Bad Homburg v. d. H.
FPS Beteiligungs AG Düsseldorf
FPS Immobilien VerwaltungsGmbH & Co. Reichenbach KG Bad Homburg v. d. H.
ProServe Krankenhaus Beteiligungs-gesellschaft mbH & Co. KG München
Fresenius Kabi
CFl GmbH Frankfurt am Main
Fresenius Kabi AG Bad Homburg v. d. H.
Fresenius Kabi Deutschland GmbH Bad Homburg v. d. H.
Hosped GmbH Friedberg
Rheinische Compounding GmbH Bonn
V. Krütten MedizinischeEinmalgeräte GmbH Idstein
Name of the company Registered office
Fresenius Helios
Betriebsführungsgesellschaft Schloß Schönhagen GmbH Schönhagen
Damp Diagnostik und Physio Holding GmbH Hamburg
ENDO Reha-Zentrum GmbH Hamburg
Gesundheitszentrum Buch GmbH Berlin
HElIOS Agnes-Karll-Krankenhaus GmbH Bad Schwartau
HElIOS Care GmbH Berlin
HElIOS Fachklinik Schleswig GmbH Schleswig
HElIOS Fachpflege Schleswig GmbH Schleswig
HElIOS Gesundheitsmanagement GmbH Berlin
HElIOS Kids in Pflege GmbH Geesthacht
HElIOS Klinik Ahrenshoop GmbH Ahrenshoop
HElIOS Klinik Berching GmbH Berching
HElIOS Klinik Blankenhain GmbH Blankenhain
HElIOS Klinik Bleicherode GmbH Bleicherode
HElIOS Klinik Geesthacht GmbH Geesthacht
HElIOS Klinik leisnig GmbH leisnig
HElIOS Klinik lengerich GmbH lengerich
HElIOS Klinik Schkeuditz GmbH Schkeuditz
HElIOS Klinik Schloss Schönhagen GmbH Damp
HElIOS Klinik Volkach GmbH Volkach
HElIOS Kliniken GmbH Berlin
HElIOS Kliniken Breisgau-Hochschwarzwald GmbH Müllheim
HElIOS Kliniken Mansfeld-Südharz GmbH Sangerhausen
HElIOS Kliniken Taunus GmbH Bad Schwalbach
HElIOS Klinikum Aue GmbH Aue
HElIOS Klinikum Bad Saarow GmbH Bad Saarow
HElIOS Klinikum Berlin-Buch GmbH Berlin
HElIOS Klinikum Erfurt GmbH Erfurt
HElIOS Klinikum Schwelm GmbH Schwelm
HElIOS Klinikum Wuppertal GmbH Wuppertal
HElIOS Privatkliniken GmbH Bad Homburg v. d. H.
HElIOS Rehaklinik Damp GmbH Damp
HElIOS-SERVICE GmbH Berlin
HElIOS Spital Überlingen GmbH Überlingen
HElIOS St. Josefs-Hospital GmbH Bochum
HElIOS Versorgungszentren GmbH Berlin
HElIOS Vogtland-Klinikum Plauen GmbH Plauen
HUMAINE Kliniken GmbH Berlin
Medizinisches Versorgungszentrum am HElIOS Klinikum Bad Saarow GmbH Bad Saarow
ostsee resort damp GmbH Damp
Reha-Zentrum Norderstedt GmbH Norderstedt
Senioren- und Pflegeheim Erfurt GmbH Erfurt
Verwaltungsgesellschaft ENDO-Klinik mbH Hamburg
WAK Wittgensteiner Akutkliniken “Bad Berleburg” GmbH Bad Berleburg

Consolidated Financial Statements104
Financial S
tatements
c) ClassificationsCertain items in the consolidated financial statements of
2013 have been reclassified to conform with the presentation
in 2014.
d) Sales recognition policySales from services are recognized at the amount estimated
to be receivable under reimbursement arrangements with
third party payors. Sales are recognized on the date services
and related products are provided and the customer is obli-
gated to pay.
Product sales are recognized when the title to the product
passes to the customers, either at the time of shipment,
upon receipt by the customer or upon any other terms that
clearly define passage of title. As product returns are not
typical, no return provisions are recognized. In the event that
a return is required, the appropriate reductions to sales,
cost of sales and accounts receivable are made. Sales are pre-
sented net of discounts, allowances and rebates.
In the business segment Fresenius Vamed, sales for long-
term production contracts are recognized using the percent-
age of completion (PoC) method when the accounting condi-
tions are met. The sales to be recognized are calculated as a
percentage of the costs already incurred based on the esti-
mated total cost of the contract, milestones laid down in the
contract or the percentage of completion. Profits are only rec-
ognized when the earnings of a production contract accounted
for using the PoC method can be measured reliably. Any
expected excess of total contract costs over total contract rev-
enue for a contract is recognized as an expense immediately.
Any tax assessed by a governmental authority that is
incurred as a result of a sales transaction (e. g. sales tax) is
excluded from sales and the related sale is reported on a
net basis.
e) Government grantsThe Fresenius Group primarily receives governmental funding
for hospitals in Germany to finance buildings and medical
equipment. Public sector grants are not recognized until there
is reasonable assurance that the respective conditions are
met and the grants will be received. Initially, the grant is
recorded as a liability and as soon as the asset is acquired,
the grant is offset against the acquisition costs. Expense-
related grants are recognized as income in the periods in
which related costs occur.
f) research and development expensesResearch is the independent and planned investigation under-
taken with the prospect of gaining new scientific or techni-
cal knowledge and understanding. Development is the techni-
cal and commercial implementation of research results and
occurs before the start of the commercial production or use.
Research and development expenses are expensed as incurred.
g) impairmentThe Fresenius Group reviews the carrying amounts of its prop-
erty, plant and equipment, intangible assets and other non-
current assets for impairment whenever events or changes in
circumstances indicate that the carrying amount of these
assets may not be recoverable. Recoverability of these assets
is measured by comparing the carrying amount of an asset
to the future net cash flow directly associated with the asset.
If assets are considered to be impaired, the impairment rec-
ognized is the amount by which the carrying amount exceeds
the fair value of the asset. The Fresenius Group uses a dis-
counted cash flow approach or other methods, if appropriate,
to assess fair value. long-lived assets to be disposed of by
sale are reported at the lower of carrying amount or fair value
less cost to sell and depreciation is ceased.
h) Capitalized interestThe Fresenius Group includes capitalized interest as part of
the cost of the asset if it is directly attributable to the acqui-
sition, construction or manufacture of qualifying assets. For
the fiscal years 2014 and 2013, interest of € 3 million and
€ 5 million, based on an average interest rate of 5.09% and
5.92%, respectively, was recognized as a component of the
cost of assets.

Consolidated Financial Statements General notes 105
Fin
anci
al S
tate
men
ts
i) income taxesCurrent taxes are calculated based on the earnings of the
fiscal year and in accordance with local tax rules of the
respective tax jurisdictions. Expected and executed addi-
tional tax payments and tax refunds for prior years are
also taken into account.
Deferred tax assets and liabilities are recognized for the
future consequences attributable to temporary differences
between the financial statement carrying amounts of existing
assets and liabilities and their respective tax basis. Further-
more, deferred taxes are recognized on certain consolidation
procedures affecting net income attributable to shareholders
of Fresenius SE & Co. KGaA. Deferred tax assets also include
claims to future tax reductions which arise from the more
likely than not expected usage of existing tax losses available
for carryforward. The recognition of deferred tax assets
from net operating losses and their utilization is based on the
budget planning of the Fresenius Group and implemented
tax strategies.
Deferred taxes are computed using enacted or adopted tax
rates in the relevant national jurisdictions when the amounts
are recovered. Tax rates which will be valid in the future but
are not adopted till the date of the statement of financial posi-
tion are not considered.
The realizability of the carrying amount of a deferred tax
asset is reviewed at each date of the statement of financial
position. In assessing the realizability of deferred tax assets,
the Management considers whether it is more likely than
not that some portion or all of a deferred tax asset will be real-
ized. The ultimate realization of deferred tax assets is depen-
dent upon the gen eration of future taxable income during the
periods in which those temporary differences and tax loss
carryforwards become deductible. The Management considers
the expected reversal of deferred tax lia bilities and projected
future taxable income in making this assessment.
If it is no longer more likely than not that sufficient taxable
income will be available to allow the benefit of part or of the
entire deferred tax asset to be utilized, the carrying amount of
the deferred tax asset is reduced to that certain extent. The
reduction is reversed to the date and extent that it becomes
probable that sufficient taxable profit will be available.
It is Fresenius Group’s policy that assets on uncertain tax
positions are recognized to the extent it is more likely than not
the tax will be recovered. It is also Fresenius Group’s policy
to recognize interest and penalties related to its tax positions
as income tax expense.
j) unrecognized tax benefitsThe recognition and measurement of all tax positions taken
or expected to be taken on a tax return requires a two step
approach. The Fresenius Group must determine whether it is
more likely than not that a tax position will be sustained
upon examination, including resolution of any related appeals
or litigation processes, based on the technical merits of the
position. If the threshold is met, the tax position is measured
at the largest amount of tax benefit that is more than 50%
likely of being realized upon settlement and is recognized in
the consolidated financial statements.
k) earnings per ordinary shareBasic earnings per ordinary share are computed by dividing
net income attributable to shareholders of Fresenius SE & Co.
KGaA by the weighted-average number of ordinary shares
outstanding during the year. Diluted earnings per share include
the effect of all potentially dilutive instruments on ordi nary
shares that would have been outstanding during the fiscal year.
The equity-settled awards granted under Fresenius’ and
Fresenius Medical Care’s stock option plans can result in a
dilutive effect.
l) Cash and cash equivalentsCash and cash equivalents are comprised of cash funds and
all short-term, liquid investments with original maturities of up
to three months (time deposits and securities).
m) trade accounts receivableTrade accounts receivable are stated at their nominal value
less an allowance for doubtful accounts. The allowances are
estimates comprised of customer-specific evaluations regard-
ing their payment history, current financial stability, and

Consolidated Financial Statements106
Financial S
tatements
applicable country-specific risks for receivables that are over-
due more than one year. From time to time, accounts receiv-
able are reviewed for changes from the historic collection expe-
rience to ensure the appropriateness of the allowances.
n) inventoriesInventories are comprised of all assets which are held for sale
in the normal course of business (finished goods), in the pro-
cess of production for such sale (work in process) or consumed
in the production process or in the rendering of services (raw
materials and purchased components).
Inventories are stated at the lower of acquisition and
manufacturing cost (determined by using the average or first-
in, first-out method) or market value. Manufacturing costs
are comprised of direct costs, production and material over-
head, including depreciation charges.
o) available for sale financial assetsInvestments in equity instruments, debt instruments and
fund shares are classified as available for sale financial assets
and measured at fair value. The Fresenius Group regularly
reviews if objective substantial evidence occurs that would
indicate an impairment of a financial asset or a portfolio of
financial assets. After testing the recover ability of these assets,
a possible impairment loss is recorded in the consolidated
statement of financial position. Gains and losses of available
for sale financial assets are recognized directly in the con-
solidated statement of equity until the financial asset is dis-
posed of or if it is considered to be impaired. In the case of
an impairment, the accumulated net loss is retrieved from the
consolidated statement of equity and recognized in the con-
solidated statement of income.
p) Property, plant and equipmentProperty, plant and equipment are stated at acquisition and
manufacturing cost less accumulated depreciation. Signifi-
cant improvements are capitalized; repairs and maintenance
costs that do not extend the useful lives of the assets are
charged to expense as incurred. Depreciation on property,
plant and equipment is calculated using the straight-line
method over the estimated useful lives of the assets ranging
from 3 to 50 years for buildings and improvements (with
a weighted-average life of 16 years) and 2 to 15 years for
machinery and equipment (with a weighted-average life of
11 years).
q) intangible assets with finite useful livesIntangible assets with finite useful lives, such as patents, prod-
uct and distribution rights, non-compete agreements, tech-
nology as well as licenses to manufacture, distribute and sell
pharmaceutical drugs, are amortized using the straight-line
method over their respective useful lives to their residual val-
ues and reviewed for impairment (see note 1. III. g, Impair-
ment). The useful life of patents, product and distribution rights
ranges from 5 to 20 years, the average useful life is 13 years.
Non-compete agreements with finite useful lives have useful
lives ranging from 2 to 25 years with an average useful life
of 8 years. The useful life of management contracts with finite
useful lives ranges from 5 to 40 years. Technology has a
finite useful live of 15 years. licenses to manufacture, distrib-
ute and sell pharmaceutical drugs are amortized over the
contractual license period based upon the annual estimated
units of sale of the licensed product. All other intangible
assets are amortized over their individual estimated useful
lives between 3 and 15 years.
losses in value of a lasting nature are recorded as an
impairment.
r) Goodwill and other intangible assets with indefinite useful livesThe Fresenius Group identified intangible assets with indefi-
nite useful lives because, based on an analysis of all of the
relevant factors, there is no foreseeable limit to the period over
which those assets are expected to generate net cash inflows
for the Group. The identified intangible assets with indefinite
useful lives such as trade names and certain qualified man-
agement contracts acquired in a purchase method business

Consolidated Financial Statements General notes 107
Fin
anci
al S
tate
men
ts
combination are recognized and reported apart from goodwill.
They are recorded at acquisition costs. Goodwill and intan-
gible assets with indefinite useful lives are not amortized but
tested for impairment annually or when an event becomes
known that could trigger an impairment (impairment test).
To perform the annual impairment test of goodwill, the
Fresenius Group identified several reporting units and deter-
mined their carrying amount by assigning the assets and lia-
bilities, including the existing goodwill and intangible assets,
to those reporting units. A reporting unit is usually defined
one level below the segment level based on regions or legal
entities. 4 reporting units were identified in the segments
Fresenius Medical Care and Fresenius Kabi, respectively
(Europe, latin America, Asia-Pacific and North America). Ac-
cording to the regional organizational structure, the segment
Fresenius Helios consists of 11 reporting units, which are
managed by a central division. The segment Fresenius Vamed
consists of 2 reporting units (Project business and Service
business). At least once a year, the Fresenius Group compares
the fair value of each reporting unit to the reporting unit’s
carrying amount. The fair value of a reporting unit is deter-
mined using a discounted cash flow approach based upon the
cash flow expected to be generated by the reporting unit.
In case that the fair value of the reporting unit is less than its
carrying amount, the difference is at first recorded as an
impairment of the fair value of the goodwill.
To evaluate the recoverability of separable intangible assets
with indefinite useful lives, the Fresenius Group compares
the fair values of these intangible assets with their car rying
amounts. An intangible asset’s fair value is determined using
a discounted cash flow approach and other methods, if appro-
priate.
The recoverability of goodwill and other separable intan-
gible assets with indefinite useful lives recorded in the Group’s
consolidated statement of financial position was verified. As
a result, the Fresenius Group did not record any impairment
losses in 2014 and 2013.
Any excess of the net fair value of identifiable assets and
liabilities over cost (badwill) still existing after reassessing
the purchase price allocation is recognized immediately in
profit or loss.
s) leasesleased assets assigned to the Fresenius Group based on
the risk and rewards approach (finance leases) are recognized
as property, plant and equipment and measured on receipt
date at the present values of lease payments as long as their
fair values are not lower. leased assets are depreciated in
straight-line over their useful lives. If there is doubt as to
whether title to the asset passes at a later stage and there is
no opportune purchase option, the asset is depreciated over
the lease term if this is shorter. An impairment loss is recog-
nized if the recoverable amount is lower than the amortized
cost of the leased asset.
Finance lease liabilities are measured at the present value
of the future lease payments and are recognized as a finan-
cial liability.
Property, plant and equipment that is rented by the
Fresenius Group is accounted for at its purchase cost. Depre-
ciation is calculated using the straight-line method over
the leasing time and its expected residual value.
t) Financial instrumentsA financial instrument is any contract that gives rise to a
financial asset of one entity and a financial liability or equity
instrument of another entity.
Purchases and sales of financial assets are accounted for
on the trading day. The Fresenius Group does not make use
of the fair value option, which allows financial assets or finan-
cial liabilities to be classified as at fair value through profit
or loss upon initial recognition.
The following categories (according to International
Accounting Standard 39, Financial Instruments: Recognition
and Measurement) are relevant for the Fresenius Group:
loans and receivables, financial liabilities measured at amor-
tized cost, available for sale financial assets as well as finan-
cial liabilities / assets measured at fair value in the consolidated

Consolidated Financial Statements108
Financial S
tatements
statement of income. Other categories are immaterial or not
existing in the Fresenius Group. No financial instruments were
reclassified during the fiscal year 2014.
According to their character, the Fresenius Group classifies
its financial instruments into the following classes: cash and
cash equivalents, assets recognized at carrying amount, liabil-
ities recognized at carrying amount, derivatives for hedging
purposes as well as assets recognized at fair value, liabilities
recognized at fair value and noncontrolling interest subject
to put provisions recognized at fair value.
The relationship between classes and categories as well
as the reconciliation to the consolidated statement of finan-
cial position is shown in tabular form in note 29, Financial
instruments.
The Fresenius Group has potential obligations to purchase
the noncontrolling interests held by third parties in certain
of its consolidated subsidiaries. These obligations are in the
form of put provisions and are exercisable at the third-party
owners’ discretion within specified periods as outlined in each
specific put provision. If these put provisions were exercised,
the Fresenius Group would be required to purchase all or
part of the third-party owners’ noncontrolling interests at the
appraised fair value at the time of exercise. To estimate the
fair values of the noncontrolling interest subject to put provi-
sions, the Fresenius Group recognizes the higher of net book
value or a multiple of earnings, based on historical earnings,
the development stage of the underlying business and other
factors. Depending on the market conditions, the estimated
fair values of the noncontrolling interest subject to these put
provisions can also fluctuate and the implicit multiple of
earnings at which the noncontrolling interest subject to put
provisions may ultimately be settled could vary significantly
from Fresenius Group’s current estimates.
Derivative financial instruments, which primarily include
foreign currency forward contracts and interest rate swaps,
are recognized at fair value as assets or liabilities in the consol-
idated statement of financial position. Changes in the fair
value of derivative financial instruments classified as fair value
hedges and in the corresponding underlying assets and lia-
bilities are recognized periodically in earnings. The effective
portion of changes in fair value of cash flow hedges is recog-
nized in accumulated other comprehensive income (loss) in
shareholders’ equity until the secured underlying transaction
is realized (see note 29, Financial instruments). The ineffec-
tive portion of cash flow hedges is recognized in current earn-
ings. Changes in the fair value of derivatives that are not
designated as hedging instruments are recognized periodically
in earnings.
Derivatives embedded in host contracts are accounted for
as separate derivatives if their economic characteristics and
risks are not closely related to those of the host contracts and
the host contracts are not held for trading or designated at
fair value though profit or loss. These embedded derivatives
are measured at fair value with changes in fair value recog-
nized in the income statement.
u) liabilitiesliabilities are generally stated at present value, which nor-
mally corresponds to the value of products or services which
are delivered. As a general policy, short-term liabilities are
measured at their repayment amount.
v) legal contingenciesIn the ordinary course of Fresenius Group’s operations, the
Fresenius Group is involved in litigation, arbitration, adminis-
trative procedure and investigations relating to various aspects
of its business. The Fresenius Group regularly analyzes cur-
rent information about such claims for probable losses and pro-
vides accruals for such matters, including the estimated legal
expenses and consulting services in connection with these
matters, as appropriate. The Fresenius Group utilizes its inter-
nal legal department as well as external resources for these
assessments. In making the decision regarding the need for a
loss accrual, the Fresenius Group considers the degree of
probability of an unfavorable outcome and its ability to make
a reasonable estimate of the amount of loss.
The filing of a suit or formal assertion of a claim, or the
disclosure of any such suit or assertion, does not necessarily
indicate that an accrual of a loss is appropriate.

Consolidated Financial Statements General notes 109
Fin
anci
al S
tate
men
ts
w) accrued expensesAccruals for taxes and other obligations are recognized when
there is a present obligation to a third party arising from
past events, it is probable that the obligation will be settled in
the future and the amount can be reliably estimated.
Accruals for warranties and complaints are estimated based
on historical experience.
Tax accruals include obligations for the current year and
for prior years.
x) Pension liabilities and similar obligationsThe Fresenius Group recognizes the underfunded status of its
defined benefit plans, measured as the difference between
the fair value of the plan assets and the present value of the
benefit obligation, as a liability (funded status).
The Fresenius Group uses December 31 as the measure-
ment date when measuring the funded status of all plans.
Changes in the funded status of a plan resulting from actu-
arial gains or losses and prior service costs or credits that
are not recognized as components of the net periodic benefit
cost are recognized through accumulated other comprehen-
sive income (loss), net of tax, in the year in which they occur.
The Fresenius Group uses the corridor method for the
recognition of the actuarial gains and losses. Actuarial gains
and losses that exceed a corridor of 10% of the present value
of the defined benefit obligation are spread over the expected
average remaining working lives of the employees participat-
ing in the plans, adjusted for fluctuation.
Actuarial gains or losses and prior service costs are sub-
sequently recognized as components of net periodic benefit
cost when realized.
y) Debt issuance costsDebt issuance costs are capitalized separately from the
underlying debt and are amortized over the term of the related
obligation.
z) Stock option plansIn line with the standard for share-based payment, the
Fresenius Group uses the modified prospective transition
method. Under this transition method, in 2013 and 2014,
the Fresenius Group recognized compensation cost for all
stock-based payments subsequent to January 1, 2011 (based
on the grant-date fair value estimated).
The measurement date fair value of cash-settled phantom
stocks granted to members of the Management Board and
executive employees of the Fresenius Group is calculated using
the Monte Carlo simulation. The corresponding liability
based on the measurement date fair value is accrued over the
vesting period of the phantom stock plans.
aa) Self-insurance programsUnder the insurance programs for professional, product and
general liability, auto liability and worker’s compensation
claims, the largest subsidiary of Fresenius Medical Care AG &
Co. KGaA (FMC-AG & Co. KGaA), located in North America,
is partially self-insured for professional liability claims. For all
other coverage, FMC-AG & Co. KGaA assumes responsibility
for incurred claims up to predetermined amounts, above which
third party insurance applies. Reported liabilities for the
year represent estimated future payments of the anticipated
expense for claims incurred (both reported and incurred
but not reported) based on historical experience and existing
claim activity. This experience includes both the rate of
claims incidence (number) and claim severity (cost) and is
combined with individual claim expectations to estimate
the reported amounts.
bb) Foreign currency translationThe reporting currency is the euro. Substantially all assets and
liabilities of the foreign subsidiaries that use a functional
currency other than the euro are translated at the mid-closing
rate on the date of the statement of financial position, while
income and expense are translated at average exchange rates.
Adjustments due to foreign currency trans lation fluctuations
are excluded from net earnings and are reported in accumu-
lated other comprehensive income (loss). In addition, the
translation adjustments of certain intercompany borrowings,
which are of a long-term nature, are also reported in accu-
mulated other comprehensive income (loss).

Consolidated Financial Statements110
Financial S
tatements
Gains and losses arising from the translation of foreign
currency positions as well as those arising from the elimination
of foreign currency intercompany loans are recorded as
general and administrative expenses, as far as they are not
considered foreign equity instruments. In the fiscal year
2014, only immaterial gains resulted out of this translation.
The exchange rates of the main currencies affecting foreign currency translation developed as follows:
Year-end exchange rate 1 Average exchange rate
Dec. 31, 2014 Dec. 31, 2013 2014 2013
U.S. dollar per € 1.2141 1.3791 1.3285 1.3281
Pound sterling per € 0.7789 0.8337 0.8061 0.8493
Swedish krona per € 9.3930 8.8591 9.0985 8.6515
Chinese renminbi per € 7.5358 8.3491 8.1857 8.1646
Japanese yen per € 145.23 144.72 140.31 129.66
Russian ruble per € 72.3370 45.3246 50.9518 42.3370
Brazilian real per € 3.2207 3.2576 3.1211 2.8687
1 Mid-closing rate on the date of the statement of financial position
cc) Fair value hierarchyThe three-tier fair value hierarchy as defined in Financial
Accounting Standards Boards Accounting Standards Codifica-
tion Topic 820, Fair Value Measurements and Disclosures,
classifies assets and liabilities recognized at fair value based
on the inputs used in estimating the fair value. level 1 is
defined as observable inputs, such as quoted prices in active
markets. level 2 is defined as inputs other than quoted prices
in active markets that are directly or indirectly observable.
level 3 is defined as unobservable inputs for which little or
no market data exists, therefore requiring the company to
develop its own assumptions. The three-tier fair value hierar-
chy is used in note 24, Pensions and similar obligations, and
in note 29, Financial instruments.
dd) use of estimatesThe preparation of consolidated financial statements in con-
formity with U.S. GAAP requires management to make esti-
mates and assumptions that affect the reported amounts of
assets and liabilities, the disclosure of contingent assets and
liabilities at the date of the consolidated financial statements
and the reported amounts of income and expenses during
the reporting period. Actual results could differ from those
estimates. Estimates and discretionary decisions are required
in particular for the positions trade accounts receivable,
deferred tax assets and pension liabilities as well as when
examining the recoverability of goodwill.
ee) receivables managementThe entities of the Fresenius Group perform ongoing eval-
uations of the financial situation of their customers and gener-
ally do not require a collateral from the customers for the
supply of products and provision of services. Approximately
16% and 17% of Fresenius Group’s sales were earned and
subject to the regulations under governmental health care pro-
grams, Medicare and Medicaid, administered by the United
States government in 2014 and 2013, respectively.
ff) recent pronouncements, appliedThe Fresenius Group has prepared its consolidated financial
statements at December 31, 2014 in conformity with U.S. GAAP
that have to be applied for fiscal years beginning on Janu-
ary 1, 2014 or U.S. GAAP that can be applied earlier on a vol-
untary basis.
The Fresenius Group applied the following standards, as
far as they are relevant for Fresenius Group’s business, for
the first time:
In November 2014, the Financial Accounting Standards
Board (FASB) issued accounting Standards update 2014-17
(ASU 2014-17), FASB Accounting Standards Codification
(ASC) Topic 805, Business Combinations – Pushdown Account-
ing. ASU 2014-17’s objective is to provide an acquired entity
with an option to apply pushdown accounting in its separate
financial statements. This option is given upon occurrence
of an event in which an acquirer obtains control of the acquired
entity. The update is effective on November 18, 2014 and
has been adopted by the Fresenius Group as of November 18,
2014. ASU 2014-17 does not have an impact on the consoli-
dated financial statements of the Fresenius Group.

Consolidated Financial Statements General notes 111
Fin
anci
al S
tate
men
ts
In November 2014, the FASB issued accounting Standards
update 2014-16 (ASU 2014-16), FASB ASC Topic 815,
Derivatives and Hedging – Determining Whether the Host
Contract in a Hybrid Financial Instrument Issued in the
Form of a Share Is More Akin to Debt or to Equity. ASU 2014-
16’s objective is to eliminate the use of different methods in
practice and thereby reduce existing diversity under U.S. GAAP
in the accounting for hybrid financial instruments issued in
the form of a share. The update is effective for fiscal years and
interim periods within those years beginning on or after
December 15, 2015. As early adoption is permissible and the
Fresenius Group’s financial statements are in conformity
with the update, the Fresenius Group has adopted ASU 2014-
16 as of November 4, 2014. ASU 2014-16 does not have a
material impact on the consolidated financial statements of the
Fresenius Group.
In June 2014, the FASB issued accounting Standards
update 2014-12 (ASU 2014-12), FASB ASC Topic 718, Com-
pensation – Stock Compensation – Accounting for Share-
Based Payments When the Terms of an Award Provide That a
Performance Target Could Be Achieved after the Requisite
Service Period. The amendments in ASU 2014-12 require that
a performance target that affects vesting and that could be
achieved after the requisite service period is treated as a per-
formance condition. The update is effective for fiscal years
and interim periods within those years beginning on or after
December 15, 2015. Earlier adoption is permitted. The
Fresenius Group utilized and will continue to utilize the guid-
ance updated by this ASU and as such there is no expected
impact on its consolidated financial statements.
In July 2013, the FASB issued accounting Standards
update 2013-11 (ASU 2013-11), FASB ASC Topic 740, Income
Taxes – Presentation of an Unrecognized Tax Benefit When a
Net Operating loss Carryforward, a Similar Tax loss, or a Tax
Credit Carryforward Exists. The purpose of ASU 2013-11 is to
align the financial statement presentation of an unrecognized
tax benefit when a net operating loss carryforward, a similar
tax loss or a tax credit carryforward exists. In most cases, the
unrecognized tax benefit should be presented as a reduction
to a deferred tax asset for a net operating loss carryforward,
a similar tax loss or a tax credit carryforward. The update is
effective for fiscal years and interim periods within those years
beginning on or after December 15, 2013. The Fresenius
Group adopted ASU 2013-11 as of January 1, 2014. ASU 2013-
11 does not have a material impact on the consolidated
financial statements of the Fresenius Group.
In March 2013, the FASB issued accounting Standards
update 2013-05 (ASU 2013-05), FASB ASC Topic 830, For-
eign Currency Matters – Parent’s Accounting for the Cumula-
tive Translation Adjustment upon Derecognition of Certain
Subsidiaries or Groups of Assets within a Foreign Entity or of
an Investment in a Foreign Entity. The purpose of ASU 2013-
05 is to provide clarification and further refinement regarding
the treatment of the release of a cumulative translation adjust-
ment into net income. This occurs in instances where the
parent sells either a part or all of its investment in a foreign
entity, as well as when a company ceases to hold a control-
ling interest in a subsidiary or group of assets that is a non-
profit activity or business within a foreign entity. The update
is effective for fiscal years and interim periods within those
years beginning on or after December 15, 2013. The Fresenius
Group adopted ASU 2013-05 as of January 1, 2014. ASU 2013-
05 does not have a material impact on the consolidated finan-
cial statements of the Fresenius Group.
In February 2013, the FASB issued accounting Standards
update 2013-04 (ASU 2013-04), FASB ASC Topic 405, lia-
bil ities – Obligations Resulting from Joint and Several liabil-
ity Arrangements for which the Total Amount of the Obliga-
tions is Fixed at the Reporting Date. ASU 2013-04’s objective
is to provide guidance and clarification on the recognition,
measurement and disclosure of obligations resulting from joint
and several liability arrangements such as debt arrangements,
other contractual obligations and settled litigation and judi-
cial rulings. The update is effective for fiscal years and interim
periods within those years beginning on or after December 15,
2013. The Fresenius Group adopted ASU 2013-04 as of Janu-
ary 1, 2014. ASU 2013-04 does not have a material impact on
the consolidated financial statements of the Fresenius Group.
In July 2011, the FASB issued accounting Standards
update 2011-06 (ASU 2011-06), FASB ASC Topic 720, Other
Expenses – Fees Paid to the Federal Government by Health
Insurers. The amendments in ASU 2011-06 address how
health insurers should recognize and classify their income
statement fees mandated by the Health Care and Educational

Consolidated Financial Statements112
Financial S
tatements
Affordability Reconciliation Act. These amendments require
that the liability for the fee be estimated and recorded in full
once the entity provides qualifying health insurance in the
applicable calendar year in which the fee is payable. In con-
junction, the corresponding deferred cost is amortized to
expense using a straight-line allocation method unless another
method better allocates the fee over the entire calendar year
for which it is payable. In addition, the ASU states that this fee
does not meet the definition of an acquisition cost. The dis-
closures required under ASU 2011-06 are effective for calen-
dar years beginning after December 31, 2013, when the fee
initially becomes effective. The Fresenius Group adopted
ASU 2011-06 effective January 1, 2014. ASU 2011-06 does not
have a material impact on the consolidated financial state-
ments of the Fresenius Group.
gg) recent pronouncements, not yet appliedThe FASB issued the following for the Fresenius Group rele -
vant new standards, which are mandatory for fiscal years com-
mencing on or after January 1, 2015:
In June 2014, the FASB issued accounting Standards
update 2014-11 (ASU 2014-11), FASB ASC Topic 860, Trans-
fers and Servicing – Repurchase-to-Maturity Transactions,
Repurchase Financings, and Disclosures, which aligns the
accounting for repurchase-to-maturity transactions and repur-
chase financing arrangements with the accounting for other
typical repurchase agreements, i. e. these transactions will be
accounted for as secured borrowings. ASU 2014-11 also
requires additional disclosures about repurchase agreements
and other similar transactions. The update is effective for
fiscal years and interim periods within those years beginning
on or after December 15, 2014. ASU 2014-11 will not have
a material impact on the consolidated financial statements of
the Fresenius Group.
In May 2014, the FASB issued accounting Standards
update 2014-09 (ASU 2014-09), FASB ASC Topic 606, Revenue
from Contracts with Customers. Simultaneously, the Inter-
national Accounting Standards Board (IASB) published its
equivalent revenue standard, IFRS 15, Revenue from Contracts
with Customers. The standards are the result of a conver-
gence project between FASB and the IASB. This update spec-
ifies how and when companies reporting under U.S. GAAP
will recognize revenue as well as providing users of financial
statements with more informative and relevant disclosures.
ASU 2014-09 supersedes some guidance included in Topic
605, Revenue Recognition, some guidance within the scope of
Topic 360, Property, Plant, and Equipment, and some guid-
ance within the scope of Topic 350, Intangibles – Goodwill and
Other. This ASU applies to nearly all contracts with custom-
ers, unless those contracts are within the scope of other stan-
dards (for example, lease contracts or insurance contracts).
This update is effective for fiscal years and interim periods
within those years beginning on or after December 15, 2016.
Earlier adoption is not permitted. The Fresenius Group is
currently evaluating the impact of ASU 2014-09 on its consol-
idated financial statements.
In April 2014, the FASB issued accounting Standards
update 2014-08 (ASU 2014-08), FASB ASC Topic 205, Pre-
sentation of Financial Statements and FASB ASC Topic 360,
Property, Plant, and Equipment – Reporting Discontinued
Operations and Disclosures of Disposals of Components of an
Entity. ASU 2014-08’s objective is to reduce the complexity
and difficulty in applying guidance for discontinued opera-
tions. ASU 2014-08’s main focus is to limit the presentation
to disposals representing a strategic shift that has a major
effect on operations or financial results. The update is effec-
tive for fiscal years and interim periods within those years
beginning on or after December 15, 2014. Currently, ASU 2014-
08 will not have a material impact on the consolidated finan-
cial statements of the Fresenius Group.
In January 2014, the FASB issued accounting Standards
update 2014-05 (ASU 2014-05), FASB ASC Topic 853, Ser-
vice Concession Arrangements. ASU 2014-05’s objective is to
specify that an operating entity should not account for a
service concession arrangement that is within the scope of
ASU 2014-05 as a lease. The update is effective for fiscal
years and interim periods within those years beginning on or
after December 15, 2014. ASU 2014-05 will not have a mate-
rial impact on the consolidated financial statements of the
Fresenius Group.

Consolidated Financial Statements General notes 113
Fin
anci
al S
tate
men
ts
iV. CritiCal aCCountinG PoliCieS
In the opinion of the Management of the Fresenius Group, the
following accounting policies and topics are critical for the
consolidated financial statements in the present economic envi-
ronment. The influences and judgments as well as the uncer-
tainties which affect them are also important factors to be
considered when looking at present and future operating earn-
ings of the Fresenius Group.
a) recoverability of goodwill and intangible assets with indefinite useful livesThe amount of intangible assets, including goodwill, prod-
uct rights, tradenames and management contracts, repre-
sents a considerable part of the total assets of the Fresenius
Group. At December 31, 2014 and December 31, 2013, the
carrying amount of goodwill and non-amortizable intangible
assets with indefinite useful lives was € 20,076 million and
€ 15,013 million, respectively. This represented 50% and 46%,
respectively, of total assets.
An impairment test of goodwill and non-amortizable intan-
gible assets with indefinite useful lives is performed at least
once a year, or if events occur or circumstances change that
would indicate the carrying amount might be impaired (Impair-
ment test).
To determine possible impairments of these assets, the
fair value of the reporting units is compared to their carrying
amount. The fair value of each reporting unit is determined
using estimated future cash flows for the unit discounted by
a weighted-average cost of capital (WACC) specific to that
reporting unit. Estimating the discounted future cash flows
involves significant assumptions, especially regarding future
reimbursement rates and sales prices, number of treatments,
sales volumes and costs. In determining discounted cash
flows, the Fresenius Group utilizes for every reporting unit its
approved three-year budget, projections for years 4 to 10
and a corresponding growth rate for all remaining years. These
growth rates are 0% to 4% for Fresenius Medical Care, 3%
for Fresenius Kabi and 1% for Fresenius Helios and Fresenius
Vamed. Projections for up to 10 years are possible due to
historical experience and the stability of Fresenius Group’s
business, which is largely independent from the economic
cycle. The discount factor is determined by the WACC of the
respective reporting unit. Fresenius Medical Care’s WACC
consisted of a basic rate of 6.01% and the WACC in the busi-
ness segment Fresenius Kabi consisted of a basic rate of
4.86% for 2014, respectively. This basic rate is then adjusted
by a country-specific risk rate and, if appropriate, by a factor
to reflect higher risks associated with the cash flow from
recent material acquisitions, until they are appropriately inte-
grated, within each reporting unit. In 2014, WACCs (after
tax) for the reporting units of Fresenius Medical Care ranged
from 5.96% to 15.73% and WACCs (after tax) for the report-
ing units of Fresenius Kabi ranged from 4.86% to 13.36%. In
the business segments Fresenius Helios and Fresenius Vamed,
the WACC (after tax) was 4.86%, country-specific adjust-
ments did not occur. If the fair value of the reporting unit is less
than its carrying amount, the difference is recorded as an
impairment of the fair value of the goodwill at first. An increase
of the WACC (after tax) by 0.5% would not have resulted in
the recognition of an impairment loss in 2014.
A prolonged downturn in the health care industry with
lower than expected increases in reimbursement rates and / or
higher than expected costs for providing health care ser-
vices could adversely affect the estimated future cash flows of
certain countries or segments. Future adverse changes in a
reporting unit’s economic environment could affect the dis-
count rate. A decrease in the estimated future cash flows
and / or a decline in the reporting unit’s economic environment
could result in impairment charges to goodwill and other
intangible assets with indefinite useful lives which could mate-
rially and adversely affect Fresenius Group’s future operating
results.
b) legal contingenciesThe Fresenius Group is involved in several legal matters arising
from the ordinary course of its business. The outcome of
these matters may have a material effect on the financial posi-
tion, results of operations or cash flows of the Fresenius
Group. For details, please see note 28, Commitments and con-
tingent liabilities.
The Fresenius Group regularly analyzes current informa-
tion about such claims for probable losses and provides accru-
als for such matters, including estimated expenses for legal

Consolidated Financial Statements114
Financial S
tatements
services, as appropriate. The Fresenius Group utilizes its inter-
nal legal department as well as external resources for these
assessments. In making the decision regarding the need for a
loss accrual, the Fresenius Group considers the degree of
probability of an unfavorable outcome and its ability to make
a reasonable estimate of the amount of loss.
The filing of a suit or formal assertion of a claim, or the
disclosure of any such suit or assertion, does not necessarily
indicate that an accrual of a loss is appropriate.
c) allowance for doubtful accountsTrade accounts receivable are a significant asset and the allow-
ance for doubtful accounts is a significant estimate made by
the Management. Trade accounts receivable were € 4,235 mil-
lion and € 3,474 million in 2014 and 2013, respectively, net
of allowance. Approximately 62% of receivables derive from
the business segment Fresenius Medical Care and mainly
relate to the dialysis care business in North America.
The major debtors or debtor groups of trade accounts re-
ceivable were U.S. Medicare and Medicaid health care pro-
grams with 17% and private insurers in the United States with
10% at December 31, 2014. Other than that, the Fresenius
Group has no significant risk concentration, due to its inter-
national and heterogeneous customer structure.
The allowance for doubtful accounts was € 545 million
and € 487 million as of December 31, 2014 and December 31,
2013, respectively.
The allowances are estimates comprised of customer-
specific evaluations regarding their payment history, current
financial stability, and applicable country-specific risks for
overdue receivables. In the Fresenius Group’s opinion, these
analyses result in a well-founded estimate of allowances
for doubtful accounts. From time to time, the Fresenius
Group reviews changes in collection experience to ensure the
appropriateness of the allowances.
A valuation allowance is calculated if specific circum-
stances indicate that amounts will not be collectible. When all
efforts to collect a receivable, including the use of outside
sources where required and allowed, have been exhausted, and
after appropriate management review, a receivable deemed to
be uncollectible is considered a bad debt and written off.
Deterioration in the aging of receivables and collection dif-
ficulties could require that the Fresenius Group increases
the estimates of allowances for doubtful accounts. Additional
expenses for uncollectible receivables could have a signifi-
cant negative impact on future operating results.
d) Self-insurance programsUnder the insurance programs for professional, product and
general liability, auto liability and worker’s compensation
claims, the largest subsidiary of Fresenius Medical Care AG &
Co. KGaA, located in North America, is partially self-insured
for professional liability claims. For further details regarding
the accounting policies for self-insurance programs, please
see note 1. III. aa, Self-insurance programs.
2. aCquiSitionS, DiVeStitureS anD inVeStmentS
aCquiSitionS, DiVeStitureS anD inVeStmentS
The Fresenius Group made acquisitions, investments and pur-
chases of intangible assets of € 2,450 million and € 2,754 mil-
lion in 2014 and 2013, respectively. Of this amount, € 2,214
million was paid in cash and € 236 million was assumed obli-
gations in 2014.

Consolidated Financial Statements General notes 115
Fin
anci
al S
tate
men
ts
Fresenius medical CareIn 2014, Fresenius Medical Care spent € 1,495 million on
acquisitions. Besides the transactions described separately in
the following, this amount mainly comprises the purchase of
dialysis clinics, the short-term investment in available for sale
securities and the purchase of intangible assets.
On May 23, 2014, Fresenius Medical Care acquired
MedSpring Urgent Care Centers with operations in Illinois and
Texas. MedSpring Urgent Care Centers’ 14 urgent care cen-
ters provide convenient, consistent, high-quality primary care
and customer service.
On July 1, 2014, Fresenius Medical Care completed a
transaction to become the controlling majority shareholder of
Sound Inpatient Physicians, Inc., United States, a physician
services organization focused on hospitalist and post-acute
care services.
On October 21, 2014, Fresenius Medical Care acquired
National Cardiovascular Partners. National Cardiovascular
Partners is the leading operator of endovascular, vasuclar and
cardiovascular specialty services in the United States.
On November 21, 2014, Fresenius Medical Care, through
Sound Inpatient Physicians, Inc., acquired Cogent Health-
care with more than 650 providers, who offer hospitalist and
intensivist services to more than 80 hospitals throughout
the United States.
Based on preliminary purchase price allocations, Fresenius
Medical Care recorded € 1,287 million of goodwill and € 148
million of intangible assets.
The intangible assets associated with these acquisitions
consist primarily of customer relationships and tradenames
at fair value to be amortized on a straight-line basis over a
weighted-average period of approximately eight to nine years.
In 2013, Fresenius Medical Care spent € 424 million on
acquisitions, mainly for the purchase of dialysis clinics and
the expansion in the laboratory services business.
Fresenius KabiIn 2014, Fresenius Kabi spent € 118 million on acquisitions.
Throughout 2014, Fresenius Kabi purchased further shares
in Fresenius Kabi Oncology ltd., India.
On May 9, 2014, Fresenius Kabi announced the acquisi-
tion of the Brasilian pharmaceutical company Novafarma
Indústria Farmacêutica ltda. After antitrust approval, the trans-
action could be closed on July 3, 2014. Furthermore, on
July 4, 2014, Fresenius Kabi acquired two companies in
Ecuador, Medisumi, a pharmaceutical distributor, as well as
labfarm, an IV antibiotic manufacturer.
In 2013, Fresenius Kabi spent € 131 million on acquisitions,
mainly for a 51% stake in PT Ethica Industri Farmasi, Indone-
sia, production plants in India and China as well as for com-
pounding companies in Germany.
Divestitures
In December 2012, Fresenius Kabi announced that it had
signed an agreement to sell its subsidiary Calea France SAS
(Calea) to The linde Group. Calea is active in the French
homecare market and focuses on respiratory therapy, which
is not a core business of Fresenius Kabi.
The transaction was completed in January 2013. The
gain on disposal in the amount of € 48 million was included
in selling, general and administrative expenses in the con-
solidated statement of income.
Fresenius HeliosIn 2014, Fresenius Helios spent € 824 million on acquisitions.
Thereof, € 816 million related to the acquisition of hospitals
and outpatient facilities of Rhön-Klinikum AG, Germany. Tak-
ing into account the advance payment of € 2,178 million
transferred at the end of the year 2013 in conjunction with
this acquisition, the total purchase price finally added up to
€ 2,994 million.

Consolidated Financial Statements116
Financial S
tatements
In connection with the acquisition of hospitals of Rhön-
Klinikum AG, Fresenius Helios sold two hospitals in Borna and
Zwenkau in the first quarter of 2014 due to antitrust authority
requirements. The corresponding book gain in the amount
of € 22 million before tax is included in selling, general and
administrative expenses in the consolidated statement of
income.
acquisition of hospitals of rhön-Klinikum aG
In fiscal year 2014, Fresenius Helios completed the acquisition
of 41 hospitals and 13 outpatient facilities of Rhön-Klinikum
AG, Germany. The majority of the acquired hospitals and out-
patient facilities was consolidated as of January 1, 2014. In
most instances, 100% of the share capital was purchased, only
in a few cases 94% to 99% of the share capital was acquired.
In relation to HSK Dr. Horst Schmidt Kli niken, 49% of the
share capital was acquired.
The transaction strengthens Fresenius Helios’ position
as Europe’s largest hospital operator and provides the basis
for offering nationwide care models across Germany.
Due to contractual conditions, the Fresenius Group was
primary beneficiary of the majority of the acquired hospitals
and outpatient facilities for the period from January 1, 2014
until the closing of the majority of the transaction on Febru-
ary 27, 2014. During this period, the Fresenius Group there-
fore fully consolidated these companies according to regula-
tions for variable interest entities. The majority of the other
acquired companies has been fully consolidated as of Febru-
ary 27, 2014. The acquired HSK Dr. Horst Schmidt Kliniken
have been consolidated since June 30, 2014 as the Fresenius
Group has rights that give the Fresenius Group the ability
to direct the relevant activities and, hence, the earnings of the
company. The acquired hospital in Cuxhaven has been con-
solidated since August 1, 2014.
The transaction was accounted for as a business combina-
tion. The following table comprises the final fair values of
assets acquired and liabilities assumed at the date of the acqui-
sition. Any adjustments to acquisition accounting until final-
ization on December 31, 2014 was recorded with a correspond-
ing adjustment to goodwill, net of related income tax effects.
€ in millions
Trade accounts receivable 231
Working capital and other assets 405
Assets 995
liabilities - 752
Goodwill 2,245
Noncontrolling interest - 12
Fair value of consideration transferred 3,112
Net cash acquired - 100
transaction amount 3,012
The consideration transferred was fully paid in cash.
The transaction amount contained contingent purchase
price elements in an amount of € 49 million in connection with
the implementation of antitrust authority requirements. The
contingent consideration amounted to € 31 million by the end
of 2014.
The goodwill in the amount of € 2,245 million that was
acquired as part of the acquisition is not deductible for tax
purposes.
Goodwill is an asset mainly representing the market
position of the acquired hospitals, the established nationwide
hospital network, economics of scale of the substantially
grown hospital network and the know-how of employees.
The noncontrolling interests acquired as part of the acqui-
sition are stated at fair value.
In 2014, the acquired hospitals and outpatient facilities
have contributed € 1,791 million to sales and, before integra-
tion costs, € 158 million to the operating income (EBIT) and
€ 65 million to the net income of the Fresenius Group. After
integrations costs, the contribution to the operating income
(EBIT) amounted to € 107 million and the contribution to the
net income of the Fresenius Group was € 24 million.

Consolidated Financial Statements General notes 117
Fin
anci
al S
tate
men
ts
In 2013, Fresenius Helios spent € 2,185 million on acquisi-
tions, mainly for advances made in the amount of € 2,178 mil-
lion under a fiduciary arrangement for the acquisition of hos-
pitals and outpatient facilities of Rhön-Klinikum AG.
Fresenius VamedIn 2014, Fresenius Vamed spent € 12 million on acquisitions,
mainly for the acquisition of kneipp-hof Dussnang AG, Swit-
zerland.
In 2013, Fresenius Vamed spent € 16 million on acquisitions,
mainly for the purchase of two hospitals in the Czech Republic.
Corporate / otherDivestitures
On June 30, 2014, the Fresenius Group sold the 5% stake in
Rhön-Klinikum AG which was acquired in 2012 as part of
the takeover offer to the shareholders of Rhön-Klinikum AG.
Sales proceeds of € 160 million were achieved. The corre-
sponding book gain in the amount of € 35 million before tax is
included in selling, general and administrative expenses in
the consolidated statement of income.
During 2013, German government securities with a carrying
amount of € 37 million were divested.
On June 28, 2013, the sale of Fresenius Biotech to the
Fuhrer family, owners of Neopharm, Israel’s second-largest
pharmaceutical company, was closed. The transaction
includes both the trifunctional antibody Removab as well as
the immunosuppressive drug ATG-Fresenius S. The gain
on disposal amounted to € 0 million.
imPaCtS on FreSeniuS GrouP’S
ConSoliDateD FinanCial StatementS
reSultinG From aCquiSitionS
In the fiscal year 2014, all acquisitions have been accounted
for applying the purchase method and accordingly have
been consolidated starting with the date of acquisition. The
excess of the total acquisition costs over the fair value of
the net assets acquired was € 3,882 million and € 510 million
in 2014 and 2013, respectively.
The purchase price allocations are not yet finalized for all
acquisitions. Based on preliminary purchase price allocations,
the recognized goodwill was € 3,650 million and the other
intangible assets were € 232 million. Of this goodwill, € 1,287
million is attributable to the acquisitions of Fresenius Medical
Care, € 99 million to Fresenius Kabi’s acquisitions, € 2,250
million to the acquisitions of Fresenius Helios and € 14 million
to the acquisitions of Fresenius Vamed.
Goodwill is an asset representing the future economic
benefits arising from other assets acquired in a business com-
bination that are not individually identified and separately
recognized. Goodwill arises principally due to the fair value
placed on an established stream of future cash flows versus
building a similar business.
The acquisitions completed in 2014 or included in the
consolidated statements for the first time for a full year, con-
tributed the following amounts to the development of sales
and earnings:
€ in millions 2014
Sales 2,271
EBITDA 204
EBIT 126
Net interest - 99
Net income attributable to shareholders of Fresenius SE & Co. KGaA 21
The acquisitions increased the total assets of the Fresenius
Group by € 4,068 million.
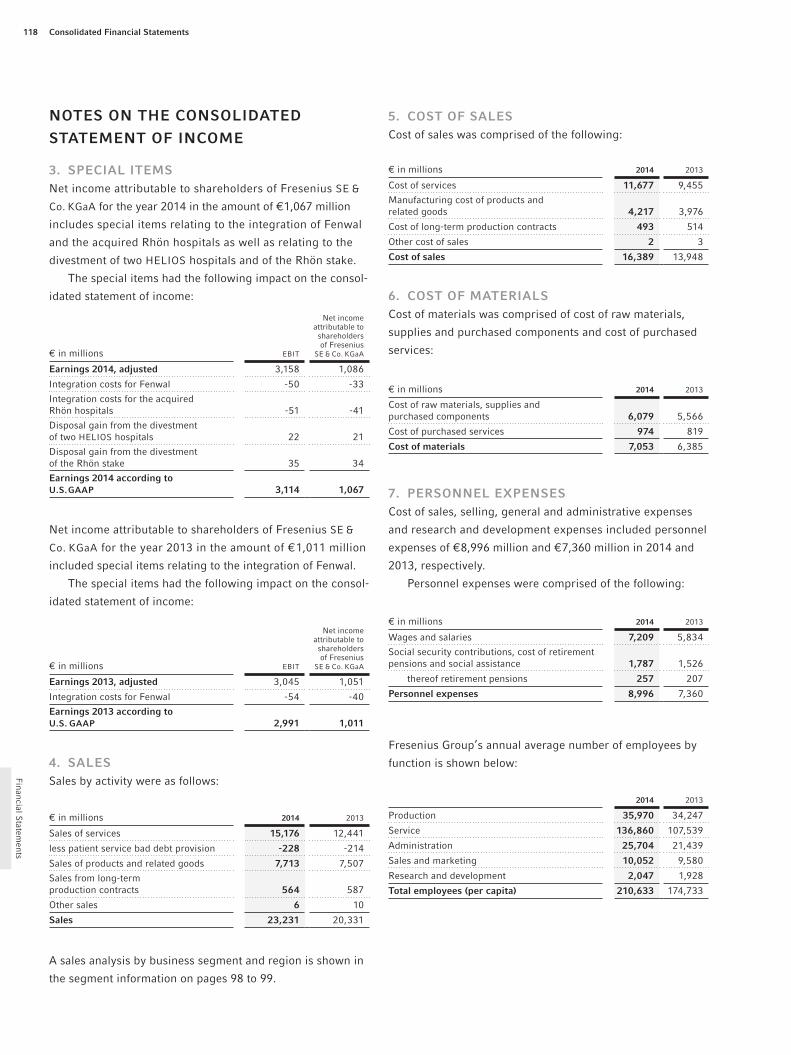
Consolidated Financial Statements118
Financial S
tatements
Notes oN the coNsolidated
statemeNt of iNcome
3. special itemsNet income attributable to shareholders of Fresenius SE &
Co. KGaA for the year 2014 in the amount of € 1,067 million
includes special items relating to the integration of Fenwal
and the acquired Rhön hospitals as well as relating to the
divestment of two HELIOS hospitals and of the Rhön stake.
The special items had the following impact on the consol-
idated statement of income:
€ in millions EBIT
Net income attributable to share holders of Fresenius
SE & Co. KGaA
earnings 2014, adjusted 3,158 1,086
Integration costs for Fenwal - 50 - 33
Integration costs for the acquired Rhön hospitals - 51 - 41
Disposal gain from the divestment of two HELIOS hospitals 22 21
Disposal gain from the divestment of the Rhön stake 35 34
earnings 2014 according to U.s. Gaap 3,114 1,067
Net income attributable to shareholders of Fresenius SE &
Co. KGaA for the year 2013 in the amount of € 1,011 million
included special items relating to the integration of Fenwal.
The special items had the following impact on the consol-
idated statement of income:
€ in millions EBIT
Net income attributable to share holders of Fresenius
SE & Co. KGaA
earnings 2013, adjusted 3,045 1,051
Integration costs for Fenwal - 54 - 40
earnings 2013 according to U.s. Gaap 2,991 1,011
4. salesSales by activity were as follows:
€ in millions 2014 2013
Sales of services 15,176 12,441
less patient service bad debt provision - 228 - 214
Sales of products and related goods 7,713 7,507
Sales from long-term production contracts 564 587
Other sales 6 10
sales 23,231 20,331
A sales analysis by business segment and region is shown in
the segment information on pages 98 to 99.
5. cost of salesCost of sales was comprised of the following:
€ in millions 2014 2013
Cost of services 11,677 9,455
Manufacturing cost of products and related goods 4,217 3,976
Cost of long-term production contracts 493 514
Other cost of sales 2 3
cost of sales 16,389 13,948
6. cost of materialsCost of materials was comprised of cost of raw materials,
supplies and purchased components and cost of purchased
services:
€ in millions 2014 2013
Cost of raw materials, supplies and purchased components 6,079 5,566
Cost of purchased services 974 819
cost of materials 7,053 6,385
7. persoNNel expeNsesCost of sales, selling, general and administrative expenses
and research and development expenses included personnel
expenses of € 8,996 million and € 7,360 million in 2014 and
2013, respectively.
Personnel expenses were comprised of the following:
€ in millions 2014 2013
Wages and salaries 7,209 5,834
Social security contributions, cost of retirement pensions and social assistance 1,787 1,526
thereof retirement pensions 257 207
personnel expenses 8,996 7,360
Fresenius Group’s annual average number of employees by
function is shown below:
2014 2013
Production 35,970 34,247
Service 136,860 107,539
Administration 25,704 21,439
Sales and marketing 10,052 9,580
Research and development 2,047 1,928
total employees (per capita) 210,633 174,733

119
Fin
anci
al S
tate
men
ts
consolidated financial statements Notes on the consolidated statement of income
8. selliNG, GeNeral aNd admiNistrative expeNsesSelling expenses were € 841 million (2013: € 801 million) and
mainly included expenditures for sales personnel of € 406 mil-
lion (2013: € 387 million).
General and administrative expenses amounted to € 2,518
million (2013: € 2,243 million) and were related to expendi-
tures for administrative functions not attributable to research
and development, production or selling.
Proceeds of € 203 million (2013: € 324 million) were
included in selling, general and administrative expenses.
9. Net iNterestNet interest of - € 602 million included interest expenses of
€ 730 million and interest income of € 128 million. The main
portion of the interest expenses resulted from Fresenius
Group’s financial liabilities, which are not recognized at fair
value in the consolidated statement of income (see note 29,
Financial instruments). The main portion of interest income
resulted from the valuation of the call options in connection
with the convertible bonds.
10. taxes
iNcome taxes
Income before income taxes was attributable to the following
geographic regions:
€ in millions 2014 2013
Germany 686 515
International 1,826 1,892
total 2,512 2,407
Income tax expenses (benefits) for 2014 and 2013 consisted
of the following:
€ in millionsCurrent
taxesDeferred
taxesincome
taxes
2014
Germany 122 16 138
international 518 44 562
total 640 60 700
2013
Germany 111 - 23 88
International 557 24 581
Total 668 1 669
A reconciliation between the expected and actual income
tax expense is shown in the following table. The expected
corporate income tax expense is computed by applying the
German corporation tax rate (including the solidarity sur-
charge) and the effective trade tax rate on income before
income taxes. The respective combined tax rate was 30.0%
for the fiscal year 2014 (2013: 29.5%).
€ in millions 2014 2013
Computed “expected” income tax expense 754 710
Increase (reduction) in income taxes resulting from:
Items not recognized for tax purposes 52 28
Tax rate differential 35 42
Tax-free income - 60 - 76
Taxes for prior years - 20 - 11
Changes in valuation allowances on deferred tax assets 1 - 14
Noncontrolling interests - 61 - 41
Other - 1 31
income tax 700 669
effective tax rate 27.9% 27.8%
deferred taxes
The tax effects of the temporary differences that gave rise
to deferred tax assets and liabilities at December 31 are pre-
sented below:
€ in millions 2014 2013
deferred tax assets
Accounts receivable 25 16
Inventories 78 65
Other current assets 19 33
Other non-current assets 70 105
Accrued expenses 315 242
Other short-term liabilities 65 56
Other liabilities 44 32
Benefit obligations 236 124
Losses carried forward from prior years 326 260
deferred tax assets, before valuation allowance 1,178 933
less valuation allowance 88 87
deferred tax assets 1,090 846
deferred tax liabilities
Accounts receivable 35 32
Inventories 29 26
Other current assets 14 14
Other non-current assets 974 742
Accrued expenses 13 14
Other short-term liabilities 150 120
Other liabilities 69 102
deferred tax liabilities 1,284 1,050
Net deferred taxes - 194 - 204

Consolidated Financial Statements120
Financial S
tatements
In the consolidated statement of financial position, the net
amounts of deferred tax assets and liabilities are included as
follows:
2014 2013
€ in millionsthereof
short-termthereof
short-term
Deferred tax assets 727 406 535 331
Deferred tax liabilities 921 54 739 48
Net deferred taxes - 194 352 - 204 283
As of December 31, 2014, Fresenius Medical Care has not
recognized a deferred tax liability on approximately € 5.5 bil-
lion of undistributed earnings of its foreign subsidiaries,
because those earnings are considered indefinitely reinvested.
Net operatiNG losses
The expiration of net operating losses is as follows:
for the fiscal years € in millions
2015 16
2016 23
2017 25
2018 26
2019 52
2020 9
2021 8
2022 12
2023 10
2024 and thereafter 138
total 319
The total remaining operating losses of € 911 million can
mainly be carried forward for an unlimited period.
Based upon the level of historical taxable income and
projections for future taxable income, the Management of the
Fresenius Group believes it is more likely than not that the
Fresenius Group will realize the benefits of these deductible
differences, net of the existing valuation allowances, at
December 31, 2014.
UNrecoGNized tax beNefits
Fresenius SE & Co. KGaA and its subsidiaries are subject to
tax audits in Germany and the United States on a regular basis
and ongoing tax audits in other jurisdictions.
In Germany, for Fresenius Medical Care, the tax audit
for the years 2002 through 2005 was completed during 2014
and resulted in payments totaling € 76 million, which had
been previously provided for. The tax years 2006 through 2012
are currently under audit by the tax authorities. Fiscal years
2013 and 2014 are open to audit. The other German entities of
the Fresenius Group are currently subject to tax audits for
the tax years 2006 through 2009. Fiscal years 2010 until 2014
are open to audit. The Fresenius Group recognized and
recorded the current proposed adjustments of this audit period
in the consolidated financial statements. All proposed adjust-
ments are deemed immaterial.
For Fresenius Kabi USA, the tax years 2010 and 2011 are
currently under audit by the tax authorities. Fiscal years 2012
until 2014 are open to audit.
In the United States, for Fresenius Medical Care, the tax
years 2011 and 2012 are currently under audit by the tax
authorities. Fiscal years 2013 and 2014 are open to audit.
Fresenius Medical Care Holdings, Inc. (FMCH) is also subject
to audit in various state jurisdictions. A number of these
audits are in progress and various years are open to audit in
various state jurisdictions. All expected results for both
federal and state income tax audits have been recognized in
the consolidated financial statements.
Fresenius Medical Care filed claims for refunds contesting
the Internal Revenue Service’s (IRS) disallowance of FMCH’s
deductions for civil settlement payments taken by FMCH in
prior year tax returns. As a result of a settlement agreement
with the IRS, Fresenius Medical Care received a partial refund
in September 2008 of US$ 37 million, inclusive of interest,
and preserved its right to pursue claims in the United States
Courts for refunds of all other disallowed deductions, which
totaled approximately US$ 126 million. On December 22, 2008,
Fresenius Medical Care filed a complaint for complete refund
in the United States District Court for the District of Massa-
chusetts, styled as Fresenius Medical Care Holdings, Inc. v.
United States. On August 15, 2012, a jury entered a verdict
for FMCH granting additional deductions of US$ 95 million. On
May 31, 2013, the District Court entered final judgment for

121
Fin
anci
al S
tate
men
ts
consolidated financial statements Notes on the consolidated statement of income
11. NoNcoNtrolliNG iNterestAs of December 31, noncontrolling interest in net income in
the Fresenius Group was as follows:
€ in millions 2014 2013
Noncontrolling interest in Fresenius Medical Care 542 576
Noncontrolling interest in Fresenius Vamed 10 9
Noncontrolling interest in the business segments
Fresenius Medical Care 161 109
Fresenius Kabi 20 25
Fresenius Helios 11 7
Fresenius Vamed 1 1
total noncontrolling interest 745 727
In the fiscal year 2014, Fresenius Medical Care AG & Co. KGaA
paid dividends to noncontrolling interests in the amount of
€ 159 million (2013: € 159 million).
12. earNiNGs per shareThe following table shows the earnings per share including
and excluding the dilutive effect from stock options issued
after registration of the capital increase from company’s
funds (stock split 1 : 3, see note 26, Fresenius SE & Co. KGaA
shareholders’ equity) with the commercial register on
August 1, 2014:
2014 2013 1
Numerators, € in millions
Net income attributable to shareholders of Fresenius SE & Co. KGaA 1,067 1,011
less effect from dilution due to Fresenius Medical Care shares 1 1
Income available to all ordinary shares 1,066 1,010
denominators in number of shares
Weighted-average number of ordinary shares outstanding 540,347,847 536,017,956
Potentially dilutive ordinary shares 3,950,327 3,695,064
Weighted-average number of ordinary shares outstanding assuming dilution 544,298,174 539,713,020
basic earnings per ordinary share in € 1.97 1.89
fully diluted earnings per ordinary share in € 1.96 1.87
1 Prior year figures were adjusted accordingly.
FMCH in the refund amount of US$ 50 million. On Septem-
ber 18, 2013, the IRS appealed the District Court’s ruling to the
United States Court of Appeals for the First Circuit (Boston).
On August 13, 2014, the United States Court of Appeals for
the First Circuit (Boston) affirmed the District Court’s order.
The Disctrict Court judgment became final upon the govern-
ment’s decision not to seek a writ of certiorari from the United
States Supreme Court. Accordingly, Fresenius Medical Care
recorded a net tax benefit of approximately US$ 23 million in
the fourth quarter of 2014.
Subsidiaries of Fresenius SE & Co. KGaA in a number of
countries outside of Germany and the United States are also
subject to tax audits. The Fresenius Group estimates that the
effects of such tax audits are not material to the consolidated
financial statements.
The following table shows the changes to unrecognized
tax benefits during the year 2014:
€ in millions 2014
balance at January 1, 2014 248
Increase in unrecognized tax benefits prior periods 27
Decrease in unrecognized tax benefits prior periods - 31
Increase in unrecognized tax benefits current periods 18
Changes related to settlements with tax authorities - 47
Foreign currency translation 19
balance at december 31, 2014 234
Included in the balance at December 31, 2014 are € 226 mil-
lion of unrecognized tax benefits, which would affect the
effective tax rate if recognized. The Fresenius Group is cur-
rently not in a position to forecast the timing and magni-
tude of changes in other unrecognized tax benefits.
It is Fresenius Group’s policy to recognize interest and
penalties related to its tax positions as income tax expense.
During the fiscal year 2014, the Fresenius Group recognized
€ 10 million in interest and penalties. The Fresenius Group
had a total accrual of € 1 million of tax related interest and
pen alties at December 31, 2014.

consolidated financial statements122
Financial S
tatements
Notes oN the coNsolidated
statemeNt of fiNaNcial positioN
13. cash aNd cash eqUivaleNtsAs of December 31, cash and cash equivalents were as follows:
€ in millions 2014 2013
Cash 1,127 846
Time deposits and securities (with a maturity of up to 90 days) 48 18
total cash and cash equivalents 1,175 864
As of December 31, 2014 and December 31, 2013, earmarked
funds of € 52 million and € 22 million, respectively, were
included in cash and cash equivalents.
The Fresenius Group operates a multi-currency notional
pooling cash management system. The Fresenius Group
met the conditions to offset balances within this cash pool for
reporting purposes. At December 31, 2014, € 72 million
(December 31, 2013: € 0 million) of the cash balances and the
equivalent amount of the overdraft balances were offset.
14. trade accoUNts receivableAs of December 31, trade accounts receivable were as follows:
€ in millions 2014 2013
Trade accounts receivable 4,780 3,961
less allowance for doubtful accounts 545 487
trade accounts receivable, net 4,235 3,474
All trade accounts receivable are due within one year.
The following table shows the development of the allow-
ance for doubtful accounts during the fiscal year:
€ in millions 2014 2013
allowance for doubtful accounts at the beginning of the year 487 406
Change in valuation allowances as recorded in the consolidated statement of income 241 284
Write-offs and recoveries of amounts previously written-off - 216 - 185
Foreign currency translation 33 - 18
allowance for doubtful accounts at the end of the year 545 487
15. iNveNtoriesAs of December 31, inventories consisted of the following:
€ in millions 2014 2013
Raw materials and purchased components 527 445
Work in process 451 323
Finished goods 1,440 1,314
less reserves 85 68
inventories, net 2,333 2,014
The companies of the Fresenius Group are obliged to pur-
chase approximately € 740 million of raw materials and pur-
chased components under fixed terms, of which € 456 mil-
lion was committed at December 31, 2014 for 2015. The terms
of these agreements run one to six years. Advance payments
from customers of € 427 million (2013: € 248 million) have
been offset against inventories.
Inventories as of December 31, 2014 and December 31,
2013 included approximately € 29 million and approximately
€ 24 million, respectively, of the product Erythropoietin (EPO).
Fresenius Medical Care’s previous contract with its EPO sup-
plier Amgen, Inc. expired on December 31, 2014. As a result,
Fresenius Medical Care entered into a new four-year sourcing
and supply agreement with Amgen, Inc.
The following table shows the aging analysis of trade accounts receivable and their allowance for
doubtful accounts:
€ in millionsnot
overdue
up to 3 months overdue
3 to 6 months overdue
6 to 12 months overdue
more than 12 months
overdue total
Trade accounts receivable 2,737 866 352 298 527 4,780
less allowance for doubtful accounts 33 92 59 75 286 545
trade accounts receivable, net 2,704 774 293 223 241 4,235

consolidated financial statements Notes on the consolidated statement of financial position 123
Fin
anci
al S
tate
men
ts
The purchase price deposit in the amount of € 2,178 million,
that was shown under other non-current assets as of Decem-
ber 31, 2013, was offset in the course of the acquisition of
hospitals and outpatient facilities of Rhön-Klinikum AG in the
first quarter of 2014.
As of December 31, 2014, investments were comprised of
investments of € 558 million (2013: € 482 million), mainly
regarding the joint venture between Fresenius Medical Care
and Galenica Ltd., that were accounted for under the equity
method. In 2014, income of € 19 million (2013: € 20 million)
resulting from this valuation was included in selling, general
and administrative expenses in the consolidated statement of
income. Securities and long-term loans included € 148 mil-
lion financial assets available for sale as of December 31, 2014
(2013: € 197 million) mainly relating to shares in funds. At
December 31, 2013, these mainly referred to shares in Rhön-
Klinikum AG with acquisition costs of € 124 million and a
fair value of € 147 million. Furthermore, securities and long-
term loans included € 148 million as of December 31, 2014
that Fresenius Medical Care loaned to a middle-market dialy-
sis provider.
The receivables resulting from the German hospital law
primarily contain approved but not yet received earmarked
subsidies of the Fresenius Helios operations. The approval is
evidenced in a letter written by the granting authorities that
Fresenius Helios has already received.
In the fiscal years 2014 and 2013, depreciation on other
non-current assets was recognized in an immaterial amount.
16. other cUrreNt aNd NoN-cUrreNt assetsAs of December 31, other current and non-current assets were comprised of the following:
2014 2013
€ in millionsthereof
short-termthereof
short-term
Investments 620 0 534 0
Prepaid expenses 133 69 129 64
Capitalized debt financing costs 109 16 95 13
Advances made 86 55 60 60
Prepaid rent and insurance 69 69 55 55
Purchase price deposits 0 0 2,178 0
Other assets 661 500 514 380
other non-financial assets, net 1,678 709 3,565 572
Tax receivables 462 434 254 233
Securities and long-term loans 362 152 377 46
Accounts receivable resulting from German hospital law 249 233 168 153
Derivative financial instruments 176 30 32 30
Cost report receivable from Medicare and Medicaid 113 113 94 94
Leasing receivables 91 46 78 36
Discounts 72 72 78 78
Deposits 65 21 48 19
Assets held for sale 33 33 0 0
other financial assets, net 1,623 1,134 1,129 689
other assets, net 3,301 1,843 4,694 1,261
Allowances 10 7 11 9
other assets, gross 3,311 1,850 4,705 1,270

Consolidated Financial Statements124
Financial S
tatements
17. property, plaNt aNd eqUipmeNtAs of December 31, the acquisition and manufacturing costs as well as accumulated depreciation of property, plant
and equipment consisted of the following:
ACqUISITION AND MANUFACTURING COSTS
€ in millionsAs of
Jan. 1, 2014
Foreign currency
translation
Changes in entities
consolidated AdditionsReclassifi-
cations Disposalsas of
dec. 31, 2014
Land and land facilities 294 1 221 11 – 3 524
Buildings and improvements 3,825 178 615 208 170 133 4,863
Machinery and equipment 4,961 239 192 526 161 172 5,907
Machinery, equipment and rental equipment under capital leases 145 2 25 8 - 8 1 171
Construction in progress 584 29 63 551 - 358 7 862
property, plant and equipment 9,809 449 1,116 1,304 - 35 316 12,327
DEPRECIATION
€ in millionsAs of
Jan. 1, 2014
Foreign currency
translation
Changes in entities
consolidated AdditionsReclassifi-
cations Disposalsas of
dec. 31, 2014
Land and land facilities 6 – 0 – 0 – 6
Buildings and improvements 1,732 106 2 257 - 1 65 2,031
Machinery and equipment 2,944 136 5 522 - 9 140 3,458
Machinery, equipment and rental equipment under capital leases 44 – – 12 - 4 1 51
Construction in progress 1 – 0 – 4 – 5
property, plant and equipment 4,727 242 7 791 - 10 206 5,551
ACqUISITION AND MANUFACTURING COSTS
€ in millionsAs of
Jan. 1, 2013
Foreign currency
translation
Changes in entities
consolidated AdditionsReclassifi-
cations Disposalsas of
dec. 31, 2013
Land and land facilities 285 - 7 4 17 2 7 294
Buildings and improvements 3,672 - 113 1 93 231 59 3,825
Machinery and equipment 4,665 - 196 4 459 195 166 4,961
Machinery, equipment and rental equipment under capital leases 139 - 1 – 10 – 3 145
Construction in progress 542 - 25 8 489 - 422 8 584
property, plant and equipment 9,303 - 342 17 1,068 6 243 9,809
DEPRECIATION
€ in millionsAs of
Jan. 1, 2013
Foreign currency
translation
Changes in entities
consolidated AdditionsReclassifi-
cations Disposalsas of
dec. 31, 2013
Land and land facilities 6 – 0 1 – 1 6
Buildings and improvements 1,598 - 50 - 3 226 5 44 1,732
Machinery and equipment 2,741 - 107 - 9 472 - 4 149 2,944
Machinery, equipment and rental equipment under capital leases 39 - 1 – 9 - 1 2 44
Construction in progress 1 – 0 – – – 1
property, plant and equipment 4,385 - 158 - 12 708 – 196 4,727
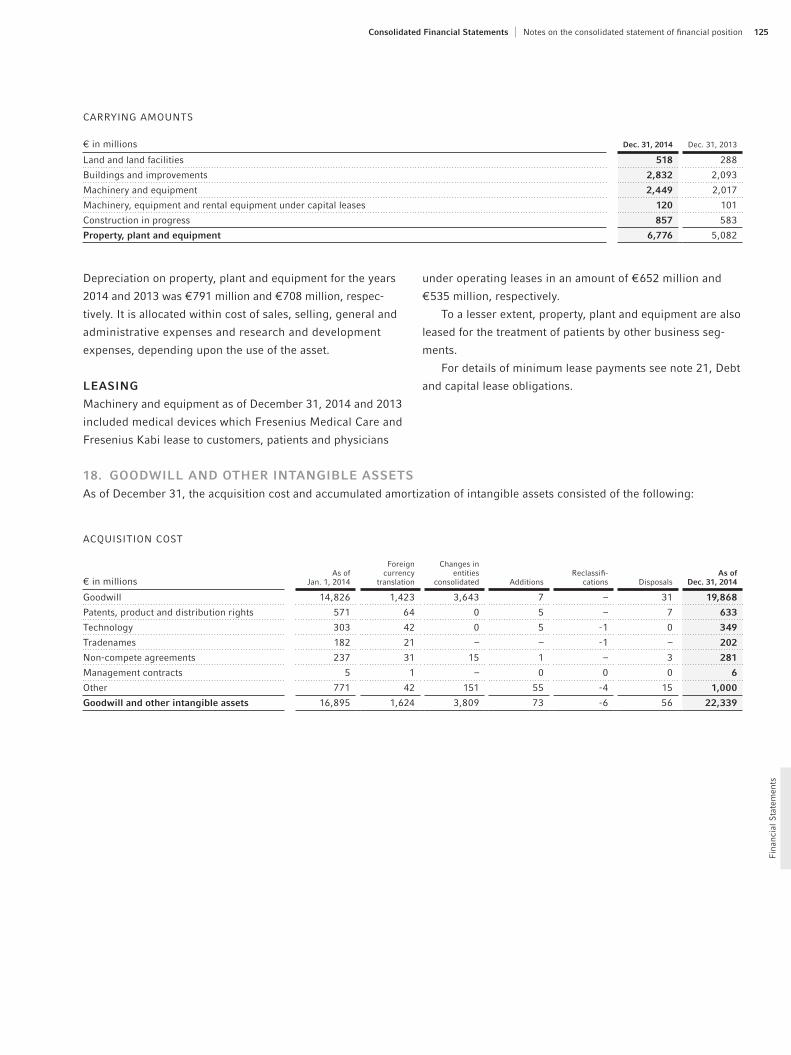
125
Fin
anci
al S
tate
men
ts
consolidated financial statements Notes on the consolidated statement of financial position
CARRyING AMOUNTS
€ in millions dec. 31, 2014 Dec. 31, 2013
Land and land facilities 518 288
Buildings and improvements 2,832 2,093
Machinery and equipment 2,449 2,017
Machinery, equipment and rental equipment under capital leases 120 101
Construction in progress 857 583
property, plant and equipment 6,776 5,082
Depreciation on property, plant and equipment for the years
2014 and 2013 was € 791 million and € 708 million, respec-
tively. It is allocated within cost of sales, selling, general and
administrative expenses and research and development
expenses, depending upon the use of the asset.
leasiNG
Machinery and equipment as of December 31, 2014 and 2013
included medical devices which Fresenius Medical Care and
Fresenius Kabi lease to customers, patients and physicians
under operating leases in an amount of € 652 million and
€ 535 million, respectively.
To a lesser extent, property, plant and equipment are also
leased for the treatment of patients by other business seg-
ments.
For details of minimum lease payments see note 21, Debt
and capital lease obligations.
18. Goodwill aNd other iNtaNGible assetsAs of December 31, the acquisition cost and accumulated amortization of intangible assets consisted of the following:
ACqUISITION COST
€ in millionsAs of
Jan. 1, 2014
Foreign currency
translation
Changes in entities
consolidated AdditionsReclassifi-
cations Disposalsas of
dec. 31, 2014
Goodwill 14,826 1,423 3,643 7 – 31 19,868
Patents, product and distribution rights 571 64 0 5 – 7 633
Technology 303 42 0 5 - 1 0 349
Tradenames 182 21 – – - 1 – 202
Non-compete agreements 237 31 15 1 – 3 281
Management contracts 5 1 – 0 0 0 6
Other 771 42 151 55 - 4 15 1,000
Goodwill and other intangible assets 16,895 1,624 3,809 73 - 6 56 22,339

Consolidated Financial Statements126
Financial S
tatements
AMORTIzATION
€ in millionsAs of
Jan. 1, 2014
Foreign currency
translation
Changes in entities
consolidated AdditionsReclassifi-
cations Disposalsas of
dec. 31, 2014
Goodwill 0 0 0 0 0 0 0
Patents, product and distribution rights 235 26 0 32 - 1 4 288
Technology 48 8 0 21 – 0 77
Tradenames 0 0 0 0 0 0 0
Non-compete agreements 174 24 0 17 – 3 212
Management contracts 0 0 0 0 0 0 0
Other 371 23 – 76 - 9 13 448
Goodwill and other intangible assets 828 81 – 146 - 10 20 1,025
ACqUISITION COST
€ in millionsAs of
Jan. 1, 2013
Foreign currency
translation
Changes in entities
consolidated AdditionsReclassifi-
cations Disposalsas of
dec. 31, 2013
Goodwill 15,014 - 539 326 29 – 4 14,826
Patents, product and distribution rights 585 - 23 – 16 1 8 571
Technology 321 - 12 2 1 - 8 1 303
Tradenames 175 - 10 17 – – – 182
Non-compete agreements 242 - 11 8 1 0 3 237
Management contracts 6 – - 1 0 – 0 5
Other 684 - 33 78 33 31 22 771
Goodwill and other intangible assets 17,027 - 628 430 80 24 38 16,895
AMORTIzATION
€ in millionsAs of
Jan. 1, 2013
Foreign currency
translation
Changes in entities
consolidated AdditionsReclassifi-
cations Disposalsas of
dec. 31, 2013
Goodwill 0 0 0 0 0 0 0
Patents, product and distribution rights 216 - 8 – 35 – 8 235
Technology 32 - 2 0 20 - 2 – 48
Tradenames 0 0 0 0 0 0 0
Non-compete agreements 162 - 8 0 23 0 3 174
Management contracts 0 0 0 0 0 0 0
Other 319 - 14 - 1 57 17 7 371
Goodwill and other intangible assets 729 - 32 - 1 135 15 18 828

127
Fin
anci
al S
tate
men
ts
consolidated financial statements Notes on the consolidated statement of financial position
CARRyING AMOUNTS
€ in millions dec. 31, 2014 Dec. 31, 2013
Goodwill 19,868 14,826
Patents, product and distribution rights 345 336
Technology 272 255
Tradenames 202 182
Non-compete agreements 69 63
Management contracts 6 5
Other 552 400
Goodwill and other intangible assets 21,314 16,067
The split of intangible assets into amortizable and non-amortizable intangible assets is shown in the following tables:
AMORTIzABLE INTANGIBLE ASSETS
dec. 31, 2014 Dec. 31, 2013
€ in millionsacquisition
costaccumulated amortization
carrying amount
Acquisition cost
Accumulated amortization
Carrying amount
Patents, product and distribution rights 633 288 345 571 235 336
Technology 349 77 272 303 48 255
Non-compete agreements 281 212 69 237 174 63
Other 1,000 448 552 771 371 400
total 2,263 1,025 1,238 1,882 828 1,054
Estimated regular amortization expenses of intangible assets for the next five years are shown in the following table:
€ in millions 2015 2016 2017 2018 2019
Estimated amortization expenses 158 150 144 140 136
NON-AMORTIzABLE INTANGIBLE ASSETS
dec. 31, 2014 Dec. 31, 2013
€ in millionsacquisition
costaccumulated amortization
carrying amount
Acquisition cost
Accumulated amortization
Carrying amount
Tradenames 202 0 202 182 0 182
Management contracts 6 0 6 5 0 5
Goodwill 19,868 0 19,868 14,826 0 14,826
total 20,076 0 20,076 15,013 0 15,013
Amortization on intangible assets amounted to € 146 mil-
lion and € 135 million for the years 2014 and 2013, respec-
tively. It is allocated within cost of sales, selling, general
and administrative expenses and research and development
expenses, depending upon the use of the asset.

Consolidated Financial Statements128
Financial S
tatements
The carrying amount of goodwill has developed as follows:
€ in millionsFresenius
Medical CareFresenius
KabiFresenius
HeliosFresenius
VamedCorporate /
Otherfresenius
Group
carrying amount as of January 1, 2013 8,657 4,123 2,151 77 6 15,014
Additions 195 138 14 8 0 355
Disposals 0 - 4 0 0 0 - 4
Reclassifications – 0 0 0 0 –
Foreign currency translation - 398 - 141 0 0 0 - 539
carrying amount as of december 31, 2013 8,454 4,116 2,165 85 6 14,826
Additions 1,287 99 2,250 14 0 3,650
Disposals 0 - 3 - 28 0 0 - 31
Reclassifications 0 – 0 0 0 –
Foreign currency translation 1,034 389 0 0 0 1,423
carrying amount as of december 31, 2014 10,775 4,601 4,387 99 6 19,868
The goodwill additions in the segment Fresenius Helios in
2014 mainly resulted from the acquisition of hospitals and
outpatient facilities of Rhön-Klinikum AG.
As of December 31, 2014 and December 31, 2013, the carry-
ing amounts of the other non-amortizable intangible assets
were € 179 million and € 158 million, respectively, for Fresenius
Medical Care as well as € 29 million for Fresenius Kabi.
19. accrUed expeNsesAs of December 31, accrued expenses consisted of the following:
2014 2013
€ in millionsthereof
short-termthereof
short-term
Personnel expenses 1,018 885 706 604
Invoices outstanding 314 314 253 253
Self-insurance programs 197 197 147 147
Bonuses and discounts 136 136 115 115
Warranties and complaints 118 117 67 66
Legal matters, advisory and audit fees 87 87 57 57
Accrued variable payments outstanding for acquisition 42 27 35 13
Commissions 28 28 30 30
Special charge for legal matters 0 0 83 83
Other accrued expenses 628 551 512 460
accrued expenses 2,568 2,342 2,005 1,828
The following table shows the development of accrued expenses in the fiscal year:
€ in millionsAs of
Jan. 1, 2014
Foreign currency
translation
Changes in entities
consolidated AdditionsReclassifi-
cations Utilized Reversedas of
dec. 31, 2014
Personnel expenses 706 37 158 651 - 2 - 482 - 50 1,018
Invoices outstanding 253 3 37 254 - 2 - 200 - 31 314
Self-insurance programs 147 22 0 37 0 - 1 - 8 197
Bonuses and discounts 115 8 2 126 – - 102 - 13 136
Warranties and complaints 67 2 32 42 – - 17 - 8 118
Legal matters, advisory and audit fees 57 4 13 46 - 1 - 28 - 4 87
Accrued variable payments outstanding for acquisition 35 - 1 28 7 – - 20 - 7 42
Commissions 30 – – 24 0 - 21 - 5 28
Special charge for legal matters 83 4 0 0 0 - 87 0 0
Other accrued expenses 512 19 153 400 - 9 - 378 - 69 628
total 2,005 98 423 1,587 - 14 - 1,336 - 195 2,568

129
Fin
anci
al S
tate
men
ts
consolidated financial statements Notes on the consolidated statement of financial position
Accruals for personnel expenses mainly refer to bonus, sev-
erance payments, contribution of partial retirement and
holiday entitlements. For details regarding accruals for self-
insurance programs, please see note 1. III. aa, Self-insurance
programs.
In 2001, Fresenius Medical Care recorded a US$ 258 mil-
lion special charge to address legal matters relating to trans-
actions pursuant to the Agreement and Plan of Reorganiza-
tion dated as of February 4, 1996 by and between W.R. Grace &
Co. and Fresenius AG, estimated liabilities and legal expenses
arising in connection with the W.R. Grace & Co. Chapter 11 pro-
ceedings (Grace Chapter 11 Proceedings) and the cost of
resolving pending litigation and other disputes with certain
commercial insurers. During the second quarter of 2003,
the court supervising the Grace Chapter 11 Proceedings
approved a definitive settlement whereby Fresenius Medical
Care agreed to pay US$ 115 million. On February 3, 2014,
Fresenius Medical Care paid US$ 115 million (€ 87 million),
which had been previously accrued. All matters related to the
recorded charge have now been resolved (see note 28, Com-
mitments and contingent liabilities).
20. other liabilitiesAs of December 31, other liabilities consisted of the following:
2014 2013
€ in millionsthereof
short-termthereof
short-term
Debtors with credit balances 295 295 227 227
Accounts payable resulting from German hospital law 251 248 130 130
Accounts receivable credit balance 160 58 145 51
Advance payments from customers 69 58 32 32
All other liabilities 491 330 344 193
other non-financial liabilities 1,266 989 878 633
Personnel liabilities 277 272 223 218
Derivative financial instruments 232 80 23 17
Tax liabilities 205 204 145 144
Interest liabilities 172 172 145 145
Leasing liabilities 90 90 72 72
Liabilities held for sale 15 15 0 0
other financial liabilities 991 833 608 596
other liabilities 2,257 1,822 1,486 1,229
The payables resulting from the German hospital law primar-
ily contain earmarked subsidies received but not yet spent
appropriately by Fresenius Helios. The amount not yet spent
appropriately is classified as liability.
At December 31, 2014, the total amount of other non-current
liabilities was € 435 million, thereof € 232 million was due
between one and five years and € 203 million was due after
five years. The statement of financial position line item long-
term accrued expenses and other long-term liabilities of € 661
million also included other long-term accrued expenses of
€ 226 million as of December 31, 2014.

Consolidated Financial Statements130
Financial S
tatements
21. debt aNd capital lease obliGatioNs
short-term debt
The Fresenius Group had short-term debt of € 230 million and
€ 959 million at December 31, 2014 and December 31, 2013,
respectively. As of December 31, 2014, this debt consisted of
borrowings by certain entities of the Fresenius Group under
lines of credit with commercial banks. The average interest
rates on these borrowings at December 31, 2014 and 2013
were 5.83% and 1.65%, respectively.
loNG-term debt aNd capital lease
obliGatioNs
As of December 31, long-term debt and capital lease obliga-
tions consisted of the following:
€ in millions 2014 2013
Fresenius Medical Care 2012 Credit Agreement 2,389 1,963
2013 Senior Credit Agreement 2,561 1,709
Bridge Financing Facility 0 1,410
Euro Notes 1,025 859
European Investment Bank Agreements 40 188
Accounts receivable facility of Fresenius Medical Care 281 255
Capital lease obligations 151 94
Other 283 248
Subtotal 6,730 6,726
less current portion 753 855
long-term debt and capital lease obligations, less current portion 5,977 5,871
Maturities of long-term debt and capital lease obligations are shown in the following table:
€ in millionsup to
1 year1 to 3 years
3 to 5 years
more than 5 years
Fresenius Medical Care 2012 Credit Agreement 189 378 1,822 0
2013 Senior Credit Agreement 451 408 794 908
Euro Notes 0 410 353 262
European Investment Bank Agreements 8 16 16 0
Accounts receivable facility of Fresenius Medical Care 0 281 0 0
Capital lease obligations 13 29 12 97
Other 92 93 49 49
long-term debt and capital lease obligations 753 1,615 3,046 1,316

131
Fin
anci
al S
tate
men
ts
consolidated financial statements Notes on the consolidated statement of financial position
Aggregate annual repayments applicable to the above listed
long-term debt and capital lease obligations for the years
subsequent to December 31, 2014 are:
for the fiscal years € in millions
2015 753
2016 759
2017 856
2018 795
2019 2,251
Subsequent years 1,316
total 6,730
fresenius medical care 2012 credit agreement Fresenius Medical Care AG & Co. KGaA (FMC-AG & Co. KGaA)
originally entered into a syndicated credit facility ( Fresenius
Medical Care 2012 Credit Agreement) of US$ 3,850 million and
a 5-year period with a large group of banks and institutional
investors (collectively, the Lenders) on October 30, 2012.
On November 26, 2014, the Fresenius Medical Care 2012
Credit Agreement was amended to increase the total credit
facility to approximately US$ 4,400 million and extend the term
for an additional two years until October 30, 2019.
The following tables show the available and outstanding
amounts under the Fresenius Medical Care 2012 Credit Agree-
ment at December 31:
2014
Maximum amount available balance outstanding
€ in millions € in millions
Revolving Credit (in US$) US$ 1,000 million 824 Us$ 36 million 30
Revolving Credit (in €) € 400 million 400 € 0 million 0
US$ Term Loan US$ 2,500 million 2,059 Us$ 2,500 million 2,059
€ Term Loan € 300 million 300 € 300 million 300
total 3,583 2,389
2013
Maximum amount available balance outstanding
€ in millions € in millions
Revolving Credit (in US$) US$ 600 million 435 Us$ 138 million 100
Revolving Credit (in €) € 500 million 500 € 50 million 50
US$ Term Loan US$ 2,500 million 1,813 Us$ 2,500 million 1,813
total 2,748 1,963
As of December 31, 2014, the Fresenius Medical Care 2012
Credit Agreement consisted of:
▶ Revolving credit facilities of approximately US$ 1,500 mil-
lion comprising a US$ 1,000 million revolving facility and
a € 400 million revolving facility, which will be due and
payable on October 30, 2019.
▶ A term loan facility of US$ 2,500 million, also scheduled to
mature on October 30, 2019. quarterly repayments of
US$ 50 million, which began in January 2015 are required
with the remaining balance outstanding due on Octo-
ber 30, 2019.
▶ A term loan facility of € 300 million scheduled to mature
on October 30, 2019. quarterly repayments of € 6 mil-
lion, which began in January 2015 are required with the
remaining balance outstanding due October 30, 2019.
Interest on the credit facilities is, at Fresenius Medical
Care’s option, at a rate equal to either (i) LIBOR or EURIBOR
(as applicable) plus an applicable margin or (ii) the Base
Rate as defined in the Fresenius Medical Care 2012 Credit
Agreement plus an applicable margin. As of December 31,
2014, the U.S. dollar-denominated tranches outstanding
under the Fresenius Medical Care 2012 Credit Agreement
had a weighted-average interest rate of 1.61%. The euro-
denominated tranche had an interest rate of 1.42%.

Consolidated Financial Statements132
Financial S
tatements
The applicable margin is variable and depends on Fresenius
Medical Care’s consolidated leverage ratio which is a ratio of
its consolidated funded debt (less cash and cash equivalents)
to consolidated EBITDA (as these terms are defined in the
Fresenius Medical Care 2012 Credit Agreement).
In addition to scheduled principal payments, indebtedness
outstanding under the Fresenius Medical Care 2012 Credit
Agreement would be reduced by portions of the net cash pro-
ceeds received from certain sales of assets.
Obligations under the Fresenius Medical Care 2012 Credit
Agreement are secured by pledges of capital stock of certain
material subsidiaries in favor of the Lenders.
The Fresenius Medical Care 2012 Credit Agreement con-
tains affirmative and negative covenants with respect to FMC-
AG & Co. KGaA and its subsidiaries. Under certain circum-
stances, these covenants limit indebtedness, investments and
restrict the creation of liens. Under the Fresenius Medical
Care 2012 Credit Agreement, FMC-AG & Co. KGaA is required
to comply with a maximum leverage ratio (ratio of net debt
to EBITDA). Additionally, the Fresenius Medical Care 2012
Credit Agreement provides for a limitation on dividends, share
buy-backs and similar payments. Dividends to be paid are
subject to an annual basket, which is € 360 million for 2015,
and will increase in subsequent years. Additional dividends
and other restricted payments may be made subject to the
maintenance of a maximum leverage ratio. In default, the out-
standing balance under the Fresenius Medical Care 2012
Credit Agreement becomes immediately due and payable at
the option of the Lenders.
As of December 31, 2014, FMC-AG & Co. KGaA and its
subsidiaries were in compliance with all covenants under the
Fresenius Medical Care 2012 Credit Agreement.
In addition, at December 31, 2014 and December 31, 2013,
Fresenius Medical Care had letters of credit outstanding in
the amount of US$ 7 million and US$ 9 million, respectively,
which were not included above as part of the balance out-
standing at those dates but which reduce available borrow-
ings under the Revolving Credit Facility.
2013 senior credit agreementOn December 20, 2012, Fresenius SE & Co. KGaA and various
subsidiaries entered into a delayed draw syndicated credit
agreement (2013 Senior Credit Agreement) in the original
amount of US$ 1,300 million and € 1,250 million. The 2013
Senior Credit Agreement was funded on June 28, 2013 and
replaced a prior credit agreement. On August 7, 2013, the
2013 Senior Credit Agreement was extended by a term loan
B facility in the amount of US$ 500 million.
The 2013 Senior Credit Agreement allows for establish-
ment of incremental facilities if certain conditions are met. In
line with these provisions, the 2013 Senior Credit Agree-
ment has been increased on November 27, 2013 by facilities
in the initial amount of € 1,200 million, which at that time
consisted of an incremental term loan facility A of € 600 million,
an incremental term loan facility B of € 300 million and an
incremental revolving facility of € 300 million. These incremen-
tal facilities were drawn down on February 27, 2014 and used
to fund the acquisition of hospitals from Rhön-Klinikum AG.

133
Fin
anci
al S
tate
men
ts
consolidated financial statements Notes on the consolidated statement of financial position
The following tables show the available and outstanding amounts under the 2013 Senior Credit Agreement at December 31:
2014
Maximum amount available balance outstanding
€ in millions € in millions
Revolving Credit Facilities (in €) € 900 million 900 € 0 million 0
Revolving Credit Facilities (in US$) US$ 300 million 247 Us$ 0 million 0
Term Loan A (in €) € 1,125 million 1,125 € 1,125 million 1,125
Term Loan A (in US$) US$ 890 million 733 Us$ 890 million 733
Term Loan B (in €) € 297 million 297 € 297 million 297
Term Loan B (in US$) US$ 494 million 406 Us$ 494 million 406
total 3,708 2,561
2013
Maximum amount available balance outstanding
€ in millions € in millions
Revolving Credit Facilities (in €) € 600 million 600 € 0 million 0
Revolving Credit Facilities (in US$) US$ 300 million 218 Us$ 0 million 0
Term Loan A (in €) € 637 million 637 € 637 million 637
Term Loan A (in US$) US$ 980 million 710 Us$ 980 million 710
Term Loan B (in US$) US$ 499 million 362 Us$ 499 million 362
total 2,527 1,709
As of December 31, 2014, the 2013 Senior Credit Agreement
consisted of:
▶ Revolving credit facilities in the aggregate principal
amount of US$ 300 million, € 700 million and a € 200 mil-
lion multicurrency facility with a final repayment date
on June 28, 2018.
▶ Term loan facilities in the aggregate principal amount of
US$ 890 million and € 1,125 million (together Term Loan
A). Term Loan A amortizes and is repayable in unequal
quarterly installments with a final maturity on June 28,
2018.
▶ Term loan facilities in the aggregate principal amount of
US$ 494 million and € 297 million (together Term Loan B).
Term Loan B amortizes and is repayable in quarterly
installments, whereby the majority of the loans is due on
June 28, 2019.
On January 29, 2015, the term loan B facility of € 297 million
under the 2013 Senior Credit Agreement was voluntarily
prepaid. On February 12, 2015, Fresenius SE & Co. KGaA refi-
nanced the revolving credit facilities and the term loan A
tranches in a total amount of € 3,044 million. The new facilities
consist initially of revolving facilities of € 900 million and
US$ 300 million, as well as term loan A facilities of € 1,150 mil-
lion and US$ 850 million. The maturity of these tranches
was extended by two years to June 28, 2020. The term loan B
facility of US$ 494 million remains unchanged.
The maturities of the 2013 Senior Credit Agreement shown
in the consolidated statement of financial position as of
December 31, 2014, already take into account the amendments
made in February 2015.
The interest rate on each borrowing under the 2013 Senior
Credit Agreement is a rate equal to either (i) LIBOR or
EURIBOR (as applicable) plus an applicable margin or (ii) the
Base Rate as defined in the 2013 Senior Credit Agreement
plus an applicable margin. The applicable margin is variable
and depends on the leverage ratio as defined in the 2013
Senior Credit Agreement.
In addition to scheduled principal payments, indebted-
ness outstanding under the 2013 Senior Credit Agreement
will be reduced by mandatory prepayments in the case of
certain sales of assets and the incurrence of certain addi-
tional indebtedness, with the amount to be prepaid depend-
ing on the proceeds which are generated by the respective
transaction.
The 2013 Senior Credit Agreement is guaranteed by
Fresenius SE & Co. KGaA, Fresenius ProServe GmbH,
Fresenius Kabi AG and certain U.S. subsidiaries of Fresenius

Consolidated Financial Statements134
Financial S
tatements
Kabi AG. Obligations under the 2013 Senior Credit Agree-
ment are secured by pledges of capital stock of certain mate-
rial subsidiaries of Fresenius Kabi AG, and upon funding of
the incremental facilities in February 2014 are additionally
secured by a pledge of the capital stock of HELIOS Kliniken
GmbH, in favor of the lenders.
The 2013 Senior Credit Agreement contains a number of
customary affirmative and negative covenants and other
payment restrictions. These covenants include limitations on
liens, sale of assets, incurrence of debt, investments and
acquisitions and restrictions on the payment of dividends,
among other items. The 2013 Senior Credit Agreement also
includes financial covenants – as defined in the agreement –
that require Fresenius SE & Co. KGaA and its subsidiaries
(other than Fresenius Medical Care and its subsidiaries) to
maintain a maximum leverage ratio and a minimum interest
coverage ratio.
As of December 31, 2014, the Fresenius Group was in
compliance with all covenants under the 2013 Senior Credit
Agreement.
bridge financing facilityOn October 15, 2013, Fresenius SE & Co. KGaA entered into a
Bridge Financing Facility in the amount of € 1,800 million with
a group of banks. The Bridge Financing Facility was guaran-
teed by Fresenius ProServe GmbH and Fresenius Kabi AG. The
Bridge Financing Facility had been drawn in an amount of
€ 1,500 million on December 30, 2013. The proceeds were
used for advances made in the amount of € 2,178 million under
a fiduciary arrangement for the acquisition of hospitals and
outpatient facilities of Rhön-Klinikum AG.
The Bridge Financing Facility initially had a one year tenor
and had to be mandatorily reduced by the net proceeds of
any capital markets transaction. In line with these provisions,
the facility has been reduced by the net proceeds of the
€ 1,200 million Senior Notes issuances as well as the US$ 300
million Senior Notes issuance that were made in January
and February 2014. For more information, see note 22, Senior
Notes. Due to the refinancing, this portion of the Bridge
Financing Facility in the amount of € 1,410 million is shown
under long-term debt in the consolidated statement of finan-
cial position at December 31, 2013. On February 27, 2014,
the Bridge Financing Facility was voluntarily cancelled before
maturity and the remaining outstanding amount of € 90 mil-
lion was prepaid.
euro NotesAs of December 31, Euro Notes (Schuldscheindarlehen) of the Fresenius Group consisted of the following:
Book value / nominal value€ in millions
Maturity Interest rate 2014 2013
Fresenius Finance B.V. 2008 / 2014 April 2, 2014 5.98% 0 112
Fresenius Finance B.V. 2008 / 2014 April 2, 2014 variable 0 88
Fresenius Finance B.V. 2007 / 2014 July 2, 2014 5.75% 0 38
Fresenius Finance B.V. 2007 / 2014 July 2, 2014 variable 0 62
Fresenius SE & Co. KGaA 2012 / 2016 April 4, 2016 3.36% 156 156
Fresenius SE & Co. KGaA 2012 / 2016 April 4, 2016 variable 129 129
Fresenius SE & Co. KGaA 2013 / 2017 Aug. 22, 2017 2.65% 51 51
Fresenius SE & Co. KGaA 2013 / 2017 Aug. 22, 2017 variable 74 74
Fresenius SE & Co. KGaA 2014 / 2018 April 2, 2018 2.09% 97 0
Fresenius SE & Co. KGaA 2014 / 2018 April 2, 2018 variable 76 0
Fresenius SE & Co. KGaA 2014 / 2018 April 2, 2018 variable 65 0
Fresenius SE & Co. KGaA 2012 / 2018 April 4, 2018 4.09% 72 72
Fresenius SE & Co. KGaA 2012 / 2018 April 4, 2018 variable 43 43
Fresenius SE & Co. KGaA 2014 / 2020 April 2, 2020 2.67% 106 0
Fresenius SE & Co. KGaA 2014 / 2020 April 2, 2020 variable 55 0
Fresenius SE & Co. KGaA 2014 / 2020 April 2, 2020 variable 101 0
Fresenius Medical Care AG & Co. KGaA 2009 / 2014 Oct. 27, 2014 8.38% 0 11
Fresenius Medical Care AG & Co. KGaA 2009 / 2014 Oct. 27, 2014 variable 0 23
euro Notes 1,025 859

135
Fin
anci
al S
tate
men
ts
consolidated financial statements Notes on the consolidated statement of financial position
The Euro Notes issued by Fresenius Finance B.V. in the amount
of € 300 million, which were due in April and July 2014, were
repaid as scheduled. Fresenius SE & Co. KGaA issued Euro
Notes in the amount of € 334 million for the refinancing of the
€ 300 million Euro Notes as well as for general corporate
purposes on April 2, 2014. In addition, an agreement for the
issuance of further Euro Notes in an amount of € 166 million
was reached. These additional Euro Notes were issued on
July 2, 2014.
On February 22, 2013, Fresenius SE & Co. KGaA issued
Euro Notes in an amount of € 125 million. Proceeds were used
for general corporate purposes.
The Euro Notes issued by Fresenius Medical Care AG & Co.
KGaA in the amount of € 28 million, which were due on Octo-
ber 27, 2014, were repaid as scheduled.
The Euro Notes of Fresenius SE & Co. KGaA are guaran-
teed by Fresenius Kabi AG and Fresenius ProServe GmbH.
The Euro Notes of FMC-AG & Co. KGaA were guaranteed by
Fresenius Medical Care Holdings, Inc. and Fresenius Medical
Care Deutschland GmbH.
As of December 31, 2014, the Fresenius Group was in
compliance with all of its covenants under the Euro Notes.
european investment bank agreements Various subsidiaries of the Fresenius Group maintain credit facilities with the European Investment Bank (EIB).
The following table shows the amounts outstanding under the EIB facilities as of December 31:
Book value € in millions
Maturity 2014 2013
Fresenius Medical Care AG & Co. KGaA 2013 / 2014 0 140
HELIOS Kliniken GmbH 2019 40 48
loans from eib 40 188
The EIB is the not-for-profit long-term lending institution
of the European Union and loans funds at favorable rates for
the purpose of specific capital investment and research and
development projects. The facilities were granted to finance
certain research and development projects, to invest in the
expansion and optimization of existing production facilities
in Germany and for the construction of a hospital.
Repayment of the loan of HELIOS Kliniken GmbH already
started in December 2007 and will continue through Decem-
ber 2019 with constant half-yearly payments.
On June 14, 2013, € 96 million borrowings of Fresenius SE &
Co. KGaA and US$ 91 million borrowings of FMC-AG & Co.
KGaA were due. The loans were repaid as scheduled. In addi-
tion, loans borrowed by Fresenius SE & Co. KGaA of € 100 mil-
lion and FMC-AG & Co. KGaA of US$ 49 million, which were
due at September 10 and 13, 2013, respectively, were repaid
as scheduled.
The loans borrowed by FMC-AG & Co. KGaA, which were
due at February 3 and 17, 2014, respectively, were repaid as
scheduled.
As of December 31, 2014, the Fresenius Group was in
compliance with the covenants contained in the remaining
outstanding loan agreements.

Consolidated Financial Statements136
Financial S
tatements
accounts receivable facility of fresenius medical careOn November 24, 2014, the asset securitization facility
(accounts receivable facility) of Fresenius Medical Care was
refinanced for a term expiring on November 24, 2017 with
available borrowings of US$ 800 million.
At December 31, 2014, there were outstanding borrowings
under the accounts receivable facility of US$ 342 million (€ 281
million) (2013: US$ 351 million (€ 255 million)). Fresenius
Medical Care also had letters of credit outstanding in the
amount of US$ 67 million (€ 55 million) at December 31, 2014.
These letters of credit were not included above as part of
the balance outstanding at December 31, 2014, however, they
reduce available borrowings under the accounts receivable
facility.
Under the accounts receivable facility, certain receivables
are sold to NMC Funding Corp. (NMC Funding), a wholly
owned subsidiary of Fresenius Medical Care. NMC Funding
then assigns percentage ownership interests in the accounts
receivable to certain bank investors. Under the terms of
the accounts receivable facility, NMC Funding retains the right,
at any time, to recall all the then outstanding transferred
interests in the accounts receivable. Consequently, the receiv-
ables remain on the consolidated statement of financial posi-
tion and the proceeds from the transfer of percentage owner-
ship interests are recorded as long-term debt.
NMC Funding pays interest to the bank investors, calculated
based on the commercial paper rates for the particular
tranches selected. The average interest rate during 2014 was
1.052%. Refinancing fees, which include legal costs and
bank fees, are amortized over the term of the facility.
credit liNes
In addition to the financial liabilities described before, the
Fresenius Group maintains additional credit facilities which
have not been utilized, or have only been utilized in part, as
of the reporting date. At December 31, 2014, the additional
financial cushion resulting from unutilized credit facilities
was approximately € 3.3 billion.
Syndicated credit facilities accounted for € 2.3 billion. This
portion is comprised of the Fresenius Medical Care 2012
Credit Agreement in the amount of US$ 1,443 million (€ 1,188
million) and the 2013 Senior Credit Agreement in the amount
of US$ 1,393 million (€ 1,147 million). Furthermore, bilateral
facili ties of approximately € 970 million were available. They
include credit facilities which certain entities of the Fresenius
Group have arranged with commercial banks. These credit
facilities are used for general corporate purposes and are usu-
ally unsecured.
In addition, Fresenius SE & Co. KGaA has a commercial
paper program under which up to € 1,000 million in short-term
notes can be issued. As of December 31, 2014, the commer-
cial paper program was not utilized.
Additional financing of up to US$ 800 million can be pro-
vided using the Fresenius Medical Care accounts receivable
facility which had been utilized in the amount of US$ 409 mil-
lion as of December 31, 2014.

137
Fin
anci
al S
tate
men
ts
consolidated financial statements Notes on the consolidated statement of financial position
22. seNior NotesAs of December 31, Senior Notes of the Fresenius Group consisted of the following:
Book value € in millions
Notional amount Maturity Interest rate 2014 2013
Fresenius Finance B.V. 2014 / 2019 € 300 million Feb. 1, 2019 2.375% 299 0
Fresenius Finance B.V. 2012 / 2019 € 500 million Apr. 15, 2019 4.25% 500 500
Fresenius Finance B.V. 2013 / 2020 € 500 million July 15, 2020 2.875% 500 500
Fresenius Finance B.V. 2014 / 2021 € 450 million Feb. 1, 2021 3.00% 445 0
Fresenius Finance B.V. 2014 / 2024 € 450 million Feb. 1, 2024 4.00% 453 0
Fresenius US Finance II, Inc. 2009 / 2015 € 275 million July 15, 2015 8.75% 273 270
Fresenius US Finance II, Inc. 2009 / 2015 US$ 500 million July 15, 2015 9.00% 409 357
Fresenius US Finance II, Inc. 2014 / 2021 US$ 300 million Feb. 1, 2021 4.25% 247 0
FMC Finance VI S.A. 2010 / 2016 € 250 million July 15, 2016 5.50% 249 249
FMC Finance VII S.A. 2011 / 2021 € 300 million Feb. 15, 2021 5.25% 297 295
FMC Finance VIII S.A. 2011 / 2016 € 100 million Oct. 15, 2016 variable 100 100
FMC Finance VIII S.A. 2011 / 2018 € 400 million Sept. 15, 2018 6.50% 397 396
FMC Finance VIII S.A. 2012 / 2019 € 250 million July 31, 2019 5.25% 245 243
Fresenius Medical Care US Finance, Inc. 2007 / 2017 US$ 500 million July 15, 2017 6.875% 410 360
Fresenius Medical Care US Finance, Inc. 2011 / 2021 US$ 650 million Feb. 15, 2021 5.75% 532 468
Fresenius Medical Care US Finance II, Inc. 2011 / 2018 US$ 400 million Sept. 15, 2018 6.50% 327 287
Fresenius Medical Care US Finance II, Inc. 2012 / 2019 US$ 800 million July 31, 2019 5.625% 659 580
Fresenius Medical Care US Finance II, Inc. 2014 / 2020 US$ 500 million Oct. 15, 2020 4.125% 411 0
Fresenius Medical Care US Finance II, Inc. 2012 / 2022 US$ 700 million Jan. 31, 2022 5.875% 577 508
Fresenius Medical Care US Finance II, Inc. 2014 / 2024 US$ 400 million Oct. 15, 2024 4.75% 329 0
senior Notes 7,659 5,113
All Senior Notes included in the table are unsecured.
On January 23, 2014, Fresenius Finance B.V. issued unsecured
Senior Notes of € 750 million. The € 300 million tranche due
2019 has a coupon of 2.375% and was issued at a price of
99.647%. The € 450 million tranche which has a coupon of
3.00% was issued at a price of 98.751% and is due in 2021.
Moreover, Fresenius Finance B.V. placed € 300 million of
unsecured Senior Notes with a maturity of 10 years on Janu-
ary 28, 2014. The Senior Notes have a coupon of 4.00% and
were placed at par. On February 6, 2014, these Senior Notes
were increased by an amount of € 150 million at a price of
102%. The Senior Notes in the nominal amount of € 450 mil-
lion were issued on February 11, 2014.
Furthermore, on February 14, 2014, Fresenius US Finance
II, Inc. issued US$ 300 million of unsecured Senior Notes
with a maturity of seven years. The Senior Notes have a cou-
pon of 4.25% and were issued at par.
Net proceeds of the Senior Notes issued in January and Feb-
ruary 2014 were used to partially refinance the drawing
under the Bridge Financing Facility. On February 27, 2014,
the Bridge Financing Facility was voluntarily cancelled
before maturity and the remaining outstanding amount of
€ 90 million was repaid.
On January 7, 2013, Fresenius announced the early
redemption of the 5.5% Senior Notes due in 2016 that were
issued in 2006. The aggregate principal amount of € 650 mil-
lion was completely repaid on February 7, 2013 at a price
of 100.916% plus accrued and unpaid interest. Initially, the
redemption was financed by utilizing existing credit lines.
Starting end of June 2013, the 2013 Senior Credit Agreement
was used for the refinancing.
On January 24, 2013, Fresenius Finance B.V. issued unse-
cured Senior Notes of € 500 million at par which are due in
2020. Net proceeds were used to refinance the Senior Notes
which were due in January 2013.

Consolidated Financial Statements138
Financial S
tatements
The Senior Notes issued by Fresenius US Finance II, Inc.
which are due on July 15, 2015 are shown as current portion
of Senior Notes in the consolidated statement of financial
position.
All Senior Notes of Fresenius Finance B.V. and of Fresenius
US Finance II, Inc. are guaranteed by Fresenius SE & Co. KGaA,
Fresenius Kabi AG and Fresenius ProServe GmbH. The hold-
ers have the right to request that the issuers repurchase the
Senior Notes at 101% of principal plus accrued interest upon
the occurrence of a change of control followed by a decline
in the rating of the respective Senior Notes. All Senior Notes of
Fresenius Finance B.V. and of Fresenius US Finance II, Inc.
may be redeemed prior to their maturity at the option of the
issuers at a price of 100% plus accrued interest and a pre-
mium calculated pursuant to the terms of the indentures under
observ ance of certain notice periods.
Fresenius SE & Co. KGaA has agreed to a number of
covenants to provide protection to the bondholders, which,
under certain circumstances, partly restrict the scope of
action of Fresenius SE & Co. KGaA and its subsidiaries (exclud-
ing Fresenius Medical Care AG & Co. KGaA (FMC-AG & Co.
KGaA) and its subsidiaries). These covenants include restric-
tions on further debt that can be raised, the payment of
dividends, investments, the redemption of subor dinated lia-
bilities and the mortgaging or sale of assets, among other
items. Some of these restrictions are lifted automatically when
the rating of the respective Senior Notes reaches invest-
ment grade. In the event of non-compliance with certain terms
of the Senior Notes, the bondholders (owning in aggregate
more than 25% of the outstanding Senior Notes) are entitled
to call the Senior Notes and demand immediate repayment
plus interest. As of December 31, 2014, the Fresenius Group
was in compliance with all of its covenants.
On October 29, 2014, Fresenius Medical Care US
Finance II, Inc., issued US$ 500 million and US$ 400 million
US$-denominated unsecured Senior Notes to repay a short-
term loan under the Fresenius Medical Care 2012 Credit
Agreement as well as other short-term debt, and for acquisi-
tions and general corporate purposes. The Senior Notes were
issued at par.
The Senior Notes of Fresenius Medical Care US Finance,
Inc., Fresenius Medical Care US Finance II, Inc., FMC
Finance VI S.A., FMC Finance VII S.A. and FMC Finance VIII
S.A. (wholly owned subsidiaries of FMC-AG & Co. KGaA)
are guaranteed on a senior basis jointly and severally by
FMC-AG & Co. KGaA, Fresenius Medical Care Holdings, Inc. and
Fresenius Medical Care Deutschland GmbH. The holders have
the right to request that the respective issuers repurchase
the respective Senior Notes at 101% of principal plus accrued
interest upon the occurrence of a change of control of
FMC-AG & Co. KGaA followed by a decline in the rating of the
respective Senior Notes. The issuers may redeem the Senior
Notes (except for the floating-rate Senior Notes of FMC
Finance VIII S.A.) at any time at 100% of principal plus
accrued interest and a premium calculated pursuant to the
terms of the indentures.
FMC-AG & Co. KGaA has agreed to a number of covenants
to provide protection to the holders which, under certain
circumstances, limit the ability of FMC-AG & Co. KGaA and its
subsidiaries to, among other things, incur debt, incur liens,
engage in sale and leaseback transactions and merge or con-
solidate with other companies or sell assets. As of Decem-
ber 31, 2014, FMC-AG & Co. KGaA and its subsidiaries were in
compliance with all of their covenants under the Senior Notes.
23. coNvertible boNds
freseNiUs se & co. KGaa
On March 18, 2014, Fresenius SE & Co. KGaA placed € 500 mil-
lion equity-neutral convertible bonds due 2019. The bonds
were issued at par. The coupon was fixed at 0%, the initial
conversion price has been determined at € 149.3786. This
represented a 35% premium over the reference share price
of € 110.65081. The reference share price has been deter-
mined as the arithmetic average of Fresenius’ daily volume-
weighted average Xetra share prices over a period of 10 con-
secutive Xetra trading days, starting on March 19, 2014.

139
Fin
anci
al S
tate
men
ts
consolidated financial statements Notes on the consolidated statement of financial position
Net proceeds were used to partially fund the acquisition of
hospitals and outpatient facilities of Rhön-Klinikum AG. Due
to the dividend payment in May 2014 and the capital increase
from company’s funds in August 2014, the conversion price
was adjusted. Accordingly, at December 31, 2014, the conver-
sion price was € 49.7249.
The fair value of the derivative embedded in the con-
vertible bonds was € 91 million at December 31, 2014.
Fresenius SE & Co. KGaA has purchased stock options (call
options) to secure against future fair value fluctuations
of this derivative. The call options also had an aggregate
fair value of € 91 million at December 31, 2014.
The conversion will be cash-settled. Any increase of
Fresenius’ share price above the conversion price would be
offset by a corresponding value increase of the call options.
The derivative embedded in the convertible bonds and
the call options are recognized in other non-current liabilities /
assets in the consolidated statement of financial position.
freseNiUs medical care aG & co. KGaa
On September 19, 2014, Fresenius Medical Care AG & Co.
KGaA (FMC-AG & Co. KGaA) placed € 400 million equity-neutral
convertible bonds due 2020. The bonds were issued at par.
The coupon was fixed at 1.125%, the initial conversion price
has been determined at € 73.6448. This represented a 35%
premium over the reference share price of € 54.55171. The
reference share price has been determined as the arithmetic
average of Fresenius Medical Care’s daily volume-weighted
average Xetra share prices over a period of 15 consecutive
Xetra trading days, starting on September 17, 2014. Net pro-
ceeds were used for general corporate purposes.
The fair value of the derivative embedded in the convert-
ible bonds was € 54 million at December 31, 2014. FMC-AG &
Co. KGaA has purchased stock options (call options) to secure
against future fair value fluctuations of this derivative. The
call options also had an aggregate fair value of € 54 million at
December 31, 2014.
The conversion will be cash-settled. Any increase of
Fresenius Medical Care’s share price above the conversion
price would be offset by a corresponding value increase of
the call options.
The derivative embedded in the convertible bonds and
the call options are recognized in other non-current liabilities /
assets in the consolidated statement of financial position.
24. peNsioNs aNd similar obliGatioNs
GeNeral
The Fresenius Group recognizes pension costs and related
pension liabilities for current and future benefits to quali-
fied current and former employees of the Fresenius Group.
Fresenius Group’s pension plans are structured in accor-
dance with the differing legal, economic and fiscal circum-
stances in each country. The Fresenius Group currently has
two types of plans, defined benefit and defined contribution
plans. In general, plan benefits in defined benefit plans are
based on all or a portion of the employees’ years of services
and final salary. Plan benefits in defined contribution plans
are determined by the amount of contribution by the employee
and the employer, both of which may be limited by legis-
lation, and the returns earned on the investment of those con-
tributions.
Upon retirement under defined benefit plans, the Fresenius
Group is required to pay defined benefits to former employ-
ees when the defined benefits become due. Defined benefit
plans may be funded or unfunded. The Fresenius Group has
funded defined benefit plans in particular in the United States,
Norway, the United Kingdom, the Netherlands and Austria.
Unfunded defined benefit plans are located in Germany and
France.

Consolidated Financial Statements140
Financial S
tatements
Actuarial assumptions generally determine benefit obliga-
tions under defined benefit plans. The actuarial calculations
require the use of estimates. The main factors used in the
actuarial calculations affecting the level of the benefit obliga-
tions are: assumptions on life expectancy, the discount rate
and future salary and benefit levels. Under Fresenius Group’s
funded plans, assets are set aside to meet future payment
obligations. An estimated return on the plan assets is recog-
nized as income in the respective period. Actuarial gains and
losses are generated when there are variations in the actu-
arial assumptions and by differences between the actual and
the estimated projected benefit obligations and the return
on plan assets for that year. A company’s pension liability is
impacted by these actuarial gains or losses.
Related to defined benefit plans, the Fresenius Group is
exposed to certain risks. Besides general actuarial risks, e. g.
the longevity risk and the interest rate risk, the Fresenius
Group is exposed to market risk as well as to investment risk.
In the case of Fresenius Group’s funded plans, the
defined benefit obligation is offset against the fair value of plan
assets (funded status). A pension liability is recognized in
the consolidated statement of financial position if the defined
benefit obligation exceeds the fair value of plan assets. An
asset is recognized and reported under other assets in the con-
solidated statement of financial position if the fair value of
plan assets exceeds the defined benefit obligation and if the
Fresenius Group has a right of reimbursement against the
fund or a right to reduce future payments to the fund.
Under defined contribution plans, the Fresenius Group pays
defined contributions to an independent third party as
directed by the employee during the employee’s service life
which satisfies all obligations of the Fresenius Group to
the employee. The employee retains all rights to the contri-
butions made by the employee and to the vested portion
of the Fresenius Group paid contributions upon leaving the
Fresenius Group. The Fresenius Group has a main defined
contribution plan in the United States.
defiNed beNefit peNsioN plaNs
At December 31, 2014, the projected benefit obligation (PBO)
of the Fresenius Group of € 1,472 million (2013: € 1,020 mil-
lion) included € 391 million (2013: € 312 million) funded by
plan assets and € 1,081 million (2013: € 708 million) covered
by pension provisions. Furthermore, the pension liability
contains benefit obligations offered by other subsidiaries of
Fresenius Medical Care in an amount of € 35 million (2013:
€ 21 million). The current portion of the pension liability in an
amount of € 17 million is recognized in the consolidated
statement of financial position within short-term accrued
expenses and other short-term liabilities. The non-current por-
tion of € 1,099 million is recorded as pension liability.
The major part of pension liabilities relates to Germany.
At December 31, 2014, 70% of the pension liabilities were
recognized in Germany and 30% predominantly in the rest of
Europe and North America. 57% of the beneficiaries were
located in North America, 31% in Germany and the remainder
throughout the rest of Europe and other continents.
61% of the pension liabilities in an amount of € 1,116 mil-
lion relate to the “Versorgungsordnung der Fresenius-Unter-
nehmen” established in 1988 (Pension plan 1988), which
applies for most of the German entities of the Fresenius Group
except Fresenius Helios. The rest of the pension liabilities
relates to individual plans from Fresenius Helios entities in
Germany and non-German Group entities.

141
Fin
anci
al S
tate
men
ts
consolidated financial statements Notes on the consolidated statement of financial position
Plan benefits are generally based on an employee’s years of
service and final salary. Consistent with predominant practice
in Germany, the benefit obligations of the German entities of
the Fresenius Group are unfunded. The German Pension Plan
1988 does not have a separate pension fund.
Fresenius Medical Care Holdings, Inc. (FMCH), a subsid-
iary of Fresenius Medical Care AG & Co. KGaA, has a defined
ben efit pension plan for its employees in the United States
and supplemental executive retirement plans. During the first
quarter of 2002, FMCH curtailed these pension plans. Under
the curtailment amendment for substantially all employees
eligible to participate in the plan, benefits have been frozen
as of the curtailment date and no additional defined benefits
for future services will be earned. FMCH has retained all
employee benefit obligations as of the curtailment date. Each
year, FMCH contributes at least the minimum amount required
by the Employee Retirement Income Security Act of 1974,
as amended. In 2014, FMCH’s minimum funding requirement
was US$ 21 million (€ 16 million). In addition to the compul-
sory con tributions, FMCH voluntarily provided US$ 21 million
(€ 16 million) to the defined benefit plan. Expected funding
for 2015 is US$ 20 million (€ 17 million).
Benefit plans offered by other subsidiaries of Fresenius
Medical Care outside of the United States and Germany
contain separate benefit obligations. The total pension liabil-
ity for these other plans was € 35 million and € 21 million
at December 31, 2014 and 2013, respectively, and consists of
a pension asset of € 56 thousand (2013: € 56 thousand) rec-
ognized as other non-current assets and a current pension lia-
bility of € 2 million (2013: € 1 million), which is recognized as
a current liability in the line item short-term accrued expenses
and other short-term liabilities. The non-current pension lia-
bility of € 33 million (2013: € 20 million) for these plans is
recorded as pension liability in the consolidated statement of
financial position.
Fresenius Group’s benefit obligations relating to fully or partly
funded pension plans were € 638 million. Benefit obligations
relating to unfunded pension plans were € 834 million.
The following table shows the changes in benefit obliga-
tions, the changes in plan assets, the funded status of the
pension plans and the pension liability. Benefits paid as shown
in the changes in benefit obligations represent payments
made from both the funded and unfunded plans while the ben-
efits paid as shown in the changes in plan assets include
only benefit payments from Fresenius Group’s funded benefit
plans.
The pension liability has developed as follows:
€ in millions 2014 2013
benefit obligations at the beginning of the year 1,020 986
Changes in entities consolidated 17 6
Foreign currency translation 50 - 15
Service cost 35 30
Prior service cost - 1 1
Interest cost 43 39
Contributions by plan participants 2 2
Transfer of plan participants – 3
Curtailments / settlements - 2 - 5
Actuarial losses 339 –
Benefits paid - 31 - 27
benefit obligations at the end of the year 1,472 1,020
thereof vested 1,242 868
fair value of plan assets at the beginning of the year 312 294
Changes in entities consolidated 7 –
Foreign currency translation 29 - 9
Actual return on plan assets 19 25
Contributions by the employer 40 15
Contributions by plan participants 2 2
Settlements - 1 - 4
Transfer of plan participants – 3
Benefits paid - 17 - 14
fair value of plan assets at the end of the year 391 312
funded status as of december 31 1,081 708
Benefit plans offered by other subsidiaries 35 21
pension liability as of december 31 1,116 729

Consolidated Financial Statements142
Financial S
tatements
As of December 31, 2014 and December 31, 2013, the fair
value of plan assets did not exceed the benefit obligations in
any pension plan.
The discount rates for all plans are based upon yields of
portfolios of equity and highly rated debt instruments with
matur ities that mirror the plan’s benefit obligation. Fresenius
Group’s discount rate is the weighted average of these plans
based upon their benefit obligations.
The following weighted-average assumptions were utilized
in determining benefit obligations as of December 31:
in % 2014 2013
Discount rate 2.77 4.09
Rate of compensation increase 3.00 3.09
Rate of pension increase 1.63 1.67
Mainly changes in the discount factor, as well as inflation
and mortality assumptions used for the actuarial computation
resulted in actuarial losses in 2014 which increased the fair
value of the defined benefit obligation. Unrecognized actu arial
losses were € 634 million (2013: € 293 million).
sensitivity analysisIncreases and decreases in principal actuarial assumptions
by 0.5 percentage points would affect the pension liability as
of December 31, 2014 as follows:
Development of pension liability € in millions0.5 pp
increase0.5 pp
decrease
Discount rate - 130 149
Rate of compensation increase 21 - 21
Rate of pension increase 72 - 64
The sensitivity analysis was calculated based on the average
duration of the pension obligations determined at Decem-
ber 31, 2014. The calculations were performed isolated for
each significant actuarial parameter, in order to show the
effect on the fair value of the pension liability separately. The
sensitivity analysis for compensation increases and for pen-
sion increases excludes the U.S. pension plan, because it is
frozen and therefore is not affected by changes from these
two actuarial assumptions.
At December 31, 2014, the accumulated benefit obliga-
tions for all defined benefit pension plans were € 1,344 million
(2013: € 935 million).
The following table relates to pension plans with pro-
jected benefit obligations and accumulated benefit obligations
in excess of plan assets:
€ in millions 2014 2013
Projected benefit obligation (PBO) 1,472 1,020
Accumulated benefit obligation (ABO) 1,344 935
Fair value of plan assets 391 312

143
Fin
anci
al S
tate
men
ts
consolidated financial statements Notes on the consolidated statement of financial position
The pre-tax changes of other comprehensive income (loss) relating to pension liabilities during the years 2014
and 2013 are shown in the following tables:
€ in millionsAs of
Jan. 1, 2014 Reclassifications 1 AdditionsForeign currency
translationas of
dec. 31, 2014
Actuarial gains and losses - 293 20 - 339 - 22 - 634
Prior service cost - 1 1 – – –
Transition obligation – – – – –
adjustments related to pension liabilities - 294 21 - 339 - 22 - 634
1 Effects recognized in the consolidated statement of income
€ in millionsAs of
Jan. 1, 2013 Reclassifications 1 AdditionsForeign currency
translationas of
dec. 31, 2013
Actuarial gains and losses - 329 23 8 5 - 293
Prior service cost - 1 1 - 1 – - 1
Transition obligation - 1 1 – – –
adjustments related to pension liabilities - 331 25 7 5 - 294
1 Effects recognized in the consolidated statement of income
For the tax effects on other comprehensive income at Decem-
ber 31, 2014 see note 27, Other comprehensive income (loss).
The Fresenius Group expects the following amounts to
be amortized from other comprehensive income into net peri-
odic pension cost in the year 2015:
€ in millions 2015
Actuarial gains and losses 39
Prior service cost 1
Transition obligation –
Defined benefit pension plans’ net periodic benefit costs of
€ 80 million (2013: € 78 million) were comprised of the follow-
ing components:
€ in millions 2014 2013
Service cost 35 30
Interest cost 43 39
Expected return on plan assets - 19 - 16
Amortization of unrealized actuarial losses, net 20 23
Amortization of prior service costs 1 1
Amortization of transition obligations – 1
Settlement loss – –
Net periodic benefit cost 80 78
Net periodic benefit cost is allocated as personnel expense
within cost of sales or selling, general and administrative
expenses as well as research and development expenses. The
allocation depends upon the area in which the beneficiary
is employed.
The following weighted-average assumptions were used
in determining net periodic benefit cost for the year ended
December 31:
in % 2014 2013
Discount rate 4.09 4.10
Expected return of plan assets 4.71 4.99
Rate of compensation increase 3.09 3.13
Rate of pension increase 1.67 1.68
The following table shows the expected benefit payments for
the next 10 years:
for the fiscal years € in millions
2015 34
2016 38
2017 39
2018 41
2019 44
2020 to 2024 273
total expected benefit payments 469
At December 31, 2014, the weighted-average duration of the
defined benefit obligation was 19 years (December 31, 2013:
20 years).
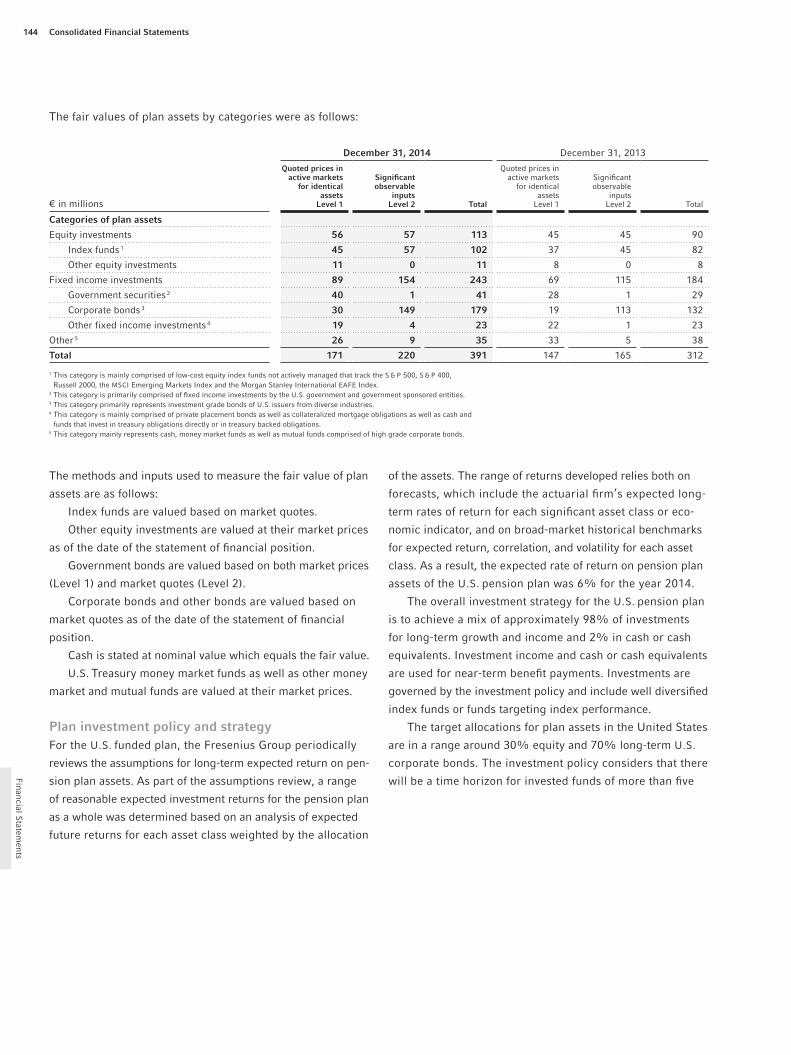
Consolidated Financial Statements144
Financial S
tatements
The fair values of plan assets by categories were as follows:
december 31, 2014 December 31, 2013
€ in millions
quoted prices in active markets
for identical assets
level 1
significant observable
inputslevel 2 total
quoted prices in active markets
for identical assets
Level 1
Significant observable
inputsLevel 2 Total
categories of plan assets
Equity investments 56 57 113 45 45 90
Index funds 1 45 57 102 37 45 82
Other equity investments 11 0 11 8 0 8
Fixed income investments 89 154 243 69 115 184
Government securities 2 40 1 41 28 1 29
Corporate bonds 3 30 149 179 19 113 132
Other fixed income investments 4 19 4 23 22 1 23
Other 5 26 9 35 33 5 38
total 171 220 391 147 165 312
1 This category is mainly comprised of low-cost equity index funds not actively managed that track the S & P 500, S & P 400, Russell 2000, the MSCI Emerging Markets Index and the Morgan Stanley International EAFE Index.
2 This category is primarily comprised of fixed income investments by the U.S. government and government sponsored entities.3 This category primarily represents investment grade bonds of U.S. issuers from diverse industries.4 This category is mainly comprised of private placement bonds as well as collateralized mortgage obligations as well as cash and
funds that invest in treasury obligations directly or in treasury backed obligations.5 This category mainly represents cash, money market funds as well as mutual funds comprised of high grade corporate bonds.
The methods and inputs used to measure the fair value of plan
assets are as follows:
Index funds are valued based on market quotes.
Other equity investments are valued at their market prices
as of the date of the statement of financial position.
Government bonds are valued based on both market prices
(Level 1) and market quotes (Level 2).
Corporate bonds and other bonds are valued based on
market quotes as of the date of the statement of financial
position.
Cash is stated at nominal value which equals the fair value.
U.S. Treasury money market funds as well as other money
market and mutual funds are valued at their market prices.
plan investment policy and strategyFor the U.S. funded plan, the Fresenius Group periodically
reviews the assumptions for long-term expected return on pen-
sion plan assets. As part of the assumptions review, a range
of reasonable expected investment returns for the pension plan
as a whole was determined based on an analysis of expected
future returns for each asset class weighted by the allocation
of the assets. The range of returns developed relies both on
forecasts, which include the actuarial firm’s expected long-
term rates of return for each significant asset class or eco-
nomic indicator, and on broad-market historical benchmarks
for expected return, correlation, and volatility for each asset
class. As a result, the expected rate of return on pension plan
assets of the U.S. pension plan was 6% for the year 2014.
The overall investment strategy for the U.S. pension plan
is to achieve a mix of approximately 98% of investments
for long-term growth and income and 2% in cash or cash
equivalents. Investment income and cash or cash equivalents
are used for near-term benefit payments. Investments are
governed by the investment policy and include well diversified
index funds or funds targeting index performance.
The target allocations for plan assets in the United States
are in a range around 30% equity and 70% long-term U.S.
corporate bonds. The investment policy considers that there
will be a time horizon for invested funds of more than five

145
Fin
anci
al S
tate
men
ts
consolidated financial statements Notes on the consolidated statement of financial position
years. The total portfolio will be measured against a custom
index that reflects the asset class benchmarks and the target
asset allocation. The plan policy does not allow investments in
securities of Fresenius Medical Care AG & Co. KGaA or other
related party securities. The performance benchmarks for the
separate asset classes include: S & P 500 Index, S & P 400
Mid Cap Index, Russell 2000 Index, MSCI EAFE Index, MSCI
Emerging Markets Index and Barclays Capital Long-Corpo-
rate Bond Index.
The following schedule describes Fresenius Group’s allo-
cation for its funded plans.
in %allocation
2014Allocation
2013Target
allocation
Equity investments 28.86 28.83 31.90
Fixed income investments 61.97 58.98 61.22
Other incl. real estate 9.17 12.19 6.88
total 100.00 100.00 100.00
The overall expected long-term rate of return on assets of
the Fresenius Group amounts to 4.83% compounded annu-
ally. Contributions to plan assets for the fiscal year 2015 are
expected to amount to € 24 million.
defiNed coNtribUtioN plaNs
Fresenius Group’s total expense under defined contribution
plans for 2014 was € 121 million (2013: € 86 million). Of this
amount, € 80 million related to contributions by the Fresenius
Group to several public supplementary pension funds for
employees of Fresenius Helios. Further € 31 million related to
contributions to the U.S. savings plan, which employees of
Fresenius Medical Care Holdings, Inc. (FMCH) can join.
Following applicable collective bargaining agreements, the
Fresenius Group pays contributions for a given number of
employees of Fresenius Helios to the Rheinische zusatz ver sor-
gungskasse (a supplementary pension fund) and to other
public supplementary pension funds (together referred to as
zVK ÖD) to complement statutory retirement pensions.
Given that employees from multiple participating entities are
insured by these zVK ÖDs, these plans are Multi-Employer
plans. Employees are entitled to the benefits defined in the stat-
utes regardless of the contributed amounts.
The plan operates on a pay-as-you-earn system based on
applying a collection rate to given parts of gross remuneration.
Paid contributions are accounted for as personnel
expenses within cost of sales and selling, general and admin-
istrative expenses and amounted to € 80 million in 2014
(2013: € 47 million). Thereof, € 43 million (2013: € 24 million)
were payments to Rheinische zusatzversorgungskasse, to
Versorgungsanstalt des Bundes und der Länder and to zusatz-
versorgungskasse Wiesbaden (supplementary pension funds).
Further disclosures are either irrelevant or immaterial
for plans in supplementary pension funds or the necessary
information cannot be obtained from the zVK ÖDs without
undue cost and effort.
Under the U.S. savings plan, employees can deposit up
to 75% of their pay up to an annual maximum of US$ 17,500
if under 50 years old (US$ 23,000 if 50 or over). Fresenius
Medical Care will match 50% of the employee deposit up to
a maximum Company contribution of 3% of the employee’s
pay. Fresenius Medical Care’s total expense under this
defined contribution plan for the years ended December 31,
2014 and 2013 was € 31 million and € 29 million, respec-
tively.
25. NoNcoNtrolliNG iNterest
NoNcoNtrolliNG iNterest
sUbJect to pUt provisioNs
The Fresenius Group has potential obligations to purchase
the noncontrolling interests held by third parties in certain of
its consolidated subsidiaries. These obligations are in the
form of put provisions and are exercisable at the third-party
owners’ discretion within specified periods as outlined in
each specific put provision. If these put provisions were exer-
cised, the Fresenius Group would be required to purchase
all or part of third-party owners’ noncontrolling interests at
the appraised fair value at the time of exercise.

Consolidated Financial Statements146
Financial S
tatements
Noncontrolling interest subject to put provisions changed
as follows:
€ in millions 2014
Noncontrolling interest subject to put provisions as of January 1, 2014 472
Noncontrolling interest subject to put provisions in profit 110
Purchase of noncontrolling interest subject to put provisions 82
Dividend payments - 118
Currency effects and other changes 135
Noncontrolling interest subject to put provisions as of december 31, 2014 681
99.7% of noncontrolling interest subject to put provisions
applied to Fresenius Medical Care at December 31, 2014.
As of December 31, 2014 and 2013, put options with an
aggregate purchase obligation of € 102 million and € 86 mil-
lion, respectively, were exercisable. Three put options were
exercised for a total consideration of € 7 million in 2014
(2013: two put options for a total consideration of € 3 million).
NoNcoNtrolliNG iNterest
Not sUbJect to pUt provisioNs
As of December 31, noncontrolling interest not subject to put
provisions in the Fresenius Group was as follows:
€ in millions 2014 2013
Noncontrolling interest not subject to put provisions in Fresenius Medical Care AG & Co. KGaA 5,360 4,599
Noncontrolling interest not subject to put provisions in VAMED AG 43 38
Noncontrolling interest not subject to put provisions in the business segments
Fresenius Medical Care 482 182
Fresenius Kabi 123 126
Fresenius Helios 134 117
Fresenius Vamed 6 3
total noncontrolling interest not subject to put provisions 6,148 5,065
For further financial information relating to Fresenius
Medical Care see the consolidated segment reporting on
pages 98 to 99.
Noncontrolling interest not subject to put provisions changed
as follows:
€ in millions 2014
Noncontrolling interest not subject to put provisions as of January 1, 2014 5,065
Noncontrolling interest not subject to put provisions in profit 635
Purchase of noncontrolling interest not subject to put provisions 297
Stock options 59
Dividend payments - 240
Currency effects and other changes 332
Noncontrolling interest not subject to put provisions as of december 31, 2014 6,148
26. freseNiUs se & co. KGaa shareholders’ eqUity
sUbscribed capital
development of subscribed capitalcapital increase from company’s funds
(stock split 1 : 3)
On May 16, 2014, the Annual General Meeting of Fresenius
SE & Co. KGaA has resolved a capital increase from company’s
funds with issuance of new shares. For each existing non-
par value share, Fresenius SE & Co. KGaA issued two new non-
par value shares without additional payment to the share-
holders. Accordingly, upon execution of the capital increase,
both the subscribed capital of Fresenius SE & Co. KGaA and
the number of shares issued tripled (stock split 1 : 3).
After registration of the capital increase with the com-
mercial register on August 1, 2014, the subscribed capital
increased to € 540,511,632 (including newly created shares
due to options exercised until this date). The new shares
have full dividend entitlement for the fiscal year 2014. The pro-
portionate amount of the subscribed capital will continue to
be € 1.00 per share.
During the fiscal year 2014, 2,448,113 stock options
were exercised. Consequently, as of December 31, 2014, the
subscribed capital of Fresenius SE & Co. KGaA consisted of
541,532,600 bearer ordinary shares. The shares are issued as
non-par value shares. The proportionate amount of the sub-
scribed capital is € 1.00 per share.

147
Fin
anci
al S
tate
men
ts
consolidated financial statements Notes on the consolidated statement of financial position
Notification by shareholdersThe following table shows the notifications disclosed in 2014 in accordance with Section 26 (1) of the German Securities
Trading Act (WpHG). In cases where holdings reached, exceeded or fell below the thresholds on several occasions, only the
most recent notification is mentioned.
Notifying party
Date of reaching, exceeding or falling below Reporting threshold Attribution pursuant to WpHG
Percentage of voting rights
Number of voting rights
The Capital Group Companies, Inc.Los Angeles, United States 1 March 6, 2014 Falling below 3%
section 22 (1) sentence 1 No. 6 in connection with section 22 (1)
sentence 2 and 3 2.92 5,254,430
Commerzbank AGFrankfurt am Main, Germany May 26, 2014 Falling below 5%
thereof pursuant to sections 21, 22 thereof pursuant to section 25
thereof pursuant to section 25a
2.53 0.05 0.00 2.47
4,542,462 95,862
0 4,446,600
BlackRock Advisors Holdings, Inc.New york, United States
September 25, 2014
section 21 (1) thereof pursuant to section 22 (1)
sentence 1 No. 1 thereof pursuant to section 22 (1)
sentence 1 No. 2 in connection with sentence 2
thereof pursuant to section 22 (1) sentence 1 No. 6 in connection with
sentence 2 thereof pursuant to section 22 (1) sentence 1 No. 1 and pursuant to
section 22 (1) sentence 1 No. 6 in connection with sentence 2
3.44
1.49
0.02
1.68
0.26
18,615,308
8,053,557
87,267
9,088,675
1,385,809
BlackRock International Holdings, Inc.New york, United States
September 25, 2014
section 21 (1) thereof pursuant to section 22 (1)
sentence 1 No. 1 thereof pursuant to section 22 (1)
sentence 1 No. 2 in connection with sentence 2
thereof pursuant to section 22 (1) sentence 1 No. 6 in connection with
sentence 2 thereof pursuant to section 22 (1) sentence 1 No. 1 and pursuant to
section 22 (1) sentence 1 No. 6 in connection with sentence 2
3.44
1.49
0.02
1.68
0.26
18,615,308
8,053,557
87,267
9,088,675
1,385,809
BR Jersey International Holdings L. P.St. Helier, Jersey, Channel Islands
September 25, 2014
section 21 (1) thereof pursuant to section 22 (1)
sentence 1 No. 1 thereof pursuant to section 22 (1)
sentence 1 No. 2 in connection with sentence 2
thereof pursuant to section 22 (1) sentence 1 No. 6 in connection with
sentence 2 thereof pursuant to section 22 (1) sentence 1 No. 1 and pursuant to
section 22 (1) sentence 1 No. 6 in connection with sentence 2
3.44
1.49
0.02
1.68
0.26
18,615,308
8,053,557
87,267
9,088,675
1,385,809
BlackRock, Inc.New york, Ny, United States
November 28, 2014 Falling below 5%
pursuant to sections 21, 22 pursuant to section 25
0.00 5.95 0.00
0 32,197,886
0
BlackRock Holdco 2, Inc.Wilmington, DE, United States
November 28, 2014 Falling below 5%
pursuant to sections 21, 22 pursuant to section 25
0.00 5.85 0.00
0 31,669,646
0
BlackRock Financial Management, Inc.New york, Ny, United States
November 28, 2014 Falling below 5%
pursuant to sections 21, 22 pursuant to section 25
0.00 5.44 0.00
0 29,476,463
0
BlackRock Group LimitedLondon, Great Britain 2
December 11, 2014 Falling below 3%
section 21 (1) thereof pursuant to section 22 (1)
sentence 1 No. 1 thereof pursuant to section 22 (1)
sentence 1 No. 6 in connection with sentence 2
2.9997
1.15
2.16
16,242,207
6,231,342
11,691,115
The voting rights of the individual BlackRock companies are attributed to the controlling company BlackRock, Inc.
1 Attribution of voting rights via Capital Research and Management Company2 The total amount stated does not necessarily equal the sum of the detailed attributed holdings. This results from voting rights having multiple attributions within the BlackRock group structure.

Consolidated Financial Statements148
Financial S
tatements
The Else Kröner- Fresenius- Stiftung as major shareholder
informed Fresenius SE & Co. KGaA on December 16, 2014,
that it holds 144,695,094 ordinary shares of Fresenius SE &
Co. KGaA representing 26.72% of the subscribed capital on
December 31, 2014.
All WpHG-notifications by shareholders are published
on the website of the Company www.fresenius.com.
aUthorized capital
In connection with the stock split 1 : 3 described before, by
resolution of the Annual General Meeting on May 16, 2014,
the previous Authorized Capital I was revoked and a new
Authorized Capital I with a proportionally adjusted amount
and a five-year term was created.
In accordance with the new provision in the articles of
association of Fresenius SE & Co. KGaA, the general partner,
Fresenius Management SE, is authorized, with the approval
of the Supervisory Board, until May 15, 2019, to increase
Fresenius SE & Co. KGaA’s subscribed capital by a total amount
of up to € 120,960,000 through a single or multiple issues
of new bearer ordinary shares against cash contributions and /
or contributions in kind (Authorized Capital I).
The number of shares must increase in the same propor-
tion as the subscribed capital. A subscription right must be
granted to the shareholders in principle. In defined cases, the
general partner is authorized, with the consent of the Super-
visory Board, to decide on the exclusion of the shareholders’
subscription right (e. g. to eliminate fractional amounts). For
cash contributions, the authorization can only be exercised if
the issue price is not significantly below the stock exchange
price of the already listed shares at the time the issue price is
fixed with final effect by the general partner. Furthermore,
in case of a capital increase against cash contributions, the
proportionate amount of the shares issued with exclusion of
subscription rights may not exceed 10% of the subscribed
capital. An exclusion of subscription rights in the context of
the use of other authorizations concerning the issuance or
the sale of the shares of Fresenius SE & Co. KGaA or the issu-
ance of rights which authorize or bind to the subscription
of shares of Fresenius SE & Co. KGaA has to be taken into con-
sideration during the duration of the Authorized Capital until
its utilization. In the case of a subscription in kind, the sub-
scription right can be excluded only in order to acquire a com-
pany, parts of a company or a participation in a company.
The authorizations granted concerning the exclusion of sub-
scription rights can be used by Fresenius Management SE
only to such extent that the proportional amount of the total
number of shares issued with exclusion of the subscription
rights does not exceed 20% of the subscribed capital. An
exclusion of subscription rights in the context of the use of
other authorizations concerning the issuance or the sale of
the shares of Fresenius SE & Co. KGaA or the issuance of
rights which authorize or bind to the subscription of shares
of Fresenius SE & Co. KGaA has to be taken into consider-
ation during the duration of the Authorized Capital until its
utilization.
The changes to the Authorized Capital I became effective
upon registration with the commercial register on August 1,
2014.
coNditioNal capital
stock option plansThe following Conditional Capitals exist in order to fulfill the
subscription rights under the stock option plans of Fresenius
SE & Co. KGaA: Conditional Capital I (Stock Option Plan 2003),
Conditional Capital II (Stock Option Plan 2008) and Condi-
tional Capital IV (Stock Option Plan 2013) (see note 33, Stock
options).
Due to the stock split 1 : 3, Conditional Capitals I, II and
IV increased, by operation of law, in the same proportion as the
subscribed capital. After registration with the commercial
register on August 1, 2014, the Conditional Capital I amounted
to € 6,014,670, the Conditional Capital II to € 11,680,542 and
the Conditional Capital IV to € 25,200,000.
option bearer bonds and convertible bondsThe previous authorization to issue option bearer bonds and /
or convertible bonds (Conditional Capital III) dated May 11,
2012 was revoked by resolution of the Annual General Meet-
ing of Fresenius SE & Co. KGaA on May 16, 2014. In line with
the stock split 1 : 3, the same Annual General Meeting approved
a new Conditional Capital III with a proportionally adjusted
amount and a five-year term. The new Conditional Capital III
became effective upon registration with the commercial reg-
ister on August 1, 2014.

149
Fin
anci
al S
tate
men
ts
consolidated financial statements Notes on the consolidated statement of financial position
Accordingly, the general partner is authorized, with the
approval of the Supervisory Board, until May 15, 2019, to
issue option bearer bonds and / or convertible bearer bonds,
once or several times, for a total nominal amount of up to
€ 2.5 billion. To fulfill the granted subscription rights, the sub-
scribed capital of Fresenius SE & Co. KGaA is increased con-
ditionally by up to € 48,971,202 through issuing of up to
48,971,202 new bearer ordinary shares. The conditional cap-
ital increase shall only be implemented to the extent that
the holders of cash issued convertible bonds or of cash issued
warrants from option bonds exercise their conversion or
option rights and as long as no other forms of settlement are
used. The new bearer ordinary shares shall participate in
the profits from the start of the fiscal year in which they are
issued.
After registration with the commercial register on
August 1, 2014, the Conditional Capital III amounted to
€ 48,971,202.
The following table shows the development of the Conditional Capital:
in € ordinary shares
Conditional Capital I Fresenius AG Stock Option Plan 2003 2,111,517
Conditional Capital II Fresenius SE Stock Option Plan 2008 4,262,602
Conditional Capital III, approved on May 11, 2012 16,323,734
Conditional Capital IV Fresenius SE & Co. KGaA Stock Option Plan 2013 8,400,000
total conditional capital as of January 1, 2014 31,097,853
Fresenius AG Stock Option Plan 2003 – options exercised - 106,627
Fresenius SE Stock Option Plan 2008 – options exercised - 369,088
total conditional capital as of July 31, 2014 30,622,138
Conditional Capital I after registration of the stock split on August 1, 2014 6,014,670
Conditional Capital II after registration of the stock split on August 1, 2014 11,680,542
Conditional Capital III after registration of the stock split on August 1, 2014 48,971,202
Conditional Capital IV after registration of the stock split on August 1, 2014 25,200,000
Fresenius AG Stock Option Plan 2003 – options exercised after July 31, 2014 - 241,614
Fresenius SE Stock Option Plan 2008 – options exercised after July 31, 2014 - 779,354
total conditional capital as of december 31, 2014 90,845,446
capital reserves
Capital reserves are comprised of the premium paid on the
issue of shares and the exercise of stock options (additional
paid-in capital).
In connection with the capital increase from company’s
funds, the capital reserves were reduced by € 360,341,088
due to a conversion of a portion of the capital reserves into
subscribed capital.
other reserves
Other reserves are comprised of earnings generated by
Group entities in prior years to the extent that they have not
been distributed.
divideNds
Under the German Stock Corporation Act (AktG), the
amount of dividends available for distribution to shareholders
is based upon the unconsolidated retained earnings of
Fresenius SE & Co. KGaA as reported in its statement of finan-
cial position determined in accordance with the German
Commercial Code (HGB).
In May 2014, a dividend of € 1.25 per bearer ordinary share
was approved by Fresenius SE & Co. KGaA’s shareholders at
the Annual General Meeting and paid. The total dividend pay-
ment was € 224.6 million.
share bUy-bacK proGram of
freseNiUs medical care
Fresenius Medical Care completed a share buy-back pro-
gram during the third quarter of 2013. When the program
ended on August 14, 2013, 7,548,951 ordinary shares had
been repurchased in the intended amount of € 385 million
(US$ 505 million).
At December 31, 2014, Fresenius SE & Co. KGaA owned
31.09% of the ordinary voting shares of Fresenius Medical
Care AG & Co. KGaA (December 31, 2013: 31.31%).

Consolidated Financial Statements150
Financial S
tatements
27. other compreheNsive iNcome (loss)Other comprehensive income (loss) is comprised of all
amounts recognized directly in equity (net of tax) resulting
from the currency translation of foreign subsidiaries’ financial
statements and the effects of measuring financial instruments
at their fair value as well as the change in benefit obligation.
Changes in the components of other comprehensive
income (loss) in 2014 and 2013 were as follows:
€ in millionsAmount
before taxes Tax effect
Total before noncontrolling
interest after taxes
Noncontrolling interest
Total after noncontrolling
interest after taxes
Cash flow hedges 20 - 5 15 12 27
Change in unrealized gains / losses 2 – 2 3 5
Realized gains / losses due to reclassifications 18 - 5 13 9 22
Change of fair value of available for sale financial assets 41 - 7 34 – 34
Foreign currency translation - 278 11 - 267 - 303 - 570
Actuarial losses on defined benefit pension plans - 2 - 3 - 5 23 18
total changes 2013 - 219 - 4 - 223 - 268 - 491
Cash flow hedges - 1 - 1 - 2 2 –
Change in unrealized gains / losses - 23 5 - 18 - 10 - 28
Realized gains / losses due to reclassifications 22 - 6 16 12 28
Change of fair value of available for sale financial assets - 23 7 - 16 – - 16
Foreign currency translation 422 - 29 393 531 924
Actuarial gains / losses on defined benefit pension plans - 203 60 - 143 - 89 - 232
total changes 2014 195 37 232 444 676
Changes in accumulated other comprehensive income (loss) net of tax by component in 2014 and 2013 were as follows:
€ in millionsCash flow
hedges
Change of fair value of available for
sale financial assets
Foreign currency
translation
Actuarial gains / losses
on defined benefit
pension plans
Total, before non-controlling
interest
Non-controlling
interest
Total, after non-
controlling interest
balance as of december 31, 2012 - 122 - 17 168 - 157 - 128 13 - 115
Other comprehensive income (loss) before reclassifications 2 34 - 267 - 14 - 245 - 285 - 530
Amounts reclassified from accumulated other comprehensive income (loss) 13 0 – 9 22 17 39
Other comprehensive income (loss), net 15 34 - 267 - 5 - 223 - 268 - 491
balance as of december 31, 2013 - 107 17 - 99 - 162 - 351 - 255 - 606
Other comprehensive income (loss) before reclassifications - 18 – 393 - 151 224 426 650
Amounts reclassified from accumulated other comprehensive income (loss) 16 - 16 – 8 8 18 26
Other comprehensive income (loss), net - 2 - 16 393 - 143 232 444 676
balance as of december 31, 2014 - 109 1 294 - 305 - 119 189 70

151
Fin
anci
al S
tate
men
ts
consolidated financial statements Notes on the consolidated statement of financial position
Reclassifications out of accumulated other comprehensive income (loss) into net income in 2014 and 2013 were as follows:
Amount of gain or loss reclassified from accumulated other
comprehensive (income) loss
€ in millions 2014 2013Affected line item in the
con solidated statement of income
details about accumulated other comprehensive (income) loss components
Cash flow hedges
Interest rate contracts 34 32 Interest income / expense
Foreign exchange contracts 1 - 2 Cost of sales
Foreign exchange contracts 3 –Selling, general and
administrative expenses
Foreign exchange contracts – – Interest income / expense
Other comprehensive income (loss) 38 30
Tax expense or benefit - 10 - 8
Other comprehensive income (loss), net 28 22
Change of fair value of available for sale financial assets - 23 0Selling, general and
administrative expenses
Tax expense or benefit 7 0
Other comprehensive income (loss), net - 16 0
amortization of defined benefit pension items
Prior service costs 1 1 1
Transition obligations – 1 1
Actuarial gains / losses on defined benefit pension plans 20 23 1
Other comprehensive income (loss) 21 25
Tax expense or benefit - 7 - 8
Other comprehensive income (loss), net 14 17
total reclassifications for the period 26 39
1 Net periodic benefit cost is allocated as personnel expense within cost of sales or selling, general and administrative expenses as well as research and development expenses.

Consolidated Financial Statements152
Financial S
tatements
Other nOtes
28. COmmitments and COntingent liabilities
Operating leases and rental payments
Fresenius Group’s subsidiaries lease office and manufactur-
ing buildings as well as machinery and equipment under
various lease agreements expiring on dates through 2101.
Rental expense recorded for operating leases for the years
ended December 31, 2014 and 2013 was € 661 million and
€ 621 million, respectively.
Future minimum rental payments under non-cancellable
operating leases for the years subsequent to December 31,
2014 are:
for the fiscal years € in millions
2015 619
2016 534
2017 451
2018 369
2019 310
Thereafter 1,273
total 3,556
As of December 31, 2014, future investment commitments
existed up to the year 2018 from the acquisition contracts for
hospitals at projected costs of up to € 356 million. Thereof
€ 75 million relates to the year 2015.
Besides the above mentioned contingent liabilities, the
amount of other commitments is immaterial.
legal and regulatOry matters
The Fresenius Group is routinely involved in numerous claims,
lawsuits, regulatory and tax audits, investigations and other
legal matters arising, for the most part, in the ordinary course
of its business of providing health care services and prod-
ucts. Legal matters that the Fresenius Group currently deems
to be material or noteworthy are described below. For the
matters described below in which the Fresenius Group believes
a loss is both reasonably possible and estimable, an estimate
of the loss or range of loss exposure is provided. For the other
matters described below, the Fresenius Group believes that
the loss probability is remote and / or the loss or range of pos-
sible losses cannot be reasonably estimated at this time. The
outcome of litigation and other legal matters is always diffi-
cult to predict accurately and outcomes that are not consis-
tent with Fresenius Group’s view of the merits can occur. The
Fresenius Group believes that it has valid defenses to the
legal matters pending against it and is defending itself vigor-
ously. Nevertheless, it is possible that the resolution of one
or more of the legal matters currently pending or threatened
could have a material adverse effect on its business, results
of operations and financial condition.
Commercial litigationW.r. grace & Co. lawsuit
Fresenius Medical Care was originally formed as a result of
a series of transactions it completed pursuant to the Agree-
ment and Plan of Reorganization dated as of February 4, 1996,
by and between W.R. Grace & Co. and Fresenius SE (formerly:
Fresenius AG) (the Merger). At the time of the Merger, a
W.R. Grace & Co. subsidiary known as W.R. Grace & Co.-Conn.
had signifi cant lia bilities arising out of product-liability related
litigation (including asbestos-related actions), pre-Merger

Consolidated Financial statements Other notes 153
Fin
anci
al S
tate
men
ts
included the terms of the Settlement Agreement within the
First Amended Plan of reorganization (Grace Bankruptcy Plan)
that was ultimately approved and confirmed by the District
Court. On February 3, 2014, the Court of Appeals dismissed
the last of the appeals of the District Court order confirming
the plan of reorganization, and the Grace Bankruptcy Plan went
effective on that date. Pursuant to the terms of the Settle-
ment Agreement and the Grace Bankruptcy Plan, all actions
asserting fraudulent conveyance and other claims raised on
behalf of asbestos claimants were dismissed with prejudice
and Fresenius Medical Care received protection against
existing and potential future W.R. Grace & Co. related claims,
including fraudulent conveyance and asbestos claims by
operation of injunctions and releases and Fresenius Medical
Care also received indemnification against income tax claims
related to the non-NMC members of the W.R. Grace & Co.
consolidated tax group. Also, pursuant to the Settlement Agree-
ment on February 3, 2014, Fresenius Medical Care paid a
total of US$ 115 million, which had previously been accrued
and is included on Fresenius Group’s consolidated statement
of financial position, to the asbestos personal injury and
property damage trusts created under the Grace Bankruptcy
Plan. No admission of liability was made.
baxter patent dispute “touchscreen interfaces” (1)
On April 4, 2003, Fresenius Medical Care Holdings, Inc.
(FMCH) filed a suit in the U.S. District Court for the Northern
District of California, styled Fresenius USA, Inc., et al., v.
Baxter International, Inc., et al., Case No. C 03-1431, seeking
a declaratory judgment that FMCH does not infringe patents
held by Baxter International, Inc. and its subsidiaries and
affiliates (Baxter), that the patents are invalid, and that Baxter
is without right or authority to threaten or maintain suit
tax claims and other claims unrelated to National Medical
Care, Inc. (NMC), which was W.R. Grace & Co.’s dialysis busi-
ness prior to the Merger. In connection with the Merger,
W.R. Grace & Co.-Conn. agreed to indemnify Fresenius Medical
Care, Fresenius Medical Care Holdings, Inc. (FMCH), and
NMC against all liabilities of W.R. Grace & Co., whether relat-
ing to events occurring before or after the Merger, other
than liabilities arising from or relating to NMC’s operations.
W.R. Grace & Co. and certain of its subsidiaries filed for
reorganization under Chapter 11 of the U.S. Bankruptcy Code
(the Grace Chapter 11 Proceedings) on April 2, 2001.
Prior to and after the commencement of the Grace Chapter
11 Proceedings, class action complaints were filed against
W.R. Grace & Co. and FMCH by plaintiffs claiming to be credi-
tors of W.R. Grace & Co.-Conn., and by the asbestos creditors’
committees on behalf of the W.R. Grace & Co. bankruptcy
estate in the Grace Chapter 11 Proceedings, alleging, among
other things that the Merger was a fraudulent conveyance,
violated the uniform fraudulent transfer act and constituted a
conspiracy. All such cases have been dismissed as part of
the Grace Chapter 11 Proceedings.
In 2003, Fresenius Medical Care reached agreement
with the asbestos creditors’ committees on behalf of the
W.R. Grace & Co. bankruptcy estate and W.R. Grace & Co. in
the matters pending in the Grace Chapter 11 Proceedings
for the settlement of all fraudulent conveyance and tax claims
against it and other claims related to Fresenius Medical
Care that arise out of the bankruptcy of W.R. Grace & Co. The
District Court approved the terms of the settlement agree-
ment as amended (Settlement Agreement) in 2003, and

Consolidated Financial Statements154
Financial S
tatements
against FMCH for alleged infringement of Baxter’s patents. In
general, the asserted patents concern the use of touch screen
interfaces for hemodialysis machines. Baxter filed counter-
claims against FMCH seeking more than US$ 140 million in
monetary damages and injunctive relief, and alleging that
FMCH willfully infringed on Baxter’s patents. On July 17, 2006,
the court entered judgment on a jury verdict in favor of FMCH
finding all asserted claims of Baxter patents invalid as obvi-
ous and / or anticipated in light of prior art.
On February 13, 2007, the court granted Baxter’s motion
to set aside the jury’s verdict in favor of FMCH and reinstated
the patents and entered judgment of infringement. Following
a trial on damages, the court entered judgment on Novem-
ber 6, 2007 in favor of Baxter on a jury award of US$ 14.3 mil-
lion. On April 4, 2008, the court denied Baxter’s motion for
a new trial, established a royalty payable to Baxter of 10% of
the sales price for continuing sales of FMCH’s 2008K hemo-
dialysis machines and 7% of the sales price of related dispos-
ables, parts and service beginning November 7, 2007, and
enjoined sales of the touchscreen-equipped 2008K machine
effective January 1, 2009. Fresenius Medical Care appealed
the court’s rulings to the United States Court of Appeals for the
Federal Circuit (Federal Circuit). On September 10, 2009,
the Federal Circuit reversed the district court’s decision and
determined that the asserted claims in two of the three pat-
ents at issue are invalid. As to the third patent, the Federal Cir-
cuit affirmed the district court’s decision; however, the Court
also vacated the injunction and award of damages. These
issues were remanded to the District Court for reconsideration
in light of the invalidity ruling on most of the claims. Upon
remand, the district court reduced the post-verdict damages
award to US$ 10 million. Separately, the U.S. Patent and
Trademark Office (USPTO) and the Board of Patent Appeals
and Interferences ruled that the remaining Baxter patent is
invalid. On May 17, 2012, the Federal Circuit affirmed the
USPTO’s ruling and invalidated the final remaining Baxter
patent. Baxter appealed to the Federal Circuit claiming that
approximately US$ 20 million of damages awarded to it by the
District Court before the Federal Circuit affirmed the USPTO
ruling constituted a final judgment that may be collected. On
July 2, 2013, the Federal Circuit denied Baxter’s appeal and
ordered the District Court to dismiss the case. The court-
approved escrow account has been terminated and the escrow
funds have been returned to FMCH. On March 5, 2014, Baxter
petitioned the United States Supreme Court to review the
decisions of the Federal Circuit. On May 19, 2014, the U.S. Su-
preme Court denied Baxter’s petition and let stand the Fed-
eral Circuit’s order dismissing the case.
baxter patent dispute “liberty Cycler”
On August 27, 2012, Baxter Health International, Inc. ( Baxter)
filed suit in the U.S. District Court for the Northern District
of Illinois, styled Baxter International, Inc., et al., v. Fresenius
Medical Care Holdings, Inc., Case No. 12-cv-06890, alleging
that Fresenius Medical Care Holdings, Inc.’s Liberty ® cycler
infringes certain U.S. patents that were issued to Baxter
between October 2010 and June 2012. Fresenius Medical Care
believes it has valid defenses to these claims, and will defend
this litigation vigorously.
Consolidated Financial statements Other notes 155
Fin
anci
al S
tate
men
ts
product liability litigation
On April 5, 2013, the U.S. Judicial Panel on Multidistrict Litiga-
tion ordered that the numerous lawsuits filed and anticipated
to be filed in various federal courts alleging wrongful death
and personal injury claims against Fresenius Medical Care
Holdings, Inc.’s (FMCH) and certain of its affiliates relating to
FMCH’s acid concentrate products NaturaLyte ® and Granu-
flo ® be transferred and consolidated for pretrial management
purposes into a consolidated multidistrict litigation in the
United States District Court for the District of Massachusetts,
styled In Re: Fresenius Granuflo / Naturalyte Dialysate Prod-
ucts Liability Litigation, Case No. 2013-md-02428. The Mas-
sachusetts state courts subsequently established a similar
consolidated litigation for such cases filed in Massachusetts
county courts, styled In Re: Consolidated Fresenius Cases,
Case No. MICV-2013-03400-O (Massachusetts Superior Court,
Middlesex County). These lawsuits allege generally that inade-
quate labeling and warnings for these products caused harm
to patients. In addition, similar cases have been filed in sev-
eral state courts outside Massachusetts, in some of which
the judicial authorities have established consolidated proceed-
ings for their disposition. The attorneys general of Louisiana
and Mississippi have also filed complaints under their state
deceptive practice statutes and in their state courts based
on allegations similar to those advanced in the personal injury
litigation. FMCH believes that these lawsuits are without merit,
and will defend them vigorously.
In a number of cases with the same subject matter in dis-
pute, Fresenius SE & Co. KGaA and Fresenius Management SE
have become formally involved in the litigation. Also for
these cases, both companies believe the lawsuits to be with-
out merit and intend to defend them vigorously.
Other litigation and potential exposures Fresenius medical Care holdings – Qui tam complaint
(massachusetts)
On February 15, 2011, a whistleblower action under the False
Claims Act against Fresenius Medical Care Holdings, Inc.
(FMCH) was unsealed by order of the United States District
Court for the District of Massachusetts and served by the
relator. The United States has not intervened in the case United
States ex rel. Chris Drennen v. Fresenius Medical Care Hold-
ings, Inc., 2009 Civ. 10179 (D. Mass.). The relator’s complaint,
which was first filed under seal in February 2009, alleges that
FMCH seeks and receives reimbursement from government
payors for serum ferritin and hepatitis B laboratory tests that
are medically unnecessary or not properly ordered by a phy-
sician. On March 6, 2011, the United States Attorney for the
District of Massachusetts issued a subpoena seeking the pro-
duction of documents related to the same laboratory tests that
are the subject of the relator’s complaint. FMCH has cooper-
ated fully in responding to the subpoena, and will vigorously
contest the relator’s complaint.
subpoena “american access Care, llC”
Subpoenas, or search warrants have been issued by federal
and state law enforcement authorities under the supervision of
the United States Attorneys for the Districts of Connecticut,
Southern Florida, Eastern Virginia and Rhode Island to Ameri-
can Access Care, LLC (AAC), which Fresenius Medical Care
acquired in October 2011, and to Fresenius Medical Care’s
subsidiary Fresenius Vascular Care, Inc., which now operates

Consolidated Financial Statements156
Financial S
tatements
former AAC centers as well as its own original facilities. Sub-
poenas have also been issued to certain of Fresenius Medical
Care’s outpatient hemodialysis facilities for records relating to
vascular access treatment and monitoring. Fresenius Medical
Care is cooperating fully in these investigations. Communica-
tions with certain of the investigating United States Attorney
Offices indicate that the inquiry encompasses invoicing and
coding for procedures commonly performed in vas cular ac-
cess centers and the documentary support for the medical
necessity of such procedures. The AAC acquisition agreement
contains customary indemnification obligations with respect
to breaches of rep resentations, warranties or covenants and
certain other specified matters. As of October 18, 2013, a group
of the prior owners of AAC exercised their right pursuant to
the terms of the acquisition agreement to assume responsibil-
ity for responding to certain of the subpoenas. Pursuant to
the AAC acquisition agreement, the prior owners are obligated
to indemnify Fresenius Medical Care for certain liabilities
that might arise from those subpoenas. On February 9, 2015,
Fresenius Medical Care reached an agreement in principle
with the United States Attorney for the Southern District of
Florida to resolve the Southern Florida (Miami) investigation,
which arose from allegations made in whistleblower actions
filed under seal in July 2011. Under the settlement, which
remains contingent on judicial approval, Fresenius Medical
Care will pay US$ 1.2 million to the United States. The settle-
ment and whistleblower complaint relate to actions prior to
Fresenius Medical Care’s acquisition of AAC by a physician
no longer associated with Fresenius Medical Care.
internal review
Fresenius Medical Care has received communications alleg-
ing conduct in countries outside the United States and Ger-
many that may violate the U.S. Foreign Corrupt Practices Act
(FCPA) or other anti-bribery laws. The Audit and Corporate
Governance Committee of Fresenius Medical Care’s Supervi-
sory Board is conducting an investigation with the assistance
of independent counsel. Fresenius Medical Care voluntarily
advised the U.S. Securities and Exchange Commission (SEC)
and the U.S. Department of Justice (DOJ). Fresenius Medical
Care’s investigation and dialogue with the SEC and DOJ are
ongoing. Fresenius Medical Care has received a subpoena
from the SEC requesting additional documents and a request
from the DOJ for copies of the documents provided to the
SEC. Fresenius Medical Care is cooperating with the requests.
Conduct has been identified that may result in monetary
penalties or other sanctions under the FCPA or other anti-
bribery laws. In addition, Fresenius Medical Care’s ability to
conduct business in certain jurisdictions could be negatively
impacted. Fresenius Medical Care has previously recorded
a non-material accrual for an identified matter. Given the cur-
rent status of the investigation and remediation activities,
Fresenius Medical Care cannot reasonably estimate the range
of possible loss that may result from identified matters or
from the final outcome of the investigation or remediation
activities.
Fresenius Medical Care’s independent counsel, in conjunc-
tion with Fresenius Medical Care’s Compliance Department,
has reviewed Fresenius Medical Care’s anti-corruption com-
pliance program, including internal controls related to com-
pliance with international anti-bribery laws, and appropriate
enhancements are being implemented. Fresenius Medical
Care is fully committed to FCPA and other anti-bribery law
compliance.

Consolidated Financial statements Other notes 157
Fin
anci
al S
tate
men
ts
subpoenas “massachusetts and louisiana”
In December 2012, Fresenius Medical Care Holdings, Inc.
(FMCH) received a subpoena from the United States Attorney
for the District of Massachusetts requesting production of a
broad range of documents related to products manufactured
by FMCH, electron-beam sterilization of dialyzers and the
Liberty peritoneal dialysis cycler. FMCH has cooperated fully
in the government’s investigation. In December 2014, FMCH
was advised that the government’s investigation was precipi-
tated by a whistleblower, who first filed a complaint under seal
in June 2013. In September 2014, the government declined
to intervene in the whistleblower’s actions.
In January 2013, FMCH received a subpoena from the
United States Attorney for the Western District of Louisiana
requesting discovery responses relating to the Granuflo ® and
Naturalyte ® acid concentrate products that are also the sub-
ject of personal injury litigation described above. FMCH has
cooperated fully in the government’s investigation.
China anti-dumping investigation
On June 13, 2014, the Ministry of Commerce of the People’s
Republic of China (MOFCOM) launched an anti-dumping
investigation into producers of hemodialysis equipment in the
European Union and Japan, which includes certain of the
Fresenius Medical Care’s subsidiaries. On December 17, 2014,
the MOFCOM announced the termination of the investigation
after the complaint had been withdrawn by the petitioner.
subpoena “maryland”
In August 2014, Fresenius Medical Care Holdings, Inc. (FMCH)
received a subpoena from the United States Attorney for the
District of Maryland inquiring into FMCH’s contractual arrange-
ments with hospitals and physicians, including contracts
relating to the management of in-patient acute dialysis ser-
vices. FMCH is cooperating in the investigation.
subpoena “nevada”
In November 2014, Fresenius Kabi Oncology Limited (FKOL)
received a subpoena from the U.S. Department of Justice
(DOJ), U.S. Attorney for the District of Nevada. The subpoena
requests documents in connection with the January 2013
inspection by the U.S. Food and Drug Administration (FDA) of
FKOL’s plant for active pharmaceutical ingredients in Kaly-
ani, India. That inspection resulted in a warning letter from
the FDA in July 2013. The subpoena now begins the DOJ’s
criminal and / or civil investigation in this connection and
seeks information from throughout the Fresenius Kabi group.
Fresenius Kabi fully cooperates with the governmental
investigation.
From time to time, the Fresenius Group is a party to or may
be threatened with other litigation or arbitration, claims or
assessments arising in the ordinary course of its business.
Management regularly analyzes current information includ-
ing, as applicable, the Fresenius Group’s defenses and insur-
ance coverage and, as necessary, provides accruals for prob-
able liabilities for the eventual disposition of these matters.

Consolidated Financial Statements158
Financial S
tatements
The Fresenius Group, like other health care providers, con-
ducts its operations under intense government regulation and
scrutiny. It must comply with regulations which relate to or
govern the safety and efficacy of medical products and sup-
plies, the marketing and distribution of such products, the
operation of manufacturing facilities, laboratories and dialysis
clinics, and environmental and occupational health and safety.
With respect to its development, manufacture, marketing
and distribution of medical products, if such compliance is not
maintained, the Fresenius Group could be subject to signif-
icant adverse regulatory actions by the U.S. Food and Drug
Administration (FDA) and comparable regulatory authorities
outside the United States. These regulatory actions could
include warning letters or other enforcement notices from the
FDA and / or comparable foreign regulatory authority, which
may require the Fresenius Group to expend significant time
and resources in order to implement appropriate corrective
actions. If the Fresenius Group does not address matters raised
in warning letters or other enforcement notices to the satis-
faction of the FDA and / or comparable regulatory authorities
outside the United States, these regulatory authorities could
take additional actions, including product recalls, injunctions
against the distribution of products or operation of manu-
facturing plants, civil penalties, seizures of Fresenius Group’s
products and / or criminal prosecution. FMCH is currently
engaged in remediation efforts with respect to three pending
FDA warning letters, Fresenius Kabi with respect to two
pending FDA warning letters. The Fresenius Group must also
comply with the laws of the United States, including the fed-
eral Anti-Kickback Statute, the federal False Claims Act, the
federal Stark Law and the federal Foreign Corrupt Practices
Act as well as other federal and state fraud and abuse laws.
Applicable laws or regulations may be amended, or enforce-
ment agencies or courts may make interpretations that differ
from Fresenius Group’s interpretations or the manner in
which it conducts its business. Enforcement has become a high
priority for the federal government and some states. In addi-
tion, the provisions of the False Claims Act authorizing pay-
ment of a portion of any recovery to the party bringing the
suit encourage private plaintiffs to commence whistleblower
actions. By virtue of this regulatory environment, Fresenius
Group’s business activities and practices are subject to exten-
sive review by regulatory authorities and private parties, and
continuing audits, subpoenas, other inquiries, claims and liti-
gation relating to Fresenius Group’s compliance with appli-
cable laws and regulations. The Fresenius Group may not
always be aware that an inquiry or action has begun, particu-
larly in the case of “whistleblower” actions, which are ini-
tially filed under court seal.

Consolidated Financial statements Other notes 159
Fin
anci
al S
tate
men
ts
The Fresenius Group operates many facilities throughout the
United States and other parts of the world. In such a decen-
tralized system, it is often difficult to maintain the desired level
of oversight and control over the thousands of indi viduals
employed by many affiliated companies. The Fresenius Group
relies upon its management structure, regulatory and legal
resources, and the effective operation of its compliance pro-
gram to direct, manage and monitor the activities of these
employees. On occasion, the Fresenius Group may identify
instances where employees or other agents deliberately, reck-
lessly or inadvertently contravene Fresenius Group’s poli-
cies or violate applicable law. The actions of such persons may
subject the Fresenius Group and its subsidiaries to liability
under the Anti-Kickback Statute, the Stark Law, the False
Claims Act and the Foreign Corrupt Practices Act, among other
laws and comparable laws of other countries.
Physicians, hospitals and other participants in the health
care industry are also subject to a large number of lawsuits
alleging professional negligence, malpractice, product lia-
bility, worker’s compensation or related claims, many of
which involve large claims and significant defense costs. The
Fresenius Group has been and is currently subject to these
suits due to the nature of its business and expects that those
types of lawsuits may continue. Although the Fresenius
Group maintains insurance at a level which it believes to be
prudent, it cannot assure that the coverage limits will be
adequate or that insurance will cover all asserted claims. A
successful claim against the Fresenius Group or any of its sub-
sidiaries in excess of insurance coverage could have a mate-
rial adverse effect upon it and the results of its operations. Any
claims, regardless of their merit or eventual outcome, could
have a material adverse effect on Fresenius Group’s reputation
and business.
The Fresenius Group has also had claims asserted against
it and has had lawsuits filed against it relating to alleged
patent infringements or businesses that it has acquired or
divested. These claims and suits relate both to operation of the
businesses and to the acquisition and divestiture transac-
tions. The Fresenius Group has, when appropriate, asserted
its own claims, and claims for indemnification. A successful
claim against the Fresenius Group or any of its subsidiaries
could have a material adverse effect upon its business, finan-
cial condition, and the results of its operations. Any claims,
regardless of their merit or eventual outcome, could have a
material adverse effect on Fresenius Group’s reputation and
business.

Consolidated Financial Statements160
Financial S
tatements
29. FinanCial instrumentsThe relationship between classes and categories as well as the reconciliation to the statement
of financial position line items is shown in the following table:
Categories
loans and receivables
Financial liabilities measured at
amortized cost
Financial liabilities / assets measured at fair value
in the consolidated statement of income
available for sale financial assets relating to no category
Cla
sses
Cash and cash equivalents
▶ Cash and cash equivalents
assets recognized at carrying amount
▶ Trade accounts receiv-able (incl. receivables from and loans to related parties)
▶ Other non-current assets (loan to a dialysis provider)
assets recognized at fair value
▶ European government bonds (until 2013)
▶ Shares (until 2013)
▶ Shares in funds
liabilities recognized at carrying amount
▶ Trade accounts payable
▶ Short-term accounts pay-able to related parties
▶ Short-term debt (incl. short-term loans from related parties)
▶ Long-term debt excluding capital lease obligations
▶ Senior Notes
▶ Convertible bonds
▶ Long-term capital lease obligations
liabilities recognized at fair value
▶ Other long-term liabilities
noncontrolling interest subject to put provisions recognized at fair value
▶ Noncontrolling interest subject to put provisions
derivatives for hedging purposes
▶ Other current assets
▶ Other non-current assets
▶ Other short-term liabilities
▶ Other long-term liabilities
▶ Other current assets
▶ Other non-current assets
▶ Other short-term liabilities
▶ Other long-term liabilities

Consolidated Financial statements Other notes 161
Fin
anci
al S
tate
men
ts
ValuatiOn OF FinanCial instruments
The carrying amounts of financial instruments at December 31, classified into categories, were as follows:
€ in millions 2014 2013
Loans and receivables 4,419 3,622
Financial liabilities measured at amortized cost 16,360 13,597
Assets measured at fair value in the consolidated statement of income 1 166 16
Liabilities measured at fair value in the consolidated statement of income 1 198 25
Available for sale financial assets 148 197
Relating to no category 304 301
1 There are no financial instruments designated as at fair value through profit or loss upon initial recognition.
The following table presents the carrying amounts and fair values as well as the fair value hierarchy levels
of Fresenius Group’s financial instruments as of December 31, classified into classes:
2014 2013
€ in millionsFair value
hierarchy levelCarrying amount
Fair value Carrying amount
Fair value
Cash and cash equivalents 1 1,175 1,175 864 864
Assets recognized at carrying amount 3 4,419 4,420 3,622 3,629
Assets recognized at fair value 1 148 148 197 197
Liabilities recognized at carrying amount 2 16,511 17,356 13,691 14,225
Liabilities recognized at fair value 2 161 161 16 16
Noncontrolling interest subject to put provisions recognized at fair value 3 681 681 472 472
Derivatives for hedging purposes 2 90 90 10 10
The significant methods and assumptions used to estimate
the fair values of financial instruments as well as classification
of fair value measurements according to the three-tier fair
value hierarchy are as follows:
Cash and cash equivalents are stated at nominal value,
which equals the fair value.
The nominal value of short-term financial instruments such
as accounts receivable and payable and short-term debt
represents its carrying amount, which is a reasonable estimate
of the fair value due to the relatively short period to maturity
for these instruments.
The fair values of major long-term financial instruments
are calculated on the basis of market information. Financial
instruments for which market quotes are available are mea-
sured with the market quotes at the reporting date. The fair
values of the other long-term financial liabilities are calculated
at the present value of respective future cash flows. To deter-
mine these present values, the prevailing interest rates and
credit spreads for the Fresenius Group as of the date of the
statement of financial position are used.
The class assets recognized at carrying amount consists of
trade accounts receivable and a loan which Fresenius Medical
Care granted to a middle-market dialysis provider. The fair
value of the loan is based on significant unobservable inputs of
comparable instruments and thus the class is classified as
fair value hierarchy Level 3.
In 2013, the class assets recognized at fair value was com-
prised of European government bonds, shares and shares in
funds. In 2014, shares in funds are included in this class. The
fair values of these assets are calculated on the basis of mar-
ket information. The fair value of available for sale financial
assets quoted in an active market is based on price quota-
tions at the period-end date (Level 1). Therefore, this class is
classified as Level 1.
The class liabilities recognized at carrying amount is clas-
sified as hierarchy Level 2.
The derivatives embedded in the convertible bonds are
included in the class liabilities recognized at fair value. The
fair value of the embedded derivatives is calculated using

Consolidated Financial Statements162
Financial S
tatements
the difference between the market value of the convertible
bond and the market value of an adequate straight bond dis-
counted with the market interest rates as of the reporting
date. The class was classified as Level 2.
The valuation of the class noncontrolling interest subject
to put provisions recognized at fair value is determined using
significant unobservable inputs. It is therefore classified as
Level 3.
Derivatives, mainly consisting of interest rate swaps and
foreign exchange forward contracts, are valued as follows:
The fair value of interest rate swaps is calculated by discount-
ing the future cash flows on the basis of the market interest
rates applicable for the remaining term of the contract as of
the date of the statement of financial position. To determine
the fair value of foreign exchange forward contracts, the con-
tracted forward rate is compared to the current forward rate
for the remaining term of the contract as of the date of the
statement of financial position. The result is then discounted
on the basis of the market interest rates prevailing at the
date of the statement of financial position for the respective
currency.
Fresenius Group’s own credit risk is incorporated in the
fair value estimation of derivatives that are liabilities. Counter-
party credit risk adjustments are factored into the valuation
of derivatives that are assets. The Fresenius Group monitors
and analyses the credit risk from derivative financial instru-
ments on a regular basis. For the valuation of derivative finan-
cial instruments, the credit risk is considered in the fair
value of every individual instrument. The basis for the default
probability are Credit Default Swap Spreads of each counter-
party appropriate for the duration. The calculation of the
credit risk considered in the valuation is done by multiplying
the default probability appropriate for the duration with
the expected discounted cash flows of the derivative financial
instrument.
The class of derivatives for hedging purposes includes the
call options which have been purchased to hedge the con-
vertible bonds. The fair values of these call options are derived
from market quotes. For the fair value measurement of the
class deriv atives for hedging purposes, significant other
observable inputs are used. Therefore, the class is classified
as Level 2 in accordance with the defined fair value hierarchy
levels.
Currently, there is no indication that a decrease in the
value of Fresenius Group’s financing receivables is probable.
Therefore, the allowances on credit losses of financing
receivables are immaterial.
FAIR VALUES OF DERIVATIVE FINANCIAL INSTRUMENTS
dec. 31, 2014 Dec. 31, 2013
€ in millions assets liabilities Assets Liabilities
Interest rate contracts (current) 0 0 0 4
Interest rate contracts (non-current) 1 6 0 4
Foreign exchange contracts (current) 9 43 15 5
Foreign exchange contracts (non-current) 0 – 1 –
derivatives designated as hedging instruments 1 10 49 16 13
Interest rate contracts (current) 0 0 0 –
Interest rate contracts (non-current) 0 1 0 1
Foreign exchange contracts (current) 1 21 37 15 8
Foreign exchange contracts (non-current) 1 – – 1 1
Derivatives embedded in the convertible bonds 0 145 0 0
Call options to secure the convertible bonds 1 145 0 0 0
derivatives not designated as hedging instruments 166 183 16 10
1 Derivatives designated as hedging instruments, foreign exchange contracts not designated as hedging instruments and call options to secure the convertible bonds are classified as derivatives for hedging purposes.

Consolidated Financial statements Other notes 163
Fin
anci
al S
tate
men
ts
Derivative financial instruments are marked to market each
reporting period, resulting in carrying amounts equal to fair
values at the reporting date.
Derivatives not designated as hedging instruments, which
are derivatives that do not qualify for hedge accounting, are
also solely entered into to hedge economic business transac-
tions and not for speculative purposes.
Derivatives for hedging purposes as well as the deriva-
tives embedded in the convertible bonds were recognized at
gross value within other assets in an amount of € 176 mil-
lion and other liabilities in an amount of € 231 million.
The current portion of interest rate contracts and foreign
exchange contracts indicated as assets in the preceding table
is recognized within other current assets in the consolidated
statement of financial position, while the current portion of
those indicated as liabilities is included in short-term accrued
expenses and other short-term liabilities. The non-current
portions indicated as assets or liabilities are recognized in
other non-current assets or in long-term accrued expenses
and other long-term liabilities, respectively. The derivatives
embedded in the convertible bonds and the call options to
secure the convertible bonds are recognized in other non-
current liabilities / assets in the consolidated statement of finan-
cial position.
effects of financial instruments recorded in the consolidated statement of incomeThe net gains and losses from financial instruments consisted
of allowances for doubtful accounts in an amount of € 241
million and foreign currency transactions of € 17 million. Inter-
est income of € 128 million resulted mainly from the valua-
tion of call options in connection with the convertible bonds,
trade accounts receivable and loans to related parties. Inter-
est expense of € 730 million resulted mainly from financial lia-
bilities, which are not recognized at fair value in the consoli-
dated statement of income.
EFFECT OF DERIVATIVES DESIGNATED AS HEDGING INSTRUMENTS ON THE
CONSOLIDATED STATEMENT OF COMPREHENSIVE INCOME
2014
€ in millions
Gain or loss recognized in other comprehensive
income (loss) (effective portion)
Gain or loss reclassified from accumulated other comprehensive income
(loss) (effective portion)
Gain or loss recognized in the
consolidated statement of income
Interest rate contracts – 34 0
Foreign exchange contracts - 37 4 0
derivatives in cash flow hedging relationships 1 - 37 38 0
Foreign exchange contracts - 14
derivatives in fair value hedging relationships - 14
derivatives designated as hedging instruments - 37 38 - 14
1 The amount of gain or loss recognized in the consolidated statement of income solely relates to the ineffective portion.
2013
€ in millions
Gain or loss recognized in other comprehensive
income (loss) (effective portion)
Gain or loss reclassified from accumulated other comprehensive income
(loss) (effective portion)
Gain or loss recognized in the
consolidated statement of income
Interest rate contracts 21 32 3
Foreign exchange contracts - 16 - 2 –
derivatives in cash flow hedging relationships 1 5 30 3
Foreign exchange contracts –
derivatives in fair value hedging relationships –
derivatives designated as hedging instruments 5 30 3
1 The amount of gain or loss recognized in the consolidated statement of income solely relates to the ineffective portion.

Consolidated Financial Statements164
Financial S
tatements
Gains from derivatives in fair value hedging relationships
and from foreign exchange contracts not designated as hedg-
ing instruments recognized in the consolidated statement of
income are faced by losses from the underlying transactions
in the corresponding amount.
The Fresenius Group expects to recognize a net amount of
€ 13 million of the existing losses for foreign exchange con-
tracts deferred in accumulated other comprehensive income
(loss) in the consolidated statement of income within the next
12 months. For interest rate contracts, the Fresenius Group
expects to recognize € 30 million of losses in the course of
normal business during the next 12 months in interest
expense.
Gains and losses from foreign exchange contracts and
the corresponding underlying transactions are accounted for
as cost of sales, selling, general and administrative expenses
and net interest. Gains and losses resulting from interest rate
contracts are recognized as net interest in the consolidated
statement of income.
In 2014, losses of € 16 million (2013: gains of € 34 million)
for available for sale financial assets were recognized in other
comprehensive income (loss).
EFFECT OF DERIVATIVES NOT DESIGNATED AS HEDGING INSTRUMENTS
ON THE CONSOLIDATED STATEMENT OF COMPREHENSIVE INCOME
Gain or loss recognized in the consolidated statement of income
€ in millions 2014 2013
Interest rate contracts – 7
Foreign exchange contracts 56 31
derivatives not designated as hedging instruments 56 38
The following table shows when the cash flow from cash flow hedges is expected to occur.
CASH FLOW FROM CASH FLOW HEDGES
expected in period of
€ in millions 1 year 1 to 3 years 3 to 5 years over 5 years
Designated as hedging instrument 34 3 3 - 1
Not designated as hedging instrument 16 – – 1
market risk
generalThe Fresenius Group is exposed to effects related to foreign
exchange fluctuations in connection with its international
business activities that are denominated in various currencies.
In order to finance its business operations, the Fresenius
Group issues senior notes and commercial papers and enters
into mainly long-term credit agreements and euro notes
(Schuld scheindarlehen) with banks. Due to these financing
activities, the Fresenius Group is exposed to interest risk
caused by changes in variable interest rates and the risk of
changes in the fair value of statement of financial position
items bearing fixed interest rates.
In order to manage the risk of interest rate and foreign
exchange rate fluctuations, the Fresenius Group enters into
certain hedging transactions with highly rated financial
insti tutions as authorized by the Management Board. Deriva-
tive financial instruments are not entered into for trading
purposes.
In general, the Fresenius Group conducts its derivative
financial instrument activities under the control of a single cen-
tralized department. The Fresenius Group has established
guidelines derived from best practice standards in the banking
industry for risk assessment procedures and supervi sion
concerning the use of financial derivatives. These guidelines
require amongst other things a clear segregation of duties
in the areas of execution, administration, accounting and con-
trolling. Risk limits are continuously monitored and, where
appropriate, the use of hedging instruments is adjusted to that
extent.

Consolidated Financial statements Other notes 165
Fin
anci
al S
tate
men
ts
The Fresenius Group defines benchmarks for individual expo-
sures in order to quantify interest and foreign exchange
risks. The benchmarks are derived from achievable and sus-
tainable market rates. Depending on the individual bench-
marks, hedging strategies are determined and generally imple-
mented by means of micro hedges.
Earnings of the Fresenius Group were not materially
affected by hedge ineffectiveness in the reporting period since
the critical terms of the interest and foreign exchange deriv-
atives mainly matched the critical terms of the under lying
exposures.
derivative financial instrumentsClassification
To reduce the credit risk arising from derivatives, the
Fresenius Group concluded master netting agreements with
banks. Through such agreements, positive and negative fair
values of the derivative contracts could be offset against one
another if a partner becomes insolvent. This offsetting is
valid for transactions where the aggregate amount of obliga-
tions owed to and receivable from are not equal. If insolvency
occurs, the party which owes the larger amount is obliged
to pay the other party the difference between the amounts
owed in the form of one net payment.
Fresenius elects not to offset the fair values of derivative
financial instruments subject to master netting agreements in
the consolidated statement of financial position.
At December 31, 2014 and December 31, 2013, the
Fresenius Group had € 30 million and € 29 million of derivative
financial assets subject to netting arrangements and € 77 mil-
lion and € 22 million of derivative financial liabilities subject to
netting arrangements. Offsetting these derivative financial
instruments would have resulted in net assets of € 15 million
and € 22 million as well as net liabilities of € 62 million and
€ 15 million at December 31, 2014 and December 31, 2013,
respectively.
Foreign exchange risk management
The Fresenius Group has determined the euro as its financial
reporting currency. Therefore, foreign exchange translation
risks resulting from the fluctuation of exchange rates between
the euro and the local currencies, in which the financial
statements of the foreign subsidiaries are prepared, have an
impact on results of operations and financial positions reported
in the consolidated financial statements.
Besides translation risks, foreign exchange transaction
risks exist, which mainly relate to transactions such as pur-
chases and sales as well as projects and services provided by
the Fresenius Group which are denominated in foreign cur-
rencies. A major part of transaction risks arise from products
manufactured in Fresenius Group’s worldwide production
sites which are usually denominated in the local currency of
the respective manufacturer and are delivered worldwide
to various Fresenius Group entities. These intragroup sales
are mainly denominated in euros and U.S. dollars. Therefore,
Group companies are exposed to changes of the foreign
exchange rates between the invoicing currencies and the local
currencies in which they conduct their businesses. Solely for
the purpose of hedging existing and foreseeable foreign
exchange transaction exposures, the Fresenius Group enters
into foreign exchange forward contracts and, on a small
scale, foreign exchange options. To ensure that no foreign
exchange risks result from loans in foreign currencies, the
Fresenius Group enters into foreign exchange swap contracts.
As of December 31, 2014, the notional amounts of for-
eign exchange contracts totaled € 2,061 million. These foreign
exchange contracts have been entered into to hedge risks
from operational business and in connection with loans in for-
eign currency. The predominant part of the foreign exchange
forward contracts to hedge risks from operational business
was recognized as cash flow hedge, while foreign exchange
contracts in connection with loans in foreign currencies are
partly recognized as fair value hedges. The fair values of cash
flow hedges and fair value hedges were - € 34 million and € 54
thousand, respectively.
The hedge-effective portion of changes in the fair value of
foreign exchange forward contracts that are designated and
qualified as cash flow hedges of forecasted product purchases
and sales is reported in accumulated other comprehensive
income (loss). These amounts are subsequently reclassified
into earnings as a component of cost of sales or as selling,
general and administrative expenses in the same period in
which the hedged transaction affects earnings.
As of December 31, 2014, the Fresenius Group was party
to foreign exchange contracts with a maximum maturity of
17 months.
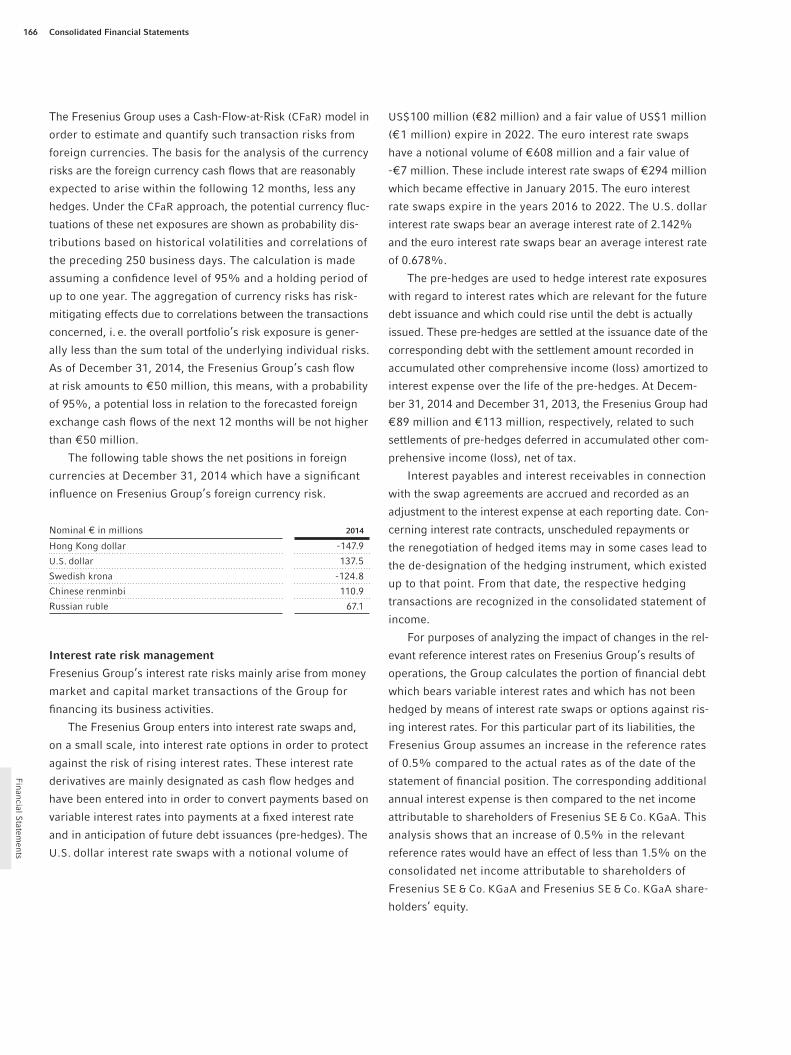
Consolidated Financial Statements166
Financial S
tatements
The Fresenius Group uses a Cash-Flow-at-Risk (CFaR) model in
order to estimate and quantify such transaction risks from
foreign currencies. The basis for the analysis of the currency
risks are the foreign currency cash flows that are reasonably
expected to arise within the following 12 months, less any
hedges. Under the CFaR approach, the potential currency fluc-
tuations of these net exposures are shown as prob ability dis-
tributions based on historical volatilities and correlations of
the preceding 250 business days. The calculation is made
assuming a confidence level of 95% and a holding period of
up to one year. The aggregation of currency risks has risk-
mitigating effects due to correlations between the transactions
concerned, i. e. the overall portfolio’s risk exposure is gener-
ally less than the sum total of the underlying individual risks.
As of December 31, 2014, the Fresenius Group’s cash flow
at risk amounts to € 50 million, this means, with a probability
of 95%, a potential loss in relation to the forecasted foreign
exchange cash flows of the next 12 months will be not higher
than € 50 million.
The following table shows the net positions in foreign
currencies at December 31, 2014 which have a significant
influence on Fresenius Group’s foreign currency risk.
Nominal € in millions 2014
Hong Kong dollar - 147.9
U.S. dollar 137.5
Swedish krona - 124.8
Chinese renminbi 110.9
Russian ruble 67.1
interest rate risk management
Fresenius Group’s interest rate risks mainly arise from money
market and capital market transactions of the Group for
financing its business activities.
The Fresenius Group enters into interest rate swaps and,
on a small scale, into interest rate options in order to protect
against the risk of rising interest rates. These interest rate
derivatives are mainly designated as cash flow hedges and
have been entered into in order to convert payments based on
variable interest rates into payments at a fixed interest rate
and in anticipation of future debt issuances (pre-hedges). The
U.S. dollar interest rate swaps with a notional volume of
US$ 100 million (€ 82 million) and a fair value of US$ 1 million
(€ 1 million) expire in 2022. The euro interest rate swaps
have a notional volume of € 608 million and a fair value of
- € 7 million. These include interest rate swaps of € 294 million
which became effective in January 2015. The euro interest
rate swaps expire in the years 2016 to 2022. The U.S. dollar
interest rate swaps bear an average interest rate of 2.142%
and the euro interest rate swaps bear an average interest rate
of 0.678%.
The pre-hedges are used to hedge interest rate exposures
with regard to interest rates which are relevant for the future
debt issuance and which could rise until the debt is actually
issued. These pre-hedges are settled at the issuance date of the
corresponding debt with the settlement amount recorded in
accumulated other comprehensive income (loss) amortized to
interest expense over the life of the pre-hedges. At Decem-
ber 31, 2014 and December 31, 2013, the Fresenius Group had
€ 89 million and € 113 million, respectively, related to such
settlements of pre-hedges deferred in accumulated other com-
prehensive income (loss), net of tax.
Interest payables and interest receivables in connection
with the swap agreements are accrued and recorded as an
adjustment to the interest expense at each reporting date. Con-
cerning interest rate contracts, unscheduled repayments or
the renegotiation of hedged items may in some cases lead to
the de-designation of the hedging instrument, which existed
up to that point. From that date, the respective hedging
transactions are recognized in the consolidated statement of
income.
For purposes of analyzing the impact of changes in the rel-
evant reference interest rates on Fresenius Group’s results of
operations, the Group calculates the portion of financial debt
which bears variable interest rates and which has not been
hedged by means of interest rate swaps or options against ris-
ing interest rates. For this particular part of its liabilities, the
Fresenius Group assumes an increase in the reference rates
of 0.5% compared to the actual rates as of the date of the
statement of financial position. The corresponding additional
annual interest expense is then compared to the net income
attributable to shareholders of Fresenius SE & Co. KGaA. This
analysis shows that an increase of 0.5% in the relevant
ref erence rates would have an effect of less than 1.5% on the
consolidated net income attributable to shareholders of
Fresenius SE & Co. KGaA and Fresenius SE & Co. KGaA share-
holders’ equity.

Consolidated Financial statements Other notes 167
Fin
anci
al S
tate
men
ts
Credit risk
The Fresenius Group is exposed to potential losses regarding
financial instruments in the event of non-performance by
counterparties. With respect to derivative financial instruments,
it is not expected that any counterparty fails to meet its obli-
gations as the counterparties are highly rated financial institu-
tions. The maximum credit exposure of deri v atives is repre-
sented by the fair value of those contracts with a positive fair
value amounting to € 30 million for foreign exchange deriv-
atives and € 1 million for interest rate derivatives at Decem-
ber 31, 2014. The maximum credit risk resulting from the
use of non-derivative financial instruments is defined as the
total amount of all receivables. In order to control this credit
risk, the Management of the Fresenius Group performs an
aging analysis of trade accounts receivable. For details on the
aging analysis and on the allowance for doubtful accounts,
please see note 14, Trade accounts receivable.
liQuidity risk
The liquidity risk is defined as the risk that a company is
potentially unable to meet its financial obligations. The Man-
agement of the Fresenius Group manages the liquidity of
the Group by means of effective working capital and cash man-
agement as well as an anticipatory evaluation of refinanc-
ing alternatives. The Management of the Fresenius Group
believes that existing credit facilities as well as the cash gener-
ated by operating activities and additional short-term bor-
rowings are sufficient to meet the Company’s foreseeable
demand for liquidity (see note 21, Debt and capital lease obli-
gations).
The following table shows the future undiscounted con-
tractual cash flows (including interests) resulting from recog-
nized financial liabilities as well as the fair value of noncon-
trolling interest subject to put provisions and the fair value of
derivative financial instruments:
€ in millions up to 1 year 1 to 3 years 3 to 5 years more than 5 years
Long-term debt and capital lease obligations (including accounts receivable securitization program) 1 874 1,818 3,183 1,361
Short-term debt 234 0 0 0
Senior Notes 1,088 1,427 2,968 4,181
Convertible bonds 4 9 509 402
Trade accounts payable 1,052 0 0 0
Noncontrolling interest subject to put provisions 285 161 153 82
Derivative financial instruments – designated as cash flow hedge 43 3 3 0
Derivative financial instruments – designated as fair value hedge – 0 0 0
Derivative financial instruments – not designated as hedging instruments 36 33 113 1
total 3,616 3,451 6,929 6,027
1 Future interest payments for financial liabilities with variable interest rates were calculated using the latest interest rates fixed prior to December 31, 2014.
30. supplementary inFOrmatiOn On Capital managementThe Fresenius Group has a solid financial profile. Capital
management includes both equity and debt. A principal objec-
tive of Fresenius Group’s capital management is to optimize
the weighted-average cost of capital. Further, it is sought to
achieve a balanced mix of equity and debt. To secure growth
on a long-term basis, a capital increase may also be con-
sidered in exceptional cases, for instance to finance a major
acquisition.
Due to the Company’s diversification within the health care
sector and the strong market positions of the business seg-
ments in global, growing and non-cyclical markets, predict-
able and sustainable cash flows are generated. They allow
a reasonable proportion of debt, i. e. the employment of an
extensive mix of financial instruments. Moreover, Fresenius
Group’s customers are generally of high credit quality.
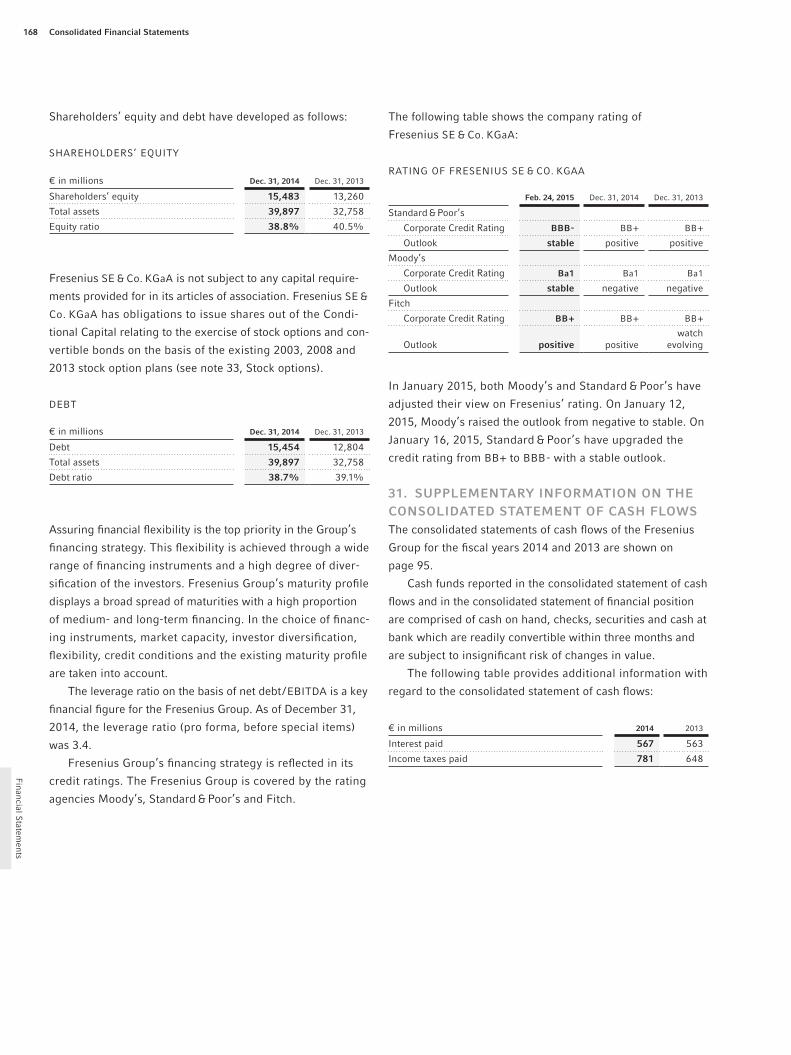
Consolidated Financial Statements168
Financial S
tatements
Shareholders’ equity and debt have developed as follows:
SHAREHOLDERS’ EqUITy
€ in millions dec. 31, 2014 Dec. 31, 2013
Shareholders’ equity 15,483 13,260
Total assets 39,897 32,758
Equity ratio 38.8% 40.5%
Fresenius SE & Co. KGaA is not subject to any capital require-
ments provided for in its articles of association. Fresenius SE &
Co. KGaA has obligations to issue shares out of the Condi-
tional Capital relating to the exercise of stock options and con-
vertible bonds on the basis of the existing 2003, 2008 and
2013 stock option plans (see note 33, Stock options).
DEBT
€ in millions dec. 31, 2014 Dec. 31, 2013
Debt 15,454 12,804
Total assets 39,897 32,758
Debt ratio 38.7% 39.1%
Assuring financial flexibility is the top priority in the Group’s
financing strategy. This flexibility is achieved through a wide
range of financing instruments and a high degree of diver-
sification of the investors. Fresenius Group’s maturity profile
displays a broad spread of maturities with a high proportion
of medium- and long-term financing. In the choice of financ-
ing instruments, market capacity, investor diversi fication,
flexibility, credit conditions and the existing maturity profile
are taken into account.
The leverage ratio on the basis of net debt / EBITDA is a key
financial figure for the Fresenius Group. As of December 31,
2014, the leverage ratio (pro forma, before special items)
was 3.4.
Fresenius Group’s financing strategy is reflected in its
credit ratings. The Fresenius Group is covered by the rating
agencies Moody’s, Standard & Poor’s and Fitch.
The following table shows the company rating of
Fresenius SE & Co. KGaA:
RATING OF FRESENIUS SE & CO. KGAA
Feb. 24, 2015 Dec. 31, 2014 Dec. 31, 2013
Standard & Poor’s
Corporate Credit Rating bbb - BB + BB +
Outlook stable positive positive
Moody’s
Corporate Credit Rating ba1 Ba1 Ba1
Outlook stable negative negative
Fitch
Corporate Credit Rating bb + BB + BB +
Outlook positive positive watch
evolving
In January 2015, both Moody’s and Standard & Poor’s have
adjusted their view on Fresenius’ rating. On January 12,
2015, Moody’s raised the outlook from negative to stable. On
January 16, 2015, Standard & Poor’s have upgraded the
credit rating from BB + to BBB - with a stable outlook.
31. supplementary inFOrmatiOn On the COnsOlidated statement OF Cash FlOWsThe consolidated statements of cash flows of the Fresenius
Group for the fiscal years 2014 and 2013 are shown on
page 95.
Cash funds reported in the consolidated statement of cash
flows and in the consolidated statement of financial position
are comprised of cash on hand, checks, securities and cash at
bank which are readily convertible within three months and
are subject to insignificant risk of changes in value.
The following table provides additional information with
regard to the consolidated statement of cash flows:
€ in millions 2014 2013
Interest paid 567 563
Income taxes paid 781 648

Consolidated Financial statements Other notes 169
Fin
anci
al S
tate
men
ts
The business segments were identified in accordance with
FASB ASC Topic 280, Segment Reporting which defines the
segment reporting requirements in the annual financial state-
ments and interim reports with regard to the operating busi-
ness, product and service businesses and regions. The busi-
ness segments of the Fresenius Group are as follows:
▶ Fresenius Medical Care
▶ Fresenius Kabi
▶ Fresenius Helios
▶ Fresenius Vamed
▶ Corporate / Other
The segment Corporate / Other is mainly comprised of the hold-
ing functions of Fresenius SE & Co. KGaA as well as Fresenius
Netcare GmbH, which provides services in the field of infor-
mation technology and, until June 28, 2013, Fresenius Biotech,
which did not fulfill the characteristics of a reportable seg-
ment. In addition, the segment Corporate / Other includes inter-
segment consolidation adjustments as well as special items
(see note 3, Special items).
Details on the business segments are shown on page 101
of the notes.
Segment reporting by region takes account of geographi-
cal factors and the similarity of markets in terms of opportu-
nities and risks. The allocation to a particular region is based
on the domicile of the customers.
nOtes On the business segments
The key figures used by the Management Board to assess
segment performance, have been selected in such a way that
they include all items of income and expenses which fall
under the area of responsibility of the business segments. The
Cash paid for acquisitions (without investments in licenses)
consisted of the following:
€ in millions 2014 2013
Assets acquired 3,728 2,781
Liabilities assumed - 938 - 67
Noncontrolling interest - 331 - 73
Notes assumed in connection with acquisitions - 238 - 60
Cash paid 2,221 2,581
Cash acquired - 232 - 34
Cash paid for acquisitions, net 1,989 2,547
Cash paid for investments, net of cash acquired 207 147
Cash paid for intangible assets, net 18 9
total cash paid for acquisitions and investments, net of cash acquired, and net purchases of intangible assets 2,214 2,703
Proceeds from the sale of subsidiaries were € 18 million in
2014 (2013: € 109 million).
32. nOtes On the COnsOlidated segment repOrting
general
The consolidated segment reporting tables shown on pages
98 to 99 of this Annual Report are an integral part of the notes.
The Fresenius Group has identified the business segments
Fresenius Medical Care, Fresenius Kabi, Fresenius Helios
and Fresenius Vamed, which corresponds to the internal orga-
nizational and reporting structures (Management Approach)
at December 31, 2014.
The key data disclosed in conjunction with the consoli-
dated segment reporting correspond to the key data of the
internal reporting system of the Fresenius Group. Internal
and external reporting and accounting correspond to each
other; the same key data and definitions are used.
Sales and proceeds between the segments are indicative
of the actual sales and proceeds agreed with third parties.
Administrative services are billed in accordance with service
level agreements.

Consolidated Financial Statements170
Financial S
tatements
Management Board is convinced that the most suitable per-
form ance indicator is the operating income (EBIT). The Man-
agement Board believes that, in addition to the operating
income, the figure for earnings before interest, taxes and
depreciation / amortization (EBITDA) can also help investors to
assess the ability of the Fresenius Group to generate cash
flows and to meet its financial obligations. The EBITDA figure
is also the basis for assessing Fresenius Group’s compliance
with the terms of its credit agreements (e. g. the Fresenius
Medical Care 2012 Credit Agreement or the 2013 Senior Credit
Agreement).
Depreciation and amortization is presented for property,
plant and equipment and intangible assets with definite useful
lives of the respective business segment.
Net interest is comprised of interest expenses and inter-
est income.
Net income attributable to shareholders of Fresenius SE &
Co. KGaA is defined as earnings after income taxes and non-
controlling interest.
The operating cash flow is the cash provided by / used in
operating activities.
The cash flow before acquisitions and dividends is the
operating cash flow less net capital expenditure.
Debt is comprised of bank loans, senior notes, convertible
bonds, capital lease obligations, liabilities relating to outstand-
ing acquisitions as well as intercompany liabilities.
Capital expenditure mainly includes additions to property,
plant and equipment.
Acquisitions refer to the purchase of shares in legally
inde pendent companies and the acquisition of business divi-
sions and intangible assets (e. g. licenses). The key figures
shown with regard to acquisitions present the contractual pur-
chase prices comprising amounts paid in cash (less cash
acquired), debts assumed and the issuance of shares, whereas
for the purposes of the statement of cash flows, only cash
purchase price components less acquired cash and cash equiv-
alents are reported.
The EBITDA margin is calculated as a ratio of EBITDA
to sales.
The EBIT margin is calculated as a ratio of EBIT to sales.
The return on operating assets (ROOA) is defined as the
ratio of EBIT to average operating assets. Operating assets are
defined as total assets less deferred tax assets, trade accounts
payable and advance payments from customers as well as
guaranteed subsidies.
In addition, the key indicators “Depreciation and amortiza-
tion in % of sales” and “Operating cash flow in % of sales”
are also disclosed.
RECONCILIATION OF KEy FIGURES TO
CONSOLIDATED EARNINGS
€ in millions 2014 2013
Total EBIT of reporting segments 3,182 3,070
General corporate expenses Corporate / Other (EBIT) - 68 - 79
group ebit 3,114 2,991
Interest expenses - 730 - 634
Interest income 128 50
income before income taxes 2,512 2,407
RECONCILIATION OF NET DEBT WITH THE CONSOLIDATED
STATEMENT OF FINANCIAL POSITION
€ in millions dec. 31, 2014 Dec. 31, 2013
Short-term debt 230 959
Short-term loans from related parties 3 6
Current portion of long-term debt and capital lease obligations 753 855
Current portion of Senior Notes 682 0
Long-term debt and capital lease obligations, less current portion 5,977 5,871
Senior Notes, less current portion 6,977 5,113
Convertible bonds 832 0
debt 15,454 12,804
less cash and cash equivalents 1,175 864
net debt 14,279 11,940

Consolidated Financial statements Other notes 171
Fin
anci
al S
tate
men
ts
The following table shows the non-current assets by geo-
graphical region:
€ in millions dec. 31, 2014 Dec. 31, 2013
Germany 7,865 6,893
Europe (excluding Germany) 2,904 2,879
North America 16,524 13,174
Asia-Pacific 1,476 1,220
Latin America 586 372
Africa 47 42
total non-current assets 1 29,402 24,580
1 The aggregate amount of net non-current assets is the sum of non-current assets less deferred tax assets and less derivative financial instruments.
In 2014, the Fresenius Group generated sales of € 6,292 mil-
lion (2013: € 4,403 million) in Germany. Sales in the United
States were € 9,107 million at actual rates and € 9,110 million
in constant currency in 2014 (2013: € 8,414 million).
33. stOCk OptiOns
COmpensatiOn COst in COnneCtiOn With the
stOCk OptiOn plans OF the Fresenius grOup
In 2014, the Fresenius Group recognized compensation cost in
an amount of € 23 million for stock options granted since
2011. For stock incentive plans which are performance-based,
the Fresenius Group recognizes compensation cost over the
vesting periods, based on the market values of the underlying
stock at the grant date.
Fair Value OF stOCk OptiOns
The Fresenius Group elected to adopt FAS 123(R), Share-
Based Payment, prospectively.
The Fresenius Group uses a binomial option pricing
model in determining the fair value of stock options granted
under the stock option plans of Fresenius SE & Co. KGaA
and Fresenius Medical Care AG & Co. KGaA. Option valuation
models require the input of highly subjective assumptions
including expected stock price volatility. Fresenius Group’s
assumptions are based upon its past experiences, market
trends and the experiences of other entities of the same size
and in similar industries. To incorporate the effects of
expected early exercise in the model, an early exercise of
vested options was assumed as soon as the share price
exceeds 150% of the exercise price. Fresenius Group’s stock
options have characteristics that vary significantly from
traded options and changes in subjective assumptions can
materially affect the fair value of the option.
The weighted-average assumptions for the calculation of
the fair value of grants of the Fresenius SE & Co. KGaA Stock
Option Plan 2013 made during 2014 and 2013 are as follows:
2014 2013
€ in millionsJuly
grantDecember
GrantJuly
Grant
Expected dividend yield 1.47% 1.50% 1.47%
Risk-free interest rate 0.85% 1.41% 1.33%
Expected volatility 26.83% 27.43% 27.75%
Life of options 8 years 8 years 8 years
Exercise price per option in € 36.92 33.10 32.12
The expected volatility results from the historical volatility cal-
culated over the expected life of options. The volatility was
determined when the fair value of stock options was calculated
for the first time and since then has been controlled every
year upon issuance of a new tranche.
Fresenius se & CO. kgaa stOCk OptiOn plans
description of the Fresenius se & Co. kgaa stock option plans in placeAs of December 31, 2014, Fresenius SE & Co. KGaA had three
stock option plans in place: the Fresenius AG Stock Option
Plan 2003 (2003 Plan) which is based on convertible bonds,
the stock option based Fresenius SE Stock Option Plan 2008
(2008 Plan) and the Fresenius SE & Co. KGaA Long Term
Incentive Program 2013 (2013 LTIP) which is based on stock
options and phantom stocks. In 2014, stock options were
solely granted under the 2013 LTIP.

Consolidated Financial Statements172
Financial S
tatements
2013 ltip
The 2013 LTIP is comprised of the Fresenius SE & Co. KGaA
Stock Option Plan 2013 (2013 SOP) and the Fresenius SE &
Co. KGaA Phantom Stock Plan 2013 (2013 PSP). It combines
the granting of stock options with the granting of phantom
stock awards which entitle the holder to receive cash payments
upon exercising the phantom stock. Each of the 2013 SOP
and 2013 PSP making up the 2013 LTIP have been established
under a stand-alone legal documentation.
2013 sOp
Under the 2013 SOP, which was approved by the Annual
General Meeting of Fresenius SE & Co. KGaA on May 17, 2013,
Fresenius Management SE is authorized to issue up to 8.4
million subscription rights for an amount of 8.4 million non-par
value ordinary bearer shares of Fresenius SE & Co. KGaA
until May 16, 2018.
Of the up to 8.4 million options, up to 1.6 million options
are designated for members of the Management Board of
Fresenius Management SE; up to 4.4 million options are des-
ignated for members of the management of directly or indi-
rectly affiliated companies (except for Fresenius Medical Care)
and up to 2.4 million options are designated for executive
employees of Fresenius SE & Co. KGaA and its affiliated com-
panies (except for Fresenius Medical Care).
The granting of the options shall occur in five annual
tranches, each to the last Monday in July or the first Monday
in December. With respect to new options, the Supervisory
Board of Fresenius Management SE determines the stock
options granted to members of Fresenius Management SE’s
Management Board, whereas the Management Board of
Fresenius Management SE determines the other participants
in the 2013 SOP and the stock options granted to them.
The exercise price of an option shall equal the volume-
weighted average stock market price (closing price) of the non-
par value ordinary bearer share of Fresenius SE & Co. KGaA
in the electronic Xetra trading of Deutsche Börse AG in Frank-
furt am Main, or a comparable successor system, on the last
30 calendar days prior to the respective grant date.
Options granted have an eight-year term but can be exercised
only after a four-year vesting period. The exercise of options
is subject to the condition precedent, in each case, that the
annual success target within a four-year waiting period is
achieved. The success target is achieved in each case if, after
the granting of the options to the respective entitled person,
either (i) the consolidated net income attributable to share-
holders of Fresenius SE & Co. KGaA according to U.S. GAAP,
adjusted for extraordinary effects and on a constant currency
basis, has increased by at least 8% per annum in comparison
to the previous year in each case within the waiting period,
or (ii) – if this is not the case – the compounded annual growth
rate of the consolidated net income attributable to share-
holders of Fresenius SE & Co. KGaA according to U.S. GAAP,
adjusted for extraordinary effects and on a constant currency
basis, during the four years of the waiting period amounts
to at least 8%. In the event that the success target within the
four-year waiting period is not achieved for the individual
years or for the compounded annual growth rate, the options
issued in each case are forfeited in proportion to the non-
achievement of the success target within the waiting period,
i. e. by one quarter, two quarters, three quarters, or com-
pletely. The performance targets for 2013 and 2014 were met.
The adjusted net income attributable to shareholders of
Fresenius SE & Co. KGaA according to U.S. GAAP (currency
adjusted) and changes thereto compared to the adjusted
net income according to U.S. GAAP (without currency adjust-
ment) of the relevant comparison year shall be verified with
binding effect in each case by the auditors of Fresenius SE &
Co. KGaA on the basis of the audited consolidated financial
statements. Upon exercise of vested options, Fresenius SE &
Co. KGaA has the right to grant treasury shares in lieu of
increasing capital by the issuance of new shares.
After the expiration of the waiting period, all options in
respect of which the success target has been achieved
may be exercised at any time outside the designated black-
out periods.

Consolidated Financial statements Other notes 173
Fin
anci
al S
tate
men
ts
2013 psp
Fresenius SE & Co. KGaA’s 2013 PSP was established in May
2013, together with the 2013 SOP. Awards of phantom stock
can be granted on each stock option grant date. Phantom stock
awarded under the 2013 PSP may be granted to the mem-
bers of Fresenius Management SE’s Management Board, the
members of the management of directly or indirectly affili-
ated companies (except for Fresenius Medical Care) and for
executive employees of Fresenius SE & Co. KGaA and its affili-
ated companies (except for Fresenius Medical Care).
As under the 2013 SOP, the Supervisory Board of Fresenius
Management SE determines the phantom stock granted to
members of Fresenius Management SE’s Management Board,
whereas the Management Board of Fresenius Management SE
determines the other participants in the 2013 PSP and the
phantom stock granted to them.
Phantom stock awards under the 2013 PSP entitle the
holder to receive a cash payment. Each phantom stock award
shall entitle the holder to receive the volume-weighted aver-
age stock market price (closing price) of the non-par value
ordinary bearer share of Fresenius SE & Co. KGaA in the elec-
tronic Xetra trading of Deutsche Börse AG in Frankfurt am
Main, or a comparable successor system, during the last three
months prior to the date the phantom stock is exercised.
The exercise of phantom stock is subject to the condition
precedent, in each case, that the annual success target within
a four-year waiting period is achieved. The success target is
achieved in each case if, after the granting of the subscription
rights to the respective entitled person, either (i) the consoli-
dated net income attributable to shareholders of Fresenius SE &
Co. KGaA according to U.S. GAAP, adjusted for extraordinary
effects and on a constant currency basis, has increased by at
least 8% per annum in comparison to the previous year in
each case within the waiting period, or (ii) – if this is not the
case – the compounded annual growth rate of the consolidated
net income attributable to shareholders of Fresenius SE &
Co. KGaA according to U.S. GAAP, adjusted for extraordinary
effects and on a constant currency basis, during the four
years of the waiting period amounts to at least 8%. In the event
that the success target within the four-year waiting period
is not achieved for the individual years or for the compounded
annual growth rate, the phantom stock awards issued in each
case are forfeited in proportion to the non-achievement of the
success target within the waiting-period, i. e. by one quarter,
two quarters, three quarters, or completely. The performance
targets for 2013 and 2014 were met.
The adjusted net income attributable to shareholders of
Fresenius SE & Co. KGaA according to U.S. GAAP (currency
adjusted) and changes thereto compared to the adjusted net
income according to U.S. GAAP (without currency adjust-
ment) of the relevant comparison year shall be verified with
binding effect in each case by the auditors of Fresenius SE &
Co. KGaA on the basis of the audited consolidated financial
statements.
After the expiration of the waiting period, all exercisable
phantom stock will be deemed to be exercised and cashed
out on March 1 following the end of the waiting period (or the
following banking day).
stock Option plan 2008
During 2008, Fresenius SE adopted the 2008 Plan to grant
subscription rights to members of the Management Board and
executive employees of the Company and affiliated compa-
nies. Under the 2008 Plan, up to 6.2 million options could be
issued, which carried the entitlement to exclusively obtain
6.2 million ordinary shares. The options granted have a seven-
year term but can be exercised only after a three-year vest-
ing period. The vesting of options granted is mandatorily sub-
ject to the condition, in each case, that the annual success
target within the three-year vesting period is achieved. For
each such year, the success target is achieved if the consoli-
dated net income attributable to shareholders of Fresenius SE &
Co. KGaA, adjusted for extraordinary effects, has increased
by at least 8% compared to the respective adjusted net income
attrib utable to shareholders of Fresenius SE & Co. KGaA of
the previous fiscal year. For each year in which the success
target has not been met, one-third of the options granted
shall forfeit. The adjusted net income attributable to share-
holders of Fresenius SE & Co. KGaA shall be calculated on the
basis of the calculation method of the accounting principles
according to U.S. GAAP. For the purposes of the 2008 Plan,

Consolidated Financial Statements174
Financial S
tatements
the adjusted net income attributable to shareholders of
Fresenius SE & Co. KGaA is determined and will be verified
with binding effect by Fresenius SE & Co. KGaA’s auditor
during the audit of the consolidated financial statements. The
performance targets were met in all years. If all conditions
are fulfilled, stock options may be exercised throughout the
year with the exception of certain pre-determined black-
out periods.
This stock incentive plan was replaced by the 2013 SOP.
The last options were granted in 2012.
stock Option plan 2003
During 2003, Fresenius AG adopted the 2003 Plan for mem-
bers of the Management Board and executive employees. This
incentive plan which is based on convertible bonds was
replaced by the 2008 Plan and no convertible bonds have been
granted since 2008. Under the 2003 Plan, eligible employees
have the right to acquire ordinary shares of Fresenius SE &
Co. KGaA. The bonds expire in 10 years and one third of them
can be exercised beginning after two, three and four years
after the grant date, respectively. Upon issuance of the option,
the employees had the right to choose options with or with-
out a stock price target. In the case of options not subject to a
stock price target, the number of convertible bonds awarded
to the eligible employee was 15% less than if the employee
elected options subject to the stock price target.
Changes of the stock option plans due to the capital increase from company’s funds (stock split 2014 at a ratio of 1 : 3)Compared to the existing conditions described, the follow-
ing material changes to the stock option plans result from the
stock split 2014 at a ratio of 1 : 3 coming into effect:
2013 sOp
As far as options have not yet been granted under the 2013
SOP, the total volume of not yet granted subscription rights
increases in the same proportion as the subscribed capital
(factor 3). The same applies to the subsets of the subscription
rights that are attributable to individual groups of partici-
pants. For stock options that were granted before the stock
split 2014 came into effect, the entitlement of the participants
to receive new shares through the exercise of stock options
increases in the same proportion as the subscribed capital
(factor 3). The participants are now entitled to receive three
bearer ordinary shares of Fresenius SE & Co. KGaA. The exer-
cise price is reduced proportionally.
2013 psp
The holders of phantom stocks, that were issued before the
stock split 2014 came into effect, will be granted an economic
compensation through retroactively tripling the number of
phantom stocks granted before the stock split 2014 came into
effect.
stock Option plan 2008
For stock options that were granted before the stock split
2014 came into effect, the entitlement of the participants to
receive new shares through the exercise of stock options
increases in the same proportion as the subscribed capital
(factor 3). The participants are now entitled to receive three
bearer ordinary shares of Fresenius SE & Co. KGaA. The
maximum number of ordinary shares to be issued increases
accordingly. The exercise price is reduced proportionally.

Consolidated Financial statements Other notes 175
Fin
anci
al S
tate
men
ts
stock Option plan 2003
Convertible bonds granted prior to the registration of the
resolutions of the Annual General Meeting dated December 4,
2006 with the commercial register regarding the capital
increase from company’s funds and the new division of the
subscribed capital (stock split 2006) but converted after the
stock split 2014 came into effect, now entitle participants to
receive nine bearer ordinary shares of Fresenius SE & Co.
KGaA per convertible bond. The maximum number of ordinary
shares to be issued increases accordingly. The conversion
price is reduced proportionally.
Convertible bonds granted after the registration of the stock
split 2006 with the commercial register but converted after
the stock split 2014 came into effect, now entitle participants
to receive three bearer ordinary shares of Fresenius SE &
Co. KGaA per convertible bond. The maximum number of ordi-
nary shares to be issued increases accordingly. The conver-
sion price is reduced proportionally.
transactions during 2014In 2014, Fresenius SE & Co. KGaA awarded 2,233,812 stock
options under the 2013 LTIP, including 315,000 options to
members of the Management Board of Fresenius Manage-
ment SE, at an exercise price of € 36.92, a fair value of € 8.28
each and a total fair value of € 18.5 million, which will be
amortized over the four-year vesting period. Fresenius SE &
Co. KGaA also awarded 326,592 phantom stocks under the
2013 LTIP, including 81,606 phantom stocks granted to mem-
bers of the Management Board of Fresenius Management SE,
at a measurement date (December 31, 2014) fair value of
€ 41.11 each and a total fair value of € 13.4 million, which will
be revalued if the fair value changes, and amortized over the
four-year vesting period.
During the fiscal year 2014, Fresenius SE & Co. KGaA received
cash of € 45 million from the exercise of 2,448,113 stock
options. The average stock price of the ordinary share at the
exercise date was € 37.82. The intrinsic value of convertible
bonds and stock options exercised in 2014 was € 45 million.
1,048,413 convertible bonds were outstanding and exer-
cisable under the 2003 Plan at December 31, 2014. The mem-
bers of the Fresenius Management SE Management Board
held 137,724 convertible bonds. At December 31, 2014, out of
7,594,726 outstanding stock options issued under the 2008
Plan, 4,276,591 were exercisable and 1,578,180 were held by
the members of the Fresenius Management SE Management
Board. 4,260,627 stock options issued under the 2013 LTIP
were outstanding at December 31, 2014. The members of the
Fresenius Management SE Management Board held 630,000
stock options. 644,679 phantom stocks issued under the
2013 LTIP were outstanding at December 31, 2014. The mem-
bers of the Fresenius Management SE Management Board
held 163,422 phantom stocks.
Stock option transactions are summarized as follows:
Ordinary shares Dec. 31
Number of options
Weighted- average
exercise price in €
Number of options
exercisable
balance 2012 16,154,256 19.57 6,183,987
Granted 2,160,618 32.26
Exercised 4,519,707 15.16
Forfeited 305,664 21.91
balance 2013 13,489,503 23.06 4,657,380
Granted 2,233,812 36.92
Exercised 2,448,113 18.29
Forfeited 371,436 27.42
balance 2014 12,903,766 26.27 5,325,004

Consolidated Financial Statements176
Financial S
tatements
The following table provides a summary of fully vested options outstanding and exercisable for ordinary shares
at December 31, 2014:
OPTIONS FOR ORDINARy SHARES
Options outstanding Options exercisable
Range of exercise price in € Number of options
Weighted-average remaining
contractual life in years
Weighted-average exercise price
in € Number of options
Weighted-average remaining
contractual life in years
Weighted-average exercise price
in €
5.01 – 10.00 97,407 0.50 9.83 97,407 0.50 9.83
10.01 – 15.00 716,360 1.45 12.14 716,360 1.45 12.14
15.01 – 20.00 2,249,066 2.29 18.22 2,249,066 2.29 18.22
20.01 – 25.00 2,262,171 3.48 23.73 2,262,171 3.48 23.73
25.01 – 30.00 3,318,135 4.51 26.18 0
30.01 – 35.00 2,032,815 6.63 32.27 0
35.01 – 40.00 2,227,812 7.58 36.92 0
12,903,766 4.61 26.27 5,325,004 2.65 19.59
At December 31, 2014, the aggregate intrinsic value of exer-
cisable options for ordinary shares was € 126 million.
At December 31, 2014, total unrecognized compensation
cost related to non-vested options granted under the 2008
Plan and the 2013 LTIP was € 30 million. This cost is expected
to be recognized over a weighted-average period of 2.8 years.
Fresenius mediCal Care ag & CO. kgaa
stOCk OptiOn plans
Fresenius medical Care ag & Co. kgaa long term incentive program 2011On May 12, 2011, the Fresenius Medical Care AG & Co. KGaA
Stock Option Plan 2011 (2011 SOP) was established by reso-
lution of Fresenius Medical Care AG & Co. KGaA’s (FMC-AG &
Co. KGaA) Annual General Meeting (AGM). The 2011 SOP,
together with the Phantom Stock Plan 2011, which was estab-
lished by resolution of Fresenius Medical Care Management
AG’s (FMC Management AG) Management and Supervisory
Boards, forms FMC-AG & Co. KGaA’s Long Term Incentive Pro-
gram 2011 (2011 Incentive Program). Under the 2011 Incen-
tive Program, participants may be granted awards, which will
consist of a combination of stock options and phantom stock.
Awards under the 2011 Incentive Program will be granted
over a five-year period and can be granted on the last Monday
in July and / or the first Monday in December each year. Gener-
ally, and prior to the respective grant, the participants will
be able to choose how much of the granted value is granted in
the form of stock options and phantom stock in a predefined
range of 75 : 25 to 50 : 50, stock options vs. phantom stock. For
grants made in the year 2014 and for participants not belong-
ing to FMC Management AG’s Management Board, the grant
ratio was predefined at 50 : 50. The number of phantom shares
that plan participants may choose to receive instead of stock
options within the aforementioned predefined range is deter-
mined on the basis of a fair value assessment pursuant to a
binomial model. With respect to grants made in July, this fair
value assessment will be conducted on the day following
FMC-AG & Co. KGaA’s AGM and with respect to the grants made
in December, on the first Monday in October. The awards
under the 2011 Incentive Program are subject to a four-year
vesting period. The vesting of the awards granted is subject
to achievement of performance targets. The 2011 Incentive
Program was established with a conditional capital increase
up to € 12 million subject to the issue of up to 12 million

Consolidated Financial statements Other notes 177
Fin
anci
al S
tate
men
ts
non-par value bearer ordinary shares with a nominal value
of € 1.00, each of which can be exercised to obtain one
ordinary share.
Members of the Management Board of FMC Manage-
ment AG, members of the management boards of FMC-AG &
Co. KGaA’s affiliated companies and the managerial staff
members of FMC-AG & Co. KGaA and of certain affiliated com-
panies are entitled to participate in the 2011 Incentive Pro-
gram. With respect to participants who are members of FMC
Management AG’s Management Board, FMC Management
AG’s Supervisory Board has sole authority to make plan inter-
pretations, decide on certain adjustments and to grant awards
under the 2011 Incentive Program. FMC Management AG
has such authority with respect to all other participants in the
2011 Incentive Program.
The exercise price of stock options granted under the 2011
Incentive Program shall be the average stock exchange price
on the Frankfurt Stock Exchange of FMC-AG & Co. KGaA’s
ordi nary shares during the 30 calendar days immediately prior
to each grant date. Stock options granted under the 2011
Incentive Program have an eight-year term and can be exer-
cised only after a four-year vesting period. Stock options
granted under the 2011 Incentive Program to U.S. participants
are non-qualified stock options under the United States Inter-
nal Revenue Code of 1986, as amended. Options under the
2011 Incentive Program are not transferable by a participant
or a participant’s heirs, and may not be pledged, assigned,
or disposed of otherwise.
Phantom stock under the 2011 Incentive Program entitles
the holders to receive payment in euro from FMC-AG & Co.
KGaA upon exercise of the phantom stock. The payment per
phantom share in lieu of the issuance of such stock shall be
based upon the closing stock exchange price on the Frankfurt
Stock Exchange of one of FMC-AG & Co. KGaA’s ordinary
shares on the exercise date. Phantom stock will have a five-
year term and can be exercised only after a four-year vesting
period, beginning with the grant date, however a shorter
period may apply for certain exceptions. For participants who
are U.S. tax payers, the phantom stock is deemed to be exer-
cised in any event in the month of March following the end of
the vesting period.
stock Option plan 2006The Fresenius Medical Care AG & Co. KGaA Stock Option Plan
2006 (Amended 2006 Plan) was established with a condi-
tional capital increase up to € 12.8 million subject to the issue
of up to 5 million non-par value bearer ordinary shares with
a nominal value of € 1.00, each of which can be exercised to
obtain one ordinary share. In connection with the share split
affected in 2007, the principal amount was adjusted to the
same proportion as the share capital out of the capital increase
up to € 15 million by the issue of up to 15 million new non-
par value bearer ordinary shares.
After December 2010, no further grants were issued
under the Amended 2006 Plan. Options granted under this
plan are exercisable through December 2017.
Options granted under the Amended 2006 Plan to U.S. par-
ticipants are non-qualified stock options under the United
States Internal Revenue Code of 1986, as amended. Options
under the Amended 2006 Plan are not transferable by a par-
ticipant or a participant’s heirs, and may not be pledged,
assigned, or otherwise disposed of.
2001 international stock Option planUnder the Fresenius Medical Care 2001 International Stock
Incentive Plan (2001 Plan), options in the form of convertible
bonds with a principal of up to € 10.24 million were issued
to the members of the Management Board and other employ-
ees of FMC-AG & Co. KGaA representing grants for up to 4 mil-
lion non-voting preference shares. The convertible bonds
originally had a par value of € 2.56 and bear interest at a rate
of 5.5%. In connection with the share split affected in 2007,
the principal amount was adjusted in the same proportion as
the share capital out of the capital increase and the par
value of the convertible bonds was adjusted to € 0.85 without
affecting the interest rate.
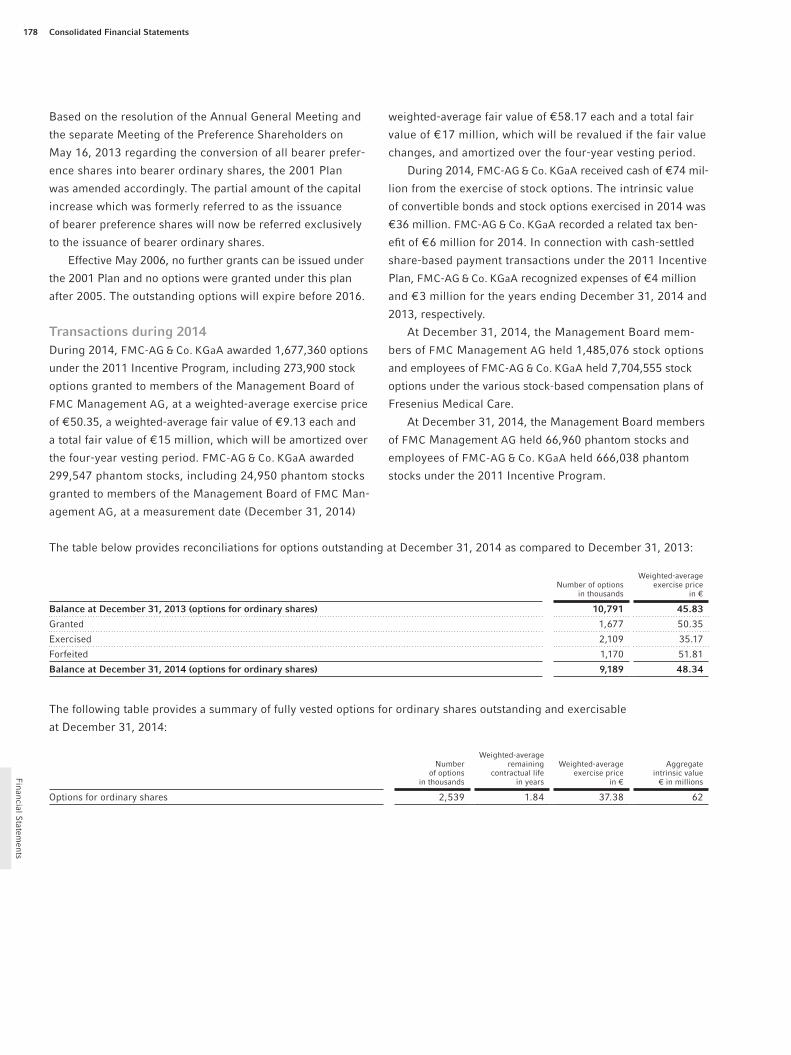
Consolidated Financial Statements178
Financial S
tatements
Based on the resolution of the Annual General Meeting and
the separate Meeting of the Preference Shareholders on
May 16, 2013 regarding the conversion of all bearer prefer-
ence shares into bearer ordinary shares, the 2001 Plan
was amended accordingly. The partial amount of the capital
increase which was formerly referred to as the issuance
of bearer preference shares will now be referred exclusively
to the issuance of bearer ordinary shares.
Effective May 2006, no further grants can be issued under
the 2001 Plan and no options were granted under this plan
after 2005. The outstanding options will expire before 2016.
transactions during 2014During 2014, FMC-AG & Co. KGaA awarded 1,677,360 options
under the 2011 Incentive Program, including 273,900 stock
options granted to members of the Management Board of
FMC Management AG, at a weighted-average exercise price
of € 50.35, a weighted-average fair value of € 9.13 each and
a total fair value of € 15 million, which will be amortized over
the four-year vesting period. FMC-AG & Co. KGaA awarded
299,547 phantom stocks, including 24,950 phantom stocks
granted to members of the Management Board of FMC Man-
agement AG, at a measurement date (December 31, 2014)
The table below provides reconciliations for options outstanding at December 31, 2014 as compared to December 31, 2013:
Number of options in thousands
Weighted-average exercise price
in €
balance at december 31, 2013 (options for ordinary shares) 10,791 45.83
Granted 1,677 50.35
Exercised 2,109 35.17
Forfeited 1,170 51.81
balance at december 31, 2014 (options for ordinary shares) 9,189 48.34
The following table provides a summary of fully vested options for ordinary shares outstanding and exercisable
at December 31, 2014:
Number of options
in thousands
Weighted-average remaining
contractual life in years
Weighted-average exercise price
in €
Aggregate intrinsic value
€ in millions
Options for ordinary shares 2,539 1.84 37.38 62
weighted-average fair value of € 58.17 each and a total fair
value of € 17 million, which will be revalued if the fair value
changes, and amortized over the four-year vesting period.
During 2014, FMC-AG & Co. KGaA received cash of € 74 mil-
lion from the exercise of stock options. The intrinsic value
of convertible bonds and stock options exercised in 2014 was
€ 36 million. FMC-AG & Co. KGaA recorded a related tax ben-
efit of € 6 million for 2014. In connection with cash-settled
share-based payment trans actions under the 2011 Incentive
Plan, FMC-AG & Co. KGaA recognized expenses of € 4 million
and € 3 million for the years ending December 31, 2014 and
2013, respectively.
At December 31, 2014, the Management Board mem-
bers of FMC Management AG held 1,485,076 stock options
and employees of FMC-AG & Co. KGaA held 7,704,555 stock
options under the various stock-based compensation plans of
Fresenius Medical Care.
At December 31, 2014, the Management Board members
of FMC Management AG held 66,960 phantom stocks and
employees of FMC-AG & Co. KGaA held 666,038 phantom
stocks under the 2011 Incentive Program.

Consolidated Financial statements Other notes 179
Fin
anci
al S
tate
men
ts
At December 31, 2014, total unrecognized compensation
cost related to non-vested options granted under all plans was
€ 24 million. This cost is expected to be recognized over a
weighted-average period of 1.95 years.
34. related party transaCtiOnsProf. Dr. med. D. Michael Albrecht, a member of the Super-
visory Board of Fresenius SE & Co. KGaA, is medical director
and spokesman of the management board of the University
Hospital Carl Gustav Carus Dresden and a member of the
supervisory board of the University Hospital Aachen. Further-
more, he was a member of the supervisory board of the
University Hospital Magdeburg until October 3, 2013 and a
member of the supervisory board of the University Hospital
Rostock until February 28, 2013. The Fresenius Group main-
tains business relations with these hospitals in the ordinary
course and under customary conditions.
Prof. Dr. h. c. Roland Berger, a member of the Supervisory
Board of Fresenius Management SE and of Fresenius SE &
Co. KGaA, is a partner of Roland Berger Strategy Consultants
Holding GmbH. In 2014, after discussion and approval by
the Supervisory Board of Fresenius Management SE and
Fresenius SE & Co. KGaA, the Fresenius Group paid € 3.1 mil-
lion to affiliated companies of the Roland Berger group for
consulting serv ices rendered (2013: € 2.9 million).
Klaus-Peter Müller, a member of the Supervisory Board
of Fresenius Management SE and of Fresenius SE & Co. KGaA,
is the chairman of the supervisory board of Commerzbank
AG. The Fresenius Group maintains business relations with
Commerzbank under customary conditions. In 2014, the
Fresenius Group paid in aggregate € 1.1 million to Commerz-
bank for financing commitments, in connection with Senior
Notes issuances and a capital increase from company’s funds
(stock split) (2013: € 1.4 million).
Dr. Gerhard Rupprecht, who died in an accident in August
2014, was a member of the Supervisory Boards of Fresenius
Management SE and of Fresenius SE & Co. KGaA as well as of
the administrative board of Allianz France SA. In 2014, the
Fresenius Group paid € 11.6 million (2013: € 5.3 million) for
insurance premiums to the Allianz group under customary
conditions.
Dr. Dieter Schenk, deputy chairman of the Supervisory
Board of Fresenius Management SE, is a partner in the inter-
national law firm Noerr LLP, which provides legal serv ices
to the Fresenius Group. In 2014, after discussion and approval
of each mandate by the Supervisory Board of Fresenius Man-
agement SE, the Fresenius Group paid or processed for pay-
ment in December 2014 about € 1.8 million to this law firm
for legal services rendered (2013: € 1.5 million). Not included
in the amount paid or processed for payment are such pay-
ments made in the fiscal year 2014 that had already been pro-
cessed for payment in 2013 and have therefore already been
reported for the fiscal year 2013.
In 2014, € 11 million (2013: € 9 million) were paid to
Fresenius Management SE as compensation for the Manage-
ment Board and the Supervisory Board, general partners’
fees and other reimbursements of out-of pocket expenses. At
December 31, 2014, there were outstanding liabilities pay-
able to Fresenius Management SE in the amount of € 22 mil-
lion (December 31, 2013: € 21 million), consisting mainly of
pension obligations.
The payments mentioned in this note are net amounts. In
addition, VAT and insurance tax were paid.
35. subseQuent eVentsFresenius announced on January 12, 2015, that its pharma-
ceutical manufacturing facility in Grand Island, N.y., has
achieved the upgraded status of “voluntary action indicated”
(VAI) following an October 2014 inspection. The status
change is an improvement from the “official action indicated”
status the facility had been operating under. The new VAI
classification permits FDA approval of new Fresenius Kabi
products at the plant.
On February 12, 2015, Fresenius SE & Co. KGaA refinanced
the revolving credit facilities and the term loan A tranches
under the 2013 Senior Credit Agreement in a total amount of
€ 3,044 million. The maturity was extended by two years
to June 28, 2020.
On February 16, 2015, Fresenius Kabi has sold its German
subsidiary CFL GmbH to NewCo Pharma GmbH. Fresenius
Kabi will remain active in compounding. In Germany, the focus
will be on parenteral nutrition products. In 2014, CFL GmbH
had sales of € 77 million.
There have been no significant changes in the Fresenius
Group’s operating environment following the end of the fiscal
year 2014 until February 24, 2015. No other events of mate-
rial importance on the assets and liabilities, financial position,
and results of operations of the Group have occurred follow-
ing the end of the fiscal year.

Consolidated Financial Statements180
Financial S
tatements
nOtes in aCCOrdanCe With the
german COmmerCial COde (hgb)
36. COmpensatiOn OF the management bOard and the superVisOry bOardIndividualized information regarding the compensation of the
members of the Management Board and of the Supervisory
Board is disclosed in the audited Compensation Report (see
page 23 ff.), which is part of the Management Report.
The compensation of the Management Board is, as a whole,
performance-based and was composed of three elements in
the fiscal year 2014:
▶ non-performance-based compensation (fixed compensa-
tion and fringe benefits)
▶ short-term performance-based compensation (one-year
variable compensation)
▶ components with long-term incentive effects (several-year
variable compensation comprising stock options, share-
based compensation with cash settlement (phantom stocks)
and postponed payments of the one-year variable com-
pensation)
The cash compensation paid to the Management Board for
the performance of its responsibilities was € 11,462 thousand
(2013: € 11,044 thousand). Thereof, € 5,016 thousand (2013:
€ 5,044 thousand) is not performance-based and € 6,446 thou-
sand (2013: € 6,000 thousand) is performance-based. The
amount of the performance-based compensation depends on
the achievement of targets relating to the net income of the
Fresenius Group and business segments. As a long-term incen-
tive component, the members of the Management Board
received 315,000 stock options under the Fresenius SE & Co.
KGaA Stock Option Plan 2013 and 74,700 stock options
under the Fresenius Medical Care AG & Co. KGaA Stock Option
Plan 2011 and a share-based compensation with cash set-
tlement in an amount of € 3,743 thousand.
The payment of a part of the performance-based compen-
sation in an amount of € 271 thousand was postponed by
two years as a long-term incentive component. The payment
depends on the achievement of targets relating to the net
income attributable to shareholders of Fresenius SE & Co. KGaA
of the years 2015 and 2016. The total compensation of the
Management Board was € 18,759 thousand (2013: € 18,407
thousand).
The total compensation paid to the Supervisory Boards
of Fresenius SE & Co. KGaA and Fresenius Management SE
and their committees was € 2,961 thousand in 2014 (2013:
€ 2,920 thousand). Of this amount, € 206 thousand was fixed
compensation (2013: € 213 thousand), € 100 thousand was
compensation for committees services (2013: € 100 thousand),
and € 2,655 thousand was variable compensation (2013:
€ 2,607 thousand).
In 2014, based on pension commitments to former mem-
bers of the Management Board, € 1,049 thousand (2013:
€ 1,064 thousand) was paid. The pension obligation for these
persons amounted to € 18,465 thousand in 2014 (2013:
€ 17,389 thousand).
In the fiscal years 2014 and 2013, no loans or advance
payments of future compensation components were made
to members of the Management Board of Fresenius Manage-
ment SE.

181
Fin
anci
al S
tate
men
ts
Consolidated Financial statements Notes in accordance with the German Commercial Code (HGB)
37. auditOr’s FeesIn 2014 and 2013, fees for the auditor KPMG AG Wirtschafts prüfungsgesellschaft were expensed as follows:
2014 2013
€ in millions total germany Total Germany
Audit fees 16 6 15 5
Audit-related fees 1 1 2 1
Tax consulting fees 1 0 1 –
Other fees 6 6 4 4
total auditor’s fees 24 13 22 10
The leading auditor has been responsible for the audit of the
consolidated financial statements since 2012.
38. COrpOrate gOVernanCeFor each consolidated stock exchange listed entity, the decla-
ration pursuant to Section 161 of the German Stock Corpo-
ration Act (Aktiengesetz) has been issued and made available
to shareholders on the website of Fresenius SE & Co. KGaA
(www.fresenius.com), and of Fresenius Medical Care AG & Co.
KGaA (www.freseniusmedicalcare.com).
39. prOpOsal FOr the distributiOn OF earningsThe general partner and the Supervisory Board of Fresenius
SE & Co. KGaA propose to the Annual General Meeting that
the earnings for 2014 of Fresenius SE & Co. KGaA are distrib-
uted as follows:
in €
Payment of a dividend of € 0.44 per bearer ordinary share on the 541,532,600 ordinary shares entitled to dividend 238,274,344.00
Balance to be carried forward 942,025.95
retained earnings 239,216,369.95

Consolidated Financial Statements182
Financial S
tatements
Bad Homburg v. d. H., February 24, 2015
Fresenius SE & Co. KGaA,
represented by:
Fresenius Management SE, its general partner
The Management Board
Dr. U. M. Schneider Dr. F. De Meo Dr. J. Götz
M. Henriksson R. Powell S. Sturm Dr. E. Wastler
40. respOnsibility statement“To the best of our knowledge, and in accordance with the
applicable reporting principles, the consolidated financial
statements give a true and fair view of the assets, liabilities,
financial position and profit or loss of the Group, and the
Group management report includes a fair review of the devel-
opment and performance of the business and the position of
the Group, together with a description of the principal oppor-
tunities and risks associated with the expected development
of the Group.”

183
Aud
itor
’s R
epor
t
auditor’s report
auditOr’s repOrt
To the Fresenius SE & Co. KGaA
We have audited the consolidated financial statements pre-
pared by the Fresenius SE & Co. KGaA, Bad Homburg v. d.
Höhe, comprising the consolidated statement of income, the
consolidated statement of comprehensive income, the consol-
idated statement of financial position, the consolidated state-
ment of cash flows, the consolidated statement of changes in
equity and the notes to the consolidated financial statements
for the business year from January 1 to December 31, 2014.
The preparation of the consolidated financial statements in
accord ance with Accounting Principles Generally Accepted in
the United States of America (U.S. GAAP) is the responsibility
of the legal representative of the Company. Our responsibility
is to express an opinion on the consolidated financial state-
ments based on our audit. In addition, we have been engaged
to express an opinion as to whether the voluntarily prepared
group management report is in agreement with the group man-
agement report of Fresenius SE & Co. KGaA, Bad Hom burg
v. d. Höhe, prepared in accordance with § 290 and § 315 HGB
[Handels gesetz buch “German Commercial Code”] apart from
appropriate incorporation of U.S. GAAP financial data.
We conducted our audit of the consolidated financial state-
ments in accordance with § 317 HGB and German generally
accepted standards for the audit of financial statements pro-
mulgated by the Institut der Wirtschaftsprüfer (IDW). Those
standards require that we plan and perform the audit such that
misstatements materially affecting the presentation of the
net assets, financial position and results of operations in the
consolidated financial statements in accordance with the
applicable financial reporting framework and in the group
management report are detected with reasonable assurance.
Knowledge of the business activities and the economic and
legal environment of the Group and expectations as to possi-
ble misstatements are taken into account in the determina-
tion of audit procedures. The effectiveness of the accounting-
related internal control system and the evidence supporting
the disclosures in the consolidated financial statements and
the group management report are examined primarily on a
test basis within the framework of the audit. The audit includes
assessing the annual financial statements of those entities
included in consolidation, the determination of entities to be
included in consolidation, the accounting and consolidation
principles used and significant estimates made by the legal
representative, as well as evaluating the overall presentation
of the consolidated financial statements. We believe that our
audit provides a reasonable basis for our opinion.
Our audit has not led to any reservations.
In our opinion, based on the findings of our audit, the con-
solidated financial statements comply with U.S. GAAP and
give a true and fair view of the net assets, financial position
and results of operations of the Group in accordance with
these requirements. The voluntarily prepared group manage-
ment report is consistent with the consolidated financial
statements prepared in accordance with U.S. GAAP and is,
apart from appropriate incorporation of U.S. GAAP financial
data, in agreement with the group management report of
Fresenius SE & Co. KGaA prepared in accordance with § 290
and § 315 HGB, on which we issued an unqualified statu-
tory audit opinion. Based on this, the group management
report as a whole provides a suitable view of the Group’s posi-
tion and suitably presents the opportunities and risks of
future development.
Frankfurt am Main, February 24, 2015
KPMG AG
Wirtschaftsprüfungsgesellschaft
Rohrbach Walter
German Public Auditor German Public Auditor
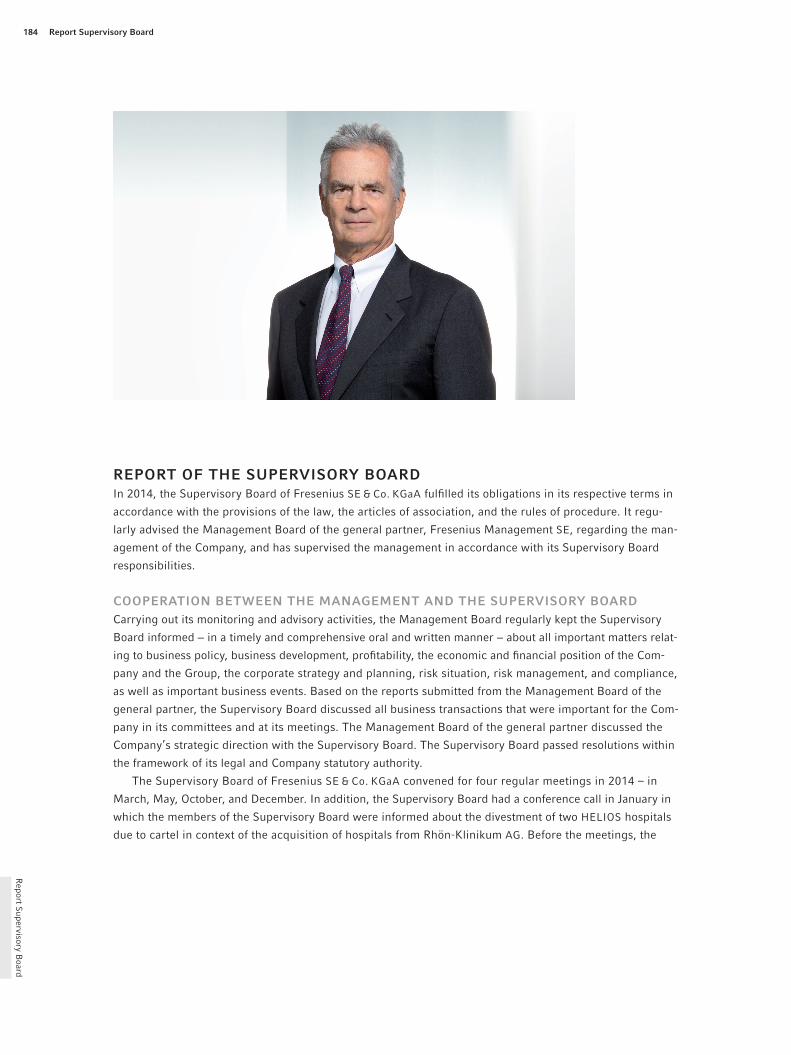
Report S
upervisory Board
Report Supervisory Board184
REPORT OF THE SUPERVISORY BOARDIn 2014, the Supervisory Board of Fresenius SE & Co. KGaA fulfilled its obligations in its respective terms in
accordance with the provisions of the law, the articles of association, and the rules of procedure. It regu-
larly advised the Management Board of the general partner, Fresenius Management SE, regarding the man-
agement of the Company, and has supervised the management in accordance with its Supervisory Board
responsibilities.
COOPERATION BETWEEN THE MANAGEMENT AND THE SUPERVISORY BOARDCarrying out its monitoring and advisory activities, the Management Board regularly kept the Supervisory
Board informed − in a timely and comprehensive oral and written manner − about all important matters relat-
ing to business policy, business development, profitability, the economic and financial position of the Com-
pany and the Group, the corporate strategy and planning, risk situation, risk management, and compliance,
as well as important business events. Based on the reports submitted from the Management Board of the
general partner, the Supervisory Board discussed all business transactions that were important for the Com-
pany in its committees and at its meetings. The Management Board of the general partner discussed the
Company’s strategic direction with the Supervisory Board. The Supervisory Board passed resolutions within
the framework of its legal and Company statutory authority.
The Supervisory Board of Fresenius SE & Co. KGaA convened for four regular meetings in 2014 – in
March, May, October, and December. In addition, the Supervisory Board had a conference call in January in
which the members of the Supervisory Board were informed about the divestment of two HELIOS hospitals
due to cartel in context of the acquisition of hospitals from Rhön-Klinikum AG. Before the meetings, the

Rep
ort
Sup
ervi
sory
Boa
rd
Report Supervisory Board 185
Management Board of the general partner sent detailed reports and comprehensive approval documents to
the members of the Supervisory Board. At the meetings, the Supervisory Board discussed in detail the busi-
ness development and any important corporate decisions based on the reports from the general partner’s
Management Board.
All matters requiring Supervisory Board approval were submitted with sufficient time for proper scrutiny.
After reviewing the related approval documents and detailed consultation with the Management Board of
the general partner, the Supervisory Board approved all matters submitted to it.
The Supervisory Board was also informed about any important business events occurring between meet-
ings. In a few cases, it passed resolutions by written proceeding in lieu of a meeting. In addition, the Chair-
man of the general partner’s Management Board regularly informed the Chairman of the Supervisory Board
in separate meetings about the latest development of the business and forthcoming decisions and discussed
them with him.
Every member of the Supervisory Board of Fresenius SE & Co. KGaA attended at least half of the regular
Supervisory Board Meetings in 2014.
MAIN FOCUS OF THE SUPERVISORY BOARD’S ACTIVITIESIn 2014, the Supervisory Board mostly focused its monitoring and consulting activities on business opera-
tions and investments by the business segments. Furthermore, the Supervisory Board thoroughly reviewed
and discussed all other significant business activities with the Management Board. The main consulting focus
was on the stock split and on acquisitions, especially at Fresenius Medical Care in the area of Care Coordi-
nation and at Fresenius Kabi regarding a planned joint venture in Russia, as well as the development and
integration of the hospitals acquired from Rhön-Klinikum AG. The Supervisory Board discussed in detail the
2015 budget and the mid-term planning of the Fresenius Group. It also focused on the strategies of the
business segments, especially on the business perspectives for Fresenius HELIOS. At its meetings and within
the Audit Committee, the Supervisory Board also kept itself regularly informed about the Group’s risk situa-
tion and risk management activities as well as compliance.
CORPORATE GOVERNANCEThe Supervisory Board and the Management Board of the general partner jointly issued a Declaration of Con-
formity in accordance with the German Corporate Governance Code pursuant to Section 161 of the German
Stock Corporation Act (AktG) on December 20, 2014.

Report S
upervisory Board
Report Supervisory Board186
The Management Board of the general partner and the Supervisory Board of Fresenius SE & Co. KGaA have
a duty to act in the best interests of the Company. In performing their activities, they do not pursue personal
interests or bestow unjustified benefits on others. Any sideline activities or transactions with the Company
by members of the corporate bodies must be reported to, and approved by, the Supervisory Board.
Prof. Dr. med. D. Michael Albrecht is a member of the Supervisory Board of our Company and is medical
director and spokesman for the management board of the University Hospital Carl Gustav Carus Dresden as
well as a member of the supervisory board of the University Hospital in Aachen. The Fresenius Group main-
tains regular business relationships with these hospitals in the ordinary course under customary conditions.
Klaus-Peter Müller is a member of the Supervisory Boards of our Company and of Fresenius Management SE,
as well as chairman of the supervisory board of Commerzbank AG, with which the Fresenius Group main-
tains business relationships under customary conditions. In 2014, the Fresenius Group paid € 1.1 million to
Commerzbank AG for capital market financing and for carrying out the share split. Until his death on August 8,
2014, Dr. Gerhard Rupprecht was a member of the Supervisory Board of our Company and of Fresenius
Management SE, as well as a member of the supervisory board of Allianz France SA. In 2014, the Fresenius
Group paid € 11.6 million for insurance premiums to Allianz under customary conditions.
There are no direct consultancy or other service relationships between the Company and any given mem-
ber of the Supervisory Board. In 2014, the Fresenius Group had consultancy contracts with the management
consultancy firm Roland Berger Strategy Consultants GmbH, an affiliated company of the management con-
sultancy firm Roland Berger Strategy Consultants Holding GmbH. Prof. Dr. h. c. Roland Berger is a member of
the Supervisory Board of Fresenius Management SE and a member of the Supervisory Board of our Com-
pany. Prof. Dr. h. c. Berger is, at the same time, a partner in Roland Berger Strategy Consultants Holding GmbH.
The Fresenius Group paid approximately € 3.1 million (2013: € 2.9 million) to companies of the Roland Berger
Group associated with this company. The Supervisory Board closely examined this mandate and approved
it in the fiscal year 2013. Prof. Dr. h. c. Berger abstained from voting. The respective approval was made on
the basis of a written submission to the Supervisory Board and prior to the payment of the invoices for the
services. Work on this mandate given in the 2013 fiscal year continued in the fiscal year 2014.
Furthermore, various companies of the Fresenius Group were advised by affiliated companies of the inter-
nationally acting law firm Noerr. Dr. Dieter Schenk, member of the Supervisory Board of Fresenius Manage-
ment SE and Deputy Chairman of the same, is also a partner of the law firm Noerr LLP. In 2014, the Fresenius

Rep
ort
Sup
ervi
sory
Boa
rd
Report Supervisory Board 187
Group paid or processed for payment in December about € 1.8 million to the law firm Noerr (2013: € 1.5 mil-
lion). This corresponds to 1% of the total amount paid by the Fresenius Group for services and legal advice
in 2014 (2013: 1%). Not included in the amount paid or processed for payment are such payments made in
2014 that had already been processed for payment in 2013, and have therefore already been reported for the
2013 fiscal year. Of the total amount for the 2014 fiscal year, about € 0.7 million was attributable to services
for Group companies not related to the business segment Fresenius Medical Care. The services rendered for
Group companies of the business segment Fresenius Medical Care require separate approval by the Super-
visory Boards of Fresenius Medical Care Management AG and Fresenius Medical Care AG & Co. KGaA. The
Supervisory Board of Fresenius Management SE, of which Dr. Schenk is a member, closely examined this man-
date and approved it. Dr. Schenk abstained from voting. The Supervisory Board of Fresenius SE & Co. KGaA,
of which Dr. Schenk is not a member, dealt with the amounts for legal services paid to the law firm Noerr in
relation to the amounts paid to other law firms.
The payments mentioned in this section are net amounts in euros. VAT was paid also.
For more information on corporate governance at Fresenius, please refer to the Corporate Governance
Declaration and Report on pages 11 to 35 of the Annual Report. Fresenius has disclosed the information on
related parties in its quarterly reports and on page 179 of the Annual Report.
WORK OF THE COMMITTEESThe Audit Committee held three meetings and four conference calls in 2014. The main focus of its monitoring
activities was on the preliminary audit of the annual financial statements of Fresenius SE & Co. KGaA and the
Group for 2012 and discussions with the auditors about their reports and the terms of reference of the audit.
Another matter dealt with by the Audit Committee was its recommendation to the Supervisory Board regarding
which auditing firm to propose to the Annual General Meeting for election as auditor for the annual financial
statements of Fresenius SE & Co. KGaA and the Group for 2014. The Supervisory Board’s proposal to the
Annual General Meeting in 2014 to elect KPMG AG Wirtschaftsprüfungsgesellschaft, Berlin, as auditor was
based on a recommendation to this effect by the Audit Committee. The Audit Committee also reviewed the
2014 quarterly reports, the controlling reports on the development of the acquisitions, the compliance, the risk

Report S
upervisory Board
Report Supervisory Board188
management system, the internal control system, and the internal auditing system. The Chairman of the Audit
Committee reported regularly in the following Supervisory Board meetings on the work of the committee.
The Company’s Nomination Committee did not meet in 2014.
The Joint Committee, whose approval is necessary for certain important transactions of Fresenius SE & Co.
KGaA and for certain legal acts between the Company and the Else Kröner-Fresenius Foundation, did not
meet in 2014 because no transactions were effected that required the Joint Committee’s approval.
There is no Mediation Committee because the Supervisory Board of Fresenius SE & Co. KGaA does not
appoint the Management Board members of Fresenius Management SE.
For more information about the committees, their composition, and their work methods, please refer to
the Corporate Governance Declaration and Report on pages 15, 16, and 191 of the Annual Report.
PERSONNELDr. Gerhard Rupprecht, a member of the Supervisory Board of Fresenius SE & Co. KGaA was killed in an acci-
dent on August 8, 2014. Dr. Rupprecht joined the Supervisory Board of the now Fresenius SE & Co. KGaA in
October 2004, and as Deputy Chairman since March 2011 made important contributions to the Company’s
successful development. We will retain respectful memories of Dr. Rupprecht.
The Supervisory Board of Fresenius SE & Co. KGaA will propose that the next Annual General Meeting
elect Mr. Michael Diekmann, who will serve as Chief Executive Officer of Allianz SE until May 2015, to the
Supervisory Board.
In 2014, there were no changes in the composition of the Management Board of the general partner
Fresenius Management SE.
FINANCIAL STATEMENTS AND CONSOLIDATED FINANCIAL STATEMENTSThe accounting records, the financial statements prepared according to the German Commercial Code (HGB),
and the 2014 Management Report of the Company were audited by KPMG AG Wirtschaftsprüfungsgesell-
schaft, Berlin. The firm was elected as auditor in accordance with the resolution passed at the Annual General
Meeting of Fresenius SE & Co. KGaA on May 16, 2014, and was subsequently commissioned by the Super-
visory Board. The auditors of KPMG issued their unqualified audit opinion for these statements. The same
applies to the Company’s consolidated financial statements, prepared according to IFRS accounting princi-
ples, and to the regulations that govern these statements pursuant to Section 315a of the German Commercial
Code (HGB). It also applies to the Company’s consolidated financial statements, which are prepared voluntarily
according to U.S. GAAP.

Rep
ort
Sup
ervi
sory
Boa
rd
Report Supervisory Board 189
The financial statements, the consolidated financial statements, the Management Reports, and the auditor’s
reports were submitted to each member of the Company’s Supervisory Board within the required time. At
their meetings on March 12 and 13, 2015, the Audit Committee and then the Supervisory Board discussed
all the documents in detail.
The auditors delivered a detailed report on the results of the audit at each of these meetings. They found
no weaknesses in the risk management system and the internal control system with regard to the accounting
process. The auditors attended all meetings of the Supervisory Board and all meetings and conference calls
of the Audit Committee.
The Audit Committee and the Supervisory Board approved the auditor’s findings. Also the Audit Com-
mittee’s and the Supervisory Board’s own review found no objections to the Company’s financial statements
and Management Report or the consolidated financial statements and the Group Management Reports.
At its meeting on March 13, 2015, the Supervisory Board approved the financial statements and Manage-
ment Reports presented by the general partner and the statements contained therein with respect to future
development.
The Supervisory Board concurs with the general partner’s proposal on the allocation of the 2014 dis-
tributable profit.
The Supervisory Board would like to thank the members of the Management Board of the general partner
and all employees for their outstanding achievements.
Bad Homburg v. d. H., March 13, 2015
The Supervisory Board
Dr. Gerd Krick
Chairman

Boards
Boards190
SUPERVISORY BOARD FRESENIUS SE & CO. KGAA
Dr. Gerd Krick
Former Chairman of Fresenius AG
Chairman
OfficesSupervisory BoardFresenius Management SE (Chairman)Fresenius Medical Care AG & Co. KGaA (Chairman)Fresenius Medical Care Management AGVAMED AG, Austria (Chairman)
Prof. Dr. med. D. Michael Albrecht
Medical Director and Spokesman of the
Management Board of the Universitäts-
klinikum Carl Gustav Carus Dresden
OfficesSupervisory BoardGÖK Consulting AGUniversitätsklinikum Aachen
Prof. Dr. h. c. Roland Berger
Management Consultant
OfficesSupervisory BoardFresenius Management SEPrime Office REIT-AG (until January 22, 2014, Chairman)Prime Office AG (since January 22, 2014 until May 5, 2014) Schuler AGDeutsche Oppenheim Family Office AG (former: Wilhelm von Finck AG (Deputy Chairman)WMP EuroCom AG (Chairman)Rocket Internet AG (since September 1, 2014)
Administrative BoardWittelsbacher Ausgleichsfonds (until September 30, 2014)
Board of DirectorsGeox S.p.A., ItalyRCS Mediagroup S.p.A., Italy (Vice President)
Dario Anselmo Ilossi
Trade Union Officer FEMCA Cisl –
Energy, Fashion, and Chemicals
Konrad Kölbl
Full-time Works Council Member
Member of the Manual Workers’ Works
Council of VAMED-KMB Krankenhaus-
management und Betriebsführungs-
ges. m.b.H.
Chairman of the Group Works Council
of VAMED AG
Deputy Chairman of the European Works
Council of Fresenius SE & Co. KGaA
Corporate OfficesSupervisory BoardVAMED-KMB Krankenhausmanagement und Betriebsführungsges. m.b.H., Austria
Klaus-Peter Müller
Chairman of the Supervisory Board of
Commerzbank AG
OfficesSupervisory BoardCommerzbank AG (Chairman)Fresenius Management SE Linde AG
Administrative BoardLandwirtschaftliche Rentenbank (until July 3, 2014)
Board of DirectorsParker Hannifin Corporation, USA
Dieter Reuß
Full-time Works Council Member
Chairman of the Joint Works Council
of Fresenius SE & Co. KGaA /
Bad Homburg site
Deputy Chairman of the General Works
Council of Fresenius SE & Co. KGaA
(since May 14, 2014)
Gerhard Roggemann
Canaccord Genuity Ltd., London (for-
merly: Hawkpoint Partners Ltd., London)
Vice Chairman Investment Banking
(until August 31, 2014)
Edmond de Rothschild Private
Merchant Banking LLP, London
Senior Advisor and Advisory Counsel to
the Frankfurt branch (since September 1,
2014)
OfficesSupervisory BoardDeutsche Beteiligungs AG (Deputy Chairman)Deutsche Börse AG (Deputy Chairman)GP Günter Papenburg AG (Chairman)WAVE Management AG (Deputy Chairman)
Dr. Gerhard Rupprecht
(† August 8, 2014)
Former member of the Management
Board of Allianz SE
Deputy Chairman
OfficesSupervisory BoardEuler Hermes Deutschland AGFresenius Management SE
Administrative BoardAllianz France SA
BOARDS
Boa
rds
Boards 191
SUPERVISORY BOARD FRESENIUS SE & CO. KGAA
Stefan Schubert
Hospital nurse and full-time Works
Council Member
Chairman of the Works Council of
HELIOS Klinik Bad Schwalbach and of
HELIOS Klinik Idstein
Chairman of the Group Works Council
of Wittgensteiner Kliniken GmbH
Member of the European Works Council
of Fresenius SE & Co. KGaA
Corporate OfficesSupervisory BoardWittgensteiner Kliniken GmbH
Rainer Stein
Full-time Works Council Member
Chairman of the Group Works Council
of HELIOS Kliniken GmbH
Chairman of the European Works
Council of Fresenius SE & Co. KGaA
Corporate OfficesSupervisory BoardHELIOS Kliniken GmbH
Niko Stumpfögger
Secretary of the Trade Union ver.di,
Head of Company and Industry Politics
in Health Care and Social Affairs
Deputy Chairman
OfficesSupervisory BoardHELIOS Kliniken GmbH (Deputy Chairman)
Audit Committee
Prof. Dr. h. c. Roland Berger
(Chairman)
Konrad Kölbl
Dr. Gerd Krick
Gerhard Roggemann
Rainer Stein
Nomination Committee
Dr. Gerd Krick (Chairman)
Prof. Dr. h. c. Roland Berger
Dr. Gerhard Rupprecht
(† August 8, 2014)
Joint Committee 1
Dr. Dieter Schenk (Chairman)
Dr. Gerd Krick
Dr. Gerhard Rupprecht
(† August 8, 2014)
Dr. Karl Schneider
COMMITTEES OF THE SUPERVISORY BOARD
1 The committee consists equally of two members each of the Supervisory Board of Fresenius SE & Co. KGaA and of Fresenius Management SE.

Boards
Boards192
Dr. Ulf M. Schneider
Chairman
Corporate OfficesSupervisory BoardFPS Beteiligungs AG (Chairman)Fresenius Kabi AG (Chairman)Fresenius Kabi España S.A.U., SpainFresenius Medical Care Groupe France S.A.S., France (Chairman)Fresenius Medical Care Management AG (Chairman)HELIOS Kliniken GmbH (Chairman)
Board of DirectorsFresenius Kabi USA, Inc., USA FHC (Holdings) Ltd., Great Britain
OfficesBoard of DirectorsE. I. Du Pont de Nemours and Company, USA(since October 22, 2014)
Dr. Francesco De Meo
Business Segment Fresenius Helios
Corporate OfficesSupervisory BoardHELIOS Beteiligungs AG (Chairman)HELIOS Kliniken Schwerin GmbH (Chairman)
Dr. Jürgen Götz
Chief Legal and Compliance Officer,
and Labor Relations Director
Corporate OfficesSupervisory BoardFPS Beteiligungs AG (Deputy Chairman)HELIOS Kliniken GmbH Wittgensteiner Kliniken GmbH (Chairman)
Mats Henriksson
Business Segment Fresenius Kabi
Corporate OfficesSupervisory BoardFresenius Kabi Austria GmbH, Austria (Chairman)Fresenius Kabi España S.A.U., Spain Fresenius Kabi Japan K.K., JapanLabesfal – Laboratórios Almiro, S.A., Portugal
Administrative BoardFresenius Kabi Groupe France S.A., France (Chairman)Fresenius Kabi Italia S.p.A., Italy (Chairman)
Board of DirectorsFenwal, Inc., USAFenwal Canada Holdings, Inc., USAFenwal Holdings, Inc., USAFHC (Holdings) Ltd., Great Britain Fresenius Kabi Asia Pacific Ltd., Hong Kong Fresenius Kabi Oncology Ltd., India Fresenius Kabi Pharmaceuticals Holding, Inc., USA Fresenius Kabi (Singapore) Pte Ltd., Singapore Fresenius Kabi USA, Inc., USA Sino-Swed Pharmaceutical Corp, Ltd., China
Rice Powell
Business Segment
Fresenius Medical Care
Corporate OfficesManagement BoardFresenius Medical Care Management AG (Chairman)
Administrative BoardVifor Fresenius Medical Care Renal Pharma Ltd., Switzerland (Deputy Chairman)
Board of DirectorsFresenius Medical Care Holdings, Inc., USA (Chairman)
Stephan Sturm
Chief Financial Officer
Corporate Offices Supervisory BoardFPS Beteiligungs AGFresenius Kabi AG (Deputy Chairman)Fresenius Kabi España S.A.U., SpainHELIOS Kliniken GmbHLabesfal – Laboratórios Almiro, S.A., PortugalVAMED AG, Austria (Deputy Chairman)Wittgensteiner Kliniken GmbH
Administrative BoardFresenius Kabi Groupe France S.A., France
Board of DirectorsFHC (Holdings) Ltd., Great Britain
Dr. Ernst Wastler
Business Segment Fresenius Vamed
Corporate OfficesSupervisory BoardCharité CFM Facility Management GmbH (Deputy Chairman)VAMED-KMB Krankenhausmanagement und Betriebsführungsges. m.b.H., Austria (Chairman)
MANAGEMENT BOARD FRESENIUS MANAGEMENT SE(General partner of Fresenius SE & Co. KGaA)

Boa
rds
Boards 193
Dr. Gerd Krick
Chairman
Prof. Dr. h. c. Roland Berger
Klaus-Peter Müller
Dr. Gerhard Rupprecht
(† August 8, 2014)
Dr. Dieter Schenk
Lawyer and Tax Consultant
Deputy Chairman
OfficesSupervisory BoardFresenius Medical Care AG & Co. KGaA (Deputy Chairman)Fresenius Medical Care Management AG (Deputy Chairman)Gabor Shoes AG (Chairman)Greiffenberger AG (Deputy Chairman)TOPTICA Photonics AG (Chairman)
Administrative BoardElse Kröner-Fresenius-Stiftung (Chairman)
Dr. Karl Schneider
Former Spokesman of Südzucker AG
OfficesAdministrative BoardElse Kröner-Fresenius-Stiftung (Deputy Chairman)
SUPERVISORY BOARD FRESENIUS MANAGEMENT SE(General partner of Fresenius SE & Co. KGaA)

194 Glossary
Glossary
Health care terms / Products and services
Administrative data Data transmitted to sickness funds as part of the billing process or to federal agencies like the German Federal Statistical Office due to legal requirements. In Germany, this includes information about coded diagnoses and pro-cedures.
AlbuminProtein that is indicative of a patient’s general nutritional status.
Blood volume substitutesThey are used for the temporary stabilization and / or maintenance of blood volume, for exam-ple, in the event of major blood loss.
DialysisForm of renal replacement therapy where a semipermeable membrane – in peritoneal dial-ysis the peritoneum of the patient, in hemo-dialysis the membrane of the dialyzer – is used to clean a patient’s blood.
Dialysis machineThe hemodialysis process is controlled by a dial-ysis machine, which pumps blood, adds anti-coagulants, regulates the cleansing process, and controls the mixture of dialysate and its flow rate through the system.
Dialysis solution / Dialysate Fluid used in the process of dialysis in order to remove the filtered out substances and excess water from the blood.
Dialyzer Special filter used in hemodialysis for removing toxic substances, waste products of metabolic processes, and excess water from the blood. The dialyzer is sometimes referred to as the “artifi-cial kidney.”
Enteral nutrition Application of liquid nutrition as a tube or sip feed via the gastrointestinal tract.
EPO (Erythropoietin) Hormone that stimulates red blood cell produc-tion. Recombinant (i. e., artificially produced) human EPO is commonly prescribed to patients on dialysis who suffer from anemia.
FDA (U.S. Food & Drug Administration)Official authority for food observation and drug registration in the United States.
HD (Hemodialysis) A treatment method for dialysis patients where the blood of the patient is cleansed by a dia-lyzer. The solute exchange between blood and dialysate is dominated by diffusive processes.
HemoglobinComponent of red blood cells that transports oxygen around the body. An insufficient level of hemoglobin is indicative of anemia, which typically occurs in patients with chronic kidney failure. Besides dialysis, anemia is treated with iron supplements and the hormone compound erythropoietin (EPO).
GLOSSARy

195
Glo
ssar
y
Glossary
Health care terms / Products and services
Kt / V value Provides information on urea content in the blood. Urea is mostly excreted by healthy kid-neys, but for dialysis patients it must be filtered from the blood through renal replacement ther-apy. The Kt / V value shows whether a patient was detoxified effectively during dialysis.
Medicare / MedicaidA program developed by the federal U.S. Social Security Administration that reimburses health insurance companies and providers of medi-cal services for medical care to individuals over 65, people with chronic kidney failure, or the disabled.
Outpatient facility Interdisciplinary facility for outpatient care, managed by a physician. Potential shareholders of the medical care center include all service providers (such as physicians, pharmacists, health care facilities), which are authorized to treat patients with statutory health insurance.
Parenteral nutrition Application of nutrients directly into the blood-stream of the patient (intravenously). This is necessary if the condition of a patient does not allow to absorb and metabolize essential nutri-ents orally or as sip and tube feed in a suffi-cient quantity.
PD (Peritoneal dialysis) Dialysis treatment method using the patient’s peritoneum as a filter to cleanse his blood.
PhosphatePhosphate concentrations show whether treat-ing the patient with dialysis and medication is sufficient for the body to absorb phosphate ingested with food. Healthy people excrete excess phosphate via the kidney, but a diseased kidney is unable to do this. If the phosphate concentrations in the blood are too high, this can lead to severe conditions.
Prevalence Number of all patients who suffer from a specific disease within a defined period. The prevalence rate indicates the number of people with this specific disease (e. g., terminal kidney failure) treated per million population.
PPP (public-private partnership model) Public-private partnership describes a govern-ment service or private business venture that is funded and operated through a partnership of government and one or more private-sector companies. PPP accompanies in most cases with a part-privatization of governmental services.
Three-chamber bag The three-chamber bag contains all the macro-nutrients like amino acids, glucose, and lipids, as well as electrolytes in three separate cham-bers. Immediately before infusion all nutrients are mixed thoroughly within the bag simply by opening individual chambers. This reduces the risk of contamination and saves time when preparing the infusions.

196
Glossary
Glossary
Financial terms
ADR (American Depositary Receipt)Certificate that represents indirect ownership of shares in a non-U.S. company and enables trading in the United States.
Cash flow Financial key figure that shows the net balance of incoming and outgoing payments during a reporting period.
Commercial paper program Short-term unsecured promissory notes issued by corporations in need of short-term loans. Typically, commercial paper maturities range from a few days up to under two years.
Compliance Measures for adherence to laws and company policies.
Corporate Governance Designation in international parlance for com-pany management and company controlling focused on responsible, long-term value creation.
Days Sales Outstanding (DSO)
Indicates the average number of days it takes for a receivable to be paid. A shorter DSO results in less interest for the creditor and a lower risk of default.
EBIT
Earnings before interest and income taxes.
EBITDA
Earnings before interest, income taxes, depre-ciation, and amortization.
KGaA (Kommanditgesellschaft auf Aktien) A German legal form meaning partnership limited by shares. An entity with its own legal identity in which at least one general partner has full liability (personally liable shareholder, or Komplementär aktionär), while the other shareholders have an interest in the capital stock divided into shares without being person-ally liable for the debts of the company.
Organic sales growth Growth that is generated by a company’s existing businesses and not by acquisitions, divestitures, or foreign exchange impact.
OTC (Over-the-counter)Trading of securities that are not listed on a stock exchange in the respective country. Fresenius’ sponsored Level 1 ADRs are traded on the OTC market in the United States.
RatingA classification of the creditworthiness of a company accepted on the international capital market. It is published by independent rating agencies such as Standard & Poor’s, Moody’s, or Fitch based on a company analysis.
ROE (Return on Equity) Measure of a corporation’s profitability reveal-ing how much profit a company generates with the money shareholders have invested. ROE = fiscal year’s net income / total equity x 100.
ROIC (Return on Invested Capital) Calculated by: (EBIT – taxes) : Invested capitalInvested capital = total assets + amortization of goodwill (accumulated) – deferred tax assets – cash and cash equivalents – trade accounts pay-able – accruals (without pension accruals) – other liabilities not bearing interest. This key figure can be found on pages 50, 64, 75, and 81 of the Management Report.
ROOA (Return on Operating Assets) Calculated by: EBIT x 100 : operating assets (average) Operating assets = total assets – deferred tax assets – trade accounts payable – payments received on account – approved subsidies. This key figure can be found on pages 50, 64, 75, and 81 of the Management Report.
SE (Societas Europaea)Legal form of a European stock corporation. The supranational legal entity is based on European Community law. Subject to European regula-tions, the SE is treated in all member states of the European Union as a stock corporation according to the national law of the member state in which the SE is incorporated.
SOI (Scope of Inventory)
Indicates the average number of days between receiving goods as inventory and the sale of the finished product. Calculated by: (Inventories : Costs of goods sold) x 365 days.
Working Capital Current assets (including deferred assets) – accruals – trade accounts payable – other liabili-ties – deferred charges.
Xetra (Exchange Electronic Trading)Electronic trading system of Deutsche Börse AG to buy or sell stocks, foreign currencies, or other financial instruments.

197
Inde
x
Index
AAccounting policies 102 ff.Acquisitions 36 f., 38 f., 40 f., 48 f., 72 f., 77, 114 ff.ADR Inside cover, 9, 196Analyst recommendation 10Annual General Meeting 11 f.Articles of association 11 ff., 47 f.Assets and liabilities 73 ff.Authorized capital 47, 148
BBoards 12 ff., 190 ff.Business development 62 ff.
CCapital 47 f.Cash and cash equivalents 95, 105, 122Cash flow 7, 72, 95, 196Cash flow statement 71 f., 95, 168 f.Clinical nutrition 38 f., 51, 60, 79Compensation of Management Board and Supervisory Board 23 ff., 34 f., 180Compliance 16 f., 87, 196Composition of the Group 102 f.Conditional capital 47 f., 148 f.Corporate governance 11 ff., 181, 185 ff., 196Corporate governance declaration 11 ff.Corporate performance criteria 49 f.Currency and interest risk management 75, 89 f., 161 ff.Currency translation 46, 89 f., 109 f.Current assets 74, 94, 123
DDeclaration of conformity 17 ff.Dialysis care 36 f., 59, 78 f.Dialysis products 36 f., 59, 78 f.Distribution of earnings 181Diversity 19 f., 52Dividend 9 f., 72, 82, 149
EEarnings per share 65 ff., 105, 121Employees 52 f., 82Employee participation 53Enteral nutrition 38 f., 51, 60, 194Environment 55 ff.Equity ratio 74, 168
FFinancial position 68 ff.Financing 69 ff., 81, 167 f.
GGroup structure 45, 101
HHealth care industry 58 ff.Hemodialysis 36, 50, 59, 194
IInfusion therapy 38 f., 51, 60, 79Inventories 106, 122Investments 41, 49, 72 f., 81Investor Relations 10IV drugs 38 f., 51, 60, 79
MManagement Board 2 ff., 12 ff., 192Market capitalization 9
NNet income 6, 65 ff., 80 f., 121Net interest 67, 119Noncontrolling interests 74, 94, 121, 145 f.Non-current assets 74, 94, 123
OOperating cash flow 7, 71 f.Opportunities management 83Outlook 76 ff., 80 f.
PParenteral nutrition 38 f., 51, 60, 195Pensions 94, 109, 139 ff.Peritoneal dialysis 36, 50, 59, 195Personnel expenses 52, 118Procurement 53, 82
QQuality management 54 ff.
RRating 75 f., 168, 196Renal pharmaceuticals 59, 78 f.Research and development 50 f., 82Results of operations 64 ff.Risk management / risk areas 17, 83 ff.ROE Inside cover, 196ROIC Inside cover, 50, 64, 75, 81, 196ROOA Inside cover, 50, 64, 75, 81, 170, 196
SSales 6, 64 f., 80 f., 118Segment reporting 98 f., 169 ff.Share Inside cover, 8 ff.Shareholder structure 10, 146 ff.Share price development 8 f.Stock option plan 22 ff., 53, 171 ff.Strategy 48 f.Subsequent events 76 Supervisory Board 12 ff., 46 f., 184 ff., 190 ff.Supervisory Board Committees 15 f., 47, 191Sustainability 55 ff.
TTransfusion technology 38 f., 51, 60, 79
VVocational training 53
WWorking capital 70 ff., 196
INDEx

198
Imprint
Imprint
Commercial Register: Bad Homburg v. d. H.; HRB 11852 Chairman of the Supervisory Board: Dr. Gerd Krick
General Partner: Fresenius Management SE
Registered Office and Commercial Register: Bad Homburg v. d. H.; HRB 11673 Management Board: Dr. Ulf M. Schneider (President and CEO), Dr. Francesco De Meo, Dr. Jürgen Götz, Mats Henriksson, Rice Powell, Stephan Sturm, Dr. Ernst WastlerChairman of the Supervisory Board: Dr. Gerd Krick
The German version of this Annual Report is legally binding.The editorial closing date of this Annual Report was on March 18, 2015, and it was published on March 19, 2015.
The Annual Report, the financial statements of Fresenius SE & Co. KGaA, and the consolidated statements in accordance with IFRS accounting principles are available on our website and may be obtained upon request under Investor Relations.
You will find further information and current news about our company on our website at: http: // www.fresenius.com.
Forward-looking statements:This Annual Report contains forward-looking statements. These statements represent assessments that we have made on the basis of the information available to us at the time. Should the assumptions on which the statements are based on not occur, or if risks should arise – as mentioned in the risk report and the SEC filings of Fresenius Medical Care AG & Co. KGaA – the actual results could differ materially from the results currently expected.
Design concept / realization: Hilger & Boie Design, WiesbadenPrint: Ziegler GmbH & Co. KG, Neckarbischofsheim, Germany
IMPRINT
EN14_184-198_AR_Mandate.indd 198 17.03.15 14:39

190 211 9,8 211
FRESENIUS MEDICAL CARE
FRESENIUS HELIOS
FRESENIUS KABI
FRESENIUS VAMED
DIALYSIS PRODUCTS,
HEALTH CARE SERVICES
(DIALYSIS SERVICES
AND CARE COORDINATION)
HOSPITAL OPERATION
IV DRUGS, CLINICAL NUTRITION,
INFUSION THERAPY, MEDICAL DEVICES /
TRANSFUSION TECHNOLOGY
PROjECTS AND SERVICES
FOR HOSPITALS AND
OTHER HEALTH CARE FACILITIES
1 Before special items2 Net income attributable to the parent company of the respective business segment
For a detailed overview of 2013 – 2014 special items please see the reconciliation table on page 66.
2014US$ in millions
2013US$ in millions Change
2014€ in millions
2013€ in millions Change
Sales 15,832 14,610 8% 5,146 4,996 3%
EBIT 2,255 2,256 0% 873 1 926 1 - 6%
Net income 2 1,045 1,110 - 6% 468 1 487 1 - 4%
Operating cash flow 1,861 2,035 - 9% 641 488 31%
Capital expenditure / acquisitions 2,919 1,311 123% 479 448 7%
R & D expenses 122 126 - 3% 276 1 250 1 10%
Employees (December 31) 105,917 95,637 11% 32,899 31,961 3%
2014€ in millions
2013€ in millions Change
2014€ in millions
2013€ in millions Change
Sales 5,244 3,393 55% 1,042 1,020 2%
EBIT 553 1 390 42% 59 55 7%
Net income 2 400 1 275 45% 41 37 11%
Operating cash flow 558 258 116% - 9 31 - 129%
Capital expenditure /acquisitions 1,090 2,357 - 54% 22 27 - 19%
Order intake n / a n / a 840 744 13%
Employees (December 31) 68,852 42,913 60% 7,746 7,010 10%
Key
fig
ures
of
the
busi
ness
seg
men
ts
<
FINANCIAL CALENDAR
Report on 1st quarter 2015 Conference call, live webcast April 30, 2015
Annual General Meeting, Frankfurt am Main, Germany May 20, 2015
Payment of dividend 1 May 21, 2015
Report on 2nd quarter 2015 Conference call, live webcast july 30, 2015
Report on 3rd quarter 2015 Conference call, live webcast October 29, 2015
1 Subject to prior approval by the Annual General Meeting
FRESENIUS GROUP IN FIGURES (U.S. GAAP)
€ in millions 2014 2013 2012 2011 2010
Sales and Earnings
Sales 23,231 20,331 19,290 16,361 1 15,972
EBITDA 2 4,095 3,888 3,851 3,237 3,057
EBIT 2 3,158 3,045 3,075 2,563 2,418
Net income (before special items) 3 1,086 1,051 938 770 660
Depreciation and amortization 937 843 776 674 639
Earnings per share in € (before special items) 3 2.01 1.96 4 1.81 4 1.58 4 1.36 4
Cash flow and Balance sheet
Operating cash flow 2,585 2,320 2,438 1,689 1,911
Operating cash flow in % of sales 11.1% 11.4% 12.6% 10.3% 12.0%
Total assets 39,897 32,758 30,664 26,321 23,577
Non-current assets 29,869 24,786 22,551 19,170 17,142
Equity 5 15,483 13,260 12,758 10,577 8,844
Equity ratio 5 39% 41% 42% 40% 38%
Net debt 14,279 11,940 10,143 9,164 8,015
Net debt / EBITDA 6 3.41 2.51 2.56 2.83 2.62
Investments 7 3,795 3,827 4,179 2,395 1,402
Profitability
EBIT margin 2 13.6% 15.0% 15.9% 15.7% 15.1%
Return on equity after taxes (ROE) 3 11.6% 12.8% 12.3% 12.9% 13.3%
Return on operating assets (ROOA) 6 9.1% 10.6% 11.0% 10.9% 11.6%
Return on invested capital (ROIC) 6 7.5% 8.8% 9.0% 8.8% 8.9%
Dividend per share in € 0.44 8 0.42 4 0.37 4 0.32 4 0.29 4
Employees (December 31) 216,275 178,337 169,324 149,351 137,552
1 2011 sales were adjusted by - € 161 million according to a U.S. GAAP accounting change; this solely relates to Fresenius Medical Care North America.2 2013 – 2014 before special items; 2012 before one-time costs (€ 6 million) related to the offer to the shareholders of Rhön-Klinikum AG
as well as other one-time costs (€ 86 million) at Fresenius Medical Care3 Net income attributable to shareholders of Fresenius SE & Co. KGaA; 2013 – 2014 before special items; 2012 before a non-taxable
investment gain (€ 34 million) and other one-time costs (€ 17 million) at Fresenius Medical Care as well as one-time costs (€ 29 million) related to the offer to the shareholders of Rhön-Klinikum AG; 2010 – 2011 before the effects of the mark-to-market accounting of the MEB and the CVR
4 Adjusted for 1 : 3 share split5 Including noncontrolling interest6 2012 – 2014 before special items; 2014 pro forma acquisitions; 2013 pro forma excluding advances made in the amount of € 2.18 billion under a fiduciary
agreement for the acquisition of hospitals and outpatient facilities of Rhön-Klinikum AG and before integration costs of Fenwal (€ 54 million); 2012 pro forma acquisitions
7 Investments in property, plant and equipment, and intangible assets, acquisitions8 Proposal
You will find a 10-year overview on our website: www.fresenius.com under “Investor Relations.”
FRESENIUS SHARE / ADR
CONTACT
Ordinary share ADR
Securities identification no. 578 560 CUSIP 35804M105
Ticker symbol FRE Ticker symbol FSNUY
ISIN DE0005785604 ISIN US35804M1053
Bloomberg symbol FRE GR Structure Sponsored Level 1 ADR
Reuters symbol FREG.de Ratio 4 ADR = 1 share 1
Main trading location Frankfurt / Xetra Trading platform OTCQX
1 As of August 4, 2014, the ADR ratio was changed in conjunction with the company’s stock split (previous ratio: 8 ADR = 1 share).
Corporate HeadquartersElse-Kröner-Straße 1Bad Homburg v. d. H.Germany
Postal addressFresenius SE & Co. KGaA
61346 Bad Homburg v. d. H.Germany
Contact for shareholdersInvestor RelationsTelephone: ++ 49 61 72 6 08-26 37Telefax: ++ 49 61 72 6 08-24 88E-mail: [email protected]
Contact for journalistsCorporate CommunicationsTelephone: ++ 49 61 72 6 08-23 02Telefax: ++ 49 61 72 6 08-22 94E-mail: [email protected]


![GKSS-2008-12 [9,8 MB] (PDF)](https://img.pdfslide.net/doc/110x75/587de8211a28ab2b6f8bd0d4/gkss-2008-12-98-mb-pdf.jpg)