Embed Size (px)
Citation preview
22-1Copyright © 2012 Pearson Prentice Hall. All rights reserved.
C H A P T E R 22Consumer Choice Using Utility Theory
Copyright © 2012 Pearson Prentice Hall. All rights reserved.

Consumer Choice UsingUtility Theory
Brock Williams
P R E P A R E D B Y
In February 2010, Apple Computer sold its 10 billionth song at its iTunes music store.
CHAPTER
22
Copyright © 2012 Pearson Prentice Hall. All rights reserved.

22-3Copyright © 2012 Pearson Prentice Hall. All rights reserved.
C H A P T E R 22Consumer Choice Using Utility Theory
How does a tax on one good affect the demand for substitute goods?
A Tax on Soft Drinks
What is the substitution effect of a price increase?
The Price of Pirate Songs
How do consumers respond to free goods?
The Big Difference between $0.20 and FREE!
How does product branding affect consumers’ brain activity?
Neuroscience and the Cola Challenge
1
2
3
4
A P P L Y I N G T H E C O N C E P T S

22-4Copyright © 2012 Pearson Prentice Hall. All rights reserved.
C H A P T E R 22Consumer Choice Using Utility Theory
• utilityThe satisfaction experienced from consuming a good.
• utilOne unit of utility.
TOTAL AND MARGINAL UTILITY22.1

22-5Copyright © 2012 Pearson Prentice Hall. All rights reserved.
C H A P T E R 22Consumer Choice Using Utility Theory
► FIGURE 22.1Total Utility and Marginal Utility
TOTAL AND MARGINAL UTILITY (cont’d)22.1
In Panel A, the total utility or satisfaction from downloaded songs increases with the number of songs, but at a decreasing rate.
In Panel B, the marginal utility from songs decreases as the number of songs increases.

22-6Copyright © 2012 Pearson Prentice Hall. All rights reserved.
C H A P T E R 22Consumer Choice Using Utility Theory
• marginal utilityThe change in total utility from one additional unit of a good.
• law of diminishing marginal utilityAs the consumption of a particulargood increases, marginal utilitydecreases.
TOTAL AND MARGINAL UTILITY (cont’d)22.1

22-7Copyright © 2012 Pearson Prentice Hall. All rights reserved.
C H A P T E R 22Consumer Choice Using Utility Theory
• budget lineThe line connecting the combinationsof two goods that exhaust aconsumer’s budget.
Consumer Constraints: The Budget Line
• budget setA set of points that includes all the combinations of two goods that a consumer can afford, given the consumer’s income and the prices of the goods.
CONSUMER CHOICE22.2

22-8Copyright © 2012 Pearson Prentice Hall. All rights reserved.
C H A P T E R 22Consumer Choice Using Utility Theory
Consumer Constraints: The Budget Line
FIGURE 22.2Budget Set and Budget Line
CONSUMER CHOICE (cont’d)22.2
The budget set (the shaded triangle) shows all the affordable combinations ofbooks and movies, and the budget line (with endpoints a and k) shows the combinationsthat exhaust the budget.

22-9Copyright © 2012 Pearson Prentice Hall. All rights reserved.
C H A P T E R 22Consumer Choice Using Utility Theory
Making Choices Using the Equimarginal Rule
• equimarginal rulePick the combination of two activitieswhere the marginal benefit per dollarfor the first activity equals themarginal benefit per dollar for thesecond activity.
CONSUMER CHOICE (cont’d)22.2

22-10Copyright © 2012 Pearson Prentice Hall. All rights reserved.
C H A P T E R 22Consumer Choice Using Utility Theory
Making Choices Using the Equimarginal Rule
E Q U I M A R G I N A L R U L E
Pick the combination of two activities where the marginal benefit
per dollar for the first activity equals the marginal benefit per
dollar for the second activity.
CONSUMER CHOICE (cont’d)22.2

22-11Copyright © 2012 Pearson Prentice Hall. All rights reserved.
C H A P T E R 22Consumer Choice Using Utility Theory
Online music stores provide an alternative to buying bundles of songs on CDs. We can use the theory of consumer choice to explain the logic behind this recent development.
FIGURE 22.3Internet Music Piracy and iTunes
When music is sold as 15-song bundles on CDs, the consumer has three budget points (a, c, and d) rather than an entire budget line.
If songs are sold individually, the consumer has a complete budget line and can legally reach his or her ideal combination of 6 songs and 48 arcade games (point b).
Bundling of Goods and iTunes
CONSUMER CHOICE (cont’d)22.2

22-12Copyright © 2012 Pearson Prentice Hall. All rights reserved.
C H A P T E R 22Consumer Choice Using Utility Theory
A TAX ON SOFT DRINKS
APPLYING THE CONCEPTS #1: How does a tax on one good affect the demand for substitute goods?
•In response to the obesity problem among young people some policy makers have proposed a tax on soft drinks. They are responsible for 10 percent of caloric intake of adolescents.
•Although estimates vary, a mid-range estimate of elasticity suggests 0.5 which would mean a 20 percent increase in price would result in a decrease in consumption of 10 percent.
•Using the equimarginal rule: if before the tax the marginal bang for buck is 12 (6 utils / $.50), a 20 percent tax will decrease the marginal bang for buck to 10 (6 utils / $.60). The bang for buck for juice would then exceed that for soft drinks.
A P P L I C A T I O N 1

22-13Copyright © 2012 Pearson Prentice Hall. All rights reserved.
C H A P T E R 22Consumer Choice Using Utility Theory
FIGURE 22.4The Individual Demand Curve
An individual demand curve shows the relationship between the price of a productand the quantity demanded by a rational consumer. In other words, the demandcurve shows, for each price, the utility-maximizing quantity for the consumer.
THE INDIVIDUAL DEMAND CURVE22.3
When the price of a movie is $3, Maxine maximizes utility at point i, with four movies. If the price drops to $2, she maximizes utility at point j, with seven movies.

22-14Copyright © 2012 Pearson Prentice Hall. All rights reserved.
C H A P T E R 22Consumer Choice Using Utility Theory
• substitution effectThe change in quantity consumed that is caused by a change in the relative price of the good, with real income held constant.
The Income and Substitution Effects of a Price Change
• income effectThe change in quantity consumed that is caused by a change in real income, with relative prices held constant.
THE INDIVIDUAL DEMAND CURVE (cont’d)22.3

22-15Copyright © 2012 Pearson Prentice Hall. All rights reserved.
C H A P T E R 22Consumer Choice Using Utility Theory
The Income and Substitution Effects of a Price Change
Points on the Demand Curve
In general, each point on a demand curve shows the utility-maximizing choice for a particular price.
THE INDIVIDUAL DEMAND CURVE (cont’d)22.3

22-16Copyright © 2012 Pearson Prentice Hall. All rights reserved.
C H A P T E R 22Consumer Choice Using Utility Theory
Example: Substitution Effect of a Gasoline Tax
•If the government raises the gasoline tax and cuts income taxes, will gasoline consumption decrease?
• Initial price of gas = $4 per gallon• Price of another good = $1 per unit• When the consumer maximizes utility, gas consumption is 1,000 gallons per
year and the marginal utility of gas = 12 utils. The marginal utility of the other good = 3 utils. This yields the equimarginal principle:
•Then, a tax of $2 is imposed on gasoline. The price of gas after tax = $4 + $2 = $6, and the equimarginal principle is affected as follows:
•The citizen will cut back on gasoline and spend more on the other good. The decrease in gas consumption is the substitution effect in action.
12 utils
$4<3 utils$1
12 utils
$6<3 utils$1

22-17Copyright © 2012 Pearson Prentice Hall. All rights reserved.
C H A P T E R 22Consumer Choice Using Utility Theory
THE PRICE OF PIRATE SONGS
APPLYING THE CONCEPTS #2: What is the substitution effect of a price increase?
• Scarlett loves songs about pirates.
• Her parents give her money each month to keep her utility level constant. If the price increased $0.20 and she normally bought 10 songs, her parents would pay her an additional $2.00.
• How will she respond?
• The substitution effect tells us she will consume fewer pirate songs even though she can afford to buy the same number. The increase in the price relative to other goods will cause her to substitute other goods.
A P P L I C A T I O N 2
22-18Copyright © 2012 Pearson Prentice Hall. All rights reserved.
C H A P T E R 22Consumer Choice Using Utility Theory
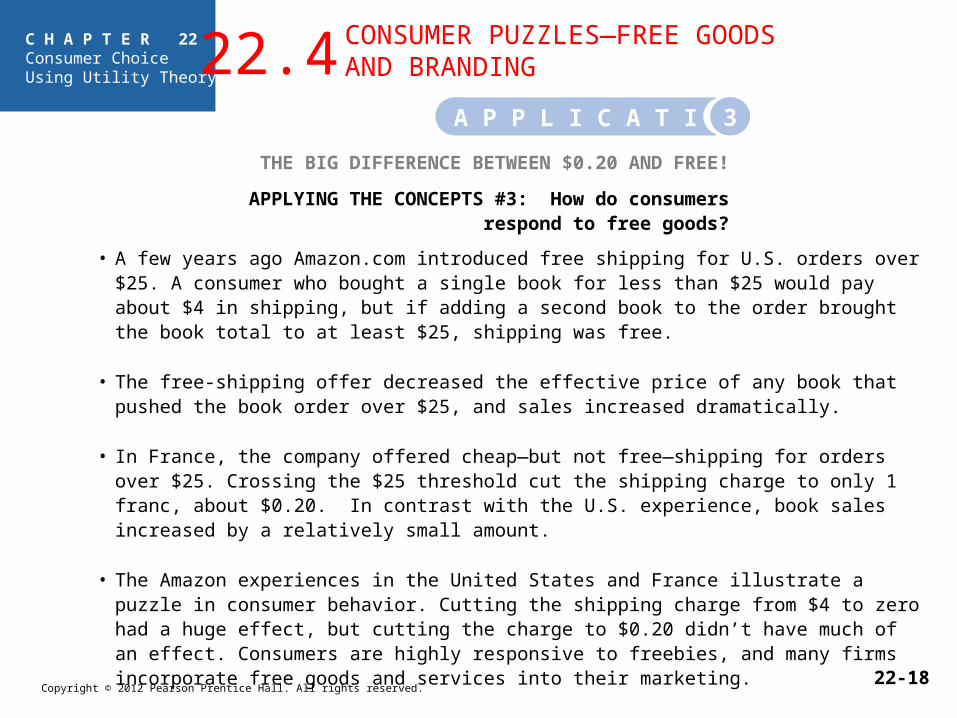
THE BIG DIFFERENCE BETWEEN $0.20 AND FREE!
APPLYING THE CONCEPTS #3: How do consumers respond to free goods?
• A few years ago Amazon.com introduced free shipping for U.S. orders over $25. A consumer who bought a single book for less than $25 would pay about $4 in shipping, but if adding a second book to the order brought the book total to at least $25, shipping was free.
• The free-shipping offer decreased the effective price of any book that pushed the book order over $25, and sales increased dramatically.
• In France, the company offered cheap—but not free—shipping for orders over $25. Crossing the $25 threshold cut the shipping charge to only 1 franc, about $0.20. In contrast with the U.S. experience, book sales increased by a relatively small amount.
• The Amazon experiences in the United States and France illustrate a puzzle in consumer behavior. Cutting the shipping charge from $4 to zero had a huge effect, but cutting the charge to $0.20 didn’t have much of an effect. Consumers are highly responsive to freebies, and many firms incorporate free goods and services into their marketing.
CONSUMER PUZZLES—FREE GOODSAND BRANDING22.4
A P P L I C A T I O N 3

22-19Copyright © 2012 Pearson Prentice Hall. All rights reserved.
C H A P T E R 22Consumer Choice Using Utility Theory
NEUROSCIENCE AND THE COLA CHALLENGE
APPLYING THE CONCEPTS #4: How does product branding affect consumers’ brain activity?
• In the “Pepsi Challenge” advertisements, randomly chosen consumers tasted Pepsi and Coke, and a majority preferred Pepsi. In an advertising campaign running at the same time, Coca-Cola proclaimed that a majority of consumers who tasted both products actually preferred Coke. Can both companies be correct?
• There was a subtle difference between the two taste tests.
• Pepsi used blind tasting, while Coca-Cola used non-blind tasting. • When consumers don’t know what brand they are drinking, Pepsi has the edge. In
other words, branding makes a difference.
• Neuroscientists ran the cola challenge while monitoring the brain activity of the tasters. When the participants knew which brand they were drinking, the portion of the brain involved in higher order functions—working memory, associations, higher-order cognitions, and ideas—was stimulated, and the activation was much greater with Coke than with Pepsi.
• In other words, branding affects brain activity and consumer preference.
A P P L I C A T I O N 4

22-20Copyright © 2012 Pearson Prentice Hall. All rights reserved.
C H A P T E R 22Consumer Choice Using Utility Theory
budget line
budget set
equimarginal rule
income effect
law of diminishing marginal utility
marginal utility
substitution effect
util
utility
K E Y T E R M S
22-21Copyright © 2012 Pearson Prentice Hall. All rights reserved.
C H A P T E R 22Consumer Choice Using Utility Theory
To determine whether a consumer is making the best choice, what single question can you ask?
What’s Your MRS?
How do consumers respond to free goods?
The Big Difference between $0.20 and FREE!
What is the substitution effect of a price increase?
The Price of Pirate Songs
CONSUMER CHOICE WITH INDIFFERENCE CURVES
A P P E N D I X A
A P P L Y I N G T H E C O N C E P T S
1
3
2222

22-22Copyright © 2012 Pearson Prentice Hall. All rights reserved.
C H A P T E R 22Consumer Choice Using Utility Theory
Consumer Constraints: The Budget Set and Budget Line
CONSUMER CONSTRAINTS AND PREFERENCES22A.1
• budget setA set of points that includes all thecombinations of two goods that aconsumer can afford, given theconsumer’s income and the prices of the goods.
• price ratioThe price of the good on thehorizontal axis divided by the price of the good on the vertical axis.
• budget lineThe line connecting all thecombinations of two goods thatexhaust a consumer’s budget.
CONSUMER CHOICE WITH INDIFFERENCE CURVES
A P P E N D I X A

22-23Copyright © 2012 Pearson Prentice Hall. All rights reserved.
C H A P T E R 22Consumer Choice Using Utility Theory
Consumer Constraints: The Budget Set and Budget Line
FIGURE 22A.1Budget Set and Budget Line
The budget set (the shaded triangle)shows all the affordable combinations of books and movies.
The budget line (with endpoints a and k) shows the combinations that exhaust the budget.
CONSUMER CONSTRAINTS AND PREFERENCES (cont’d)22A.1
CONSUMER CHOICE WITH INDIFFERENCE CURVES
A P P E N D I X A
22-24Copyright © 2012 Pearson Prentice Hall. All rights reserved.
C H A P T E R 22Consumer Choice Using Utility Theory
Consumer Preferences: Indifference Curves
• indifference curveA curve showing the differentcombinations of two goods thatgenerate the same level of utility orsatisfaction.
• utilityThe satisfaction experienced fromconsuming a good.
• marginal rate of substitution (MRS)The rate at which a consumer iswilling to trade or substitute one goodfor another.
CONSUMER CHOICE WITH INDIFFERENCE CURVES
CONSUMER CONSTRAINTS AND PREFERENCES (cont’d)22A.1A P P E N D I X A

22-25Copyright © 2012 Pearson Prentice Hall. All rights reserved.
C H A P T E R 22Consumer Choice Using Utility Theory
FIGURE 22A.2Indifference Curve and the Marginal Rate of Substitution
The indifference curve shows the different combinations of movies and books that generate the same utility level. The slope is the marginal rate of substitution (MRS) between the two goods. The MRS is eight books per movie between points b and i, but only one book per movie between points m and n.
The indifference curve passing through points b, i, m, and n separates the combinations of books and movies into three groups:
1 Superior combinations.
2 Inferior combinations.
3 Equivalent combinations.
CONSUMER CHOICE WITH INDIFFERENCE CURVES
A P P E N D I X A
CONSUMER CONSTRAINTS AND PREFERENCES (cont’d)22A.1
22-26Copyright © 2012 Pearson Prentice Hall. All rights reserved.
C H A P T E R 22Consumer Choice Using Utility Theory
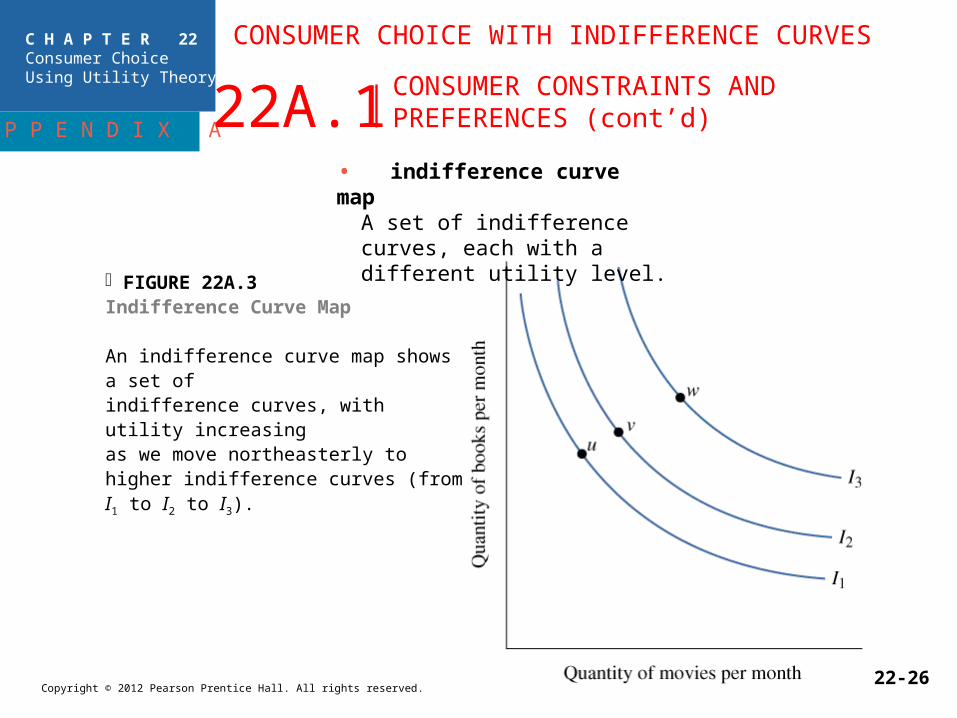
FIGURE 22A.3Indifference Curve Map
An indifference curve map shows a set ofindifference curves, with utility increasingas we move northeasterly to higher indifference curves (from I1 to I2 to I3).
• indifference curve mapA set of indifference curves, each with a different utility level.
CONSUMER CHOICE WITH INDIFFERENCE CURVES
A P P E N D I X A
CONSUMER CONSTRAINTS AND PREFERENCES (cont’d)22A.1

22-27Copyright © 2012 Pearson Prentice Hall. All rights reserved.
C H A P T E R 22Consumer Choice Using Utility Theory
The Tangency Condition
FIGURE 22A.4Maximizing Utility: MRS Equals the Price Ratio
To maximize utility, the consumer finds the combination of books and movies where an indifference curve is tangent to the budget line.
At the utility-maximizing combination (point e), the marginal rate of substitution (the consumer’s own trade-off, shown by the slope of the indifference curve) equals the price ratio (the market trade-off, shown by the slope of the budget line).
MAXIMIZING UTILITY22A.2
CONSUMER CHOICE WITH INDIFFERENCE CURVES
A P P E N D I X A

22-28Copyright © 2012 Pearson Prentice Hall. All rights reserved.
C H A P T E R 22Consumer Choice Using Utility Theory
The Utility-Maximizing Rule: MRS = Price Ratio
• utility-maximizing rulePick the combination that makes themarginal rate of substitution equal to the price ratio.
CONSUMER CHOICE WITH INDIFFERENCE CURVES
A P P E N D I X A MAXIMIZING UTILITY (cont’d)22A.2

22-29Copyright © 2012 Pearson Prentice Hall. All rights reserved.
C H A P T E R 22Consumer Choice Using Utility Theory
FIGURE 22A.5Internet Music Piracy and iTunes
When music is sold as 15-song bundles on CDs, the consumer has three budget points (a, c, and d) rather than an entire budget line.
If songs are sold individually, the consumer has a full budget line and can legally reach his or her ideal combination of 6 songs and 48 arcade games (point b).
A P P E N D I X A MAXIMIZING UTILITY (cont’d)22A.2

22-30Copyright © 2012 Pearson Prentice Hall. All rights reserved.
C H A P T E R 22Consumer Choice Using Utility Theory
WHAT’S YOUR MRS?
APPLYING THE CONCEPTS #1: To determine whether a consumer is making the best choice,
what single question can you ask?
We can use the utility-maximizing rule to determine whether consumers are doing the best they can. Suppose a firm has a fixed budget of $200 to spend on punch and cookies for its holiday party.
• The price of punch is $2 per cup and the price of cookies is $1 per cookie; both goods will, of course, be provided free of charge to workers at the party.
• The firm’s objective is to maximize the utility of the typical employee, and your job is to determine whether the company spent this year’s party budget wisely.
• Assume that all employees have identical tastes for cookies and punch, so data from a single person will apply to every employee. You can ask the typical employee a single question. What’s your question?
“How many cookies would you be willing to trade for one cup of punch?”
If the answer is “two cookies per cup of punch,” the MRS equals the price ratio, and the firm did the best it could. On the other hand, if the answer is “five cookies per cup of punch,” the MRS exceeds the price ratio, and the firm could have generated higher utility with its $200 by providing more punch and fewer cookies.
A P P E N D I X A
A P P L I C A T I O N 1

22-31Copyright © 2012 Pearson Prentice Hall. All rights reserved.
C H A P T E R 22Consumer Choice Using Utility Theory
THE BIG DIFFERENCE BETWEEN $0.20 AND FREE!
APPLYING THE CONCEPTS #2: How do consumers respond to free goods?
• A few years ago Amazon.com introduced free shipping for U.S. orders over $25. A consumer who bought a single book for less than $25 would pay about $4 in shipping, but if adding a second book to the order brought the book total to at least $25, shipping was free.
• The free-shipping offer decreased the effective price of any book that pushed the book order over $25, and sales increased dramatically.
• In France, the company offered cheap—but not free—shipping for orders over $25. Crossing the $25 threshold cut the shipping charge to only 1 franc, about $0.20. Book sales increased by a relatively small amount.
• The Amazon experiences in the United States and France illustrates a puzzle in consumer behavior. Cutting the shipping charge from $4 to zero had a huge effect, but cutting the charge to $0.20 didn’t have much of an effect. Consumers are highly responsive to freebies, and many firms incorporate free goods and services into their marketing.
A P P E N D I X A
A P P L I C A T I O N 2

22-32Copyright © 2012 Pearson Prentice Hall. All rights reserved.
C H A P T E R 22Consumer Choice Using Utility Theory
With so many curves floating around, it is worth reviewing their roles in consumer decision making:
• The budget line shows the affordable combinations of two goods, representing the consumer’s constraints.
• An indifference curve shows the different combinations of two goods that generate the same utility level, representing the consumer’s preferences.
• The demand curve shows how much of a single product a consumer is willing to buy at a particular price. To get the demand curve, we use both the budget line and indifference curves.
The Negatively Sloped Demand Curve
CONSUMER CHOICE WITH INDIFFERENCE CURVES
DRAWING THE INDIVIDUALDEMAND CURVE22A.3A P P E N D I X A

22-33Copyright © 2012 Pearson Prentice Hall. All rights reserved.
C H A P T E R 22Consumer Choice Using Utility Theory
The Negatively Sloped Demand Curve
FIGURE 22A.6Drawing the Demand Curve
A decrease in the price of movies tilts the budget line outward.
In Panel A, the indifference curve is tangent to the new budget line at point t, with a larger quantity of movies (7 instead of 4).
In Panel B, when the price of movies is $3, the consumer maximizes utility with 4 movies. A decrease in price to $2 increases the utility-maximizing number of movies to 7, illustrating the law of demand.
CONSUMER CHOICE WITH INDIFFERENCE CURVES
A P P E N D I X A
DRAWING THE INDIVIDUALDEMAND CURVE (cont’d)22A.3

22-34Copyright © 2012 Pearson Prentice Hall. All rights reserved.
C H A P T E R 22Consumer Choice Using Utility Theory
The Income and Substitution Effects of a Price Change
• substitution effectThe change in quantity consumed that is caused by a change in the relative price of the good, with real income held constant.
• income effectThe change in quantity consumed that is caused by a change in real income, with relative prices held constant.
CONSUMER CHOICE WITH INDIFFERENCE CURVES
A P P E N D I X A
DRAWING THE INDIVIDUALDEMAND CURVE (cont’d)22A.3

22-35Copyright © 2012 Pearson Prentice Hall. All rights reserved.
C H A P T E R 22Consumer Choice Using Utility Theory
The Income and Substitution Effects of a Price Change
Let’s take a closer look at a consumer’s response to a change in price. We will break down Maxine’s response to a decrease in price into two effects:
• Substitution effect. A decrease in the price of movies decreases the price of movies relative to the price of other goods, such as books. As movies become less costly relative to books, Maxine substitutes movies for books.
• Income effect. A decrease in the price of movies increases Maxine’s real income (the purchasing power of her nominal income), and she will buy more of all normal goods. If watching movies is a normal good, she will watch more movies.
CONSUMER CHOICE WITH INDIFFERENCE CURVES
A P P E N D I X A
DRAWING THE INDIVIDUALDEMAND CURVE (cont’d)22A.3

22-36Copyright © 2012 Pearson Prentice Hall. All rights reserved.
C H A P T E R 22Consumer Choice Using Utility Theory
FIGURE 22A.7The Substitution Effect of aDecrease in Price
To observe the substitution effect, shown by the move from point e to point s, we offset the decrease in price of movies (from $3 to $2) by decreasing the consumer’s income to $26, thereby making the original choice (point e) just affordable.
At the original choice, the MRS (three books per movie) exceeds the new price ratio (two books per movie), so the consumer can do better.
Moving from point e to point s, utility increases and the quantity of movies increases from four to six.
The Income and Substitution Effects of a Price Change
CONSUMER CHOICE WITH INDIFFERENCE CURVES
A P P E N D I X A
DRAWING THE INDIVIDUALDEMAND CURVE (cont’d)22A.3

22-37Copyright © 2012 Pearson Prentice Hall. All rights reserved.
C H A P T E R 22Consumer Choice Using Utility Theory
FIGURE 22A.8The Income Effect of a Decrease in Price
To observe the income effect, shown by the move from point s to point t, we restore the consumer’s original nominal income of $30 (up from the $26 used to reveal the substitution effect) while keeping a price of $2 per movie.
The budget line shifts outward, and the consumer maximizes utility at point t, so the quantity of movies increases from six to seven.
The Income and Substitution Effects of a Price Change
CONSUMER CHOICE WITH INDIFFERENCE CURVES
A P P E N D I X A
DRAWING THE INDIVIDUALDEMAND CURVE (cont’d)22A.3

22-38Copyright © 2012 Pearson Prentice Hall. All rights reserved.
C H A P T E R 22Consumer Choice Using Utility Theory
The Income and Substitution Effects of a Price ChangeFIGURE 22A.9Increasing the Gas Tax and Decreasing the Income Tax
If a $2 gasoline tax is combined with a $2,000 decrease in the income tax, a person who initially buys 1,000 gallons (point a) can still afford the initial choice.
But the increase in the relative price of gasoline means that the initial point no longer maximizes utility.
At point a, the MRS is less than the new price ratio, and the substitution effect moves the consumer from point a to point b, reducing gasoline consumption from 1,000 to 700 gallons.
CONSUMER CHOICE WITH INDIFFERENCE CURVES
A P P E N D I X A
DRAWING THE INDIVIDUALDEMAND CURVE (cont’d)22A.3

22-39Copyright © 2012 Pearson Prentice Hall. All rights reserved.
C H A P T E R 22Consumer Choice Using Utility Theory
THE PRICE OF PIRATE SONGS
APPLYING THE CONCEPTS #3: What is the substitution effect of a price increase?
•Scarlett loves songs about pirates.
•Her parents give her money each month to keep her utility level constant. If the price increased $.20 and she normally bought 10 songs, her parents would pay here an additional $2.00.
•How will she respond?
•The substitution effect tells us she will consume fewer pirate songs even though she can afford to buy the same number. The increase in the price relative to other goods will cause her to substitute other goods.
A P P E N D I X A
A P P L I C A T I O N 3

22-40Copyright © 2012 Pearson Prentice Hall. All rights reserved.
C H A P T E R 22Consumer Choice Using Utility Theory
budget line
budget set
income effect
indifference curve
indifference curve map
marginal rate of substitution (MRS)
price ratio
substitution effect
utility
utility-maximizing rule
K E Y T E R M S
A P P E N D I X A