Embed Size (px)
Citation preview

22 Hannover Re | Annual Report 2013
Combined management report
Foundations of the Group 23Business model 23
Management system 24
Research and development 27
Report on economic position 29Macroeconomic climate and industry-specific environment 29
Business development 31
Overall assessment of the business position 33
Results of operations 34
Non-life reinsurance 34
Life and health reinsurance 46
Investments 50
Financial position and net assets 51
Information on Hannover Rück SE 58
Other success factors 63Our staff 63
Sustainability at Hannover Re 65
Opportunity and risk report 70Risk report 70
Opportunity report 92
Enterprise management 95Declaration on Corporate Governance 95
Remuneration report 99
Outlook 118Forecast 118
Events after the reporting date 124
The Group management report was com-piled for the first time in accordance with the new German Accounting Standard No. 20 (DRS 20).

23
Com
bine
d m
anag
emen
t re
port
Hannover Re | Annual Report 2013
Foundations of the Group
Business model• As the third-largest reinsurer in the world, we transact all lines of non-life and life and health
reinsurance with the goal of achieving the most balanced possible regional and product-specific diversification
• Through our global presence and infrastructure we are able to optimally respond to the needs of our clients
• Centralised risk management and risk steering ensure consistent underwriting decisions • Effective capital management through the efficient use of hybrid capital, securitisations and
retrocessions • Lean structures enable us to maintain one of the lowest administrative expense ratios in our industry
With a gross premium volume of around EUR 14.0 billion, Hannover Re is the third-largest reinsurer in the world. We transact reinsurance in our business groups of non-life and life and health reinsurance. Through our worldwide presence (see section “Branch offices and subsidiaries of the Hanno-ver Re Group abroad”, page 234 et seq.) and our activities in all lines of reinsurance we achieve optimal risk diversification while maintaining a balanced opportunity / risk profile. Most significantly, diversification into both the non-life and life and health reinsurance business groups enables us to effectively deploy our capital and is thus crucial to our ability to achieve an exceptionally high return on equity.
Our lean structures enable us to maintain one of the lowest administrative expense ratios in the reinsurance industry.
As a reinsurance specialist, we transact primary insurance busi-ness as a complement to our reinsurance activities in selected niche markets. In this context, we work together with part-ners from the primary sector, just as we do in our reinsurance business.
Our subsidiary E+S Rückversicherung AG, as the “dedicated reinsurer for the German market”, offers a range of products and services focused on the peculiarities of the German mar-ket – especially for those mutual insurers with whom we have established a particularly trusting cooperation that is under-scored through their participation in E+S Rück.
The business models in both non-life and life and health rein-surance support our higher-level Group mission of “Growing Hannover Re profitably”. This includes, among other things, our aspiration to be the best option for our business partners when they come to choose their reinsurance partner. It is for this reason that our clients and their concerns form the focus of our activities.
In the non-life reinsurance business group we consider our-selves to be an undogmatic, flexible and innovative market player that ranks amongst the best in any given market.
Thanks to our worldwide presence and infrastructure, our organisational approach is optimally geared to customer and market requirements; working together with our client, it ena-bles us to act on specific business opportunities. With our three pillars of target markets, specialty lines and global reinsurance, we are in a position to successfully meet individual client and market needs.
Central risk steering in combination with local talent is the key to our success. In markets where an on-the-spot pres-ence opens up additional profit opportunities we write busi-ness through local branches and subsidiaries. Risk manage-ment functions are, however, always exercised centrally. These include, for example, capital allocation, resource planning, ret-rocessions and the use of capital market instruments. These centrally exercised risk steering functions serve the goals of maintaining consistent underwriting decisions, facilitating the maximum allocation of capacity and efficiently deploying resources, underwriting know-how and capital.
In the life and health reinsurance business group Hannover Re has established itself as one of the major professional, glob-ally operating reinsurers that combines sophisticated solution models with a long-term, partnership-based approach.
At the core of our activities is a customer orientation that stresses the cultivation of mutually beneficial profit and growth opportunities. This includes the provision of reinsurance solu-tions for risk management as well as those featuring financ-ing and / or capital management components together with the associated services – by which we mean, inter alia, the optimi-sation of processes, access to global expertise and the accel-eration of new business growth, always individually tailored to the needs of our customers.

24 Hannover Re | Annual Report 2013
In life and health business we are represented on every conti-nent by 23 units in 19 countries around the world and we offer reinsurance protection in all lines of life and health reinsur-ance. Our portfolio covers all traditional risks such as mortality, morbidity and longevity. Within the business group we strive for a balance between these risks so as to ensure diversifica-tion among them.
Our potential clients include not only life and health insurers but also banks, sales companies and pension funds. Thanks to our decentralised approach our customers enjoy the benefits of advice and support provided on the spot in their own language.
This local approach furthers our aspiration to be the preferred business partner for our customers. In view of the long dura-tion of contracts, we consider close and trusting cooperation with our clients to be a fundamental element of a successful business relationship.
Management system
Value-based management
Our integrated system of enterprise management is central to the accomplishment of our strategic objectives. Located at its core are, first and foremost, our profit and growth targets, which are summarised for the Group and its business groups in the so-called target matrix. In addition to traditional perfor-mance indicators geared to the IFRS balance sheet, our sys-tem of targets also includes economic targets derived from our economic capital model. The targets are analysed and where necessary adjusted as part of a regular process. Our focus is on long-term strategic target attainment.
Target attainment
Business group Key data Targets for
2013Target attainment
2013 2012 1 2011 Ø 2011–2013 2
Group Investment return 3 ≥ 3.4% 3.4% 4.1% 4.1% 3.9%
Return on equity ≥ 9.8% 4 15.0% 15.4% 12.8% 13.9%
Growth in earnings per share (year-on-year comparison) ≥ 10% 5.4% 41.6% -19.1% 6.2%
Value creation per share 5 ≥ 10% 3.6% 19.4% 12.0% 11.1%
Non-life reinsurance
Gross premium growth 6 3 – 5% 3.5% 9.3% 9.4% 7.3%
Combined ratio ≤ 96% 7 94.9% 95.8% 104.3% 98.1%
EBIT margin 8 ≥ 10% 15.5% 15.9% 10.1% 14.0%
xRoCA 9 ≥ 2% 5.4% 6.0% 3.0% 4.9%
Life and health reinsurance
Gross premium growth 105 – 7% 5.1% 9.8% 5.2% 6.7%
Value of New Business (VNB) growth ≥ 10% -1.6% 30.3% 61.2% 27.4%
EBIT margin 8, 11 Financial Solutions / Longevity ≥ 2% 5.2% 5.0% 5.5% 5.2%
EBIT margin 8, 11 Mortality / Morbidity ≥ 6% 1.2% 5.2% 3.9% 3.4%
xRoCA 9 ≥ 3% 8.3% -1.3% 0.9% 2.9%
1 Adjusted pursuant to IAS 8 (cf. Section 3.1 of the notes)2 Average annual growth, otherwise weighted averages3 Excluding inflation swaps and ModCo derivatives4 750 basis points above the 5-year average return on 10-year German government bonds after tax5 Growth in book value per share including dividends paid6 Average over the reinsurance cycle at constant exchange rates7 Including major loss budget of EUR 625 million8 EBIT / net premium earned9 Excess return on allocated economic capital10 Organic growth only; annual average growth (5 years); at constant exchange rates 11 Reclassification of treaties

25
Com
bine
d m
anag
emen
t re
port
Hannover Re | Annual Report 2013
With a view to allocating our profit and growth targets for the Group and its business groups to the individual business activi-ties and profit centres on a basis that adequately reflects the risks and in order to be able to measure target attainment, we have for many years now used various value-based manage-ment tools that are integrated into our corporate processes.
In Performance Excellence (PE) we have at our disposal a con-sistent method Group-wide that enables us to steer the develop-ment of the company and measure the extent to which we have achieved our strategic objectives. The decentralised approach used by PE is of special importance in this context: every sin-gle organisational unit defines and continuously examines its contributions to execution of the Hannover Re Group strategy and develops improvement initiatives.
Planning processThe planning process spans the three levels of Results, Risks and Resources, which are closely interrelated. These three lev-els are planned by the responsible officers with central sup-port and are reviewed and approved by the Executive Board. On the basis of the corporate strategy and the corresponding strategy contributions of all treaty / regional departments and service units, the planning is adopted by the Executive Board and subsequently communicated within the Group.
Management by ObjectivesThe targets that emerge out of the planning process are inte-grated into the individual agreements on objectives with man-agers. When it comes to the definition of objectives, the par-ticipants take into account not only standardised financial indicators but also non-financial variables derived from the strategic parameters.
Management ReportingThe annual Management Reporting presents in detail the degree of target attainment for each individual operational unit and for the Group as a whole. On this basis appropri-ate performance controlling is carried out, potential scope for improvement and refinement is identified and performance-oriented remuneration components defined in the context of Management by Objectives are established.
System of value-based management:Performance Excellence (PE) combines the strategic and operational levels
Strategy
PerformanceExcellence
Management by Objectives
Results
Risks
Ressources
Plan Implementation Evaluation
Pla
nn
ing
pro
cess
Executive Board retreat / GMF 1
PE Check 2
ManagementReporting
Agreement on targets Attainment of targets
Planning year -1 Planning year +1
PE Check 2 PE Check 2
Executive Board retreat / GMF 1
Executive Board retreat / GMF 1
Planning year
1 All managers of the Hannover Re Group worldwide come together once a year at the Global Management Forum (GMF) to define strategic orientations. The parameters developed here serve as the basis for the subsequent planning process
2 Verification and elaboration of contributions to the Group strategy

26 Hannover Re | Annual Report 2013
Capital allocationThe basis of value-based management is the risk-appropriate allocation of capital to the individual business activities. This enables us to evaluate the assumption of underwriting risks and investment risks both in light of individual risk / return aspects and against the backdrop of our overall risk appetite. Our economic capital model supplies the key parameters for this purpose. In addition, along with considerations of business policy, outside influencing factors such as the requirements of regulatory authorities and rating agencies also play a major role in the allocation of capital. Allowance is therefore made for them in the form of collateral conditions on the various alloca-tion levels. Starting out from the Group’s overall risk situation, capital is first allocated to the functional areas of underwriting and investments. We then further divide the capital within the underwriting sector, first between the business segments of non-life reinsurance and life and health reinsurance and then between the various reinsurance products according to risk categories / treaty types and lines. In this way, we ensure that when evaluating and pricing our various reinsurance products our profit targets are taken into consideration consistently and in light of risk / return aspects.
IVC – the decisive management ratio In order to fine-tune the portfolios and individual treaties we apply underwriting-year-oriented measurement principles based on expected cash flows that appropriately accommo-date the specific characteristics of non-life and life and health reinsurance. The accomplishment of targets in a particular financial year is also of interest – especially from the stand-point of shareholders. Based on our economic capital model,
the foundation of our enterprise management, we strive to generate a profit in excess of the cost of capital. This return – which is the decisive ratio for the management of our busi-ness activities – is referred to as Intrinsic Value Creation (IVC).
With the aid of the IVC ratio it is possible to compare the value contributions of the Group as a whole, its two business groups and the individual operational units. This enables us to reliably identify value creators and value destroyers. In this way, we can
•optimise the allocation of capital and resources,
•identify opportunities and risks and
• measure strategy contributions with an eye to our demanding profit and growth targets.
The IVC (Intrinsic Value Creation) is calculated according to the following formula: Adjusted operating profit (EBIT) − (capital allocated x weighted cost of capital) = IVC
The adjusted operating profit (EBIT) is comprised of two fac-tors: the IFRS Group net income recognised after tax and the change in the balancing items for differences between eco-nomic valuations and amounts stated in the IFRS balance sheet. By way of the latter we make allowance for changes in the fair values of assets not recognised in income under IFRS, discount effects of the loss reserves and the Embedded Value Not Recog-nised (EVNR) in life and health reinsurance. In addition, inter-est on hybrid capital already recognised in the IFRS Group net income and the non-controlling interest in profit and loss are included back in the calculation.
Intrinsic Value Creation and excess return on capital allocated
in EUR million 2013 2012
IVC xRoCA Reported IVC Adjustment 1 Final IVC xRoCA
Non-life reinsurance 295.5 +5.4% 251.8 40.5 292.2 +6.0%
Life and health reinsurance 226.6 +8.3% 58.6 (89.4) (30.8) -1.3%
Investments 2 108.6 +6.2% 790.7 (29.3) 761.4 +49.4%
Group 617.1 +5.9% 1,088.8 (78.0) 1,010.8 +10.8%
1 Adjustment based on amended allocation of economic effects (non-life reinsurance / investments) and final MCEV calculation (life and health reinsurance)
2 Income above risk-free after deduction of risk-appropriate cost of capital

27
Com
bine
d m
anag
emen
t re
port
Hannover Re | Annual Report 2013
The allocated capital consists of three components: the share-holders’ equity including non-controlling interests, the balanc-ing items for differences between economic valuations and amounts stated in the IFRS balance sheet and the hybrid capi-tal. In this context, capital that is not at risk (excess capital) is disregarded, i. e. it is not allocated. Capital is allocated to the profit centres as described above according to the risk content of the business in question. A systematic distinction is made here between the assumption of underwriting risks, on the one hand, and investment risks, on the other. Under the IVC calculation, therefore, only risk-free interest income on the generated cash flows is allocated to the business segments of non-life and life and health reinsurance. The investment income above and beyond risk-free is allocated in its entirety to the functional area of investments and included in the IVC after deduction of the risk-appropriate cost of capital and the administrative expenses.
In calculating the cost of capital, our assumption – based on a Capital Asset Pricing Model (CAPM) approach – is that the investor’s opportunity costs are 450 basis points above the risk-free interest rate, meaning that value is created above this threshold. Our strategic return on equity target of 750 basis points above risk-free thus already contains a not insignificant target value creation. We allocate equity sparingly and use equity substitutes to optimise our average cost of capital. At 6.4%, our average cost of capital is comparatively low.
Since comparison of absolute amounts is not always meaning-ful, we have introduced the xRoCA (excess return on capital allocated) in addition to the IVC. This describes the IVC in rela-tion to the allocated capital and shows us the relative excess return generated above and beyond the weighted cost of capital.
Operational management system
A number of IFRS-based financial performance indicators are embedded in our strategic system of targets and coordinated with our parameters for value creation derived from the eco-nomic capital model. We use these indicators for operational management within the year, in part because they are available promptly and also because they already provide initial point-ers as to whether we are likely to achieve our higher-order strategic objectives. These are for both business groups the growth in gross premium, for non-life reinsurance the com-bined ratio, for life and health reinsurance the EBIT margin and for the Group as a whole the return on investment. We do not use non-financial performance indicators for operational management within the year.
Research and development
As a reinsurer, Hannover Re does not have its own R&D depart-ment but it does develop products and solutions for its own benefit and that of its clients as part of day-to-day business operations. By way of example, our move to give capital mar-ket players access to insurance risks as far back as the mid-1990s through our “K” transactions puts us among the indus-try pioneers. The intervening years have seen the evolution of a market for so-called insurance-linked securities, which is one of the fastest-growing markets in the insurance sector. Another example of Hannover Re’s development activities is the creation of its own internal model for risk management under Solvency II that caters to the requirements of various stakeholders (regulators, rating agencies, capital providers). Although we do not conduct any basic research, we are very active in tracking the latest developments and publications in science and research. Not only that, through our active involve-ment and the provision of financial resources we support sci-entific initiatives geared to developing products, solutions or markets that will be crucial success factors in the viability of a reinsurance undertaking going forward.
When it comes to research into natural perils, Hannover Re sponsors a number of different initiatives. Particularly note-worthy here is the OECD’s “Global Earthquake Model” (GEM) initiative. Since 2009 we have been a sponsor and active sup-porter of the GEM Foundation (www.globalquakemodel.org), which works to develop models for earthquake risks around the world. The goal of this public / private partnership is to develop freely accessible worldwide earthquake risk models that will help to raise risk awareness and motivate preventive actions, e.g. by improving the earthquake safety of buildings. For Han-nover Re, participation in this work not only facilitates expan-sion of the available risk assessment models but also opens up direct contacts with the scientific community.
Reinsurance business is founded on the comprehensive under-standing and active management of risks. Our specialists there-fore continuously analyse known risks with an eye to changes in their structure and probability of occurrence, while at the same time focusing on the early detection of newly emerg-ing risks and working to provide our clients with appropriate solutions tailored to their needs (cf. here also the Opportunity report on page 92 et seq.).

28 Hannover Re | Annual Report 2013
In 2013 Hannover Re developed, inter alia, innovative concepts for coverage of weather-related risks and renewable energies with its partner WetterProtect and subsequently launched them on the market in cooperation with primary insurance partners. In the former case, solutions targeting specific sectors were designed for a clientele heavily dependent on weather condi-tions. These products protect customers against the vagaries of nature and hence give them greater certainty for planning purposes. In addition, an insurance product was developed to protect providers of energy-efficient measures against a failure to deliver the promised level of energy savings. This solution can play a decisive part in promoting greater investment in energy-efficiency and hence make a meaningful contribution to reducing energy consumption.
After several delays the implementation of Solvency II, the new prudential regime for insurance undertakings, is now immi-nent and continues to preoccupy clients of Hannover Re with regard to the possible implications for their capital require-ments. Within its structured reinsurance line (Advanced Solu-tions) Hannover Re designs bespoke solutions that are tailored to the individual needs of its clients. A simplified QIS 5 tool was developed, for example, to facilitate analysis of the effect of reinsurance solutions on the Solvency II capital requirements of insurers according to the standard formula.
“Development work” on the life and health reinsurance side has many facets. Given that the assessment of biometric risks is of fundamental and essential importance to our company, Hanno-ver Re invests continuously in expanding the specialist exper-tise that produces new and enhanced reinsurance solutions. We have, for example, concentrated and refined our know-how in the area of longevity risks. We are able to offer novel derivative solutions for this type of risk that bring considerable capital relief to ceding clients and companies. Furthermore, we are currently working on a new version of our IT-based underwrit-ing tool. We shall then make this improved software, which has undergone thorough conceptual reworking, available to our customers for their automated underwriting processes. The advantages of the new system are efficiency gains and expanded underwriting know-how. Our goal is to develop sus-tainable solutions for our clients that take adequate account of the latest trends. The focus of our development efforts is not only on innovative products, such as so-called lifestyle prod-ucts; we also seek opportunities to assist our customers with the cultivation of new markets or sales channels.

29
Com
bine
d m
anag
emen
t re
port
Hannover Re | Annual Report 2013
Report on economic position
Macroeconomic climate and industry-specific environment• Economic activity still muted despite increased stability on capital markets• Protracted low interest rate environment a challenge for life (re)insurers • Progress in the implementation of Solvency II framework directive • Unusually heavy losses from weather-related disasters in Europe
Macroeconomic climate
While the global economic recovery continued in 2013 with growth of 2.9% (previous year: 3.1%), it remained muted and varied from region to region. For the first time in four years advanced economies were the driving force. Assisted by an expansionary monetary policy, the United States and United Kingdom saw further debt reduction in the private sec-tor. Europe also benefited from a more open fiscal policy. The uncertainty surrounding the continued existence of the single currency area receded slightly. In Japan, too, the economy began to gather momentum again.
In emerging markets, on the other hand, economic growth was more restrained, although the pace of growth in China picked up again after a slow start to the year. Major emerging econo-mies such as Brazil, India, Indonesia, South Africa and Turkey experienced a softer phase in 2013. Along with structural dif-ficulties, they were faced with an increased exodus of foreign capital. This caused refinancing conditions to deteriorate by the middle of the year, putting currencies in these countries under pressure.
USAThe US economy continued to fare well despite application of the fiscal brake and the temporary government shutdown: according to figures from the Kiel Institute for the World Econo my (IfW), gross domestic product (GDP) rose by 1.6% in 2013 (2.8%). Although the automatic spending cuts that took effect in March curtailed growth in the year just ended, consumer demand nevertheless remained relatively robust as gradual improvement in the financial position of private house-holds supported investment in residential construction and private consumption. This trend was fostered by favourable financial framework conditions. Private-sector capital invest-ments rose and exports also grew. The expansionary fiscal policy pursued by individual states and municipalities more than offset the lower spending on the federal level. Even though consumer confidence indicators retreated in the final quarter and the business climate was softer in some areas, the trend at the end of 2013 was clearly towards growth.
EuropeBy the middle of the year the Eurozone economy was able to move out of the protracted recession that had lasted more than twelve months. This development was encouraged by the easing of fiscal policy and implementation of the OMT (Outright Mon-etary Transactions) programme by the European Central Bank (ECB). Since October 2012 this scheme has served to safe-guard at no expense sovereign bonds issued by crisis-ridden countries, thereby easing their cost of borrowing and helping them to raise new debt.
Yet the single-currency economy remains in a poor state: the situation continues to vary greatly among the individual Mem-ber States. High levels of private and public debt have left many national economies vulnerable to upheavals of crisis-like dimensions. Greece, Italy, Portugal and Spain, above all, have still failed to regain their competitiveness, even though the risk situation here with respect to troubled loans has improved appreciably. According to IfW calculations, GDP in the Euro-zone contracted by 0.4% in 2013 (-0.7%).
GermanyIn Germany the expansion in total economic output – which had been temporarily interrupted by the heightened Eurozone debt crisis – continued. Yet the anticipated economic upswing failed to materialise. Growth for 2013 was put at 0.4% (0.7%) by the IfW. The forces at work here are, however, changing: while momentum in the recovery phase after the financial and eco-nomic crisis predominantly came from exports, the spotlight moved to the domestic economy in the year just ended. Low unemployment, higher earnings and a low interest rate level encouraged private consumption and drove home construction.
Foreign trade, on the other hand, was weaker in 2013: owing to comparatively soft demand from the Eurozone, growth in German exports was slower than the pace seen in world trade. With a working population of 41.78 million (+0.6%), the num-ber of people in Germany with a job reached a new record high for the seventh year in succession.

30 Hannover Re | Annual Report 2013
AsiaEconomic growth in Asia’s emerging markets was again muted. Aside from the lack of demand stimuli from the more advanced economies, domestic economic difficulties increasingly made themselves felt. In China the tendency towards more moderate economic expansion continued. After a weaker first six months the economy picked up momentum over the rest of the year, as reflected in the IfW’s growth figure of 7.5% for the full year (7.8%). This rally was, however, crucially driven by a stimu-lus programme launched at short notice. Faced with the ever-greater challenge of maintaining its high pace of growth, China unveiled an economic reform project in November that recog-nises the more significant role played in the economy by market forces and the non-public sector. The Indian econo my, cur-rently languishing in a period of weakness, boosted its growth to 4.0% thanks to a vigorous spurt at year-end and hence climbed back to the level seen in 2012 (3.7%).
In Japan the economy regained momentum in 2013. Thanks to powerful stimuli provided by monetary and fiscal policy as well as the markedly improved price competitiveness of Japa-nese producers on the back of massive currency devaluation, GDP moved sharply higher in the first half of the year. It did, however, soften again towards year-end – as had been the case in the previous year too.
Capital marketsThe effects of the Euro debt crisis on capital markets could still be clearly felt in 2013 and central banks continued to pursue an expansionary monetary policy in our main currency areas. The ECB, for example, cut its main rate for the Euro-zone twice during the year from a starting point of 0.75% to the current 0.25%; the US Federal Reserve left key inter-est rates unchanged in the low range of zero to 0.25%, the level on which rates have been since 2008. Over the full year US, German and UK government bonds recorded sometimes marked yield increases in virtually all maturity segments. The yield on ten-year German government bonds, for example, climbed from 1.3% to 1.9% in the course of the year; ten-year US treasury bonds saw an even sharper rise from 1.7% to 3.0%. These increases were supported not only by market expectations concerning the Fed’s gradual pullback from its active market interventions but also by improved or at least stabilised macroeconomic prospects for the US and Europe. As regards those European countries with higher risk premiums which had become the focus of so much attention, the pic-ture was almost uniformly one of recovery. On the other hand, credit spreads on corporate bonds in our main currency areas decreased somewhat as the year progressed, although greater volatility could be observed here in the spring of 2013 as dis-cussions got underway about Federal Reserve policy going forward. The yield increases that ultimately ensued were, in the final analysis, fed primarily by the interest rate component.
Major stock markets soared in some cases to historic highs and recorded substantial price gains over the year. This, too, was a reflection of the continued expansionary monetary policy practised by central banks as well as of the quest by inves-tors for high-yield investments. Such price movements can, however, be only partially explained by isolated indications beginning to emerge from the real economy. Global economic developments nevertheless continue to be subject to a variety of uncertainties and risks.
Despite fluctuations during the year the euro ultimately closed slightly higher against the US dollar and pound sterling year-on-year. The gains against the Australian and Canadian dollars, on the other hand, were significant.
For detailed remarks on the development of Hannover Re’s invest-ments please see the “Investments” section on page 50 et seq.
Industry-specific environment
The continuing tense economic climate and the accompany-ing measures on the economic policy side again determined conditions for the international insurance industry in 2013: given that the state of capital markets remains challenging, particularly high importance attaches to preserving the value of investments and the stability of returns. Sales of traditional life insurance policies were also impacted by the low interest rate environment; at the same time, though, growing demand is emerging for products geared towards this market environ-ment. In 2013 this could be discerned, inter alia, in the increas-ing demand for products designed to deliver capital relief and improve solvency.
The interest rate situation was also reflected overall in the technical pricing of premiums on the primary and reinsur-ance markets. Considerable discipline was needed in order to be able to offset further declines in investment income. In this regard new (re)insurance capacity has also entered the insurance-linked securities (ILS) market, with the result that additional alternative capital met with unchanged demand. The pressure on prices and conditions, especially in natural catas-trophe business, consequently intensified further.

31
Com
bine
d m
anag
emen
t re
port
Hannover Re | Annual Report 2013
Implementation of the Solvency II framework directive was again a central preoccupation in the year just ended. Although the financial market and a prolonged low interest rate envi-ronment made the introduction of this system of insurance regulation difficult in its originally envisaged form, another major step forward was taken in 2013. In order to overcome the obstacles the European Parliament, European Council and European Commission reached a compromise in November 2013. The amendments that were negotiated are to be adopted in the spring of 2014 by way of the Omnibus II directive and then implemented in national law by March 2015. Especially with respect to the widely discussed assessment of long-term guarantees, which are a vital component for the life insurance sector, key details were elaborated that, most notably, give companies greater security in their planning.
Europe suffered exceptionally heavy damage from weather events in 2013. The June flooding was the most expensive natural disaster for the (re)insurance industry measured in terms of total economic losses. The most costly insurance loss worldwide in 2013 – and at the same time the most expensive ever hail event in German history – was the series of hailstorms that impacted some areas of northern and south-western Ger-many at the end of July. While the hurricane season in North America once again passed off very quietly, typhoon Haiyan triggered a major humanitarian catastrophe in the Philippines. The losses for the insurance industry in this case were, how-ever, relatively slight owing to the very low insurance density.
Business development• New record profit of EUR 895.5 million generated • Performance assisted by additional positive tax effects • Best result ever posted in non-life reinsurance • Major loss incidence slightly below the expected level• Capital base remains robust• Return on equity 15.0%
For Hannover Re the 2013 financial year was a pleasing one despite challenging market conditions. At EUR 895.5 million we generated the highest Group net income to date in the history of Hannover Re. Although this figure was assisted by positive tax effects from the recognition of deferred taxes, we would have surpassed our guidance of around EUR 800 million even without this effect. Please find below a brief summary of the development of our business groups – non-life and life and health reinsurance – and of our investments. More detailed information is to be found on pages 34 to 51.
Non-life reinsurance
We were highly satisfied with the development of our busi-ness in non-life reinsurance, even though competition con-tinued to intensify relative to the previous year. Despite our selective underwriting policy we were able to further enlarge our premium volume. Gross premium increased by 1.3% as at 31 December 2013 to EUR 7.8 billion (previous year: EUR 7.7 billion). At constant exchange rates growth would have amounted to 3.5%. We thus came in within our forecast target of 3% to 5% for the full financial year.
Investment income from assets under own management for non-life reinsurance contracted by 17.7% year-on-year to EUR 766.2 million (EUR 930.8 million). This was due in part to the low interest rate level and also to the elimination of positive special effects, which in 2012 had resulted from higher realised gains and the gratifying fair value develop-ment of the inflation swaps. The operating profit (EBIT) of EUR 1,061.0 million fell only slightly short of the previous year’s result (EUR 1,091.4 million). The underwriting result was thoroughly pleasing. The combined ratio improved on the previous year’s good level of 95.8% to reach 94.9%. The EBIT margin of 15.5% came in comfortably above our strategic target of 10% and reflects the outstanding result in non-life reinsur-ance. Group net income increased by 17.8% to EUR 807.7 mil-lion (EUR 685.6 million) and is thus the best performance to date in non-life reinsurance in Hannover Re’s history.

32 Hannover Re | Annual Report 2013
Life and health reinsurance
Despite the generally tense state of the life (re)insurance mar-ket, business developed moderately in life and health reinsur-ance in the year under review. Gross premium volume increased by 1.4% to EUR 6.1 billion (EUR 6.1 billion). Adjusted for exchange rate effects, growth amounted to 5.1%; it thus came in within the forecast target corridor for 2013 of 5% to 7%.
Investment income in life and health reinsurance totalled EUR 611.5 million (EUR 685.1 million) in the year under review. Of this, EUR 269.1 million (EUR 343.4 million) was attribut-able to assets under own management and EUR 342.4 million (EUR 341.7 million) to securities deposited with ceding com-panies. The decline of 10.7% in investment income reflects the stubbornly low interest rate level and the difficult investment climate on capital markets. As a further factor, the performance of the Modified Coinsurance (ModCo) derivatives reverted to normal after the very positive result posted in the previous year.
The operating profit (EBIT) of EUR 150.5 million (EUR 279.0 mil-lion) lagged well behind the level of the previous year. It should be borne in mind here that the previous year’s result had been influenced by positive special effects that were not repeated in the year under review. In addition, we strengthened reserves for our Australian disability business in the reporting period. The fact that we nevertheless delivered a solid performance for 2013 shows that even in challenging conditions our written portfolio generates profitable results.
Our Financial Solutions and Longevity business fared excep-tionally well, generating an EBIT margin of 5.2% and thus comfortably beating the 2% target. The EBIT margin for Mor-tality and Morbidity business fell well short of the targeted 6% mark at 1.2%. This was influenced by the unfavourable per-formance of Morbidity business; considered separately, Mor-tality business would have actually surpassed the target. The elevated risk experiences market-wide in Australian disability business and the deterioration in their run-off were the key factors in the unsatisfactory development of the EBIT margin. The Australian market has since initiated intensive efforts to positively counteract this trend.
These to some extent opposing developments resulted in reduced Group net income of EUR 164.2 million (EUR 222.5 mil-lion) for life and health reinsurance. Earnings per share amounted to EUR 1.36 (EUR 1.84).
Investments
We are satisfied with the development of our total investments. Thanks to what was still a highly positive operating cash flow, the portfolio of investments under own management amounted to EUR 31.9 billion and thus remained on a par with the pre-vious year (EUR 31.9 billion) despite the decrease in valuation reserves. Bearing in mind the continued low level of inter-est rates, it is very pleasing to note that ordinary investment income excluding income from funds withheld and contract deposits remained virtually unchanged at EUR 1,041.3 million (EUR 1,088.4 million).
Overall, our income from assets under own management con-tracted year-on-year as expected: it totalled EUR 1,054.5 mil-lion (EUR 1,300.2 million) as at 31 December 2013. The result-ing annual return (excluding ModCo derivatives and inflation swaps) amounted to 3.4% (4.1%). The decrease relative to the previous year can be attributed in part to the net realised gains, which at EUR 144.2 million (EUR 227.5 million) were consid-erably lower than in the previous year – when we had acted to a greater extent on opportunities in the real estate sector. On the other hand, in the previous year we had recorded excep-tionally high positive fair value changes of EUR 89.3 million in our financial assets measured at fair value through profit or loss; these contrasted with a negative fair value change of EUR 27.1 million as at 31 December 2013, which was attribut-able primarily to the performance of the inflation swaps. This was only partially offset by the marginally positive result of the ModCo derivatives.
Write-downs were again taken in only a minimal volume in the year under review, the bulk of them being due to sched-uled depreciation on real estate. Income from funds withheld and contract deposits remained stable at EUR 357.3 million (EUR 355.5 million).
Gross premium by business groupin EUR million
0
3000
6000
9000
12000
15000
0
3000
6000
9000
12000
15000
2009
Non-life reinsurance Life and health reinsurance
7,8187,717
5,7476,8266,339
6,1456,058
4,529
5,2705,090
10,275
12,09611,429
13,774 13,963
2010 2011 2012 2013
15,000
12,000
9,000
6,000
3,000
0

33
Com
bine
d m
anag
emen
t re
port
Hannover Re | Annual Report 2013
Total result
The gross premium in our total business increased by 1.4% as at 31 December 2013 to EUR 14.0 billion (EUR 13.8 billion). At constant exchange rates the increase would have been 4.2%. The growth rate in a fiercely competitive environment was thus somewhat below our forecast, which had anticipated around 5%. The level of retained premium decreased slightly to 89.0% (89.8%). This resulted principally from increased reinsurance cessions for fronting business written for third parties. Net pre-mium earned remained almost unchanged at EUR 12.2 billion (EUR 12.3 billion). At constant exchange rates growth would have come in at 2.3%.
We are exceptionally satisfied with the development of our results. Although the operating profit (EBIT) retreated by 11.8% following the elimination of positive effects from fair value changes in the ModCo derivatives and inflation swaps, it still reached a very good level at EUR 1,229.1 million (EUR 1,393.9 million). Despite a generally challenging environ-ment in the reinsurance sector and faced with stubbornly low
interest rates, we generated the highest Group net income in the history of Hannover Re at EUR 895.5 million. The crucial factors here were a thoroughly pleasing result in non-life rein-surance and the aforementioned special tax effects. Earnings per share amounted to EUR 7.43 (EUR 7.04).
The equity attributable to shareholders of Hannover Re also developed favourably in the year under review: while erosion of the valuation reserves due to rises in yields – especially on high-quality government bonds – and payment of an increased dividend in the second quarter led to a slight reduction in shareholders’ equity, the return on equity of 15.0% (15.4%) nevertheless comfortably surpassed our minimum target of 9.8% (750 basis points above the risk-free interest rate). The shareholders’ equity as at 31 December 2013 amounted to EUR 5.9 billion (EUR 6.0 billion). The book value per share was also positive at EUR 48.83 (EUR 50.02). The total policyhold-ers’ surplus, consisting of shareholders equity, non-control-ling interests and hybrid capital, amounted to EUR 8.8 billion (EUR 8.9 billion).
Business development in the year under review
Forecast 2013 Target attainment 2013
Gross premium growth (Group) ≈ + 5% 1 +4.2% at constant exchange rates +1.4% not adjusted for currency effects
Gross premium growth for non-life reinsurance ≈ + 3 – 5% 1 +3.5% at constant exchange rates +1.3% not adjusted for currency effects
Gross premium growth for life and health reinsurance ≈ + 5 – 7% 1, 2 +5.1% at constant exchange rates +1.4% not adjusted for currency effects
Return on investment 3 ≈ 3.4% 3.4%
Group net income ≈ EUR 800 million 4 EUR 895.5 million
1 At constant exchange rates2 Organic growth only3 Excluding inflation swaps and ModCo derivatives4 Assuming stable capital markets and / or major loss expenditure in 2013 that does not exceed EUR 625 million
Overall assessment of the business position
The Executive Board of the Hannover Re Group is satisfied with the development of business in 2013. The company sur-passed its goals, such as those for Group net income, return on equity and combined ratio. Although investment income declined owing to the sustained low level of interest rates, it is pleasing to note that the targeted return on investment was achieved in the reporting period. Indeed, Group net income actually came in significantly higher than planned. This per-
formance is particularly gratifying in view of the challenging business environment. Despite sharply lower valuation reserves in the investment portfolio and the distribution of an attrac-tive dividend including a bonus, Hannover Re’s shareholders’ equity remains robust. At the time of preparing the manage-ment report, the company’s business position and its financial strength continue to be very good.

34 Hannover Re | Annual Report 2013
Results of operations
In the following sections we discuss the development of the financial year in our two strategic business groups, namely non-life reinsurance and life and health reinsurance, as well as the performance of our investments and the financial posi-tion and assets of our Group. Supplementary to the information provided here, the segment reporting in Section 5 of the notes to this Annual Report shows the key balance sheet items and profit components broken down into the two business groups.
Non-life reinsurance
• Highest-ever Group net income of EUR 807.7 million • Major losses slightly below expectations at EUR 577.6 million • Pleasing combined ratio of 94.9% • Currency-adjusted premium growth of +3.5% according to plan
Accounting for 56% of our premium volume, non-life reinsur-ance is Hannover Re’s largest business group. We continue to pursue unchanged our strategy of active cycle management: we expand our business only in areas where the rate situation is favourable. If prices fail to meet our profitability require-ments, we systematically reduce our shares.
We were broadly satisfied with the market development in non-life reinsurance in the year under review, although competition was considerably more intense than in 2012. The primary rea-son here was the availability of sufficient capacity in the market overall, as a consequence of which the supply of reinsurance protection exceeded demand. A further contributory factor was the increased business carried by our clients in their retention.
The treaty renewals in non-life reinsurance as at 1 January 2013 – the date on which almost two-thirds of our treaties in traditional reinsurance were renegotiated – got off to a thor-oughly promising start. The heavy losses incurred by the (re)insurance industry from hurricane “Sandy” had exerted a sta-bilising effect on rates. Over the year, however, the rate level softened more appreciably than had been initially expected. This was especially true of US natural catastrophe business. Substantial price erosion was observed here, driven in part by additional capacities from alternative markets (catastrophe bonds, collateralised reinsurance). Given that Hannover Re’s exposure to US natural catastrophe business is disproportion-ately small relative to its market share, the repercussions were nevertheless limited.
Yet in regions or lines that had seen significant losses in 2012, such as marine reinsurance, it was possible to push through sometimes appreciable price increases. In view of the record high loss expenditure associated with the wreck and salvage of the “Costa Concordia” cruise ship as well as with hurricane “Sandy”, rates here climbed sharply; under loss-impacted pro-grammes the increases ranged from 25% to 40%. We were again able to obtain considerable premium increases for non-proportional motor liability covers in the United Kingdom. In markets or lines that had posted good underwriting results in the comparable period owing to minimal losses – for example aviation business – rates declined, but the business was still adequately priced. We were also satisfied with the develop-ment of the rest of our property and casualty portfolio in North America. As expected, appreciable growth was booked from the markets of Asia and the Middle East.
Thanks to our selective underwriting approach we were able to achieve a price level in the non-life reinsurance that was at least equivalent in quality to the good 2012 financial year. Against this backdrop, we slightly enlarged our portfolio.
The gross premium volume for our non-life reinsurance business group climbed by 1.3% in the year under review to EUR 7.8 billion (previous year: EUR 7.7 billion). At con-stant exchange rates, growth would have come in at 3.5%. This means that the growth in our currency-adjusted gross premium was within the expected range of 3% to 5%. The retention decreased slightly to 89.9% (90.2%) on account of an increased volume of fronting business. Net premium earned consequently nudged only slightly higher by 0.2% to EUR 6.9 billion (EUR 6.9 billion). Growth would have been 2.3% at constant exchange rates.

35
Com
bine
d m
anag
emen
t re
port
Hannover Re | Annual Report 2013
Non-life reinsurance at a glance
Gross written premium in non-life reinsurance in EUR million
0
1000
2000
3000
4000
5000
6000
7000
8000
0
1000
2000
3000
4000
5000
6000
7000
8000
2009
Target markets Global reinsurance Specialty lines
1,736
2,235
2,212
2,371
1,857
2,403
2,566
2,131
2,7892,966
2,594
2,257
2,798
1,776
1,756
5,747
6,339
6,826
7,717 7,818
2010 2011 2012 2013
8,000
6,000
4,000
2,000
0
Geographical breakdown of gross written premium in 2013
2.5% Australia
3.7% Africa
25.1% North America
21.8% Rest of Europe
14.9% United Kingdom
12.7% Germany
11.3% Asia
8.1% Latin America
Breakdown of proportional and non-proportional treaties by volume in EUR million
proportional non-proportional
0
1000
2000
3000
4000
5000
6000
7000
8000
0
1000
2000
3000
4000
5000
6000
7000
8000
6,8266,339
7,717 7,818
2010 2011 2012 2013
8,000
6,000
4,000
2,000
0
4,752(61%)
4,837(63%)4,310
(63%)3,829(60%)
3,066(39%)
2,880(37%)
2,518(37%)
2,509(40%)
Breakdown into business written through brokers and direct business in EUR million
0
1000
2000
3000
4000
5000
6000
7000
8000
0
1000
2000
3000
4000
5000
6000
7000
8000
business written through brokers direct business
6,8266,339
7,717 7,818
2010 2011 2012 2013
8,000
6,000
4,000
2,000
0
2,459(32%)
2,450(32%)
2,525(37%)
3,930(62%)
5,359(68%)5,267
(68%)4,300(63%)
2,409(38%)

36 Hannover Re | Annual Report 2013
After a very tranquil first quarter we were faced with numerous major losses in the course of 2013. Germany and Canada were impacted especially heavily by losses from natural disasters. The hurricane season in North America and the Caribbean, on the other hand, again passed off unremarkably. For the first time since 1968 no storm exceeded category 1, the weakest of the five categories.
The largest individual losses incurred by Hannover Re in the year under review were the hail event “Andreas” in Ger-many – with net expenditure of EUR 99.3 million – and the
flooding in Germany and other European countries, at a cost of EUR 92.5 million. These and other major losses combined to produce net expenditure for 2013 of altogether EUR 577.6 mil-lion (EUR 477.8 million). Although this figure was higher than in the previous year, the burden of major losses nevertheless came in below our expected level of EUR 625 million. At 94.9% (95.8%), our combined ratio again improved on the previous year and remained below our target mark of 96%. Key factors in this pleasing development were the merely partial utilisa-tion of our major loss budget as well as run-off profits. The latter still remained in line with expectations thanks to the
0
500
1000
1500
2000
0
500
1000
1500
2000
2500
200
300
400
500
600
700
Non-life reinsurance: Major loss trend 1in EUR million
2,500
2,000
1,500
1,000
500
0
2004 2005 2006 2007 2008 2009 2010 2011 2012 2013
Gross Net Net expectancy for major losses 1
1 Natural catastrophes and other major losses in excess of EUR 10 million gross (until 31 December 2011: in excess of EUR 5 million gross)
2,373
1,730
281 314378 360
428 450500 530 560
625
775
377
1,070
121 107
410285
672
458
291 240
863
662
981
662724
478578
Non-life reinsurance: Key figures for individual markets and lines in 2013
Gross premium in EUR million
Change in gross premium relative to
previous year
EBIT in EUR million
Combined ratio
Maximum tolerable combined ratio (MtCR)
Target markets 2,257.6 +5.9% 204.9 101.8% 96.1%
Germany 1,080.8 +7.4% (30.6) 111.2% 97.1%
North America 1,176.8 +4.7% 235.5 92.9% 95.3%
Specialty lines 2,594.2 -7.3% 299.7 94.0% 97.3%
Marine 290.8 -5.8% 71.5 76.2% 94.4%
Aviation 402.5 -3.2% 103.6 78.4% 97.5%
Credit / surety 630.5 +2.2% 70.0 94.2% 96.2%
Structured reinsurance incl. ILS 612.6 -15.9% 55.4 97.5% 99.6%
UK, London market & direct business 657.7 -9.7% (0.8) 107.7% 96.7%
Global reinsurance 2,966.1 +6.4% 556.5 90.4% 95.1%
Worldwide treaty reinsurance 1,691.6 +7.4% 268.2 94.3% 97.6%
Global catastrophe business 433.1 +6.5% 156.3 65.1% 75.7%
Facultative reinsurance 841.5 +4.2% 131.9 91.6% 96.0%

37
Com
bine
d m
anag
emen
t re
port
Hannover Re | Annual Report 2013
Key figures for non-life reinsurance
in EUR million 2013 + / –previous
year
2012 1 2011 2010 2009
Gross written premium 7,817.9 +1.3% 7,717.5 6,825.5 6,339.3 5,746.6
Net premium earned 6,866.3 +0.2% 6,854.0 5,960.8 5,393.9 5,229.5
Underwriting result 335.5 +23.2% 272.2 (268.7) 82.4 143.5
Net investment income 781.2 -17.3% 944.5 845.4 721.2 563.2
Operating result (EBIT) 1,061.0 -2.8% 1,091.4 599.3 879.6 731.4
Group net income 807.7 +17.8% 685.6 455.6 581.0 472.6
Earnings per share in EUR 6.70 +17.8% 5.68 3.78 4.82 3.92
EBIT margin 2 15.5% 15.9% 10.1% 16.3% 14.0%
Retention 89.9% 90.2% 91.3% 88.9% 94.1%
Combined ratio 3 94.9% 95.8% 104.3% 98.2% 96.6%
1 Adjusted pursuant to IAS 8 (cf. Section 3.1 of the notes)2 Operating result (EBIT) / net premium earned3 Including expenses on funds withheld and contract deposits
conservative initial reserves constituted for recent underwriting years. The confidence level of the loss reserves was neverthe-less further increased. The underwriting result improved again markedly to EUR 335.5 million (EUR 272.2 million).
Investment income in the non-life reinsurance business group contracted by 17.3% in the year under review to EUR 781.2 mil-lion (EUR 944.5 million). Key drivers here were lower real-ised gains as well as the elimination of positive effects from the inflation swaps taken out by Hannover Re to partially hedge its loss reserves. These factors were in large measure offset by the very good underwriting result. The operating profit (EBIT) of EUR 1,061.0 million – a decrease of 2.8% – fell only very slightly short of last year’s record level of EUR 1,091.4 million. Assisted by the positive tax effect, Group net income for the non-life reinsurance business group increased by a substantial 17.8% to EUR 807.7 million (EUR 685.6 million). Earnings per share for non-life reinsurance amounted to EUR 6.70 (EUR 5.68).
On the following pages we report in detail on developments in the individual markets and lines of our non-life reinsurance business group, which is split into three segments according to the areas of responsibility on the Executive Board: target markets, specialty lines and global reinsurance.
Target markets We classify Germany and North America as target markets. The premium volume grew by 5.9% to EUR 2,257.6 million (EUR 2,131.1 million) and was thus within our planned range for 2013. The combined ratio inched slightly higher to 101.8% (101.3 %). The operating profit (EBIT) in the year under review amounted to EUR 204.9 million (EUR 270.4 million).
Germany Within the Hannover Re Group the German market – the sec-ond-largest in the world for non-life reinsurance – is served by our subsidiary E+S Rück. As the “dedicated reinsurer for Germany”, the company is a sought-after partner thanks to its good rating and the continuity of its business relations. E+S Rück is superbly positioned in its domestic German market and one of the market leaders in non-life reinsurance.
The German insurance market recorded further growth in property / casualty business in the year under review. This was driven principally by motor insurance, which enjoyed another year of premium growth in all lines in 2013. Nevertheless, the
Non-life reinsurance: Breakdown of gross written premium in target markets in EUR million
0
500
1000
1500
2000
2500
0
500
1000
1500
2000
2500
Germany North America
883 920978
878
1,0071,081
1,124
1,177
852836
1,736 1,7541,858
2,1312,258
20102009 2011 2012 2013
2,500
2,000
1,500
1,000
500
0

38 Hannover Re | Annual Report 2013
retail property insurance lines also posted gains. The insur-ance density in the area of extended coverage for natural perils increased as a consequence of greater risk awareness with respect to natural catastrophe events.
The loss experience in our domestic market was particularly elevated in the year under review owing to extreme weather events. Following extensive flooding in June with insured losses in the order of EUR 2 billion, (re)insurers found themselves facing further losses of around EUR 3 billion within just a few weeks as a consequence of severe hail events. The enormous scale of damage was caused by the exceptionally large hail-stones and the storm track across densely populated areas. Property insurance and motor own damage insurance were especially hard hit by these events. The net losses for the Han-nover Re Group from the hail events “Manni” and “Andreas” totalled EUR 137 million. Germany suffered additional heavy losses from windstorms “Christian” and “Xaver”.
In homeowners insurance, which was heavily impacted by these natural catastrophe events, further action was still needed after the unsatisfactory results of prior years and the latest red figures. Industrial property insurance lines remained fiercely competitive; there were no indications of a broad-based improvement in premium levels.
Long-tail liability lines (general liability, motor liability) are sensitive to interest rates; as anticipated, improved rates could be obtained here – especially for motor XL covers. The stub-bornly low level of interest rates nevertheless necessitates fur-ther technical rate adjustments.
Personal accident business once again fared very well for our company. Along with reinsurance covers, we offer our clients in this line a broad range of services. In the year under review, for example, we completed the project that we had undertaken with other partners to overhaul a product that provides func-tional disability insurance for adults. A comparable product for children is scheduled to be ready by the beginning of 2014.
Hannover Re also supports covers for sources of renewable energy. Our exposure in this new segment is, however, still modest in view of the continued difficulty of assessing risks and the intense competition.
Although we had anticipated a modest reduction, our pre-mium volume for German business increased by 7.4% to EUR 1,080.8 million (EUR 1,006.7 million). Reflecting the high loss intensity in the year under review, the combined ratio climbed sharply to 111.2% (99.9%). The operat-ing result (EBIT) consequently fell short of expectations at -EUR 30.6 million. North AmericaThe North American (re)insurance market is the largest single market both worldwide and for Hannover Re. Our business is written through brokers.
The economic climate picked up slightly in the year under review, and with economic growth insured values also rose – hence further boosting the premium volume in the original market. The reinsurance volume also continued to increase in 2013. Given that the US was largely spared significant natural catastrophe losses, the combined ratio for the reinsurance mar-ket was considerably better than it was for the primary market. Against this backdrop, our business in the United States devel-oped favourably. Only in our Canadian business were results adversely impacted by record one-off losses due to two major flood events in Calgary and Toronto.
Rate movements on the North American primary insurance market gave grounds for satisfaction. With the exception of a few minor lines such as medical malpractice, rate increases of 5% to 10% were achieved. Overall, the pressure on the rate level was sustained on account of reduced investment income. Hardly any new players entered the US market in 2013, and the reinsurance market – despite a slight increase in equity resources – can therefore still be described as disciplined. How-ever, rates in the catastrophe XL market – which accounts for less than 10% of our total portfolio – came under pressure due to the inflow of capital from alternative markets (ILS).
Thanks to our excellent rating and financial standing we are a valued partner for our clients, especially when it comes to long-tail liability placements. Access to the entire market spectrum enables us to optimally diversify our portfolio. Our business is made up of more than 2,000 treaties spread across almost 600 clients.
Non-life reinsurance: Breakdown of gross written premium in Germany by line of business
8.4% Other
36.9% Property
34.3% Motor
20.4% Liability
39
Com
bine
d m
anag
emen
t re
port
Hannover Re | Annual Report 2013
Casualty business continued to grow in appeal. Almost all lines saw further rate increases combined with a reduced loss inci-dence. On the property side, as expected, rates improved on the back of the losses from hurricane “Sandy”, although in the third and fourth quarters a slight softening – especially in industrial lines – could be observed. Given that the overall level was nevertheless highly satisfactory, we continued to expand our property portfolio.
The major loss situation in North America was crucially shaped in the year under review by the flood events in Canada. While Alberta, in particular, suffered flooding as a consequence of heavy rainfall, the US was affected by a series of tornadoes. On the other hand, hurricane events with implications for the reinsurance industry were once again absent in 2013. For fur-ther information on losses from natural disasters please see the section entitled “Global catastrophe business” on page 45.
We continued to expand our portfolio in the year under review thanks to an improved pricing environment. The premium vol-ume for our business in North America grew as expected by 4.7% to EUR 1,176.8 million, an outcome which we consider satisfactory. The combined ratio for our North American busi-ness stood at 92.9% in the year under review after 102.5 % in 2012. The operating profit (EBIT) increased to EUR 235.5 mil-lion (EUR 150.8 million).
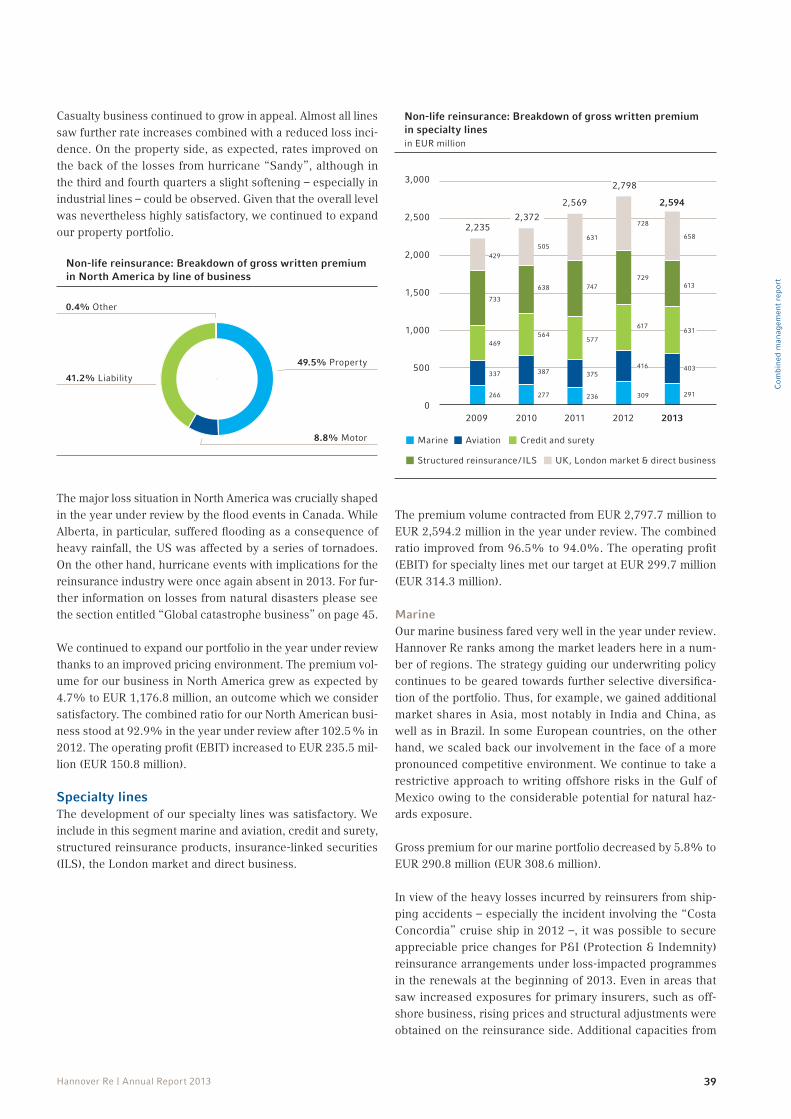
Specialty lines The development of our specialty lines was satisfactory. We include in this segment marine and aviation, credit and surety, structured reinsurance products, insurance-linked securities (ILS), the London market and direct business.
The premium volume contracted from EUR 2,797.7 million to EUR 2,594.2 million in the year under review. The combined ratio improved from 96.5% to 94.0%. The operating profit (EBIT) for specialty lines met our target at EUR 299.7 million (EUR 314.3 million).
MarineOur marine business fared very well in the year under review. Hannover Re ranks among the market leaders here in a num-ber of regions. The strategy guiding our underwriting policy continues to be geared towards further selective diversifica-tion of the portfolio. Thus, for example, we gained additional market shares in Asia, most notably in India and China, as well as in Brazil. In some European countries, on the other hand, we scaled back our involvement in the face of a more pronounced competitive environment. We continue to take a restrictive approach to writing offshore risks in the Gulf of Mexico owing to the considerable potential for natural haz-ards exposure.
Gross premium for our marine portfolio decreased by 5.8% to EUR 290.8 million (EUR 308.6 million).
In view of the heavy losses incurred by reinsurers from ship-ping accidents – especially the incident involving the “Costa Concordia” cruise ship in 2012 –, it was possible to secure appreciable price changes for P&I (Protection & Indemnity) reinsurance arrangements under loss-impacted programmes in the renewals at the beginning of 2013. Even in areas that saw increased exposures for primary insurers, such as off-shore business, rising prices and structural adjustments were obtained on the reinsurance side. Additional capacities from
Non-life reinsurance: Breakdown of gross written premium in North America by line of business
0.4% Other
49.5% Property
8.8% Motor
41.2% Liability
UK, London market & direct business
Non-life reinsurance: Breakdown of gross written premium in specialty lines in EUR million
0
500
1000
1500
2000
2500
3000
0
500
1000
1500
2000
2500
3000
Marine
Structured reinsurance / ILS
Aviation Credit and surety
266
337
469
429
277
387
564
236
375
747
577
631
309 291
416 403
617631
729613
728
658
733
638
505
2,2352,372
2,569 2,594
2,798
20102009 2011 2012 2013
3,000
2,500
2,000
1,500
1,000
500
0

40 Hannover Re | Annual Report 2013
the ILS market played no significant role in marine reinsurance because, among other things, there are no means of model-ling the risks.
In the year under review we incurred a major loss for which we set aside reserves of EUR 20.7 million. The claims situation in marine business was, however, also notable for a deteriora-tion in the run-off of losses from prior years. In particular, the doubling of the salvage costs for the “Costa Concordia” left a mark. This state of affairs had no substantial effect on our net loss expenditure, however, owing to corresponding protection covers that we had purchased.
The underwriting result for our marine business was consid-erably better than in the previous year of heavy losses. The combined ratio was very good at 76.2% (114.8%). The oper-ating profit (EBIT) climbed appreciably to EUR 71.5 million (EUR 2.5 million).
Aviation In international aviation reinsurance, too, Hannover Re is one of the market leaders.
In airline fleet business the (re)insurance industry benefited from both the rising insured values of aircraft and higher pas-senger numbers. General aviation business, on the other hand, was flat in many regions with fewer private aircraft being pur-chased as economic uncertainties persist.
The loss experience in the aviation market remains very favour-able relative to the multi-year historical average. This trend can be attributed above all to technical advances in aviation safety systems.
Although the burden of major losses continued to be below average, the year under review saw a higher frequency of hull losses. This development did not, however, have any significant implications for reinsurers because for the most part the claims remained within the retention carried by primary insurers. Given a moderate loss situation overall and the existing sur-plus capacities, rates in aviation business continued to soften.
In a market that is not without its challenges on the whole, our goal is to preserve our portfolio and further consolidate it where necessary. We successfully achieved this aim in the year under review. The premium volume for our total aviation portfolio contracted slightly, as forecast, to EUR 402.5 million (EUR 415.7 million).
The largest single loss in 2013 was the crash landing of a pas-senger plane at San Francisco airport. The resulting net loss for Hannover Re amounted to EUR 20.3 million. We are thor-oughly satisfied with the underwriting result. The combined ratio stood at 78.4% (81.8%), a testament to the strong prof-itability of our aviation portfolio. The operating profit (EBIT) retreated slightly to EUR 103.6 million (EUR 112.6 million).
Credit and surety In worldwide credit and surety reinsurance Hannover Re ranks among the market leaders.
With the global economy showing tepid growth and in the face of generally difficult economic conditions, the number of insolvencies remained high. Nevertheless, credit insurance largely resisted this trend thanks to a disciplined underwrit-ing policy. Expenditure on basic losses therefore remained on a moderate level; only in terms of the absolute loss amounts was a slight increase recorded. Rates in credit reinsurance remained broadly stable.
An increased number of mid-sized basic losses was observed in surety insurance in 2013. This development was due to the fact that the repercussions of the crisis in the construction industry only made themselves felt after a time delay. Improvements in conditions were possible in some markets in response to the increased claims expenditure. From an overall perspective, surety markets remained stable.
Despite greater risk awareness, the claims burden in the area of political risks remained low. Prices in this line consequently showed a moderate decrease.
In view of a prevailing capacity surplus and the diminishing appeal of treaty conditions in credit and surety reinsurance, further expansion of our market share was not a priority for us. Only in cases where our required margins were met did we undertake measured expansion of our portfolio. This was especially true of business with political risks in the year under review.
Gross premium income increased by 2.2% in 2013 to EUR 630.5 million (EUR 616.7 million). On the whole, we are satisfied with the development of our credit and surety busi-ness in the year under review. The increased frequency of mid-sized losses was largely offset by a positive run-off of prior underwriting years. The combined ratio amounted to 94.2% (90.4%). The operating profit (EBIT) came in at EUR 70.0 mil-lion (EUR 107.8 million).
Structured reinsuranceHannover Re is one of the largest providers in the world of structured reinsurance solutions. These products are designed, among other things, to optimise the cost of capital for our ced-ing companies.
As forecast, demand for bespoke alternative reinsurance solu-tions continued to grow in the year under review. This trend also includes aggregate excess of loss covers, which protect the net retention of our clients against significant loss scenarios with a low probability of occurrence.

41
Com
bine
d m
anag
emen
t re
port
Hannover Re | Annual Report 2013
Growth impetus for structured reinsurance is deriving in par-ticular from preparations for the adoption of Solvency II in the European Union as well as from the implementation of risk-based capital requirements in various countries.
In keeping with our objective we pressed ahead with the enlargement of our customer base and further improved the regional diversification of our portfolio in the year under review. We also stepped up our involvement in the area of aggregate excess of loss covers. Quota share arrangements in motor business designed to deliver solvency relief continued to enjoy brisk demand.
The premium volume for structured reinsurance contracted in the year under review. Results fell slightly short of our expecta-tions owing to an increased loss frequency and the strengthen-ing of reserves for a medical malpractice programme.
Insurance-Linked Securities (ILS)Demand for ILS products not only on the capital market but also among investors from the traditional reinsurance and primary insurance market showed no signs of easing. Thus, for exam-ple, we were able to renew our “K” quota share – a modelled quota share cession consisting of non-proportional reinsur-ance treaties in the property, catastrophe, aviation and marine (including offshore) lines that we have placed inter alia on the ILS market for almost 20 years – on a virtually unchanged level of around USD 320 million for 2013.
In addition to using the capital market to protect our own prop-erty catastrophe risks, we transfer risks to it in a structured and packaged form on behalf of our cedants. We also take the role of investor ourselves by investing in catastrophe bonds.
The year under review, just like the previous year, brought another strong inflow of cash into the ILS market. On the one hand, investors value the low correlation with other financial assets and the associated diversification, while at the same time they also find the market for insurance risks relatively appeal-ing in comparison with other investments. As a result, catas-trophe bonds have enjoyed lively demand among the investor community. Prices for these bonds have consequently fallen considerably. Yet the issuance of catastrophe bonds has also become a more attractive proposition. The volume of new issues in the market was once again higher.
The available funds currently exceed by far the opportunities for new investments in catastrophe bonds. This has prompted investors to look for other means of investing in the reinsur-ance sector. So-called collateralised reinsurance programmes enjoyed particularly strong growth in the year under review and have now surpassed the volume of funds invested in catas-trophe bonds. Under collateralised reinsurance business the investor assumes reinsurance risks that are normally collater-alised in the amount of the limit of liability.
Hannover Re’s product range encompasses the entire spec-trum of activities typically associated with the ILS market. We thereby offer investors optimised and customised access to the capital market. In the year under review we further expanded our cooperation with selected managers of investor funds in the area of collateralised reinsurance business and were able to generate attractive margins. When it comes to investing in catastrophe bonds, on the other hand, we showed restraint on account of the sharp decline in prices.
United Kingdom, London market and direct business Traditional reinsurance We are satisfied with the reinsurance business that we write in the United Kingdom and on the London market. The rate level remained stable overall. Building on the very favourable market conditions in non-proportional motor reinsurance in 2012, we secured further appreciable rate increases in the year under review. Against this backdrop we doubled our premium volume in this area. As anticipated, we were able to expand our UK portfolio in 2013.
Direct business We write our direct business through two subsidiaries, Inter-national Insurance Company of Hannover Plc (Inter Hannover) in the United Kingdom and the South African company Com-pass Insurance Company Limited, a subsidiary of Hannover Reinsurance Africa Limited. This essentially involves tightly defined portfolios of niche or other non-standard business that complements our principal commercial activity as a reinsurer.
The state of the UK economy showed no significant improve-ment compared to 2012. Fierce competition continued to pre-vail among the insurers and reinsurers writing business in this market. In many lines this was inevitably reflected in a deterio-rating rate level. In contrast to the non-proportional reinsur-ance sector, rates in motor primary business retreated after short-lived rallies. Private homeowners insurance as well as covers for small and mid-sized businesses were also impacted by rate erosion. We responded by significantly scaling back our exposures in these areas from agency acceptances.

42 Hannover Re | Annual Report 2013
Inter Hannover’s business written in Sweden continued to per-form highly satisfactorily. The focus there is on the marine and aviation lines. The development of business at the branches in Australia and Canada – markets which are highly competitive – was in line with expectations.
The South African non-life reinsurance market reached the low-est point of the soft market in 2013. In common with most insur-ers in South Africa, Compass Insurance Company Limited, our second company writing specialty lines, failed to achieve its profit targets on account of heavy losses. The market losses did, however, put a stop to rate reductions and virtually all market players have announced or in some cases already implemented significant increases for 2014. Compass Insurance Company Limited and the local partner underwriting managers belong-ing to the Hannover Re Group are ideally placed to profit from these rate improvements.
Global reinsuranceWe combine all markets worldwide under global reinsurance with the exception of our target markets of Germany and North America and the specialty lines. This segment also encom-passes global catastrophe business, facultative reinsurance, the reinsurance of agricultural risks and Sharia-compliant retakaful business.
The premium volume grew by 6.4% in the year under review to EUR 2,966.1 million (EUR 2,788.7 million). This is in line with our forecast of stable growth. The combined ratio decreased from 90.9% to 90.4%. The operating profit (EBIT) improved from EUR 507.1 million to EUR 556.5 million.
Worldwide treaty reinsuranceWe were satisfied with the development of our worldwide treaty reinsurance portfolio. The gross premium volume grew by 7.4% to EUR 1,691.6 million and was thus in line with our expectations. The combined ratio improved from 96.3% to 94.3%. The operating profit (EBIT) came in as planned, rising to EUR 268.2 million.
Europe European markets continue to be fiercely competitive; this is true both of countries in Central and Eastern Europe and of mature markets such as France. On the whole, market condi-tions here are still very soft. As anticipated, prices retreated slightly in most lines of business. In builder’s risk insurance the challenging economic circumstances led to sharply lower premiums. No significant loss events occurred in France in 2013. The premium volume for Hannover Re remained stable in the year under review.
Despite very tight margins, we were able to enlarge our market share in Spain and Portugal thanks to regrouping of the port-folio. While industrial fire business recorded further losses, the situation in Spain was dominated by the devastating accident near Santiago de Compostela involving a high-speed passen-ger train, which caused numerous fatalities. This incident did not result in a major loss for Hannover Re.
The markets of Northern Europe are served by our branch in Stockholm. Although large industrial programmes continued to be highly competitive, the situation in retail insurance lines was considerably more relaxed. Rates in general remained broadly stable. No major loss events were recorded.
Non-life reinsurance: Breakdown of gross written premium in global reinsurance in EUR million
0
500
1000
1500
2000
2500
3000
0
500
1000
1500
2000
2500
3000
Facultative reinsurance
Worldwide treaty reinsurance
Global catastrophe business
487
304
986
693
305
1,215
680
365
1,358
808842
407433
1,574
1,692
1,776
2,213
2,399
2,7892,966
20102009 2011 2012 2013
3,000
2,500
2,000
1,500
1,000
500
0
Non-life reinsurance: Breakdown of gross written premium in worldwide treaty reinsurance
9.2% Other
55.9% Property
17.6% Liability
17.4% Motor

43
Com
bine
d m
anag
emen
t re
port
Hannover Re | Annual Report 2013
Compared with the primary insurance markets of Western Europe, growth rates in the countries of Central and Eastern Europe continue to be above average. As a result, competi-tion remains intense and original rates in most countries are under pressure. On the reinsurance side, by contrast, prices and conditions in the year under review were again broadly commensurate with the risks, thereby enabling us to boost our premium volume as forecast. We have defined the markets of Central and Eastern Europe as strategic growth markets and it remains our assumption – based on a selective underwriting policy – that we can generate further strong profitability going forward. In terms of losses, various Central and Eastern Euro-pean countries were impacted by severe flooding in the sum-mer of 2013; we also incurred a number of basic losses. Despite this, we were thoroughly satisfied with the development of our business in the markets of Central and Eastern Europe.
Latin AmericaHannover Re is well positioned in Latin America and a market leader in some countries. The most important markets for our company are Brazil – where a survey found us to be one of the three most highly regarded reinsurers –, Mexico, Argentina, Colombia and Ecuador.
Latin American markets have enjoyed very vigorous growth in recent years. In Brazil further programmes were launched to stimulate the economy. The country is investing heavily in infrastructure and power generation as it prepares for two major sporting events, the FIFA World Cup in 2014 and the 2016 Olympic Games. These growth incentives continued to foster rising demand for (re)insurance covers in the year under review.
In Brazil, a market in which we operate as an “admitted rein-surer”, we ensure close business ties with our clients through a representative office. Although competition here is intensi-fying, we are very well positioned in the market and a valued partner thanks to our excellent financial standing.
In view of the competitive climate, rising loss ratios and major losses in property business, we wrote our business highly selec-tively. We increased our shares in areas where we considered business to be attractive, for example by further enlarging our casualty and motor portfolio in the year under review.
In Argentina we succeeded in slightly expanding our port-folio despite the restrictions placed on foreign reinsurers. In Chile, Peru and Panama we boosted our market share while staying firmly focused on the profitability of the business writ-ten. Losses were incurred from several hurricanes in Mexico, although these did not result in a major loss for Hannover Re. These events did, however, have a favourable effect on reinsur-ance prices. Double-digit percentage increases in rates were pushed through for treaties that had been impacted by losses.
Asia-PacificregionThe Asia-Pacific countries are considered a growth region by Hannover Re. In the year under review we again extended our position here. Developments in the individual markets – in com-mon with the markets themselves – were very mixed. On the whole, the region was shaped by intense competition coupled with heavy losses in previous years as well as by losses in the year under review.
In Japan, a key market for our company, we were able to slightly expand our premium volume as planned. After the heavy losses incurred in 2011 conditions remained stable on a good level. Our broadly diversified product range and proven long-standing loyalty to our Japanese cedants enabled us to successfully set ourselves apart from our competitors. At the same time, though, the market consolidation and associated synergistic effects at our clients as well as adverse movements in the exchange rate presented a challenge.
Catastrophe covers, an important area of business in Japan, did not suffer any notable loss events in the year under review. Nor were there any appreciable losses in property, casualty and accident insurance – lines in which we often take the role of lead reinsurer –, as a consequence of which we were highly satisfied with the results of our Japanese portfolio.
While the Chinese insurance market failed to expand quite as vigorously in the year under review as it had in prior years, the growth was nevertheless considerably stronger than in mature insurance markets. Having scaled back our portfolio at the outset of 2013 in the face of soft conditions and hence insufficient profit expectations, we successfully intensified our business relations with selected clients as the year progressed. All in all, the market remained fiercely competitive, as was evident not only in original business but also in conditions for reinsurance treaties. With this in mind, we wrote our portfolio extremely selectively. Despite this, we were able to slightly enlarge the premium volume. Our underwriting result was adversely impacted in the year under review by a major loss at a semiconductor memory fabrication plant and two typhoons.
The aforementioned semiconductor fire also had repercussions on the Korean market, since the operator of the Chinese fac-tory was a Korean company. In what is in any case a highly competitive market – we write exclusively non-proportional covers in the property and casualty insurance segment – this led to a sharply poorer result.

44 Hannover Re | Annual Report 2013
In South and Southeast Asia we were again able to substan-tially improve our market position. Driven first and foremost by rising insurance densities, almost all insurance markets in this region posted disproportionately strong growth. Yet the tragic effects of typhoon “Haiyan”, which devastated parts of the Philippines and claimed thousands of lives, showed just how far many countries in this region still are from an area-wide and sustainable insurance density. Against this backdrop, the losses for the insurance industry were rather moderate; the cost of this event for our company, at EUR 18.5 million, was also comparatively slight.
In many parts of this region our portfolio consists predomi-nantly of property and motor business. We reduced the propor-tion of catastrophe-exposed business in the year under review because we did not consider conditions to be commensurate with the risks.
In India we established a service company that concentrates exclusively on the growing segment of microinsurance. Pro-vincial governments and local insurers are advised on prod-ucts that can provide insurance protection for low-income individuals.
We are thoroughly satisfied with the development of our busi-ness and our results in South and Southeast Asian markets. Our premium volume surged more strongly in the financial year than had been forecast. Growth was driven inter alia by niche lines. The burden of major losses in 2013 came in below expectations.
Unlike in the previous years, the loss situation in Australia and New Zealand was relatively untroubled in terms of natu-ral disasters. Adverse effects on our portfolio were therefore minimal. Even the bushfires close to Sydney failed to reach the scale that had been feared. Taken in conjunction with very low claims activity in the other lines, this prompted initial conces-sions over terms and conditions.
Thanks to our strong market position we benefited from an increased need for capacity driven by the more exacting capital requirements imposed by local insurance regulators.
On the whole, the development of our portfolio in Australia and New Zealand was satisfactory. As expected, our premium volume increased slightly in the year under review.
Retakaful business We write retakaful business – that is to say, reinsurance trans-acted in accordance with Islamic law – both on the Arabian Peninsula and in Southeast Asia. We maintain a dedicated sub-sidiary for this business in Bahrain (Hannover ReTakaful) as well as a branch that bears responsibility for writing traditional reinsurance in the Arab world.
The economy in this region continues to develop satisfacto-rily. Growth is driven in particular by government spending on infrastructure as well as oil and gas projects. The primary insurance market remains highly competitive, thereby adding to the pressure on rates. On the reinsurance side new providers with additional capacities forced their way into the markets.
Hannover Re is strongly placed in retakaful business. Our larg-est single market continues to be Saudi Arabia, followed by Malaysia. Our strategy is geared to further profitable growth. We maintained the lead position in our most important markets without neglecting our profitability requirements.
The premium volume increased by around 10% in the year under review. Retakaful business can be expected to show further dynamic growth over the coming years.
The largest loss events were fires at a sugar factory in Saudi Arabia and at a Dubai airport building under construction in the United Arab Emirates. The resulting strains for our account were each in the mid-single-digit million euro range. Agricultural risks Demand for the insurance of agricultural land and livestock continued to grow, driven by a steadily rising need for food and increasing extremes of weather as a consequence of cli-mate change. This was especially true of developing countries.
In view of the growing premium volume written by primary insurers, the volume for reinsurance covers also increased worldwide. Hannover Re, one of the largest reinsurers of agri-cultural risks, expanded its portfolio as planned in the year under review.
We successfully pursued our strategy of diversifying our port-folio both in terms of its geographical spread and the break-down by lines of business; a larger share of livestock covers, for example, played a part here.
After the heavy losses incurred in 2012 the loss situation in the year under review was moderate. Argentina recorded an elevated intensity and frequency of hail events, the expendi-tures on which have already had positive implications for rates. Hannover Re did not incur any major losses from agricultural risks in the year under review.
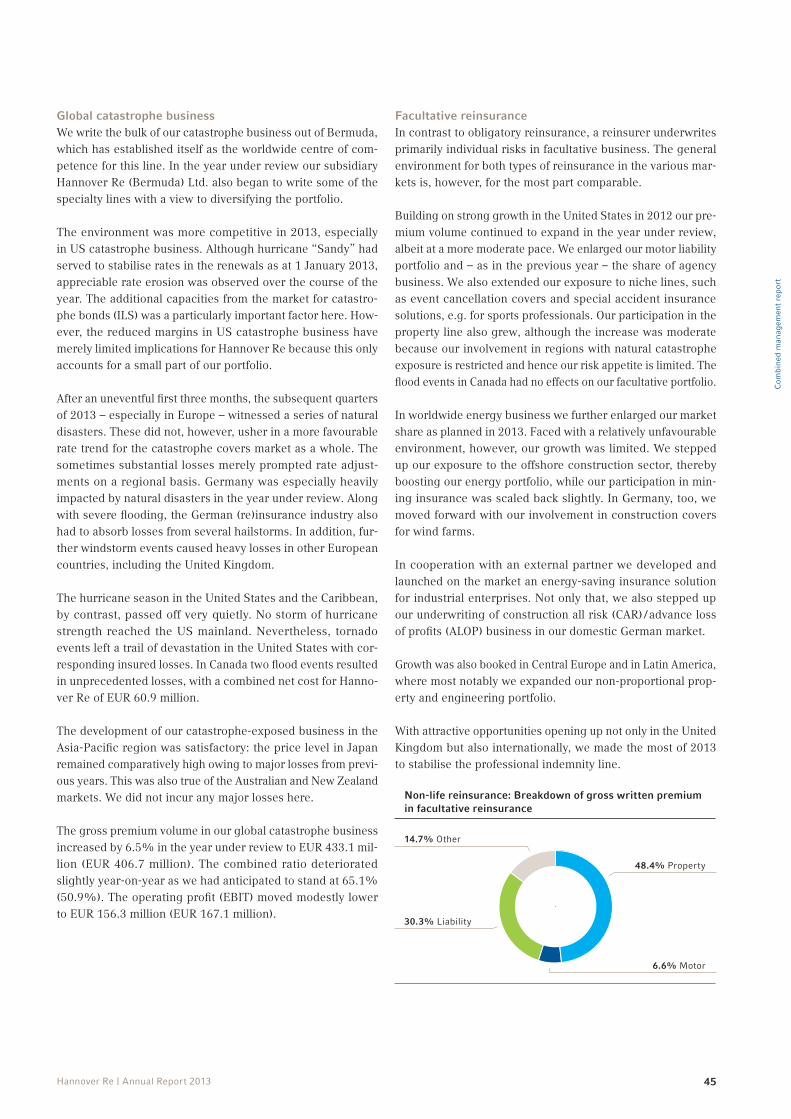
45
Com
bine
d m
anag
emen
t re
port
Hannover Re | Annual Report 2013
Global catastrophe business We write the bulk of our catastrophe business out of Bermuda, which has established itself as the worldwide centre of com-petence for this line. In the year under review our subsidiary Hannover Re (Bermuda) Ltd. also began to write some of the specialty lines with a view to diversifying the portfolio.
The environment was more competitive in 2013, especially in US catastrophe business. Although hurricane “Sandy” had served to stabilise rates in the renewals as at 1 January 2013, appreciable rate erosion was observed over the course of the year. The additional capacities from the market for catastro-phe bonds (ILS) was a particularly important factor here. How-ever, the reduced margins in US catastrophe business have merely limited implications for Hannover Re because this only accounts for a small part of our portfolio.
After an uneventful first three months, the subsequent quarters of 2013 – especially in Europe – witnessed a series of natural disasters. These did not, however, usher in a more favourable rate trend for the catastrophe covers market as a whole. The sometimes substantial losses merely prompted rate adjust-ments on a regional basis. Germany was especially heavily impacted by natural disasters in the year under review. Along with severe flooding, the German (re)insurance industry also had to absorb losses from several hailstorms. In addition, fur-ther windstorm events caused heavy losses in other European countries, including the United Kingdom.
The hurricane season in the United States and the Caribbean, by contrast, passed off very quietly. No storm of hurricane strength reached the US mainland. Nevertheless, tornado events left a trail of devastation in the United States with cor-responding insured losses. In Canada two flood events resulted in unprecedented losses, with a combined net cost for Hanno-ver Re of EUR 60.9 million.
The development of our catastrophe-exposed business in the Asia-Pacific region was satisfactory: the price level in Japan remained comparatively high owing to major losses from previ-ous years. This was also true of the Australian and New Zealand markets. We did not incur any major losses here.
The gross premium volume in our global catastrophe business increased by 6.5% in the year under review to EUR 433.1 mil-lion (EUR 406.7 million). The combined ratio deteriorated slightly year-on-year as we had anticipated to stand at 65.1% (50.9%). The operating profit (EBIT) moved modestly lower to EUR 156.3 million (EUR 167.1 million).
Facultative reinsurance In contrast to obligatory reinsurance, a reinsurer underwrites primarily individual risks in facultative business. The general environment for both types of reinsurance in the various mar-kets is, however, for the most part comparable.
Building on strong growth in the United States in 2012 our pre-mium volume continued to expand in the year under review, albeit at a more moderate pace. We enlarged our motor liability portfolio and – as in the previous year – the share of agency business. We also extended our exposure to niche lines, such as event cancellation covers and special accident insurance solutions, e.g. for sports professionals. Our participation in the property line also grew, although the increase was moderate because our involvement in regions with natural catastrophe exposure is restricted and hence our risk appetite is limited. The flood events in Canada had no effects on our facultative portfolio.
In worldwide energy business we further enlarged our market share as planned in 2013. Faced with a relatively unfavourable environment, however, our growth was limited. We stepped up our exposure to the offshore construction sector, thereby boosting our energy portfolio, while our participation in min-ing insurance was scaled back slightly. In Germany, too, we moved forward with our involvement in construction covers for wind farms.
In cooperation with an external partner we developed and launched on the market an energy-saving insurance solution for industrial enterprises. Not only that, we also stepped up our underwriting of construction all risk (CAR) / advance loss of profits (ALOP) business in our domestic German market.
Growth was also booked in Central Europe and in Latin America, where most notably we expanded our non-proportional prop-erty and engineering portfolio.
With attractive opportunities opening up not only in the United Kingdom but also internationally, we made the most of 2013 to stabilise the professional indemnity line.
Non-life reinsurance: Breakdown of gross written premium in facultative reinsurance
14.7% Other
48.4% Property
6.6% Motor
30.3% Liability

46 Hannover Re | Annual Report 2013
We are broadly satisfied with the development of our total fac-ultative portfolio in the year under review: we further diver-sified our business and generated profitable growth, while at the same time suffering a sizeable accumulation of mid-sized losses in 2013. Our premium volume increased by 4.2% to EUR 841.5 million and thus lived up to the forecast growth. The combined ratio was slightly below the level of the previous year at 91.6%. The operating profit (EBIT) remained stable as expected at EUR 131.9 million (EUR 130.5 million).
Life and health reinsurance • Challenging market conditions influence the business • Currency-adjusted growth target reached with increase of 5.1% in gross premium• Operating result falls short of expectations owing to various factors
The life and health reinsurance business group now accounts for 44% of our total premium volume. Reflecting the new reporting structure implemented in 2012, we subdivide our broadly diversified portfolio into the categories of Financial Solutions and Risk Solutions.
Total businessMarket conditions for worldwide life and health reinsurance were challenging in the year under review, as a consequence of which our premium volume also grew less vigorously in 2013 than in previous years. Gross premium income increased by 1.4% to EUR 6,145.4 million (EUR 6,057.9 million). Adjusted for exchange rate fluctuations, growth would have come in at 5.1%. In the year under review we thus achieved our targeted gross premium growth in the range of 5% to 7%. The level of retained premium decreased to 87.7% (89.3%). Net pre-mium earned was down slightly by 1.2% to EUR 5,359.8 mil-lion (EUR 5,425.6 million); adjusted for exchange rate effects, net premium increased by 2.4%.
The operating result (EBIT) of EUR 150.5 million (EUR 279.0 million) fell short of the previous year’s figure owing to a number of different influencing factors, but it was still solid. The key factors in the decline were the elimination of positive non-recurring effects from 2012 as well as losses in Australian disability business. Group net income reached EUR 164.2 million (EUR 222.5 million); earnings per share amounted to EUR 1.36 (EUR 1.84).

47
Com
bine
d m
anag
emen
t re
port
Hannover Re | Annual Report 2013
Key figures for life and health reinsurance
in EUR million 2013 + / – previous
year
2012 1 2011 2010 2009
Gross written premium 6,145.4 +1.4% 6,057.9 5,270.1 5,090.1 4,529.3
Net premium earned 5,359.8 -1.2% 5,425.6 4,788.9 4,653.9 4,078.7
Investment income 611.5 -10.7% 685.1 512.6 508.2 520.1
Claims and claims expenses 4,305.7 +7.0% 4,023.5 3,328.6 3,135.8 2,743.0
Change in benefit reserve 146.5 529.4 619.7 653.5 563.7
Commissions 1,169.0 +6.5% 1,098.0 985.8 1,022.8 926.2
Own administrative expenses 156.7 +8.7% 144.1 130.6 118.7 98.3
Other income / expenses (42.9) +17.0% (36.7) (19.2) 53.0 107.1
Operating result (EBIT) 150.5 -46.1% 279.0 217.6 284.4 374.7
Net income after tax 164.2 -26.2% 222.5 182.3 219.6 298.1
Earnings per share in EUR 1.36 -26.2% 1.84 1.51 1.82 2.47
Retention 87.7% 89.3% 91.0% 91.7% 90.7%
EBIT margin 2 2.8% 5.1% 4.5% 6.1% 9.2%
1 Adjusted pursuant to IAS 8 (cf. Section 3.1 of the notes)2 Operating result (EBIT) / net premium earned
In the following section we discuss in detail developments in our reporting categories in the year under review.
Financial SolutionsFinancial Solutions business encompasses those reinsurance transactions that – along with the transfer of biometric risks – can optimise the financial position of our ceding companies. Reinsurance solutions of this type offer clients an alternative means of raising capital as well as the resulting optimisa-tion of their equity and debt position. Gross premium income for this reporting category amounted to EUR 1,554.3 million (EUR 1,536.6 million) in the year under review, accounting for 25.3% of the total premium volume. The major driver of growth here in 2013 was our US subsidiary. Thanks to solu-tions designed to provide relief for capital and reserves so as to optimise the balance sheet structure of our clients, we were able to build on the successful development of the previous year in the United States. This type of reinsurance is heavily influenced by regulatory requirements, such as those arising out of the planned Solvency II standards and to some extent also indirectly from the Basel III framework. At this early point in time it still remains to be seen whether these effects will have positive or negative implications for insurance demand; this will only become clear in the future, once Solvency II and other prudential regimes have been adopted on a mandatory basis. Increasing regulation was also evident in emerging markets, especially in Asia. Although competition continues to inten-sify on account of the business potential in these regions, we booked double-digit percentage growth rates for our premium in both China and Hong Kong. Despite a challenging market climate, we thus asserted our leading position in Financial Solutions business.
Life and health reinsurance: Breakdown of gross premium by reporting categories in EUR million
7,000
6,000
5,000
4,000
3,000
2,000
1,000
0
0
1000
2000
3000
4000
5000
6000
7000
0
1000
2000
3000
4000
5000
6000
7000
Reihenfolge unten geändert! Zweites (hellgrau) nach ganz oben.
Financial Solutions Longevity Mortality Morbidity
1,118
885
2,624
644
1,554
885
2,834
873
1,537
884
2,825
813
5,270
6,145 6,058
2011 2012 2013

48 Hannover Re | Annual Report 2013
Africa
South AfricaJohannesburg
America
BermudaHamilton
MexicoMexico City
USACharlotteDenverNew YorkOrlando
Asia
BahrainManama
ChinaHong KongShanghai
IndiaMumbay
JapanTokyo
MalaysiaKuala Lumpur
South KoreaSeoul
TaiwanTaipei
Australia
AustraliaSydney
Europe
GermanyHannover
FranceParis
United KingdomLondon
IrelandDublin
ItalyMilan
SwedenStockholm
SpainMadrid
Present at 23 locations in 19 countries International network in life and health reinsurance
Life and health reinsurance at a glance
Breakdown of gross premium by continents in EUR million
7,000
6,000
5,000
4,000
3,000
2,000
1,000
0
0
1000
2000
3000
4000
5000
6000
7000
0
1000
2000
3000
4000
5000
6000
7000
blau und cyan im Layout getauscht, in den Daten noch nicht
Europe
Africa Central and Latin America
North America Asia Australia / New Zealand
2,082
2,320
750
585
188222
2,041
2,451
584
583
200199
1,663
2,352
491
420188157
1,799
2,302
349
336173131
5,2705,090
6,1456,058
2010 2011 2012 2013
Reporting structure
Hannover Re
Life & Health
Financial Solutions Risk Solutions
Mortality Morbidity Longevity

49
Com
bine
d m
anag
emen
t re
port
Hannover Re | Annual Report 2013
Risk SolutionsIn our reporting category of Risk Solutions we further differ-entiate between Mortality, Morbidity and Longevity.
The Mortality sector encompasses our business with exposure to the mortality risk. For our company, as a reinsurer, the main danger is that the actual mortality in a portfolio may diverge negatively from our expectations. Mortality business is tradi-tionally a core component of life and health reinsurance. This is reflected in the gross premium volume of EUR 2,833.5 mil-lion (EUR 2,824.6 million) generated in 2013. At 46.1%, it contributes the lion’s share of total premium income. In the US risk-oriented life reinsurance market we further expanded our share to more than 10%. This is all the more gratifying given that the market itself contracted again – as it had already in 2012. Irrespective of this, our focus was on further optimising our portfolio management, which we shall continue to do in the coming years.
In Europe the business climate on the reinsurance market was again challenging in 2013 and the market for traditional risk-oriented products proved to be largely saturated, leaving only limited scope for growth. Against this backdrop, a number of primary insurers in the German market came up with plans to modify traditional products – such as term life insurance – and limit the long-term guarantees under savings products in order to preserve the competitiveness of such offerings in the future. It is all the more pleasing to report that, among other things, we were able to retain our leading position in Italian credit life business.
Developments and trends in society around the world are exert-ing a growing influence on the insurance sector. In 2013, for example, we observed a sharp increase in lifestyle products – an area where traditional insurance is often combined with perks for sports and leisure activities. The idea is to motivate insureds to lead a more health-conscious lifestyle and hence also positively influence the policy experience.
The Morbidity risk is generally considered to be the risk of deterioration in a person’s state of health due to disease, injury or infirmity. Typical products are strict (any occupation) disability, occupational disability and long-term care insur-ance. Gross premium in this reporting category increased to EUR 872.9 million (EUR 813.0 million). Growth was generated principally in South America and Asia.
The less favourable developments in morbidity business are connected to the elevated risk experiences and reserve increases in Australian disability business, the adverse reper-cussions of which left their mark throughout the entire industry on insurers and reinsurers alike. Intensive efforts have been made on the Australian market to counteract this development and thereby improve results.
The US health market is facing considerable changes as the healthcare reform programme popularly known as “Obama-care” begins to take effect in 2014. One of the core elements of the new reform is curbing price increases in the medical sec-tor. The health insurance market is also taking active steps to counter this effect, hence opening up new insurance opportu-nities which we seek to cover with the broadest possible range of reinsurance solutions. As a further factor, the so-called dual demonstration programme was launched in the United States: previously operated independently of one another, the feder-ally backed Medicare programme was coordinated with Med-icaid, responsibility for which rests with the individual states. The dual demonstration programme is aimed at insureds who are theoretically entitled to participate in both schemes. For health insurance companies participating in the new programme this created fresh business potential, hence also leading to new opportunities on the reinsurance side. As anticipated, develop-ments in the Middle East region were also positive, consequently giving rise to attractive profitable growth in group business.
The Longevity reporting category encompasses annuity and pension insurance products as well as all reinsurance solutions connected with the longevity risk. This business frequently involves the transfer of sizeable portfolios, for which we – in our role as reinsurer – take over the annuity payments that will actually be incurred in the future. The greatest risk is associ-ated with the longevity of the insureds in the portfolios and the resulting potentially incorrect estimations of the duration of recurring pension payments. In the year under review we wrote a gross premium volume of EUR 884.7 million (EUR 883.6 mil-lion). The worldwide demographic trend has led to consist-ent growth in the elderly proportion of the population, hence bringing a significant increase in longevity exposure and boost-ing demand for such products. We already enjoyed concrete benefits from this trend in the year under review in the form of a rise in inquiries regarding the assumption of longevity portfolios. The United Kingdom continues to be the largest market, where we supported life insurers with – among other things – the risk assessment of annuity insurance policies in the financial year just ended. Yet we also received our first specific inquiries from other European countries too and submitted quotations. This expanding market is, however, also encourag-ing an ever-increasing number of new providers to move into the business, causing competition to intensify sharply. As an established business partner with a decades-long track record, we were able to renew existing contracts and reinsure our first longevity portfolios outside the United Kingdom despite the more competitive climate.
Irrespective of the various reporting categories, we are seeing a clearly emerging trend towards automated underwriting. We offer our customers this additional service in the form of point-of-sale systems. These are designed to relieve the strain on underwriters associated with the application process while at the same time enhancing underwriting efficiency. Furthermore, particularly as a consequence of the challenging low interest

50 Hannover Re | Annual Report 2013
rate environment, run-off business began to take on greater significance in 2013 and became a central concern for primary insurers. Activities in this area are focused on the professional run-off of closed blocks of business.
This trend towards the growing importance attached to addi-tional services that go above and beyond pure reinsurance pro-tection was again sustained in 2013. In the markets of East-
ern Europe, in particular, insurers are seeking to tap into new growth segments, e.g. for disability products and private health insurance covers. The level of service expected here – not only from insurers but also reinsurers – is rising. Thanks to our cus-tomer-oriented solutions and innovative product ideas in this area, we were able to consolidate existing customer relation-ships and win over new clients.
Investments • Return on investment at 3.4% as forecast• Ordinary investment income relatively stable despite low interest rate level• Strains from derivatives and lower realised gains than in the previous year
In view of the sustained low level of interest rates, ordinary investment income excluding income from funds withheld and contract deposits developed in line with our expectations at EUR 1,041.3 million (previous year: EUR 1,088.4 million). Income from funds withheld and contract deposits, on the other hand, came in slightly higher than in the previous year at EUR 357.3 million (EUR 355.5 million). The net realised gains on disposals amounted to a very pleasing EUR 144.2 mil-lion (EUR 227.5 million) and derived principally from regroup-ing moves as part of regular portfolio management as well as from the change in reporting currency at our subsidiary in Bermuda. This figure was, however, lower than in the previous year, when we had acted to a greater extent on opportunities in the real estate sector.
We also recorded exceptionally positive changes in the fair values of our financial assets recognised at fair value through profit or loss (EUR 89.3 million), contrasting with a negative fair value change of EUR 27.1 million as at 31 December 2013. This can be attributed primarily to the performance of the ModCo derivatives and the inflation swaps. We recognise a derivative for the credit risk associated with special life reinsurance trea-ties (ModCo) under which securities deposits are held by ced-ants for our account; the performance of this derivative in the period under review gave rise to positive fair value changes rec-ognised in income of EUR 7.4 million (EUR 51.8 million). The inflation swaps taken out in 2010 and 2011 to hedge part of the inflation risks associated with the loss reserves in our technical account produced negative fair value changes of EUR 41.0 mil-lion, as against a positive contribution of EUR 28.0 million in the previous year. The changes in the fair values of the infla-tion swaps are recognised in income as a derivative pursuant
Investment income
in EUR million 2013 + / –previous
year
2012 2011 2010 2009
Ordinary investment income 1 1,041.3 -4.3% 1,088.4 966.2 880.5 810.5
Result from participations in associatedcompanies 12.5 +20.4% 10.4 3.1 3.9 (5.0)
Realised gains / losses 144.2 -36.6% 227.5 179.6 162.0 113.0
Appreciation 0.3 -88.1% 2.7 36.8 27.2 20.1
Depreciation, amortisation, impairments 2 19.4 -10.7% 21.7 31.0 23.8 142.5
Change in fair value of financial instruments 3 (27.1) -130.4% 89.3 (38.8) (39.9) 100.6
Investment expenses 97.3 +1.0% 96.4 70.3 67.4 53.1
Net investment income fromassets under own management 1,054.5 -18.9% 1,300.2 1,045.5 942.5 843.6
Net investment income fromfunds withheld 357.3 +0.5% 355.5 338.5 316.4 276.8
Total investment income 1,411.8 -14.7% 1,655.7 1,384.0 1,258.9 1,120.4
1 Excluding expenses on funds withheld and contract deposits2 Including depreciation / impairments on real estate3 Portfolio at fair value through profit or loss and trading

51
Com
bine
d m
anag
emen
t re
port
Hannover Re | Annual Report 2013
to IAS 39. Over the entire term we assume for the most part an economically neutral development for these two items for Hannover Re, and hence the volatility that can occur in specific periods has no bearing on the actual business performance.
Impairments and depreciation totalling just EUR 19.4 mil-lion (EUR 21.7 million) were taken. By far the bulk of the impairments – amounting to EUR 3.5 million – were attribut-able to alternative investments (EUR 5.8 million). Scheduled depreciation taken on directly held real estate amounted to EUR 14.0 million (EUR 10.4 million), a reflection of our greater involvement in this area. These write-downs contrasted with write-ups of EUR 0.3 million (EUR 2.7 million).
Principally due to reduced realised gains and a lower result from investments measured at fair value through profit or loss, our investment income fell short of the previous year’s level. It stood at EUR 1,411.8 million (EUR 1,655.7 mil-lion) in the reporting period, of which EUR 1,054.5 million (EUR 1,300.2 million) was attributable to assets under own management. This produces an average return (excluding effects from inflation swaps and ModCo derivatives) of 3.4%, a figure in line with our forecast.
Financial position and net assets• Risk-appropriate investment policy• High-quality diversified investment portfolio to be maintained• Expansion in the area of corporate bonds and in the real estate sector• Shareholders’ equity stable thanks to excellent Group net income in spite of challenging interest
rate and currency environment
Investment policy
Hannover Re’s investment policy continues to be guided by the following core principles:
• generation of stable and risk-commensurate returns while at the same time maintaining the high quality standard of the portfolio;
• ensuring the liquidity and solvency of Hannover Re at all times;
•high diversification of risks;
• limitation of currency exposures and maturity risks through matching currencies and maturities.
With these goals in mind we engage in active risk manage-ment based on balanced risk / return analyses. In this context we are guided by centrally implemented investment guidelines and the insights of dynamic financial analysis. In light of the current market situation and requirements on the liabilities side investment ranges are defined on this basis, within which operational portfolio management is carried out. These meas-ures are intended to safeguard the generation of an appropriate level of return. In so doing, we pay strict attention to compli-ance with our clearly defined risk appetite, which is reflected in the risk capital allocated to the investments and establishes the foundation for the asset allocation of the entire Hannover Re Group to the individual portfolios. In addition, we ensure that we are able to meet our payment obligations at all times. Within the scope of our asset / liability management (ALM) the allocation of investments by currencies and maturities is deter-mined by the technical liabilities. The modified duration of our bond portfolio is geared largely to the technical liabilities.
Investment income in EUR million
0
500
1000
1500
2000
0
500
1000
1500
2000
2009
Investment income from assets under own management
Income and expenses on funds withheld and contract deposits
844943
1,046 1,054
1,300
277
316
339 357
356
1,120
1,259
1,384 1,412
1,656
2010 2011 2012 2013
2,000
1,500
1,000
500
0

52 Hannover Re | Annual Report 2013
By adjusting the maturity pattern of our fixed-income securities to the expected payment patterns of our liabilities we reduce the economic exposure to the interest rate risk. In the current reporting period we slightly reduced the modified duration of our fixed-income portfolio, as a result of which it stood at 4.4 years (previous year: 4.5 years) as at 31 December 2013. Furthermore, through active and regular management of the currency spread in our fixed-income portfolio we bring about extensive matching of currencies on the assets and liabilities sides of the balance sheet, as a consequence of which fluctua-tions in exchange rates have only a limited effect on our result.
At year-end 2013 we held 40.7% (40.4%) of our investments in euro, 38.0% (37.1%) in US dollars, 8.3% (8.2%) in pound sterling and 4.9% (5.6%) in Australian dollars.
Breakdown of investments under own management in %
100
90
80
70
60
50
40
30
20
10
0
0
20
40
60
80
100
0
20
40
60
80
100
Government bonds
Covered Bonds, ABS
Other Short-term investments and cash
Private Equity
Real estate
Semi-government bonds
Corporate bonds
2523
19 19 19
26
21 23 23
20
22
2530 32
34
15
16
1617
15
24
22
21 2
22
42 2
22
28 8
53 4
2009 2010 2011 2012 2013
Investment portfolio
in EUR million 2013 2012 2011 2010 2009
Funds withheld 14,343 14,751 13,342 12,636 10,786
Investments under own management 31,875 31,874 28,341 25,411 22,507
Total 46,219 46,625 41,683 38,047 33,293
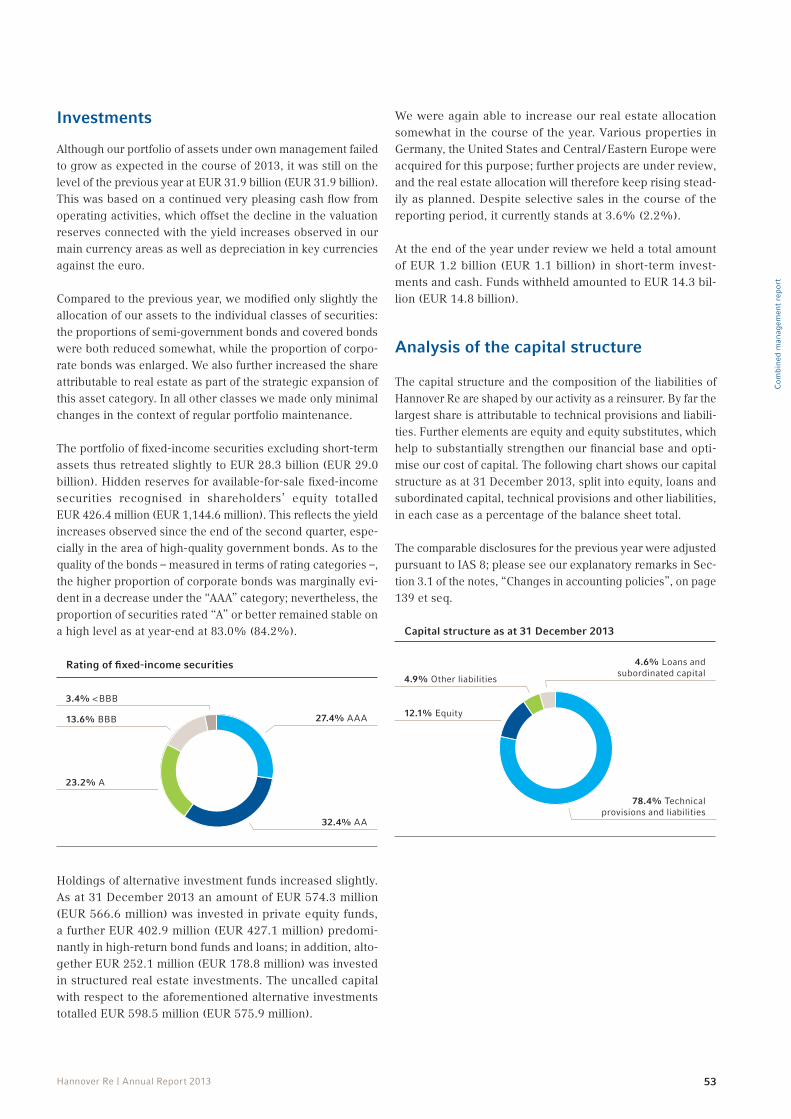
53
Com
bine
d m
anag
emen
t re
port
Hannover Re | Annual Report 2013
Investments
Although our portfolio of assets under own management failed to grow as expected in the course of 2013, it was still on the level of the previous year at EUR 31.9 billion (EUR 31.9 billion). This was based on a continued very pleasing cash flow from operating activities, which offset the decline in the valuation reserves connected with the yield increases observed in our main currency areas as well as depreciation in key currencies against the euro.
Compared to the previous year, we modified only slightly the allocation of our assets to the individual classes of securities: the proportions of semi-government bonds and covered bonds were both reduced somewhat, while the proportion of corpo-rate bonds was enlarged. We also further increased the share attributable to real estate as part of the strategic expansion of this asset category. In all other classes we made only minimal changes in the context of regular portfolio maintenance.
The portfolio of fixed-income securities excluding short-term assets thus retreated slightly to EUR 28.3 billion (EUR 29.0 billion). Hidden reserves for available-for-sale fixed-income securities recognised in shareholders’ equity totalled EUR 426.4 million (EUR 1,144.6 million). This reflects the yield increases observed since the end of the second quarter, espe-cially in the area of high-quality government bonds. As to the quality of the bonds – measured in terms of rating categories –, the higher proportion of corporate bonds was marginally evi-dent in a decrease under the “AAA” category; nevertheless, the proportion of securities rated “A” or better remained stable on a high level as at year-end at 83.0% (84.2%).
Holdings of alternative investment funds increased slightly. As at 31 December 2013 an amount of EUR 574.3 million (EUR 566.6 million) was invested in private equity funds, a further EUR 402.9 million (EUR 427.1 million) predomi-nantly in high-return bond funds and loans; in addition, alto-gether EUR 252.1 million (EUR 178.8 million) was invested in structured real estate investments. The uncalled capital with respect to the aforementioned alternative investments totalled EUR 598.5 million (EUR 575.9 million).
We were again able to increase our real estate allocation somewhat in the course of the year. Various properties in Germany, the United States and Central / Eastern Europe were acquired for this purpose; further projects are under review, and the real estate allocation will therefore keep rising stead-ily as planned. Despite selective sales in the course of the reporting period, it currently stands at 3.6% (2.2%).
At the end of the year under review we held a total amount of EUR 1.2 billion (EUR 1.1 billion) in short-term invest-ments and cash. Funds withheld amounted to EUR 14.3 bil-lion (EUR 14.8 billion).
Analysis of the capital structure
The capital structure and the composition of the liabilities of Hannover Re are shaped by our activity as a reinsurer. By far the largest share is attributable to technical provisions and liabili-ties. Further elements are equity and equity substitutes, which help to substantially strengthen our financial base and opti-mise our cost of capital. The following chart shows our capi tal structure as at 31 December 2013, split into equity, loans and subordinated capital, technical provisions and other liabilities, in each case as a percentage of the balance sheet total.
The comparable disclosures for the previous year were adjusted pursuant to IAS 8; please see our explanatory remarks in Sec-tion 3.1 of the notes, “Changes in accounting policies”, on page 139 et seq.
Rating of fixed-income securities
3.4% < BBB
23.2% A
13.6% BBB 27.4% AAA
32.4% AA
Capital structure as at 31 December 2013
4.6% Loans and subordinated capital
12.1% Equity
4.9% Other liabilities
78.4% Technical provisions and liabilities

54 Hannover Re | Annual Report 2013
The technical provisions and liabilities shown above, which include funds withheld / contract deposits and reinsurance pay-able, make up 78.4% (78.2%) of the balance sheet total and are more than covered by our investments, (assets-side) funds withheld / contract deposits, accounts receivable and reinsur-ance recoverables.
The equity including non-controlling interests at 12.1% (12.3%) of the balance sheet total as well as the loans and – especially – subordinated capital at altogether 4.6% (4.4%) of the balance sheet total represent our most important sources of funds.
We ensure that our business is sufficiently capitalised at all times through continuous monitoring and by taking appropriate steering actions as necessary. For further information please see the following section “Management of policyholders’ surplus”.
Management of policyholders’ surplus
The preservation of its capital is a key strategic objective for Hannover Re. In the 2013 financial year and in recent years hybrid capital was issued as an equity substitute in order to keep the cost of capital on a low level. The policyholders’ sur-plus is a key management ratio in the context of Hannover Re’s comprehensive capital management. The policyholders’ surplus is defined as follows:
• shareholders’ equity excluding non-controlling interests, composed of the common shares, additional paid-in capi-tal, other comprehensive income and retained earnings,
•non-controlling interests and
• hybrid capital used as an equity substitute, which encom-passes our subordinated debt.
The policyholders’ surplus totalled EUR 8,767.9 million (EUR 8,947.2 million) as at the balance sheet date, a decrease of 2.0% in the year under review due to changes in cumulative other comprehensive income and in light of adjustments to the previ-ous year pursuant to IAS 8 (cf. Section 3.1 of the notes).
Hannover Re uses “Intrinsic Value Creation” (IVC) as its cen-tral value-based management tool. With the aid of this tool we apply the principles of economic allocation of equity and effi-cient use of debt as an equity substitute in order to achieve the lowest possible weighted cost of capital. This concept as well as the objectives and principles in accordance with which we conduct our enterprise management and capital management are described in greater detail in our remarks on value-based management on page 24 et seq. of this report.
Hannover Re is guided in its capital management by the require-ments and expectations of the rating agencies that assess the Group with an eye to its targeted rating. Furthermore, while making appropriate allowance for business policy considera-tions and factors that influence market presence, the allocation of capital to the Group’s operational companies is based upon the economic risk content of the business group in question. The Group companies are also subject to national capital and solvency requirements. All Group companies met the applicable local minimum capital requirements in the year under review. Adherence to these capital requirements is continuously moni-tored by the responsible organisational units on the basis of the latest actual figures as well as the corresponding planned and forecast figures. If, despite the capital allocation mechanisms described above, a scenario occurs in which there is a danger of minimum capital requirements being undershot, suitable options are immediately discussed and measures set in motion to counteract such an eventuality. From the Group perspective we manage Hannover Re’s solvency using our internal capital model, which is described in greater detail on page 78 et seq. of the opportunity and risk report.
Group shareholders’ equity
In view of the favourable result, the development of the share-holders’ equity of the Hannover Re Group was broadly stable despite opposing effects from currency translation and the interest rate environment. Compared to the position as at 31 December 2012, it decreased slightly by EUR 184.1 million – or 2.7% – in the year under review to EUR 6,530.0 million. After adjustment for non-controlling interests, it contracted by EUR 144.0 million to EUR 5,888.4 million. The book value
Development of policyholders’ surplusin EUR million
0
2000
4000
6000
8000
10000
0
2000
4000
6000
8000
10000
2009
Shareholders’ equity
Hybrid capital, limited maturity Hybrid capital, no maturity
Non-controlling interests
3,714
4,5094,971
6,032 5,888
542
480
885609
1,385
484
636
1,246
486 682642
1,743 1,744
490 493
5,622
6,9877,339
8,947 8,768
2010 2011 2012 2013
10,000
8,000
6,000
4,000
2,000
0

55
Com
bine
d m
anag
emen
t re
port
Hannover Re | Annual Report 2013
per share fell accordingly by 2.4% to EUR 48.83. The changes in shareholders’ equity were shaped chiefly by the following developments:
Net unrealised gains on investments recognised in the other reserves stood at EUR 533.7 million, a sharp decrease of EUR 454.2 million compared to the beginning of the year under review. This contraction was due to increased yields on high-quality government bonds as well as the appreciation of the euro.
The reserve for currency translation adjustment decreased significantly by -EUR 230.2 million from -EUR 16.2 million to -EUR 246.3 million as a consequence of exchange rate fluc-tuations of foreign currencies against the euro in the financial year. The fall in the reserve for currency translation adjustment resulted principally from the depreciation of the Australian dol-lar, South African rand and US dollar in the year under review.
Non-controlling interests in shareholders’ equity decreased by EUR 40.1 million to EUR 641.6 million as at 31 December 2013. This reduction was attributable primarily to the non-controlling interests in E+S Rückversicherung AG in an amount of EUR 27.9 million.
The Group net income for 2013 attributable to the sharehold-ers of the Hannover Re Group increased to EUR 895.5 million (EUR 849.6 million). The non-controlling interest in the profit generated in the year under review totalled EUR 43.8 million (EUR 75.4 million).
Financing and Group debt
In addition to the financing effect of the changes in share-holders’ equity described above, debt financing on the capi-tal market is a key component of Hannover Re’s financing. It was essentially composed of subordinated bonds issued to ensure lasting protection of our capital base – in part also in observance of rating requirements. The total volume of debt and subordinated capital stood at EUR 2,465.0 million (EUR 2,400.8 million) as at the balance sheet date.
Our subordinated bonds supplement our equity with the aim of reducing the cost of capital and also help to ensure liquid-ity at all times. In the previous year we issued further subor-dinated debt with a nominal volume of EUR 500.0 million and a maturity of approximately 30 years. As at the balance sheet date four subordinated bonds had been placed on the European capital market through Hannover Finance (Luxembourg) S.A.
The table above presents an overview of the amortised cost of our subordinated bonds.
Development of Group shareholders’ equityin EUR million
0
1000
2000
3000
4000
5000
6000
7000
8000
0
1000
2000
3000
4000
5000
6000
7000
8000
2009
Non-controlling interests Group net income (loss)
Retained earnings excluding Group net income (loss)
Cumulative other comprehensive income
Common shares and additional paid-in capital
84513
2,123
845
313
2,602
845
446
3,073
845845
262
938
3,8863,400
734
542 749
609606
636 895850
642682
4,257
5,118
5,607
6,5306,714
2010 2011 2012 2013
8,000
7,000
6,000
5,000
4,000
3,000
2,000
1,000
0
Amortised cost of our subordinated bonds
in EUR millionIssue date Coupon
in %2013 2012
Hannover Finance (Luxembourg) S.A. subordinated debt, EUR 750 million; 2004 / 2024 26.2.2004 5.75 749.6 748.8
Hannover Finance (Luxembourg) S.A. subordinated debt, EUR 500 million; 2005 / undated 1.6.2005 5.00 493.3 489.6
Hannover Finance (Luxembourg) S.A.subordinated debt, EUR 500 million; 2010 / 2040 14.9.2010 5.75 498.2 498.0
Hannover Finance (Luxembourg) S.A. subordinated debt, EUR 500 million; 2012 / 2043 20.11.2012 5.00 496.7 496.6
Total 2,237.8 2,233.0

56 Hannover Re | Annual Report 2013
Several Group companies have also taken up long-term debt – principally in the form of mortgage loans – amounting to EUR 227.1 million (EUR 167.8 million).
For further explanatory information please see our remarks in the notes to this report, Section 6.12 “Debt and subordinated capital”, page 200 et seq., and Section 6.13 “Shareholders’ equity, non-controlling interests and treasury shares”, page 203.
Letters of credit have been furnished by various financial insti-tutions as collateral for our technical liabilities. Both bilateral agreements and an unsecured syndicated guarantee facility existed as at the balance sheet date with a number of finan-cial institutions for this purpose. We report in detail on exist-ing contingent liabilities in the notes, Section 6.12 “Debt and subordinated capital” in our remarks on other financial facili-ties, page 202 et seq., and Section 8.7 “Contingent liabilities and commitments”, page 222 et seq.
Analysis of the consolidated cash flow statement
LiquidityWe generate liquidity primarily from our operational reinsur-ance business, investments and financing measures. Regular liquidity planning and a liquid investment structure ensure that Hannover Re is able to make the necessary payments at all times. Hannover Re’s cash flow is shown in the consolidated cash flow statement on page 132 et seq.
Hannover Re does not conduct any automated internal cash pooling within the Group. Liquidity surpluses are managed and created by the Group companies. Various loan relationships exist within the Hannover Re Group for the optimal structuring and flexible management of the short- or long-term allocation of liquidity and capital.
Consolidated cash flow statement
in EUR million 2013 2012
Cash flow from operating activities 2,225.5 2,637.2
Cash flow from investing activities (1,761.5) (2,712.9)
Cash flow from financing activities (347.7) 148.4
Exchange rate differences on cash (41.7) (7.4)
Change in cash and cash equivalents 74.6 65.2
Cash and cash equivalents at the beginning of the period 572.2 507.0
Change in cash and cash equivalents according to cash flow statement 74.6 65.2
Changes in the consolidated group 1 (3.8) –
Cash and cash equivalents at the end of the period 642.9 572.2
1 Cf. Section 4 “Consolidation” of the notes
Cash flow from operating activitiesThe cash flow from operating activities, which also includes inflows from interest received and dividend receipts, amounted to EUR 2,225.5 million in the year under review as opposed to EUR 2,637.2 million in the previous year. Along with the reduced net premium and the contraction of EUR 47.1 million in ordinary investment income, the decrease of EUR 411.7 mil-lion in the net inflow year-on-year was attributable to the higher inflow in the previous year from the retrocession of major losses, an outflow for an acquisition payment for a US port-folio and an adjustment payment for the New Zealand earth-quake in the year under review.
Cash flow from operating activitiesin EUR million
3,000
2,500
2,000
1,500
1,000
500
0
0
500
1000
1500
2000
2500
3000
0
500
1000
1500
2000
2500
3000
0
500
1000
1500
2000
2500
3000
2009 2010 2011 2012 2013
1,752 1,681
2,6372,523
2,225
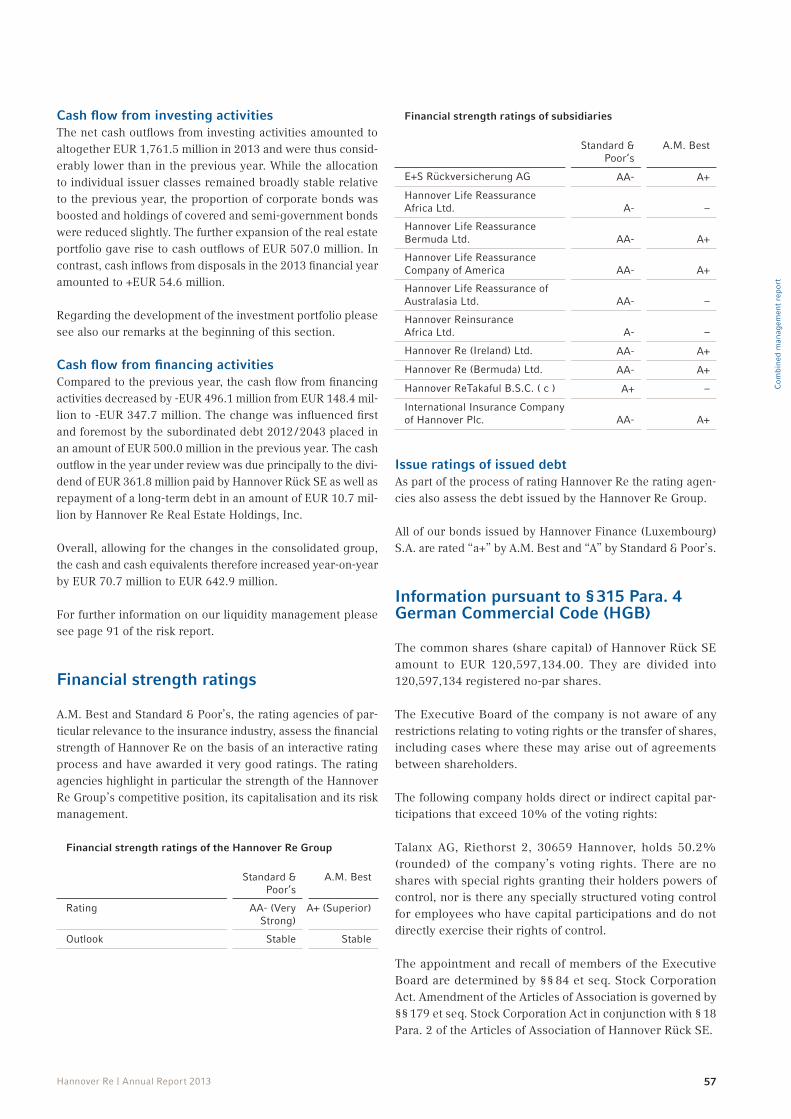
57
Com
bine
d m
anag
emen
t re
port
Hannover Re | Annual Report 2013
Cash flow from investing activitiesThe net cash outflows from investing activities amounted to altogether EUR 1,761.5 million in 2013 and were thus consid-erably lower than in the previous year. While the allocation to individual issuer classes remained broadly stable relative to the previous year, the proportion of corporate bonds was boosted and holdings of covered and semi-government bonds were reduced slightly. The further expansion of the real estate portfolio gave rise to cash outflows of EUR 507.0 million. In contrast, cash inflows from disposals in the 2013 financial year amounted to +EUR 54.6 million.
Regarding the development of the investment portfolio please see also our remarks at the beginning of this section.
Cash flow from financing activitiesCompared to the previous year, the cash flow from financing activities decreased by -EUR 496.1 million from EUR 148.4 mil-lion to -EUR 347.7 million. The change was influenced first and foremost by the subordinated debt 2012 / 2043 placed in an amount of EUR 500.0 million in the previous year. The cash outflow in the year under review was due principally to the divi-dend of EUR 361.8 million paid by Hannover Rück SE as well as repayment of a long-term debt in an amount of EUR 10.7 mil-lion by Hannover Re Real Estate Holdings, Inc.
Overall, allowing for the changes in the consolidated group, the cash and cash equivalents therefore increased year-on-year by EUR 70.7 million to EUR 642.9 million.
For further information on our liquidity management please see page 91 of the risk report.
Financial strength ratings
A.M. Best and Standard & Poor’s, the rating agencies of par-ticular relevance to the insurance industry, assess the financial strength of Hannover Re on the basis of an interactive rating process and have awarded it very good ratings. The rating agencies highlight in particular the strength of the Hannover Re Group’s competitive position, its capitalisation and its risk management.
Financial strength ratings of the Hannover Re Group
Standard &
Poor‘sA.M. Best
Rating AA- (Very Strong)
A+ (Superior)
Outlook Stable Stable
Financial strength ratings of subsidiaries
Standard &
Poor‘sA.M. Best
E+S Rückversicherung AG AA- A+
Hannover Life Reassurance Africa Ltd. A- –
Hannover Life Reassurance Bermuda Ltd. AA- A+
Hannover Life Reassurance Company of America AA- A+
Hannover Life Reassurance of Australasia Ltd. AA- –
Hannover Reinsurance Africa Ltd. A- –
Hannover Re (Ireland) Ltd. AA- A+
Hannover Re (Bermuda) Ltd. AA- A+
Hannover ReTakaful B.S.C. ( c ) A+ –
International Insurance Company of Hannover Plc. AA- A+
Issue ratings of issued debtAs part of the process of rating Hannover Re the rating agen-cies also assess the debt issued by the Hannover Re Group.
All of our bonds issued by Hannover Finance (Luxembourg) S.A. are rated “a+” by A.M. Best and “A” by Standard & Poor’s.
Information pursuant to § 315 Para. 4 German Commercial Code (HGB)
The common shares (share capital) of Hannover Rück SE amount to EUR 120,597,134.00. They are divided into 120,597,134 registered no-par shares.
The Executive Board of the company is not aware of any restrictions relating to voting rights or the transfer of shares, including cases where these may arise out of agreements between shareholders.
The following company holds direct or indirect capital par-ticipations that exceed 10% of the voting rights:
Talanx AG, Riethorst 2, 30659 Hannover, holds 50.2% (rounded) of the company’s voting rights. There are no shares with special rights granting their holders powers of control, nor is there any specially structured voting control for employees who have capital participations and do not directly exercise their rights of control.
The appointment and recall of members of the Executive Board are determined by §§ 84 et seq. Stock Corporation Act. Amendment of the Articles of Association is governed by §§ 179 et seq. Stock Corporation Act in conjunction with § 18 Para. 2 of the Articles of Association of Hannover Rück SE.
58 Hannover Re | Annual Report 2013
The powers of the Executive Board with respect to the issue and repurchase of shares are defined in the Articles of Asso-ciation of Hannover Rück SE as well as in §§ 71 et seq. Stock Corporation Act. In this connection the Annual General Meet-ing authorised the Executive Board on 4 May 2010 pursuant to § 71 Para. 1 No. 8 Stock Corporation Act to acquire treas-ury shares on certain conditions for a period of five years, ending on 3 May 2015.
The following paragraphs explain major agreements con-cluded by the company that are subject to reservation in the event of a change of control, inter alia following a takeover bid, and describe the resulting effects. The letter of credit lines extended to Hannover Rück SE contain standard market change-of-control clauses that entitle the banks to require early repayment if Talanx AG loses its majority interest or drops below the threshold of a 25 percent participation or if a third party acquires the majority interest in Hannover Rück SE. For details of the letter of credit lines please see our explanatory remarks on other financial facilities in the notes, Section 6.12 “Debt and subordinated capital”, page 202.
In addition, retrocession covers in non-life and life business contain standard market change-of-control clauses which in each case grant the other contracting party a right of termi-nation if a significant change occurs in the ownership struc-ture and participation ratios of the affected contracting party.
The company has not concluded any compensation agree-ments with the members of the Executive Board or with employees in the event of a takeover bid being made.
Information on Hannover Rück SE(condensed version in accordance with the Commercial Code (HGB))
In the year under review Hannover Re for the first time availed itself of the option to present a combined Group and company management report pursuant to § 315 Para. 3 of the Commer-cial Code (HGB) in conjunction with § 298 Para. 3 of the Com-mercial Code (HGB). Supplementary to the reporting on the Hannover Re Group, we therefore discuss below the develop-ment of Hannover Rück SE.
The annual financial statement of Hannover Rück SE is drawn up in accordance with German accounting principles. The con-solidated financial statement, on the other hand, conforms to International Financial Reporting Standards (IFRS). This gives rise to various divergences in accounting policies affecting, above all, intangible assets, investments, technical assets and liabilities, financial instruments and deferred taxes.
The annual financial statement of Hannover Rück SE – from which the balance sheet and profit and loss account in particu-lar are reproduced here in condensed form – has been submit-ted to the operator of the electronic Federal Gazette and can be accessed via the webpage of the Companies Register. This annual financial statement may be requested from Hannover Rück SE, Karl-Wiechert-Allee 50, 30625 Hannover, Germany.
Hannover Rück SE transacts reinsurance business in the business groups of non-life and life and health reinsurance. Through its global presence and activities in all lines of rein-surance the company achieves optimal risk diversification.
Since 1 January 1997 Hannover Rück SE has written active reinsurance for the Group – with few exceptions – solely in foreign markets. Responsibility within the Hannover Re Group for German business rests with the subsidiary E+S Rückver-sicherung AG. Geographical risk spreading between the two companies is ensured by means of reciprocal retrocessions.
Results of operations
The 2013 financial year passed off satisfactorily for Hannover Rück SE. The gross premium of Hannover Rück SE in total business increased by 5.6% to EUR 11.1 billion (previous year: EUR 10.5 billion). The level of retained premium retreated slightly from 76.0% to 75.2%. Net premium earned grew by 5.1% to EUR 8.2 billion (EUR 7.8 billion).
The underwriting result for total business (before changes in the equalisation reserve) declined in the year under review from EUR 93.2 million to -EUR 4.7 million. An amount of EUR 267.7 million (EUR 340.7 million) was allocated to the equalisation reserve and similar provisions.
After a thoroughly untroubled first quarter we incurred numer-ous major losses in the course of 2013. Germany and Canada were especially heavily impacted by considerable losses from natural disasters. The hurricane season in North America and the Caribbean, on the other hand, again passed off unremark-ably. The largest single losses in the year under review for Hannover Re were the hail event “Andreas” in Germany with a net loss of EUR 11.6 million and the flooding in Germany and other European countries at a cost of EUR 21.6 million. These and other major losses caused total net expenditure in 2013 of EUR 283.2 million (EUR 318.3 million).
Ordinary investment income including deposit interest clearly surpassed the previous year at EUR 1,304.8 million (EUR 1,205.9 million). This figure includes the non-recurring effect from transformation of our UK life reinsurance subsidi-ary into a branch in an amount of EUR 231.4 million. Net gains of EUR 43.5 million (EUR 68.9 million) were realised on dis-posals. Write-downs of EUR 186.7 million (EUR 25.4 million) were taken on investments. They were attributable principally

59
Com
bine
d m
anag
emen
t re
port
Hannover Re | Annual Report 2013
to shares in affiliated companies and fixed-income securities. The write-downs contrasted with write-ups of EUR 14.4 million (EUR 29.6 million) that were made on assets written down in previous periods in order to reflect increased fair values. Pro-visions for contingent losses of EUR 21.7 million were estab-lished in the reporting period due to lower fair values of some of our inflation swaps. These new provisions were opposed by reversals of provisions for contingent losses constituted for technical derivatives in an amount of just EUR 6.1 million.
All in all, our net investment result therefore contracted to EUR 1,116.6 million (EUR 1,233.9 million).
The profit on ordinary activities decreased to EUR 380.1 mil-lion (EUR 546.0 million). The year under review closed with a profit for the year of EUR 367.2 million (EUR 410.3 million).
Development of the individual lines of business
The following section describes the development of the vari-ous lines of business. Hannover Rück SE also participates in the German reinsurance market through intra-Group retroces-sions from E+S Rückversicherung AG. The proportion of Han-nover Rück SE’s gross written premium attributable to busi-ness accepted from E+S Rückversicherung AG stood at 3.7% (3.8%) in the year under review.
FireTotal gross premium for the fire line again grew by an appre-ciable 8.1% in the 2013 financial year to EUR 1,375.7 million (EUR 1,272.1 million). The net loss ratio deteriorated in the year under review from 59.4% to 64.0%. After an underwriting result of EUR 157.6 million in the previous year, the fire line closed with a profit of EUR 105.3 million in 2013. An amount of EUR 148.4 million (EUR 201.3 million) was allocated to the equalisation reserve and similar provisions.
Condensed profit and loss account of Hannover Rück SE
in EUR thousand 2013 2012
Earned premiums, net of retrocession 8,209,507 7,808,183
Allocated investment return transferred from the non-technical account, net of retrocession 194,599 214,966
Other technical income, net of retrocession 425 1
Claims incurred, net of retrocession 6,254,293 5,843,453
Changes in other technical provisions, net of retrocession 21,669 (8,902)
Bonuses and rebates, net of retrocession 1,963 1
Operating expenses, net of retrocession 2,171,507 2,073,564
Other technical charges, net of retrocession 3,121 3,988
Subtotal (4,684) 93,242
Change in the equalisation reserve and similar provisions (267,717) (340,657)
Net technical result (272,401) (247,415)
Investment income 1,385,550 1,320,197
Investment charges 268,993 86,275
Allocated investment return transferred to the technical account (247,895) (265,880)
Other income 109,866 77,868
Other charges 325,993 252,530
Profit or loss on ordinary activities before tax 380,134 545,965
Taxes on profit and income and other taxes 12,973 135,711
Profit for the financial year 367,161 410,254
Profit brought forward from previous year 89,209 40,746
Withdrawals from other retained earnings – 1,021
Allocations to other retained earnings 370 1,021
Disposable profit 456,000 451,000

60 Hannover Re | Annual Report 2013
Fire
in EUR million 2013 2012
Gross written premium 1,375.7 1,272.1
Loss ratio (%) 64.0 59.4
Underwriting result (net) 105.3 157.6
CasualtyGross premium in casualty business contracted by 2.5% to EUR 1,228.0 million (EUR 1,259.5 million). The loss ratio increased slightly from 92.4% to 96.6%. The underwrit-ing result consequently slipped back to -EUR 209.8 million (-EUR 164.8 million). An amount of EUR 34.2 million was with-drawn from the equalisation reserve and similar provisions in the year under review; the allocation in the previous year had totalled EUR 27.5 million.
Casualty
in EUR million 2013 2012
Gross written premium 1,228.0 1,259.5
Loss ratio (%) 96.6 92.4
Underwriting result (net) (209.8) (164.8)
AccidentGross premium climbed sharply as anticipated by 25.9% to EUR 362.2 million (EUR 287.8 million). Profitability was grati-fying: the very good loss ratio of 51.1% in the previous year was almost maintained in the year under review at 52.8%. The underwriting result came in at a very pleasing EUR 31.9 mil-lion, after EUR 41.0 million in the previous year. An amount of EUR 2.5 million was allocated to the equalisation reserve and similar provisions, following an allocation of EUR 8.1 million in the previous year.
Accident
in EUR million 2013 2012
Gross written premium 362.2 287.8
Loss ratio (%) 52.8 51.1
Underwriting result (net) 31.9 41.0
MotorThe gross premium volume for the motor line contracted by 12.7% to EUR 653.8 million (EUR 748.6 million). The loss ratio slipped back to 78.9% (74.7%). The underwrit-ing result decreased slightly year-on-year to -EUR 21.2 mil-lion (-EUR 20.6 million). An amount of EUR 37.2 million (EUR 1.8 million) was withdrawn from the equalisation reserve and similar provisions.
Motor
in EUR million 2013 2012
Gross written premium 653.8 748.6
Loss ratio (%) 78.9 74.7
Underwriting result (net) (21.2) (20.6)
AviationThe gross premium volume contracted in the year under review from EUR 405.2 million to EUR 384.5 million. The major loss experience was once again unremarkable. Against this back-drop the net loss ratio decreased to 50.9% (69.6%). The underwriting result came in at a very good EUR 66.1 million (EUR 27.5 million). Following an allocation of EUR 6.8 mil-lion in the previous year, the equalisation reserve and similar provisions were boosted by an amount of EUR 34.0 million in the year under review.
Aviation
in EUR million 2013 2012
Gross written premium 384.5 405.2
Loss ratio (%) 50.9 69.6
Underwriting result (net) 66.1 27.5
MarineGross written premium declined by 4.8% to EUR 414.4 mil-lion (EUR 435.2 million). The net loss ratio improved from 81.3% to a pleasing 49.4%. The underwriting result con-sequently climbed from -EUR 11.7 million to EUR 75.5 mil-lion. The previous year had been overshadowed by significant strains from major losses due to the wreck of the “Costa Con-cordia” cruise ship as well as Hurricane “Sandy”. An amount of EUR 123.3 million (EUR 35.3 million) was allocated to the equalisation reserve and similar provisions.
Marine
in EUR million 2013 2012
Gross written premium 414.4 435.2
Loss ratio (%) 49.4 81.3
Underwriting result (net) 75.5 (11.7)
LifeGross premium income in the life line remained on the level of the previous year at EUR 3.9 billion. The flat premium volume is attributable primarily to the saturated insurance market in European countries, where premium growth rates have been on the retreat for years, as well as to termination of a large treaty from the United States. Nevertheless, we succeeded in boosting our market share of new business in the United States despite a declining market overall. Furthermore, the sluggish effects were offset by a positive business development in China, France and some parts of Eastern Europe.

61
Com
bine
d m
anag
emen
t re
port
Hannover Re | Annual Report 2013
A strengthening of the reserves for Australian disability busi-ness, which was made necessary by elevated risk experiences market-wide, caused the underwriting result to deteriorate sharply from EUR 67.2 million to -EUR 53.6 million.
Life
in EUR million 2013 2012
Gross written premium 3,893.5 3,912.1
Underwriting result (net) (53.6) 67.2
Other linesThe lines of health, credit and surety, other indemnity insur-ance and other property insurance are reported together under other lines. Other property insurance consists of the extended coverage, comprehensive householder’s (contents), compre-hensive householder’s (buildings), burglary and robbery, water damage, plate glass, engineering, loss of profits, hail, livestock
and windstorm lines. Other indemnity insurance encompasses legal protection, fidelity as well as other pure financial losses and property damage.
The total premium volume in the other lines increased by 28.0% to EUR 2.7 billion (EUR 2.1 billion). The loss ratio of 76.0% was virtually unchanged from the previous year (73.1%). The underwriting result closed at EUR 1.0 million in the year under review, after -EUR 3.0 million in the previous year. An amount of EUR 31.0 million (EUR 63.4 million) was allocated to the equalisation reserve and similar provisions.
Other lines
in EUR million 2013 2012
Gross written premium 2,735.8 2,136.8
Loss ratio (%) 76.0 73.1
Underwriting result (net) 1.0 (3.0)
Assets and financial position
Balance sheet structure of Hannover Rück SE
in EUR thousand 2013 2012
Assets
Intangible assets 73,438 23,928
Investments 33,203,262 30,452,002
Receivables 2,029,910 2,196,172
Other assets 386,231 229,067
Prepayments and accrued income 200,150 179,184
Total assets 35,892,991 33,080,353
Liabilities
Subscribed capital 120,597 120,597
Capital reserve 880,608 880,608
Retained earnings 380,511 380,511
Disposable profit 456,000 451,000
Capital and reserves 1,837,716 1,832,716
Subordinated liabilities 1,800,000 1,800,000
Technical provisions 27,684,284 25,276,558
Provisions for other risks and charges 319,702 335,905
Deposits received from retrocessionaires 3,219,018 2,882,346
Other liabilities 1,032,271 952,828
Total liabilities 35,892,991 33,080,353

62 Hannover Re | Annual Report 2013
Our portfolio of assets under own management grew in the year under review to EUR 20.8 billion (EUR 19.5 billion). This cor-responds to an increase of 6.3% and can be attributed above all to the very positive operating cash flow, which offset the yield increases recorded especially on high-quality govern-ment bonds as well as the softening of key foreign currencies against the euro. The balance of unrealised gains on fixed-income securities and bond funds consequently decreased to EUR 414.7 million (EUR 798.3 million).
Deposits with ceding companies, which are shown under the investments, totalled EUR 12.4 billion (EUR 10.9 billion) in the year under review.
Our capital and reserves – excluding the disposable profit – stood at EUR 1,381.7 million (EUR 1,381.7 million). The total capital, reserves and technical provisions – comprised of the capital and reserves excluding disposable profit, the subordi-nated liabilities, the equalisation reserve and similar provisions as well as the net technical provisions – grew during the year under review to EUR 30,866.0 million (EUR 28,458.3 million). Based on the increase in the total capital, reserves and tech-nical provisions, the balance sheet total of Hannover Rück SE grew to EUR 35.9 billion (EUR 33.1 billion).
A dividend of EUR 2.60 and a bonus of EUR 0.40 per share, equivalent to EUR 361.8 million (previous year: EUR 253.3 mil-lion), was paid in the year under review for the 2012 financial year.
It will be proposed to the Annual General Meeting on 7 May 2014 that a dividend of EUR 3.00 per share should be paid for the 2013 financial year. This corresponds to a total distribution of EUR 361.8 million. The dividend proposal does not form part of this consolidated financial statement.
Risks and opportunities
The business development of Hannover Rück SE is essentially subject to the same risks and opportunities as that of the Han-nover Re Group. As a general principle, Hannover Rück SE shares in the risks of participating interests and subsidiaries according to the amount of its respective holding. The risks are set out in the risk report. The relations with participating interests of Hannover Rück SE may also give rise to losses from legal or contractual contingent liabilities (particularly novation clauses and guarantees). Please see our explanatory remarks in the notes to this report.
Other information
We received an adequate consideration for all transactions with affiliated companies according to the circumstances of which we were aware at the time when the transactions were effected. We incurred no losses requiring compensation as defined by § 311 Para. 1 Stock Corporation Act (AktG).
Hannover Rück SE maintains branches in Australia, Bahrain, Canada, China, France, Korea, Malaysia, Sweden and the United Kingdom.
Outlook
In November 2013 the responsible bodies of Hannover Rück SE and its subsidiary E+S Rückversicherung AG decided to reorganise the business relationship between the two compa-nies with effect from 1 January 2014. The exchange of busi-ness under the joint underwriting arrangements is to be dis-continued at the beginning of 2014. In non-life reinsurance business, however, a retrocession from Hannover Rück SE to E+S Rückversicherung AG will be maintained. The exclusive responsibility borne by E+S Rückversicherung AG for German business and by Hannover Rück SE for international business remains in place.
In view of the interrelations between the parent company and the Group companies and the former’s large share of business within the Group, we would refer here to our remarks contained in the section entitled “Outlook for the full 2014 financial year” on page 124, which also reflect in particular the expectations for Hannover Rück SE. For 2014, as in recent years, we are again targeting a payout ratio for the dividend in the range of 35% to 40% of Group net income.

63
Com
bine
d m
anag
emen
t re
port
Hannover Re | Annual Report 2013
Other success factors
Our staff
Key personnel ratios
The Hannover Re Group employed 2,419 (previous year: 2,312) staff as at 31 December 2013. The turnover ratio at Home Office in Hannover of 2.8% was unchanged from the previous year (2.8%). The rate of absenteeism – at 3.4% – was slightly below the previous year (3.5%). The turnover ratio and rate of absenteeism continued to be below the average expected across the industry as a whole.
Employee survey analysed and findings translated into practice
The skills and dedication of our staff are a high-value asset for our company. It is for this reason that we conduct an internal employee survey – usually every other year – in order, among other things, to ascertain how satisfied our employees are with their tasks, their working conditions, their development and advancement as well as to explore the topics of cooperation and leadership.
Working through this survey, carried out most recently at the end of 2012, was one of the dominant themes of our work in human resources in the financial year just ended. The Executive Board also considered the survey and its findings on several occasions at its meetings.
As an overall statement, it is very pleasing to note that the vast majority of our employees are highly satisfied with their tasks and general conditions. For example, 93% of our workforce finds our company to be a particularly good place to work. The responses to questions such as whether our employees enjoy coming to work or whether they would choose to work for our company again are similarly positive. Job activities are for the most part also rated as interesting, varied and challenging for one’s own individual skill set.
It goes without saying that the survey also revealed areas in need of improvement. As regards the content of human resources activities, our employees would like to see, among other things, an expanded range of opportunities for develop-ment and advancement. This would provide fresh incentives to learn, especially for staff who already have extensive profes-sional experience and considerable expertise. Further room for improvement was identified, for example, in the expansion of opportunities for project work and in the handling of conflicts.
We have already picked up on many of these suggestions in the financial year just ended. With a view to better fostering seasoned members of staff, for example, we designed a semi-nar which deals with difficult decision-making situations of the type that present themselves increasingly often in our employ-ees’ everyday working lives. We also continued to hold our so-called “Client Centric Re Skills” seminar, which is aimed at experienced senior underwriters wishing to supplement their already well-proven negotiating skills with successful alterna-tive approaches.
The individual specialist units took it upon themselves to foster opportunities for project work, devising appropriate solution approaches on a decentralised basis. On the one hand, these emphasise the need to inform staff so as to make it clear which projects are upcoming for which areas of the company. On the other hand, for example, opportunities for members of staff to apply independently for project work were improved.
With a view to strengthening our internal conflict management, we subjected our relevant personnel development tools to fresh scrutiny. In this connection we offer our managers wide-ranging support tailored to specific issues, including for example media-tion, coaching, process support and specially created seminars such as our “Conflict manager”.
Staff turnover / absenteeism Hannover Home Officein %
0
1
2
3
4
5
6
7
8
0
1
2
3
4
5
0
1
2
3
4
5
0
1
2
3
4
5
2009
Turnover Absenteeism
2.8 2.8
2.3
4.3
1.9
3.5 3.43.2
3.4
3.0
2010 2011 2012 2013
5
4
3
2
1
0

64 Hannover Re | Annual Report 2013
Mentoring programme successfully up and running
Part of our diversity management intended to boost the pro-portion of women in our company’s management ranks, our mentoring programme got off to a very successful start. Five tandems of female employees and seasoned managers met regularly for a productive exchange to discuss the individual issues faced by our mentees. On the part of the company we assist these discussions by means of process support. In addi-tion, the mentees were given the opportunity to share their experiences with one another at an event held halfway through the year. This occasion was enriched by a practically oriented workshop on the theme of “Image as a success factor”.
Breakdown of employees by country
2013 2012
Germany 1,219 1,164
United States 280 283
United Kingdom 208 186
South Africa 164 164
Sweden 89 86
Australia 85 75
China 56 60
France 50 55
Ireland 50 45
Bermuda 43 41
Malaysia 43 36
Bahrain 42 36
Columbia 25 20
Italy 12 13
Japan 10 9
Korea 9 9
India 8 8
Spain 7 7
Mexico 6 3
Canada 5 4
Brazil 4 4
Taiwan 4 4
Total 2,419 2,312
Further tools successfully established
We devoted considerable effort in the financial year just ended to the establishment of further personnel (development) tools that we had newly created or revised in recent years. Mention should be made first and foremost here of “blended learning” and the implementation of management feedback.
Blended learning, i. e. the interlinking of electronic study pro-grammes with tutoring support and traditional face-to-face classes, has now become established as our standard form of basic reinsurance instruction. In the financial year just ended we again carried out four modularly structured training events spanning several weeks on the basis of blended learning. Thanks to its universal structure and multilingual design our employees abroad were also able to profit from this training opportunity. With a view to making our training processes even more professional, we also initiated a project to explore the structure of a state-of-the-art learning management system tailored to meet our requirements.
Our reorganised management feedback, by means of which managers receive feedback from their employees and super-visors, also proved its worth. Geared systematically towards our Management Principles, this tool is now used successfully by all executive staff and chief / senior managers with manage-rial responsibility for disciplinary matters. In general terms, the high quality of our management performance was confirmed. At the close of the financial year just ended we also prepared the next implementation round for our executive staff, who will already be experiencing this new form of feedback for the second time; this will make it possible to identify develop-ments and trends in relation to the previous survey, which will hopefully attest to a further strengthening of our management quality.
Employee participation in Hannover Rück SE
With the entry in the commercial register of Hannover Country Court the transformation of Hannover Rückversicherung AG into the legal form of a European Company, Societas Europaea (SE), came into effect on 19 March 2013. The negotiations conducted by management with the Special Negotiating Body regarding the structuring of the participation procedure and the determination of employee participation rights in the SE were an important milestone in the process of conversion into an SE. On 23 January 2013 the negotiations were successfully concluded with the signing of the Participation Agreement.
By this time it had been necessary to resolve numerous ques-tions and issues between the parties on the basis of the Act on the Participation of Employees in a European Company (SEBG). While this legislation is intended to safeguard in an SE the rights acquired by employees to participate in company decisions, it leaves room for interpretation as to the specifics. In accordance with the SEBG negotiations with the Special Negotiating Body can take as long as six months and may be extended under certain conditions – an option which the par-ties to the negotiations made use of.

65
Com
bine
d m
anag
emen
t re
port
Hannover Re | Annual Report 2013
The negotiations centred on, among other things, matters such as the responsibilities of the SE Employee Council, the num-ber of seats assigned to a Member State in the SE Employee Council and the allocation of seats. It was necessary to deter-mine whether one or two annual regular meetings of the SE Employee Council should be held and establish rules governing formation, tasks, number of meetings and number of members of an Executive Committee. A further important step was to reach agreement on an information and consultation procedure to facilitate dialogue between the SE Employee Council and the Executive Board of Hannover Rück SE. Another key point of negotiation was the rules governing co-determination on the Supervisory Board.
Word of thanks to our staff
The Executive Board would like to thank all employees for their dedication in the past year. At all times the workforce iden-tified with the company’s objectives and pursued them with motivation. We would also like to express our appreciation to the representatives of staff and senior management who par-ticipated in our co-determination bodies for their critical yet always constructive cooperation.
Sustainability at Hannover Re
The sustainability strategy of the Hannover Re Group
Profit and value creation are indispensable prerequisites for sustainable development in the interests of our clients, share-holders, staff and business partners. As a leading player in the reinsurance industry, our commercial success is crucially dependent on the correct assessment and evaluation of present and emerging risks. Sustainability therefore not only forms an important part of how we see our business in general, it also has a direct bearing on our operational activities. Our goal is to achieve economic success in conformity with legal regulations and in light of the needs of our clients, staff and the company, while also giving due consideration to conserva-tion of the environment. In so doing, our premises of financ-ing growth through self-generated profits and avoiding imbal-ances that could necessitate capital measures continue to apply unchanged. Our operations are thus guided primarily by prof-itability considerations and we concentrate on attractive seg-ments of reinsurance business.
With this in mind, in September 2011 we drew up a Sustain-ability Strategy for Hannover Re in which we explicitly com-mit to our strategic objective of sustainable value creation. This Sustainability Strategy is based on good and sustainable implementation of all compliance requirements and fleshes out in more concrete terms relevant aspects of the higher-level corporate strategy of the Hannover Re Group. For us, sustain-ability encompasses the following five action fields:
•Governance and dialogue
•Product responsibility
•Successful employees
•Procurement and environmental protection
•Social commitment
Governance and dialogue
As an internationally operating company, Hannover Re bears responsibility in various senses. This is true of its compliance with relevant laws and regulations, but also applies to its rela-tionship with staff, shareholders, the public at large and the cultures within which the company operates. As a company based in Germany, the formal framework that shapes our cor-porate governance is determined by German law. With few exceptions Hannover Re fulfils all the recommendations of the German Corporate Governance Code (DCKG), cf. page 95. What is more, our Code of Conduct serves as a further guide for our day-to-day actions.
In the year just ended we again reported on our achievements as a responsible enterprise in the form of a stand-alone Sus-tainability Report. In this regard we follow the currently appli-cable and internationally recognised guidelines of the Global Reporting Initiative (GRI); we fulfil Application Level B – the intermediate level of transparency – as defined by the GRI.
Since 2009 Hannover Re’s sustainability performance has been regularly evaluated by the rating agency oekom research. Since 2013, upon completion of the current rating process, we have been ranked among the leading companies in our industry and we fulfil the industry-specific minimum requirements. This is reflected in our inclusion in the oekom research Prime Standard.
Building on the active and open dialogue that we initiated with key stakeholder groups in 2010, we conducted a second stakeholder survey in the year just ended. In this context we again engaged in a dialogue with some 30 representatives of the capital market, clients, employees, non-governmental organisations and the public sector, thereby gaining not only recognition for our reporting but also valuable suggestions in relation to future topics.
Our detailed Sustainability Report can be accessed at www.hannover-re.com / sustainability / index.html

66 Hannover Re | Annual Report 2013
Product responsibility
Our range of reinsurance products and services is geared to the needs of the market and our clients. In response to changing social challenges, new economic, social and ecological risks – known as emerging risks – are increasingly reflected in our risk assessment. Examples of emerging risks include demographic change, the formation of megacities, shortage of resources, cli-mate change and its impacts on global development (natural disasters, environmental damage) as well as pandemics. We use all internally and externally acquired insights in order to be able to offer better insurance solutions. In so doing, we devote special attention to protecting against risks that result from climate change and providing insurance coverage for socially vulnerable groups. This is especially relevant in developing countries, where a constantly growing demand for food makes it important to have coverage for livestock and crop failures.
In our understanding, product responsibility also extends to the management of our investment portfolio. The goal of our investment strategy is to generate a commensurate market return in the interests of our clients, institutional investors and private investors. In this context we pay attention not only to traditional financial considerations but also to environmental, social and governance (ESG) criteria. Since 2012 our invest-ment policy has been guided specifically by the ten principles of the United Nations Global Compact and thus also recognises the aspects of human rights, working conditions, the environ-ment and anti-corruption. Since 2013 our investments have been reviewed half-yearly to verify compliance with these ESG standards. Exclusion from our investment universe is provided for in the event of failure to comply with the criteria. Further-more, investments in correspondingly identified securities are also prospectively avoided. As we develop and continuously review our investment strategy, we work together with a ser-vice provider that specialises in sustainability.
Successful employees
The success of our company is directly dependent on the suc-cessful work of our staff. We therefore pay special attention to their skills, experience and commitment and we attach con-siderable importance to outstanding personnel development and management activities. In this context, the compatibility of career and private life for our employees is especially sig-nificant. By way of flexible working-time models and telecom-muting Hannover Re promotes a balance between these two elements.
Furthermore, we attach particular importance to maintaining the physical and mental well-being of our staff. The focus is on the prevention of disease. Through medical check-ups by the company physician, workplace inspections, advice on matters of general medicine as well as an extensive range of sporting opportunities we seek to play our part in helping our employ-ees to stay healthy.
Procurement and environmental protection
Hannover Re is committed to keeping negative environmental impacts of its business operations as low as possible. With this in mind, the focus of our efforts is on reducing carbon diox-ide (CO2) emissions as we move towards climate neutrality by the year 2015. A major step towards achieving this goal was the implementation of our Environmental Management Sys-tem at Hannover Home Office in 2012. Shortly after launch it was successfully certified according to DIN EN ISO 14001; its conformity was recertified in this year’s maintenance audit.
We took another step towards our goal of climate neutrality with the construction of a photovoltaic system on the roof of our main office premises in Hannover at the end of 2013. From 2014 onwards all the power that it generates will be fed directly into the building’s own grid. Depending on the actual number of hours of sunshine, the system can generate some 145,000 kilowatt hours of solar power per year, which is roughly equiva-lent to the electricity consumption of 42 two-person house-holds. Put another way, this means that approximately 136 tonnes of harmful CO2 emissions will be avoided each year.

67
Com
bine
d m
anag
emen
t re
port
Hannover Re | Annual Report 2013
Hannover Re’s carbon dioxide emissions at the Hannover Home Office location amounted to 7,203 (previous year: 4,984) tonnes in 2013, some 44.5% more than in the previous year. In addition to an increased number of kilometres flown on busi-ness, the considerably higher level of carbon dioxide pollution can be attributed to a greater need for heating on account of a longer winter.
In 2013, as in previous years, we also offset our absolute CO2 footprint of 6,859 (4,743) tonnes caused by airline and train travel by making voluntary offsetting payments to the inter-national organisation “atmosfair” and to Deutsche Bahn AG.
The table below breaks down Hannover Re’s consumption and emissions over the past five years.
Social commitment
Hannover Re’s commitment as a sponsor in the areas of art and culture as well as research and learning goes back to its founding in 1966. Essentially, our social involvement is subdi-vided into four areas: sponsorship, foundation support, dona-tions and voluntary activities performed by our staff as well as their passing on of know-how on a local basis at our various locations worldwide.
More detailed information on our social commitment can be found at www.hannover-re.com / sustainability / index.html
Resources consumed at Hannover Home Office
2013 3 2012 3 2011 2 2010 1 2009 1
Electricity (in kWh) 9,114,482 8,802,262 8,214,917 8,055,429 8,014,946
Heat (in kWh) 3,359,694 2,319,854 1,859,119 2,383,918 2,314,009
Water (in l) 15,778,000 14,961,000 14,464,500 14,722,000 12,100,000
Paper (in sheets) 8,502,060 8,766,000 9,172,180 9,074,300 8,488,368
Waste (in kg) 214,250 205,790 257,400 297,000 327,000
Business trips (in km) 18,185,062 16,654,504 17,658,598 16,018,500 15,179,745
CO2 emissions 4 (in kg) 7,203,000 4,984,000 8,123,000 7,685,000 9,005,000
1 Karl-Wiechert-Allee 50, Roderbruchstraße 26 and infant daycare centre, Hannover2 Karl-Wiechert-Allee 50, Roderbruchstraße 21 and 26 as well as infant daycare centre, Hannover3 Karl-Wiechert-Allee 50, Roderbruchstraße 21 and 26 as well as infant daycare centre, Karl-Wiechert-Allee 57 (pro rata), Hannover 4 Radiative Forcing Index: 2.7

68 Hannover Re | Annual Report 2013
Increasing numbers of patients with common diseases Diabetes mellitus manifests itself in an elevated blood glucose level. If not a dequately controlled, diabetes normally leads to significantly higher morbidity and mortality rates among sufferers. The worldwide prevalence of diabetes mel-litus climbed from 150 million people in 1980 to almost 350 million in 2008. The total number is expected to rise steadily in the coming decades. The increase is due first and foremost to the growth and ageing of the population as well as to the rise in age-specific prevalences. One of the primary factors for the increase in the most widespread form, diabetes mellitus type 2, is the worldwide rise in a person’s average body weight.
Persons suffering from diabetes mellitus in million
Source: The Lancet, Volume 378, Issue 9785, 2 July 2011
1501980
3502008

69Hannover Re | Annual Report 2013
The steadily rising number of patients
afflicted by common diseases poses new
challenges for re-search and medicine as well as for society
and insurance companies.
Increasing numbers of patients with common diseases

70 Hannover Re | Annual Report 2013
Opportunity and risk report
Risk report• Taking a deliberate and controlled approach, we enter into a broad variety of risks which,
on the one hand, can open up opportunities for profit but, on the other hand, can also have adverse implications for our company
• We are convinced that our risk management system gives us a transparent overview of the current risk situation at all times and that our overall risk profile is appropriate
Risk landscape of Hannover Re
As part of its business operations the Hannover Re Group enters into a broad variety of risks. These risks are deliber-ately accepted and controlled in order to be able to act on the associated opportunities. For the purpose of systematising and managing these risks we split them into:
• technical risks in non-life and life and health reinsurance which originate from our business activities and manifest themselves inter alia in fluctuations in loss estimates as well as in unexpected catastrophes and changes in bio-metric factors such as mortality,
• market risks which arise in connection with our invest-ments and also as a consequence of the valuation of some-times long-term payment obligations associated with the technical account,
• default and credit risks resulting from our diverse busi-ness relationships and payment obligations inter alia with clients and retrocessionaires,
• operational risks which may derive, for example, from defi-cient processes or systems and
•other risks, such as reputational and liquidity risks.
At the present time our most significant risks are the reserv-ing and catastrophe risks within the technical risks of non-life reinsurance, the credit and spread risks within the market risks and the risk of changes in mortality within the technical risks of life and health reinsurance.
• Reserving risks can manifest themselves when the cur-rent estimates of future payment obligations from exist-ing insurance contracts diverge from the payments that are actually to be made in the future.
• Catastrophe risks can give rise to loss payments for natural disasters, such as storms or earthquakes, and man-made disasters, such as terrorist attacks or accidents in the air or at sea, the amount of which exceeds the losses antici-pated over the multi-year average.
• Credit and spread risks result from fair value changes or defaults in connection with our investments in fixed-income securities issued by companies or sovereigns or in asset-backed securities.
• Risks of changes in mortality derive from the difference between the mortality of insureds factored into the pric-ing and reserving and the actual mortality.
Our risk profile remained stable over the financial year just ended. The risks essentially increased in step with the growth of our business. Particularly notable aspects are described in the following sections.
The parameters and decisions of the Executive Board with respect to the risk appetite of the Hannover Re Group, which are based on the calculations of risk-bearing capacity, are fun-damental to the acceptance of risks. Through our business operations on all continents and the diversification between our non-life and life and health reinsurance business groups we are able to effectively allocate our capital in light of oppor-tunity and risk considerations and generate a higher-than-average return on equity. In non-life reinsurance we practise active cycle management and adopt a selective and disciplined underwriting approach.
By expanding our portfolio of life and health reinsurance we reduce the volatility of results within the Group and maintain stable dividend payments. Along with our principal business operations as a reinsurer of non-life and life and health busi-ness, we also transact primary insurance business in selected niche markets as a complement to our core reinsurance busi-ness. With this approach we are well positioned for further profitable growth. Crucial importance attaches to our risk man-agement in order to ensure, among other things, that risks to the reinsurance portfolio remain calculable and also that exceptional major losses do not have an unduly adverse impact on the result.

71
Com
bine
d m
anag
emen
t re
port
Hannover Re | Annual Report 2013
Strategy implementation
The risk strategy derived from the corporate strategy consti-tutes the basis for our handling of opportunities and risks. The strategy is implemented on multiple levels.
Our corporate strategy encompasses ten basic strategic prin-ciples, which safeguard across divisions the accomplishment of our mission “Growing Hannover Re profitably”. The orien-tations of the different business groups are guided by these principles and thus contribute directly to attainment of the overarching goals. Key strategic points of departure for our Group-wide risk management are the principles of active risk management, an adequate capital base and sustained compli-ance. For further information on the corporate strategy and the strategic principles in detail please see the section entitled “Our strategy” on p. 16 et seq.
The risk strategy specifies more concretely the goals derived from our corporate strategy with respect to risk management and documents our understanding of risk. With a view to achieving these goals, we have defined ten overriding princi-ples that are set out in our risk strategy:
1. We keep to the risk appetite defined by the Executive Board.
2. We integrate risk management into value-based management.
3. We promote an open risk culture and the transparency of the risk management system.
4. We aspire to each rating agency’s highest risk manage-ment rating and we seek approval of our internal capital model for Solvency II.
5. We define a materiality limit for our risks.
6. We use appropriate quantitative methods.7. We apply suitable qualitative methods.8. We practise risk-based allocation of our capital.9. We ensure the necessary separation of functions in our
organisational structure.10. We evaluate the risk content of new business areas and
new products.
The risk strategy is specified with an increasing degree of detail on the various levels of the company, for example down to the adoption and testing of contingency plans in the event of an emergency or the underwriting guidelines of our treaty and regional departments. The risk strategy and the guide-lines derived from it, such as the Framework Guideline on Risk Management and the central system of limits and thresholds, are reviewed at least once a year. In this way, we ensure that our risk management system is kept up-to-date.
We manage our total enterprise risk such that we can expect to generate positive Group net income with a probability of 90% and the likelihood of the complete loss of our economic capi-tal and IFRS shareholders’ equity does not exceed 0.03% p.a. These indicators are monitored using our internal capital model and the Executive Board is informed quarterly about adher-ence to these key parameters. The necessary equity resources are determined according to the requirements of our economic capital model, solvency regulations, the expectations of rating agencies with respect to our target rating and the expectations of our clients. Above and beyond that, we maintain a capital buffer in order to be able to act on new business opportuni-ties at any time.
Operationalisation of the risk strategy
Corporate strategy
Risk strategy
Framework Guideline on Risk Management
Limit and threshold system for the material risks of the Hannover Re Group
Central guidelines: investments, exposure management, central underwriting guidelines (non-life and life and health reinsurance) …
Local guidelines: e. g. local underwriting guidelines, signature rules, local contingency plans, deputising arrangements

72 Hannover Re | Annual Report 2013
Strategic targets for the risk position
Limit 2013
Probability of positive Group net income > 90% 94.9%
Probability of complete loss of shareholders' equity < 0.03% 0.01%
Probability of complete loss of economic capital < 0.03% < 0.01%
Major external factors influencing risk management in the financial year just ended
In the year under review it was first and foremost the agree-ment reached in November 2013 on the implementation of Solvency II effective 1 January 2016 that was of importance. The main goals of the Solvency II framework directive are to strengthen protection for insureds, put in place consistent com-petitive standards in the insurance sector of the European Sin-gle Market and hence ensure a broadly uniform regulatory practice in Europe. Key details must still be determined on the European and national level before the new regime can fully enter into effect on 1 January 2016. Hannover Re has been preparing intensively for Solvency II for years and is well equipped to provide the markets with tailored products. We believe that we are well placed for Solvency II because we are a solid and low-risk contracting partner with an excellent rat-ing. We can make multiple use of the know-how that we have acquired through development of the internal capital model, and we expect the convergence of supervisory, rating and inter-nal capital requirements to bring relief that will provide us with additional reinsurance capacity.
Further major external influencing factors are the protracted low level of interest rates and the Euro debt crisis. For further information on these topics please see the “Investments” sec-tion of the management report on page 50 et seq.
Risk capital
In the interests of our shareholders and clients we strive to ensure that our risks remain commensurate with our capital resources. Our quantitative risk management provides a uni-form framework for the evaluation and steering of all risks affecting the company as well as of our capital position. In this context, the internal capital model is our central tool.
The internal capital model of the Hannover Re Group is a sto-chastic enterprise model. It covers all subsidiaries and business areas of the Hannover Re Group. The central variable in risk and enterprise management is the economic capital, which is calculated according to market-consistent measurement prin-ciples and in many respects corresponds to the business valu-ation likely to be adopted in future under Solvency II.
Hannover Re’s internal capital model reflects all risks that influ-ence the development of the economic capital. They are split into technical risks, market risks affecting investments, credit risks and operational risks. For each of these risk classes we have identified a number of risk factors for which we define probability distributions. These risk factors include, for exam-ple, economic indicators specific to each currency area, such as interest rates, exchange rates and inflation indices, but also insurance-specific indicators such as the mortality of a par-ticular age group within our insurance portfolio in a particu-lar country or the number of natural catastrophes in a cer-tain region and the insured loss amount per catastrophe. The specification of the probability distributions for the risk fac-tors draws upon historic and publically available data as well as on the internal (re)insurance data stock of the Hannover Re Group. The process is further supplemented by the know-how of internal and external experts. The suitability of the probability distributions is regularly checked by our special-ist departments, although more importantly it is also verified in the context of the regular, company-wide use of the capital model when assessing risks and allocating the cost of capital.
Hannover Re calculates the required risk capital as the Value at Risk (VaR) of the economic change in value over a period of one year with a confidence level of 99.97%. This reflects the goal of not exceeding a one-year ruin probability of 0.03%. The internal target capitalisation of the Hannover Re Group is therefore significantly higher than the confidence level of 99.5% which will be required in future under Solvency II. It goes without saying that Hannover Rück SE also meets the cur-rent capital requirements set by regulators. The capital cover-age ratio under Solvency I stood at 147% as at 31 December 2013. Since the corresponding calculation is neither market-consistent nor risk-based a relevant comparison with the cov-erage ratio under the internal capital model is not possible.

73
Com
bine
d m
anag
emen
t re
port
Hannover Re | Annual Report 2013
The Hannover Re Group is seeking approval of its inter-nal model for the determination of regulatory capital under Solvency II. In the event of approval and depending on the final measurement rules of Solvency II, the capitalisation with a confidence level of 99.5% constitutes an indication of the fulfilment of future regulatory requirements.
Our excess capital coverage at the target confidence level of 99.97% is currently very comfortable. We hold additional capi-tal above all to meet the requirements of the rating agencies for our target rating. In this connection we strive for a rating from the rating agencies most relevant to our industry that facilitates and secures our access to all reinsurance business worldwide.
Hannover Re is analysed by the rating agencies Standard & Poor’s (S&P) and A.M. Best as part of an interactive rating pro-cess, meaning that both these rating agencies are also given access to confidential information about Hannover Re. The current financial strength ratings are assessed as “AA-” (Very Strong, stable outlook) by Standard & Poor’s and “A+” (Supe-rior, stable outlook) by A.M. Best.
Standard & Poor’s evaluates Hannover Re’s risk management as “Very Strong”, the best possible rating. The rating high-lights, in particular, the company’s very good risk management, the consistent and systematic implementation of corporate strategy by management and the excellent capital resources. Hannover Re’s internal capital model is also examined as part of the rating. Based on this review, Standard & Poor’s factors the results of the internal capital model of the Hannover Re Group into the determination of the target capital for the rating.
Organisation and processes of risk management
Our Group-wide risk management is geared to making a sig-nificant contribution to profitable growth and hence to imple-mentation of our strategy through the systematic weighing up of opportunities and risks. Profit and value creation constitute the foundation of our sustainable development in the interests of our clients, shareholders, employees and business partners.
Hannover Re has set up risk management functions and bod-ies Group-wide to safeguard an efficient risk management sys-tem. The individual elements of risk management are closely interlinked in this system and the roles, tasks and reporting channels are clearly defined and documented in guidelines. This makes possible a shared understanding of Group-wide and holistic monitoring of all material risks. Regular meet-ings of the Group-wide risk management functions are held in order to promote risk communication and establish an open risk culture. The organisation and interplay of the individual risk management functions are fundamental to our internal risk management and control system. The following chart pro-vides an overview of the central functions and bodies within the overall system as well as of their major tasks and powers.
Available capital and required risk capital 1
in EUR million 2013 2012
Available economic capital 11,143.9 10,693.7
Confidence level 99.97% 99.5% 99.97% 99.5%
Required risk capital 6,896.9 3,375.2 6,292.1 3,190.5
Excess capital 4,247.0 7,768.6 4,401.5 7,503.1
Capitalisation ratio 161.6% 330.2% 170.0% 335.2%
1 The presentation of the risks was amended in the reporting period. The required risk capital is now shown as the change relative to the expected value (rather than the initial value) and the expected result is reflected in the available capital. The previous year’s figures for the required and available capital have been restated accordingly.
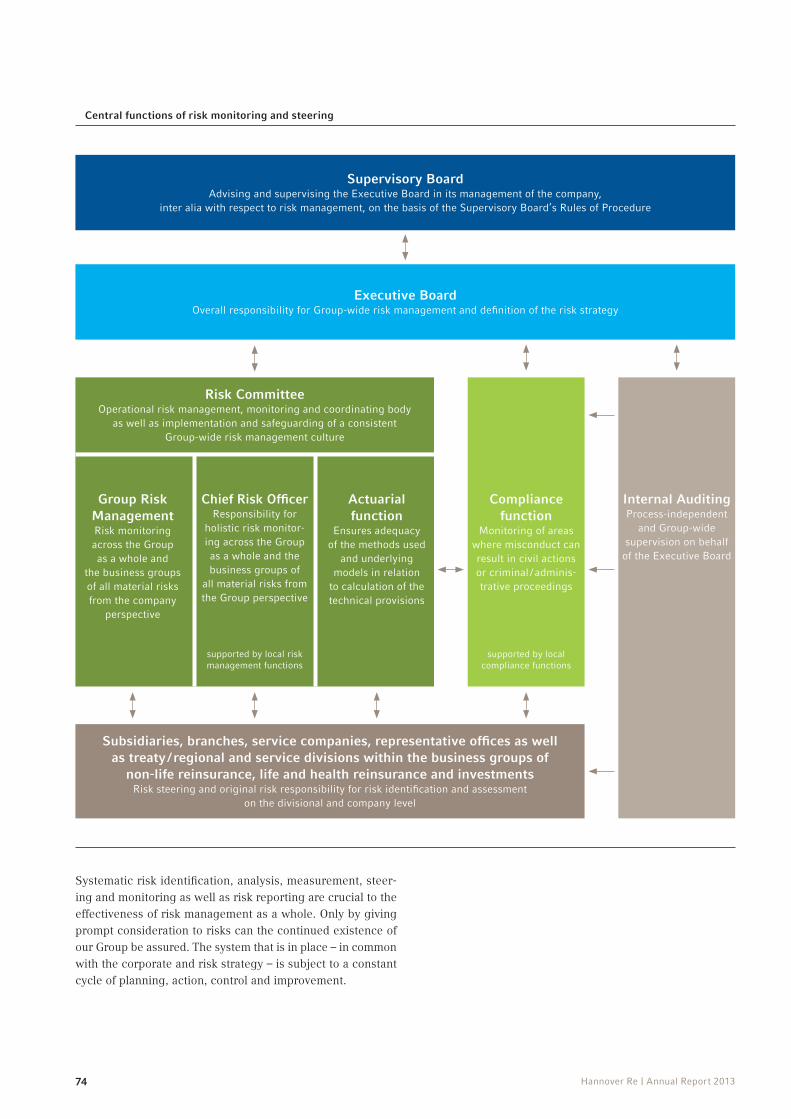
74 Hannover Re | Annual Report 2013
Systematic risk identification, analysis, measurement, steer-ing and monitoring as well as risk reporting are crucial to the effectiveness of risk management as a whole. Only by giving prompt consideration to risks can the continued existence of our Group be assured. The system that is in place – in common with the corporate and risk strategy – is subject to a constant cycle of planning, action, control and improvement.
Central functions of risk monitoring and steering
Supervisory BoardAdvising and supervising the Executive Board in its management of the company,
inter alia with respect to risk management, on the basis of the Supervisory Board’s Rules of Procedure
Executive BoardOverall responsibility for Group-wide risk management and definition of the risk strategy
Risk CommitteeOperational risk management, monitoring and coordinating body
as well as implementation and safeguarding of a consistent Group-wide risk management culture
Group Risk ManagementRisk monitoring across the Group as a whole and
the business groups of all material risks from the company
perspective
Chief Risk OfficerResponsibility for
holistic risk monitor-ing across the Group as a whole and the business groups of
all material risks from the Group perspective
supported by local risk management functions
Actuarial function
Ensures adequacy of the methods used
and underlying models in relation
to calculation of the technical provisions
Compliance function
Monitoring of areas where misconduct can result in civil actions or criminal / adminis-trative proceedings
supported by local compliance functions
Internal AuditingProcess-independent
and Group-wide supervision on behalf
of the Executive Board
Subsidiaries, branches, service companies, representative offices as well as treaty / regional and service divisions within the business groups of
non-life reinsurance, life and health reinsurance and investmentsRisk steering and original risk responsibility for risk identification and assessment
on the divisional and company level

75
Com
bine
d m
anag
emen
t re
port
Hannover Re | Annual Report 2013
The Hannover Re Group’s Framework Guideline on Risk Man-agement sets out the existing elements of the risk management system that has been put in place. It describes, among other things, the major tasks, rights and responsibilities, the organi-sational framework conditions and the risk control process. The guideline also contains principles governing the evalu-ation of new products in light of risk considerations as well as requirements for the outsourcing of functions. It aims to establish homogeneous Group standards for risk management. Key elements of our risk management system area as follows:
Risk-bearing capacity conceptThe establishment of the risk-bearing capacity involves deter-mining the total available risk coverage potential and calcu-lating how much of this is to be used for covering all material risks. This is done in conformity with the parameters of the risk strategy and the risk appetite defined by the Executive Board. The quantitatively measurable individual risks and the risk position as a whole are evaluated using our risk model. A central system of limits and thresholds is in place to monitor material risks. This system incorporates – along with other
risk-related key figures – in particular the indicators derived and calculated from the risk-bearing capacity. Adherence to the overall risk appetite is verified using the results of the risk model. The calculation is updated half-yearly.
Risk identificationThe most important source of information for monitoring risks is the risk identification carried out on a rotating basis. In order to ensure that all risks are identified in the context of risk iden-tification an overarching categorisation containing all material risks has been established. Risk identification is carried out – adjusted to fit the particular risk – by way of, for example, structured assessments, interviews, scenario analyses, check-lists or standardised questionnaires. External insights such as recognised industry know-how (e.g. from position papers of the CRO Forum; the CRO Forum is an international organisation comprised of the Chief Risk Officers (CRO) of large insurance and reinsurance companies) are incorporated into the process. Risk identification ensures that new risks identified from the current and rotating monitoring are added and known risks can be revised if necessary.
Internal risk steering and control system
Internal risk steering and control
system
Risk-bearing capacity concept
Risk identification
Risk analysis and assessment
Risk steeringRisk monitoring
Risk communication and culture
Risk reporting
Improvement Planning
Control Action
Corporate strategy
Risk strategy

76 Hannover Re | Annual Report 2013
Risk analysis and assessment Every risk that is identified and considered material is quan-titatively assessed. Only risk types for which quantitative risk measurement is currently impossible or difficult are qualita-tively assessed, e.g. reputational risks or emerging risks.
Evaluation is carried out using, for example, qualitative self-assessments. As part of the Hannover Re risk model Group Risk Management carries out a quantitative assessment of material risks and the overall risk position. In so doing, allow-ance is made as far as possible for risk accumulations and concentrations.
Risk steeringThe steering of all material risks is the task of the operational business units on the divisional and company level. In this context, risk steering encompasses the process of developing and implementing strategies and concepts that are designed to consciously accept, avoid or minimise identified and analysed risks. The risk / reward ratio and the required capital are fac-tored into the division’s decision. Risk steering is operationally assisted by, among other things, the parameters of the local underwriting guidelines, the system of limits and thresholds and the internal control system.
Risk monitoring The monitoring of all identified material risks is a fundamental risk management task. This includes, inter alia, monitoring exe-cution of the risk strategy and adherence to the defined limits and thresholds. A further major task of risk monitoring is the ascertainment of whether risk steering measures were carried out at the planned point in time and whether the planned effect of the measures is sufficient.
Risk communication and risk cultureThe Executive Board is responsible for the implementation of Group-wide risk communication and risk culture. Risk Man-agement takes responsibility for operational implementation on behalf of the Executive Board. Key elements of communication include internal and external risk reporting, information on risk complexes in the intranet (e.g. position papers on emerging risks) as well as regular meetings of risk management officers within the Group.
Risk reportingThe aim of our risk reporting is to provide systematic and timely information about risks and their potential implications and to safeguard adequate internal communication within the company about all material risks. The central risk reporting system consists primarily of regular risk reports, e.g. on the overall risk situation, adherence to the parameters defined in the risk strategy or on the capacity utilisation of natural catas-trophe scenarios. Complementary to the regular risk reporting, immediate internal reporting on material risks that emerge at short notice takes place as necessary.
Process-integrated / -independent monitoring and quality assurance The Executive Board is responsible for the orderly organisation of the company’s business irrespective of internally assigned competencies. This also encompasses monitoring of the inter-nal risk steering and control system. Process-independent moni toring and quality assurance of risk management is car-ried out by the internal audit function and external instances (independent auditors, regulators). Most notably, the inde-pendent auditors review the trigger mechanism and the inter-nal monitoring system. The entire system is rounded off with process-integrated procedures and rules, such as those of the internal control system.
Internal control system
We organise our business activities in such a way that they are always in conformity with all legal requirements. The internal control system (ICS) is an important subsystem that serves, among other things, to secure and protect existing assets, pre-vent and reveal errors and irregularities and comply with laws and regulations.
The core elements of Hannover Re’s ICS are documented in a Framework Guideline that establishes a common understand-ing of the differentiated execution of the necessary controls. In the final analysis, it is designed to systematically steer and monitor the implementation of our corporate strategy.
The Framework Guideline defines concepts, stipulates respon-sibilities and provides a guide for the description of controls. In addition, it forms the basis for the accomplishment of internal objectives and the fulfilment of external requirements imposed on Hannover Re. The ICS consists of systematically structured organisational and technical measures and controls within the enterprise. This includes, among other things:
•the principle of dual control,
•separation of functions,
•documentation of the controls within processes,
• and technical plausibility checks and access privileges in the IT systems.
The proper functioning of the ICS necessitates the involvement of management, executive staff and employees on all levels. Yet even with an optimally designed ICS it is not possible to avoid all errors. The system comes up against its limits, most notably with respect to fraud risks and imprecise or incomplete rules and responsibilities.

77
Com
bine
d m
anag
emen
t re
port
Hannover Re | Annual Report 2013
The financial reporting of the parent company and the Group must satisfy international and national financial reporting standards as well as regulatory requirements. This is safe-guarded in the area of accounting and reporting by processes with integrated controls which ensure the completeness and accuracy of the annual and consolidated financial statements. A structure made up of differentiated criteria, control points and materiality thresholds assures our ability to identify and minimise the risk of material errors in the annual and consoli-dated financial statements at an early stage.
All components of the accounting-related internal control sys-tem, the processes for the organisation and implementation of consolidation tasks and for the preparation of the consoli-dated financial statement as well as the accompanying con-trols are consistently documented. In order to safeguard and continuously improve the adequacy of the control system it is subject to regular review and evaluation. In this regard, the internal audit function ensures that the quality of the control system is constantly monitored. All relevant accounting prin-ciples are collated in a Group Accounting Manual that sets out uniform Group-wide rules for the recognition, measurement and reporting of items in the consolidated financial statement. The process for updating and, if necessary, adjusting these rules is clearly regulated with respect to information chan-nels, responsibilities and period of validity. Not only that, we provide prompt Group-wide notification of significant develop-ments and modified requirements in Group financial reporting.
Within the scope of our control system the Group companies are responsible for Group-wide adherence to the accounting policies and the internal control guidelines. The managing directors and chief financial officers of the Group companies defined as material in our control system affirm to the Execu-tive Board of Hannover Rück SE at each closing date the com-pleteness, correctness and reliability of the financial data that they pass on to Group Accounting. Data for the preparation of the consolidated financial statement is delivered using a Web-based IT application. The relevant data for Group financial reporting is collected in a database and processed via auto-matic interfaces in a consolidation system. Depending upon the results of our checks, these figures can be corrected if necessary. Given that our Group financial reporting is heavi ly dependent on IT systems, these systems also need to be sub-ject to controls. Authorisation concepts regulate system access and for each step content-based as well as system-side checks have been implemented, by means of which errors are analysed and promptly eliminated.
Internal risk assessment
In the following section we compare the available economic capi-tal with the required risk capital.
Hannover Re calculates the economic equity as the difference between the market-consistent value of the assets and the market-consistent value of the liabilities. The corresponding accounting principles also apply largely to the IVC (see the section “Manage-ment system” on page 24). While fair values are available for most investments, the market-consistent valuation of reinsurance treaties necessitates a specific valuation model. We establish the market-consistent value of technical items as the present value of projected payments using actuarial methods. This is adjusted by a risk loading that factors in the fluctuation in future payments. Such fluctuations result from risks that cannot be hedged by means of capital market products, such as technical risks. In a departure from the measurement rules currently under discussion in rela-tion to Solvency II, we use risk-free interest rates derived from the yields on high-quality government bonds for discounting of our future cash flows.
Market prices for options and guarantees embedded in insurance contracts are determined or approximated using option valuation models from the field of financial mathematics.
The methods used are the same as those adopted in the calculation of our Market Consistent Embedded Value (for further remarks on the Market Consistent Embedded Value please see our comments in the section “Technical risks in life and health reinsurance” on page 83). The significance of these options and guarantees in our portfolio is, however, minimal.
The valuation reserves for investments indicate the difference between fair value and book value of those investments recog-nised under IFRS at book values. Other valuation adjustments encompass above all deferred tax assets and liabilities that arise in connection with valuation adjustments.
The available economic capital increased in the period under review from EUR 10,693.7 million to EUR 11,143.9 million. This was due to the positive effects from economic value adjustments for non-life and life and health reinsurance. In view of the posi-tive business result the shareholders’ equity remained broadly stable despite opposing effects from currency translation and the interest rate environment. The higher interest rates on good-qual-ity government bonds as well as the strengthening euro led to a reduction in the valuation reserves for investments. Conversely, the discounting effect for the loss reserves in non-life reinsurance increased owing to the higher interest rates. The higher value adjustments for life and health reinsurance are attributable above all to lower effects – in comparison with IFRS – from changes in interest rates and exchange rates. The rise in other value adjust-ments resulted from deferred taxes as a consequence of the higher valuation reserves.

78 Hannover Re | Annual Report 2013
Reconciliation 1 (economic capital / shareholders’ equity)
in EUR million 2013 2012 2
Shareholders’ equity 6,530.0 6,714.1
Value adjustments for non-life reinsurance 1,627.8 775.2
Value adjustments for life and health reinsurance 1,116.5 930.5
Value adjustments for assets under own management 357.6 599.0
Value adjustments due to tax ef-fects and other (725.8) (558.1)
Economic equity 8,906.1 8,460.7
Hybrid capital 2,237.8 2,233.0
Available economic capital 11,143.9 10,693.7
1 In the course of the change of the risk presentation as change relative to the expected targets (instead of intial values) the expected result is now considered within the respective value adjustment as part of the available capital. The figures for the previous year have been adjusted accordingly.
2 Adjusted pursuant to IAS 8 (cf. Section 3.1 of the notes)
The required risk capital of the Hannover Re Group relative to the target confidence level of 99.97% grew in the year under review from EUR 6,292.1 million to EUR 6,896.9 million. The increase in underwriting risks in non-life reinsurance results largely from the rise in the risk budget for natural catastrophes and from model improvements. By factoring in the increased risk budget we are taking a rather conservative view, since the committed capacities are not fully utilised at all times of the year. The increase in risk capital for market risks is attribut-able above all to changes in the modelling of credit and spread risks and to an enlarged volume of real estate. The underwrit-ing risks in life and health reinsurance, the credit risks and the operational risks changed in accordance with the underlying business volumes.
The available economic capital, which is available as liable capital for policyholders, is comprised of the economic equity measured as described above and the hybrid capital. The inter-nal capital model is based on current methods from actuarial science and financial mathematics. In the case of technical risks, we are able to draw on a rich internal data history to esti-mate the probability distributions, e.g. for the reserving risk. For risks from natural perils we use external models, which are adjusted in the context of a detailed internal review process such that they reflect our risk profile as closely as possible. In the area of life and health reinsurance long-term payment flows are modelled under various scenarios. With respect to all the aforementioned risks we use internal data to define scenarios and probability distributions. The internal data is enhanced by way of parameters set by our internal experts. These param-eters are especially significant in relation to extreme events that have not previously been observed.
Required risk capital 1
in EUR million 2013 2012
Confidence level 99.97%
Confidence level 99.5%
Confidence level 99.97%
Confidence level 99.5%
Underwriting risk in non-life reinsurance 4,459.9 2,738.6 4,025.5 2,610.6
Underwriting risk in life and health reinsurance 2,607.3 1,434.3 2,592.8 1,336.6
Market risk 3,609.5 2,032.9 3,465.0 1,898.0
Credit risk 739.5 324.0 737.2 316.6
Operational risk 510.7 296.8 556.9 267.5
Diversification (3,905.2) (2,187.7) (3,781.5) (2,237.9)
Tax effects (1,124.8) (1,263.7) (1,303.8) (1,000.9)
Required risk capital of the Hannover Re Group 6,896.9 3,375.2 6,292.1 3,190.5
1 In the year under review the presentation of the risks was modified and the figures for the previous year were restated accordingly. In the interests of more transparent presentation of the diversification and tax effects the individual risks are now shown before allowance for tax effects and as a change relative to the expected value (instead of the initial value).
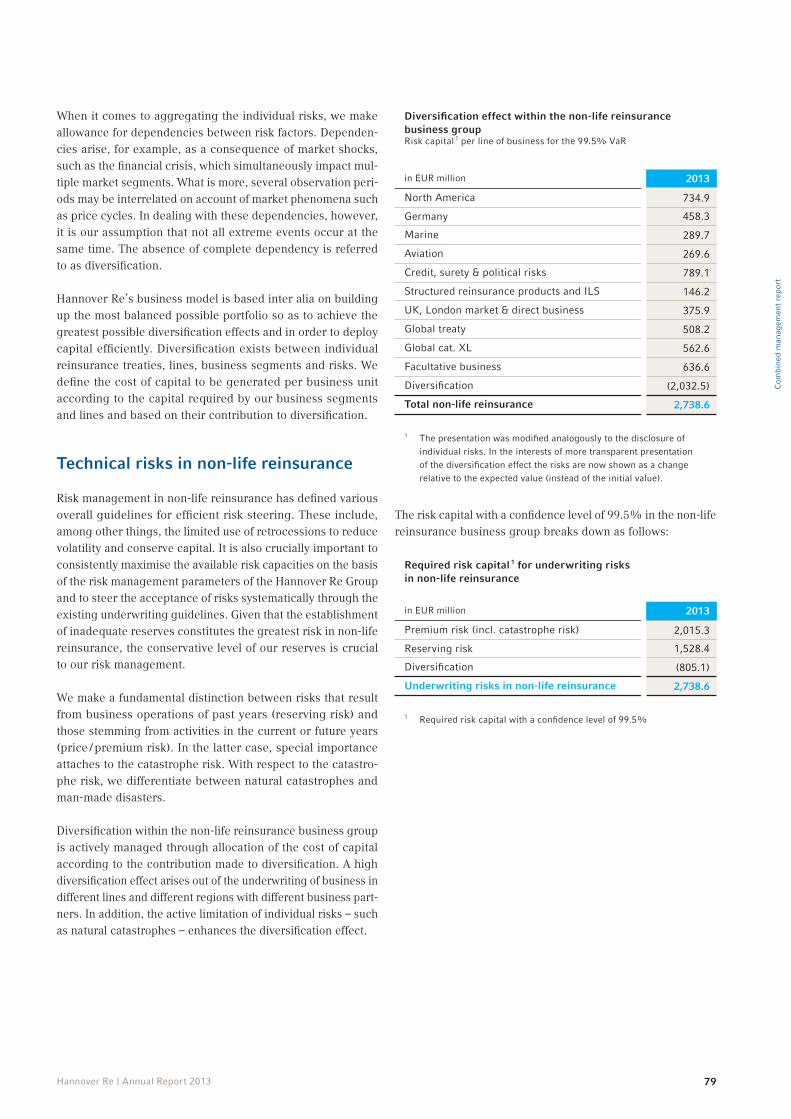
79
Com
bine
d m
anag
emen
t re
port
Hannover Re | Annual Report 2013
When it comes to aggregating the individual risks, we make allowance for dependencies between risk factors. Dependen-cies arise, for example, as a consequence of market shocks, such as the financial crisis, which simultaneously impact mul-tiple market segments. What is more, several observation peri-ods may be interrelated on account of market phenomena such as price cycles. In dealing with these dependencies, however, it is our assumption that not all extreme events occur at the same time. The absence of complete dependency is referred to as diversification.
Hannover Re’s business model is based inter alia on building up the most balanced possible portfolio so as to achieve the greatest possible diversification effects and in order to deploy capital efficiently. Diversification exists between individual reinsurance treaties, lines, business segments and risks. We define the cost of capital to be generated per business unit according to the capital required by our business segments and lines and based on their contribution to diversification.
Technical risks in non-life reinsurance
Risk management in non-life reinsurance has defined various overall guidelines for efficient risk steering. These include, among other things, the limited use of retrocessions to reduce volatility and conserve capital. It is also crucially important to consistently maximise the available risk capacities on the basis of the risk management parameters of the Hannover Re Group and to steer the acceptance of risks systematically through the existing underwriting guidelines. Given that the establishment of inadequate reserves constitutes the greatest risk in non-life reinsurance, the conservative level of our reserves is crucial to our risk management.
We make a fundamental distinction between risks that result from business operations of past years (reserving risk) and those stemming from activities in the current or future years (price / premium risk). In the latter case, special importance attaches to the catastrophe risk. With respect to the catastro-phe risk, we differentiate between natural catastrophes and man-made disasters.
Diversification within the non-life reinsurance business group is actively managed through allocation of the cost of capital according to the contribution made to diversification. A high diversification effect arises out of the underwriting of business in different lines and different regions with different business part-ners. In addition, the active limitation of individual risks – such as natural catastrophes – enhances the diversification effect.
Diversification effect within the non-life reinsurance business groupRisk capital 1 per line of business for the 99.5% VaR
in EUR million 2013
North America 734.9
Germany 458.3
Marine 289.7
Aviation 269.6
Credit, surety & political risks 789.1
Structured reinsurance products and ILS 146.2
UK, London market & direct business 375.9
Global treaty 508.2
Global cat. XL 562.6
Facultative business 636.6
Diversification (2,032.5)
Total non-life reinsurance 2,738.6
1 The presentation was modified analogously to the disclosure of individual risks. In the interests of more transparent presentation of the diversification effect the risks are now shown as a change relative to the expected value (instead of the initial value).
The risk capital with a confidence level of 99.5% in the non-life reinsurance business group breaks down as follows:
Required risk capital 1 for underwriting risks in non-life reinsurance
in EUR million 2013
Premium risk (incl. catastrophe risk) 2,015.3
Reserving risk 1,528.4
Diversification (805.1)
Underwriting risks in non-life reinsurance 2,738.6
1 Required risk capital with a confidence level of 99.5%

80 Hannover Re | Annual Report 2013
The reserving risk, i. e. the risk of under-reserving losses and the resulting strain on the underwriting result, is the overriding priority in our risk management. We attach the utmost impor-tance to a conservative reserving level and therefore tradition-ally have a high confidence level (> 50%). In order to counter this potential risk we calculate our loss reserves based on our own actuarial estimations and establish, where necessary, addi-tional reserves supplementary to those posted by our cedants as well as the segment reserve for losses that have already occurred but have not yet been reported to us. Liability claims have a major influence on this reserve. The segment reserve is calculated on a differentiated basis according to risk cat-egories and regions. The segment reserve established by the Hannover Re Group amounted to EUR 5,359.6 million in the year under review.
The statistical run-off triangles used by our company are another monitoring tool. They show the changes in the reserve over time as a consequence of paid claims and in the recalcula-tion of the reserves to be established as at each balance sheet date. Their adequacy is monitored using actuarial methods.
Our own actuarial calculations regarding the adequacy of the reserves are also subject to annual quality assurance reviews conducted by external firms of actuaries and auditors. For fur-ther remarks on the reserving risk please see our comments in Section 6.7 “Technical provisions” on page 189 et seq.
In the case of asbestos- and pollution-related claims it is dif-ficult to reliably estimate future loss payments. The adequacy of these reserves can be estimated using the so-called “sur-vival ratio”. This ratio expresses how many years the reserves would cover if the average level of paid claims over the past three years were to continue.
Hannover Re has taken out inflation swaps (USD and EUR zero coupon swaps) to partially hedge inflation risks. These serve to protect parts of the loss reserves against inflation risks. An inflation risk exists particularly inasmuch as the liabilities (e.g. loss reserves) could develop differently than assumed at the time when the reserve was constituted because of infla-tion. Inflation protection was purchased for the first time in the second quarter of 2010 with terms of 4 and 5 years; it was increased in the first quarter of 2011 (term of 8 years). We also secure parts of the inflation protection for our loss reserves by purchasing bonds with inflation-linked coupon payments.
Licensed scientific simulation models, supplemented by the expertise of our own specialist departments, are used to assess our material catastrophe risks from natural hazards (especially earthquake, windstorm and flood). Furthermore, we establish the risk to our portfolio from various scenarios in the form of probability distributions. The monitoring of the risks result-ing from natural hazards is rounded out by realistic extreme loss scenarios. Within the scope of this process, the Executive Board defines the risk appetite for natural perils once a year on the basis of the risk strategy by specifying the portion of the economic capital that is available to cover risks from natural perils. This is a key basis for our underwriting approach in this segment. As part of our holistic approach to risk management across business groups, we take into account numerous rele-vant scenarios and extreme scenarios, determine their effect on portfolio and performance data, evaluate them in relation to the planned figures and identify alternative courses of action.
Survival ratio in years and reserves for asbestos-related claims and pollution damage
in EUR million 2013 2012
Individual loss
reserves
IBNR reserves
Survival ratio in
years
Individual loss
reserves
IBNR reserves
Survival ratio in
years
Asbestos-related claims / pollution damage 28.8 170.8 32.1 27.8 182.2 29.1

81
Com
bine
d m
anag
emen
t re
port
Hannover Re | Annual Report 2013
Stress tests for natural catastrophes after retrocessions
in EUR million 2013 2012
Effect on forecast net income
Windstorm Europe
100-year loss -227.8 -101.3
250-year loss -415.2 -241.0
Windstorm United States
100-year loss -393.1 -369.1
250-year loss -630.6 -568.0
Windstorm Japan
100-year loss -241.1 -289.4
250-year loss -292.0 -363.0
Earthquake Japan 1
100-year loss -263.4 -335.4
250-year loss -490.8 -478.0
Earthquake California
100-year loss -271.9 -281.2
250-year loss -461.1 -433.0
Earthquake Australia
100-year loss -166.5 -176.2
250-year loss -369.1 -393.0
1 Previous year’s scenario limited to Tokyo
For the purposes of risk limitation, maximum amounts are also stipulated for various extreme loss scenarios and return periods in light of profitability criteria. Adherence to these limits is con-tinuously verified by Group Risk Management. The Risk Com-mittee, Executive Board and Non-Life Executive Committee are kept regularly updated on the degree of capacity utilisation. The limits and thresholds for the 200-year aggregate loss as well as the utilisation thereof are set out in the following table:
Limit and threshold for the 200-year aggregate annual loss as well as utilisation thereof
in EUR million Limit 2013
Threshold 2013
Actual utilisation
(July 2013)
All natural catastrophe risks 1
200-year aggregate annual loss 1,404 1,264 900
1 Loss relative to the underwriting result

82 Hannover Re | Annual Report 2013
Our company incurred the following catastrophe losses and major claims in the 2013 financial year:
Catastrophe losses and major claims 1 in 2013
in EUR million Date gross net
Hailstorm “Andreas” in Germany 27 – 28 July 137.9 99.3
6 property claims 117.2 115.8
Flooding in Europe 20 May – 4 June 113.4 92.5
Flooding in Canada 19 – 21 June 66.1 45.9
Hailstorm “Manni” in Germany, Switzerland and Austria 19 – 20 June 51.9 37.7
Windstorm “Christian” in Germany 28 October 45.5 33.7
Windstorm “Xaver” in Germany 5 December 39.5 27.5
2 aviation claims 37.8 33.5
2 credit claims 28.7 28.7
1 marine claim 26.0 18.5
Flooding in Canada 8 and 9 July 25.9 15.0
Typhoon “Haiyan” in the Philippines 9 November 18.7 18.5
Tornadoes in the United States 19 – 20 May 15.5 11.0
Total 724.1 577.6
1 Natural catastrophes and other major claims in excess of EUR 10 million gross
The price / premium risk lies primarily in the possibility of a random claims realisation that diverges from the claims expec-tancy on which the premium calculation was based. Regular and independent reviews of the models used for treaty quota-tion as well as central and local underwriting guidelines are vital management components.
In addition, Hannover Re’s regional and treaty departments prepare regular reports on the progress of their respective renewals. The reporting in this regard makes reference inter alia to significant changes in conditions, risks (such as inad-equate premiums) as well as to emerging market opportunities and the strategy pursued in order to accomplish targets. The development of the combined ratio in non-life reinsurance is shown in the table below:
Combined and catastrophe loss ratio
in % 2013 2012 2011 2010 2009 2008 2007 2006 2005 1 2004 1
Combined ratio (non-life reinsurance) 94.9 95.8 104.3 98.2 96.6 95.4 99.7 100.8 112.8 97.2
Thereof catastrophe losses 2 8.4 7.0 16.5 12.3 4.6 10.7 6.3 2.3 26.3 8.3
1 Including financial reinsurance and specialty insurance2 Net share of the Hannover Re Group for natural catastrophes and other major claims in excess of EUR 10 million gross
as a percentage of net premium earned (until 31 December 2011: in excess of EUR 5 million gross)
For further information on the run-off of the loss reserves please see our explanatory remarks in the section “Run-off of the net loss reserve in the non-life reinsurance segment” on page 190 et seq.

83
Com
bine
d m
anag
emen
t re
port
Hannover Re | Annual Report 2013
Technical risks in life and health reinsurance
All risks directly connected with the life of an insured person are referred to as biometric risks (especially the miscalculation of mortality, life expectancy, morbidity and occupational dis-ability); they constitute material risks for our company in the area of life and health reinsurance. Our goal is to find a bal-ance between biometric risks. Counterparty, lapse and catas-trophe risks are also material since we additionally prefinance our cedants’ new business acquisition costs. The reserves are determined on the basis of secure biometric actuarial bases in light of the information provided by our clients. The biometric actuarial bases used and the lapse assumptions are continu-ously reviewed with an eye to their adequacy and if necessary adjusted. This is done using the company’s own empirical data as well as market-specific insights.
Our current risk profile in life and health reinsurance is domi-nated by mortality risks. This is due to the fact that for the majority of our insurance contract we pay death benefits rather than survival benefits. The volume of our annuity portfolio has continued to grow, as a consequence of which the longevity risk is now our second-largest risk within the life and health reinsurance business group. We calculate the diversification effect between mortality and longevity risks prudently in view of the fact that the contracts are normally taken out for differ-ent regions, age groups and individuals.
Required risk capital 1 for underwriting risks in life and health reinsurance
in EUR million 2013
Mortality risk 1,216.6
Longevity risk 693.7
Morbidity and disability risk 293.3
Lapse risk 485.9
Diversification (1,255.2)
Underwriting risk in life and health reinsurance 1,434.3
1 Required risk capital with a confidence level of 99.5%
Diversification is a central management tool for our company. We seek to spread risks as far as possible across different risk classes and different regions. In our pricing of reinsurance trea-ties we provide incentives to further increase diversification.
Through our quality assurance measures we ensure that the reserves established by ceding companies in accordance with local accounting principles satisfy all requirements with respect to the calculation methods used and assumptions made (e.g. use of mortality and morbidity tables, assumptions regarding the lapse rate). New business is written in all regions in com-pliance with underwriting guidelines applicable worldwide, which set out detailed rules governing the type, quality, level and origin of risks. These global guidelines are revised annu-ally and approved by the Executive Board. Special underwrit-ing guidelines give due consideration to the particular features of individual markets.
By monitoring compliance with these underwriting guidelines we minimise the risk of an inability to pay or of deterioration in the financial status of cedants. Regular reviews and holistic analyses (e.g. with an eye to lapse risks) are carried out with respect to new business activities and the assumption of inter-national portfolios. The interest rate risk, which in the primary sector is important in life business owing to the guarantees that are given, is of only minimal relevance to our company thanks to the structure of our contracts. The actuarial reports and documentation required by local regulators ensure that regular scrutiny also takes place on the level of the subsidiaries.
We have confidence in the entrepreneurial abilities of our underwriters and grant them the most extensive possible pow-ers. In our decentralised organisation we manage risks where they arise using a consistent approach in order to obtain an overall view of the risks in life and health reinsurance. Our global underwriting guidelines provide underwriters with an appropriate framework for this purpose.
Another major element of risk management in life and health reinsurance is the Market Consistent Embedded Value (MCEV). The Market Consistent Embedded Value (MCEV) is a ratio used for the valuation of life insurance and reinsurance business; it is calculated as the present value of the future shareholders’ earn-ings from the worldwide life and health reinsurance portfolio plus the allocated capital. The calculation makes allowance as far as possible for all risks included in this business. The MCEV is established on the basis of the principles of the CFO Forum published in October 2009 (the CFO Forum is an international organisation of Chief Financial Officers from major insurance and reinsurance enterprises).
For detailed information please see the MCEV report 2012 pub-lished on our website. The MCEV report for the 2013 financial year will be published on our website close to publication of this report.

84 Hannover Re | Annual Report 2013
Market risks
Faced with a challenging capital market climate, particularly high importance attaches to preserving the value of assets under own management and the stability of the return. Han-nover Re’s portfolio is therefore guided by the principles of a balanced risk / return profile and broad diversification. Based on a risk-averse asset mix, the investments reflect both the currencies and durations of our liabilities. Market price risks include equity risks, interest rate risks, currency risks, real estate risks, spread risks and credit risks.
Our portfolio currently consists in large part of fixed-income securities, and hence interest rate, credit and spread risks account for the bulk of the market risk. We minimise interest rate and currency risks through the greatest possible matching of payments from fixed-income securities with the projected future payment obligations from our insurance contracts.
Required risk capital 1 for market risks
in EUR million 2013
Credit and spread risk 1,408.1
Interest rate risk 812.9
Currency risk 816.0
Equity risk2 531.0
Real estate risk 287.7
Diversification (1,822.8)
Market risk 2,032.9
1 Required risk capital with a confidence level of 99.5%2 Including private equity
With a view to preserving the value of our assets under own management, we constantly monitor adherence to a trigger mechanism based on a clearly defined traffic light system that is applied across all portfolios. This system defines clear thresh-olds and escalation channels for the cumulative fluctuations in fair value and realised gains / losses on investments since the beginning of the year.
These are unambiguously defined in conformity with our risk appetite and trigger specified information and escalation chan-nels if a corresponding fair value development is overstepped.
Our conservatively oriented investment portfolio was unable to escape the effects of increases in interest rates for govern-ment bonds triggered in particular in May and June of 2013 by the so-called tapering debate in the United States; from May 2013 onwards it consequently gave back some of the fair value gains made in previous years. The escalation levels of the trigger mechanism were activated in this context (cf. chart below). Our longer-duration fixed-income securities, which we hold to cover corresponding liabilities in accordance with our strict asset / liability management approach, were a key con-tributory factor in this development.
The short-term loss probability measured as the “Value at Risk” (VaR) is another vital tool used for monitoring and managing market price risks. It is calculated on the basis of historical data, e.g. the volatility of the securities positions under own management and the correlation between these risks. As part of these calculations the decline in the fair value of our port-folio is simulated with a certain probability and within a cer-tain period. The VaR of the Hannover Re Group determined in accordance with these principles specifies the decrease in the
Utilisation of the trigger systemin %
Utilisation by Hannover Re Warning level 1 Warning level 2 Warning level 3
0,0
0,3
0,6
0,9
1,2
1,5
0,0
0,3
0,6
0,9
1,2
1,5
Q1 2013 Q2 2013 Q3 2013 Q4 2013
150
120
90
60
30
0

85
Com
bine
d m
anag
emen
t re
port
Hannover Re | Annual Report 2013
fair value of our securities portfolio under own management that with a probability of 95% will not be exceeded within ten trading days. A multi-factor model is used to calculate the VaR indicators for the Hannover Re Group. It is based on time series of selected representative market parameters (equity prices, yield curves, spread curves, exchange rates, commodity prices and macro-economic variables). All asset positions are mapped on the level of individual positions within the multi-factor model; residual risks (e.g. market price risks that are not directly explained by the multi-factor model) can be deter-mined through back-calculation and are incorporated into the overall calculation. The model takes into account interest rate risks, credit and spread risks, systematic and specific equity risks, commodity risks and option-specific risks.
Against the backdrop of what was still a difficult capital mar-ket environment, the volatilities of fixed-income assets, in par-ticular, and hence the market price risks increased in the year under review relative to the previous year. Based on continued broad risk diversification and the orientation of our investment portfolio, our Value at Risk in the course of the reporting period and – at 1.1% (0.8%) – as at the end of the reporting period was clearly below the Value at Risk upper limit defined in our investment guidelines.
Value at Risk 1 for the investment portfolio of the Hannover Re Groupin %
1.5
1.2
0.9
0.6
1 VaR upper limit according to Hannover Re’s investment guidelines: 2.5%
0,6
0,9
1,2
1,5
0,6
0,9
1,2
1,5
Q1 2013 Q2 2013 Q3 2013 Q4 2013
Scenarios for changes in the fair value of material asset classes
in EUR millionScenario Portfolio change on
a fair value basisChange in equity
before tax
Equity securities Share prices -10% -2.9 -2.9
Share prices -20% -5.8 -5.8
Share prices +10% +2.9 +2.9
Share prices +20% +5.8 +5.8
Fixed-income securities Yield increase +50 basis points -635.1 -508.3
Yield increase +100 basis points -1,241.6 -993.5
Yield decrease -50 basis points +656.9 +524.8
Yield decrease -100 basis points +1,341.2 +1,071.6
Real estate Real estate market values -10% -115.9 -24.7
Real estate market values +10% +115.9 +24.7

86 Hannover Re | Annual Report 2013
Stress tests are conducted in order to be able to map extreme scenarios as well as normal market scenarios for the purpose of calculating the Value at Risk. In this context, the loss poten-tials for fair values and shareholders’ equity (before tax) are simulated on the basis of already occurred or notional extreme events. Further significant risk management tools – along with various stress tests used to estimate the loss potential under extreme market conditions – include sensitivity and duration analyses and our asset / liability management (ALM).
The internal capital model provides us with quantitative sup-port for the investment strategy as well as a broad diversity of VaR calculations. In addition, tactical duration ranges are in place, within which the portfolio can be positioned opportunis-tically according to market expectations. The parameters for these ranges are directly linked to our calculated risk-bearing capacity.
Further information on the risk concentrations of our invest-ments can be obtained from the tables on the rating struc-ture of fixed-income securities as well as on the currencies in which investments are held. Please see our comments in Sec-tion 6.1 of the notes, “Investments under own management”, page 175 et seq.
Share price risks derive from the possibility of unfavourable changes in the value of equities, equity derivatives or equity index derivatives in our portfolio. We hold such assets only on a very modest scale as part of strategic participations. The scenarios for changes in equity prices consequently have only extremely slight implications for our portfolio. Please see our comments in Section 6.1 of the notes, “Investments under own management”, page 168 et seq. The portfolio of fixed-income securities is exposed to the inter-est rate risk. Declining market yields lead to increases and rising market yields to decreases in the fair value of the fixed-income securities portfolio. The credit spread risk should also be mentioned. The credit spread refers to the interest rate dif-ferential between a risk-entailing bond and risk-free bond of the same maturity. Changes in these risk premiums, which are observable on the market, result – analogously to changes in pure market yields – in changes in the fair values of the cor-responding securities.
Currency risks are especially relevant if there is a currency imbalance between the technical liabilities and the assets. Through extensive matching of currency distributions on the assets and liabilities side, we reduce this risk on the basis of the individual balance sheets within the Group. The short-term Value at Risk therefore does not include quantification of the currency risk. We regularly compare the liabilities per currency with the covering assets and optimise the currency coverage in light of various collateral conditions such as different account-ing requirements by regrouping assets. Remaining currency surpluses are systematically quantified and monitored within
the scope of economic modelling. A detailed presentation of the currency spread of our investments is provided in Section 6.1, “Investments under own management”, page 176 et seq.
Real estate risks result from the possibility of unfavourable changes in the value of real estate held either directly or through fund units. They may be caused by a deterioration in particular qualities of a property or by a general downslide in market values (such as the US real estate crash). Real estate risks continued to grow in importance for our portfolio owing to our ongoing involvement in this sector. We spread these risks through broadly diversified investments in high-quality markets of Germany, Europe as a whole and the United States.
We use derivative financial instruments only to a very limited extent. The primary purpose of such financial instruments is to hedge against potentially adverse situations on capital markets. In the year under review we took out inflation swaps to hedge part of the inflation risks associated with the loss reserves in our technical account. In addition, as in the previous year, a modest portion of our cash flows from the insurance business was hedged using forward exchange transactions. Hannover Re holds further derivative financial instruments to hedge inter-est rate risks from loans taken out to finance real estate. The contracts are concluded with reliable counterparties and for the most part collateralised on a daily basis so as to avoid credit risks associated with the use of such transactions. The remaining exposures are controlled according to the restrictive parameters set out in the investment guidelines
Our investments entail credit risks that arise out of the risk of a failure to pay (interest and / or capital repayment) or a change in the credit status (rating downgrade) of issuers of securi-ties. We attach equally vital importance to exceptionally broad diversification as we do to credit assessment conducted on the basis of the quality criteria set out in the investment guidelines.
We measure credit risks in the first place using the standard market credit risk components, especially the probability of default and the potential amount of loss – making allowance for any collateral and the ranking of the individual instruments depending on their effect in each case. We then assess the credit risk first on the level of individual securities (issues) and in subsequent steps on a combined basis on the issuer level.
In order to limit the risk of counterparty default we set vari-ous limits on the issuer and issue level as well as in the form of dedicated rating quotas. A comprehensive system of risk reporting ensures timely reporting to the functions entrusted with risk management.

87
Com
bine
d m
anag
emen
t re
port
Hannover Re | Annual Report 2013
The measurement and monitoring mechanisms that have been put in place safeguard a prudent, broadly diversified invest-ment strategy. This is reflected inter alia in the fact that within our portfolio of assets under own management the exposures to government bonds or instruments backed by sovereign guar-antees issued by the so-called GIIPS states (Greece, Ireland, Italy, Portugal, Spain) amount to altogether just EUR 126.6 mil-lion on a fair value basis. This corresponds to a proportion of 0.4%. The individual countries account for the following shares: Spain EUR 39.3 million, Portugal EUR 20.1 million, Italy EUR 67.2 million and Ireland EUR 0.0 million. No impair-ments had to be taken on these holdings. Our portfolio does not contain any bonds of Greek issuers.
On a fair value basis EUR 3,480.2 million of the corporate bonds held by our company were issued by entities in the financial sector. Of this amount, EUR 2,963.5 million was attributable to banks. The vast majority of these bank bonds (68.9%) are rated “A” or better. Our investment portfolio under own management does not contain any written or issued credit default swaps.
Credit risks
The credit risk consists primarily of the risk of complete or partial failure of the counterparty and the associated default on payment.
Since the business that we accept is not always fully retained, but instead portions are retroceded as necessary, the credit risk is also material for our company in reinsurance transactions. Our retrocession partners are carefully selected and monitored in light of credit considerations in order to keep the risk as small as possible. This is also true of our broker relationships, which entail a risk inter alia through the potential loss of the premium paid by the cedant to the broker. We minimise these risks, among other things, by reviewing all broker relation-ships once a year with an eye to criteria such as the existence
of professional indemnity insurance, payment performance and proper contract implementation. The credit status of retro-cessionaires is continuously monitored. On the basis of this ongoing monitoring a Security Committee decides on meas-ures where necessary to secure receivables that appear to be at risk of default. This process is supported by a Web-based risk management application, which specifies cession limits for the individual retrocessionaires participating in protection cover programmes and determines the capacities still available for short-, medium- and long-term business. Depending on the type and expected run-off duration of the reinsured busi-ness, the selection of reinsurers takes into account not only the minimum ratings of the rating agencies Standard & Poor’s and A. M. Best but also internal and external expert assessments (e.g. market information from brokers).
Overall, retrocessions conserve our capital, stabilise and opti-mise our results and enable us to act on opportunities across a broader front, e.g. following a major loss event. Regular vis-its to our retrocessionaires give us a reliable overview of the market and put us in a position to respond quickly to capac-ity changes. The following table shows how the proportion of assumed risks that we do not retrocede (i. e. that we run in our retention) has changed in recent years.
Rating structure of our fixed-income securities 1
Rating classes Government bonds Securities issued by semi-governmental
entities 2
Corporate bonds Covered bonds / asset-backed
securities
in % in EUR million
in % in EUR million
in % in EUR million
in % in EUR million
AAA 21.9 1,345.0 50.4 3,188.4 1.5 169.5 63.0 3,047.9
AA 62.1 3,825.8 46.4 2,931.5 15.4 1,699.2 15.0 722.7
A 10.0 614.7 2.5 155.0 48.2 5,310.0 10.2 491.7
BBB 5.0 305.6 0.5 32.8 28.9 3,186.7 7.1 340.7
< BBB 1.0 63.1 0.2 13.3 5.9 651.3 4.7 226.9
Total 100.0 6,154.2 100.0 6,320.9 100.0 11,016.8 100.0 4,830.0
1 Securities held through investment funds are recognised pro rata with their corresponding individual ratings2 Including government-guaranteed corporate bonds

88 Hannover Re | Annual Report 2013
Gross written premium retained
in % 2013 2012 2011 2010 2009
Hannover Re Group 89.0 89.8 91.2 90.1 92.6
Non-life reinsurance 89.9 90.2 91.3 88.9 94.1
Life and health reinsurance 87.7 89.3 91.0 91.7 90.7
Alongside traditional retrocessions in non-life reinsurance we also transfer risks to the capital market. Yet credit risks are rele-vant to our investments and in life and health reinsurance, too, because we prefinance acquisition costs for our ceding com-panies. Our clients, retrocessionaires and broker relationships as well as our investments are therefore carefully evaluated and limited in light of credit considerations and are constantly monitored and controlled within the scope of our system of limits and thresholds.
The key ratios for managing the credit risk are as follows:
Ratios used to monitor and manage our credit risks
Management ratios 2013 2012 5 2011 2010 2009
Solvency margin 1 71.7% 72.9% 68.3% 69.5% 60.4%
Debt leverage 2 34.3% 33.3% 30.9% 36.5% 32.1%
Interest coverage 3 9.7x 13.3x 8.5x 13.8x 14.9x
Reserves / premium 4 270.6% 268.4% 292.7% 275.1% 270.1%
Combined ratio (non-life reinsurance) 94.9% 95.8% 104.3% 98.2% 96.6%
1 (Shareholders’ equity + hybrid capital) / net earned premium2 Hybrid capital / shareholders’ equity3 EBIT / interest on hybrid capital4 Net reserves / net premium earned5 Adjusted pursuant to IAS 8 (cf. Section 3.1 in the notes)
• 89.4% of our retrocessionaires have an investment grade rating (“AAA” to “BBB”).
• 88.6% are rated “A” or better.
• Since 2009 we have reduced the level of recoverables by altogether 19.7%.
• 47.3% of our recoverables from reinsurance business are secured by deposits or letters of credit. What is more, for the majority of our retrocessionaires we also function as reinsurer, meaning that in principle recoverables can potentially be set off against our own liabilities.
• In terms of the Hannover Re Group’s major companies, EUR 300.9 million (10.2%) of our accounts receivable from reinsurance business totalling EUR 2,945.7 million were older than 90 days as at the balance sheet date.
• The average default rate over the past three years was 0.09%
Retrocession gives rise to claims that we hold against our retrocessionaires. These reinsurance recoverables – i. e. the reinsurance recoverables on unpaid claims – amounted to EUR 1,403.8 million (EUR 1,538.2 million) as at the balance sheet date. The following chart shows the development of our reinsurance recoverables – split by rating quality – due from our retrocessionaires. Recent years are clearly trending lower with an average reduction of 5.3% per year.

89
Com
bine
d m
anag
emen
t re
port
Hannover Re | Annual Report 2013
Further remarks on technical and other assets which were unadjusted but considered overdue as at the balance sheet date as well as on significant impairments in the year under review are provided in Section 6.4 “Technical assets”, page 183 et seq., Section 6.6 “Other assets”, page 186 et seq. and Section 7.2 “Investment income”, page 205 et seq.
Operational risks
Operational risks refer to the risk of losses occurring because of the inadequacy or failure of internal processes or as a result of events triggered by employee-related, system-induced or external factors. In contrast to technical risks (e.g. the premium risk), which we enter into in a deliberate and controlled manner in the context of our business activities, operational risks are an indivisible part of our business activities. The focus is there-fore on risk avoidance and risk minimisation. As a derivation from our strategic principle “We manage risks actively”, we act according to the following principles in relation to opera-tional risks:
1. We integrate operational risk management into the com-pany and its culture.
2. We manage operational risks proactively and sustainably.3. We consider events and scenarios that cover that entire
spectrum of operational risks.4. We strive for adequate risk minimisation through our
actions. 5. We manage within defined limits and create transpar-
ency through measurements.
With the aid of Self-Assessments for Operational Risks (SAOR) we determine the degree of maturity of our operational risk management and define action fields for improvements. Based on these measurements, limits and thresholds are devel-oped in light of risk indicators and efficiency considerations. One key indicator in this regard is the SAOR-based capital commitment in our internal model. This currently stands at EUR 510.7 million. The assessment is carried out, for example, by assessing the degree of maturity of the respective risk management function or of the risk monitoring and reporting. The system enables us, among other things, to prioritise operational risks. Within the overall framework we consider, in particular, business pro-cess risks, compliance risks, risks associated with sales chan-nels and outsourcing of functions, fraud risks, personnel risks, information technology risks / information security risks and business interruption risks.
-5.3% p. a.
Reinsurance recoverables as at the balance sheet datein EUR million
0
500
1000
1500
2000
0
500
1000
1500
2000
2009
Secured AAA AA A ≤ BBB, NR
533
74
325
345
1
519
332
98
1
647 664
379
277
84
117
22 0
440
313
23
829
288
57
297
601
1,748
1,025
1,551 1,538
1,404
2010 2011 2012 2013
2,000
1,500
1,000
500
0

90 Hannover Re | Annual Report 2013
Business process risks are associated with the risk of deficient or flawed internal processes, which can arise as a consequence of an inadequate process organisation. We have defined cri-teria to evaluate the degree of maturity of the material pro-cesses, e.g. for the reserving process. This enables us to ensure that process risks are monitored. In cooperation with the pro-cess participants, the process owner evaluates the risks of the metaprocess and develops measures for known, existing risks. Data quality is also a highly critical success factor, especially in risk management, because – among other things – the validity of the results delivered by the internal model depends primarily on the data provided. The overriding goal of our data quality management is the sustainable improvement and safeguard-ing of data quality within the Hannover Re Group. Appropriate management of data quality risks is conditional upon clearly defined roles and associated responsibilities. Within the scope of process-integrated risk monitoring, centralised data qual-ity management is responsible for establishing and maintain-ing the system and in so doing has the authority to prescribe standards and methods.
Compliance risks are associated with the risk of breaches of standards and requirements, non-compliance with which may entail lawsuits or official proceedings with not inconsiderable detrimental implications for the business activities of the Han-nover Re Group. Regulatory compliance, compliance with the company’s Code of Conduct, data privacy and compliance with anti-trust and competition laws have been defined as issues of particular relevance to compliance. The compliance risk also includes tax and legal risks. Responsibilities within the compli-ance organisation are regulated and documented Group-wide and interfaces with risk management have been put in place. The set of tools is rounded off with regular compliance training programmes. For further information on compliance-related topics, including for example lawsuits, contingent liabilities and commitments, please see Sections 8.6 and 8.7, page 222.
We transact primary insurance business that complements our reinsurance activities in selected market niches. In so doing, just as on the reinsurance side, we always work together with partners from the primary sector – such as insurance brokers and underwriting agencies. This gives rise to risks associ-ated with such sales channels, although these are minimised through the careful selection of agencies, mandatory under-writing guidelines and regular checks.
Risks associated with the outsourcing of functions can result from such outsourcing of functions, services and / or organisa-tional units to third parties outside Hannover Re. Mandatory rules have been put in place to limit this risk; among other things, they stipulate that a risk analysis is to be performed prior to a material outsourcing. In the context of this analysis a check is carried out to determine, inter alia, what specific risks exist and whether outsourcing can even occur in the first place.
Fraud risks refer to the risk of intentional violations of laws or regulations by members of staff (internal fraud) and / or by externals (external fraud). This risk is reduced by the internal control system as well as by the audits conducted by Internal Auditing on a Group-wide and line-independent basis.
The proper functioning and competitiveness of the Hannover Re Group can be attributed in large measure to the expertise and dedication of our staff. In order to minimise personnel risks, we pay special attention to the skills, experience and motivation of our employees and foster these qualities through outstanding personnel development and leadership activities. Regular employee surveys and the monitoring of turnover rates ensure that such risks are identified at an early stage and scope to take the necessary actions is created.
Information technology risks and information security risks arise, inter alia, out of the risk of the inadequate integrity, con-fidentiality or availability of systems and information. By way of example, losses and damage resulting from the unauthor-ised passing on of confidential information, the malicious over-loading of important IT systems or from computer viruses are material to the Hannover Re Group. Given the broad spectrum of such risks, a diverse range of steering and monitoring meas-ures and organisational standards, including for example the requirement to conclude confidentiality agreements with ser-vice providers, have been put in place. In addition, our employ-ees are made more conscious of such security risks through practically oriented tools provided online in the intranet or by way of training opportunities.
When it comes to reducing business interruption risks, the paramount objective is the quickest possible return to nor-mal operations after a crisis, for example through implemen-tation of existing contingency plans. Guided by internation-ally accepted standards, we have defined the key framework conditions and – among other measures – we have assembled a crisis team to serve as a temporary body in the event of an emergency. The system is complemented by regular exercises and tests. Regular risk reporting to the Risk Committee and the Executive Board has also been put in place.

91
Com
bine
d m
anag
emen
t re
port
Hannover Re | Annual Report 2013
Other risks
Of material importance to our company in the category of other risks are primarily emerging risks, strategic risks, reputational risks and liquidity risks.
The hallmark of emerging risks is that the content of such risks cannot as yet be reliably assessed – especially on the under-writing side with respect to our treaty portfolio. Such risks evolve gradually from weak signals to unmistakable tenden-cies. It is therefore vital to detect these risks at an early stage and then determine their relevance. For the purpose of early detection we have developed an efficient process that spans divisions and lines of business and we have ensured its linkage to risk management. Operational implementation is handled by an expert working group assembled specially for this task. The analyses performed by this working group are used Group-wide in order to pinpoint any necessary measures (e.g. the imple-mentation of contractual exclusions or the development of new reinsurance products). By way of example, the risks arising out of the emergence of large cities and urban conurbations – so-called megacities – are analysed by this working group. The growth of such urban centres goes hand-in-hand with a host of different problems, including a growing demand for food, drinking water, energy and living space. These challenges may also have implications for our treaty portfolio – in the form not only of risks but also opportunities, e.g. through increased demand for reinsurance products. Climate change, nanotech-nology, political unrest, amendments to laws and changes in regulatory requirements may be cited as examples of other emerging risks.
Strategic risks derive from a possible imbalance between the corporate strategy of the Hannover Re Group and the con-stantly changing general business environment. Such an imbalance might be caused, for example, by incorrect stra-tegic policy decisions, a failure to consistently implement the defined strategies and business plans or an incorrect alloca-tion of resources. We therefore regularly review our corporate strategy in a multi-step procedure and adjust our processes and the resulting guidelines as and when required. We have defined performance criteria and indicators for the operational implementation of the strategic guidelines; these are authori-tative when it comes to determining fulfilment of the various targets. With the “Strategy Cockpit” the Executive Board and responsible managers have at their disposal a strategy tool that assists them with the planning, elaboration and management of strategic objectives and measures and safeguards their overall perspective on the company and its strategic risks. In addition, the process for the management of strategic risks is assessed annually as part of the monitoring of business process risks. Further details on the topic of strategy are provided in the sec-tion entitled “Our strategy” on page 16 et seq.
Reputational risks refer to the risk that the trust put in our company by clients, shareholders, employees or the public at large may be damaged. This risk has the potential to jeopard-ise the business foundation of the Hannover Re Group. A good corporate reputation is therefore an indispensable prerequisite for our core business as a reinsurer. Reputational risks may arise out of all business activities conducted by the Hannover Re Group. Reputational damage may be caused, inter alia, by a data mishap that becomes public knowledge, a serious case of fraud or financial difficulties on account of a technical risk. In addition to the risk identification methods already described, we use a number of different techniques for risk minimisation, such as our defined communication channels, a professional approach to corporate communications, tried and tested pro-cesses for specific crisis scenarios as well as our established Code of Conduct.
The liquidity risk refers to the risk of being unable to meet our financial obligations when they become due. The liquidity risk consists of the refinancing risk, i. e. the necessary cash cannot be obtained or can only be raised at increased costs, and the market liquidity risk, meaning that financial market transac-tions can only be completed at a poorer price than expected due to a lack of market liquidity. Core elements of the liquidity management of our investments are, in the first place, man-agement of the maturity structure of our investments on the basis of the planned payment profiles arising out of our techni-cal liabilities and, secondly, regular liquidity planning as well as the asset structure of the investments. Above and beyond the foreseeable payments, unexpected and exceptionally large payments may pose a threat to liquidity. Yet in reinsurance business significant events (major losses) are normally paid out after a lead time that can be reliably planned. As part of our liquidity management we have nevertheless defined asset holdings that have proven to be highly liquid – even in times of financial stress such as the 2008 financial crisis.
Our holdings of unrestricted German, UK and US government bonds as well as cash during the year under review were larger than possible disbursements for assumed extreme events, which means that our liquidity is assured even in the unlikely case of financial crises coinciding with an extreme event that needs to be paid out quickly. The liquid asset reserve stood at more than EUR 2.1 billion as at the balance sheet date. In addition, we manage the liquidity of the portfolio by checking on each trading day the liquidity of the instruments contained therein; their underlying parameters are verified on a regular and ad hoc basis. These measures serve to effectively reduce the liquidity risk.

92 Hannover Re | Annual Report 2013
Opportunity report
Speed is one of the qualities used to measure a successful knowledge transfer. Quick solutions and staying one step ahead of the competition is the name of the game. Hanno-ver Re searches systematically for new business opportunities in order to generate sustainable growth and strengthen the company’s profitable development. With a view to identifying opportunities and successfully translating ideas into business, Hannover Re adopts a number of closely related approaches in order to achieve holistic opportunistic and risk management. Of significance here is the interplay without overlaps of the various functions within opportunity and risk management, which is ensured by interfaces.
Key elements in Hannover Re’s opportunity management include its various market-specific innovations in the life and health and non-life reinsurance business groups (see page 120 et seq. of the Forecast). What is more, innovative and creative ideas are generated by our employees. If they can be suc-cessfully translated into additional profitable premium volume, such ideas are financially rewarded. Further elements are the “Future Radar” initiative and the working group on “Emerging Risks and Scientific Affairs”. Not only that, Hannover Re has set up a stand-alone organisational unit for “Business Oppor-tunity Management”. This service unit deals exclusively and systematically with ideas and opportunities and it concentrates its activities on generating additional premium volume with profit potential. In this context, among other things, ideas on business opportunities are refined and optimal framework con-ditions for fresh commercial ideas are put in place.
The “Future Radar” initiative, the members of which cut across divisions and hierarchies, picks up on a broad range of topics and arrives at initial business approaches. The working group is tasked with evaluating trends and issues of the future. This includes, for example, increasing fluctuations in the weather, obstacles to the turnaround in energy policy, greater scarcity of resources, developments in the health market or cybercrime.
CybercrimeThe trend analysis carried out by the “Future Radar” initiative anticipates, among other things, a sharp increase in cybercrime. Going forward, malware is expected to become much more common on smart-phones and tablet PCs. There is also a risk that in future physical targets (e.g. power plants, electricity grids or communication networks in the banking and finance sector) may be targeted more heavily via the information and communication infrastructure.
In general terms, attractive business opportunities are analysed prospectively by the “Future Rader” in order to translate them, as a second step, into marketable insurance and reinsurance products. For this purpose, concrete topics are examined by cross-divisional and interdisciplinary teams and potential busi-ness approaches are elaborated. The analyses carried out in the “Future Rader” encompass not only topics of the future but also the steps taken by competitors to identify business opportunities and niche markets at an early stage.
These business approaches are subsequently evaluated and given concrete shape by the Opportunity Management service unit. This unit also supports selected projects from the concep-tual design of integrated business models to their operational implementation or until their handover to line responsibility. The goal is to generate new business and thereby sustainably foster Hannover Re’s profitable growth. Since the unit was set up several initiatives and projects have evolved out of the roughly 100 ideas developed by the worldwide network. Under an attractive employee incentive system various project groups have already been financially rewarded, including those work-ing on the opportunity management projects “Weather” and “Energy Savings Protect” (“Energie Einspar Protect = EEP”):
Business opportunity management project “Weather”The goal was to offer a clientele heavily dependent on the weather industry-specific solutions to protect against weather fluctuations. The interest shown by customers in this product has grown sharply of late on account of greater variability in weather conditions and the higher profile of the product.
Business opportunity management project “Energy Savings Protect”This project was tasked with developing covers for so-called energy-savings warranties in Germany. This insurance solution enables providers of energy effi-ciency solutions to take out protection in the event that the promised energy savings fail to materialise. In this case the company in question receives a compensatory payment from the primary insurer. For its part, Hanno-ver Re covers the energy saving warranties of its pri-mary insurance clients.
Since 2010 the stand-alone service unit Business Opportunity Management has been assigned to the Chief Executive Offic-er’s area of responsibility – a reflection of the considerable importance that Hannover Re attaches to business opportu-nity management.

93
Com
bine
d m
anag
emen
t re
port
Hannover Re | Annual Report 2013
In view of the diverse range of potential future opportunities, close links exist with other projects, working groups and bod-ies, such as with the working group on “Emerging Risks und Scientific Affairs” in regard to emerging risks and opportuni-ties (see page 91 “Other risks”). The working group carries out qualitative assessments of emerging risks. As a result, however, not only are the potential risks analysed but also any available business opportunities. In the year under review, for example, issues such as fracking and the repercussions of protracted heatwaves were explored by the working group.
Protracted heatwavesProtracted heatwaves have repercussions on many areas of daily life. While the most well-known impacts are on agriculture and health, the consequences for industry, transportation, power and water supplies and the environment – with the associated heavy financial strains – also need to be borne in mind.
If a business idea is translated into reality and a new reinsur-ance product results, the normal procedure – provided the cri-teria defined for this purpose by Risk Management are appli-cable – is to work through the so-called new product process. This process is supported by Risk Management at Hannover Re. The process is always worked through if a contractual com-mitment is to be entered into in a form previously not used by Hannover Re or if the exposure substantially exceeds the exist-ing scope of coverage. If this is the case, all material internal and external influencing factors are examined beforehand (e.g. implications for the overall risk profile or the risk strategy). In so doing, Risk Management ensures that before it can be used or sold a new reinsurance product must be approved by the Executive Board.
The opportunity management process can be illustrated in sim-plified form as follows:
Product launch under line responsibility
Corporate strategyOur mission: “Growing Hannover Re profitably”
Trends Ideas Future factors Soft signals
Handover to line responsibility
Analysis
Concrete specification
Assessment
Risk assessment in the context of the “New Product
Process”, as appropriate

94 Hannover Re | Annual Report 2013
Overall assessment by the Executive Board
We are convinced that our risk management affords us a trans-parent overview of the current risk situation at all times, that our overall risk profile is appropriate and that our business opportunity management plays an important part in Hanno-ver Re’s profitable growth. Based on our currently available insights arrived at from a holistic analysis of the opportunities and risks, the Executive Board of Hannover Re cannot discern any risks that could jeopardise the continued existence of the Hannover Re Group in the short or medium term or have a material and lasting effect on its assets, financial position or net income.
As an internationally operating reinsurance group, we move in a highly complex environment. Nevertheless, thanks to our business activities in all lines of reinsurance we are able to achieve optimal risk spreading through geographical and risk-specific diversification while at the same time maintain-ing a balanced opportunity / risk profile. We consider the risks described in the above sections to be manageable, particularly because our steering and monitoring measures are effectively and optimally interlinked. Despite these diverse mechanisms, individual and especially accumulation risks can decisively affect our assets, financial position and net income. In accord-ance with our understanding of risk, however, we consider not only risks but also at the same time opportunities. We therefore only enter into those risks that go hand-in-hand with opportunities.
Our steering and monitoring tools as well as our organisational and operational structure ensure that we identify risks at an early stage and are able to act on our opportunities. Our central monitoring tool is the system of risk management that we have installed Group-wide, which brings together both qualitative and quantitative information for the purpose of effective risk monitoring. Most notably, the interplay between domestic and foreign risk management functions affords us a holistic and Group-wide overview.
Our own evaluation of the manageability of existing risks is confirmed by various financial indicators and external assess-ments. Key monitoring indicators, reporting limits and potential escalation steps are defined on a mandatory basis in our cen-tral system of limits and thresholds for the material risks of the Hannover Re Group. As a result, the system provides us with a precise overview of potentially undesirable developments in the defined risk tolerances and enables us to react in a timely manner. One testament to our financial stability, for example,
is the growth of our shareholders’ equity. Since 2008 we have been able to increase our total policyholders’ surplus (hybrid capital, non-controlling interests and shareholders’ equity) by more than 86%. In this context, the necessary equity resources are determined by the requirements of our economic capital model, solvency regulations, the assumptions of rating agen-cies with respect to our target rating and the expectations of our clients and shareholders. This increase gives us a sufficient capital buffer to be able both to absorb risks and act on busi-ness opportunities that may arise.
Similarly, our very good ratings (see page 57) also testify to our financial stability. The quality of our Enterprise Risk Manage-ment (ERM) is evaluated separately by Standard & Poor’s. In the year under review Standard & Poor’s gave our risk manage-ment its highest possible grade of “very strong”. Most nota-bly, our established risk culture promotes the development of appropriate risk monitoring systems and strategic risk manage-ment. The evaluation encompasses above all the areas of risk culture, risk controls, the management of emerging risks, risk models and strategic risk management. This external appraisal confirms the quality of our holistic approach to risk manage-ment. We would also refer to the explanatory remarks on the financial strength ratings of our subsidiaries in the “Financial position and net assets” section of the management report. In addition, the risk trigger mechanism and internal monitoring system are reviewed annually by the independent auditor. The Group-wide risk management system is also a regular part of the audits conducted by the internal audit function.
For additional information on the opportunities and risks asso-ciated with our business please see the Forecast on page 118 et seq. as well as Section 8.11 “Events after the balance sheet date” on page 224.

95
Com
bine
d m
anag
emen
t re
port
Hannover Re | Annual Report 2013
Enterprise management
Declaration on Corporate GovernanceDeclaration of the Executive Board regarding the Corporate Governance of the Company as defined by § 289a Para. 1 Com-mercial Code (HGB):
German Corporate Governance Code
In the previous year Hannover Re was not in compliance with three recommendations of the German Corporate Gov-ernance Code (DCGK); this year, the company’s implementa-tion of the recommendations of the Code as amended 13 May 2013 diverges from the recommendations in four respects. The recommendations in question are that a cap on severance payments should be included when concluding or renewing a management board contract (Code Item 4.2.3 Para. 4), that the Chairman of the Supervisory Board should not chair the Audit Committee (Code Item 5.2 Para. 2) and that the Chairman of the Audit Committee should be independent (Code Item 5.3.2). Purely as a precautionary measure, a divergence from the rec-ommendation contained in Code Item 4.2.3 Para. 2 regard-ing caps on the amount of variable compensation elements in management board contracts has been declared. The reasons for these divergences are set out in the following Declaration of Conformity pursuant to § 161 Stock Corporation Act (AktG). The present and all previous Declarations of Conformity of the company are published on its website (http://www.hannover-re.com / about / corporate / declaration / index.html).
Declaration of Conformity
pursuant to § 161 Stock Corporation Act (AktG) regarding com-pliance with the German Corporate Governance Code at Han-nover Rück SE:
The German Corporate Governance Code sets out major statu-tory requirements governing the management and supervision of German listed companies. It contains both nationally and internationally recognised standards of good and responsi-ble enterprise management. The purpose of the Code is to foster the trust of investors, clients, employees and the gen-eral public in German enterprise management. Under § 161 Stock Corporation Act (AktG) it is incumbent on the Manage-ment Board and Supervisory Board of German listed compa-nies to provide an annual declaration of conformity with the recommendations of the “German Corporate Governance Code Government Commission” published by the Federal Ministry of Justice or to explain which recommendations of the Code were / are not applied.
The Executive Board and Supervisory Board declare pursuant to § 161 Stock Corporation Act (AktG) that in its implementation of the German Corporate Governance Code Hannover Rück SE diverges in four respects from the recommendations contained in the version of the Code dated 13 May 2013:
Code Item 4.2.3 Para. 2; Caps on the amount of variable com-pensation elements in management board contracts
The variable compensation of the members of the Executive Board consists of a cash component and payments into a bonus bank as well as – accounting for 20% of the total variable compensation – the automatic allocation of virtual Hannover Re share awards. The number of share awards allocated is determined by dividing the amount of the 20% variable com-pensation by the average share price of the Hannover Re share on the five trading days before and five trading days after the Annual General Meeting for the allocation year in question.
This means that upon allocation of the share awards the expense accruing to the company on this variable compen-sation element is fixed (capped) at the time of allocation. In economic terms, these virtual share awards constitute a com-pulsory investment by the members of the Executive Board in the Hannover Re share that is geared to a holding period of four years. This compulsory investment thus appropriately takes into account both positive and negative developments at the company as reflected in the share price.
These share awards are paid out after a vesting period of four years according to the share price of the Hannover Re share applicable at the payment date plus an amount equivalent to the total dividends per share distributed during the vesting period. The virtual share awards thus follow the economic fortunes of physically awarded real shares.
Should the share price at the time of exercise be higher than the share price at the time of allocation, the resulting addi-tional expenditure for the company can be neutralised by way of appropriate safeguards.
Insofar as the delivery of real shares for retention by the Execu-tive Board members is granted with a resale lock-up period as part of the variable compensation, a cap is normally only pro-vided for with respect to the granting of shares (i. e. at the time of allocation) and not at the time of exercise, which is at the discretion of the recipient once the lock-up period has expired.

96 Hannover Re | Annual Report 2013
The virtual share awards of Hannover Re have a cap at the time of allocation and a time of exercise set by the company after four years. Given the safeguards put in place by the company, we consider a further cap at the time of exercise – especially in light of the desired economic identity of compulsory invest-ments in virtual and real shares – to be unnecessary. As a pre-caution, however, the company is declaring a divergence from Code Item 4.2.3 Para. 2.
Code Item 4.2.3 Para. 4; Caps on severance payments in man-agement board contracts
Premature termination of a service contract without serious cause may only take the form of cancellation by mutual con-sent. Even if the Supervisory Board insists upon setting a sev-erance cap when concluding or renewing an Executive Board contract, this does not preclude the possibility of negotiations also extending to the severance cap in the event of a member leaving the Executive Board. In addition, the scope for nego-tiation over a member leaving the Executive Board would be restricted if a severance cap were agreed, which could be par-ticularly disadvantageous in cases where there is ambiguity surrounding the existence of serious cause for termination. In the opinion of Hannover Rück SE, it is therefore in the interest of the company to diverge from the recommendation contained in Code Item 4.2.3 Para. 4.
Code Item 5.2 Para. 2; Chairman of the Audit Committee
The current Chairman of the Supervisory Board of Hannover Rück SE served as the company’s Chief Financial Officer in the period from 1994 to 2002. During this time he acquired superb knowledge of the company and he is equipped with extensive professional expertise in the topics that fall within the scope of responsibility of the Finance and Audit Committee. With this in mind, the serving Chairman of the Supervisory Board is optimally suited to chairing the Audit Committee. In the opinion of Hannover Rück SE, it is therefore in the interest of the company to diverge from the recommendation contained in Code Item 5.2 Para. 2.
Code Item 5.3.2; Independence of the Chairman of the Audit Committee
The current Chairman of the Audit Committee is at the same time also the Chairman of the Board of Management of the con-trolling shareholder and hence cannot, in the company’s legal assessment, be considered independent. As already explained above in the justification for divergence from Code Item 5.2 Para. 2, the current Chairman of the Supervisory Board is, however, optimally suited to chairing the Audit Committee. This assessment is also not cast into question by the fact that the Committee Chairman cannot therefore be considered inde-pendent within the meaning of the German Corporate Govern-ance Code. Furthermore, since his service as Chief Financial Officer of Hannover Rück SE already dates back ten years, it
is also the case that the reviews and checks performed by the Finance and Audit Committee no longer relate to any period in which he himself was still a member of the Executive Board or decisions initiated by him as a member of the Executive Board were still being realised. In the opinion of Hannover Rück SE, it is therefore in the interest of the company to diverge from this recommendation contained in Code Item 5.3.2.
We are in compliance with all other recommendations of the Code.
Hannover, 4 November 2013
Executive Board Supervisory Board
Statement of enterprise management practices
Hannover Re’s objective continues to be the consolidation and further expansion of its position as one of the leading, glob-ally operating reinsurance groups of above-average profita-bility. Through our worldwide presence and activities in all lines of reinsurance we achieve an optimal risk diversification while maintaining a balanced risk / opportunity profile. Profit and value creation constitute the foundation of our sustain-able development in the interests of our clients, shareholders, employees and business partners. Our goal is to increase the IFRS net income before and after tax as well as the value of the company – including dividends paid – by a double-digit margin every year. We consider the organic growth of our business volume, which exceeds the growth of the reinsurance market over the long term, to be a crucial success factor in this regard. This does not preclude temporary losses of market share. We offer our shareholders the prospect of a sustained above-average return on their capital. Consequently, we strive for an IFRS return on equity that is at least 750 basis points above the risk-free interest rate and a share price performance that beats the weighted Global Reinsurance Index over a roll-ing three-year period. When it comes to our staff, we pay special attention to their skills, experience and motivation, which we foster through our attractive workplaces, personnel development activities and leadership practices. Based on our strategic human resources planning, we align the size and qualifications of our workforce with the current and future requirements of our global market presence. We put our trust in the greatest possible delega-tion of tasks, authorities and responsibility and thereby estab-lish the conditions needed to be able to respond quickly and flexibly. We lead on the basis of Management by Objectives, we enable our employees to participate in our sustained suc-cess and we expect our managers to encourage the self-reli-ance of their staff (http://www.hannover-re.com / about / strat-egy / index.html).

97
Com
bine
d m
anag
emen
t re
port
Hannover Re | Annual Report 2013
Corporate Governance
We support sensible and pragmatic Corporate Governance principles and recognise their central importance in guid-ing our activities. The principles of responsible and good enterprise management constitute the core of our Cor-porate Governance principles, which were extensively revised in the year under review (http://www.hannover-re.com / resources / cc / generic / CGprinciples-e.pdf). Our efforts are intended to ensure integrity at all times in our dealings with business partners, staff, shareholders and other stake-holder groups. On this basis Hannover Re supports the prin-ciples of value-based and transparent enterprise management and supervision as defined in the German Corporate Govern-ance Code (DCGK). The Supervisory Board, Executive Board and employees of Hannover Rück SE identify with these prin-ciples, which are aligned with the German Corporate Govern-ance Code. The Executive Board ensures that the principles are observed Group-wide.
This is not contradicted by the fact that in the year under review we again did not comply with some recommendations of the Code, since a well justified deviation from the recommendations of the Code may – as in the present case – be in the interests of good corporate governance (cf. Foreword to the DCKG). Based on what is still a high degree of fulfilment of the recommendations and suggestions of the DCGK, Hannover Re continues to rank very highly among the companies listed on the DAX and MDAX.
In 2010 the Supervisory Board had set out in its Rules of Proce-dure the goal of increasing the number of women on the Super-visory Board to at least two (at the time no women were repre-sented on the body). This goal was accomplished in 2012 and in 2013 – with three female members of the Supervisory Board – it was actually surpassed. In addition, for the first time one of the members of the Supervisory Board’s Nomination Committee is a woman. The Supervisory Board again considered the concept for the advancement of women that had been implemented in 2012 and was informed of the progress that had been made. The primary objective of this concept is to foster promising young female professionals through a variety of measures and to enlarge the proportion of women in management positions. Considerable energy was once again devoted to the issue of sustainability. The aim here is to achieve commercial success on the basis of a solid business model in accordance with the needs of our staff and the company as well as with an eye to protecting the envi-ronment and conserving natural resources. We strive to reduce as far as possible the greenhouse gas emissions produced by our day-to-day business activities in order to come closer to reaching our goal of carbon neutrality. In so doing, we are demonstrably taking responsibility for a sustainable future. In 2011 we defined for the first time a concrete Sustainability Strategy setting out our primary objectives in this field. Not only that, in the year under review we again presented our Sustainability Report in the form of a so-called “GRI Report”. Further information on the topic of sustainability is provided on our website (www.hannover-re.com / sustainability / index.html).
Compliance
In addition to our Corporate Governance principles, the Code of Conduct was also revised in 2013 (http://www.hannover-re.com / resources / cc / generic / codeofconduct-e.pdf). Comple-menting our corporate strategy and the Corporate Governance principles, it establishes rules governing integrity in the behav-iour of all employees of Hannover Re and is intended to help members of staff cope with the ethical and legal challenges that they face as part of day-to-day work. The rules defined in the Code of Conduct reflect the high ethical and legal standards that guide our actions worldwide. It is our belief that integ-rity in dealings with our stakeholders constitutes the founda-tion of a successful enterprise. In both our strategic planning and our day-to-day business activities, we therefore aspire to consistently apply the highest ethical and legal standards; for our actions and the way in which every single one of us pre-sents and conducts himself or herself are crucial in shaping the image of the Hannover Re Group.
The compliance report for the 2012 calendar year was sub-mitted to the Finance and Audit Committee in March 2013. The report for the 2013 calendar year will be presented in March 2014. The reporting sets out the structure and diverse range of activities of Hannover Re in this regard. After in-depth examination of topics such as directors’ dealings, ad hoc and other reporting requirements, the insider register, adherence to internal guidelines, consulting agreements, data protection, international sanctions and the Group-wide whistleblower sys-tem, the report concludes that only a few circumstances have been identified which point to breaches of relevant compliance standards. After detailed exploration of these incidents, the necessary safeguards were put in place to ensure that such breaches do not occur again in the future.
Risk monitoring and steering
The risk management system applicable throughout the entire Hannover Re Group is based on the risk strategy, which in turn is derived from the company strategy. A core component is the systematic and comprehensive recording of all risks that from the current standpoint could conceivably jeopardise the com-pany’s profitability and continued existence. Further details in this regard may be obtained from the risk report contained in the Annual Report on page 70 et seq.
Working practice of the Executive Board and Supervisory Board
The Executive Board and Supervisory Board of Hannover Re work together on a trusting basis to manage and monitor the company. In accordance with the Rules of Procedure of theExecutive Board, matters of fundamental importance require the consent of the Supervisory Board. In addition, the Super-visory Board is kept informed on a regular and timely basis
98 Hannover Re | Annual Report 2013
of the business development, the execution of strategic deci-sions, material risks and planning as well as relevant compli-ance issues. The Chairman of the Supervisory Board stays in regular contact with the Chairman of the Executive Board in order to discuss with him significant business occurrences. The composition of the Executive Board (including areas of responsibility) as well as of the Supervisory Board and its com-mittees is set out on pages 6 and 233 respectively of the pre-sent Annual Report. The Rules of Procedure of the Executive Board are intended to ensure that a consistent business policy is elaborated and implemented for the company in accordance with its strate-gic objectives. Within the framework of a consistent business policy, the principle of “delegation of responsibility” enjoys special status. In the interests of shareholders, importance is expressly attached to an organisation that facilitates cost-effective, quick and unbureaucratic decision processes. Open and trusting cooperation geared to the interest of the whole is the foundation of success. In this context, the members of the Executive Board bear joint responsibility for the overall man-agement of business. Irrespective of their overall responsibility, each member of the Executive Board leads their own area of competence at their individual responsibility within the bounds of the resolutions adopted by the Executive Board. Only per-sons under the age of 65 may be appointed to the Executive Board. The term of appointment shall be determined such that it expires no later than the end of the month in which the mem-ber of the Executive Board turns 65. The Supervisory Board takes account of diversity considerations in the composition of the Executive Board.
The Rules of Procedure of the Supervisory Board provide inter alia that each member of the Supervisory Board must have the knowledge, skills and professional experience required for orderly performance of their tasks and that the Supervisory Board must have a sufficient number of independent mem-bers. Currently, four of the six shareholder representatives are independent as defined by Item 5.4.2 of the German Corporate Governance Code. At least one independent member shall have technical expertise in the fields of accounting and the audit-ing of financial statements. Persons suggested to the Annual General Meeting as candidates for election to the Supervisory Board may not be older than 72 at the time of their election. Nominations shall take account of the company’s international activities as well as diversity. For their part, each member of the Supervisory Board shall ensure that they have sufficient time to discharge their mandate. The Supervisory Board meets at least twice each calendar half-year. If a member of the Super-visory Board participates in less than half of the meetings of the Supervisory Board in a financial year, this shall be noted in the Supervisory Board’s report. No more than two former members of the company’s Executive Board may belong to the Supervisory Board.
In 2012 the Supervisory Board carried out another regularly scheduled audit of the effectiveness of its work. An extensive questionnaire addressed, among other aspects, issues such as the organisation of the Supervisory Board and the conduct of meetings, the cooperation between the Executive Board and the Supervisory Board and the supply of information to the Supervisory Board. The findings were explained and discussed at the first Supervisory Board meeting of 2013. They resulted, among other things, in meeting documents being made avail-able to the Supervisory Board members in an “Electronic Board Room” as part of the efficient provision of information.
The committees of the Supervisory Board prepare the decisions of the Supervisory Board within their area of competence and take decisions in lieu of the Supervisory Board within the scope of competence defined by the Rules of Procedure applicable to the committee in question.
The Finance and Audit Committee monitors the accounting process and the effectiveness of the internal control system, the risk management system and the internal auditing system. It also handles issues relating to compliance and the informa-tion system for the Supervisory Board and discusses the interim reports as well as the semi-annual reports prior to their publi-cation. It prepares the Supervisory Board’s examination of the annual financial statement, management report and proposal for the appropriation of profit as well as of the consolidated financial statement and Group management report. In this con-text, the Finance and Audit Committee receives detailed infor-mation on the auditor’s view of the net assets, financial position and results of operations as well as explanations of the effects of any modified recognition and measurement principles on the net assets, financial position and results of operations together with available alternatives. In addition, the committee prepares the Supervisory Board’s decision on the commissioning of the independent auditor for the financial statements. It considers matters associated with the necessary independence of the auditor, the awarding of the audit mandate to the independ-ent auditor, the determination of the audit concentrations and the fee agreement.
The Standing Committee prepares personnel decisions for the Supervisory Board and decides in lieu of the Supervisory Board on the content, formation, amendment and termination of con-tracts of service with the members of the Executive Board with the exception of matters of remuneration-related content and their implementation. It bears responsibility for the granting of loans to the group of persons specified in §§ 89 Para. 1, 115 Stock Corporation Act and those considered equivalent pursuant to § 89 Para. 3 Stock Corporation Act as well as for the approval of contracts with Supervisory Board members in accordance with § 114 Stock Corporation Act. It exercises the powers arising out of § 112 Stock Corporation Act in lieu of the Supervisory Board and – in cooperation with the Executive Board – ensures that long-term succession planning is in place.

99
Com
bine
d m
anag
emen
t re
port
Hannover Re | Annual Report 2013
The Nomination Committee is tasked with proposing to the Supervisory Board appropriate candidates for the nominations that it puts forward to the Annual General Meeting for election to the Supervisory Board.
For further details of the activities of the Supervisory Board committees please see the explanations provided in the Super-visory Board Report on pages 230 to 232.
Information regarding the following items is provided in the remuneration report:
• Remuneration report for the Executive Board and disclo-sure of the remuneration received by Supervisory Board members pursuant to Items 4.2.5 and 5.4.6 of the German Corporate Governance Code,
• Securities transactions pursuant to Item 6.6 of the German Corporate Governance Code,
• Shareholdings pursuant to Item 6.6 of the German Corpo-rate Governance Code.
Information on share-based payment pursuant to Item 7.1.3 of the German Corporate Governance Code is provided in Section 8.3 of the notes “Share-based payment”, page 217 et seq., and in the remuneration report with respect to the members of the Executive Board.
Remuneration report
The remuneration report summarises the principles used to determine the remuneration of the Executive Board of Han-nover Rück SE and explains the structure, composition and amount of the components of the remuneration received by the Executive Board in the 2013 financial year on the basis of the work performed by the Board members for Hannover Rück SE and companies belonging to the Group.
In addition, the amount of remuneration paid to the Supervisory Board on the basis of its work for Hannover Rück SE and com-panies belonging to the Group as well as the principles accord-ing to which this remuneration is determined are described; we also explain the principles on which the remuneration for managers below the level of Executive Board is based.
The remuneration report is guided by the recommendations of the German Corporate Governance Code and contains infor-mation which forms part of the notes to the 2013 consolidated financial statement as required by IAS 24 “Related Party Dis-closures”. Under German commercial law, too, this informa-tion includes data specified as mandatory for the notes (§ 314 HGB) and the management report (§ 315 HGB). These details are discussed as a whole in this remuneration report and pre-sented in summary form in the notes.
The provisions of the Act on the Adequacy of Management Board Remuneration (VorstAG) and of the Insurance Supervi-sion Act in conjunction with the Regulation on the Supervisory Law Requirements for Remuneration Schemes in the Insurance Sector (VersVergV) have been observed. In addition, we took into account the more specific provisions of DRS 17 (amended 2010) “Reporting on the Remuneration of Members of Gov-erning Bodies”.
Remuneration of the Executive Board
Responsibility The Standing Committee decides on the content, formation, modification and cancellation as well as termination of ser-vice contracts with the members of the Executive Board. A full meeting of the Supervisory Board determines all remuneration-related matters of content for the Executive Board of Hannover Rück SE and regularly reviews the remuneration structure and the adequacy of the remuneration system for the members of the Executive Board.
Objective, structure and system of Executive Board remunerationThe total remuneration of the Executive Board and its split into fixed and variable components conform to regulatory require-ments – especially the provisions of the Act on the Adequacy of Management Board Remuneration (VorstAG) and the Regula-tion on the Supervisory Law Requirements for Remuneration Schemes in the Insurance Sector (VersVergV).
The amount and structure of the remuneration of the Executive Board are geared to the size and activities of the company, its economic and financial position, its success and future pros-pects as well as the customariness of the remuneration, making reference to the benchmark environment (horizontal) and the remuneration structure otherwise applicable at the company (vertical). The remuneration is also guided by the tasks of the specific member of the Executive Board, his or her individual performance and the performance of the full Executive Board.
With an eye to these objectives, the remuneration system has two components: fixed salary / non-cash compensation and var-iable remuneration. The variable remuneration is designed to take account of both positive and negative developments. Overall, the remuneration is to be measured in such a way that it reflects the company’s sustainable development and is fair and competitive by market standards. In the event of 100% goal attainment the remuneration model provides for a split into roughly 40% fixed remuneration and roughly 60% vari-able remuneration.

100 Hannover Re | Annual Report 2013
Fixed remuneration (approx. 40% of total remuneration upon 100% goal attainment)
Measurement basis and payment procedures for fixed remuneration
Components Measurement basis /
parametersCondition of payment Paid out
Basic remuneration;
Non-cash compensation,fringe benefits:Accident, liability and luggage insurance, company car for business and personal use (tax on the pecuniary advantage pay-able by the Board member), re-imbursement of travel expenses and other expenditures incurred in the interest of the company
Function,responsibility,length of service on the Executive Board
Remuneration reviewed by the Supervisory Board normally at two-year intervals.
Contractual stipulations 12 equal monthly instalments
Variable remuneration (approx. 60% of total remuneration upon 100% goal attainment)The profit- and performance-based remuneration (variable remuneration) is contingent on certain defined results and the attainment of certain set targets. The set targets vary according to the function of the Board member in question. The variable remuneration consists of a profit bonus and a performance bonus.
The variable remuneration is defined at the Supervisory Board meeting that approves the consolidated financial statement for the financial year just ended.
The following chart summarises the make-up of the variable remuneration components. For details of measurement and pay-ment procedures please see the two tables following the chart.

101
Com
bine
d m
anag
emen
t re
port
Hannover Re | Annual Report 2013
Overview of the composition of variable remuneration
Upon 100% goal attainment
Approx. 40% fixed remuneration Approx. 60% variable remuneration
Variable remuneration as per regulatory requirements
Cash 3
Annually (60%)
Bonus bank 3
3 years (20%)
HR share awards 3
4 years (20%)
Payment procedure
Timing of payment
Payment of variable remuneration
Profit bonus (50 – 70%)1
Group RoEover the last 3 years
Performance bonus (30 – 50%)1
Personal and business group targets (IVC) 2
for the financial year
Goals according to area of Board responsibility
Indicator for perfor-mance measurement
Measurement (variable remuneration)
1 Chief Executive Officer / Chief Financial Officer 70% profit bonus, 30% performance bonus (personal targets); all other Board members: 50% profit bonus, 50% performance bonus (25% personal targets / 25% business group targets)
2 An instrument of value-based management used to measure the attainment of long-term goals on the level of the Group, business groups and operational units
3 Split defined by legal minimum requirements

102 Hannover Re | Annual Report 2013
Measurement bases / conditions of payment for variable remuneration
Component Measurement basis / parameters Condition of payment
Profit bonus
Proportion of variable remu-neration:Chief Executive Officer / Chief Financial Officer: 70%;Board members except for Chief Executive Officer / Chief Financial Officer: 50%
The profit bonus is dependent on the risk-free interest rate and the average Group return on equity (RoE) of the past three financial years.
An individually determined and contractually defined basic amount is paid for each 0.1 percentage point by which the RoE of the past three financial years exceeds the risk-free interest rate of 2.8%. Goal attainment of 100% corresponds to an RoE of 11.6%. Goal attain-ment can amount to a maximum of 200% and a minimum of -100%.
The IFRS Group net income (excluding non-controlling interests) and the arithmetic mean of the IFRS Group shareholders’ equity (excluding non-controlling interests) at the beginning and end of the financial year are used to calculate the RoE.
The risk-free interest rate is the average market rate for 10-year German government bonds over the past 5 years and is set at an agreed level of 2.8%. The arrangements governing the profit bonus may be adjusted if the risk-free interest rate of 2.8% changes to such an extent that an (absolute) deviation of at least one percent-age point arises.
Contractual stipulations
Attainment of three-year targets
Decision of the Supervisory Board

103
Com
bine
d m
anag
emen
t re
port
Hannover Re | Annual Report 2013
Component Measurement basis / parameters Condition of payment
Performance bonusThe performance bonus for the Chief Executive Officer and the Chief Financial Officer is arrived at from individual qualitative and, as appropriate, quantitative targets defined annually by the Supervisory Board that are to be accomplished in the subsequent year. For members of the Executive Board with responsibility for a certain business group, the performance bonus consists in equal parts of the business group bonus and the individual bonus.
Business group bonusProportion of variable remu-neration: Board members except for Chief Executive Officer / Chief Financial Officer: 25%
Resolution by the Supervisory Board of 6 March 2013 regarding the reorganisation of the business group bonus from the 2013 financial year onwards:
The basis for the business group bonus is the return generated on the capital allocated to the business group in the respective 3-year period just ended (RoCa = Return on Capital allocated).
An individually determined amount specified in the service contract is calculated for each 0.1 percentage point by which the average 3-year RoCa exceeds the level of 0%.
A RoCa of 9.1% corresponds to goal attainment of 100%. Allowing for the planned cost of capital, this level corresponds to a return which is above the planned cost of capital and hence constitutes positive intrinsic value creation (IVC 1).
Goal attainment can amount to a maximum of 200% and from 2015 onwards a minimum of -100%.
The method used to calculate the IVC as a basis for determining the business group performance is checked by independent experts.
The business group bonus is determined by the Supervisory Board according to its best judgement. The determination also takes into account, in particular, the contribution made by the business under the responsibility of the Board member concerned to the achieved business group performance and the relative change in the average IVC in the remuneration year. The Supervisory Board may make ad-ditions to or deductions from the arithmetically calculated values at any time in the event of over- or underfulfilment of the criteria.
Special arrangements for 2013 and 2014: the basis for the average RoCa is the business group performance from 2013 onwards; the minimum business group bonus is EUR 0.
Attainment of three-year targets (basis for 2013 and 2014: business group performance from 2013 onwards)
Contractual agreement
Decision of the Supervisory Board according to its best judgement
Individual bonusProportion of variable remuner-ation: Chief Executive Officer / Chief Financial Officer: 30%; Board members except for Chief Executive Officer / Chief Finan-cial Officer: 25%
Personal qualitative, quantitative targets; individual contribution to the overall result, leadership skills, innovative skills, entrepreneurial skills, specific features of area of responsibility;
The individual bonus for goal attainment of 100% is contractually stipulated. Over- and underfulfilment result in additions / deductions.
The minimum individual bonus amounts to EUR 0 and the maximum is double the bonus payable upon complete goal attainment.
Attainment of annual targets
Decision by the Supervisory Board according to its best judgement.
1 An instrument of value-based management used to measure the attainment of long-term goals on the level of the Group, business groups and operational units (see also page 24 “Management system”).

104 Hannover Re | Annual Report 2013
Payment procedures for the total variable remuneration
Of the total amount of defined variable remuneration, a partial amount of 60% is paid out in the month following the Super-visory Board meeting that approves the consolidated financial statement. The remaining amount of 40% is initially withheld as explained below with a view to encouraging long-term value creation:
Short-term Medium-term Long-term
60% of the variable remunera-tion with the next monthly salary paymentfollowing the Supervisory Board resolution
20% of the variable remuneration in the bonus bank;
withheld for 3 years;
the positive amount contributed 3 years prior to the payment date is available for payment, provided this does not exceed the balance of the bonus bank in light of credits / debits up to and including those for the financial year just ended;
an impending payment not covered by a posi-tive balance in the bonus bank is omitted;
a positive balance in the bonus bank is carried forward to the following year after deduction of any payment made; a negative balance is not carried forward to the follow-ing year;
loss of claims due from the bonus bank in special cases: resignation from office without a compelling reason; contract extension on the same conditions is rejected;
no interest is paid on credit balances.
Automatic granting of virtual Hannover Re share awards (HR-SAs) with a value equivalent to 20% of the variable remuneration;
payment of the value calculated at the payment date after a vesting period of four years;
value of the share on awarding / payment: unweighted arithmetic mean of the Xetra closing prices five trading days before to five trading days after the meeting of the Supervisory Board that approves the consolidated financial statement;
additional payment of the sum total of all dividends per share paid out during the vesting period;
changes in a cumulative amount of 10% or more in the value of the HR-SAs caused by structural meas-ures trigger an adjustment;
the Board member has no entitlement to the delivery of shares.
Negative variable total bonus = payment of EUR 0 variable remuneration.Any minus value of the variable total bonus for a financial year is transferred in full to the bonus bank (see “Medium-term” column).

105
Com
bine
d m
anag
emen
t re
port
Hannover Re | Annual Report 2013
Handling of payment of variable remuneration components in special casesIn the event of voluntary resignation or termination / dismissal by the company for a compelling reason or if an offered con-tract extension on the same conditions (exception: the mem-ber of the Executive Board has reached the age of 60 and has served as a member of the Executive Board for two terms of office) is declined, all rights to payment of the balances from the bonus bank and from the HR-SAs are forfeited.
If the contractual relationship ends normally prior to the end of the vesting period for the bonus band or HR-SAs, and if a contract extension is not offered, the member of the Execu-tive Board retains his entitlements to payment from the bonus bank – making reference to a defined forward projection of the bonus bank – and for already awarded HR-SAs.
All claims to the allocation of amounts to the bonus bank and / or awarding of HR-SAs after leaving the company are excluded. In cases where an individual leaves the company because of non-reappointment, retirement or death this shall not apply with respect to claims to variable remuneration acquired (pro rata) in the final year of the Board member’s work for the company.
Variable remuneration under the old remuneration structure (until 2011)The virtual stock option plan with stock appreciation rights existing under the old remuneration structure remains in force for all members of the Executive Board until all stock appre-ciation rights have been exercised or have lapsed. In the 2013 financial year no further stock appreciation rights were granted to active Board members. Of the stock appreciation rights granted in previous years, active and former Board members exercised amounts totalling EUR 1.4 million (previous year: EUR 4.3 million) in 2013.
As at 31 December 2013 active members of the Executive Board had at their disposal a total of 288,797 (391,891) granted, but not yet exercised stock appreciation rights with a fair value of EUR 2.4 million (EUR 3.2 million).
Continued payment in case of disabilityIn the event of temporary incapacity for work the fixed annual salary shall continue to be paid in the same amount, at most until termination of the service contract.
If a member of the Executive Board is permanently incapacitated for work during the period of the service contract, the service contract shall terminate at the end of the sixth month after which the permanent incapacity for work is established – although no later than at the end of the service contract.
Other informationThe contracts of the Board members do not include a com-mitment to benefits in the event of a premature termination of employment on the Executive Board owing to a change of control. Only the conditions for the granting of share-based remuneration in the form of stock appreciation rights provide for special exercise options in the event of the merger, spin-off or demerger of Hannover Re into another legal entity.
With regard to Item 4.2.3. Paragraph 2 “Caps on the amount of variable compensation elements in management board con-tracts” and Item 4.2.3 Paragraph 4 “Caps on severance pay-ments in management board contracts” of the German Cor-porate Governance Code, we would refer the reader to our remarks in the Declaration of Conformity contained in the sec-tion “Statement of enterprise management practices” on page 95 of this Group Annual Report.
If the company insists on a non-competition clause with Mr. Wallin for two years after the termination of his service con-tract, he shall be recompensed in a monthly amount of 50% of his most recent fixed remuneration. Income earned through the application of his working capacity elsewhere shall be counted towards this compensation insofar as such income in combina-tion with the compensation exceeds 100% of the most recently received fixed remuneration. The non-competition clause shall not apply if the contract ends prior to the age of 65 because the company does not extend it or because Mr. Wallin declines an extension offered to him on what are for him inferior terms, or if the premature termination or non-extension is due to a com-pelling reason for which the company is responsible.
Amount of remuneration received by the Executive BoardThe total remuneration received by the Executive Board of Han-nover Rück SE on the basis of its work for Hannover Rück SE and the companies belonging to the Group is calculated from the sum of all the components set out in the following table pursuant to DRS 17 (amended 2010).
The remuneration (excluding pension payments) received by former members of the Executive Board totalled EUR 0.4 mil-lion (EUR 2.4 million).

106 Hannover Re | Annual Report 2013
Total remuneration of the active members of the Executive Board pursuant to DRS 17 (amended 2010)
Name
in EUR thousand
Financial year Non-performance-based remuneration Performance-based remuneration 1 Performance-based remuneration 1 Total Number of share awards 6
2012 = Actual2013 = Estimate
Basic salary Non-cash compensation / fringe benefits 2
Short-term Medium-term Long-term
Variable remuneration payable Bonus bank Share awards
60% 3 Netted remuneration
from seats with Group bodies 4 in EUR thousand
20% (allocation) 4 20% (allocation) 5
Ulrich Wallin 2013 520.0 15.3 563.8 187.9 187.9 1,474.9 3,012
2012 520.0 15.0 615.1 205.1 205.1 1,560.3 3,329
André Arrago 2013 320.0 9.5 340.4 113.4 113.4 896.7 1,856
2012 320.0 6.9 352.1 117.4 117.4 913.8 1,867
Claude Chèvre 2013 320.0 13.3 329.6 109.8 109.8 882.5 1,760
2012 320.0 5.1 351.9 117.3 117.3 911.6 1,906
Jürgen Gräber 2013 400.0 14.3 473.2 157.7 157.7 1,202.9 2,321
2012 400.0 20.7 440.1 146.7 146.7 1,154.2 2,592
Dr. Klaus Miller 2013 320.0 13.8 329.6 109.8 109.8 883.0 1,760
2012 320.0 17.9 352.1 117.4 117.4 924.8 1,906
Dr. Michael Pickel 2013 320.0 17.2 347.6 115.8 115.8 916.4 1,856
2012 320.0 9.6 352.1 117.4 117.4 916.5 1,906
Roland Vogel 2013 380.0 15.7 347.0 35.3 115.6 115.6 973.9 1,853
2012 320.0 15.7 378.5 25.0 126.2 126.2 966.6 2,048
Total 2013 2,580.0 99.1 2,731.2 35.3 910.0 910.0 7,230.3 14,418
Total 2012 2,520.0 90.9 2,841.9 25.0 947.5 947.5 7,347.8 15,554
1 As at the balance sheet date no Board resolution was available regarding the performance-based remuneration for 2013. The variable remuneration is recognised on the basis of estimates and the provisions constituted accordingly.
2 The non-cash compensation has been carried in the amounts established for tax purposes.3 In 2013 altogether EUR 32,000 more in variable remuneration was paid out to Board members for 2012 than had been reserved.4 The nominal amount is stated; full or partial repayment in 2017, depending on the development until such time of the balance in the bonus bank.
In 2013 altogether EUR 10,700 more than had been originally reserved was allocated to the bonus bank for 2012.5 The nominal amount is stated; virtual Hannover Re share awards are automatically granted in an amount equivalent to 20% of the variable remuneration.
The equivalent amount will be paid in 2018 at the prevailing share price of Hannover Re. In 2013 nominal amounts of EUR 10,700 more than had been originally reserved were used as a basis for allocation of the 2012 share awards.
6 In order to calculate the number of share awards for 2013 reference was made to the Xetra closing price of the Hannover Re share on 30 December 2013 (EUR 62.38). The number to be actually awarded is established from the arithmetic mean of the Xetra closing prices of the Hannover Re share in a period from five trading days before to five trading days after the meeting of the Supervisory Board that approves the consolidated financial state-ment in March 2014. The applicable market price of the Hannover Re share had increased from EUR 58.96 (28 December 2012) to EUR 61.54 by the allocation date (6 March 2013) of the share awards for 2012; the share awards actually allocated for 2012 are shown here, not those estimated in the 2012 Annual Report.

107
Com
bine
d m
anag
emen
t re
port
Hannover Re | Annual Report 2013
Total remuneration of the active members of the Executive Board pursuant to DRS 17 (amended 2010)
Name
in EUR thousand
Financial year Non-performance-based remuneration Performance-based remuneration 1 Performance-based remuneration 1 Total Number of share awards 6
2012 = Actual2013 = Estimate
Basic salary Non-cash compensation / fringe benefits 2
Short-term Medium-term Long-term
Variable remuneration payable Bonus bank Share awards
60% 3 Netted remuneration
from seats with Group bodies 4 in EUR thousand
20% (allocation) 4 20% (allocation) 5
Ulrich Wallin 2013 520.0 15.3 563.8 187.9 187.9 1,474.9 3,012
2012 520.0 15.0 615.1 205.1 205.1 1,560.3 3,329
André Arrago 2013 320.0 9.5 340.4 113.4 113.4 896.7 1,856
2012 320.0 6.9 352.1 117.4 117.4 913.8 1,867
Claude Chèvre 2013 320.0 13.3 329.6 109.8 109.8 882.5 1,760
2012 320.0 5.1 351.9 117.3 117.3 911.6 1,906
Jürgen Gräber 2013 400.0 14.3 473.2 157.7 157.7 1,202.9 2,321
2012 400.0 20.7 440.1 146.7 146.7 1,154.2 2,592
Dr. Klaus Miller 2013 320.0 13.8 329.6 109.8 109.8 883.0 1,760
2012 320.0 17.9 352.1 117.4 117.4 924.8 1,906
Dr. Michael Pickel 2013 320.0 17.2 347.6 115.8 115.8 916.4 1,856
2012 320.0 9.6 352.1 117.4 117.4 916.5 1,906
Roland Vogel 2013 380.0 15.7 347.0 35.3 115.6 115.6 973.9 1,853
2012 320.0 15.7 378.5 25.0 126.2 126.2 966.6 2,048
Total 2013 2,580.0 99.1 2,731.2 35.3 910.0 910.0 7,230.3 14,418
Total 2012 2,520.0 90.9 2,841.9 25.0 947.5 947.5 7,347.8 15,554
1 As at the balance sheet date no Board resolution was available regarding the performance-based remuneration for 2013. The variable remuneration is recognised on the basis of estimates and the provisions constituted accordingly.
2 The non-cash compensation has been carried in the amounts established for tax purposes.3 In 2013 altogether EUR 32,000 more in variable remuneration was paid out to Board members for 2012 than had been reserved.4 The nominal amount is stated; full or partial repayment in 2017, depending on the development until such time of the balance in the bonus bank.
In 2013 altogether EUR 10,700 more than had been originally reserved was allocated to the bonus bank for 2012.5 The nominal amount is stated; virtual Hannover Re share awards are automatically granted in an amount equivalent to 20% of the variable remuneration.
The equivalent amount will be paid in 2018 at the prevailing share price of Hannover Re. In 2013 nominal amounts of EUR 10,700 more than had been originally reserved were used as a basis for allocation of the 2012 share awards.
6 In order to calculate the number of share awards for 2013 reference was made to the Xetra closing price of the Hannover Re share on 30 December 2013 (EUR 62.38). The number to be actually awarded is established from the arithmetic mean of the Xetra closing prices of the Hannover Re share in a period from five trading days before to five trading days after the meeting of the Supervisory Board that approves the consolidated financial state-ment in March 2014. The applicable market price of the Hannover Re share had increased from EUR 58.96 (28 December 2012) to EUR 61.54 by the allocation date (6 March 2013) of the share awards for 2012; the share awards actually allocated for 2012 are shown here, not those estimated in the 2012 Annual Report.

108 Hannover Re | Annual Report 2013
The following table shows the expense for share-based remu-neration of the Executive Board in the financial year.
The table is to be viewed independently of the presentation of the total remuneration received by active members of the Executive Board pursuant to DRS 17.
Total expense for share-based remuneration of the Executive Board
Name
in EUR thousand
Year Stock appre-ciation rights
exercised
Change in reserve in
2013 for stock appreciation
rights
Change in reserve for
share awards from previous
year 1
Expense for share awards
allocated in current
financial year 2
Total
Ulrich Wallin 2013 114.0 58.6 61.6 40.3 274.5
2012 411.3 (108.4) 135.3 76.8 515.0
André Arrago 2013 535.2 (439.2) 109.9 69.5 275.4
2012 88.6 196.0 68.3 44.0 396.9
Claude Chèvre 2013 – – 20.7 22.0 42.7
2012 – – 11.8 41.4 53.2
Jürgen Gräber 2013 164.2 (1.5) 108.2 31.0 301.9
2012 671.5 (273.7) 71.7 29.3 498.8
Dr. Klaus Miller 2013 – 19.5 (28.7) 22.0 12.8
2012 – 16.9 98.3 70.4 185.6
Dr. Michael Pickel 2013 149.5 (3.1) 79.5 23.2 249.1
2012 596.9 (238.6) 22.9 23.5 404.7
Roland Vogel 2013 44.3 30.4 91.4 27.2 193.3
2012 146.6 (28.2) 65.4 25.2 209.0
Total 2013 1,007.2 (335.3) 442.6 235.2 1,349.7
Total 2012 1,914.9 (436.0) 473.7 310.6 2,263.2
1 The change in the reserve for share awards from previous years derives from the increased market price of the Hannover Re share, the dividend approved for 2012, contract extensions and the spreading of the expense for share awards across the remaining period of the individual service contracts.
2 The expense for share awards is spread across the remaining period of the individual service contracts. This gives rise to a difference relative to the nominal amount shown in the table of total remuneration.

109
Com
bine
d m
anag
emen
t re
port
Hannover Re | Annual Report 2013
Cash remuneration actually accruing to active members of the Executive Board
Name
in EUR thousand
Year Fixed remuneration
Variable remuneration
Stock appre-ciation rights
exercised
Total
Ulrich Wallin 2013 520.0 614.5 114.0 1,248.5
2012 520.0 698.9 411.3 1,630.2
André Arrago 2013 320.0 344.6 535.2 1,199.8
2012 320.0 352.8 88.6 761.4
Claude Chèvre 2013 320.0 351.8 – 671.8
2012 320.0 64.8 – 384.8
Jürgen Gräber 2013 400.0 478.5 164.2 1,042.7
2012 400.0 490.5 671.5 1,562.0
Dr. Klaus Miller 2013 320.0 351.8 – 671.8
2012 320.0 378.0 – 698.0
Dr. Michael Pickel 2013 320.0 351.8 149.5 821.3
2012 320.0 374.4 596.9 1,291.3
Roland Vogel 1 2013 380.0 388.3 44.3 812.6
2012 320.0 453.4 146.6 920.0
Total 2 2013 2,580.0 2,881.3 1,007.2 6,468.5
Total 2012 2,520.0 2,812.8 1,914.9 7,247.7
1 Remuneration for seats with Group bodies that is counted towards the variable remuneration accrues in the year of occurrence.2 In 2013 altogether EUR 32,000 more in variable remuneration was paid to the members of the Executive Board for 2012 than had been reserved.
Sideline activities of the members of the Executive BoardThe members of the Executive Board require the approval of the Supervisory Board to take on sideline activities. This ensures that neither the remuneration granted nor the time required for this activity can create a conflict with their responsibilities on the Executive Board. If the sideline activities involve seats on supervisory boards or comparable control boards, these are listed and published in the Annual Report of Hannover Rück SE. The remuneration received for such seats at Group companies and other board functions is deducted when cal-culating the variable bonus and shown separately in the table of total remuneration.
Retirement provisionFinal-salary pension commitment (appointment before 2009) The contracts of members of the Executive Board first appointed prior to 2009 contain commitments to an annual retirement pension calculated as a percentage of the pension-able fixed annual remuneration (defined benefit). The target pension is at most 50% of the monthly fixed salary payable on reaching the age of 65. A non-pensionable fixed remuneration component was introduced in conjunction with the remunera-tion structure applicable from 2011 onwards.
Contribution-based pension commitment (appointment from 2009 onwards)The commitments given to members of the Executive Board from 2009 onwards are based on a defined contribution scheme.
A Board member who has reached the age of 65 and left the company’s employment receives a life-long retirement pension. The amount of the monthly retirement pension is calculated according to the reference date age (year of the reference date less year of birth) and the funding contribution on the reference date. The annual funding contribution for these contracts is paid by the company in an amount of 25% of the pensionable income (fixed annual remuneration as at the reference date of 1 July of each year).
In both contract variants (i. e. defined benefit and defined con-tribution) other income received while drawing the retirement pension is taken into account pro rata or in its entirety under certain circumstances (e.g. in the event of incapacity for work or termination of the service contract before reaching the age of 65).
Provision for surviving dependantsIf the Board member dies during the period of the service contract, the surviving spouse – or alternatively the eligible children – shall be entitled to continued payment of the fixed monthly salary for the month in which the Board member dies and the six months thereafter, at most until termination of the service contract. If the member of the Executive Board dies

110 Hannover Re | Annual Report 2013
after pension payments begin, the surviving spouse and alter-natively the dependent children shall receive continued pay-ment of the retirement pension for the month of death and the following six months.
The widow’s pension amounts to 60% of the retirement pay that the Board member received or would have received if he had been incapacitated for work at the time of his death.
An orphan’s pension shall be granted in the amount of 15% – in the case of full orphans 25% (final-salary pension commit-ment) or 30% (contribution-based pension commitment) – of the retirement pay that the Board member received or would have received on the day of his death if the pensionable event had occurred owing to a permanent incapacity for work.
Adjustments The following parameters are used for adjustments to retire-
ment, widow’s and orphan’s benefits: the price index for the cost of living of all private households in Germany (contracts from 2001 onwards) or the price index for the cost of living of four-person households of civil servants and higher-income salaried employees (contracts from 1997 to 2000).
Current pensions based on the commitments given from 2009 onwards (defined contribution commitment) are increased annually by at least 1% of their most recent (gross) amount.
Pension payments to former members of the Executive Board The pension payments to former members of the Executive Board and their surviving dependants, for whom 14 (13) pension com-mitments existed, totalled EUR 1.4 million (EUR 1.4 million) in the year under review. The projected benefit obligation of the pension commitments to former members of the Executive Board amounted to altogether EUR 21.4 million (EUR 22.5 million).
Defined benefit commitments
Name
in EUR thousand
Financial year Attainable annual pension (age 65)
DBO 31.12. Personnel expense
Ulrich Wallin 2013 220.0 3,284.1 120.8
2012 220.0 3,620.2 90.5
André Arrago 2013 127.0 2,273.0 85.8
2012 127.0 2,390.8 68.3
Jürgen Gräber 2013 158.5 2,133.3 97.9
2012 158.5 2,381.1 69.9
Dr. Michael Pickel 2013 120.0 1,163.5 101.2
2012 120.0 1,298.0 67.0
Roland Vogel 1 2013 80.4 786.8 38.1
2012 71.2 703.5 23.7
Total 2013 705.9 9,640.7 443.8
Total 2012 696.7 10,393.6 319.4
1 Mr. Vogel was appointed as a member of the Executive Board on 1 April 2009. He was first granted a pension commitment on the basis of his service to the company prior to 2001; the earned portion of the commitment from the Unterstützungskasse is therefore established as a proportion (in the ratio [currently attained service years since entry] / [attainable service years from entry to exit age]) of the final benefit. Measurement under IFRS con-sequently uses the defined benefit method. An annual premium of EUR 95,000 (25% of the pensionable income) was paid for Mr. Vogel in 2013. The guaranteed interest rate of his commitment is 3.25%.
Defined contribution commitments
Name
in EUR thousand
Financial year Annual funding contribution 1
Attainable annual pension (age 65)
Premium
Claude Chèvre 2 2013 25% 68.4 80.0
2012 25% 68.2 80.0
Dr. Klaus Miller 2 2013 25% 48.7 80.0
2012 25% 48.5 80.0
Total 2013 117.1 160.0
Total 2012 116.7 160.0
1 Percentage of pensionable income (fixed annual remuneration as at the reference date of 1 July of each year)2 Guaranteed interest rate 2.25%

111
Com
bine
d m
anag
emen
t re
port
Hannover Re | Annual Report 2013
Remuneration of the Supervisory Board
The remuneration of the Supervisory Board is determined by the Annual General Meeting of Hannover Rück SE and regu-lated by the Articles of Association.
In accordance with § 14 of the Articles of Association as amended on 18 July 2013 and the resolution of the Annual General Meeting on 7 May 2013, the members of the Supervi-sory Board receive fixed annual remuneration of EUR 30,000 per member in addition to reimbursement of their expenses. Furthermore, each member of the Supervisory Board receives variable remuneration measured according to the average earn-ings per share (EPS) of the company over the past three finan-cial years preceding the Annual General Meeting at which the actions of the Supervisory Board for the last of these three years are ratified. The variable remuneration amounts to EUR 330 for each EUR 0.10 average earnings per share (EPS) of the company. The measurement of this performance-based remuneration component according to the average earnings per share of the last three financial years ensures that the vari-able remuneration is geared to sustainable corporate develop-ment. The variable remuneration is limited to an annual maxi-mum of EUR 30,000. The Chairman of the Supervisory Board receives twice the aforementioned remuneration amounts and the Deputy Chairman of the Supervisory Board receives one-and-a-half times the said amounts.
In addition, the members of the Finance and Audit Commit-tee formed by the Supervisory Board receive remuneration of EUR 15,000 for their Committee work and the members of the Standing Committee formed by the Supervisory Board receive remuneration of EUR 7,500. In this case, too, the Chairman of the Committee receives twice and the Deputy Chairman one-and-a-half times the stated amounts. No remuneration is envis-aged for the Nomination Committee.
Members who have only belonged to the Supervisory Board or one of its Committees for part of the financial year receive the remuneration pro rata temporis.
All the members of the Supervisory Board receive an attend-ance allowance of EUR 1,000 for their participation in each meeting of the Supervisory Board and the Committees in addi-tion to the aforementioned remuneration. If a meeting of the Supervisory Board and one or more Committee meetings fall on the same day, the attendance allowance for this day is only paid once in total.

112 Hannover Re | Annual Report 2013
Individual remuneration received by the members of the Supervisory Board
Name
in EUR thousand 1
Function Type of remuneration 2013 2012
Herbert K. Haas 2 Chairman of the• Supervisory Board• Standing Committee• Finance and Audit Committee • Nomination Committee
Fixed remuneration 100.0 100.0
Variable remuneration 76.4 82.4
Remuneration for committee work 85.1 85.0
Attendance allowances 15.0 14.0
276.5 281.4
Dr. Klaus Sturany Deputy Chairman of the • Supervisory BoardMember of the • Standing Committee• Nomination Committee
(until 6 March 2013)
Fixed remuneration 45.0 45.0
Variable remuneration 32.4 30.3
Remuneration for committee work 7.5 7.5
Attendance allowances 6.0 5.0
90.9 87.8
Wolf-Dieter Baumgartl 2 Member of the• Supervisory Board• Standing Committee• Finance and Audit Committee • Nomination Committee
Fixed remuneration 50.0 50.0
Variable remuneration 38.3 40.2
Remuneration for committee work 22.5 22.5
Attendance allowances 12.0 10.0
122.7 122.7
Frauke Heitmüller 3 Member of the Supervisory Board Fixed remuneration 30.0 19.8
Variable remuneration 21.3 12.9
Remuneration for committee work – –
Attendance allowances 4.0 2.0
55.3 34.7
Uwe Kramp 3 Member of the Supervisory Board (until 3 May 2012)
Fixed remuneration – 10.3
Variable remuneration 0.3 7.4
Remuneration for committee work – –
Attendance allowances – 2.0
0.3 19.7
Karl Heinz Midunsky Member (until 3 May 2011) of the • Supervisory Board• Nomination Committee
Fixed remuneration – –
Variable remuneration – 0.2
Remuneration for committee work – –
Attendance allowances – –
– 0.2
Otto Müller 3 Member of the Supervisory Board Fixed remuneration 30.0 30.0
Variable remuneration 21.6 20.2
Remuneration for committee work – –
Attendance allowances 4.0 4.0
55.6 54.2
Dr. Andrea Pollak Member of the • Supervisory Board• Nomination Committee
(since 6 March 2013)
Fixed remuneration 30.0 30.0
Variable remuneration 21.6 19.9
Remuneration for committee work – –
Attendance allowances 4.0 4.0
55.6 53.9

113
Com
bine
d m
anag
emen
t re
port
Hannover Re | Annual Report 2013
Dr. Immo Querner 2 Member of the Supervisory Board Fixed remuneration 50.0 50.0
Variable remuneration 38.2 41.2
Remuneration for committee work 10.0 10.0
Attendance allowances 7.0 6.0
105.2 107.2
Dr. Erhard Schipporeit Member of the • Supervisory Board• Finance and Audit Committee
Fixed remuneration 30.0 30.0
Variable remuneration 21.6 20.2
Remuneration for committee work
15.0 15.0
Attendance allowances 8.0 7.0
74.6 72.2
Maike Sielaff 3 Member of the Supervisory Board (from 6 March 2013)
Fixed remuneration 24.6 –
Variable remuneration 17.0 –
Remuneration for committee work – –
Attendance allowances 4.0 –
45.6 –
Gert Wächtler 3 Member of the Supervisory Board(until 6 March 2013)
Fixed remuneration 5.5 30.0
Variable remuneration 4.6 20.2
Remuneration for committee work – –
Attendance allowances 1.0 3.0
11.1 53.2
Total 893.5 887.2
1 Amounts excluding reimbursed VAT2 Including supervisory board remuneration and remuneration for committee work as well as advisory board remuneration received
from entities affiliated with the company3 Employee representatives
The individualised presentation of the remuneration shows the expense charged to the financial year in question. Since the remuneration for a financial year becomes due at the end of the Annual General Meeting that ratifies the acts of the Super-visory Board for the financial year, the relevant reserve allo-cations for the variable remuneration are recognised allowing for any fractional amounts. Value-added tax payable upon the remuneration is reimbursed by the company.
In the year under review no payments or benefits were granted to members of the Supervisory Board in return for services provided individually outside the Committee work described above, including for example consulting or mediation services, with the exception of the remuneration paid to employee rep-resentatives on the basis of their employment contracts.
Loans to members of the management boards and contingent liabilities
In order to avoid potential conflicts of interest, Hannover Rück SE or its subsidiaries may only grant loans to members of the Executive Board or Supervisory Board or their dependants with the approval of the Supervisory Board.
In 2013 no loan relationships existed with members of the Executive Board or Supervisory Board of Hannover Rück SE, nor did the company enter into any contingent liabilities for members of the management boards.
Securities transactions and shareholdings (directors’ dealings)
Dealings in shares, options and derivatives of Hannover Rück SE effected by members of the Executive Board or Supervi-sory Board of Hannover Re or by other persons with manage-rial functions who regularly have access to insider informa-tion concerning the company and who are authorised to take major business decisions – as well as such dealings conducted by certain persons closely related to the aforementioned indi-viduals – in excess of EUR 5,000 are to be reported pursuant to § 15a Securities Trading Act (WpHG). No such reportable transactions took place in the 2013 financial year.
Members of the Supervisory Board and Executive Board of Han-nover Rück SE as well as their spouses or registered partners and first-degree relatives hold less than 1.0% of the issued shares. The total holding as at 31 December 2013 amounted to 0.056% (0.056%) of the issued shares, i. e. 67,103 (67,118) shares.

114 Hannover Re | Annual Report 2013
Remuneration of staff and senior executives
Structure and systemThe remuneration scheme for senior executives below the Executive Board (management levels 2 and 3) consists of a fixed annual salary and a system of variable remuneration. This is comprised of a short-term variable remuneration component, the annual cash bonus, and a long-term share-based remunera-tion component, the Share Award Plan. This variable remunera-tion has been uniformly applied worldwide since 1 January 2012 to all Group senior executives (i. e. Managing Directors, Directors and General Managers). It satisfies the requirements of the Regulation on the Supervisory Law Requirements for Remuneration Schemes in the Insurance Sector (VersVergV), which entered into force on 13 October 2010, inasmuch as – in its basic principles and parameters – it meets the special requirements of § 4 VersVergV and is appropriately realised according to the various management levels. As part of the reorientation of the remuneration system for senior executives the Share Award Plan of the Executive Board was consciously extended to include management levels 2 and 3. Given that at the same time the stock appreciation rights plan for senior executives was cancelled with effect from the 2012 alloca-tion year, this means that a uniform share-based remuneration component has been maintained for the Executive Board and senior executives alike.
Members of staff on the levels of Chief Manager, Senior Man-ager and Manager are also able to participate in a variable remuneration system through the Group Performance Bonus (GPB). The Group Performance Bonus (GPB) is a remunera-tion model launched in 2004 that is linked to the success of the company. This tool is geared to the minimum return on equity of 750 basis points above the risk-free interest rate and
the return on equity actually generated. For those participat-ing in the GPB 14.15 monthly salary payments are guaranteed; a maximum of 16.7 salary payments is attainable. Since its launch the maximum amount of the GPB was paid out in 2006, 2007, 2009, 2010 and 2012.
The group of participants and the total number of eligible par-ticipants in the variable remuneration systems of Hannover Re are set out in the table on this page.
Measurement of variable remuneration for senior executivesThe measurement of the variable remuneration is based on three elements: Group net income, business group targets and individual targets. The weighting of the elements is depend-ent upon whether responsibility is carried in a treaty / regional department or in a service department. In the treaty / regional departments the Group net income is weighted at 20%, the business group targets at 40% and the individual targets also at 40%. In the service departments the Group net income car-ries a 40% weighting, while the individual targets account for 60%. Agreements on business group targets and individual targets as well as on their degree of goal attainment are arrived at as part of the Management by Objectives (MbO) process.
The Group net income is measured by the three-year average return on equity (ROE) of the Hannover Re Group above the risk-free interest rate. Goal attainment is calculated as follows: for each individual financial year of the last three financial years it is calculated by how many percentage points the RoE of the Hannover Re Group exceeds the risk-free interest rate. The average of these three differences determines the three-year average RoE above the risk-free interest rate. The risk-free interest rate is the average market interest rate over the past five years for 10-year German government bonds.
Group of participants and total number of eligible participants in variable remuneration systems Valid: 31 December 2013
Participants Variable remuneration system
Number of eligible participants in the variable remuneration system
Managing Director Management level 2 Cash bonus and Share Award Plan
Hannover Re GroupAll 149 Group senior executives worldwide receive a cash bonus upon corresponding goal attainment. 148 of them participate in the Share Award Plan.
Director Management level 3
General Manager
Chief Manager Group Performance Bonus (GPB)
Home Office Hannover581 staff (excl. seconded employees) out of the altogether 1,201 at Hannover Home Office (incl. 90 senior executives) are GPB-eligible.
Senior Manager
Manager
115
Com
bine
d m
anag
emen
t re
port
Hannover Re | Annual Report 2013
If the three-year average RoE above the risk-free interest rate reaches the expected minimum return on equity of 750 basis points, goal attainment stands at 85%. Goal attainment of 100% is recorded at 882 basis points. The maximum possi-ble goal attainment is 200%. A lower limit is placed on goal attainment of -50% (penalty) for management level 2 (Man-aging Director) and 0% for management level 3 (Director and General Manager).
The measurement of the business group targets – which in the case of the treaty / regional departments account for 40% of overall goal attainment – is geared to the actual value cre-ated. The Intrinsic Value Creation (IVC) of the business group encompassing the relevant area of responsibility is therefore used as a one-year measurement basis. Negative performance contributions are excluded here – the minimum possible goal attainment is 0%. The maximum possible goal attainment is limited to 150%.
Attainment of the agreed IVC results in goal attainment of 100%. Outperformance of the business group targets, i. e. a degree of goal attainment in excess of 100%, requires at least the agreement and attainment of a positive IVC. Furthermore, a degree of goal attainment in excess of 100% should be geared to a real comparison of planned IVC with actual IVC. A maxi-mum degree of goal attainment of 150% is conditional upon attainment of an excellent positive IVC and implies that the actual IVC of the business group is significantly in excess of the planned IVC.
Individual targets are agreed and measured for a period of one year. The degree of goal attainment is between 0% and 100%.
Amount and payment of variable remuneration for senior executivesThe overall degree of goal attainment determines the amount of variable remuneration including share awards. On manage-ment level 2 (Managing Director) 60% of the variable remu-neration is paid out annually in cash and 40% is granted in the form of share awards. On management level 3 (Director and General Manager) the variable remuneration is split into 65% cash payment and 35% granted as share awards.
On management level 3 (Director and General Manager) the minimum variable remuneration amounts to EUR 0 on the premise that the degree of attainment for all goals is 0%. For management level 2 (Managing Director) in treaty / regional departments the minimum limit for the variable remuneration is set at -10% if the degree of goal attainment for Group net income is -50% while at the same time goal attainment of 0% is determined for the business group targets and individual tar-gets. For management level 2 (Managing Director) in service departments -20% of the variable remuneration is possible as the lower limit, if the degree of goal attainment for Group net income is -50% and at the same time goal attainment of 0% is determined for the individual targets.
In view of the fact that outperformance of up to 200% is pos-sible for Group net income and up to 150% for business group targets, a maximum total degree of goal attainment of 140% can be attained in both treaty / regional departments and ser-vice departments. Given outperformance of all targets, a maxi-mum of 140% of the variable remuneration can therefore be attained on management levels 2 and 3.
Allocation and payment of share awards to senior executivesThe total number of share awards allocated is determined according to the value per share of Hannover Re. This value is arrived at from the average of the closing prices of the shares in a period extending from 20 trading days before to 10 trad-ing days after the meeting of the Supervisory Board at which the consolidated financial statement is approved. The number of share awards is established by dividing the specified por-tion of the total bonus (40% or 35%) by the value per share, rounded up to the next full share.
Following expiry of a vesting period of four years the value of one Hannover Re share calculated at the disbursement date is paid out for each share award. The value of the Hannover Re share is again determined from the average of the closing prices of the shares in a period from 20 trading days before to 10 trading days after the meeting of the Supervisory Board that approves the consolidated balance sheet. In addition, a sum in the amount of the dividend is paid out for each share award, insofar as dividends were distributed to shareholders. The level of the dividend payment is the sum total of all divi-dends per share paid out during the period of the share awards multiplied by the number of share awards.
In the case of the allocation and payment of share awards to participants in the Share Award Plan who are located abroad, the rate of exchange used to convert the average share price is the average of the relevant exchange rate in a period from 20 trading days before to 10 trading days after the meeting of the Supervisory Board that approves the consolidated balance sheet. For payment of the dividend to participants in the Share Award Plan who are located abroad, the rate of exchange used to convert the dividend per share is the average of the relevant exchange rate in a period from 20 trading days before to 10 trading days after the Annual General Meeting that approves the dividend payment for the financial year just ended.
The cash bonus was paid for the first time in June 2013 for the 2012 financial year. In view of the fact that the share awards were also allocated for the first time in June 2013 for the 2012 financial year, they will be paid out for the first time in the spring of 2017 including dividends paid for the 2012, 2013, 2014 and 2015 financial years.

116 Hannover Re | Annual Report 2013
Growing marketsStudies by the Global Earthquake Model Foundation show that the number of people worldwide at moderate or severe risk of experiencing earthquakes will grow by more than 30% by 2030. In the same period the insured values in earthquake-exposed regions will rise disproportionately. This is a consequence of increasing insurance densities and higher-value construction methods, which in turn are attributable to greater prosperity in many countries around the world.
Worldwide earthquake exposure in 2013 (proportion of the global population)
25%Severe
45%Moderate
30%Slight
Source: Global Earthquake Model Foundation

117Hannover Re | Annual Report 2013
Exposure in earth-quake regions con-
tinues to increase

118 Hannover Re | Annual Report 2013
Outlook
Forecast• Solid prospects for 2014 despite softer market conditions in non-life reinsurance• Stable to modestly higher gross premium volume in total business• Selective underwriting policy in non-life reinsurance should preserve 2013 profitability• Significantly improved result expected in life and health reinsurance• Return on investment of 3.2% for assets under own management• Group net income in the order of EUR 850 million targeted
Economic development
Global economy The outlook for the global economy continued to brighten as it put 2013 behind it and moved into 2014. Factors which had put the world’s economy under appreciable strain over the past two years began to diminish in significance: in the United States the process of consolidation continued apace, while in the Eurozone confidence solidified in the survival of the single currency area. The Kiel Institute for the World Economy expects the effects
of expansionary monetary policy to be felt progressively more strongly as confidence grows among households and the busi-ness community. By and large, fiscal policy will also be less restrictive than in recent years.
In its forecast for 2014, the Kiel Institute for the World Econo my expects that central banks in mature national economies will stand by their expansionary monetary policy. Given these frame-work conditions, experts anticipate accelerated growth of 3.7% for the global economy in the coming year.
Growth in gross domestic product (GDP)
in % 2013 (forecast from previous year)
2013 (provisional calculation)
2014 (forecast)
Economic areas
World economy 3.4% 2.9% 3.7%
Eurozone -0.2% -0.4% 0.9%
Selected countries
United States 1.5% 1.6% 2.3%
China 8.0% 7.5% 7.5%
India 6.5% 4.0% 5.0%
Japan 0.5% 1.6% 1.5%
Germany 0.3% 0.4% 1.7%
Source: Kiel Institute for the World Economy
United StatesThe effect of monetary stimuli is likely to be felt increas-ingly strongly in the US in the course of the year, causing the econo my to pick up further momentum. The Kiel Institute for the World Economy anticipates a growth rate of 2.3% in the year ahead. Experts believe that the real estate market will also benefit greatly from this development. Increasing debt reduc-tion and further improvement on the labour market will boost private consumption. On the corporate side, it can be assumed that the positive framework conditions will bring greater invest-ment confidence.
Markets are prepared for the fresh fiscal restrictions that take effect in the US budget at the beginning of 2014, as a conse-quence of which the restraining effect on the economy will be far slighter than in previous years. In view of the improved state of the economy, the budget deficit in the 2014 financial year will continue to shrink.
EuropeWithin the Eurozone the consolidation processes in the crisis-affected countries will further curb domestic demand, with the result that economic growth will likely be comparatively weak in 2014. In addition, problems in the banking sector which hinder the transfer of monetary stimuli to the markets persist.

119
Com
bine
d m
anag
emen
t re
port
Hannover Re | Annual Report 2013
Despite this, economic activity in the Eurozone will gradually gather steam. The Kiel Institute for the World Economy fore-casts growth of 0.9% for 2014. Unemployment has passed its peak and will slowly subside overall; the crisis-hit countries will remain exceptions here for the time being. In the United Kingdom, too, the economy is picking up; a sustained upturn with a growth rate of 2.0% for 2014 is possible here.
GermanyThe economic data in Germany are pointing towards expan-sion. After the muted growth in the past year, economic activ-ity is likely to gather further momentum in 2014. The Kiel Institute for the World Economy anticipates a growth rate of 1.7%. As part of this upturn the volume of replacement and expansion investments, some of which had been deferred, is likely to increase markedly. The extremely favourable financ-ing environment will further stimulate residential construc-tion and support the emerging real estate boom. Exports will enjoy a brisk revival in light of improved economic conditions abroad. Foreign trade will not give rise to any appreciable production effects.
Assisted by a favourable situation on the labour market, private households will significantly step up their consumer spending. Despite this positive tone on the employment front, the number of jobseekers will likely still remain just under three million.
China, India, JapanThe growth in potential output will slow in a number of emerg-ing economies, although it should remain on a high level. The Kiel Institute for the World Economy expects China’s growth rate to retreat slightly in the coming year; it will probably stand at 7.5% in 2014. Particularly in China, the figures published by the ECB suggest that the growth potential for the coming years will follow a downward trend. Given that the population of working age is shrinking in size, the gradual elimination of demand imbalances will lead to a shift in capital spending towards private consumption. For India, too, the forecast of 5% for the coming year is well short of the higher levels of prior years.
The outlook for Japan is that the current expansion will be sustained over a protracted period. The growth anticipated for 2014 is in the order of 1.5%.
Capital markets All in all, 2014 is likely to be a solid year on the financial mar-kets, driven by further recovery in the global economy and stabilisation in public finances. While we expect the European Central Bank to initially maintain its low interest rate policy, the US Federal Reserve should continue its progressive pull-back from active market intervention, although it will likely leave interest rate policy unchanged. In 2014 international bond markets will again see unusually low interest rate levels. In the relevant currency areas for our company we expect at most moderate increases in key interest rates. With respect to treasury bonds issued by the countries of the European Mon-
etary Union with higher risk premiums, which have been the focus of so much attention of late, the stabilisation that began to take hold in 2013 may be sustained. Last but not least, the incremental strategy for resolving the Euro debt crisis may lead to a sometimes volatile capital market environment. While the necessary consolidation of public finances in the western world will continue to preoccupy the economic environment, it may, however, overcompensate due to resurgent domestic consumption and investment demand. Overall, the risks to the world economy have not really diminished, but the opportu-nities are greater. Broad diversification within the investment portfolio will therefore continue to be of considerable impor-tance in the current financial year.
Insurance industryThe situation in the international insurance industry is likely to change only marginally in 2014. Despite a challenging general environment, it is likely to remain on a broadly stable course – despite the fact that investment income will probably move lower again as a reflection of the difficult investment conditions on cap-ital markets. In order to be able to generate adequate investment income, (re)insurers may continue to shift portfolios into other asset classes, e.g. in the infrastructure sector, or adjust products even more specifically in line with market circumstances. For the German life (re)insurance market this means having to establish further legally prescribed additional reserves for policies with guarantees; in the companies’ own assessment, however, build-ing up such a financial buffer would be feasible.
Generating growth will likely continue to be a dominant topic despite sustained competition. Industry experts anticipate stim-uli for both non-life and life and health reinsurance first and foremost from growth markets: attractive business potential should be available here in view of rising population numbers and the associated urbanisation. If major losses – especially from natural disasters – are again absent in 2014, the market may soften and hence usher in further premium reductions. The market for catastrophe bonds (ILS), which gives investors with strong capital resources access to the (re)insurance mar-ket, may further exacerbate the pressure on prices. Now more than ever, therefore, the industry will likely attach importance to prices and conditions that appropriately reflect the risks. Moderate nominal premium growth is anticipated for the Ger-man insurance industry in 2014, although the overall expecta-tion is slightly below that of the previous year.
Strengthening the risk-bearing capacity of insurers should remain a central concern in 2014. The currently ongoing adjustment of European regulations, especially with respect to Solvency II, as well as improvements in compliance and risk management systems will likely enhance the ability of insur-ers to withstand crises. These requirements affect not only mature markets but also increasingly growth markets around the world, where insurance reforms and solvency rules are being adopted and implemented in individual countries. The resulting challenges should at the same time open up fresh opportunities for (re)insurers.

120 Hannover Re | Annual Report 2013
Non-life reinsurance
OverviewEven compared to 2013, competition is intensifying appreci-ably in the non-life reinsurance market in the current financial year. This is being driven by a number of factors: along with the absence of market-changing major losses, ceding companies are retaining more risks for net account due to their healthy capital resources. Not only that, the inflow of capital from the ILS market – especially in the area of US natural catastrophe business – is causing marked price erosion. For Hannover Re, however, this aspect has not prompted any significant share reductions. On the whole, it may be stated that there is cur-rently an oversupply of reinsurance capacity. This development was already becoming apparent in the course of the year under review and overshadowed the treaty renewals as at 1 January 2014. On this date we renegotiated around 65% of our trea-ties in non-life reinsurance (excluding facultative business and structured reinsurance).
Despite the fiercer competition, we were satisfied with the outcome of the renewals. Thanks to our selective underwriting policy we were able to generate adequate margins. We expect the profitability of the new business written to remain broadly stable relative to 2013.
Even though the rate erosion was appreciable in some areas, prices were obtained on a level commensurate with the risks. The rate reductions in non-proportional business amounted to 3.8%. Despite various efforts in the market to bring about softening, we were able to write our business at broadly unchanged conditions.
Under loss-impacted programmes it was possible to push through rate increases; this was particularly true of catastro-phe covers in Germany and Canada. In marine business fur-ther increases were booked as a consequence of negative loss experiences from prior years.
Overall, Hannover Re again benefited in the treaty renewals from its durable customer relationships and its position as one of the leading and most financially robust reinsurance groups.
We see further growth potential in North America, the Asia-Pacific markets, the countries of Central and Eastern Europe, marine business and facultative reinsurance and in structured reinsurance.
Non-life reinsurance: Forecast development for 2014
Volume 1 Profitability 2
Target markets
Germany 3 + / –
North America 3 +
Specialty lines
Marine ++
Aviation + / –
Credit and surety +
Structured reinsurance / ILS + / –
UK, London market & direct business + / –
Global reinsurance
Worldwide treaty reinsurance +
Global catastrophe business +
Facultative reinsurance +
1 In EUR, development in original currency may vary2 ++ = significantly above the cost of capital; + = above the cost of capital; + / – = on a par with the cost of capital; – = below the cost of capital3 All lines with the exception of those reported separately
The development of our business is described in greater detail below.
Target marketsOur domestic market was similarly notable for marked competi-tion in the treaty renewals. Although demand for natural catas-trophe XL covers rose in Germany on account of heavy losses from the severe flood and hail events of 2013, not all expecta-tions were fulfilled. In both proportional motor own damage insurance and homeowners insurance we profited from fur-ther premium increases in the original business. The rate level for covers in non-proportional motor liability was also sharply improved. The fierce competition observed in commercial and industrial business is likely to be sustained in 2014. The trend towards higher retentions – observable for some time now – principally through the reduction of proportional cessions is continuing in the current year. With this in mind, we anticipate a discernible premium decline in industrial fire business. All in all, our portfolio in our domestic market should remain stable.

121
Com
bine
d m
anag
emen
t re
port
Hannover Re | Annual Report 2013
The treaty renewals as at 1 January 2014 for business in North America passed off satisfactorily for our company; we gener-ated premium growth of around 5%. Although rates for US property business came under pressure due to a year of rela-tively low losses, the rate reductions proved to be smaller than anticipated; the level is still adequate. Broadly stable rates and conditions were obtained in US casualty business, prompting us to selectively expand our portfolio here. Appreciable rate increases were booked in Canadian property business owing to heavy losses from the 2013 flood events. Rates in the casu-alty lines were for the most part unchanged. We expect to see further price erosion in the renewals as at 1 June and 1 July 2014 – the date when, most notably, catastrophe XL covers are renegotiated. This is not likely to be the case with loss-impacted programmes in Canada.
When it comes to the development of our premium income, we expect to see growth overall for 2014.
Specialty lines In marine reinsurance we expect to see further rate increases in 2014 for Protection & Indemnity (P&I) covers owing to the deterioration of the liability claims associated with the chal-lenging salvage of the “Costa Concordia” cruise ship. The price level for non-proportional reinsurance of business with offshore exposure should remain stable on both the property and casualty side. As far as the other lines are concerned, such as hull, cargo and marine liability, the rate environment is likely to remain broadly stable. Hannover Re anticipates more intense competition and hence pressure on prices under marine programmes that do not cover worldwide exposures. These include, in particular, the European and Asian markets.
In view of the very good underwriting results booked in avia-tion reinsurance in recent years, prices on both the primary and reinsurance markets are continuing to decline. With this in mind, our focus remains firmly on disciplined underwriting so as to preserve the profitability of our portfolio. Reflecting our selective underwriting approach in the treaty renewals as at 1 January 2014, our premium volume contracted. For the year as a whole, too, we anticipate an appreciable drop in our premium income.
With the economy slowly recovering, we are standing by our underwriting policy in credit and surety reinsurance. In the area of credit insurance we expect premium income to remain stable or decline slightly at constant claims rates. In surety reinsurance, on the other hand, loss expenditure is again likely to exceed the multi-year average, despite trending slightly lower. In business with political risks we enlarged our portfolio by a double-digit margin in the renewals as at 1 January 2014; we anticipate fur-ther premium growth coupled with good claims rates. For 2014 Hannover Re expects to see premium volume in its credit and surety business come in slightly lower than the previous year.
In our business with structured reinsurance products we antici-pate further healthy demand for tailored reinsurance solutions in the current financial year. The key driver here is the increasing integration of reinsurance into companies’ risk management. This trend has been fostered by the rising capital requirements imposed on providers: with ever more countries implementing risk-based solvency systems and the adoption of Solvency II tak-ing on increasingly concrete form, 2014 is again likely to see strong demand for contracts designed to provide solvency relief.
It is our assumption that demand in the area of insurance-linked securities will continue to grow. In addition to protecting our own peak exposures, we make the most of the attractive opportu-nities available in collateralised reinsurance business. The extent to which we step up our investments in catastrophe bonds will depend on price movements. For 2014 we are looking to a rising premium volume and pleasing results. We were able to renew our “K” quota share – a collateralised modelled quota share cession of non-proportional reinsurance treaties in the property catastro-phe, aviation and marine (including offshore) lines that we have placed in the ILS market for almost 20 years – with a capacity of USD 320 million for 2014.
We do not anticipate premium growth for our reinsurance busi-ness in the United Kingdom in the current year. Although rates in non-proportional motor reinsurance are likely to flatten out somewhat after the increases in previous years, the price level is still high. In direct business the focus of our subsidiary Inter Hannover is on risk selection with a view to further enhancing the quality of its portfolio. In South Africa we expect our rein-surance business and specialty lines to deliver modest premium growth and improved profitability in 2014.

122 Hannover Re | Annual Report 2013
Global reinsurance Treaty reinsurance worldwideThe premium volume for our portfolio of worldwide treaty rein-surance is expected to remain broadly stable.
The picture on European markets is again a mixed one for 2014: in Central and Eastern Europe demand for high-quality reinsurance protection remains unabated. In the treaty renew-als as at 1 January 2014 we achieved largely stable rates and conditions. Developments in Russia, where we enjoyed stronger demand for reinsurance protection for large infrastructure projects, were especially pleasing. We therefore enlarged our portfolio. Modest premium erosion was recorded only under programmes that had been spared losses. Thanks to our posi-tioning and selective underwriting policy we again expect to generate profitable growth for our portfolio in the markets of Central and Eastern Europe in the current year. In France, on the other hand, the market remains soft and no trend towards higher prices can currently be discerned. With this in mind, we do not intend to expand our business. In the countries of Northern Europe the volume should remain virtually stable. We anticipate a roughly unchanged premium volume for our portfolio in Spain and Portugal.
We were highly satisfied with the outcome of the treaty renew-als in Latin America. In both Brazil and Mexico we booked slightly higher prices. A further positive upswing is antici-pated in Brazil following the October elections, and this should deliver additional growth stimuli for the region. In view of the regulatory environment for cross-border reinsurance transac-tions, however, we expect to see a reduction in our premium income from Argentina in the middle of the year.
For the markets of the Asia-Pacific region we are looking at further premium growth. In Japan we expect stable demand for reinsurance covers; rates for natural catastrophe risks are likely to retreat in the April renewals, but should still remain on a good level. Overall, it is our assumption that our portfolio in Japan will deliver modest premium growth in the original currency. The region of South and Southeast Asia should prove to be an engine of growth in the current year and beyond. Consequently, we anticipate a further rise in premium vol-ume for our portfolio in this region. Rates in most markets of South and Southeast Asia are likely to remain broadly stable. Given that 2013 was another relatively untroubled year on the claims side in Australia and New Zealand, the pressure here on prices intensified. Nevertheless, we are looking to profitably enlarge our portfolio in these markets (adjusted for exchange rate effects) based on our local presence and long-standing client relationships. Particularly in Australia, the prudential regime newly adopted in 2014 should further drive demand for reinsurance.
Retakaful business is developing well. In this area we shall continue to concentrate on expanding profitable business and it is our expectation that the licence granted in principle in 2013 for a branch of Hannover ReTakaful in Labuan will lead to further sustained growth in Malaysia.
We also see additional growth potential in traditional reinsur-ance in the Middle East. Particularly crucial here are major projects such as Expo 2020 in Dubai and the FIFA Football World Cup 2022 in Qatar. All in all, gross premium volume for the current financial year should show a double-digit increase.
In the area of agricultural covers we anticipate undiminished demand. Key factors here are a growing demand for food and a greater need to protect against extreme weather events. In addition, the use of index-based insurance products – along with loss-based covers – is likely to increase, especially in the field of micro-insurance policies in developing countries. Han-nover Re’s premium volume for agricultural risks should again rise sharply in the current financial year.
Global catastrophe businessIn view of the protracted low interest rate environment, fur-ther capital on the ILS market can be expected to flow into global catastrophe reinsurance. Against this backdrop, the treaty renewals as at 1 January 2014 saw further rate reduc-tions, especially in US catastrophe business. On the other hand, in regions impacted by losses in 2013, such as Germany and Canada, we were able to secure rate improvements in some instances. The future trend in catastrophe business, particu-larly on the US market, will depend upon the major loss situ-ation in the current year. For 2014 we currently anticipate a reduced premium volume.
Facultative reinsuranceIn facultative reinsurance, too, the climate is becoming more competitive. The good results posted by insurers in 2013 as well as an adequate supply of capacity are keeping up the pressure on rates and conditions. Despite this, we anticipate attractive business opportunities. We are looking to book fur-ther growth in our portfolio of facultative risks in the current financial year. In addition, we set up a new department for the energy lines in order to further strengthen our position here.

123
Com
bine
d m
anag
emen
t re
port
Hannover Re | Annual Report 2013
Life and health reinsurance
Along with the effects of developments in the global economy, another major challenge facing the insurance industry is the constant shift in the age structure. Given that people are on average living longer, the need for corresponding insurance solutions remains consistently high. In 2014 we expect that demand for competitive and innovative insurance concepts designed to provide longevity coverage will rise around the world. Based on our long-standing expertise, it can be assumed that our customers will trust us to deliver fresh stimuli and appropriate reinsurance solutions.
Life and health reinsurance: Forecast development for 2014
Volume 1 Profitability 2
Financial Solutions ++
Risk Solutions
Longevity +
Mortality +
Morbidity + / –
1 In EUR, development in original currency may vary2 ++ = significantly above the cost of capital; + = above the cost of capital; + / – = on a par with the cost of capital; – = below the cost of capital
In Europe, the market is very largely saturated when it comes to traditional life insurance products. In recent years an emerging shift in the target group could already be observed, and in 2014 too we expect the primary market to cater increasingly to the needs of seniors. There will likely be no easing in the consider-able pressure to deliver competitive, cost-efficient and innova-tive products which focus on the needs of the over-sixties. If growth is to be generated, new products must be designed and existing product ranges expanded. In this context the primary emphasis will doubtless be on the biometric risk of morbidity, such as in long-term care insurance. Even if Germany is con-sidered in isolation, an attractive return cannot be anticipated for traditional life insurance in the coming years.
In 2014 we shall pay close attention to the Asian market and expect demand for financially oriented reinsurance solutions to remain strong. It may be assumed that the consistently grow-ing urban middle class will continue to take a closer interest in health coverage and retirement provision.
In the United States we anticipate further contraction in the risk-oriented life reinsurance market. We are nevertheless cau-tiously optimistic that we can again enlarge our market share in 2014. Furthermore, it is our expectation that effective portfolio management will be a success factor in this business segment going forward and will hence take on growing importance.
In addition to offering protection for biometric risks, we are also working on the assumption that primary insurers will have an increasing need for service offerings in 2014. In our assess-ment, an efficient combination of coverage for biometric risks and resource-saving processes will be reflected in stronger demand.
Investments
Against the backdrop of the European debt crisis – which has still to be overcome – and the associated uncertainties, we shall maintain the conservative orientation of significant parts of our investment portfolio. Nevertheless, irrespective of the issue of government debt, the improved economic outlook will be reflected in selective risk-taking. Our emphasis on broad diversification shall remain unchanged. By way of a neutral modified duration we shall continue to ensure that the interest rate risk is tightly managed.
The enlargement of the asset portfolio is expected to have a positive effect on investment income, although the average return will decline owing to sustained low interest rates. In view of the low returns on more secure investments, we shall continue to invest in products offering attractive credit spreads and selectively expand our portfolio in the areas of alternative investments and real estate.
Given the high capital requirements and potentially increased volatility on equity markets – which are in part driven by liquid-ity –, our cautious stance on investments in listed equities remains unchanged.
124 Hannover Re | Annual Report 2013
Outlook for the full 2014 financial year
In the current year, despite a challenging environment both on the capital market and in reinsurance business, we anticipate a good overall result for the Hannover Re Group.
Reflecting the assumptions described for the development of non-life and life and health reinsurance, we expect to generate stable or slightly higher gross premium for the current 2014 financial year based on constant exchange rates.
In view of the relatively soft market conditions in non-life rein-surance and our correspondingly selective underwriting policy, the premium volume for the current year is expected to remain broadly stable. Going forward, too, we shall not make any con-cessions to our systematic underwriting discipline and we shall reduce our shares in areas where the risks are not adequately priced. In terms of the targeted combined ratio, we expect a figure under 96%. We are aiming to generate an EBIT margin of at least 10%.
For our total life and health reinsurance portfolio we are look-ing to book organic, currency-adjusted growth in the low to mid-single-digit percentage range for 2014. The Value of New Business (VNB) should be in excess of EUR 180 million. We continue to anticipate EBIT margins of 2% for Financial Solu-tions and Longevity business and 6% for Mortality and Mor-bidity business.
The expected positive cash flow that we generate from the tech-nical account and our investments should – subject to stable exchange rates – lead to further growth in our asset portfolio. We are targeting a return on investment of 3.2%. In both non-life and life and health reinsurance it is our assumption that we shall accomplish our minimum IVC targets of 2% xRoCA for non-life reinsurance and 3% xRoCA for life and health reinsurance.
Assuming that the burden of major losses does not significantly exceed the expected level of EUR 670 million and that there are no downturns on capital markets, Hannover Re expects to generate Group net income in the order of EUR 850 million for the 2014 financial year.
As for the dividend, we continue to aim for our payout ratio of 35% to 40% of Group net income.
Our strategic objective is to generate a minimum return on equity within the Group that is 750 basis points above the risk-free interest rate. We also seek to increase both the earnings per share and the book value per share (including dividends paid) by at least 10% annually.
Events after the reporting date
Matters of special significance arising after the closing date for the consolidated financial statements are discussed in Sec-tion 8.11 of the notes “Events after the balance sheet date” on page 224.