Embed Size (px)
Citation preview

2019State of
Metropolitan Housing Report
EQUITIES22,000
AddressingRacial Gaps in
Homeownershipand Wealth

LETTER TO MHC MEMBERS
22,000 EQUITIES
Addressing Racial Gaps in Homeownership and Wealth01
In 1917, the U.S. Supreme Court overturned months of
work by Louisville’s city power brokers to codify, block by
block, where White people and where Black people were
allowed to live (Buchanan v. Warley). The Supreme Court
was not offended by the racial bigotry, but did not like the
limitation on the ability to contract. There was no epiphany
by Louisville’s city leaders that racial bigotry was wrong.
Indeed they hired a consultant to circumvent the Supreme
Court decision and enforce segregation. We still live with
the zoning basics of that time. And we have the outcome
they so strenuously fought for- segregation then, segregation
now and, until we change things, segregation forever (to
paraphrase George Wallace).
Land use was only one weapon of bigotry. By now you have
all seen the 1937 post flood redlining maps on lending that
the banking industry used. How does that play out today?
In many ways, but the newest discovery is that algorithms,
mathematical predictions based on past behavior, are based
on past bigotry thereby concretizing future bigotry.
As for real estate practices, restrictive covenants by race
were popular in Louisville and it was only in 1972 that the
U.S. Supreme Court finally outlawed all uses of restrictive
covenants, but the viewpoint was baked into the real estate
industry. It is no accident that half of all Black/African
American homeowners are in just 22 census tracts.
As we learned from our 2018 Annual Meeting keynote
speaker, Richard Rothstein, the federal government played
an ongoing, and quite overt role, in ensuring that while
subsidizing the entry of White households into home
ownership, Black/African American households were
excluded. Federally guaranteed loans to developers and
mortgages to households were explicitly limited to Whites.
The 2019 Metropolitan Housing Report zeroes in on one
area of the 2018 Report on Involuntary Displacement. While
there is a surge in real estate investment in West Louisville,
homeownership for Black/African American households in
Louisville is half that of White households and the median
income for Black/African American households is far less
than the median income of White households. Yet the
investment is focused on land, not residents. Fifty plus years
after the passage of local and national Fair Housing laws,
after the protests in the Parkland neighborhood, and after the
urban renewal “improvements”, the financial well-being of the
people in West Louisville neighborhoods has not kept pace
with the country in general.
The 22,000 Equities gap in Black/African American
homeownership documented in the 2018 Report symbolizes
the scale of the historical and ongoing disenfranchisement of
an entire population. Homeownership is certainly not the only
path to wealth creation even as it is sold to many as such.
We use the 22,000 Equities framework to focus on policies
that will address the racial wealth gap and simultaneously
promote access to safe, fair, and affordable housing.
Our analysis this year documents the housing, racial and
ethnic, and demographic changes from 2000 to 2017 in
Louisville/Jefferson County to tell the story of the development
and maintenance of wealth and housing gaps that will persist
unless policy changes are implemented at the local, state,
and federal level. We also provide a critical summary of
several new affordable housing and community development
initiatives. These initiatives are making some important positive
changes but are not fully equipped to address the affordable
housing gaps let alone any racial wealth gaps.
Our findings show that in Louisville/Jefferson County, between
2000 and 2017, Black/African American homeownership
rates declined, Black/African American homeowners
experienced disproportionate losses in home values, Black/
African American household incomes continue to remain far
below the median income of Louisville/Jefferson County, and
Black/African American households earn a disproportionate
share of Louisville/Jefferson County’s ‘income pie’. All of
these facts unveil the scale of the racial wealth gap and the
obstacles Black/African American households face in building
and maintaining wealth.
Russell has the only geographically focused initiative on
helping the residents. MHC is very excited about this and
we will be working with Russell: A Place of Promise to see
how this concerted effort and focus of services brings
success to the current residents, so we can replicate that
success in other neighborhoods.
The urgency of addressing the disparities made MHC rethink
the presentation in this report. The old format for the Report
has been replaced. All the data is integrated into the narrative
and some data has not been updated. Do we really need new
maps of the segregation by race, female-headed households,
persons with disabilities and Latinx households? Spoiler
alert– NOT MUCH HAS CHANGED. Rather than repeating this
message, we call for the next step—changing our legacy
policies that hold us back.
Stacy Deck, Ph.D. MHC Board Chair
Cathy Hinko Executive Director Metropolitan Housing Coalition

2019
State of Metropolitan Housing Report 02
MHC’s key accomplishments in the last year:
• MHC helped mobilize YOU to ensure that the new
Comprehensive Plan included clear imperatives for fair
housing and affordable housing. That directly led to the
inclusion of affordable housing in the new proposed
complex called One Park. It was thrilling to see the staff
of Planning and Design incorporate the new housing
part of the Comprehensive Plan and to see the Planning
Commission empowered to commit to it in a zoning case.
Our next job is to get a predictable matrix for inclusion of
the housing and, in the case of commercial and industrial
development, get funding for the Louisville Affordable
Housing Trust Fund to ensure housing affordable to workers.
• MHC’s new initiative of 22,000 Equities is the inspiration
for this year’s report. Ending the disparity in wealth
building for those in fair housing protected classes is a
big goal, but you share our vision!
• MHC ensured that civil issues were a part of the public
discussions on Race & the Kentucky Courts, initiated by
Kentucky Supreme Court Chief Justice John D. Minton,
Jr. and Kentucky Court of Appeals Chief Judge Denise G.
Clayton. MHC has focused Coalition efforts on evictions
and foreclosures. The Court system has been very
receptive to discussing the issues
• MHC has expanded its commitment to raising the issues
for renters in other ways as well. We are beginning a
new educational process – to have renters talk about
their lack of power in a rental relationship, talk about
the deteriorating physical conditions of rental housing
stock, talk about the lack of power in Eviction Court. We
are also working with Coders for Kentucky as they work
towards a useful app for renters to save documents,
letters, and pictures and have access to standard letters
for issues like physical conditions in the unit. MHC has
been privileged to work with a powerful group of social
assistance providers who want to see a meaningful
eviction diversion program in Louisville- it is far less
expensive (in several ways) to keep a family stable than
to recover from an eviction.
• MHC received grants from the Louisville Bar Foundation
and the Louisville Affordable Housing Trust Fund (LAHTF) to
create Renter Center, a rental readiness program designed
to educate renters about their rights and responsibilities and
how to have a successful tenure as a renter. We are adding
two more videos. You can view the videos and find the
Interactive Affordability Calculator on our website at http://
www.metropolitanhousing.org/resources/rentercenter/.
• MHC convened a Fair Housing Month Forum in April
2019 entitled “Work to End Segregation! The Housing
Needs Assessment Recommendations and Fair Housing.”
The forum featured individuals from the Louisville
Affordable Housing Trust Fund, Lexington Fair Housing
Council, Louisville Metro Human Relations Commission,
and Louisville Metro Office of Housing & Community
Development.
• MHC acted as an Intervener before the Kentucky Public
Service Commission with our attorney Tom Fitzgerald
through the Kentucky Resources Council. MHC has helped
prevent more costly utility raises and championed the
retention of the WeCare program for energy efficient
housing. But now we have a case against the Public
Service Commission who summarily threw us, Community
Ministries, and Community Action of Lexington out of
a case, changing years of precedent. We believe no
agency is above meaningful judicial review of outrageous
decisions. Our Kentucky government has three branches
to enforce our Constitution.
• MHC remains involved with the zoning case that
prohibited apartments for lower income seniors in east
Jefferson County. A fair housing case was filed. We
will continue to combat the underlying racism of the
prohibition in all parts of Jefferson County.
• MHC helped fund the creation of many of the affordable
housing units our community needs through the MHC
revolving loan pool.

TABLE OF CONTENTS
22,000 EQUITIES
Addressing Racial Gaps in Homeownership and Wealth03
Letter to MHC Members .................................................................................................................................................... 01
Introduction: Why 22,000 Equities? .................................................................................................................................. 04
22,000: How Did We Get Here? ..................................................................................................................................... 05
Documenting the Wealth Gap in Income and
Housing: Louisville/Jefferson County, 2000-2017 ........................................................................................................... 07
Racial and Ethnic Demographic Shifts ........................................................................................................................... 07
Housing Trends .............................................................................................................................................................. 07
Homeownership by Race and Ethnicity ................................................................................................................... 09
Household Income Trends: Growing Inequality ............................................................................................................... 11
Louisville/Jefferson County Income Inequality ........................................................................................................ 11
Cost and Rent Burdened Households by Income ........................................................................................................... 14
Comparing Black Homeownership Experiences: A Closer Look at Russell and Shively ................................................. 15
Homeownership in Russell and Shively ......................................................................................................................... 16
Household Income and Home Values in Russell and Shively ......................................................................................... 17
Measures of Displacement and Housing Insecurity: Homelessness,
Utility Disconnections, Evictions and Foreclosures, Louisville /Jefferson County ........................................................... 19
Homelessness ............................................................................................................................................................... 19
Residential Utility Disconnections .................................................................................................................................. 21
Eviction and Foreclosure Follow-up ............................................................................................................................... 21
Select Louisville Housing and Community Development Initiatives ............................................................................... 23
Focus on Russell ........................................................................................................................................................... 24
Choice Neighborhood Grant ................................................................................................................................... 24
Resident Relocation and Service Provision Activities ........................................................................................ 25
Redevelopment Activities ................................................................................................................................. 26
People Activities............................................................................................................................................... 27
Russell: A Place of Promise ..................................................................................................................................... 27
Overview ......................................................................................................................................................... 27
Organizational Structure .................................................................................................................................. 28
Grant Goals and Activities ................................................................................................................................ 29
Louisville Affordable Housing Trust Fund (LAHTF) and Creating Affordable Residences for Economic Success (CARES) ....... 30
Understanding Area Median Income (AMI) and Median Income.............................................................................. 31
How do these efforts address the 22K Equities Gap? ..................................................................................................... 35
How Should Louisville/Jefferson County Address the Racial Wealth/Housing Gap? ...................................................... 36
Endnotes ............................................................................................................................................................................. 41
References ......................................................................................................................................................................... 42
2019 State of Metropolitan Housing Report Funders ....................................................................................................... 44
2019 Annual Meeting Sponsors ........................................................................................................................................ 44
Sponsors of Other MHC Events ......................................................................................................................................... 44
2019 MHC Board of Directors ........................................................................................................................................... 45
Foundations and Grant-Making Institutions ...................................................................................................................... 45
MHC Staff ........................................................................................................................................................................... 45
Acknowledgements ............................................................................................................................................................ 45
MHC Members ................................................................................................................................................................... 46

Addressing Racial Gaps in Homeownership and Wealth
EQUITIES22,000
IntroductionWhy 22,000 Equities?
The number 22,000 in the title of this year’s report is roughly
the number of Black/African American households that would
need to become homeowners to erase the gap between
Black and White homeownership in Louisville/Jefferson
County. This number, 22,000 households, represents just
over 1/3 of the 2017 Black/African American households in
Louisville/Jefferson County.
However, this number represents more than a gap in
homeownership: 22,000 Equities symbolizes the
historical and ongoing disenfranchisement of an entire
population. It reflects the unequal access to homeownership
and wealth-building opportunities among Black/African
American households. It reflects the racial wealth gap in
Louisville/Jefferson County.
Homeownership is by far the primary way that Black/African
Americans1 build wealth and it has a cultural meaning that
symbolizes achievement and prosperity (Oliver and Shapiro
1995). More generally, homeownership offers other benefits,
including improved psychological and physical health, a
lowered likelihood of having to move, greater neighborhood
residential stability that improves school outcomes, and
improved social and political interaction among residents
(Wiedrich and Newville 2019). Although homeownership
is not the only avenue for wealth-building, quantifying the
homeownership gap provides an understanding of the
enormity of one aspect of wealth inequity between White
residents in Louisville/Jefferson County and households of
color. The extent to which homeownership remains out of
reach for people of color is symbolic of their exclusion from
social benefits that many Whites take for granted.
At the same time, homeownership experiences are
varied. Homeownership by itself is not a guaranteed
avenue for building wealth and the value that accrues
from homeownership often depends on factors beyond
an individual’s control. While there are racial gaps in
homeownership (who owns and who does not), racial
gaps also exist between homeowners’ experiences as a
group. In other words, the social and economic systems
(e.g. employment, income, education, banking access) that
privilege White people overall intersect with homeownership,
and facilitates wealth-building more effectively for White
homeowners compared to non-White homeowners.
Documenting racial disparities in homeownership rates is
useful in demonstrating unequal access to one of the most
powerful wealth-building paths in the United States. In the
2018 State of Metropolitan Housing Report, we noted that
the 2017 American Community Survey data showed that the
gap between Black and White homeownership continued
to widen in Kentucky, the Louisville MSA, and Louisville/
Jefferson County (MHC 2018). This is also true for Hispanic/
Latinx households. In addition, White homeownership rates
remained stable from 2016 to 2017, while the rates for
both Black and Hispanic/Latinx homeowners fell slightly.
These differences in percentages represent real families and
households.
Photo provided by Special Collections: Photographic Archives University of Louisville
2019
State of Metropolitan Housing Report 04

While the gap in homeownership by race is most pronounced
for Black/African American households, homeownership
among Hispanic/Latinx households2 also trails that of White
households. The difference is numerically smaller (about
3,700 households would need to become homeowners)
than among Black/African Americans, but represents a similar
proportion, about 1/3 of the 2017 Hispanic/Latinx households
in Louisville/Jefferson County.
Zooming out to the national level, the racial wealth gap
is defined as the difference in the median household
wealth between different racial groups (Amadeo 2019).
In 2016, Black median wealth was only 7 percent that of
non-Hispanic Whites ($9,590 and $130,800, respectively)
(U.S. Census Bureau 2016). Similarly, the median wealth
of Hispanics (any race) is only $17,530 or 13 percent
of non-Hispanic Whites. Perceptions of the racial wealth
gaps among Whites differ vastly from the economic reality.
Whites severely underestimate the racial wealth gap; on
average, they guess that Black wealth is about 80 percent
that of Whites (Kraus, Rucker and Richeson 2017).
The gap in homeownership is a particularly important
manifestation of larger racial inequities because it
ultimately results in less political voice. In U.S. cities
and neighborhoods, scholars characterize homeowners
as “homevoters” whose collective property rights are
protected through local zoning (Fischel 2001). In this
view, homeowners are strongly motivated to control local
government because the value of their largest asset depends
on local policy, especially schools. In turn, local politicians
respond to homeowners because they pay taxes and are
most likely to vote. Thus, 22,000 Equities translates to greater
political power and distributional equity.
The Metropolitan Housing Coalition’s use of 22,000
Equities is intended to highlight one part of the racial
wealth gap and provide a more concrete understanding
of one of the obstacles for achieving equitable access
to wealth-building paths for communities of color, and
particularly, Blacks/African Americans. Homeownership
is not, nor should it be the only path to wealth-building.
Furthermore, the racial wealth gap will not be solved simply
by narrowing the gap between Black/African American and
White rates of homeownership. Finally, rather than a narrow
policy focus on single-family homeownership, models of
collective ownership are a critical need missing from the
Louisville housing landscape and are also missing from
discussions of solutions to address both affordable housing
and racial equity.
22,000 EQUITIES
Addressing Racial Gaps in Homeownership and Wealth05
We use the 22,000 equities framework to focus on the racial
wealth gap and connect it to the need to pursue policies that
promote safe, fair, and affordable housing. Making substantial
progress in closing the 22,000 equities gap through the pursuit
of ambitious milestones would mean facing head-on the
racial inequities in housing that have accumulated because
of historical and current racist policies and practices. It would
mean developing pathways to economic stability that also
promote a sense of attachment to one’s neighborhood and
civic pride for a significant number of Black/African American
households. The material resources necessary to turn good
intentions into reality will reflect our local commitment
to spark paths to prosperity that will lead to safer and
more secure neighborhoods. This will enable residents to
contribute their own share to the stimulation of Louisville’s
local economy, and help our city become more racially and
economically integrated.
22,000: How Did We Get Here? Federal housing policies created during the middle of the
20th century significantly shaped housing opportunities
across the U.S. for decades to come. For instance, in 1933, the
Home Owners Loan Corporation (HOLC), established as a part
of President Franklin D. Roosevelt’s New Deal, created the now
notorious redlining maps, a grading system used to determine
which residential areas were worthy of mortgage financing
and which were not. Areas designated in red on HOLC maps
were deemed “hazardous” and riskier for mortgages. The race
and ethnicity of residents was a key factor in determining risk
levels, and neighborhoods with Black, immigrant, and foreign-
born residents consistently received the lowest ratings, which
were reflected in red on the maps. Areas receiving the highest
grade were shaded green, which indicated that they were
virtually free of any Blacks or foreign-born persons.
Racist housing practices existed prior to HOLC. The federal
government built racially segregated public housing, local
zoning ordinances permitted the regulation of land based
on the race of residents, and racially restrictive deed and
covenants allowed the restriction of property sales based on
race. However, the HOLC maps are important because they
created a framework that would perpetuate the systematic
exclusion of non-White households from expanded mortgage
lending and new housing opportunities in suburban
locations after WWII. By 1968, the passage of the Fair
Housing Act, complementing other Civil Rights legislation,
was predicated on changing the overt racism dominating the
housing system.

2019
State of Metropolitan Housing Report 06
This historical period demonstrates the relational roots of
the racial gap in homeownership. We use the term relational
to highlight the fact that when socially differentiated groups
share space, the advantages that flow exclusively to one
group equate to disadvantages for other groups (Tilly
1998). Conversely, penalties directed exclusively to one
or a few groups yield advantages to the other groups who
are not penalized. This leads to some groups being doubly
privileged, some groups being doubly disadvantaged,
and other groups being somewhere in-between. Whites,
who benefited from the housing policies described above,
were doubly privileged by having their 30-year, low-
interest mortgages backed by the federal government and
by escaping the racial penalties that Blacks and others
experienced. Blacks, on the other hand, were doubly
disadvantaged through their exclusion from the suburban
homeownership-based wealth building process financed
by government-based mortgages and by having their
neighborhoods redlined and stigmatized as unworthy of
investment (Oliver and Shapiro 1995, Rothstein 2017).
The roots of more recent concerns related to widespread
disinvestment and neighborhood changes resulting in
gentrification and displacement can be traced to processes
that began during the mid-twentieth century. For example,
White flight, or the out-migration of economically mobile
White households away from neighborhoods that experience
increasing in-migration of non-Whites, continues to
disadvantage both Black residents and the White residents
who remain. White flight occurs in both urban and
suburban settings and is often accompanied by the flight of
capital investment, which leads to the economic decline of
neighborhoods (Pattillo 1999, Rothstein 2017).
In a cyclical process, the depressed property values that
result from White flight and economic decline eventually
compel capital investment in some of the areas due to
market perceptions of their geographical potential and the
low transaction costs involved in acquiring property (Zuk et
al. 2018). The dominant pattern so far is investments of this
form taking place near central business districts and other
urban amenities (Zuk et al. 2018). All things being equal, once
capital investment begins flowing into communities that were
previously economically depressed, the benefits tend to accrue
to the recent property owners and new residents, not to the
long-term residents who weathered the storm of disinvestment
(Owens 2012). The cycle described here underscores the
human reality and the connection between structural racism
and economic valuations of place. These aspects of place-
making are too often characterized as simply predictable
neighborhood changes driven by anonymous economic,
housing, and real estate market patterns.
The accumulation of place-based advantages for Whites and
place-based disadvantages for Blacks remains evident in the
stark racial segregation that pervades Louisville and many
other U.S. cities, alongside a widening racial wealth gap. The
Fair Housing Act did not wipe clean the decades of racial
discrimination in housing (Massey 2015, Rothstein 2017),
Evidence suggests that discrimination in housing simply changed
form, from explicit to implicit or “color-blind” racism (Bonilla-Silva
2013, Feagin and Sikes 1994, Korver-Glenn 2018, Taylor 2019).
For example, instead of African American homebuyers being
outright rejected from a neighborhood they desire, their calls may
be ignored or real estate agents may lie about the property being
sold (Feagin and Sikes 1994). Segregation has been reinforced
in Louisville through the redevelopment of public housing.
Hanlon (2010) shows how the Park duValle HOPE VI project
resulted in many residents relocating to neighborhoods that
were also disproportionately Black/African American and had
higher poverty rates. Walker and Hanchette (2015) find similar
patterns of persistent racial segregation among residents
relocated from the Clarksdale public housing site. While some
progress has been made, for instance, research shows that
residential segregation has declined overall since the 1970s,
a wide chasm remains between the depths of the housing
inequities and our collective will to erase the inequities
(Madden and Ruther 2018). The report’s focus on 22,000
equities acknowledges this reality, helps describe the specific
nature of the challenges in Louisville/Jefferson County, and
sets forth recommendations to reduce the existing inequities.
Photo provided by Special Collections: Photographic Archives University of Louisville

22,000 EQUITIES
Addressing Racial Gaps in Homeownership and Wealth07
-7
-6
-5
-4
-3
-2
-1
0
1
2
3
4
5
6
7
8
5.9%
1.7%2.3%
0.1%
-4.6%
5.9%
1.7%2.3%
0.3%
-6.5%
2.0%
0.8% 0.6%0.2%
-1.9%
5.9%
1.7%2.3%
0.1%
-4.6%
8.0%
2.5%2.9%
0.3%
-6.5%
2.0%
0.8% 0.6%0.2%
-1.9%
Change 2000-2012 Change 2012-2017 Change 2000-2017Change 2000-2012 Change 2012-2017 Change 2000-2017
Documenting Wealth Gaps in Housing and Income
Louisville/Jefferson County 2000-20173
The housing, racial and ethnic, and demographic changes
from 2000 to 2017 in Louisville/Jefferson County tell the
story of the development and maintenance of wealth and
housing gaps that will persist into 2020 unless policy
changes are implemented at the local, state, and federal
level.
Racial and Ethnic Demographic Shifts
Between 2000 and 2017, population and households
increased in Louisville/Jefferson County, rising by 10.2 and
8.0 percent, respectively. Over the same period, the racial/
ethnic composition of households shifted in Louisville/
Jefferson County (Figure 1). Generally, this change reflects
increases in non-White households. Following national
trends, Hispanic/Latinx households increased by 2.5
percentage points from 1.2 to 3.7 percent of all households.
Multiracial households increased to 1.5 percent of all
households in 2017, up from 1.3 percent in 2000. Black/
African American households experienced the largest
percentage point growth from 2000, increasing by 2.9
percentage points from 17.8 percent of total households to
20.7 percent. Non-Hispanic White households declined from
78.6 to 72.1 percent of all households from 2000 to 2017.
Housing Trends4
From 2000 to 2017, owner-occupied housing units declined
by 3.4 percentage points in Louisville/Jefferson County, from
64.9 percent in 2000 to 61.5 percent in 2017, which is roughly
similar to the nationwide trends over the same time period that
show an increase in renters and declines in homeownership
(+/- 2.4 percent). Over the same period, there was strong
growth in median home values nationally (21.6 percent) while
homes values in Louisville/Jefferson County grew at a somewhat
slower pace (10.8 percent). Median gross rents4 also increased
substantially over this period, growing by 14.6 percent nationally
and 13.8 percent in Louisville/Jefferson County. In 2000, median
gross rent in Louisville/Jefferson County was $703 and by 2017
had increased to $800. Additionally, median gross rent increased
by 13.3 percent from 2012-2017, outpacing the national rate of
10.5 percent for the same time. In short, rents increased at slightly
faster pace than home values from 2000-2017 in Louisville/
Jefferson County, which differs from the national trend where
home values outpaced rental increases over the same period.
Although median home values grew overall from 2000-2017,
Map 1 shows that this growth was not evenly distributed across
Louisville/Jefferson County. In fact, in more than half of all census
tracts (58.1 percent), median home values declined over this
period. Tracts with declining home values are dispersed across
Louisville/Jefferson County, but places that experienced the
largest declines in median home value are concentrated in
western and south-central Louisville/Jefferson County.
Figure 1: Percent Change in Households by Race/Ethnicity, 2000-2017, Louisville/Jefferson County
Total Households
Percent Hispanic/Latinx Households
Percent non-Hispanic Black/African American Households1
Percent non-Hispanic White Households
Percent Multiracial Households
SOURCE: Census 2000 Summary File 3; American Community Survey, 2008-2012 and 2013-2017 5-year estimatesNote: 1- Census 2000 data are Black alone households
2019
State of Metropolitan Housing Report 08
For example, from 2000-2017, tracts in Portland (tract 3.00)
and Shawnee (tract 7.00) saw real median home values
decrease by 38.4 percent and 40.9 percent, respectively.
There is also a distinctive pattern of growth in median home
values among census tracts located inside the Watterson
Expressway and east of 9th Street.
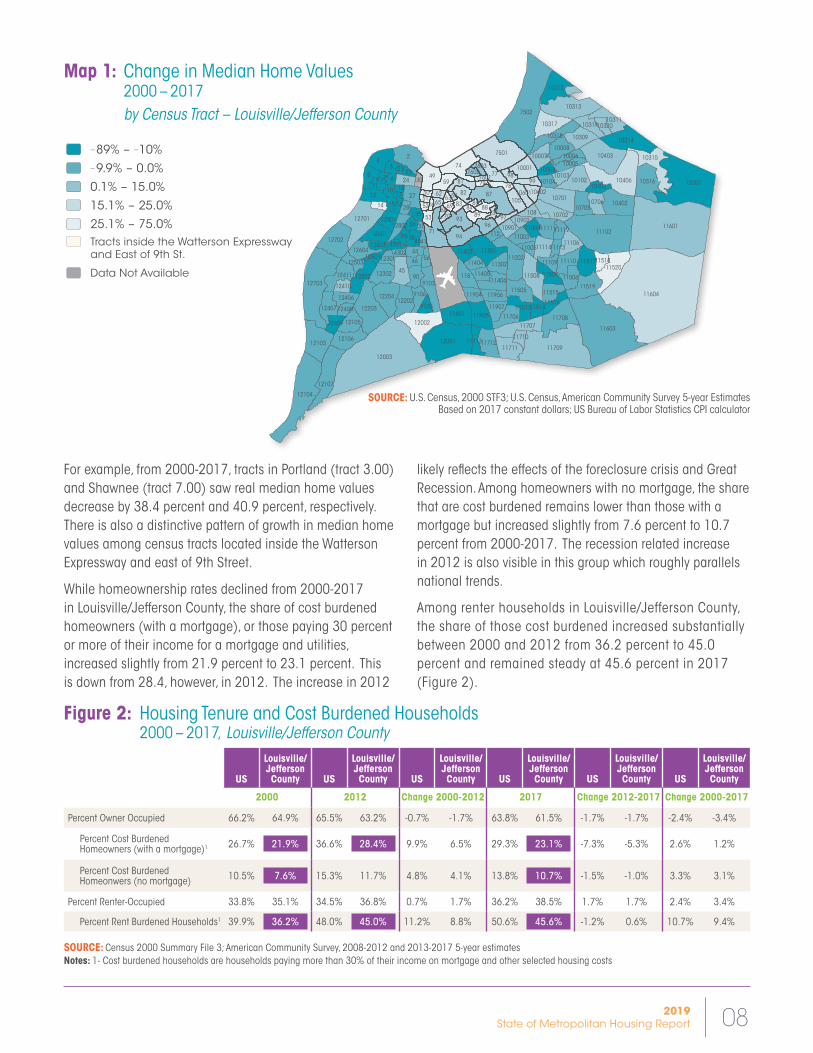
While homeownership rates declined from 2000-2017
in Louisville/Jefferson County, the share of cost burdened
homeowners (with a mortgage), or those paying 30 percent
or more of their income for a mortgage and utilities,
increased slightly from 21.9 percent to 23.1 percent. This
is down from 28.4, however, in 2012. The increase in 2012
likely reflects the effects of the foreclosure crisis and Great
Recession. Among homeowners with no mortgage, the share
that are cost burdened remains lower than those with a
mortgage but increased slightly from 7.6 percent to 10.7
percent from 2000-2017. The recession related increase
in 2012 is also visible in this group which roughly parallels
national trends.
Among renter households in Louisville/Jefferson County,
the share of those cost burdened increased substantially
between 2000 and 2012 from 36.2 percent to 45.0
percent and remained steady at 45.6 percent in 2017
(Figure 2).
11604
12003
11601
11603
7502
2
11709
11102
10307
4
9801
87
12703
12104
12001
74
71
7501
94
1040649
10313
93
12203
8
10403
45
12701
12107
10314
11708
27
12702
12002
12103
77
12
11002
3
10316
11520
10402
90
10701
10315
11508118
59
12204
11301
96
11519
11901
9103
10312
11707
10317
82
101026 81
11905
11711
12106
11505
12411
11712
24
11517
105
12202
99
10309
89
44
12302
38
10001
11406
11110
11106
10702
12407
7
10008
108
78
88
12601
11706
35
56
12105
39
11114
98
11111
10705
36
46
10007
12604
11506
53
115159106
11907
11302
83
10
2814
11906
15
11003
12801
12406
11403
62
65
10901
30
11405
41
11404
52
18
126034302
10318
12502
10311
11
97
11509
10319
11513
10706
9
11514
10005
112
11904
11713
11516
12409
12802
1110912503
11004
16
1060110405
10103
9105
23
10006
11112
69
11518
12410
10602
70
10104
10320
84
4301
51
11710
21
79
63
10004
10902
12301
85
11005
5017
11113
37
12408
13168
12501
7602
64
40
66
7603
7601
Map 1: Change in Median Home Values 2000 – 2017
by Census Tract – Louisville/Jefferson County
Figure 2: Housing Tenure and Cost Burdened Households 2000 – 2017, Louisville/Jefferson County
– 89% – – 10%
– 9.9% – 0.0%
0.1% – 15.0%
15.1% – 25.0%
25.1% – 75.0%
Tracts inside the Watterson Expressway and East of 9th St.
Data Not Available
SOURCE: U.S. Census, 2000 STF3; U.S. Census, American Community Survey 5-year EstimatesBased on 2017 constant dollars; US Bureau of Labor Statistics CPI calculator
US
Louisville/ Jefferson County US
Louisville/ Jefferson County US
Louisville/ Jefferson County US
Louisville/ Jefferson County US
Louisville/ Jefferson County US
Louisville/ Jefferson County
2000 2012 Change 2000-2012 2017 Change 2012-2017 Change 2000-2017
Percent Owner Occupied 66.2% 64.9% 65.5% 63.2% -0.7% -1.7% 63.8% 61.5% -1.7% -1.7% -2.4% -3.4%
Percent Cost Burdened Homeowners (with a mortgage)1 26.7% 21.9% 36.6% 28.4% 9.9% 6.5% 29.3% 23.1% -7.3% -5.3% 2.6% 1.2%
Percent Cost Burdened Homeonwers (no mortgage) 10.5% 7.6% 15.3% 11.7% 4.8% 4.1% 13.8% 10.7% -1.5% -1.0% 3.3% 3.1%
Percent Renter-Occupied 33.8% 35.1% 34.5% 36.8% 0.7% 1.7% 36.2% 38.5% 1.7% 1.7% 2.4% 3.4%
Percent Rent Burdened Households1 39.9% 36.2% 48.0% 45.0% 11.2% 8.8% 50.6% 45.6% -1.2% 0.6% 10.7% 9.4%
SOURCE: Census 2000 Summary File 3; American Community Survey, 2008-2012 and 2013-2017 5-year estimatesNotes: 1- Cost burdened households are households paying more than 30% of their income on mortgage and other selected housing costs

22,000 EQUITIES
Addressing Racial Gaps in Homeownership and Wealth09
Homeownership by Race and Ethnicity
The ability to accrue wealth through homeownership is
not evenly distributed by race or ethnicity in Louisville/
Jefferson County. This is magnified for Black/African American
households. Figure 3 shows the rates of homeownership
by race/ethnicity in Louisville/Jefferson County in 2000,
2012, and 2017. Paralleling their overall growth, the rate
of homeownership among Hispanic/Latinx households
increased by nearly 10 percentage points from 2000-2017,
although it declined slightly from a 2012 high of 38.5
percent. The total number of Hispanic/Latinx homeowners in
Louisville/Jefferson County grew from 901 in 2000, to 4,145
in 2017, an increase of 360 percent, which outpaces the
overall growth among Hispanic/Latinx households. In contrast,
the rate of homeownership for Black/African American
households decreased from 40.2 percent in 2000 to 36.1
percent in 2017. The rates for both of these groups remain
well below rates for non-Hispanic White households, which
declined slightly over this period from 71.7 percent (2000)
to 70.8 percent (2017). As Figure 3 shows, homeownership
rates among non-Hispanic White households had fully
recovered to pre-Great Recession rates in 2012.
With fewer homeowners, Black/African American households
have not benefitted from wealth-building opportunities that
more White and increasingly Hispanic/Latinx households
experienced through homeownership.
As shown in Map 1, changes in home values exhibit wide
variation across tracts. When comparing the changes
in median home values to the location of Black/African
American homeowners, the data indicate that Black/
African American households likely have not shared
equally in the overall home value gains from 2000-2017.
Map 2 shows that Black/African American homeowners
are highly concentrated in just a handful of census tracts.
451
370
347366 433
591
440
831
1245
537
1166
372372
578
470419
726367
390390
329 435 440440
450450
Map 2: 22 Tracts Containing 50% of Total Black/African American Homeowners in Louisville/Jefferson County (2017)
Number of Black/African American Homeowners
Tracts with fewer than 330 Black/African American Homeowners
Louisville/Jefferson County Totals:
Non-Hispanic Black/African American Homeowners: 23,170
Non-Hispanic Black/African American Homeownership Rate: 36.1 per 100 Households
Total Non-Hispanic White Homeowners: 158,189
Non-Hispanic White Homeownership Rate: 70.8 per 100 Households
SOURCE: U.S. Census, American Community Survey 5-year Estimates (2013-2017)
Figure 3: Homeownership Rates by Race/Ethnicity Louisville/Jefferson County, 2000, 2012, 2017
SOURCE: Census 2000 Summary File 3; American Community Survey, 2008-2012 and 2013-2017 5-year estimates
0%
10%
20%
30%
40%
50%
60%
70%
80%
26.2%
40.2%
71.7%
38.5% 37.6%
71.5%
36.0% 36.1%
70.8%
26.2%
40.2%
Census 2000 ACS 2012 ACS 2017
71.7%
38.5% 37.6%
71.5%
36.0% 36.1%
70.8%
Hispanic/Latinx Non-Hispanic Black Non-Hispanic White

2019
State of Metropolitan Housing Report 10
Just twenty-two tracts contain half of all Black/African
American homeowners in Louisville/Jefferson County,
and in 16 of these tracts, median home values declined
from 2000-2017. Lower rates of homeownership among
Black/African American households combined with their
segregation in areas where home prices have declined
contributes to the uneven distribution of local political
power derived from homeownership and public assets such
as school funding.
Map 3 displays the geographic distribution of changes
in the rates of Black/African American homeowners from
2000-2017 across Louisville/Jefferson County. Overall, the
rate of homeownership among Black/African American
households declined in over half of all tracts (54 percent).
While these tracts are dispersed throughout Louisville/
Jefferson County, highlighting that Black/African American
homeownership decreased all over the county, many tracts
in West Louisville experienced declines in Black/African
American homeownership. For example, in census tract
3.00 which includes parts of the Portland neighborhood,
the rate of Black/African American homeownership dropped
from 53.6 percent to 29.7 percent. Census tract 7.00, which
includes parts of the Shawnee neighborhood, the population
remained over 90 percent Black/African American from 2000-
2017, yet Black/African American homeownership declined
from 56.2 percent in 2000 to 44.7 percent in 2017. Certainly,
the foreclosure crisis likely influenced some of the losses in
Black/African American homeownership observed over this
period, and rates of homeownership are generally lower here
than in other parts of Louisville/Jefferson County. However, as
new investments pour into West Louisville neighborhoods, the
questions of “who benefits?” and “who owns the change?”
remain important ones to be answered. These data points,
combined with others in this report, indicate that an explicit
racial equity lens is necessary and that policy tools are
needed to help build and retain Black/African American
homeownership and wealth in West Louisville.
11604
12003
11601
11603
7502
2
11709
11102
10307
4
9801
87
12703
12104
12001
74
71
7501
94
1040649
10313
93
12203
8
10403
45
12701
12107
10314
11708
27
12702
12002
12103
77
12
11002
3
10316
11520
10402
90
10701
10315
11508118
59
12204
11301
96
11519
11901
9103
10312
11707
10317
82
101026 81
11905
11711
12106
11505
12411
11712
24
11517
105
12202
99
10309
89
44
12302
38
10001
11406
11110
11106
10702
12407
7
10008
108
78
88
12601
11706
35
56
12105
39
11114
98
11111
10705
36
46
10007
12604
11506
53
115159106
11907
11302
83
10
2814
11906
15
11003
12801
12406
11403
62
65
10901
30
11405
41
11404
52
18
12603
4302
10318
12502
10311
11
97
11509
10319
11513
10706
9
11514
10005
112
11904
11713
11516
12409
12802
1110912503
11004
16
1060110405
10103
9105
23
10006
11112
69
11518
12410
10602
70
10104
10320
84
4301
51
11710
21
79
63
10004
10902
12301
85
11005
5017
11113
37
12408
13168
12501
7602
64
40
66
7603
7601
Map 3: Change in Black/African American Homeownership 2000-2017
by Census Tracts – Louisville/Jefferson County
– 99.0% – – 51.0%
– 50.9% – 0.0%
0.1% – 10.0%
10.1% – 33.3%
33.4% – 76.8%
Tracts with too few Black homeowners to compute change
Data Not Available
SOURCE: U.S. Census, 2000 STF3; U.S. Census, American Community Survey 5-year Estimates
Photo provided by Louisville Metro Housing Authority

22,000 EQUITIES
Addressing Racial Gaps in Homeownership and Wealth11
Louisville/Jefferson County Income Inequality
The racial homeownership disparities documented in
Louisville/Jefferson County intersect with broader trends
in income inequality that magnify wealth gaps and thus
perpetuate homeownership gaps. At the root of racial
homeownership differences are an intergenerational lack
of economic resources that more generally allow families
to build wealth and to access economic benefits across
generations (Sharkey, 2013). Examining the Gini coefficient
for Louisville/Jefferson County and analyzing the distribution
of total income among the top and bottom earners are two
ways of better understanding local income inequality, an
important component of the wealth gap.
How far apart are the high-income households from the low-income households?
In 2017, the Gini coefficient for Louisville/Jefferson County
was .481, which is identical to the income inequality across
the U.S. and represents a slight increase (1 percent) since
2012. Furthermore, we know that the U.S. is one of the most
unequal countries in the world with inequality levels similar
to Russia, Mexico, Turkey and Chile (OECD, 2016).
Household Income Trends: Growing Inequality
Nationally, median household income declined by 3.5
percent from 2000-2017. In Louisville/Jefferson County,
median household incomes in 2017 were 7.0 percent
lower than in 2000. However, from 2012-2017, median
household income grew in Louisville/Jefferson County by
4.8 percent indicating a recovery that outpaced national
growth (1.8 percent). Meanwhile, poverty rates declined
slightly from 2012-2017 nationally (0.3 percent) and in
Louisville/Jefferson County (1.5 percent). However, overall,
persons experiencing poverty increased since 2000,
nationally rising 2.2 percentage points and locally 2.6
percentage points. Even though incomes are recovering
somewhat, poverty rates continue to increase. Furthermore,
the share of cost-burdened renters remained higher in
2017 than in 2000. Collectively, these data points indicate
the impacts of rising housing costs and result in greater
income inequality.
What is the Gini Coefficient? The Gini coefficient is a measure of income inequality
within a population distribution. The coefficient ranges
from zero to one, with zero representing perfect
equality and one representing perfect inequality. For
example, if all residents in Louisville/Jefferson County
earned the same income, the Gini coefficient would be
zero. On the other hand, if one resident earned all the
income in Louisville/Jefferson County,
while everyone else earned
nothing,
the Gini
coefficient
would be one.
How is the ‘income pie’ divided?
Since 1970, income inequality between the top earners
and households in the middle and lower parts of the
income distributions has sharply widened. Income growth
has continued steadily for top earners while earnings have
stagnated for households further down the income ladder.
Wealth is even more concentrated than income – “the best
survey data show that the share of wealth held by the top 1
percent rose from just under 30 percent in 1989 to nearly
39 percent in 2016, while the share held by the bottom
90 percent fell from just over 33 percent to less than 23
percent over the same period” (Stone et al. 2019:1).
Comparing incomes among the top fifth to the bottom fifth
of households shows the proportion of the total income
each group earns. In 2017, Louisville/Jefferson County
households in the top 20 percent earned 51.6 percent
of the total income pie. At the other end of the spectrum,
households in the bottom 20 percent only earned only 3.2
percent of the income pie (Figure 4). The distribution of
income pie in Louisville/Jefferson County closely mirrors the
national distribution, where 51.5 percent of all income is
earned the top 20 percent of households.
Photo by Chris Harrell

2019
State of Metropolitan Housing Report 12
Additionally, when we consider the distribution of total income
by race, non-Hispanic White households account for over 80
percent of aggregate household income in Louisville/Jefferson
County, while Black/African American households earn just
under 13 percent and Hispanic/Latinx about 3 percent.
Comparing these trends to the overall racial distribution
of households highlights the inequity. The share of total
household income for Whites is about 10 percentage
points larger than their share of total households, while
among Black/African Americans their share of total
income is 12.8 percent, yet they make up over 20 percent
of all households (Figure 5). In other words, non-Hispanic
White households’ share of the “income pie” is higher than
their representation among all households while Black/
African American households’ share of the “income pie” is
lower than their representation among all households.
Turning to how income inequality manifests at the census
tract level, in 14 percent of all tracts, the top 20 percent of
earners capture more than 51.5 percent of the ‘income pie’
within those tracts, outpacing the overall rate in Louisville/
Jefferson County. Adding to this geo-spatial measure of
income inequality, in 2017, no census tracts have a Gini
coefficient lower than 0.30, although most are below the
Louisville/Jefferson County rate (0.481). However, in over 10
percent of all tracts, the Gini is higher than the 0.481. The
downtown/Central Business District tract (49.00) exhibits
the greatest income inequality at 0.718 (Map 4).
Figure 4: Share of Total Income by Household Quintiles Jefferson County, 2017 Aggregate County Income = $22.69 Billion
Figure 5: Distribution of Aggregate Household Income by Race/Ethnicity Louisville/Jefferson County, 2017
SOURCE: ACS 2013-2017 5-year Estimates SOURCE: ACS 2013-2017 5-year Estimates
22.5%
14.2%
51.6%
8.5%3.2%
13%
80%
4%3%
Bottom (Poorest 20%) Second Third Fourth
Top (Richest 20%)
Black/African American Households
Non-Hispanic White Households
Hispanic/Latinx Households
Asian, Hawaiian, Other Pacific Islander, Two or More Races, or Some other Race
Photo by Chris Harrell

22,000 EQUITIES
Addressing Racial Gaps in Homeownership and Wealth13
non-Hispanic Whites (-3.2). Moreover, the median income
of Black/African American households in 2017 ($32,456)
is nearly 40 percent below median income overall (Figure
6). In addition, while the real median income of Hispanics/
Latinx households has grown by 4.6 percent, from $43,416
in 2000 to $45,412 in 2017, it is still 13 percent below
Louisville/Jefferson County’s overall median household
income.
Changes in median income over time (2000, 2012, and
2017) also show disparities across racial and ethnic
categories. Louisville/Jefferson County households saw
real median incomes decrease 7.0 percent from $56,161
in 2000 to $52,237 in 2017, compared with only a 3.7
percent decrease nationally. Between 2000 and 2017,
there were greater losses in median income for Black/
African American households (-7.1 percent) compared to
Map 4: Income Gini Coefficient Census Tracts Above and Below the Louisville/Jefferson County 2017 Gini Coefficient
0.303 – 0.481
0.482 – 0.718
Data Not Available
The Gini coefficient is a measure of income inequality within a population distribution. The coefficient ranges from zero to one, with zero representing perfect equality and one representing perfect inequality.
In 2017, the Gini coefficient for Louisville/Jefferson County was .481
SOURCE: American Communit Survey, 2013-2017 5-year Estimates
Figure 6: Median Household Income by Race/Ethnicity as Percent Louisville/Jefferson County Median Household Income (MHI), 2000, 2012, 2017
-40% -30% -20% -10% 0% 10% 20% 30% 40%
Year Louisville/Jefferson County MHI
2017
2012
2000
$52,237
$49,854
$56,161
-13%
14%
14%
9%
-38%
-18%
-38%
-23%
-38%
Percent ABOVE Median IncomePercent BELOW Median Income
Hispanic/Latinx Households Non-Hispanic Black Households Non-Hispanic White Households
SOURCE: US Census, Census 2000 and 2008-2012 and 2013-2017 5-year American Community Surveys Based on 2017 constant dollars; US Bureau of Labor Statistics CPI calculator
2019
State of Metropolitan Housing Report 14
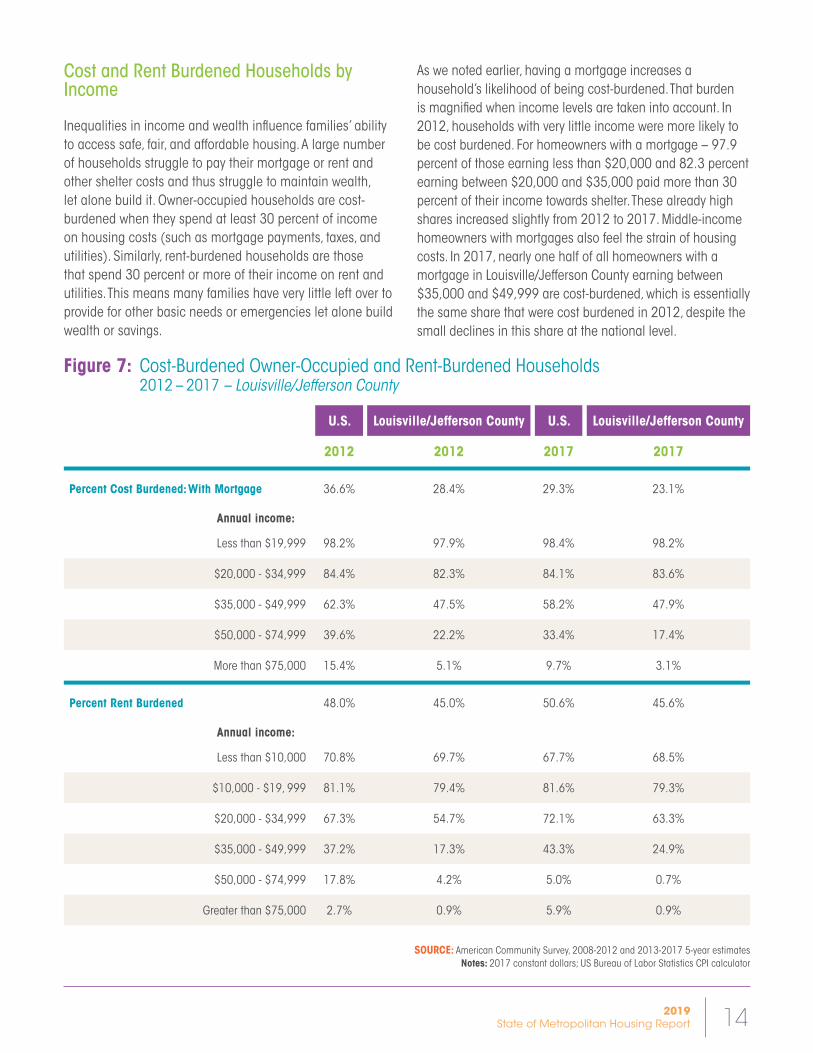
Cost and Rent Burdened Households by Income
Inequalities in income and wealth influence families’ ability
to access safe, fair, and affordable housing. A large number
of households struggle to pay their mortgage or rent and
other shelter costs and thus struggle to maintain wealth,
let alone build it. Owner-occupied households are cost-
burdened when they spend at least 30 percent of income
on housing costs (such as mortgage payments, taxes, and
utilities). Similarly, rent-burdened households are those
that spend 30 percent or more of their income on rent and
utilities. This means many families have very little left over to
provide for other basic needs or emergencies let alone build
wealth or savings.
As we noted earlier, having a mortgage increases a
household’s likelihood of being cost-burdened. That burden
is magnified when income levels are taken into account. In
2012, households with very little income were more likely to
be cost burdened. For homeowners with a mortgage – 97.9
percent of those earning less than $20,000 and 82.3 percent
earning between $20,000 and $35,000 paid more than 30
percent of their income towards shelter. These already high
shares increased slightly from 2012 to 2017. Middle-income
homeowners with mortgages also feel the strain of housing
costs. In 2017, nearly one half of all homeowners with a
mortgage in Louisville/Jefferson County earning between
$35,000 and $49,999 are cost-burdened, which is essentially
the same share that were cost burdened in 2012, despite the
small declines in this share at the national level.
Figure 7: Cost-Burdened Owner-Occupied and Rent-Burdened Households 2012 – 2017 – Louisville/Jefferson County
SOURCE: American Community Survey, 2008-2012 and 2013-2017 5-year estimatesNotes: 2017 constant dollars; US Bureau of Labor Statistics CPI calculator
U.S. Louisville/Jefferson County U.S. Louisville/Jefferson County
2012 2012 2017 2017
Percent Cost Burdened: With Mortgage 36.6% 28.4% 29.3% 23.1%
Annual income:
Less than $19,999 98.2% 97.9% 98.4% 98.2%
$20,000 - $34,999 84.4% 82.3% 84.1% 83.6%
$35,000 - $49,999 62.3% 47.5% 58.2% 47.9%
$50,000 - $74,999 39.6% 22.2% 33.4% 17.4%
More than $75,000 15.4% 5.1% 9.7% 3.1%
Percent Rent Burdened 48.0% 45.0% 50.6% 45.6%
Annual income:
Less than $10,000 70.8% 69.7% 67.7% 68.5%
$10,000 - $19, 999 81.1% 79.4% 81.6% 79.3%
$20,000 - $34,999 67.3% 54.7% 72.1% 63.3%
$35,000 - $49,999 37.2% 17.3% 43.3% 24.9%
$50,000 - $74,999 17.8% 4.2% 5.0% 0.7%
Greater than $75,000 2.7% 0.9% 5.9% 0.9%

Photo by Chris Harrell Photo by Sam Upshaw Jr., Courier-Journal
22,000 EQUITIES
Addressing Racial Gaps in Homeownership and Wealth15
Comparing Black Homeownership Experiences: A Closer Look at Russell and ShivelyThe Russell neighborhood and the city of Shively are
residential geographies with distinct histories. Russell had a
racially diverse population before the 1937 and 1945 floods.
By the middle of the twentieth century, White flight and
disinvestment through the racist practices of redlining and
then urban renewal destroyed its once vibrant commercial
corridor. This left the neighborhood with high concentrations
of lower-income, Black/African American households.
Russell’s demographic changes over time tell the story of
Black homeownership (or the lack thereof) in the context of
a formerly redlined section of Louisville/Jefferson County.
Shively is a suburban municipality that has undergone a
different racial transition over the course of the past 30 years,
shifting from a majority-White to a majority-Black population, and
maintaining a relatively high median income when compared
with Black/African American families across Louisville/Jefferson
County. Shively’s changes highlight the unique challenges
faced by middle-income Black/African Americans living in
suburban communities and parallels patterns found in similar
communities across the U.S. After seeking the homeownership-
based prosperity that dominant discourses say will come to
suburbanites, residents have witnessed their neighborhoods’
decline over time (Bartlett 2017, Byrnes and Henricks 2014,
Pattillo 1999, Woldoff and Ovadia 2009). Together, these
neighborhood stories reveal the complex ways that anti-Black
racial bias, both historical and contemporary, economically
disadvantages Black/African American populations.
About 45 percent of all renter households in Louisville/
Jefferson County are rent burdened households or are
spending more than 30 percent of their income on rent
and utilities in 2017. This number remained unchanged
in Louisville/Jefferson County from 2012 to 2017 despite
small increases nationally. Like homeowners, rent burden
is most severe among households with the most modest
incomes. Paralleling national trends, there were increases
in the share of rent burdened households among those
earning between $20,000 and $50,000. Rent burden in
Louisville/Jefferson County is somewhat lower than the
national level for renters earning more than $10,000.
Increasing rent burden can be attributed to the
combination of several factors. First, median gross rents
have risen, while incomes have remained stagnant.
Median gross rent in the United States was $857 in 2000
and rose to $982 by 2017. In Louisville/Jefferson County,
median rent also increased from $703 to $800 over that
same period (13.8 percent). Rising rents, especially at the
lower end of the price range, are at least partly attributable
to a lack of available affordable housing. Moreover, with
such strong competition for affordable units, landlords can
turn away prospective tenants for any number of reasons
and afford to evict tenants for any infraction (Immergluck,
Ernsthausen, Earl, and Powell 2019). In addition, the few
remaining federal subsidies targeting affordable housing
have been dedicated to renewing existing subsidies
rather than giving assistance to the growing number of
households in need (Desmond and Kimbro 2015). As has
always been the case, the vast majority of poor renters
today do not benefit from any kind of federal housing
program (Schwartz 2010).

2019
State of Metropolitan Housing Report 16
Historically speaking, systems of privilege (e.g. redlining, urban
renewal, zoning, mortgage insurance) afforded Whites the
opportunity to choose freely where to buy a home, whereas the
same systems greatly limited where Black/African American
households could live. Today, Black/African American
households who have the means to purchase a home navigate
a housing market that offers them some choice in where they
live, but still poses barriers to accessing the full portfolio of
housing options available to Whites (Feagin and Sikes 1994,
Korver-Glenn 2017, Rothstein 2017). For instance, recent
analysis of Home Mortgage Disclosure Act data in Louisville/
Jefferson County shows banks continue to disproportionately
deny home loans to non-White applicants (Mann 2018).
Examining changes from 2000 to 2017 in Russell and
Shively provides insight to the ongoing but distinct impacts
borne by Black/African American households with different
economic histories, but also connected to residential
segregation through redlining and urban renewal practices.
Between 2000 and 2017 in Russell, the percent of Black/
African American households remained steady comprising
about 96 percent of all households. In Shively, the percent
of Black/African American households shifted from a
minority of 43.0 percent in 2000 to a majority of 69.6
percent in 2012 and remained at nearly 70 percent
through 2017.
Homeownership in Russell and Shively
The patterns of homeownership and median household income
for Russell and Shively can be summarized as stability in
disadvantage and racialized neighborhood decline, respectively.
Overall homeownership rates for Russell and Shively both
declined from 2000 to 2012 with Russell continuing to decline
through 2017 after the Great Recession and Shively rebounding
slightly from 2012 to 2017. In Russell, the homeownership rate
reached its low point in 2017 at 14.9 percent from a high point
of 24.4 percent in 2000. In Shively, the homeownership rate
declined from 69.8 percent in 2000 to 60.1 percent in 2012
and rising only slightly by 2017 to 61.8 percent (Figure 9).
Figure 10 reflects disparate homeownership rates between
Whites and Black/African Americans in Russell, Shively,
and Louisville/Jefferson County in 2017. The low rates of
homeownership in Russell for both Blacks/African Americans
and Whites as compared to Louisville/Jefferson County and
Shively suggests that both Black and White homeowners
are choosing to live outside of the Russell neighborhood. In
Shively, however, both groups have homeownership rates close
to or higher than the countywide rates. In addition, three of
the four Shively census tracts are among the 22 tracts shown
in Map 2 that include the highest numbers of Black/African
American homeowners. The percentage of White homeowners
in Shively is slightly lower (66.9 percent) than the share
of White homeowners in Louisville/Jefferson County (70.8
percent). Shively’s Black/African American homeownership rate
Figure 8: Percentage Black/African American and Non-Hispanic White Households, Russell and Shively 2000, 2012, 2017
Figure 9: Homeownership Rates Russell, Shively, Louisville/Jefferson County 2000, 2012, 2017
SOURCE: US Census, Census 2000 and 2008-2012 and 2013-2017 5-year American Community Survey
SOURCE: US Census, Census 2000, 2008-2012, and 2013-2017 5-year American Community Surveys
0%
20%
40%
60%
80%
100% 94.9%95.9% 96.1%
5.1%4.1% 3.9%
30.4%
57.0%
30.8%
69.6%
43.0%
69.2%
94.9%95.9% 96.1%
5.1%4.1% 3.9%
30.4%
57.0%
30.8%
69.6%
43.0%
69.2%
Russell Black/African American
Households
Russell Non-Hispanic White
Households
Shively Black/African American
Households
Shively Non-Hispanic White
Households
Russell
24.4%20.8%
14.9%
69.8%
60.1%61.8%
64.9%63.2% 61.5%
Shively Louisville/Jefferson County
0%
10%
20%
30%
40%
50%
60%
70%
80%
2000 2012 2017
2000 2012 2017

22,000 EQUITIES
Addressing Racial Gaps in Homeownership and Wealth17
is 56.5 percent, 20.4 percentage points higher than Louisville/
Jefferson County rate (36.1 percent).
In addition, there was a substantial decrease in White
homeowners over the same period in Shively. In 2000, Whites
made up 60.9 percent of homeowners in Shively, but by 2017,
White homeowners fell sharply to 33.3 percent while Blacks/
African American homeowners increased to 66.7 percent of
homeowners over the same period (Figure 12). Taken together
with the overall decrease in White households in Shively, this
indicates a substantial number of White households and
homeowners left Shively between 2000 and 2017.
Looking at homeownership rates through a racial lens it
is clear that Russell and Shively tell different stories. White
homeownership declined steadily in both Russell and
Shively from 2000 to 2017. While Black/African American
homeownership declined in Russell, the Black/African
American share of homeownership increased in Shively.
Household Income and Home Values in Russell and Shively
From 2000 to 2017, median household income and median
home values changed in substantially different ways in Russell
and Shively (Figures 13 and 14). For Russell, both incomes and
home values were relatively unchanging, but low. In Shively,
median household incomes declined from $45,673 (2000)
to $34,963 (2012) then increased slightly to $36,525 by
2017. In addition, median home values in Shively declined
from $112,193 (2000) to $108,629 (2012), with a further
drop to $97,860 in 2017. Between 2012 and 2017, after the
Great Recession there were marginal increases in both median
home values and median household incomes in Russell.
When we take a closer look at change in Black/African American
homeownership over time in Russell and Shively, we find Black/
African American homeownership rates remained relatively
stable in Shively from 2000-2017 while Russell experienced a
decrease from 23.4 percent to 14.9 percent (Figure 11).
Figure 10: Black/African American and White Homeownership Rates, Russell, Shively, Louisville/Jefferson County 2017
Figure 12: Percentage Black/African American and White Homeowners, Shively 2000 and 2017
Figure 11: Black/African American Homeownership Rates in Russell, Shively, Louisville/Jefferson County 2000, 2012, 2017
SOURCE: US Census, 2013-2017 5-year American Community Survey
SOURCE: US Census, Census 2000 and 2013-2017 5-year American Community Survey
SOURCE: US Census, Census 2000, 2008-2012, and 2013-2017 5-year American Community Surveys
Russell Shively Louisville/Jefferson County
0%
10%
20%
30%
40%
50%
60%
70%
80%
56.5%
66.9%
36.1%
70.8%
15.4%
6.6%
2000 20170%
10%
20%
30%
40%
50%
60%
70%
80%
66.7%
33.3%
39.0%
60.9%
Black White
Black White
Russell
23.4%20.8%
14.9%
63.5%60.1%
61.8%
Shively Louisville/Jefferson County
0%
10%
20%
30%
40%
50%
60%
70%
80%
40.2%37.6% 36.1%
2000 2012 2017

2019
State of Metropolitan Housing Report 18
Whereas in Shively, median household incomes began to
recover but median home values continued to fall (Figures 13
and 14). The value residents in Shively lost in their incomes
and home values contributed to the overall loss of wealth in
the neighborhood.
The diverging trends of stable disadvantage in Russell and
decline in Shively are further highlighted by comparing
neighborhood median household income and median
home value to Louisville/Jefferson County values. Russell’s
median income in 2000 was $18,568, about one-third of
the Louisville/Jefferson County median income of $55,939.
By 2017, the median household income in Russell was
$17,681, and remained about one-third of the Louisville/
Jefferson County’s of $52,237. Russell’s median home
values in 2000 were 31.1 percent of the Louisville/Jefferson
County and 27.6 percent in 2017. Russell’s relative stability
in relation to the Louisville/Jefferson County further reflects
the area’s consistent inability to build wealth.
Shively’s median household income ($45,673) in 2000
was 81.6 percent of Louisville/Jefferson County’s median
household income ($55,939) and in 2017, it falls to 69.9
percent ($36,525).
Additionally, median home values in Shively fell from 76.5
percent of the Louisville/Jefferson County median home
value ($103,000) in 2000 to 61.5 percent of the value
($159,000) in 2017. For Shively, these declines in median
household income and median home value highlight
how an area with a high share of Black middle-income
households is slowly falling behind other areas in Louisville/
Jefferson County.
The stable disadvantage, reflecting long-term and
unchanging distress, seen in Russell and the racialized
economic decline that is apparent in Shively are indicative
of both the failure to erase the neighborhood disparities
that are linked to the history of redlining and the limitations
of Black homeownership as a means of neighborhood
revitalization in a society plagued by structural racism.
Addressing the challenges associated with both contexts will
require a transformation in the local collective conscience
and a commitment to multi-pronged solutions that address
both long-term neighborhood distress and newer patterns of
disadvantage occurring on the periphery of urban cores.
Figure 13: Median Household Income, Russell and Shively – 2000, 2012, 2017*
Figure 14: Median Home Value, Russell and Shively – 2000, 2012, 2017*
SOURCE: US Census, Census 2000 and 2008-2012 and 2013-2017 5-year American Community Survey
*Dollars shown in 2017 dollars using the Consumer Price Index Calculator (http://data.bls.gov/cgi-bin /cpicalc.pl)
SOURCE: US Census, Census 2000 and 2008-2012 and 2013-2017 5-year American Community Survey
*Dollars shown in 2017 dollars using the Consumer Price Index Calculator (http://data.bls.gov/cgi-bin /cpicalc.pl)
Russell Shively$0
$10,000
$20,000
$30,000
$40,000
$50,000
$18,568$15,947
$17,681
$45,673
$34,963$36,525
$18,568$15,947
$17,681
$45,673
$34,963$36,525
Russell Shively$0
$20,000
$40,000
$60,000
$80,000
$100,000
$120,000
$45,634$42,603 $43,848
$112,193$112,193$108,269
$97,860
2000 2012 2017
2000 2012 2017
Photo by Chris Harrell

22,000 EQUITIES
Addressing Racial Gaps in Homeownership and Wealth19
Measures of Displacement and Housing Insecurity
Homelessness, Utility Disconnections, Evictions
and Foreclosures, Louisville/Jefferson County
Families in Louisville/Jefferson County continue to face the
financial burdens caused by lack of housing stability, utility
disconnections, evictions, and foreclosures. These measures
demonstrate that involuntary displacement continues to
place families at risk and disproportionately affect Black/
African American households who experience higher rates
of homelessness and are more likely to live in areas with
high rates of utility shutoffs, evictions, and foreclosures.
Homelessness
Louisville/Jefferson County continues to struggle in
serving people without homes.
The Louisville Metro Continuum of Care 2018 Homeless
Census reported 6,986 sheltered and unsheltered homeless
people served during the 2018 fiscal year in Louisville/
Jefferson County. This reflects a 4.3 percent increase from
2017. The total number of unsheltered homeless individuals
declined by 18.3 percent to 632, while the number of the
sheltered homeless (6,354) represents a 7.3 percent increase
from the previous year (Coalition for the Homeless 2019).
Data from the Homeless Management Information System
(HMIS) show an overall decline of 20.6 percent in the
homeless population from 2012-2017 (Buchino et al.
2019). However, the data also show growth among several
vulnerable sub-groups, including recent (2017-2018)
increases (29.4 percent) in the number of young adults
experiencing homeless. The sharp rise in the number of
women and families experiencing homelessness due to
domestic violence continues to be a troubling trend. From
2015-2018, there was a cumulative increase of 52.0
percent in the number of such cases (Buchino et al. 2019).
According to data collected through the Vulnerability
Index-Service Prioritization Decision Assistance Tool (VI-
SPDAT), which captures a subset of persons experiencing
homelessness, the unsheltered female homeless population
increased from 23.2 percent in 2017 to 31.8 percent in
2018 (Buchino et al. 2019). In addition, among unsheltered
families, the vast majority have a female head of household.
Experiences of trauma are high among both the overall
and unsheltered populations, with the VI-SPDAT reporting
rates of 70.8 and 71.7 percent, respectively. Similarly, over
half of persons experiencing homelessness also reports
chronic health conditions. Lastly, the VI-SPDAT shows that
unsheltered families are disproportionately Black/African
American, comprising 78.3 percent of the total population of
unsheltered families (Buchino et al. 2019).
The trends in homelessness noted above are also reflected
in Jefferson County Public Schools (JCPS) data reported to
the Kentucky Department of Education (KDE). JCPS reported
an increase in the number and percentage of students
experiencing homelessness from 2017/18 to 2018/19
school years. The number of students rose from 4,580
to 5,177, a 13.0 percent increase. While the numbers
are small compared to Jefferson County, other Kentucky
districts within the Metropolitan Statistical Area (MSA) also
reported increases in the number of students experiencing
homelessness with two county districts, Oldham and
Shelby, more than doubling and Henry County increasing
by 79 percent. Data from Indiana counties in the MSA for
the 2018/19 school year were not available at the time of
publication (Figure 15).
Photo by Bryan Woolston/ZUMA Wire/Alamy Live News

2019
State of Metropolitan Housing Report 20
Figure 15: Louisville MSA Homeless Students 2017/18 - 2018/19
2017-18 2018-192017/18 - 2018/19
School SystemHomeless Students
Total Enrollment
Percent Total Enrollment
Homeless Students
Total Enrollment
Percent Total Enrollment
Percent Change
Jefferson County Public Schools 4580 98877 4.6% 5177 98506 5% 13%
Other Kentucky Counties in the MSA
Bullitt County Public Schools 373 13309 2.8% 435 13237 3% 17%
Henry County Public Schools 28 2136 1.3% 50 2076 2% 79%
Oldham County Public Schools 19 12614 0.2% 41 12724 0% 116%
Shelby County Public Schools 15 7014 0.2% 35 7129 0% 133%
Spencer County Public Schools 31 2926 1.1% 35 2964 1% 13%
Trimble County Public Schools 10 1224 0.8% 12 1220 1% 20%
Indiana Counties within Louisville MSA
Clark County Public Schools 9 15907 0.1% 16348
Floyd County Public Schools 6 11459 0.1% 11637
Harrison County Public Schools 63 6137 1.0% 6046
Scott County Public Schools 55 3880 1.4% 3856
Washington County Public Schools 126 4131 3.1% 4115
SOURCES: For 2019 KY Student Enrollment Data: “Superintendent’s Annual Attendance Report (SAAR)” https://education.ky.gov/districts/enrol/Pages/Superintendents-Annual-Attendance-Report-(SAAR).aspx
For 2019 IN Student Enrollment Data: “Corporation Enrollment by Grade Level” https://www.doe.in.gov/accountability/find-school-and-corporation-data-reports
For 2018-2019 Student Homeless Data: https://openhouse.education.ky.gov/Home/SRCData
Shutterstock.com

22,000 EQUITIES
Addressing Racial Gaps in Homeownership and Wealth21
Eviction and Foreclosure Follow-up
Eviction Filings 2016-20187
In the 2018 State of Metropolitan Housing Report, data on
eviction rates and eviction filings were presented using the
national Eviction Lab dataset. Involuntary displacement
through eviction continues to be a critical concern,
particularly in the context of increased investment in West
Louisville, where renter households are concentrated,
poverty rates are high, and landlords are motivated to
capitalize on rising property values due to the ongoing real
estate-based revitalization efforts.
40177
40299
40272
40291
40245
40216
40214
40023
40219
40118 40229
40223
40258
40059
40207
40213
40222
40241
40228
40218
40211
40220
40206
40205
40212
40243
40215
40210
40242
4020440203
40217
40202
40209
40208
40025
40109
40041
40292
40109
40177
Map 5: Average Residential Utility Disconnection Rates (2017-2018) by Zip Codes, Louisvillle/Jefferson County, KY
0.6% – 12.7%
12.7% – 53.8%
All Zip Codes: 2-year Average Rate per 100 Households
2017 Total Shutoffs = 39,403
2018 Total Households = 42,179
Total Households=321,360
2-year Average Rate = 12.7 per 100 Households
SOURCE: Data Provided by Louisville Gas & Electric
Note: Numbers include multiple shutoffs at one property and total households if zip exceeds county boundary.
Residential Utility Disconnections
According to data provided by Louisville Gas and Electric,
gas/electric utilities were physically turned off at the
meter 39,403 times in 2017, and utility disconnections
increased by 7.0 percent to 42,179 in 2018 in Louisville/
Jefferson County. The rate of utility disconnections per 100
households for 2017 was 12.3 percent and increased to
13.1 percent in 2018. These numbers include multiple
shutoffs at a single home and include some zip codes that
exceed the Louisville/Jefferson County boundaries.6
Turning to the spatial distribution of utility disconnections,
Map 5 displays the two-year average residential utility
disconnection rates from 2017-2018 for zip codes at least
partially contained within Louisville/Jefferson County. The
zip code (40209) with the highest average shutoff rate
(53.8 percent) contains only 105 households, but there
were 113 shutoffs over the two-year period. Four other zip
codes have disconnection rates above 20 percent, including
40212 (26.6 percent), 40210 (26.2 percent), 40211, (25.4
percent), and 40215 (24.0 percent). Two of these zip codes
(40210 and 40215) also exhibited some of the largest
disconnection rate increases from 2017-2018 (more than
5 percentage points). Finally, 15 out of 39 zip codes have
a two-year average disconnection rate above the Louisville/
Jefferson County average, and as Map 5 highlights, all of
these zip codes are in the western and south central parts of
the county.
Understanding the scale and geography of residential utility
disconnections is an important and often unexamined
element of housing security. As Map 5 shows, zip codes with
the highest utility disconnection rates in Louisville/Jefferson
County overlap with locations where the population is
disproportionately Black/African American and where poverty
rates are high (MHC, 2018). This corresponds with research
showing that energy insecurity is more prominent among
Black/African American households, renters, households
with children, and households earning less than $20,000
(Philadelphia Energy Authority 2018). Energy insecurity is
defined as households receiving a shut-off notification and
foregoing basic needs like food and medicine to pay energy
bills or reducing energy bills by maintaining an unhealthy
living temperature.

2019
State of Metropolitan Housing Report 22
Map 6 displays the three-year (2016-2018) average
eviction filing rate by zip code for Louisville/Jefferson
County using a new local dataset provided by the
Administrative Office of the Courts. The availability of this
data is an important development for locally tracking
eviction patterns. There were 51,217 total eviction filings in
Louisville/Jefferson County over this three-year period, and
the average eviction filing rate from 2016-2018 was 14.2
40177
40299
40272
40291
40245
40216
40214
40023
40219
40118 40229
40223
40258
40059
40207
40213
40222
40241
40228
40218
40211
40220
40206
40205
40212
40243
40215
40210
40242
4020440203
40217
40202
40209
40208
40025
40109
40041
40109
40177
Map 6: Average Eviction Filing Rates (2016-2018) by Zip Codes, Louisvillle/Jefferson County, KY
0.5% – 5.0%
5.1% – 15.0%
15.1% – 25.8%
*Total Filings = 51,217
*Total Occupied Rental Units= 120,549
* Average Rate 2016 - 2018 = 14.2 per 100 Occupied Rental Units
SOURCE: Commonwealth of Kentucky Court of JusticeAdministrative Office of the Courts
Forcible Detainer Cases Filed CY2016 - CY2018Database Provided by Kentucky Courts/Courts Net
Photo Provided by Louisville/Jefferson County Metropolitan Sewer District (MSD)
percent. One-third of all zip codes had an eviction filing
rate higher than the Louisville/Jefferson County average.
As shown on Map 6, eviction filings are widespread across
Louisville/Jefferson County, and only six zip codes have
eviction filing rates below 5.0 percent. The zip codes with
the highest average eviction filing rates are located in
western and south central Louisville/Jefferson County.

22,000 EQUITIES
Addressing Racial Gaps in Homeownership and Wealth23
40177
40299
40272
40291
40245
40216
40214
40023
40219
40118 40229
40223
40258
40059
40207
40213
40222
40241
40228
40218
40211
40220
40206
40205
40212
40243
40215
40210
40242
40204
40209
40203
4020840217
40202
40025
40109
40041
40177
Map 7: Distribution of Foreclosure Sales (2018) by Zip Codes, Louisvillle/Jefferson County, KY
0.0% – 3.4%
3.41% – 6.8%
6.82% – 10.2%
Jefferson County:
Total Foreclosure Sales = 1,876
* Rates represent number of foreclosure sales in zip code as a percentage of total foreclosure sales in Jefferson County
SOURCE: Jefferson County Circuit Court
include a clarification of the term Area Median Income (AMI)
because it is a key metric used by programs to determine
what type of housing public funds will build as well as who
ultimately has access to housing built with those public dollars.
Select Louisville Housing and Community Development InitiativesWhile the federal government has all but eliminated funding
for constructing public housing and federal public dollars
aimed at housing assistance continue to shrink, attention
to local spending priorities remains crucial. Initiatives in
the Russell neighborhood have both public (federal and
local) and private (for profit, non-profit, and foundation)
funding sources. In addition, two newer Louisville Metro
Government affordable housing programs, the Louisville
Affordable Housing Trust Fund (LAHTF) and Creating Affordable
Residences for Economic Success (CARES) provide funding
mechanisms for constructing new and preserving existing
affordable housing, and support other services intended to
address housing needs in Louisville. In this section, we also
Map 7 shows the distribution of foreclosure sales in 2018
using data from the Jefferson County Circuit Court. This
data reflects properties that received orders of sale (or
commissioner sales) in 2018. Foreclosure sales are a
conservative estimate of total foreclosures because they
only include properties sold at auction, rather than total
foreclosure filings, which indicate the initiation of the
foreclosure process. Commissioner’s sales data also include
all property types (residential, commercial, industrial,
etc.). Three zip codes contain the largest shares of total
foreclosure sales in Louisville/Jefferson County: 40216 (10.2
percent), 40211 (10. 2 percent), and 40212 (7.3 percent).
These are the same three zip codes identified in last year’s
report as having the largest shares of foreclosure sales in
2017 (MHC 2018). As we reported then, these zip codes
were also at the center of the foreclosure crisis, with some
of the highest rates of foreclosure in 2005 and 2007 (MHC
2008). Over ten years after the foreclosure crisis, the spatial
disparities of foreclosure still persist in Louisville/Jefferson
County, and continue to be concentrated in West Louisville.
Photo Provided by Louisville/Jefferson County Metropolitan Sewer District (MSD)

2019
State of Metropolitan Housing Report 24
Focus on Russell
As noted in the comparison of neighborhood change over
time in Shively and Russell, Russell has a unique history. It
is also the focus of several ongoing initiatives intended to
concentrate community and economic investments. These
include efforts jointly led by the Louisville Metropolitan
Housing Authority (LMHA) and Louisville Metropolitan
Government (LMG) through the Choice Neighborhood Grant
and the Russell Place of Promise initiative. Collectively, these
efforts are focused on intentional neighborhood change.
Following the progress of these primarily publicly funded
initiatives and grant programs sets the stage for better
understanding relationships between public investments,
neighborhood changes, and impacts on existing residents.
CHOICE NEIGHBORHOOD GRANT (Louisville Metro Housing Authority and Louisville Metro Government)
Beecher Terrace and Vision Russell Transformation Plan:
In December of 2016, LMHA received a $29.574M U.S. HUD Choice Neighborhood Initiative (CNI) Implementation
grant. This grant catalyzed over $200M of additional public and private investment to help implement the Vision
Russell Transformation Plan. Vision Russell (LMHA 2017) also includes several elements specific to Beecher Terrace
(1) the demolition of the Beecher Terrace public housing development, (2) relocation of existing Beecher Terrace
households, and (3) creation of a “new, sustainable, walkable, and amenity-rich” Beecher Terrace (Vision Russell
2019a) . Built in 1941, Beecher Terrace was a 31.4-acre public housing development that had 758 one-, two- and
three-bedroom housing units (LMHA 2017:1-18).
In addition to the redevelopment of Beecher Terrace, the HUD Choice Neighborhood grant funds comprehensive
case management and support services for residents. These include financial literacy, savings and wealth building
programs, job training and placement, higher education scholarship funds, and a variety of programs designed to
improve educational outcomes. Additional supports include transportation assistance, emergency assistance funds,
homeownership counseling, a Section 8 Homeownership program, and fitness and wellness programs.
Demolition and remediation of Beecher Terrace began in fall of 2017. New construction is expected to be completed
by September of 2023. The redevelopment efforts are guided by the Vision Russell Transformation Plan (LMHA 2017).
Beecher Conceptual Site Plan:

22,000 EQUITIES
Addressing Racial Gaps in Homeownership and Wealth25
Resident Relocation and Service Provision Activities
How Many Households and Residents of Beecher
Terrace are Impacted?
In 2015, as part of the preparation to apply for the Choice
Neighborhood Grant, LMG and LMHA surveyed residents of
Beecher Terrace and the broader Russell neighborhood. The
survey reported 697 occupied units in Beecher Terrace at that
time (LMHA 2015). That number expanded to 726 households
prior to relocation activities in 2017. The total number of
Beecher Terrace households and individuals tracked by
LMHA changes as the population changes. The number of
original Beecher residents LMHA reported they would follow
was 1,383. That number declined to 1,297 individuals (568
households) by October 2019 because of deaths, ‘involuntary
terminations,’ and other moves, but includes births and
individuals who moved in prior to relocation. LMHA reported
that 60.1 percent of Beecher Terrace households were Black/
African American, 33.9 percent households were recorded
as two or more races, 4.9 percent were other races, and 0.9
percent identified as Hispanic or Latinx (LMHA 2015).
andHOUSEHOLDS726
1,383 INDIVIDUALS
in 2017LIVED IN BEECHER TERRACE
https://lojic.maps.arcgis.com/apps/webappviewer/index.
html?id=42a5c460b5204e089d9028c1bd8b38f1
NOTE: Map reflects those who received moving assistance from LMHA as of November 14, 2019.
At the start of the implementation of the Choice Neighborhood
Grant in 2017, at least 1,383, primarily Black/African American
individuals in 726 Beecher Terrace households would be
impacted and displaced (LMHA 2019).
The following are select statistics and program goals for Vision
Russell reported by LMHA to HUD on a quarterly basis.
Households Moved in Phases
A total of 454 households experienced their first move from
Beecher Terrace under the relocation process by August of 2019.

2019
State of Metropolitan Housing Report 26
Following Household Outcomes
In order to keep track of household outcomes and serve their
residents, as of September 30, 2019, LMHA will continue to
follow and serve 568 Beecher Terrace households. This includes
41 households who moved into Beecher post grant application
but prior to relocation activities. From the original 726
households, 199 Beecher Terrace households (27.4 percent)
are no longer in the LMHA system. Of these, there were 107
(14.7 percent) ‘involuntary terminations’ and 92 (12.7 percent)
households who moved into the private housing market, died,
left Louisville/Jefferson County, or left due to illness.
LMHA records the reasons for ‘involuntary terminations’ of
Beecher Terrace households to distinguish between those who
left without notice owing rent or did not turn in their keys and
those who were formally evicted for a lease violation. The 107
‘involuntary terminations’ includes 93 households for non-
payment of rent, left without notice or did not leave keys, and 14
for lease violations. In each of these 107 cases, and in any case
where a tenant leaves without turning in their keys, LMHA goes
through the formal eviction process in order to legally enter the
apartment, re-key it, clean, dispose of any abandoned items, and
prepare it for a new tenant. This response can have long-term
negative consequences, particularly for tenants who simply
did not turn in their keys. However, LMHA follows this process
to document legal entry into vacated units. Distinguishing the
reasons for the ‘involuntary termination’ provides LMHA with
information they could use to better target eviction prevention
strategies. It also could allow them to assist those who left
without notice or simply did not return their keys, to determine a
path to return to the new development or other housing option.
It will be difficult to know the long-term outcomes for those who
left the LMHA system through eviction or moves to the private
market. Furthermore, it is not clear whether LMHA will be able
to follow those former Beecher Terrace residents who opt to use
Section 8 Vouchers and are evicted by future landlords unless
they move into Section 8 Project Based locations where LMHA
has some influence on the information managers report to LMHA.
Urban Strategies, the nonprofit arm of McCormack Baron Salazar
who is the primary developer of the new Beecher Terrace, is
responsible for case-management and will need to continue to
provide eviction prevention counseling and maintain their records
in a manner that corresponds accurately with LMHA’s records.
Redevelopment Activities
Replacement Units within and External to Russell
LMHA has plans for 758 replacement units. On-site replacement
units will total 316 and 442 will be off-site. In addition, the
housing plan includes market rate units (172 on-site and 229
off-site), Low Income Housing Tax Credit units (132 on-site and
223 off-site), and 20 units for sale on-site. Important to note
here is that the off-site units are not ‘new build’ and therefore
further put pressure on the current rental market that cannot
accommodate existing housing needs, especially those below
30 percent of Area Median Income. Presently, there also
is no centralized application list for residents interested in
moving to the off-site units, meaning they will have to navigate
the individualized application requirements at each site.
Furthermore, the ability of all former Beecher Terrace households
who wish to return to do so will be constrained by their capacity
to remain ‘lease compliant’ during the transition.
Demolition of the public housing units is funded through
allocations from LMG’s Community Development Block Grant.
As of August 21, 2019, 277 housing units had been demolished
with a second phase of demolition expected to be complete
by February 2020. The third phase of demolition is planned for
completion by July 2020 (LMG 2019c).
Construction activities began in 2017. In the fall of 2017, the
LMG broke ground on a $600,000 project to renovate Sheppard
Park, which sits between 16th and 17th Streets on Magazine.
These renovations added a spray ground, Congo drum play area,
restrooms, picnic tables and walking path markers to the park.
Housing construction began in April 2019 when LMHA broke
ground on the first new residential building at 9th Street and
West Liberty as part of the Phase 1 construction plan. The
building will include 117 energy-efficient one- and two-bedroom
apartments for seniors age 55 and older. It is planned to be
complete by Fall 2020.
As of October 31, 2019, 543 families received relocation
assistance and none remained in Beecher Terrace. These
families’ housing relocation choices included:
• Housing Choice Voucher – 219
• Public Housing including scattered sites – 275
• Privately managed HOPE VI (Park Duvalle, Sheppard
Square, Liberty Green) – 38
• Market-Rate Units – 9
• Home Purchase – 2
An additional 25 families moved on their own prior to their
scheduled move date, without moving assistance from LMHA,
24 into Section 8 housing and one family purchased a home.
The geographic distribution of Beecher Terrace residents
who received moving assistance from LMHA shows that they
relocated to homes all over Louisville/Jefferson County but the
majority remain in western and northwestern neighborhoods.

22,000 EQUITIES
Addressing Racial Gaps in Homeownership and Wealth27
intentional transformation will change the neighborhood that
has historically been the center of Louisville/Jefferson County’s
Black/African American community.
Looking at this in Louisville’s larger affordable housing
context, in 2018, LMHA granted a total of 14,501 Section
8 (housing choice and project-based) rent subsidies. This
number is well below the needs of the very low-income
renters in Louisville (MHC 2018). This means that the
unintended impacts of the Choice Neighborhood Grant efforts
will be increased pressure on Louisville/Jefferson County’s
affordable rental market and increased demand for Section
8 vouchers specifically as LMHA relocates former Beecher
Terrace residents into existing units using a limited supply of
Section 8 housing choice vouchers or into a geographically
limited number of new project-based Section 8 Vouchers (to-
date not awarded and or built).
Russell: A Place of Promise
Overview
As implementation of the Choice Neighborhood Grant
demolition and redevelopment of Beecher Terrace is
underway, so too is Russell: A Place of Promise (RPOP).
RPOP is an initiative that facilitates investments in the
Russell neighborhood that are designed to build wealth for
Black/African American families and support existing and
attract new business investment without displacing current
businesses and residents. With Louisville’s Community
Foundation serving as a fiscal sponsor, the initiative was born
from an initial collaboration between Cities United and LMG.
Financial support for RPOP activities comes primarily from
William R. Kenan, Jr. Charitable Trust with additional funding
from the JPMorgan Chase’s Advancing Cities grant and LMG’s
housing development funds targeting Russell.
RPOP partner, Cities United, is a national network of mayors
focused on making sure all children grow up in safe,
healthy, and hopeful communities. They are committed to
reducing homicide and shootings of young Black men and
boys. A project of the Tides Foundation, Cities United (Tides
Foundation 2019) views RPOP as an opportunity to show best
practices at work (Campaign for Black Male Achievement
2018). RPOP counts several other organizations as partners
in the effort, including Louisville Urban League, REBOUND,
Park Community Credit Union, Perkins + Will, Play Cousins
Collective and Arcadis.
The initiative “aims to create affordable housing, new
community gathering spots, opportunities for mobility, wealth
creation, and whole-community health” (LMG 2018).The
People Activities
LMHA reports to HUD on efforts directed at supporting
Beecher Terrace residents through Case Management,
Economic Mobility and Self Sufficiency, Education, and
Health and Wellness measures. The following data points
reflect a selection of some of the information contained in
the August 21, 2019 quarterly report:
• Over 70 percent of individuals (858 of 1218) were
receiving case management services.
• 298 adults who can work are in case management with
169 (56.7 percent) of those employed. Urban Strategies
and other CNI partners set a goal of increasing the
overall percent of Beecher Residents who can work (the
‘workable population’) to 80 percent through service
supports (LMHA 2019).
• 12 youth were matched with summer jobs through the
Summerworks program.
• 2 Beecher Terrace residents have become homeowners.
• 81 youth were referred to on-sight training or summer
programming.
Finally, LMHA is responsible for monitoring efforts that
Urban Strategies Inc. is tasked with, such as providing case
management and coordinating community partners, and
ensuring that they meet their obligations and set goals.
Focusing specifically on Beecher Terrace residents, there are
some disconcerting trends evident in the data presented
here. One-quarter of the original households are no longer
in the LMHA system, many of which are potentially left
to find affordable housing amidst a market with severe
shortages for households earning less than 50 percent of
Area Median Income. As off-site housing options become
available, residents may face barriers because of site-
specific applications, and these off-site units will not add to
the existing supply of affordable units.
The purpose of the CNI grant is to transform the Russell
neighborhood by replacing the Beecher Terrace public
housing complex and implementing other critical community
improvements in the neighborhood (Vision Russell 2019b).
In other words, the primarily public funds supporting this
initiative are mostly oriented towards transforming the real
estate in Russell. While there are some services to support the
former residents of Beecher, these activities are secondary
to the physical improvements at the center of the CNI grant.
This real estate orientation is not unique to LMHA or Russell
and is embedded in the HUD funding structure. However, it
is critical to consider and to continue to monitor how this

2019
State of Metropolitan Housing Report 28
long-term focus is centered on asset ownership in the
community by the families that have occupied that space for
generations and minimizing involuntary displacement. The
Kenan award gives RPOP seed funding to support wealth
creation activities through an incubation period with an
eye to supporting an eventual launch in to a stand-alone,
community-based organization and a national model for
neighborhood development and wealth creation in Black/
African American communities.
The JPMorgan Chase Advancing Cities (2019) grant
centers on six of Louisville’s lowest income neighborhoods
to improve digital inclusion and economic resilience with
the goal of greater access to better paying jobs. Lead by
Metro United Way of Louisville, the $3M three-year grant
brings together Goodwill Industries of Kentucky, The Greater
Louisville Workforce Development Board (KentuckianaWorks),
RPOP, Catholic Charities, AMPED, One West, Evolve502, and
the Commonwealth Institute of Kentucky.
Implementation of the Russell Place of Promise goals and
activities began in earnest in 2018 and implementation
continues to evolve as new partners, and resources are
identified. The following sections organize activities by
those RPOP originally proposed to Kenan Charitable Trust and
JPMorgan and include activities that combine resources from
other partners.
Organizational Structure8
The organizational structure of RPOP is still in development.
It currently includes two branches, one dedicated to the
“Promise of Place” and led by Theresa Zawacki, ‘Executive
on Loan’ and former Louisville Metro Government Senior
Policy Advisor to Louisville Forward and the other dedicated
to the “Promise of People” led by Anthony Smith, Executive
Director of Cities United. In addition, RPOP has hired one
of four project managers who will assist with place-based
initiatives and a Community Engagement Coordinator who
will lead five neighborhood organizers and up to 20 stipend-
based individuals or organizations to support engagement
and outreach. The initiative also works with consultants
who advise the team on wealth building strategies as well
as capital strategies intended to create the basis for the
sustainability of the organization. RPOP intends to establish
a standalone, as of yet to be defined, community-based
organization within five years.
RPOP is supported by an advisory board of 7 individuals (as
of 11/5/2019) who have skills in neighborhood capacity
building, affordable housing, property development,
fundraising and banking, as well as religious leaders,
neighborhood business owners and residents. There are 7
board positions that will be filled by Russell residents who
will make up approximately half of the RPOP advisory board.
RUSSELL: A PLACE OF PROMISE ADVISORY BOARD
Dana Jackson Better Together Strategies
Haven Harrington Russell Resident, Main Event Sports
Kevin Dunlap Rebound, Inc.
Alice Houston HJI Solutions
Paul Resch Blacksmith Ironworks
Mary Grissom Community Foundation of Louisville
Gill Holland Portland Investment Initiative
David Shadburne Park Community Credit Union
In Progress Up to 7 positions filled by Russell Residents
Promise of Place
Teresa Zawacki Executive on Loan
Future Project Manger
Future Project Manger
Future Project Manger
Future Organizer
Future Organizer
Future Organizer
Dana Johnson Project
Manager
Future Organizer
Dr. Pamela Jolly Wealth Building
Strategy
Napoleon Wallace Capital Strategy
Cassandra Webb Community Engagement Coordinator
Jackie Floyd Lead Organizer
Cities United Team
Anthony Smith Executive Director, Cities United
Promise of Place
SOURCE: Russell: A Place of Promise

22,000 EQUITIES
Addressing Racial Gaps in Homeownership and Wealth29
Grant Goals and Activities
Kenan Charitable Trust Grant
RPOP Organization
• Create a formal and informal operating and decision-
making structure through which residents can provide
feedback and guidance that will lead to a documented
community benefits commitment for RPOP in partnership
with residents.
– The intent is to create a community compact with the
residents of Russell so that there is a documented
relationship that gives them a path into ownership of
RPOP and the decision-making process. It will outline
residents’ expectations of RPOP and each other. To date
a community advisory board has been established, and
a lead community organizer has been hired to support
future outreach activities.
RPOP Development
• Increase rate of homeownership by 20 percent (an
increase of about 135 homeowners).
– Through a partnership with REBOUND and Park
Community Credit Union, RPOP was awarded
$802,000 by LMG through an RFP for new market
rate housing and will build at least 8 owner-occupied
homes, some of which will be owner-occupied
duplexes. The idea behind these is that while the
homeowner builds equity, the rentals will include an
incentive in the form of an Individual Development
Account that helps the renter build savings and
keeps them there longer, creating more certainty for
the homeowner and a wealth-building tool for the
tenant. Park Community will provide a $500,000 line
of credit to support new home construction through
this partnership.
– Project partner Park Community Credit Union pledged
$7.5M in mortgage loans dedicated to increasing
home ownership in Russell. These funds will connect
with the new home ownership opportunities available
through RPOP.
– Redevelop the former Madison Street historic tobacco
warehouse (Madison Street Warehouses) to support
at least 5 new businesses, 25 residential units and a
variety of community uses. RPOP plans to engage the
community to refine the uses included in the Madison
Street Warehouses. In addition, RPOP will work with
residents on site design and the creation of a community
ownership model through which residents can own a
portion of the development. Technical assistance has
been identified to explore baseline site conditions and
early stage redevelopment needs, including:
LMG Brownfields program accessed funding to
support soil and groundwater assessment prior
to LMG’s purchase of the site and supported an
application to the EPA’s TAB Program for assessment
of building materials and further exploration of
potential soil and groundwater contamination.
Arcadis, a global design and consultancy firm,
selected RPOP through its Pro Bono Program to
receive support for baseline site documentation,
including the development of a 3D building model,
as well as additional design support for green
infrastructure and stormwater management.
Perkins + Will, an international architecture studio
with expertise in large-scale community-based
projects, is providing pro bono assistance to
develop conceptual architectural renderings and
site designs through collaboration with community.
RPOP Business and Job Development
• Create at least 5 new businesses using a cooperative
or nontraditional structure, that result in at least 30 new
jobs for Russell residents.
– This could include worker-owned and democratically
controlled businesses, employers who direct benefits
to their employees beyond traditional wages and
health care, or those who use open applications or
bypass criminal background checks.
• Create six new franchise ownership opportunities for
Russell residents, resulting in 120 new jobs by August
2023. Types of franchises to be recruited would be those
that fill a gap in the neighborhood, such as a healthy
food retail or sit-down restaurants and those that provide
specific programs and support for new and minority
business operators.
• Connect 150 Russell residents with higher-paying, career-
track job opportunities.
– RPOP is working to build a network of Russell
businesses who are interested in hiring residents
Many of these have starting salaries above the current
residents’ average.

Continued on page 33
2019
State of Metropolitan Housing Report 30
– RPOP works with existing workforce development
partners, including the Louisville Urban League, to
identify residents who may be good candidates for open
positions in Russell Businesses. For example, Blacksmith
Ironworks, a Russell-based metal fabricator and ironworks,
has hired approximately 30 percent of its workforce from
the area. The company is willing to provide training to
help these individuals gain higher levels of responsibility,
skill and income through the business.
– Assess employer needs with survey of current
Russell employers. RPOP estimated that there are
approximately 2,000 jobs in the neighborhood and
Russell residents hold only about 150 of those. The
survey will be used to develop a strategy to help
employers meet their needs by hiring residents.
RPOP Community and Wealth Building
• Host wealth circles for Russell residents to build
knowledge around wealth building and investing.
Potential outcome of resident directed investment clubs
depends on participant-determined goals.
– RPOP is participating in the Shared Equity in Economic
Development (SEED) Fellowship, an effort of the
Democracy at Work Institute and National League of
Cities. RPOP will use this opportunity to grow local and
national connections that can help it develop a plan to
support cooperative development in Russell.
• Host and participate in neighborhood events and
meetings and have a daily presence in public spaces to
support existing and build new social connections.
To date, numerous community meetings and seasonal
neighborhood festivals and events have been held with
partners, in addition to several small group conversations
focused on wealth creation.
JPMorgan, Advancing Cities Grant
RPOP Specific Activities and Goals
• Engage 3,600 households in Russell and build
community capacity by training 5-8 community and faith-
based organizations to use techniques and approaches
for connecting with residents that RPOP developed with
Cities United and other community experts.
• Connect 175 residents to high-quality, certified financial
coaches.
• Support 600 residents in workforce development and
education.
• Participate in the grant partners’ efforts to increase
connectedness among government, social services, health,
education, and the private sectors by creating a formalized,
unified network of social supports for financial health
including a shared data platform.
• Conduct a gap assessment of Advancing Cities grant
partners’ resources and distribute to the most impactful
efforts.
As RPOP takes root alongside the redevelopment of Beecher
Terrace and reinvestments in the Russell neighborhood,
determining if the efforts to reduce involuntary displacement
and build wealth among Russell residents are effective will
be a difficult task. Having baseline measures for existing
residents and businesses and methods for determining
impacts on individuals rather than real estate values will
be crucial in evaluating the success of efforts to mitigate
displacement. It is therefore all the more important for
LMHA to be able to follow outcomes for the Beecher Terrace
residents who are displaced during redevelopment and for
LMHA along with LMG, RPOP, and other project partners, to
assist in following outcomes for existing Russell neighborhood
residents more broadly. The existing RPOP housing initiatives
are market rate ventures and while cooperative ownership
models are proposed for economic development, there does
not appear to be a similar focus within the housing activities
to promote collective community land ownership. Adding
cooperative land ownership models and affordable housing
to their housing strategies could contribute to wealth stability
and further mitigate displacement. In addition, as this effort
emerges, clear timelines for specific projects developed
with the RPOP advisory board and transparency through the
proposed community compact will contribute to establishing
buy-in and trust around this initiative.
Louisville Affordable Housing Trust Fund (LAHTF) and Creating Affordable Residences for Economic Success CARES
Two LMG significant sources of financial support for affordable
housing are LMG’s Louisville Affordable Housing Trust Fund
(LAHTF) and the Creating Affordable Residences for Economic
Success (CARES) program. Both are newer tools in Louisville’s
affordable housing toolkit. This means that establishing
systematic ways of documenting how they are funded, how
funds are spent over time, and who ultimately benefits from
the expenditures is crucial to maintaining legitimacy and
public support.

AMI (household of 4) = $76,400
Family size
1 2 3 4 5 6 7 8
30 % AMI
Extremely Low Income$16,050 $18,350 $21,330 $25,750 $30,170 $34,590 $39,010 $43,430
50 % AMI
Very Low Income$26,750 $30,600 $34,400 $38,200 $41,300 $44,350 $47,400 $50,450
80% AMI
Low Income$42,800 $48,900 $55,000 $61,100 $66,000 $70,900 $75,800 $80,700
Understanding Area Median Income (AMI) and Median Income9
Defining AMI and Median Income
Area Median Income (AMI) is the annual median family income, typically expressed in terms of a family of four, for a
specific geographic area. AMI is determined by the Department of Housing and Urban Development (HUD) and adjusts
for both household size (between one and eight persons) and local housing cost factors. Adjusting earnings based on
household size is an important consideration for families with children, single-income households with children, and
multigenerational households. For example, a very large household may earn slightly more income, but have much less
purchasing power. HUD calculates the AMI over a predetermined geographic area. For Louisville/Jefferson County, this is
the Louisville, KY-IN HUD Metro Fair Market Rent Area and includes Clark County, IN; Floyd County, IN; Harrison County, IN;
Bullitt County, KY; Henry County, KY; Jefferson County, KY; Oldham County, KY; Spencer County, KY; and Trimble County, KY. In
2019, the AMI for this region is $76,400 for a household of four (Figure 16) (HUD 2019b). These spatial boundaries and
the housing cost adjustments used to calculate the AMI are what distinguishes it from median income.
Median income is calculated simply by determining the mathematical median of the incomes of all households or
families, regardless of size, within a given geographic area. The Census and American Community Survey (ACS) calculate
median income for a range of spatial units (e.g. census tract, zip code, county, state), household sizes, and other
demographic characteristics such as race/ethnicity, but does not include the adjustments for local housing cost factors
that are reflected in AMI.
How are AMI and Median Income used in practice?
Nationally, AMI is used to determine which households are eligible for HUD’s rental assistance programs and housing
vouchers. Using AMI, HUD creates a set of income limits for a geographical area calculated at 30 percent, 50 percent,
and 80 percent of the local AMI for each household size from 1 to 8 persons. To be eligible for a HUD housing voucher,
a household generally must not exceed 50 percent AMI (HUD 2019a). Federal law also states 75 percent of housing
vouchers must be awarded to households at or below 30 percent AMI (HUD 2019a).
Locally, programs providing affordable, quality housing, including the Louisville Affordable Housing Trust Fund (LAHTF) and
the Louisville Creating Affordable Residences for Economic Success program (CARES), also choose to use AMI income
limits. For instance, the LAHTF ordinance requires that half of any public dollars allocated to the Trust be dedicated to
serving households at or below 50 percent AMI (e.g. $38,200 for a family of four). Like the LAHTF, CARES also uses AMI
income limits as part of its program guidelines, targeting the creation of units that are affordable to households earning
80 percent AMI or less (e.g. $61,100 for a family of four) (LAHTF 2019).
Figure 16: Area Median Income Limits of the Louisville, KY-IN HUD Metro FMR Area 2019
3122,000 EQUITIES
Addressing Racial Gaps in Homeownership and Wealth
SOURCE: https://www.huduser.gov/portal/datasets/il/il2019/2019summary.odn

2019
State of Metropolitan Housing Report 32
Advantages and Limitations of AMI and Median Income
There are both advantages and limitations to using either AMI or median income. For local programs, using AMI is
beneficial because it is a federally recognized standard and can potentially make it easier to pair local and federal
funding sources - such as the Low-Income Housing Tax Credit, which relies on AMI limits - to create affordable
housing units. Additionally, the algorithm used to calculate AMI considers a variety of national and regional income
and affordability thresholds, and HUD adjusts income limits based on these calculations, making these limits at least
somewhat sensitive to national and regional housing market changes (HUD 2011). However, these adjustments also make
the number incredibly opaque and difficult to understand.
AMI considers a large geographic area, which for Louisville/Jefferson County includes eight other counties, three of which
have substantially higher median household incomes than Jefferson County (Figure17). In practice, this leads to higher
incomes limits, which in turn affects the affordability of the units produced through local programs that rely on AMI limits.
In other words, if 80 percent AMI is calculated from a baseline that includes the median family income in surrounding
suburban, higher-income counties, this means local affordable housing programs in Louisville are subsidizing the creation
of units that on their face may be “affordable,” but rent for prices that are still out-of-reach for low-income households
in Louisville/Jefferson County. Additionally, because these local programs are generally funding profit-driven private
and nonprofit developers, the tendency will be to create units at the maximum allowable rents per program guidelines.
If funding for affordable housing were plentiful, this would less of an issue. However, funding for affordable housing is
limited at the local, state, and federal levels.
Geography is not the only limitation. AMI also masks differences in household income by race. In 2017, the median family
income for non-Hispanic Whites in Louisville/Jefferson County was $78,993 compared to a median family income of just
$41,674 for Black/African Americans. Comparing this to the current AMI income limits, units developed to be affordable for
households earning between 80 percent ($61,000) and 50 percent ($38,200) AMI will not be affordable for nearly half of
all Black/African American households in Louisville/Jefferson County, as they earn less than $41,674.
As an alternative to AMI, median income is far more intuitive and easier to understand. The Census and ACS already
calculate it for a variety of geographic areas, races/ethnicities, and household sizes. However, combining all three of these
variables into a single income-based metric would still be a challenge. Moving away from AMI as a threshold for local
programs could also create barriers when blending local and federal funds at the project level.
Figure 17: Median Household Income (4-person Households) vs. Area Median Income (Family of 4), Louisville, KY-IN HUD Metro Fair Market Rent Area
SOURCE: ACS 2017 5-year Estimates; HUD FY 2019 Income Limits Documentation System
$84,272
$67,958
$77,847
$86,390
-20%
-5%
10%
25%
40%
55%
70% $127,179
$91,250
$97,711
$82,273
$74,611AMI (family of four) = $76,400
Bullitt Co. Henry Co. Harrison Co.Jefferson Co. Oldham Co. Spencer Co. Floyd Co.Trimble Co. Clark Co.

Continued from page 30
22,000 EQUITIES
Addressing Racial Gaps in Homeownership and Wealth33
Established in 2008, the Louisville Affordable Housing
Trust Fund (LAHTF) is the primary financial mechanism
through which Louisville Metro Government supports the
preservation of existing and creation of new affordable
housing units. In addition to its primary purpose of
preserving existing and creating new affordable housing
units across Louisville/Jefferson County, the LAHTF also
prioritizes promoting homeownership and preserving
affordable units in places with high rates of low-income
housing, constructing multi-family units outside of I-264,
and ensuring at least half of all funds awarded are repaid
for fiscal sustainability (LAHTF 2019).
LAHTF, using public funds granted by the city, awards
loans and grants to both for- and not-for-profit developers.
These funds incentivize developers to build or rehabilitate
affordable housing by decreasing their financial risk which
then reduces the local affordable housing shortage by
increasing the pool of available affordable housing units.
Developers can obtain funding to rehabilitate or create
single-family homes or multi-family dwellings that are
intended to be either rented or purchased.
Per the ordinance governing the LAHTF, its purpose is to
address the affordable housing needs of low- and moderate-
income households through promotion, preservation, and
production of long-term, affordable housing. For public funds
(e.g. general revenue allocations) received by the LAHTF,
one-half must serve households earning 50 percent or less
of the Area Median Income (AMI) (see Figure 17), while
the remaining half can serve households earning up to 80
percent and below of AMI. The LAHTF is also authorized to
accept private donations, and these funds can be used to serve
households earning up to 110 percent of AMI. This is important
because it also sets the parameters by which the LAHTF, with
a staff of two, tracks data and information on housing units
supported or created. In other words, while some households in
LAHTF-supported units may be, for instance, below 30 percent
AMI, since this income category is not part of their mandate,
LAHTF does not directly track units created for this group.
Because housing is embedded in a market-based system
intended to maximize profits, developers are unlikely to
create units that are affordable to those with the lowest
incomes, thus government intervention and incentives
are necessary to support the creation of housing units
affordable to households with limited incomes. Housing
projects supported by the LAHTF are often highly complicated
financial deals that involve other sources of funding– for
instance Low-Income Housing Tax Credits (LIHTC) – which
have separate rules and regulations governed by the federal
government. In short, LAHTF invests more funds to create a
housing unit that is affordable to households at or below 50
percent AMI because these households are able to afford
lower rents. For instance, a unit affordable to a household
earning 50 percent AMI may require up to $30,000 of
subsidy, whereas a unit affordable to households above 50
percent AMI may only need $10,000.
Per its ordinance, the LAHTF is charged with a dual mandate
to serve both low- (50 percent AMI and below) and
moderate-income (80 percent AMI and below) households.
However the findings of the 2019 Louisville Housing
Needs Assessment show that the shortage of affordable
available homes is far more acute for Louisville lowest
income households: the unmet demand for households
earning 30 percent or less of AMI is 31,412 units, while
there is shortage of 22,250 units for earning between
31 and 50 percent AMI. There is also a shortage for
households earning between 51-80 percent AMI, but it is
substantially smaller (4,409). And, there is a surplus of units
(5,213) for renters in this income group. It is also important
to remember that both existing housing supply and demand
by household income is not evenly distributed across
Louisville/Jefferson County, and part of the previously noted
LAHTF priorities are to intended to improve the geographic
distribution of affordable housing. However, there is a
shortage of affordable units for households earning 50
percent or less AMI in ALL of the 21 market areas within
Louisville/Jefferson County.
In 2016, Louisville Metro Government launched the
Creating Affordable Residences for Economic Success
(CARES) program, to work in partnership with the LAHTF
(e.g. there is a joint pre-application process for both
programs) and create affordable rental workforce housing
near employment centers. The CARES program aims to
support the creation of affordable, multi-family rental
dwellings by providing low-interest loans to both for- and
not-for-profit developers. The income targets for the CARES
program are households earning 80 percent or less of AMI,
setting it apart somewhat from the LAHTF, which is required
to serve households earning 50 percent or less AMI, and
to address cost-burdened households, or those paying
more than 30 percent of their income towards housing
and utilities (LMG 2019b). In 2018, this translated to the
following maximum rents for projects supported by the
CARES program (LMG 2019a):
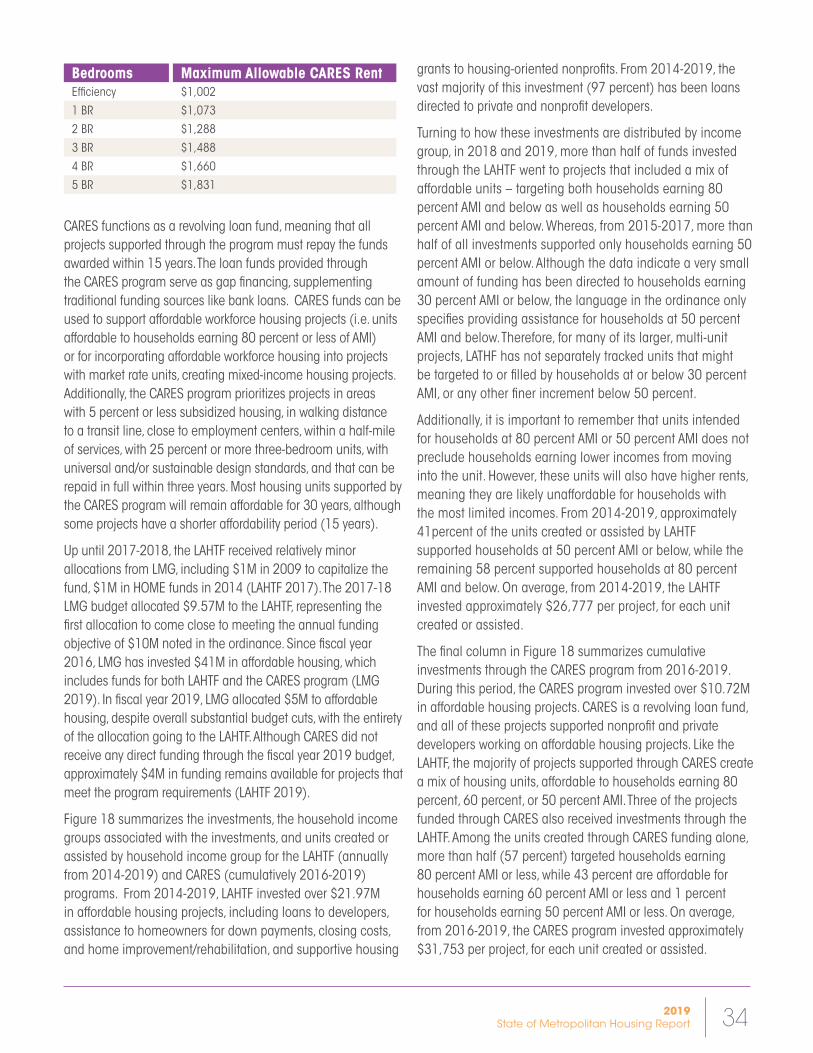
2019
State of Metropolitan Housing Report 34
Bedrooms Maximum Allowable CARES RentEfficiency $1,002
1 BR $1,073
2 BR $1,288
3 BR $1,488
4 BR $1,660
5 BR $1,831
CARES functions as a revolving loan fund, meaning that all
projects supported through the program must repay the funds
awarded within 15 years. The loan funds provided through
the CARES program serve as gap financing, supplementing
traditional funding sources like bank loans. CARES funds can be
used to support affordable workforce housing projects (i.e. units
affordable to households earning 80 percent or less of AMI)
or for incorporating affordable workforce housing into projects
with market rate units, creating mixed-income housing projects.
Additionally, the CARES program prioritizes projects in areas
with 5 percent or less subsidized housing, in walking distance
to a transit line, close to employment centers, within a half-mile
of services, with 25 percent or more three-bedroom units, with
universal and/or sustainable design standards, and that can be
repaid in full within three years. Most housing units supported by
the CARES program will remain affordable for 30 years, although
some projects have a shorter affordability period (15 years).
Up until 2017-2018, the LAHTF received relatively minor
allocations from LMG, including $1M in 2009 to capitalize the
fund, $1M in HOME funds in 2014 (LAHTF 2017). The 2017-18
LMG budget allocated $9.57M to the LAHTF, representing the
first allocation to come close to meeting the annual funding
objective of $10M noted in the ordinance. Since fiscal year
2016, LMG has invested $41M in affordable housing, which
includes funds for both LAHTF and the CARES program (LMG
2019). In fiscal year 2019, LMG allocated $5M to affordable
housing, despite overall substantial budget cuts, with the entirety
of the allocation going to the LAHTF. Although CARES did not
receive any direct funding through the fiscal year 2019 budget,
approximately $4M in funding remains available for projects that
meet the program requirements (LAHTF 2019).
Figure 18 summarizes the investments, the household income
groups associated with the investments, and units created or
assisted by household income group for the LAHTF (annually
from 2014-2019) and CARES (cumulatively 2016-2019)
programs. From 2014-2019, LAHTF invested over $21.97M
in affordable housing projects, including loans to developers,
assistance to homeowners for down payments, closing costs,
and home improvement/rehabilitation, and supportive housing
grants to housing-oriented nonprofits. From 2014-2019, the
vast majority of this investment (97 percent) has been loans
directed to private and nonprofit developers.
Turning to how these investments are distributed by income
group, in 2018 and 2019, more than half of funds invested
through the LAHTF went to projects that included a mix of
affordable units – targeting both households earning 80
percent AMI and below as well as households earning 50
percent AMI and below. Whereas, from 2015-2017, more than
half of all investments supported only households earning 50
percent AMI or below. Although the data indicate a very small
amount of funding has been directed to households earning
30 percent AMI or below, the language in the ordinance only
specifies providing assistance for households at 50 percent
AMI and below. Therefore, for many of its larger, multi-unit
projects, LATHF has not separately tracked units that might
be targeted to or filled by households at or below 30 percent
AMI, or any other finer increment below 50 percent.
Additionally, it is important to remember that units intended
for households at 80 percent AMI or 50 percent AMI does not
preclude households earning lower incomes from moving
into the unit. However, these units will also have higher rents,
meaning they are likely unaffordable for households with
the most limited incomes. From 2014-2019, approximately
41percent of the units created or assisted by LAHTF
supported households at 50 percent AMI or below, while the
remaining 58 percent supported households at 80 percent
AMI and below. On average, from 2014-2019, the LAHTF
invested approximately $26,777 per project, for each unit
created or assisted.
The final column in Figure 18 summarizes cumulative
investments through the CARES program from 2016-2019.
During this period, the CARES program invested over $10.72M
in affordable housing projects. CARES is a revolving loan fund,
and all of these projects supported nonprofit and private
developers working on affordable housing projects. Like the
LAHTF, the majority of projects supported through CARES create
a mix of housing units, affordable to households earning 80
percent, 60 percent, or 50 percent AMI. Three of the projects
funded through CARES also received investments through the
LAHTF. Among the units created through CARES funding alone,
more than half (57 percent) targeted households earning
80 percent AMI or less, while 43 percent are affordable for
households earning 60 percent AMI or less and 1 percent
for households earning 50 percent AMI or less. On average,
from 2016-2019, the CARES program invested approximately
$31,753 per project, for each unit created or assisted.

22,000 EQUITIESAddressing Racial Gaps in Homeownership and Wealth35
How do these efforts address the 22K Equities Gap?Long-term federal funding cuts to affordable housing programs—especially those that build units—stagnating wages, and a general increase in low-income households and families in poverty contribute to the growing housing and wealth gaps and magnify racial inequities. National studies find that there are 1.7 very low-income renters who do not receive assistance for each very low-income renter who does (Watson, Steffen, Martin, and Vandenbroucke, 2017). Locally, that level of demand is shown in the 2019 Housing Needs Assessment (HNA) that finds Louisville/Jefferson County needs more than 31,000 units for households earning 30 percent or less of AMI. The HNA found there is high competition for the few available affordable rental properties, The demand is also apparent in the 13,092 households who were on LMHA’s Section 8 waiting list, the 3,608 on their managed site waiting list, and
the 4,417 on the site-based waiting list in 2018 (MHC, 2018).
LMHA, CARES, and LAHTF do not currently have the capacity, nor are they structured or empowered to fill this enormous affordable housing gap let alone explicitly address the racial and ethnic gaps in wealth and homeownership we document that continue to grow over time. Explicitly addressing racial and ethnic inequity using publicly funded programs that are not allowed to be centered on race-based eligibility but nonetheless must avoid racially disparate outcomes creates a difficult tension in housing policies and programs.
RPOP is conceptually promising, employing an explicit racial equity framework with focused attention on investing in people to improve well-being and wealth for Black/African American families in Russell. However, RPOP is not structured to address affordable housing needs. That said, raising incomes, business, and employment opportunities for existing residents does have the potential to mitigate widening wealth gaps.
Figure 18: Louisville Affordable Housing Trust Fund and Louisville CARES
SOURCE: Louisville Affordable Housing Trust Fund and Louisville CARES Program StaffNotes: 1 Data on the income of households supported through the Supportive Housing Grants are not reported.2 30% AMI units tracked here were supported through HOME funds and private funding from 5/3 Bank. LAHTF does not track which households are below 30% AMI in
other projects because their mandate is to serve households at and below 50% AMI. 3 AMI was not tracked for units assisted in 2014. In 2015, 4 units are missing household AMI data. CARES has supported a total of 826 units. 316 of those units also
received LAHTF funding and are already counted in the columns associated with LAHTF. The 510 units are from projects that only received CARES funding. The 217 market rate units associated with CARES are not included here.
4 Average investment per unit created or assisted was calculated by averaging the cost per unit for each project in a given year. CARES total project development costs include 3 projects (316 units) also funded by the LAHTF.
Louisville Affordable Housing Trust Fund Louisville CARES
Loan Origination/Closing Dates 2014 2015 2016 2017 2018 2019 2014-2019 Percent of Total 2016-2019 Percent
of Total
Affordable Housing Investments
Total Loan Amounts/Developer Subsidy $167,500 $205,149 $69,045 $2,571,343 $9,116,893 $9,193,128 $21,323,058 97% $10,717,054
Total Downpayment & Closing Cost Assistance $151,051 $194,163 $112,023 $— $— $457,237 2%
Homeowner Loan Assistance Program $39,002 $24,274 $63,276 0.3%
Supportive Housing Grants1 $25,000 $49,500 $55,000 $129,500 1%
Investments by Household Income Group
30% AMI and less2 $56,676 $9,938 $66,614 0.3%
50% AMI and less $210,246 $218,234 $1,960,067 $2,366,381 $2,491,766 $7,246,694 34%
60% AMI and less $1,277,054 12%
80% AMI and less $35,954 $44,974 $666,622 $2,069,576 $314,508 $3,131,634 15% $2,570,000 24%
Projects with mix of AMI units $4,710,000 $6,411,128 $11,121,128 52% $6,870,000 64%
Annual Total Investment3 $167,500 $356,199 $263,208 $2,708,366 $9,205,395 $9,272,402 $21,973,070 $10,717,054
Units Produced or Assisted by Household AMI
30% AMI and less2 1 2 3 0.1%
50% AMI and less 7 5 111 563 246 932 41% 4 1%
60% AMI and less 217 43%
80% AMI and less 2 1 220 753 352 1328 58% 289 57%
Total Units Created or Assisted3 11 13 6 332 1318 598 2,278 510
Average Annual Investment per Project, per Unit Created or Assisted4 $14,531 $35,767 $34,728 $34,086 $19,510 $22,039 $26,777 $31,753

2019
State of Metropolitan Housing Report 36
How Should Louisville/Jefferson County Address the Racial Wealth/Housing Gap?In closing, we offer selected recommendations for beginning
to close the racial wealth and housing gap highlighted
in the previous sections of this report. This list is by no
means exhaustive and other policies and programs that
complement these recommendations should also be
pursued.
Institute a Racial Equity Lens across Housing and Neighborhood Decision-Making Processes
All organizations across the public, private, and nonprofit
sectors engaged in processes influencing housing and
neighborhood redevelopment processes should adopt an
explicit racial equity lens for this work. These changes could
be modeled on Jefferson County Public School system’s Racial
Equity Plan (JCPS 2018) and its Diversity, Equity, and Poverty
programming (JCPS 2019). Additionally, the Center for Health
Equity’s “Towards Racial Equity through Policy & Assessment”
(Arno and Gonzales 2015) is another resource that can help
guide this movement towards racial equity in housing and
neighborhood development processes. LMG’s Fair Housing
Assessment had not yet been shared with the public. Other
national resources include the African American Financial
Capability Initiative, which offers examples of community-
centered financial capability projects in six cities (Prosperity
Now 2019). A key component of this change should include
achieving and maintaining explicit racial representation on
local government decision-making boards like the Planning
Commission and Board of Zoning Appeals.
As housing policies become more reliant on big data, new
technologies, and artificial intelligence, we must be mindful
that the instruments in use are not neutral in a social
environment profoundly shaped by structural racism. In short,
the data and technologies we employ reflect our current
systems of privilege and do not push us beyond histories of
exclusion and discrimination (Benjamin 2019).
WHO: public, private, nonprofit sectors
Photo by Lauren Heberle

22,000 EQUITIES
Addressing Racial Gaps in Homeownership and Wealth37
Support Initiatives that Build and Maintain Wealth
Remove Barriers and Provide Funding for Resident-led Cooperative Ownership Models
Community land trusts and limited equity cooperatives
are two approaches that can be deployed to address the
connected issues of wealth-building, housing affordability,
displacement, and resident-control of land (Ehlenz and Taylor
2019). As a community wealth-building strategy, cooperative
ownership models like community land trusts create and
maintain long-term land leases that disallow speculative
sales to developers and facilitate cooperative, community
possession of the land through the organizational structure
of the trust. To maintain long-term affordability, the housing
structure is separated from the land, and the lease between
the homeowner and the land trust sets a fixed rate for the
structure’s appreciation. This allows the homeowner to build
equity while still maintaining the long-term affordability of
the housing unit. Because housing units within cooperative
ownership models are designed to be affordable, this
creates access to homeownership and wealth-creation for
households that may not be able to own in the traditional
private market. Having a land trust or other cooperative
housing model in place before land values increase is a
critical tool for minimizing the displacement of existing low-
income residents.
There are ongoing discussions related to the creation of
a community land trust. Louisville Metro Government and
partners including MHC and LHOME hosted an informational
session on community land trusts for advocates and
interested resident in July 2019 with national partner
Grounded Solutions Network, who also returned in
November as part of the Center for Neighborhood’s 2019
Annual Neighborhood Summit. LMG should work with and
support resident and community-led groups to minimize
or remove any legal or land use barriers that may prevent
the creation of a land trust or other cooperative ownership
models. And, LMG and foundations should provide initial
funding needed to launch a land trust or other cooperative
ownership models.
WHO: public sector, foundations
Build Savings through Individual Development Accounts and Mortgage Reserve Accounts
• Individual Development Accounts (IDAs) are matched
savings programs that offer participants a means
of expanding their savings for down payments,
entrepreneurship, or education. These programs generally
match participants’ savings at a two to one rate and offer
other financial education opportunities. Research shows
that IDAs are useful tools to increase homeownership
rates among low- and moderate-income households and
IDA participation is associated with lower foreclosure
rates and consistent mortgage payments (Carrico 2019).
Currently, organizations such as the Kentucky Coalition
Against Domestic Violence offer IDAs and Russell Place
of Promise is using this tool. LMHA uses this tool for
homeowners in its Section 8 homeownership program.
• Complementing IDAs, Mortgage Reserve Accounts (MRAs)
are matched savings accounts that promote targeted
savings and are intended to minimize the negative
effects of unexpected income losses for low-income
homeowners. The Portland (OR) Housing Center recently
created an MRA program, matching every $200 saved by
program participants (Griggs and Ingram 2019).
WHO: nonprofits, banking community.
Community Land Trusts as a Wealth-Building Strategy:
• The median shared equity household accumulates
$14,000 in earned equity (compared to a median
initial investment of $1,875)
• 6 out of 10 equity homeowners use their earned
equity to eventually purchase a traditional market
rate home
• 99 percent of shared equity homes avoid
foreclosure proceedings
• 95 percent of shared equity homes are priced
affordably (under 30 percent of monthly income)
for households earning 80 percent of AMI or below
(Grounded Solutions Network 2019)

2019
State of Metropolitan Housing Report 38
Create Tools to Address Insurance Disparities across Neighborhoods The lower incidence of default on mortgages for those
going through intense homeownership counseling is
now decades old. Yet homeowners’ insurance does not
recognize this difference and charges higher rates in Black/
African American neighborhoods, although it is challenging
to collect and analyze data that precisely shows the effect
of this type of discrimination (Squires 2003). Research
has shown that premiums for car insurance in Black
neighborhoods are significantly higher, although insurance
payouts may be similar (Angwin, Larson and Mattu 2017).
More transparency in reporting by insurance companies, as
required in other states, is an important step for reining in
what many consider a legacy form of redlining - charging
higher premiums in car and homeowners’ insurance in
Black/African American neighborhoods.
WHO: state government; insurance industry
Promote the widespread use of Rent Reporting Rent reporting, or the monthly reporting of a tenant’s rent
payments to major credit bureaus for inclusion on credit
reports, is a critical solution for building a credit history
among low-income households without the burden of
additional debt (Agava 2019). Improved credit can build
wealth by reducing the need for high-cost credit tools and
creating access to traditional credit markets. Research
shows that the inclusion of payments such as rent, or
utilities is associated with improved credit access for low-
income households (Turner, Walker and Wiermanski 2017).
LMHA should finalize the implementation of rent reporting
and LMG could adopt this as a requirement for developers
seeking public funds or other benefits.
WHO: local government; private developers
Support Nonprofits Focused on Wealth Building and Targeting The Racial Wealth Gap
Community Development Financial Institutions (CDFI)
provide an important source of local capital dedicated to
meeting the lending needs of lower-income households.
LHOME, a nonprofit Community Development Loan Fund,
is a certified CDFI providing small business loans, working
capital loans for minority and women affordable housing
contractors, and small developer/investor loans, among
other products. In partnership with Sponsor 4 Success, the
small developer loan is focused on creating high quality
affordable housing for West Louisville residents. LHOME
also recently announced its JobUp! Loan Programs, in
partnership with Strategic Alliance Consultants, which will
provide low-interest loans to immigrants and refugees
seeking recertification in high-demand occupations across
Louisville/Jefferson County. LHOME fills an important gap as
a community-based lender carefully targeting specific local
needs as a means of building-wealth and alleviating poverty.
WHO: foundations; individuals donors
Photo by Chris Harrell

22,000 EQUITIES
Addressing Racial Gaps in Homeownership and Wealth39
Needs Assessment – units that are affordable to households
under 50 percent AMI and under 30 percent AMI.
WHO: local government; Metro Council
Eliminate Single Family Zoning
The rationale for single family zoning is rooted in racist housing policies
that promoted the exclusion of Black/African American households
from White neighborhoods. As LMG updates the Land Development
Code to align with the goals of Plan 2040, careful attention should be
paid to approaches that can support the creation of more affordable
housing and dismantle the racial and economic segregation that
persists in Louisville. Specifically, LMG should consider eliminating
the single-family zoning classification. This would promote increased
housing density across the wide swaths of Louisville/Jefferson County
that currently do not all multifamily housing without additional permits
and approvals. This zoning change could encourage the development
of more affordable housing and signal the dismantling of historic
systems that perpetuate racial housing inequities.
WHO: local government; Metro Council
Implement and Enforce Community Benefit AgreementsPlanning processes can proactively address involuntary
displacement by including community input before major
reinvestments take place, prioritizing the concerns of existing
residents, and offering a means through which the needs
of these residents are incorporated into development plans.
Community Benefit Agreements allow for negotiation between the
neighborhood and developers, with a focus on ensuring that project
benefits align with residents’ needs. Similarly, a Community Impact
Report, like an environmental impact report, analyzes project costs,
benefits, and outcomes to the neighborhood, and identifies ways to
mitigate negative consequences (Bates 2013). Cities can require
these in any project receiving public incentives or investment.
WHO: local government; Metro Council; community-based
organizations
Develop Anti-Displacement Policies and Programs
As discussed in the 2018 State of Metropolitan Housing
Report, direct policy action is needed to prevent involuntary
Address the Affordable Housing Needs of Low-Income Households
Repurpose the CARES Program to target
Households below 50 percent AMI
Based on the findings of the Housing Needs Assessment, the
income groups with the greatest affordable housing needs are
households earning 50 percent and below and 30 percent
and below of AMI. As currently structured, the CARES program
targets households earning 80 percent AMI and below, but
the Housing Needs Assessment reveals that the affordability
gap for this group is much smaller than for lower-income
groups. Additionally, as discussed in this report, household
income among Black-African Americans and Hispanic/Latinx
is much lower than overall the overall median and 80 percent
AMI. Shifting the focus of CARES to households at 50 percent
AMI and below would better orient this program for addressing
the existing racial wealth gaps in Louisville/Jefferson County.
WHO: local government
Change Land-Use Policy and Practices that Limit Affordability and Perpetuate Residential Racial Segregation and Racial Disparities in Access to Housing
Create and Implement an Inclusionary Zoning
Ordinance
The prominence of affordable housing language included in
Louisville/Jefferson County’s recently adopted comprehensive
plan – Plan 2040 – has empowered Metro Council to ask
for inclusion of affordable housing units from developer’s
receiving benefits such as public funds or rezoning. However,
inclusionary zoning needs to be codified within the Land
Development Code for all projects receiving public funding
or any other benefits from LMG. The ordinance should also
specify the affordability targets for such a program, which
should directly address the largest gap identified in Housing

402019
State of Metropolitan Housing Report
displacement. From a racial equity lens, the need for
these policies is most acute in West Louisville. As home
to a substantial portion of the Black/African American
population in Louisville/Jefferson County, substantial
changes to the real estate are already underway in many
West Louisville neighborhoods. Real estate changes alone
will almost certainly result in the widespread displacement
of many current residents of these neighborhoods. A
robust anti-displacement people strategy is necessary,
centered on supporting current residents’ ability to remain
in their neighborhoods and directly benefit from the
ongoing investments. Some specific anti-displacement
measures include, but are not limited to:
• Implementing rent control
• Supporting a tenants’ union and other tools to support
renters
• Implementing property tax moratoriums
• Implementing a just cause eviction statute
• Funding Legal Aid and other legal advocates to represent
renters in eviction court
• Changing the Forcible Entry and Detainer form to give
information to renters
• Changing foreclosure sales bidding policies to allow
residents to bid without an asset.
• Creating an organization or program that can purchase
foreclosure sales in fragile areas and convert to home
ownership opportunities
• Establishing a significantly funded eviction diversion
program to prevent homelessness.
• Creating a rental registry, where landlords would be
required to register rental properties, a list that includes
addresses and emergency contacts, with rent costs
included.
• Capping rental late fees at $50 or 5 percent of monthly
rent. Landlords will not be permitted to charge interest,
which happens now.
• Creating a rental inspection program. Landlords with long-
term (1 year or more), outstanding code violations would
be deemed a chronic nuisance and be subject to monthly
inspections every 30 days.
• Expanding fair housing protected classes.
• Supporting activist groups like Black Lives Matter Louisville
in their anti-displacement work.
WHO: local and state government; foundations; individual
donors
Invest in People as Much as Real Estate
MHC uses the disparity in homeownership to
highlight the difference in inter-generational wealth
building and income. The best way to make housing
affordable, create housing choice everywhere and
to enable households to enter into equity building
is to enhance households’ income and reliability of
income. Those programs should precede investment
in real estate encouraged by LMG. They should not be
after thoughts. The work of Russell: A Place of Promise
is several years behind pace with the application
and approval of tearing down Beecher Terrace, yet
Russell: A Place of Promise offers the best program
to help current residents of the neighborhood. It is
the intention of MHC and Russell: A Place of Promise
to track the results of interventions, programs, and
community engagement to see if the residents’ get
the tools needed to take advantage of and participate
in the results of the real estate investment. That is
where the true measurement of success will lie.
Photo courtesy of Russell: A Place of Promise
2019
State of Metropolitan Housing Report 40
ENDNOTES1 According to the US Census Bureau, the
term Black/African American refers to
individuals with origins in the “Black racial
groups of Africa.”
2 We rely on US Census race and ethnicity
categories in which the Hispanic/Latinx
category is considered an ethnic grouping
that is inclusive of multiple racial groups
ranging from White to Black as well as a
variety of country of origin statuses.
3 In this section, we analyze three
separate waves of Census and American
Community Survey (ACS) data – Census
2000, ACS 2008-2012 5-year estimates,
and ACS 2013-2017 5-year estimates
2017. For ease of discussion, we refer
to ACS 2008-2012 as simply 2012 and
ACS 2013-2017 as 2017. We chose
these years in order to analyze recent
trends and changes over time for housing,
demographic, and socioeconomic data
points. Census 2000 provides a baseline
comparison prior to the housing crisis.
The ACS 2008-2012 5-year estimates are
a proxy for after the housing crisis and
Great Recession. Finally, ACS 2013-2017
5-year estimates reflect the most recent
data available. We adjusted Census
2000 tract level data to be comparable
to Census 2010 tract boundaries using
the Brown Disparities and Diversities
Crosswalk files (Logan et. Al 2012).
4 All dollar values (e.g. median rents, home
values, and income) are expressed in
constant 2017 dollars.
5 All median rents in the report refer to
median gross rent. Median gross rent
number includes utilities if the renter must
pay. For ease of discussion, we often refer
to median gross rent as median rent.
6 There are nine zip codes that extend
beyond the Louisville/Jefferson County
boundary, which are included in the
analysis (40023, 40059, 40109, 40177,
40229, 40241, 40245, 40272, and 40299).
7 Eviction filings are cases filed in an area,
including multiple cases filed against
the same address in the same year.
The eviction filing rate is the ratio of
the number of evictions filed in an area
divided by the number of occupied renter
households in the same area. Counts
include all eviction cases filed in area,
including multiple cases filed against the
same address in the same year.
8 The information presented in this section
is based on documents provided by
RPOP and conversations in October and
November 2019 with the organization’s
director.
9 In this section, we use the most recently
available data for AMI (2019; HUD FY
2019 Income Limits Documentation
System) and median income (2017 ACS
5-year estimates).
22,000 EQUITIES
Addressing Racial Gaps in Homeownership and Wealth41
Photo Provided by Jane Walsh

REFERENCESAgava, Pamela. 2019. “What You Need to Know About Rent Reporting.” ProsperityNow. (https://prosperitynow.org/blog/what-you-need-know-about-rent-reporting).
Amadeo, Kimberly. 2019, “Racial Wealth Gap in the United States: Is There a Way to Close It and Fill the Divide?” The Balance. (https://www.thebalance.com/racial-wealth-gap-in-united-states-4169678).
Angwin, Julia, Jeff Larson and Surya Mattu. 2017. “Minority Neighborhoods Pay Higher Car Insurance Premiums Than White Areas with the Same Risk.” ProPublica. (https://www.propublica.org/article/minority-neighborhoods-higher-car-insurance-premiums-white-areas-same-risk).
Arno, C. Anneta and T. Benicio Gonzales. 2015. “Towards Racial Equity through Policy & Assessment.” Center for Health Equity. (https://louisvilleky.gov/sites/default/files/health_and_wellness/che/healing_possible_quorum/hpq100_final_recommendations_jan_2015.pdf).
Bartlett, Jackson Christopher. 2017. “Rights, Respectability, and Responsibility: Black Middle Class Frameworks for Understanding Neighborhood Decline.” Issues in Race & Society 5 (Fall 2017):30.
Benjamin, Ruha. 2019. Race after Technology: Abolitionist Tools for the New Jim Code. Cambridge, UK : Polity.
Bonilla-Silva, E. 2013. Racism without Racists: Color-Blind Racism and the Persistence of Racial Inequality in America: Rowman & Littlefield Publishers, Incorporated.
Buchino, Susan, Catherine Fosl, Lora Haynes, Kelly Kinahan, Linda Omer and Diane Zero. 2019. “Solving Street Homelessness in Louisville, KY: Improving the Climate of Care for Individuals Experiencing Homelessness.” University of Louisville: Commonwealth Institute of Kentucky.
Byrnes, Bill and Kasey Henricks. 2014. “That’s When the Neighborhood Went South”: How Middle Class Blacks and Whites Police Racial Boundaries of Stigmatized Blackness.” Sociological Spectrum 34(5):381-402. doi: 10.1080/02732173.2014.937650.
Campaign for Black Male Achievement. 2018. “CBMA Turns 10: 2018 Impact Report: A Decade of Risk, Urgency and Momentum.” (https://storage.googleapis.com/cbma-files/img/CBMA_2018_Impact_Rpt_web-2.pdf).
Carrico, Andrew. 2019. “Matched Savings for Downpayment Assistance: A Review of Current Research.” (https://prosperitynow.org/resources/matched-savings-downpayment-assistance).
Korver-Glenn, Elizabeth. 2017. “Brokering Ties and Inequality: How White Real Estate Agents Recreate Advantage and Exclusion in Urban Housing Markets.” Social Currents. doi: 10.1177/2329496517748333.
Korver-Glenn, Elizabeth. 2018. “Compounding Inequalities: How Racial Stereotypes and Discrimination Accumulate across the Stages of Housing Exchange.” American Sociological Review 83(4):627-56. doi: 10.1177/0003122418781774.
Kraus, Michael W. , Julian M. Rucker and Jennifer A. Richeson. 2017. “Americans Misperceive Racial Economic Equality.” Proceedings of the National Academy of Sciences of the United States of America. (https://www.pnas.org/content/114/39/10324).
Logan, J. R., Xu, Z., & Stults, B. (2012). Interpolating US Decennial Census Tract Data from as Early as 1970 to 2010: A Longitudinal Tract Database. Professional Geographer, 66(3), 412-420.
Louisville Affordable Housing Trust Fund (LAHTF). 2017. “2016-2017 Annual Report.” (http://loutrustfund.org/wp-content/uploads/2018/06/17-12-14-LAHTF-Annual-Report.pdf).
Louisville Affordable Housing Trust Fund (LAHTF). 2019. “Fact Sheet Lahtf Lousville Cares Program.” (http://loutrustfund.org/wp-content/uploads/2019/06/HousingFactSheetFINAL.pdf).
Louisville Metro Government (LMG). 2019. “Fy2019-2010 Louisville Metro Approved Executive Budget.” (https://louisvilleky.gov/sites/default/files/management_budget/2019-2020_louisville_metro_approved_executive_budget_2.pdf).
Louisville Metropolitan Government (LMG). 2018. “Cities United and Kenan Charitable Trust Launch Russell: A Place of Promise.” 2019. (https://louisvilleky.gov/news/louisville-metro-government-cities-united-and-kenan-charitable-trust-launch-russell-place).
Louisville Metropolitan Government (LMG). 2019a. “Lousiville Cares. Rent and Income Limits.”. (https://louisvilleky.gov/government/housing/louisville-cares).
Louisville Metropolitan Government (LMG). 2019b. “Lousiville Cares.” (https://louisvilleky.gov/government/housing/louisville-cares).
Louisville Metropolitan Government (LMG). 2019c. “Section 106 Consulting Parties Meeting June 6, 2019. Slide #6 “Stage 1: Demolition Update, Beecher Terrace Demolition Plan-Revised 4-2-2019”. Retrieved November 2, 2019.
Ehlenz, Meagan M. and Constance Taylor. 2019. “Shared Equity Homeownership in the United States: A Literature Review.” Journal of Planning Literature 34(1):3-18. doi: 10.1177/0885412218795142.
Feagin, Joe R. and Melvin P. Sikes. 1994. Living with Racism: The Black Middle-Class Experience. Boston: Beacon Press.
Fischel, William A. 2001. “Homevoters, Municipal Corporate Governance, and the Benefit View of the Property Tax.” National Tax Journal 54(1):157-73. doi: https://www.jstor.org/stable/41789539.
Griggs, Lindsey and Renee Ingram. 2019. “The Long-Term Benefits of Buying a Home through an Individual Development Account.” ProsperityNow. (https://prosperitynow.org/blog/long-term-benefits-buying-home-through-individual-development-account).
Grounded Solutions Network. 2019. “Foreveryonehome: City Solutions for Housing Equity.” (https://groundedsolutions.org/ForEveryoneHome).
Hanlon, James. 2010. “Success by Design: HOPE VI, New Urbanism, and the Neoliberal Transformation of Public Housing in the United States.” Environment and Planning A 42 (1): 80-98. (https://doi.org/10.1068/a41278).
Housing and Urban Development (HUD). 2011. “HUD’s Methodology for Calculating Area Median Income (AMI) Limits.” Citizen’s Housing and Planning Association. (https://www.chapa.org/sites/default/files/HUDincomelimitexplainer2011.pdf)
Housing and Urban Development (HUD). 2019a. “Housing Choice Voucher Fact Sheet.” Office of Housing Choice Vouchers. (https://www.hud.gov/program_offices/public_indian_housing/programs/hcv/about/fact_sheet).
Housing and Urban Development (HUD). 2019b. “FY 2019 Income Limits Summary for Loiusville Metropolitan Statistical Area.” HUD User. (https://www.huduser.gov/portal/datasets/il/il2019/2019summary.odn).
Jefferson County Public Schools (JCPS). 2018. “JCPS Racial Educational Equity Plan 2018-2020.” (https://www.jefferson.kyschools.us/sites/default/files/Racial%20Education%20Equity%20Plan.pdf).
Jefferson County Public Schools (JCPS). 2019. “Diversity, Equity, & Poverty Programs Division.” (https://www.jefferson.kyschools.us/department/diversity-equity-and-poverty-programs-division).
JPMorgan Chase & Company. 2019. “Jpmorgan Chase Announces $15 Million for Advancingcities Challenge Winners.” (https://www.jpmorganchase.com/corporate/news/pr/2019-advancingcities-winners.htm). Continued on following page
2019
State of Metropolitan Housing Report 42

REFERENCESContinued from previous page
22,000 EQUITIES
Addressing Racial Gaps in Homeownership and Wealth43
U.S. Census Bureau. 2012. American Community Survey 2008-2012 5-year estimates Retrieved from https://www.socialexplorer.com/tables/ACS2012_5yr/R12293161.
U.S. Census Bureau. 2016, “Selected Characteristics, 2016 American Community Survey”.
U.S. Census Bureau. 2017. Selected housing and population characteristics, 2013-2017 American Community Survey 5-year estimates. Retrieved from (https://www.socialexplorer.com/tables/ACS2017_5yr/R12293386).
U.S. Department of Labor Bureau of Labor Statistics. 2019. US Inflation Calculator. (https://www.usinflationcalculator.com/inflation/consumer-price-index-and-annual-percent-changes-from-1913-to-2008).
Vision Russell. 2019a. “Beecher Terrace.” (https://visionrussell.org/beecher/).
Vision Russell. 2019b. “Beecher Terrace.” A Road Map for the Future. (https://visionrussell.org/beecher/).
Walker, Margath A. and Carol Hanchette. 2015. “Residents’ Experiences in the Aftermath of a Hope VI Revitalization Project: A Three-Pronged, Grounded Visualization Approach.” Applied Geography 57:71-79. doi: 10.1016/j.apgeog.2014.12.018.
Wiedrich, Kasey and David Newville. 2019. “Vulnerability in the Face of Economic Uncertainty.” ProsperityNow.org. (https://prosperitynow.org/sites/default/files/resources/2019_Scorecard_Key_Findings.pdf).
Woldoff, Rachael A. and Seth Ovadia. 2009. “Not Getting Their Money’s Worth: African-American Disadvantages in Converting Income,Wealth, and Education into Residential Quality.” Urban Affairs Review 45(1): 66-91. (https://doi.org/10.1177/1078087408328947).
Zuk, Miriam, Ariel H. Bierbaum, Karen Chapple, Karolina Gorska and Anastasia Loukaitou-Sideris. 2018. “Gentrification, Displacement, and the Role of Public Investment.” Journal of Planning Literature 33(1):31-44. doi: 10.1177/0885412217716439.
Louisville Metropolitan Housing Authority (LMHA). 2015. “Beecher Terrace Resident Survey Summary Tables, September 2015.”
Louisville Metropolitan Housing Authority (LMHA). 2017. “Vision Russell Transformation Plan.” EJP Consulting Group LLC, (January). (https://visionrussell.org/wp-content/uploads/2018/07/FinalVisionRussellTransformationPlan.pdf).
Louisville Metropolitan Housing Authority (LMHA). 2019. “Choice Neighborhood Inform: Housing Summary Report, Q2 2019, August 21, 2019.” Report submitted to HUD by LMHA and provided to authors via email.
Madden, Janice and Matt Ruther. 2018 “The paradox of expanding ghettos and declining racial segregation in large U.S. metropolitan areas, 1970–2010.” Journal of Housing Economics 40: 117-128. (https://doi.org/10.1016/j.jhe.2018.01.003).
Mann, David A. 2018. “Cover Story: Denying the American Dream — Louisville Banks Routinely Deny More Minority Home Loans.” Louisville Business First, April 13.
Massey, Douglas S. 2015. “The Legacy of the 1968 Fair Housing Act.” Sociological Forum 30(S1):571-88. doi: 10.1111/socf.12178.
Metropolitan Housing Coalition (MHC). 2008. “Louisville’s Foreclosure Crisis.” (http://www.metropolitanhousing.org/wp-content/uploads/member_docs/2008_Louisville_Foreclosure_Crisis.pdf).
Metropolitan Housing Coaltion (MHC). 2018. “State of Metropolitan Housing Report, Involuntary Displacement.” (http://www.metropolitanhousing.org/wp-content/uploads/2018/11/2018_SMHR_FINAL2_LoRes.pdf).
Oliver, Melvin L. and Thomas M. Shapiro. 1995. Black Wealth/White Wealth: A New Perspective on Racial Inequality. New York: Routledge.
Owens, Ann. 2012. “Neighborhoods on the Rise: A Typology of Neighborhoods Experiencing Socioeconomic Ascent.” City & Community 11(4):345-69. (10.1111/j.1540-6040.2012.01412.x).
Pattillo, Mary E. 1999. Black Picket Fences : Privilege and Peril among the Black Middle Class. Chicago: University of Chicago Press.
Philadelphia Energy Authority. 2018. “Residential Energy Consumption Survey: Implications for Philadelphia.” (http://philaenergy.org/residential-energy-consumption-survey-implications-for-philadelphia/).
Prosperity Now. 2019. “African American Financial Capability Initiative.” (https://prosperitynow.org/african-american-financial-capability-initiative).
Rothstein, Richard. 2017. The Color of Law : A Forgotten History of How Our Government Segregated America. New York: Liveright Publishing Corporation, a division of W.W. Norton & Company.
Squires, Gregory D. 2003. “Racial Profiling, Insurance Style: Insurance Redlining and the Uneven Development of Metropolitan Areas.” Journal of Urban Affairs 25(4):391-410. doi: 10.1111/1467-9906.t01-1-00168.
Stone, Chad, Danilo Trisi, Arloc Sherman and Roderick Taylor. 2019. “A Guide to Statistics on Historical Trends in Income Inequality.” Center on Budget and Policy Priorities. (https://www.cbpp.org/sites/default/files/atoms/files/11-28-11pov_0.pdf).
Taylor, Keeanga-Yamahtta. 2019. Race for Profit : How Banks and the Real Estate Industry Undermined Black Homeownership. Chapel Hill: University of North Carolina Press.
Tides Foundation. 2019. “Cities United.” Tides. (https://www.tides.org/project/social-venture/cities-united/).
Turner, Michael, Patrick Walker and Chet Wiermanski. 2017. “Changing the Lending Landscape: Credit Deserts, the Credit Ivisible, and Data Gaps in Silicon Valley “. PERC Results and Solutions. (https://www.perc.net/wp-content/uploads/2017/11/Credit_Desert.pdf).
U.S. Census Bureau. 2000. Selected housing and population characteristics, Summary Tape File 3. Prepared by Social Explorer. (https://www.socialexplorer.com/tables/C2000/R12294663).
Photo by Chris Harrell

2019 STATE OF METROPOLITAN HOUSING REPORT FUNDERS
2019 MHC ANNUAL MEETING SPONSORS
SPONSORS OF OTHER MHC EVENTS
MHC wishes to thank the following organizations for their generous sponsorship
of our 2019 Annual Meeting, held on May 30, 2019 at The Olmsted.
Foundation Sponsor ($2,500)
PNC Bank
Keystone Sponsors ($1,500)
BB&T
LDG Development
Tyler Park Neighborhood Association
Groundbreaking Sponsors ($1,000)
Fifth Third Bank
First Financial Bank
Organizations
City of Plantation
First Financial Bank
The Housing Partnership, Inc. (HPI)
Habitat for Humanity of Metro Louisville
The Housing Partnership, Inc. (HPI)
Dr. Johanna Bos
Louisville Metro Housing Authority (LMHA)
Louisville Metro Office of Housing and Community Development
Louisville Urban League/Rebound, Inc.
New Directions Housing Corporation
River City Housing
League of Women Voters
of Louisville
Tyler Park Neighborhood
Association
The Weber Group
Stites & Harbison PLLC
Advocate Sponsors ($500)
AARP
A Fund, Inc.
Craig Henry PLC
Jewish Family and Career
Services (JFCS)
Kentucky Housing
Corporation (KHC)
LockUpLead™
Louisville Affordable
Housing Trust Fund (LAHTF)
Individuals
Robin Bray
Janet Dakan
Stacy Deck
Kevin Dunlap
Everett Hoffman & Cathy
Ford
Lisa Thompson & Tom
Johnson
Metro United Way
Next Step Network
Spalding University School
of Social Work
The Weber Group
In-Kind Sponsors
Farley Printing
Republic Bank
Program Advertisements
League of Women Voters
of Louisville
2019
State of Metropolitan Housing Report 44

2019 MHC BOARD OF DIRECTORS
FOUNDATIONS AND GRANT-MAKING INSTITUTIONS
MHC STAFF
ACKNOWLEDGEMENTS
MHC Board Chair
Dr. Stacy Deck
Spalding University School of Social Work
MHC Board Vice Chair Robin Bray
Bray Property Management, LLC
MHC Treasurer Adam Hall Fifth Third Bank
Kendall Boyd Louisville Metro Human Relations Commission
James Craig Craig Henry PLC
Janet Dakan League of Women Voters
Jeana Dunlap 2019 Loeb Fellow, Harvard Graduate School of Design
Kevin Dunlap REBOUND, Inc.
Jackie Floyd Russell: A Place of Promise
Alicia Hurle Kentuckians for the Commonwealth
Dana Jackson Better Together Strategies
Stephen Kertis Kertis Creative
Dr. Jim Mims Elite Homes
David Morrison David Morrison HR Consulting
John Nevitt Metro United Way
Johnetta Roberts The Forty and One Company
Renita Rosa PNC Bank
Lisa Thompson Louisville Urban League
Ramona Vasta LDG Multifamily LLC
Faith Weekly Federal Reserve Bank of St. Louis, Louisville Branch
Arthur K. Smith Foundation
BB&T
Econometrica, Inc.
Epiphany Catholic Church
Gannett Foundation
Executive Director Cathy Hinko
The Gheens Foundation
Kentucky Housing Corporation
Lexington Fair Housing Council
Development Director Anthony P. Curtis
Louisville Affordable Housing Trust Fund
Louisville Bar Foundation
Louisville Metro Government
The Mason Family Fund
Norton Healthcare Foundation
Wells Fargo
The 2019 State of Metropolitan Housing Report is a product of the Center for Environmental Policy and Management (CEPM) at the University of Louisville in collaboration with the Metropolitan Housing Coalition. The report was authored by Dr. Lauren C. Heberle, Associate Professor, Sociology and Director, CEPM; Dr. Kelly L. Kinahan, Assistant Professor, Urban and Public Affairs; Danielle Rohret, Urban and Public Affairs Doctoral Candidate; Jamar Wheeler, Sociology Doctoral Candidate; and Rebecca Halpryn, Sociology Master’s student, with support from Dexter Horne and Quincy Langford. This report also received support from the UofL Cooperative Consortium for Transdisciplinary Social Justice Research as part of the Housing Justice Research Group. We thank Rachel Carter, Assistant Professor, Theatre Arts for substantive editorial, messaging, and design support. We also acknowledge Professor Carter’s efforts to connect the research produced with the UofL Theatre Arts Mainstage Season 2019-2020 “A Season of Black Plays”.
Further thanks to the local agencies and organizations who share their data with us every year.
Graphic Design: Rob Gorstein Design
MHC RemembersOur First Executive DirectorSuzy Post
SUZY POST WAS THE FIRST EXECUTIVE DIRECTOR of the
Metropolitan Housing Coalition (MHC) and without
her ability and focus, MHC would not exist today.
Suzy had worked for school desegregation, Title IX
compliance, and led the Kentucky ACLU all before
arriving at MHC. What a life of justice! Suzy formed the
basis of a coalition, gathering the first members and
financial supporters. That is a special talent. Under her
leadership MHC’s first research reports were produced
which now are the basis of much of MHC’s advocacy.
Her legacy in our community is immeasurable and her
wit and presence are sorely missed.
Cardinal Planning & Design, Inc.
Kate Cunningham
Cathy Hinko
Joe & Kathy Kremer
Al Spotts & Maggie Steptoe
Joe and Karen Stevenson
Thank you to the following donors who made a donation to MHC in Honor of Suzy Post:
22,000 EQUITIES
Addressing Racial Gaps in Homeownership and Wealth45

Thanks to these families and individuals for their support of MHC’s work!
Thanks to our organizational members for their partnership and support!
MHC MEMBERS
Anchoring Members ($200 – $499) Continued
Supporting Members ($75 – $199) Continued
Assisting Members ($1 – $74) Continued
Assisting Members ($1 – $74) Continued
Assisting Members ($1-$74) Continued
Sponsoring Members($1,000 & Above)Janet DakanJeana DunlapCathy HinkoSusan Hinko & Carl BatlinEverett Hoffman & Cathy
FordStephen Reily & Emily
BinghamBob & Felice SachsJohanna Wit van Wijk-Bos
Sustaining Members($500 - $999)Martin BosKate CunninghamBob & Susie CurtisAndrea LevereKatie McBride &
Mazen MasriJim MimsDavid MorrisonAgnes & Patrick NoonanCarla Wallace & Lisa Osanka
Anchoring Members($200 - $499)Barry BarkerTim & Melissa BarryBethany Breetz & Ron
LoughryMary Gail BryanSandra Riley BryantJohn Bugbee & Huyett
HurleyNancy ChurchDavid CoyteKevin DunlapRob & Tiffanie GorsteinKen & Angela Stallings
HaganAdam HallChristopher HarmerLauren HeberleVictoria MarkellDavid MindelJohn NevittElizabeth Smith RodesAl Spotts & Maggie SteptoeCurtis A. Stauffer & Rachel
CutlerEllen Van Hamburg
Ellen WeissJohn WelcherJena & Todd Willis
Supporting Members($75 – $199)Garrett & Lane AdamsAnn AllenBarbara BanaszynskiEdward BlayneyRobin BrayMarianne ButlerFaustine CaldwellBarbara CarterSherry L. CastetterMary CeridanPatrick CornettJohn & Amy CullenIrwin & Carol CutlerJoseph DeckStacy DeckHope Leet DittmeierPatrick DurhamDavid Joseph DutschkeCatheryn O’Connor DykstraDan FarrisLori Hudson FlaneryColleen FordAndrew M. FriedEllen Friedman & Jim
BirminghamMary FustingGordon & Joyce GarnerFr. Joseph GraffisMichael GrossJames HaswellMichele & Gordon HenryGeoffrey Hobin & Jennifer
HubbardCourtney & Valerie
HoekstraWilliam HollanderMike & Jennifer HynesDana JacksonJanet Jernigan & Frank
HeftLauren KehrLaDonna KennedyNancy LeachGregory B. Leichty
Karen & Mark LoringLynn & Crit LuallenTom & Noreen MasonKathryn MathenyKitty McKuneIsaac & Tari MooreGregory MooreKathleen M. Mounce &
Donald L. GartonBecky PeakRobin PenickNancy PetersonSuzy PostPatricia H. RameyStephanie ReeseSarah H. RhyneDavid RitchaySusan RostovMark & Laura RothsteinDavid Ruccio & Lisa
MarkowitzAnne SandersRon SchneiderBill & Rose SchreckFrank SchwartzRachelle SegerRich SeckelDiane ShottMandy SimpsonBarbara & John SinaiSue SpeedJoe & Karen StevensonElwood & Roxanne
SturtevantLisa Thompson & Tom
JohnsonJack Trawick & Patti ClareRick VanceRamona VastaBillie WadeJane WalshJim WayneZach WeddingRobert WilsonEd WnorowskiDwight Young
Assisting Members($1 – $74)Katie & Will Adamchik
Michael AldridgeConnor AllenCarrie AndersonAnonymousAnonymousAnonymousAnonymousRoger BastelEmily BooneKevin BordersNick BradenRay H. BrundigeJon Paul BryanMike BucciJane & Dick BurksBen & Sarah CarterJoseph CarterKatie CarterYolanda CarterBrian CaudillJan CieremansRose M. ClayCynthia ConleyAida CopicJames CraigCassandra CulinPatricia CummingsTony & Beth CurtisDolores DelahantyYolanda Buford DemareeDarrell DensonAnn DeVilbissKatharine DobbinsGary DrehmelKathleen DrehmelGeorge EklundJessica M. ElkinSara & John ElliottAnne ElyMaria FernandezCarol FinckTrisha FinneganTom FitzgeraldJackie FloydDennis & Beth FordCate FoslAmanda FullerNancy Gall-Clayton
Faye GarnerBrenda GarnettTom & Judith GerdisJohnny GibsonZan D. GloverCarol Kirby GreenCarol HanchetteJessica HarbesonChristopher HarrellNatalie & John HarrisJohn HawkinsRoz HeinzJoseph B. & Louise HelmSteve HenryMaNya HillmanTerrell HolderDavid & Mary HorvathLisa Huber & Chris GoodlettAlicia HurleNicole JacksonSharon JeterElizabeth JohnstonStephen & Stephanie KertisThomas J. KiffmeyerLisa KilkellyKelly KinahanHarrison KirbyMichael KolodziejValerie KolodziejJoe & Kathy KremerForrest S. KuhnVicki W. LarmeeMichael LefflerAmy LowenAmy & Jay LuckettAllison MableyDoug Magee & Anne Marie
ReganBeverley MarmionJackie MayfieldAnne MayhughChristie McCravyDarrell Meadows &
Amanda FickeyTonya MontgomeryBeverly MoorePatricia MurrellTravis MylesStephen Neal
Carolyn NeustadtJoshua O. OdetundeEileen OrdoverDavid & Shirley OwenAndy PattersonDonna PearsonJessica PendergrassAmy PowellMaria PriceNancy Reinhart & David
MitchellKimberly RiceJohnetta RobertsBecky RoehrigRenita RosaIris SamsonJennifer SamuelsonTim ScheldorfJudy SchroederElizabeth Senn-AlveyJon & Jenny ShemwellAmy ShirDavid SimcoxKatie SkidmoreAllison SmithBarbara Sexton SmithKelsie SmithsonLori Stallworth-SmithEric & Jane StaufferJudy & Bob TiellAndrew P. TuckerJinny TurmanJennifer VandiverCindy VenableSandra WagnerNina WalfoortGeoff WallaceClare Rutz WallaceBill WalshElena Sexton WebbFaith WeeklyLynda WilcoxJustin WirthSteve WirthDiane M. WrightJennifer Yennes-VizhnayJoel ZakemBarry Zalph & Katie WhitesideMarilyn Zoidis
Anchoring Members($200 - $499) Continued
Supporting Members($75 - $199) Continued
Supporting Members($75-$199) Continued
Institutional Members($1,000 & Above)AARP of KentuckyArthur K Smith Family
FoundationBB&TBray Property Management LLCCommonwealth Bank & TrustEpiphany Catholic ChurchFifth Third BankNorton HealthcarePNC BankStites & HarbisonYum! Brands Foundation Inc
Sponsoring Members($500 - $999)Center for Women & FamiliesFirst Capital Bank of KentuckySisters of Charity of Nazareth
Anchoring Members($200 - $499)Center for Nonprofit ExcellenceCenterstone of KentuckyELCA-South-Central Conference
CouncilJefferson County Teachers
AssociationKentucky State AFL-CIO
KIPDA Area Agency on AgingSociety of St. Vincent de PaulSt. John Center, Inc.Valbridge Property Advisors |
Allgeier
Supporting Members($75 - $199)Access Ventures, Inc.Americana Community CenterAmick & CompanyAnne Braden Institute for Social
Justice Research
Benevity Community Impact Fund
Elderserve, Inc.Family & Children’s PlaceHarbor HouseHighland Presbyterian ChurchHoly Trinity ParishLHOMEMetro BankMulti-County Clients CouncilSt. Williams ChurchThomas Jefferson Unitarian
Church
Vision Homes LLC
Neighborhood Members($1 - $74)Dreams With Wings, Inc.Greater Louisville Sierra ClubHeart 2 Heart Wellness CenterKentucky Resources CouncilLeague of Women Voters of
LouisvilleLouisville Climate Action NetworkMile Wide Beer Co.Watrous Associates Architects, PSC
2019State of Metropolitan Housing Report 46

The Metropolitan Housing Coalition (MHC) strengthens, unites, and mobilizes private and public
resources to provide fair, accessible, and affordable housing for everyone in our community.