Embed Size (px)
Citation preview
Mailing address: P.O. Box 30009, 3001 DA Rotterdam, The NetherlandsPhone: +31 10 201 34 34 Fax: +31 10 411 40 81E-mail: [email protected] Internet: http://www.cbi.nl
Office and showroom: WTC-Beursbuilding, 5th floor37 Beursplein, Rotterdam, The Netherlands
CENTRE FOR THE PROMOTION OF IMPORTS FROM DEVELOPING COUNTRIES
DOMESTIC FURNITURE
DO
ME
ST
IC FU
RN
ITU
RE
EU MARKET SURVEY 2002
EU
MA
RK
ET
SU
RV
EY
2002V
OLU
ME
II VOLUME II
EU MARKET SURVEY 2002
DOMESTIC FURNITURE
Compiled for CBI by:
Searce
in collaboration withJ. Jonkers
July 2002

DISCLAIMERThe information provided in this market survey is believed to be accurate at the time of writing. It is, however, passedon to the reader without any responsibility on the part of CBI or the authors and it does not release the reader from theobligation to comply with all applicable legislation.
Neither CBI nor the authors of this publication make any warranty, expressed or implied, concerning the accuracy ofthe information presented, and will not be liable for injury or claims pertaining to the use of this publication or theinformation contained therein.
No obligation is assumed for updating or amending this publication for any reason, is it new or contrary information orchanges in legislation, regulations or jurisdiction.

Update of EU Market Survey ‘Domestic furniture’ (May 2001)

Photo courtesy:
Searce
CONTENTSREPORT SUMMARY 6
1 PRODUCT CHARACTERISTICS 91.1 Product groups 91.2 Customs/statistical product classification 9
2 INTRODUCTION TO THE EU MARKET 11
3 CONSUMPTION 133.1 Market size 133.2 Market segmentation 173.3 Consumption patterns and trends 23
4 PRODUCTION 27
5 IMPORTS 305.1 Total imports 305.2 Imports by product group 355.3 The role of developing countries 43
6 EXPORTS 47
7 TRADE STRUCTURE 507.1 EU trade channels 507.2 Distribution channels for developing country exporters 55
8 PRICES AND MARGINS 578.1 Prices and margins 578.2 Sources of price information 58
9 OPPORTUNITIES FOR EXPORTERS 59
APPENDICES 611 HS Codes - Domestic furniture 612 Detailed import/export statistics 623 Standards organisations 754 Sources of price information 765 Trade associations 776 Trade fair organisers 797 Trade press 808 Business support organisations 829 Other useful addresses 8310 List of developing countries 8411 List of relevant importers in The Netherlands and selected EU markets 8512 Useful Internet sites 91
5
REPORT SUMMARY
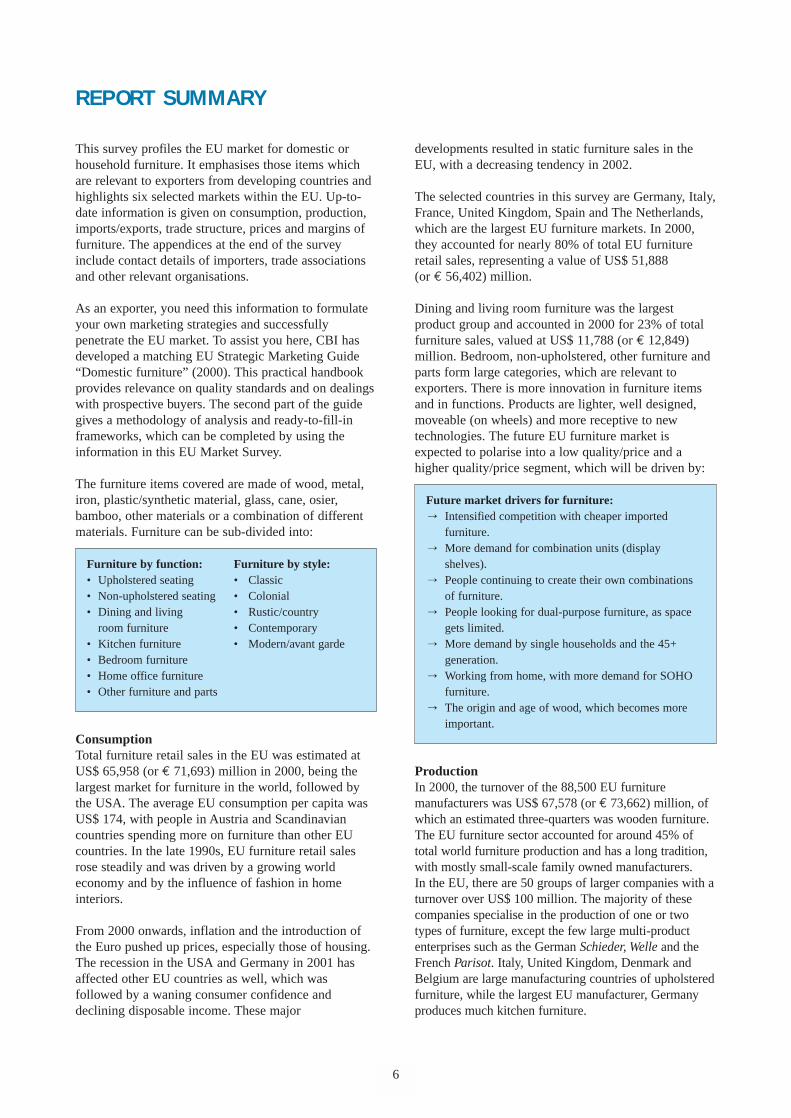
This survey profiles the EU market for domestic orhousehold furniture. It emphasises those items whichare relevant to exporters from developing countries andhighlights six selected markets within the EU. Up-to-date information is given on consumption, production,imports/exports, trade structure, prices and margins offurniture. The appendices at the end of the surveyinclude contact details of importers, trade associationsand other relevant organisations.
As an exporter, you need this information to formulateyour own marketing strategies and successfullypenetrate the EU market. To assist you here, CBI hasdeveloped a matching EU Strategic Marketing Guide“Domestic furniture” (2000). This practical handbookprovides relevance on quality standards and on dealingswith prospective buyers. The second part of the guidegives a methodology of analysis and ready-to-fill-inframeworks, which can be completed by using theinformation in this EU Market Survey.
The furniture items covered are made of wood, metal,iron, plastic/synthetic material, glass, cane, osier,bamboo, other materials or a combination of differentmaterials. Furniture can be sub-divided into:
Furniture by function: Furniture by style:• Upholstered seating • Classic• Non-upholstered seating • Colonial• Dining and living • Rustic/country
room furniture • Contemporary• Kitchen furniture • Modern/avant garde• Bedroom furniture• Home office furniture• Other furniture and parts
ConsumptionTotal furniture retail sales in the EU was estimated atUS$ 65,958 (or € 71,693) million in 2000, being thelargest market for furniture in the world, followed bythe USA. The average EU consumption per capita wasUS$ 174, with people in Austria and Scandinaviancountries spending more on furniture than other EUcountries. In the late 1990s, EU furniture retail salesrose steadily and was driven by a growing worldeconomy and by the influence of fashion in homeinteriors.
From 2000 onwards, inflation and the introduction ofthe Euro pushed up prices, especially those of housing.The recession in the USA and Germany in 2001 hasaffected other EU countries as well, which wasfollowed by a waning consumer confidence anddeclining disposable income. These major
6
developments resulted in static furniture sales in theEU, with a decreasing tendency in 2002.
The selected countries in this survey are Germany, Italy,France, United Kingdom, Spain and The Netherlands,which are the largest EU furniture markets. In 2000,they accounted for nearly 80% of total EU furnitureretail sales, representing a value of US$ 51,888 (or € 56,402) million.
Dining and living room furniture was the largestproduct group and accounted in 2000 for 23% of totalfurniture sales, valued at US$ 11,788 (or € 12,849)million. Bedroom, non-upholstered, other furniture andparts form large categories, which are relevant toexporters. There is more innovation in furniture itemsand in functions. Products are lighter, well designed,moveable (on wheels) and more receptive to newtechnologies. The future EU furniture market isexpected to polarise into a low quality/price and ahigher quality/price segment, which will be driven by:
Future market drivers for furniture:o Intensified competition with cheaper imported
furniture.o More demand for combination units (display
shelves).o People continuing to create their own combinations
of furniture.o People looking for dual-purpose furniture, as space
gets limited.o More demand by single households and the 45+
generation.o Working from home, with more demand for SOHO
furniture.o The origin and age of wood, which becomes more
important.
ProductionIn 2000, the turnover of the 88,500 EU furnituremanufacturers was US$ 67,578 (or € 73,662) million, ofwhich an estimated three-quarters was wooden furniture.The EU furniture sector accounted for around 45% oftotal world furniture production and has a long tradition,with mostly small-scale family owned manufacturers. In the EU, there are 50 groups of larger companies with aturnover over US$ 100 million. The majority of thesecompanies specialise in the production of one or twotypes of furniture, except the few large multi-productenterprises such as the German Schieder, Welle and theFrench Parisot. Italy, United Kingdom, Denmark andBelgium are large manufacturing countries of upholsteredfurniture, while the largest EU manufacturer, Germanyproduces much kitchen furniture.
ImportsThe EU is the leading importer of furniture in the worldand, in 2000, accounted for around 50% of total worldimports, or 7,232 thousand tonnes with a value of US$19,434 (or € 21,124) million. Germany imports morethan one quarter (28%) of all EU imports and isfollowed by France (15%) and The United Kingdom(14%). Between 1998 and 2000, all countries in the EUincreased their imports of furniture, especially in termsof volume (+30%). This was mainly due to the strengthof the US dollar and falling values for EU importsbecause of lower prices of most furniture items.
Product groupsMajor product groups: Dining and living, upholsteredand non-upholstered furniture together formed morethan one third (38%) of total EU imports in 2000. Thecategory other furniture is a sizeable product group,which grew fast recently and accounted in 2000 for18% of the value of EU imports. The largest categoryis furniture parts, which represented almost one thirdof EU imports.Raw materials: Wooden furniture accounted for nearlythree-quarters of EU imports in 2000, while imports ofmetal chairs and tables have grown in importance in thepast few years.
Main supplying countriesIntra-EU supplying countries: In 2000, around 55% ofEU imports came from other EU countries with Italyrepresenting 27% of total Intra-EU furniture supplies,followed by Germany (23%). Eastern European countries: These countriesexpanded their exports to the EU very rapidly in thepast decade, which is likely to grow further after theintroduction of the Euro. In 2000, EU imports fromthese countries together, valued US$ 3,993 (or € 4,340)million, or 20% of the EU total. Next to imports of lowpriced furniture, German manufacturers have furnitureof higher quality woods produced here. Especially inPoland, which accounted in 2000 for 8% of total EUimports. Other important countries, increasing theirsupplies to the EU were: Czech Republic, Slovenia,Romania, Hungary, Slovakia and Lithuania.
Developing countriesIn 2000, EU furniture imports from developingcountries was 1,362 thousand tonnes, representing avalue of US$ 3,875 (or € 4,212) million, a 58% volume increase over 1998. Around 75% is sourcedfrom Asia with rising tendencies in most countries.Particularly China and Malaysia increased their exportsespecially of dining and living, non-upholstered andother furniture.
7
In 2000, imports from China reached a value of US$ 855 (or € 929) million and have doubled both invalue and volume terms between 1998 and 2000.Supplies from Indonesia, Malaysia, Vietnam andThailand showed a similar trend. Most of thesecountries were able to benefit from the devaluationof their currencies relative to those in Europe, whichresulted in lower prices for EU importers, especiallyin the UK (strong Pound). Other countries whichincreased their supplies, between 1998 and 2000,to the EU were: India (+69% in volume terms), Brazil(+59%), Argentina (+322%), Bolivia (+40%), SouthAfrica (+27%), Turkey (+68%), Morocco (+115%)and Egypt (+42%).
Trade channelsMost furniture is supplied from manufacturers throughimporters/wholesalers or direct to consumers by the large retailers. In 2000, there were around80,000 furniture retail companies in the selected EUcountries, employing 400,000 people. In the same year,the share of EU furniture retail sales accounted for by specialists averaged 78%. Small furniture shopsare still strongly represented in Italy and Spain and most of them are not organised. Another furniturespecialist’s category were, franchised and chain store operations, which are dominant in France andUnited Kingdom. In the EU, the top 50 furnitureretailers controls 42% of the total market, most ofwhich were chain or franchised stores (IKEA, MFI,Conforama etc.). Many of these stores have their ownpurchasing staff, buying from all over the world.
Buying groups are important in Germany and The Netherlands, with smaller specialised shops. Sometimes these shops are housed in large interiorshopping malls at out-of-town centres. Althoughrecently, shopping malls suffered from the recessionand competition from discounters, non-specialists e.g.DIY, department stores, hypermarkets or clothing stores(UK). Specialist retailers also suffered from,manufacturers increasingly selling directly toconsumers by opening up single brand stores (e.g.Capellini or Leolux), factory outlets or franchisedoperations (e.g. Divani & Divani by Natuzzi).
Opportunities for exportersAs the EU furniture market declined since 2001,exporters should seek opportunities in growing niches:• Ethnic furniture in styles ranging from classic,
contemporary or modern rustic. It is important thatfurniture conveys its authenticity by special materials,designs, skills in craftsmanship or in finish.
• Colonial furniture with luxury items in darker wood(wengé, mahogany or cherry) more popular.
• Rattan furniture is frequently combined with woodentables in contemporary or rustic style furniture. A niche market developed for furniture of finewickerwork rattan, mixed with metal.
• Home office furniture, where items should bepractical, multi-functional and up-to-date.
• Children’s furniture, multi-functional and modularitems with safety standards being important.
• Solid woods similar to light oak, cherry or darkerwoods became popular, instead of veneers
• Special natural materials could be: rose oak,eucalyptus, palm fibre, bark, midribs, rice husk,seagrass, nutshells, parts of banana trees, waterhyacinth, canvas, cork or abacca leave.
• RTA: The quality and diversity in design of RTAfurniture is increasing.
• Specific target groups: such as furniture for seniors orfor the growing number of single households.
• Accessories, which could range from fruit bowls,candle holders, vases, flower pots, lampshades,storage boxes etc. Wicker or bamboo baskets or canemats are popular in bedrooms or bathrooms.
• Sub-contracting, as EU manufacturers look for newlow-cost countries to outsource production.
Requirements and difficulties for exporters• In order to approach the low and medium end of the
market, competitive prices are necessary.• Fast delivery (according to sample), good packaging,
and after-sales service are required. • Innovations are required to keep the interest of
consumers, who are more demanding.• As trends in home interiors change faster, it is difficult
to start a long-term investment.• Avoid using wood of (too) young trees, resulting in
warped furniture that cannot be sold.
8
Further market researchThis EU Market Survey and the EU StrategicMarketing Guide serve as a basis for further marketresearch: after you have read the survey and filled in the frameworks in the strategic marketing guide it isimportant to further research your target markets,sales channels and potential customers.
Market research depends on secondary data (data thathas already been compiled and published) and primarydata (information that you collect yourself). An exampleof secondary data is this EU Market Survey. Primarydata is needed when secondary data is not sufficient foryour needs as, for example, when you are researchingwhich type of consumer will be interested in yourspecific product.
Sources of information include (statistical) databanks,newspapers and magazines, market reports, (annual)reports from branch associations, along with shops intarget countries, products or catalogues from yourcompetitors, and conversations with suppliers,specialists, colleagues and even competitors. After youcollected your information you should analyse theinformation. In order to judge the attractiveness of amarket, you should develop a classification or scoresystem.
For more detailed information on market researchreference is made to CBI’s Export Planner (2000).
1 PRODUCT CHARACTERISTICS
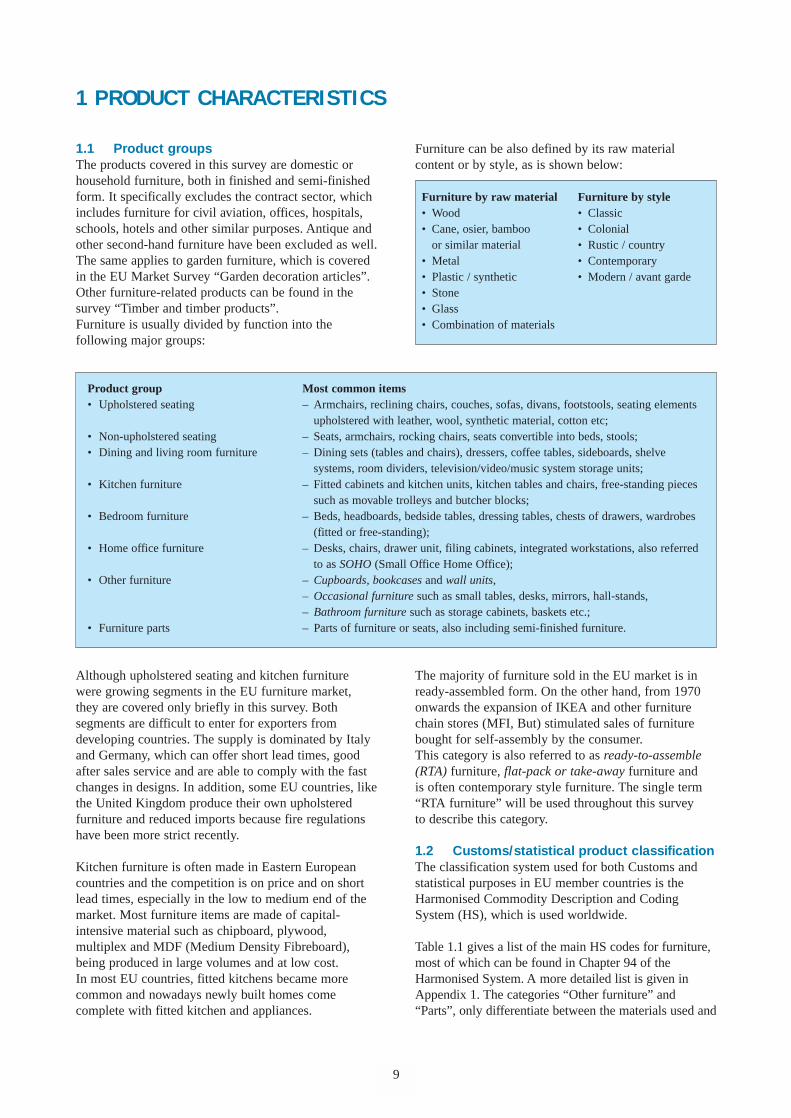
1.1 Product groupsThe products covered in this survey are domestic orhousehold furniture, both in finished and semi-finishedform. It specifically excludes the contract sector, whichincludes furniture for civil aviation, offices, hospitals,schools, hotels and other similar purposes. Antique andother second-hand furniture have been excluded as well.The same applies to garden furniture, which is coveredin the EU Market Survey “Garden decoration articles”.Other furniture-related products can be found in thesurvey “Timber and timber products”. Furniture is usually divided by function into thefollowing major groups:
Although upholstered seating and kitchen furniturewere growing segments in the EU furniture market,they are covered only briefly in this survey. Bothsegments are difficult to enter for exporters fromdeveloping countries. The supply is dominated by Italyand Germany, which can offer short lead times, goodafter sales service and are able to comply with the fastchanges in designs. In addition, some EU countries, likethe United Kingdom produce their own upholsteredfurniture and reduced imports because fire regulationshave been more strict recently.
Kitchen furniture is often made in Eastern Europeancountries and the competition is on price and on shortlead times, especially in the low to medium end of themarket. Most furniture items are made of capital-intensive material such as chipboard, plywood,multiplex and MDF (Medium Density Fibreboard),being produced in large volumes and at low cost. In most EU countries, fitted kitchens became morecommon and nowadays newly built homes comecomplete with fitted kitchen and appliances.
Furniture can be also defined by its raw materialcontent or by style, as is shown below:
The majority of furniture sold in the EU market is inready-assembled form. On the other hand, from 1970onwards the expansion of IKEA and other furniturechain stores (MFI, But) stimulated sales of furniturebought for self-assembly by the consumer. This category is also referred to as ready-to-assemble(RTA) furniture, flat-pack or take-away furniture andis often contemporary style furniture. The single term“RTA furniture” will be used throughout this surveyto describe this category.
1.2 Customs/statistical product classificationThe classification system used for both Customs andstatistical purposes in EU member countries is theHarmonised Commodity Description and CodingSystem (HS), which is used worldwide.
Table 1.1 gives a list of the main HS codes for furniture,most of which can be found in Chapter 94 of theHarmonised System. A more detailed list is given inAppendix 1. The categories “Other furniture” and“Parts”, only differentiate between the materials used and
9
Product group Most common items• Upholstered seating – Armchairs, reclining chairs, couches, sofas, divans, footstools, seating elements
upholstered with leather, wool, synthetic material, cotton etc;• Non-upholstered seating – Seats, armchairs, rocking chairs, seats convertible into beds, stools;• Dining and living room furniture – Dining sets (tables and chairs), dressers, coffee tables, sideboards, shelve
systems, room dividers, television/video/music system storage units; • Kitchen furniture – Fitted cabinets and kitchen units, kitchen tables and chairs, free-standing pieces
such as movable trolleys and butcher blocks; • Bedroom furniture – Beds, headboards, bedside tables, dressing tables, chests of drawers, wardrobes
(fitted or free-standing);• Home office furniture – Desks, chairs, drawer unit, filing cabinets, integrated workstations, also referred
to as SOHO (Small Office Home Office);• Other furniture – Cupboards, bookcases and wall units,
– Occasional furniture such as small tables, desks, mirrors, hall-stands,– Bathroom furniture such as storage cabinets, baskets etc.;
• Furniture parts – Parts of furniture or seats, also including semi-finished furniture.
Furniture by raw material• Wood• Cane, osier, bamboo
or similar material• Metal• Plastic / synthetic• Stone• Glass• Combination of materials
Furniture by style• Classic• Colonial• Rustic / country • Contemporary• Modern / avant garde
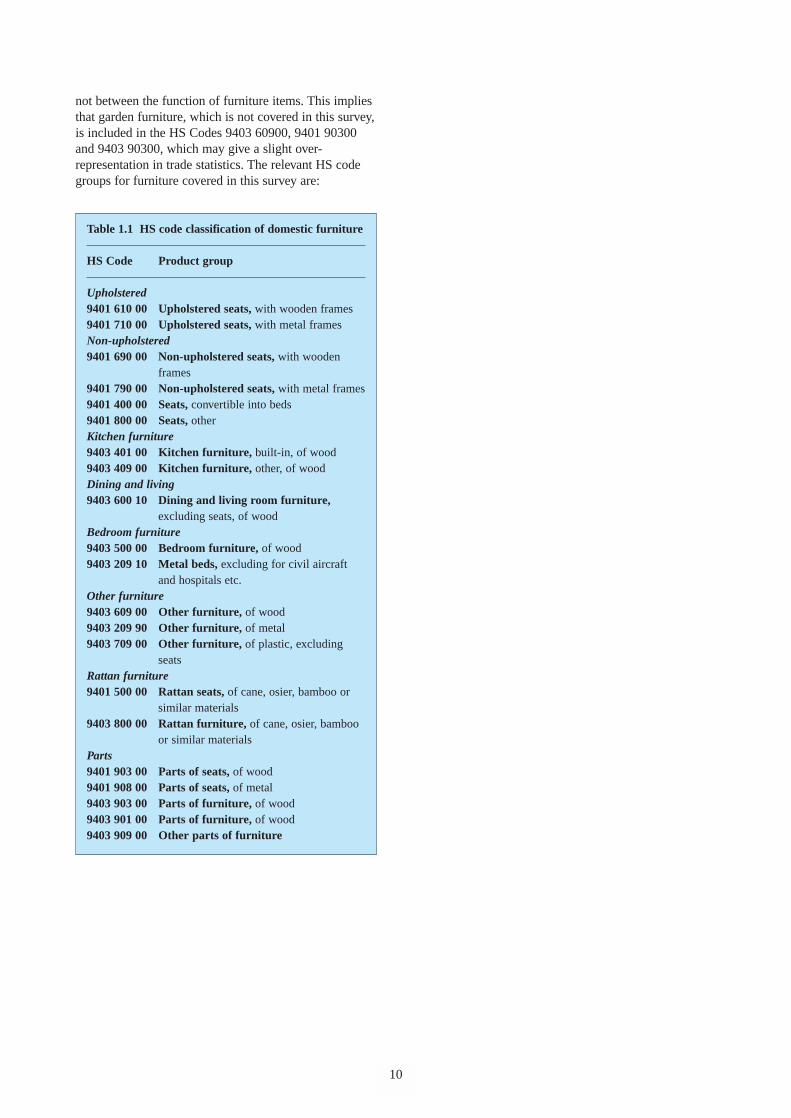
not between the function of furniture items. This impliesthat garden furniture, which is not covered in this survey,is included in the HS Codes 9403 60900, 9401 90300and 9403 90300, which may give a slight over-representation in trade statistics. The relevant HS codegroups for furniture covered in this survey are:
Table 1.1 HS code classification of domestic furniture
HS Code Product group
Upholstered 9401 610 00 Upholstered seats, with wooden frames9401 710 00 Upholstered seats, with metal framesNon-upholstered9401 690 00 Non-upholstered seats, with wooden
frames9401 790 00 Non-upholstered seats, with metal frames9401 400 00 Seats, convertible into beds9401 800 00 Seats, otherKitchen furniture9403 401 00 Kitchen furniture, built-in, of wood9403 409 00 Kitchen furniture, other, of woodDining and living9403 600 10 Dining and living room furniture,
excluding seats, of woodBedroom furniture9403 500 00 Bedroom furniture, of wood9403 209 10 Metal beds, excluding for civil aircraft
and hospitals etc.Other furniture9403 609 00 Other furniture, of wood9403 209 90 Other furniture, of metal 9403 709 00 Other furniture, of plastic, excluding
seatsRattan furniture9401 500 00 Rattan seats, of cane, osier, bamboo or
similar materials 9403 800 00 Rattan furniture, of cane, osier, bamboo
or similar materials Parts9401 903 00 Parts of seats, of wood9401 908 00 Parts of seats, of metal9403 903 00 Parts of furniture, of wood9403 901 00 Parts of furniture, of wood9403 909 00 Other parts of furniture
10
2 INTRODUCTION TO THE EU MARKET
European Union The European Union (EU) is the current name for theformer European Community. Since January 1, 1995the EU has consisted of 15 member states. Negotiationsare in progress with a number of candidate memberstates, many of whom already have extensive trade andco-operation agreements with the EU. It is envisagedthat five of these countries will become members in2003.
PopulationIn 2001, the EU population totalled 379 million, whichis around 3 times the Japanese and 1.4 times the USpopulation. The population of the selected EU marketsin this survey represents 314 million people with 124 million households. Germany has by far the largestpopulation size, with 82.3 million people. The UnitedKingdom, Italy, and France each have around 58 million inhabitants. The densely populated areas inthe EU are located in The Netherlands, Belgium,the Northwest of Germany, the Southwest of Englandand in northern Italy.
The unification processThe most important aspect of the process of unification(of the former EC countries) which affects trade is theharmonisation of rules in EU countries. As unificationallows free movement of capital, goods, services andpeople, the internal borders have been removed andgoods produced or imported into one member state canbe moved around between the other member stateswithout restrictions. A precondition for this free movement is uniformity inthe rules and regulations concerning locally producedor imported products. Although the EU is already afact, regulations in member countries have not yet beenharmonised. Work is in progress to create EUregulations in the fields of environmental pollution,health, safety, quality and education.
Size of the EU EconomyThe EU is among the largest economies in the world. In 2001, the average GDP per capita amounted to US$23,358 (or € 25,953) and a total GDP of US$ 6,653 (or € 7,392) billion. Germany, France, United Kingdomand Italy together account for three-quarters of the EUtotal GDP. The 2001 figures of national statistic officespoint to an average GDP growth in 2000 of 3.0% in theselected EU countries, with large growth in France, UK,Italy, Spain and The Netherlands, but with a slowdown in 2001, due to the economic recession following theattacks in the USA in September 2001.
Changeover to the Euro (€) On January 1, 1999, the Euro (€) became the legalcurrency within 11 EU member states: Austria,Belgium, Finland, France, Germany, Italy, Ireland,Luxembourg, The Netherlands, Spain, and Portugal.Circulation of Euro coins and banknotes started inJanuary 1, 2002 and replaced national currency notesand coins, which were withdrawn in July 1, 2002.
Currencies used in this EU market surveyThe most recent Eurostat trade statistics quoted in thissurvey are from the year 2000. In previous years,the European Currency Unit (ECU) was still used as amonetary instrument by financial institutions tosimplify financial procedures. On January 1, 1999,statistical and contractual values in ECU wereconverted into Euros on a 1:1 exchange rate. In 1999,the €/US$ exchange rate was US$ 1.06 for one € andin 2000 US$ 0.92 for one €, which are used in tradestatistics in this market survey. However in 2001,the value of the Euro fell to US$ 0.86 for one €,but regained in July 2002 an equal level (i.e. one € forone US$) since the US$ has weakened due to therecession in the USA.
In this market survey, the US$ is the basic currency unitused to indicate value. In trade statistics given inAppendix 2, the values for dates after January 1, 1999are also expressed in €.
11
Exchange rates of EU currencies in US$
Country Currency 1995 1996 1997 1998 1999 2000 2001
European Union ECU / € 1.29 1.25 1.13 1.12 1.06 0.92 0.86Denmark Dkr 0.18 0.17 0.15 0.15 0.13 0.12 0.12Sweden Skr 0.14 0.15 0.13 0.13 0.12 0.11 0.09United Kingdom GB£ 1.57 1.56 1.64 1.66 1.62 1.58 1.54
Source: CBS Statline (2002)
Trade statisticsTrade statistic quoted in this survey must be interpretedand used with extreme caution. The collection of dataregarding trade flows has become more difficult sincethe establishment of the single market on January 1,1993. Until that date, trade was registered by means ofcompulsory customs procedures at border crossings,but, since the removal of the intra-EU borders, this isno longer the case.
Statistical bodies such as Eurostat cannot now dependon the automatic generation of trade figures. In the caseof intra-EU trade, statistical reporting is onlycompulsory for exporting and importing firms whosetrade exceeds a certain annual value. The thresholdvaries considerably from country to country, but it istypically about € 100,000. As a consequence, tradewithin the EU is generally underestimated.On the other hand, figures for trade between the EUand the rest of the world (Extra-EU) are accuratelyregistered and, therefore, more precisely represented inthese statistics.
12
EU Market Survey - a brief introductionThis survey profiles the EU market for “Domesticfurniture” in which six selected markets within the EUare highlighted. The countries selected for this surveyare Germany, Italy, France, United Kingdom, Spain andThe Netherlands, which are the largest consumingcountries for furniture. In 2000, these countries togetheraccounted for nearly 80% of total EU furnitureconsumption, in which Germany had the largest share.Italy is the second largest consumer and sets worldwidetrends in furniture design. In 2000, the selected EUcountries accounted for almost three-quarter of EUfurniture imports, of which developing countriessupplied 20% in volume terms.
The United Kingdom, France and The Netherlandsplay an important role in furniture trends with peoplewho are more open to influences from other culturesand who tend to create more original home interiors.Spain has become a sizeable market for furniture andmay offer opportunities for exporters from developingcountries, especially because of its colonial linkswith supplying countries in Latin America and in The Philippines.
3 CONSUMPTION
3.1 Market size
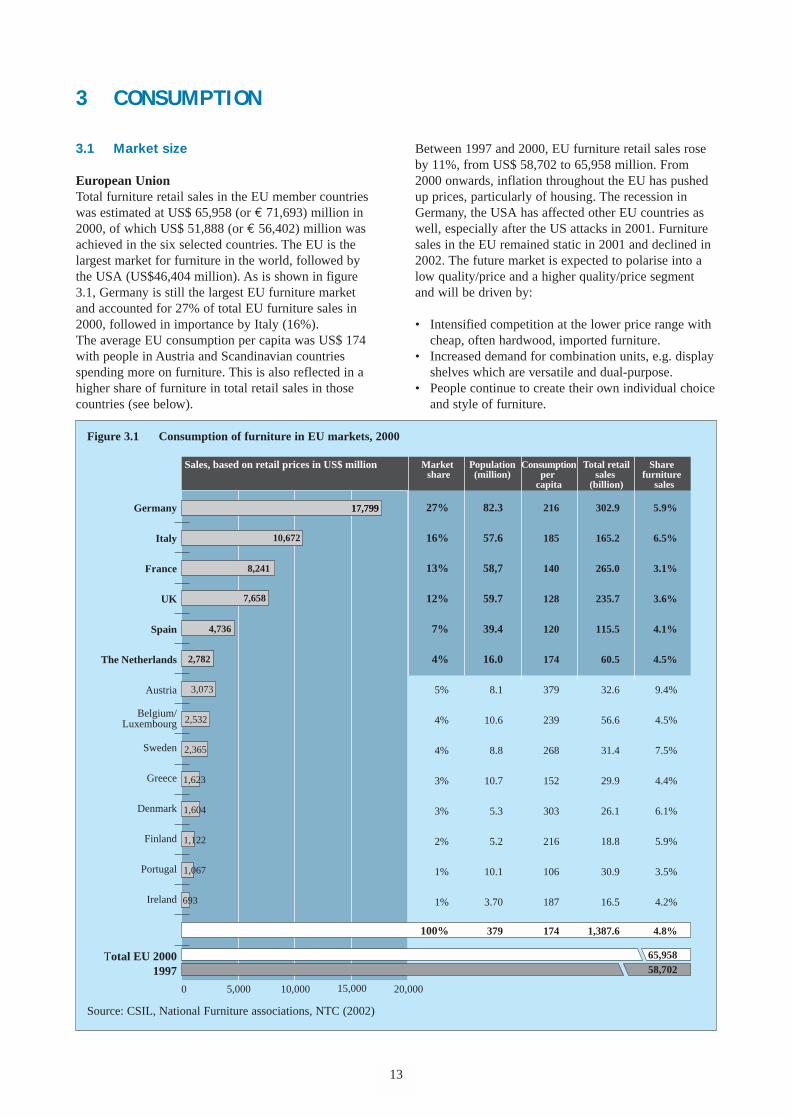
European UnionTotal furniture retail sales in the EU member countrieswas estimated at US$ 65,958 (or € 71,693) million in2000, of which US$ 51,888 (or € 56,402) million wasachieved in the six selected countries. The EU is thelargest market for furniture in the world, followed bythe USA (US$46,404 million). As is shown in figure3.1, Germany is still the largest EU furniture marketand accounted for 27% of total EU furniture sales in2000, followed in importance by Italy (16%). The average EU consumption per capita was US$ 174with people in Austria and Scandinavian countriesspending more on furniture. This is also reflected in ahigher share of furniture in total retail sales in thosecountries (see below).
Between 1997 and 2000, EU furniture retail sales roseby 11%, from US$ 58,702 to 65,958 million. From2000 onwards, inflation throughout the EU has pushedup prices, particularly of housing. The recession inGermany, the USA has affected other EU countries aswell, especially after the US attacks in 2001. Furnituresales in the EU remained static in 2001 and declined in2002. The future market is expected to polarise into alow quality/price and a higher quality/price segmentand will be driven by:
• Intensified competition at the lower price range withcheap, often hardwood, imported furniture.
• Increased demand for combination units, e.g. displayshelves which are versatile and dual-purpose.
• People continue to create their own individual choiceand style of furniture.
13
5,0000 10,000 15,000 20,000
Germany
Italy
France
UK
Spain
The Netherlands
Austria
Belgium/Luxembourg
Sweden
Greece
Denmark
Finland
Portugal
Ireland
Total EU 20001997
216
185
140
128
120
174
379
239
268
152
303
216
106
187
174
302.9
165.2
265.0
235.7
115.5
60.5
32.6
56.6
31.4
29.9
26.1
18.8
30.9
16.5
1,387.6
82.3
57.6
58,7
59.7
39.4
16.0
8.1
10.6
8.8
10.7
5.3
5.2
10.1
3.70
379
5.9%
6.5%
3.1%
3.6%
4.1%
4.5%
9.4%
4.5%
7.5%
4.4%
6.1%
5.9%
3.5%
4.2%
4.8%
65,95858,702
Sales, based on retail prices in US$ million Population(million)
Consumptionper
capita
Total retailsales
(billion)
Share furniture
sales
Market share
27%
16%
13%
12%
7%
4%
5%
4%
4%
3%
3%
2%
1%
1%
100%
17,799
8,241
17,799
10,672
7,658
4,736
2,782
3,073
2,532
2,365
1,623
1,604
1,122
1,067
693
Figure 3.1 Consumption of furniture in EU markets, 2000
Source: CSIL, National Furniture associations, NTC (2002)
• Increased demand for contemporary furniture bysingle households and the 45+ generation, with morevariety in designs, material, functions and coloursavailable.
• A growing home office furniture sector (SOHO),as more people work from home.
Germany
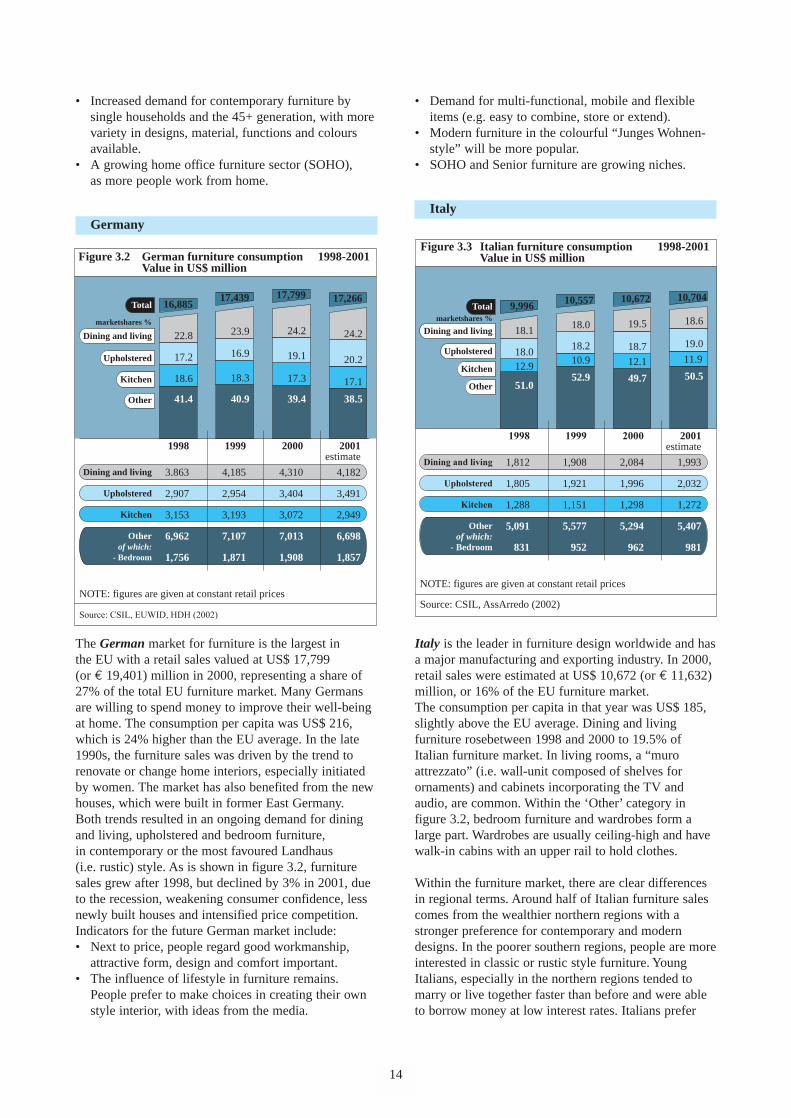
The German market for furniture is the largest in the EU with a retail sales valued at US$ 17,799 (or € 19,401) million in 2000, representing a share of27% of the total EU furniture market. Many Germansare willing to spend money to improve their well-beingat home. The consumption per capita was US$ 216,which is 24% higher than the EU average. In the late1990s, the furniture sales was driven by the trend torenovate or change home interiors, especially initiatedby women. The market has also benefited from the newhouses, which were built in former East Germany. Both trends resulted in an ongoing demand for diningand living, upholstered and bedroom furniture,in contemporary or the most favoured Landhaus (i.e. rustic) style. As is shown in figure 3.2, furnituresales grew after 1998, but declined by 3% in 2001, dueto the recession, weakening consumer confidence, lessnewly built houses and intensified price competition.Indicators for the future German market include:• Next to price, people regard good workmanship,
attractive form, design and comfort important.• The influence of lifestyle in furniture remains.
People prefer to make choices in creating their ownstyle interior, with ideas from the media.
14
• Demand for multi-functional, mobile and flexibleitems (e.g. easy to combine, store or extend).
• Modern furniture in the colourful “Junges Wohnen-style” will be more popular.
• SOHO and Senior furniture are growing niches.
Italy
Italy is the leader in furniture design worldwide and hasa major manufacturing and exporting industry. In 2000,retail sales were estimated at US$ 10,672 (or € 11,632)million, or 16% of the EU furniture market. The consumption per capita in that year was US$ 185,slightly above the EU average. Dining and livingfurniture rosebetween 1998 and 2000 to 19.5% ofItalian furniture market. In living rooms, a “muroattrezzato” (i.e. wall-unit composed of shelves forornaments) and cabinets incorporating the TV andaudio, are common. Within the ‘Other’ category infigure 3.2, bedroom furniture and wardrobes form alarge part. Wardrobes are usually ceiling-high and havewalk-in cabins with an upper rail to hold clothes.
Within the furniture market, there are clear differencesin regional terms. Around half of Italian furniture salescomes from the wealthier northern regions with astronger preference for contemporary and moderndesigns. In the poorer southern regions, people are moreinterested in classic or rustic style furniture. YoungItalians, especially in the northern regions tended tomarry or live together faster than before and were ableto borrow money at low interest rates. Italians prefer
Figure 3.2 German furniture consumption 1998-2001 Value in US$ million
Total 16,885
1998 1999 2001estimate
2000
22.8
18.6
41.4
17.2
17,439
16.9
23.9
40.9
18.3
17,799
19.1
24.2
39.4
17.3
Dining and living
Upholstered
Kitchen
Other
3.863
2,907
3,153
6,962
1,756
4,185
2,954
3,193
7,107
1,871
4,182
3,491
2,949
6,698
1,857
4,310
3,404
3,072
7,013
1,908
Dining and living
Upholstered
Kitchen
Otherof which:
- Bedroom
marketshares %
NOTE: figures are given at constant retail prices
Source: CSIL, EUWID, HDH (2002)
24.2
17.1
38.5
20.2
17,266
Figure 3.3 Italian furniture consumption 1998-2001 Value in US$ million
Total 9,996
1998 1999 2001estimate
2000
18.1
12.9
51.0
18.0
10,557
18.2
18.0
52.9
10.9
10,672
18.7
19.5
49.7
12.1
4
Dining and living
Upholstered
Kitchen
Other
1,812
1,805
1,288
5,091
831
1,908
1,921
1,151
5,577
952
1,993
2,032
1,272
5,407
981
2,084
1,996
1,298
5,294
962
Dining and living
Upholstered
Kitchen
Otherof which:
- Bedroom
marketshares %
NOTE: figures are given at constant retail prices
Source: CSIL, AssArredo (2002)
18.6
11.9
50.5
19.0
10,704
tailor-made sets of furniture and regard product(material, design etc.), service and delivery (4 - 8 weeks) to be more important than price.
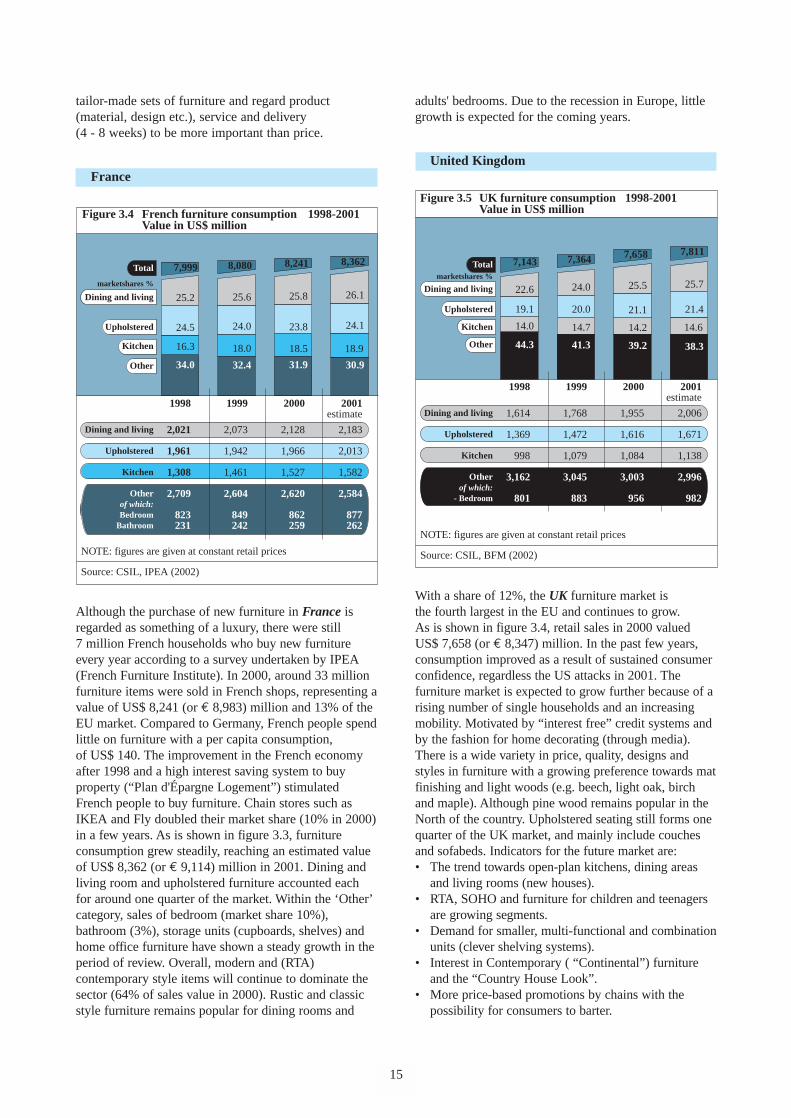
France
Although the purchase of new furniture in France isregarded as something of a luxury, there were still 7 million French households who buy new furnitureevery year according to a survey undertaken by IPEA(French Furniture Institute). In 2000, around 33 millionfurniture items were sold in French shops, representing avalue of US$ 8,241 (or € 8,983) million and 13% of theEU market. Compared to Germany, French people spendlittle on furniture with a per capita consumption,of US$ 140. The improvement in the French economyafter 1998 and a high interest saving system to buyproperty (“Plan d'Épargne Logement”) stimulatedFrench people to buy furniture. Chain stores such asIKEA and Fly doubled their market share (10% in 2000)in a few years. As is shown in figure 3.3, furnitureconsumption grew steadily, reaching an estimated valueof US$ 8,362 (or € 9,114) million in 2001. Dining andliving room and upholstered furniture accounted eachfor around one quarter of the market. Within the ‘Other’category, sales of bedroom (market share 10%),bathroom (3%), storage units (cupboards, shelves) andhome office furniture have shown a steady growth in theperiod of review. Overall, modern and (RTA)contemporary style items will continue to dominate thesector (64% of sales value in 2000). Rustic and classicstyle furniture remains popular for dining rooms and
15
adults' bedrooms. Due to the recession in Europe, littlegrowth is expected for the coming years.
United Kingdom
With a share of 12%, the UK furniture market is the fourth largest in the EU and continues to grow. As is shown in figure 3.4, retail sales in 2000 valuedUS$ 7,658 (or € 8,347) million. In the past few years,consumption improved as a result of sustained consumerconfidence, regardless the US attacks in 2001. Thefurniture market is expected to grow further because of arising number of single households and an increasingmobility. Motivated by “interest free” credit systems andby the fashion for home decorating (through media).There is a wide variety in price, quality, designs andstyles in furniture with a growing preference towards matfinishing and light woods (e.g. beech, light oak, birchand maple). Although pine wood remains popular in theNorth of the country. Upholstered seating still forms onequarter of the UK market, and mainly include couchesand sofabeds. Indicators for the future market are:• The trend towards open-plan kitchens, dining areas
and living rooms (new houses).• RTA, SOHO and furniture for children and teenagers
are growing segments.• Demand for smaller, multi-functional and combination
units (clever shelving systems). • Interest in Contemporary ( “Continental”) furniture
and the “Country House Look”.• More price-based promotions by chains with the
possibility for consumers to barter.
Figure 3.4 French furniture consumption 1998-2001 Value in US$ million
Total 7,999
1998 1999 2001estimate
2000
25.2
16.3
34.0
24.5
8,080
24.0
25.6
32.4
18.0
8,241
23.8
25.8
31.9
18.5
Dining and living
Upholstered
Kitchen
Other
2,021
1,961
1,308
2,709
823231
2,073
1,942
1,461
2,604
849242
2,183
2,013
1,582
2,584
877262
2,128
1,966
1,527
2,620
862259
Dining and living
Upholstered
Kitchen
Otherof which:Bedroom
Bathroom
marketshares %
NOTE: figures are given at constant retail prices
Source: CSIL, IPEA (2002)
26.1
18.9
30.9
24.1
8,362
Figure 3.5 UK furniture consumption 1998-2001 Value in US$ million
Total 7,143
1998 1999 2001estimate
2000
22.6
14.0
44.3
19.1
7,364
20.0
24.0
41.3
14.7
7,658
21.1
25.5
39.2
14.2
Dining and living
Upholstered
Kitchen
Other
1,614
1,369
998
3,162
801
1,768
1,472
1,079
3,045
883
2,006
1,671
1,138
2,996
982
1,955
1,616
1,084
3,003
956
Dining and living
Upholstered
Kitchen
Otherof which:
- Bedroom
marketshares %
NOTE: figures are given at constant retail prices
Source: CSIL, BFM (2002)
25.7
14.6
38.3
21.4
7,811
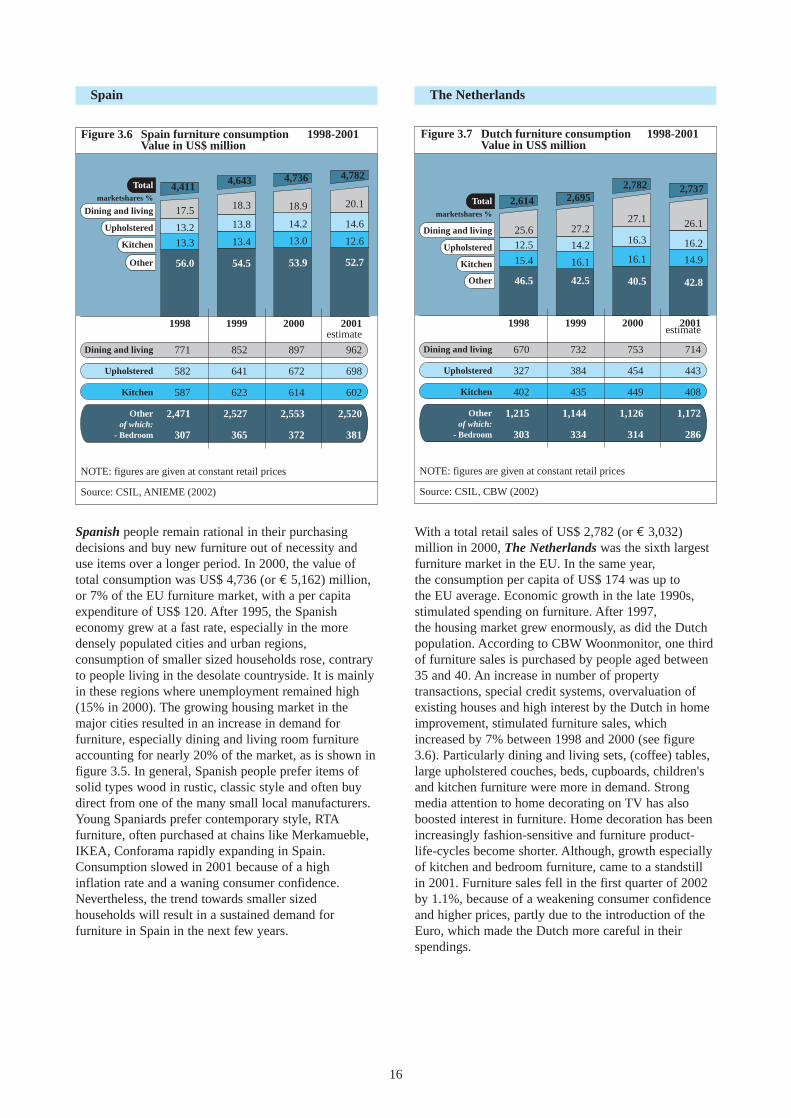
Spain
Spanish people remain rational in their purchasingdecisions and buy new furniture out of necessity anduse items over a longer period. In 2000, the value oftotal consumption was US$ 4,736 (or € 5,162) million,or 7% of the EU furniture market, with a per capitaexpenditure of US$ 120. After 1995, the Spanisheconomy grew at a fast rate, especially in the moredensely populated cities and urban regions,consumption of smaller sized households rose, contraryto people living in the desolate countryside. It is mainlyin these regions where unemployment remained high(15% in 2000). The growing housing market in themajor cities resulted in an increase in demand forfurniture, especially dining and living room furnitureaccounting for nearly 20% of the market, as is shown infigure 3.5. In general, Spanish people prefer items ofsolid types wood in rustic, classic style and often buydirect from one of the many small local manufacturers.Young Spaniards prefer contemporary style, RTAfurniture, often purchased at chains like Merkamueble,IKEA, Conforama rapidly expanding in Spain.Consumption slowed in 2001 because of a highinflation rate and a waning consumer confidence.Nevertheless, the trend towards smaller sizedhouseholds will result in a sustained demand forfurniture in Spain in the next few years.
16
The Netherlands
With a total retail sales of US$ 2,782 (or € 3,032)million in 2000, The Netherlands was the sixth largestfurniture market in the EU. In the same year,the consumption per capita of US$ 174 was up to the EU average. Economic growth in the late 1990s,stimulated spending on furniture. After 1997,the housing market grew enormously, as did the Dutchpopulation. According to CBW Woonmonitor, one thirdof furniture sales is purchased by people aged between35 and 40. An increase in number of propertytransactions, special credit systems, overvaluation ofexisting houses and high interest by the Dutch in homeimprovement, stimulated furniture sales, whichincreased by 7% between 1998 and 2000 (see figure3.6). Particularly dining and living sets, (coffee) tables,large upholstered couches, beds, cupboards, children'sand kitchen furniture were more in demand. Strongmedia attention to home decorating on TV has alsoboosted interest in furniture. Home decoration has beenincreasingly fashion-sensitive and furniture product-life-cycles become shorter. Although, growth especiallyof kitchen and bedroom furniture, came to a standstillin 2001. Furniture sales fell in the first quarter of 2002by 1.1%, because of a weakening consumer confidenceand higher prices, partly due to the introduction of theEuro, which made the Dutch more careful in theirspendings.
Figure 3.6 Spain furniture consumption 1998-2001 Value in US$ million
Total 4,411
1998 1999 2001estimate
2000
17.5
56.0
13.2
4,643
13.8
18.3
54.5
13.4
4,736
14.2
18.9
53.9
13.0
Dining and living
Upholstered
Kitchen
Other
771
582
587
2,471
307
852
641
623
2,527
365
962
698
602
2,520
381
897
672
614
2,553
372
Dining and living
Upholstered
Kitchen
Otherof which:
- Bedroom
marketshares %
NOTE: figures are given at constant retail prices
Source: CSIL, ANIEME (2002)
20.1
12.6
52.7
14.6
4,782
13.3
Figure 3.7 Dutch furniture consumption 1998-2001 Value in US$ million
Total 2,614
1998 1999 2001estimate
2000
25.6
15.4
46.5
12.5
2,695
14.2
27.2
42.5
16.1
2,782
16.3
27.1
40.5
16.1
Dining and living
Upholstered
Kitchen
Other
670
327
402
1,215
303
732
384
435
1,144
334
714
443
408
1,172
286
753
454
449
1,126
314
Dining and living
Upholstered
Kitchen
Otherof which:
- Bedroom
marketshares %
NOTE: figures are given at constant retail prices
Source: CSIL, CBW (2002)
26.1
14.9
42.8
16.2
2,737
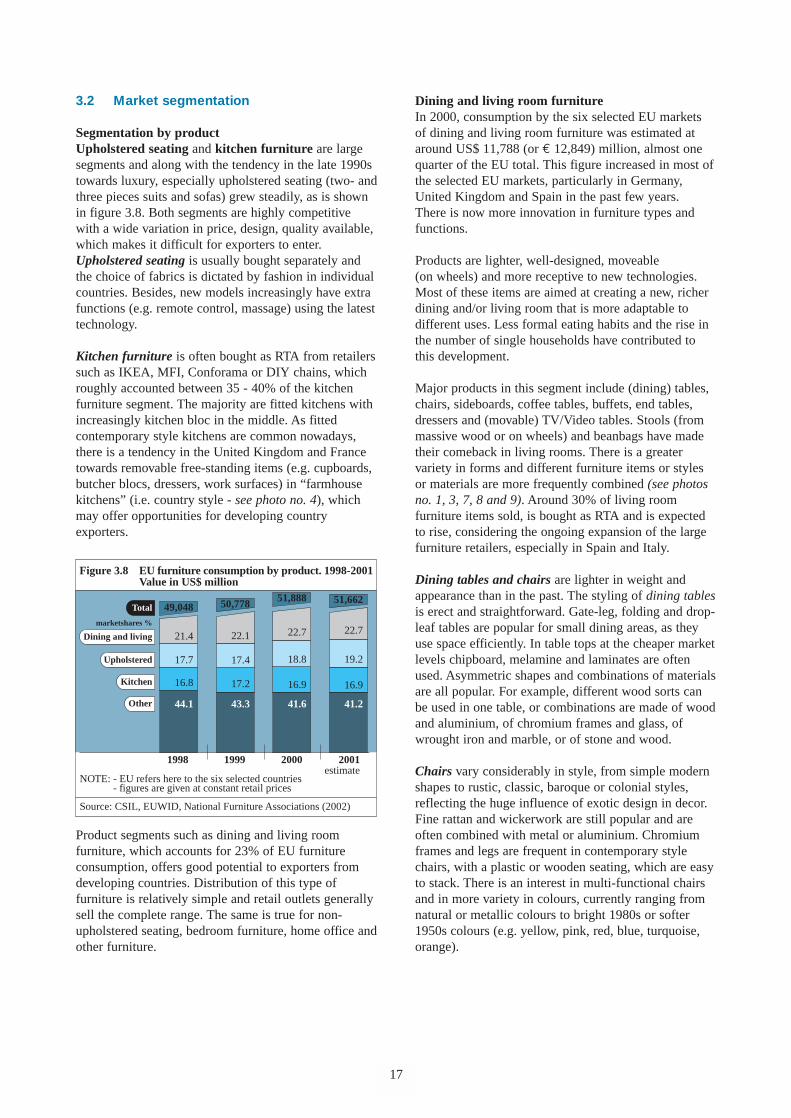
3.2 Market segmentation
Segmentation by productUpholstered seating and kitchen furniture are largesegments and along with the tendency in the late 1990stowards luxury, especially upholstered seating (two- andthree pieces suits and sofas) grew steadily, as is shownin figure 3.8. Both segments are highly competitivewith a wide variation in price, design, quality available,which makes it difficult for exporters to enter.Upholstered seating is usually bought separately andthe choice of fabrics is dictated by fashion in individualcountries. Besides, new models increasingly have extrafunctions (e.g. remote control, massage) using the latesttechnology.
Kitchen furniture is often bought as RTA from retailerssuch as IKEA, MFI, Conforama or DIY chains, whichroughly accounted between 35 - 40% of the kitchenfurniture segment. The majority are fitted kitchens withincreasingly kitchen bloc in the middle. As fittedcontemporary style kitchens are common nowadays,there is a tendency in the United Kingdom and Francetowards removable free-standing items (e.g. cupboards,butcher blocs, dressers, work surfaces) in “farmhousekitchens” (i.e. country style - see photo no. 4), whichmay offer opportunities for developing countryexporters.
Product segments such as dining and living roomfurniture, which accounts for 23% of EU furnitureconsumption, offers good potential to exporters fromdeveloping countries. Distribution of this type offurniture is relatively simple and retail outlets generallysell the complete range. The same is true for non-upholstered seating, bedroom furniture, home office andother furniture.
17
Dining and living room furnitureIn 2000, consumption by the six selected EU markets of dining and living room furniture was estimated ataround US$ 11,788 (or € 12,849) million, almost onequarter of the EU total. This figure increased in most ofthe selected EU markets, particularly in Germany,United Kingdom and Spain in the past few years. There is now more innovation in furniture types andfunctions.
Products are lighter, well-designed, moveable (on wheels) and more receptive to new technologies.Most of these items are aimed at creating a new, richerdining and/or living room that is more adaptable todifferent uses. Less formal eating habits and the rise inthe number of single households have contributed tothis development.
Major products in this segment include (dining) tables,chairs, sideboards, coffee tables, buffets, end tables,dressers and (movable) TV/Video tables. Stools (frommassive wood or on wheels) and beanbags have madetheir comeback in living rooms. There is a greatervariety in forms and different furniture items or stylesor materials are more frequently combined (see photosno. 1, 3, 7, 8 and 9). Around 30% of living roomfurniture items sold, is bought as RTA and is expectedto rise, considering the ongoing expansion of the largefurniture retailers, especially in Spain and Italy.
Dining tables and chairs are lighter in weight andappearance than in the past. The styling of dining tablesis erect and straightforward. Gate-leg, folding and drop-leaf tables are popular for small dining areas, as theyuse space efficiently. In table tops at the cheaper marketlevels chipboard, melamine and laminates are oftenused. Asymmetric shapes and combinations of materialsare all popular. For example, different wood sorts canbe used in one table, or combinations are made of woodand aluminium, of chromium frames and glass, ofwrought iron and marble, or of stone and wood.
Chairs vary considerably in style, from simple modernshapes to rustic, classic, baroque or colonial styles,reflecting the huge influence of exotic design in decor.Fine rattan and wickerwork are still popular and areoften combined with metal or aluminium. Chromiumframes and legs are frequent in contemporary stylechairs, with a plastic or wooden seating, which are easyto stack. There is an interest in multi-functional chairsand in more variety in colours, currently ranging fromnatural or metallic colours to bright 1980s or softer1950s colours (e.g. yellow, pink, red, blue, turquoise,orange).
Figure 3.8 EU furniture consumption by product. 1998-2001 Value in US$ million
Total 49,048
1998 1999 2001estimate
2000
21.4
16.8
44.1
17.7
50,778
17.4
22.1
43.3
17.2
51,888
18.8
22.7
41.6
16.9
Dining and living
Upholstered
Kitchen
Other
marketshares %
NOTE: - EU refers here to the six selected countries - figures are given at constant retail prices
Source: CSIL, EUWID, National Furniture Associations (2002)
22.7
16.9
41.2
19.2
51,662
Colonial style furniture, which combines south Asianand western design features, is becoming morerecognised as a permanent style and are often made ofdarker types of wood (e.g. teak, wengé, mahogany,cherry) or rattan and bamboo. Next to the usual teakwooden dining sets, more luxury items are beingintroduced in the selected EU markets (see large couchat photo no.2). These include seating made of highlypolished cherry wood and upholstered with leather,abundantly decorated small tables, or desks, with theiratmosphere of travel to exotic countries. Colonial stylefurniture is still a growing niche market in mostselected EU countries.
Bedroom furnitureAlong with increased concerns about their health,consumers are now more aware of their sleeping habitsand this has resulted in the replacement of mattressesand beds. Nowadays, people are more inclined to buybeds or bed bases made from wooden laths, without abedstead. This is partly because, as the population getstaller, there is a greater demand for bedding 180 x 200or 210 cm in size and manufacturers of bedsteads havenot always met this change in demand. Furthermore, itis also cheaper to exclude the bedstead from the overallpurchase. The trend now is towards lighter bedsteads onrelatively tall (decorative) legs, and heights which makethem more convenient for older people.
Sleeping areas in European bedrooms have beenreduced because of the popularity of large fittedcupboards. Bedrooms are now often multi-purpose andthis has resulted in an increase in demand for incidentalfurniture like occasional tables, drawer sets, modulardesks/shelving (for computers, TV, video), roomdividers and chairs. In the United Kingdom there iscurrently a move away from wardrobes and people tendto store their clothing in open racks, on rails or inwicker baskets.
In 2000, bedroom furniture represented 10% of totalEU consumption on furniture, with a value of aroundUS$ 5,374 (or € 5,857) million. An important trend inthis sector is the increasing demand for adjustable beds.Consumers buy around one quarter of bedroomfurniture in RTA form (in volume terms). Wood andMDF are the mostly used raw materials in themanufacture of beds. Modern and elegantly designedmetal beds and classic/baroque style metal or wroughtiron beds are becoming more popular. Beds made ofpine and light oak continue to hold an important share(see photo no.6), while birch, beech, ash and warmerwood colours like cherry are gaining interest.
Children's furnitureBedroom furniture for children and teenagers haveexperienced a steady growth with gradually morespecialist furniture makers entering this segment.
18
The introduction of multi-functional and modularranges, (see photo no.5), which can be added to overtime as the child grows, has meant that parents are nowmore willing to purchase better quality items. Recentlyparents tend to buy more for their children, who nowplay a larger role in furnishing their own rooms.
Another tendency is that young people are spendingmore time in their rooms (computer, TV, video gamesetc.). In this segment, safety standards are importantand exporters must pay extra attention to roundedcorners, non-cascading drawers, steel bolts in bunk bedsand bolted bed rails.
Home office furnitureThe home office furniture market, sometimes referred toas SOHO (Small Office Home Office) has grown fast.In most EU markets home working is becoming morecommon. There is a rapid expansion of flexible, remoteand telework practices coupled with PC penetration inthe home for business and family use. Additionaldemand for home office furniture comes from a newgeneration of computer-literate schoolchildren, whoneed some sort of workstation at home to complementthe facilities available at school. In addition, the leisureuse of PCs, for surfing the Internet, e-mailing andchatting, video games and interactive TV games, is stillon the increase.
Demand for space-saving furniture to accommodate theequipment (PC, printer, scanner, disks etc.) is likely toreplace the old spare table at home. Specific productsinclude desks, filing cabinets, integrated workstations,printer trolleys, shelving and drawer units (for storageof files and papers), office style chairs and roomdividers (see photo no.10). All these items are preferredto be on wheels, so that they can be moved easily. Most home office furniture is made of laminatedparticleboard, is low-priced and is often purchased asRTA. Designs can vary from the “industrial” to a more“personalised” look. This growing segment is highlycompetitive and quality standards, ergonomicrequirements and fast delivery are important in mostEU markets.
Other furnitureSales of Cupboards, bookshelves, room-dividers andstorage/wall units have grown strongly in the last fewyears. As personal computers and other electronicequipment become the focal point of the home forinformation, communication and entertainment,consumers are seeking and buying practical, multi-functional, good-looking furniture to house thisequipment in such a way that it does not dominate theambience of the room.
As with other furniture, there is a general trend to fillershapes (for corners etc.), open shelves and lighter
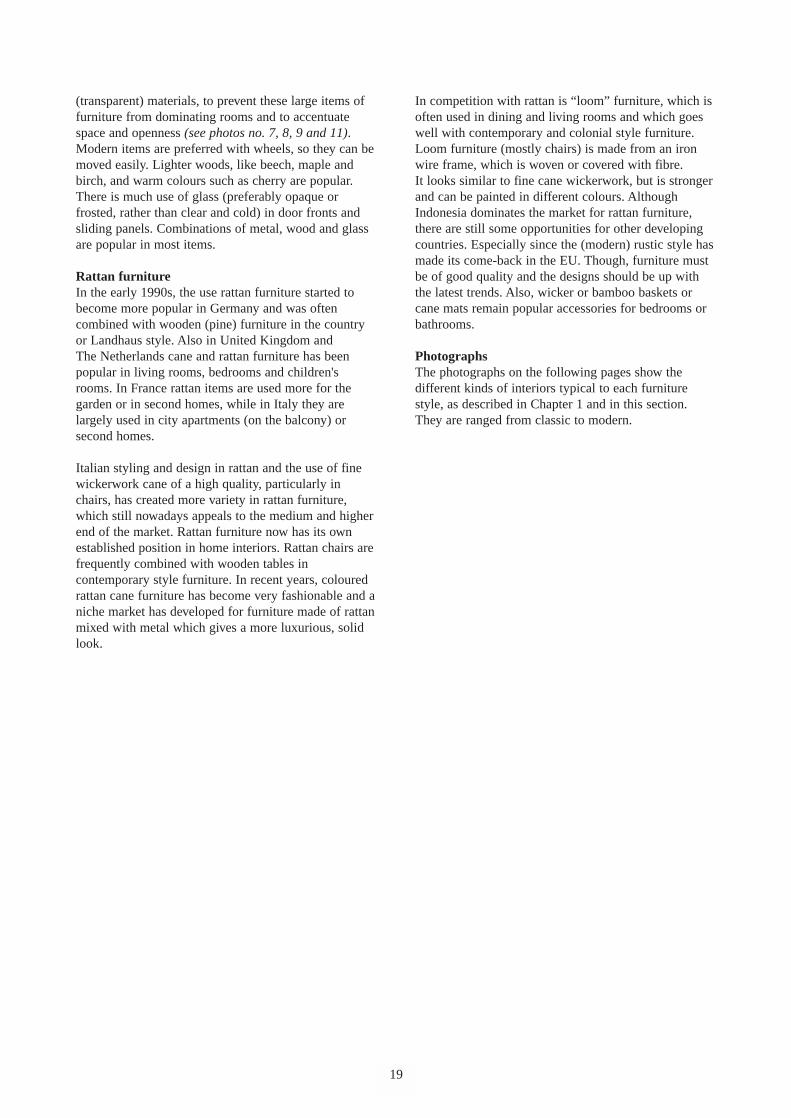
(transparent) materials, to prevent these large items offurniture from dominating rooms and to accentuatespace and openness (see photos no. 7, 8, 9 and 11).Modern items are preferred with wheels, so they can bemoved easily. Lighter woods, like beech, maple andbirch, and warm colours such as cherry are popular.There is much use of glass (preferably opaque orfrosted, rather than clear and cold) in door fronts andsliding panels. Combinations of metal, wood and glassare popular in most items.
Rattan furnitureIn the early 1990s, the use rattan furniture started tobecome more popular in Germany and was oftencombined with wooden (pine) furniture in the countryor Landhaus style. Also in United Kingdom and The Netherlands cane and rattan furniture has beenpopular in living rooms, bedrooms and children'srooms. In France rattan items are used more for thegarden or in second homes, while in Italy they arelargely used in city apartments (on the balcony) orsecond homes.
Italian styling and design in rattan and the use of finewickerwork cane of a high quality, particularly inchairs, has created more variety in rattan furniture,which still nowadays appeals to the medium and higherend of the market. Rattan furniture now has its ownestablished position in home interiors. Rattan chairs arefrequently combined with wooden tables incontemporary style furniture. In recent years, colouredrattan cane furniture has become very fashionable and aniche market has developed for furniture made of rattanmixed with metal which gives a more luxurious, solidlook.
19
In competition with rattan is “loom” furniture, which isoften used in dining and living rooms and which goeswell with contemporary and colonial style furniture.Loom furniture (mostly chairs) is made from an ironwire frame, which is woven or covered with fibre. It looks similar to fine cane wickerwork, but is strongerand can be painted in different colours. AlthoughIndonesia dominates the market for rattan furniture,there are still some opportunities for other developingcountries. Especially since the (modern) rustic style hasmade its come-back in the EU. Though, furniture mustbe of good quality and the designs should be up withthe latest trends. Also, wicker or bamboo baskets orcane mats remain popular accessories for bedrooms orbathrooms.
PhotographsThe photographs on the following pages show thedifferent kinds of interiors typical to each furniturestyle, as described in Chapter 1 and in this section.They are ranged from classic to modern.
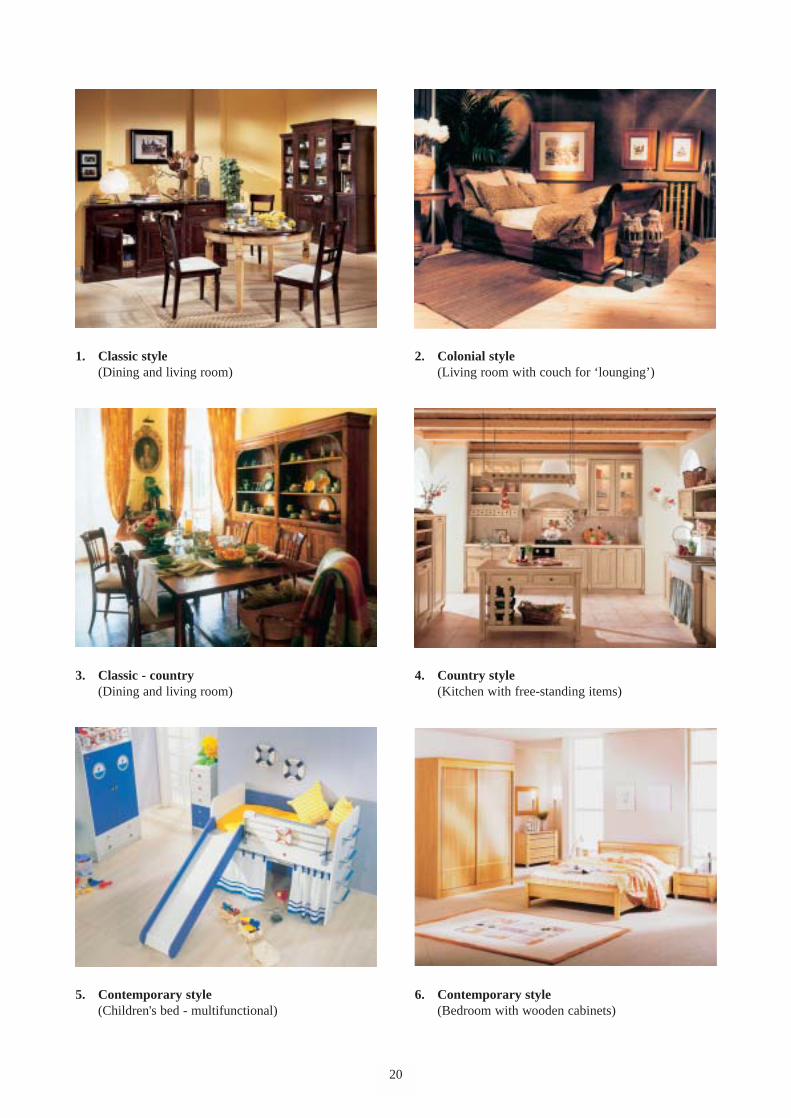
1. Classic style(Dining and living room)
3. Classic - country(Dining and living room)
5. Contemporary style(Children's bed - multifunctional)
20
2. Colonial style(Living room with couch for ‘lounging’)
4. Country style(Kitchen with free-standing items)
6. Contemporary style(Bedroom with wooden cabinets)
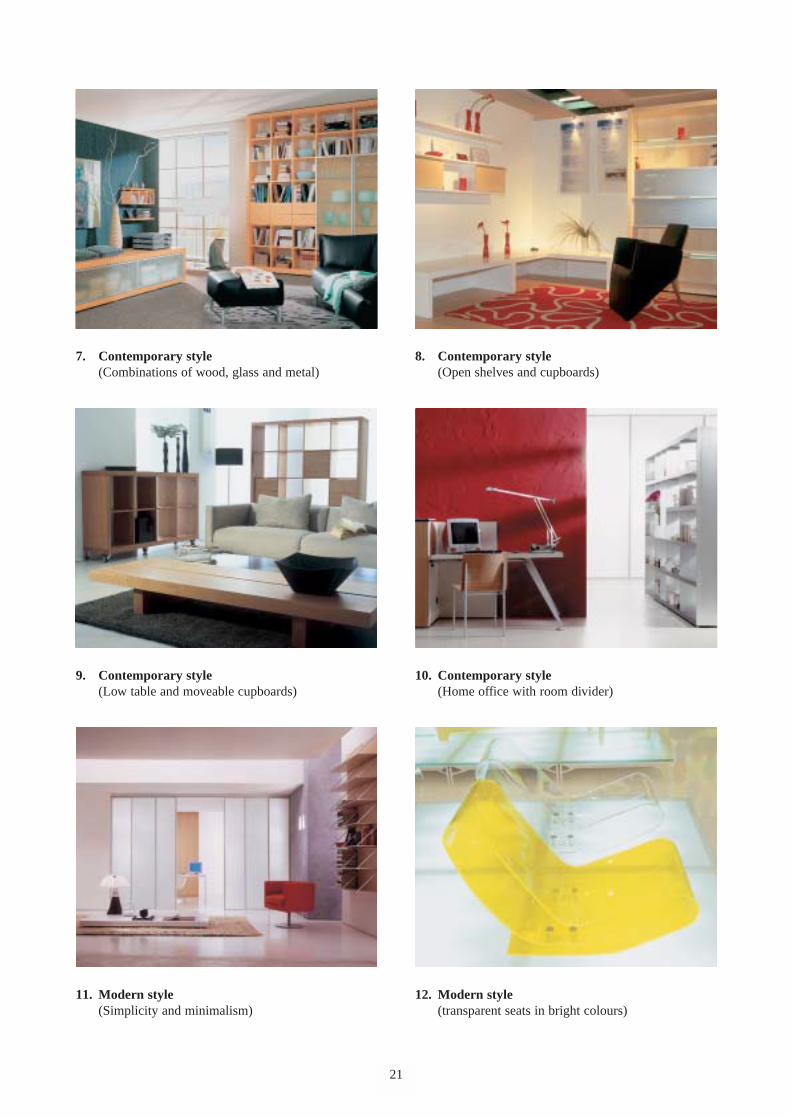
7. Contemporary style(Combinations of wood, glass and metal)
9. Contemporary style(Low table and moveable cupboards)
11. Modern style (Simplicity and minimalism)
21
8. Contemporary style(Open shelves and cupboards)
10. Contemporary style(Home office with room divider)
12. Modern style(transparent seats in bright colours)
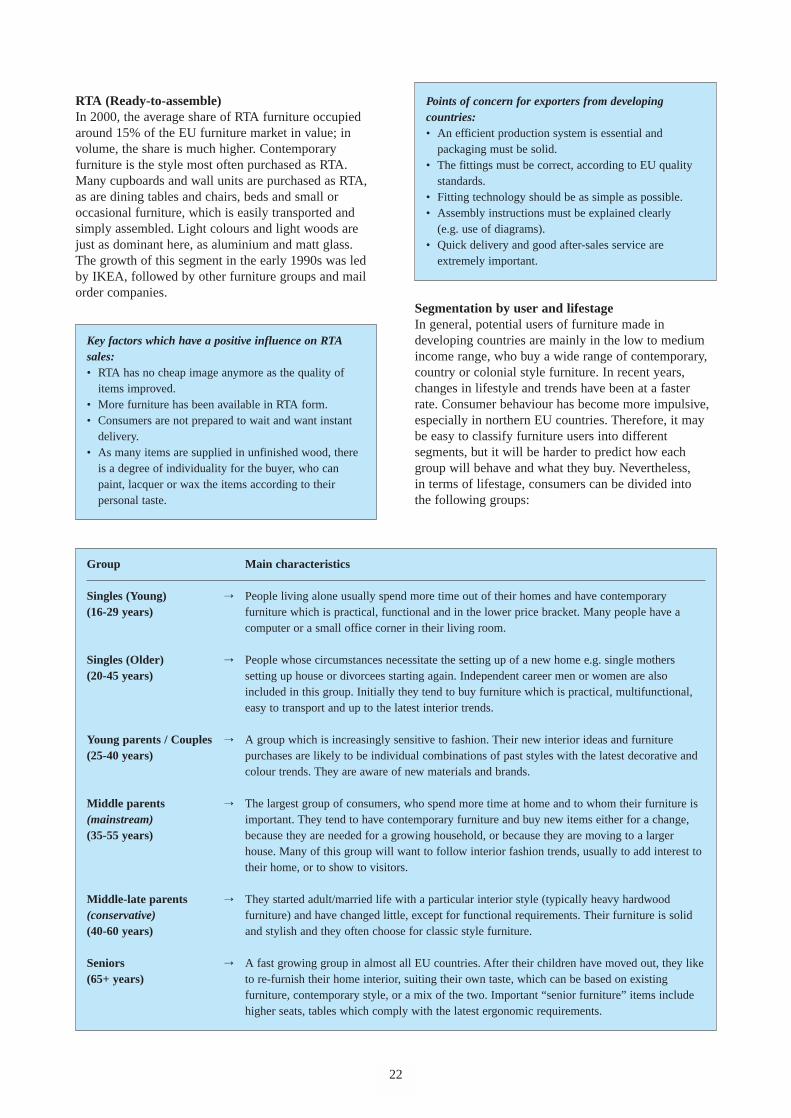
RTA (Ready-to-assemble)In 2000, the average share of RTA furniture occupiedaround 15% of the EU furniture market in value; involume, the share is much higher. Contemporaryfurniture is the style most often purchased as RTA.Many cupboards and wall units are purchased as RTA,as are dining tables and chairs, beds and small oroccasional furniture, which is easily transported andsimply assembled. Light colours and light woods arejust as dominant here, as aluminium and matt glass. The growth of this segment in the early 1990s was ledby IKEA, followed by other furniture groups and mailorder companies.
Key factors which have a positive influence on RTAsales:• RTA has no cheap image anymore as the quality of
items improved.• More furniture has been available in RTA form.• Consumers are not prepared to wait and want instant
delivery.• As many items are supplied in unfinished wood, there
is a degree of individuality for the buyer, who canpaint, lacquer or wax the items according to theirpersonal taste.
22
Points of concern for exporters from developingcountries:• An efficient production system is essential and
packaging must be solid.• The fittings must be correct, according to EU quality
standards.• Fitting technology should be as simple as possible.• Assembly instructions must be explained clearly
(e.g. use of diagrams).• Quick delivery and good after-sales service are
extremely important.
Segmentation by user and lifestageIn general, potential users of furniture made indeveloping countries are mainly in the low to mediumincome range, who buy a wide range of contemporary,country or colonial style furniture. In recent years,changes in lifestyle and trends have been at a fasterrate. Consumer behaviour has become more impulsive,especially in northern EU countries. Therefore, it maybe easy to classify furniture users into differentsegments, but it will be harder to predict how eachgroup will behave and what they buy. Nevertheless,in terms of lifestage, consumers can be divided into the following groups:
Group Main characteristics
Singles (Young) o People living alone usually spend more time out of their homes and have contemporary (16-29 years) furniture which is practical, functional and in the lower price bracket. Many people have a
computer or a small office corner in their living room.
Singles (Older) o People whose circumstances necessitate the setting up of a new home e.g. single mothers (20-45 years) setting up house or divorcees starting again. Independent career men or women are also
included in this group. Initially they tend to buy furniture which is practical, multifunctional,easy to transport and up to the latest interior trends.
Young parents / Couples o A group which is increasingly sensitive to fashion. Their new interior ideas and furniture (25-40 years) purchases are likely to be individual combinations of past styles with the latest decorative and
colour trends. They are aware of new materials and brands.
Middle parents o The largest group of consumers, who spend more time at home and to whom their furniture is (mainstream) important. They tend to have contemporary furniture and buy new items either for a change,(35-55 years) because they are needed for a growing household, or because they are moving to a larger
house. Many of this group will want to follow interior fashion trends, usually to add interest totheir home, or to show to visitors.
Middle-late parents o They started adult/married life with a particular interior style (typically heavy hardwood (conservative) furniture) and have changed little, except for functional requirements. Their furniture is solid (40-60 years) and stylish and they often choose for classic style furniture.
Seniors o A fast growing group in almost all EU countries. After their children have moved out, they like (65+ years) to re-furnish their home interior, suiting their own taste, which can be based on existing
furniture, contemporary style, or a mix of the two. Important “senior furniture” items includehigher seats, tables which comply with the latest ergonomic requirements.
3.3 Consumption patterns and trends
Influences on consumption
Smaller householdsIn the coming years, the number of single households isexpected to increase in all selected EU countries becauseof more divorces, career men and women and olderpeople. This may result in an overall reduction in size ofhouses, apartments and rooms in the near future and anincreased demand for smaller sized multifunctionalfurniture items. In the United Kingdom, Germany, Franceand The Netherlands, single and two-person householdstogether account roughly for two-third of all householdsand are stronger represented than in Italy and Spain.
In northern EU countries, birth rates are expected toslow as women tend to have children later (average:29 years), which implies that the age profile is risinghere. In southern EU countries family ties are strongand families live together for a longer time, whichmeans more 4 and 5 person households.
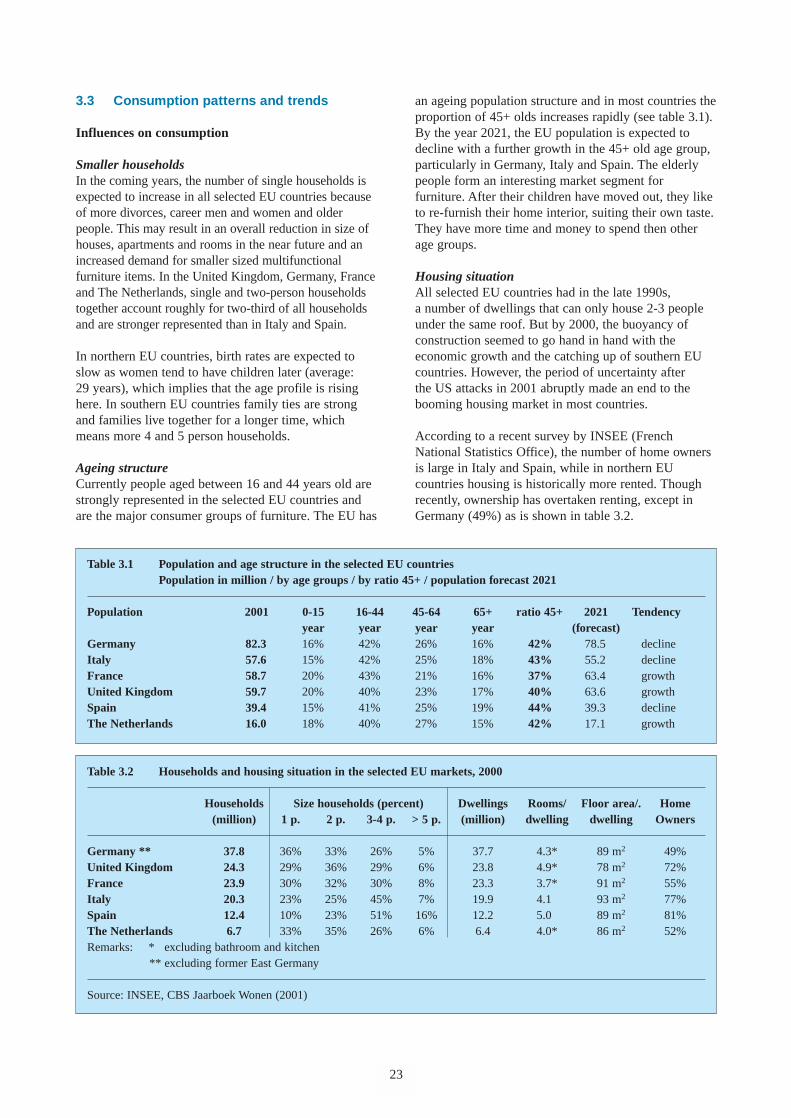
Ageing structureCurrently people aged between 16 and 44 years old arestrongly represented in the selected EU countries andare the major consumer groups of furniture. The EU has
23
an ageing population structure and in most countries theproportion of 45+ olds increases rapidly (see table 3.1).By the year 2021, the EU population is expected todecline with a further growth in the 45+ old age group,particularly in Germany, Italy and Spain. The elderlypeople form an interesting market segment forfurniture. After their children have moved out, they liketo re-furnish their home interior, suiting their own taste.They have more time and money to spend then otherage groups.
Housing situation All selected EU countries had in the late 1990s,a number of dwellings that can only house 2-3 peopleunder the same roof. But by 2000, the buoyancy ofconstruction seemed to go hand in hand with theeconomic growth and the catching up of southern EUcountries. However, the period of uncertainty after the US attacks in 2001 abruptly made an end to thebooming housing market in most countries.
According to a recent survey by INSEE (FrenchNational Statistics Office), the number of home ownersis large in Italy and Spain, while in northern EUcountries housing is historically more rented. Thoughrecently, ownership has overtaken renting, except inGermany (49%) as is shown in table 3.2.
Table 3.1 Population and age structure in the selected EU countries Population in million / by age groups / by ratio 45+ / population forecast 2021
Population 2001 0-15 16-44 45-64 65+ ratio 45+ 2021 Tendencyyear year year year (forecast)
Germany 82.3 16% 42% 26% 16% 42% 78.5 declineItaly 57.6 15% 42% 25% 18% 43% 55.2 declineFrance 58.7 20% 43% 21% 16% 37% 63.4 growthUnited Kingdom 59.7 20% 40% 23% 17% 40% 63.6 growthSpain 39.4 15% 41% 25% 19% 44% 39.3 declineThe Netherlands 16.0 18% 40% 27% 15% 42% 17.1 growth
Table 3.2 Households and housing situation in the selected EU markets, 2000
Households Size households (percent) Dwellings Rooms/ Floor area/. Home(million) 1 p. 2 p. 3-4 p. > 5 p. (million) dwelling dwelling Owners
Germany ** 37.8 36% 33% 26% 5% 37.7 4.3* 89 m2 49%United Kingdom 24.3 29% 36% 29% 6% 23.8 4.9* 78 m2 72%France 23.9 30% 32% 30% 8% 23.3 3.7* 91 m2 55%Italy 20.3 23% 25% 45% 7% 19.9 4.1* 93 m2 77%Spain 12.4 10% 23% 51% 16% 12.2 5.0* 89 m2 81%The Netherlands 6.7 33% 35% 26% 6% 6.4 4.0* 86 m2 52%Remarks: * excluding bathroom and kitchen
** excluding former East Germany
Source: INSEE, CBS Jaarboek Wonen (2001)
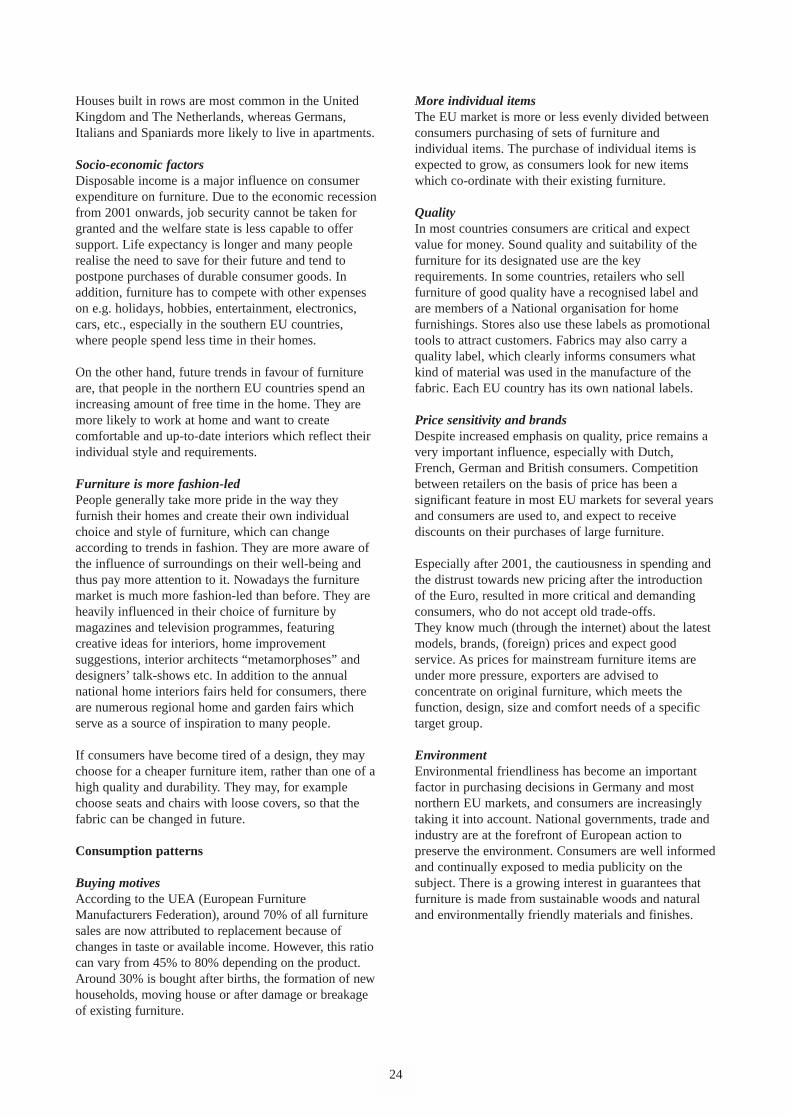
Houses built in rows are most common in the UnitedKingdom and The Netherlands, whereas Germans,Italians and Spaniards more likely to live in apartments.
Socio-economic factorsDisposable income is a major influence on consumerexpenditure on furniture. Due to the economic recessionfrom 2001 onwards, job security cannot be taken forgranted and the welfare state is less capable to offersupport. Life expectancy is longer and many peoplerealise the need to save for their future and tend topostpone purchases of durable consumer goods. Inaddition, furniture has to compete with other expenseson e.g. holidays, hobbies, entertainment, electronics,cars, etc., especially in the southern EU countries,where people spend less time in their homes.
On the other hand, future trends in favour of furnitureare, that people in the northern EU countries spend anincreasing amount of free time in the home. They aremore likely to work at home and want to createcomfortable and up-to-date interiors which reflect theirindividual style and requirements.
Furniture is more fashion-ledPeople generally take more pride in the way theyfurnish their homes and create their own individualchoice and style of furniture, which can changeaccording to trends in fashion. They are more aware ofthe influence of surroundings on their well-being andthus pay more attention to it. Nowadays the furnituremarket is much more fashion-led than before. They areheavily influenced in their choice of furniture bymagazines and television programmes, featuringcreative ideas for interiors, home improvementsuggestions, interior architects “metamorphoses” anddesigners’ talk-shows etc. In addition to the annualnational home interiors fairs held for consumers, thereare numerous regional home and garden fairs whichserve as a source of inspiration to many people.
If consumers have become tired of a design, they maychoose for a cheaper furniture item, rather than one of ahigh quality and durability. They may, for examplechoose seats and chairs with loose covers, so that thefabric can be changed in future.
Consumption patterns
Buying motivesAccording to the UEA (European FurnitureManufacturers Federation), around 70% of all furnituresales are now attributed to replacement because ofchanges in taste or available income. However, this ratiocan vary from 45% to 80% depending on the product.Around 30% is bought after births, the formation of newhouseholds, moving house or after damage or breakageof existing furniture.
24
More individual itemsThe EU market is more or less evenly divided betweenconsumers purchasing of sets of furniture andindividual items. The purchase of individual items isexpected to grow, as consumers look for new itemswhich co-ordinate with their existing furniture.
QualityIn most countries consumers are critical and expectvalue for money. Sound quality and suitability of thefurniture for its designated use are the keyrequirements. In some countries, retailers who sellfurniture of good quality have a recognised label andare members of a National organisation for homefurnishings. Stores also use these labels as promotionaltools to attract customers. Fabrics may also carry aquality label, which clearly informs consumers whatkind of material was used in the manufacture of thefabric. Each EU country has its own national labels.
Price sensitivity and brandsDespite increased emphasis on quality, price remains avery important influence, especially with Dutch,French, German and British consumers. Competitionbetween retailers on the basis of price has been asignificant feature in most EU markets for several yearsand consumers are used to, and expect to receivediscounts on their purchases of large furniture.
Especially after 2001, the cautiousness in spending andthe distrust towards new pricing after the introductionof the Euro, resulted in more critical and demandingconsumers, who do not accept old trade-offs. They know much (through the internet) about the latestmodels, brands, (foreign) prices and expect goodservice. As prices for mainstream furniture items areunder more pressure, exporters are advised toconcentrate on original furniture, which meets thefunction, design, size and comfort needs of a specifictarget group.
EnvironmentEnvironmental friendliness has become an importantfactor in purchasing decisions in Germany and mostnorthern EU markets, and consumers are increasinglytaking it into account. National governments, trade andindustry are at the forefront of European action topreserve the environment. Consumers are well informedand continually exposed to media publicity on thesubject. There is a growing interest in guarantees thatfurniture is made from sustainable woods and naturaland environmentally friendly materials and finishes.
Trends in furnitureFrom the second half of the 1990s onwards, consumersin all categories showed a growing interest incontemporary style furniture, which then became a fastgrowing segment of the market at the expense of classicstyle furniture. Nowadays consumers mix manydifferent styles and take ideas from all over to produceinteriors where they can relax from their otherwisehectic lives to, enjoy time with family and friends. They prefer to create their own interior concept whichis different from that of others, and which expresseswho they are to other people. Significant trends infurniture include:
Combinations and fusions• The boundaries between styles have become much
more vague and this has resulted in combinations or“fusions”. For example, a modern aluminium wallunit may co-exist with a classic dark wooden table,rattan chairs and a retro designed coffeetable fromthe 1970s, all in the same living room.
• Materials like wood, metal, aluminium, glass andstone are being combined. Colours are mingled,so that dark, bright, transparent or natural colourscan be used in the same interior.
• Special interior decorative effects are achievedthrough the placing of small furniture, accent coloursand accessories, in which there is a growing interest.
Multifunctionality, flexibility and comfort• Individual items of furniture can be used for different
functions: flexible seating for sitting, reclining orsleeping; modular wall systems and adjustable bedsallow flexible sleeping arrangements.
• Specialised furniture, made for older people with afocus on comfort/ergonomy (e.g. higher seats).
Simplicity and enriched minimalism• In contemporary style furniture, designs are simple,
fine, straightforward and cubic, but at the same timehave soft, rounded lines.
• Small visible legs, made of metal or wood, are animportant feature at the moment for living roomchairs, couches, armchairs and cupboards.
• Minimalism is enriched in terms of quality andcolours (e.g. gold or platinum instead of silver).
Modern rustic style and international interiors • Rustic style has made a comeback in a modern form,
with a natural, familiar, romantic and adventurousatmosphere, created by robust furniture combinedwith exotic accessories.For example, a dining set consisting of a square tableof solid wood (light oak) and chairs with “high-tech”chrome frame, combined with seating of canvas,hemp, cork or abacca leave.
• Other matching occasional furniture include tables,
25
stools of solid wood with ethnic, folk andcolonial/oriental designs, including curves,latticework, wrought iron from countries likeMorocco, Philippines, Mexico, India, Thailand andother developing countries.
• This style is a reaction to the ongoing changes indesigns in the past few years. Popularity has alsobeen stimulated by an increasing number of peopletravelling to exotic locations.
Trends in raw materialAccording to the UEA, furniture made of wood,including cane, rattan and similar materials, accountedin 2000 for around 65% of total volume of furnituresold in the EU. About 25% is made of metal and theremaining 10% is made of plastic and other syntheticmaterials. This latter segment is expected to increase inrelative importance.
In addition, wooden furniture is more frequentlycombined with metal or chrome. In the late 1990s,metal, glass and plastic have been more popular inmodern and contemporary styled interiors. Compositeboard or particle boards and MDF (Medium DensityFibreboard) are increasingly being used in themanufacture of furniture, which is then veneered withmore costly hardwoods (e.g. birch, beech, cherry, alder,maple or oak). This has resulted in the production andsale of low-cost wall systems, beds, tables and desks.
Materials and colours• Woods: Interior parts and primary and secondary
frames of most items are made from lower qualitywood like birch, ply and laminates, while for exposedsurfaces fine timbers are used. Lighter hard woods likeoak, beech, maple, alder, birch, cherry and hickoryhave proved more popular than pine. The importanceof warm tints has resulted in more demand for darkerwood species like cherry, oak, walnut, wengé,mahogany, teak or rubberwood in faded/darker colours.“Antique” or “old paint” and “aged” looks remainimportant and recycled wood is gaining in popularity.
Exotic looking wood such as Lenga from Chile, Jatobaand Macaranduba from Brazil, Zebrano from CentralAfrica and Rubberwood from Malaysia are becomingpopular.
• Rattan, fine wickerwork, bamboo, hemp and eelgrasscontinue to be important materials, which areincreasingly used in contemporary designs. Rattanfurniture fits closely with a growing consumerinterest in natural interiors, combined with aspects ofindoor/outdoor/patio life and exotic, oriental elements.The construction of verandas and in-house gardens hasgained in popularity.
to be continued
26
Materials and colours continue• Metals: the metallic, hi-tech or industrial look is
becoming increasingly popular in the furniture world.Steel is not considered as a stabiliser for table andchair legs anymore, but also serves as an eye-catchingdesign element. In modern designs, metal in simpleforms and thin structures is frequently used inconjunction with wood or glass. Stainless steel,chrome, wrought iron, aluminium and copper havebecome more popular in the past few years.
• Glass: frosted glass and other opaque finishes, ratherthan clear (cold) glass is popular. Natural and acrylicglass is increasingly used in combination with othermaterials in tables, cabinets etc.
• Mixed materials: new natural materials are used incombination with wood, rattan and metal.
• Fabrics: these are softer in texture and appearance,with single light natural colours used as a basis. Smallmotifs, a textured look, geometric or large colourfuldesigns are possible. Floral designs, micro-fibres arestill common and (soft) hi-tech fibres are gainingimportance.
• Colours: basic colours for large pieces of furniture canbe light, natural or dark; accent colours are strongerand vary from strong natural tints such as vanilla,gold/light brown, cinnamon and cacao to a greatvariety of decorative exotic colours. Bright colours likeyellow, yellow-gold, purple, hard red, turquoise, nightblue, electric blue, orange and green are common incontemporary, modern interiors and in furniture forchildren, and became more popular in upholstered andother furniture.
• Finishes: there is a comeback of polished lacquerscombined with solid colours and chrome plated metal,with some products recalling the style of the 1970s and1980s. There is much use of satin-finish, acid-etched,painted glass with neutral or bright colors; opaquelacquers; painted and enameled steel; anodised,polished and mat aluminum. In the more expensiveitems laminates are used.
5,0000 10,000 15,000 20,000
Germany
Italy
France
UK
Spain
The Netherlands
Denmark
Belgium
Austria
Sweden
Portugal
Finland
Greece
Ireland
Total EU
18,135
16,209
9,188
6,479
5,589
2,135
2,112
1,878
1,704
1,426
921
897
568
337
67,578
18,551
15,723
8,958
6,348
5,477
2,177
2,178
1,902
1,619
1,397
911
762
516
307
66,826
19,768
17,668
10,015
7,062
6,092
2,327
2,302
2,047
1,858
1,554
1,004
978
619
368
73,662
- 1.7%
+ 3%
+ 2.5%
+ 2%
+ 2.4%
- 2%
- 3%
- 1.3%
+ 5%
+ 9%
+ 1%
+ 14%
+ 3%
+ 9%
+ 1.1%
Production, based on sales turnover in 20002000
€ million2000
US $ million1999
US $ millionDifference1999/2000
Number of companies
Sales turnover furniture Industry
19,100
28,000
17,020
8,025
7,560
4,100
na
na
na
na
na
na
na
na
88,500
18,135
9,188
16,209
6,479
5,589
2,135
4 PRODUCTION
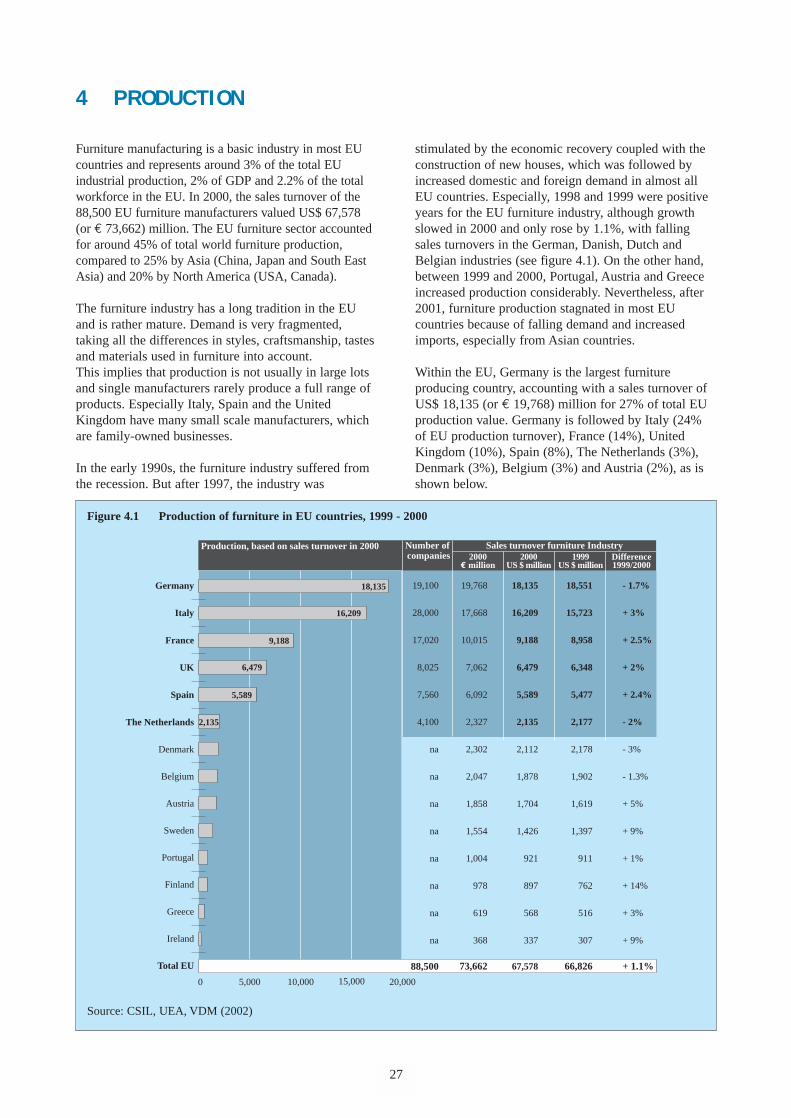
Furniture manufacturing is a basic industry in most EUcountries and represents around 3% of the total EUindustrial production, 2% of GDP and 2.2% of the totalworkforce in the EU. In 2000, the sales turnover of the88,500 EU furniture manufacturers valued US$ 67,578(or € 73,662) million. The EU furniture sector accountedfor around 45% of total world furniture production,compared to 25% by Asia (China, Japan and South EastAsia) and 20% by North America (USA, Canada).
The furniture industry has a long tradition in the EUand is rather mature. Demand is very fragmented,taking all the differences in styles, craftsmanship, tastesand materials used in furniture into account. This implies that production is not usually in large lotsand single manufacturers rarely produce a full range ofproducts. Especially Italy, Spain and the UnitedKingdom have many small scale manufacturers, whichare family-owned businesses.
In the early 1990s, the furniture industry suffered fromthe recession. But after 1997, the industry was
stimulated by the economic recovery coupled with theconstruction of new houses, which was followed byincreased domestic and foreign demand in almost allEU countries. Especially, 1998 and 1999 were positiveyears for the EU furniture industry, although growthslowed in 2000 and only rose by 1.1%, with fallingsales turnovers in the German, Danish, Dutch andBelgian industries (see figure 4.1). On the other hand,between 1999 and 2000, Portugal, Austria and Greeceincreased production considerably. Nevertheless, after2001, furniture production stagnated in most EUcountries because of falling demand and increasedimports, especially from Asian countries.
Within the EU, Germany is the largest furnitureproducing country, accounting with a sales turnover ofUS$ 18,135 (or € 19,768) million for 27% of total EUproduction value. Germany is followed by Italy (24%of EU production turnover), France (14%), UnitedKingdom (10%), Spain (8%), The Netherlands (3%),Denmark (3%), Belgium (3%) and Austria (2%), as isshown below.
27
Figure 4.1 Production of furniture in EU countries, 1999 - 2000
Source: CSIL, UEA, VDM (2002)
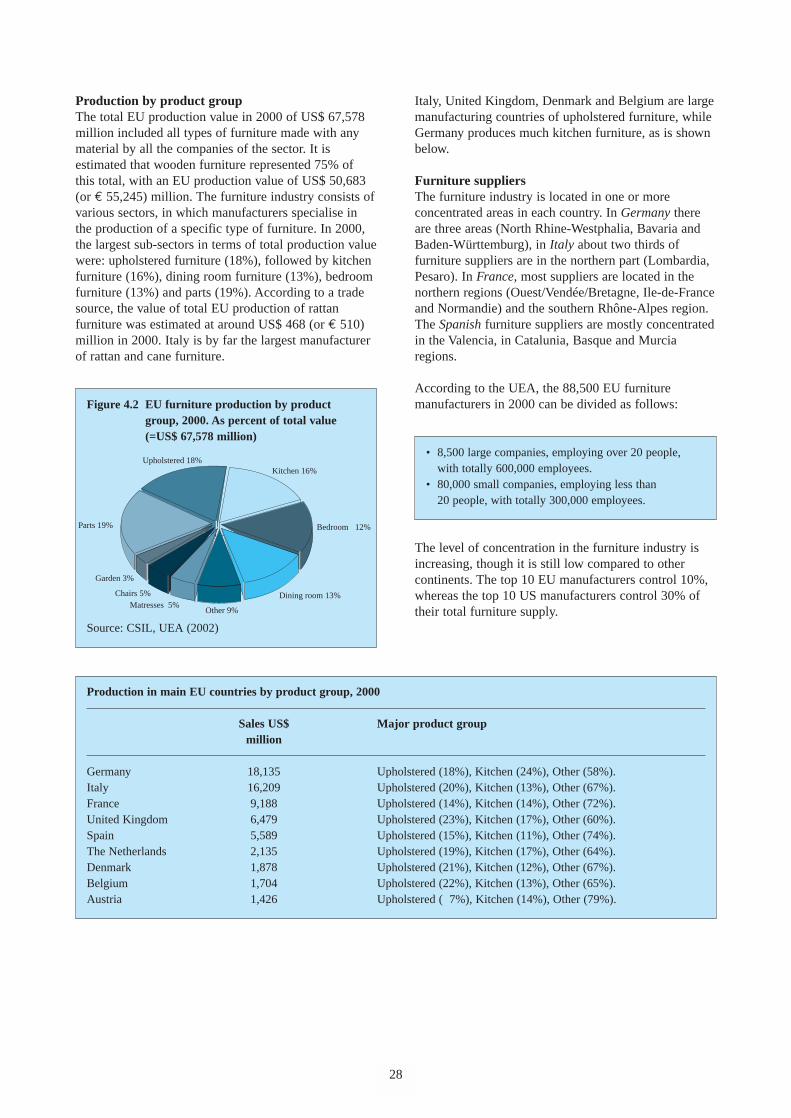
Bedroom 12%
Dining room 13%
Other 9%
Parts 19%
Upholstered 18%Kitchen 16%
Garden 3%
Chairs 5%Matresses 5%
Production by product groupThe total EU production value in 2000 of US$ 67,578million included all types of furniture made with anymaterial by all the companies of the sector. It isestimated that wooden furniture represented 75% of this total, with an EU production value of US$ 50,683(or € 55,245) million. The furniture industry consists ofvarious sectors, in which manufacturers specialise inthe production of a specific type of furniture. In 2000,the largest sub-sectors in terms of total production valuewere: upholstered furniture (18%), followed by kitchenfurniture (16%), dining room furniture (13%), bedroomfurniture (13%) and parts (19%). According to a tradesource, the value of total EU production of rattanfurniture was estimated at around US$ 468 (or € 510)million in 2000. Italy is by far the largest manufacturerof rattan and cane furniture.
Figure 4.2 EU furniture production by productgroup, 2000. As percent of total value(=US$ 67,578 million)
Source: CSIL, UEA (2002)
28
Italy, United Kingdom, Denmark and Belgium are largemanufacturing countries of upholstered furniture, whileGermany produces much kitchen furniture, as is shownbelow.
Furniture suppliersThe furniture industry is located in one or moreconcentrated areas in each country. In Germany thereare three areas (North Rhine-Westphalia, Bavaria andBaden-Württemburg), in Italy about two thirds offurniture suppliers are in the northern part (Lombardia,Pesaro). In France, most suppliers are located in thenorthern regions (Ouest/Vendée/Bretagne, Ile-de-Franceand Normandie) and the southern Rhône-Alpes region.The Spanish furniture suppliers are mostly concentratedin the Valencia, in Catalunia, Basque and Murciaregions.
According to the UEA, the 88,500 EU furnituremanufacturers in 2000 can be divided as follows:
• 8,500 large companies, employing over 20 people,with totally 600,000 employees.
• 80,000 small companies, employing less than 20 people, with totally 300,000 employees.
The level of concentration in the furniture industry isincreasing, though it is still low compared to othercontinents. The top 10 EU manufacturers control 10%,whereas the top 10 US manufacturers control 30% oftheir total furniture supply.
Production in main EU countries by product group, 2000
Sales US$ Major product groupmillion
Germany 18,135 Upholstered (18%), Kitchen (24%), Other (58%).Italy 16,209 Upholstered (20%), Kitchen (13%), Other (67%).France 9,188 Upholstered (14%), Kitchen (14%), Other (72%).United Kingdom 6,479 Upholstered (23%), Kitchen (17%), Other (60%).Spain 5,589 Upholstered (15%), Kitchen (11%), Other (74%).The Netherlands 2,135 Upholstered (19%), Kitchen (17%), Other (64%).Denmark 1,878 Upholstered (21%), Kitchen (12%), Other (67%).Belgium 1,704 Upholstered (22%), Kitchen (13%), Other (65%).Austria 1,426 Upholstered ( 7%), Kitchen (14%), Other (79%).
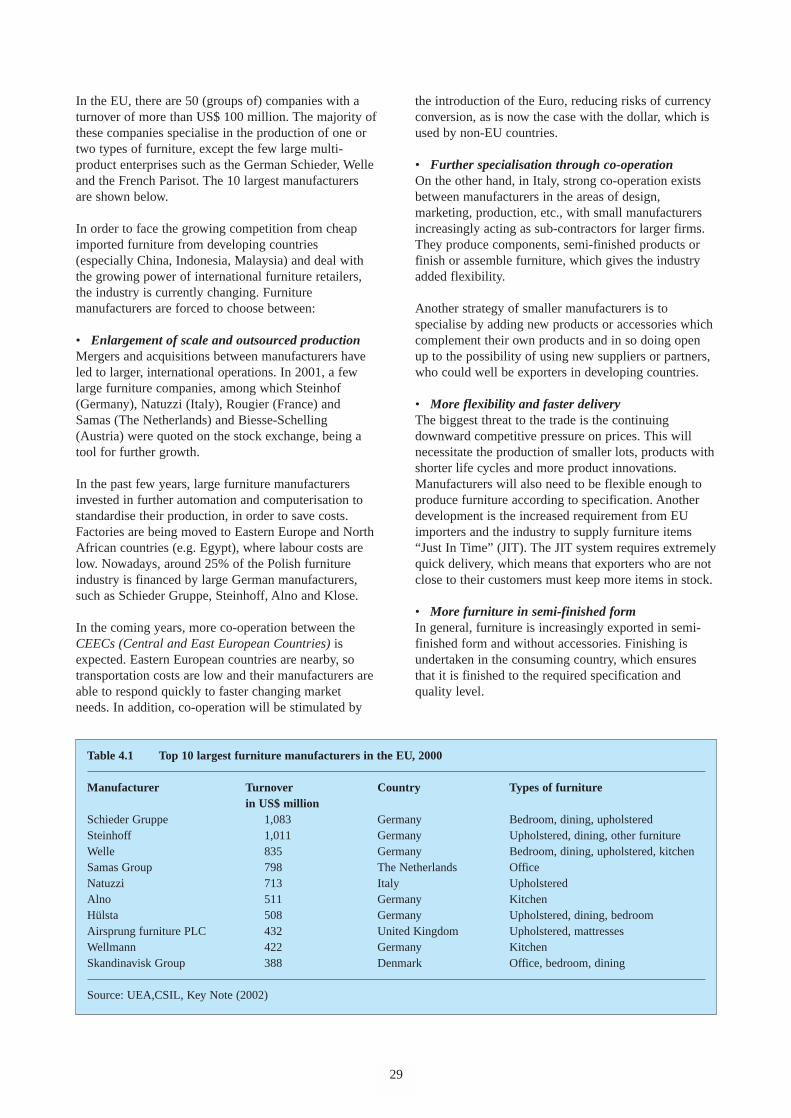
In the EU, there are 50 (groups of) companies with aturnover of more than US$ 100 million. The majority ofthese companies specialise in the production of one ortwo types of furniture, except the few large multi-product enterprises such as the German Schieder, Welleand the French Parisot. The 10 largest manufacturersare shown below.
In order to face the growing competition from cheapimported furniture from developing countries(especially China, Indonesia, Malaysia) and deal withthe growing power of international furniture retailers,the industry is currently changing. Furnituremanufacturers are forced to choose between:
• Enlargement of scale and outsourced productionMergers and acquisitions between manufacturers haveled to larger, international operations. In 2001, a fewlarge furniture companies, among which Steinhof(Germany), Natuzzi (Italy), Rougier (France) andSamas (The Netherlands) and Biesse-Schelling(Austria) were quoted on the stock exchange, being atool for further growth.
In the past few years, large furniture manufacturersinvested in further automation and computerisation tostandardise their production, in order to save costs.Factories are being moved to Eastern Europe and NorthAfrican countries (e.g. Egypt), where labour costs arelow. Nowadays, around 25% of the Polish furnitureindustry is financed by large German manufacturers,such as Schieder Gruppe, Steinhoff, Alno and Klose.
In the coming years, more co-operation between theCEECs (Central and East European Countries) isexpected. Eastern European countries are nearby, sotransportation costs are low and their manufacturers areable to respond quickly to faster changing marketneeds. In addition, co-operation will be stimulated by
29
the introduction of the Euro, reducing risks of currencyconversion, as is now the case with the dollar, which isused by non-EU countries.
• Further specialisation through co-operationOn the other hand, in Italy, strong co-operation existsbetween manufacturers in the areas of design,marketing, production, etc., with small manufacturersincreasingly acting as sub-contractors for larger firms.They produce components, semi-finished products orfinish or assemble furniture, which gives the industryadded flexibility.
Another strategy of smaller manufacturers is tospecialise by adding new products or accessories whichcomplement their own products and in so doing openup to the possibility of using new suppliers or partners,who could well be exporters in developing countries.
• More flexibility and faster deliveryThe biggest threat to the trade is the continuingdownward competitive pressure on prices. This willnecessitate the production of smaller lots, products withshorter life cycles and more product innovations.Manufacturers will also need to be flexible enough toproduce furniture according to specification. Anotherdevelopment is the increased requirement from EUimporters and the industry to supply furniture items“Just In Time” (JIT). The JIT system requires extremelyquick delivery, which means that exporters who are notclose to their customers must keep more items in stock.
• More furniture in semi-finished formIn general, furniture is increasingly exported in semi-finished form and without accessories. Finishing isundertaken in the consuming country, which ensuresthat it is finished to the required specification andquality level.
Table 4.1 Top 10 largest furniture manufacturers in the EU, 2000
Manufacturer Turnover Country Types of furniturein US$ million
Schieder Gruppe 1,083 Germany Bedroom, dining, upholsteredSteinhoff 1,011 Germany Upholstered, dining, other furnitureWelle 835 Germany Bedroom, dining, upholstered, kitchenSamas Group 798 The Netherlands OfficeNatuzzi 713 Italy UpholsteredAlno 511 Germany KitchenHülsta 508 Germany Upholstered, dining, bedroomAirsprung furniture PLC 432 United Kingdom Upholstered, mattressesWellmann 422 Germany KitchenSkandinavisk Group 388 Denmark Office, bedroom, dining
Source: UEA,CSIL, Key Note (2002)
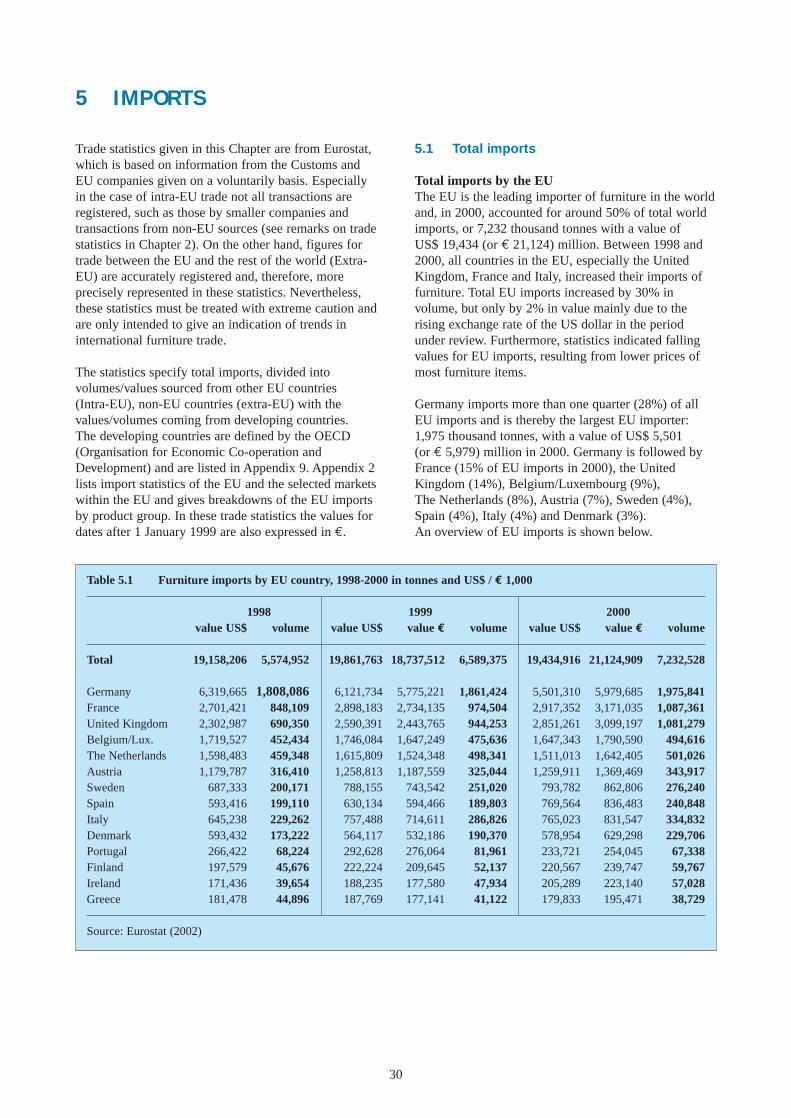
5 IMPORTS
Trade statistics given in this Chapter are from Eurostat,which is based on information from the Customs andEU companies given on a voluntarily basis. Especiallyin the case of intra-EU trade not all transactions areregistered, such as those by smaller companies andtransactions from non-EU sources (see remarks on tradestatistics in Chapter 2). On the other hand, figures fortrade between the EU and the rest of the world (Extra-EU) are accurately registered and, therefore, moreprecisely represented in these statistics. Nevertheless,these statistics must be treated with extreme caution andare only intended to give an indication of trends ininternational furniture trade.
The statistics specify total imports, divided intovolumes/values sourced from other EU countries (Intra-EU), non-EU countries (extra-EU) with thevalues/volumes coming from developing countries. The developing countries are defined by the OECD(Organisation for Economic Co-operation andDevelopment) and are listed in Appendix 9. Appendix 2lists import statistics of the EU and the selected marketswithin the EU and gives breakdowns of the EU importsby product group. In these trade statistics the values fordates after 1 January 1999 are also expressed in €.
5.1 Total imports
Total imports by the EUThe EU is the leading importer of furniture in the worldand, in 2000, accounted for around 50% of total worldimports, or 7,232 thousand tonnes with a value of US$ 19,434 (or € 21,124) million. Between 1998 and2000, all countries in the EU, especially the UnitedKingdom, France and Italy, increased their imports offurniture. Total EU imports increased by 30% involume, but only by 2% in value mainly due to therising exchange rate of the US dollar in the periodunder review. Furthermore, statistics indicated fallingvalues for EU imports, resulting from lower prices ofmost furniture items.
Germany imports more than one quarter (28%) of allEU imports and is thereby the largest EU importer:1,975 thousand tonnes, with a value of US$ 5,501 (or € 5,979) million in 2000. Germany is followed byFrance (15% of EU imports in 2000), the UnitedKingdom (14%), Belgium/Luxembourg (9%),The Netherlands (8%), Austria (7%), Sweden (4%),Spain (4%), Italy (4%) and Denmark (3%). An overview of EU imports is shown below.
30
Table 5.1 Furniture imports by EU country, 1998-2000 in tonnes and US$ / € 1,000
1998 1999 2000value US$ volume value US$ value € volume value US$ value € volume
Total 19,158,206 5,574,952 19,861,763 18,737,512 6,589,375 19,434,916 21,124,909 7,232,528
Germany 6,319,665 1,808,086 6,121,734 5,775,221 1,861,424 5,501,310 5,979,685 1,975,841France 2,701,421 848,109 2,898,183 2,734,135 974,504 2,917,352 3,171,035 1,087,361United Kingdom 2,302,987 690,350 2,590,391 2,443,765 944,253 2,851,261 3,099,197 1,081,279Belgium/Lux. 1,719,527 452,434 1,746,084 1,647,249 475,636 1,647,343 1,790,590 494,616The Netherlands 1,598,483 459,348 1,615,809 1,524,348 498,341 1,511,013 1,642,405 501,026Austria 1,179,787 316,410 1,258,813 1,187,559 325,044 1,259,911 1,369,469 343,917Sweden 687,333 200,171 788,155 743,542 251,020 793,782 862,806 276,240Spain 593,416 199,110 630,134 594,466 189,803 769,564 836,483 240,848Italy 645,238 229,262 757,488 714,611 286,826 765,023 831,547 334,832Denmark 593,432 173,222 564,117 532,186 190,370 578,954 629,298 229,706Portugal 266,422 68,224 292,628 276,064 81,961 233,721 254,045 67,338Finland 197,579 45,676 222,224 209,645 52,137 220,567 239,747 59,767Ireland 171,436 39,654 188,235 177,580 47,934 205,289 223,140 57,028Greece 181,478 44,896 187,769 177,141 41,122 179,833 195,471 38,729
Source: Eurostat (2002)
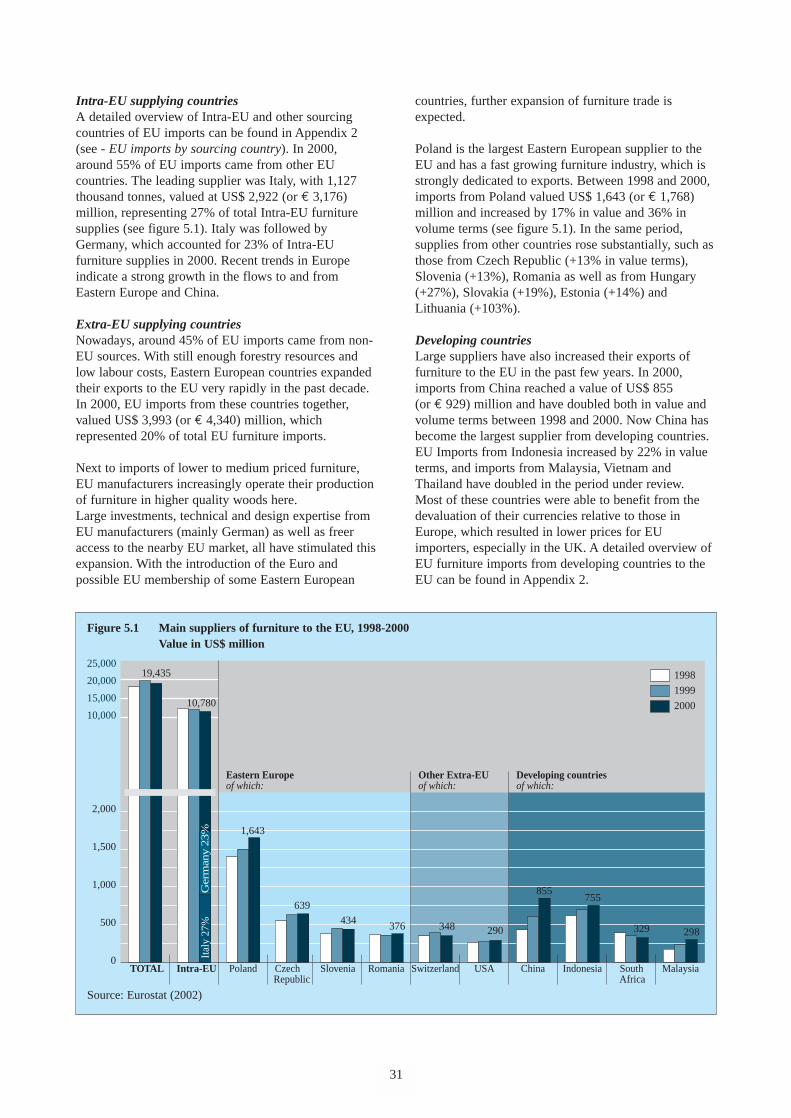
2,000
1,500
1,000
500
0
25,000
20,000
15,000
10,000
TOTAL Intra-EU Poland Czech Slovenia Romania Switzerland USA China Indonesia South Malaysia Republic Africa
1998
1999
2000
19,435
434 376 348 290
855755
329 298
10,780
1,643
639
Eastern Europeof which:
Other Extra-EUof which:
Developing countriesof which:
Ital
y 27
%G
erm
any 2
3%
Intra-EU supplying countriesA detailed overview of Intra-EU and other sourcingcountries of EU imports can be found in Appendix 2(see - EU imports by sourcing country). In 2000,around 55% of EU imports came from other EUcountries. The leading supplier was Italy, with 1,127thousand tonnes, valued at US$ 2,922 (or € 3,176)million, representing 27% of total Intra-EU furnituresupplies (see figure 5.1). Italy was followed byGermany, which accounted for 23% of Intra-EUfurniture supplies in 2000. Recent trends in Europeindicate a strong growth in the flows to and fromEastern Europe and China.
Extra-EU supplying countries Nowadays, around 45% of EU imports came from non-EU sources. With still enough forestry resources andlow labour costs, Eastern European countries expandedtheir exports to the EU very rapidly in the past decade.In 2000, EU imports from these countries together,valued US$ 3,993 (or € 4,340) million, whichrepresented 20% of total EU furniture imports.
Next to imports of lower to medium priced furniture,EU manufacturers increasingly operate their productionof furniture in higher quality woods here. Large investments, technical and design expertise fromEU manufacturers (mainly German) as well as freeraccess to the nearby EU market, all have stimulated thisexpansion. With the introduction of the Euro andpossible EU membership of some Eastern European
31
countries, further expansion of furniture trade isexpected.
Poland is the largest Eastern European supplier to theEU and has a fast growing furniture industry, which isstrongly dedicated to exports. Between 1998 and 2000,imports from Poland valued US$ 1,643 (or € 1,768)million and increased by 17% in value and 36% involume terms (see figure 5.1). In the same period,supplies from other countries rose substantially, such asthose from Czech Republic (+13% in value terms),Slovenia (+13%), Romania as well as from Hungary(+27%), Slovakia (+19%), Estonia (+14%) andLithuania (+103%).
Developing countriesLarge suppliers have also increased their exports offurniture to the EU in the past few years. In 2000,imports from China reached a value of US$ 855 (or € 929) million and have doubled both in value andvolume terms between 1998 and 2000. Now China hasbecome the largest supplier from developing countries.EU Imports from Indonesia increased by 22% in valueterms, and imports from Malaysia, Vietnam andThailand have doubled in the period under review. Most of these countries were able to benefit from thedevaluation of their currencies relative to those inEurope, which resulted in lower prices for EUimporters, especially in the UK. A detailed overview ofEU furniture imports from developing countries to theEU can be found in Appendix 2.
Figure 5.1 Main suppliers of furniture to the EU, 1998-2000Value in US$ million
Source: Eurostat (2002)
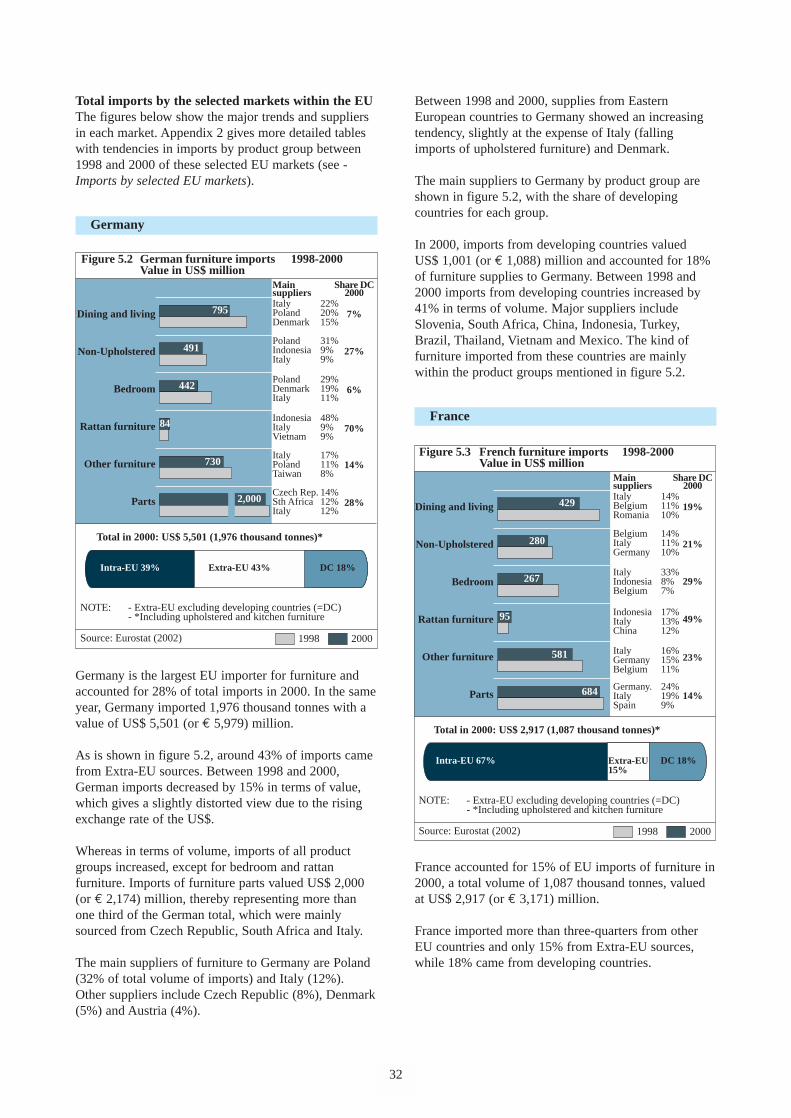
Total imports by the selected markets within the EUThe figures below show the major trends and suppliersin each market. Appendix 2 gives more detailed tableswith tendencies in imports by product group between1998 and 2000 of these selected EU markets (see -Imports by selected EU markets).
Germany
Germany is the largest EU importer for furniture andaccounted for 28% of total imports in 2000. In the sameyear, Germany imported 1,976 thousand tonnes with avalue of US$ 5,501 (or € 5,979) million.
As is shown in figure 5.2, around 43% of imports camefrom Extra-EU sources. Between 1998 and 2000,German imports decreased by 15% in terms of value,which gives a slightly distorted view due to the risingexchange rate of the US$.
Whereas in terms of volume, imports of all productgroups increased, except for bedroom and rattanfurniture. Imports of furniture parts valued US$ 2,000(or € 2,174) million, thereby representing more thanone third of the German total, which were mainlysourced from Czech Republic, South Africa and Italy.
The main suppliers of furniture to Germany are Poland(32% of total volume of imports) and Italy (12%).Other suppliers include Czech Republic (8%), Denmark(5%) and Austria (4%).
32
Between 1998 and 2000, supplies from EasternEuropean countries to Germany showed an increasingtendency, slightly at the expense of Italy (fallingimports of upholstered furniture) and Denmark.
The main suppliers to Germany by product group areshown in figure 5.2, with the share of developingcountries for each group.
In 2000, imports from developing countries valued US$ 1,001 (or € 1,088) million and accounted for 18%of furniture supplies to Germany. Between 1998 and2000 imports from developing countries increased by41% in terms of volume. Major suppliers includeSlovenia, South Africa, China, Indonesia, Turkey,Brazil, Thailand, Vietnam and Mexico. The kind offurniture imported from these countries are mainlywithin the product groups mentioned in figure 5.2.
France
France accounted for 15% of EU imports of furniture in2000, a total volume of 1,087 thousand tonnes, valuedat US$ 2,917 (or € 3,171) million.
France imported more than three-quarters from otherEU countries and only 15% from Extra-EU sources,while 18% came from developing countries.
Figure 5.2 German furniture imports 1998-2000 Value in US$ million
Dining and living
Non-Upholstered
Bedroom
Rattan furniture
Other furniture
Parts
Share DC2000
7%
27%
6%
70%
14%
28%
795
491
442
84
730
2,000
NOTE: - Extra-EU excluding developing countries (=DC) - *Including upholstered and kitchen furniture
Source: Eurostat (2002)
Intra-EU 39% Extra-EU 43%
Total in 2000: US$ 5,501 (1,976 thousand tonnes)*
1998
DC 18%
2000
Main suppliersItaly 22%Poland 20%Denmark 15%
Poland 31%Indonesia 9%Italy 9%
Poland 29%Denmark 19%Italy 11%
Indonesia 48%Italy 9%Vietnam 9%
Italy 17%Poland 11%Taiwan 8%
Czech Rep. 14%Sth Africa 12%Italy 12%
Figure 5.3 French furniture imports 1998-2000 Value in US$ million
41
Dining and living
Non-Upholstered
Bedroom
Rattan furniture
Other furniture
Parts
Share DC2000
19%
21%
29%
49%
23%
14%
429
280
267
95
581
684
NOTE: - Extra-EU excluding developing countries (=DC) - *Including upholstered and kitchen furniture
Source: Eurostat (2002)
Intra-EU 67%
Total in 2000: US$ 2,917 (1,087 thousand tonnes)*
1998 2000
DC 18%
Main suppliersItaly 14%Belgium 11%Romania 10%
Belgium 14%Italy 11%Germany 10%
Italy 33%Indonesia 8%Belgium 7%
Indonesia 17%Italy 13%China 12%
Italy 16%Germany 15%Belgium 11%
Germany. 24%Italy 19%Spain 9%
Extra-EU15%
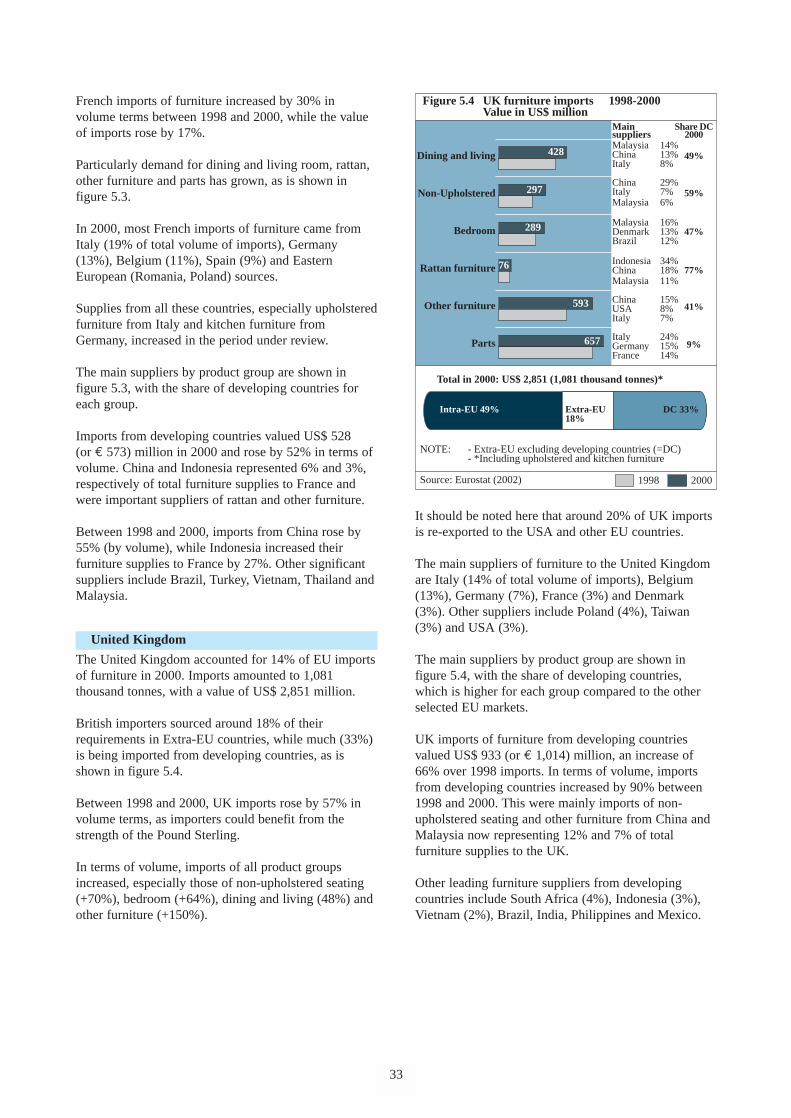
French imports of furniture increased by 30% involume terms between 1998 and 2000, while the valueof imports rose by 17%.
Particularly demand for dining and living room, rattan,other furniture and parts has grown, as is shown infigure 5.3.
In 2000, most French imports of furniture came fromItaly (19% of total volume of imports), Germany(13%), Belgium (11%), Spain (9%) and EasternEuropean (Romania, Poland) sources.
Supplies from all these countries, especially upholsteredfurniture from Italy and kitchen furniture fromGermany, increased in the period under review.
The main suppliers by product group are shown infigure 5.3, with the share of developing countries foreach group.
Imports from developing countries valued US$ 528 (or € 573) million in 2000 and rose by 52% in terms ofvolume. China and Indonesia represented 6% and 3%,respectively of total furniture supplies to France andwere important suppliers of rattan and other furniture.
Between 1998 and 2000, imports from China rose by55% (by volume), while Indonesia increased theirfurniture supplies to France by 27%. Other significantsuppliers include Brazil, Turkey, Vietnam, Thailand andMalaysia.
United Kingdom
The United Kingdom accounted for 14% of EU importsof furniture in 2000. Imports amounted to 1,081thousand tonnes, with a value of US$ 2,851 million.
British importers sourced around 18% of theirrequirements in Extra-EU countries, while much (33%)is being imported from developing countries, as isshown in figure 5.4.
Between 1998 and 2000, UK imports rose by 57% involume terms, as importers could benefit from thestrength of the Pound Sterling.
In terms of volume, imports of all product groupsincreased, especially those of non-upholstered seating(+70%), bedroom (+64%), dining and living (48%) andother furniture (+150%).
33
It should be noted here that around 20% of UK importsis re-exported to the USA and other EU countries.
The main suppliers of furniture to the United Kingdomare Italy (14% of total volume of imports), Belgium(13%), Germany (7%), France (3%) and Denmark(3%). Other suppliers include Poland (4%), Taiwan(3%) and USA (3%).
The main suppliers by product group are shown infigure 5.4, with the share of developing countries,which is higher for each group compared to the otherselected EU markets.
UK imports of furniture from developing countriesvalued US$ 933 (or € 1,014) million, an increase of66% over 1998 imports. In terms of volume, importsfrom developing countries increased by 90% between1998 and 2000. This were mainly imports of non-upholstered seating and other furniture from China andMalaysia now representing 12% and 7% of totalfurniture supplies to the UK.
Other leading furniture suppliers from developingcountries include South Africa (4%), Indonesia (3%),Vietnam (2%), Brazil, India, Philippines and Mexico.
Figure 5.4 UK furniture imports 1998-2000 Value in US$ million
Dining and living
Non-Upholstered
Bedroom
Rattan furniture
Other furniture
Parts
Share DC2000
49%
59%
47%
77%
41%
9%
428
297
289
76
593
657
NOTE: - Extra-EU excluding developing countries (=DC) - *Including upholstered and kitchen furniture
Source: Eurostat (2002)
Intra-EU 49%
Total in 2000: US$ 2,851 (1,081 thousand tonnes)*
1998
DC 33%
2000
Main suppliersMalaysia 14%China 13%Italy 8%
China 29%Italy 7%Malaysia 6%
Malaysia 16%Denmark 13%Brazil 12%
Indonesia 34%China 18%Malaysia 11%
China 15%USA 8%Italy 7%
Italy 24%Germany 15%France 14%
Extra-EU18%
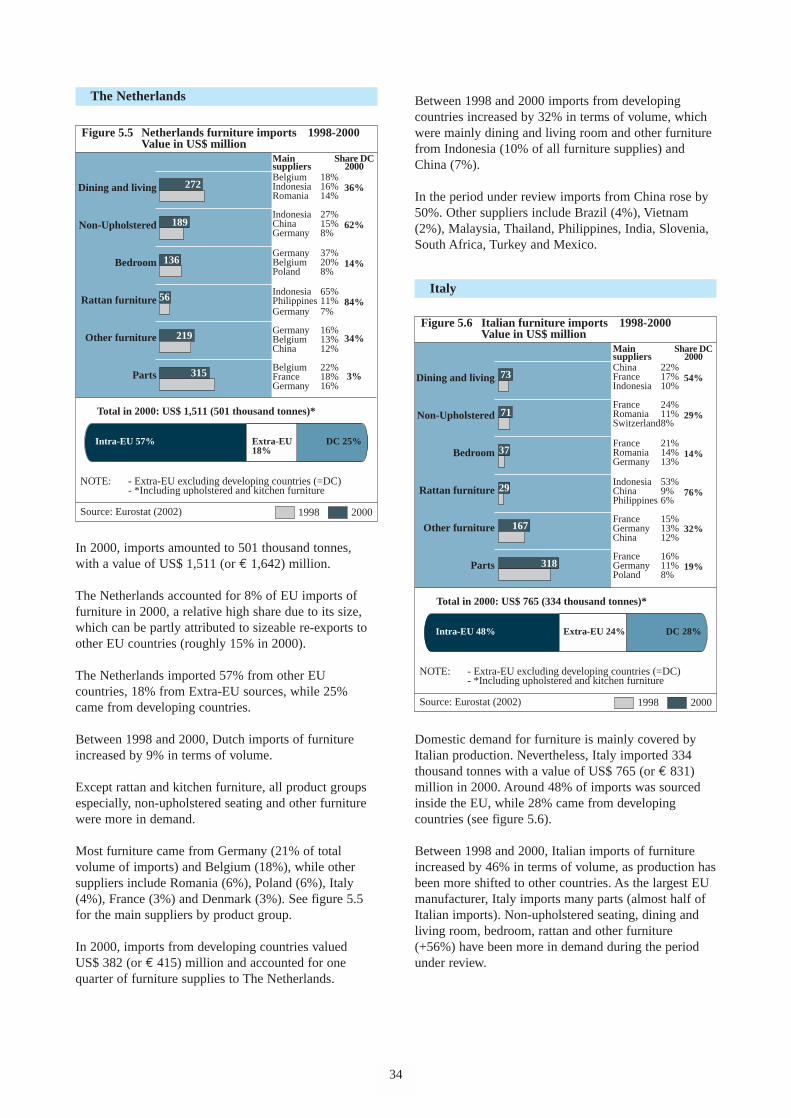
The Netherlands
In 2000, imports amounted to 501 thousand tonnes,with a value of US$ 1,511 (or € 1,642) million.
The Netherlands accounted for 8% of EU imports offurniture in 2000, a relative high share due to its size,which can be partly attributed to sizeable re-exports toother EU countries (roughly 15% in 2000).
The Netherlands imported 57% from other EUcountries, 18% from Extra-EU sources, while 25%came from developing countries.
Between 1998 and 2000, Dutch imports of furnitureincreased by 9% in terms of volume.
Except rattan and kitchen furniture, all product groupsespecially, non-upholstered seating and other furniturewere more in demand.
Most furniture came from Germany (21% of totalvolume of imports) and Belgium (18%), while othersuppliers include Romania (6%), Poland (6%), Italy(4%), France (3%) and Denmark (3%). See figure 5.5for the main suppliers by product group.
In 2000, imports from developing countries valued US$ 382 (or € 415) million and accounted for onequarter of furniture supplies to The Netherlands.
34
Between 1998 and 2000 imports from developingcountries increased by 32% in terms of volume, whichwere mainly dining and living room and other furniturefrom Indonesia (10% of all furniture supplies) andChina (7%).
In the period under review imports from China rose by50%. Other suppliers include Brazil (4%), Vietnam(2%), Malaysia, Thailand, Philippines, India, Slovenia,South Africa, Turkey and Mexico.
Italy
Domestic demand for furniture is mainly covered byItalian production. Nevertheless, Italy imported 334thousand tonnes with a value of US$ 765 (or € 831)million in 2000. Around 48% of imports was sourcedinside the EU, while 28% came from developingcountries (see figure 5.6).
Between 1998 and 2000, Italian imports of furnitureincreased by 46% in terms of volume, as production hasbeen more shifted to other countries. As the largest EUmanufacturer, Italy imports many parts (almost half ofItalian imports). Non-upholstered seating, dining andliving room, bedroom, rattan and other furniture(+56%) have been more in demand during the periodunder review.
Figure 5.5 Netherlands furniture imports 1998-2000 Value in US$ million
Dining and living
Non-Upholstered
Bedroom
Rattan furniture
Other furniture
Parts
Share DC2000
36%
62%
14%
84%
34%
3%
272
189
136
56
219
315
NOTE: - Extra-EU excluding developing countries (=DC) - *Including upholstered and kitchen furniture
Source: Eurostat (2002)
Intra-EU 57%
Total in 2000: US$ 1,511 (501 thousand tonnes)*
1998
DC 25%
2000
Main suppliersBelgium 18%Indonesia 16%Romania 14%
Indonesia 27%China 15%Germany 8%
Germany 37%Belgium 20%Poland 8%
Indonesia 65%Philippines 11%Germany 7%
Germany 16%Belgium 13%China 12%
Belgium 22%France 18%Germany 16%
Extra-EU18%
Figure 5.6 Italian furniture imports 1998-2000 Value in US$ million
Dining and living
Non-Upholstered
Bedroom
Rattan furniture
Other furniture
Parts
Share DC2000
54%
29%
14%
76%
32%
19%
73
71
37
29
167
318
NOTE: - Extra-EU excluding developing countries (=DC) - *Including upholstered and kitchen furniture
Source: Eurostat (2002)
Intra-EU 48%
Total in 2000: US$ 765 (334 thousand tonnes)*
1998
DC 28%
2000
Main suppliersChina 22%France 17%Indonesia 10%
France 24%Romania 11%Switzerland 8%
France 21%Romania 14%Germany 13%
Indonesia 53%China 9%Philippines 6%
France 15%Germany 13%China 12%
France 16%Germany 11%Poland 8%
Extra-EU 24%
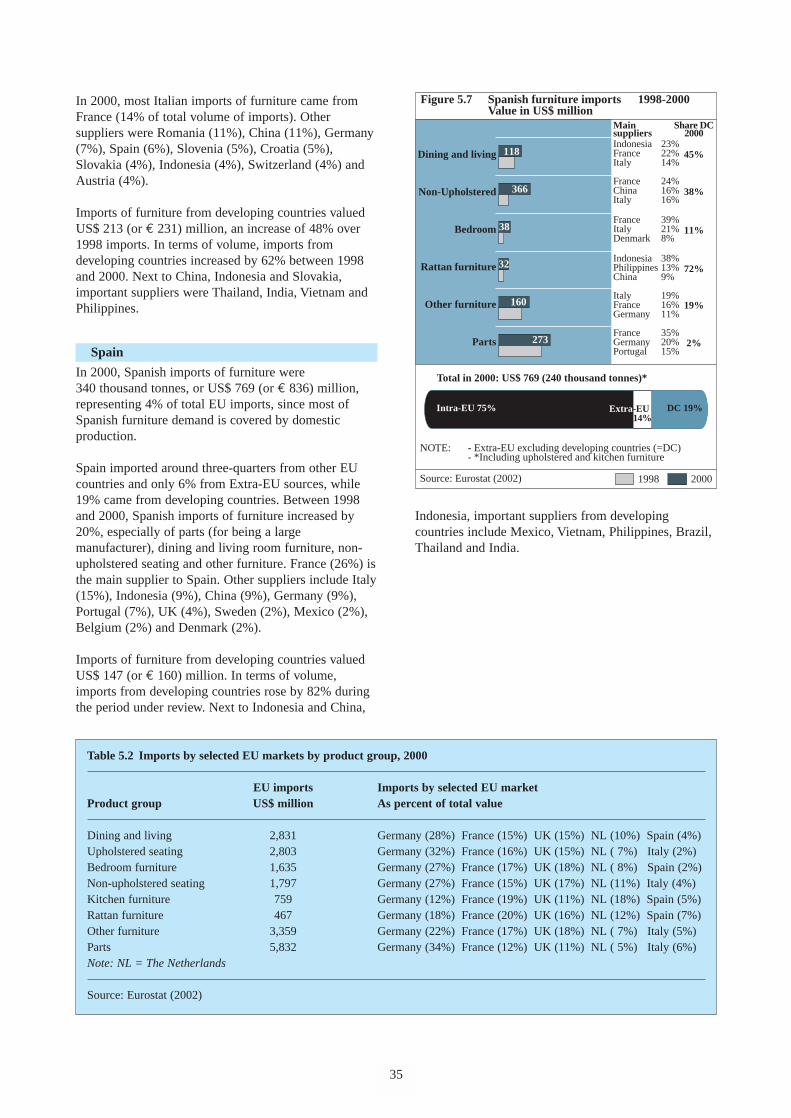
In 2000, most Italian imports of furniture came fromFrance (14% of total volume of imports). Othersuppliers were Romania (11%), China (11%), Germany(7%), Spain (6%), Slovenia (5%), Croatia (5%),Slovakia (4%), Indonesia (4%), Switzerland (4%) andAustria (4%).
Imports of furniture from developing countries valuedUS$ 213 (or € 231) million, an increase of 48% over1998 imports. In terms of volume, imports fromdeveloping countries increased by 62% between 1998and 2000. Next to China, Indonesia and Slovakia,important suppliers were Thailand, India, Vietnam andPhilippines.
Spain
In 2000, Spanish imports of furniture were 340 thousand tonnes, or US$ 769 (or € 836) million,representing 4% of total EU imports, since most ofSpanish furniture demand is covered by domesticproduction.
Spain imported around three-quarters from other EUcountries and only 6% from Extra-EU sources, while19% came from developing countries. Between 1998and 2000, Spanish imports of furniture increased by20%, especially of parts (for being a largemanufacturer), dining and living room furniture, non-upholstered seating and other furniture. France (26%) isthe main supplier to Spain. Other suppliers include Italy(15%), Indonesia (9%), China (9%), Germany (9%),Portugal (7%), UK (4%), Sweden (2%), Mexico (2%),Belgium (2%) and Denmark (2%).
Imports of furniture from developing countries valuedUS$ 147 (or € 160) million. In terms of volume,imports from developing countries rose by 82% duringthe period under review. Next to Indonesia and China,
35
Indonesia, important suppliers from developingcountries include Mexico, Vietnam, Philippines, Brazil,Thailand and India.
Figure 5.7 Spanish furniture imports 1998-2000 Value in US$ million
Dining and living
Non-Upholstered
Bedroom
Rattan furniture
Other furniture
Parts
Share DC2000
45%
38%
11%
72%
19%
2%
118
366
38
32
160
273
NOTE: - Extra-EU excluding developing countries (=DC) - *Including upholstered and kitchen furniture
Source: Eurostat (2002)
Intra-EU 75%
Total in 2000: US$ 769 (240 thousand tonnes)*
1998
DC 19%
2000
Main suppliersIndonesia 23%France 22%Italy 14%
France 24%China 16%Italy 16%
France 39%Italy 21%Denmark 8%
Indonesia 38%Philippines 13%China 9%
Italy 19%France 16%Germany 11%
France 35%Germany 20%Portugal 15%
Extra-EU 14%
Table 5.2 Imports by selected EU markets by product group, 2000
EU imports Imports by selected EU marketProduct group US$ million As percent of total value
Dining and living 2,831 Germany (28%) France (15%) UK (15%) NL (10%) Spain (4%)Upholstered seating 2,803 Germany (32%) France (16%) UK (15%) NL ( 7%) Italy (2%)Bedroom furniture 1,635 Germany (27%) France (17%) UK (18%) NL ( 8%) Spain (2%)Non-upholstered seating 1,797 Germany (27%) France (15%) UK (17%) NL (11%) Italy (4%)Kitchen furniture 759 Germany (12%) France (19%) UK (11%) NL (18%) Spain (5%)Rattan furniture 467 Germany (18%) France (20%) UK (16%) NL (12%) Spain (7%)Other furniture 3,359 Germany (22%) France (17%) UK (18%) NL ( 7%) Italy (5%)Parts 5,832 Germany (34%) France (12%) UK (11%) NL ( 5%) Italy (6%)Note: NL = The Netherlands
Source: Eurostat (2002)
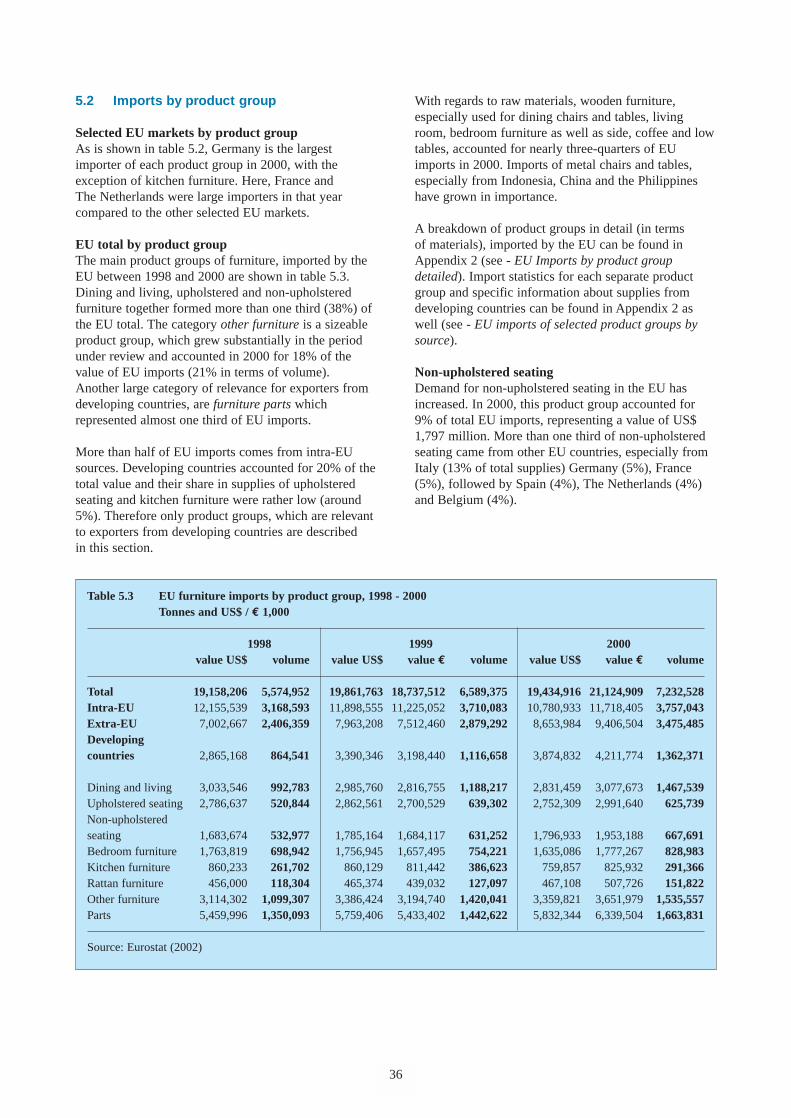
Table 5.3 EU furniture imports by product group, 1998 - 2000Tonnes and US$ / € 1,000
1998 1999 2000value US$ volume value US$ value € volume value US$ value € volume
Total 19,158,206 5,574,952 19,861,763 18,737,512 6,589,375 19,434,916 21,124,909 7,232,528Intra-EU 12,155,539 3,168,593 11,898,555 11,225,052 3,710,083 10,780,933 11,718,405 3,757,043Extra-EU 7,002,667 2,406,359 7,963,208 7,512,460 2,879,292 8,653,984 9,406,504 3,475,485Developing countries 2,865,168 864,541 3,390,346 3,198,440 1,116,658 3,874,832 4,211,774 1,362,371
Dining and living 3,033,546 992,783 2,985,760 2,816,755 1,188,217 2,831,459 3,077,673 1,467,539Upholstered seating 2,786,637 520,844 2,862,561 2,700,529 639,302 2,752,309 2,991,640 625,739Non-upholstered seating 1,683,674 532,977 1,785,164 1,684,117 631,252 1,796,933 1,953,188 667,691Bedroom furniture 1,763,819 698,942 1,756,945 1,657,495 754,221 1,635,086 1,777,267 828,983Kitchen furniture 860,233 261,702 860,129 811,442 386,623 759,857 825,932 291,366Rattan furniture 456,000 118,304 465,374 439,032 127,097 467,108 507,726 151,822Other furniture 3,114,302 1,099,307 3,386,424 3,194,740 1,420,041 3,359,821 3,651,979 1,535,557Parts 5,459,996 1,350,093 5,759,406 5,433,402 1,442,622 5,832,344 6,339,504 1,663,831
Source: Eurostat (2002)
5.2 Imports by product group
Selected EU markets by product groupAs is shown in table 5.2, Germany is the largestimporter of each product group in 2000, with theexception of kitchen furniture. Here, France and The Netherlands were large importers in that yearcompared to the other selected EU markets.
EU total by product groupThe main product groups of furniture, imported by theEU between 1998 and 2000 are shown in table 5.3.Dining and living, upholstered and non-upholsteredfurniture together formed more than one third (38%) ofthe EU total. The category other furniture is a sizeableproduct group, which grew substantially in the periodunder review and accounted in 2000 for 18% of thevalue of EU imports (21% in terms of volume). Another large category of relevance for exporters fromdeveloping countries, are furniture parts whichrepresented almost one third of EU imports.
More than half of EU imports comes from intra-EUsources. Developing countries accounted for 20% of thetotal value and their share in supplies of upholsteredseating and kitchen furniture were rather low (around5%). Therefore only product groups, which are relevantto exporters from developing countries are describedin this section.
36
With regards to raw materials, wooden furniture,especially used for dining chairs and tables, livingroom, bedroom furniture as well as side, coffee and lowtables, accounted for nearly three-quarters of EUimports in 2000. Imports of metal chairs and tables,especially from Indonesia, China and the Philippineshave grown in importance.
A breakdown of product groups in detail (in terms of materials), imported by the EU can be found inAppendix 2 (see - EU Imports by product groupdetailed). Import statistics for each separate productgroup and specific information about supplies fromdeveloping countries can be found in Appendix 2 aswell (see - EU imports of selected product groups bysource).
Non-upholstered seatingDemand for non-upholstered seating in the EU hasincreased. In 2000, this product group accounted for9% of total EU imports, representing a value of US$1,797 million. More than one third of non-upholsteredseating came from other EU countries, especially fromItaly (13% of total supplies) Germany (5%), France(5%), followed by Spain (4%), The Netherlands (4%)and Belgium (4%).
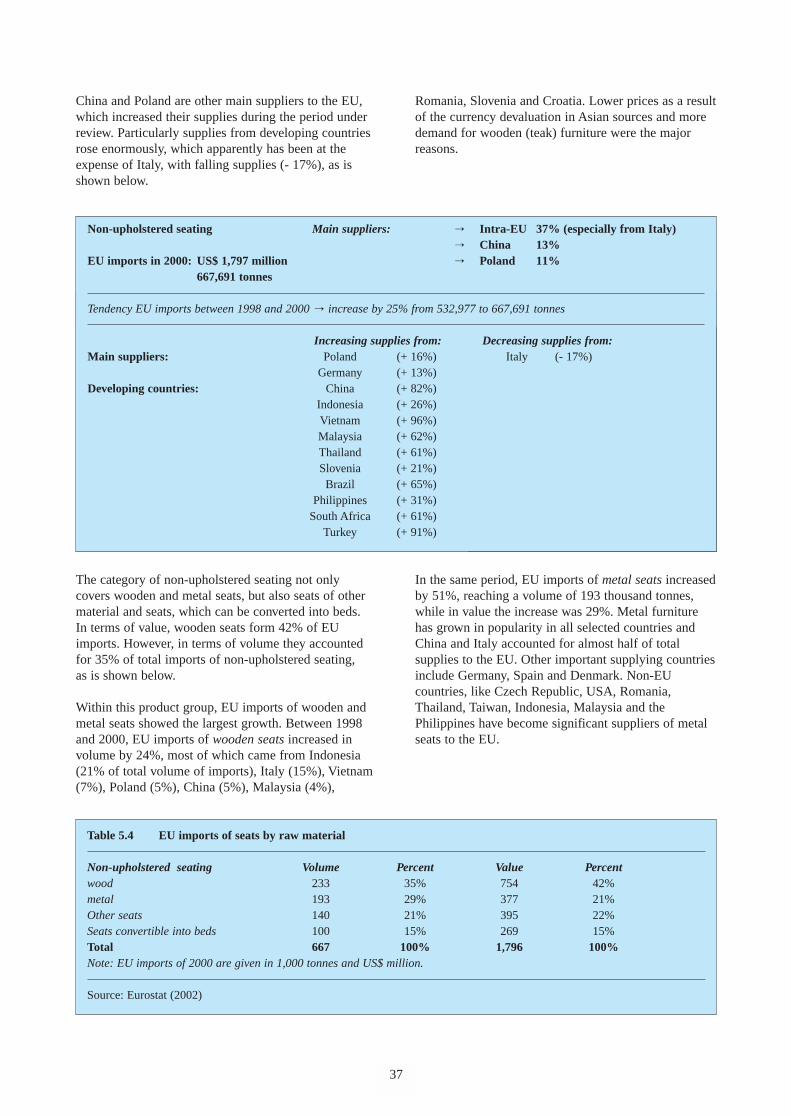
China and Poland are other main suppliers to the EU,which increased their supplies during the period underreview. Particularly supplies from developing countriesrose enormously, which apparently has been at theexpense of Italy, with falling supplies (- 17%), as isshown below.
37
The category of non-upholstered seating not onlycovers wooden and metal seats, but also seats of othermaterial and seats, which can be converted into beds. In terms of value, wooden seats form 42% of EUimports. However, in terms of volume they accountedfor 35% of total imports of non-upholstered seating,as is shown below.
Within this product group, EU imports of wooden andmetal seats showed the largest growth. Between 1998and 2000, EU imports of wooden seats increased involume by 24%, most of which came from Indonesia(21% of total volume of imports), Italy (15%), Vietnam(7%), Poland (5%), China (5%), Malaysia (4%),
Table 5.4 EU imports of seats by raw material
Non-upholstered seating Volume Percent Value Percentwood 233 35% 754 42%metal 193 29% 377 21%Other seats 140 21% 395 22%Seats convertible into beds 100 15% 269 15%Total 667 100% 1,796 100%Note: EU imports of 2000 are given in 1,000 tonnes and US$ million.
Source: Eurostat (2002)
Romania, Slovenia and Croatia. Lower prices as a resultof the currency devaluation in Asian sources and moredemand for wooden (teak) furniture were the majorreasons.
In the same period, EU imports of metal seats increasedby 51%, reaching a volume of 193 thousand tonnes,while in value the increase was 29%. Metal furniturehas grown in popularity in all selected countries andChina and Italy accounted for almost half of totalsupplies to the EU. Other important supplying countriesinclude Germany, Spain and Denmark. Non-EUcountries, like Czech Republic, USA, Romania,Thailand, Taiwan, Indonesia, Malaysia and thePhilippines have become significant suppliers of metalseats to the EU.
Tendency EU imports between 1998 and 2000 o increase by 25% from 532,977 to 667,691 tonnes
Non-upholstered seating Main suppliers: o Intra-EU 37% (especially from Italy)o China 13%
EU imports in 2000: US$ 1,797 million o Poland 11%667,691 tonnes
Tendency EU imports between 1998 and 2000 o increase by 25% from 532,977 to 667,691 tonnes
Increasing supplies from: Decreasing supplies from:Main suppliers: Poland (+ 16%) Italy (- 17%)
Germany (+ 13%)Developing countries: China (+ 82%)
Indonesia (+ 26%)Vietnam (+ 96%)Malaysia (+ 62%)Thailand (+ 61%)Slovenia (+ 21%)
Brazil (+ 65%)Philippines (+ 31%)
South Africa (+ 61%)Turkey (+ 91%)
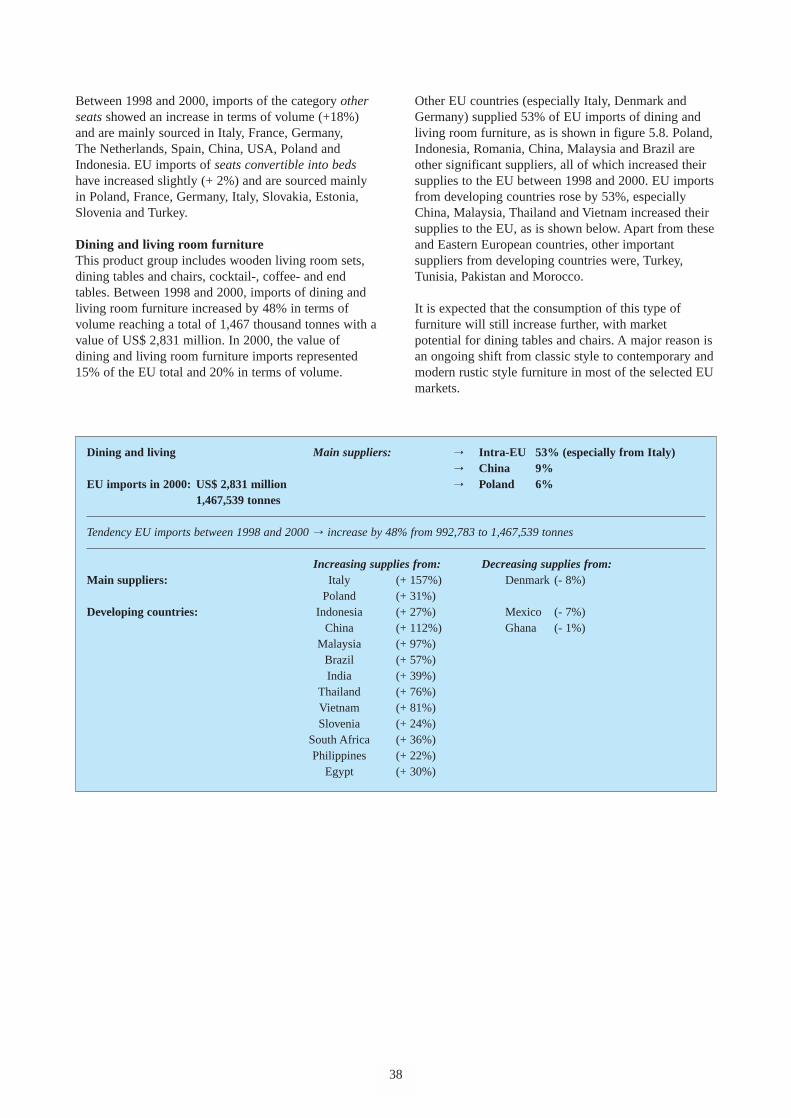
Between 1998 and 2000, imports of the category otherseats showed an increase in terms of volume (+18%)and are mainly sourced in Italy, France, Germany,The Netherlands, Spain, China, USA, Poland andIndonesia. EU imports of seats convertible into bedshave increased slightly (+ 2%) and are sourced mainlyin Poland, France, Germany, Italy, Slovakia, Estonia,Slovenia and Turkey.
Dining and living room furnitureThis product group includes wooden living room sets,dining tables and chairs, cocktail-, coffee- and endtables. Between 1998 and 2000, imports of dining andliving room furniture increased by 48% in terms ofvolume reaching a total of 1,467 thousand tonnes with avalue of US$ 2,831 million. In 2000, the value ofdining and living room furniture imports represented15% of the EU total and 20% in terms of volume.
38
Other EU countries (especially Italy, Denmark andGermany) supplied 53% of EU imports of dining andliving room furniture, as is shown in figure 5.8. Poland,Indonesia, Romania, China, Malaysia and Brazil areother significant suppliers, all of which increased theirsupplies to the EU between 1998 and 2000. EU importsfrom developing countries rose by 53%, especiallyChina, Malaysia, Thailand and Vietnam increased theirsupplies to the EU, as is shown below. Apart from theseand Eastern European countries, other importantsuppliers from developing countries were, Turkey,Tunisia, Pakistan and Morocco.
It is expected that the consumption of this type offurniture will still increase further, with marketpotential for dining tables and chairs. A major reason isan ongoing shift from classic style to contemporary andmodern rustic style furniture in most of the selected EUmarkets.
Dining and living Main suppliers: o Intra-EU 53% (especially from Italy)o China 9%
EU imports in 2000: US$ 2,831 million o Poland 6%1,467,539 tonnes
Tendency EU imports between 1998 and 2000 o increase by 48% from 992,783 to 1,467,539 tonnes
Increasing supplies from: Decreasing supplies from:Main suppliers: Italy (+ 157%) Denmark (- 8%)
Poland (+ 31%)Developing countries: Indonesia (+ 27%) Mexico (- 7%)
China (+ 112%) Ghana (- 1%)Malaysia (+ 97%)
Brazil (+ 57%)India (+ 39%)
Thailand (+ 76%)Vietnam (+ 81%)Slovenia (+ 24%)
South Africa (+ 36%)Philippines (+ 22%)
Egypt (+ 30%)
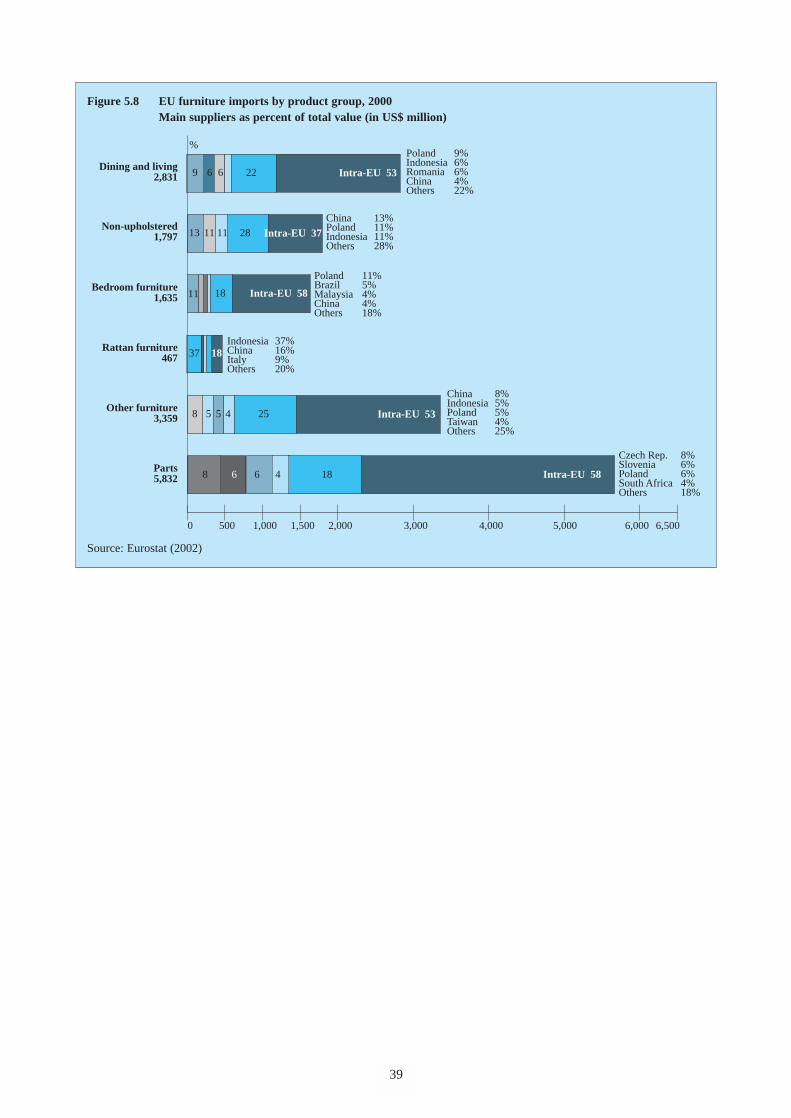
39
China 13%Poland 11%Indonesia 11%Others 28%
Non-upholstered1,797 Intra-EU 371113 28
6,000 6,500500 1,000 1,500 2,000 3,000 4,000 5,0000
Dining and living2,831
Rattan furniture467
Other furniture3,359
Parts5,832
%
China 8%Indonesia 5%Poland 5%Taiwan 4%Others 25%
Czech Rep. 8%Slovenia 6%Poland 6%South Africa 4%Others 18%
Intra-EU 53
Poland 9%Indonesia 6%Romania 6%China 4%Others 22%
Indonesia 37%China 16%Italy 9%Others 20%
Intra-EU 53
Intra-EU 58186 468
254558
37 18
9
9 6 6 22
Poland 11%Brazil 5%Malaysia 4%China 4%Others 18%
11
Bedroom furniture1,635 46Intra-EU 581811
Figure 5.8 EU furniture imports by product group, 2000Main suppliers as percent of total value (in US$ million)
Source: Eurostat (2002)
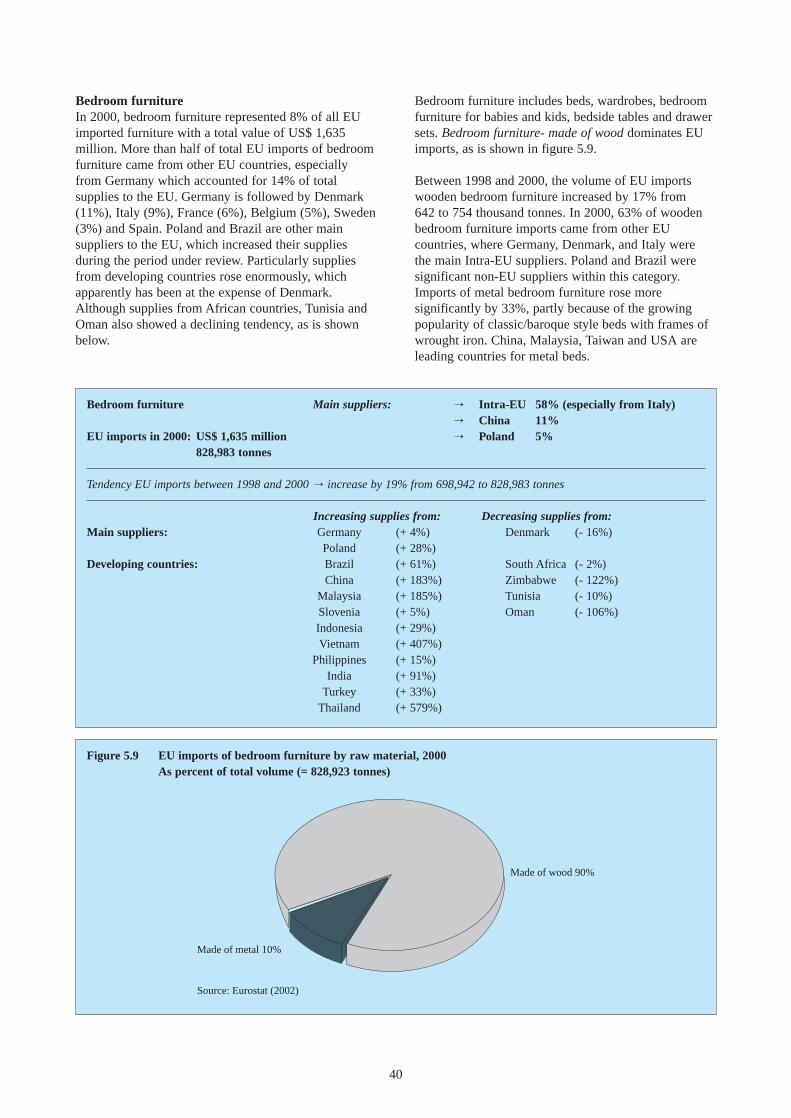
Bedroom furnitureIn 2000, bedroom furniture represented 8% of all EUimported furniture with a total value of US$ 1,635million. More than half of total EU imports of bedroomfurniture came from other EU countries, especiallyfrom Germany which accounted for 14% of totalsupplies to the EU. Germany is followed by Denmark(11%), Italy (9%), France (6%), Belgium (5%), Sweden(3%) and Spain. Poland and Brazil are other mainsuppliers to the EU, which increased their suppliesduring the period under review. Particularly suppliesfrom developing countries rose enormously, whichapparently has been at the expense of Denmark.Although supplies from African countries, Tunisia andOman also showed a declining tendency, as is shownbelow.
40
Bedroom furniture includes beds, wardrobes, bedroomfurniture for babies and kids, bedside tables and drawersets. Bedroom furniture- made of wood dominates EUimports, as is shown in figure 5.9.
Between 1998 and 2000, the volume of EU importswooden bedroom furniture increased by 17% from 642 to 754 thousand tonnes. In 2000, 63% of woodenbedroom furniture imports came from other EUcountries, where Germany, Denmark, and Italy were the main Intra-EU suppliers. Poland and Brazil weresignificant non-EU suppliers within this category.Imports of metal bedroom furniture rose moresignificantly by 33%, partly because of the growingpopularity of classic/baroque style beds with frames ofwrought iron. China, Malaysia, Taiwan and USA areleading countries for metal beds.
Made of metal 10%
Made of wood 90%
Source: Eurostat (2002)
Figure 5.9 EU imports of bedroom furniture by raw material, 2000As percent of total volume (= 828,923 tonnes)
Bedroom furniture Main suppliers: o Intra-EU 58% (especially from Italy)o China 11%
EU imports in 2000: US$ 1,635 million o Poland 5%828,983 tonnes
Tendency EU imports between 1998 and 2000 o increase by 19% from 698,942 to 828,983 tonnes
Increasing supplies from: Decreasing supplies from:Main suppliers: Germany (+ 4%) Denmark (- 16%)
Poland (+ 28%)Developing countries: Brazil (+ 61%) South Africa (- 2%)
China (+ 183%) Zimbabwe (- 122%)Malaysia (+ 185%) Tunisia (- 10%)Slovenia (+ 5%) Oman (- 106%)Indonesia (+ 29%)Vietnam (+ 407%)
Philippines (+ 15%)India (+ 91%)
Turkey (+ 33%)Thailand (+ 579%)
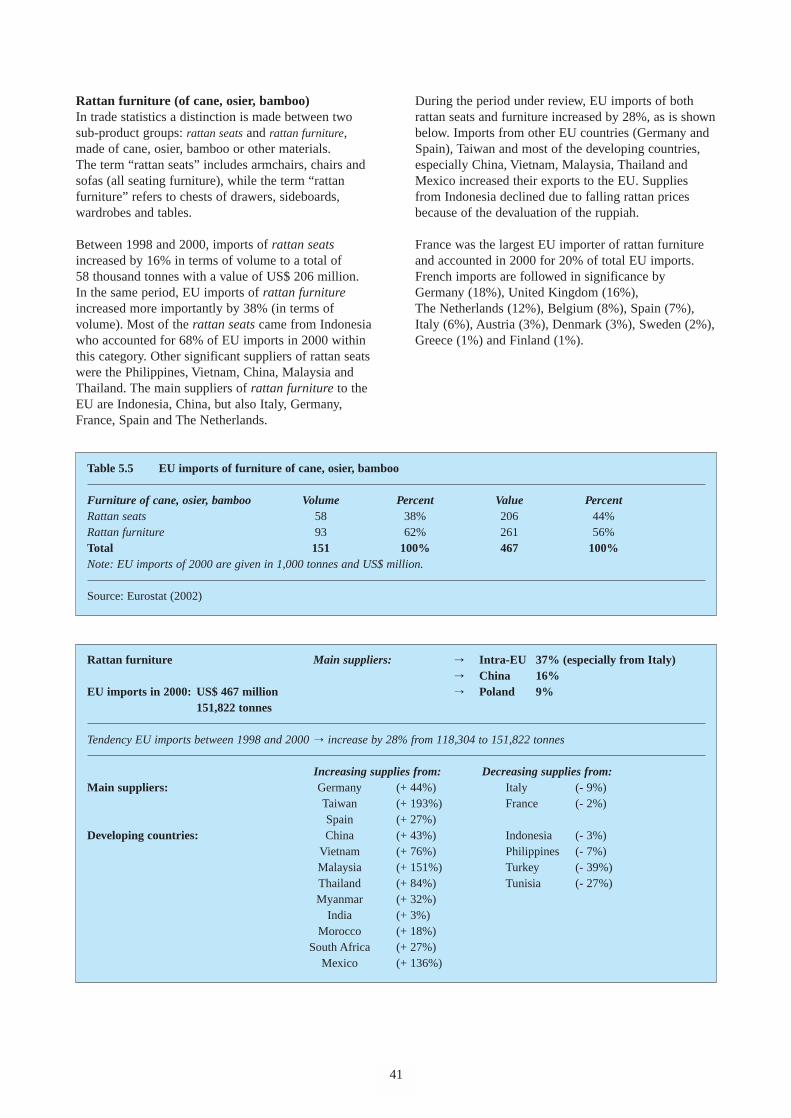
Rattan furniture (of cane, osier, bamboo) In trade statistics a distinction is made between twosub-product groups: rattan seats and rattan furniture,made of cane, osier, bamboo or other materials. The term “rattan seats” includes armchairs, chairs andsofas (all seating furniture), while the term “rattanfurniture” refers to chests of drawers, sideboards,wardrobes and tables.
Between 1998 and 2000, imports of rattan seatsincreased by 16% in terms of volume to a total of 58 thousand tonnes with a value of US$ 206 million. In the same period, EU imports of rattan furnitureincreased more importantly by 38% (in terms ofvolume). Most of the rattan seats came from Indonesiawho accounted for 68% of EU imports in 2000 withinthis category. Other significant suppliers of rattan seatswere the Philippines, Vietnam, China, Malaysia andThailand. The main suppliers of rattan furniture to theEU are Indonesia, China, but also Italy, Germany,France, Spain and The Netherlands.
41
Table 5.5 EU imports of furniture of cane, osier, bamboo
Furniture of cane, osier, bamboo Volume Percent Value PercentRattan seats 58 38% 206 44%Rattan furniture 93 62% 261 56%Total 151 100% 467 100%Note: EU imports of 2000 are given in 1,000 tonnes and US$ million.
Source: Eurostat (2002)
During the period under review, EU imports of bothrattan seats and furniture increased by 28%, as is shownbelow. Imports from other EU countries (Germany andSpain), Taiwan and most of the developing countries,especially China, Vietnam, Malaysia, Thailand andMexico increased their exports to the EU. Suppliesfrom Indonesia declined due to falling rattan pricesbecause of the devaluation of the ruppiah.
France was the largest EU importer of rattan furnitureand accounted in 2000 for 20% of total EU imports.French imports are followed in significance byGermany (18%), United Kingdom (16%),The Netherlands (12%), Belgium (8%), Spain (7%),Italy (6%), Austria (3%), Denmark (3%), Sweden (2%),Greece (1%) and Finland (1%).
Rattan furniture Main suppliers: o Intra-EU 37% (especially from Italy)o China 16%
EU imports in 2000: US$ 467 million o Poland 9%151,822 tonnes
Tendency EU imports between 1998 and 2000 o increase by 28% from 118,304 to 151,822 tonnes
Increasing supplies from: Decreasing supplies from:Main suppliers: Germany (+ 44%) Italy (- 9%)
Taiwan (+ 193%) France (- 2%)Spain (+ 27%)
Developing countries: China (+ 43%) Indonesia (- 3%)Vietnam (+ 76%) Philippines (- 7%)Malaysia (+ 151%) Turkey (- 39%)Thailand (+ 84%) Tunisia (- 27%)Myanmar (+ 32%)
India (+ 3%)Morocco (+ 18%)
South Africa (+ 27%)Mexico (+ 136%)
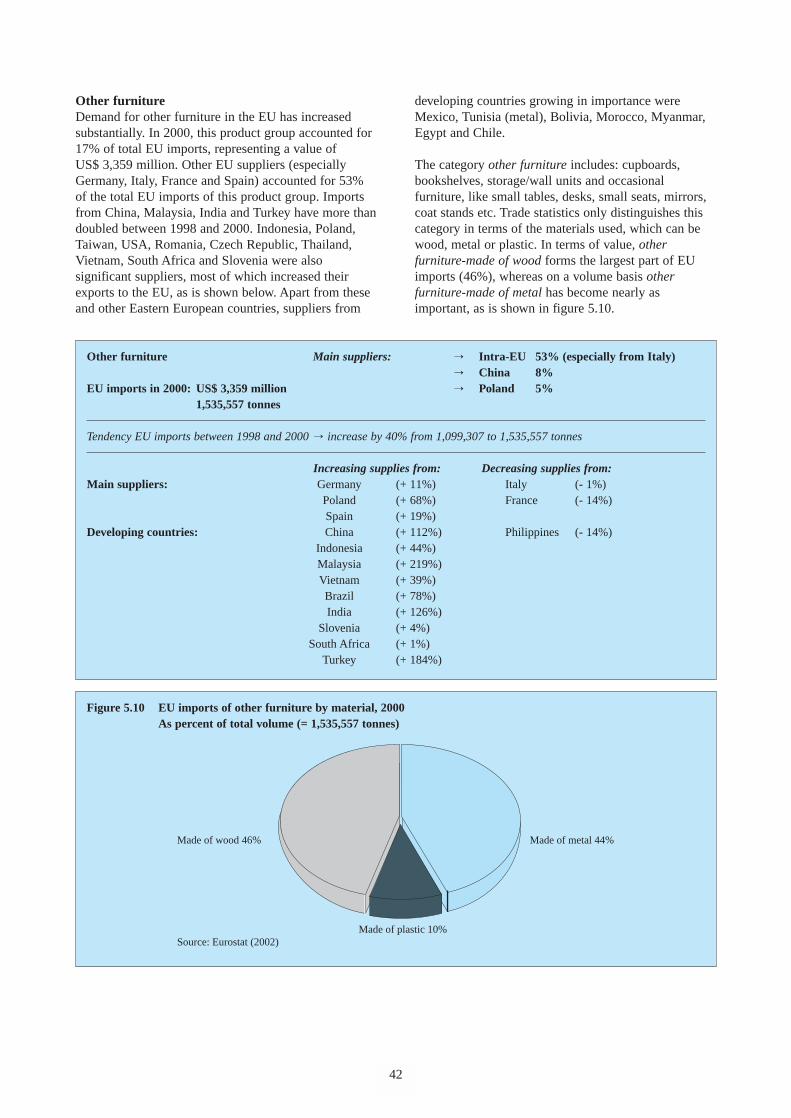
Other furnitureDemand for other furniture in the EU has increasedsubstantially. In 2000, this product group accounted for17% of total EU imports, representing a value of US$ 3,359 million. Other EU suppliers (especiallyGermany, Italy, France and Spain) accounted for 53%of the total EU imports of this product group. Importsfrom China, Malaysia, India and Turkey have more thandoubled between 1998 and 2000. Indonesia, Poland,Taiwan, USA, Romania, Czech Republic, Thailand,Vietnam, South Africa and Slovenia were alsosignificant suppliers, most of which increased theirexports to the EU, as is shown below. Apart from theseand other Eastern European countries, suppliers from
42
developing countries growing in importance wereMexico, Tunisia (metal), Bolivia, Morocco, Myanmar,Egypt and Chile.
The category other furniture includes: cupboards,bookshelves, storage/wall units and occasionalfurniture, like small tables, desks, small seats, mirrors,coat stands etc. Trade statistics only distinguishes thiscategory in terms of the materials used, which can bewood, metal or plastic. In terms of value, otherfurniture-made of wood forms the largest part of EUimports (46%), whereas on a volume basis otherfurniture-made of metal has become nearly asimportant, as is shown in figure 5.10.
Made of wood 46% Made of metal 44%
Source: Eurostat (2002)Made of plastic 10%
Figure 5.10 EU imports of other furniture by material, 2000As percent of total volume (= 1,535,557 tonnes)
Other furniture Main suppliers: o Intra-EU 53% (especially from Italy)o China 8%
EU imports in 2000: US$ 3,359 million o Poland 5%1,535,557 tonnes
Tendency EU imports between 1998 and 2000 o increase by 40% from 1,099,307 to 1,535,557 tonnes
Increasing supplies from: Decreasing supplies from:Main suppliers: Germany (+ 11%) Italy (- 1%)
Poland (+ 68%) France (- 14%)Spain (+ 19%)
Developing countries: China (+ 112%) Philippines (- 14%)Indonesia (+ 44%)Malaysia (+ 219%)Vietnam (+ 39%)Brazil (+ 78%)India (+ 126%)
Slovenia (+ 4%)South Africa (+ 1%)
Turkey (+ 184%)
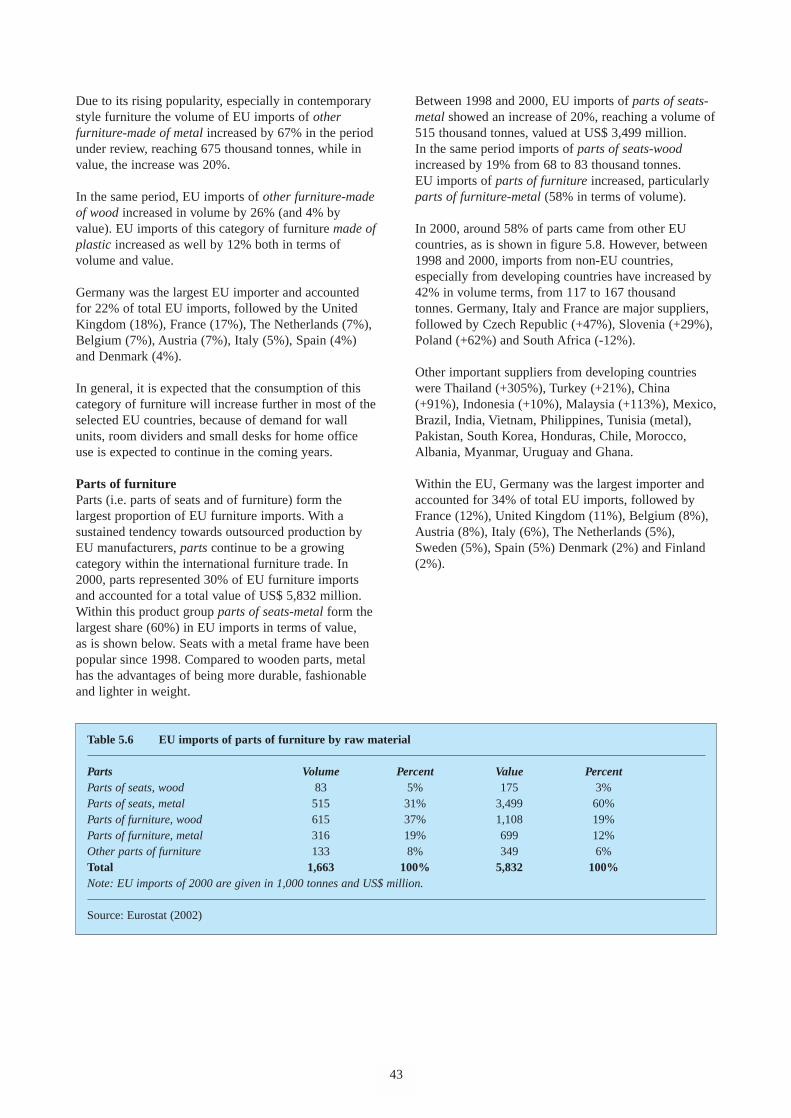
Due to its rising popularity, especially in contemporarystyle furniture the volume of EU imports of otherfurniture-made of metal increased by 67% in the periodunder review, reaching 675 thousand tonnes, while invalue, the increase was 20%.
In the same period, EU imports of other furniture-madeof wood increased in volume by 26% (and 4% byvalue). EU imports of this category of furniture made ofplastic increased as well by 12% both in terms ofvolume and value.
Germany was the largest EU importer and accountedfor 22% of total EU imports, followed by the UnitedKingdom (18%), France (17%), The Netherlands (7%),Belgium (7%), Austria (7%), Italy (5%), Spain (4%)and Denmark (4%).
In general, it is expected that the consumption of thiscategory of furniture will increase further in most of theselected EU countries, because of demand for wallunits, room dividers and small desks for home officeuse is expected to continue in the coming years.
Parts of furnitureParts (i.e. parts of seats and of furniture) form thelargest proportion of EU furniture imports. With asustained tendency towards outsourced production byEU manufacturers, parts continue to be a growingcategory within the international furniture trade. In2000, parts represented 30% of EU furniture importsand accounted for a total value of US$ 5,832 million.Within this product group parts of seats-metal form thelargest share (60%) in EU imports in terms of value,as is shown below. Seats with a metal frame have beenpopular since 1998. Compared to wooden parts, metalhas the advantages of being more durable, fashionableand lighter in weight.
43
Between 1998 and 2000, EU imports of parts of seats-metal showed an increase of 20%, reaching a volume of515 thousand tonnes, valued at US$ 3,499 million. In the same period imports of parts of seats-woodincreased by 19% from 68 to 83 thousand tonnes. EU imports of parts of furniture increased, particularlyparts of furniture-metal (58% in terms of volume).
In 2000, around 58% of parts came from other EUcountries, as is shown in figure 5.8. However, between1998 and 2000, imports from non-EU countries,especially from developing countries have increased by42% in volume terms, from 117 to 167 thousandtonnes. Germany, Italy and France are major suppliers,followed by Czech Republic (+47%), Slovenia (+29%),Poland (+62%) and South Africa (-12%).
Other important suppliers from developing countrieswere Thailand (+305%), Turkey (+21%), China(+91%), Indonesia (+10%), Malaysia (+113%), Mexico,Brazil, India, Vietnam, Philippines, Tunisia (metal),Pakistan, South Korea, Honduras, Chile, Morocco,Albania, Myanmar, Uruguay and Ghana.
Within the EU, Germany was the largest importer andaccounted for 34% of total EU imports, followed byFrance (12%), United Kingdom (11%), Belgium (8%),Austria (8%), Italy (6%), The Netherlands (5%),Sweden (5%), Spain (5%) Denmark (2%) and Finland(2%).
Table 5.6 EU imports of parts of furniture by raw material
Parts Volume Percent Value PercentParts of seats, wood 83 5% 175 3%Parts of seats, metal 515 31% 3,499 60%Parts of furniture, wood 615 37% 1,108 19%Parts of furniture, metal 316 19% 699 12%Other parts of furniture 133 8% 349 6%Total 1,663 100% 5,832 100%Note: EU imports of 2000 are given in 1,000 tonnes and US$ million.
Source: Eurostat (2002)
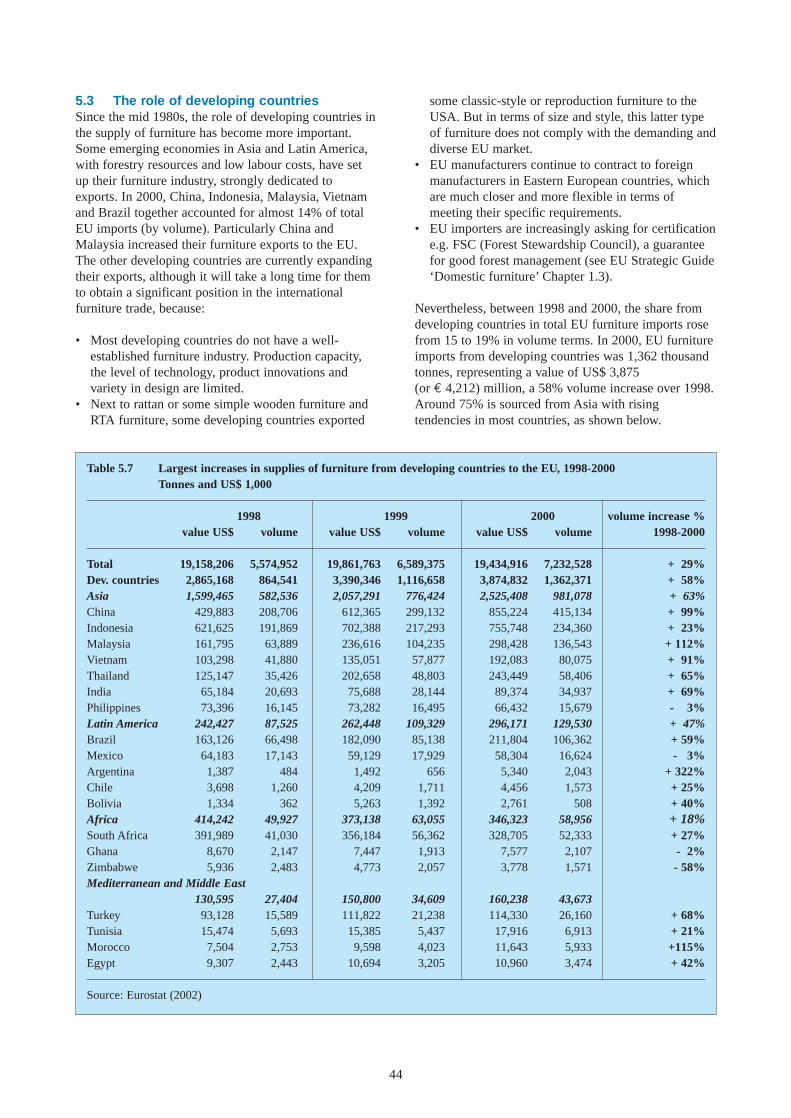
5.3 The role of developing countriesSince the mid 1980s, the role of developing countries inthe supply of furniture has become more important.Some emerging economies in Asia and Latin America,with forestry resources and low labour costs, have setup their furniture industry, strongly dedicated toexports. In 2000, China, Indonesia, Malaysia, Vietnamand Brazil together accounted for almost 14% of totalEU imports (by volume). Particularly China andMalaysia increased their furniture exports to the EU.The other developing countries are currently expandingtheir exports, although it will take a long time for themto obtain a significant position in the internationalfurniture trade, because:
• Most developing countries do not have a well-established furniture industry. Production capacity,the level of technology, product innovations andvariety in design are limited.
• Next to rattan or some simple wooden furniture andRTA furniture, some developing countries exported
44
some classic-style or reproduction furniture to theUSA. But in terms of size and style, this latter typeof furniture does not comply with the demanding anddiverse EU market.
• EU manufacturers continue to contract to foreignmanufacturers in Eastern European countries, whichare much closer and more flexible in terms ofmeeting their specific requirements.
• EU importers are increasingly asking for certificatione.g. FSC (Forest Stewardship Council), a guaranteefor good forest management (see EU Strategic Guide‘Domestic furniture’ Chapter 1.3).
Nevertheless, between 1998 and 2000, the share fromdeveloping countries in total EU furniture imports rosefrom 15 to 19% in volume terms. In 2000, EU furnitureimports from developing countries was 1,362 thousandtonnes, representing a value of US$ 3,875 (or € 4,212) million, a 58% volume increase over 1998.Around 75% is sourced from Asia with risingtendencies in most countries, as shown below.
Table 5.7 Largest increases in supplies of furniture from developing countries to the EU, 1998-2000Tonnes and US$ 1,000
1998 1999 2000 volume increase % value US$ volume value US$ volume value US$ volume 1998-2000
Total 19,158,206 5,574,952 19,861,763 6,589,375 19,434,916 7,232,528 + 29%Dev. countries 2,865,168 864,541 3,390,346 1,116,658 3,874,832 1,362,371 + 58%Asia 1,599,465 582,536 2,057,291 776,424 2,525,408 981,078 + 63%China 429,883 208,706 612,365 299,132 855,224 415,134 + 99%Indonesia 621,625 191,869 702,388 217,293 755,748 234,360 + 23%Malaysia 161,795 63,889 236,616 104,235 298,428 136,543 + 112%Vietnam 103,298 41,880 135,051 57,877 192,083 80,075 + 91%Thailand 125,147 35,426 202,658 48,803 243,449 58,406 + 65%India 65,184 20,693 75,688 28,144 89,374 34,937 + 69%Philippines 73,396 16,145 73,282 16,495 66,432 15,679 - 3%Latin America 242,427 87,525 262,448 109,329 296,171 129,530 + 47%Brazil 163,126 66,498 182,090 85,138 211,804 106,362 + 59%Mexico 64,183 17,143 59,129 17,929 58,304 16,624 - 3%Argentina 1,387 484 1,492 656 5,340 2,043 + 322%Chile 3,698 1,260 4,209 1,711 4,456 1,573 + 25%Bolivia 1,334 362 5,263 1,392 2,761 508 + 40%Africa 414,242 49,927 373,138 63,055 346,323 58,956 + 18%South Africa 391,989 41,030 356,184 56,362 328,705 52,333 + 27%Ghana 8,670 2,147 7,447 1,913 7,577 2,107 - 2%Zimbabwe 5,936 2,483 4,773 2,057 3,778 1,571 - 58%Mediterranean and Middle East
130,595 27,404 150,800 34,609 160,238 43,673Turkey 93,128 15,589 111,822 21,238 114,330 26,160 + 68%Tunisia 15,474 5,693 15,385 5,437 17,916 6,913 + 21%Morocco 7,504 2,753 9,598 4,023 11,643 5,933 +115%Egypt 9,307 2,443 10,694 3,205 10,960 3,474 + 42%
Source: Eurostat (2002)
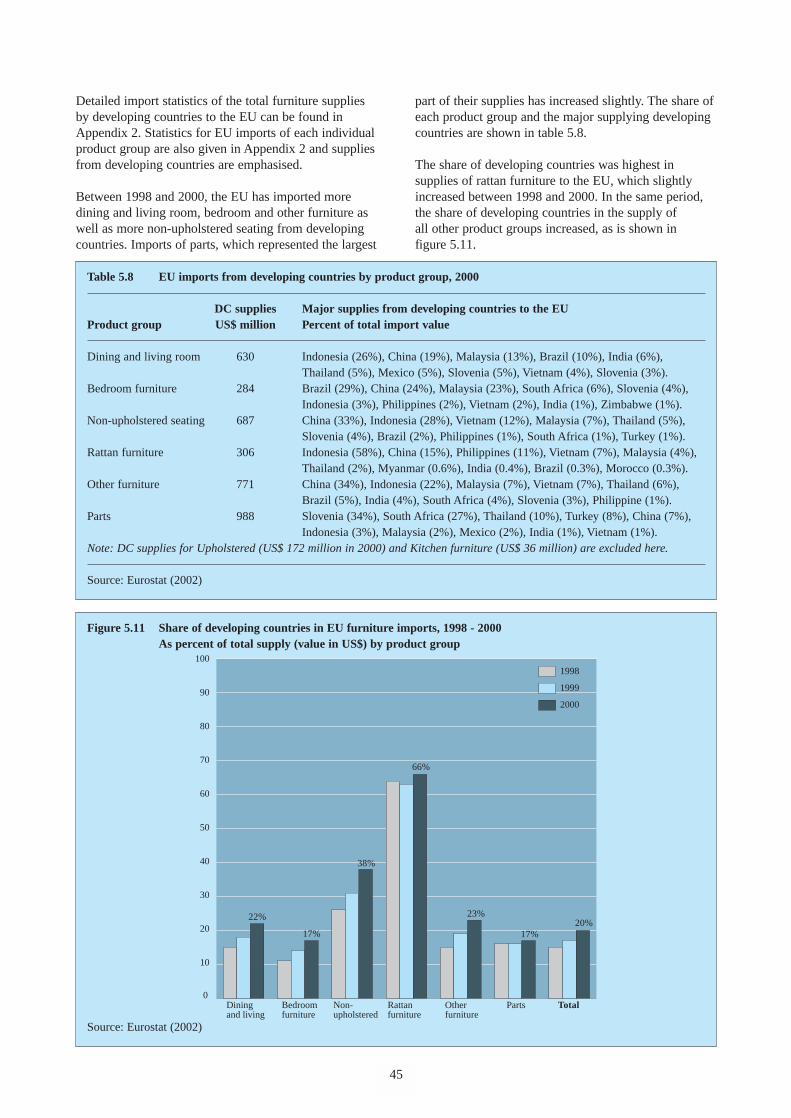
Detailed import statistics of the total furniture suppliesby developing countries to the EU can be found inAppendix 2. Statistics for EU imports of each individualproduct group are also given in Appendix 2 and suppliesfrom developing countries are emphasised.
Between 1998 and 2000, the EU has imported moredining and living room, bedroom and other furniture aswell as more non-upholstered seating from developingcountries. Imports of parts, which represented the largest
45
part of their supplies has increased slightly. The share ofeach product group and the major supplying developingcountries are shown in table 5.8.
The share of developing countries was highest insupplies of rattan furniture to the EU, which slightlyincreased between 1998 and 2000. In the same period,the share of developing countries in the supply of all other product groups increased, as is shown in figure 5.11.
Table 5.8 EU imports from developing countries by product group, 2000
DC supplies Major supplies from developing countries to the EUProduct group US$ million Percent of total import value
Dining and living room 630 Indonesia (26%), China (19%), Malaysia (13%), Brazil (10%), India (6%),Thailand (5%), Mexico (5%), Slovenia (5%), Vietnam (4%), Slovenia (3%).
Bedroom furniture 284 Brazil (29%), China (24%), Malaysia (23%), South Africa (6%), Slovenia (4%),Indonesia (3%), Philippines (2%), Vietnam (2%), India (1%), Zimbabwe (1%).
Non-upholstered seating 687 China (33%), Indonesia (28%), Vietnam (12%), Malaysia (7%), Thailand (5%),Slovenia (4%), Brazil (2%), Philippines (1%), South Africa (1%), Turkey (1%).
Rattan furniture 306 Indonesia (58%), China (15%), Philippines (11%), Vietnam (7%), Malaysia (4%),Thailand (2%), Myanmar (0.6%), India (0.4%), Brazil (0.3%), Morocco (0.3%).
Other furniture 771 China (34%), Indonesia (22%), Malaysia (7%), Vietnam (7%), Thailand (6%),Brazil (5%), India (4%), South Africa (4%), Slovenia (3%), Philippine (1%).
Parts 988 Slovenia (34%), South Africa (27%), Thailand (10%), Turkey (8%), China (7%),Indonesia (3%), Malaysia (2%), Mexico (2%), India (1%), Vietnam (1%).
Note: DC supplies for Upholstered (US$ 172 million in 2000) and Kitchen furniture (US$ 36 million) are excluded here.
Source: Eurostat (2002)
100
90
80
70
60
50
40
30
20
10
0Dining and living
Bedroomfurniture
Non-upholstered
Rattanfurniture
Otherfurniture
Parts Total
1998
1999
2000
22%
17%
38%
66%
23%
17%20%
Figure 5.11 Share of developing countries in EU furniture imports, 1998 - 2000As percent of total supply (value in US$) by product group
Source: Eurostat (2002)
Developing countries, as defined by the OECD, arelisted in Appendix 9. The differences and difficulties inexpansion of furniture industries in each region can bedescribed as follows:
AsiaMost EU importers buy products from Indonesia, China,Malaysia, Thailand, Vietnam, India and the Philippines.Indonesia is leading supplier of rattan furniture, woodenseats (teak) and dining and living room furniture.Supplies from these countries are large and the furnitureindustry in both countries is characterised by thepresence of many small companies, competing in termsof price, product innovations (Philippines), efficiency andquality (China) and shortening of lead-times. Indonesia,China, Malaysia, Philippines, Thailand and India havewell-established furniture associations.
International or national trade fairs in these countries takeplace as well. Furniture from Thailand and India is notyet widely known, although EU imports have increased,especially of dining and living room furniture from India.Vietnam has increased exports of wooden seats,cupboards and living and dining room furniture and isincreasingly recognised as an interesting new supplier offurniture. Other growing Asian suppliers to the EU areMyanmar, Pakistan and Iran.
Latin AmericaBrazil and Mexico are leading suppliers from LatinAmerica, especially for bedroom, dining and living roomfurniture. Exports of Latin American countries are moreoriented to the USA. Argentina, Chile Bolivia, Guyanaand Honduras are sizeable exporters of other woodenfurniture and parts to the EU. Small-medium supplyingcountries to the EU are Costa Rica, Colombia, Peru,Ecuador and Uruguay.
Exports from Argentina more than trebled between 1998and 2000, catching up after a period of falling exports inthe late 1990s, although prices are expected to fall due tofurther weakening of the peso. Some Latin Americancountries have furniture associations, but other countrieshave no or poorly organised wood associations. Coherentpolicies and a good co-operation between all partiesinvolved in furniture industry are lacking. In addition,technical problems and the higher prices of furniturefrom Latin American countries may be constraints tofurther development in exports to the EU.
Africa, Mediterreanean and Middle EastSouth Africa, Ghana, Zimbabwe and Swaziland areconsiderable furniture suppliers to the EU, although EUimports declined in most countries in the period underreview. Turkey, Tunisia, Morocco and Egypt are sizeablesuppliers of parts and (metal) furniture and can benefitfrom being close to the EU.
46
Nonetheless, most of the African countries do not have alarge production capacity, lack the level of technology orcannot guarantee a constant delivery. The few countrieswith a furniture industry mainly produce for the homemarket or for neighbour countries. Most exporters haveshifted their attention towards the South African market.Zimbabwe and Ghana have furniture associations but,like in Latin America, the wood associations are poorlyorganised.
Nevertheless, there are opportunities for exporters fromdeveloping countries to increase their supplies to theEU, which could be of finished, semi-finished furnitureor parts. Starting in the 1990s, developing countrieshave steadily increased their exports of parts toindustrialised countries. Now the product group partsrepresents the largest category within the DC suppliesto the EU (see table 5.8).
The tendency among importers is to look for newerdeveloping countries like Tunisia, Ghana, Morocco,Pakistan, Honduras or other sources in South Americaor Africa, where production costs are lower. With theincreasing specialisation of the fragmented EU market,manufacturers have a growing interest in a co-operationwith others.
In addition, manufacturers and large retailers areconstantly looking for different types of living orbedroom furniture from new countries with newdesigns, often contemporary, but still with a link to theculture of the supplying country, which makes it differfrom the usual contemporary furniture.
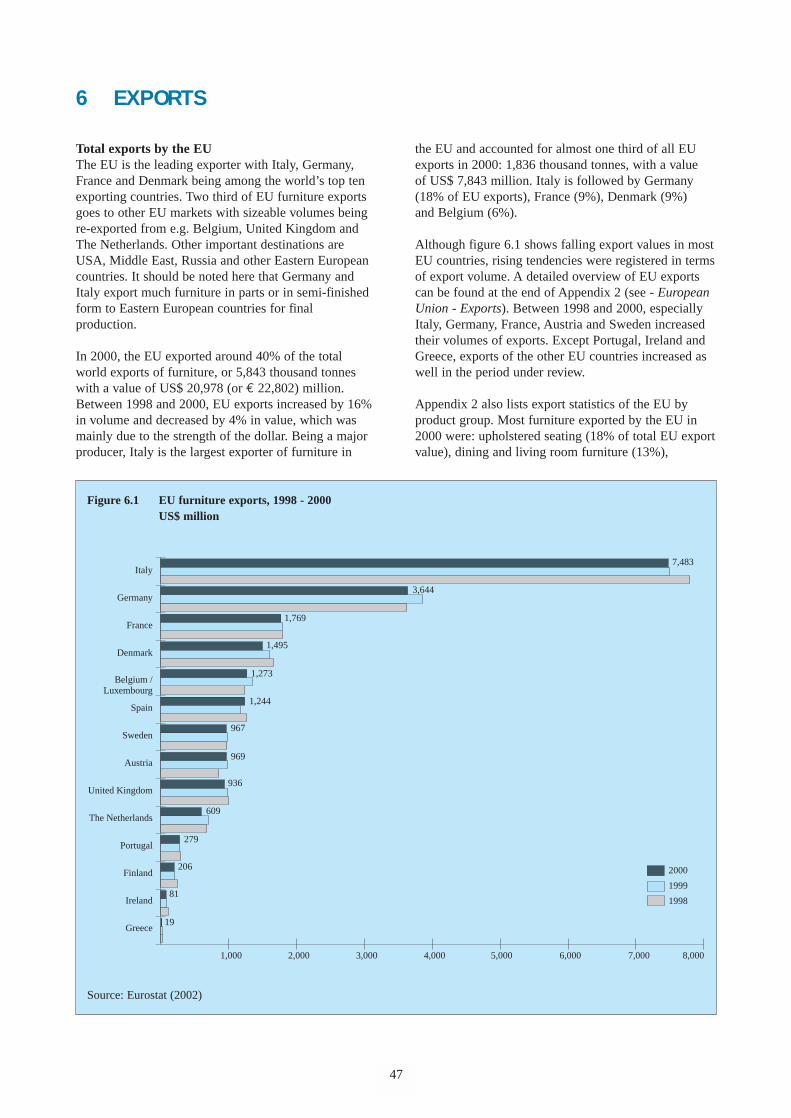
6 EXPORTS
Total exports by the EUThe EU is the leading exporter with Italy, Germany,France and Denmark being among the world’s top tenexporting countries. Two third of EU furniture exportsgoes to other EU markets with sizeable volumes beingre-exported from e.g. Belgium, United Kingdom andThe Netherlands. Other important destinations areUSA, Middle East, Russia and other Eastern Europeancountries. It should be noted here that Germany andItaly export much furniture in parts or in semi-finishedform to Eastern European countries for finalproduction.
In 2000, the EU exported around 40% of the totalworld exports of furniture, or 5,843 thousand tonneswith a value of US$ 20,978 (or € 22,802) million. Between 1998 and 2000, EU exports increased by 16%in volume and decreased by 4% in value, which wasmainly due to the strength of the dollar. Being a majorproducer, Italy is the largest exporter of furniture in
the EU and accounted for almost one third of all EUexports in 2000: 1,836 thousand tonnes, with a valueof US$ 7,843 million. Italy is followed by Germany(18% of EU exports), France (9%), Denmark (9%)and Belgium (6%).
Although figure 6.1 shows falling export values in mostEU countries, rising tendencies were registered in termsof export volume. A detailed overview of EU exportscan be found at the end of Appendix 2 (see - EuropeanUnion - Exports). Between 1998 and 2000, especiallyItaly, Germany, France, Austria and Sweden increasedtheir volumes of exports. Except Portugal, Ireland andGreece, exports of the other EU countries increased aswell in the period under review.
Appendix 2 also lists export statistics of the EU byproduct group. Most furniture exported by the EU in2000 were: upholstered seating (18% of total EU exportvalue), dining and living room furniture (13%),
47
Italy
Germany
France
Denmark
Belgium /Luxembourg
Spain
Sweden
Austria
United Kingdom
The Netherlands
Portugal
Finland
Ireland
Greece
2000
1999
1998
3,644
1,769
1,495
1,273
1,244
967
969
936
609
279
206
81
19
7,483
2,0001,000 3,000 4,000 5,000 6,000 7,000 8,000
Figure 6.1 EU furniture exports, 1998 - 2000US$ million
Source: Eurostat (2002)
bedroom furniture (9%), non-upholstered seating (7%)and kitchen furniture (7%). Other furniture and partsform around 20% each.
In 2000, around 64% of total EU exports went to otherEU countries. Major destinations for EU exports withinthe EU were Germany, which accounted for 17% ofEU exports, France (10%), United Kingdom (8%),Netherlands (7%), Belgium (5%), Austria (4%),Spain (3%), Sweden (2%) and Italy (2%). Non-EUdestinations were: USA (10%), Switzerland (5%),Russia (2%), Norway (2%) and Japan (1%).
In terms of volume, exports to most other EU countriesincreased between 1998 and 2000. Though EU exportsto destinations outside the EU (Russia, Asian countries)stagnated, which were affected by the recession.Stronger exports to Eastern Europe and the USAcompensated declining exports, especially those toAsian countries.
Exports by the selected markets within the EU
Italy
Italy, the largest EU producer, controlled a 36% shareof all furniture and exported from the EU, in 2000,a volume of 1,836 thousand tonnes, valued atUS$ 7,483 million. The most important product groupwas upholstered seating, which accounted for 31% oftotal exports. Other large export products were otherfurniture (19%), parts (16%), dining and living roomfurniture (12%), non-upholstered seating (10%),bedroom furniture (7%) and kitchen furniture (5%).
In terms of volume, Italian exports were higher in 2000than 1998 due to more exports of upholstered seating,dining and living room furniture and non-upholsteredseating. In 2000, other EU markets imported 59% ofItalian furniture, while the USA, Russia, Switzerland,Japan, Israel, Saudi Arabia, Turkey, Australia,Hong Kong and other Asian markets were also majorcustomers.
Germany
Germany is the second largest exporter of furniture in theEU and exported furniture valued at US$ 3,644 millionin 2000, which represented 18% of total EU exports.Between 1998 and 2000, German exports increased by16% in volume terms. Parts accounted for 31% of thefurniture exported by Germany, followed by kitchenfurniture (20%), other furniture (16%), upholsteredseating (12%), bedroom furniture (9%), dining and livingroom furniture (8%) and non-upholstered seating (4%).
48
Other EU markets imported 67% of German exports,while 33% went to non-EU markets, of whichSwitzerland, Russia, other Eastern European countries,USA and Japan were significant customers in 2000.
France
France is the third largest exporter of furniture,exporting a value of US$ 1,769 million, or 8% of totalEU exports in 2000. Exports by France increased by18% in volume terms in the period under review,from 408 to 482 thousand tonnes in 2000. Parts accounted for 24% of this total, followed by otherfurniture (23%), dining and living room furniture (15%),upholstered seating (11%), bedroom furniture (9%),non-upholstered seating (11%) and kitchen furniture (7%).
In 2000, around 66% of France’s total exports went toother EU countries, while Switzerland, USA, Russia,Japan and Saudi Arabia were the major non-EUdestinations.
Spain
Spain is a sizeable EU exporter of furniture andexported furniture with a value of US$ 1,244 millionin 2000, or 6% of total EU exports. Between 1998 and2000, Spanish exports increased by 9% (from 334 to365 thousand tonnes), which was due mainly toincreased exports of bedroom furniture and kitchenfurniture. Other furniture accounted for around 23% oftotal Spanish exports, followed by parts (17%), diningand living room furniture (16%), upholstered seating(12%) and bedroom furniture (12%).
In 2000, other EU markets imported 68% with Francebeing still the main market (25% of Spanish exports),followed by Portugal and Germany. Exports to non-EUdestinations declined because of a continued weakdemand in Asian markets and a slump in the Russianmarket.
United Kingdom
In 2000, the United Kingdom exported 272 thousandtonnes of furniture with a total value of US$ 936 million,or 5% of total EU exports. Between 1998 and 2000,UK exports increased by 32% in volume terms, while thevalue declined by 7%, which partly can be attributed tothe strength of the Pound Sterling, which makes exportsrelatively expensive for other countries.
Of total UK exports (by value), other furnitureaccounted for 39%, followed by parts (21%), diningand living room furniture (14%), upholstered seating(11%) and kitchen furniture (6%). In 2000, around 58%of exports went to other EU countries, with anestimated 15% being re-exported. The remaining 42%of British furniture mainly went to USA, Japan, SaudiArabia, Canada, Australia and Asian countries.
The Netherlands
The Netherlands exported a total volume of 175 thousandtonnes of furniture valued at US$ 609 million in 2000.The Dutch furniture sector comprises many smallmanufacturers with many of them having clientsabroad, mainly in Germany, Belgium, United Kingdomand France.
Between 1998 and 2000, Dutch exports decreased by8% in value, due to less exports of non-upholsteredseating and other furniture. In 2000, other furnitureaccounted for 27% of total Dutch exports, followedby dining and living room furniture (20%),non-upholstered seating (15%), upholstered seating(14%) and parts (11%). The greater part of theseexports (84%) went to other EU markets, whereasnew export markets such as Eastern Europe and theMiddle East are gradually gaining in importance.
An overview of total EU exports and EU exports byproduct group is given at the end of Appendix 2.
49
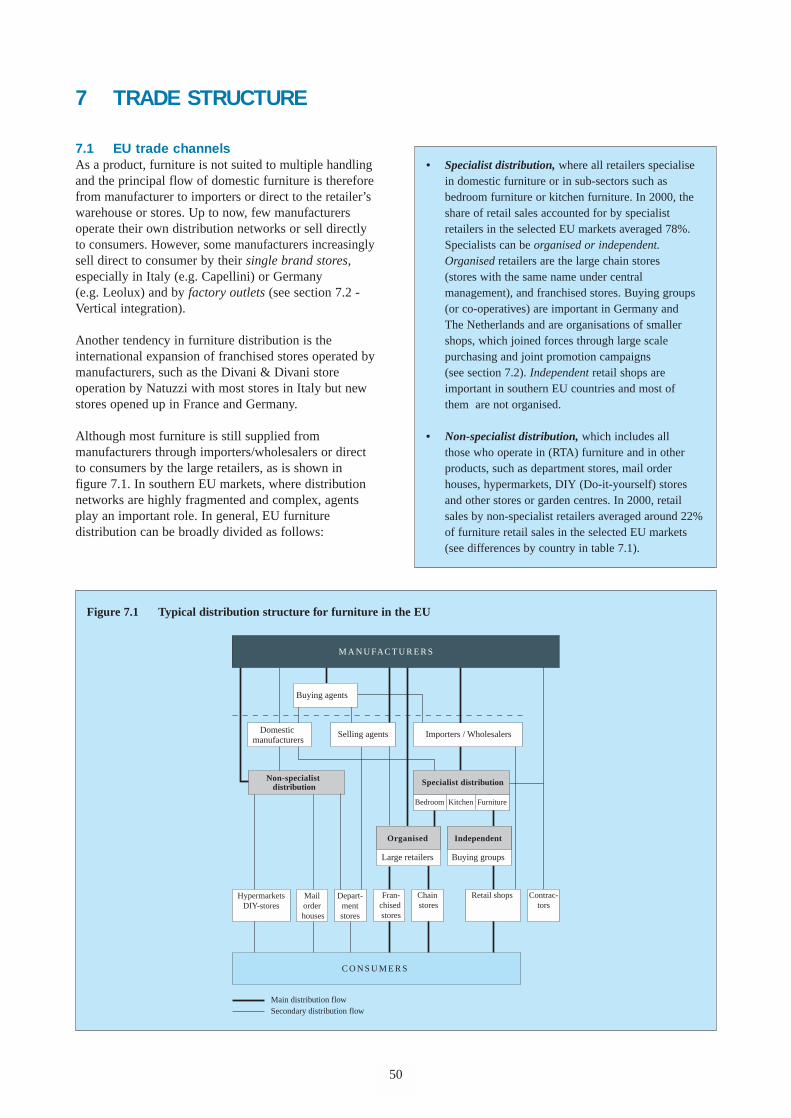
7 TRADE STRUCTURE
7.1 EU trade channelsAs a product, furniture is not suited to multiple handlingand the principal flow of domestic furniture is thereforefrom manufacturer to importers or direct to the retailer’swarehouse or stores. Up to now, few manufacturersoperate their own distribution networks or sell directlyto consumers. However, some manufacturers increasinglysell direct to consumer by their single brand stores,especially in Italy (e.g. Capellini) or Germany (e.g. Leolux) and by factory outlets (see section 7.2 -Vertical integration).
Another tendency in furniture distribution is theinternational expansion of franchised stores operated bymanufacturers, such as the Divani & Divani storeoperation by Natuzzi with most stores in Italy but newstores opened up in France and Germany.
Although most furniture is still supplied frommanufacturers through importers/wholesalers or directto consumers by the large retailers, as is shown infigure 7.1. In southern EU markets, where distributionnetworks are highly fragmented and complex, agentsplay an important role. In general, EU furnituredistribution can be broadly divided as follows:
50
Independent
Buying groups
Organised
Large retailers
Mail order houses
Depart-mentstores
Fran-chised stores
Chain stores
Contrac-tors
Non-specialist distribution
C O N S U M E R S
Selling agents
M A N U FAC T U R E R S
HypermarketsDIY-stores
Specialist distribution
Importers / WholesalersDomestic manufacturers
Retail shops
Bedroom Kitchen Furniture
Main distribution flowSecondary distribution flow
Buying agents
Figure 7.1 Typical distribution structure for furniture in the EU
• Specialist distribution, where all retailers specialisein domestic furniture or in sub-sectors such asbedroom furniture or kitchen furniture. In 2000, theshare of retail sales accounted for by specialistretailers in the selected EU markets averaged 78%.Specialists can be organised or independent.Organised retailers are the large chain stores (stores with the same name under centralmanagement), and franchised stores. Buying groups(or co-operatives) are important in Germany andThe Netherlands and are organisations of smallershops, which joined forces through large scalepurchasing and joint promotion campaigns(see section 7.2). Independent retail shops areimportant in southern EU countries and most ofthem are not organised.
• Non-specialist distribution, which includes allthose who operate in (RTA) furniture and in otherproducts, such as department stores, mail orderhouses, hypermarkets, DIY (Do-it-yourself) storesand other stores or garden centres. In 2000, retailsales by non-specialist retailers averaged around 22%of furniture retail sales in the selected EU markets(see differences by country in table 7.1).
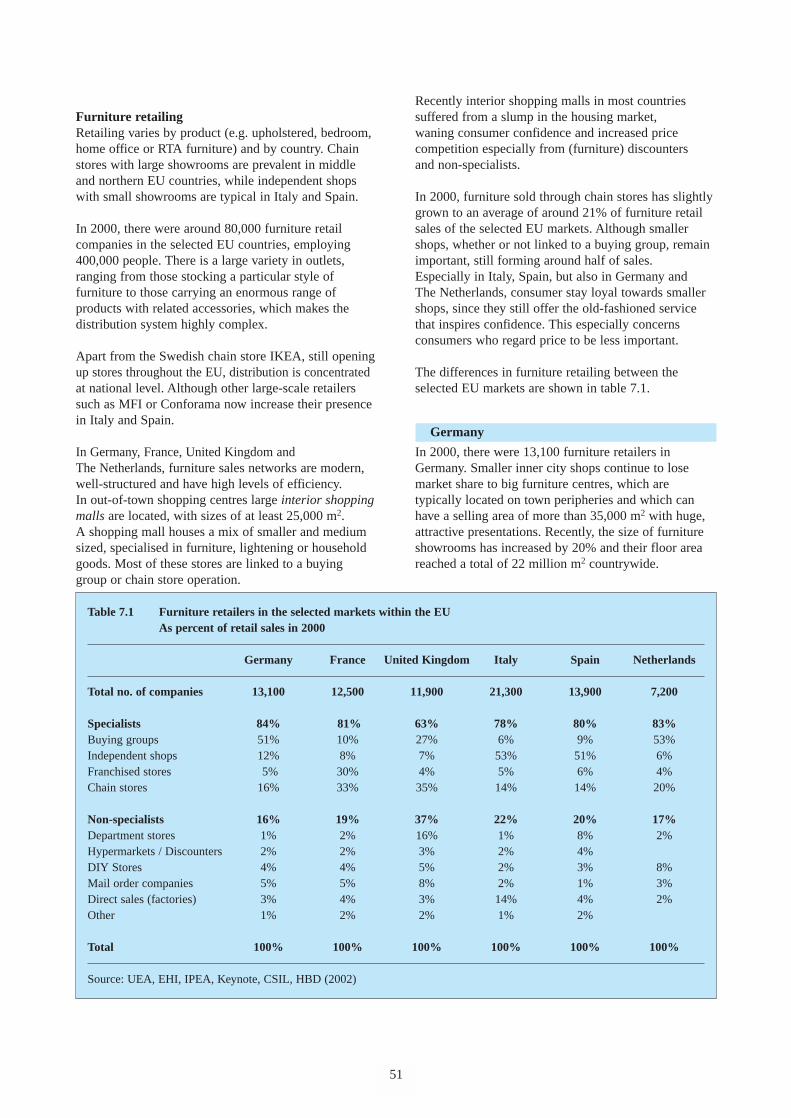
Furniture retailingRetailing varies by product (e.g. upholstered, bedroom,home office or RTA furniture) and by country. Chainstores with large showrooms are prevalent in middleand northern EU countries, while independent shopswith small showrooms are typical in Italy and Spain.
In 2000, there were around 80,000 furniture retailcompanies in the selected EU countries, employing400,000 people. There is a large variety in outlets,ranging from those stocking a particular style offurniture to those carrying an enormous range ofproducts with related accessories, which makes thedistribution system highly complex.
Apart from the Swedish chain store IKEA, still openingup stores throughout the EU, distribution is concentratedat national level. Although other large-scale retailerssuch as MFI or Conforama now increase their presencein Italy and Spain.
In Germany, France, United Kingdom and The Netherlands, furniture sales networks are modern,well-structured and have high levels of efficiency.In out-of-town shopping centres large interior shoppingmalls are located, with sizes of at least 25,000 m2.A shopping mall houses a mix of smaller and mediumsized, specialised in furniture, lightening or householdgoods. Most of these stores are linked to a buyinggroup or chain store operation.
51
Recently interior shopping malls in most countriessuffered from a slump in the housing market,waning consumer confidence and increased pricecompetition especially from (furniture) discountersand non-specialists.
In 2000, furniture sold through chain stores has slightlygrown to an average of around 21% of furniture retailsales of the selected EU markets. Although smallershops, whether or not linked to a buying group, remainimportant, still forming around half of sales.Especially in Italy, Spain, but also in Germany andThe Netherlands, consumer stay loyal towards smallershops, since they still offer the old-fashioned servicethat inspires confidence. This especially concernsconsumers who regard price to be less important.
The differences in furniture retailing between theselected EU markets are shown in table 7.1.
Germany
In 2000, there were 13,100 furniture retailers inGermany. Smaller inner city shops continue to losemarket share to big furniture centres, which aretypically located on town peripheries and which canhave a selling area of more than 35,000 m2 with huge,attractive presentations. Recently, the size of furnitureshowrooms has increased by 20% and their floor areareached a total of 22 million m2 countrywide.
Table 7.1 Furniture retailers in the selected markets within the EUAs percent of retail sales in 2000
Germany France United Kingdom Italy Spain Netherlands
Total no. of companies 13,100 12,500 11,900 21,300 13,900 7,200
Specialists 84% 81% 63% 78% 80% 83%Buying groups 51% 10% 27% 6% 9% 53%Independent shops 12% 8% 7% 53% 51% 6%Franchised stores 5% 30% 4% 5% 6% 4%Chain stores 16% 33% 35% 14% 14% 20%
Non-specialists 16% 19% 37% 22% 20% 17%Department stores 1% 2% 16% 1% 8% 2%Hypermarkets / Discounters 2% 2% 3% 2% 4%DIY Stores 4% 4% 5% 2% 3% 8%Mail order companies 5% 5% 8% 2% 1% 3%Direct sales (factories) 3% 4% 3% 14% 4% 2%Other 1% 2% 2% 1% 2%
Total 100% 100% 100% 100% 100% 100%
Source: UEA, EHI, IPEA, Keynote, CSIL, HBD (2002)
Large chain stores have become popular and thefurniture retail sector has become more concentrated.
Most of the large retailers are connected to the 15buying groups, of which Begros (150 outlets), Atlas(100 outlets), Union (167 outlets), VME, Garant,DMV and Europa Möbel are the largest. German buyinggroups were responsible for 51% of German furnitureretail sales in 2000. Chain stores are also wellrepresented in Germany with leading chain stores suchas IKEA (25 outlets), Porta Möbel (18 outlets),Möbel Walter (30 outlets), Roller Discount (68 outlets)and Segmüller (10 outlets).
The shift towards larger retail outlets has meant thatretailers are stocking a much wider product range inorder to develop a clear, distinctive image. It has alsoled to the arrangement of products by theme or style,such as “Neues Wohnen” (modern living) or “Ländlich-Mediterreanean” (country style with southern EUinfluences), rather than old-fashioned departments forbeds and upholstered furniture. At the other end of themarket, price competition has intensified with the growthof furniture discounters (e.g. Roller Discount and PocoEinrichtungsmarkt) and factory outlets (Bierstorfer).
Non-specialists in Germany accounted for 16% ofGerman retail sales (see table 7.1) in 2000. DIY storesand hypermarkets are increasing market share,especially in lower priced (RTA) furniture, and theytogether accounted for 6% of the market. The large German mail order houses such as Quelle(operated by Karstadt) or Otto Versand offer morevariety in furniture, although they have suffered fromthe growing on-line operations by furniture chainstores. Direct sales by manufacturers accounted forabout 3% of the market.
France
In France, furniture was sold by 12,500 retailers witha total selling space of 9 million m2 in 2000.Furniture specialists account for 81% of furniture sales,of which 30% are made by “multi-spécialist” franchisingcompanies such as But (owned by Kingfisher),Conforama (owned by PPR i.e. Pineault-Printemps-Redoute) and Cuir Center. Most of these stores arelarge (sized 1,500 m2 or more) and sell furniture incombination with consumer electronics and householdappliances.
There is a move among French people towards shoppingin chain stores such as IKEA, Maxiam or L’Ameublier,the majority of whom are people over 25 years old.In 2000, chain stores accounted for one third of Frenchfurniture sales. Trendy chains e.g. Fly, Docks du Meubleor Habitat, which are targeting younger consumers(“Jeune Habitat”) remain popular.
52
France also has a number of buying groups (co-operatives), which only accounted for 10% of retailsales, with Monsieur Meuble, Atlas and Mobiclub beingthe main specialists groups. Compared to other selectedEU countries, the share of buying groups is low inFrance. As in Germany, small independent shops intown centres have slowly lost market share to largeroutlets on the outskirts of towns and cities.
Within the non-specialist retailers, DIY stores havegained ground, although few female consumers visitthese stores. In France, women are the main purchasersof furniture. In 2000, mail order sales accounted for 5% of the furniture market, with the companiesLa Redoute, Trois Suisses and Camif being the dominantsuppliers. Camif operates their own high street furnitureformat, called Les Maisonnables with 3 outlets in Paris,Lyon and Lille. Due to growing on-line sales by thefranchised and chain stores, mail order lost marketshare in the past few years.
United Kingdom
In 2000, the United Kingdom had 11,900 retailerswith furniture specialists holding a lower share (64% of furniture sales - see table 7.1) as the otherselected EU countries. The role of independent shopsin UK furniture retailing became less, because of fiercecompetition from big multiple (or chain) stores andnon-specialists such as department stores, hypermarkets,discounters and DIY stores.
Leading furniture multiples were MFI, IKEA, DFS,Harveys, Magnet, Courts, Limelight, Furniture Village,Habitat and Furnitureland, often located at the out-of-town shopping centres. The leading furniture multiple,MFI was the first in offering RTA furniture to youngand price conscious consumers. By the end of the 1990sthey lost market share to IKEA, which offered morechoice and a higher quality of RTA furniture. In 2001,MFI formed a joint venture with the US furnituremanufacturer/retailer Ethan Allan. There is still anongoing tendency towards mergers and acquisitionsbetween the large companies in order to face the growingcompetition from non-specialists in UK furniture retailing.
Non-specialised outlets accounted for 37% of UK retailfurniture sales in 2000, which is significant. Departmentstores (e.g. John Lewis, Debenhams and Allders) aremore important than in most other EU markets, with ashare 16% of total sales. Argos is one of the leaders inthe field of bedroom furniture being competitive byoffering short delivery times. In addition, departmentstores, more associated with clothing, such asMarks and Spencer, started to offer a limited rangeof furniture. Also clothing chains e.g. Laura Ashleyand Next increasingly sell branded or own labelled‘lifestyle furniture’ combined with fashionable
houseware and furniture accessories, most of which ison offer on-line as well. Furniture sales by DIY stores(e.g. B&Q, Homebase, Wickes) and mail ordercompanies remains high, especially in the low-end andRTA markets. Recently DIY stores offer installationservices for furniture, which have been successful sofar, especially for “busy people”.
Italy
The EU country with the most furniture retailers wasItaly, which had more than 21,300 outlets with a totalselling area of 8 million m2, or 362 m2 per outlet. In2000, independent shops still held a market share ofabout 53%. Most furniture is made to order, whichallows consumers to choose exactly what they want,colour and texture wise. Although recently moreindependent shops are forced to join buying groups orfranchise organisations in order to comply with thegrowing power of the large furniture chains.
Divani & Divani is a leading chain, especially forupholstered furniture, which is franchised by Natuzzi.Other important Italian specialist chains includeMercato Uno (68 outlets), Mercatone Zeta (Metro),Semeraro (48 outlets), Emezeta (owned by the FrenchPPR), Bergamin, Eurocasa, Aiazzone and Casa Italiawith most of these stores also handling lightening.
Recently, bigger concentrations and the influence offoreign multiples, such as IKEA, Conforma groupand Europa Möbel, change the structure of the tradeand the consumer attitude. Up to now, Italian peoplehad a slight aversion at walking out of the stores withan (RTA) product, which they regarded as “cheapstyle”. But nowadays there is a growing interest incontemporary style furniture and IKEA opened up18 stores in whole country with success so far. On the other hand, the more fashionable and expensivechain Habitat was forced to close down all its 10 storesin Italy in 1999, due to a lack of interest by Italianconsumers.
In 2000, there were about 810 furniture chain stores,which together controlled about 14% of the Italianfurniture market. The remaining 22% of furniture salesare carried by non-specialists (e.g. hypermarkets, DIYstores and mail order houses etc.) and mainly directsales from factories.
Spain
Retail distribution of furniture in Spain is dominated bysmall independent shops, which are supplied directlyby local manufacturers. In 2000, there were an estimated13,900 retailers, 80% of which were smaller than250 m2. There is little specialisation by furniture styleand many stores offer a wide variety of items.
53
On the other hand, the number of furniture chains andfranchised stores is increasing, which is at the expenseof smaller independent shops. For example, IKEAopened up its first store in Spain in 1996 and nowachieved a leading position in Spain with only 7 stores,but each of these stores has a floorspace of over22,000 m2. This is four times the size of other leadinglarge Spanish furniture chain store, such asMerkamueble (28 outlets) or Galerias Tarragona(65 outlets). Other sizeable chains are the Frenchowned e.g. Conforama (13 outlets), Fly, Roche Boboisor Spanish chains e.g. Moblerone (franchised by theAlicante group), Espejo Hermanos and Artimueble(discount).
In 2000, 51% of Spanish furniture sales were achievedby independent shops and 9% by the buying groups, ofwhich Acem and Intermovil were the largest.
With regards to non-specialists, hypermarkets anddepartment stores together represent 12% of sales,with El Corte Inglés alone accounting for 4%. The number of (French) DIY stores increases in Spain,all of which offer a wide range of RTA furniture. As is shown in table 7.1, the share of DIY stores wasaround 3% in 2000. Direct sales by furniture factoriesremains important and took a further 6%. The Spanish furniture trade tends to be more splintered,compared to other EU markets with wholesalersoperating more on a regional than on a national basis.
The Netherlands
Similar to most other selected EU countries, specialisedoutlets dominate furniture retailing in The Netherlandsand accounted for 83% of the total market.
In 2000 there were around 7,200 furniture specialistsand about 2,000 stores selling a combination offurniture and furnishings. Most stores are small (400 -1,000 m2) with the majority being linked to anorganisation. As in Germany, retailers who areconnected to a buying group accounted for more thanhalf of Dutch retail sales. The two main buying groupsare: Euretco (388 outlets), Intres (362 outlets) andMacintosch (214 outlets, among which furnishingchains: Kwantum, Piet Klerkx and Stoutenbeek).
The trend for retailers to merge into larger groups iscontinuing, with more big foreign retail chains,selling on large floor space in interior shopping malls(e.g. Alexandrium in Rotterdam or Villa Arena inAmsterdam). Although, the popularity of interiorshopping malls (known in The Netherlands as“woonboulevards”) declined. According to the CBW(Dutch Central Bureau for Living), shopping mallsattracted many recreational consumers, looking for thelatest ideas and trends in furniture.
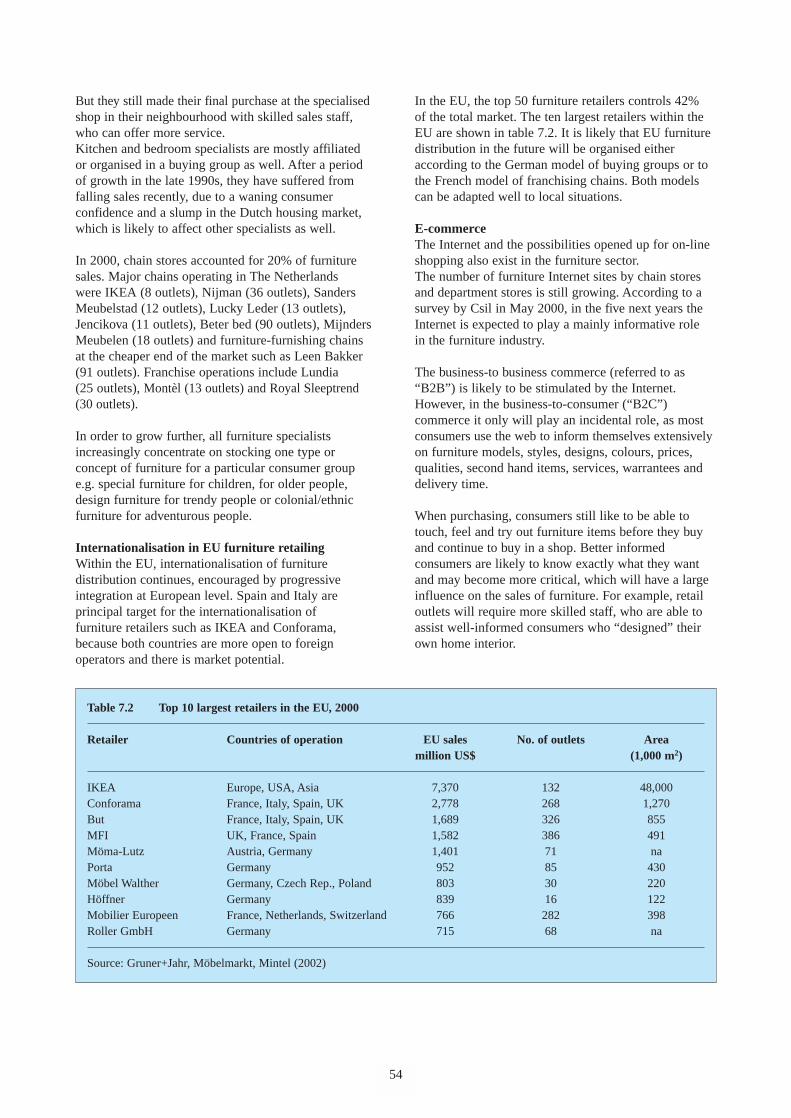
But they still made their final purchase at the specialisedshop in their neighbourhood with skilled sales staff,who can offer more service.Kitchen and bedroom specialists are mostly affiliatedor organised in a buying group as well. After a periodof growth in the late 1990s, they have suffered fromfalling sales recently, due to a waning consumerconfidence and a slump in the Dutch housing market,which is likely to affect other specialists as well.
In 2000, chain stores accounted for 20% of furnituresales. Major chains operating in The Netherlandswere IKEA (8 outlets), Nijman (36 outlets), SandersMeubelstad (12 outlets), Lucky Leder (13 outlets),Jencikova (11 outlets), Beter bed (90 outlets), MijndersMeubelen (18 outlets) and furniture-furnishing chainsat the cheaper end of the market such as Leen Bakker(91 outlets). Franchise operations include Lundia(25 outlets), Montèl (13 outlets) and Royal Sleeptrend(30 outlets).
In order to grow further, all furniture specialistsincreasingly concentrate on stocking one type orconcept of furniture for a particular consumer groupe.g. special furniture for children, for older people,design furniture for trendy people or colonial/ethnicfurniture for adventurous people.
Internationalisation in EU furniture retailing Within the EU, internationalisation of furnituredistribution continues, encouraged by progressiveintegration at European level. Spain and Italy areprincipal target for the internationalisation offurniture retailers such as IKEA and Conforama,because both countries are more open to foreignoperators and there is market potential.
54
In the EU, the top 50 furniture retailers controls 42%of the total market. The ten largest retailers within theEU are shown in table 7.2. It is likely that EU furnituredistribution in the future will be organised eitheraccording to the German model of buying groups or tothe French model of franchising chains. Both modelscan be adapted well to local situations.
E-commerceThe Internet and the possibilities opened up for on-lineshopping also exist in the furniture sector. The number of furniture Internet sites by chain storesand department stores is still growing. According to asurvey by Csil in May 2000, in the five next years theInternet is expected to play a mainly informative rolein the furniture industry.
The business-to business commerce (referred to as“B2B”) is likely to be stimulated by the Internet.However, in the business-to-consumer (“B2C”)commerce it only will play an incidental role, as mostconsumers use the web to inform themselves extensivelyon furniture models, styles, designs, colours, prices,qualities, second hand items, services, warrantees anddelivery time.
When purchasing, consumers still like to be able totouch, feel and try out furniture items before they buyand continue to buy in a shop. Better informedconsumers are likely to know exactly what they wantand may become more critical, which will have a largeinfluence on the sales of furniture. For example, retailoutlets will require more skilled staff, who are able toassist well-informed consumers who “designed” theirown home interior.
Table 7.2 Top 10 largest retailers in the EU, 2000
Retailer Countries of operation EU sales No. of outlets Area million US$ (1,000 m2)
IKEA Europe, USA, Asia 7,370 132 48,000Conforama France, Italy, Spain, UK 2,778 268 1,270But France, Italy, Spain, UK 1,689 326 855MFI UK, France, Spain 1,582 386 491Möma-Lutz Austria, Germany 1,401 71 naPorta Germany 952 85 430Möbel Walther Germany, Czech Rep., Poland 803 30 220Höffner Germany 839 16 122Mobilier Europeen France, Netherlands, Switzerland 766 282 398Roller GmbH Germany 715 68 na
Source: Gruner+Jahr, Möbelmarkt, Mintel (2002)
The American e-commerce company furniture.com hasan on-line choice of 50,000 furniture items.In the year 2003, it is estimated that Germany will have30 million Internet users, while France should have18 million users, Italy 10 million and Spain 8 million.Forecasts for 2003 of online home furniture sales arearound 2% of the total US furniture market and 0.5% ofthe EU market. These figures do not include the mailorder business, which gradually shifts into e-commerce.
7.2 Distribution channels for developingcountry exporters
For exporters in developing countries, the physicaldistribution of furniture is a problem. Therefore, it isrecommended to have a warehouse in an EU country.The following channels provide the safest and mosteffective method of distribution:
• ImportersBy buying at his own account the importer takes titleto the goods and is responsible for their further sale anddistribution in his country and/or in other EU markets.He is familiar with local markets and can supplyconsiderable information and guidance to the overseasmanufacturer in addition to the primary business ofbuying and selling, such as the administration of importand export procedures and holding of stock.The development of a successful working relationshipbetween manufacturer and importer can lead to a highlevel of co-operation with regard to appropriate designsfor the market, new trends, use of materials and qualityrequirements.
• Domestic manufacturersConfronted with rapidly rising production costs, whichhave rendered many manufacturers uncompetitive,(especially in labour-intensive production lines)manufacturers are increasingly assuming the role ofimporters. Like the importers they look for low-costsources, which produce furniture on a made-to-orderbasis, instead of purchasing ready-made articles.The main advantage is that these items can be madeaccording to their own design, quality and colourspecification.
• Buying agentsThese are independent companies which negotiate andsettle business on the instructions of their principals andwhich act as intermediaries between buyer and seller.They do not buy or sell on their own account and work
55
on a commission basis. Most agents represent morethan one manufacturer, although competition is avoided.Often the buying agent has his office in the supplyingcountry.
• Selling agentsThese are also independent companies, but they workon a contract basis for one or more manufacturers. They often sell from stock in order to meet their clients’short-term demand. They also work on commissionbasis. Stock is often formed on a consignment basis. If the selling agent builds up his own stock, he is in factfunctioning as an importer/wholesaler.
• Department stores, chain stores and discountersDepartment stores, large furniture chains and discountoutlets also buy furniture directly from foreign suppliers.This may involve intermediary activity by a sellingagent on behalf of the manufacturer or a buying agenton behalf of the (multiple) retailer. This method ofdoing business has become more popular since it cutsout several intermediaries, thus reducing costs andenabling the retailer to offer the product at a lower endprice. It is particularly significant when a fashion trend,such as the current huge popularity of rattan furniture,takes hold and there is fierce competition betweenretailers to offer lower and lower prices. Unfortunately,this method often results in the supply of huge volumesof poorer quality, cheaper merchandise, after which thedemand peaks and then falls off.
Large chains such as IKEA have their own purchasingstaff, buying from all over the world. In the country oforigin, most buyers prefer the lines between manufacturerand the source of raw material (e.g. rattan farmers) tobe as short as possible. In this case there is a bettercontrol over production and communication lines areshort, which reduces the risk of discrepancies betweenbuyers’ requirements and final product.
• Buying groups / Co-operativesCentral buying groups or co-operatives prefer tominimise the cost of middlemen by purchasing directlyfrom a supplier whenever possible. This channel isused particularly for large-scale requirements, wheredirect dealing with well-known suppliers is essential. These groups act as purchasing agents for theirindividual members (smaller retail shops) and act asfinancial intermediaries between producers andretailers. Sometimes they offer warehouse facilities totheir members. Other advantages for members includecredit card rates, provision of marketing intelligence,staff training and advice on legal and business issues.
The objective of the buying group is to make it possiblefor their members to compete with chain stores, whichhave the buying power necessary to get larger discountsfrom suppliers. Buying groups are tending to purchase
Other hurdles for furniture e-tailers to overcome are:
• To deliver the item in time in an efficient way and atlow costs.
• To establish a safe and ‘hacker-proof’ paymentsystem by credit card.
from fewer suppliers, with whom they aim to intensifytheir relationship and together promote increased salesin the market. This new trend is called “partnershipping” and originated in the USA.
Some recent issues in furniture retailing, which are ofrelevance to exporters are:
• Vertical integration by manufacturersIn this case manufacturers sell direct to consumers bytheir own stores, which removes the need for retailers.An example is, the single brand or flagship store (e.g.Leolux ‘design centres’, Ligne Roset, Sofa WorkshopDirect, Classic Choise), which sells the completefurniture range of one brand and is meant tocreate/improve the brand image. Most stores have adesign corner for tailor made furniture, based onconsumers’ needs, which nowadays are more specific.
Another example of vertical integration is the factoryoutlet, where manufacturers sell out of date furniture toconsumers at low prices. A factory outlet centre mainlysells clothing and other fast moving consumer durables.In 2000, there were 33 factory outlet centres in the UK,which is more developed in this respect than other EUcountries (e.g. 14 centres in France; 9 in Germany; 7 inSpain; 6 in Italy and 1 in The Netherlands).
• Store attractiveness and regular change byretailers
With the growing influence of fashion in furniture,furniture stores change their range more often (than 2-3 times/year), which gives the store an ongoing
56
innovative image. New furniture ranges can be combinedwith all sorts of accessories, creating a total interiorconcept. For exporters it is important to know thisconcept and he should try to make a link here whenintroducing his products, even at importer level.Nowadays, shop interiors appeal more to consumertarget groups and can range from classic, colonial tocontemporary to ultra-modern. In shop interiors,products are clearly and well laid out with some storesoffering a relax/lounge area and some inter-activity (e.g. computer aided design corners).
It is important to note that, by selecting one tradechannel, other channels are often automaticallyexcluded. One cannot have a relationship with adepartment or multiple chain store while at the sametime entering the market with the same line of productsthrough an importer/wholesaler. This is oftenunacceptable to trade partners and will definitely havean adverse effect on export operations. For the seriousdeveloping country exporter, the recommendedapproach is to aim at building up a long-term businessrelationship.
PromotionImporters, agents, retailers and other buyers travelextensively to international trade fairs to view newproducts, to decide upon suitable ranges for their marketand to keep up with the latest changes in interior design,furniture fashions, materials and colours. The SaloneInternazionale del Mobile in Milan (Italy) and theInternational Furniture Fair in Cologne (Germany) arethe most important furniture fairs in the EU.
The Salone Internazionale (Milan) is the leading fairin terms of trends, with around 173,000 visitors and 2,000 exhibitors. The International Furniture Fair (Imm - Cologne), with around 120,000 visitors and1,500 exhibitors is the leading fair in terms of size.
Other large fairs are the Salon du Meuble in Paris(France) and the Salon Internacional del Meuble inValencia (Spain). A list of the most important Europeanfurniture trade fairs can be found in the EU StrategicMarketing Guide “Domestic Furniture” (2000) section1.6. The addresses of all the trade fair organisers can befound in this survey in Appendix 6.
Traditionally the major trade fair for furniture inThe Netherlands has been the International FurnitureFair, held annually in September in Utrecht. Like inother EU markets, in The Netherlands a permanentexhibition centre, the Home Trade Center (HTC),located at Nieuwegein in the centre of The Netherlands,has become the main promotional platform for thedomestic furniture trade. Many manufacturers,importers and sales offices and agents for foreignsuppliers have showrooms in the centre.
Distribution channels for particular product groupsMass market and middle market furniture is mostlysold in unassembled or knock-down (KD) form. This isbecause of the high freight costs involved in transportingassembled furniture and because the major retail outletscan maximise retail space and turnover, thus ensuringhigh volume sales. Furniture imported in this way iseither be re-assembled by the importer for sale in retailoutlets as an assembled product or sold in flat-packs forassembly by the consumer.
Rattan furniture is usually handled by specialisedimporters of furniture, or is imported direct by retailersor central buying groups. The main retail outlets forrattan seats and furniture are all furniture specialist storesincluding rattan furniture specialists. It can also be foundin garden centres, department stores and at mail ordercompanies.
Office furniture manufacturers often sell their productsdirectly, either through franchises or through their ownagents. Roughly 40% of this segment is controlled bymanufacturers.
8 PRICES AND MARGINS
8.1 Prices and margins
PricesPrice is important in the furniture sector, but there issuch a broad range of items - qualities - materials - rawmaterials and styles that it is almost impossible to givetypical prices. Some rough price indications of diningand living room, bedroom, occasional and rattanfurniture are given in the EU Strategic Marketing Guide(2000), section 2.1 “Product profiles”.
Compared to the USA, consumer prices of furniturein EU countries are low. Price competition in the low- to middle-levels of the EU furniture market hasbecome very fierce recently.
So it is vital that new products from exporters ofdeveloping countries offer extra value. A new productcan be of interest to a buyer either because it is a specialproduct or novelty, or because it could appeal to aparticular consumer target group. In this case, the priceis of secondary importance.
The following other circumstances may also play animportant role in price decisions for exporters:• the exclusiveness of the product;• the existence/availability of competitive products;• the volume of business;
• the degree of risk (innovative design or fashion trendproduct, new or known source);
• the marketing services offered by different links inthe sales chain;
MarginsIn the price-competitive market, margin maintenance isvital along with cost controls. Especially for retailers itis important not to erode the margin when makingprice-based promotions. Successful retailers will havethe right balance between cost control, good retailmargins and good buying.
Margins at retail levelThe typical mark-up for retailers now averagesaround 80 to 90%. This includes value-added tax(VAT), which ranges from 16 to 21% on furniture,varying within the five selected EU markets.
57
The average retail prices for many low-to middle levelfurniture items have fallen because of:
h More availability of cheap imported (RTA) furniture,made of hardwood (e.g. teak).
h Large retailers, who benefit from larger economies ofscale and increased efficiency, are in position to exertmuch pressure on prices and margins in furnituretrade channels.
h A high degree of specialisation, which has resulted ina wide range of furniture items.
h More available items, coupled with an ongoingchange in interior fashion, which made consumersless prepared to pay high prices, as the lifespan of afurniture item has become shorter.
h After the economic recession from 2000 onwards,consumers have been more demanding and oftenexpect a discount. For loyal Italian or Spanishconsumer, a “special price” was already a typicalpractice. But in France, Germany (especially in theformer East) and The United Kingdom, price-basedpromotions by furniture retailers made consumers tryto barter in the shop, to get prices down.
New pricing and the Euro (€)
Despite the many fears, retailers in the selected EUcountries smoothly changed over to the Euro in January2002. Most people had mixed feelings to say farewell totheir national currency and had doubts, if the Euro couldmaintain its position against the US Dollar.
With regards to the new pricing of articles, consumerswere suspicious. Many retailers took the change over asan opportunity to include an annual price increase, aswell as their extra operational costs (e.g. dual pricing in2001, new cash registers, electronic pay machines) intonew prices. New psychological price points weredeterminated and new Euro prices were often rounded upto a nice figure.
In the coming years, the introduction of the Euro willshow the discrepancies in pricing between various EUcountries which undoubtfully will result in morecompetition in all product categories, with southerncountries lower in price.
The Euro will create more transparency and make iteasier for retailers to source products from EU countriesat the lowest possible price and without conversion costs.Differences in VAT, however, are still large, ranging from16% in Germany to over 22% in Scandinavian countries.
Also for furniture, there are still in divergences in priceswithin EU countries. According to the UEA, thedifference in consumer price in 2002 between thecheapest country (Greece) and the most expensivecountry (Sweden) was still around 40%..
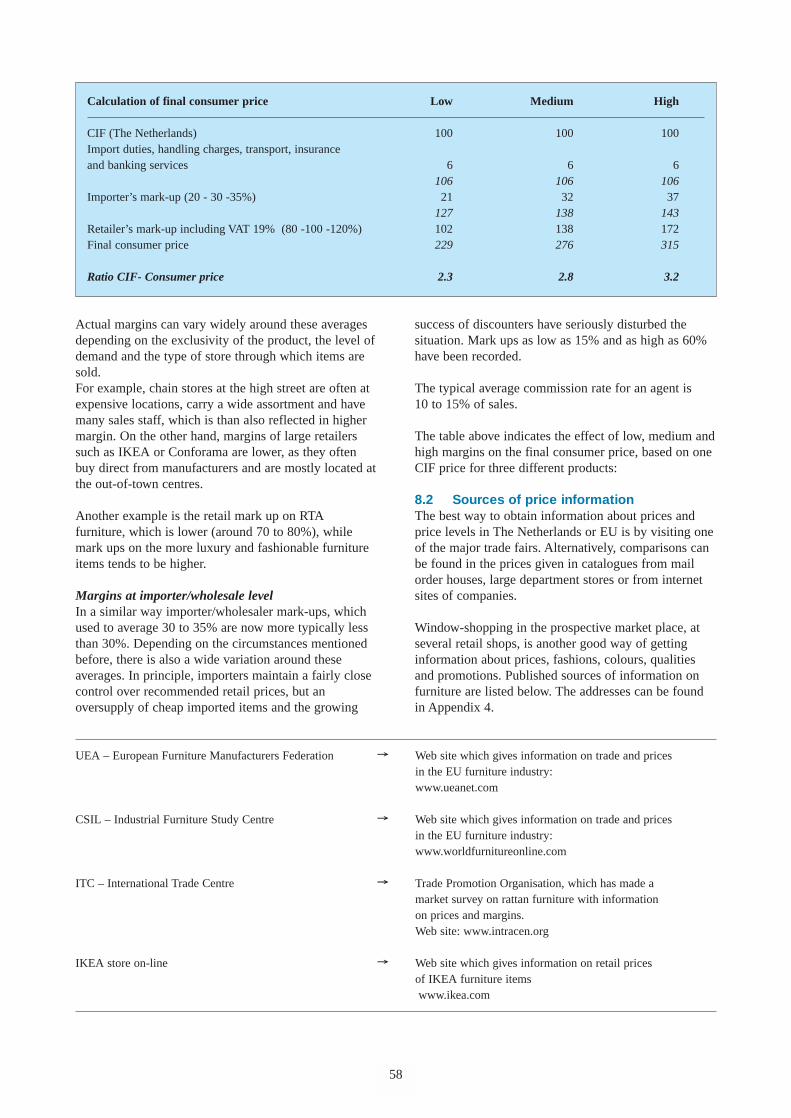
Actual margins can vary widely around these averagesdepending on the exclusivity of the product, the level ofdemand and the type of store through which items aresold.For example, chain stores at the high street are often atexpensive locations, carry a wide assortment and havemany sales staff, which is than also reflected in highermargin. On the other hand, margins of large retailerssuch as IKEA or Conforama are lower, as they oftenbuy direct from manufacturers and are mostly located atthe out-of-town centres.
Another example is the retail mark up on RTAfurniture, which is lower (around 70 to 80%), whilemark ups on the more luxury and fashionable furnitureitems tends to be higher.
Margins at importer/wholesale levelIn a similar way importer/wholesaler mark-ups, whichused to average 30 to 35% are now more typically lessthan 30%. Depending on the circumstances mentionedbefore, there is also a wide variation around theseaverages. In principle, importers maintain a fairly closecontrol over recommended retail prices, but anoversupply of cheap imported items and the growing
58
success of discounters have seriously disturbed thesituation. Mark ups as low as 15% and as high as 60%have been recorded.
The typical average commission rate for an agent is10 to 15% of sales.
The table above indicates the effect of low, medium andhigh margins on the final consumer price, based on oneCIF price for three different products:
8.2 Sources of price informationThe best way to obtain information about prices andprice levels in The Netherlands or EU is by visiting oneof the major trade fairs. Alternatively, comparisons canbe found in the prices given in catalogues from mailorder houses, large department stores or from internetsites of companies.
Window-shopping in the prospective market place, atseveral retail shops, is another good way of gettinginformation about prices, fashions, colours, qualitiesand promotions. Published sources of information onfurniture are listed below. The addresses can be foundin Appendix 4.
Calculation of final consumer price Low Medium High
CIF (The Netherlands) 100 100 100Import duties, handling charges, transport, insurance and banking services 6 6 6
106 106 106Importer’s mark-up (20 - 30 -35%) 21 32 37
127 138 143Retailer’s mark-up including VAT 19% (80 -100 -120%) 102 138 172Final consumer price 229 276 315
Ratio CIF- Consumer price 2.3 2.8 3.2
UEA – European Furniture Manufacturers Federation h Web site which gives information on trade and prices in the EU furniture industry:www.ueanet.com
CSIL – Industrial Furniture Study Centre h Web site which gives information on trade and prices in the EU furniture industry:www.worldfurnitureonline.com
ITC – International Trade Centre h Trade Promotion Organisation, which has made a market survey on rattan furniture with information on prices and margins.Web site: www.intracen.org
IKEA store on-line h Web site which gives information on retail pricesof IKEA furniture itemswww.ikea.com
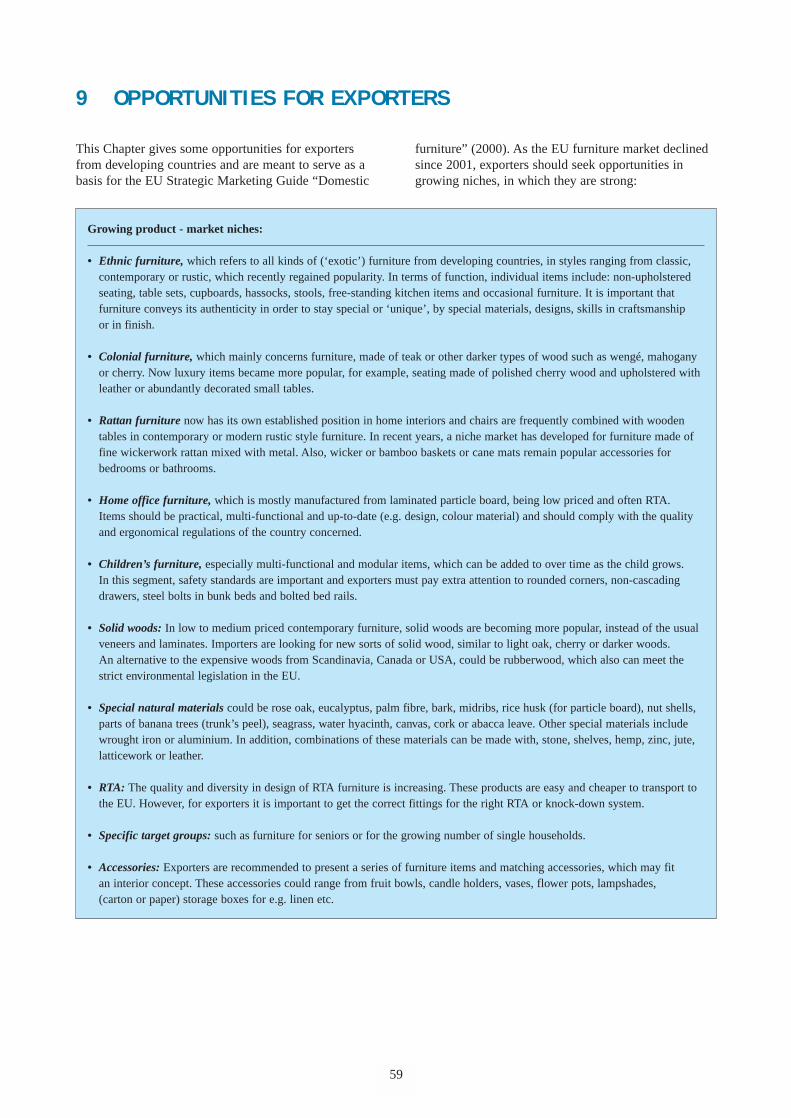
59
9 OPPORTUNITIES FOR EXPORTERS
This Chapter gives some opportunities for exportersfrom developing countries and are meant to serve as abasis for the EU Strategic Marketing Guide “Domestic
Growing product - market niches:
• Ethnic furniture, which refers to all kinds of (‘exotic’) furniture from developing countries, in styles ranging from classic,contemporary or rustic, which recently regained popularity. In terms of function, individual items include: non-upholsteredseating, table sets, cupboards, hassocks, stools, free-standing kitchen items and occasional furniture. It is important thatfurniture conveys its authenticity in order to stay special or ‘unique’, by special materials, designs, skills in craftsmanshipor in finish.
• Colonial furniture, which mainly concerns furniture, made of teak or other darker types of wood such as wengé, mahoganyor cherry. Now luxury items became more popular, for example, seating made of polished cherry wood and upholstered withleather or abundantly decorated small tables.
• Rattan furniture now has its own established position in home interiors and chairs are frequently combined with woodentables in contemporary or modern rustic style furniture. In recent years, a niche market has developed for furniture made offine wickerwork rattan mixed with metal. Also, wicker or bamboo baskets or cane mats remain popular accessories forbedrooms or bathrooms.
• Home office furniture, which is mostly manufactured from laminated particle board, being low priced and often RTA. Items should be practical, multi-functional and up-to-date (e.g. design, colour material) and should comply with the qualityand ergonomical regulations of the country concerned.
• Children’s furniture, especially multi-functional and modular items, which can be added to over time as the child grows. In this segment, safety standards are important and exporters must pay extra attention to rounded corners, non-cascadingdrawers, steel bolts in bunk beds and bolted bed rails.
• Solid woods: In low to medium priced contemporary furniture, solid woods are becoming more popular, instead of the usualveneers and laminates. Importers are looking for new sorts of solid wood, similar to light oak, cherry or darker woods. An alternative to the expensive woods from Scandinavia, Canada or USA, could be rubberwood, which also can meet thestrict environmental legislation in the EU.
• Special natural materials could be rose oak, eucalyptus, palm fibre, bark, midribs, rice husk (for particle board), nut shells,parts of banana trees (trunk’s peel), seagrass, water hyacinth, canvas, cork or abacca leave. Other special materials includewrought iron or aluminium. In addition, combinations of these materials can be made with, stone, shelves, hemp, zinc, jute,latticework or leather.
• RTA: The quality and diversity in design of RTA furniture is increasing. These products are easy and cheaper to transport tothe EU. However, for exporters it is important to get the correct fittings for the right RTA or knock-down system.
• Specific target groups: such as furniture for seniors or for the growing number of single households.
• Accessories: Exporters are recommended to present a series of furniture items and matching accessories, which may fitan interior concept. These accessories could range from fruit bowls, candle holders, vases, flower pots, lampshades,(carton or paper) storage boxes for e.g. linen etc.
furniture” (2000). As the EU furniture market declinedsince 2001, exporters should seek opportunities ingrowing niches, in which they are strong:
60
Sub-contracting:
Some EU manufacturers look for new low-cost countries to outsource production of high volume items, while others look forexclusive items to meet the increasing diversity in demand in their country. Both cases offer prospects for new suppliers orpartners, who could also be exporters from developing countries. Furniture is increasingly exported in semi-finished form(referred to as ‘parts’ in trade statistics in Chapter 5). The finishing is done in the consuming country, which ensures that it isfinished to the required specification and quality level.
Requirements and difficulties for exporters:
h In order to approach the low and medium end of the market, competitive prices are necessary.h Fast delivery (according to sample), good packaging, and after-sales service are required. h Innovations are required in order to keep the interest of consumers, who are more demanding.h As trends in home interiors change faster, it is difficult to start a long-term investment.h Avoid using wood of (too) young trees, resulting in warped furniture that cannot be sold.
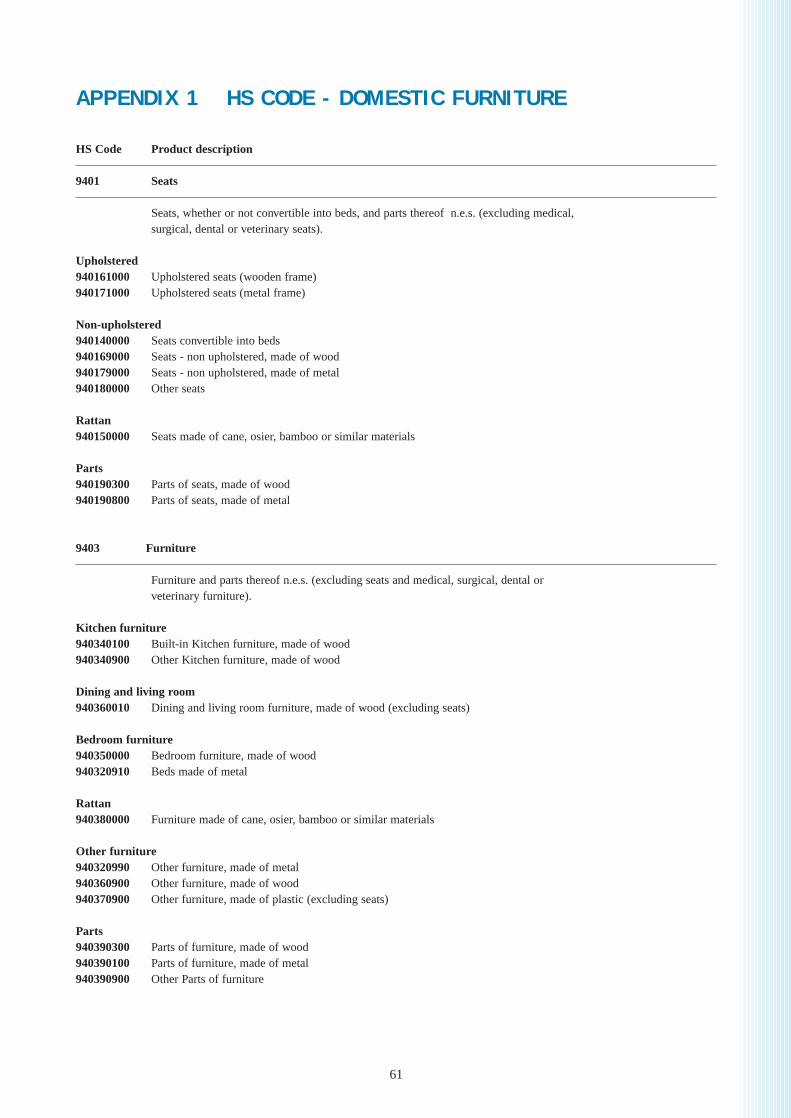
61
APPENDIX 1 HS CODE - DOMESTIC FURNITURE
HS Code Product description
9401 Seats
Seats, whether or not convertible into beds, and parts thereof n.e.s. (excluding medical,surgical, dental or veterinary seats).
Upholstered940161000 Upholstered seats (wooden frame)940171000 Upholstered seats (metal frame)
Non-upholstered940140000 Seats convertible into beds940169000 Seats - non upholstered, made of wood940179000 Seats - non upholstered, made of metal940180000 Other seats
Rattan940150000 Seats made of cane, osier, bamboo or similar materials
Parts940190300 Parts of seats, made of wood940190800 Parts of seats, made of metal
9403 Furniture
Furniture and parts thereof n.e.s. (excluding seats and medical, surgical, dental or veterinary furniture).
Kitchen furniture940340100 Built-in Kitchen furniture, made of wood940340900 Other Kitchen furniture, made of wood
Dining and living room940360010 Dining and living room furniture, made of wood (excluding seats)
Bedroom furniture940350000 Bedroom furniture, made of wood940320910 Beds made of metal
Rattan940380000 Furniture made of cane, osier, bamboo or similar materials
Other furniture940320990 Other furniture, made of metal940360900 Other furniture, made of wood940370900 Other furniture, made of plastic (excluding seats)
Parts940390300 Parts of furniture, made of wood940390100 Parts of furniture, made of metal940390900 Other Parts of furniture
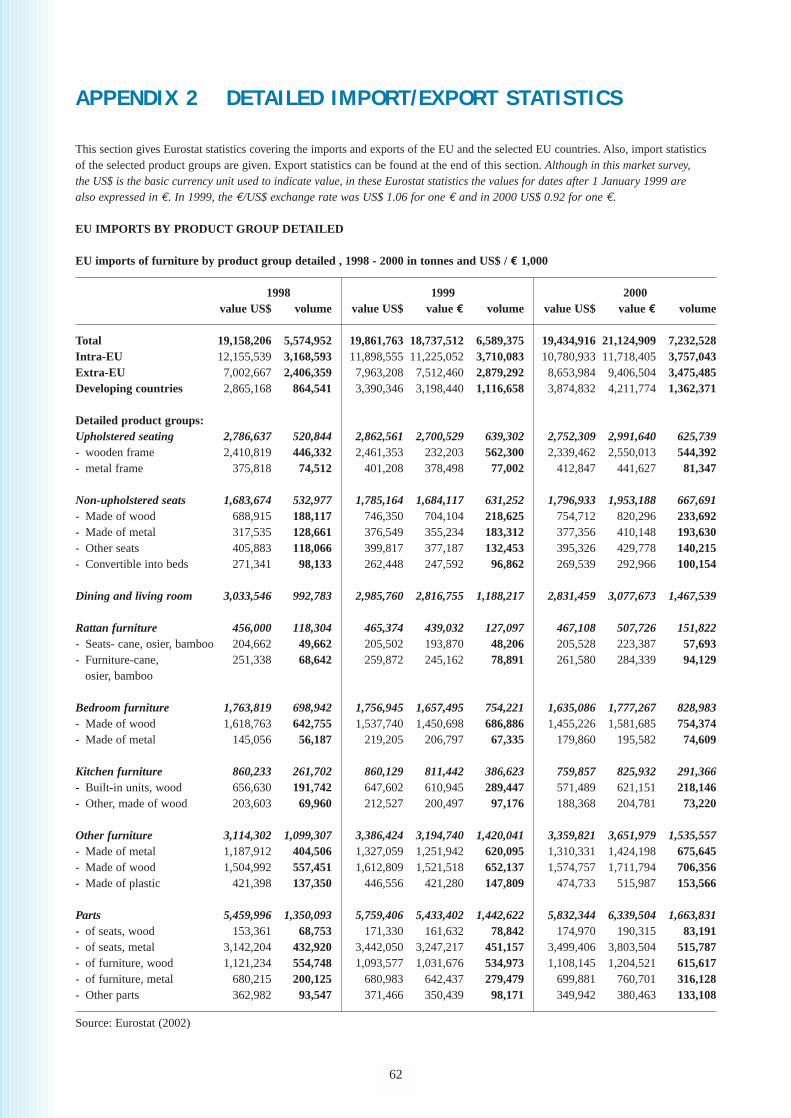
62
APPENDIX 2 DETAILED IMPORT/EXPORT STATISTICS
This section gives Eurostat statistics covering the imports and exports of the EU and the selected EU countries. Also, import statisticsof the selected product groups are given. Export statistics can be found at the end of this section. Although in this market survey,the US$ is the basic currency unit used to indicate value, in these Eurostat statistics the values for dates after 1 January 1999 arealso expressed in €. In 1999, the €/US$ exchange rate was US$ 1.06 for one € and in 2000 US$ 0.92 for one €.
EU IMPORTS BY PRODUCT GROUP DETAILED
EU imports of furniture by product group detailed , 1998 - 2000 in tonnes and US$ / € 1,000
1998 1999 2000value US$ volume value US$ value € volume value US$ value € volume
Total 19,158,206 5,574,952 19,861,763 18,737,512 6,589,375 19,434,916 21,124,909 7,232,528Intra-EU 12,155,539 3,168,593 11,898,555 11,225,052 3,710,083 10,780,933 11,718,405 3,757,043Extra-EU 7,002,667 2,406,359 7,963,208 7,512,460 2,879,292 8,653,984 9,406,504 3,475,485Developing countries 2,865,168 864,541 3,390,346 3,198,440 1,116,658 3,874,832 4,211,774 1,362,371
Detailed product groups:Upholstered seating 2,786,637 520,844 2,862,561 2,700,529 639,302 2,752,309 2,991,640 625,739- wooden frame 2,410,819 446,332 2,461,353 232,203 562,300 2,339,462 2,550,013 544,392- metal frame 375,818 74,512 401,208 378,498 77,002 412,847 441,627 81,347
Non-upholstered seats 1,683,674 532,977 1,785,164 1,684,117 631,252 1,796,933 1,953,188 667,691- Made of wood 688,915 188,117 746,350 704,104 218,625 754,712 820,296 233,692- Made of metal 317,535 128,661 376,549 355,234 183,312 377,356 410,148 193,630- Other seats 405,883 118,066 399,817 377,187 132,453 395,326 429,778 140,215- Convertible into beds 271,341 98,133 262,448 247,592 96,862 269,539 292,966 100,154
Dining and living room 3,033,546 992,783 2,985,760 2,816,755 1,188,217 2,831,459 3,077,673 1,467,539
Rattan furniture 456,000 118,304 465,374 439,032 127,097 467,108 507,726 151,822- Seats- cane, osier, bamboo 204,662 49,662 205,502 193,870 48,206 205,528 223,387 57,693- Furniture-cane, 251,338 68,642 259,872 245,162 78,891 261,580 284,339 94,129
osier, bamboo
Bedroom furniture 1,763,819 698,942 1,756,945 1,657,495 754,221 1,635,086 1,777,267 828,983- Made of wood 1,618,763 642,755 1,537,740 1,450,698 686,886 1,455,226 1,581,685 754,374- Made of metal 145,056 56,187 219,205 206,797 67,335 179,860 195,582 74,609
Kitchen furniture 860,233 261,702 860,129 811,442 386,623 759,857 825,932 291,366- Built-in units, wood 656,630 191,742 647,602 610,945 289,447 571,489 621,151 218,146- Other, made of wood 203,603 69,960 212,527 200,497 97,176 188,368 204,781 73,220
Other furniture 3,114,302 1,099,307 3,386,424 3,194,740 1,420,041 3,359,821 3,651,979 1,535,557- Made of metal 1,187,912 404,506 1,327,059 1,251,942 620,095 1,310,331 1,424,198 675,645- Made of wood 1,504,992 557,451 1,612,809 1,521,518 652,137 1,574,757 1,711,794 706,356- Made of plastic 421,398 137,350 446,556 421,280 147,809 474,733 515,987 153,566
Parts 5,459,996 1,350,093 5,759,406 5,433,402 1,442,622 5,832,344 6,339,504 1,663,831- of seats, wood 153,361 68,753 171,330 161,632 78,842 174,970 190,315 83,191- of seats, metal 3,142,204 432,920 3,442,050 3,247,217 451,157 3,499,406 3,803,504 515,787- of furniture, wood 1,121,234 554,748 1,093,577 1,031,676 534,973 1,108,145 1,204,521 615,617- of furniture, metal 680,215 200,125 680,983 642,437 279,479 699,881 760,701 316,128- Other parts 362,982 93,547 371,466 350,439 98,171 349,942 380,463 133,108
Source: Eurostat (2002)
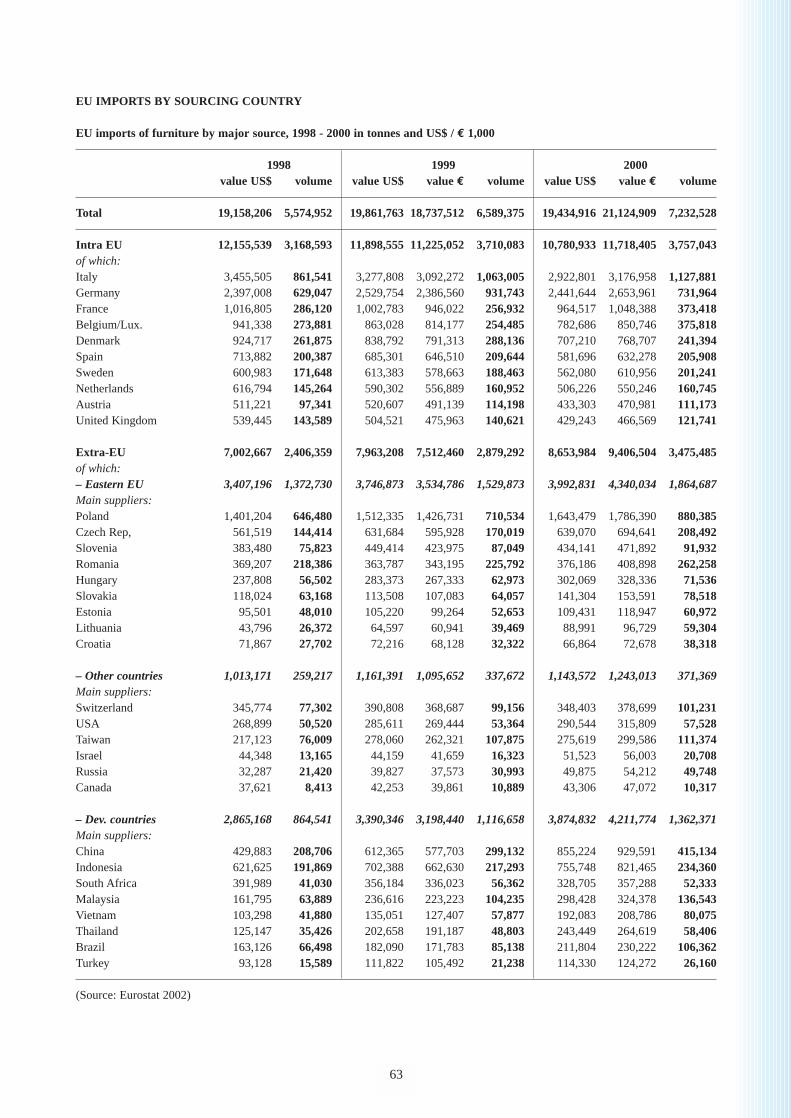
EU IMPORTS BY SOURCING COUNTRY
EU imports of furniture by major source, 1998 - 2000 in tonnes and US$ / € 1,000
1998 1999 2000value US$ volume value US$ value € volume value US$ value € volume
Total 19,158,206 5,574,952 19,861,763 18,737,512 6,589,375 19,434,916 21,124,909 7,232,528
Intra EU 12,155,539 3,168,593 11,898,555 11,225,052 3,710,083 10,780,933 11,718,405 3,757,043of which:Italy 3,455,505 861,541 3,277,808 3,092,272 1,063,005 2,922,801 3,176,958 1,127,881Germany 2,397,008 629,047 2,529,754 2,386,560 931,743 2,441,644 2,653,961 731,964France 1,016,805 286,120 1,002,783 946,022 256,932 964,517 1,048,388 373,418Belgium/Lux. 941,338 273,881 863,028 814,177 254,485 782,686 850,746 375,818Denmark 924,717 261,875 838,792 791,313 288,136 707,210 768,707 241,394Spain 713,882 200,387 685,301 646,510 209,644 581,696 632,278 205,908Sweden 600,983 171,648 613,383 578,663 188,463 562,080 610,956 201,241Netherlands 616,794 145,264 590,302 556,889 160,952 506,226 550,246 160,745Austria 511,221 97,341 520,607 491,139 114,198 433,303 470,981 111,173United Kingdom 539,445 143,589 504,521 475,963 140,621 429,243 466,569 121,741
Extra-EU 7,002,667 2,406,359 7,963,208 7,512,460 2,879,292 8,653,984 9,406,504 3,475,485of which:– Eastern EU 3,407,196 1,372,730 3,746,873 3,534,786 1,529,873 3,992,831 4,340,034 1,864,687Main suppliers:Poland 1,401,204 646,480 1,512,335 1,426,731 710,534 1,643,479 1,786,390 880,385Czech Rep, 561,519 144,414 631,684 595,928 170,019 639,070 694,641 208,492Slovenia 383,480 75,823 449,414 423,975 87,049 434,141 471,892 91,932Romania 369,207 218,386 363,787 343,195 225,792 376,186 408,898 262,258Hungary 237,808 56,502 283,373 267,333 62,973 302,069 328,336 71,536Slovakia 118,024 63,168 113,508 107,083 64,057 141,304 153,591 78,518Estonia 95,501 48,010 105,220 99,264 52,653 109,431 118,947 60,972Lithuania 43,796 26,372 64,597 60,941 39,469 88,991 96,729 59,304Croatia 71,867 27,702 72,216 68,128 32,322 66,864 72,678 38,318
– Other countries 1,013,171 259,217 1,161,391 1,095,652 337,672 1,143,572 1,243,013 371,369Main suppliers:Switzerland 345,774 77,302 390,808 368,687 99,156 348,403 378,699 101,231USA 268,899 50,520 285,611 269,444 53,364 290,544 315,809 57,528Taiwan 217,123 76,009 278,060 262,321 107,875 275,619 299,586 111,374Israel 44,348 13,165 44,159 41,659 16,323 51,523 56,003 20,708Russia 32,287 21,420 39,827 37,573 30,993 49,875 54,212 49,748Canada 37,621 8,413 42,253 39,861 10,889 43,306 47,072 10,317
– Dev. countries 2,865,168 864,541 3,390,346 3,198,440 1,116,658 3,874,832 4,211,774 1,362,371Main suppliers:China 429,883 208,706 612,365 577,703 299,132 855,224 929,591 415,134Indonesia 621,625 191,869 702,388 662,630 217,293 755,748 821,465 234,360South Africa 391,989 41,030 356,184 336,023 56,362 328,705 357,288 52,333Malaysia 161,795 63,889 236,616 223,223 104,235 298,428 324,378 136,543Vietnam 103,298 41,880 135,051 127,407 57,877 192,083 208,786 80,075Thailand 125,147 35,426 202,658 191,187 48,803 243,449 264,619 58,406Brazil 163,126 66,498 182,090 171,783 85,138 211,804 230,222 106,362Turkey 93,128 15,589 111,822 105,492 21,238 114,330 124,272 26,160
(Source: Eurostat 2002)
63
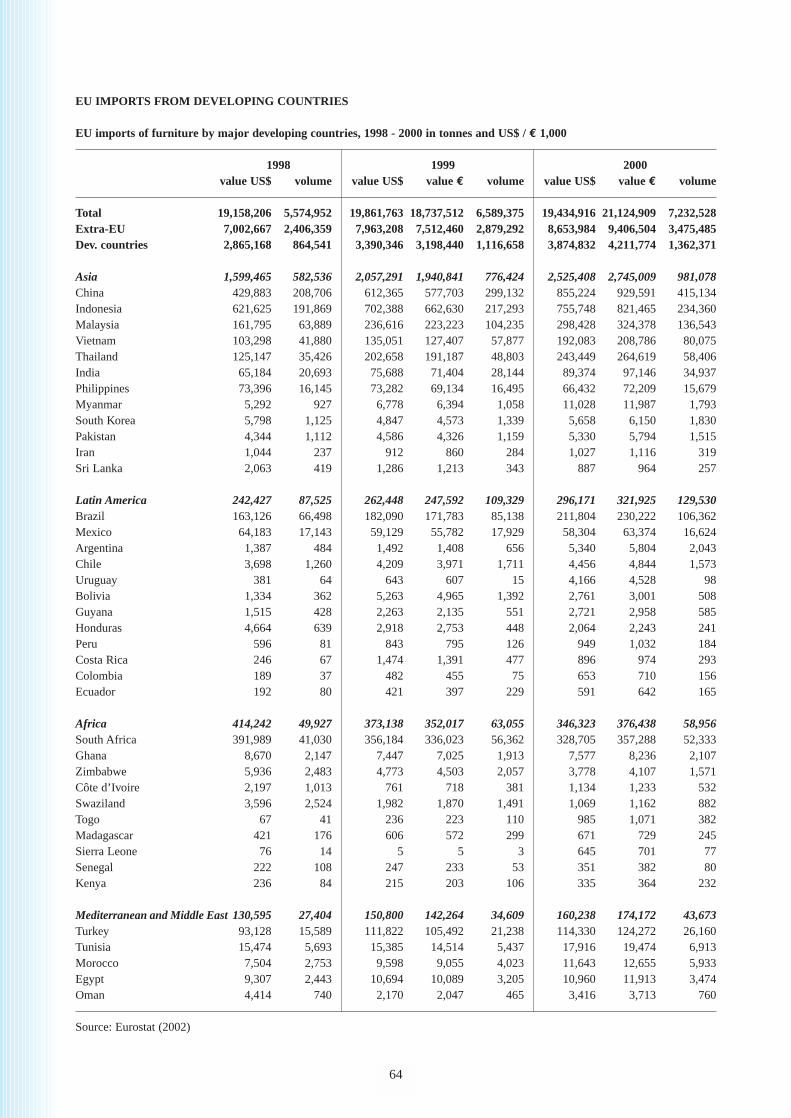
EU IMPORTS FROM DEVELOPING COUNTRIES
EU imports of furniture by major developing countries, 1998 - 2000 in tonnes and US$ / € 1,000
1998 1999 2000value US$ volume value US$ value € volume value US$ value € volume
Total 19,158,206 5,574,952 19,861,763 18,737,512 6,589,375 19,434,916 21,124,909 7,232,528Extra-EU 7,002,667 2,406,359 7,963,208 7,512,460 2,879,292 8,653,984 9,406,504 3,475,485Dev. countries 2,865,168 864,541 3,390,346 3,198,440 1,116,658 3,874,832 4,211,774 1,362,371
Asia 1,599,465 582,536 2,057,291 1,940,841 776,424 2,525,408 2,745,009 981,078China 429,883 208,706 612,365 577,703 299,132 855,224 929,591 415,134Indonesia 621,625 191,869 702,388 662,630 217,293 755,748 821,465 234,360Malaysia 161,795 63,889 236,616 223,223 104,235 298,428 324,378 136,543Vietnam 103,298 41,880 135,051 127,407 57,877 192,083 208,786 80,075Thailand 125,147 35,426 202,658 191,187 48,803 243,449 264,619 58,406India 65,184 20,693 75,688 71,404 28,144 89,374 97,146 34,937Philippines 73,396 16,145 73,282 69,134 16,495 66,432 72,209 15,679Myanmar 5,292 927 6,778 6,394 1,058 11,028 11,987 1,793South Korea 5,798 1,125 4,847 4,573 1,339 5,658 6,150 1,830Pakistan 4,344 1,112 4,586 4,326 1,159 5,330 5,794 1,515Iran 1,044 237 912 860 284 1,027 1,116 319Sri Lanka 2,063 419 1,286 1,213 343 887 964 257
Latin America 242,427 87,525 262,448 247,592 109,329 296,171 321,925 129,530Brazil 163,126 66,498 182,090 171,783 85,138 211,804 230,222 106,362Mexico 64,183 17,143 59,129 55,782 17,929 58,304 63,374 16,624Argentina 1,387 484 1,492 1,408 656 5,340 5,804 2,043Chile 3,698 1,260 4,209 3,971 1,711 4,456 4,844 1,573Uruguay 381 64 643 607 15 4,166 4,528 98Bolivia 1,334 362 5,263 4,965 1,392 2,761 3,001 508Guyana 1,515 428 2,263 2,135 551 2,721 2,958 585Honduras 4,664 639 2,918 2,753 448 2,064 2,243 241Peru 596 81 843 795 126 949 1,032 184Costa Rica 246 67 1,474 1,391 477 896 974 293Colombia 189 37 482 455 75 653 710 156Ecuador 192 80 421 397 229 591 642 165
Africa 414,242 49,927 373,138 352,017 63,055 346,323 376,438 58,956South Africa 391,989 41,030 356,184 336,023 56,362 328,705 357,288 52,333Ghana 8,670 2,147 7,447 7,025 1,913 7,577 8,236 2,107Zimbabwe 5,936 2,483 4,773 4,503 2,057 3,778 4,107 1,571Côte d’Ivoire 2,197 1,013 761 718 381 1,134 1,233 532Swaziland 3,596 2,524 1,982 1,870 1,491 1,069 1,162 882Togo 67 41 236 223 110 985 1,071 382Madagascar 421 176 606 572 299 671 729 245Sierra Leone 76 14 5 5 3 645 701 77Senegal 222 108 247 233 53 351 382 80Kenya 236 84 215 203 106 335 364 232
Mediterranean and Middle East 130,595 27,404 150,800 142,264 34,609 160,238 174,172 43,673Turkey 93,128 15,589 111,822 105,492 21,238 114,330 124,272 26,160Tunisia 15,474 5,693 15,385 14,514 5,437 17,916 19,474 6,913Morocco 7,504 2,753 9,598 9,055 4,023 11,643 12,655 5,933Egypt 9,307 2,443 10,694 10,089 3,205 10,960 11,913 3,474Oman 4,414 740 2,170 2,047 465 3,416 3,713 760
Source: Eurostat (2002)
64
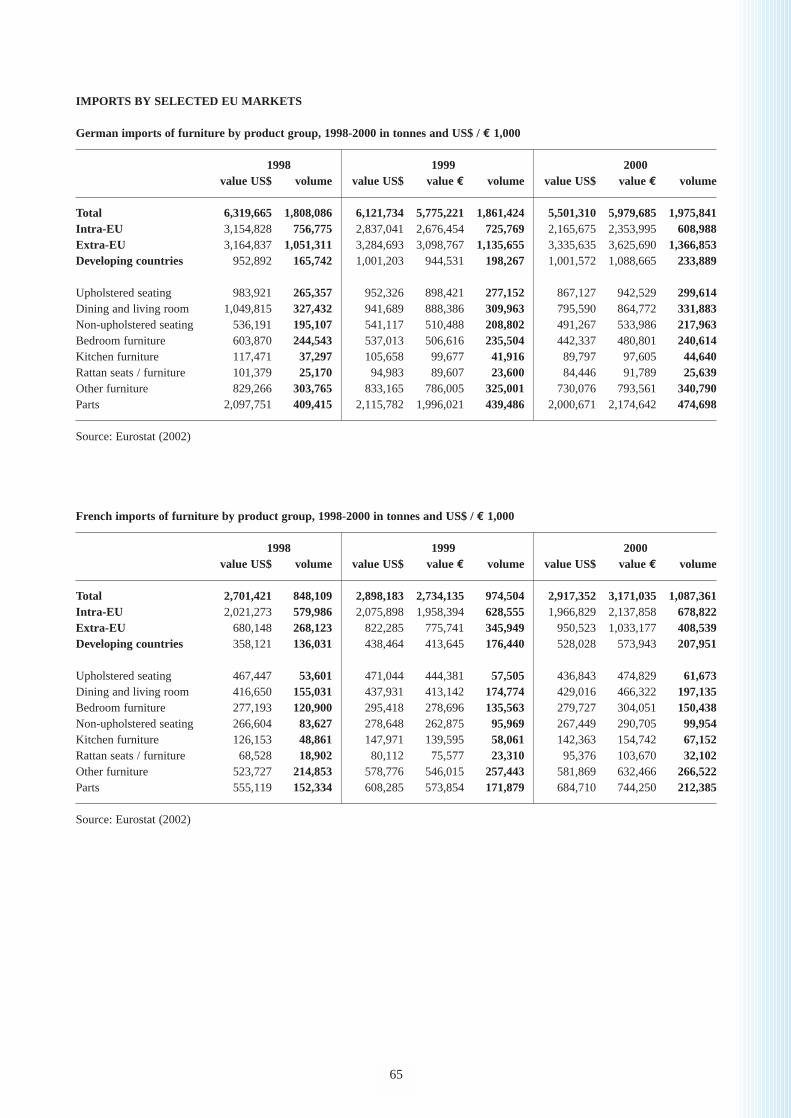
IMPORTS BY SELECTED EU MARKETS
German imports of furniture by product group, 1998-2000 in tonnes and US$ / € 1,000
1998 1999 2000value US$ volume value US$ value € volume value US$ value € volume
Total 6,319,665 1,808,086 6,121,734 5,775,221 1,861,424 5,501,310 5,979,685 1,975,841Intra-EU 3,154,828 756,775 2,837,041 2,676,454 725,769 2,165,675 2,353,995 608,988Extra-EU 3,164,837 1,051,311 3,284,693 3,098,767 1,135,655 3,335,635 3,625,690 1,366,853Developing countries 952,892 165,742 1,001,203 944,531 198,267 1,001,572 1,088,665 233,889
Upholstered seating 983,921 265,357 952,326 898,421 277,152 867,127 942,529 299,614Dining and living room 1,049,815 327,432 941,689 888,386 309,963 795,590 864,772 331,883Non-upholstered seating 536,191 195,107 541,117 510,488 208,802 491,267 533,986 217,963Bedroom furniture 603,870 244,543 537,013 506,616 235,504 442,337 480,801 240,614Kitchen furniture 117,471 37,297 105,658 99,677 41,916 89,797 97,605 44,640Rattan seats / furniture 101,379 25,170 94,983 89,607 23,600 84,446 91,789 25,639Other furniture 829,266 303,765 833,165 786,005 325,001 730,076 793,561 340,790Parts 2,097,751 409,415 2,115,782 1,996,021 439,486 2,000,671 2,174,642 474,698
Source: Eurostat (2002)
French imports of furniture by product group, 1998-2000 in tonnes and US$ / € 1,000
1998 1999 2000value US$ volume value US$ value € volume value US$ value € volume
Total 2,701,421 848,109 2,898,183 2,734,135 974,504 2,917,352 3,171,035 1,087,361Intra-EU 2,021,273 579,986 2,075,898 1,958,394 628,555 1,966,829 2,137,858 678,822Extra-EU 680,148 268,123 822,285 775,741 345,949 950,523 1,033,177 408,539Developing countries 358,121 136,031 438,464 413,645 176,440 528,028 573,943 207,951
Upholstered seating 467,447 53,601 471,044 444,381 57,505 436,843 474,829 61,673Dining and living room 416,650 155,031 437,931 413,142 174,774 429,016 466,322 197,135Bedroom furniture 277,193 120,900 295,418 278,696 135,563 279,727 304,051 150,438Non-upholstered seating 266,604 83,627 278,648 262,875 95,969 267,449 290,705 99,954Kitchen furniture 126,153 48,861 147,971 139,595 58,061 142,363 154,742 67,152Rattan seats / furniture 68,528 18,902 80,112 75,577 23,310 95,376 103,670 32,102Other furniture 523,727 214,853 578,776 546,015 257,443 581,869 632,466 266,522Parts 555,119 152,334 608,285 573,854 171,879 684,710 744,250 212,385
Source: Eurostat (2002)
65
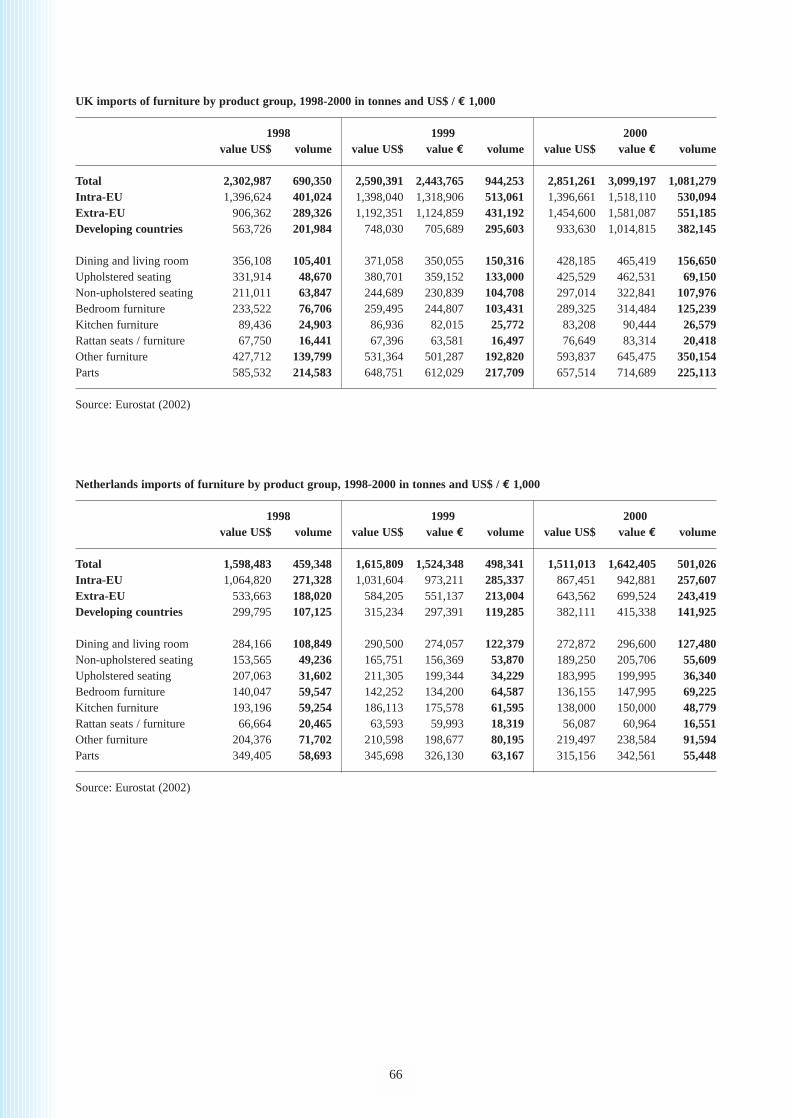
UK imports of furniture by product group, 1998-2000 in tonnes and US$ / € 1,000
1998 1999 2000value US$ volume value US$ value € volume value US$ value € volume
Total 2,302,987 690,350 2,590,391 2,443,765 944,253 2,851,261 3,099,197 1,081,279Intra-EU 1,396,624 401,024 1,398,040 1,318,906 513,061 1,396,661 1,518,110 530,094Extra-EU 906,362 289,326 1,192,351 1,124,859 431,192 1,454,600 1,581,087 551,185Developing countries 563,726 201,984 748,030 705,689 295,603 933,630 1,014,815 382,145
Dining and living room 356,108 105,401 371,058 350,055 150,316 428,185 465,419 156,650Upholstered seating 331,914 48,670 380,701 359,152 133,000 425,529 462,531 69,150Non-upholstered seating 211,011 63,847 244,689 230,839 104,708 297,014 322,841 107,976Bedroom furniture 233,522 76,706 259,495 244,807 103,431 289,325 314,484 125,239Kitchen furniture 89,436 24,903 86,936 82,015 25,772 83,208 90,444 26,579Rattan seats / furniture 67,750 16,441 67,396 63,581 16,497 76,649 83,314 20,418Other furniture 427,712 139,799 531,364 501,287 192,820 593,837 645,475 350,154Parts 585,532 214,583 648,751 612,029 217,709 657,514 714,689 225,113
Source: Eurostat (2002)
Netherlands imports of furniture by product group, 1998-2000 in tonnes and US$ / € 1,000
1998 1999 2000value US$ volume value US$ value € volume value US$ value € volume
Total 1,598,483 459,348 1,615,809 1,524,348 498,341 1,511,013 1,642,405 501,026Intra-EU 1,064,820 271,328 1,031,604 973,211 285,337 867,451 942,881 257,607Extra-EU 533,663 188,020 584,205 551,137 213,004 643,562 699,524 243,419Developing countries 299,795 107,125 315,234 297,391 119,285 382,111 415,338 141,925
Dining and living room 284,166 108,849 290,500 274,057 122,379 272,872 296,600 127,480Non-upholstered seating 153,565 49,236 165,751 156,369 53,870 189,250 205,706 55,609Upholstered seating 207,063 31,602 211,305 199,344 34,229 183,995 199,995 36,340Bedroom furniture 140,047 59,547 142,252 134,200 64,587 136,155 147,995 69,225Kitchen furniture 193,196 59,254 186,113 175,578 61,595 138,000 150,000 48,779Rattan seats / furniture 66,664 20,465 63,593 59,993 18,319 56,087 60,964 16,551Other furniture 204,376 71,702 210,598 198,677 80,195 219,497 238,584 91,594Parts 349,405 58,693 345,698 326,130 63,167 315,156 342,561 55,448
Source: Eurostat (2002)
66
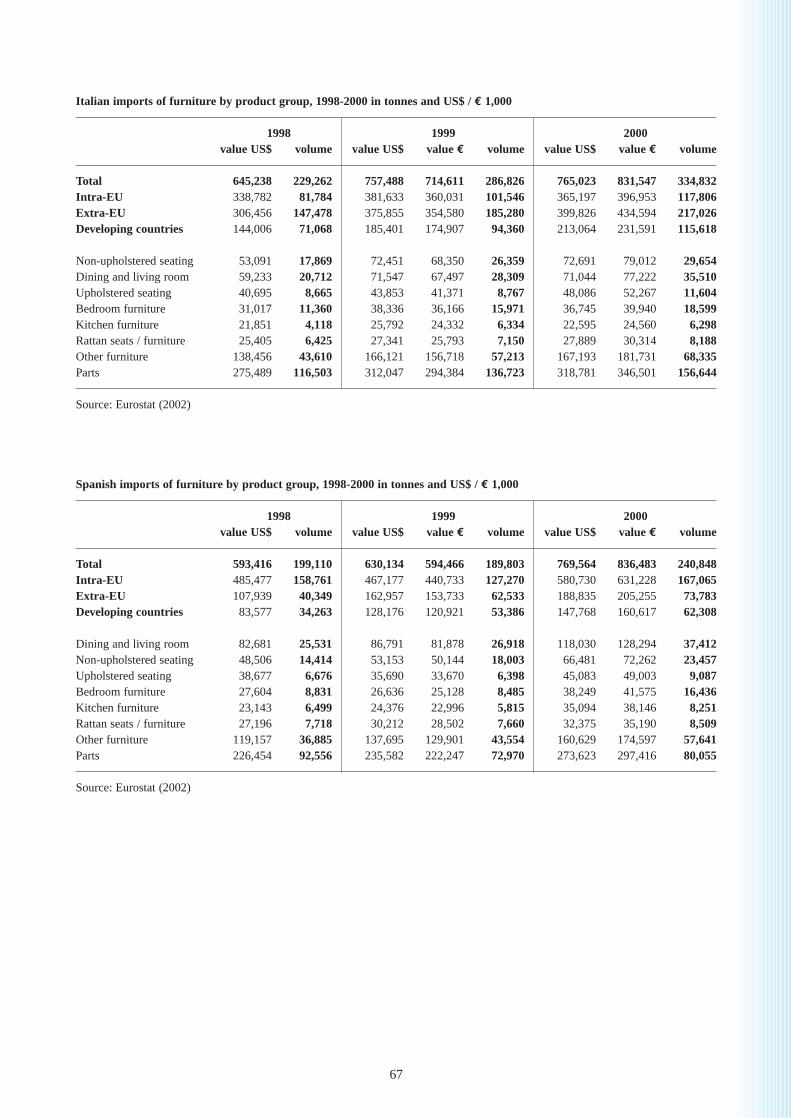
Italian imports of furniture by product group, 1998-2000 in tonnes and US$ / € 1,000
1998 1999 2000value US$ volume value US$ value € volume value US$ value € volume
Total 645,238 229,262 757,488 714,611 286,826 765,023 831,547 334,832Intra-EU 338,782 81,784 381,633 360,031 101,546 365,197 396,953 117,806Extra-EU 306,456 147,478 375,855 354,580 185,280 399,826 434,594 217,026Developing countries 144,006 71,068 185,401 174,907 94,360 213,064 231,591 115,618
Non-upholstered seating 53,091 17,869 72,451 68,350 26,359 72,691 79,012 29,654Dining and living room 59,233 20,712 71,547 67,497 28,309 71,044 77,222 35,510Upholstered seating 40,695 8,665 43,853 41,371 8,767 48,086 52,267 11,604Bedroom furniture 31,017 11,360 38,336 36,166 15,971 36,745 39,940 18,599Kitchen furniture 21,851 4,118 25,792 24,332 6,334 22,595 24,560 6,298Rattan seats / furniture 25,405 6,425 27,341 25,793 7,150 27,889 30,314 8,188Other furniture 138,456 43,610 166,121 156,718 57,213 167,193 181,731 68,335Parts 275,489 116,503 312,047 294,384 136,723 318,781 346,501 156,644
Source: Eurostat (2002)
Spanish imports of furniture by product group, 1998-2000 in tonnes and US$ / € 1,000
1998 1999 2000value US$ volume value US$ value € volume value US$ value € volume
Total 593,416 199,110 630,134 594,466 189,803 769,564 836,483 240,848Intra-EU 485,477 158,761 467,177 440,733 127,270 580,730 631,228 167,065Extra-EU 107,939 40,349 162,957 153,733 62,533 188,835 205,255 73,783Developing countries 83,577 34,263 128,176 120,921 53,386 147,768 160,617 62,308
Dining and living room 82,681 25,531 86,791 81,878 26,918 118,030 128,294 37,412Non-upholstered seating 48,506 14,414 53,153 50,144 18,003 66,481 72,262 23,457Upholstered seating 38,677 6,676 35,690 33,670 6,398 45,083 49,003 9,087Bedroom furniture 27,604 8,831 26,636 25,128 8,485 38,249 41,575 16,436Kitchen furniture 23,143 6,499 24,376 22,996 5,815 35,094 38,146 8,251Rattan seats / furniture 27,196 7,718 30,212 28,502 7,660 32,375 35,190 8,509Other furniture 119,157 36,885 137,695 129,901 43,554 160,629 174,597 57,641Parts 226,454 92,556 235,582 222,247 72,970 273,623 297,416 80,055
Source: Eurostat (2002)
67
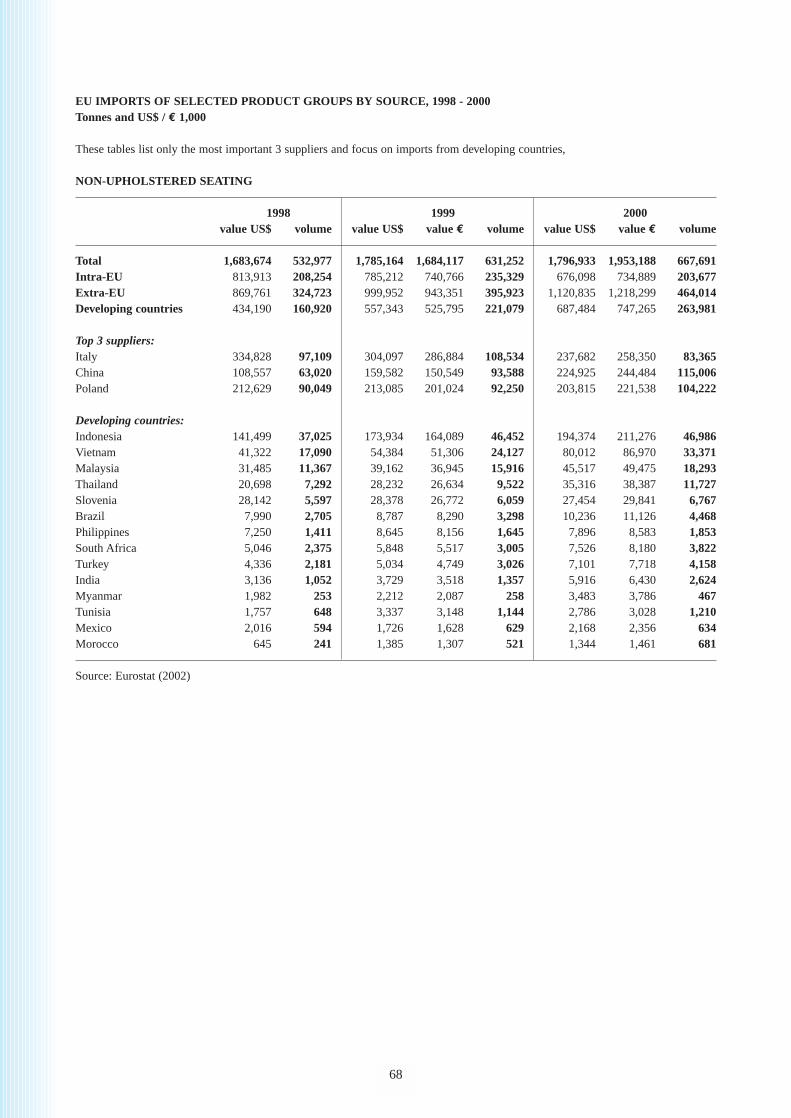
EU IMPORTS OF SELECTED PRODUCT GROUPS BY SOURCE, 1998 - 2000Tonnes and US$ / € 1,000
These tables list only the most important 3 suppliers and focus on imports from developing countries,
NON-UPHOLSTERED SEATING
1998 1999 2000value US$ volume value US$ value € volume value US$ value € volume
Total 1,683,674 532,977 1,785,164 1,684,117 631,252 1,796,933 1,953,188 667,691Intra-EU 813,913 208,254 785,212 740,766 235,329 676,098 734,889 203,677Extra-EU 869,761 324,723 999,952 943,351 395,923 1,120,835 1,218,299 464,014Developing countries 434,190 160,920 557,343 525,795 221,079 687,484 747,265 263,981
Top 3 suppliers:Italy 334,828 97,109 304,097 286,884 108,534 237,682 258,350 83,365China 108,557 63,020 159,582 150,549 93,588 224,925 244,484 115,006Poland 212,629 90,049 213,085 201,024 92,250 203,815 221,538 104,222
Developing countries:Indonesia 141,499 37,025 173,934 164,089 46,452 194,374 211,276 46,986Vietnam 41,322 17,090 54,384 51,306 24,127 80,012 86,970 33,371Malaysia 31,485 11,367 39,162 36,945 15,916 45,517 49,475 18,293Thailand 20,698 7,292 28,232 26,634 9,522 35,316 38,387 11,727Slovenia 28,142 5,597 28,378 26,772 6,059 27,454 29,841 6,767Brazil 7,990 2,705 8,787 8,290 3,298 10,236 11,126 4,468Philippines 7,250 1,411 8,645 8,156 1,645 7,896 8,583 1,853South Africa 5,046 2,375 5,848 5,517 3,005 7,526 8,180 3,822Turkey 4,336 2,181 5,034 4,749 3,026 7,101 7,718 4,158India 3,136 1,052 3,729 3,518 1,357 5,916 6,430 2,624Myanmar 1,982 253 2,212 2,087 258 3,483 3,786 467Tunisia 1,757 648 3,337 3,148 1,144 2,786 3,028 1,210Mexico 2,016 594 1,726 1,628 629 2,168 2,356 634Morocco 645 241 1,385 1,307 521 1,344 1,461 681
Source: Eurostat (2002)
68
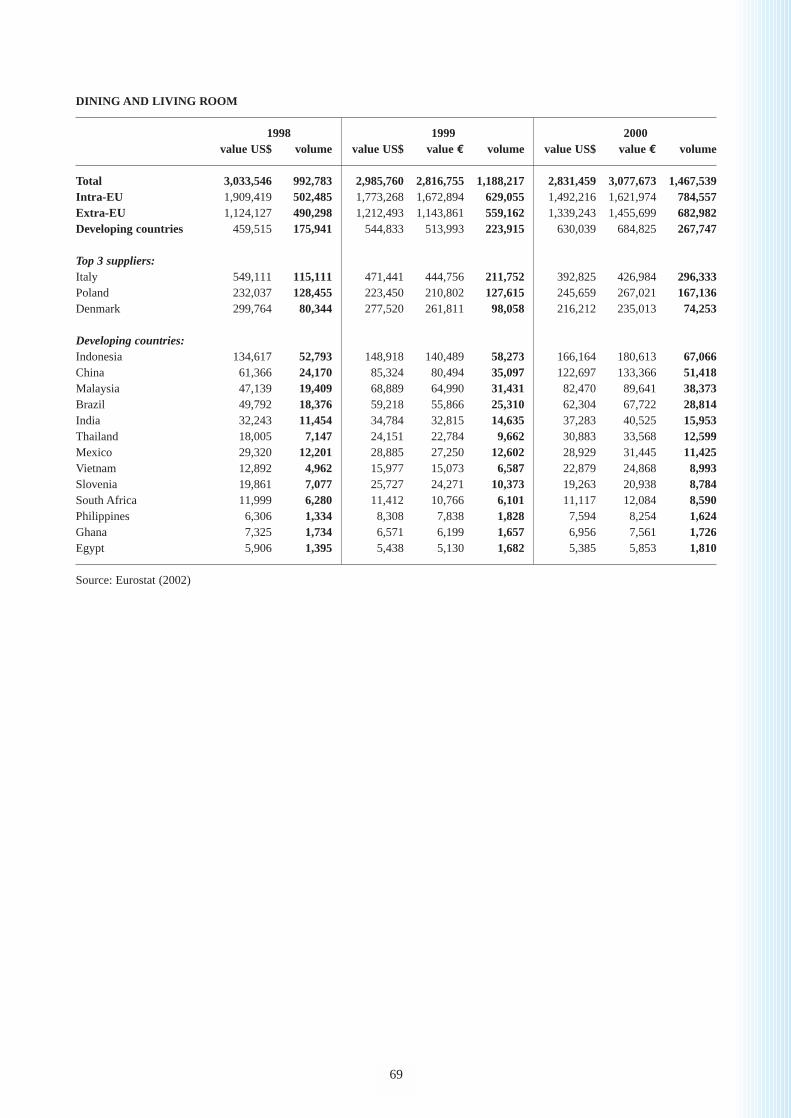
DINING AND LIVING ROOM
1998 1999 2000value US$ volume value US$ value € volume value US$ value € volume
Total 3,033,546 992,783 2,985,760 2,816,755 1,188,217 2,831,459 3,077,673 1,467,539Intra-EU 1,909,419 502,485 1,773,268 1,672,894 629,055 1,492,216 1,621,974 784,557Extra-EU 1,124,127 490,298 1,212,493 1,143,861 559,162 1,339,243 1,455,699 682,982Developing countries 459,515 175,941 544,833 513,993 223,915 630,039 684,825 267,747
Top 3 suppliers:Italy 549,111 115,111 471,441 444,756 211,752 392,825 426,984 296,333Poland 232,037 128,455 223,450 210,802 127,615 245,659 267,021 167,136Denmark 299,764 80,344 277,520 261,811 98,058 216,212 235,013 74,253
Developing countries:Indonesia 134,617 52,793 148,918 140,489 58,273 166,164 180,613 67,066China 61,366 24,170 85,324 80,494 35,097 122,697 133,366 51,418Malaysia 47,139 19,409 68,889 64,990 31,431 82,470 89,641 38,373Brazil 49,792 18,376 59,218 55,866 25,310 62,304 67,722 28,814India 32,243 11,454 34,784 32,815 14,635 37,283 40,525 15,953Thailand 18,005 7,147 24,151 22,784 9,662 30,883 33,568 12,599Mexico 29,320 12,201 28,885 27,250 12,602 28,929 31,445 11,425Vietnam 12,892 4,962 15,977 15,073 6,587 22,879 24,868 8,993Slovenia 19,861 7,077 25,727 24,271 10,373 19,263 20,938 8,784South Africa 11,999 6,280 11,412 10,766 6,101 11,117 12,084 8,590Philippines 6,306 1,334 8,308 7,838 1,828 7,594 8,254 1,624Ghana 7,325 1,734 6,571 6,199 1,657 6,956 7,561 1,726Egypt 5,906 1,395 5,438 5,130 1,682 5,385 5,853 1,810
Source: Eurostat (2002)
69
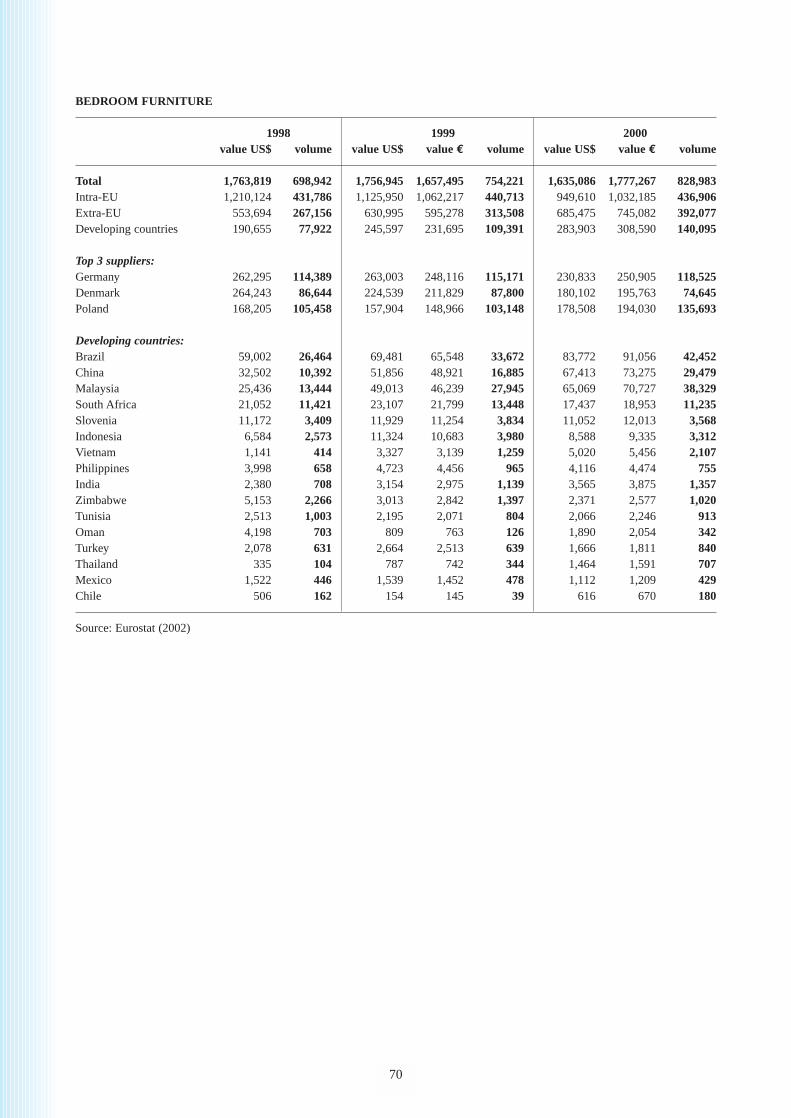
BEDROOM FURNITURE
1998 1999 2000value US$ volume value US$ value € volume value US$ value € volume
Total 1,763,819 698,942 1,756,945 1,657,495 754,221 1,635,086 1,777,267 828,983Intra-EU 1,210,124 431,786 1,125,950 1,062,217 440,713 949,610 1,032,185 436,906Extra-EU 553,694 267,156 630,995 595,278 313,508 685,475 745,082 392,077Developing countries 190,655 77,922 245,597 231,695 109,391 283,903 308,590 140,095
Top 3 suppliers:Germany 262,295 114,389 263,003 248,116 115,171 230,833 250,905 118,525Denmark 264,243 86,644 224,539 211,829 87,800 180,102 195,763 74,645Poland 168,205 105,458 157,904 148,966 103,148 178,508 194,030 135,693
Developing countries:Brazil 59,002 26,464 69,481 65,548 33,672 83,772 91,056 42,452China 32,502 10,392 51,856 48,921 16,885 67,413 73,275 29,479Malaysia 25,436 13,444 49,013 46,239 27,945 65,069 70,727 38,329South Africa 21,052 11,421 23,107 21,799 13,448 17,437 18,953 11,235Slovenia 11,172 3,409 11,929 11,254 3,834 11,052 12,013 3,568Indonesia 6,584 2,573 11,324 10,683 3,980 8,588 9,335 3,312Vietnam 1,141 414 3,327 3,139 1,259 5,020 5,456 2,107Philippines 3,998 658 4,723 4,456 965 4,116 4,474 755India 2,380 708 3,154 2,975 1,139 3,565 3,875 1,357Zimbabwe 5,153 2,266 3,013 2,842 1,397 2,371 2,577 1,020Tunisia 2,513 1,003 2,195 2,071 804 2,066 2,246 913Oman 4,198 703 809 763 126 1,890 2,054 342Turkey 2,078 631 2,664 2,513 639 1,666 1,811 840Thailand 335 104 787 742 344 1,464 1,591 707Mexico 1,522 446 1,539 1,452 478 1,112 1,209 429Chile 506 162 154 145 39 616 670 180
Source: Eurostat (2002)
70
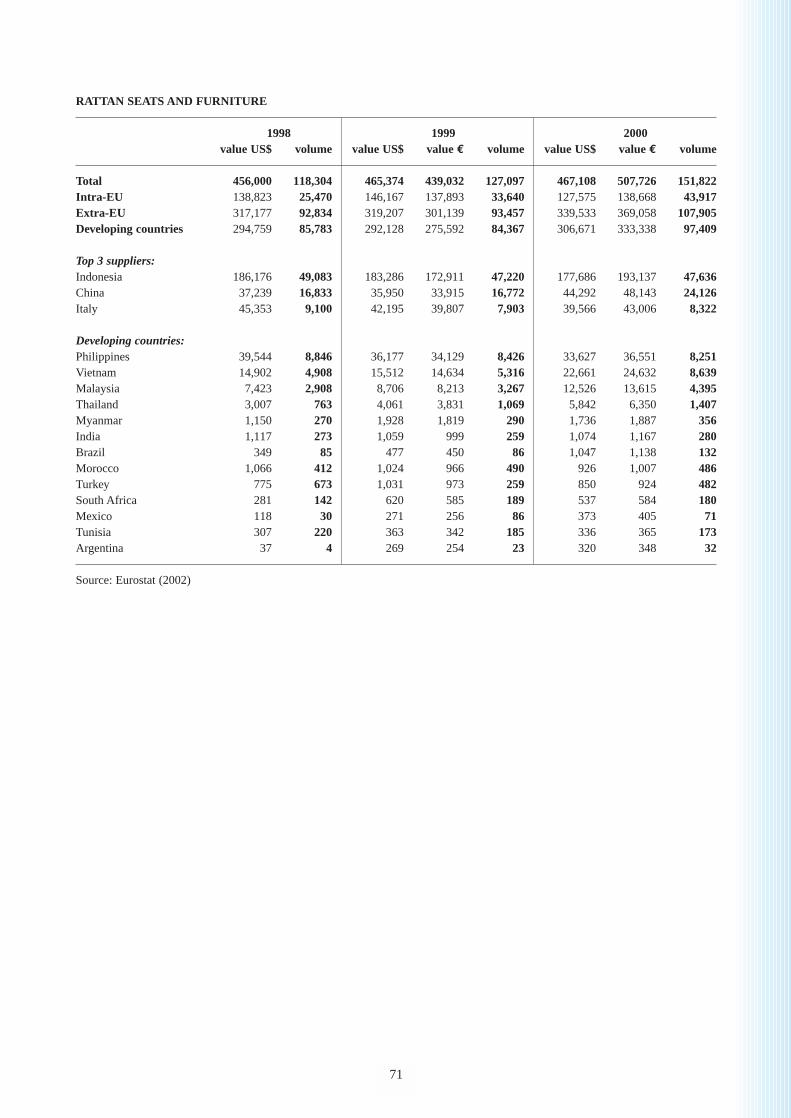
RATTAN SEATS AND FURNITURE
1998 1999 2000value US$ volume value US$ value € volume value US$ value € volume
Total 456,000 118,304 465,374 439,032 127,097 467,108 507,726 151,822Intra-EU 138,823 25,470 146,167 137,893 33,640 127,575 138,668 43,917Extra-EU 317,177 92,834 319,207 301,139 93,457 339,533 369,058 107,905Developing countries 294,759 85,783 292,128 275,592 84,367 306,671 333,338 97,409
Top 3 suppliers:Indonesia 186,176 49,083 183,286 172,911 47,220 177,686 193,137 47,636China 37,239 16,833 35,950 33,915 16,772 44,292 48,143 24,126Italy 45,353 9,100 42,195 39,807 7,903 39,566 43,006 8,322
Developing countries:Philippines 39,544 8,846 36,177 34,129 8,426 33,627 36,551 8,251Vietnam 14,902 4,908 15,512 14,634 5,316 22,661 24,632 8,639Malaysia 7,423 2,908 8,706 8,213 3,267 12,526 13,615 4,395Thailand 3,007 763 4,061 3,831 1,069 5,842 6,350 1,407Myanmar 1,150 270 1,928 1,819 290 1,736 1,887 356India 1,117 273 1,059 999 259 1,074 1,167 280Brazil 349 85 477 450 86 1,047 1,138 132Morocco 1,066 412 1,024 966 490 926 1,007 486Turkey 775 673 1,031 973 259 850 924 482South Africa 281 142 620 585 189 537 584 180Mexico 118 30 271 256 86 373 405 71Tunisia 307 220 363 342 185 336 365 173Argentina 37 4 269 254 23 320 348 32
Source: Eurostat (2002)
71
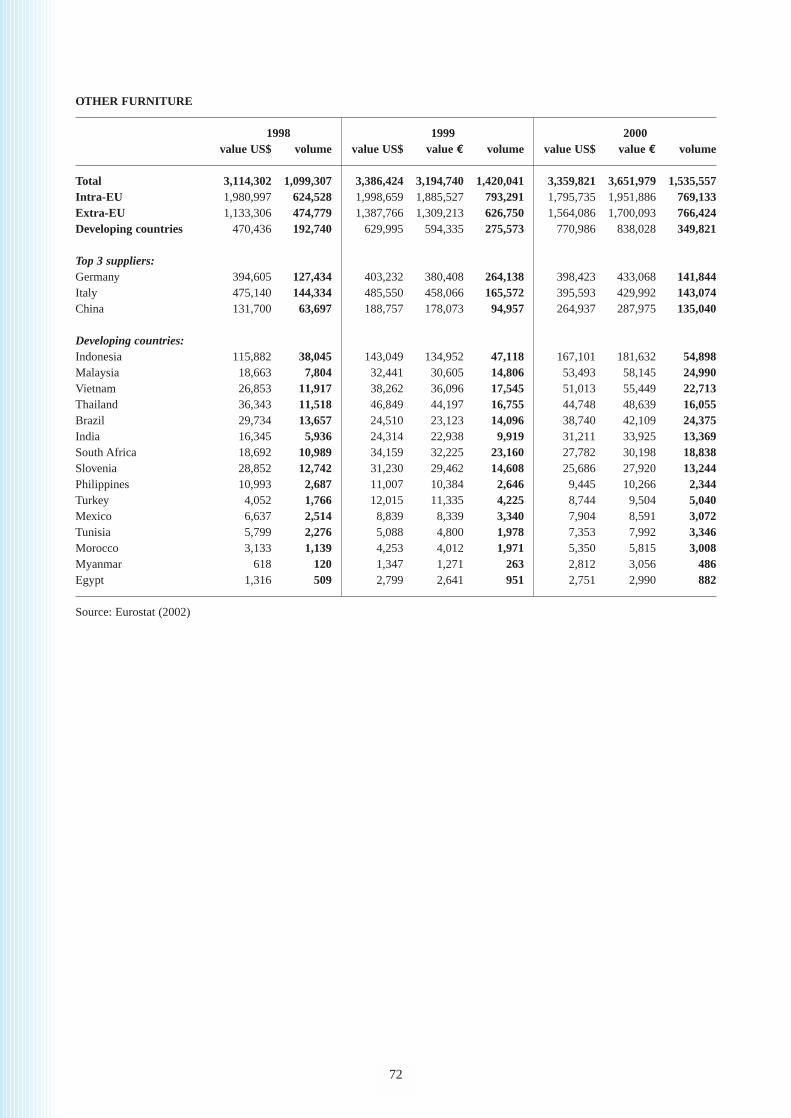
OTHER FURNITURE
1998 1999 2000value US$ volume value US$ value € volume value US$ value € volume
Total 3,114,302 1,099,307 3,386,424 3,194,740 1,420,041 3,359,821 3,651,979 1,535,557Intra-EU 1,980,997 624,528 1,998,659 1,885,527 793,291 1,795,735 1,951,886 769,133Extra-EU 1,133,306 474,779 1,387,766 1,309,213 626,750 1,564,086 1,700,093 766,424Developing countries 470,436 192,740 629,995 594,335 275,573 770,986 838,028 349,821
Top 3 suppliers:Germany 394,605 127,434 403,232 380,408 264,138 398,423 433,068 141,844Italy 475,140 144,334 485,550 458,066 165,572 395,593 429,992 143,074China 131,700 63,697 188,757 178,073 94,957 264,937 287,975 135,040
Developing countries:Indonesia 115,882 38,045 143,049 134,952 47,118 167,101 181,632 54,898Malaysia 18,663 7,804 32,441 30,605 14,806 53,493 58,145 24,990Vietnam 26,853 11,917 38,262 36,096 17,545 51,013 55,449 22,713Thailand 36,343 11,518 46,849 44,197 16,755 44,748 48,639 16,055Brazil 29,734 13,657 24,510 23,123 14,096 38,740 42,109 24,375India 16,345 5,936 24,314 22,938 9,919 31,211 33,925 13,369South Africa 18,692 10,989 34,159 32,225 23,160 27,782 30,198 18,838Slovenia 28,852 12,742 31,230 29,462 14,608 25,686 27,920 13,244Philippines 10,993 2,687 11,007 10,384 2,646 9,445 10,266 2,344Turkey 4,052 1,766 12,015 11,335 4,225 8,744 9,504 5,040Mexico 6,637 2,514 8,839 8,339 3,340 7,904 8,591 3,072Tunisia 5,799 2,276 5,088 4,800 1,978 7,353 7,992 3,346Morocco 3,133 1,139 4,253 4,012 1,971 5,350 5,815 3,008Myanmar 618 120 1,347 1,271 263 2,812 3,056 486Egypt 1,316 509 2,799 2,641 951 2,751 2,990 882
Source: Eurostat (2002)
72
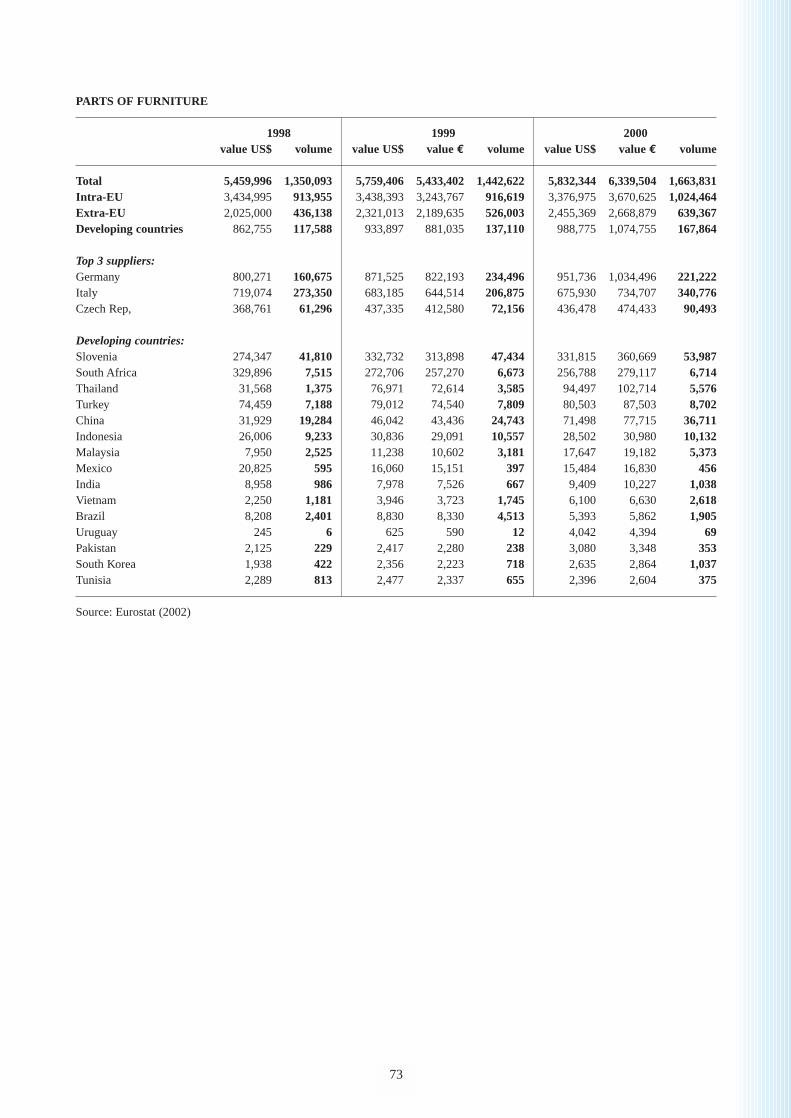
73
PARTS OF FURNITURE
1998 1999 2000value US$ volume value US$ value € volume value US$ value € volume
Total 5,459,996 1,350,093 5,759,406 5,433,402 1,442,622 5,832,344 6,339,504 1,663,831Intra-EU 3,434,995 913,955 3,438,393 3,243,767 916,619 3,376,975 3,670,625 1,024,464Extra-EU 2,025,000 436,138 2,321,013 2,189,635 526,003 2,455,369 2,668,879 639,367Developing countries 862,755 117,588 933,897 881,035 137,110 988,775 1,074,755 167,864
Top 3 suppliers:Germany 800,271 160,675 871,525 822,193 234,496 951,736 1,034,496 221,222Italy 719,074 273,350 683,185 644,514 206,875 675,930 734,707 340,776Czech Rep, 368,761 61,296 437,335 412,580 72,156 436,478 474,433 90,493
Developing countries:Slovenia 274,347 41,810 332,732 313,898 47,434 331,815 360,669 53,987South Africa 329,896 7,515 272,706 257,270 6,673 256,788 279,117 6,714Thailand 31,568 1,375 76,971 72,614 3,585 94,497 102,714 5,576Turkey 74,459 7,188 79,012 74,540 7,809 80,503 87,503 8,702China 31,929 19,284 46,042 43,436 24,743 71,498 77,715 36,711Indonesia 26,006 9,233 30,836 29,091 10,557 28,502 30,980 10,132Malaysia 7,950 2,525 11,238 10,602 3,181 17,647 19,182 5,373Mexico 20,825 595 16,060 15,151 397 15,484 16,830 456India 8,958 986 7,978 7,526 667 9,409 10,227 1,038Vietnam 2,250 1,181 3,946 3,723 1,745 6,100 6,630 2,618Brazil 8,208 2,401 8,830 8,330 4,513 5,393 5,862 1,905Uruguay 245 6 625 590 12 4,042 4,394 69Pakistan 2,125 229 2,417 2,280 238 3,080 3,348 353South Korea 1,938 422 2,356 2,223 718 2,635 2,864 1,037Tunisia 2,289 813 2,477 2,337 655 2,396 2,604 375
Source: Eurostat (2002)
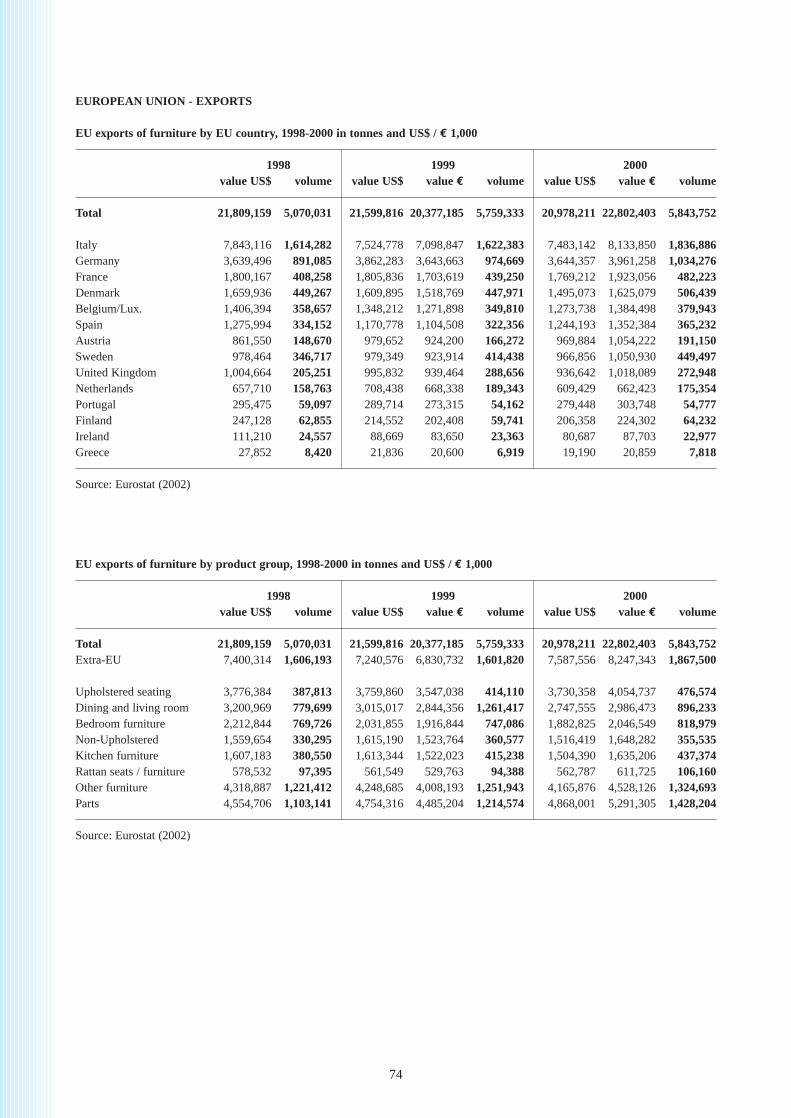
74
EUROPEAN UNION - EXPORTS
EU exports of furniture by EU country, 1998-2000 in tonnes and US$ / € 1,000
1998 1999 2000value US$ volume value US$ value € volume value US$ value € volume
Total 21,809,159 5,070,031 21,599,816 20,377,185 5,759,333 20,978,211 22,802,403 5,843,752
Italy 7,843,116 1,614,282 7,524,778 7,098,847 1,622,383 7,483,142 8,133,850 1,836,886Germany 3,639,496 891,085 3,862,283 3,643,663 974,669 3,644,357 3,961,258 1,034,276France 1,800,167 408,258 1,805,836 1,703,619 439,250 1,769,212 1,923,056 482,223Denmark 1,659,936 449,267 1,609,895 1,518,769 447,971 1,495,073 1,625,079 506,439Belgium/Lux. 1,406,394 358,657 1,348,212 1,271,898 349,810 1,273,738 1,384,498 379,943Spain 1,275,994 334,152 1,170,778 1,104,508 322,356 1,244,193 1,352,384 365,232Austria 861,550 148,670 979,652 924,200 166,272 969,884 1,054,222 191,150Sweden 978,464 346,717 979,349 923,914 414,438 966,856 1,050,930 449,497United Kingdom 1,004,664 205,251 995,832 939,464 288,656 936,642 1,018,089 272,948Netherlands 657,710 158,763 708,438 668,338 189,343 609,429 662,423 175,354Portugal 295,475 59,097 289,714 273,315 54,162 279,448 303,748 54,777Finland 247,128 62,855 214,552 202,408 59,741 206,358 224,302 64,232Ireland 111,210 24,557 88,669 83,650 23,363 80,687 87,703 22,977Greece 27,852 8,420 21,836 20,600 6,919 19,190 20,859 7,818
Source: Eurostat (2002)
EU exports of furniture by product group, 1998-2000 in tonnes and US$ / € 1,000
1998 1999 2000value US$ volume value US$ value € volume value US$ value € volume
Total 21,809,159 5,070,031 21,599,816 20,377,185 5,759,333 20,978,211 22,802,403 5,843,752Extra-EU 7,400,314 1,606,193 7,240,576 6,830,732 1,601,820 7,587,556 8,247,343 1,867,500
Upholstered seating 3,776,384 387,813 3,759,860 3,547,038 414,110 3,730,358 4,054,737 476,574Dining and living room 3,200,969 779,699 3,015,017 2,844,356 1,261,417 2,747,555 2,986,473 896,233Bedroom furniture 2,212,844 769,726 2,031,855 1,916,844 747,086 1,882,825 2,046,549 818,979Non-Upholstered 1,559,654 330,295 1,615,190 1,523,764 360,577 1,516,419 1,648,282 355,535Kitchen furniture 1,607,183 380,550 1,613,344 1,522,023 415,238 1,504,390 1,635,206 437,374Rattan seats / furniture 578,532 97,395 561,549 529,763 94,388 562,787 611,725 106,160Other furniture 4,318,887 1,221,412 4,248,685 4,008,193 1,251,943 4,165,876 4,528,126 1,324,693Parts 4,554,706 1,103,141 4,754,316 4,485,204 1,214,574 4,868,001 5,291,305 1,428,204
Source: Eurostat (2002)
INTERNATIONALInternational Standardisation Organisation (ISO)Address: P.O.Box 56, CH-1211 Geneva, SwitzerlandTelephone: + 41 (0) 22 7490111Fax: + 41 (0) 22 7333430E-mail: [email protected]
Forest Stewardship Council (FSC)Address: Avenida Hidalgo, 68000 Oaxaca, Oaxaca,
MexicoTelephone: + 52 (0) 951 46905/63244Fax: + 52 (0) 951 62110E-mail: [email protected]: www.fscoax.org
EUROPEAN UNIONEuropean Furniture Manufacturers Federation (UEA)Address: Rue Royale 109-111, 1000 Brussel, BelgiumTelephone: + 32 (0) 2 2181889Fax: + 32 (0) 2 2192701E-mail: [email protected]: www.ueanet.com/cen.html
GERMANYDeutsches Institut für Normung (DIN)Address: Burggrafenstrasse 4 - 10,
10787 Berlin, GermanyTelephone: + 49 (0) 30-26010Fax: + 49 (0) 30-26011231E-mail: [email protected]: www.din.de
FRANCEAssociation Française de Normalisation (AFNOR)Address: Tour Europe,
F-92049 Paris la Défense Cedex, FranceTelephone: + 33 (0) 1-42915555Fax: + 33 (0) 1-4291565Internet: www.afnor.fr
UNITED KINGDOMFIRA International Ltd.Address: Maxwell Road, Sevenage,
Hertfordshire SG1 2EW, United KingdomTelephone: + 44 (0) 1438 777700Fax: + 44 (0) 1438 777800E-mail: [email protected]: www.fira.co.uk
THE NETHERLANDSNetherlands Standardisation Institute(Nederlands Normalisatie Instituut (NNI))Address: Kalfjeslaan 2, P.O.Box 5059,
2600 GB Delft, The NetherlandsTelephone: + 31 (0) 15-2690390Telefax: + 31 (0) 15-2690190E-mail: [email protected]: www.nni.nl
75
APPENDIX 3 STANDARDS ORGANISATIONS
European Furniture Manufacturers Federation (UEA)Address: Rue Royale 109-111, 1000 Brussel, BelgiumTelephone: + 32 (0) 2 2181889Fax: + 32 (0) 2 2192701E-mail: [email protected]: www.ueanet.com
Centro Studi Industria Leggera (CSIL)Address: 15, Corso Monforte, 20122 Milano, ItalyTelephone: + 39 (0) 02 796630Fax: + 39 (0) 02 780703E-mail: [email protected]: www.worldfurnitureonline.com
International Trade Center (ITC)Address: Palais des Nations, P.O. Box 10,
1211 Geneve 10, SwitzerlandTelephone: + 41 (0) 22 7300111Fax: + 41 (0) 22 7334439E-mail: [email protected]: www.intracen.org
76
APPENDIX 4 SOURCES OF PRICE INFORMATION
APPENDIX 5 TRADE ASSOCIATIONS
EUROPEAN UNIONUEA - European Furniture Manufacturers FederationAddress: Rue Royale 109- 111,
B-1000 Brussels, BelgiumTelephone: + 32 (0) 2 2181889Fax: + 32 (0) 2 2192701E-mail: [email protected]: www.ueanet.com
BELGIUMNAVEM - Nationale Beroepsvereniging vanMeubelhandelaars Address: Trade Mart (C Verdieping/Calcuta 206),
P.O. Box 613, B-1020 Brussels, BelgiumTelephone: + 32 (0) 2 4784716Fax: + 32 (0) 2 4783766E-mail: [email protected]: www.furniturecenter.be
DENMARKAssociation of Danish Furniture Industries Address: Center Boulevard5, DK-2300 CopenhagenTelephone: + 45 (0) 70 268111Fax: + 45 (0) 70 268332E-mail: [email protected]: www.danishfurniture.dk
FRANCEIFA - Industries Françaises de L’AmeublementAddress: 28 bis, avenue Daumesnil, 75012 Paris, FranceTelephone: + 33 (0) 1 44681800Fax: + 33 (0) 1 44681801E-mail: [email protected]: www.meublefrance.com
GERMANYHDH - Hauptverband der Deutschen in Holz undKunstoffen MöbelAddress: Flutgraben 2, 53604 Bad Honnef, GermanyTelephone: + 49 (0) 222493770Fax: + 49 (0) 2224937777E-mail: [email protected]: www.hdh-ev.de
BVDM/Bundesverband des Deutschen Möbelhandels e.V.Address: Frangenheimstrasse 6,
D-5093 1 KöIn (Lindenthal), GermanyTelephone: + 49 (0) 221 403142Fax: + 49 (0) 221 4009396
ITALYAssArredoAddress: Foro Bonaparte 65, 20121 Milano, ItalyTelephone: + 39 (0) 02 806041Fax: + 39 (0) 02 80604392E-mail: [email protected]: www.federlegno.com
THE NETHERLANDSCBM/ Association of Furniture Manufacturers (Dufex)Address: P.O. Box 100,
2100 AC Heemstede, The NetherlandsTelephone: + 31 (0) 23 5158800Fax: + 31 (0) 23 5315538E-mail: [email protected]: www.cbm.nl
CBW / Central Association for furniture retailersAddress: Arnhemse Bovenweg 100,
3708 AG Zeist, The NetherlandsTelephone: + 31 (0) 30 6973100Fax: + 31 (0) 30 6919751E-mail: [email protected]: www.cbw.org
SPAINANIEME Address: Vinatea, 22-1a planta - 8a,
46001 Valencia, SpainTelephone: + 34 (0) 96 3153115Fax: + 34 (0) 96 3924861E-mail: [email protected]: www.anieme.com
F .E.C.M.I. Federacion Espanola de Comerciantes de MueblesAddress: C/ Juan Alvarez Mendizabal 3, 3e,
(Semiesquina a Plaza de Espana),28008 Madrid, Spain
Telephone: + 34 (0) 91 5426842Fax: + 34 (0) 91 5474937
SWEDENSMI - The Swedish Furniture IndustryAddress: Box 14012, SE-104 40 Stockholm, SwedenTelephone: + 46 (0) 8 230780Fax: + 46 (0) 8 7830596E-mail: [email protected]: www.mobelindustrie.se
77
UNITED KINGDOM B.F.M. / British Furniture ManufacturersAddress: 30 Harcourt Street, London W 1 H 2AA,
United KingdomTelephone: + 44 (0) 171 7240851Fax: + 44 (0) 171 7061924E-mail: [email protected]: www.bfm.org.uk
Independent Furniture Manufacturers Association(IFMA)Address: Norton Road, Newhaven, E Sussex BN9 0B2,
United KingdomTelephone: + 44 (0) 1273 513762Fax: + 44 (0) 1273 516735E-mail: [email protected]: www.ifma.co.uk
78
APPENDIX 6 TRADE FAIR ORGANISERS
BELGIUMFurniture Center Brussels (annual)Address: Atomium square 1, P.O. Box 211,
B-1020 Brussels, BelgiumTelephone: + 32 (0) 2 5562555Telefax: + 32 (0) 2 5562578E-mail: [email protected]: www.furniturecenter.be
DENMARKScandinavian Furniture Fair (annual)Address: Foreningen Dansk Mobelindustri, Center
Boulevard 5, DK-2300 Copenhagen, Denmark Telephone: + 45 (0) 70 268111Telefax: + 45 (0) 70 268332E-mail: [email protected]: www. danishfurniture.dk
FRANCESalon Internationale du Meuble (annual)Address: C.O.S.P, 22 avenue Franklin Roosevelt,
75008 Paris, FranceTelephone: + 33 (0) 1 40764500Telefax: + 33 (0) 1 45637824E-mail: [email protected]: www.salondumeuble.com
GERMANYInternational Furniture Fair - IMM (annual)Address: Köln Messe- und Austellungs GmbH,
P.O. Box 210760, 50532 Köln, GermanyTelephone: + 49 (0) 221 8210Telefax: + 49 (0) 221 8212574Internet: www.furniturefair-cologne.de
or www.imm-cologne.de
ITALYInternational Furniture Fair (annual)Address: Cosmit Spa., Foro Buonaparte 65,
20121 Milan, ItalyTelephone: + 39 (0) 02 725941Telefax: + 39 (0) 02 89011563E-mail: [email protected]: www.isaloni.it
THE NETHERLANDSMeubelvakbeurs (annual)Address: Royal Dutch Jaarbeurs, P.O. Box 8500,
3503 RM Utrecht, The NetherlandsTelephone: + 31 (0) 35 683 27 63Telefax: + 31 (0) 35 683 61 48Internet: www.jaarbeurs.nl or www.meubelvakbeurs.nl
Home Trade Center (permanent)Address: Symfonielaan 1,
3438 EW Nieuwengein, The NetherlandsTelephone: + 31 (0) 30 600 10 20Telefax: + 31 (0) 30 605 07 56E-mail: [email protected]: www.htc.nl
SPAINFIM International Furniture Fair (annual)Address: Feria Valencia, P.O. Box 476,
46080 Valencia, SpainTelephone: + 34 (0) 96 3861100Telefax: + 34 (0) 96 3636111E-mail: [email protected]: www.ifema.es
UNITED KINGDOMThe Furniture Show (annual)Address: Miller Freeman, 630 Chiswick High Road,
London W4 5BG, United KingdomTelephone: + 44 (0) 208 9877510Telefax: + 44 (0) 208 7423644E-mail: [email protected]: www.furnitureuk.co.uk
Into Home (annual)Address: Perfect Link, NEC Building, Birmingham,
United KingdomTelephone: + 44 (0) 8450 512610Telefax: + 44 (0) 8450 512655E-mail: [email protected]: www.intohome.co.uk
79
APPENDIX 7 TRADE PRESS
INTERNATIONALWorld Furniture International Market ReviewCentro Studi Industria Leggera (CSIL)Address: 15 Corso Monforte, 20122 Milano, ItalyTelephone: + 39 (0) 02 796630Fax: + 39 (0) 02 780703E-mail: [email protected]: www.worldfurnitureonline.com
GERMANYMöbelmarkt Verlag Matthias Ritthammer GmbHAddress: Andernacherstrasse 5a,
90411 Nürnberg, GermanyTelephone: + 49 (0) 911 955780Fax: + 49 (0) 911 955781lE-mail: [email protected]: www.moebelmarkt.de
Euwid Furniture Newsletter Address: Euwid GmbH, P.O. Box 1332,
76586 Gernsbach, GermanyTelephone: + 49 (0) 7224 93970Fax: + 49 (0) 7224 939910E-mail: [email protected]: www.euwid.de
Möbel- KulturFerdinand Holzmann Verlag GmbHAddress: Mexicoring 37, 22297 Hamburg, GermanyTelephone: + 49 (0) 40 6320180Fax: + 49 (0) 40 6307510E-mail: [email protected]: www.moebelkultur.de
FRANCELe Courrier du Meuble et de I’HabitatEditions du TigreAddress: 23, Rue Joubert, 75009 Paris, FranceTelephone: + 33 (0) 1 48745250Fax: + 33 (0) 1 40164365E-mail: [email protected]
Revue de I’ AmeublementEditions du Tigre SARLAddress: 23, Rue Joubert, 75009 Paris, France Telephone: + 33 (0) 1 48745250Fax: + 33 (0) 1 45262918
Univers HebdoAddress: 7, Rue de Paradis, 75010 Paris, FranceTelephone: + 33 (0) 1 47706770Fax: + 33 (0) 1 47706760
ITALYFedermobili Address: Cartesio Srl, Via Vincenzo de Filicaia 7,
1-10162 Milan, ItalyTelephone: + 39 (0) 2 66103539Fax: + 39 (0) 2 66103558
Design Diffusion Editioni Address: Via Lucano 3, 20135 Milan, ItalyTelephone: + 39 (0) 02 5516109Fax: + 39 (0) 02 5456803E-mail: [email protected]: www.designdiffusion.it
THE NETHERLANDSWonen/CBWAddress: P.O. Box 762, 3700 AT Zeist, The NetherlandsTelephone: + 31 (0) 30 6973150Fax: + 31 (0) 30 6919751E-mail: [email protected]: www.cbw.org
MeubelAddress: Uitgeverij Lakerveld BV, Turfschipper 53,
2292 JC Wateringen, The NetherlandsTelephone: + 31 (0) 174 315000Fax: + 31 (0) 174 315003E-mail: [email protected]: www.meubel.nl
SPAINASEMCOM Address: Promocion de Ediciones y Medios,
Santa Hortensia 15-4, 28002 Madrid, SpainTelephone: + 34 (0) 91 914157240Fax: + 34 (0) 91 915195606Internet: www.spanishfurniture.com
El MobiliarioAddress: Cactus Press Ltd., Manresa, 2 Edif.El Chalet,
08860 Castelldefels, Barcelona, SpainTelephone: + 34 (0) 93 6365300Fax: + 34 (0) 93 6640828E-mail: [email protected]
Muebles De Espagna Address: EDHISOA S.L, Avenida César Giorgeta,
30 esc. 1 pta. 4, 46007 Valencia, SpainTelephone: + 34 (0) 96 3415494Fax: + 34 (0) 96 3415497Internet: www.spanishfurniture.com
80

UNITED KINGDOM Furniture & Furnishing Industry 2001(Directory to the Furniture Trade)Address: Miller Freeman, 630 Chiswick High Road,
London W4 5BG, United KingdomTelephone: + 44 (0) 208 9877750Telefax: + 44 (0) 208 7423644E-mail: www.furnitureuk.co.uk
81
APPENDIX 8 BUSINESS SUPPORT ORGANISATIONS
INTERNATIONALInternational Trade Center (ITC)Market News Service (MNS)Division of Product and Market Development Address: Palais des Nations, P.O. Box 10,
1211 Geneva 10, SwitzerlandTelephone: + 41 (0) 22 7300111Fax: + 41 (0) 22 7334439E-mail: [email protected]: www.intracen.org
AUSTRIAAustria Federal Economic ChamberAddress: Wiener Hauptstrasse 63, 1045 Vienna, AustriaTelephone: + 43 (0) 1 501050Fax: + 43 (0) 1 50206250E-mail: [email protected]: www.wk.or.at
DENMARKThe Danish Import Promotion Office for products fromdeveloping countries (DIPO)Address: Danish Chamber of Commerce, Børsen,
1217 Copenhagen K, DenmarkTelephone: + 45 (0) 33 950500Fax: + 45 (0) 33 325216E-mail: [email protected]: www.commerce.dk
FRANCECOLEACPAddress: 5 Rue de la Corderie, Centra 342,
94586 Rungis Cedex, FranceTelephone: + 33 (0) 1 41800210Fax: + 33 (0) 1 41800219E-mail: [email protected]: www.coleacp.org
GERMANYBFAI, Federal Office of Foreign Trade Information,Germany Berlin Office Address: Scharnhornstrasse 36, P.O. Box 650268,
13302 Berlin, Germany Telephone: + 49 (0) 30 20145200Fax: + 49 (0) 30 20145204Internet: www.bfai.de
Köln OfficeAddress: Agrippastrasse 87-93, P.O. Box 100522,
50455 Köln, Germany Telephone: + 49 (0) 221 20570Fax: + 49 (0) 221 2057212E-mail: [email protected]
ITALYICE(National Institute for Foreign Trade)Address: Via Liszt 21, 00144 Rome, ItalyTelephone: + 39 (0) 6 59921Fax: + 39 (0) 6 59926900E-mail: [email protected]: www.ice.it
THE NETHERLANDSCBI(Centre for the Promotion of Imports from developingcountries)Address: P.O. Box 30009,
3001 DA Rotterdam, The NetherlandsTelephone: + 31 (0) 10 2013434Fax: + 31 (0) 10 4114081E-mail: [email protected]: www.cbi.nl
NORWAYThe Norwegian Agency for Development Cooperation(NORAD)Address: Tolbugaten 31, P.O. Box 8034 Deo, Oslo,
NorwayTelephone: + 47 (0) 22 314400Fax: + 47 (0) 22 314403E-mail: [email protected]
SWEDENThe Swedish International Development CooperationAgency (SIDA)Department for Infrastructure & Economic CooperationAddress: S-105 25 Stockholm, SwedenTelephone: + 46 (0) 8 6985000Fax: + 46 (0) 8 208864
SWITZERLANDOSEC(Swiss Office for Trade Promotion) Address: Stampsenbachstrasse 85,
8035 Zürich, SwitzerlandTelephone: + 41 (0) 1 3655151Telefax: + 41 (0) 1 3655221E-mail: [email protected]: www.sippo.ch
82
APPENDIX 9 OTHER USEFUL ADDRESSES
INTERNATIONALUnited Nations Industrial Development Organisation(UNIDO)Mr. Hallet (ext. 5265), Mr. Lewissianos (ext. 3715)Address: P.O. Box 300, Vienna International Centre,
1400 ViennaTelephone: + 43 (0) 1 26026Telefax: + 43 (0) 1 2692669
International Tropical Timber Organisation (ITTO)Address: International Organisations Center, 5th Floor,
Pacifico Yokohama, 1-1-1, Minato Mirai,Nishi-Ku, Yokohama, 220 Japan
Telephone: + 81 (0) 45 2231110Telefax: + 81 (0) 45 2231111
FAO - Forestry Department (FAO)Publication and Information coordinatorAddress: Ville delle Terme di Caracalla,
00100 Rome, ItalyTelephone: + 41 (0) 06 57054778Fax: + 41 (0) 06 57052151E-mail: [email protected]: www.fao.org/forestry/
EUROPEAN UNIONAssociation of the European Chambers of Commerce andindustryAddress: Rue Archimède 5, P.O. Box 4,
B-1000 Brussels, BelgiumTelephone: + 32 (0) 2 2310715Fax: +32 (0) 2 2300038E-mail: [email protected]
Eurostat, Statistical Bureau of the European Union Address: Rue Alcide de Gasperi, L-2920 Luxembourg,
LuxembourgTelephone: + 352 (0) 4301 34567Fax: + 352 (0) 4301 3015E-mail: [email protected]: www.eurostat.eu.int/eurostat.html
Corporate Intelligence Group (CIG) / MintelAddress: 18-19 Long Lane, London EC1A 9PL,
United KingdomTelephone: + 44 (0) 207 76065932Fax: + 44 (0) 171 6969004Internet: www.cior.com or www.mintel.com
GTZ (German Agency for Technical Cooperation)Address: Dag-Hammerskjöld-weg 1-5, P.O. Box 5180,
65726 Eschborn, GermanyTelephone: + 49 (0) 6196 790000Fax: + 49 (0) 6196 797414E-mail: [email protected]
THE NETHERLANDSCBICentre for the Promotion of Imports from developingcountriesAddress: P.O. Box 30009,
3001 DA Rotterdam, The NetherlandsTelephone: + 31 (0) 10 2013434Fax: + 31 (0) 10 4114081E-mail: [email protected]: www.cbi.nl
Home Trade Center (exposition of furniture)Address: P.O. Box 7207, 3430 JE NieuwegeinTelephone: + 31 (0) 30 6047566Telefax: + 31 (0) 30 6050756Internet: www.htc.nl
Mileudefensie - Hart voor Hout lijn (tel: 31 20 6269161)(Dutch Foundation for protection of tropical timber)Address: Postbus 19199,
1000 GD Amsterdam, The NetherlandsTelephone: + 31 (0) 20 5507300Telefax: + 31 (0) 20 5507310E-mail: [email protected]
Belasting Dienst Douane (Customs)Dept. External and Internal CommunicationAddress: P.O.Box 50964,
3007 BG Rotterdam, The NetherlandsTelephone: + 31 (0) 10 2904949
Special information number + 31 (0) 800-0143Fax: + 31 (0) 10 2904875Internet: www.douane.nl
CBI / AccessGuide c/o CBI, Centre for the Promotion ofImports from developing countriesAddress: P.O. Box 30009,
3001 DA Rotterdam, The NetherlandsTelephone: + 31 (0) 10 2013434Fax: + 31 (0) 10 4114081E-mail: [email protected]: www.cbi.nl/accessguide
83
APPENDIX 10 LIST OF DEVELOPING COUNTRIES
Please note that the list of developing countries from the OECD (Organisation for Economic Co-operation and Development), asapplied in this market survey, may include countries that are not immediately being considered as developing countries (e.g. China).
Afghanistan Guinea-Bissau São Tomé & PrincipeAlbania Guyana Saudi ArabiaAlgeria Haiti Senegal Angola Honduras Seychelles Anguilla India Sierra Leone Antigua and Barbuda Indonesia Slovenia Argentina Iran Solomon Islands Armenia Iraq Somalia Azerbaijan Jamaica South Africa Bahrain Jordan Sri Lanka Bangladesh Kazakstan St. Helena Barbados Kenya St. Kitts-Nevis Belize Kiribati St. Lucia Benin Korea, Rep. of St. Vincent and GrenadinesBhutan Kyrghyz Rep. Sudan Bolivia Laos Surinam Bosnia & Herzegovina Lebanon Swaziland Botswana Lesotho Syria Brazil Liberia Tajikistan Burkina Faso Macedonia Tanzania Burundi Madagascar Thailand Cambodia Malawi Timor Cameroon Malaysia Togo Cape Verde Maldives Tokelau Central African rep. Mali Tonga Chad Malta Trinidad & Tobago Chile Marshall Islands Tunisia China Mauritania Turkey Colombia Mauritius Turkmenistan Comoros Mayotte Turks & Caicos Islands Congo Mexico Tuvalu Cook Islands Micronesia, Fed. States Uganda Costa Rica Moldova Uruguay Côte d’Ivoire Mongolia Uzbekistan Croatia Montserrat Vanuatu Cuba Morocco Venezuela Djibouti Mozambique Vietnam Dominica Myanmar Wallis & Futuna Dominican republic Namibia Western SamoaEcuador Nauru Yemen Egypt Nepal Yugoslavia, Fed. Rep. El Salvador Nicaragua Zaire Equatorial Guinea Niger Zambia Eritrea Nigeria Zimbabwe Ethiopia Niue Fiji OmanGabon Pakistan Gambia Palau Islands Georgia Palestinian Admin. Areas Gabon Panama Ghana Papua New Guinea Grenada Peru Guatemala Philippines Guinea Rwanda
Note: Eurostat figures do not include figures of Cook Islands, Niue, St. Kitts-Nevis, Timor and Tokelau January 2000
84
NETHERLANDS IMPORTERSAhrend(Importer of office furniture)Address: Croy 1, 5653 LC EindhovenTelephone: + 31 (0) 40 2914200Telefax: + 31 (0) 40 2914301E-mail: [email protected]: www.ahrend.nl
Art of Living (Importer of living and dining room furniture)Address: Stolwijksestraat 55a, 3079 DN RotterdamTelephone: + 31 (0) 10 4362174Telefax: + 31 (0) 10 4360644E-mail: [email protected]: www.artofliving.nl
Bergers Interieurs BV (Importer of furniture)Address: Roderijseweg 23-25,
2651 BM Berkel en RodenrijsTelephone: + 31 (0) 10 5115133Telefax: + 31 (0) 10 5116302E-mail: [email protected]: www.bergers.nl
Berkelrode BV Handelsonderneming (Manufacturer/Importer of dining and living room furniture)Address: P.O. Box 95, 2650 AB Berkel en RodenrijsTelephone: + 31 (0) 10 5114850Telefax: + 31 (0) 10 5112781
Carpeti BV (Importer of garden furniture)Address: Kapt. Hatterasstraat 48, 5015 BB TilburgTelephone: + 31 (0) 13 5433155Telefax: + 31 (0) 13 5432234
Den Uyl Handelsonderneming BV (importer of rattan and wood) Address: Dieselstraat 2, 8263 AE KampenTelephone: + 31 (0) 38 3370661Telefax: + 31 (0) 38 3370664
Eurotan (Manufacturer/Importer of dining and living furniture)Address: Kanaal Z 120, 7332 BD ApeldoornTelephone: + 31 (0) 55 5394840Telefax: + 31 (0) 55 5394839E-mail: [email protected]
Frans Bijnen Meubelen BV (Importer of furniture)Address: De Run 4311, 5503 LP VeldhovenTelephone: + 31 (0) 40 2541515Telefax: + 31 (0) 40 2541225
Frezza Holland (Importer of office furniture)Address: Ridderpoort 11, 2984 BG RidderkerkTelephone: + 31 (0) 180 419606Telefax: + 31 (0) 180 419680
J.C.J. Haans BV (Importer of dining and living room furniture)Address: Mina Krusemanweg 1, 5032 ME Tilburg,Telephone: + 31 (0) 13 5947947Fax: + 31 (0) 13 5947944E-mail: [email protected]: www.haans.com
Hamefa Furniture BV (Importer of furniture)Address: Duiveland 3, 1948 RB BeverwijkTelephone: + 31 (0) 251 220351Fax: + 31 (0) 251 221455E-mail: [email protected]: www.hamefa.nl
Hoogebeen Interieur (Importer of rattan and teak furniture) Address: Dorpstraat 36-38, 3881 BD PuttenTelephone: + 31 (0) 341 353292Telefax: + 31 (0) 341 360016
Key Trading BV(Importer of furniture, including rattan)Address: Oliemolenweg 9, 6871 NS RenkumTelephone: + 31 (0) 317 313318Telefax: + 31 (0) 317 319818
Mondirama Europe BV (Importer of furniture, including rattan)Address: Zuidhollandsedijk 181, 5171 TN KaatsheuvelTelephone: + 31 (0) 416 272315Telefax: + 31 (0) 416 530073E-mail: [email protected]: www.mondirama.nl
85
APPENDIX 11 LIST OF RELEVANT IMPORTERS IN THENETHERLANDS AND SELECTED EU MARKETS
Montis BV (Importer of living and dining room furniture, wall units)Address: Steenstraat 2, 5107 NE DongenTelephone: + 31 (0) 162 377777Telefax: + 31 (0) 162 377710E-mail: [email protected]: www.montis.nl
Ross Tucker Meubelen (Importer of colonial and rattan furniture) Address: Feithspark 17, 9356 BX TolbertTelephone: + 31 (0) 594 516017Telefax: + 31 (0) 594 512962E-mail: [email protected]
Some BV (Trader of furniture, including rattan)Address: Het Haagje 132, 7906 AD HoogeveenTelephone: + 31 (0) 528 274023Telefax: + 31 (0) 528 274936
Steverink, Jan (Importer of reproduction and garden furniture)Address: Anholtseweg 40, 7091 HB DinxperloTelephone: + 31 (0) 315 655130Fax: + 31 (0) 315 341749E-mail: [email protected]: www.jan-steverink.com
Universo (Importer of furniture)Address: Kerkstraat 183, 1017 GH AmsterdamTelephone: + 31 (0) 20 6231871Telefax: + 31 (0) 20 4271161
Ufficio Benelux BV (Importer of office furniture)Address: Stuttgartstraat 22-24, 3047 AS RotterdamTelephone: + 31 (0) 10 4371244Fax: + 31 (0) 10 4371287E-mail: [email protected]: www.ufficiobenelux.com
Zijlstra BV (Importer of furniture)Address: Edisonstraat 27, 4004 JL TielTelephone: + 31 (0) 344 676767Fax: + 31 (0) 344 676700E-mail: [email protected]: www.zijlstra.nl
BUYING GROUPS
Intres BVAddress: P.O. Box 150,
3870 CD Hoevelaken, The NetherlandsTelephone: + 31 (0) 33 2532911Fax: + 31 (0) 33 2532299E-mail: [email protected]: www.intres.nl
Euretco Wonen BVAddress: Archimedesstraat 17,
4816 BA Breda, The NetherlandsTelephone: + 31 (0) 76 5785597Fax: + 31 (0) 76 5785753E-mail: [email protected]: www.euretco.nl
FURNITURE CHAIN STORES/ DIY STORES
Hartman Groep BV (Importer of certified wooden garden furniture) Address: Goolkatenweg 55, P.O. Box 505,
7521 BE EnschedeTelephone: + 31 (0) 53 4885555Telefax: + 31 (0) 53 4335790E-mail: [email protected]: www.hartman.nl
IKEA NederlandAddress: P.O. Box 23055,
1100 DN Amsterdam ZO, The NetherlandsTelephone: + 31 (0) 20 5643888Fax: + 31 (0) 20 6971824Internet: www.ikea.com
KoophomeAddress: Wijkermeerweg 43,
1948 NT Beverwijk, The NetherlandsTelephone: + 31 (0) 251 213668Fax: + 31 (0) 251 213486
Leen Bakker B.V.(Importer of knock-down furniture)Address: P.O. Box 43,
4940 AA Raamsdonksveer, The NetherlandsTelephone: + 31 (0) 162 583100Fax: + 31 (0) 162 516522Internet: www.leenbakker.nl
Montel / FauteuillerieNijman International B.V.Address: P.O. Box 3039,
3502 GA Utrecht, The NetherlandsTelephone: + 31 (0) 30 2885455Fax: + 31 (0) 30 2892880
86
W. Poppeliers Meubelen B.V.Address: Videostraat 21,
1322 AA Almere, The NetherlandsTelephone: + 31 (0) 36 5365843Fax: + 31 (0) 36 5366718
Sanders MeubelstadAddress: P.O. Box 32,
8050 AA Hattem, The NetherlandsTelephone: + 31 (0) 38 4431531Fax: + 31 (0) 38 4446800Internet: www.sanders.nl
Trendhopper International BVAddress: Plesmanstraat 1,
3833 LA Leusden, The NetherlandsTelephone: + 31 (0) 33 4343444Fax: + 31 (0) 33 4343440Internet: www.trendhopper.nl
Kwantum Nederland B.V.Address: P.O. Box 90160,
5000 LK Tilburg, The NetherlandsTelephone: + 31 (0) 13 4626626Fax: + 31 (0) 13 4637979Internet: www.kwantum.nl
Intergamma BV (Gamma - DIY) Address: P.O. Box 700, 3740 AR BaarnTelephone: + 31 (0) 35 5485222Telefax: + 31 (0) 35 5414002Internet: www.gamma.nl
DEPARTMENT STORES
De Bijenkorf (Vendex/KBB) Address: P.O. Box 12870,
1100 AW Amsterdam, The NetherlandsTelephone: + 31 (0) 20 6526526Fax: + 31 (0) 20 6973926Internet: www.bijenkorf.nl
Hema (Vendex/KBB)Address: P.O. Box 23220,
1100 DS Amsterdam, The NetherlandsTelephone: + 31 (0) 20 3114411Fax: + 31 (0) 20 3114000Internet: www.hema.nl
Vroom & Dreesmann Nederland (Vendex/KBB)Address: P.O. Box 276,
1000 AG Amsterdam, The NetherlandsTelephone: + 31 (0) 20 5959111Fax: + 31 (0) 20 6926150Internet: www.vroomendreesmann.nl
MAIL ORDER
Morres Meubelbedrijven B.V.Address: P.O. Box 40, 4560 VB Hulst, The NetherlandsTelephone: + 31 (0) 114 388388Fax: + 31 (0) 114 319988
Wehkamp B.V.Address: P.O. Box 400,
8000 AK Zwolle, The NetherlandsTelephone: + 31 (0) 38 4973311Fax: + 31 (0) 38 4973495Internet: www.wehkamp.nl
RELEVANT IMPORTERS IN THE SELECTED EU MARKETS
GERMANYBergmann GmbH (Importer of country style furniture)Address: Haferbachstrasse 9 - 15,
D-32791 Lage-Kachtenhausen, GermanyTelephone: + 49 (0) 5232 9740Fax: + 49 (0) 5232 974355E-mail: [email protected]: www.bergmann-moebel.de
Elro Ellsässer GmbH (Importer of dining and living room furniture)Address: Graf-Benzelstrasse,
D-72108 Rottenburg/Neckar, GermanyTelephone: + 49 (0) 7472 98280Fax: + 49 (0) 7472 982830E-mail: [email protected]
HABA, Habermaass GmbH (Importer of children’s furniture)Address: August-Groschstrasse 28-38,
D-96473 Bad-Rodach, GermanyTelephone: + 49 (0) 9564 929100Fax: + 49 (0) 9564 3513E-mail: [email protected]: www.haba.de
Hansen Lloyd Loom (Importer and manufacturer of rattan ‘Loom’ furniture)Address: An der Friedensburg 20-22,
D-52511 Geilenkirchen/Aachen, GermanyTelephone: + 49 (0) 2451 62060Fax: + 49 (0) 2451 620690E-mail: [email protected]: www.hansenrattan.de
87
Incasa Natur. Holz. Möbel GmbH (Manufacturer of wooden furniture)Address: Auf der Frankenburg 11-13,
D-32839 Steinheim, GermanyTelephone: + 49 (0) 5233 94120Fax: + 49 (0) 5233 7876E-mail: [email protected]: www.incasa-moebel.de
Grombach GmbH & Co. KG(Importer of furniture)Address: Wiessenstrasse 20,
D-97215 Uffenheim, GermanyTelephone: + 49 (0) 9842 2020Fax: + 49 (0) 9842 20250E-mail: [email protected]: www.grombach.de
Locker GmbH(Importer of rattan furniture)Address: Wallweg 4, 96328 Küps, GermanyTelephone: + 49 (0) 9264 563Fax: + 49 (0) 9264 6452Internet: www.locker.de
Heinrich Kruger&Sohn GmbH(Importer of rattan furniture)Address: An der Kleimannbrucke 52,
4400 Münster, GermanyTelephone: + 49 (0) 251 328060Fax: + 49 (0) 251 32892600
Gansberg Korbwaren GmbH(Importer of rattan furniture)Address: P.O. Box 105564, 2800 Bremen 1, GermanyTelephone: + 49 (0) 421 3995160
Hambur-Bergedorfer-Stuhlrohrfabrik(Manufacturer of wooden and rattan chairs)Address: Stuhlrohrstrasse 10,
21008 Hamburg, GermanyTelephone: + 49 (0) 40 7212041Fax: + 49 (0) 40 7214879
FRANCEAtelier du Vendelaise S.A.(Importer of small wooden furniture)Address: J.Y. Brault, 10 Rue de la Fontaine,
F-35210 Chattillon en Vendelais, FranceTelephone: 33 2 99 761173Telex: 33 2 99 761113
Anbry Gaspard(Importer of rattan furniture)Address: 3, Rue de la Baugerie,
544120 Baccarat, FranceTelephone: 33 83 751268Fax: 33 83 754545
JEFKA(Importer of occasional furniture)Address: BP 15, F-55130 Gondrecourt le Chateau,
FranceTelephone: 33 3 29913022Fax: 33 3 29897840E-mail: [email protected]: www.jefka.fr
Comptoir Commercial France Indochine(Group of importers of rattan and wooden furniture)Address: 32, boulevard Boues, 13003 Marseille, FranceTelephone: 33 91 501778Fax: 33 91 845362
Pierson (Importers of country style furniture)Address: ZI. de Chauvoncourt BP 28,
F-55300 Saint. Michiel, FranceTelephone: + 49 (0) 6398 993101 Fax: + 49 (0) 6398 993102Internet: www.pierson.fr
Vibel Provib(Importer of children’s furniture)Address: 40 route de Vezelay,
F-89460 Bazarnes, FranceTelephone: 33 386 425902Fax: 33 386 422812E-mail: [email protected]: www.vibel.com
ITALYBardola spa(Importer of rattan furniture)Address: Via Milite Ignoto 11, 16012 Busalla, ItalyTelephone: 39 10 9640791Fax: 39 10 9644119116
Bornia Vittorio(Importer of rattan furniture)Address: Via Grave, 31020 S.Maria del Paive, ItalyTelephone: 39 4338 289920
Calligaris SPA(Manufacturer and importer of tables, chairs and occasionalfurniture)Address: Viale Trieste 12, I-33044 Manzano (UD), ItalyTelephone: 39 0432 748211Fax: 39 0432 750104E-mail: [email protected]: www.calligaris.it
88
Girasole International (Importer of furniture)Address: L. Negrellistr. 4, I-39100 Bozen, ItalyTelephone: 39 0471 240100Fax: 39 0471 240101E-mail: [email protected]: www.girasole.com
IMS Srl(Importer of dining and living room furniture and parts)Address: Via Parini 19, I-33044 Manzano (UD), ItalyTelephone: 39 0432 749411Fax: 39 0432 749495E-mail: [email protected]: www.idgroup.it/ims
Roberti Rattan(Importer of rattan furniture)Address: Z.I. Via Madonna di Loreto,
31010 Corbanese (TV), ItalyTelephone: 39 0438 933022Fax: 39 0438 933005E-mail: [email protected]: www.roberti-rattan.it
Sech Rattan spa(Importer of rattan furniture)Address: Via J F Kennedy 16, 310053 Barbisano, ItalyTelephone: 39 4338 840446Fax: 39 4338 840449
Varaschin Spa(Importer of dining room furniture)Address: Via Cervano 20, 1-31010 Formeniga di
Vittorio, Veneto (TV), ItalyTelephone: 39 0438 933010Fax: 39 0438 933004E-mail: [email protected]: www.varaschin.it
UNITED KINGDOMErcol Furniture Ltd.(Importer of dining and living room furniture)Address: London Road, High Wycombe,
Buckinghamshire, HP13 7AE,United Kingdom
Telephone: + 44 (0) 1494 521261Fax: + 44 (0) 1494 462467E-mail: [email protected]: www.ercol.com
Caxton Furniture(Importer of furniture)Address: Springfield Road, Highbridge,
Somerset TA9 3AA, United KingdomTelephone: + 44 (0) 1278 787511Fax: + 44 (0) 1278 781337
Frank Hudson & Sons Limited(Importer of furniture)Address: Roseberry Avenue, High Wycombe,
Bucks HP13 7AH, United KingdomTelephone: + 44 (0) 1494 522011Fax: + 44 (0) 1494 436158
Link International Limited(Importer of furniture)Address: Bremhill, Highbridge, Caine, Wilts SN11 9LJ,
United KingdomTelephone: + 44 (0) 12+ 49 (0) 812121Fax: + 44 (0) 1249 813435
New Heritage(Importer of furniture)Address: Unit 9, Sutton Oak Drive, Baxters Lane
Industrial Estate, St Helens,Merseyside WA9 3PH, United Kingdom
Telephone: + 44 (0) 1744 811557Fax: + 44 (0) 1744 850559
Oceans Apart Ltd.(Importer of furniture)Address: 24-26 King Street, Salford,
Manchester M3 7DG, United KingdomTelephone: + 44 (0) 161 8352003Fax: + 44 (0) 161 8352320
Shelco Furniture Limited(Importer of furniture)Address: 10 Gorsuch Street, London E2 8HA,
United KingdomTelephone: + 44 (0) 171 7293125Fax: + 44 (0) 171 7296778
Stax Trade Centres plc(Importer of garden furniture)Address: Units 1-4 Holloway Drive, The Wardley
Industrial Estate, Worsley,Manchester M28 2LA, UK
Telephone: + 44 (0) 161 7288000Fax: + 44 (0) 161 7288010
SPAINCRA Girona A Ripoll(Manufacturer and importer of furniture)Address: KM. 16 Banyoles, 17820 Gerona, SpainTelephone: + 34 (0) 97 2570472Fax: + 34 (0) 97 2574806
Milmueble S.A.(Manufacturer of furniture)Address: Ctra. Valencia, Barcelona KM. 145, Vinaros,
12500 Castellon, SpainTelephone: + 34 (0) 96 4450166Fax: + 34 (0) 96 4456788E-mail: [email protected]
89
Mobientorno S.A.(Manufacturer and importer of furniture)Address: San Martin, 30/pol ind, De Bobalar, Alaquas,
46970 Valencia, SpainTelephone: + 34 (0) 96 1512221Fax: + 34 (0) 96 507681
Mobledor(Manufacturer and importer of country and reproductionfurniture)Address: c/Tapiceros 2,
E-46200 Paiporta (Valencia), SpainTelephone: + 34 (0) 96 3973494Fax: + 34 (0) 96 3960102
Muebles Treku S.A.(Manufacturer and importere of children’s furniture)Address: Olabidea 9, E-20800 Zarautz, SpainTelephone: + 34 (0) 943 130840Fax: + 34 (0) 943 130585E-mail: [email protected]: www.treku-mobiliario.com
Natuantaix S.A.(Manufacturer of furniture)Address: Carretera Santa, Barbara s/n, La Senia,
43560 Tarragona, SpainTelephone: + 34 (0) 97 7709100Fax: + 34 (0) 97 7709137E-mail: [email protected]
Talleres de Mobles Mattias Guarro S.A.(Manufacturer and importer of furniture)Address: C/Olzinelles 43, Barcelona,
08014 Barcelona, SpainTelephone: + 34 (0) 93 4211322Fax: + 34 (0) 93 4219330
Zadise Muebles Auxiliares S.L.(Manufacturer and importer of furniture)Address: Ctra. de Villena, s/n Yecla,
30510 Murcia, SpainTelephone: + 34 (0) 98 8796957Fax: + 34 (0) 98 8794519E-mail: [email protected]
Other Spanish importers can be found at:www.spanishfurniture.com
90
APPENDIX 12 USEFUL INTERNET SITES
UEA - website: www.ueanet.comThis site has been set up by the UEA (European FurnitureManufacturers Federation) and provides information onEuropean furniture markets, production, trade channels,imports/exports, technical developments, CEN qualitystandards and international trade fairs. The latest developments in the EU furniture industry arecovered in their newsletter and this site has linkages toother useful databases. For example to www.funstep.orgwith news on quality standards and the latest technologyin furniture.
Csil - website: www.worldfurnitureonline.comThis site provides information on the international furnitureindustry and has a news service with summaries of theirlatest published market reports. It also gives a good selectionof links to trade associations, publishers and organisationsinvolved in the furniture and wood sectors.
Furnitureweb: www.furnitureweb.comThis site gives information on global market and productiondevelopments in furniture. Its main purpose is to providecontacts between furniture manufacturers on a global basis.Information on production-related items such as machinery,components and new products are also given on this site.
Corridor: www.corridor.comThis is an on-line trading system for the UK furniture industry.In addition, it provides information on the latest trends inthe UK and International furniture markets, but also for floorcoverings, lightening and furnishing accessories. It is a goodpossibility for contacting UK importers.
Ameublement: www.ameublement.comThis is an on-line trading system for the French furnitureindustry. In addition, it provides information on the latesttrends in the French furniture markets and given contactdetails of French importers.
Spanish Furniture: www.spanishfurniture.comThis site is a database of Spanish furniture companies, alongwith the addresses of Spanish furniture manufacturers andimporters. Information on this site is also given in English.A similar useful site is www.infurma.com
Furniture Belgium: www.belgofurn.com andwww.furniturecenter.be
This site provides information on the Belgian furnitureindustry and provides profiles of Belgian furniture importers.
Rattan furniture: www.rattanlink.com and www.furniture-indonesia.com
This site has been set up by manufacturers and traders ofrattan furniture and provides information on wordwidemarkets, production, technical developments, qualitystandards and trade fairs.
91

92
CBI puts you in touch with the markets of Europe
CBI, the Centre for the Promotion of Imports from developing countries, is an agencyof the Netherlands Ministry of Foreign Affairs. Since its establishment in 1971, CBIoperates within the policy framework set by the Minister for Development Co-operation.Its mission is to contribute to the economic independence of developing countries.To fulfil this mission, CBI aims at strengthening the competitiveness of companies inthose countries on international markets, primarily the West-European market, byimproving conditions in enterprises and business support organisations. CBI considerssocial values and compliance with the most relevant environmental requirements to bean integral part of its policy and activities
CBI offers various programmes and services to its target groups:
Market information – CBI News Bulletin (6 times annually);– CBI guide “Exporting to the European Union”;– Market surveys and strategic marketing guides covering the EU including
The Netherlands;– Quick scans on environmental, social and health issues;– Manuals on subjects such as technical and environmental regulations, trade fair
participation, Fashion Forecast etc.;– CBI’s extensive Web site at www.cbi.nl providing general information about CBI,
details about CBI programmes, CBI publications (downloadable free-of-charge)and the GreenBuss database on European trade-related environmental policy andtechnology;
– CBI’ s Trade Documentation Centre offering supply-related information to importers,such as exporters’ directories, country and sector information, periodicals fromdeveloping countries, and - to visiting exporters - demand-related information such asmarket information, trade magazines, address books of European companies etc.
Matching servicesCBI’s computerized exporters’ and importers’ databases, containing around3,500 regularly updated company profiles, are instrumental in providing buyersand suppliers with relevant company data on potential trade partners.
Export promotion programmes (EPP)Step-by-step approach providing intensive assistance to selected exporters in developingcountries in order to obtain a firm and lasting position on the EU market. Made tomeasure, demand- driven and flexibility are combined with fixed elements such as:– pre-selection of candidates based on written documentation;– technical assistance during company visits and distance guidance by CBI branch
experts;– export marketing training (for instance through the EXPRO seminars);– market entry (for instance via participation in European trade fairs);– market consolidation by way of follow-up support, further technical assistance
and/or repeat market entry activities.
Human resources development– BSO MARKET INTEL: five-day seminar in Rotterdam for relevant
middle management staff of BSO’s, aiming at supporting BSO’s inestablishing or improving a Market Information Service (MIS);
– CAPITA: two-week seminar in Rotterdam for specific industry &trade associations. Aims to provide –through their associations-specific industries or sectors in developing countries with tools toengage in business relations with importers and/or manufacturersin the EU;
– BSO-FAME: two-week seminar in Rotterdam for project managersof BSOs focusing on practical knowledge and applicable tools inexport promotion to international markets in general and theEuropean market in particular;
– IntFair: two-week seminar in Rotterdam for BSO staff members onthe organization of collective participation in European trade fairs;
– Expro: seven-day seminar in Rotterdam on export marketing andmanagement for selected exporters participating in a CBI exportpromotion programme;
– Workshops in developing countries: 2-4 days for BSOs and/orexporters, focussing on general export marketing andmanagement, a specific product sector or on specific subjects.
Multilateral co-operationCBI co-operates with the International Trade Centre (ITC/WTO) toglobalize trade promotion and with other European import promotionorganizations to increase efficiency and effectiveness by combiningefforts.
Please write to us in English, the working language of the CBI.
Centre for the Promotion of Imports from developing countriesCentrum tot Bevordering van de Import uit de ontwikkelingslanden
Mailing address:CBIP.O. Box 300093001 DA RotterdamPhone +31 (0) 10 201 34 34Fax +31 (0) 10 411 40 81E-mail [email protected] www.cbi.nl
Office and showroom:WTC-Beursbuilding, 5th Floor37 Beursplein, Rotterdam, The Netherlands.
No part of this publication may be sold, reproduced in any form or by any means without the prior permission of CBI

Mailing address: P.O. Box 30009, 3001 DA Rotterdam, The NetherlandsPhone: +31 10 201 34 34 Fax: +31 10 411 40 81E-mail: [email protected] Internet: http://www.cbi.nl
Office and showroom: WTC-Beursbuilding, 5th floor37 Beursplein, Rotterdam, The Netherlands
CENTRE FOR THE PROMOTION OF IMPORTS FROM DEVELOPING COUNTRIES
PIPE AND PIPE-RELATEDPROCESS EQUIPMENT
PIP
E A
ND
PIP
E-R
ELAT
ED
PR
OC
ES
S E
QU
IPM
EN
T
EU MARKET SURVEY 2002
EU
MA
RK
ET
SU
RV
EY
2002V
OLU
ME
II VOLUME II


![Sara Garcia-Ratés and Susan Greenfield · 22308 Oncotaret the α7-nAChR enhances calcium influx and up-regulation of α7-nAChR expression in neuronal cell cultures [3]](https://img.pdfslide.net/doc/110x75/5f07747a7e708231d41d10ef/sara-garcia-rats-and-susan-greenfield-22308-oncotaret-the-7-nachr-enhances-calcium.jpg)