Embed Size (px)
Citation preview

22nd International Investors’ Day
Frankfurt, 23 October 2019
Content
Pursuing the outperformance journey Jean-Jacques Henchoz
From the CFO’s desk Roland Vogel
Capital generation and risk profile Dr. Andreas Märkert
Insights into growing segments in P&C Sven Althoff
Growth opportunities in Asia Claude Chèvre / Sven Althoff
Financial Solutions & support in the digital age Dr. Klaus Miller
Concluding remarks and outlook Jean-Jacques Henchoz7
6
5
4
3
2
1

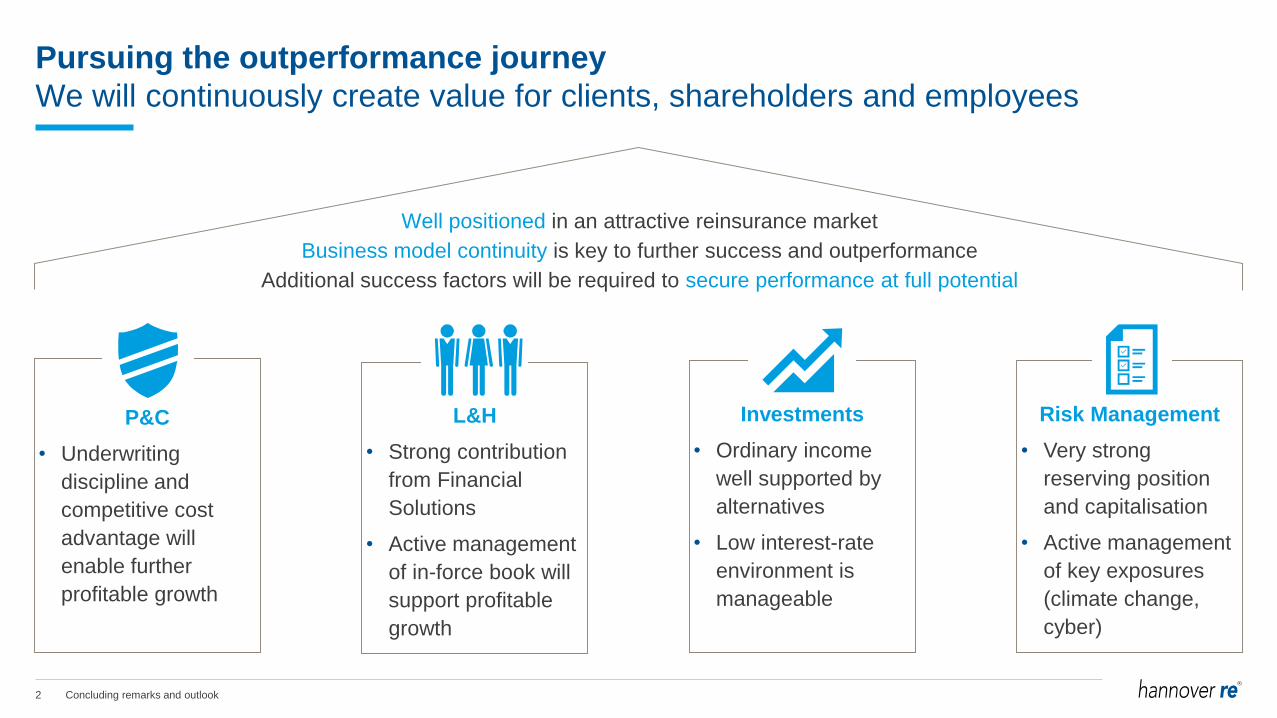
Pursuing the outperformance journey
Jean-Jacques Henchoz, Chief Executive Officer
22nd International Investors’ Day
Frankfurt, 23 October 2019
2 Pursuing the outperformance journey
Outlook: outperforming tomorrow3
Our business model: successful being "somewhat different"2
Our position in the reinsurance market1
Agenda

1 Our position in the
reinsurance market
4 Pursuing the outperformance journey
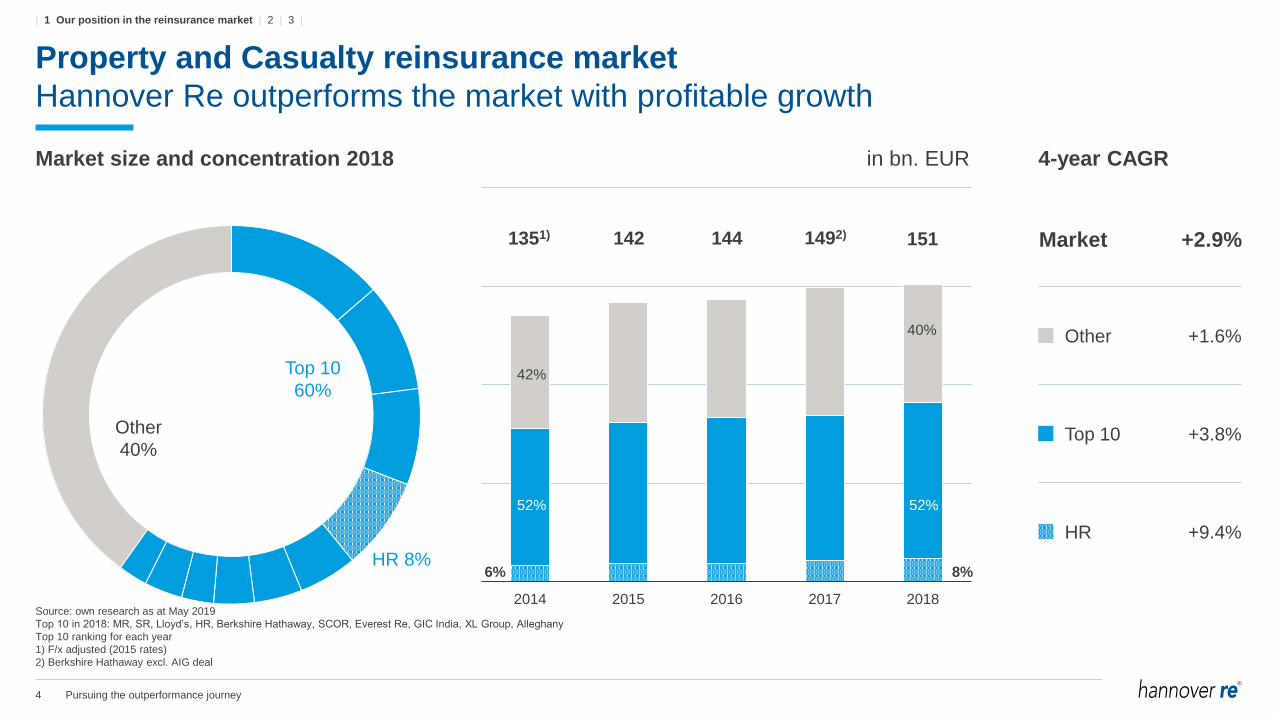
Property and Casualty reinsurance market
Hannover Re outperforms the market with profitable growth
Source: own research as at May 2019
Top 10 in 2018: MR, SR, Lloyd’s, HR, Berkshire Hathaway, SCOR, Everest Re, GIC India, XL Group, Alleghany
Top 10 ranking for each year
1) F/x adjusted (2015 rates)
2) Berkshire Hathaway excl. AIG deal
Market size and concentration 2018 in bn. EUR 4-year CAGR
HR 8%
2014 2015 2016 2017 2018
Top 10
60%
Other
40%
40%
52%
42%
52%
6% 8%
1351) 142 144 1492) Market +2.9%
Other +1.6%
Top 10 +3.8%
HR +9.4%
151
| 1 Our position in the reinsurance market | 2 | 3 |
5 Pursuing the outperformance journey
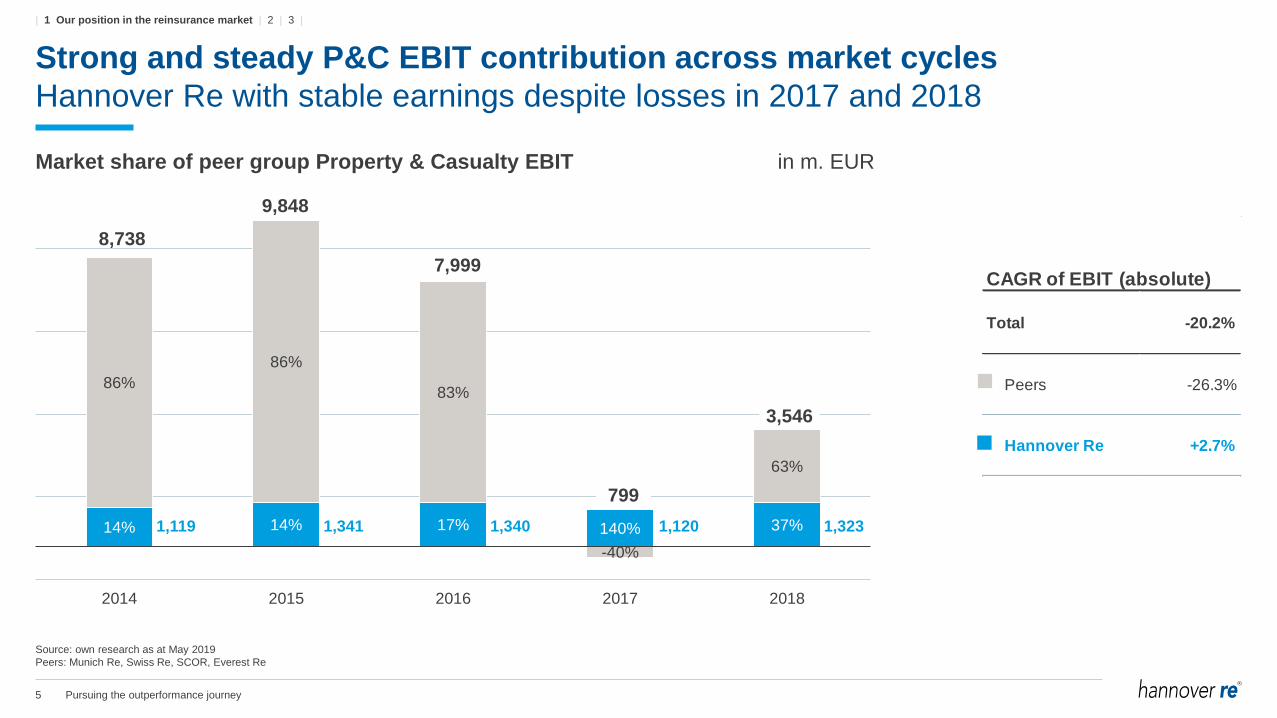
Strong and steady P&C EBIT contribution across market cycles
Hannover Re with stable earnings despite losses in 2017 and 2018
Market share of peer group Property & Casualty EBIT in m. EUR
Source: own research as at May 2019
Peers: Munich Re, Swiss Re, SCOR, Everest Re
14% 14% 17% 140% 37%
86%
86%
83%
-40%
63%
2014 2015 2016 2017 2018
Total -20.2%
Peers -26.3%
Hannover Re +2.7%
CAGR of EBIT (absolute)
8,738
9,848
7,999
799
3,546
1,341 1,340 1,120 1,3231,119
| 1 Our position in the reinsurance market | 2 | 3 |

6 Pursuing the outperformance journey
Life and Health reinsurance market
HR’s market share reflects conservative approach to commoditised segments
4-year CAGR
Market +3.9%
Other +9.6%
Top 6 +2.2%
HR -0.4%
Source: own research as at May 2019
Top 6 in 2018: Swiss Re, Munich Re, RGA, SCOR, Grest-West Lifeco, Hannover Re
Top 6 ranking for each year
1) F/x adjusted (2015 rates)
2014 2015 2016 2017 2018
9%11%
HR
9%
Top 6
74%
Other
26%
26%
65%
21%
68%
681) 70 75 79 79
Market size and concentration 2018 in bn. EUR
| 1 Our position in the reinsurance market | 2 | 3 |
7 Pursuing the outperformance journey
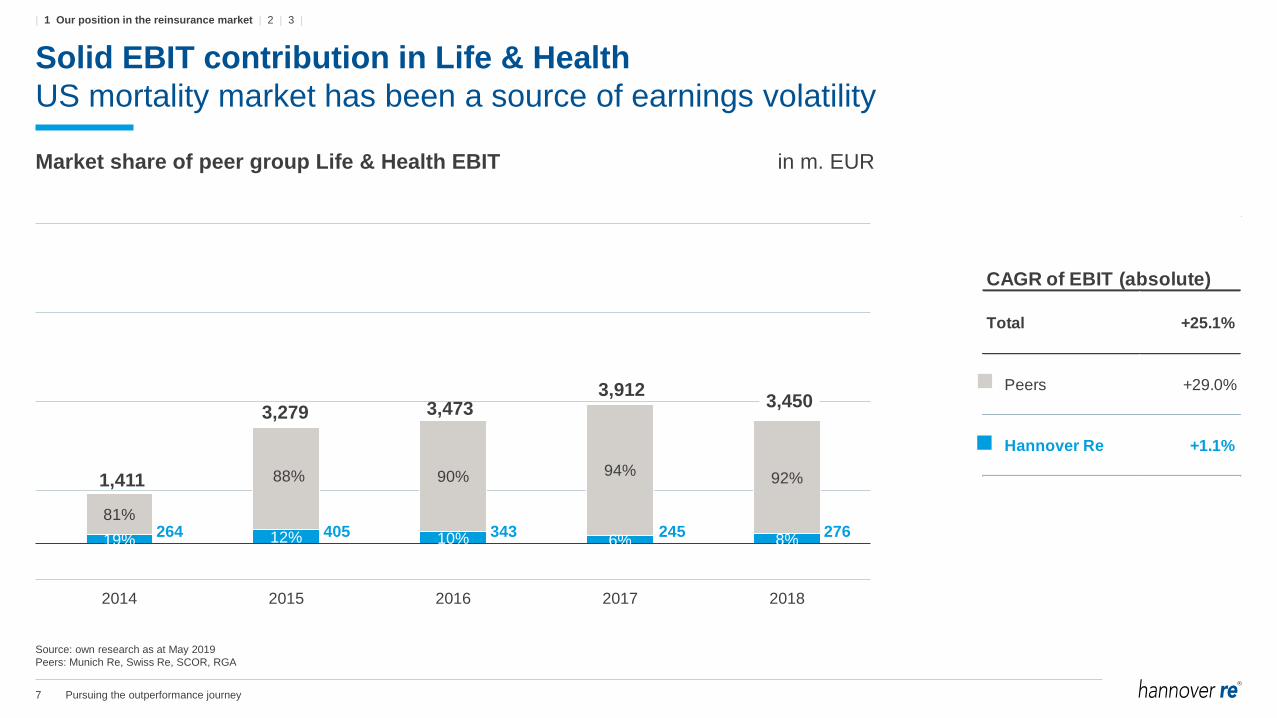
Solid EBIT contribution in Life & Health
US mortality market has been a source of earnings volatility
Market share of peer group Life & Health EBIT in m. EUR
Source: own research as at May 2019
Peers: Munich Re, Swiss Re, SCOR, RGA
19% 12% 10% 6% 8%
81%
88% 90% 94%92%
2014 2015 2016 2017 2018
Total +25.1%
Peers +29.0%
Hannover Re +1.1%
CAGR of EBIT (absolute)
1,411
3,279 3,4733,912
3,450
405 343 245 276264
| 1 Our position in the reinsurance market | 2 | 3 |
8 Pursuing the outperformance journey
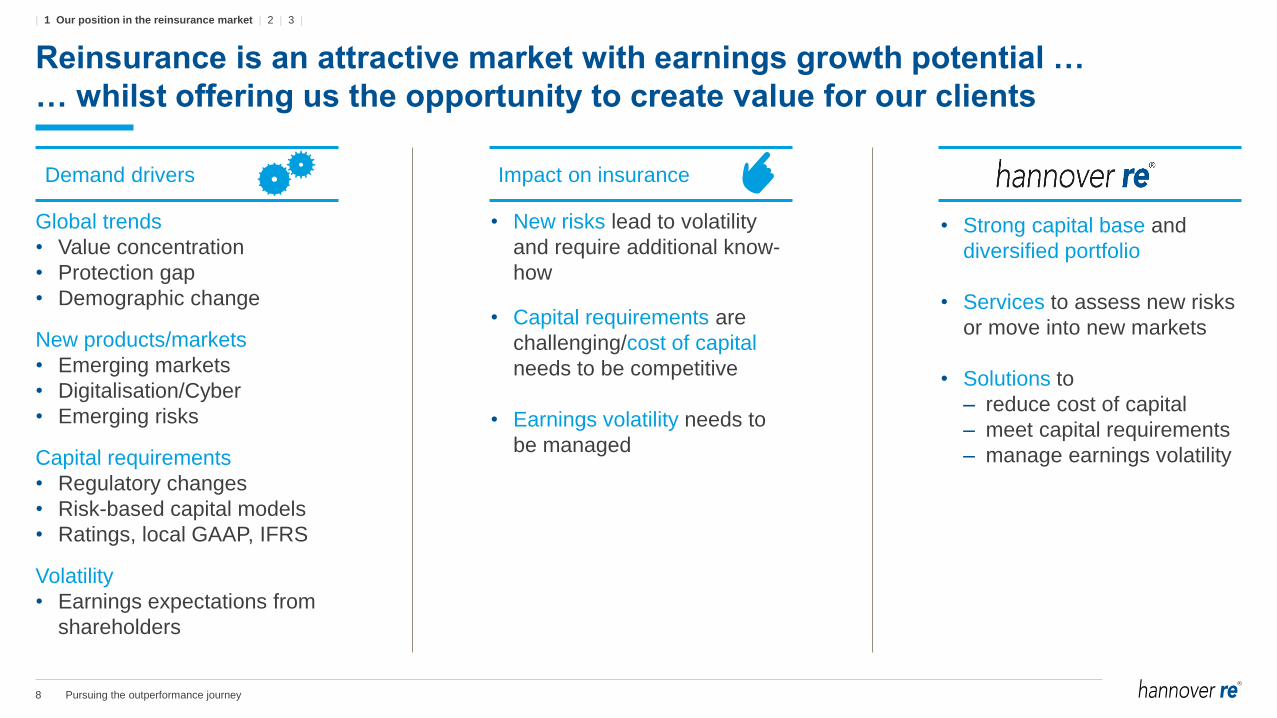
Reinsurance is an attractive market with earnings growth potential …
… whilst offering us the opportunity to create value for our clients
Global trends
• Value concentration
• Protection gap
• Demographic change
New products/markets
• Emerging markets
• Digitalisation/Cyber
• Emerging risks
Capital requirements
• Regulatory changes
• Risk-based capital models
• Ratings, local GAAP, IFRS
Volatility
• Earnings expectations from
shareholders
Demand drivers
• New risks lead to volatility
and require additional know-
how
• Capital requirements are
challenging/cost of capital
needs to be competitive
• Earnings volatility needs to
be managed
Impact on insurance
• Strong capital base and
diversified portfolio
• Services to assess new risks
or move into new markets
• Solutions to
– reduce cost of capital
– meet capital requirements
– manage earnings volatility
| 1 Our position in the reinsurance market | 2 | 3 |

2 Our business model:
successful being
"somewhat different”

10 Pursuing the outperformance journey
Our “somewhat different” approach is highly effective
Business model continuity is key to further success and outperformance
Gross written premium
10,27511,429 12,096
13,774 13,963 14,362
17,069 16,35417,791
19,176
11,694
2009 2010 2011 2012 2013 2014 2015 2016 2017 2018 1H/2019
Group net income/Return on equity
734 749
606
850 896986
1,151 1,171
9591,060
663
2009 2010 2011 2012 2013 2014 2015 2016 2017 2018 1H/2019
22.4% 18.2% 12.8% 15.0%15.4% 14.7% 14.7% 13.7% 10.9% 12.2% 14.3%
| 1 | 2 Our business model: successful being "somewhat different" | 3 |
11 Pursuing the outperformance journey
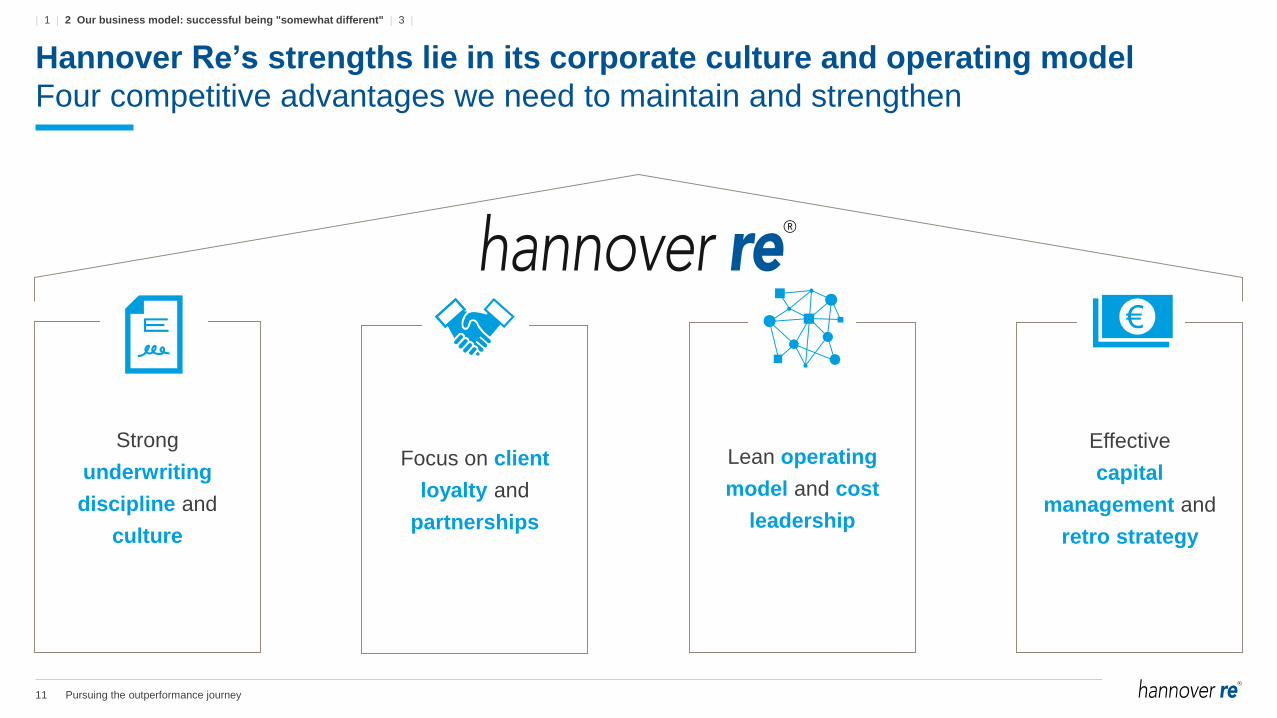
Hannover Re’s strengths lie in its corporate culture and operating model
Four competitive advantages we need to maintain and strengthen
Strong
underwriting
discipline and
culture
Focus on client
loyalty and
partnerships
Lean operating
model and cost
leadership
Effective
capital
management and
retro strategy
| 1 | 2 Our business model: successful being "somewhat different" | 3 |
12 Pursuing the outperformance journey
4%
6%
8%
10%
12%
14%
16%
0% 1% 2% 3% 4% 5% 6% 7% 8% 9% 10%
Re
tun
r o
n E
qu
ity
Standard deviation
HR Peer 1 Peer 2 Peer 3 Peer 4 Peer 5 Peer 6 Average
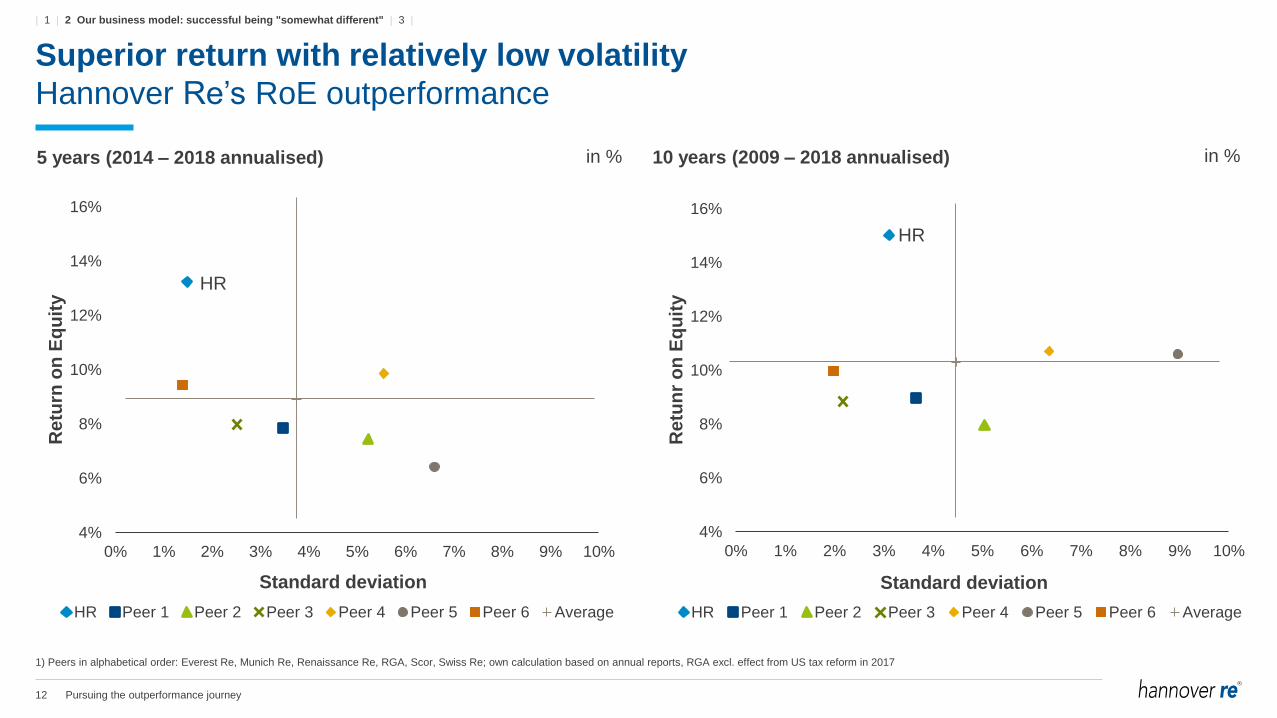
Superior return with relatively low volatility
Hannover Re’s RoE outperformance
5 years (2014 – 2018 annualised) in % 10 years (2009 – 2018 annualised) in %
4%
6%
8%
10%
12%
14%
16%
0% 1% 2% 3% 4% 5% 6% 7% 8% 9% 10%
Re
turn
on
Eq
uit
y
Standard deviation
HR Peer 1 Peer 2 Peer 3 Peer 4 Peer 5 Peer 6 Average
HR
1) Peers in alphabetical order: Everest Re, Munich Re, Renaissance Re, RGA, Scor, Swiss Re; own calculation based on annual reports, RGA excl. effect from US tax reform in 2017
HR
| 1 | 2 Our business model: successful being "somewhat different" | 3 |
13 Pursuing the outperformance journey
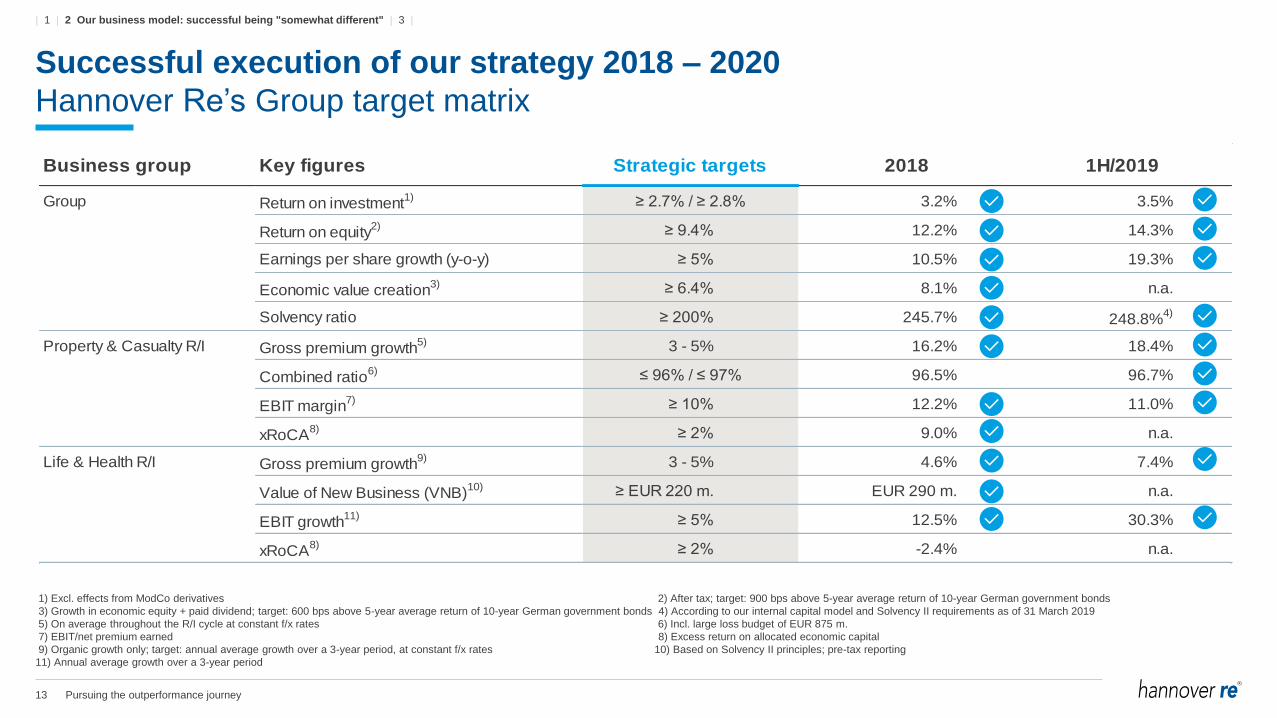
Business group Key figures Strategic targets 2018 1H/2019
Group Return on investment1) ≥ 2.7% / ≥ 2.8% 3.2% 3.5%
Return on equity2) ≥ 9.4% 12.2% 14.3%
Earnings per share growth (y-o-y) ≥ 5% 10.5% 19.3%
Economic value creation3) ≥ 6.4% 8.1% n.a.
Solvency ratio ≥ 200% 245.7% 248.8%4)
Property & Casualty R/I Gross premium growth5) 3 - 5% 16.2% 18.4%
Combined ratio6) ≤ 96% / ≤ 97% 96.5% 96.7%
EBIT margin7) ≥ 10% 12.2% 11.0%
xRoCA8) ≥ 2% 9.0% n.a.
Life & Health R/I Gross premium growth9) 3 - 5% 4.6% 7.4%
Value of New Business (VNB)10) ≥ EUR 220 m. EUR 290 m. n.a.
EBIT growth11) ≥ 5% 12.5% 30.3%
xRoCA8) ≥ 2% -2.4% n.a.
Successful execution of our strategy 2018 – 2020
Hannover Re’s Group target matrix
1) Excl. effects from ModCo derivatives 2) After tax; target: 900 bps above 5-year average return of 10-year German government bonds
3) Growth in economic equity + paid dividend; target: 600 bps above 5-year average return of 10-year German government bonds 4) According to our internal capital model and Solvency II requirements as of 31 March 2019
5) On average throughout the R/I cycle at constant f/x rates 6) Incl. large loss budget of EUR 875 m.
7) EBIT/net premium earned 8) Excess return on allocated economic capital
9) Organic growth only; target: annual average growth over a 3-year period, at constant f/x rates 10) Based on Solvency II principles; pre-tax reporting
11) Annual average growth over a 3-year period
| 1 | 2 Our business model: successful being "somewhat different" | 3 |
3 Outlook:
outperforming
tomorrow
15 Pursuing the outperformance journey
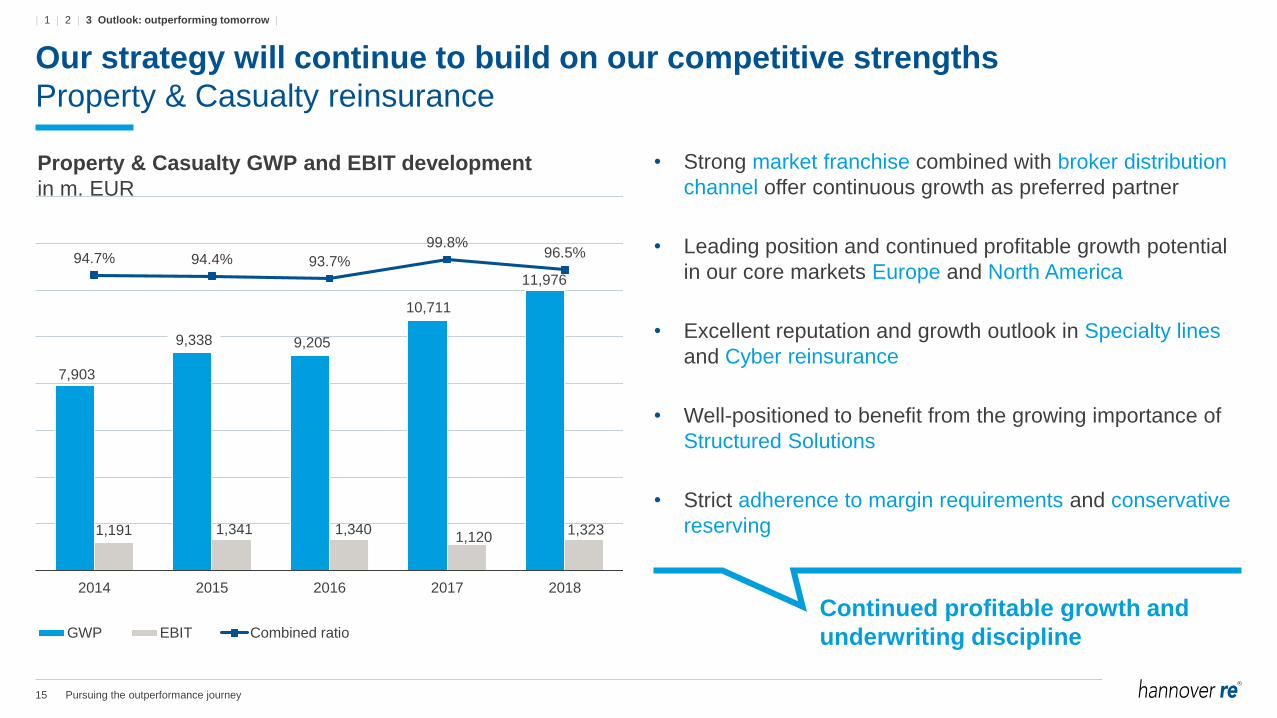
Our strategy will continue to build on our competitive strengths
Property & Casualty reinsurance
• Strong market franchise combined with broker distribution
channel offer continuous growth as preferred partner
• Leading position and continued profitable growth potential
in our core markets Europe and North America
• Excellent reputation and growth outlook in Specialty lines
and Cyber reinsurance
• Well-positioned to benefit from the growing importance of
Structured Solutions
• Strict adherence to margin requirements and conservative
reserving
Continued profitable growth and
underwriting discipline
1,191 1,341 1,3401,120
1,323
94.7% 94.4% 93.7%
99.8%96.5%
0
2.000
4.000
6.000
8.000
10.000
12.000
14.000
16.000
2014 2015 2016 2017 2018
GWP EBIT Combined ratio
Property & Casualty GWP and EBIT development
in m. EUR
7,903
9,338 9,205
10,711
11,976
| 1 | 2 | 3 Outlook: outperforming tomorrow |
16 Pursuing the outperformance journey
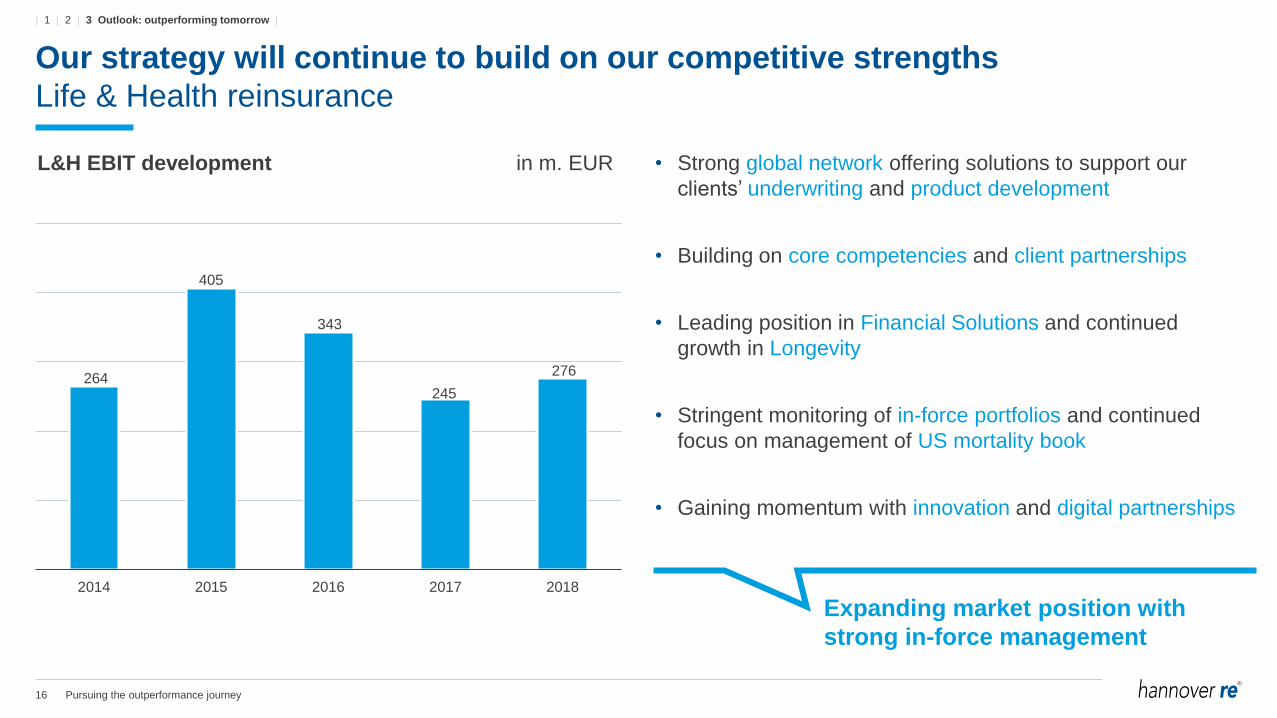
Our strategy will continue to build on our competitive strengths
Life & Health reinsurance
• Strong global network offering solutions to support our
clients’ underwriting and product development
• Building on core competencies and client partnerships
• Leading position in Financial Solutions and continued
growth in Longevity
• Stringent monitoring of in-force portfolios and continued
focus on management of US mortality book
• Gaining momentum with innovation and digital partnerships
Expanding market position with
strong in-force management
L&H EBIT development in m. EUR
264
405
343
245
276
2014 2015 2016 2017 2018
| 1 | 2 | 3 Outlook: outperforming tomorrow |
17 Pursuing the outperformance journey
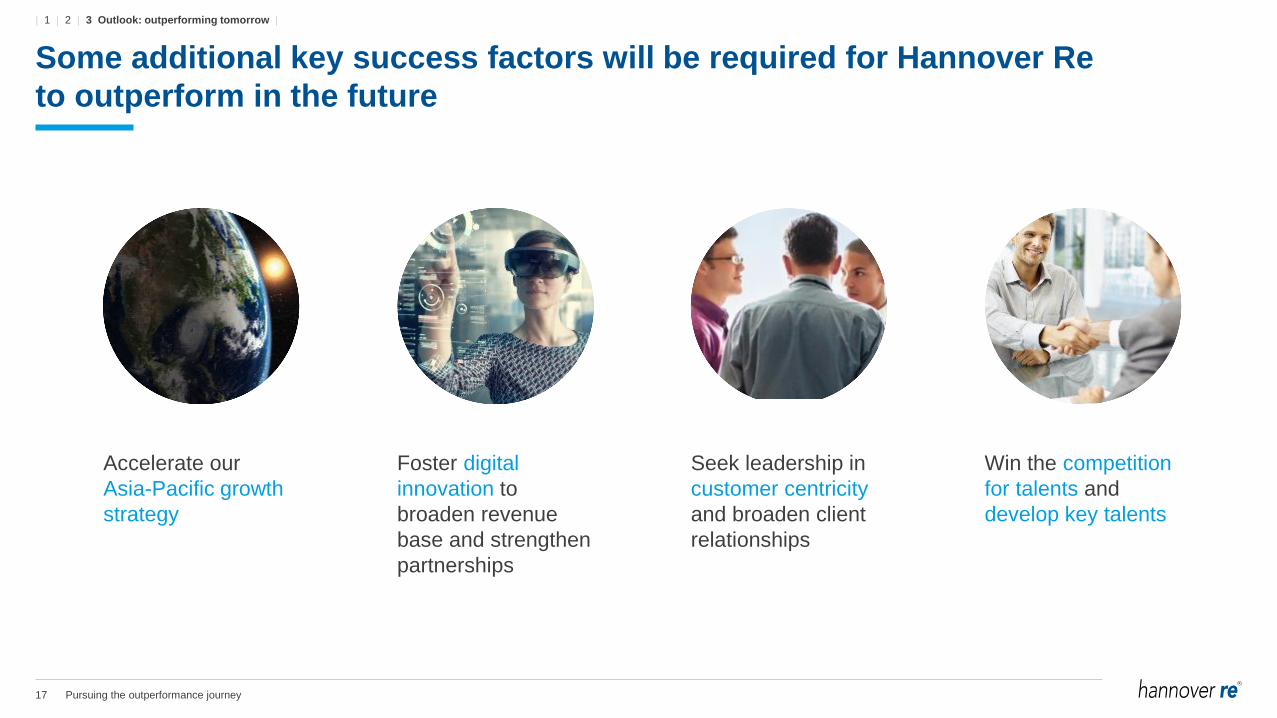
Some additional key success factors will be required for Hannover Re
to outperform in the future
Win the competition
for talents and
develop key talents
Seek leadership in
customer centricity
and broaden client
relationships
Foster digital
innovation to
broaden revenue
base and strengthen
partnerships
Accelerate our
Asia-Pacific growth
strategy
| 1 | 2 | 3 Outlook: outperforming tomorrow |
18 Pursuing the outperformance journey
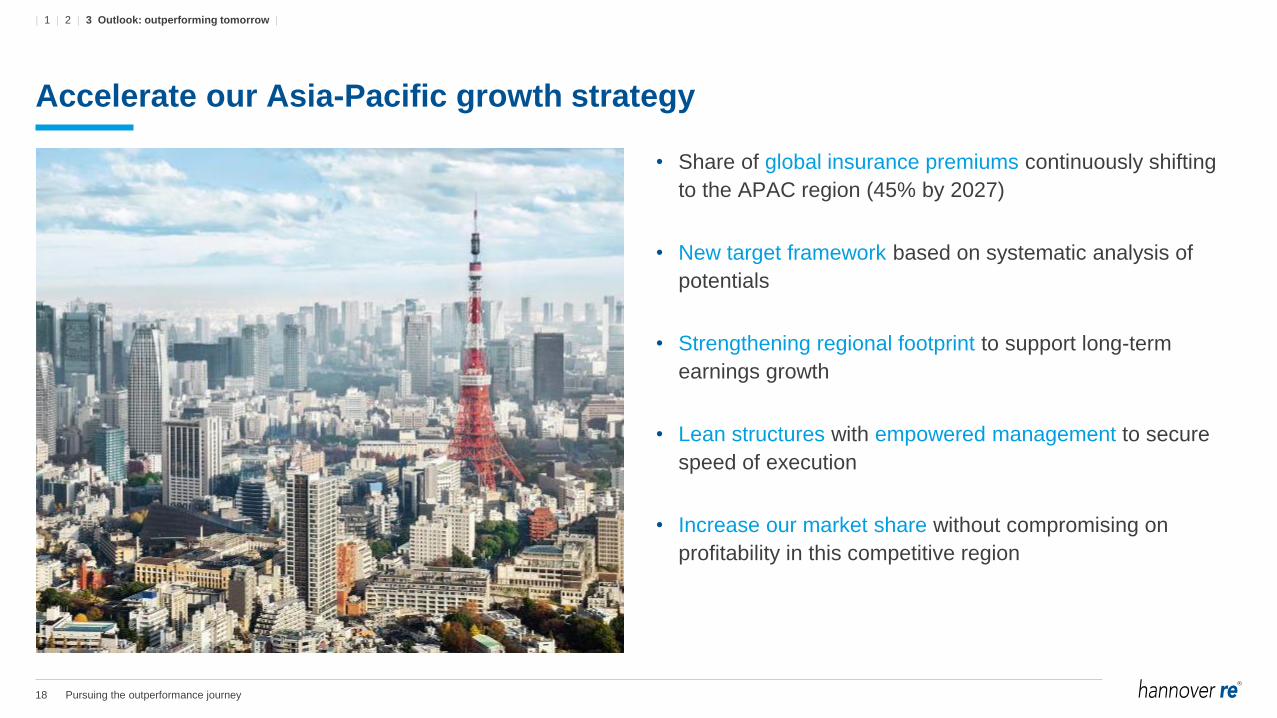
Accelerate our Asia-Pacific growth strategy
• Share of global insurance premiums continuously shifting
to the APAC region (45% by 2027)
• New target framework based on systematic analysis of
potentials
• Strengthening regional footprint to support long-term
earnings growth
• Lean structures with empowered management to secure
speed of execution
• Increase our market share without compromising on
profitability in this competitive region
| 1 | 2 | 3 Outlook: outperforming tomorrow |
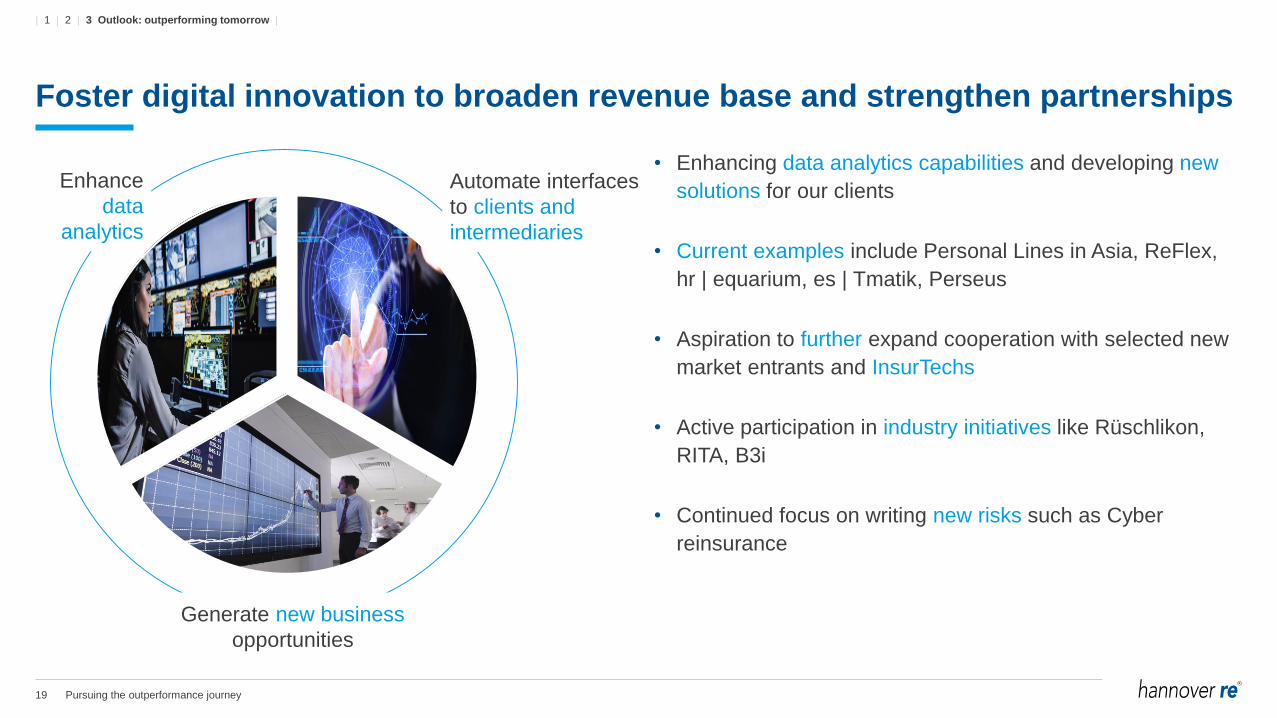
19 Pursuing the outperformance journey
Generate new business
opportunities
Enhance
data
analytics
Automate interfaces
to clients and
intermediaries
Foster digital innovation to broaden revenue base and strengthen partnerships
• Enhancing data analytics capabilities and developing new
solutions for our clients
• Current examples include Personal Lines in Asia, ReFlex,
hr | equarium, es | Tmatik, Perseus
• Aspiration to further expand cooperation with selected new
market entrants and InsurTechs
• Active participation in industry initiatives like Rüschlikon,
RITA, B3i
• Continued focus on writing new risks such as Cyber
reinsurance
| 1 | 2 | 3 Outlook: outperforming tomorrow |
20 Pursuing the outperformance journey
Seek leadership in customer centricity and broaden client relationships
• Unlock potentials with existing and new clients
• Further expand holistic customer-centric approach
• Continue to live culture of cooperation and knowledge
sharing for the benefit of the client
• Utilise cross-selling potential across markets
• Adapt ourselves to the clients’ organisational and purchasing
requirements in an efficient way
| 1 | 2 | 3 Outlook: outperforming tomorrow |
21 Pursuing the outperformance journey
• Secure effective talent sourcing and recruitment and further
strengthen the candidate’s journey
• Foster mobility across markets and functions
• Further develop leadership skills and competencies
• Strengthen succession plans and prepare the new
generation of underwriters
Win the competition for talents and develop key talents
| 1 | 2 | 3 Outlook: outperforming tomorrow |
22 Pursuing the outperformance journey
Our ambition for the next strategy cycle
Striving for performance at full potential
The recognised client-centric reinsurer
The go-to partner for insurers, brokers
and new entrants
The profitably growing, consistent
industry outperformer
| 1 | 2 | 3 Outlook: outperforming tomorrow |

23 Pursuing the outperformance journey
This presentation does not address the investment objectives or financial situation of any particular person or legal entity.
Investors should seek independent professional advice and perform their own analysis regarding the appropriateness of
investing in any of our securities.
While Hannover Re has endeavoured to include in this presentation information it believes to be reliable, complete and up-to-
date, the company does not make any representation or warranty, express or implied, as to the accuracy, completeness or
updated status of such information.
Some of the statements in this presentation may be forward-looking statements or statements of future expectations based on
currently available information. Such statements naturally are subject to risks and uncertainties. Factors such as the
development of general economic conditions, future market conditions, unusual catastrophic loss events, changes in the capital
markets and other circumstances may cause the actual events or results to be materially different from those anticipated by
such statements.
This presentation serves information purposes only and does not constitute or form part of an offer or solicitation to acquire,
subscribe to or dispose of, any of the securities of Hannover Re.
© Hannover Rück SE. All rights reserved.
Hannover Re is the registered service mark of Hannover Rück SE.
Disclaimer

From the CFO’s desk
Roland Vogel, Chief Financial Officer
22nd International Investors’ Day
Frankfurt, 23 October 2019
From the CFO’s desk2
11Expense ratio2
3Investment update1
Agenda
From the CFO’s desk3
11Expense ratio2
3Investment update1
Agenda
From the CFO’s desk4
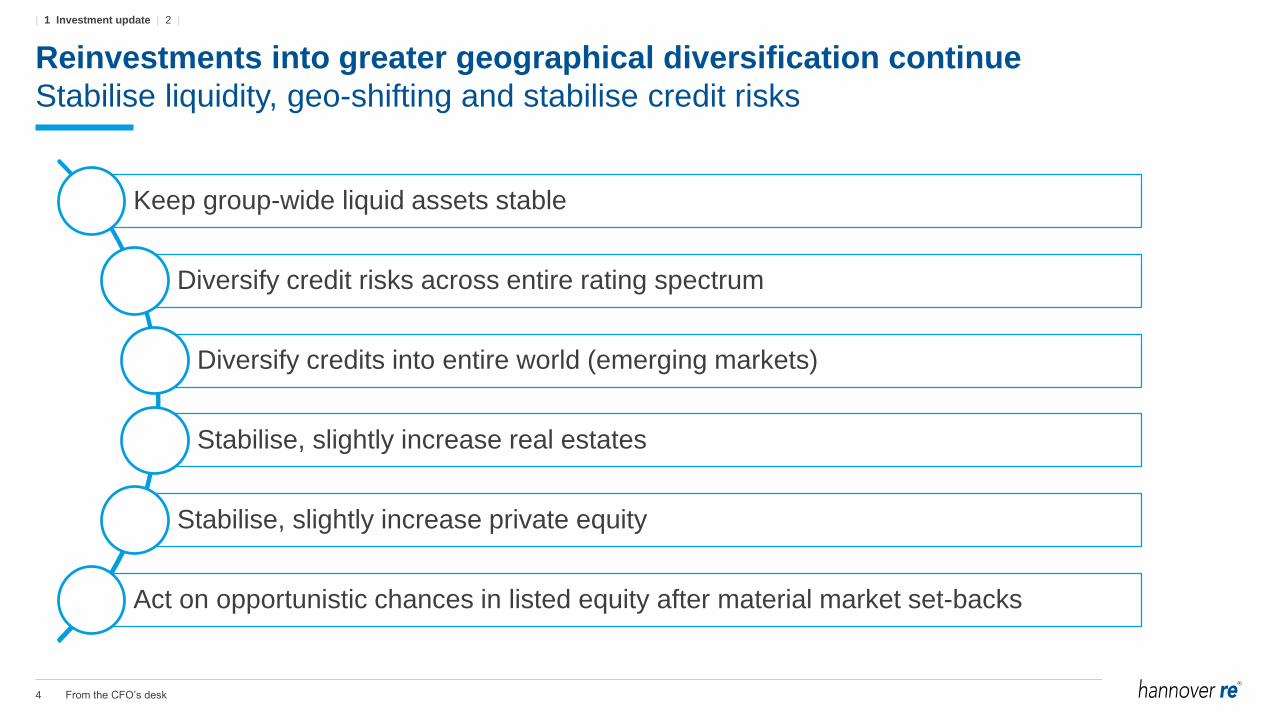
Reinvestments into greater geographical diversification continue
Stabilise liquidity, geo-shifting and stabilise credit risks
Keep group-wide liquid assets stable
Diversify credit risks across entire rating spectrum
Diversify credits into entire world (emerging markets)
Stabilise, slightly increase real estates
Stabilise, slightly increase private equity
Act on opportunistic chances in listed equity after material market set-backs
| 1 Investment update | 2 |
From the CFO’s desk5
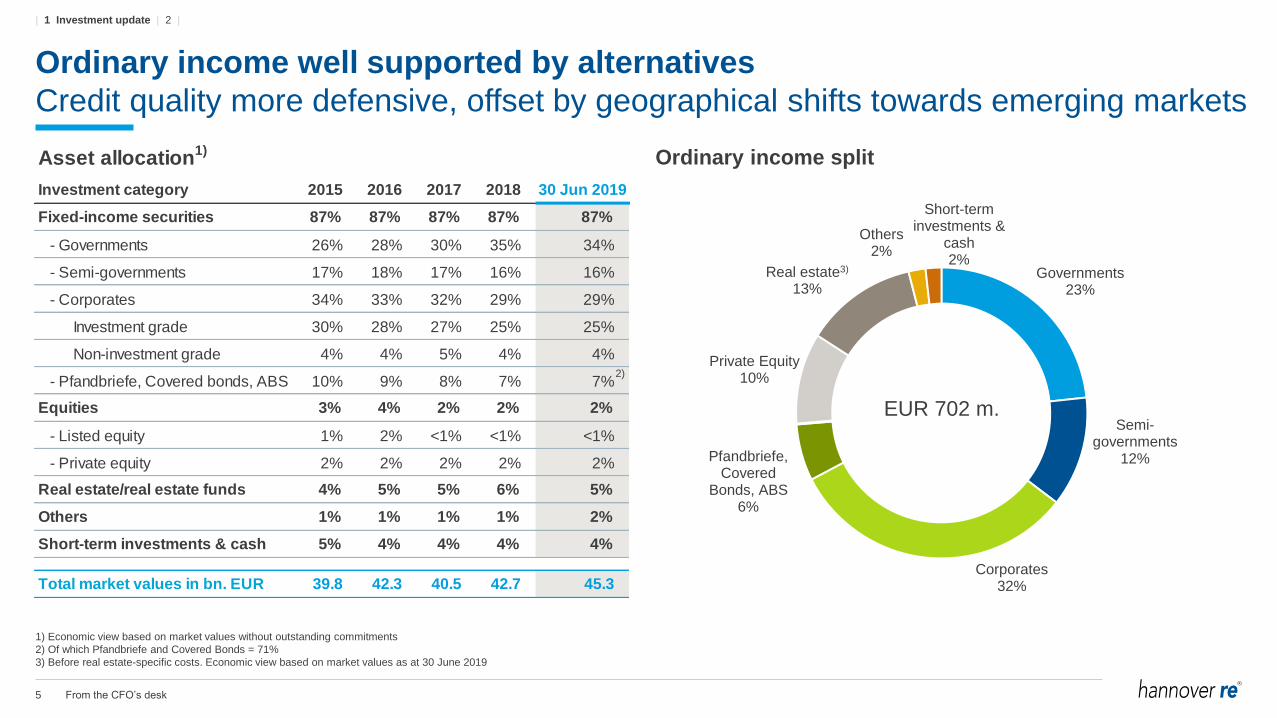
Ordinary income well supported by alternatives
Credit quality more defensive, offset by geographical shifts towards emerging markets
1) Economic view based on market values without outstanding commitments
2) Of which Pfandbriefe and Covered Bonds = 71%
3) Before real estate-specific costs. Economic view based on market values as at 30 June 2019
Ordinary income split
Governments23%
Semi-governments
12%
Corporates32%
Pfandbriefe, Covered
Bonds, ABS6%
Private Equity10%
Real estate3)
13%
Others2%
Short-term investments &
cash2%
EUR 702 m.
Asset allocation1)
Investment category 2015 2016 2017 2018 30 Jun 2019
Fixed-income securities 87% 87% 87% 87% 87%
- Governments 26% 28% 30% 35% 34%
- Semi-governments 17% 18% 17% 16% 16%
- Corporates 34% 33% 32% 29% 29%
Investment grade 30% 28% 27% 25% 25%
Non-investment grade 4% 4% 5% 4% 4%
- Pfandbriefe, Covered bonds, ABS 10% 9% 8% 7% 7%
Equities 3% 4% 2% 2% 2%
- Listed equity 1% 2% <1% <1% <1%
- Private equity 2% 2% 2% 2% 2%
Real estate/real estate funds 4% 5% 5% 6% 5%
Others 1% 1% 1% 1% 2%
Short-term investments & cash 5% 4% 4% 4% 4%
Total market values in bn. EUR 39.8 42.3 40.5 42.7 45.3
2)
| 1 Investment update | 2 |
From the CFO’s desk6
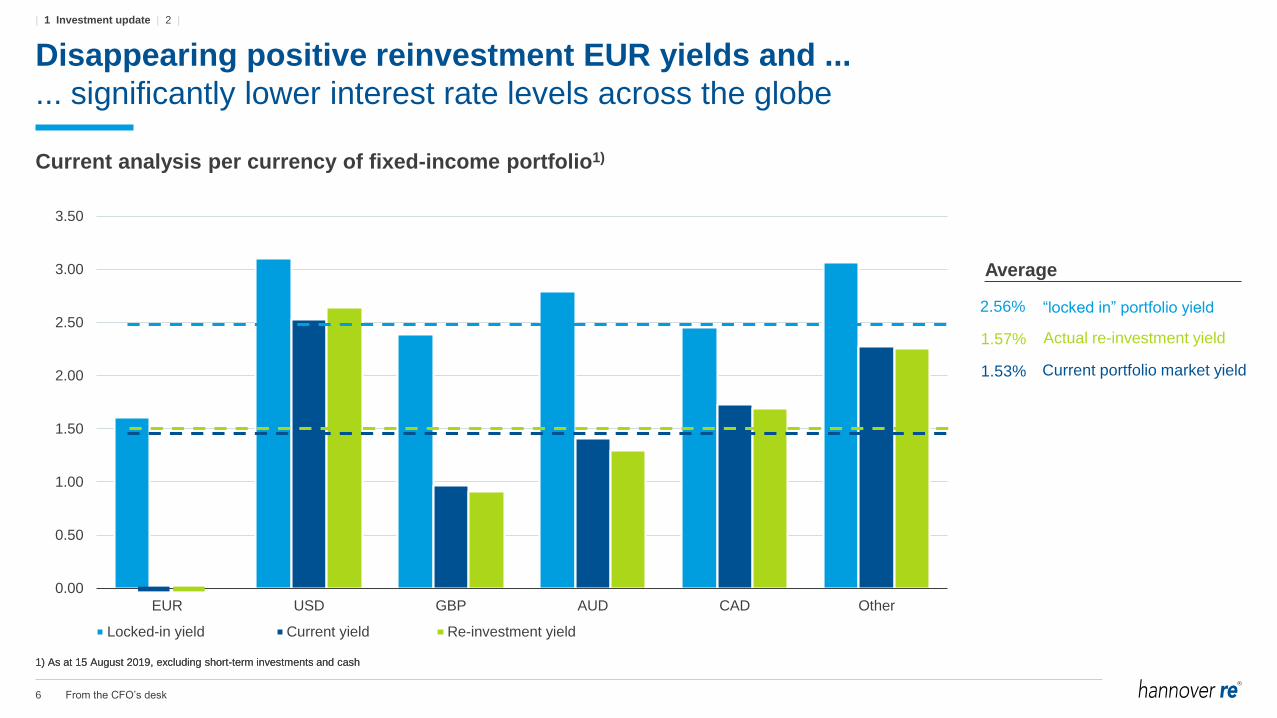
Disappearing positive reinvestment EUR yields and ...
... significantly lower interest rate levels across the globe
Current analysis per currency of fixed-income portfolio1)
1) As at 15 August 2019, excluding short-term investments and cash
0.00
0.50
1.00
1.50
2.00
2.50
3.00
3.50
EUR USD GBP AUD CAD Other
Locked-in yield Current yield Re-investment yield
Current portfolio market yield
1.57%
2.56%
1.53%
“locked in” portfolio yield
Average
Actual re-investment yield
1) As at 15 August 2019, excluding short-term investments and cash
| 1 Investment update | 2 |
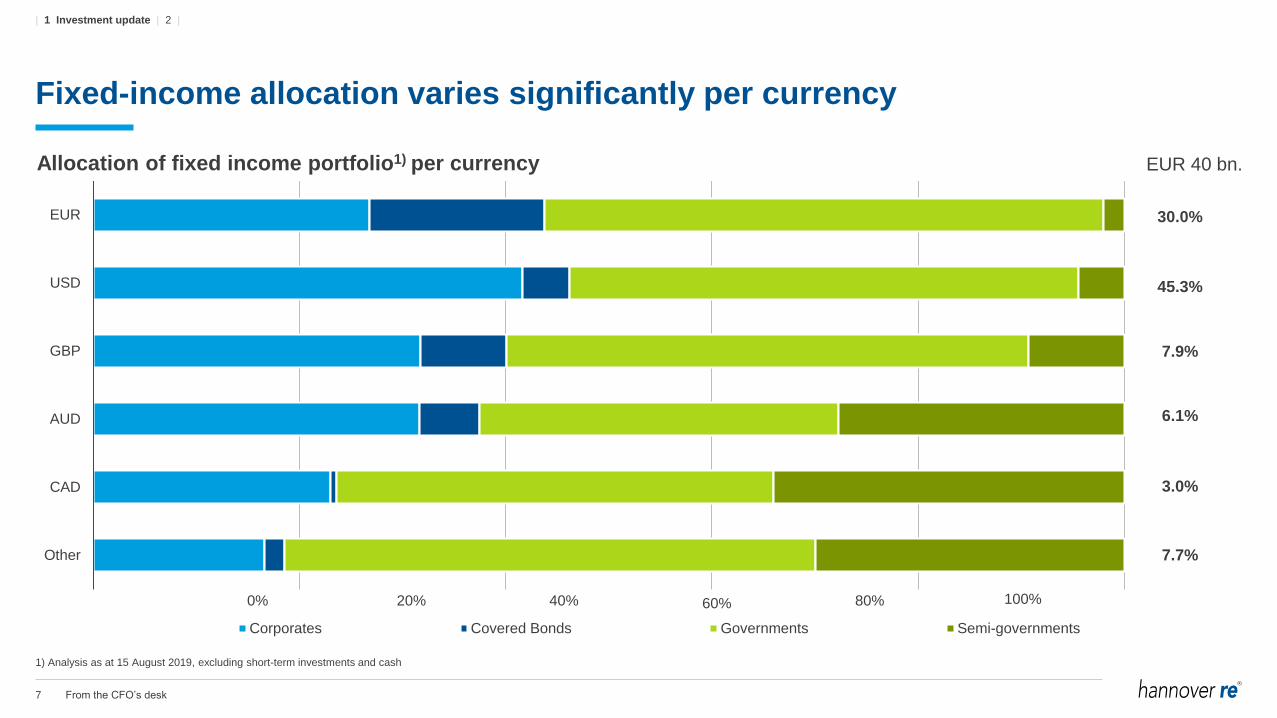
From the CFO’s desk7
Fixed-income allocation varies significantly per currency
Allocation of fixed income portfolio1) per currency EUR 40 bn.
EUR
USD
GBP
AUD
CAD
Other
Corporates Covered Bonds Governments Semi-governments
0% 100%20% 40% 60% 80%
30.0%
45.3%
7.9%
6.1%
3.0%
7.7%
1) Analysis as at 15 August 2019, excluding short-term investments and cash
| 1 Investment update | 2 |
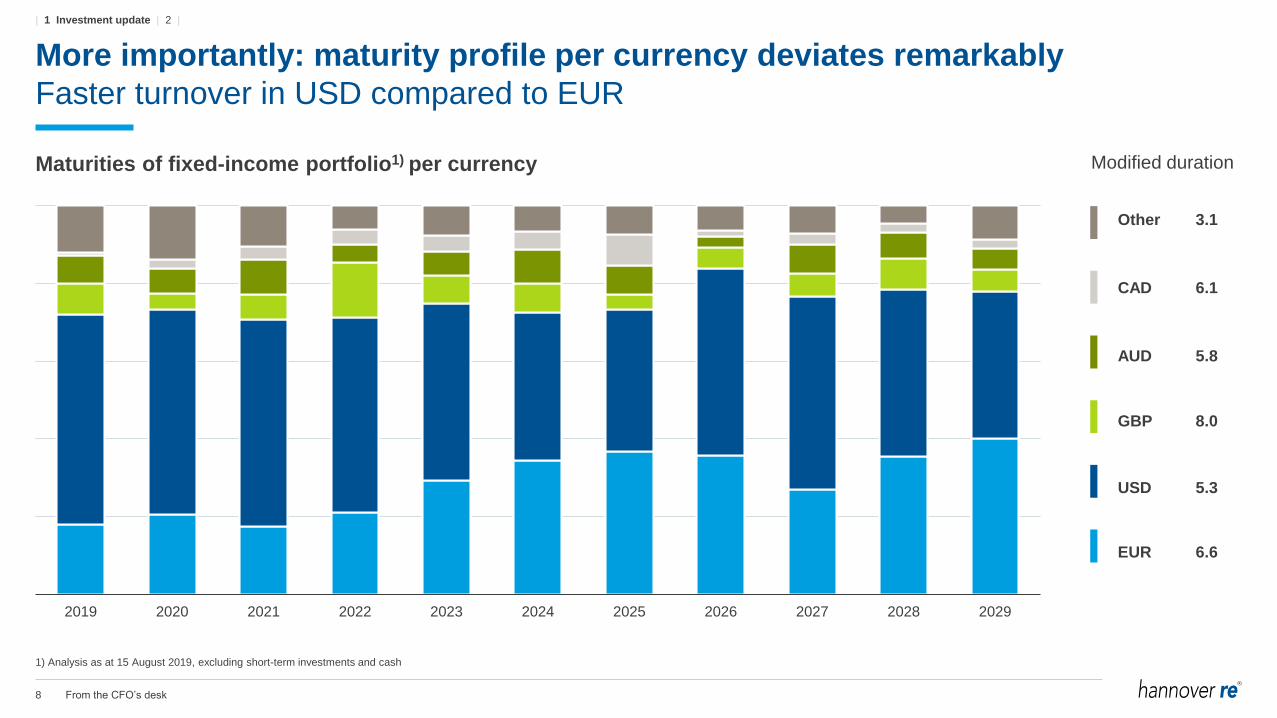
From the CFO’s desk8
More importantly: maturity profile per currency deviates remarkably
Faster turnover in USD compared to EUR
Maturities of fixed-income portfolio1) per currency Modified duration
2019 2020 2021 2022 2023 2024 2025 2026 2027 2028 2029
Other 3.1
CAD 6.1
AUD 5.8
GBP 8.0
USD 5.3
EUR 6.6
1) Analysis as at 15 August 2019, excluding short-term investments and cash
| 1 Investment update | 2 |
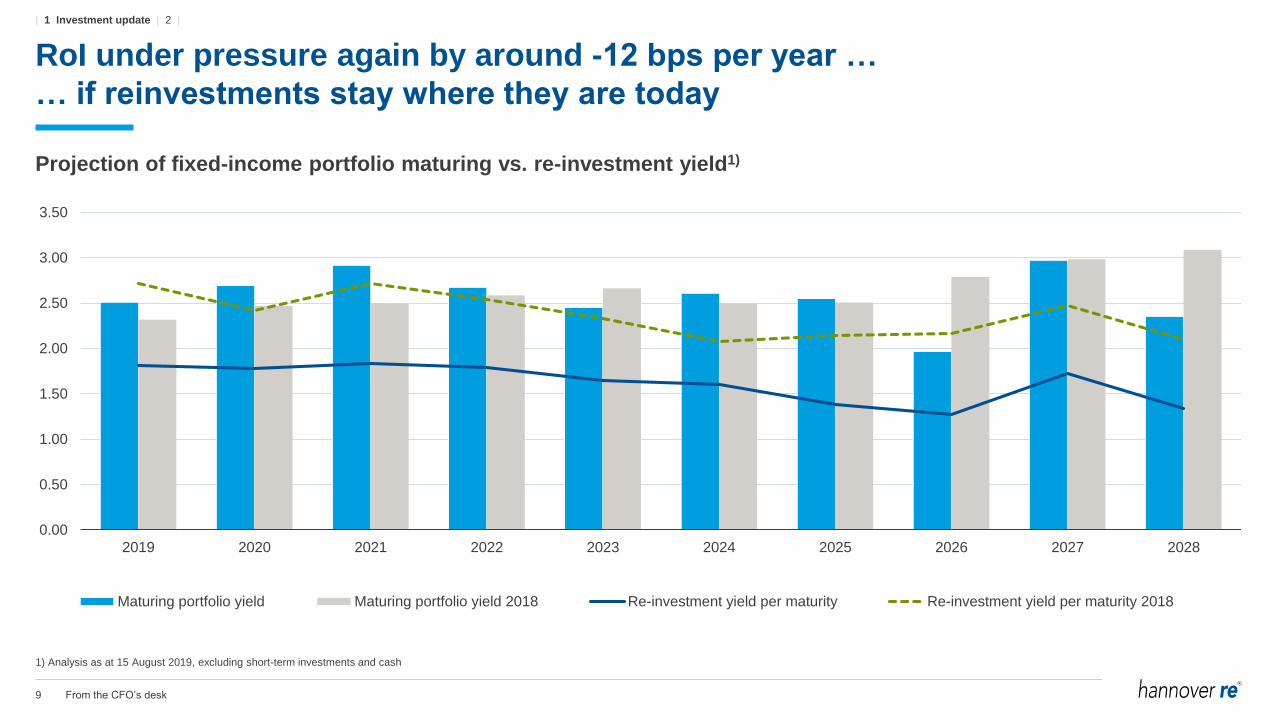
From the CFO’s desk9
RoI under pressure again by around -12 bps per year …
… if reinvestments stay where they are today
Projection of fixed-income portfolio maturing vs. re-investment yield1)
0.00
0.50
1.00
1.50
2.00
2.50
3.00
3.50
2019 2020 2021 2022 2023 2024 2025 2026 2027 2028
Maturing portfolio yield Maturing portfolio yield 2018 Re-investment yield per maturity Re-investment yield per maturity 2018
1) Analysis as at 15 August 2019, excluding short-term investments and cash
| 1 Investment update | 2 |
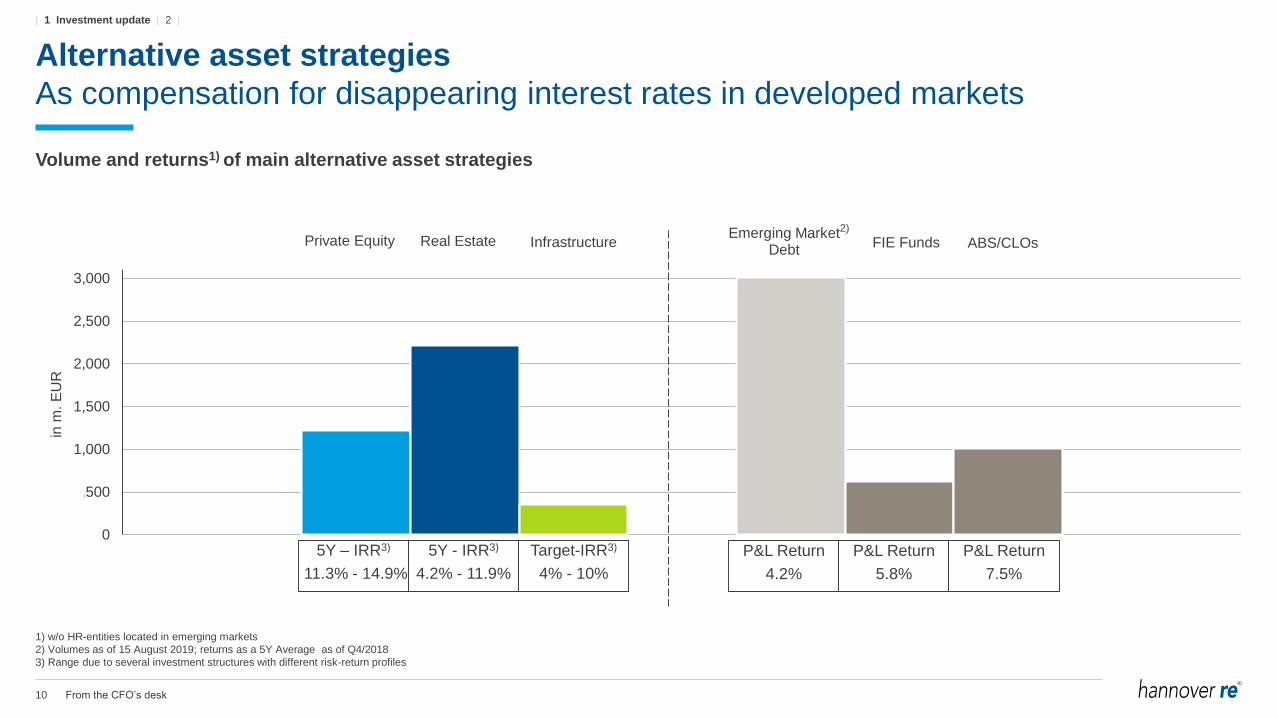
From the CFO’s desk10
Alternative asset strategies
As compensation for disappearing interest rates in developed markets
Volume and returns1) of main alternative asset strategies
Private Equity Real Estate InfrastructureEmerging Market
DebtFIE Funds ABS/CLOs
,0
,500
1,000
1,500
2,000
2,500
3,000
in m
. E
UR
2)
5Y – IRR3)
11.3% - 14.9%
5Y - IRR3)
4.2% - 11.9%
Target-IRR3)
4% - 10%
1) w/o HR-entities located in emerging markets
2) Volumes as of 15 August 2019; returns as a 5Y Average as of Q4/2018
3) Range due to several investment structures with different risk-return profiles
P&L Return
4.2%
P&L Return
5.8%
P&L Return
7.5%
| 1 Investment update | 2 |
From the CFO’s desk11
11Expense ratio2
3Investment update1
Agenda
From the CFO’s desk12
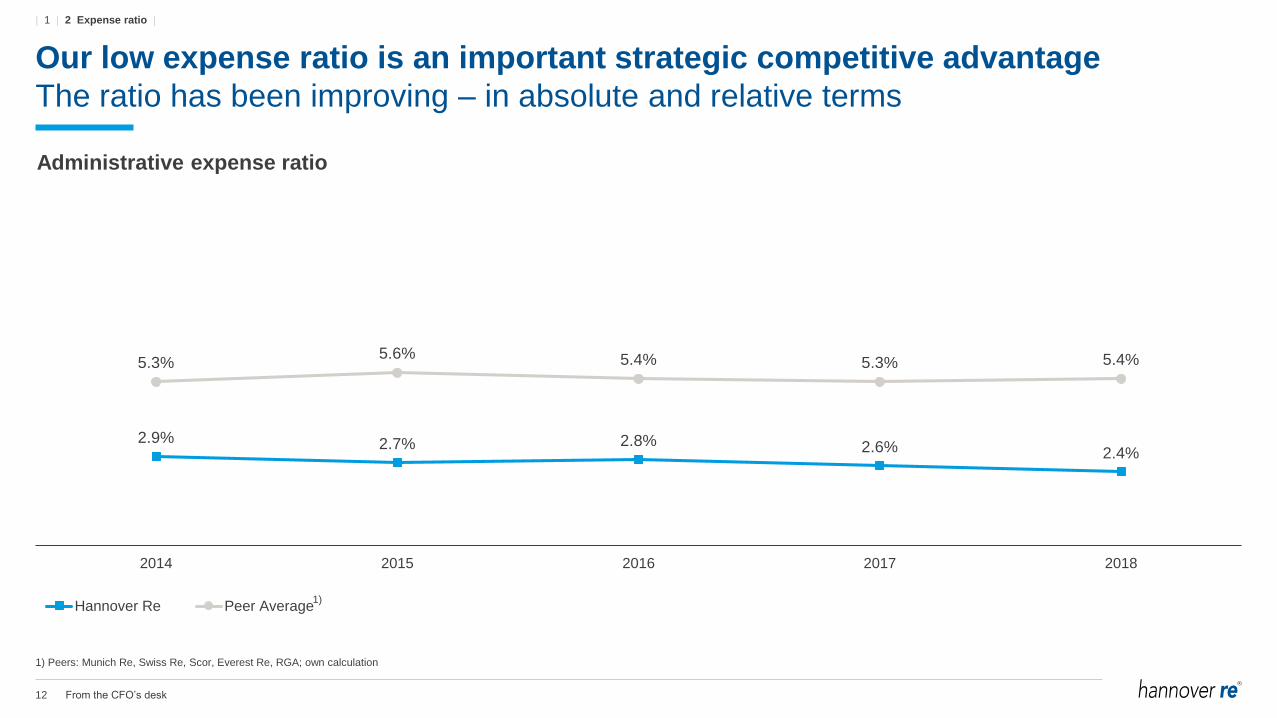
2.9% 2.7% 2.8% 2.6% 2.4%
5.3%5.6% 5.4% 5.3% 5.4%
2014 2015 2016 2017 2018
Hannover Re Peer Average1)
Our low expense ratio is an important strategic competitive advantage
The ratio has been improving – in absolute and relative terms
Administrative expense ratio
1) Peers: Munich Re, Swiss Re, Scor, Everest Re, RGA; own calculation
| 1 | 2 Expense ratio |
From the CFO’s desk13
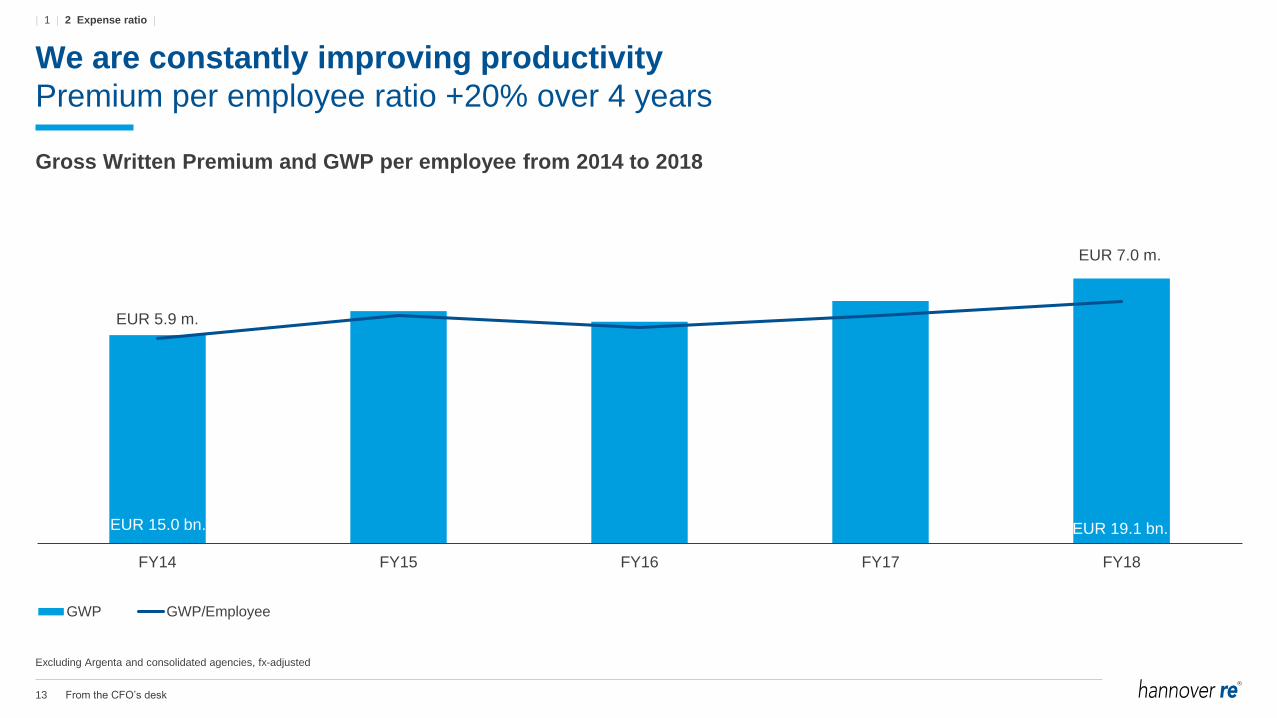
We are constantly improving productivity
Premium per employee ratio +20% over 4 years
Gross Written Premium and GWP per employee from 2014 to 2018
EUR 15.0 bn. EUR 19.1 bn.
EUR 5.9 m.
EUR 7.0 m.
FY14 FY15 FY16 FY17 FY18
GWP GWP/Employee
Excluding Argenta and consolidated agencies, fx-adjusted
| 1 | 2 Expense ratio |
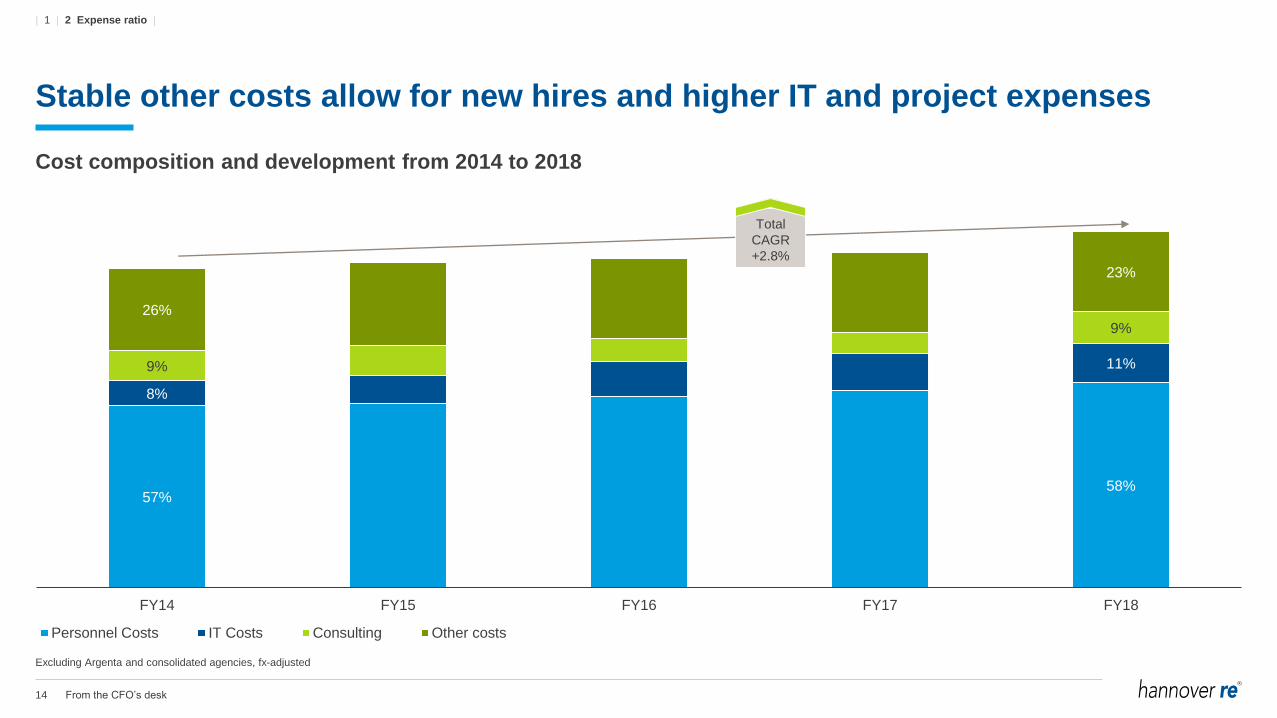
From the CFO’s desk14
Stable other costs allow for new hires and higher IT and project expenses
Cost composition and development from 2014 to 2018
57%58%
8%
11%9%
9%
26%
23%
FY14 FY15 FY16 FY17 FY18
Personnel Costs IT Costs Consulting Other costs
Total
CAGR
+2.8%
Excluding Argenta and consolidated agencies, fx-adjusted
| 1 | 2 Expense ratio |
From the CFO’s desk15
• Based in Hannover, Germany – relatively cost-attractive location
• Centralised underwriting in P&C
• Service for our clients is provided only in conjunction with business opportunities
• No major integration project in history
• Clear responsibilities – no matrix
• High degree of delegation of authorities
• Cost leadership as strategic target for decades – part of our DNA
• High degree of internal automation
Key drivers for Hannover Re’s cost leadership
Such drivers are sustainable factors & keep supporting a long-term competitive advantage
| 1 | 2 Expense ratio |
From the CFO’s desk16
This presentation does not address the investment objectives or financial situation of any particular person or legal entity.
Investors should seek independent professional advice and perform their own analysis regarding the appropriateness of
investing in any of our securities.
While Hannover Re has endeavoured to include in this presentation information it believes to be reliable, complete and up-to-
date, the company does not make any representation or warranty, express or implied, as to the accuracy, completeness or
updated status of such information.
Some of the statements in this presentation may be forward-looking statements or statements of future expectations based on
currently available information. Such statements naturally are subject to risks and uncertainties. Factors such as the
development of general economic conditions, future market conditions, unusual catastrophic loss events, changes in the capital
markets and other circumstances may cause the actual events or results to be materially different from those anticipated by
such statements.
This presentation serves information purposes only and does not constitute or form part of an offer or solicitation to acquire,
subscribe to or dispose of, any of the securities of Hannover Re.
© Hannover Rück SE. All rights reserved.
Hannover Re is the registered service mark of Hannover Rück SE.
Disclaimer

Capital generation and risk profileIncluding an update on our reserving level
Dr. Andreas Märkert, Chief Risk Officer and Managing Director Group Risk Management
22nd International Investors’ Day
Frankfurt, 23 October 2019
2 Capital generation and risk profile
Annual update of the P&C claim reserving level4
Cyber risk management3
Natural catastrophes and climate change risk2
Capital generation, Solvency II outlook and sensitivities1
Agenda
3 Capital generation and risk profile
Annual update of the P&C claim reserving level4
Cyber risk management3
Natural catastrophes and climate change risk2
Capital generation, Solvency II outlook and sensitivities1
Agenda
4 Capital generation and risk profile
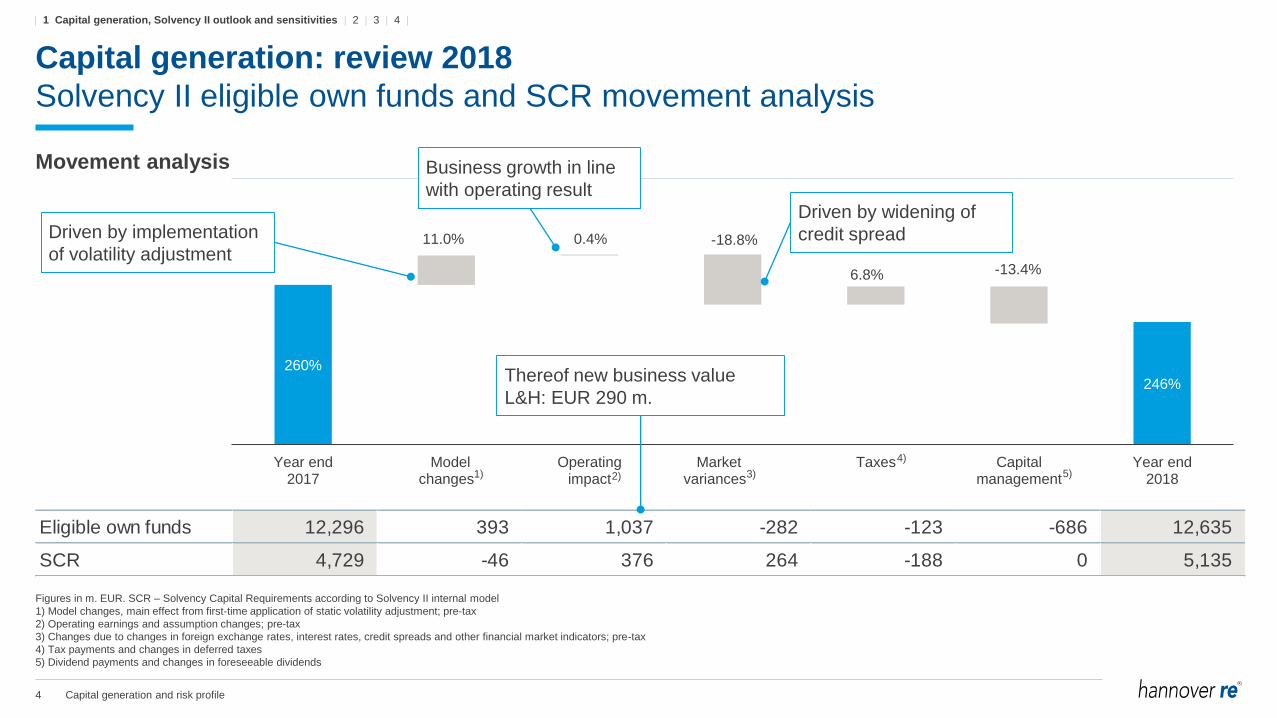
Capital generation: review 2018
Solvency II eligible own funds and SCR movement analysis
Movement analysis
260%
246%
11.0% 0.4% -18.8%
6.8% -13.4%
Year end2017
Modelchanges
Operatingimpact
Marketvariances
Taxes Capitalmanagement
Year end2018
Eligible own funds 12,296 393 1,037 -282 -123 -686 12,635
SCR 4,729 -46 376 264 -188 0 5,135
2) 3) 5)
4)
Figures in m. EUR. SCR – Solvency Capital Requirements according to Solvency II internal model
1) Model changes, main effect from first-time application of static volatility adjustment; pre-tax
2) Operating earnings and assumption changes; pre-tax
3) Changes due to changes in foreign exchange rates, interest rates, credit spreads and other financial market indicators; pre-tax
4) Tax payments and changes in deferred taxes
5) Dividend payments and changes in foreseeable dividends
Driven by widening of
credit spread
Thereof new business value
L&H: EUR 290 m.
1)
Driven by implementation
of volatility adjustment
| 1 Capital generation, Solvency II outlook and sensitivities | 2 | 3 | 4 |
Business growth in line
with operating result
5 Capital generation and risk profile
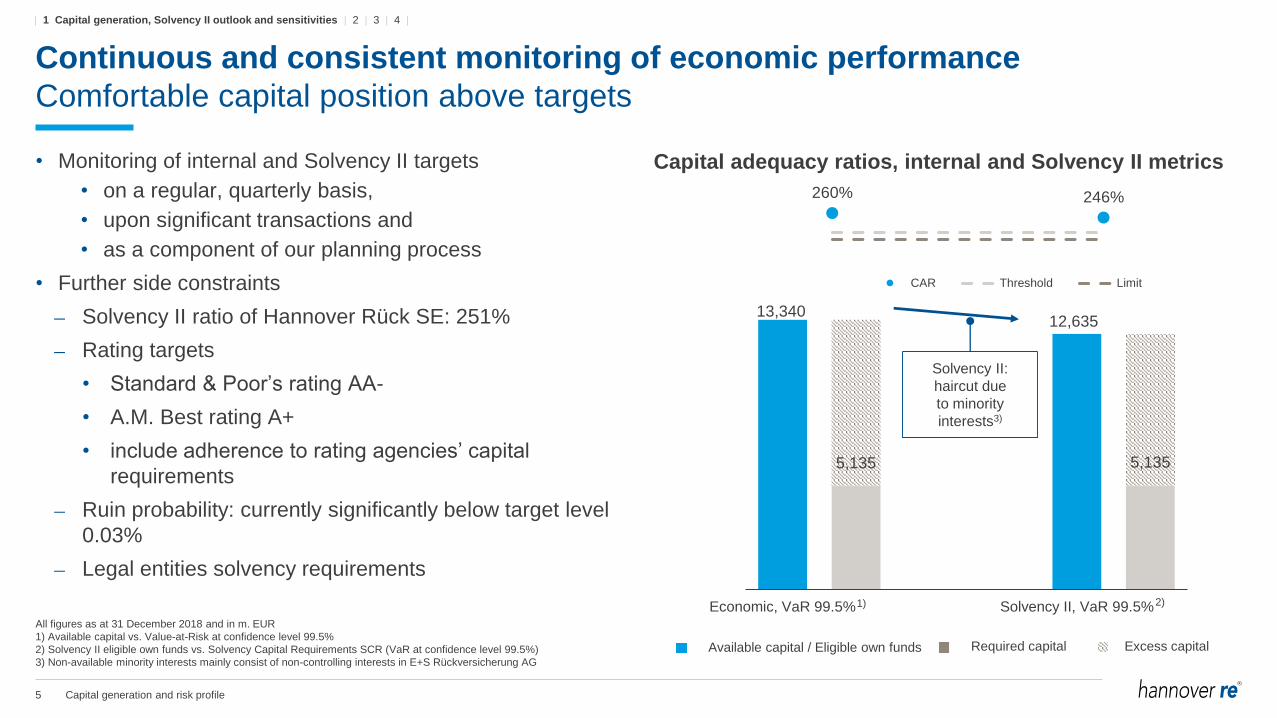
Continuous and consistent monitoring of economic performance
Comfortable capital position above targets
Capital adequacy ratios, internal and Solvency II metrics
All figures as at 31 December 2018 and in m. EUR
1) Available capital vs. Value-at-Risk at confidence level 99.5%
2) Solvency II eligible own funds vs. Solvency Capital Requirements SCR (VaR at confidence level 99.5%)
3) Non-available minority interests mainly consist of non-controlling interests in E+S Rückversicherung AG
• Monitoring of internal and Solvency II targets
• on a regular, quarterly basis,
• upon significant transactions and
• as a component of our planning process
• Further side constraints
Solvency II ratio of Hannover Rück SE: 251%
Rating targets
• Standard & Poor’s rating AA-
• A.M. Best rating A+
• include adherence to rating agencies’ capital
requirements
Ruin probability: currently significantly below target level
0.03%
Legal entities solvency requirements
260% 246%
CAR Threshold Limit
Available capital / Eligible own funds Required capital Excess capital
13,340
5,135
12,635
5,135
Economic, VaR 99.5% Solvency II, VaR 99.5%1) 2)
| 1 Capital generation, Solvency II outlook and sensitivities | 2 | 3 | 4 |
Solvency II:
haircut due
to minority
interests3)
6 Capital generation and risk profile
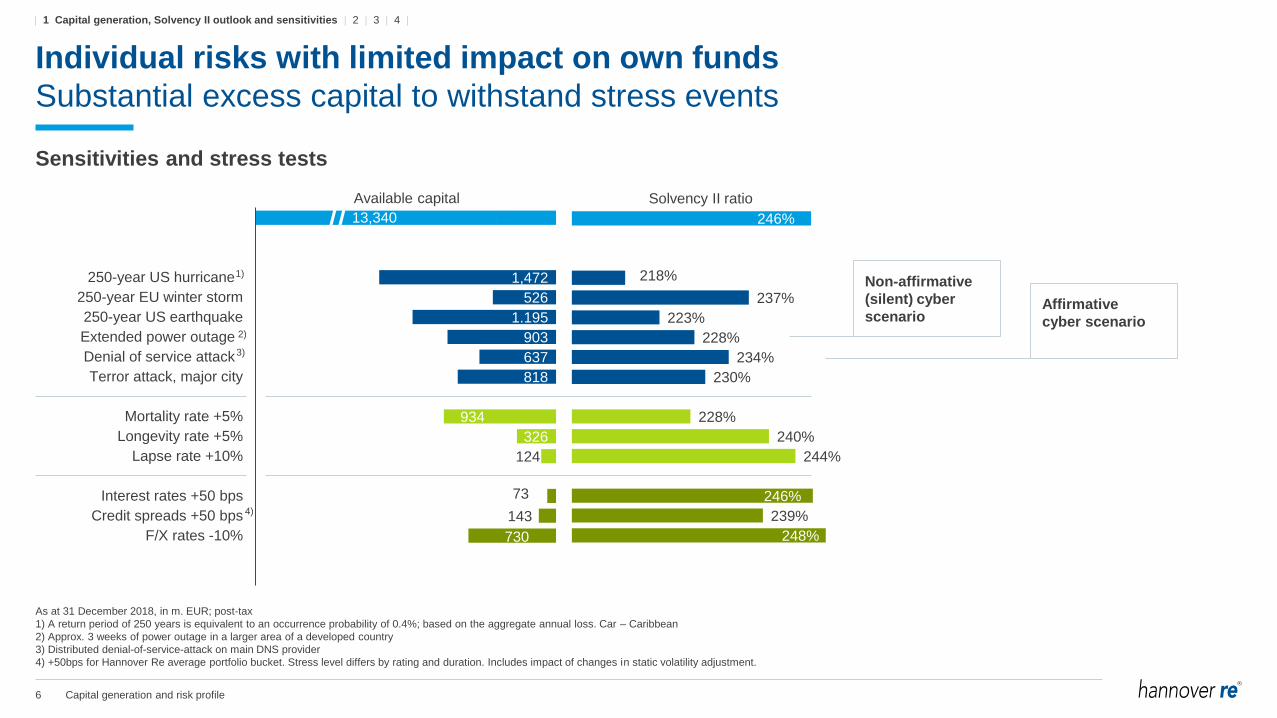
Individual risks with limited impact on own funds
Substantial excess capital to withstand stress events
As at 31 December 2018, in m. EUR; post-tax
1) A return period of 250 years is equivalent to an occurrence probability of 0.4%; based on the aggregate annual loss. Car – Caribbean
2) Approx. 3 weeks of power outage in a larger area of a developed country
3) Distributed denial-of-service-attack on main DNS provider
4) +50bps for Hannover Re average portfolio bucket. Stress level differs by rating and duration. Includes impact of changes in static volatility adjustment.
1,472
526
1.195
903
637
818
934
326
124
73
143
730
250-year US hurricane
250-year EU winter storm
250-year US earthquake
Extended power outage
Denial of service attack
Terror attack, major city
Mortality rate +5%
Longevity rate +5%
Lapse rate +10%
Interest rates +50 bps
Credit spreads +50 bps
F/X rates -10%
246%
218%
237%
223%
228%
234%
230%
228%
240%
244%
246%
239%
248%
Available capital Solvency II ratio
13,340
1)
2)
3)
Non-affirmative
(silent) cyber
scenarioAffirmative
cyber scenario
4)
| 1 Capital generation, Solvency II outlook and sensitivities | 2 | 3 | 4 |
Sensitivities and stress tests
7 Capital generation and risk profile
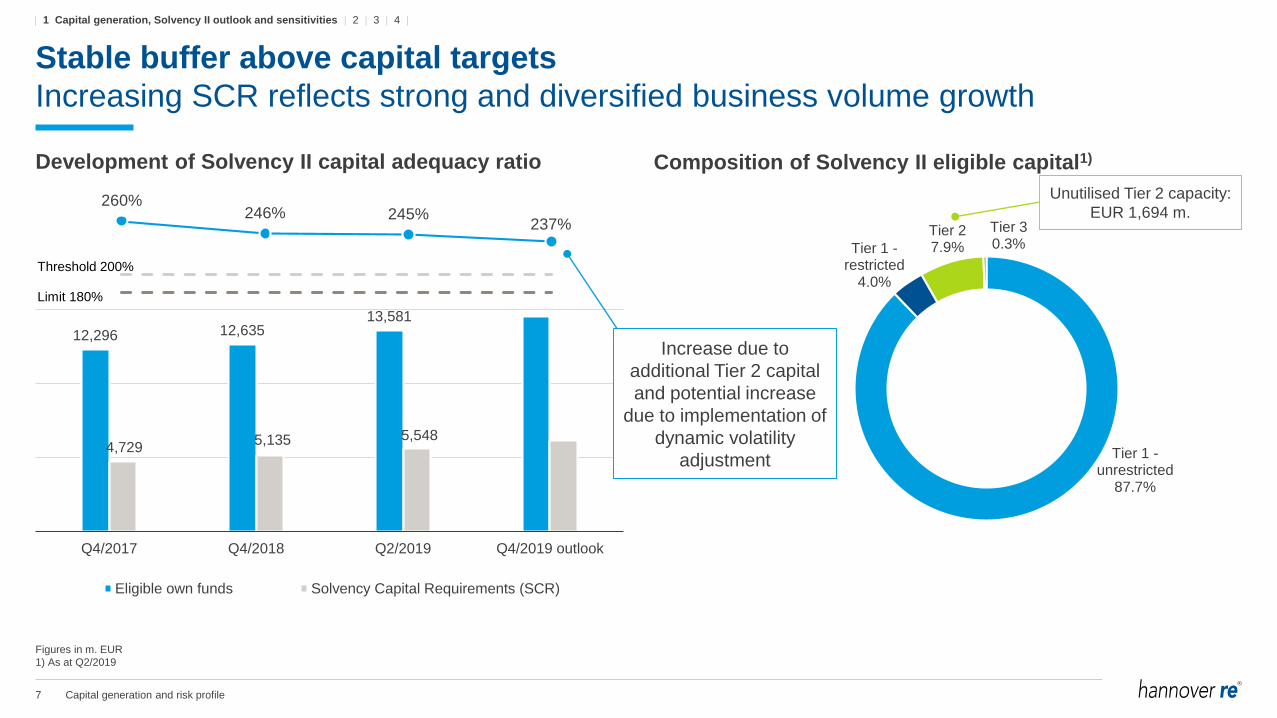
Stable buffer above capital targets
Increasing SCR reflects strong and diversified business volume growth
Development of Solvency II capital adequacy ratio Composition of Solvency II eligible capital1)
Tier 1 -unrestricted
87.7%
Tier 1 -restricted
4.0%
Tier 27.9%
Tier 30.3%
12,296 12,63513,581
4,7295,135 5,548
Q4/2017 Q4/2018 Q2/2019 Q4/2019 outlook
Eligible own funds Solvency Capital Requirements (SCR)
260%246% 245%
237%
Threshold 200%
Limit 180%
Unutilised Tier 2 capacity:
EUR 1,694 m.
Figures in m. EUR
1) As at Q2/2019
Increase due to
additional Tier 2 capital
and potential increase
due to implementation of
dynamic volatility
adjustment
| 1 Capital generation, Solvency II outlook and sensitivities | 2 | 3 | 4 |
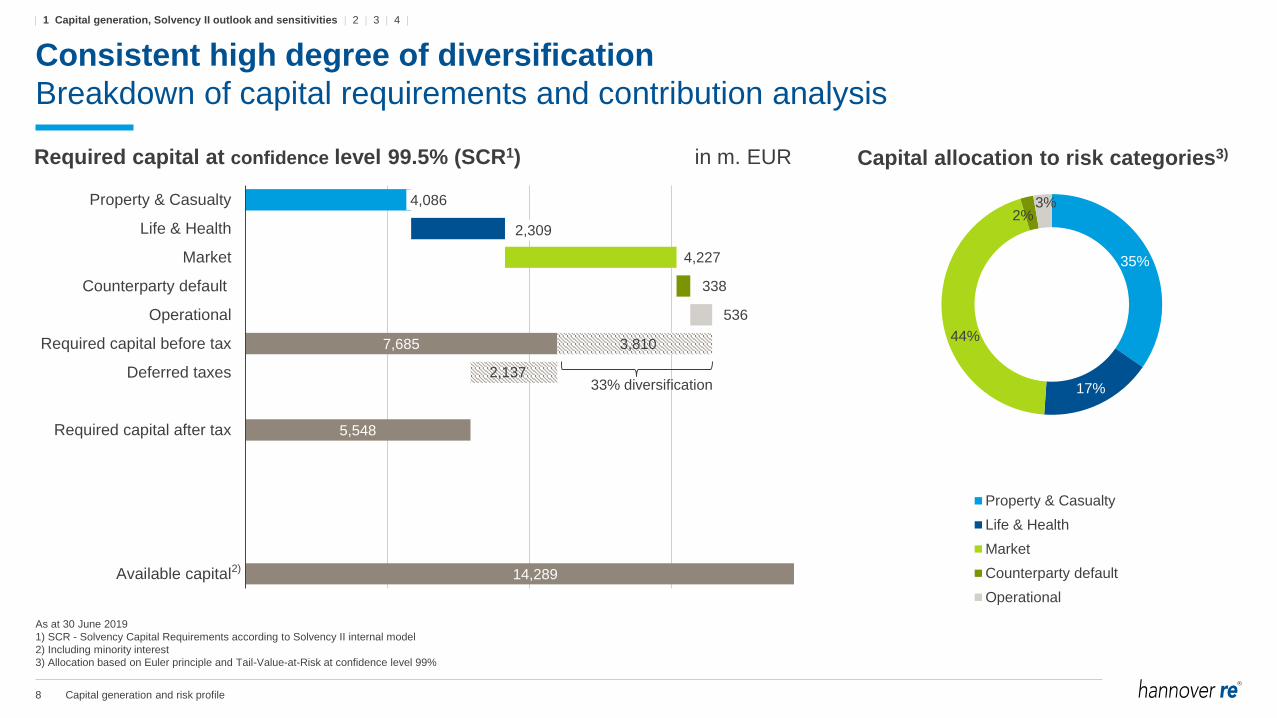
8 Capital generation and risk profile
7,685
5,548
14,289
4,086
2,309
4,227
338
536
3,810
2,137
Property & Casualty
Life & Health
Market
Counterparty default
Operational
Required capital before tax
Deferred taxes
Required capital after tax
Available capital
35%
17%
44%
2%3%
Property & Casualty
Life & Health
Market
Counterparty default
Operational
Consistent high degree of diversification
Breakdown of capital requirements and contribution analysis
Required capital at confidence level 99.5% (SCR1) in m. EUR
As at 30 June 2019
1) SCR - Solvency Capital Requirements according to Solvency II internal model
2) Including minority interest
3) Allocation based on Euler principle and Tail-Value-at-Risk at confidence level 99%
33% diversification
2)
| 1 Capital generation, Solvency II outlook and sensitivities | 2 | 3 | 4 |
Capital allocation to risk categories3)
9 Capital generation and risk profile
Annual update of the P&C claim reserving level4
Cyber risk management3
Natural catastrophes and climate change risk2
Capital generation, Solvency II outlook and sensitivities1
Agenda
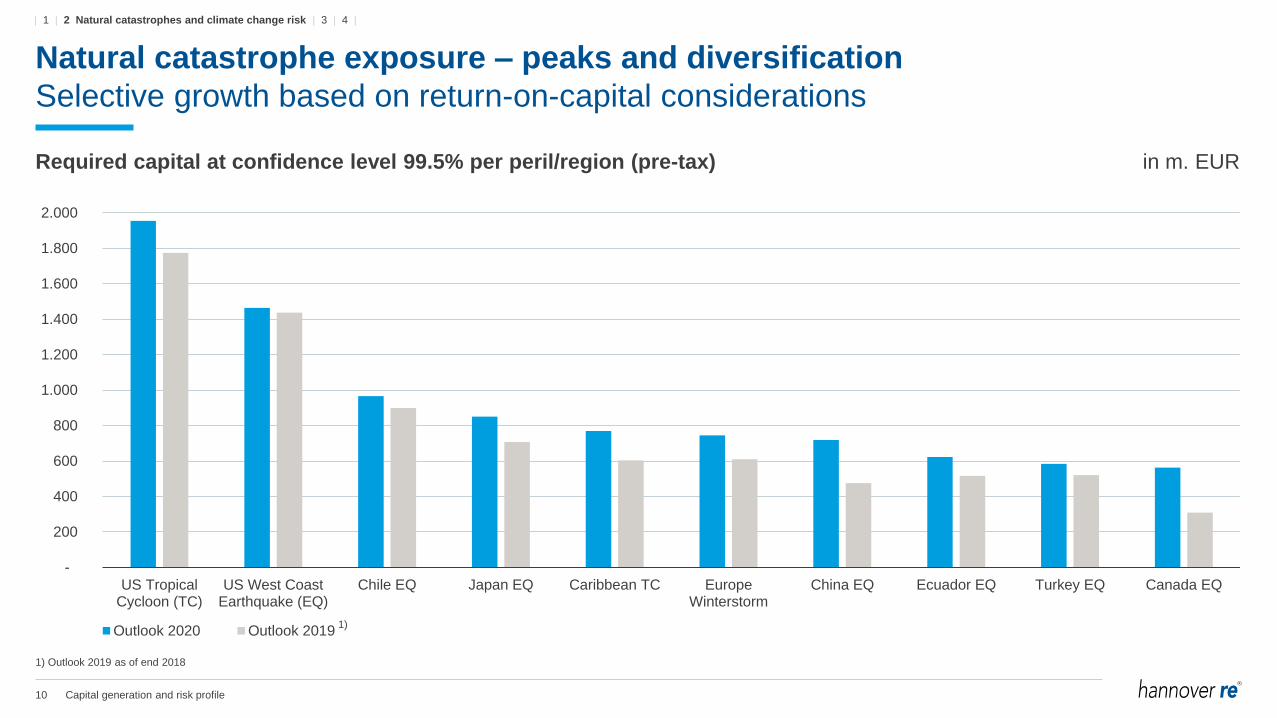
10 Capital generation and risk profile
Natural catastrophe exposure – peaks and diversification
Selective growth based on return-on-capital considerations
Required capital at confidence level 99.5% per peril/region (pre-tax) in m. EUR
-
200
400
600
800
1.000
1.200
1.400
1.600
1.800
2.000
US TropicalCycloon (TC)
US West CoastEarthquake (EQ)
Chile EQ Japan EQ Caribbean TC EuropeWinterstorm
China EQ Ecuador EQ Turkey EQ Canada EQ
Outlook 2020 Outlook 2019
1) Outlook 2019 as of end 2018
1)
| 1 | 2 Natural catastrophes and climate change risk | 3 | 4 |
11 Capital generation and risk profile
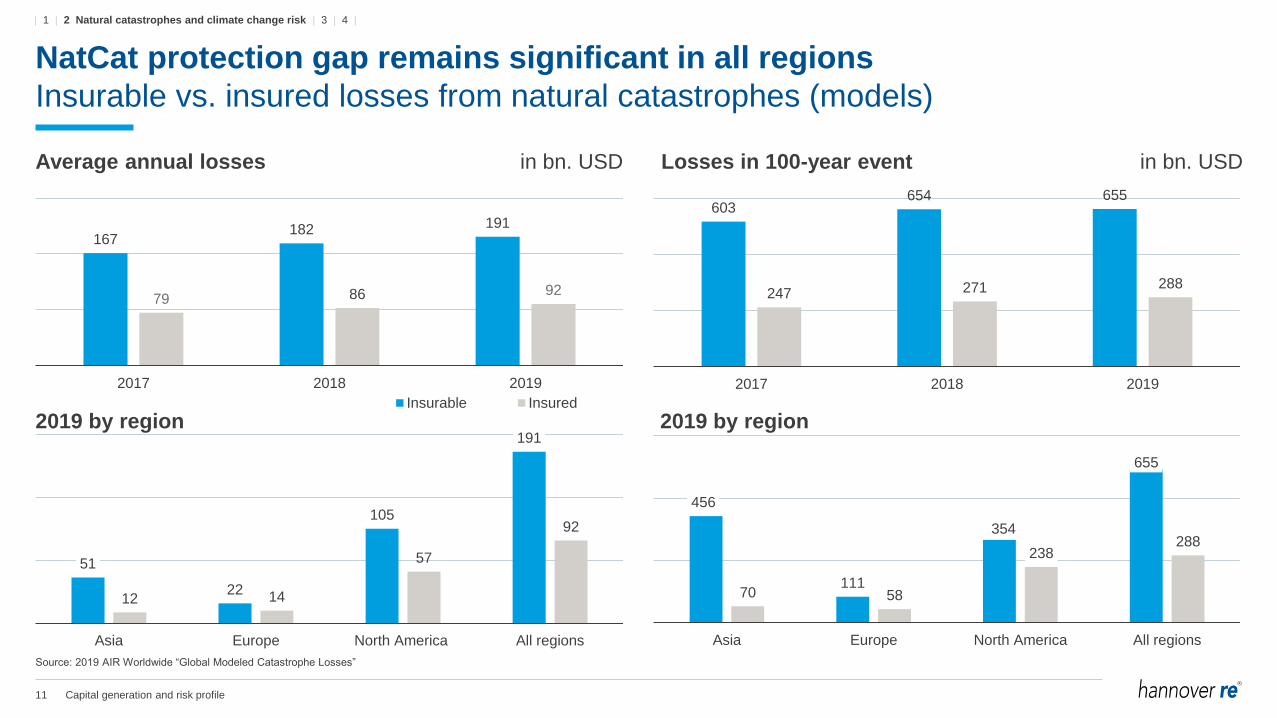
NatCat protection gap remains significant in all regions
Insurable vs. insured losses from natural catastrophes (models)
Average annual losses in bn. USD
167182 191
79 86 92
2017 2018 2019
Insurable Insured
Losses in 100-year event in bn. USD
603654 655
247 271 288
2017 2018 2019
Source: 2019 AIR Worldwide “Global Modeled Catastrophe Losses”
51
22
105
191
12 14
57
92
Asia Europe North America All regions
456
111
354
655
70 58
238288
Asia Europe North America All regions
| 1 | 2 Natural catastrophes and climate change risk | 3 | 4 |
2019 by region 2019 by region
12 Capital generation and risk profile
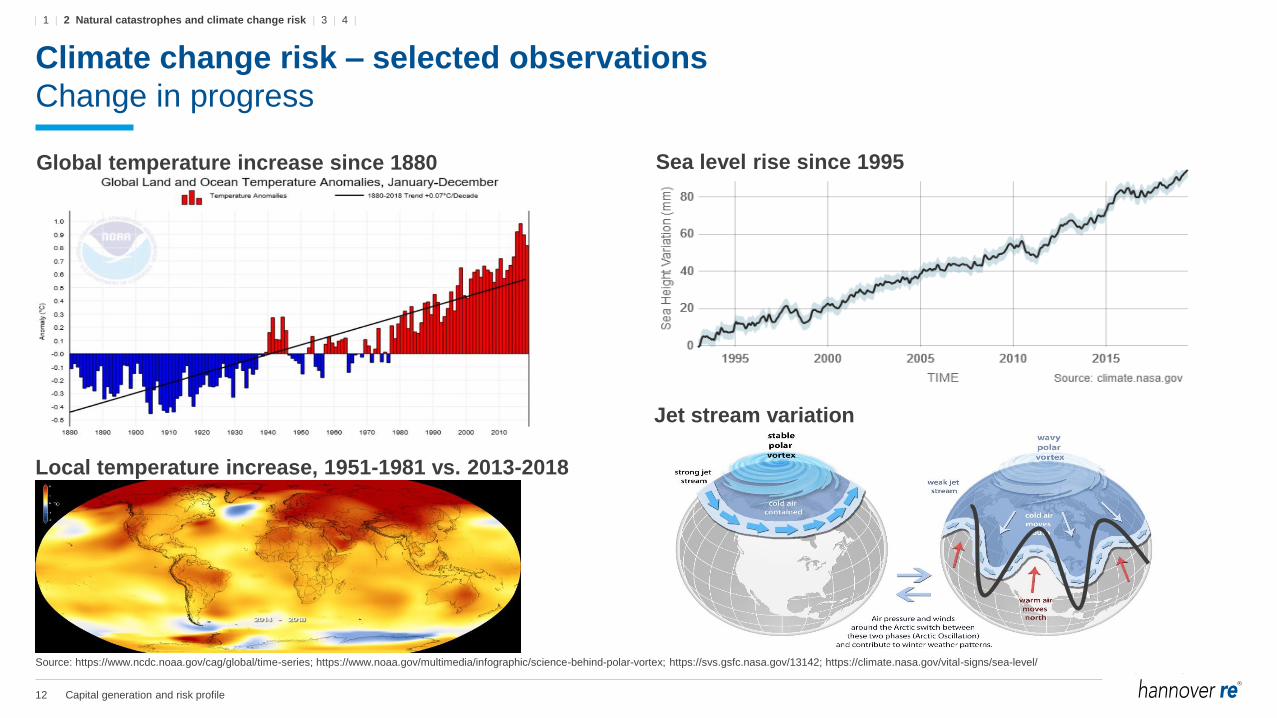
Climate change risk – selected observations
Change in progress
(NOAA)
| 1 | 2 Natural catastrophes and climate change risk | 3 | 4 |
Global temperature increase since 1880 Sea level rise since 1995
Local temperature increase, 1951-1981 vs. 2013-2018
Jet stream variation
Source: https://www.ncdc.noaa.gov/cag/global/time-series; https://www.noaa.gov/multimedia/infographic/science-behind-polar-vortex; https://svs.gsfc.nasa.gov/13142; https://climate.nasa.gov/vital-signs/sea-level/
13 Capital generation and risk profile
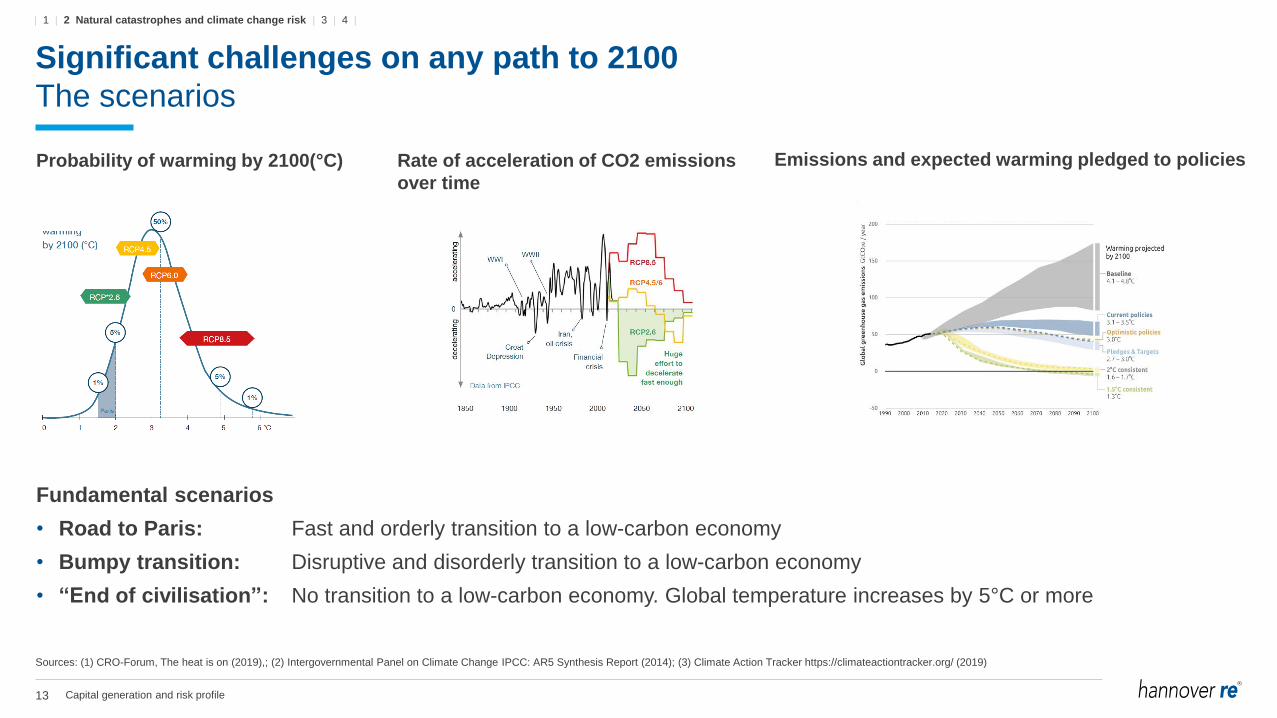
Significant challenges on any path to 2100
The scenarios
Fundamental scenarios
• Road to Paris: Fast and orderly transition to a low-carbon economy
• Bumpy transition: Disruptive and disorderly transition to a low-carbon economy
• “End of civilisation”: No transition to a low-carbon economy. Global temperature increases by 5°C or more
Probability of warming by 2100(°C) Rate of acceleration of CO2 emissions
over time
| 1 | 2 Natural catastrophes and climate change risk | 3 | 4 |
Emissions and expected warming pledged to policies
13
Sources: (1) CRO-Forum, The heat is on (2019),; (2) Intergovernmental Panel on Climate Change IPCC: AR5 Synthesis Report (2014); (3) Climate Action Tracker https://climateactiontracker.org/ (2019)
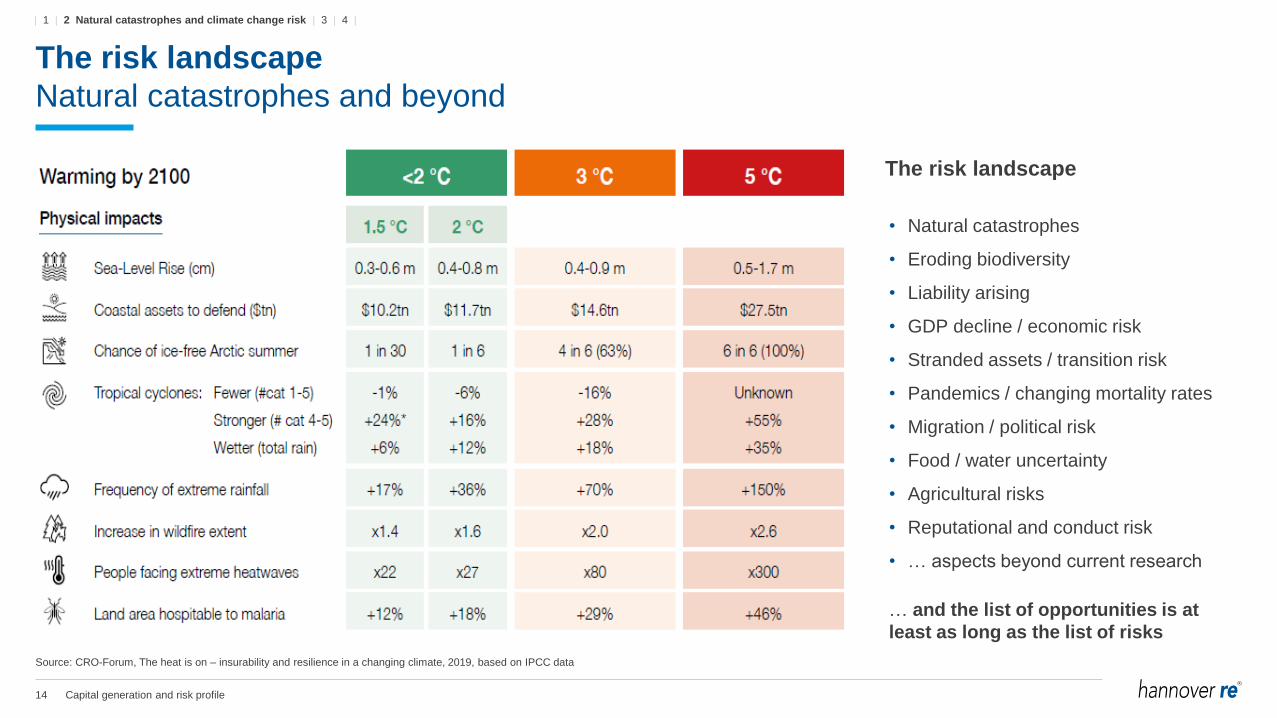
14 Capital generation and risk profile
The risk landscape
Natural catastrophes and beyond
Source: CRO-Forum, The heat is on – insurability and resilience in a changing climate, 2019, based on IPCC data
| 1 | 2 Natural catastrophes and climate change risk | 3 | 4 |
The risk landscape
• Natural catastrophes
• Eroding biodiversity
• Liability arising
• GDP decline / economic risk
• Stranded assets / transition risk
• Pandemics / changing mortality rates
• Migration / political risk
• Food / water uncertainty
• Agricultural risks
• Reputational and conduct risk
• … aspects beyond current research
… and the list of opportunities is at
least as long as the list of risks
15 Capital generation and risk profile
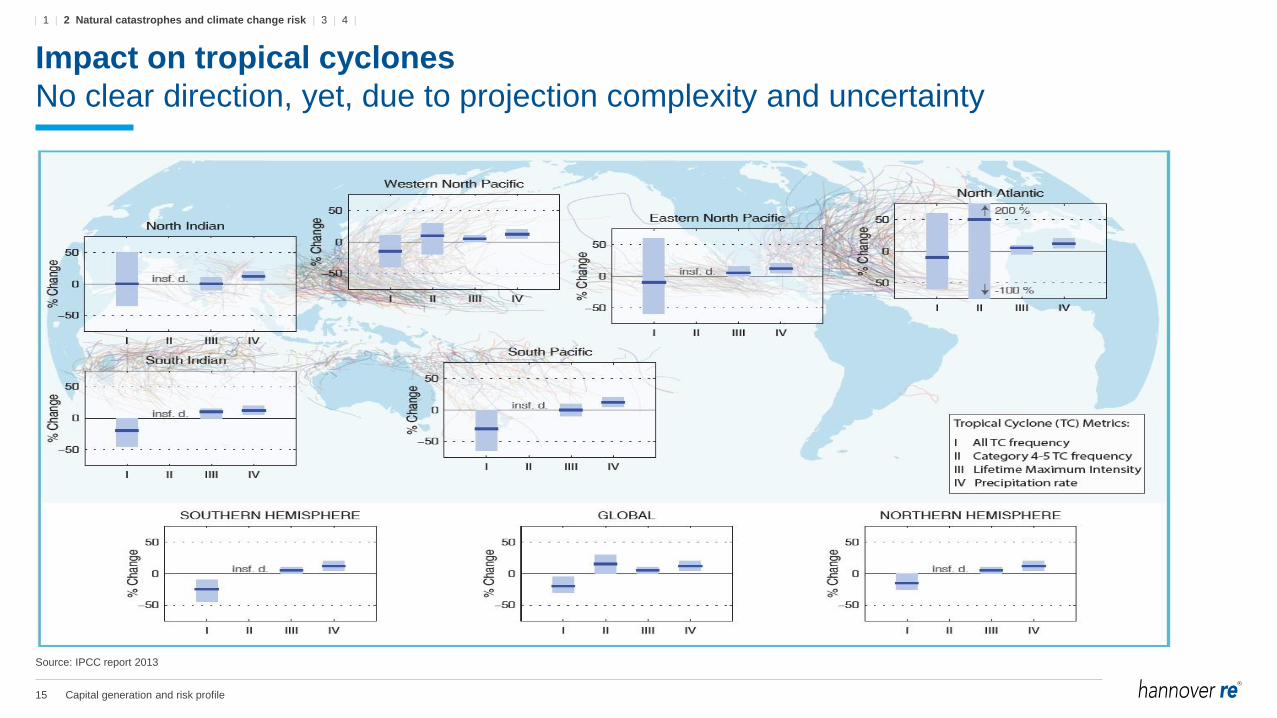
Impact on tropical cyclones
No clear direction, yet, due to projection complexity and uncertainty
Source: IPCC report 2013
| 1 | 2 Natural catastrophes and climate change risk | 3 | 4 |
16 Capital generation and risk profile
• Climate change is in progress and any path to 2100 – whether focusing on climate change prevention or adoption - bears
significant risks (and opportunities). The speed of change is difficult to estimate, e.g. due to a number of self-inflating
processes.
• Natural catastrophe protection remains a core element of re/insurance and a core element of Hannover Re’s business model.
Increasing uncertainties about the impact of climate change and the impact as it materializes may call for (technical) price
increases (for selected exposure).
• Current natural catastrophe models incorporate the past impacts from climate change but no strong trends. The one-year
time horizon of natural catastrophe protection helps to limit the impact of currently unknown effects.
• Closing the protection gap remains a challenge for both, the re/insurance industry and policy makers. More so in scenarios
with larger temperature increases. Hannover Re contributes to a significant number of projects to address the current and
future protection gap.
Climate change risk – conclusions
| 1 | 2 Natural catastrophes and climate change risk | 3 | 4 |
17 Capital generation and risk profile
Annual update of the P&C claim reserving level4
Cyber risk management3
Natural catastrophes and climate change risk2
Capital generation, Solvency II outlook and sensitivities1
Agenda
18 Capital generation and risk profile
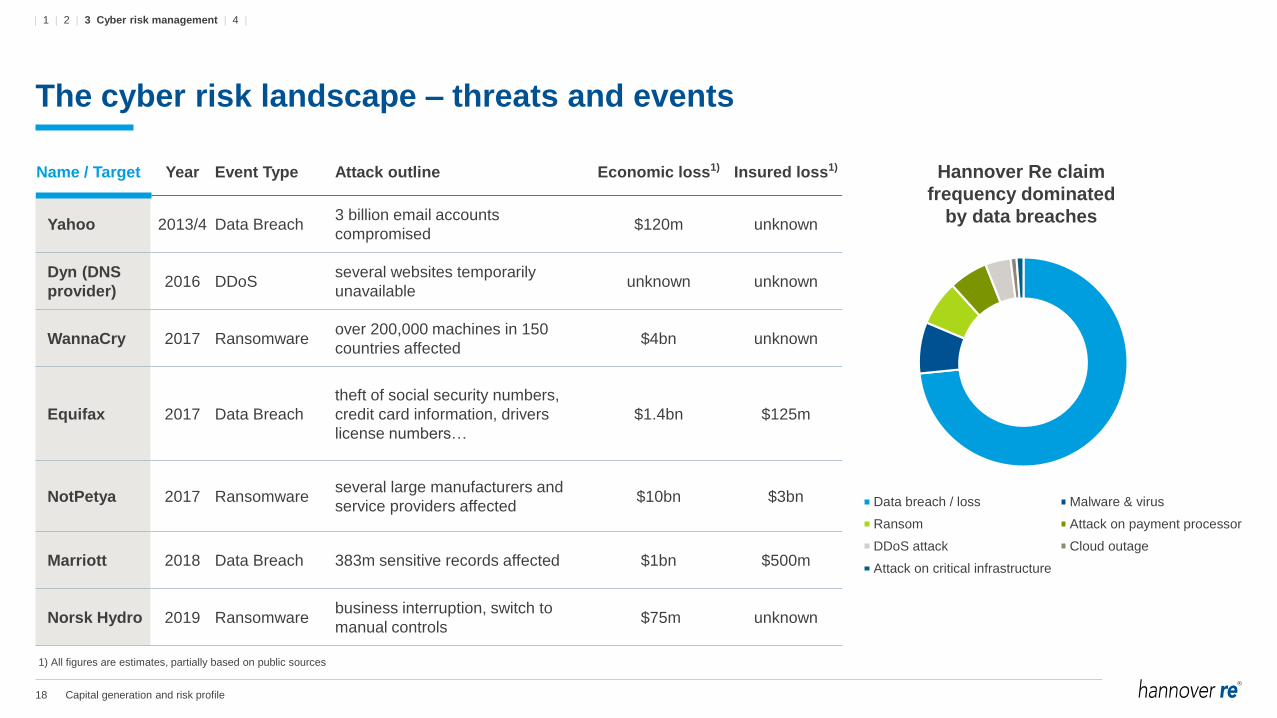
The cyber risk landscape – threats and events
Name / Target Year Event Type Attack outline Economic loss1) Insured loss1)
Yahoo 2013/4 Data Breach3 billion email accounts
compromised$120m unknown
Dyn (DNS
provider)2016 DDoS
several websites temporarily
unavailableunknown unknown
WannaCry 2017 Ransomwareover 200,000 machines in 150
countries affected$4bn unknown
Equifax 2017 Data Breach
theft of social security numbers,
credit card information, drivers
license numbers…
$1.4bn $125m
NotPetya 2017 Ransomwareseveral large manufacturers and
service providers affected$10bn $3bn
Marriott 2018 Data Breach 383m sensitive records affected $1bn $500m
Norsk Hydro 2019 Ransomwarebusiness interruption, switch to
manual controls$75m unknown
Data breach / loss Malware & virus
Ransom Attack on payment processor
DDoS attack Cloud outage
Attack on critical infrastructure
Hannover Re claim
frequency dominated
by data breaches
1) All figures are estimates, partially based on public sources
| 1 | 2 | 3 Cyber risk management | 4 |
19 Capital generation and risk profile
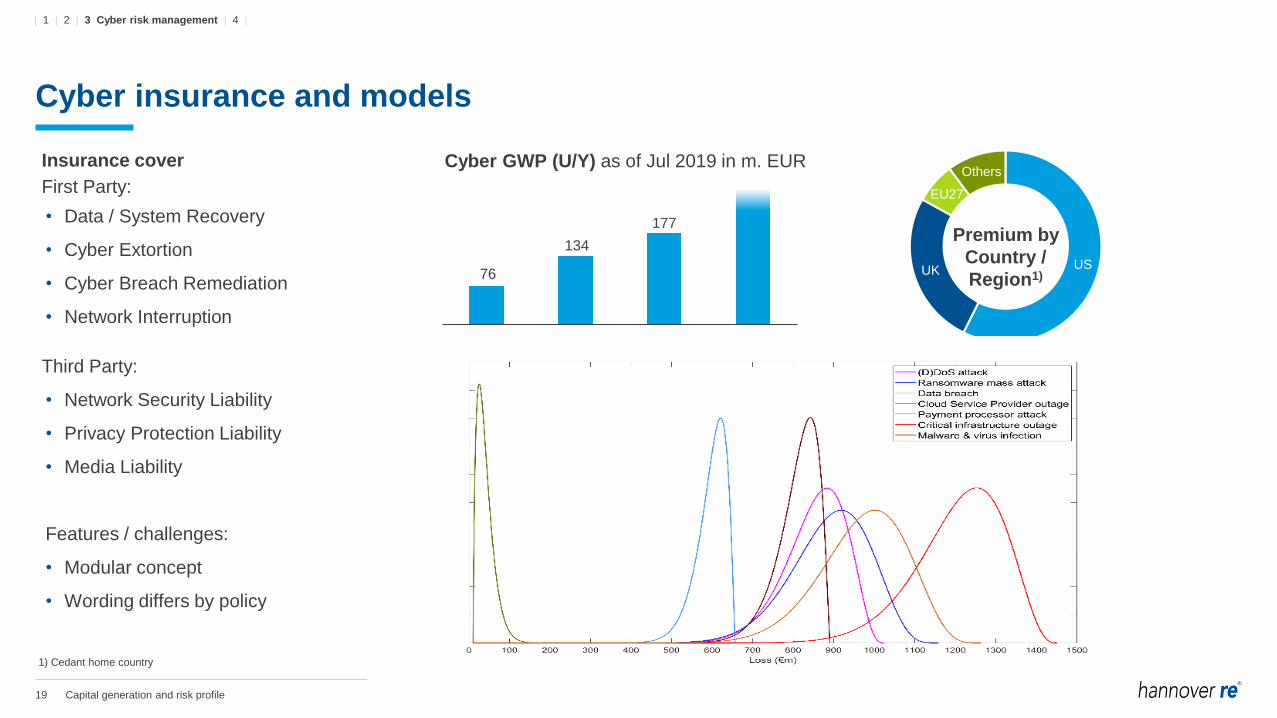
Cyber insurance and models
76
134
177
2016 2017 2018 2019
Cyber GWP (U/Y) as of Jul 2019 in m. EUR
USUK
EU27
Others
| 1 | 2 | 3 Cyber risk management | 4 |
Premium by
Country /
Region1)
Insurance cover
First Party:
• Data / System Recovery
• Cyber Extortion
• Cyber Breach Remediation
• Network Interruption
Third Party:
• Network Security Liability
• Privacy Protection Liability
• Media Liability
Features / challenges:
• Modular concept
• Wording differs by policy
1) Cedant home country
20 Capital generation and risk profile
Annual update of the P&C claim reserving level4
Cyber risk management3
Natural catastrophes and climate change risk2
Capital generation, Solvency II outlook and sensitivities1
Agenda
21 Capital generation and risk profile
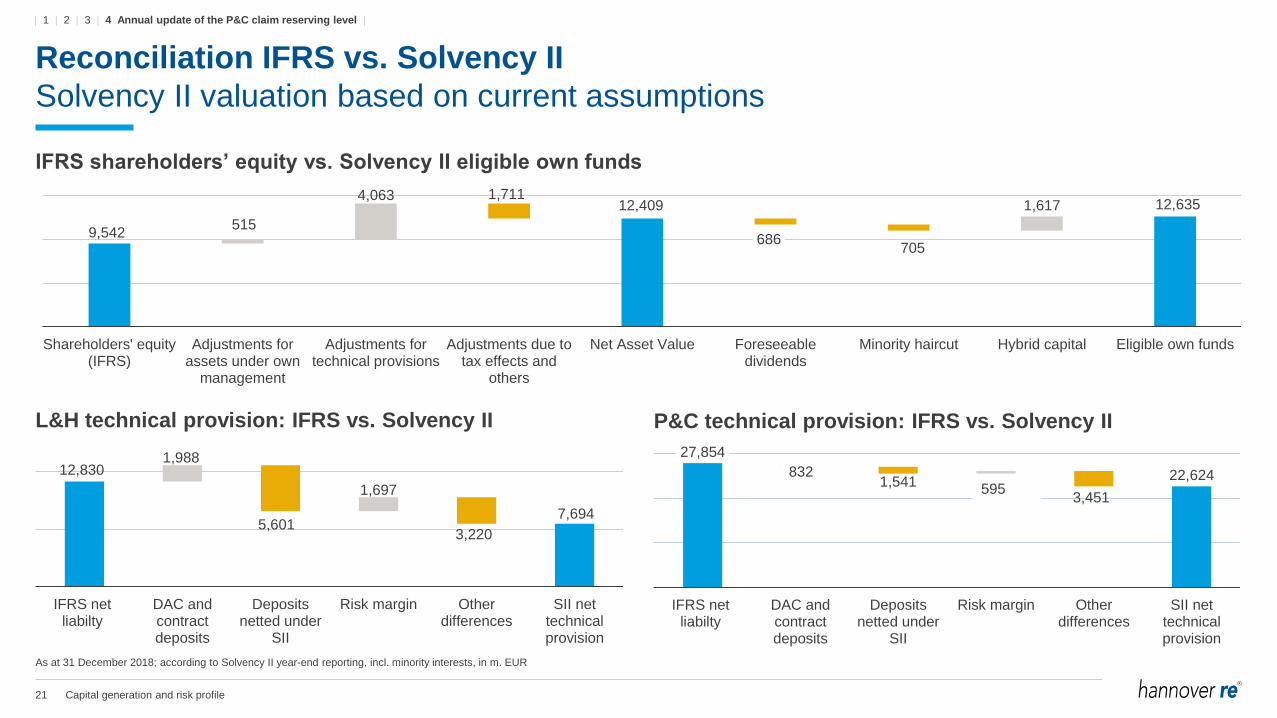
Reconciliation IFRS vs. Solvency II
Solvency II valuation based on current assumptions
| 1 | 2 | 3 | 4 Annual update of the P&C claim reserving level |
IFRS shareholders’ equity vs. Solvency II eligible own funds
12,409 12,635
9,542515
4,063 1,711
686705
1,617
Shareholders' equity(IFRS)
Adjustments forassets under own
management
Adjustments fortechnical provisions
Adjustments due totax effects and
others
Net Asset Value Foreseeabledividends
Minority haircut Hybrid capital Eligible own funds
L&H technical provision: IFRS vs. Solvency II
12,8301,988
5,601
1,697
3,220
7,694
IFRS netliabilty
DAC andcontractdeposits
Depositsnetted under
SII
Risk margin Otherdifferences
SII nettechnicalprovision
P&C technical provision: IFRS vs. Solvency II
27,854
0,832 1,541 0,5953,451
22,624
IFRS netliabilty
DAC andcontractdeposits
Depositsnetted under
SII
Risk margin Otherdifferences
SII nettechnicalprovision
832
As at 31 December 2018; according to Solvency II year-end reporting, incl. minority interests, in m. EUR
595
22 Capital generation and risk profile
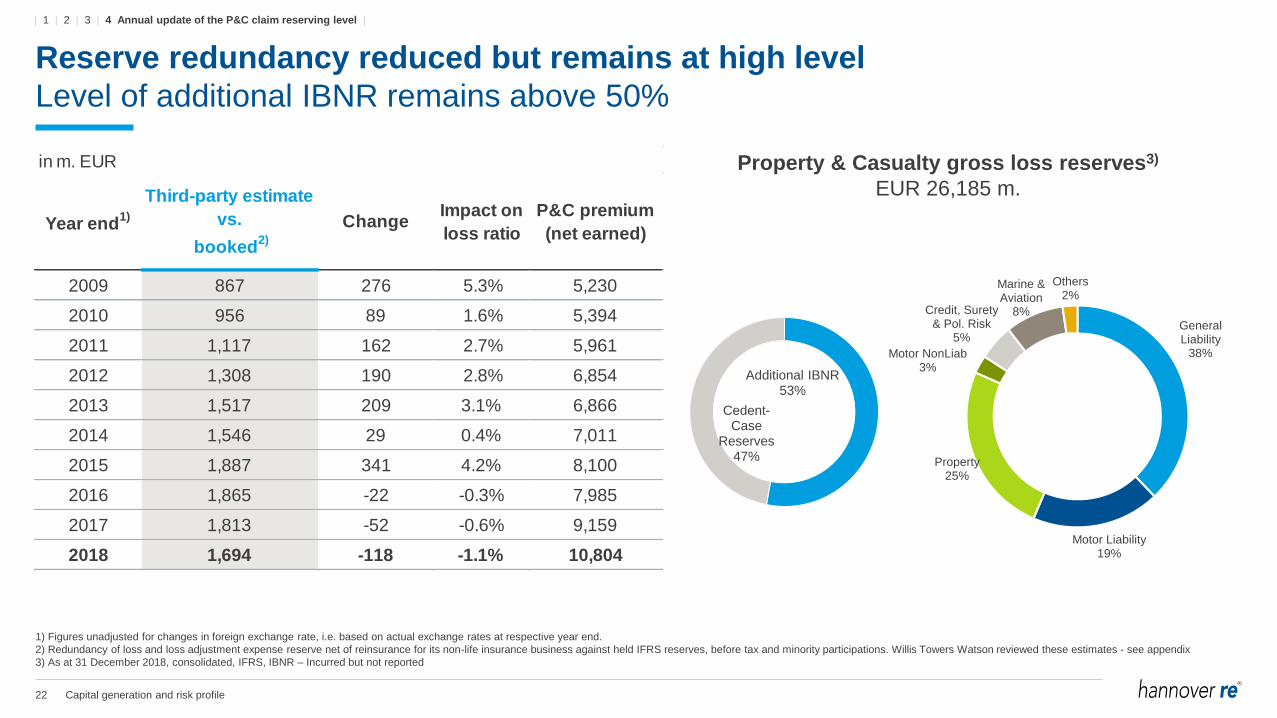
Reserve redundancy reduced but remains at high level
Level of additional IBNR remains above 50%
1) Figures unadjusted for changes in foreign exchange rate, i.e. based on actual exchange rates at respective year end.
2) Redundancy of loss and loss adjustment expense reserve net of reinsurance for its non-life insurance business against held IFRS reserves, before tax and minority participations. Willis Towers Watson reviewed these estimates - see appendix
3) As at 31 December 2018, consolidated, IFRS, IBNR – Incurred but not reported
in m. EUR
Year end1)
Third-party estimate
vs.
booked2)
Change Impact on
loss ratio
P&C premium
(net earned)
2009 867 276 5.3% 5,230
2010 956 89 1.6% 5,394
2011 1,117 162 2.7% 5,961
2012 1,308 190 2.8% 6,854
2013 1,517 209 3.1% 6,866
2014 1,546 29 0.4% 7,011
2015 1,887 341 4.2% 8,100
2016 1,865 -22 -0.3% 7,985
2017 1,813 -52 -0.6% 9,159
2018 1,694 -118 -1.1% 10,804
| 1 | 2 | 3 | 4 Annual update of the P&C claim reserving level |
General Liability
38%
Motor Liability19%
Property25%
Motor NonLiab3%
Credit, Surety & Pol. Risk
5%
Marine & Aviation
8%
Others2%
Additional IBNR53%
Cedent-Case
Reserves47%
Property & Casualty gross loss reserves3)
EUR 26,185 m.
23 Capital generation and risk profile
Details on reserve review by Willis Towers Watson
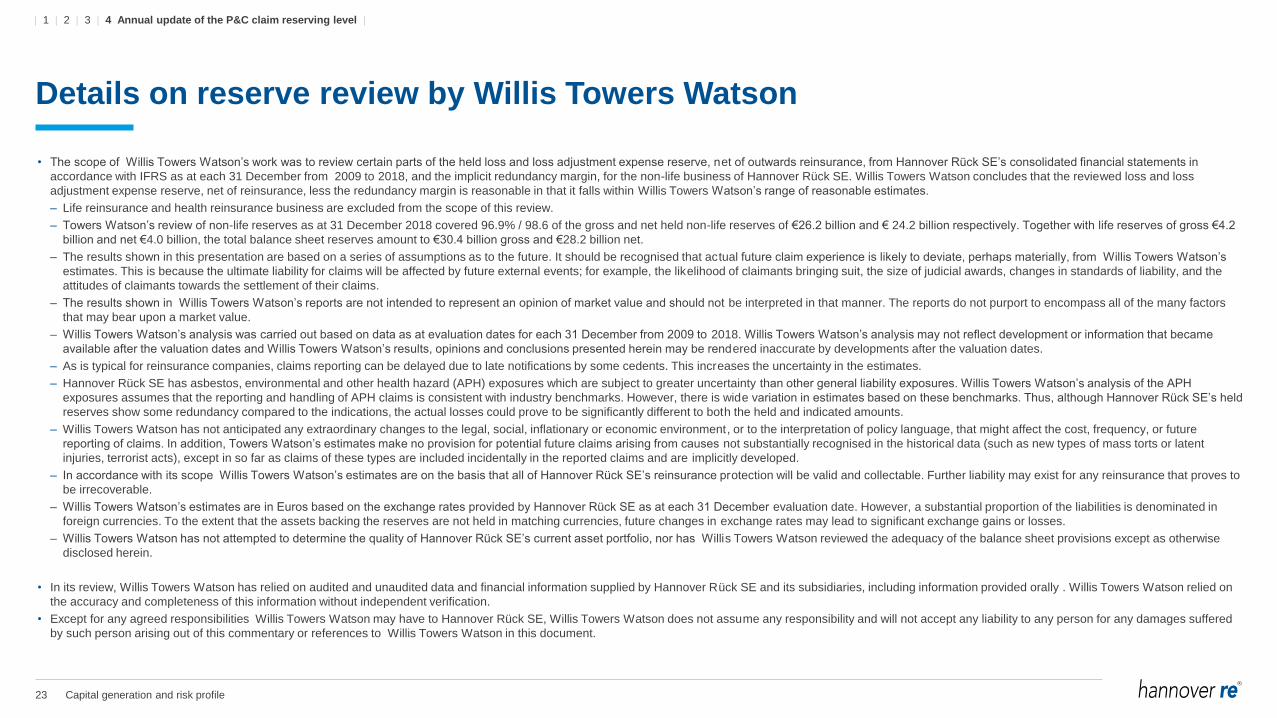
• The scope of Willis Towers Watson’s work was to review certain parts of the held loss and loss adjustment expense reserve, net of outwards reinsurance, from Hannover Rück SE’s consolidated financial statements in
accordance with IFRS as at each 31 December from 2009 to 2018, and the implicit redundancy margin, for the non-life business of Hannover Rück SE. Willis Towers Watson concludes that the reviewed loss and loss
adjustment expense reserve, net of reinsurance, less the redundancy margin is reasonable in that it falls within Willis Towers Watson’s range of reasonable estimates.
– Life reinsurance and health reinsurance business are excluded from the scope of this review.
– Towers Watson’s review of non-life reserves as at 31 December 2018 covered 96.9% / 98.6 of the gross and net held non-life reserves of €26.2 billion and € 24.2 billion respectively. Together with life reserves of gross €4.2
billion and net €4.0 billion, the total balance sheet reserves amount to €30.4 billion gross and €28.2 billion net.
– The results shown in this presentation are based on a series of assumptions as to the future. It should be recognised that actual future claim experience is likely to deviate, perhaps materially, from Willis Towers Watson’s
estimates. This is because the ultimate liability for claims will be affected by future external events; for example, the likelihood of claimants bringing suit, the size of judicial awards, changes in standards of liability, and the
attitudes of claimants towards the settlement of their claims.
– The results shown in Willis Towers Watson’s reports are not intended to represent an opinion of market value and should not be interpreted in that manner. The reports do not purport to encompass all of the many factors
that may bear upon a market value.
– Willis Towers Watson’s analysis was carried out based on data as at evaluation dates for each 31 December from 2009 to 2018. Willis Towers Watson’s analysis may not reflect development or information that became
available after the valuation dates and Willis Towers Watson’s results, opinions and conclusions presented herein may be rendered inaccurate by developments after the valuation dates.
– As is typical for reinsurance companies, claims reporting can be delayed due to late notifications by some cedents. This increases the uncertainty in the estimates.
– Hannover Rück SE has asbestos, environmental and other health hazard (APH) exposures which are subject to greater uncertainty than other general liability exposures. Willis Towers Watson’s analysis of the APH
exposures assumes that the reporting and handling of APH claims is consistent with industry benchmarks. However, there is wide variation in estimates based on these benchmarks. Thus, although Hannover Rück SE’s held
reserves show some redundancy compared to the indications, the actual losses could prove to be significantly different to both the held and indicated amounts.
– Willis Towers Watson has not anticipated any extraordinary changes to the legal, social, inflationary or economic environment, or to the interpretation of policy language, that might affect the cost, frequency, or future
reporting of claims. In addition, Towers Watson’s estimates make no provision for potential future claims arising from causes not substantially recognised in the historical data (such as new types of mass torts or latent
injuries, terrorist acts), except in so far as claims of these types are included incidentally in the reported claims and are implicitly developed.
– In accordance with its scope Willis Towers Watson’s estimates are on the basis that all of Hannover Rück SE’s reinsurance protection will be valid and collectable. Further liability may exist for any reinsurance that proves to
be irrecoverable.
– Willis Towers Watson’s estimates are in Euros based on the exchange rates provided by Hannover Rück SE as at each 31 December evaluation date. However, a substantial proportion of the liabilities is denominated in
foreign currencies. To the extent that the assets backing the reserves are not held in matching currencies, future changes in exchange rates may lead to significant exchange gains or losses.
– Willis Towers Watson has not attempted to determine the quality of Hannover Rück SE’s current asset portfolio, nor has Willis Towers Watson reviewed the adequacy of the balance sheet provisions except as otherwise
disclosed herein.
• In its review, Willis Towers Watson has relied on audited and unaudited data and financial information supplied by Hannover Rück SE and its subsidiaries, including information provided orally . Willis Towers Watson relied on
the accuracy and completeness of this information without independent verification.
• Except for any agreed responsibilities Willis Towers Watson may have to Hannover Rück SE, Willis Towers Watson does not assume any responsibility and will not accept any liability to any person for any damages suffered
by such person arising out of this commentary or references to Willis Towers Watson in this document.
| 1 | 2 | 3 | 4 Annual update of the P&C claim reserving level |
24 Capital generation and risk profile
This presentation does not address the investment objectives or financial situation of any particular person or legal entity.
Investors should seek independent professional advice and perform their own analysis regarding the appropriateness of
investing in any of our securities.
While Hannover Re has endeavoured to include in this presentation information it believes to be reliable, complete and up-to-
date, the company does not make any representation or warranty, express or implied, as to the accuracy, completeness or
updated status of such information.
Some of the statements in this presentation may be forward-looking statements or statements of future expectations based on
currently available information. Such statements naturally are subject to risks and uncertainties. Factors such as the
development of general economic conditions, future market conditions, unusual catastrophic loss events, changes in the capital
markets and other circumstances may cause the actual events or results to be materially different from those anticipated by
such statements.
This presentation serves information purposes only and does not constitute or form part of an offer or solicitation to acquire,
subscribe to or dispose of, any of the securities of Hannover Re.
© Hannover Rück SE. All rights reserved.
Hannover Re is the registered service mark of Hannover Rück SE.
Disclaimer
Insights into growing segments in P&C
Silke Sehm, Member of the Executive Board 22nd International Investors’ Day
Frankfurt, 23 October 2019
2 Insights into growing segments in P&C
Cyber business2
Structured Reinsurance1
Agenda

1 Structured
Reinsurance
4 Insights into growing segments in P&C
0
500
1,000
1,500
2,000
2,500
3,000
3,500
1990 1991 1992 1993 1994 1995 1996 1997 1998 1999 2000 2001 2002 2003 2004 2005 2006 2007 2008 2009 2010 2011 2012 2013 2014 2015 2016 2017 2018
Gross written premium Deposit accounting volume
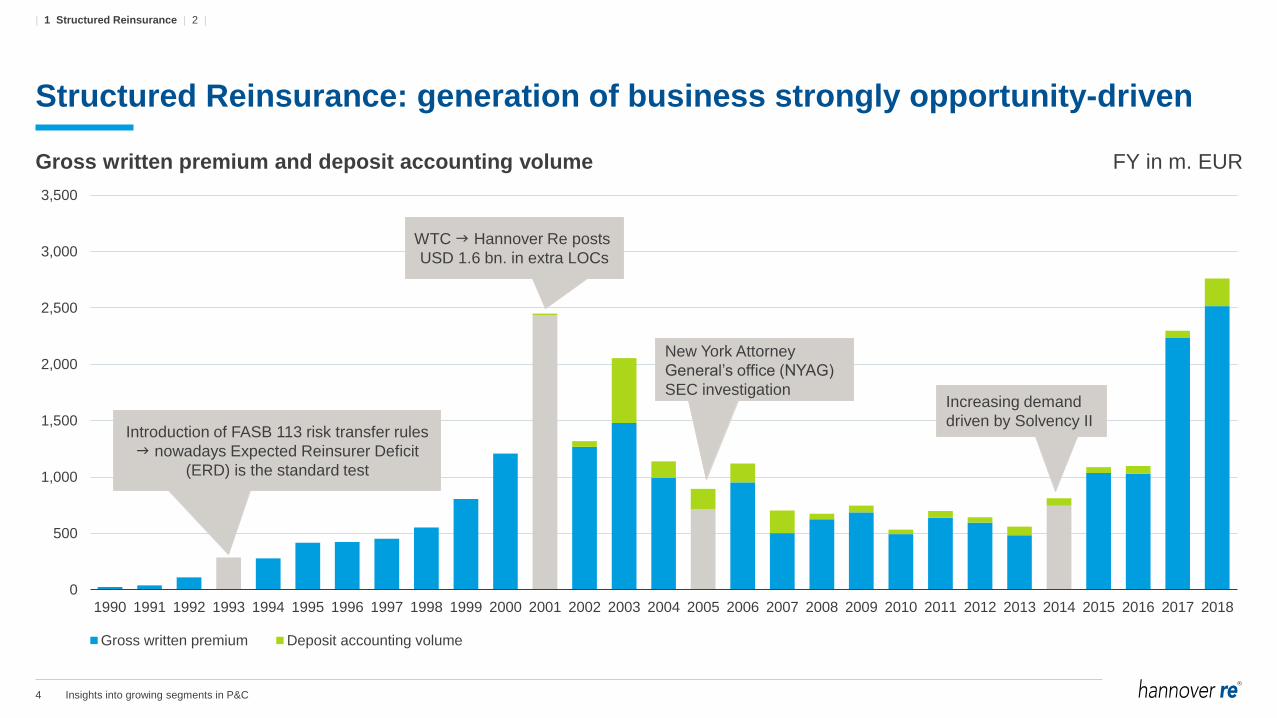
Structured Reinsurance: generation of business strongly opportunity-driven
Gross written premium and deposit accounting volume FY in m. EUR
Introduction of FASB 113 risk transfer rules
nowadays Expected Reinsurer Deficit
(ERD) is the standard test
WTC Hannover Re posts
USD 1.6 bn. in extra LOCs
New York Attorney
General’s office (NYAG)
SEC investigationIncreasing demand
driven by Solvency II
| 1 Structured Reinsurance | 2 |
5 Insights into growing segments in P&C
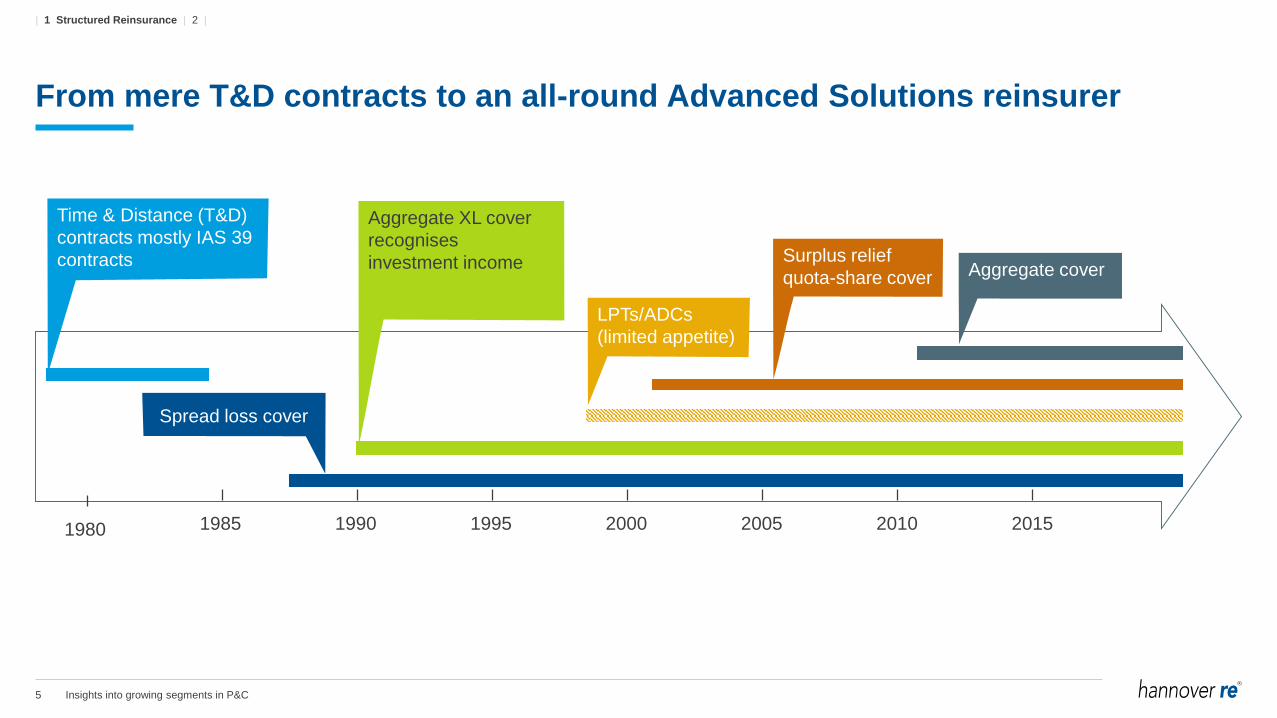
From mere T&D contracts to an all-round Advanced Solutions reinsurer
Spread loss cover
1980 1985 1990 1995 20102000 2005 2015
Surplus relief
quota-share cover
LPTs/ADCs
(limited appetite)
Aggregate cover
Aggregate XL cover
recognises
investment income
Time & Distance (T&D)
contracts mostly IAS 39
contracts
| 1 Structured Reinsurance | 2 |
6 Insights into growing segments in P&C
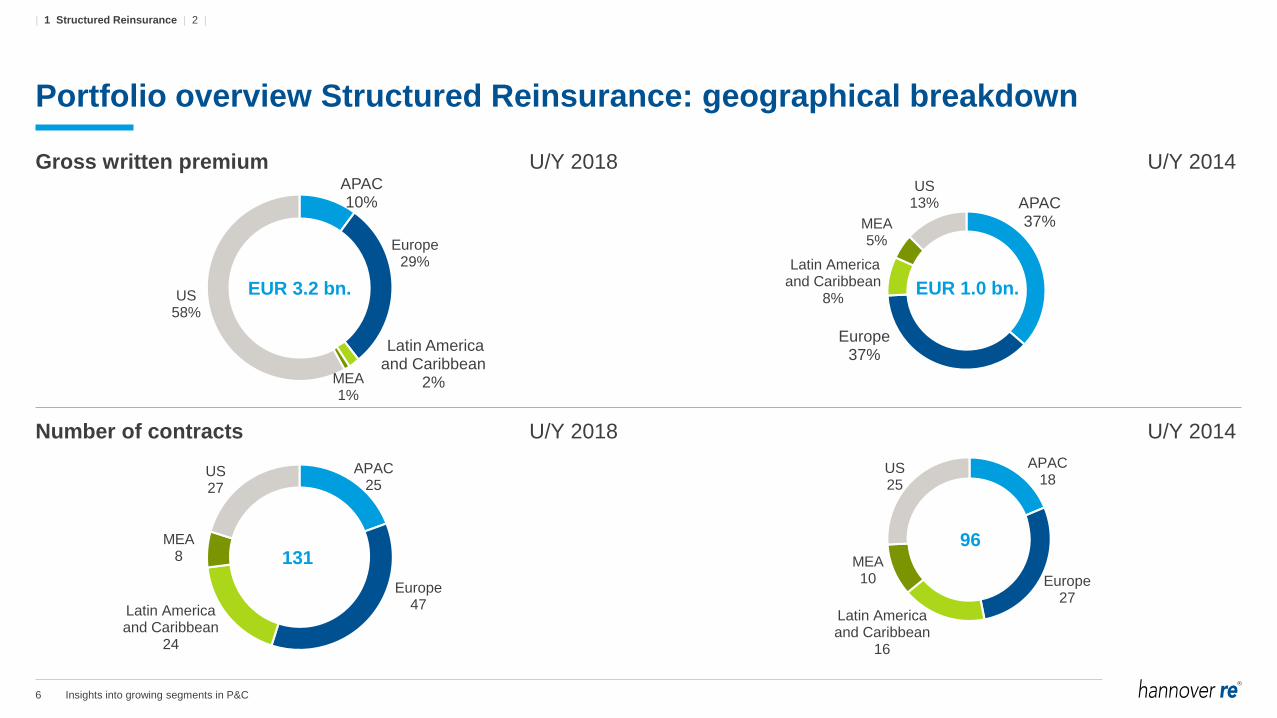
Portfolio overview Structured Reinsurance: geographical breakdown
Gross written premium U/Y 2018APAC10%
Europe29%
Latin America and Caribbean
2%MEA1%
US58%
U/Y 2014
APAC25
Europe47Latin America
and Caribbean24
MEA8
US27
EUR 3.2 bn.
131
APAC37%
Europe37%
Latin America and Caribbean
8%
MEA5%
US13%
APAC18
Europe27
Latin America and Caribbean
16
MEA10
US25
Number of contracts U/Y 2018 U/Y 2014
EUR 1.0 bn.
96
| 1 Structured Reinsurance | 2 |
7 Insights into growing segments in P&C
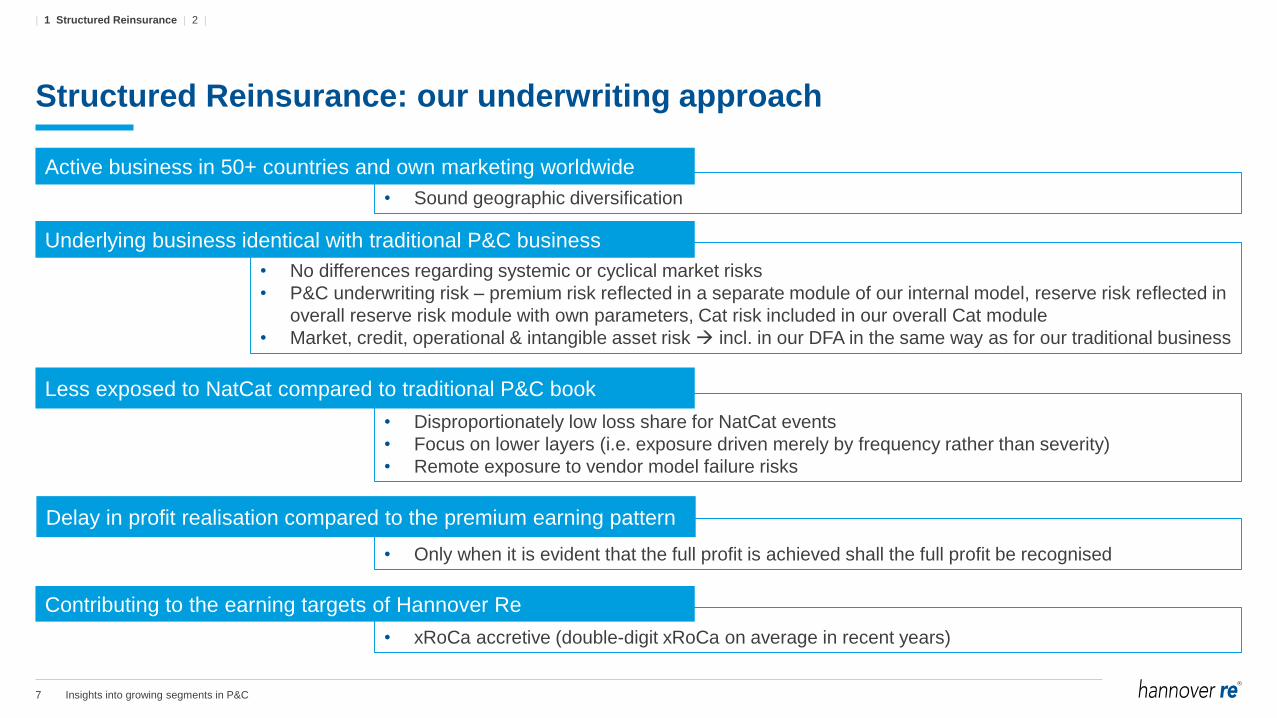
• No differences regarding systemic or cyclical market risks
• P&C underwriting risk – premium risk reflected in a separate module of our internal model, reserve risk reflected in
overall reserve risk module with own parameters, Cat risk included in our overall Cat module
• Market, credit, operational & intangible asset risk incl. in our DFA in the same way as for our traditional business
Structured Reinsurance: our underwriting approach
• Sound geographic diversification
Active business in 50+ countries and own marketing worldwide
Underlying business identical with traditional P&C business
• Disproportionately low loss share for NatCat events
• Focus on lower layers (i.e. exposure driven merely by frequency rather than severity)
• Remote exposure to vendor model failure risks
Less exposed to NatCat compared to traditional P&C book
• Only when it is evident that the full profit is achieved shall the full profit be recognised
Delay in profit realisation compared to the premium earning pattern
• xRoCa accretive (double-digit xRoCa on average in recent years)
Contributing to the earning targets of Hannover Re
| 1 Structured Reinsurance | 2 |
8 Insights into growing segments in P&C
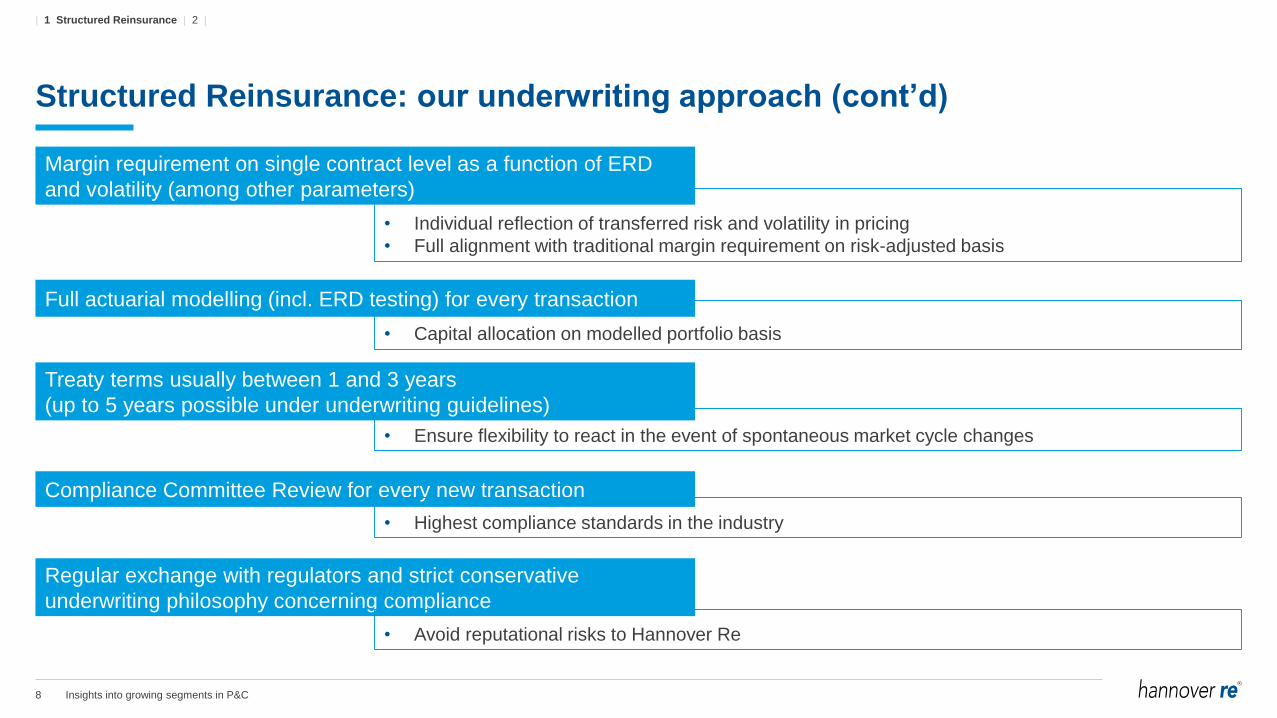
Structured Reinsurance: our underwriting approach (cont’d)
• Individual reflection of transferred risk and volatility in pricing
• Full alignment with traditional margin requirement on risk-adjusted basis
• Capital allocation on modelled portfolio basis
• Ensure flexibility to react in the event of spontaneous market cycle changes
Margin requirement on single contract level as a function of ERD
and volatility (among other parameters)
Full actuarial modelling (incl. ERD testing) for every transaction
Treaty terms usually between 1 and 3 years
(up to 5 years possible under underwriting guidelines)
Compliance Committee Review for every new transaction
• Highest compliance standards in the industry
Regular exchange with regulators and strict conservative
underwriting philosophy concerning compliance
• Avoid reputational risks to Hannover Re
| 1 Structured Reinsurance | 2 |
9 Insights into growing segments in P&C
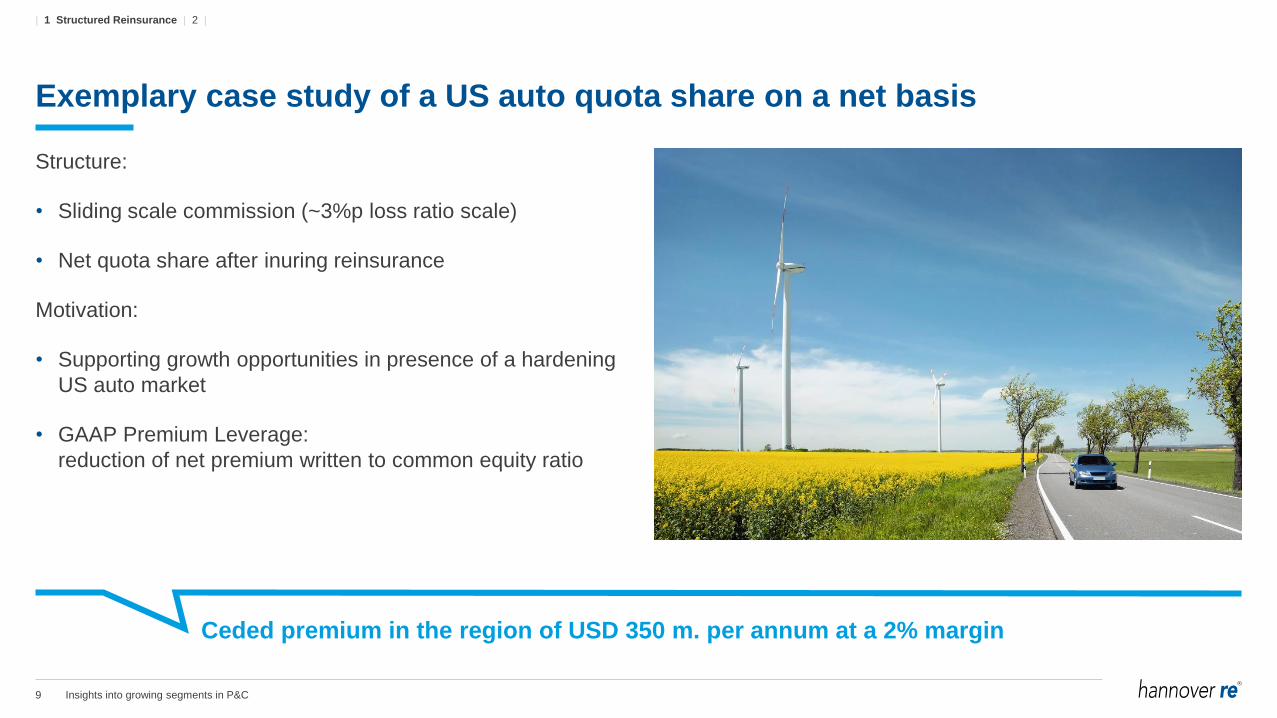
Structure:
• Sliding scale commission (~3%p loss ratio scale)
• Net quota share after inuring reinsurance
Motivation:
• Supporting growth opportunities in presence of a hardening
US auto market
• GAAP Premium Leverage:
reduction of net premium written to common equity ratio
Exemplary case study of a US auto quota share on a net basis
Ceded premium in the region of USD 350 m. per annum at a 2% margin
| 1 Structured Reinsurance | 2 |
10 Insights into growing segments in P&C
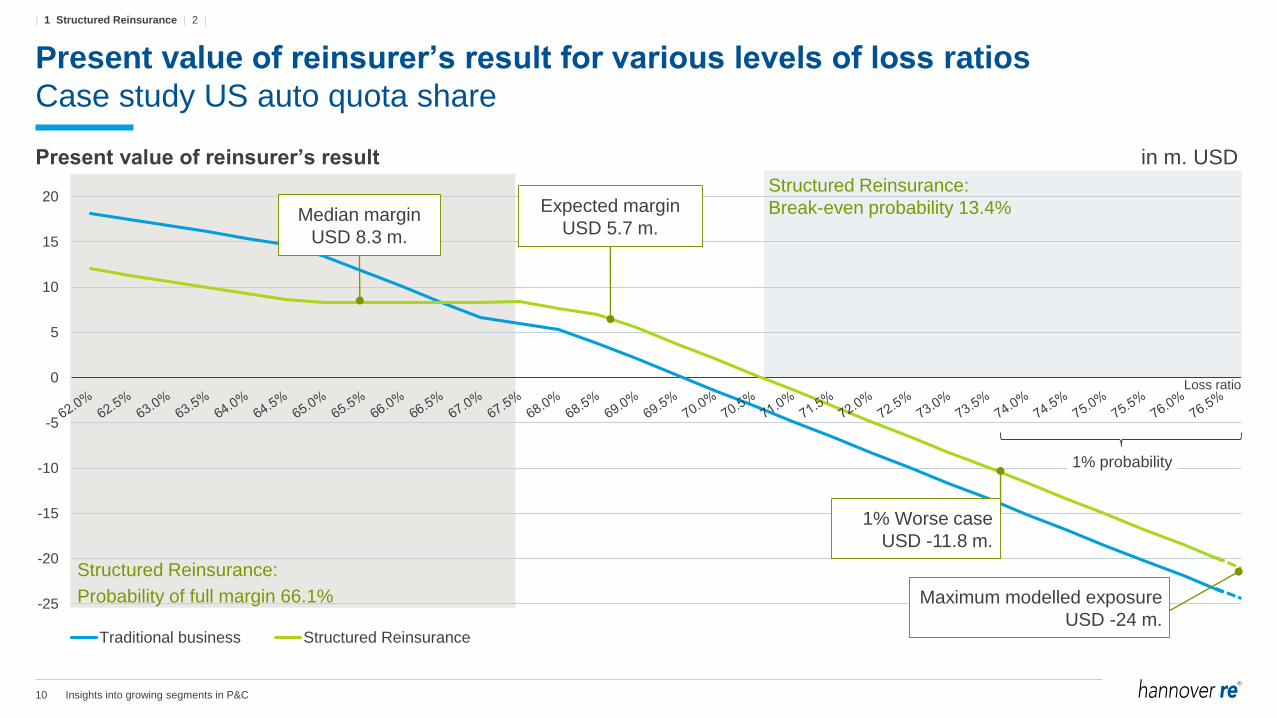
Present value of reinsurer’s result for various levels of loss ratios
Case study US auto quota share
-25
-20
-15
-10
-5
0
5
10
15
20
Traditional business Structured Reinsurance
1% Worse case
USD -11.8 m.
Structured Reinsurance:
Probability of full margin 66.1%
Median margin
USD 8.3 m.
Expected margin
USD 5.7 m.
1% probability
Structured Reinsurance:
Break-even probability 13.4%
Present value of reinsurer’s result in m. USD
Maximum modelled exposure
USD -24 m.
Loss ratio
| 1 Structured Reinsurance | 2 |
11 Insights into growing segments in P&C
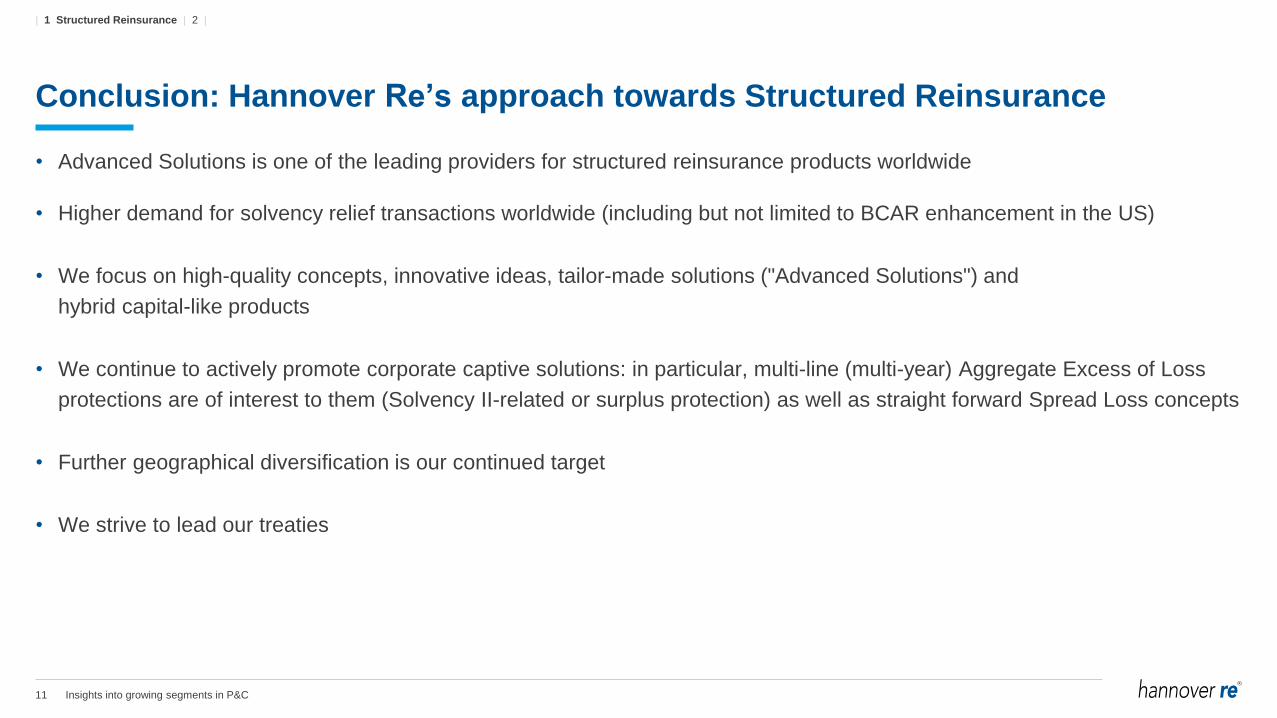
• Advanced Solutions is one of the leading providers for structured reinsurance products worldwide
• Higher demand for solvency relief transactions worldwide (including but not limited to BCAR enhancement in the US)
• We focus on high-quality concepts, innovative ideas, tailor-made solutions ("Advanced Solutions") and
hybrid capital-like products
• We continue to actively promote corporate captive solutions: in particular, multi-line (multi-year) Aggregate Excess of Loss
protections are of interest to them (Solvency II-related or surplus protection) as well as straight forward Spread Loss concepts
• Further geographical diversification is our continued target
• We strive to lead our treaties
Conclusion: Hannover Re’s approach towards Structured Reinsurance
| 1 Structured Reinsurance | 2 |

2 Cyber business
13 Insights into growing segments in P&C
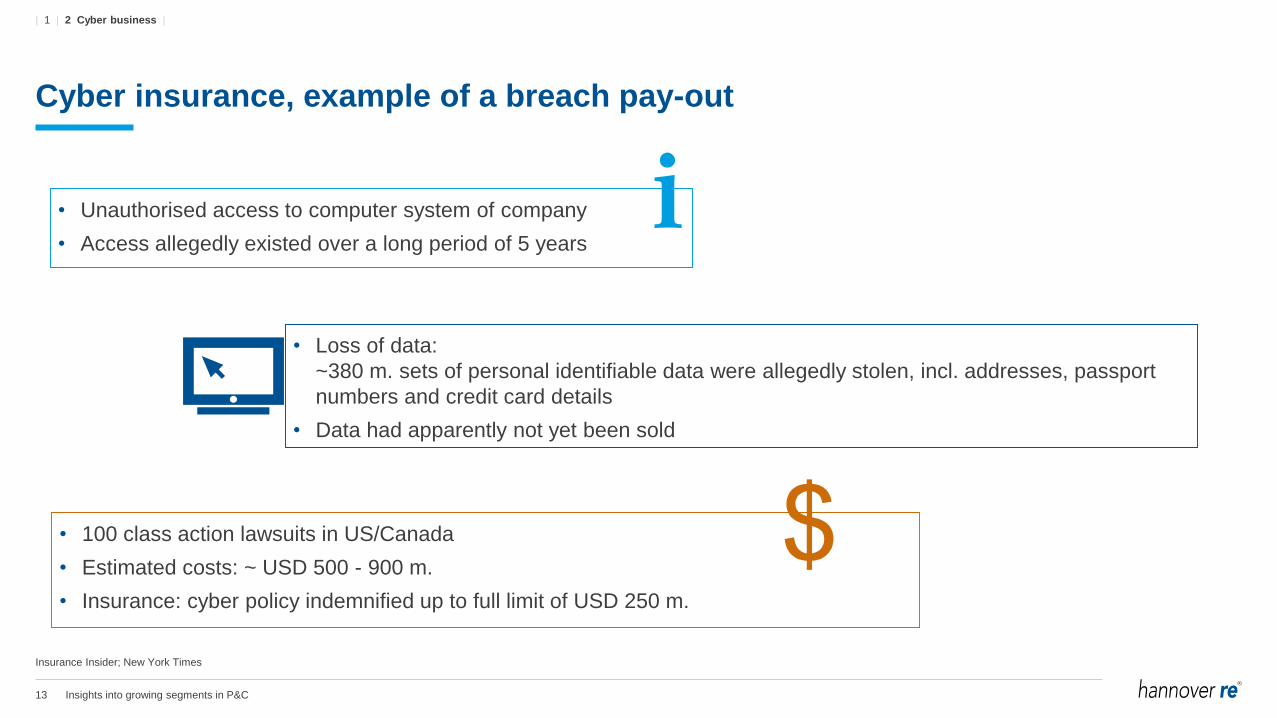
Cyber insurance, example of a breach pay-out
• Loss of data:
~380 m. sets of personal identifiable data were allegedly stolen, incl. addresses, passport
numbers and credit card details
• Data had apparently not yet been sold
• Unauthorised access to computer system of company
• Access allegedly existed over a long period of 5 years
• 100 class action lawsuits in US/Canada
• Estimated costs: ~ USD 500 - 900 m.
• Insurance: cyber policy indemnified up to full limit of USD 250 m.
Insurance Insider; New York Times
| 1 | 2 Cyber business |
14 Insights into growing segments in P&C
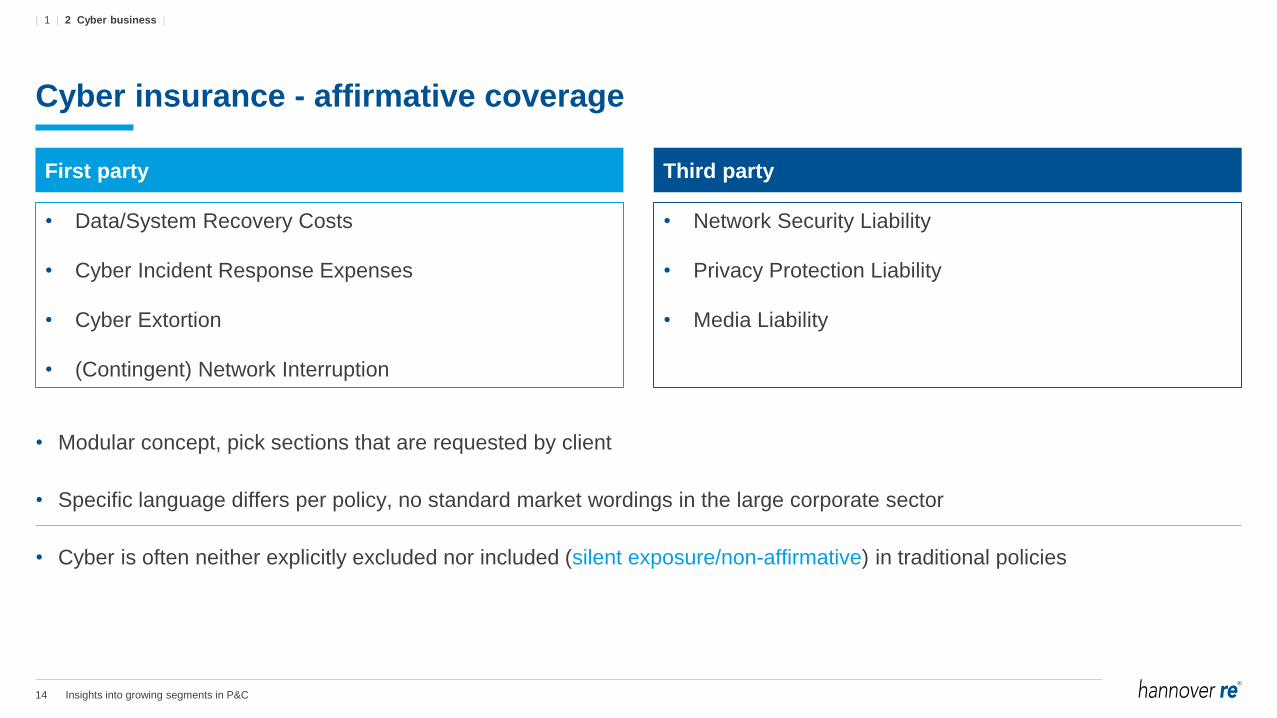
• Modular concept, pick sections that are requested by client
• Specific language differs per policy, no standard market wordings in the large corporate sector
• Cyber is often neither explicitly excluded nor included (silent exposure/non-affirmative) in traditional policies
Cyber insurance - affirmative coverage
First party Third party
• Data/System Recovery Costs
• Cyber Incident Response Expenses
• Cyber Extortion
• (Contingent) Network Interruption
• Network Security Liability
• Privacy Protection Liability
• Media Liability
| 1 | 2 Cyber business |
15 Insights into growing segments in P&C
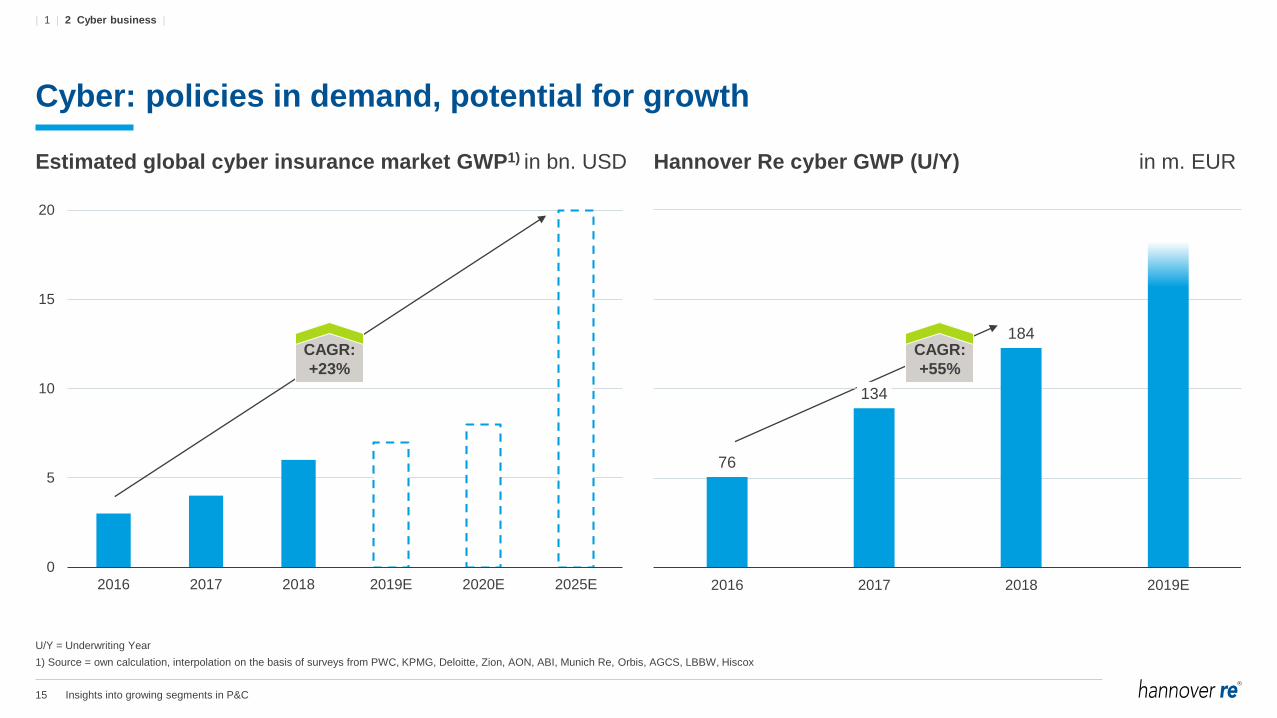
Cyber: policies in demand, potential for growth
Estimated global cyber insurance market GWP1) in bn. USD Hannover Re cyber GWP (U/Y) in m. EUR
U/Y = Underwriting Year
1) Source = own calculation, interpolation on the basis of surveys from PWC, KPMG, Deloitte, Zion, AON, ABI, Munich Re, Orbis, AGCS, LBBW, Hiscox
76
134
184
2016 2017 2018 2019E
0
5
10
15
20
2016 2017 2018 2019E 2020E 2025E
CAGR:
+55%
CAGR:
+23%
| 1 | 2 Cyber business |
16 Insights into growing segments in P&C
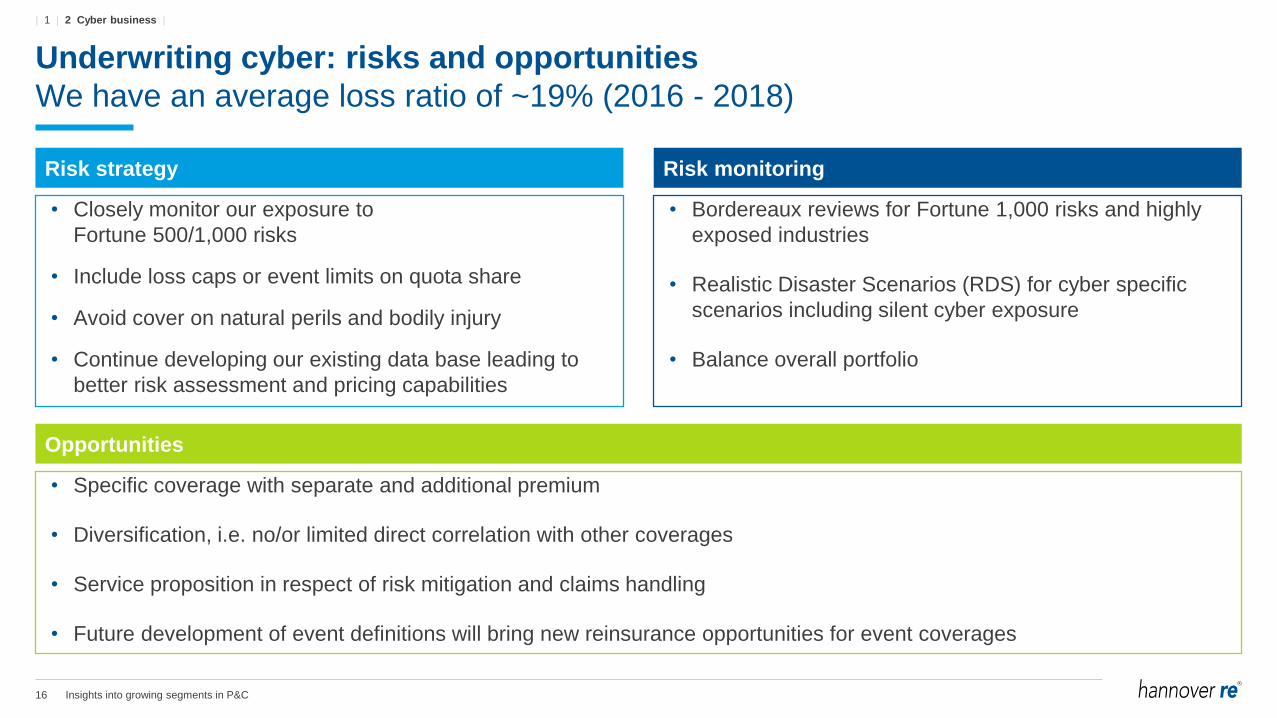
• Closely monitor our exposure to
Fortune 500/1,000 risks
• Include loss caps or event limits on quota share
• Avoid cover on natural perils and bodily injury
• Continue developing our existing data base leading to
better risk assessment and pricing capabilities
• Bordereaux reviews for Fortune 1,000 risks and highly
exposed industries
• Realistic Disaster Scenarios (RDS) for cyber specific
scenarios including silent cyber exposure
• Balance overall portfolio
Underwriting cyber: risks and opportunities
We have an average loss ratio of ~19% (2016 - 2018)
Risk strategy Risk monitoring
• Specific coverage with separate and additional premium
• Diversification, i.e. no/or limited direct correlation with other coverages
• Service proposition in respect of risk mitigation and claims handling
• Future development of event definitions will bring new reinsurance opportunities for event coverages
Opportunities
| 1 | 2 Cyber business |
17 Insights into growing segments in P&C
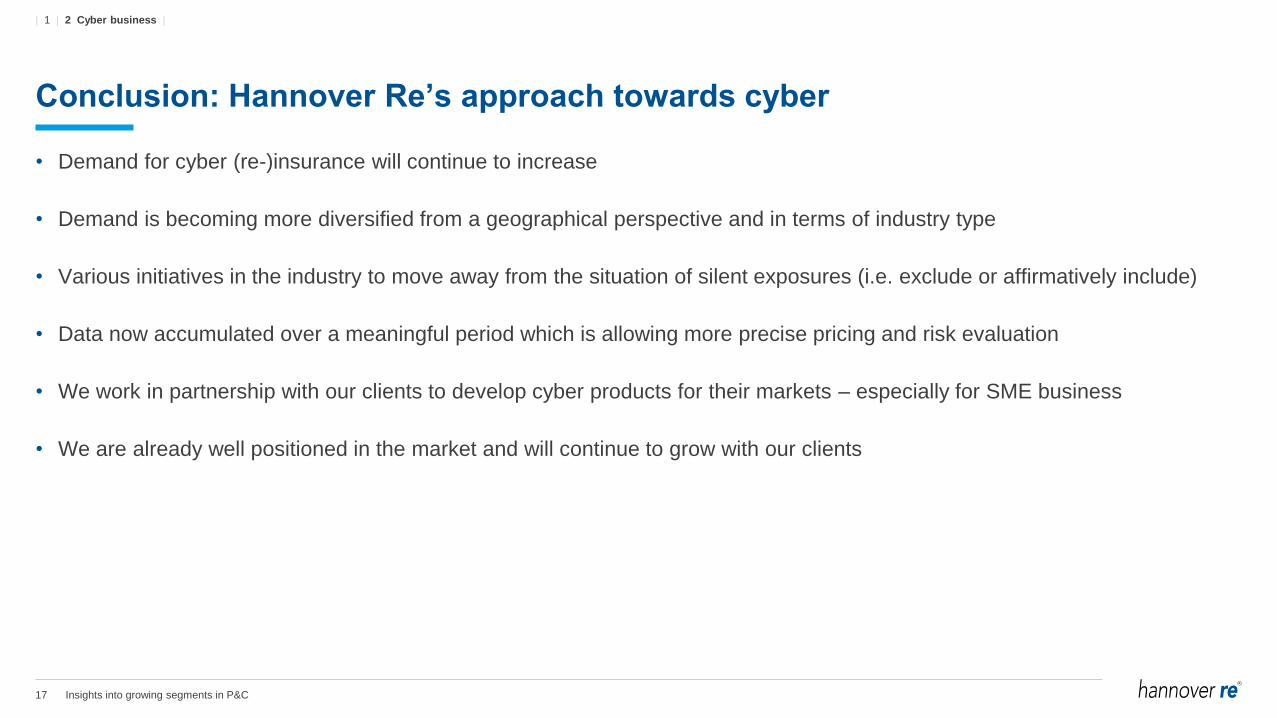
• Demand for cyber (re-)insurance will continue to increase
• Demand is becoming more diversified from a geographical perspective and in terms of industry type
• Various initiatives in the industry to move away from the situation of silent exposures (i.e. exclude or affirmatively include)
• Data now accumulated over a meaningful period which is allowing more precise pricing and risk evaluation
• We work in partnership with our clients to develop cyber products for their markets – especially for SME business
• We are already well positioned in the market and will continue to grow with our clients
Conclusion: Hannover Re’s approach towards cyber
| 1 | 2 Cyber business |

18 Insights into growing segments in P&C
This presentation does not address the investment objectives or financial situation of any particular person or legal entity.
Investors should seek independent professional advice and perform their own analysis regarding the appropriateness of
investing in any of our securities.
While Hannover Re has endeavoured to include in this presentation information it believes to be reliable, complete and up-to-
date, the company does not make any representation or warranty, express or implied, as to the accuracy, completeness or
updated status of such information.
Some of the statements in this presentation may be forward-looking statements or statements of future expectations based on
currently available information. Such statements naturally are subject to risks and uncertainties. Factors such as the
development of general economic conditions, future market conditions, unusual catastrophic loss events, changes in the capital
markets and other circumstances may cause the actual events or results to be materially different from those anticipated by
such statements.
This presentation serves information purposes onl and does not constitute or form part of an offer or solicitation to acquire,
subscribe to or dispose of, any of the securities of Hannover Re.
© Hannover Rück SE. All rights reserved.
Hannover Re is the registered service mark of Hannover Rück SE.
Disclaimer

Growth opportunities in AsiaHannover Re’s view
Sven Althoff / Claude Chèvre, Members of the Executive Board
22nd International Investors’ Day
Frankfurt, 23 October 2019
2 Growth opportunities in Asia
An attractive investment opportunity and the way of getting things done1.3
Economic and (re-)insurance market development at a glance1.2
Past and present activities of Hannover Re1.1
It's all about Asia1
Agenda
3 Growth opportunities in Asia
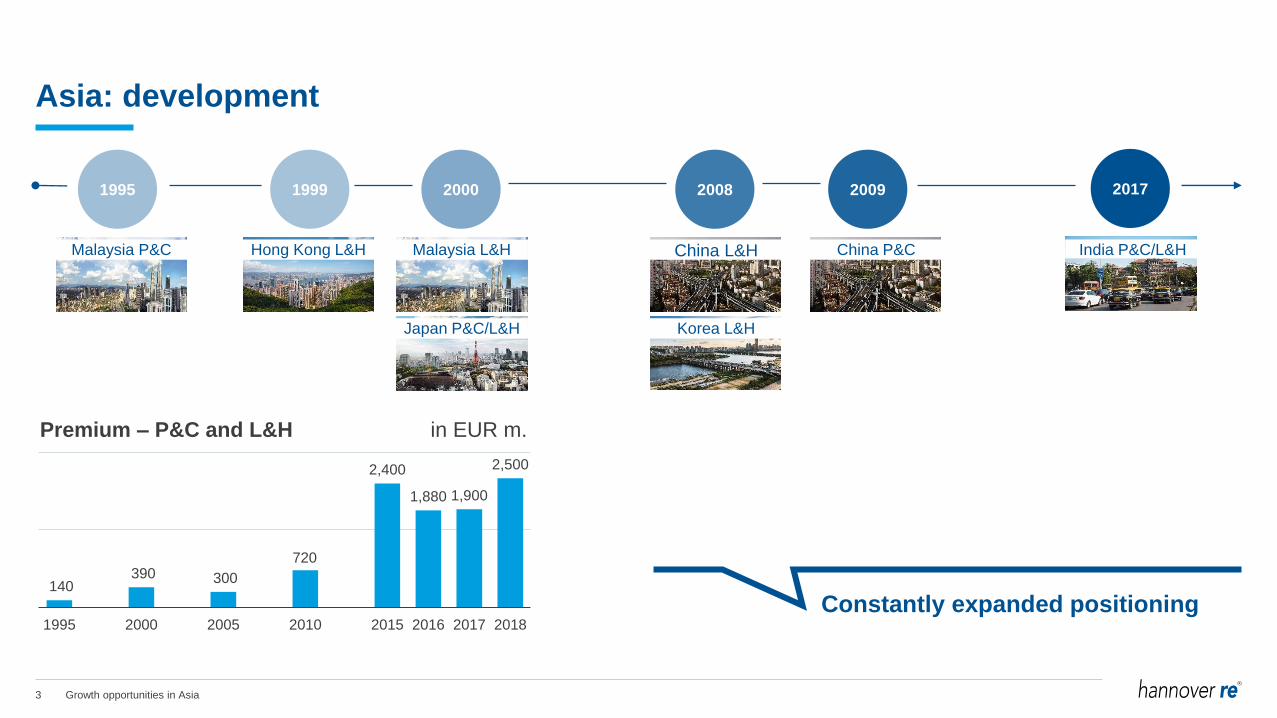
140 390 300
720
2,400
1,880 1,900
2,500
1995 2000 2005 2010 2015 2016 2017 2018
Asia: development
Malaysia P&C Hong Kong L&H
Japan P&C/L&H
Malaysia L&H China P&C India P&C/L&H
1995 1999 2000 2008 2009 2017
China L&H
Korea L&H
Constantly expanded positioning
Premium – P&C and L&H in EUR m.
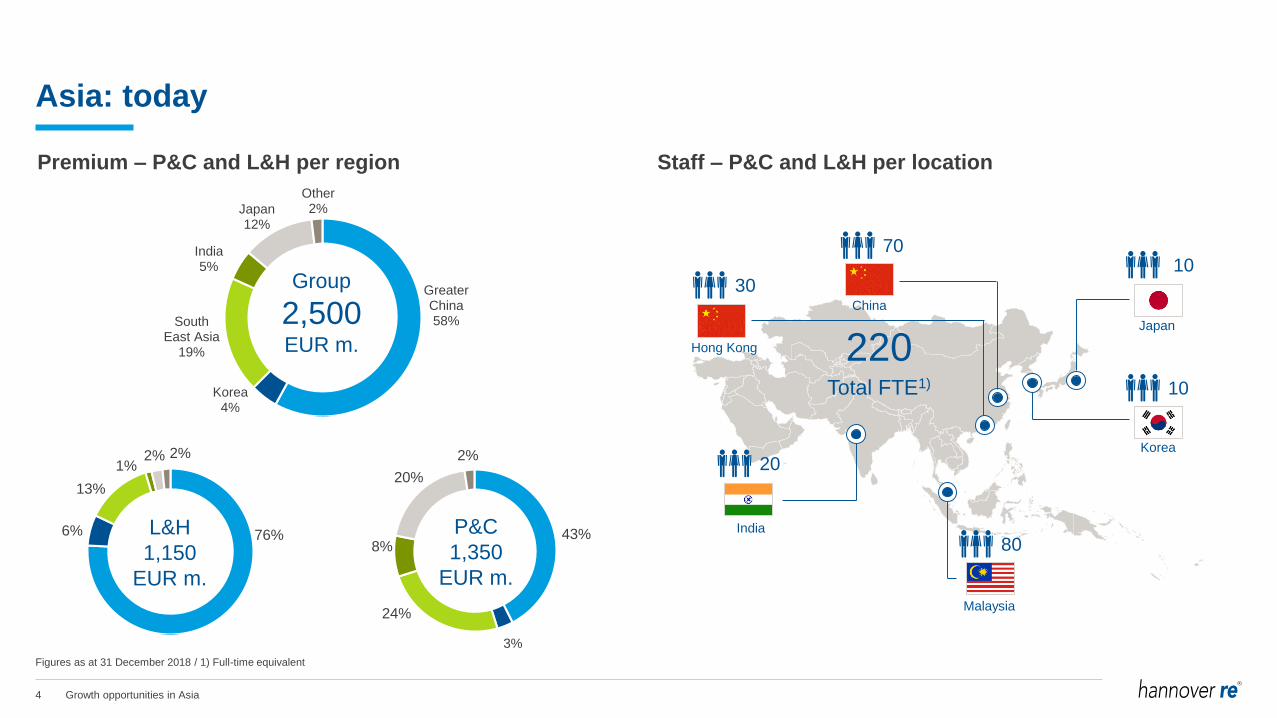
4 Growth opportunities in Asia
Greater China58%
Korea4%
South East Asia
19%
India 5%
Japan12%
Other2%
Asia: today
Malaysia
Japan
Korea
China
Hong Kong
India
Group
2,500EUR m.
Premium – P&C and L&H per region Staff – P&C and L&H per location
20
30
7010
10
80
220Total FTE1)
Figures as at 31 December 2018 / 1) Full-time equivalent
76%6%
13%
1%2% 2%
L&H
1,150
EUR m.
43%
24%
8%
20%
2%
P&C
1,350
EUR m.
3%
5 Growth opportunities in Asia
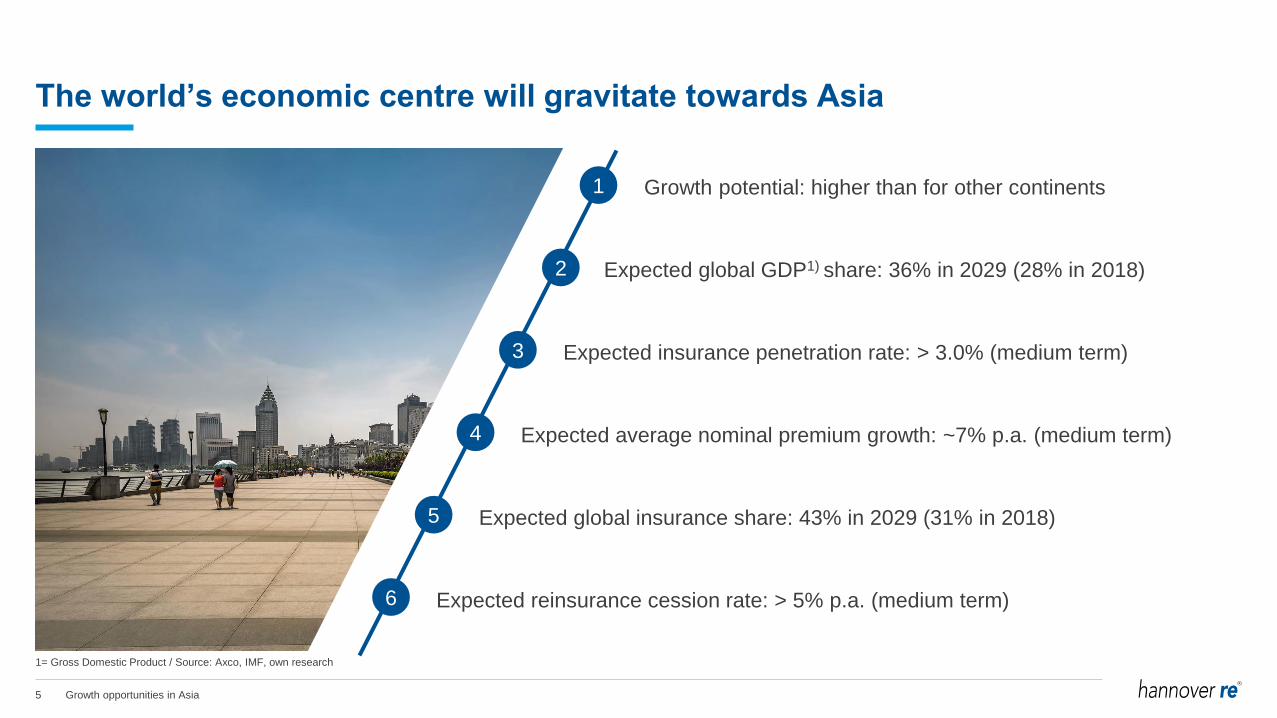
The world’s economic centre will gravitate towards Asia
1 Growth potential: higher than for other continents
2
Expected average nominal premium growth: ~7% p.a. (medium term)
3
Expected global insurance share: 43% in 2029 (31% in 2018)
4
Expected global GDP1) share: 36% in 2029 (28% in 2018)
1= Gross Domestic Product / Source: Axco, IMF, own research
Expected insurance penetration rate: > 3.0% (medium term)
Expected reinsurance cession rate: > 5% p.a. (medium term)
5
6
6 Growth opportunities in Asia
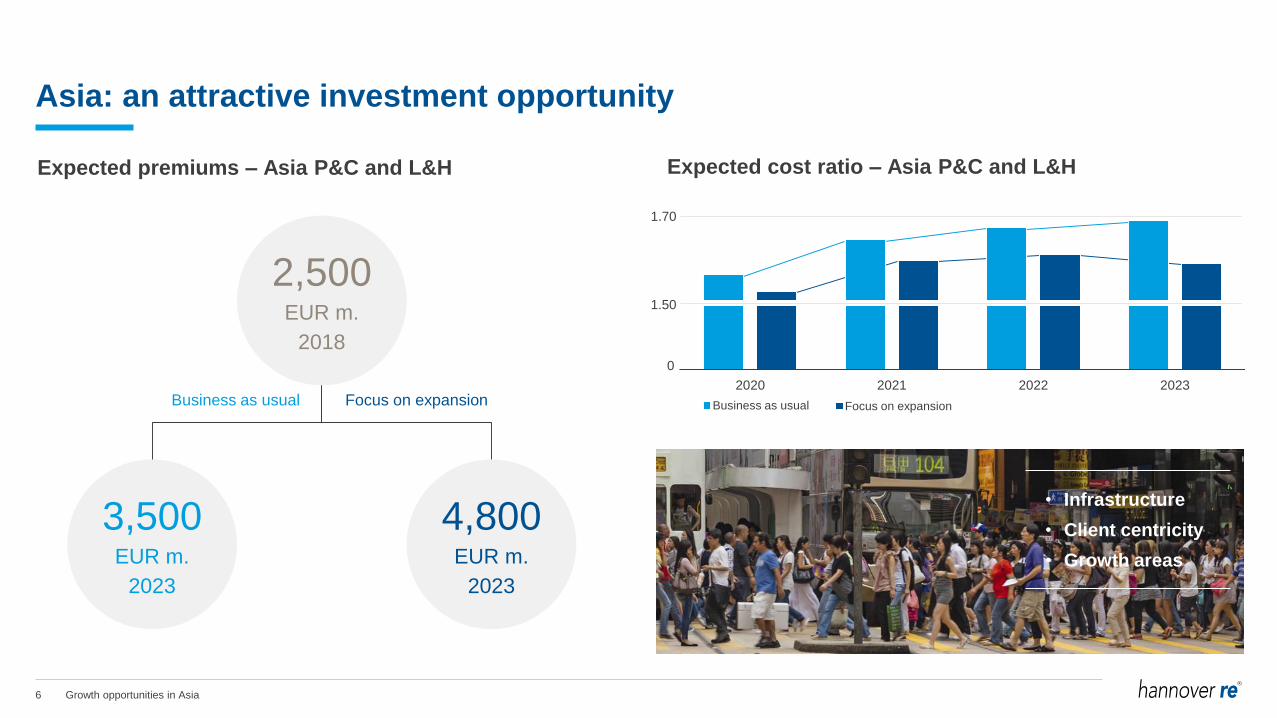
Asia: an attractive investment opportunity
Expected premiums – Asia P&C and L&H
3,500EUR m.
2023
2,500EUR m.
2018
4,800EUR m.
2023
Business as usual Focus on expansion
Expected cost ratio – Asia P&C and L&H
1.50
0
1.70
• Infrastructure
• Client centricity
• Growth areas
2020 2021 2022 2023
Business as usual Focus on expansion
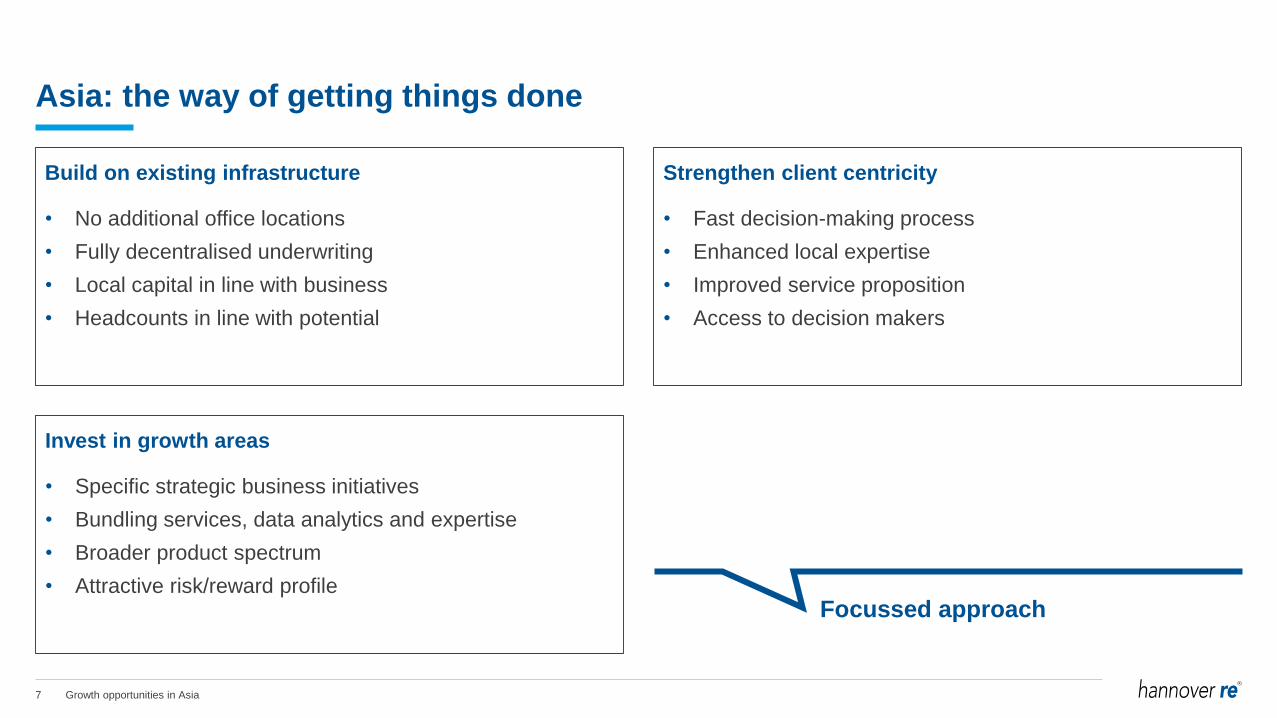
7 Growth opportunities in Asia
Build on existing infrastructure
• No additional office locations
• Fully decentralised underwriting
• Local capital in line with business
• Headcounts in line with potential
Strengthen client centricity
• Fast decision-making process
• Enhanced local expertise
• Improved service proposition
• Access to decision makers
Invest in growth areas
• Specific strategic business initiatives
• Bundling services, data analytics and expertise
• Broader product spectrum
• Attractive risk/reward profile
Asia: the way of getting things done
Focussed approach
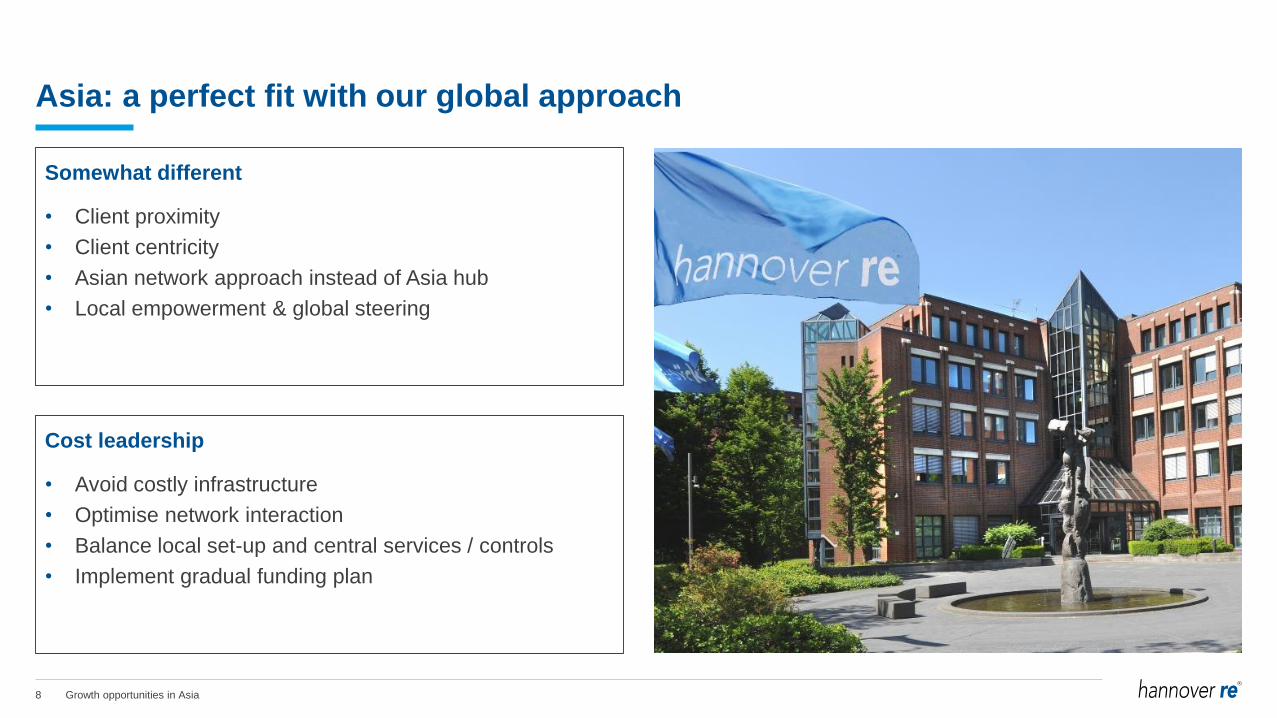
8 Growth opportunities in Asia
Somewhat different
• Client proximity
• Client centricity
• Asian network approach instead of Asia hub
• Local empowerment & global steering
Cost leadership
• Avoid costly infrastructure
• Optimise network interaction
• Balance local set-up and central services / controls
• Implement gradual funding plan
Asia: a perfect fit with our global approach
9 Growth opportunities in Asia
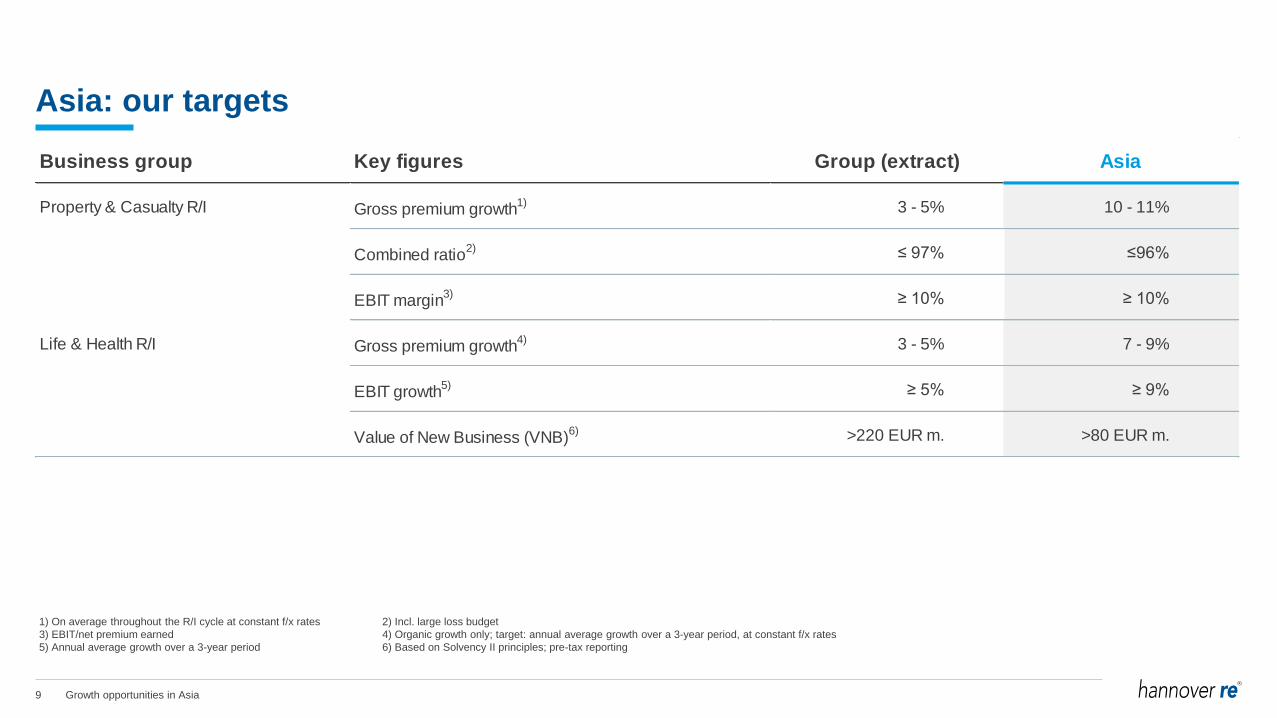
Business group Key figures Group (extract) Asia
Property & Casualty R/I Gross premium growth1) 3 - 5% 10 - 11%
Combined ratio2) ≤ 97% ≤96%
EBIT margin3) ≥ 10% ≥ 10%
Life & Health R/I Gross premium growth4) 3 - 5% 7 - 9%
EBIT growth5) ≥ 5% ≥ 9%
Value of New Business (VNB)6) >220 EUR m. >80 EUR m.
Asia: our targets
2) Incl. large loss budget
4) Organic growth only; target: annual average growth over a 3-year period, at constant f/x rates
6) Based on Solvency II principles; pre-tax reporting
1) On average throughout the R/I cycle at constant f/x rates
3) EBIT/net premium earned
5) Annual average growth over a 3-year period

10 Growth opportunities in Asia
This presentation does not address the investment objectives or financial situation of any particular person or legal entity.
Investors should seek independent professional advice and perform their own analysis regarding the appropriateness of
investing in any of our securities.
While Hannover Re has endeavoured to include in this presentation information it believes to be reliable, complete and up-to-
date, the company does not make any representation or warranty, express or implied, as to the accuracy, completeness or
updated status of such information.
Some of the statements in this presentation may be forward-looking statements or statements of future expectations based on
currently available information. Such statements naturally are subject to risks and uncertainties. Factors such as the
development of general economic conditions, future market conditions, unusual catastrophic loss events, changes in the capital
markets and other circumstances may cause the actual events or results to be materially different from those anticipated by
such statements.
This presentation serves information purposes only and does not constitute or form part of an offer or solicitation to acquire,
subscribe to or dispose of, any of the securities of Hannover Re.
© Hannover Rück SE. All rights reserved.
Hannover Re is the registered service mark of Hannover Rück SE.
Disclaimer
Financial Solutions & support in the digital ageUsual risks with unusual RoE potential - US market
Dr. Klaus Miller, Member of the Executive Board
22nd International Investors’ Day
Frankfurt, 23 October 2019

2 Financial Solutions & support in the digital age
Brief insight: digital age4
Some facts: US Financial Solutions business3
At a glance: US life insurance market2
Latest developments: US mortality business1
Agenda
3 Financial Solutions & support in the digital age
101Company groups
778Treaties
332 m.Recaptures 2018
IFRS losses
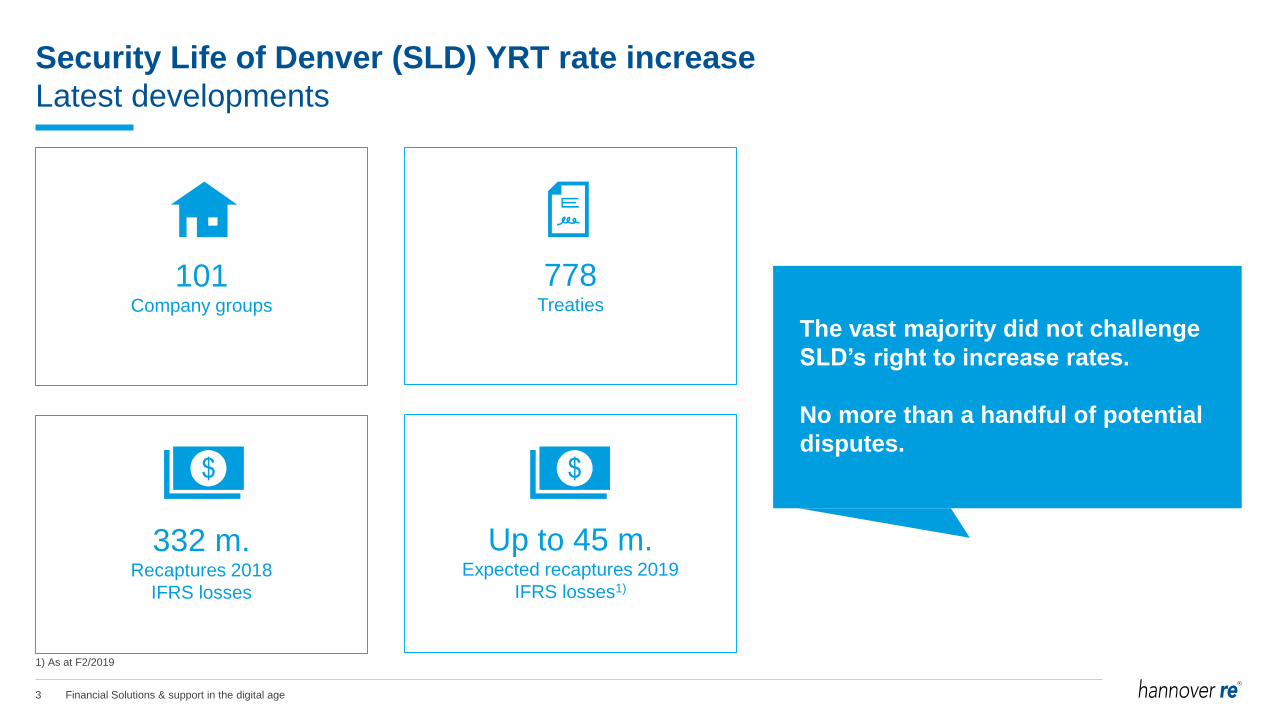
Security Life of Denver (SLD) YRT rate increase
Latest developments
Up to 45 m.Expected recaptures 2019
IFRS losses1)
1) As at F2/2019
The vast majority did not challenge
SLD’s right to increase rates.
No more than a handful of potential
disputes.
4 Financial Solutions & support in the digital age
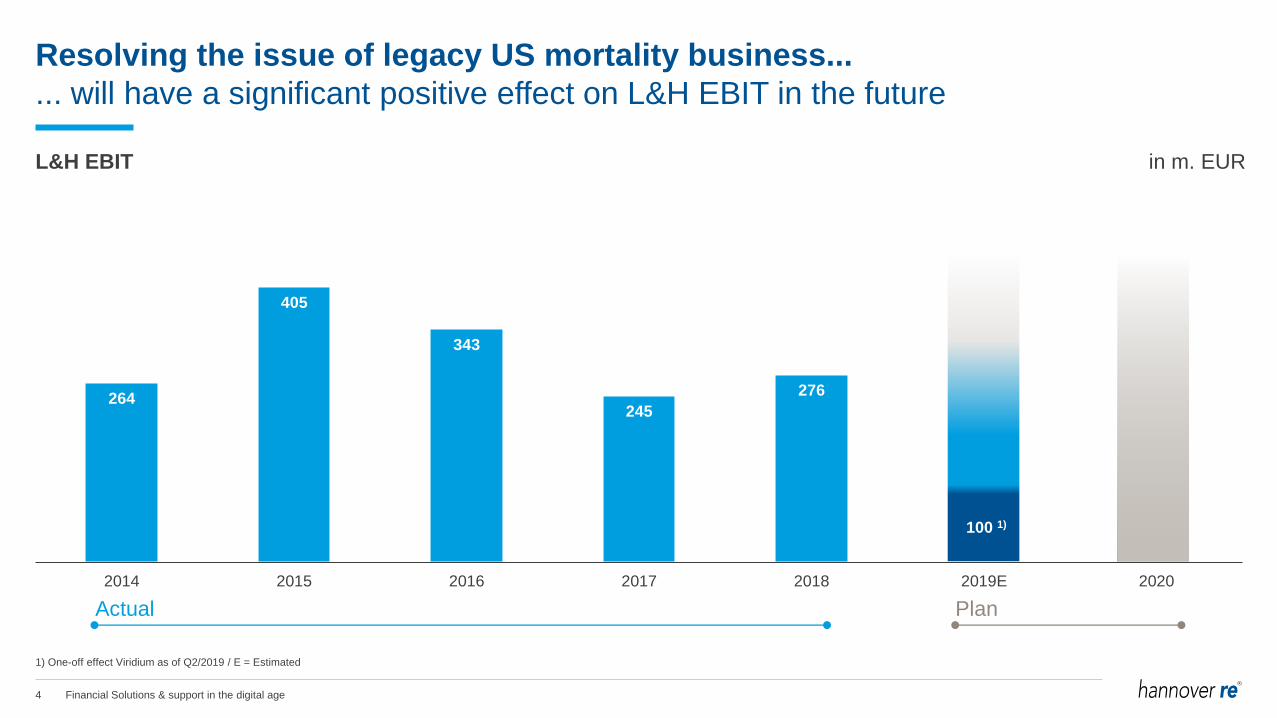
Resolving the issue of legacy US mortality business...
... will have a significant positive effect on L&H EBIT in the future
L&H EBIT in m. EUR
264
405
343
245
276
2014 2015 2016 2017 2018 2019E 2020
Actual Plan
1) One-off effect Viridium as of Q2/2019 / E = Estimated
100 1)
5 Financial Solutions & support in the digital age
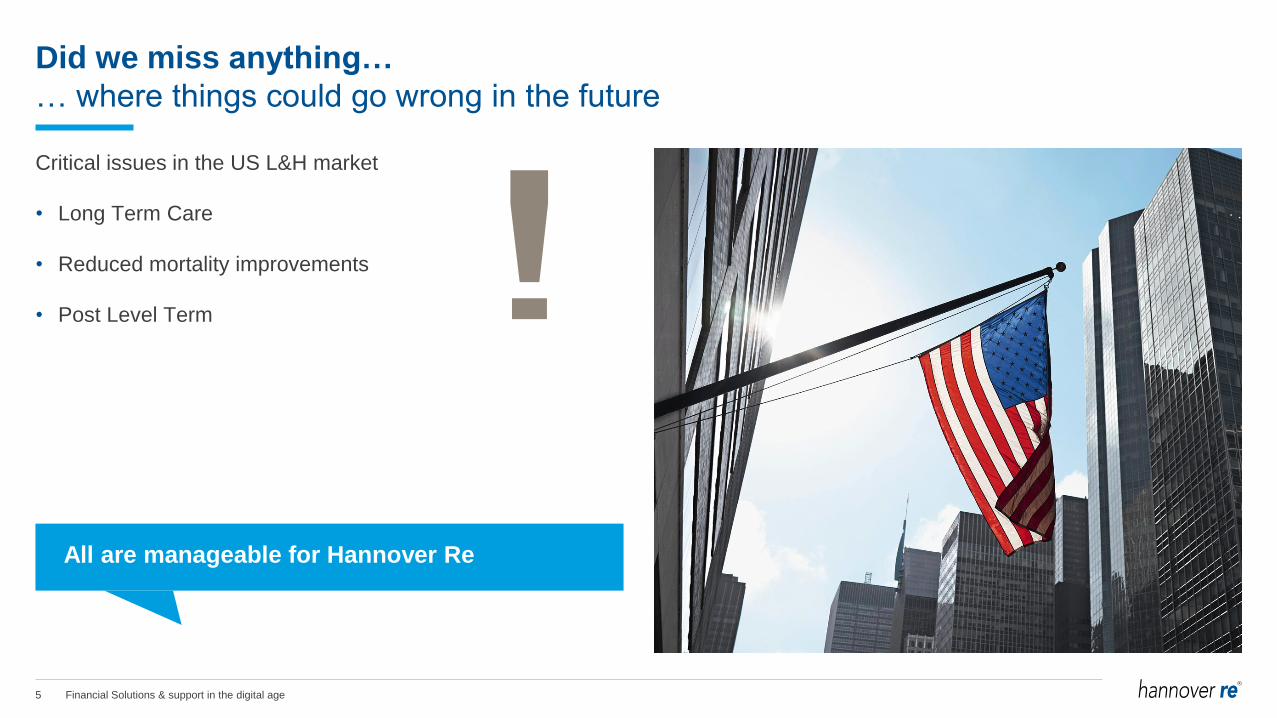
Did we miss anything…
… where things could go wrong in the future
Critical issues in the US L&H market
• Long Term Care
• Reduced mortality improvements
• Post Level Term
All are manageable for Hannover Re
6 Financial Solutions & support in the digital age
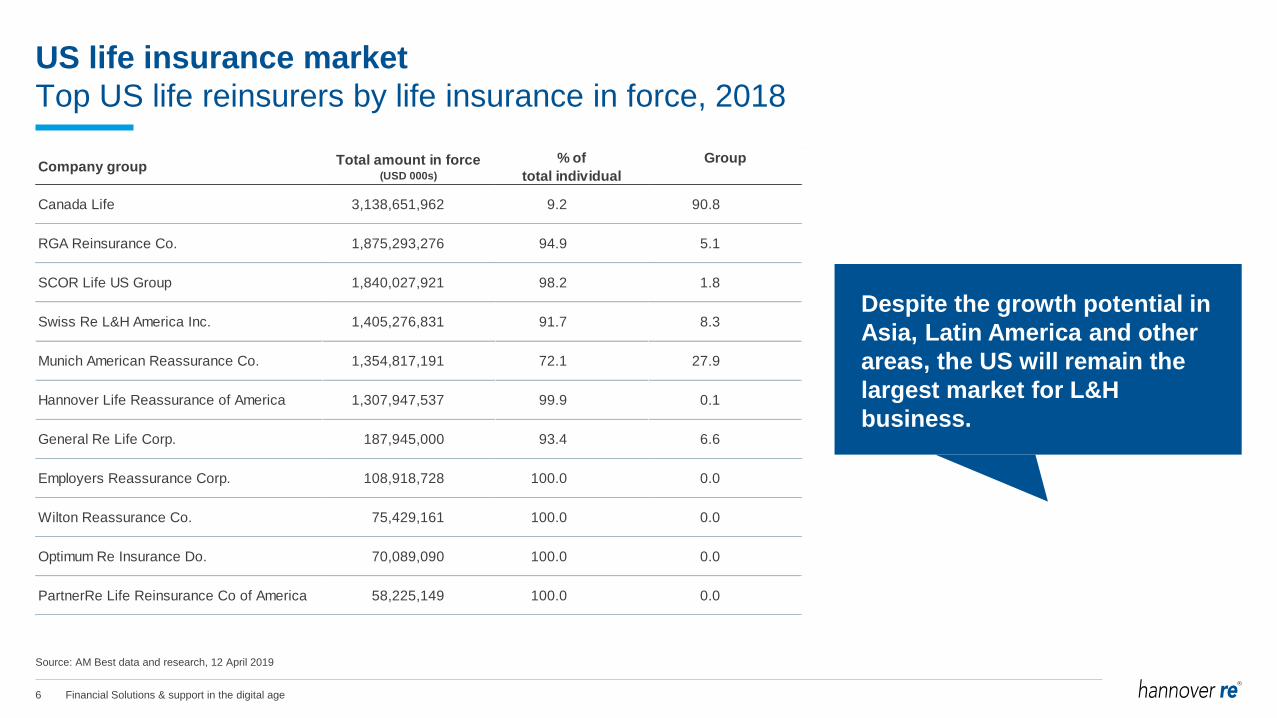
US life insurance market
Top US life reinsurers by life insurance in force, 2018
Company groupTotal amount in force
(USD 000s)
% of
total individual
Group
Canada Life 3,138,651,962 9.2 90.8
RGA Reinsurance Co. 1,875,293,276 94.9 5.1
SCOR Life US Group 1,840,027,921 98.2 1.8
Swiss Re L&H America Inc. 1,405,276,831 91.7 8.3
Munich American Reassurance Co. 1,354,817,191 72.1 27.9
Hannover Life Reassurance of America 1,307,947,537 99.9 0.1
General Re Life Corp. 187,945,000 93.4 6.6
Employers Reassurance Corp. 108,918,728 100.0 0.0
Wilton Reassurance Co. 75,429,161 100.0 0.0
Optimum Re Insurance Do. 70,089,090 100.0 0.0
PartnerRe Life Reinsurance Co of America 58,225,149 100.0 0.0
Despite the growth potential in
Asia, Latin America and other
areas, the US will remain the
largest market for L&H
business.
Source: AM Best data and research, 12 April 2019
7 Financial Solutions & support in the digital age
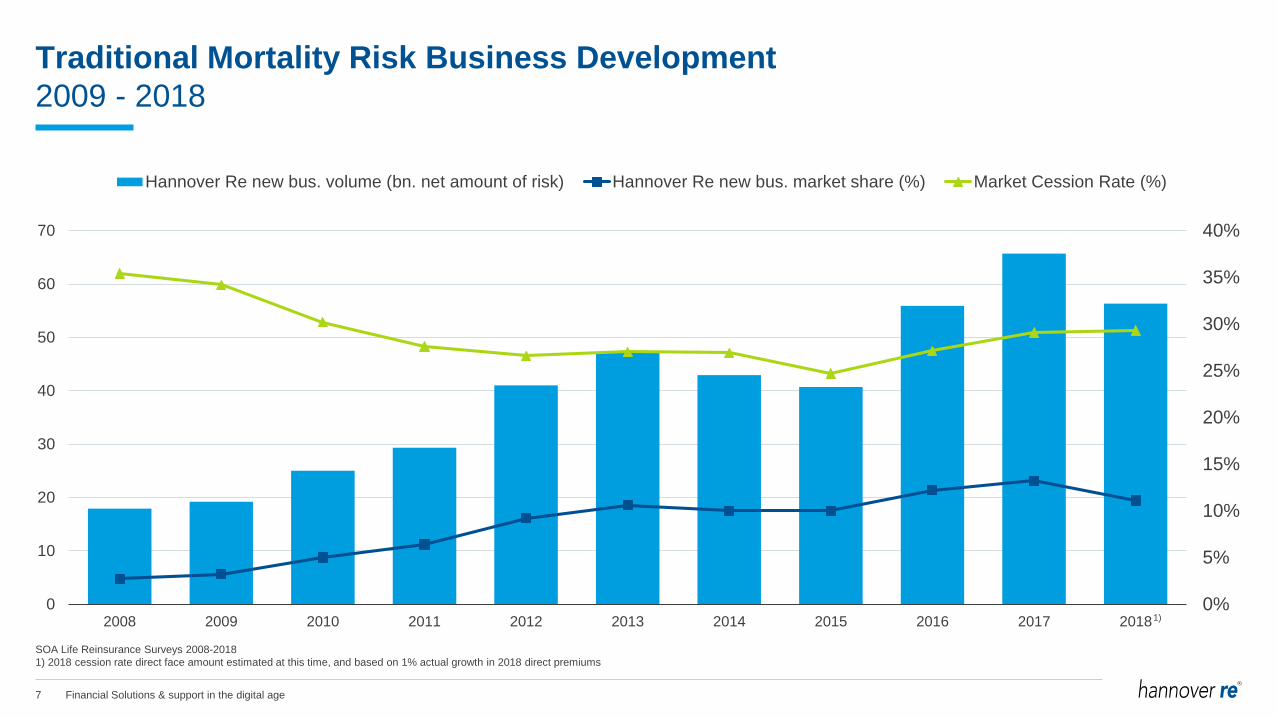
Traditional Mortality Risk Business Development
2009 - 2018
0%
5%
10%
15%
20%
25%
30%
35%
40%
0
10
20
30
40
50
60
70
2008 2009 2010 2011 2012 2013 2014 2015 2016 2017 2018
Hannover Re new bus. volume (bn. net amount of risk) Hannover Re new bus. market share (%) Market Cession Rate (%)
SOA Life Reinsurance Surveys 2008-2018
1) 2018 cession rate direct face amount estimated at this time, and based on 1% actual growth in 2018 direct premiums
1)
8 Financial Solutions & support in the digital age
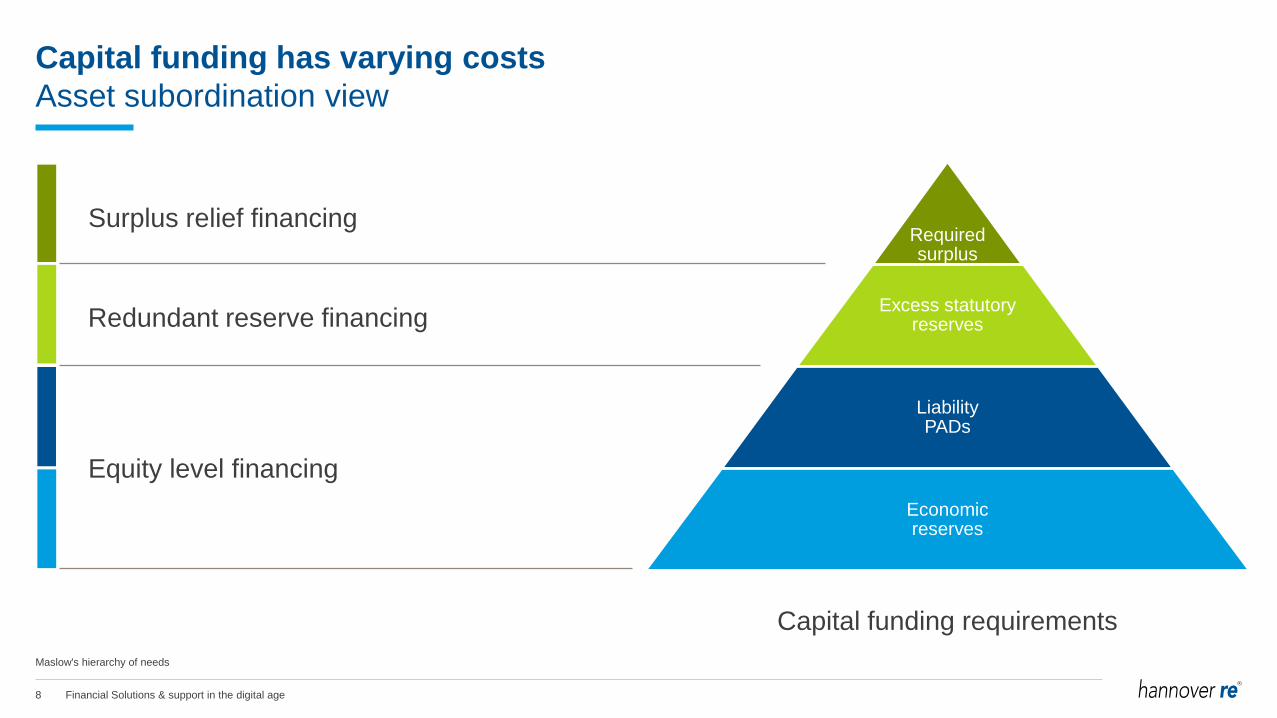
Capital funding has varying costs
Asset subordination view
Maslow's hierarchy of needs
Requiredsurplus
Excess statutory reserves
Liability PADs
Economic reserves
Capital funding requirements
Surplus relief financing
Redundant reserve financing
Equity level financing
9 Financial Solutions & support in the digital age
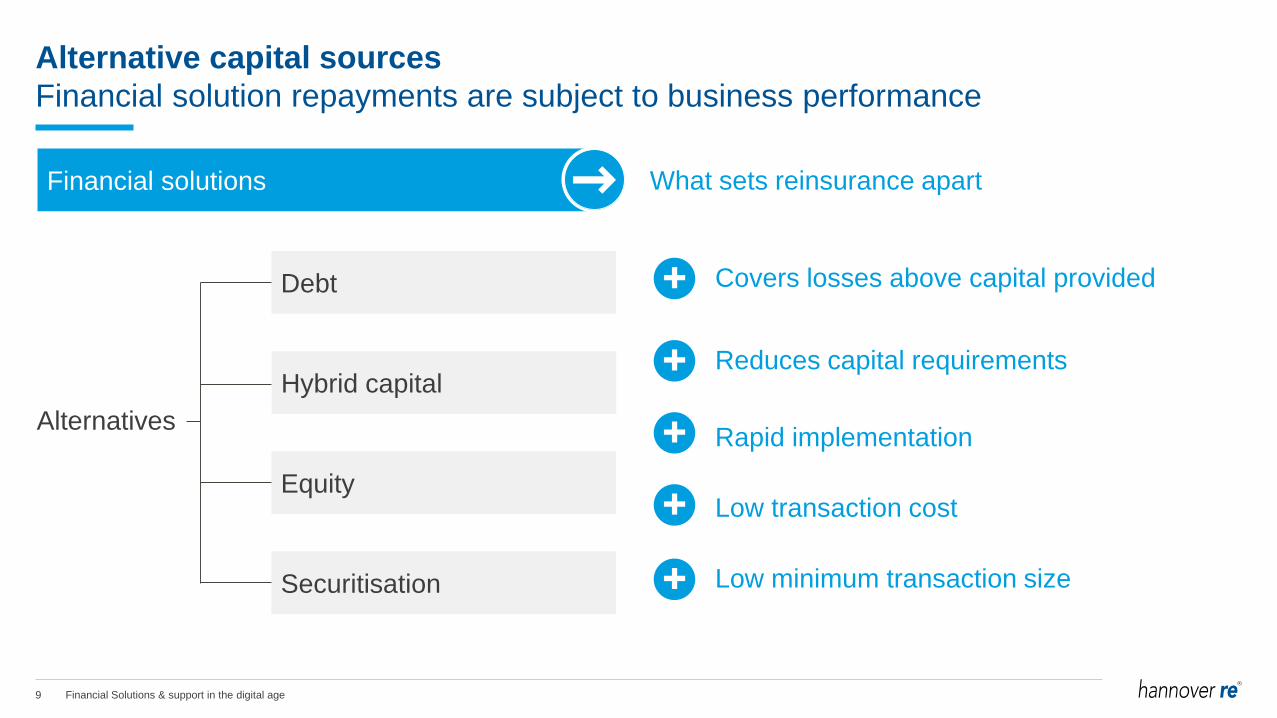
Alternative capital sources
Financial solution repayments are subject to business performance
Financial solutions
Debt
Hybrid capital
Equity
Securitisation
Covers losses above capital provided
What sets reinsurance apart
Reduces capital requirements
Rapid implementation
Low transaction cost
Low minimum transaction size
Alternatives
10 Financial Solutions & support in the digital age
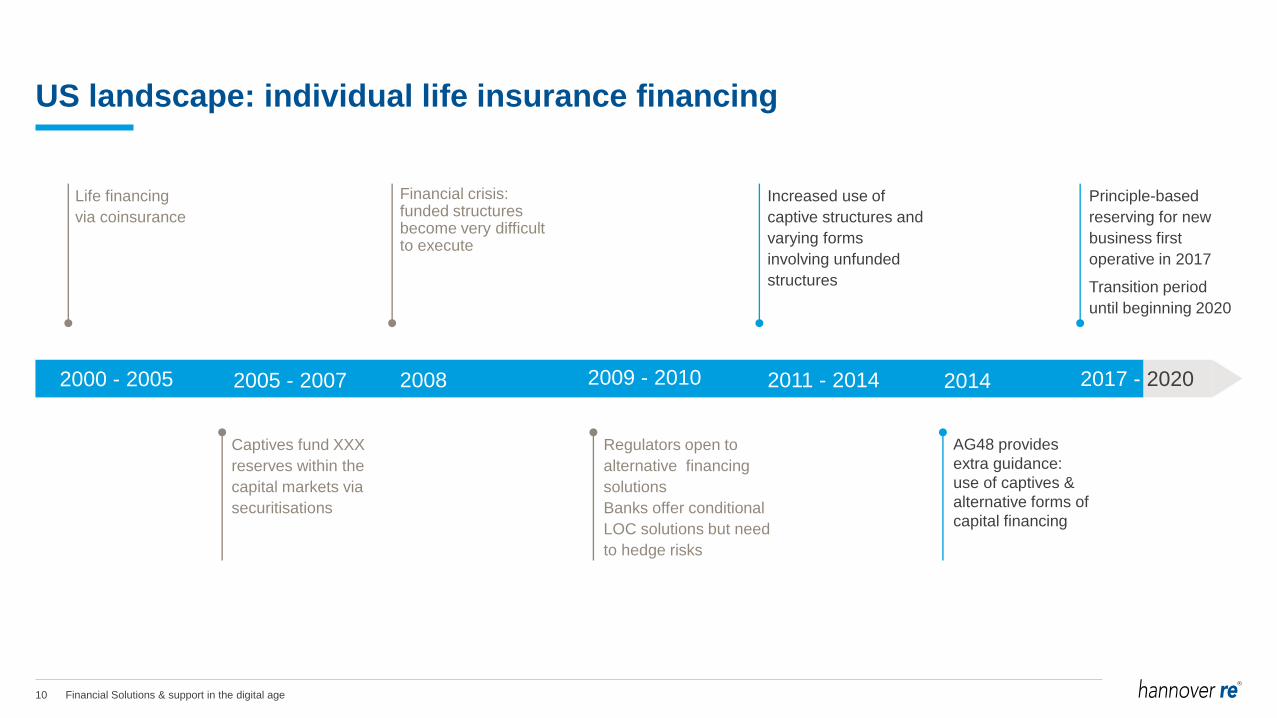
US landscape: individual life insurance financing
Life financing
via coinsurance
Captives fund XXX
reserves within the
capital markets via
securitisations
Financial crisis: funded structures become very difficult to execute
Regulators open to
alternative financing
solutions
Banks offer conditional
LOC solutions but need
to hedge risks
Increased use of
captive structures and
varying forms
involving unfunded
structures
AG48 provides
extra guidance:
use of captives &
alternative forms of
capital financing
2000 - 2005 2005 - 2007 2009 - 20102008 2011 - 2014 2017 - 20202014
Principle-based
reserving for new
business first
operative in 2017
Transition period
until beginning 2020
11 Financial Solutions & support in the digital age
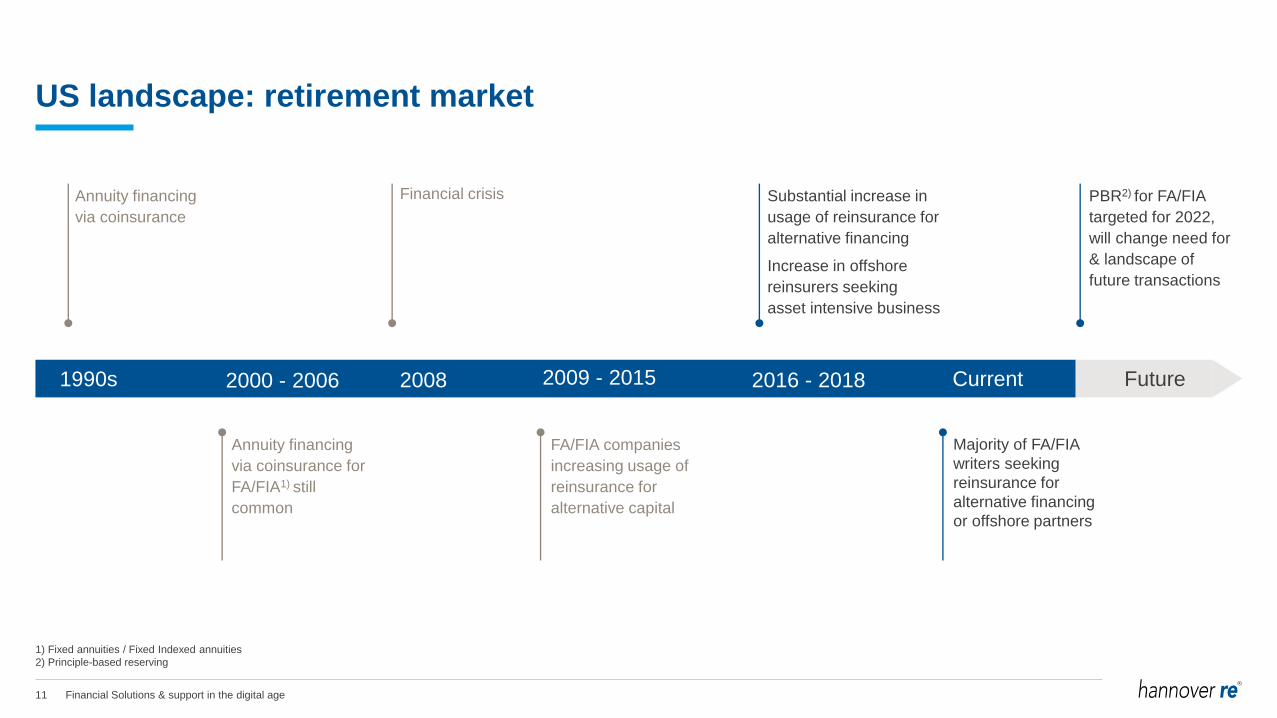
US landscape: retirement market
Annuity financing
via coinsurance
Annuity financing
via coinsurance for
FA/FIA1) still
common
Financial crisis
FA/FIA companies
increasing usage of
reinsurance for
alternative capital
Substantial increase in
usage of reinsurance for
alternative financing
Increase in offshore
reinsurers seeking
asset intensive business
Majority of FA/FIA
writers seeking
reinsurance for
alternative financing
or offshore partners
PBR2) for FA/FIA
targeted for 2022,
will change need for
& landscape of
future transactions
1990s 2000 - 2006 2009 - 20152008 2016 - 2018 FutureCurrent
1) Fixed annuities / Fixed Indexed annuities
2) Principle-based reserving
12 Financial Solutions & support in the digital age
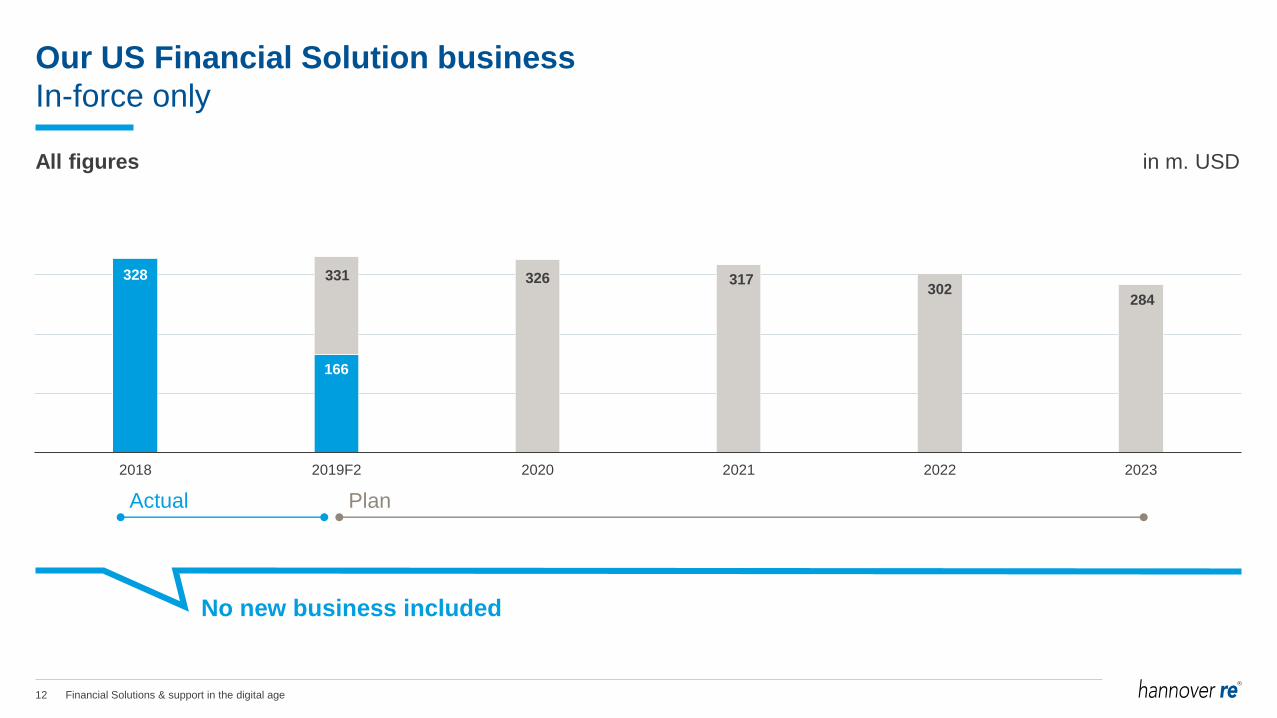
Our US Financial Solution business
In-force only
All figures in m. USD
328
166
326 317302
284
2018 2019F2 2020 2021 2022 2023
Actual Plan
331
No new business included
13 Financial Solutions & support in the digital age
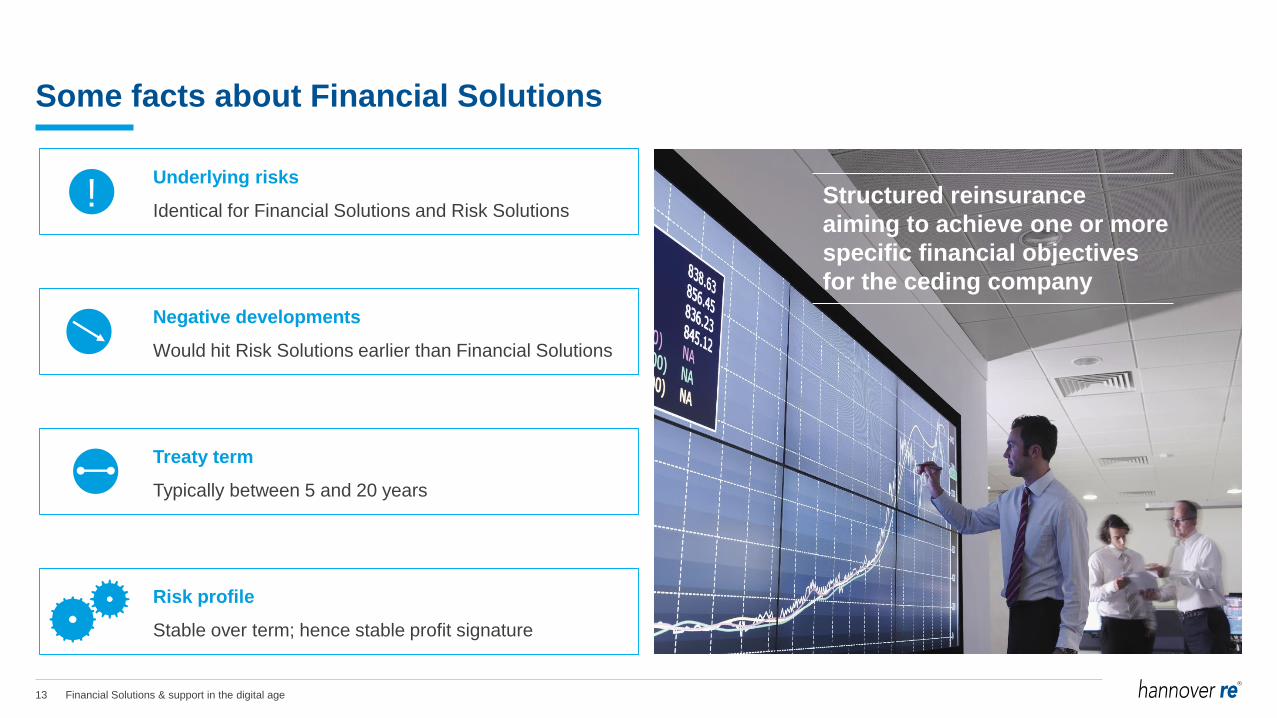
Some facts about Financial Solutions
Underlying risks
Identical for Financial Solutions and Risk Solutions!
Negative developments
Would hit Risk Solutions earlier than Financial Solutions
Risk profile
Stable over term; hence stable profit signature
Treaty term
Typically between 5 and 20 years
Structured reinsurance
aiming to achieve one or more
specific financial objectives
for the ceding company
14 Financial Solutions & support in the digital age
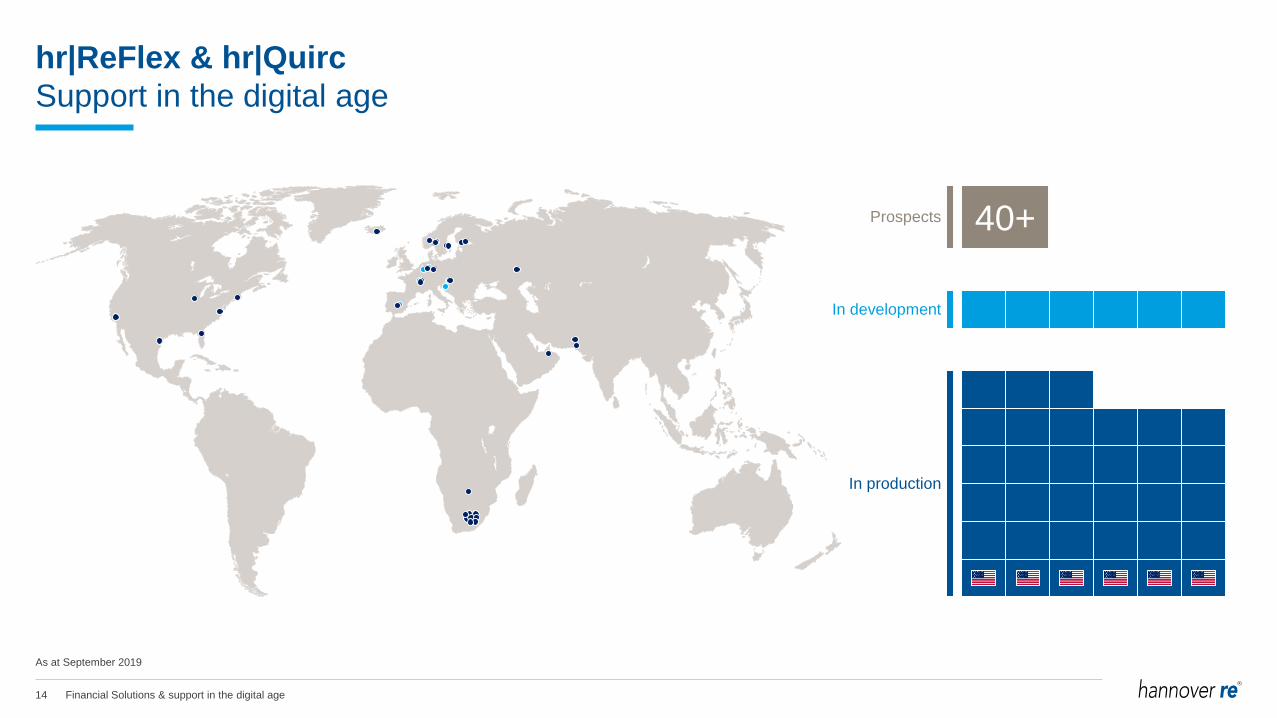
hr|ReFlex & hr|Quirc
Support in the digital age
As at September 2019
In development
In production
Prospects 40+
15 Financial Solutions & support in the digital age
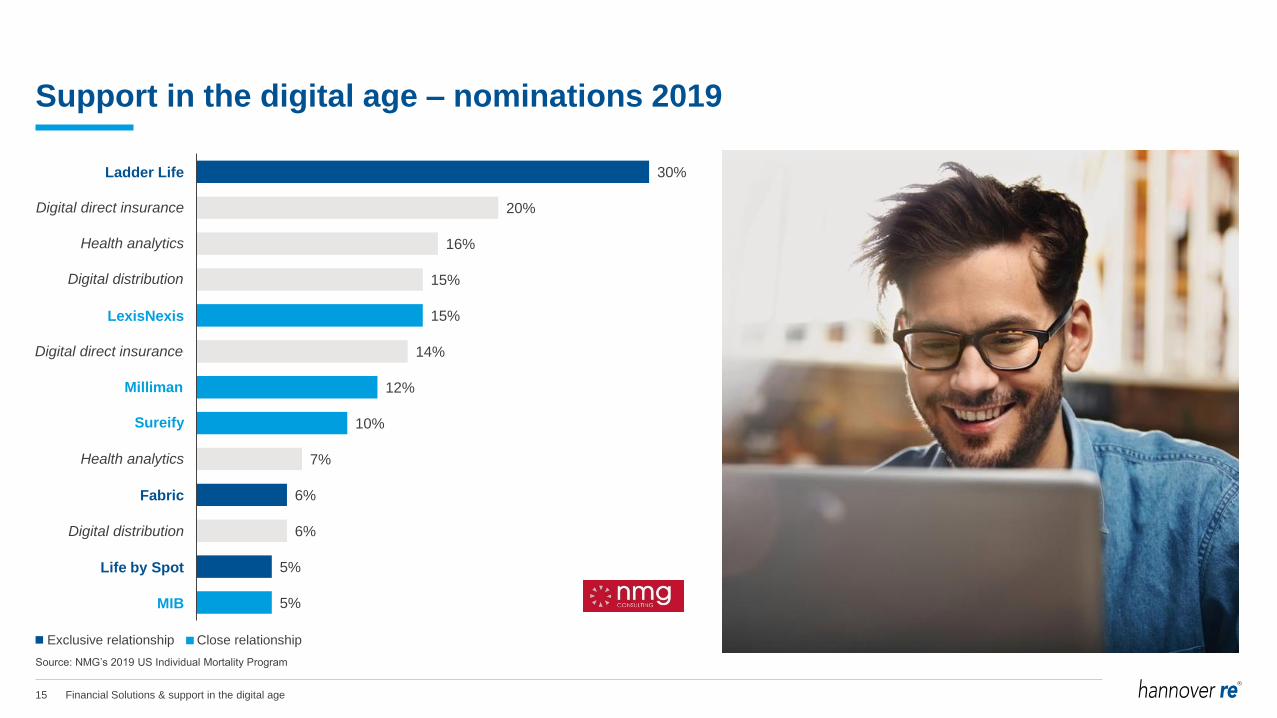
30%
20%
16%
15%
15%
14%
12%
10%
7%
6%
6%
5%
5%
Ladder Life
Digital direct insurance
Health analytics
Digital distribution
LexisNexis
Digital direct insurance
Milliman
Sureify
Health analytics
Fabric
Digital distribution
Life by Spot
MIB
Support in the digital age – nominations 2019
Source: NMG’s 2019 US Individual Mortality Program
Exclusive relationship Close relationship
Digital direct insurance
Health analytics
Digital distribution
Digital direct insurance
Health analytics
Digital distribution
Ladder Life
LexisNexis
Milliman
Sureify
Fabric
Life by Spot
MIB
16 Financial Solutions & support in the digital age
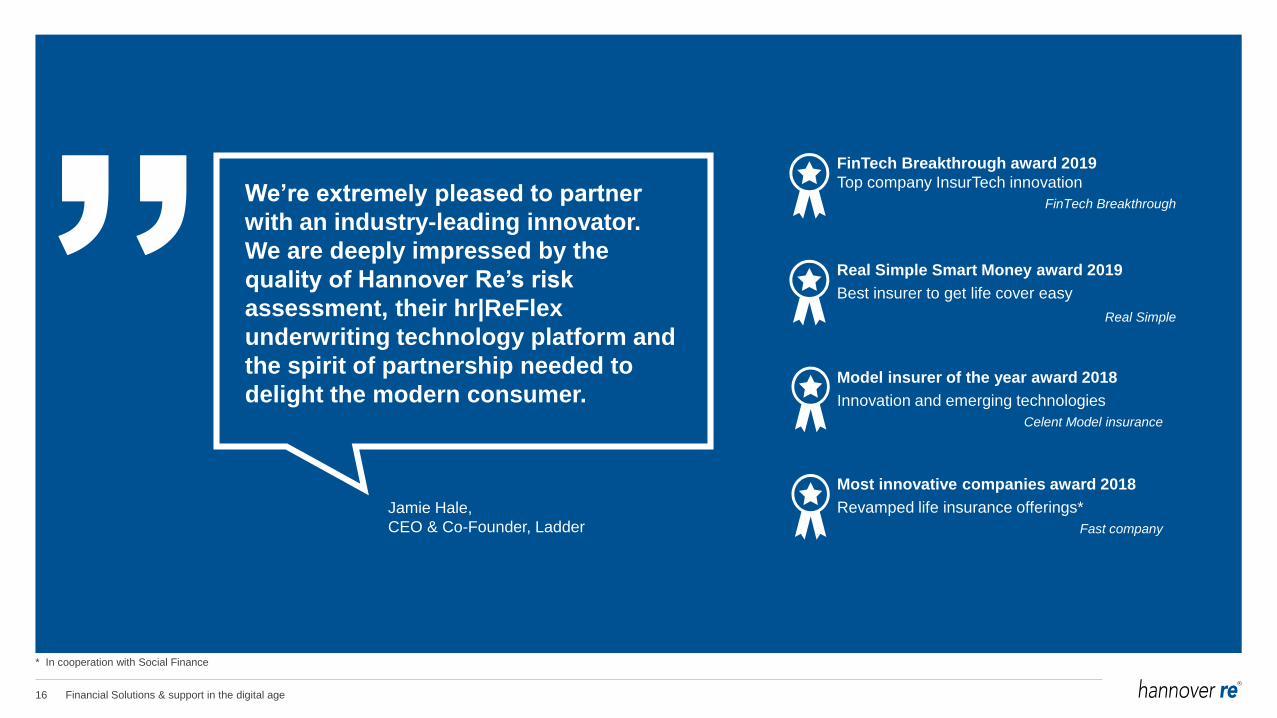
Jamie Hale,
CEO & Co-Founder, Ladder
We’re extremely pleased to partner
with an industry-leading innovator.
We are deeply impressed by the
quality of Hannover Re’s risk
assessment, their hr|ReFlex
underwriting technology platform and
the spirit of partnership needed to
delight the modern consumer.Model insurer of the year award 2018
Innovation and emerging technologies
Celent Model insurance
Most innovative companies award 2018
Revamped life insurance offerings*
Fast company
FinTech Breakthrough award 2019
Top company InsurTech innovation
FinTech Breakthrough
Real Simple Smart Money award 2019
Best insurer to get life cover easy
Real Simple
* In cooperation with Social Finance
17 Financial Solutions & support in the digital age
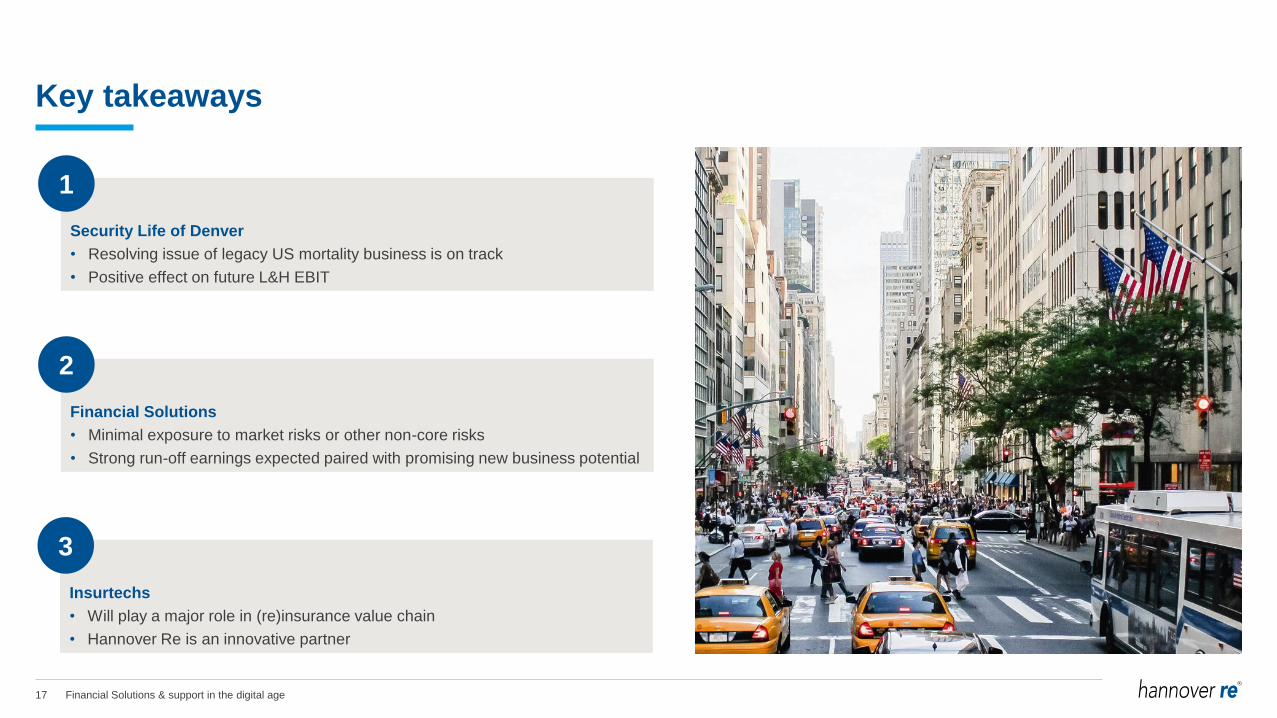
Key takeaways
Security Life of Denver
• Resolving issue of legacy US mortality business is on track
• Positive effect on future L&H EBIT
1
Financial Solutions
• Minimal exposure to market risks or other non-core risks
• Strong run-off earnings expected paired with promising new business potential
2
Insurtechs
• Will play a major role in (re)insurance value chain
• Hannover Re is an innovative partner
3
18 Financial Solutions & support in the digital age
This presentation does not address the investment objectives or financial situation of any particular person or legal entity.
Investors should seek independent professional advice and perform their own analysis regarding the appropriateness of
investing in any of our securities.
While Hannover Re has endeavoured to include in this presentation information it believes to be reliable, complete and up-to-
date, the company does not make any representation or warranty, express or implied, as to the accuracy, completeness or
updated status of such information.
Some of the statements in this presentation may be forward-looking statements or statements of future expectations based on
currently available information. Such statements naturally are subject to risks and uncertainties. Factors such as the
development of general economic conditions, future market conditions, unusual catastrophic loss events, changes in the capital
markets and other circumstances may cause the actual events or results to be materially different from those anticipated by
such statements.
This presentation serves information purposes only and does not constitute or form part of an offer or solicitation to acquire,
subscribe to or dispose of, any of the securities of Hannover Re.
© Hannover Rück SE. All rights reserved.
Hannover Re is the registered service mark of Hannover Rück SE.
Disclaimer

Concluding remarks and outlook
Jean-Jacques Henchoz, Chief Executive Officer
22nd International Investors’ Day
Frankfurt, 23 October 2019
2 Concluding remarks and outlook
P&C
• Underwriting
discipline and
competitive cost
advantage will
enable further
profitable growth
L&H
• Strong contribution
from Financial
Solutions
• Active management
of in-force book will
support profitable
growth
Investments
• Ordinary income
well supported by
alternatives
• Low interest-rate
environment is
manageable
Risk Management
• Very strong
reserving position
and capitalisation
• Active management
of key exposures
(climate change,
cyber)
Pursuing the outperformance journey
We will continuously create value for clients, shareholders and employees
Well positioned in an attractive reinsurance market
Business model continuity is key to further success and outperformance
Additional success factors will be required to secure performance at full potential

3 Concluding remarks and outlook
This presentation does not address the investment objectives or financial situation of any particular person or legal entity.
Investors should seek independent professional advice and perform their own analysis regarding the appropriateness of
investing in any of our securities.
While Hannover Re has endeavoured to include in this presentation information it believes to be reliable, complete and up-to-
date, the company does not make any representation or warranty, express or implied, as to the accuracy, completeness or
updated status of such information.
Some of the statements in this presentation may be forward-looking statements or statements of future expectations based on
currently available information. Such statements naturally are subject to risks and uncertainties. Factors such as the
development of general economic conditions, future market conditions, unusual catastrophic loss events, changes in the capital
markets and other circumstances may cause the actual events or results to be materially different from those anticipated by
such statements.
This presentation serves information purposes only and does not constitute or form part of an offer or solicitation to acquire,
subscribe to or dispose of, any of the securities of Hannover Re.
© Hannover Rück SE. All rights reserved.
Hannover Re is the registered service mark of Hannover Rück SE.
Disclaimer