Embed Size (px)
Citation preview

2.3.1. Oil transport
The various methods of transportIt is enough just to glance at a map
showing the locations of the world’s oil-producing and oil-consuming regions toappreciate that massive quantities of oil have to be transported over enormousdistances (Fig. 1).
Oil-producing regions are in most cases along way from the industrialized countries,which are the biggest consumers of oil. In 2003, nearly 2.3 billion tonnes of crude oiland refined products were transported over greatdistances. Crude oil accounted for 78% of this tonnage. And this enormous volume is constantly increasing (�19% since1996, �7% since 2000) as world oilconsumption rises. In short, some half of all the
85VOLUME IV / HYDROCARBONS: ECONOMICS, POLICIES AND LEGISLATION
2.3
Analysis of cost structureand functions in oil transport
and refining
UNITED STATES - CANADA
LATIN AMERICA
production2002 crude andLNG
crude andpetroleumproduct flow
refiningcapacity (as of1 January, 2003)
consumption2002
EUROPE FORMER USSR
CHINA
AFRICA
MIDDLEEAST
1015375
485 935 985
515
data in million tons
400 295
165
120
200
560
220
215
110
155
185
120
200
130
210
210
465
320
840755
425
170 810
730
280260
170
330
OTHER ASIAOCEANIA
120150
10010
3030
30
35
1515
10
50
60
35
5025
80
1090
20
15
757510
60
40
30
10
20
Fig. 1. Petroleum worldwide in 2002.
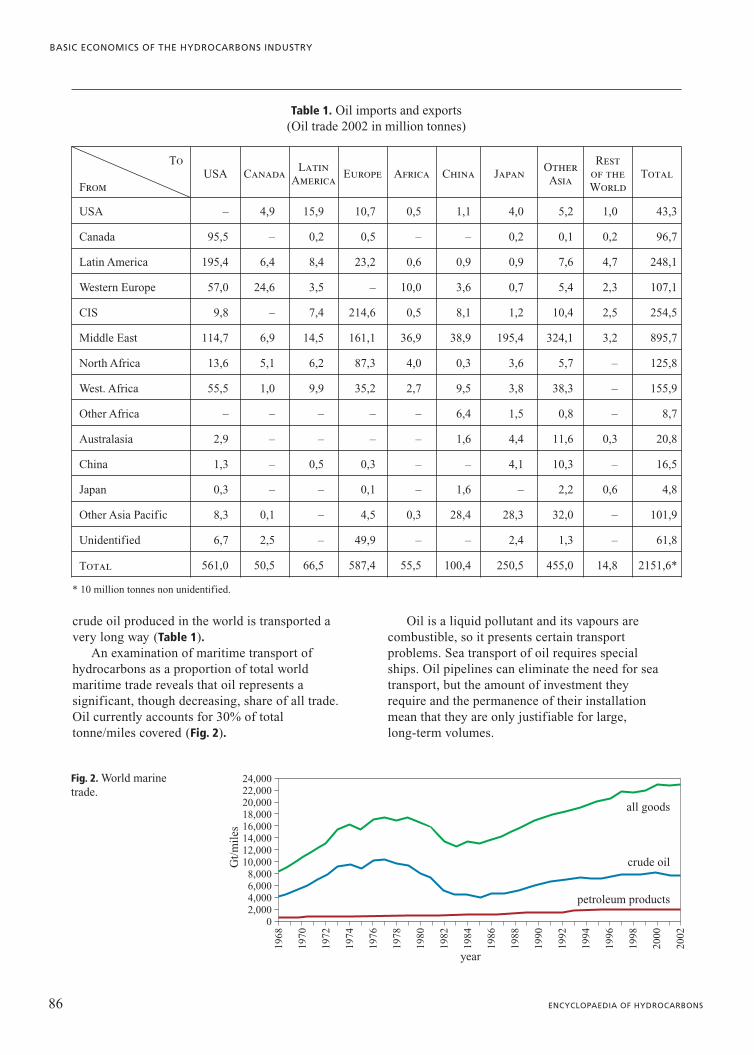
crude oil produced in the world is transported avery long way (Table 1).
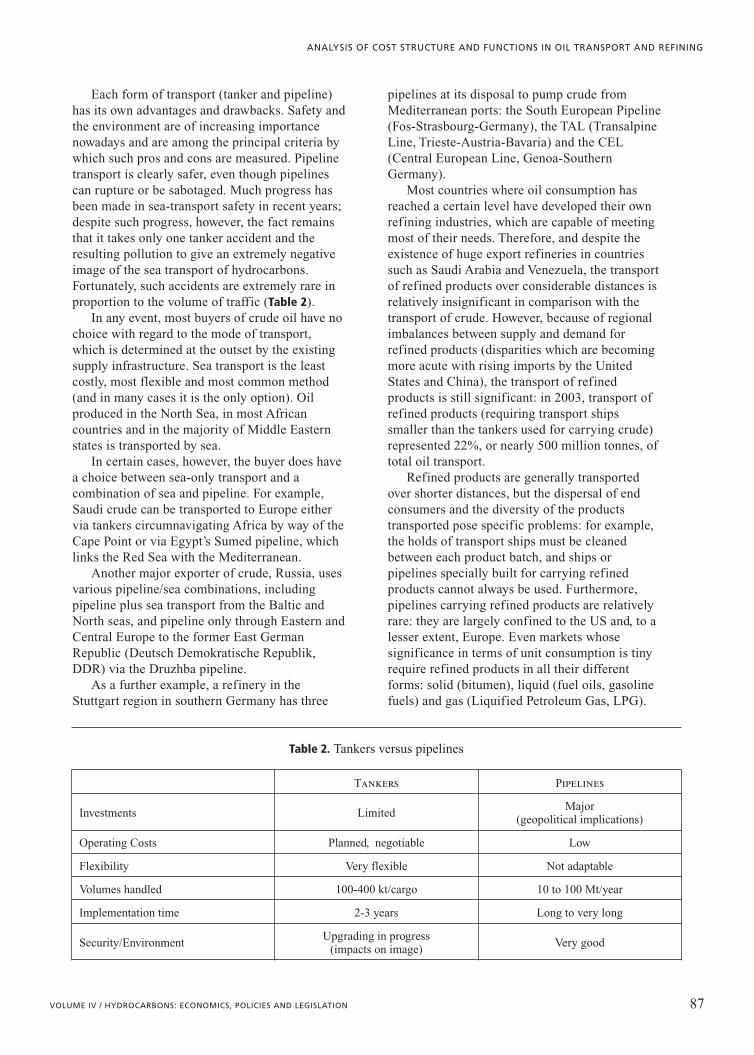
An examination of maritime transport ofhydrocarbons as a proportion of total worldmaritime trade reveals that oil represents asignificant, though decreasing, share of all trade.Oil currently accounts for 30% of totaltonne/miles covered (Fig. 2).
Oil is a liquid pollutant and its vapours arecombustible, so it presents certain transportproblems. Sea transport of oil requires specialships. Oil pipelines can eliminate the need for seatransport, but the amount of investment theyrequire and the permanence of their installationmean that they are only justifiable for large,long-term volumes.
86 ENCYCLOPAEDIA OF HYDROCARBONS
BASIC ECONOMICS OF THE HYDROCARBONS INDUSTRY
Gt/
mil
es
0
8,0006,0004,0002,000
10,00012,00014,00016,00018,00020,00022,00024,000
all goods
crude oil
petroleum products
year
1968
1970
1972
1974
1976
1978
1980
1982
1984
1986
1988
1990
1992
1994
1996
1998
2000
2002
Fig. 2. World marine trade.
* 10 million tonnes non unidentified.
Table 1. Oil imports and exports(Oil trade 2002 in million tonnes)
To
FromUSA Canada
LatinAmerica
Europe Africa China JapanOtherAsia
Restof theWorld
Total
USA – 4,9 15,9 10,7 0,5 1,1 4,0 5,2 1,0 43,3
Canada 95,5 – 0,2 0,5 – – 0,2 0,1 0,2 96,7
Latin America 195,4 6,4 8,4 23,2 0,6 0,9 0,9 7,6 4,7 248,1
Western Europe 57,0 24,6 3,5 – 10,0 3,6 0,7 5,4 2,3 107,1
CIS 9,8 – 7,4 214,6 0,5 8,1 1,2 10,4 2,5 254,5
Middle East 114,7 6,9 14,5 161,1 36,9 38,9 195,4 324,1 3,2 895,7
North Africa 13,6 5,1 6,2 87,3 4,0 0,3 3,6 5,7 – 125,8
West. Africa 55,5 1,0 9,9 35,2 2,7 9,5 3,8 38,3 – 155,9
Other Africa – – – – – 6,4 1,5 0,8 – 8,7
Australasia 2,9 – – – – 1,6 4,4 11,6 0,3 20,8
China 1,3 – 0,5 0,3 – – 4,1 10,3 – 16,5
Japan 0,3 – – 0,1 – 1,6 – 2,2 0,6 4,8
Other Asia Pacific 8,3 0,1 – 4,5 0,3 28,4 28,3 32,0 – 101,9
Unidentified 6,7 2,5 – 49,9 – – 2,4 1,3 – 61,8
Total 561,0 50,5 66,5 587,4 55,5 100,4 250,5 455,0 14,8 2151,6*
Each form of transport (tanker and pipeline)has its own advantages and drawbacks. Safety andthe environment are of increasing importancenowadays and are among the principal criteria bywhich such pros and cons are measured. Pipelinetransport is clearly safer, even though pipelinescan rupture or be sabotaged. Much progress hasbeen made in sea-transport safety in recent years;despite such progress, however, the fact remainsthat it takes only one tanker accident and theresulting pollution to give an extremely negativeimage of the sea transport of hydrocarbons.Fortunately, such accidents are extremely rare inproportion to the volume of traffic (Table 2).
In any event, most buyers of crude oil have nochoice with regard to the mode of transport,which is determined at the outset by the existingsupply infrastructure. Sea transport is the leastcostly, most flexible and most common method(and in many cases it is the only option). Oilproduced in the North Sea, in most Africancountries and in the majority of Middle Easternstates is transported by sea.
In certain cases, however, the buyer does havea choice between sea-only transport and acombination of sea and pipeline. For example,Saudi crude can be transported to Europe eithervia tankers circumnavigating Africa by way of theCape Point or via Egypt’s Sumed pipeline, whichlinks the Red Sea with the Mediterranean.
Another major exporter of crude, Russia, usesvarious pipeline/sea combinations, includingpipeline plus sea transport from the Baltic andNorth seas, and pipeline only through Eastern andCentral Europe to the former East GermanRepublic (Deutsch Demokratische Republik,DDR) via the Druzhba pipeline.
As a further example, a refinery in theStuttgart region in southern Germany has three
pipelines at its disposal to pump crude fromMediterranean ports: the South European Pipeline(Fos-Strasbourg-Germany), the TAL (TransalpineLine, Trieste-Austria-Bavaria) and the CEL(Central European Line, Genoa-SouthernGermany).
Most countries where oil consumption hasreached a certain level have developed their ownrefining industries, which are capable of meetingmost of their needs. Therefore, and despite theexistence of huge export refineries in countriessuch as Saudi Arabia and Venezuela, the transportof refined products over considerable distances isrelatively insignificant in comparison with thetransport of crude. However, because of regionalimbalances between supply and demand forrefined products (disparities which are becomingmore acute with rising imports by the UnitedStates and China), the transport of refinedproducts is still significant: in 2003, transport ofrefined products (requiring transport shipssmaller than the tankers used for carrying crude)represented 22%, or nearly 500 million tonnes, oftotal oil transport.
Refined products are generally transportedover shorter distances, but the dispersal of endconsumers and the diversity of the productstransported pose specific problems: for example,the holds of transport ships must be cleanedbetween each product batch, and ships orpipelines specially built for carrying refinedproducts cannot always be used. Furthermore,pipelines carrying refined products are relativelyrare: they are largely confined to the US and, to alesser extent, Europe. Even markets whosesignificance in terms of unit consumption is tinyrequire refined products in all their differentforms: solid (bitumen), liquid (fuel oils, gasolinefuels) and gas (Liquified Petroleum Gas, LPG).
87VOLUME IV / HYDROCARBONS: ECONOMICS, POLICIES AND LEGISLATION
ANALYSIS OF COST STRUCTURE AND FUNCTIONS IN OIL TRANSPORT AND REFINING
Table 2. Tankers versus pipelines
Tankers Pipelines
Investments LimitedMajor
(geopolitical implications)
Operating Costs Planned, negotiable Low
Flexibility Very flexible Not adaptable
Volumes handled 100-400 kt/cargo 10 to 100 Mt/year
Implementation time 2-3 years Long to very long
Security/EnvironmentUpgrading in progress
(impacts on image)Very good

Each of these products has to conform to certainstandards and specifications, and the risk ofcontamination across product lines means thattransporting or storing them in the samereceptacle is out of the question.
Aside from ship and pipeline, the mostcommonly used methods for transporting refinedproducts are barges, rail tankers and tankertrucks, the latter two being the only methodscapable of bringing products directly to the endconsumer
Sea transport
The various types of ship usedThree principal types of ship are used for
carrying oil, classified according to their dwt(deadweight tonnage), i.e. the amount of cargothat the ship can carry in addition to its own fueland supplies. To these three principal categoriescan be added the largest of all supertankers, theUltra-Large Crude Carriers (ULCCs), as well asPanamax-class carriers:• Ultra-Large Crude Carriers (ULCCs) have a
dwt of between 325,000 and 600,000. Veryfew of these giant ships are currently active.
• Very Large Crude Carriers (VLCCs), with adwt of over 160,000, are used on routes fromthe Persian Gulf westwards to the Caribbean,US and Europe, and eastwards to SoutheastAsia (Japan, Korea and Singapore). Thelargest VLCC tankers are used for supplyingEurope and the US. When empty, these shipscan negotiate the Suez Canal.
• Suezmax, with a dwt of between 100,000 and160,000, is specially designed to be able touse the Suez Canal when loaded. Suezmaxvessels are also used for transporting crudefrom West Africa to the Caribbean, the US andEurope.
• Aframax ships, which have a dwt of between80,000 and 100,000, are used in regional traffic(North Sea, Mediterranean, Caribbean/US).This is the largest carrier-class allowed to enterAmerican ports when fully loaded.
• Panamax carriers are used on certain routesonly. Their size (60,000 dwt or less) meansthat they can use the Panama Canal (servingsuch routes as California/the Gulf of Mexicoor the Pacific coast of South America/the USeastern seaboard).The world oil-tanker fleet-capacity peaked at
about 330 million dwt in the late 1970s beforefalling to under 250 million dwt with the oilcrisis of 1986. Since then, it has been rising
steadily, reaching some 300 million dwt in 2004.Requirements in terms of transport capacityfluctuate in line with world oil demand, whilethe emergence of non-OPEC (the Organizationof the Petroleum Exporting Countries)production in regions nearer to consumptionmarkets has also helped to dampen capacityrequirements. Slowdown in demand can forceshipowners to mothball many of their largertankers, something that happened in the early1980s when charter rates were so low thatshipowners were unable to operate their fleetsprofitably. Economic growth since 2000, in Asiaespecially, has sparked renewed charteringdemand.
Most (two-thirds) of the world tanker fleet isindependently owned, while the other thirdbelongs to the oil companies themselves; of these,ownership by national companies is growing atthe expense of the majors. The fleet mainlycomprises large tankers and is currentlyundergoing refurbishment in the wake of newsafety regulations.
The different types of shipping charterThree types of tanker charter exist:
• Bareboat charters: the tanker is placed at thedisposal of the charterer for a specific periodof time. The tanker is equipped by thecharterer, which also pays its operating costs.The charter hire rate (paid monthly) reflectsthe capital costs of the tanker. Bareboatcharters are therefore similar to leasingagreements, and generally incorporate apurchase option.
• Time charters: the tanker is placed at thedisposal of the charterer for a specific periodof time (anything from six months to severalyears) and operating costs are borne by theship-owner.
• Spot or voyage charters: the shipowner agrees totransport cargo from one designated port toanother and applies a cargo tariff per tonne ofcargo transported, with all costs included. Spotcharters can cover consecutive stages on thesame itinerary. Although they were practicallyunheard-of in the early 1970s, these are now themost frequent form of charter agreement.
The cost of sea transportFor shipowners, costs per tonne transported
are a key factor, as owners are unable to operatefor long under a certain threshold without havingto lay up part of their fleet. These costs comprisetwo components: depreciation of the tankers
88 ENCYCLOPAEDIA OF HYDROCARBONS
BASIC ECONOMICS OF THE HYDROCARBONS INDUSTRY
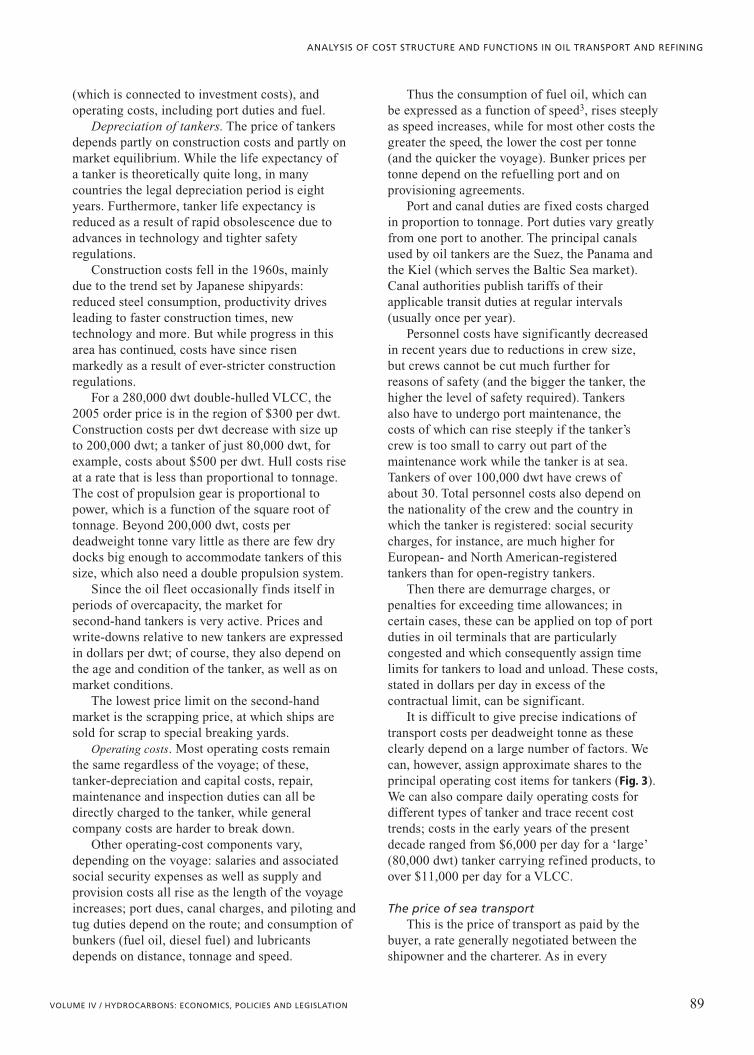
(which is connected to investment costs), andoperating costs, including port duties and fuel.
Depreciation of tankers. The price of tankersdepends partly on construction costs and partly onmarket equilibrium. While the life expectancy ofa tanker is theoretically quite long, in manycountries the legal depreciation period is eightyears. Furthermore, tanker life expectancy isreduced as a result of rapid obsolescence due toadvances in technology and tighter safetyregulations.
Construction costs fell in the 1960s, mainlydue to the trend set by Japanese shipyards:reduced steel consumption, productivity drivesleading to faster construction times, newtechnology and more. But while progress in thisarea has continued, costs have since risenmarkedly as a result of ever-stricter constructionregulations.
For a 280,000 dwt double-hulled VLCC, the2005 order price is in the region of $300 per dwt.Construction costs per dwt decrease with size upto 200,000 dwt; a tanker of just 80,000 dwt, forexample, costs about $500 per dwt. Hull costs riseat a rate that is less than proportional to tonnage.The cost of propulsion gear is proportional topower, which is a function of the square root oftonnage. Beyond 200,000 dwt, costs perdeadweight tonne vary little as there are few drydocks big enough to accommodate tankers of thissize, which also need a double propulsion system.
Since the oil fleet occasionally finds itself inperiods of overcapacity, the market forsecond-hand tankers is very active. Prices andwrite-downs relative to new tankers are expressedin dollars per dwt; of course, they also depend onthe age and condition of the tanker, as well as onmarket conditions.
The lowest price limit on the second-handmarket is the scrapping price, at which ships aresold for scrap to special breaking yards.
Operating costs. Most operating costs remainthe same regardless of the voyage; of these,tanker-depreciation and capital costs, repair,maintenance and inspection duties can all bedirectly charged to the tanker, while generalcompany costs are harder to break down.
Other operating-cost components vary,depending on the voyage: salaries and associatedsocial security expenses as well as supply andprovision costs all rise as the length of the voyageincreases; port dues, canal charges, and piloting andtug duties depend on the route; and consumption ofbunkers (fuel oil, diesel fuel) and lubricantsdepends on distance, tonnage and speed.
Thus the consumption of fuel oil, which canbe expressed as a function of speed3, rises steeplyas speed increases, while for most other costs thegreater the speed, the lower the cost per tonne(and the quicker the voyage). Bunker prices pertonne depend on the refuelling port and onprovisioning agreements.
Port and canal duties are fixed costs chargedin proportion to tonnage. Port duties vary greatlyfrom one port to another. The principal canalsused by oil tankers are the Suez, the Panama andthe Kiel (which serves the Baltic Sea market).Canal authorities publish tariffs of theirapplicable transit duties at regular intervals(usually once per year).
Personnel costs have significantly decreasedin recent years due to reductions in crew size,but crews cannot be cut much further forreasons of safety (and the bigger the tanker, thehigher the level of safety required). Tankersalso have to undergo port maintenance, thecosts of which can rise steeply if the tanker’screw is too small to carry out part of themaintenance work while the tanker is at sea.Tankers of over 100,000 dwt have crews ofabout 30. Total personnel costs also depend onthe nationality of the crew and the country inwhich the tanker is registered: social securitycharges, for instance, are much higher forEuropean- and North American-registeredtankers than for open-registry tankers.
Then there are demurrage charges, orpenalties for exceeding time allowances; incertain cases, these can be applied on top of portduties in oil terminals that are particularlycongested and which consequently assign timelimits for tankers to load and unload. These costs,stated in dollars per day in excess of thecontractual limit, can be significant.
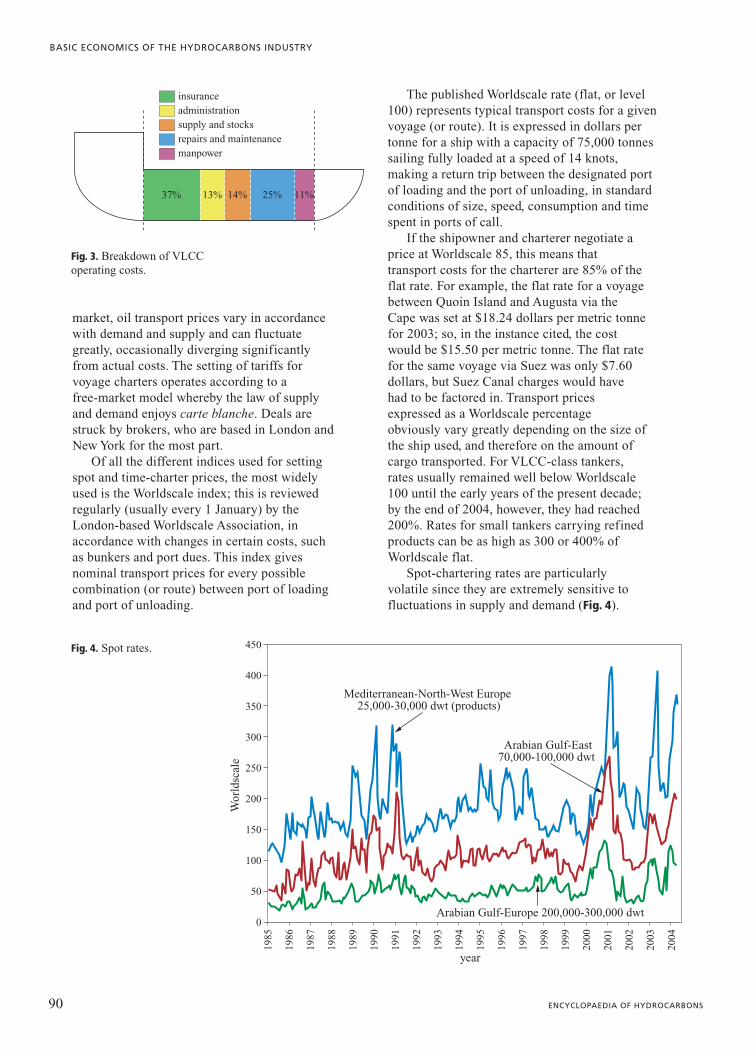
It is difficult to give precise indications oftransport costs per deadweight tonne as theseclearly depend on a large number of factors. Wecan, however, assign approximate shares to theprincipal operating cost items for tankers (Fig. 3).We can also compare daily operating costs fordifferent types of tanker and trace recent costtrends; costs in the early years of the presentdecade ranged from $6,000 per day for a ‘large’(80,000 dwt) tanker carrying refined products, toover $11,000 per day for a VLCC.
The price of sea transportThis is the price of transport as paid by the
buyer, a rate generally negotiated between theshipowner and the charterer. As in every
89VOLUME IV / HYDROCARBONS: ECONOMICS, POLICIES AND LEGISLATION
ANALYSIS OF COST STRUCTURE AND FUNCTIONS IN OIL TRANSPORT AND REFINING
market, oil transport prices vary in accordancewith demand and supply and can fluctuategreatly, occasionally diverging significantlyfrom actual costs. The setting of tariffs forvoyage charters operates according to afree-market model whereby the law of supplyand demand enjoys carte blanche. Deals arestruck by brokers, who are based in London andNew York for the most part.
Of all the different indices used for settingspot and time-charter prices, the most widelyused is the Worldscale index; this is reviewedregularly (usually every 1 January) by theLondon-based Worldscale Association, inaccordance with changes in certain costs, suchas bunkers and port dues. This index givesnominal transport prices for every possiblecombination (or route) between port of loadingand port of unloading.
The published Worldscale rate (flat, or level100) represents typical transport costs for a givenvoyage (or route). It is expressed in dollars pertonne for a ship with a capacity of 75,000 tonnessailing fully loaded at a speed of 14 knots,making a return trip between the designated portof loading and the port of unloading, in standardconditions of size, speed, consumption and timespent in ports of call.
If the shipowner and charterer negotiate aprice at Worldscale 85, this means thattransport costs for the charterer are 85% of theflat rate. For example, the flat rate for a voyagebetween Quoin Island and Augusta via theCape was set at $18.24 dollars per metric tonnefor 2003; so, in the instance cited, the costwould be $15.50 per metric tonne. The flat ratefor the same voyage via Suez was only $7.60dollars, but Suez Canal charges would havehad to be factored in. Transport pricesexpressed as a Worldscale percentageobviously vary greatly depending on the size ofthe ship used, and therefore on the amount ofcargo transported. For VLCC-class tankers,rates usually remained well below Worldscale100 until the early years of the present decade;by the end of 2004, however, they had reached200%. Rates for small tankers carrying refinedproducts can be as high as 300 or 400% ofWorldscale flat.
Spot-chartering rates are particularlyvolatile since they are extremely sensitive tofluctuations in supply and demand (Fig. 4).
90 ENCYCLOPAEDIA OF HYDROCARBONS
BASIC ECONOMICS OF THE HYDROCARBONS INDUSTRY
insurance
37% 13% 14% 25% 11%
administrationsupply and stocksrepairs and maintenancemanpower
Fig. 3. Breakdown of VLCC operating costs.
Wor
ldsc
ale
Mediterranean-North-West Europe 25,000-30,000 dwt (products)
Arabian Gulf-Europe 200,000-300,000 dwt
Arabian Gulf-East70,000-100,000 dwt
0
50
100
150
200
250
300
350
400
450
year
1985
1986
1987
1988
1989
1990
1991
1992
1993
1994
1995
1996
1997
1998
1999
2000
2001
2002
2003
2004
Fig. 4. Spot rates.
They are susceptible to seasonal variations andare also influenced by the occurrence (oranticipation) of other phenomena: war,political tensions, changes in crude prices, andnew regulations. Time chartering rates are lessvolatile.
Chartering transactions are performed bybrokers, whose duties include an obligation toensure transparency in dealings. Averagechartering prices, expressed as percentages of theWorldscale index, are regularly published byvarious bodies.
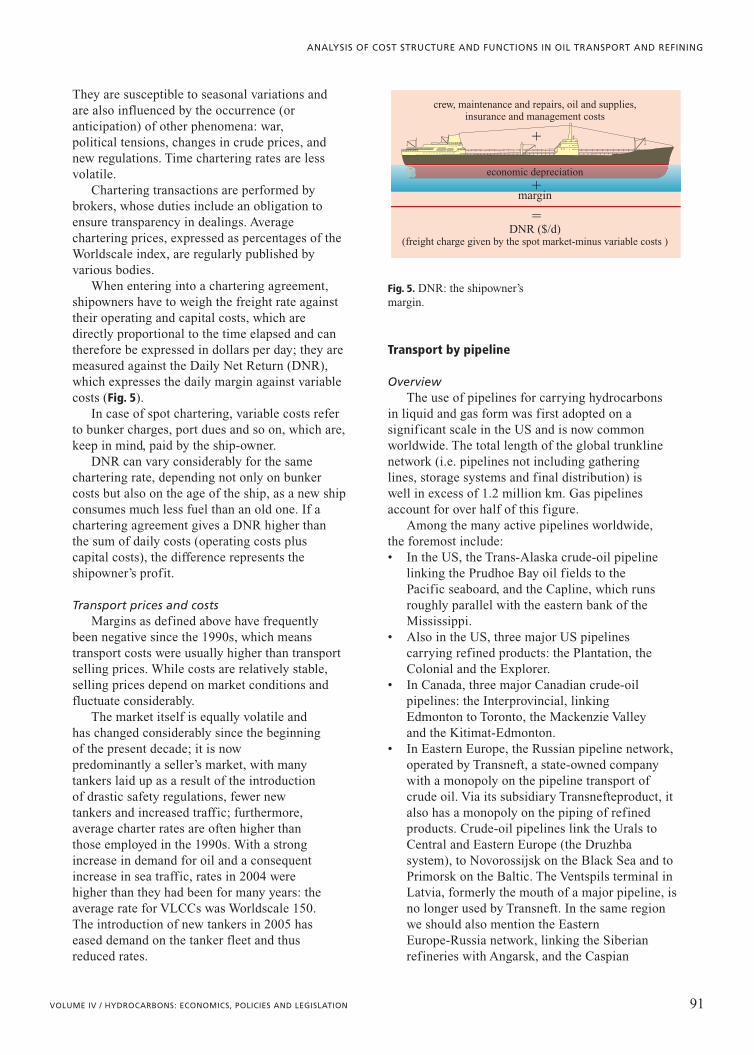
When entering into a chartering agreement,shipowners have to weigh the freight rate againsttheir operating and capital costs, which aredirectly proportional to the time elapsed and cantherefore be expressed in dollars per day; they aremeasured against the Daily Net Return (DNR),which expresses the daily margin against variablecosts (Fig. 5).
In case of spot chartering, variable costs referto bunker charges, port dues and so on, which are,keep in mind, paid by the ship-owner.
DNR can vary considerably for the samechartering rate, depending not only on bunkercosts but also on the age of the ship, as a new shipconsumes much less fuel than an old one. If achartering agreement gives a DNR higher thanthe sum of daily costs (operating costs pluscapital costs), the difference represents theshipowner’s profit.
Transport prices and costsMargins as defined above have frequently
been negative since the 1990s, which meanstransport costs were usually higher than transportselling prices. While costs are relatively stable,selling prices depend on market conditions andfluctuate considerably.
The market itself is equally volatile andhas changed considerably since the beginningof the present decade; it is nowpredominantly a seller’s market, with manytankers laid up as a result of the introductionof drastic safety regulations, fewer newtankers and increased traffic; furthermore,average charter rates are often higher thanthose employed in the 1990s. With a strongincrease in demand for oil and a consequentincrease in sea traffic, rates in 2004 werehigher than they had been for many years: theaverage rate for VLCCs was Worldscale 150.The introduction of new tankers in 2005 haseased demand on the tanker fleet and thusreduced rates.
Transport by pipeline
OverviewThe use of pipelines for carrying hydrocarbons
in liquid and gas form was first adopted on asignificant scale in the US and is now commonworldwide. The total length of the global trunklinenetwork (i.e. pipelines not including gatheringlines, storage systems and final distribution) iswell in excess of 1.2 million km. Gas pipelinesaccount for over half of this figure.
Among the many active pipelines worldwide,the foremost include:• In the US, the Trans-Alaska crude-oil pipeline
linking the Prudhoe Bay oil fields to thePacific seaboard, and the Capline, which runsroughly parallel with the eastern bank of theMississippi.
• Also in the US, three major US pipelinescarrying refined products: the Plantation, theColonial and the Explorer.
• In Canada, three major Canadian crude-oilpipelines: the Interprovincial, linkingEdmonton to Toronto, the Mackenzie Valleyand the Kitimat-Edmonton.
• In Eastern Europe, the Russian pipeline network,operated by Transneft, a state-owned companywith a monopoly on the pipeline transport ofcrude oil. Via its subsidiary Transnefteproduct, italso has a monopoly on the piping of refinedproducts. Crude-oil pipelines link the Urals toCentral and Eastern Europe (the Druzhbasystem), to Novorossijsk on the Black Sea and toPrimorsk on the Baltic. The Ventspils terminal inLatvia, formerly the mouth of a major pipeline, isno longer used by Transneft. In the same regionwe should also mention the EasternEurope-Russia network, linking the Siberianrefineries with Angarsk, and the Caspian
91VOLUME IV / HYDROCARBONS: ECONOMICS, POLICIES AND LEGISLATION
ANALYSIS OF COST STRUCTURE AND FUNCTIONS IN OIL TRANSPORT AND REFINING
crew, maintenance and repairs, oil and supplies,insurance and management costs
economic depreciation
DNR ($/d)(freight charge given by the spot market-minus variable costs )
margin
�
�
�
Fig. 5. DNR: the shipowner’s margin.
Petroleum Consortium (CPC) pipeline, whichlinks Kazakhstan to Novorossijsk via Russia.There are very few refined-product pipelines inthis region. Among the most significant of thistype are the Samara-Briansk-Leninvaros(Hungary) pipeline and another serving the Baltic(the Transnefteproduct system).
• In Western Europe, major crude pipelinesinclude the north-south system linking theNorth Sea ports with Germany and Belgium,and the south-north system, which links theMediterranean ports to Central Europe (SouthEuropean Pipeline, TAL and CEL). WesternEurope also has some major refined-productpipelines, such as the Trapil system in France,the Mediterranean-Rhone pipeline, theRotterdam-Venlo-Ludwigshafen pipeline andthe Spanish network.
• In the Middle East, major crude oil pipelinesinclude the Tapline, which links Abqaiq andSidon (partially closed), the Kirkuk-Tripolipipeline (also closed), the Sumed pipeline(which enables the transport of oil from theGulf states to the Mediterranean without usingthe Suez Canal) and the Abqaiq-Yanbupipeline in Saudi Arabia. Most of the oilpipelines from Iraq and Saudi Arabia havebeen closed for political reasons, as theyrepresent obvious targets for sabotage.
The principal constraints on pipeline transportOil pipelines work in conjunction with sea
transport as one more link in the crude-oil supplychain. Relatively few pipelines directly link theplace of production to the refinery; and, as wesaw above, pipelines carrying refined productsare relatively rare except in the US, where theywere first used in about 1930. We also examinedthe comparative advantages and disadvantages ofpipeline and tanker transport above.
One important consideration here is that thenotion of ‘capacity’ in the transport ofhydrocarbons via pipelines is not a totally reliableparameter: it depends on many factors, such asthe viscosity of the product being pumped. Initialcapacity can be considerably augmented by theinstallation of secondary pumping facilities.
The key advantages of pipelines relative toother modes of oil transport (coastal shipping viasmall tankers, river navigation, railway and road)include low operating costs, direct routes andimmunity to climatic conditions. However,pipelines require heavy investment, withenormous infrastructure responsibilities for theoil companies and absolutely no flexibility of use.
So what are the principal technical andoperational constraints in pipeline transport?
In the case of crude oil, the principalconstraints are those imposed upon thetransporter by the refiner:
Preservation of the quality of the crude duringtransport. The risk of contamination, althoughlower for crude than for refined products, isnevertheless real. Crude oils of different qualitiescan become mixed during storage at the terminalprior to pumping, while the risk of contaminationis also present in the pipeline itself betweensuccessive batches of crude. This problem doesnot arise when the entire storage and pipelinesystem handles only one class of crude, which infact is often already a blend of specific quality;this is the case, for example, with the Urals Blendthat is pumped from Russia via the Druzhbapipeline.
Preservation of quantities. This requiresaccurate and reliable metering methods at theupstream terminal, the destination refinery andthe downstream terminals. Maximum admissibleloss rates are contractually established. Barringmajor incidents on the pipeline, most losses occurduring storage.
Logistical and batch-sequencing constraints.As an example of this, it takes an average of 15days for the Société du Pipeline Sud Européen(SPLSE) to pump a batch of oil from theMediterranean (Lavéra) to Karlsruhe.
Refined products are usually pumped viamulti-product pipelines of smaller diameter thanthose used for carrying crude. These pipelines arecapable of carrying practically every kind ofrefined product (including LPG under certainconditions) with the notable exception of heavyfuel oils. In the rare event that they aretransported by pipeline, heavy fuel oils are onlypumped over very short distances, usually viaspecial pipelines that are heated to a temperatureof about 90°C.
In Europe, refined-product pipelines have adiameter of 32" and pump 15 million tonnes peryear. The capacity of a pipe depends not only onits diameter but also on the viscosity of theproduct being transported and the power of thepumping stations; for example, using the sameplant, a given pipeline can pump twice as muchpetrol as liquid fuel oil.
In the more common instances where two oreven three light-refined products are transported(i.e. gasoline, kerosene/jet fuel and diesel), thedifferent products are sent by batches followingcertain procedures that regulate, for instance, the
92 ENCYCLOPAEDIA OF HYDROCARBONS
BASIC ECONOMICS OF THE HYDROCARBONS INDUSTRY
sequence in which the products are pumped.Since refined products must meet precisespecifications (density, sulphur content andwater content), precautions have to be taken toprevent contamination at interfaces.Contaminated products can either be returned tothe refinery for recycling to the requiredspecifications or mixed with a lower-gradefinished product.
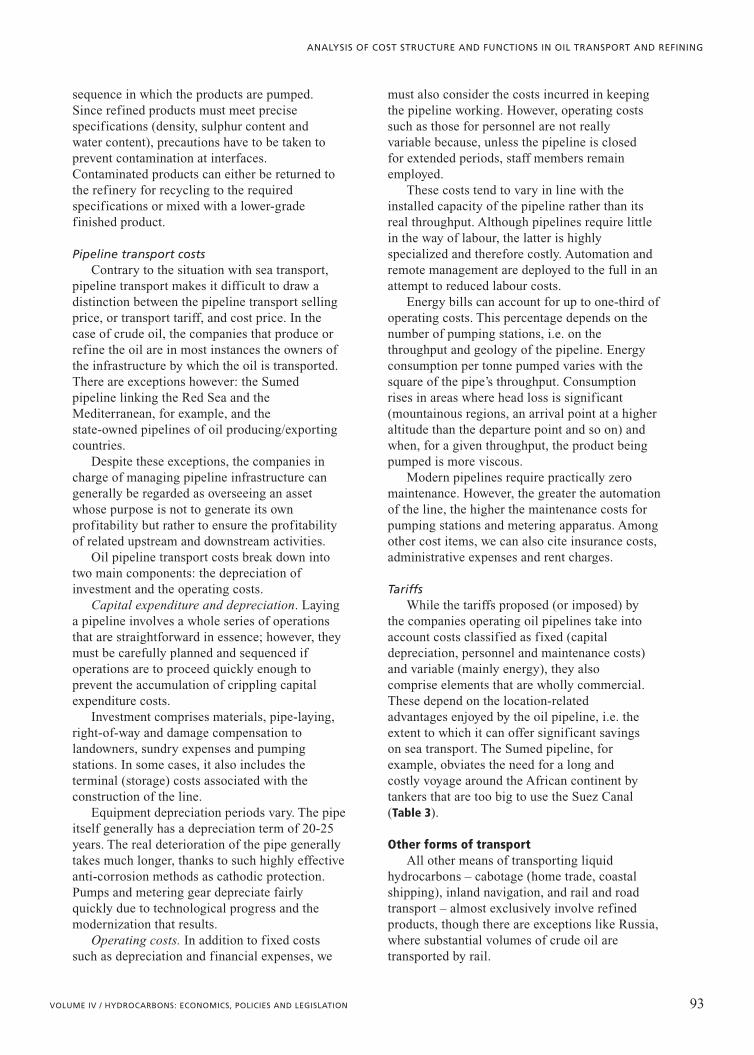
Pipeline transport costsContrary to the situation with sea transport,
pipeline transport makes it difficult to draw adistinction between the pipeline transport sellingprice, or transport tariff, and cost price. In thecase of crude oil, the companies that produce orrefine the oil are in most instances the owners ofthe infrastructure by which the oil is transported.There are exceptions however: the Sumedpipeline linking the Red Sea and theMediterranean, for example, and thestate-owned pipelines of oil producing/exportingcountries.
Despite these exceptions, the companies incharge of managing pipeline infrastructure cangenerally be regarded as overseeing an assetwhose purpose is not to generate its ownprofitability but rather to ensure the profitabilityof related upstream and downstream activities.
Oil pipeline transport costs break down intotwo main components: the depreciation ofinvestment and the operating costs.
Capital expenditure and depreciation. Layinga pipeline involves a whole series of operationsthat are straightforward in essence; however, theymust be carefully planned and sequenced ifoperations are to proceed quickly enough toprevent the accumulation of crippling capitalexpenditure costs.
Investment comprises materials, pipe-laying,right-of-way and damage compensation tolandowners, sundry expenses and pumpingstations. In some cases, it also includes theterminal (storage) costs associated with theconstruction of the line.
Equipment depreciation periods vary. The pipeitself generally has a depreciation term of 20-25years. The real deterioration of the pipe generallytakes much longer, thanks to such highly effectiveanti-corrosion methods as cathodic protection.Pumps and metering gear depreciate fairlyquickly due to technological progress and themodernization that results.
Operating costs. In addition to fixed costssuch as depreciation and financial expenses, we
must also consider the costs incurred in keepingthe pipeline working. However, operating costssuch as those for personnel are not reallyvariable because, unless the pipeline is closedfor extended periods, staff members remainemployed.
These costs tend to vary in line with theinstalled capacity of the pipeline rather than itsreal throughput. Although pipelines require littlein the way of labour, the latter is highlyspecialized and therefore costly. Automation andremote management are deployed to the full in anattempt to reduced labour costs.
Energy bills can account for up to one-third ofoperating costs. This percentage depends on thenumber of pumping stations, i.e. on thethroughput and geology of the pipeline. Energyconsumption per tonne pumped varies with thesquare of the pipe’s throughput. Consumptionrises in areas where head loss is significant(mountainous regions, an arrival point at a higheraltitude than the departure point and so on) andwhen, for a given throughput, the product beingpumped is more viscous.
Modern pipelines require practically zeromaintenance. However, the greater the automationof the line, the higher the maintenance costs forpumping stations and metering apparatus. Amongother cost items, we can also cite insurance costs,administrative expenses and rent charges.
TariffsWhile the tariffs proposed (or imposed) by
the companies operating oil pipelines take intoaccount costs classified as fixed (capitaldepreciation, personnel and maintenance costs)and variable (mainly energy), they alsocomprise elements that are wholly commercial.These depend on the location-relatedadvantages enjoyed by the oil pipeline, i.e. theextent to which it can offer significant savingson sea transport. The Sumed pipeline, forexample, obviates the need for a long andcostly voyage around the African continent bytankers that are too big to use the Suez Canal(Table 3).
Other forms of transportAll other means of transporting liquid
hydrocarbons – cabotage (home trade, coastalshipping), inland navigation, and rail and roadtransport – almost exclusively involve refinedproducts, though there are exceptions like Russia,where substantial volumes of crude oil aretransported by rail.
93VOLUME IV / HYDROCARBONS: ECONOMICS, POLICIES AND LEGISLATION
ANALYSIS OF COST STRUCTURE AND FUNCTIONS IN OIL TRANSPORT AND REFINING
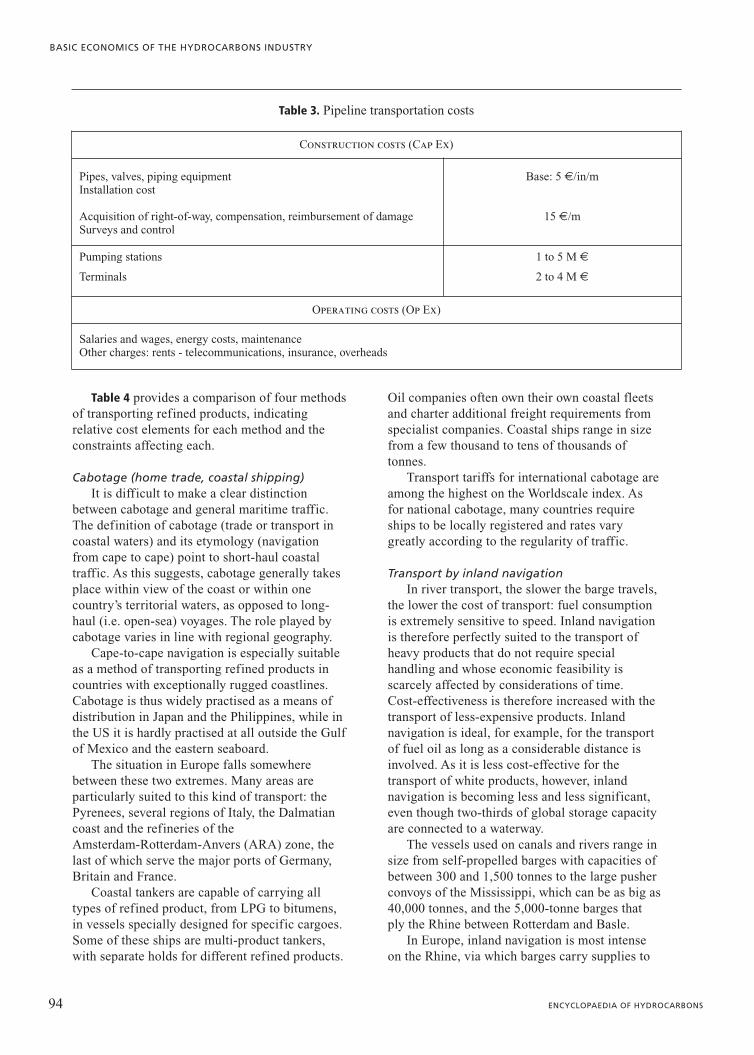
Table 4 provides a comparison of four methodsof transporting refined products, indicatingrelative cost elements for each method and theconstraints affecting each.
Cabotage (home trade, coastal shipping)It is difficult to make a clear distinction
between cabotage and general maritime traffic.The definition of cabotage (trade or transport incoastal waters) and its etymology (navigationfrom cape to cape) point to short-haul coastaltraffic. As this suggests, cabotage generally takesplace within view of the coast or within onecountry’s territorial waters, as opposed to long-haul (i.e. open-sea) voyages. The role played bycabotage varies in line with regional geography.
Cape-to-cape navigation is especially suitableas a method of transporting refined products incountries with exceptionally rugged coastlines.Cabotage is thus widely practised as a means ofdistribution in Japan and the Philippines, while inthe US it is hardly practised at all outside the Gulfof Mexico and the eastern seaboard.
The situation in Europe falls somewherebetween these two extremes. Many areas areparticularly suited to this kind of transport: thePyrenees, several regions of Italy, the Dalmatiancoast and the refineries of theAmsterdam-Rotterdam-Anvers (ARA) zone, thelast of which serve the major ports of Germany,Britain and France.
Coastal tankers are capable of carrying alltypes of refined product, from LPG to bitumens,in vessels specially designed for specific cargoes.Some of these ships are multi-product tankers,with separate holds for different refined products.
Oil companies often own their own coastal fleetsand charter additional freight requirements fromspecialist companies. Coastal ships range in sizefrom a few thousand to tens of thousands oftonnes.
Transport tariffs for international cabotage areamong the highest on the Worldscale index. Asfor national cabotage, many countries requireships to be locally registered and rates varygreatly according to the regularity of traffic.
Transport by inland navigationIn river transport, the slower the barge travels,
the lower the cost of transport: fuel consumptionis extremely sensitive to speed. Inland navigationis therefore perfectly suited to the transport ofheavy products that do not require specialhandling and whose economic feasibility isscarcely affected by considerations of time.Cost-effectiveness is therefore increased with thetransport of less-expensive products. Inlandnavigation is ideal, for example, for the transportof fuel oil as long as a considerable distance isinvolved. As it is less cost-effective for thetransport of white products, however, inlandnavigation is becoming less and less significant,even though two-thirds of global storage capacityare connected to a waterway.
The vessels used on canals and rivers range insize from self-propelled barges with capacities ofbetween 300 and 1,500 tonnes to the large pusherconvoys of the Mississippi, which can be as big as40,000 tonnes, and the 5,000-tonne barges thatply the Rhine between Rotterdam and Basle.
In Europe, inland navigation is most intenseon the Rhine, via which barges carry supplies to
94 ENCYCLOPAEDIA OF HYDROCARBONS
BASIC ECONOMICS OF THE HYDROCARBONS INDUSTRY
Table 3. Pipeline transportation costs
Construction costs (Cap Ex)
Pipes, valves, piping equipmentInstallation cost
Acquisition of right-of-way, compensation, reimbursement of damageSurveys and control
Base: 5 €/in/m
15 €/m
Pumping stations
Terminals
1 to 5 M €
2 to 4 M €
Operating costs (Op Ex)
Salaries and wages, energy costs, maintenanceOther charges: rents - telecommunications, insurance, overheads
Germany, North-eastern France and Switzerland.However, traffic on the Rhine, and therefore theprovisioning of all the regions it serves, isvulnerable to fluctuations in water levels.
Rail transportRail transport remains the main way of
supplying depots that are not connected to thesource of production either by a network ofpipelines or by sea or waterway. Although the railcompanies offer reduced tariffs, rail remains, ingeneral, a costly mode of transportation.Compared with other bulk-transport methods, it isespecially costly in Europe, but somewhat morecompetitive in Canada and Russia, where tariffsare significantly lower; in fact, a significantproportion of refined product is transported byrail in Russia.
In Europe, the longest trains can carry up to2,500 tonnes, while certain products such as LPGand lubricants can be delivered in single-wagonconsignments of between 30 and 80 m3. Pricegreatly depends on the volume to be transported,
and, once tonnage reaches significant levels,construction of a pipeline becomes feasible.
Road transportNearly all terminal transport of refined
products takes place by road, as does some bulktransport between refineries and depots. Mostheavy products (such as bitumen and fuel oil) thatcannot, except in special circumstances, betransported by pipeline, are also transported byroad. Tanker trucks are ideal for bringing smallvolumes to almost any destination, making theman extremely flexible means of transport.
Road transport also includes the supply ofretailers like service stations and fuel pumps, andthe delivery of domestic fuel to end consumersvia smaller trucks equipped with pump meters.
In the case of bulk transport, the vehicle mostoften used is a semi-articulated tanker truck witha capacity of 40 tonnes. These trucks cover anaverage of 100,000 km per year, cost over$120,000 to buy, and are usually owned byspecialist transport firms. As for terminal
95VOLUME IV / HYDROCARBONS: ECONOMICS, POLICIES AND LEGISLATION
ANALYSIS OF COST STRUCTURE AND FUNCTIONS IN OIL TRANSPORT AND REFINING
Table 4. Comparison of methods of transport
Road Rail River Pipeline
InvestmentLow by unit, high
overallModerate by unit,
high overall
High by unitif sound
cost-effectivenessis required(push boat)
Very high and madeover a short period
Infrastructure costs –Mainly borne
by StateToll duties
High, and borneentirely by company
Personnel costs Very high Fairly highHigh for
self-propelled barges,low for push boats
Low (personnel �high in skills but low
in numbers)
Maintenance costs Very highHigh except when volumes justify collective
installations and automationVery low
Return costs Empty return Empty return Return in ballast Nil
Length of route
Outward, practicallyeverywhere; natural
obstacles imposesignificant detours
Fairly dense andlimited by natural
obstacles
The most circuitousroute, where it exists
The most direct
Climactic conditions duringtransit
Very sensitive Not very sensitive Sensitive Not affected
Flexibility of use Very high Very limited Very limited Nil
transport, this is generally carried out by tankertrucks with a capacity of 20 tonnes or even less incertain regions.
2.3.2 Oil refining
Technical background
IntroductionRefining is a vital link in the oil industry. In
fact, absolutely no one consumes crude oil; weconsume refined products only, as used intransport, domestic and industrial applications,and the petrochemical sector. The refinedproducts most often consumed are gasoline,diesel and fuel oil. The fastest-growing refinedproducts in terms of consumption are jet fuel anddiesel; consumption of fuel oil is declining.Worldwide consumption of refined products,refinery fuel included, is currently in excess of3.6 billion tonnes per year, or 80 million barrelsper day. According to International EnergyAgency figures, annual consumption in 1973 wasa mere 2.75 billion tonnes.
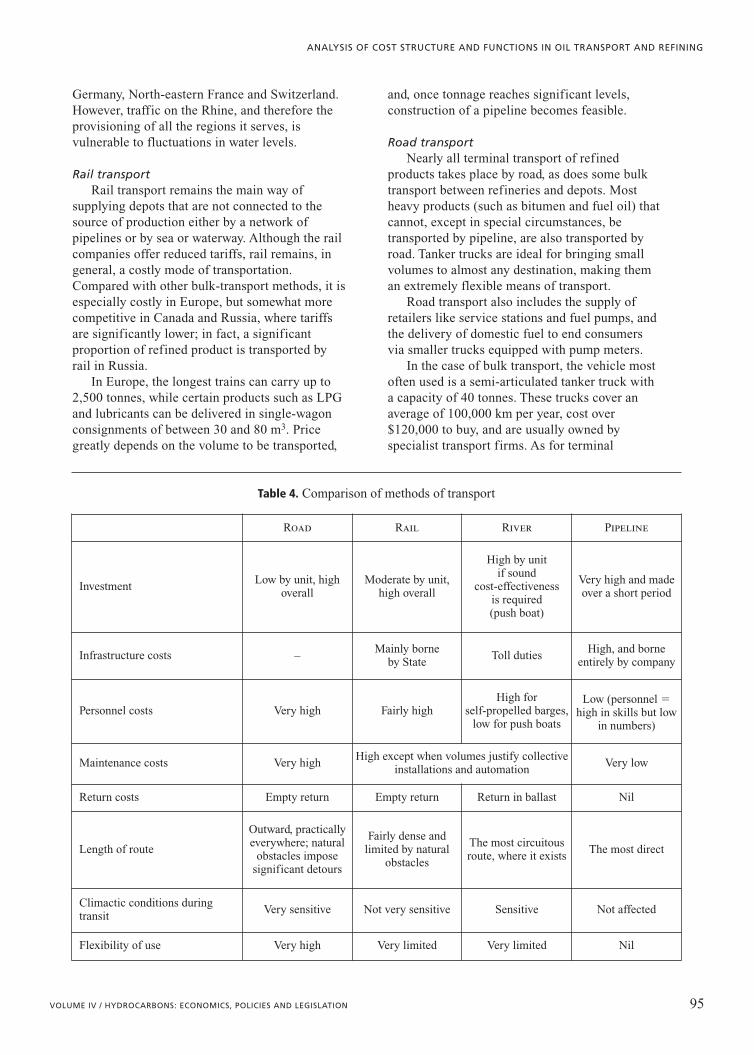
The purpose of refining is to transform thevarious kinds of crude oils into finished productsthat meet certain precise specifications (Fig. 6).
For the present purposes, we shall not examineupgrader plants, whose job is not to create finishedproducts, but rather to transform ultra-heavy crudeinto so-called synthetic crudes using conversionunits. The resulting synthetic crude is of muchhigher quality and is therefore easier to market.Venezuela has a few plants of this type.
Oil refining, i.e. the transformation of crudeinto end products, used to be a perfectlystraightforward affair: a simple distillationprocess was enough to separate out usefulfractions such as lubricants. The modernrefining industry did not really come into being
until the construction of the world’s firstdistillation unit in Boston in 1863. Its purposewas to produce lamp oil, the only petroleumproduct consumed at the time. Then the car wasinvented, sparking a rapid expansion inconsumption of petrol and diesel. At the sametime, new techniques such as continuousdistillation and thermal cracking emerged; thesewere followed by thermal reforming and then,just before the Second World War, by theintroduction of catalysis in transformationprocesses.
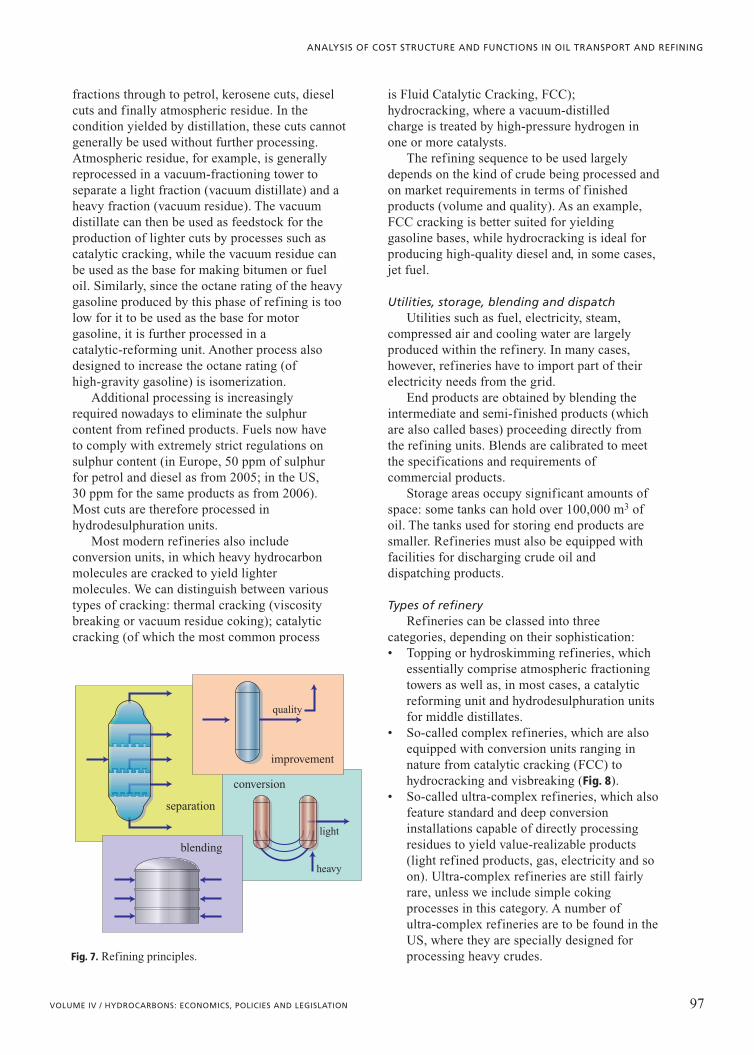
At present, the principal refining operationsfall into four categories: a) separation of crude oilinto various cuts; b) enhancement of the qualitiesof certain cuts; c) transformation of heavy cutsinto lighter cuts (conversion); d ) final preparationof finished products through blending (Fig. 7).
Refineries comprise a number of distinctparts: a) the processing plant proper, where thecrude is separated into cuts, certain cuts areenhanced and heavy cuts are converted intolighter ones; b) utility works, i.e. facilitiesproducing the energy (fuel, electricity, steam,etc.) needed for refining processes; c) tank farms;d ) reception and dispatching facilities, andblending units.
Processing facilitiesEvery crude oil on the market is unique,
depending on the deposit it comes from. The mostcommon crudes have a density of between 0.8 g/cm3, i.e. around 45°API, and 1.0 g/cm3, i.e.10°API (the API, or American Petroleum Institutedegree, is the standard unit of measurement ofcrude density). Light crudes yield higherquantities of light products (motor fuels) whileheavy crudes yield heavier fractions like heavyfuel oil.
Atmospheric distillation or topping separatesthe crude into different cuts ranging from lighter
96 ENCYCLOPAEDIA OF HYDROCARBONS
BASIC ECONOMICS OF THE HYDROCARBONS INDUSTRY
Middle East
crude oil main petroleum products
liquefied petroleum gases
gasoline
jet fuels
heavy fuel oils
bitumen
other products
naphthas, special gasoline(white spirit, aviation gasoline),kerosene, light marine diesel,special fuel oils, lube base stocks,paraffins-waxes
diesel fuel, home-heating fuel
propane, butane,LPG automotive fuel
regular, premium, unleaded
normal, low sulphur content,very low sulphur content
Saudi Arabia, Iraq,Iran, Kuwait, UAE
AfricaNigeria, Gabon, Congo,Angola, Algeria, Lybia
North Sea
other countriesCIS (ex USSR)
Venezuela, Mexico
Fig. 6. Refining target.
fractions through to petrol, kerosene cuts, dieselcuts and finally atmospheric residue. In thecondition yielded by distillation, these cuts cannotgenerally be used without further processing.Atmospheric residue, for example, is generallyreprocessed in a vacuum-fractioning tower toseparate a light fraction (vacuum distillate) and aheavy fraction (vacuum residue). The vacuumdistillate can then be used as feedstock for theproduction of lighter cuts by processes such ascatalytic cracking, while the vacuum residue canbe used as the base for making bitumen or fueloil. Similarly, since the octane rating of the heavygasoline produced by this phase of refining is toolow for it to be used as the base for motorgasoline, it is further processed in acatalytic-reforming unit. Another process alsodesigned to increase the octane rating (ofhigh-gravity gasoline) is isomerization.
Additional processing is increasinglyrequired nowadays to eliminate the sulphurcontent from refined products. Fuels now haveto comply with extremely strict regulations onsulphur content (in Europe, 50 ppm of sulphurfor petrol and diesel as from 2005; in the US, 30 ppm for the same products as from 2006).Most cuts are therefore processed inhydrodesulphuration units.
Most modern refineries also includeconversion units, in which heavy hydrocarbonmolecules are cracked to yield lightermolecules. We can distinguish between varioustypes of cracking: thermal cracking (viscositybreaking or vacuum residue coking); catalyticcracking (of which the most common process
is Fluid Catalytic Cracking, FCC);hydrocracking, where a vacuum-distilledcharge is treated by high-pressure hydrogen inone or more catalysts.
The refining sequence to be used largelydepends on the kind of crude being processed andon market requirements in terms of finishedproducts (volume and quality). As an example,FCC cracking is better suited for yieldinggasoline bases, while hydrocracking is ideal forproducing high-quality diesel and, in some cases,jet fuel.
Utilities, storage, blending and dispatchUtilities such as fuel, electricity, steam,
compressed air and cooling water are largelyproduced within the refinery. In many cases,however, refineries have to import part of theirelectricity needs from the grid.
End products are obtained by blending theintermediate and semi-finished products (whichare also called bases) proceeding directly fromthe refining units. Blends are calibrated to meetthe specifications and requirements ofcommercial products.
Storage areas occupy significant amounts ofspace: some tanks can hold over 100,000 m3 ofoil. The tanks used for storing end products aresmaller. Refineries must also be equipped withfacilities for discharging crude oil anddispatching products.
Types of refineryRefineries can be classed into three
categories, depending on their sophistication:• Topping or hydroskimming refineries, which
essentially comprise atmospheric fractioningtowers as well as, in most cases, a catalyticreforming unit and hydrodesulphuration unitsfor middle distillates.
• So-called complex refineries, which are alsoequipped with conversion units ranging innature from catalytic cracking (FCC) tohydrocracking and visbreaking (Fig. 8).
• So-called ultra-complex refineries, which alsofeature standard and deep conversioninstallations capable of directly processingresidues to yield value-realizable products(light refined products, gas, electricity and soon). Ultra-complex refineries are still fairlyrare, unless we include simple cokingprocesses in this category. A number ofultra-complex refineries are to be found in theUS, where they are specially designed forprocessing heavy crudes.
97VOLUME IV / HYDROCARBONS: ECONOMICS, POLICIES AND LEGISLATION
ANALYSIS OF COST STRUCTURE AND FUNCTIONS IN OIL TRANSPORT AND REFINING
light
heavy
conversion
separation
blending
improvement
quality
Fig. 7. Refining principles.

Economic factors
The global refining situationGlobal refining capacity, expressed in terms
of atmospheric distillation capacity, was on theorder of 4.1 billion tonnes per year, orapproximately 82 million barrels per day, in 2004.In 1950, capacity was a little over 1 billiontonnes, but from that point rose quickly to reachthe 4 billion tonne mark by 1980. The apparentstagnation in capacity between 1980 and 2004conceals the fact that capacity had in fact fallen tounder 3.6 billion tonnes in 1985 in the wake ofthe second energy crisis, only to rise again afterthe oil-price slump of 1986 (Fig. 9).
This apparent stability since 1980 in terms ofglobal capacity also conceals some considerablegeographic disparities. Roughly speaking, we cansay that North America (which remains theworld’s leading refining region) has seen itscapacity remain practically unchanged since1980, while Western Europe has lost 30% of itscapacity in the same period. Most new refinerieshave been built in the Middle East and Asia;furthermore, plans to build new refineries areessentially focused on Asia.
In total, there are just over 700 refineriesworldwide. Average refinery capacity is thus onthe order of 6 million tonnes per year or 120,000barrels per day. However, the largest refineriescan handle over 25 million tonnes per year(500,000 barrels per day) while many smallrefineries with capacity of 1 million tonnes peryear are to be found in oil-producing countriessuch as the US and in countries whereconsumption is low.
This expansion of refining capacity has beenaccompanied by an even faster proliferation ofsecondary processing capacity (reforming,cracking etc.) in attempts to augment yields andimprove the quality of light and mediumdistillates (fuels) while simultaneously reducingthe production of heavy fuels, for which demandhas collapsed.
The real challenge facing the refining industryis how to keep up with changes in the market.While the decline in demand for heavy fuel oiland the solid growth in consumption of fuels arehardly new phenomena, some recentdevelopments in requirements on product qualityhave had a major impact on refining:• The elimination of lead from petrol: the
octane index is a key indicator of petrolquality as it indicates the fuel’s resistance toself-ignition, the phenomenon that causesknocking in spark-ignition engines. The higherthe octane index, the higher the resistance toknocking. To improve the octane index, leadcompounds were traditionally added to petrol.The prohibition of lead has brought about theemergence of new processing techniquesdesigned to produce high-octane petrols thatare lead-free.
• Reduction in the sulphur content of fuels(gasolines and middle distillates), achievedthrough the construction of desulphurationunits and the conversion of existing plants.
• The introduction of new restrictions on fuelquality, such as limitations on olefin andaromatics content in fuels, which has ledrefiners to rethink conventional productionprocesses.
98 ENCYCLOPAEDIA OF HYDROCARBONS
BASIC ECONOMICS OF THE HYDROCARBONS INDUSTRY
reformer
light naphtha
1 Mt/yheavynaphtha
gas oil
vacuum distillate
atmospheric residue3,5 Mt/y
vacuum residue1,5 Mt/y
1,8 Mt/y
8 M
t/y
1,8 Mt/y
visbreaking
HD
S
gas
C3 LPGC4 LPG
gasoline
naphtha
jet fuel
diesel oil/heating oil
fuel oil(20%)
catalyticcracker
atm
osph
eric
dis
till
atio
n
LC
O
HC
O
iC4 ga
soli
ne
vacu
umdi
stil
lati
on
Fig. 8. Refining scheme-conversion.HCO�Heavy Cycle Oil;LCO�Light Cycle Oil.

Refining costs
InvestmentThe construction of a new refinery is a long,
costly and complex operation. Some three yearselapse between the decision to build the refineryand its opening; this period is preceded bymonths, if not years, of preliminary research. Thescale of investment involved in the constructionof a refinery depends mainly on its size, itscomplexity and its location.
Size and complexity. In general, it isestimated that a refinery built in Europe with acapacity of 160,000 barrels per day (8 milliontonnes per year), equipped with catalyticcracking, visbreaking and gasoline units, wouldcurrently cost some $1.5 billion. This cost couldrise considerably with the addition ofexceptionally restrictive anti-pollutionregulations that address not only the immediateenvirons of the refinery (waste) but also thequality of products.
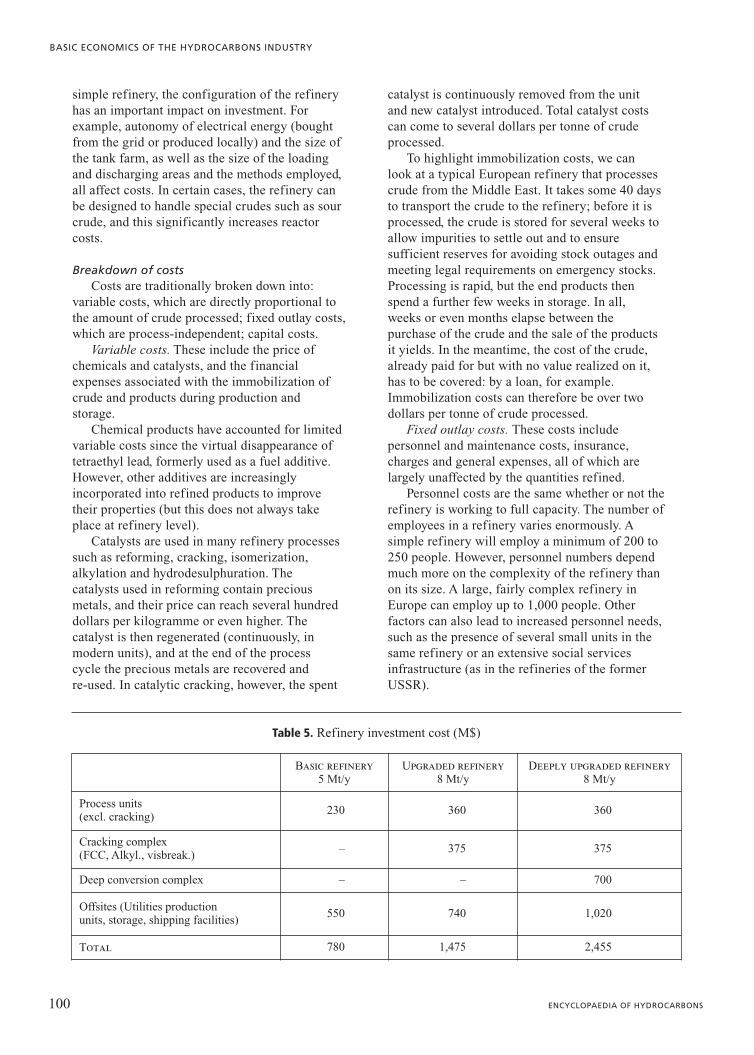
In the case of a slightly smaller (5 milliontonnes per year) simple refinery (atmosphericdistillation with catalytic reforming andhydrodesulfuration plants), the cost would be lessthan half of the figure for the larger refineryabove. Conversely, a refinery equipped with adeep conversion unit, such as fluid coking withcoke gasification or residue hydrocracking, wouldcost at least a billion dollars more than a refineryequipped with a conventional (e.g. FCC)conversion plant (Table 5).
Complexities notwithstanding, size generatessome significant economies of scale: if we doublethe charge processed by a reactor, the quantity ofsteel necessary for the construction of this reactor(and its cost) increases roughly by only two-thirds(in fact, the quantity of steel needed isproportional to the surface area of the reactor,which increases with the square of thedimensions; volume increases with the cube ofthe dimensions). These economies are confined,however, by the limitations on the size of certainunits. The maximum capacity of an atmosphericdistillation unit will, for example, be some 12million tonnes per year, so refineries with largercapacities will therefore have two atmosphericdistillation columns.
Location. Equipment transport and assemblycosts are significant factors in total constructioncosts. A refinery that is built at a great distancefrom the factories that produce its principalcomponents (columns, reactors etc.) willtherefore be more expensive than an identicalrefinery built near its equipment suppliers (whichis the case in the leading industrialized countries).Shortages of qualified local labour mean thatexternal technicians have to be sent in, and thistoo has a significant impact on costs. Finally,severe climactic conditions (as in Siberia and thefar north of North America) can also add toequipment costs.
Other factors. Since off-sites (utilities,storage, loading and discharging areas) canaccount for over half the investment costs of a
99VOLUME IV / HYDROCARBONS: ECONOMICS, POLICIES AND LEGISLATION
ANALYSIS OF COST STRUCTURE AND FUNCTIONS IN OIL TRANSPORT AND REFINING
North America
South andCentral America
Africa andMiddle East
1,0891,031
734 689
357335
4,068 Mt/y1980 4,102 Mt/y2004 135 Mt/yprojects
14
275
484
18
528
1,002
627
11
75
1,019
11
Asia
WesternEurope
Eastern Europeand other formerSoviet countries
capacity in Mt/y (at 01/2004)
Fig. 9. Refining capacities in 1980 and 2004and projects.
simple refinery, the configuration of the refineryhas an important impact on investment. Forexample, autonomy of electrical energy (boughtfrom the grid or produced locally) and the size ofthe tank farm, as well as the size of the loadingand discharging areas and the methods employed,all affect costs. In certain cases, the refinery canbe designed to handle special crudes such as sourcrude, and this significantly increases reactorcosts.
Breakdown of costsCosts are traditionally broken down into:
variable costs, which are directly proportional tothe amount of crude processed; fixed outlay costs,which are process-independent; capital costs.
Variable costs. These include the price ofchemicals and catalysts, and the financialexpenses associated with the immobilization ofcrude and products during production andstorage.
Chemical products have accounted for limitedvariable costs since the virtual disappearance oftetraethyl lead, formerly used as a fuel additive.However, other additives are increasinglyincorporated into refined products to improvetheir properties (but this does not always takeplace at refinery level).
Catalysts are used in many refinery processessuch as reforming, cracking, isomerization,alkylation and hydrodesulphuration. Thecatalysts used in reforming contain preciousmetals, and their price can reach several hundreddollars per kilogramme or even higher. Thecatalyst is then regenerated (continuously, inmodern units), and at the end of the processcycle the precious metals are recovered andre-used. In catalytic cracking, however, the spent
catalyst is continuously removed from the unitand new catalyst introduced. Total catalyst costscan come to several dollars per tonne of crudeprocessed.
To highlight immobilization costs, we canlook at a typical European refinery that processescrude from the Middle East. It takes some 40 daysto transport the crude to the refinery; before it isprocessed, the crude is stored for several weeks toallow impurities to settle out and to ensuresufficient reserves for avoiding stock outages andmeeting legal requirements on emergency stocks.Processing is rapid, but the end products thenspend a further few weeks in storage. In all,weeks or even months elapse between thepurchase of the crude and the sale of the productsit yields. In the meantime, the cost of the crude,already paid for but with no value realized on it,has to be covered: by a loan, for example.Immobilization costs can therefore be over twodollars per tonne of crude processed.
Fixed outlay costs. These costs includepersonnel and maintenance costs, insurance,charges and general expenses, all of which arelargely unaffected by the quantities refined.
Personnel costs are the same whether or not therefinery is working to full capacity. The number ofemployees in a refinery varies enormously. Asimple refinery will employ a minimum of 200 to250 people. However, personnel numbers dependmuch more on the complexity of the refinery thanon its size. A large, fairly complex refinery inEurope can employ up to 1,000 people. Otherfactors can also lead to increased personnel needs,such as the presence of several small units in thesame refinery or an extensive social servicesinfrastructure (as in the refineries of the formerUSSR).
100 ENCYCLOPAEDIA OF HYDROCARBONS
BASIC ECONOMICS OF THE HYDROCARBONS INDUSTRY
Table 5. Refinery investment cost (M$)
Basic refinery5 Mt/y
Upgraded refinery8 Mt/y
Deeply upgraded refinery8 Mt/y
Process units(excl. cracking)
230 360 360
Cracking complex(FCC, Alkyl., visbreak.)
– 375 375
Deep conversion complex – – 700
Offsites (Utilities production units, storage, shipping facilities)
550 740 1,020
Total 780 1,475 2,455
Maintenance costs are more or lessproportional to initial investment and canrepresent between 3 and 4% of investmentannually.
General expenses include charges, insuranceand miscellaneous operating expenses.
Capital costs (recovery and returns). Capital,whether the initial investment cost of a newrefinery, the costs of revamping an existing one orof constructing a new plant in an existingrefinery, has to be recouped. It also has toproduce revenue. If an investment is financedentirely by loan, the corresponding capital costsinclude yearly repayments and interest. If theinvestment is fully self-financed, the refiner hasto recover its capital and generate revenue.
To return to the example of the refinery withan annual capacity of 8 million tonnes andcosting 1,5 billion dollars, imagine that thecapital investment is financed entirely by loanwith a repayment period of 10 years and aninterest rate of 8%: the average annual cost willbe about 200 million dollars for the first 10 yearsof the refinery’s life, then nil in subsequent years.This figure breaks down as follows: capital �interest � (with the refinery working to fullcapacity) a charge of $25 per tonne of crudeprocessed.
Total cost and attendant factors. Refiningcosts depend, as we have seen, on a great manyfactors, and this makes it difficult to give accuratecost estimates. Fixed costs can represent up to80% of the total cost of processing every tonne ofcrude. Of these fixed costs, capital charges areparticularly significant. This means global costscan vary greatly depending on whether or not theinstallation has reached payback point.
If we take the case of the new refineryequipped with a conventional conversion plant asdescribed earlier, total costs per tonne of crudeprocessed are on the order of $35 or more – oncondition, that is, that it is working to its fullannual capacity of 8 million tonnes. Costs pertonne, of course, increase significantly if therefinery is working well under capacity.
If, on the other hand, we take the example of arefinery whose investment has been largelyrecouped (which is the case with most refineriesin operation in the principal refining regions),costs are much lower, even as low as $15 pertonne. But these refiners too are subject toexpenses resulting from investment in necessarymodernizations, even if only to improve thequality of their products or reduce theenvironmental impact of the refinery.
Expressed in terms of tonnes or barrels ofcrude processed, these costs are comparable to therefining margins obtained by the operators(margins that fluctuate with market conditions).
Other factors, aside from capital costs, play amore or less-significant role; the foremost ofthese is capacity utilization rate. In a refineryworking at 66% of its capacity, unit-fixed costs ofprocessing are 50% higher than for a refineryworking at 100%. In theory, therefore, it is in therefiner’s interest to work at the highest possiblecapacity. Practices may differ in cases whereexcess output in a given refining region can floodthe market and therefore reduce the marginsachieved; in this situation, it may be more in therefiner’s interest to reduce its capacity utilizationrate, at least temporarily.
As we saw, according to the law of economiesof scale, the larger the refinery the smaller theunit investment and, consequently, the lower thecapital costs. Furthermore, for a given operatingcapacity rate, the larger the refinery is, the lowerthe unit processing costs, minus capital. The sizeof the refinery has very little bearing onpersonnel costs and general expenses, andmaintenance costs rise at a rate far slower thanincreases in size; hence the notion of a minimumcost-effective threshold, which is on the order of5 million tonnes per year (100,000 barrels per day)for atmospheric distillation. At present, except insome very special cases, no smaller refineriesexist.
The complexity and the location of therefinery influence not only its capital costs butalso costs relating to labour, maintenance andother issues. As we shall see in the next section,complex refineries are capable of obtaininghigher margins than simple refineries, whichenables them to cover higher refining costs.
Refining margins
DefinitionsThe (gross) refining margin for each tonne of
crude processed is the difference between theex-works value of the products obtained and thecost of the crude entering the refinery; the valuerealization of the products is calculated bymultiplying their price by their respective yields,which vary from one refinery to another.
The net margin is equal to the gross marginminus variable costs, which include chemicalproducts, catalysts and carrying charges related tothe immobilization, especially the storage, ofcrude and products.
101VOLUME IV / HYDROCARBONS: ECONOMICS, POLICIES AND LEGISLATION
ANALYSIS OF COST STRUCTURE AND FUNCTIONS IN OIL TRANSPORT AND REFINING

To reach break-even point, gross margin mustcover total processing costs; to put it another way,net margin must cover fixed costs, i.e. all outlaycosts and capital costs. The result is thus equal tonet margin minus fixed costs.
We should note that the value realized onproducts takes into account the net (i.e. sold)output of the refinery, that is, after deduction ofinternal consumption of refinery gas and fuel oilfor the utilities. This consumption is notinsignificant: in a refinery equipped with aconventional conversion plant, it represents some5-6% of the crude processed. For the presentpurposes, although it is classified as a variablecost, we shall not include this consumption inprocessing costs as compared against margins.
Typical margins for typical refineries, knownas margin indicators, are published by oilcompanies and trade journals. In Europe, marginindicators typically refer to an imaginary refinerylocated in Rotterdam and operating in a highlycompetitive environment.
It is also possible to calculate a per-unitmargin, equal to the difference between the valueof the products yielded by the unit and the valueof the feedstock. Unlike finished products,feedstock and intermediate products do not yethave any market value. We can however evaluatethe prices of these feedstocks and intermediaryproducts on the basis of their potential uses; to doso, we use an opportunity cost, i.e. the price thatthe feedstock or product would command if put toan alternative use.
Per-unit margins are of great interest torefiners as they indicate which units areprofitable, which have to work at maximumcapacity and which should work at a slower rate.These economic imperatives are frequentlyunworkable owing to technical constraints,however.
Factors that influence marginsThe gross margin obtained by a refinery
essentially depends on its degree of complexity. Arefinery equipped with cracking units forhigh-octane gasoline bases produces lighterproducts (fuels) that meet extremely strictspecifications and have a higher market value.
Furthermore, a sophisticated refinery canmore readily process heavy or sulphur-richcrudes, putting its conversion plant to maximumuse. These crudes offer price differentials that areoften substantial in relation to lighter, low-sulphurcrudes, and with higher oil prices, pricedifferentials widen further.
A better margin does not necessarily meangreater profitability, as the costs for a complexrefinery are higher than those for a simplerefinery. In reality, the margins obtained aresometimes considerably higher than the publishedmargins. There are a number of reasons for this.The published margins refer to the principalproducts only (such as motor fuels and fuel oil)but not to specialist products (oils, bitumens,LPG, petrochemicals and so on), which are oftena more lucrative activity. For example, stock oils,which are obtained via increasingly complexrefining processes, and even in some casesfinished oils, generally offer attractive returns.Some refineries play this situation to theiradvantage by producing for niche markets.
Similarly, a refinery that is part of apetrochemical complex is better positioned torealize value on certain cuts (naphtha, etc.) andbenefit from lower raw-material rates.
More generally, prices (even prices of themajor products) are often higher than thoseapplied in margin-indicator calculations where therefinery has a favourable geographic location: arefinery located inland, and moreover in anoil-importing region, will sell its products atprices higher than those given by the internationalindices (Rotterdam, US Gulf, Singapore, etc.).
Changes in marginsUntil the mid-1970s, margins had remained at
levels that were broadly satisfactory for theindustry. Increasing consumption of refinedproducts ensured margins that were capable ofcovering long-run marginal costs, including therecovery of invested capital and the returnsgenerated. The principal concern of the oilcompanies (and of many governments) was howto satisfy demand. In the larger Europeancountries, this meant building one new refinery,or installing the equivalent new capacity, everyyear.
Over the decade as a whole, prices for atypical refinery remained at an average of $2 perbarrel. Taking into account monetary erosion, thisfigure would be about $7 per barrel in today’smoney.
At the turn of the decade, though, the situationchanged drastically and margins fell right acrossthe board. Increases in crude prices in 1973 (as aresult of the Yom Kippur war) and in 1979-80(with the Iranian revolution) caused consumptionto level out and then to decrease. The enormoussurpluses of fuel oil caused by a decline indemand and the lack of conversion capacity had
102 ENCYCLOPAEDIA OF HYDROCARBONS
BASIC ECONOMICS OF THE HYDROCARBONS INDUSTRY

the effect of widening the gap between fuel-oilprices, which were already very low, and those oflight products.
At the same time, refining capacity began tofar outstrip supply, especially in Europe and theUS. This overcapacity had two consequences:since marginal processing costs per barrel werevery low, more and more refiners began toprocess more crude, and therefore to add to thesurplus of products (a short-term gain with long-term consequences). The ultimate result was a fallin margins.
As total refinery costs had to be spread acrossquantities of products far in excess of the optimalvolumes owing to overcapacity, unit costs grewsignificantly.
This ‘scissor effect’, in conjunction withstagnation in consumption in the 1980-85 period,made itself felt in the form of low profitability,which forced refiners to reduce their capacity. Inthe US, this reduction occurred rapidly and to arelatively limited extent; however, with therestructuring of the refining industry, manysmaller, independent refineries closed down. InEurope it came later but with far more drasticeffect: of 150 refineries, some 50 had to closedown. Also, many of the refineries that survivedsaw their distillation capacity slashed as a resultof the closure of older plants; there was even, insome cases, the conversion of distillation plantsinto visbreaking units. In Japan, restructuring wasmore limited in scope as the country was a majorimporter of products (primarily from Singaporeand the Persian Gulf) and had no excess capacityproblems.
This drive to reduce capacity came to an endaround 1985, at the time of the oil crisis (OPECproduction quota policy and crude oil pricesbased on netback agreements). The sharp dropin crude oil prices that resulted from this policyrelaunched product consumption, which wasalso stimulated by new demand from emergingeconomies. The fall in the value of the dollar inthe same period was another contributingfactor.
The situation by this time was the reverse ofthe 1970s crisis. Margins increased until the endof the 1980s, reaching levels that, for the firsttime in a decade, were entirely satisfactory tooperators.
Margins remained moderate throughout the1990s at no more than a few dollars per barrel –far lower than total costs for a new refinery.There were a number of reasons for this: on theone hand, world consumption of refined
products taken as a whole was growing veryslowly (1-2% per year) during this period; on theother hand, refinery capacity-utilization rates,always a key factor for margin trends, were low,although they were improving towards the endof the decade.
While capacity was significantly reduced inmost regions (with the notable exception of theformer USSR, which on the very eve of itsdemise and the ensuing collapse in demandfound itself with a gigantic overcapacityproblem that, even today, has not yet been fullyabsorbed), the mismatch between the supplystructure of the refineries and the demandstructure of the economy persisted for years. Intheir efforts to reduce fuel oil surplusesassociated with the lack of conversion capacity,some refiners found themselves forced to cutback on their output.
Here, it is worth noting an aggravating factorin times of overcapacity: real refining capacity isoften higher than the published or stated capacity.There are several reasons for this:• Some indicators underestimate real capacity,
and some countries only take into accountdistillation capacity necessary for supplyingcracking units. In the former USSR, the realcapacity of most of these units was well abovethe design capacity.
• Mothballed capacity can be quicklyreactivated.
• Major progress has been made in addressingstoppage times for maintenance work.Intervals between stoppages have stretchedfrom every two or three years to every fiveyears; this means a refinery can now operatemore than 95% of the time.
• The phenomenon known as ‘capacity creep’:the tendency to step up capacity from initialdesign capacity caused by limited investmentsby refiners in certain units(‘de-bottlenecking’) that have not yet beenfactored into estimates.So far this decade, the situation has changed
from one year to another: the significant rise inmargins in 2000 was followed by a decrease in2001, which became more accentuated in 2002, tobe followed by a net improvement with highmargins since 2003.
The reason for this rise in margins is thesignificant increase in world demand, drivenmainly by the US and by such emergingeconomies as China. This rise in demand is alsothe cause of the extremely highcapacity-utilization rate of refineries in many
103VOLUME IV / HYDROCARBONS: ECONOMICS, POLICIES AND LEGISLATION
ANALYSIS OF COST STRUCTURE AND FUNCTIONS IN OIL TRANSPORT AND REFINING
regions. It is no longer any exaggeration tospeak of saturation in the refining sector,especially in conversion units, with the UnitedStates worst affected. Worldwide refiningcapacity, not including the persistentovercapacity in the former USSR (which iscurrently on the order of 3 million barrels perday), can be estimated at a little less than 81million barrels per day. According to theInternational Energy Agency, global productionof crude oil and liquid natural gas reached asimilar level in 2004, at slightly over 81 millionbarrels per day (a uneasy equilibrium that is theperfect illustration of the tension that gripstoday’s oil market).
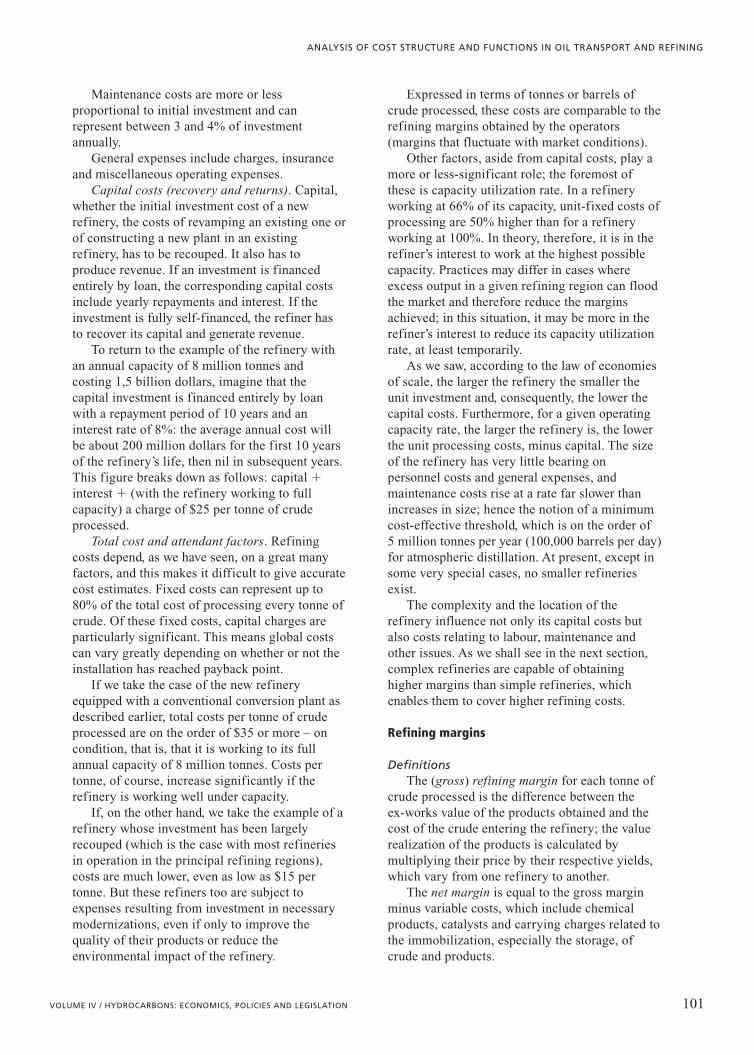
Moreover, major oil consumers such as the USand Europe (Figs. 10 and 11) are becomingincreasingly dependent on imports for supplyingtheir oil-product demands (Japan has always beena major importer).
Margins according to regionMargins vary greatly from one region to
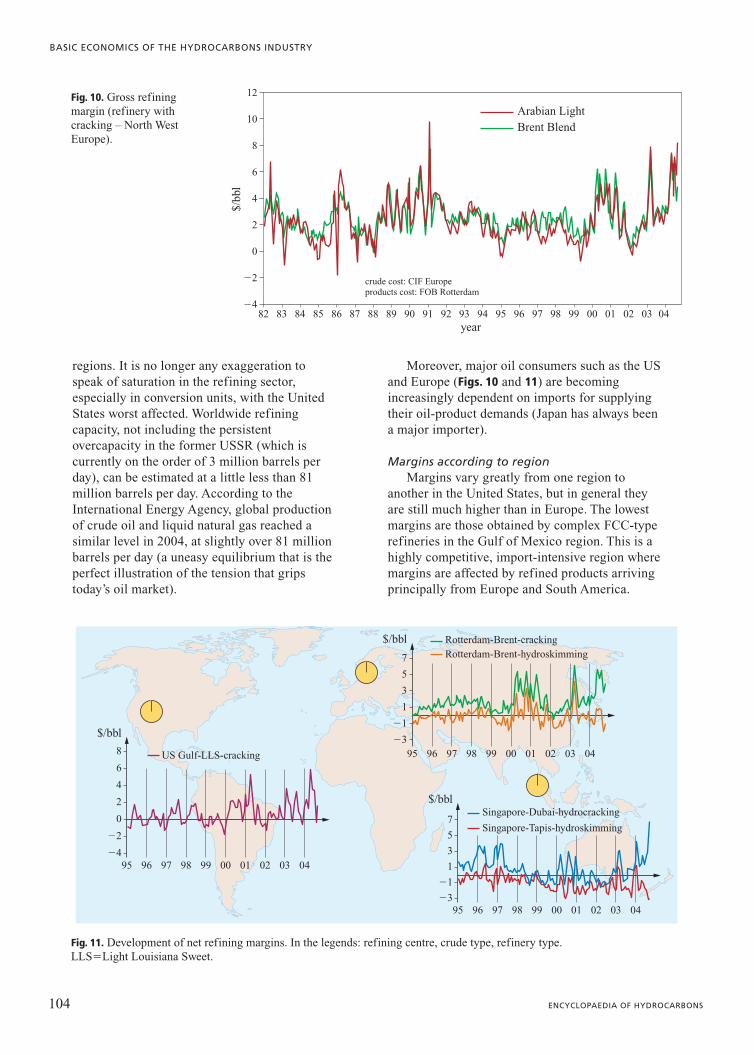
another in the United States, but in general theyare still much higher than in Europe. The lowestmargins are those obtained by complex FCC-typerefineries in the Gulf of Mexico region. This is ahighly competitive, import-intensive region wheremargins are affected by refined products arrivingprincipally from Europe and South America.
104 ENCYCLOPAEDIA OF HYDROCARBONS
BASIC ECONOMICS OF THE HYDROCARBONS INDUSTRY
$/bb
l
�4
�2
0
2
4
6
8
10Arabian Light
crude cost: CIF Europeproducts cost: FOB Rotterdam
Brent Blend
12
year82 83 84 85 86 87 88 89 90 91 92 93 94 95 96 97 98 99 00 01 02 03 04
Fig. 10. Gross refining margin (refinery withcracking – North WestEurope).
�3
�1
1
3
5
7
$/bbl
Singapore-Tapis-hydroskimming
Singapore-Dubai-hydrocracking
95 96 97 98 99 00 01 02 03 04
�4
�2
0
2
4
6
8
$/bbl
US Gulf-LLS-cracking
95 96 97 98 99 00 01 02 03 04
�3
�1
1
3
5
7
$/bblRotterdam-Brent-hydroskimmingRotterdam-Brent-cracking
95 96 97 98 99 00 01 02 03 04
Fig. 11. Development of net refining margins. In the legends: refining centre, crude type, refinery type. LLS�Light Louisiana Sweet.
Margins are much higher in the Midwest and evenmore so in California, due partly to the betterbalance between supply and demand and partly tohigher prices for products. Californian motor fuelspecifications (the California Air ResourcesBoard, CARB, regulations) are more stringentthan federal requirements, and this situation isreflected in prices. In refining regions like theGulf of Mexico and California, where manyrefineries are equipped to handle heavier crudeoils, refiners can enjoy particularly high marginswhen the price differential between heavy andlight crudes widens significantly. This has beenthe case since 2003.
In Asia, the situation was favourable untilmid-1997. Margins often reached 3 or $4 perbarrel due to heavy demand and protectionistmeasures in certain markets. Serious shortages inrefining capacity made Asia a major importer,mainly from the Middle East. Margins collapsedin 1997 as a result of the economic crisis that
swept the region at this time and the simultaneousintroduction of new and significant refiningcapacity.
In Europe, the margins of a typical complexrefinery located in Rotterdam remained extremelylow throughout the 1990s (on the order of 1 or $2per barrel) but recovered early this decade.
Bibliography
Favennec J.-P. (sous la coordination de) (1998) Exploitationet gestion de la raffinerie, in: Le raffinage du pétrole,Paris, Technip, 1994-1999, 5v.; v.V.
Masseron J. (1991) L’économie des hydrocarbures, Paris,Technip.
Olivier AppertJean-Pierre Favennec
Centre for Economics and ManagementIFP School
Rueil-Malmaison, France
105VOLUME IV / HYDROCARBONS: ECONOMICS, POLICIES AND LEGISLATION
ANALYSIS OF COST STRUCTURE AND FUNCTIONS IN OIL TRANSPORT AND REFINING