Embed Size (px)
Citation preview
therefore when using sedation to concentrate on the adequacy of sedation and analgesia and also to ensure the patient is getting suffi cient REM sleep.
Sedation of patients needs to be adequately assessed at regular intervals. To undertake this, the Richmond Agitation Sedation Scale (RASS) has been devised ( Table 2.7 ). Th e procedure for RASS assessment can be viewed in Table 2.8 .
Th e higher the score, the more agitated or restless the patient is and is in need of intervention. Positive scores require an increase in sedation and a negative score requires a reduction in sedation. Ideally, the patient should score 0 with the aid of nursing and possibly pharmacological intervention.
It is important to note that frequent objective sedation assessments are vital within the critical care setting, using a valid and reliable sedation assessment tool. Th is is vital in ensuring that the critical care nurse correctly assesses the patient’s sedation depth and titrates the sedation infusion dose to avoid severe cardiorespiratory depression.
2.3 Haemodynamic monitoring
Non-invasive Cardiovascular Haemodynamic Monitoring
Temperature Nursing and medical interventions are commonly based on temperature recordings which, if erroneously
made, can lead in extreme instances to an elevated temperature being unrecognised (Edwards 1997a). A sound understanding of temperature measurement and infl uencing factors is essential for nurses who care for patients in critical care.
When taking the temperature, it is the temperature set by the hypothalamus which is attempted to be determined. Th e pulmonary artery temperature measurement is suggested to be the most accurate way of measuring hypothalmic set point temperature. Th is form of temperature measurement is available in critical care settings and if inserted this temperature is generally recorded.
Other temperature sites which are in close proximity to the brain (axilla, oral, eardrum) and tympanic membranes also refl ect the brain’s thermal environment. Th e rectal temperature is proposed to be the most accurate tympanic membrane measure of hypothalmic temperature, and is used in critical care when the patient is unconscious. In this instance rectal temperatures are useful as long as the probe is placed correctly. As it is uncomfortable and embarrassing for conscious patients it is promptly removed when the patient regains consciousness. Th e measured rectal temperature is consistently higher than oral or axilla temperatures, a diff erence usually in the region of 0.3–1°C.
Th e axilla temperature is more convenient, but is generally not commonly used. Th is is because the axilla temperature is considered to be a skin temperature and not adequate as an indicator of core temperature. However, peripheral skin temperatures are used for determining vasoconstriction or vasodilatation to help assess the adult patient’s circulation status.
Patient assessment and investigationsHaemodynamic monitoring
117
08_F10417_Ch02.indd 11708_F10417_Ch02.indd 117 6/11/2009 4:47:07 PM6/11/2009 4:47:07 PM
Th e sublingual route is rarely used as patients are intubated orally or nasally and as such are unable to comply with this type of measurement. Th e electronic thermometer is becoming increasingly popular to replace the traditional mercury-fi lled device. In addition, single-use chemical thermometers are also available, which work by using a chemical that changes colour with increasing temperature.
A tympanic membrane closer to the brain is the ear, a temperature site that is becoming increasing popular in critical care. It uses tympanic membrane thermometry and is known as the infrared light refl ectance thermometer. It detects the temperature within the eardrum. Th is site of measurement has clear advantages: the close proximity of the measurement site to the hypothalamus, convenience, comfort, rapidity and acceptance by the patient. It registers in a matter of seconds with little inconvenience and no discomfort to the patient. Inaccurate readings usually occur due to inconsistent measurement techniques by clinicians. A temperature is recorded to determine if it is normal, high or low. It is often assumed that, when it is high, the person has an infection, but this is not always the case.
(Edwards 2003a). Th is will be refl ected in the peripheral skin temperature, as it gives a good indication of the presence and severity of a circulatory defect. Th e toe temperature gradient provides a valuable, inexpensive and non-invasive monitor of tissue perfusion.
Skin temperature can be used to determine the severity of shock: ■ During hypovolaemia circulation
to the major organs and central temperature needs to be maintained.
■ Under ANS control improves the circulation through:
● Baroreceptor activity – vasoconstriction
● Noradrenaline – receptors causes further vasoconstriction .
Th e end result is: ■ heat conservation ■ cool extremities that feel cool to touch ■ an increase in BP ■ improved circulation to the body’s
major organs.
Pulse Th e rhythmic contraction of the left ventricle of the heart results in a transmission of a pressure impulse through the arteries. Th is pulse is customarily palpated at the radial artery in the wrist. Th e important factors to consider in relation to the radial pulse are: ■ Rate ■ Rhythm ■ Pressure (volume) ■ Defi cits with apex rate . Th e pulse rate is an important component of cardiac output. Fluctuations of pulse rate in the well individual normally occur together with fl uctuations in stroke volume
Patient assessment and investigationsHaemodynamic monitoring
118
Skin/toe temperature When patient ’ s circulation is impaired there are changes to the peripheral circulation to the body’s extremities
! Many standard thermometers do not record temperatures below 35°C, so for an accurate meaurement of hypothermia a low-reading thermometer is necessary
08_F10417_Ch02.indd 11808_F10417_Ch02.indd 118 6/11/2009 4:47:07 PM6/11/2009 4:47:07 PM
to maintain optimum cardiac output for the activity being performed, for example, rest or exercise. In the resting adult, the pulse rate would normally be about 70 beats per minute. A rate greater than 100 beats per minute is termed a tachycardia, and a rate less than 60 beats per minute is termed a bradycardia.
If an altered pulse does not produce signs of haemodynamic changes it is not necessary to treat it, but if the patient does show such signs, e.g. volume depletion, immediate treatment is indicated. Th is may include drug or intravenous infusion therapy or non-pharmacological measures can be used, such as the Valsalva manoeuvre or the physician may perform carotid sinus massage.
Th e rhythm of the pulse may vary normally with respiration, especially in young adults, so that the pulse is irregular, speeding up at the peak of inspiration and slowing down with expiration; this is termed sinus arrhythmia. An irregular pulse is commonly categorized into the following rhythms: ■ Regularly irregular ■ Irregularly irregular . A regularly irregular pulse is most likely to be caused by ectopic beats (a beat originating from a site other than the sino-atrial node) which occur prematurely. If they persist in an acutely ill person, the medical staff will require notifi cation, as they can be indicative of increased cardiac irritability. Th is may be due to ischaemia or drugs (such as digoxin), increased sympathetic activity as a result of stress (for example hypoxia), or they may be related to potassium imbalance, all of which require further investigation. An irregularly irregular pulse usually indicates atrial fi brillation where atrial
behaviour is chaotic and disorganized and the transmission of impulses to the ventricles is irregular.
Th e importance of using the pulse as an early reliable indicator of physiological change is often overlooked and a greater signifi cance put on the blood pressure (BP). Yet, the pulse rate is less invasive and less time-consuming and the pulse is measured more accurately.
Pulse pressure Th is is a wave of pressure caused by a sequence of distension and elastic recoil in the wall of the aorta, which forces blood rapidly down the systemic arterial system. It determines the strength of force of the pulse and it can be defi ned as the diff erence between the systolic and diastolic blood pressures.
When the pulse pressure is low, the strength of the pulse may be feeble and thready, e.g. in hypovolaemia. When the pulse pressure is high, the pulse strength may be bounding and the person experiencing this may feel palpitations or a pounding heart: ■ increased by increased stroke volume
(SV) during exertion ■ increased by arteriosclerosis (loss of
elasticity). Th e pulse defi cit is the diff erence between the heart rate counted at the apex of the heart using a stethoscope and the pulse rate counted simultaneously at the wrist. For the majority of patients the heart rate and pulse rate will be the same, but a defi cit will occur in: ■ atrial fi brillation ■ multiple ectopic beats.
Peripheral pulses Th ere are many pulses in the body where an artery surfaces over a bony
Patient assessment and investigationsHaemodynamic monitoring
119
08_F10417_Ch02.indd 11908_F10417_Ch02.indd 119 6/11/2009 4:47:07 PM6/11/2009 4:47:07 PM
protrusion. Th e main pulses are: apical; radial; carotid; femoral, brachial; aortic; popliteal; dorsalis pedis. Th e femoral and carotid pulses are important when establishing the adequacy of cardiac output, for example in someone who has suddenly lost consciousness due to possible cardiac arrest. Th e brachial pulse is used to measure blood pressure; and the pulses of the lower limbs, the popliteal pulse located behind the knee and the dorsalis pedis and posterior tibial pulses in the feet are important in determining adequacy of perfusion to the lower limbs.
By feeling these pulses a critical care nurse can determine if a pulse is present, absent, strong and equal, faint and equal, any weakness or a bounding feeling as if there is a great pressure within the artery, whether it is fast or slow or irregular. Th ese will all give the nurse indications as to whether perfusion is inadequate or over-supplied, each giving the nurse clues to the overall circulation of each individual area of the body.
Patient assessment and investigationsHaemodynamic monitoring
120
Blood pressure (BP) By defi nition, blood pressure is the force exerted by the blood on the walls of the vessels in which it is contained (Edwards 1997b). It varies with age, gender, weight, stress level, mood, posture, physical activity. BP also varies through the heart and vascular system. It is highest and most variable in the aorta and other elastic arteries, decreasing through arterioles and capillaries. A number of factors, most signifi cantly cardiac output, peripheral resistance,
! Use a Doppler if diffi cult to palpate a limb pulse
elasticity of vessels and hormonal and chemical control mechanisms determine it. Maintenance of an adequate blood pressure is essential to permit perfusion of the brain, and the coronary arteries, and the production of urine by the kidneys.
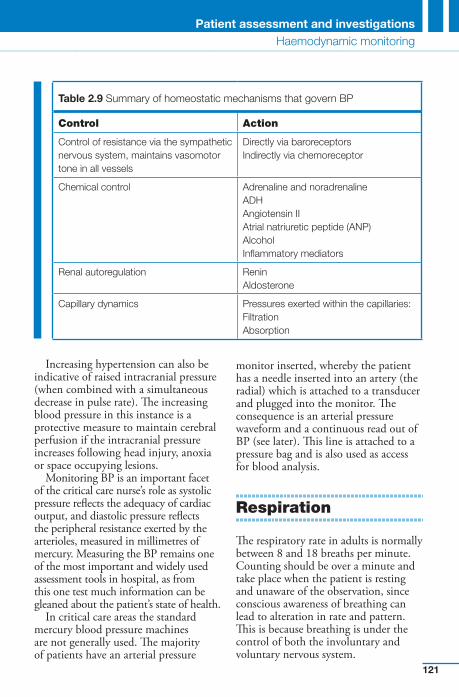
However, in the person admitted to critical care, the homeostatic mechanisms, responsible for maintaining optimum blood pressure ( Table 2.9 ) may be stretched to their limit, fail to function, or be interfered with by drugs. Th e consequences of not being able to maintain an adequate blood pressure may lead ultimately to cerebral hypoxia, cardiac failure, acute renal failure and multi-system failure. Th ese states occur as a result of prolonged hypotension (a low BP) or hypertension (a high BP).
Hypotension will only occur when all of the homeostatic mechanisms are exhausted. It may occur in hypovolaemia where there is a diminished circulatory fl uid volume. Hypovolaemic shock is the state that results from hypovolaemia and is a further decrease in the circulating fl uid volume so large that the body’s metabolic needs cannot be met.
Hypertension is consistent elevation of systemic arterial BP. Th is can be equally harmful to the patient in the acute setting, especially if it results in the breakdown of a recent surgical anastomosis or increases the work of a damaged myocardium. Th e generally agreed values for the upper limits of a normal BP is 140 systolic and 90 diastolic. Hypertension can aff ect the circulation by damaging the wall of the systemic blood vessels, stimulating the vessels to thicken and strengthen to withstand the stress, this gradually narrows the lumen of the blood vessels, and can lead to heart disease or intra-cerebral haemorrhage (stroke).
08_F10417_Ch02.indd 12008_F10417_Ch02.indd 120 6/11/2009 4:47:08 PM6/11/2009 4:47:08 PM
Increasing hypertension can also be indicative of raised intracranial pressure (when combined with a simultaneous decrease in pulse rate). Th e increasing blood pressure in this instance is a protective measure to maintain cerebral perfusion if the intracranial pressure increases following head injury, anoxia or space occupying lesions.
Monitoring BP is an important facet of the critical care nurse’s role as systolic pressure refl ects the adequacy of cardiac output, and diastolic pressure refl ects the peripheral resistance exerted by the arterioles, measured in millimetres of mercury. Measuring the BP remains one of the most important and widely used assessment tools in hospital, as from this one test much information can be gleaned about the patient’s state of health.
In critical care areas the standard mercury blood pressure machines are not generally used. Th e majority of patients have an arterial pressure
monitor inserted, whereby the patient has a needle inserted into an artery (the radial) which is attached to a transducer and plugged into the monitor. Th e consequence is an arterial pressure waveform and a continuous read out of BP (see later). Th is line is attached to a pressure bag and is also used as access for blood analysis.
Respiration
Th e respiratory rate in adults is normally between 8 and 18 breaths per minute. Counting should be over a minute and take place when the patient is resting and unaware of the observation, since conscious awareness of breathing can lead to alteration in rate and pattern. Th is is because breathing is under the control of both the involuntary and voluntary nervous system.
Table 2.9 Summary of homeostatic mechanisms that govern BP
Control Action
Control of resistance via the sympathetic nervous system, maintains vasomotor tone in all vessels
Directly via baroreceptors Indirectly via chemoreceptor
Chemical control Adrenaline and noradrenaline ADHAngiotensin II Atrial natriuretic peptide (ANP)AlcoholInfl ammatory mediators
Renal autoregulation ReninAldosterone
Capillary dynamics Pressures exerted within the capillaries:FiltrationAbsorption
Patient assessment and investigationsHaemodynamic monitoring
121
08_F10417_Ch02.indd 12108_F10417_Ch02.indd 121 6/11/2009 4:47:08 PM6/11/2009 4:47:08 PM
Control of respiration
Neural mechanisms and generation of breathing rhythm: ■ Medullary respiratory centres ● medulla oblongata
– dorsal respiratory group (DRG) inspiration
– ventral respiratory group (VRG) – inspiration and expiration
● pace setting centre normal respiratory rate and rhythm of 15 – 20 breaths per minute – eupnoea.
■ Pons respiratory centre ● infl uence and modify activity of
medullary neurons. ■ Pneumotaxic centre ● inhibitory impulses to inspiratory
centre of medulla ● fi ne tune breathing rhythm. ■ Apneustic centre ● inspiratory drive ● prolongs inspiration ● breath holding in inspiratory phase ● breathing deep and slow ● apneustic centre inhibited by
pneumotaxic centre.
Factors infl uencing the rate and depth of breathing : ■ Changes in response to body
demands. ■ Inspiratory depth is determined by
the respiratory centre. ■ Th e greater the frequency the greater
the force of respiratory muscle contraction.
■ Th e rate of respiration is determined by how long the inspiratory centre is active or how quickly it is switched off .
■ Irritating refl exes ● vagal nerve – respiratory centres
– constriction of air passages – mucus, debris, cigarette smoke,
noxious fumes
– same irritants stimulate cough in trachea, bronchi; sneeze in nasal cavity.
■ Infl ation refl ex ● Hering – Breuer refl ex ends
inspiration so expiration can begin.
■ Infl uence of higher brain centres ● hypothalamic controls
– emotions and pain can modify respiratory rate and depth
– an ↑ in temperature ↑ respiratory rate
– a ↓ in temperature ↓ respiratory rate
● cortical controls – conscious control over rate and
depth of breathing – medullary centres bypassed
– this process limited – why? ● chemical controls
– central chemoreceptors in the medulla
– peripheral chemoreceptors in vessels in the neck – mildly sensitive
● chemoreceptors – carbon dioxide:
� hypercapnia → hyper-ventilation
� hypocapnia → hypo-ventilation → apnoea
– oxygen: � found in the peripheral
chemoreceptors � arterial oxygen must reduce
substantially before oxygen levels increase ventilation
– arterial pH � eff ect on central
chemoreceptors is insignifi cant compared to the eff ect of hydrogen ions generated by elevations in carbon dioxide
� mediated through the peripheral chemoreceptors
Patient assessment and investigationsHaemodynamic monitoring
122
08_F10417_Ch02.indd 12208_F10417_Ch02.indd 122 6/11/2009 4:47:08 PM6/11/2009 4:47:08 PM
� changes in carbon dioxide and hydrogen concentration are interrelated but distinct stimuli.
Interactions of carbon dioxide, oxygen and arterial pH
■ Every cell in the body must have oxygen to live; the body’s need to rid itself of carbon dioxide is the most important stimulus for breathing in a healthy person.
■ Carbon dioxide does not act in isolation, and various chemical factors enforce or inhibit one another’s eff ects:
● rising carbon dioxide levels are the most powerful respiratory stimulant; low partial pressure of carbon dioxide levels depress respiration
● low oxygen tensions augment partial pressure of carbon dioxide eff ects; high partial pressure of oxygen levels diminish the eff ectiveness of carbon dioxide stimulation
● when arterial partial pressure of oxygen falls below 60 mmHg, it becomes the major stimulus for respiration, and ventilation is increased via refl exes initiated by the peripheral chemoreceptors. Th is may increase oxygen loading into the blood, but it also causes hypocapnia and an increase in blood pH, both of which inhibit respiration
● arterial pH does not infl uence the central chemoreceptors directly.
Urine Output
Th e process of passing urine or emptying the bladder is called micturition also known as voiding or
urination. Occurs generally when about 200 ml of urine has collected in the bladder activating stretch receptors. Th e average urinary output should be between 30 and 70 ml or more per hour. Th is should be regularly monitored by urine output, either from collecting the patient’s urine in a bedpan or urinal or by a catheter inserted into the bladder and collected in a bag, and charting it on a fl uid chart. Th e minimum urine output is 30 ml/hour; some practitioners prefer 50–70 ml/hour. Fluid balance charts measure a patient’s: ■ fl uid intake (IV, oral, EF) ■ fl uid output (urine, wound/chest drains,
vomiting, diarrhoea, insensible loss) ■ UO reduces during: ● stress to increase BP ● loss of circulating volume ● renal failure, hypoxic injury to the
kidney (ATN), retention ● heart failure (LVF, CHD, CHF, MI) ■ UO increases: ● in diabetes insipidus ● diuretic phase of renal failure ● following the administration of
diuretics ● in hypothermia (massive diuresis,
due to extreme cold).
If there are concerns about the patient’s kidney function, overall fl uid and electrolyte balance, quality of urine and circulatory status, then urinary output should be measured at regular intervals, and accurately recorded. If urine output falls below 0.5 ml/kg/hour for more than 2 hours, the medical team should be informed as fl uid administration may need to be increased or diuretics prescribed. Urine output is measured at hourly intervals and accurately recorded. Interpretation of urine output is always considered as an overall fl uid balance over a 24-hour period.
Patient assessment and investigationsHaemodynamic monitoring
123
08_F10417_Ch02.indd 12308_F10417_Ch02.indd 123 6/11/2009 4:47:08 PM6/11/2009 4:47:08 PM
Urine Testing
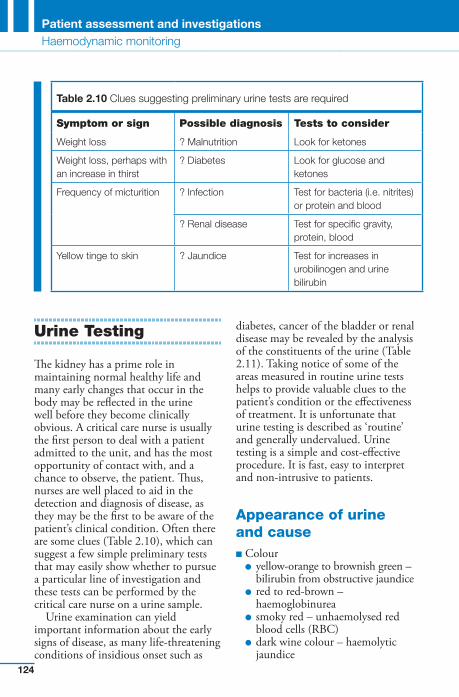
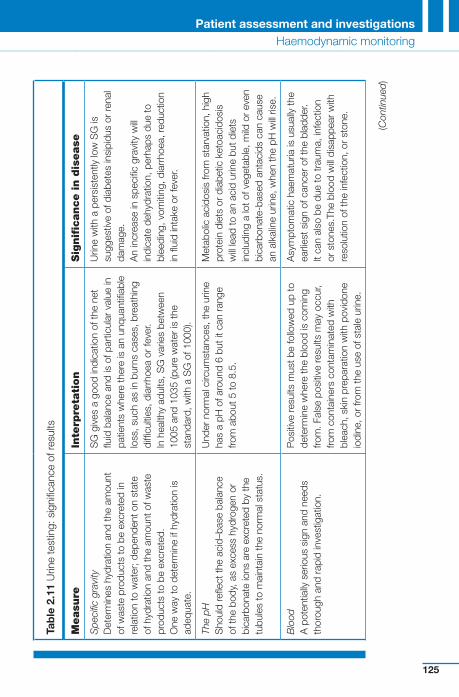
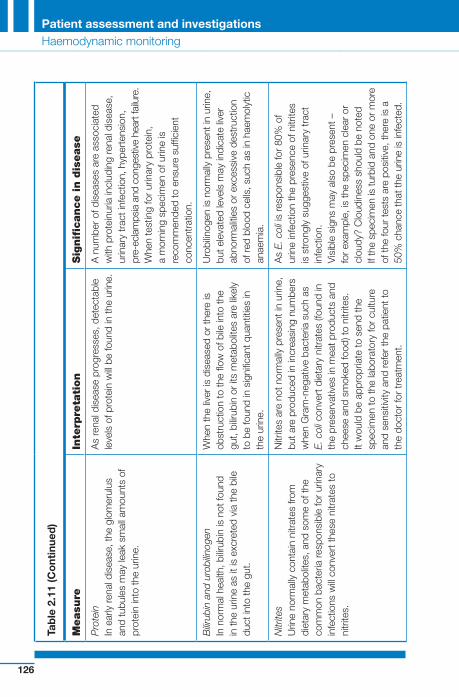
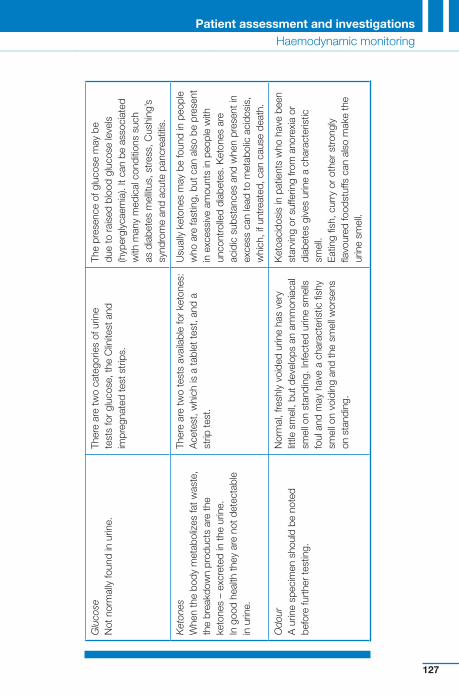
Th e kidney has a prime role in maintaining normal healthy life and many early changes that occur in the body may be refl ected in the urine well before they become clinically obvious. A critical care nurse is usually the fi rst person to deal with a patient admitted to the unit, and has the most opportunity of contact with, and a chance to observe, the patient. Th us, nurses are well placed to aid in the detection and diagnosis of disease, as they may be the fi rst to be aware of the patient’s clinical condition. Often there are some clues ( Table 2.10 ), which can suggest a few simple preliminary tests that may easily show whether to pursue a particular line of investigation and these tests can be performed by the critical care nurse on a urine sample.
Urine examination can yield important information about the early signs of disease, as many life-threatening conditions of insidious onset such as
diabetes, cancer of the bladder or renal disease may be revealed by the analysis of the constituents of the urine ( Table 2.11 ). Taking notice of some of the areas measured in routine urine tests helps to provide valuable clues to the patient’s condition or the eff ectiveness of treatment. It is unfortunate that urine testing is described as ‘ routine ’ and generally undervalued. Urine testing is a simple and cost-eff ective procedure. It is fast, easy to interpret and non-intrusive to patients.
Appearance of urine and cause ■ Colour ● yellow-orange to brownish green –
bilirubin from obstructive jaundice ● red to red-brown –
haemoglobinurea ● smoky red – unhaemolysed red
blood cells (RBC) ● dark wine colour – haemolytic
jaundice
Table 2.10 Clues suggesting preliminary urine tests are required
Symptom or sign Possible diagnosis Tests to consider
Weight loss ? Malnutrition Look for ketones
Weight loss, perhaps with an increase in thirst
? Diabetes Look for glucose and ketones
Frequency of micturition ? Infection Test for bacteria (i.e. nitrites) or protein and blood
? Renal disease Test for specifi c gravity, protein, blood
Yellow tinge to skin ? Jaundice Test for increases in urobilinogen and urine bilirubin
Patient assessment and investigationsHaemodynamic monitoring
124
08_F10417_Ch02.indd 12408_F10417_Ch02.indd 124 6/11/2009 4:47:09 PM6/11/2009 4:47:09 PM
Tab
le 2
.11
Urin
e te
stin
g: s
igni
fi can
ce o
f res
ults
Measu
re
Inte
rpre
tati
on
Sig
nifi c
ance in d
isease
Spe
cifi c
gra
vity
D
eter
min
es h
ydra
tion
and
the
amou
nt
of w
aste
pro
duct
s to
be
excr
eted
in
rela
tion
to w
ater
; dep
ende
nt o
n st
ate
of h
ydra
tion
and
the
amou
nt o
f was
te
prod
ucts
to b
e ex
cret
ed.
One
way
to d
eter
min
e if
hydr
atio
n is
ad
equa
te.
SG
giv
es a
goo
d in
dica
tion
of th
e ne
t fl u
id b
alan
ce a
nd is
of p
artic
ular
val
ue in
pa
tient
s w
here
ther
e is
an
unqu
antifi
abl
e lo
ss, s
uch
as in
bur
ns c
ases
, bre
athi
ng
diffi
culti
es, d
iarr
hoea
or
feve
r. In
hea
lthy
adul
ts, S
G v
arie
s be
twee
n 10
05 a
nd 1
035
(pur
e w
ater
is th
e st
anda
rd, w
ith a
SG
of 1
000)
.
Urin
e w
ith a
per
sist
ently
low
SG
is
sugg
estiv
e of
dia
bete
s in
sipi
dus
or re
nal
dam
age.
A
n in
crea
se in
spe
cifi c
gra
vity
will
indi
cate
deh
ydra
tion,
per
haps
due
to
blee
ding
, vom
iting
, dia
rrho
ea, r
educ
tion
in fl
uid
inta
ke o
r fe
ver.
The
pH
Sho
uld
refl e
ct th
e ac
id–b
ase
bala
nce
of th
e bo
dy, a
s ex
cess
hyd
roge
n or
bi
carb
onat
e io
ns a
re e
xcre
ted
by th
e tu
bule
s to
mai
ntai
n th
e no
rmal
sta
tus.
Und
er n
orm
al c
ircum
stan
ces,
the
urin
e ha
s a
pH o
f aro
und
6 bu
t it c
an r
ange
fro
m a
bout
5 to
8.5
.
Met
abol
ic a
cido
sis
from
sta
rvat
ion,
hig
h pr
otei
n di
ets
or d
iabe
tic k
etoa
cido
sis
will
lead
to a
n ac
id u
rine
but d
iets
in
clud
ing
a lo
t of v
eget
able
, mild
or
even
bi
carb
onat
e-ba
sed
anta
cids
can
cau
se
an a
lkal
ine
urin
e, w
hen
the
pH w
ill ris
e.
Blo
od
A p
oten
tially
ser
ious
sig
n an
d ne
eds
thor
ough
and
rap
id in
vest
igat
ion.
Pos
itive
resu
lts m
ust b
e fo
llow
ed u
p to
de
term
ine
whe
re th
e bl
ood
is c
omin
g fro
m. F
alse
pos
itive
resu
lts m
ay o
ccur
, fro
m c
onta
iner
s co
ntam
inat
ed w
ith
blea
ch, s
kin
prep
arat
ion
with
pov
idon
e io
dine
, or
from
the
use
of s
tale
urin
e.
Asy
mpt
omat
ic h
aem
atur
ia is
usu
ally
the
earli
est s
ign
of c
ance
r of
the
blad
der.
It ca
n al
so b
e du
e to
trau
ma,
infe
ctio
n or
sto
nes.
The
bloo
d w
ill di
sapp
ear
with
re
solu
tion
of th
e in
fect
ion,
or
ston
e.
(Con
tinue
d)
Patient assessment and investigationsHaemodynamic monitoring
125
08_F10417_Ch02.indd 12508_F10417_Ch02.indd 125 6/11/2009 4:47:09 PM6/11/2009 4:47:09 PM
Tab
le 2
.11
(Co
ntin
ued
)
Measu
re
Inte
rpre
tati
on
Sig
nifi c
ance in d
isease
Pro
tein
In
ear
ly re
nal d
isea
se, t
he g
lom
erul
us
and
tubu
les
may
leak
sm
all a
mou
nts
of
prot
ein
into
the
urin
e.
As
rena
l dis
ease
pro
gres
ses,
det
ecta
ble
leve
ls o
f pro
tein
will
be fo
und
in th
e ur
ine.
A
num
ber
of d
isea
ses
are
asso
ciat
ed
with
pro
tein
uria
incl
udin
g re
nal d
isea
se,
urin
ary
trac
t inf
ectio
n, h
yper
tens
ion,
pr
e-ec
lam
psia
and
con
gest
ive
hear
t fai
lure
.W
hen
test
ing
for
urin
ary
prot
ein,
a
mor
ning
spe
cim
en o
f urin
e is
re
com
men
ded
to e
nsur
e su
ffi ci
ent
conc
entr
atio
n.
Bilir
ubin
and
uro
bilin
ogen
In
nor
mal
hea
lth, b
ilirub
in is
not
foun
d in
the
urin
e as
it is
exc
rete
d vi
a th
e bi
le
duct
into
the
gut.
Whe
n th
e liv
er is
dis
ease
d or
ther
e is
ob
stru
ctio
n to
the
fl ow
of b
ile in
to th
e gu
t, bi
lirub
in o
r its
met
abol
ites
are
likel
y to
be
foun
d in
sig
nifi c
ant q
uant
ities
in
the
urin
e.
Uro
bilin
ogen
is n
orm
ally
pre
sent
in u
rine,
bu
t ele
vate
d le
vels
may
indi
cate
live
r ab
norm
aliti
es o
r ex
cess
ive
dest
ruct
ion
of re
d bl
ood
cells
, suc
h as
in h
aem
olyt
ic
anae
mia
.
Nitr
ites
Urin
e no
rmal
ly c
onta
in n
itrat
es fr
om
diet
ary
met
abol
ites,
and
som
e of
the
com
mon
bac
teria
resp
onsi
ble
for
urin
ary
infe
ctio
ns w
ill co
nver
t the
se n
itrat
es to
ni
trite
s.
Nitr
ites
are
not n
orm
ally
pre
sent
in u
rine,
bu
t are
pro
duce
d in
incr
easi
ng n
umbe
rs
whe
n G
ram
-neg
ativ
e ba
cter
ia s
uch
as
E. c
oli c
onve
rt d
ieta
ry n
itrat
es (f
ound
in
the
pres
erva
tives
in m
eat p
rodu
cts
and
chee
se a
nd s
mok
ed fo
od) t
o ni
trite
s.It
wou
ld b
e ap
prop
riate
to s
end
the
spec
imen
to th
e la
bora
tory
for
cultu
re
and
sens
itivi
ty a
nd re
fer
the
patie
nt to
th
e do
ctor
for
trea
tmen
t.
As
E. c
oli i
s re
spon
sibl
e fo
r 80
% o
f ur
ine
infe
ctio
n th
e pr
esen
ce o
f nitr
ites
is s
tron
gly
sugg
estiv
e of
urin
ary
trac
t in
fect
ion.
Vis
ible
sig
ns m
ay a
lso
be p
rese
nt –
fo
r ex
ampl
e, is
the
spec
imen
cle
ar o
r cl
oudy
? C
loud
ines
s sh
ould
be
note
dIf
the
spec
imen
is tu
rbid
and
one
or m
ore
of th
e fo
ur te
sts
are
posi
tive,
ther
e is
a
50%
cha
nce
that
the
urin
e is
infe
cted
.
Patient assessment and investigationsHaemodynamic monitoring
126
08_F10417_Ch02.indd 12608_F10417_Ch02.indd 126 6/11/2009 4:47:09 PM6/11/2009 4:47:09 PM
Tab
le 2
.11
(Co
ntin
ued
)
Measu
re
Inte
rpre
tati
on
Sig
nifi c
ance in d
isease
Glu
cose
N
ot n
orm
ally
foun
d in
urin
e.
Ther
e ar
e tw
o ca
tego
ries
of u
rine
test
s fo
r gl
ucos
e, th
e C
linite
st a
nd
impr
egna
ted
test
str
ips.
The
pres
ence
of g
luco
se m
ay b
e du
e to
rai
sed
bloo
d gl
ucos
e le
vels
(h
yper
glyc
aem
ia).
It ca
n be
ass
ocia
ted
with
man
y m
edic
al c
ondi
tions
suc
h as
dia
bete
s m
ellit
us, s
tres
s, C
ushi
ng’s
sy
ndro
me
and
acut
e pa
ncre
atiti
s.
Ket
ones
W
hen
the
body
met
abol
izes
fat w
aste
, th
e br
eakd
own
prod
ucts
are
the
keto
nes
– ex
cret
ed in
the
urin
e.
In g
ood
heal
th th
ey a
re n
ot d
etec
tabl
e in
urin
e .
Ther
e ar
e tw
o te
sts
avai
labl
e fo
r ke
tone
s:
Ace
test
, whi
ch is
a ta
blet
test
, and
a
strip
test
.
Usu
ally
ket
ones
may
be
foun
d in
peo
ple
who
are
fast
ing,
but
can
als
o be
pre
sent
in
exc
essi
ve a
mou
nts
in p
eopl
e w
ith
unco
ntro
lled
diab
etes
. Ket
ones
are
ac
idic
sub
stan
ces
and
whe
n pr
esen
t in
exce
ss c
an le
ad to
met
abol
ic a
cido
sis,
w
hich
, if u
ntre
ated
, can
cau
se d
eath
.
Odo
ur
A u
rine
spec
imen
sho
uld
be n
oted
be
fore
furt
her
test
ing .
Nor
mal
, fre
shly
voi
ded
urin
e ha
s ve
ry
little
sm
ell,
but d
evel
ops
an a
mm
onia
cal
smel
l on
stan
ding
. Inf
ecte
d ur
ine
smel
ls
foul
and
may
hav
e a
char
acte
ristic
fi sh
y sm
ell o
n vo
idin
g an
d th
e sm
ell w
orse
ns
on s
tand
ing.
Ket
oaci
dosi
s in
pat
ient
s w
ho h
ave
been
st
arvi
ng o
r su
fferin
g fro
m a
nore
xia
or
diab
etes
giv
es u
rine
a ch
arac
teris
tic
smel
l.E
atin
g fi s
h, c
urry
or
othe
r st
rong
ly
fl avo
ured
food
stuf
fs c
an a
lso
mak
e th
e ur
ine
smel
l.
Patient assessment and investigationsHaemodynamic monitoring
127
08_F10417_Ch02.indd 12708_F10417_Ch02.indd 127 6/11/2009 4:47:09 PM6/11/2009 4:47:09 PM
● brown-black – melanoma ● dark-brown – liver infection ● green – bacterial infection ■ Odour – infection, diabetes, anorexia Th e signifi cance of the urine test strip results can be found in the:
■ specifi c gravity 1005–1035 (state of hydration)
■ pH 4.5–8 (acid–base balance) ■ blood (cancer of the bladder, stones,
infection, trauma) ■ protein (renal disease, UTI,
hypertension, pre-eclampsia, CHF) ■ bilirubin and urobilinogen (liver
disease, haemolytic anaemia) ■ nitrates (UTI) ■ glucose (diabetes mellitus, stress,
Cushing’s syndrome, acute pancreatitis) ■ ketones (fasting, uncontrolled diabetes
mellitus) . Taking note of some of the areas measured in a routine urine test may: ■ Allow evaluation of a person’s fl uid
balance ■ Aid diagnosis ■ Assist in monitoring circulatory status ■ Help to provide valuable clues to the
eff ectiveness of treatment .
Th e results of a urine test should be recorded accurately in the critical care patient’s records, as soon as possible after testing. A negative test result may not only point to an alternative diagnosis, but it is also a valuable baseline indicator to be referred to later in evaluating the progress of a patient during the course of his or her illness. A negative result should always be recorded even if at the time it appears unimportant, or irrelevant.
Oxygen Saturation
Adequate tissue oxygenation depends on a balance between oxygen supply and delivery, and the tissue demand for oxygen. When oxygen demands exceeds oxygen supply, hypoxia occurs. Hypoxia can cause vasoconstriction of blood vessels and thus redistribute the circulating volume. Most cells require oxygen to survive, function correctly, and maintain tissues.
Hypoxia can occur from: ■ a blockage whereby the tissues
become hypoxic due to a reduced blood fl ow, as in arteriosclerosis
■ the loss of red blood cells which carries oxygen to the cells, often observed in haemorrhage
■ the inability to get oxygen into the circulation, seen in patients with impaired respiratory function.
Patient assessment and investigationsHaemodynamic monitoring
128
Th e critical care nurse is frequently the fi rst to observe the presence of hypoxia and the one who can intervene to correct the problem with oxygenation. Hypoxia may be observed in a number of ways. Th ere may be changes in behaviour and level of consciousness: ■ the inability to think abstractly or
perform complex mental tasks ■ restlessness
! Always check the oxygen saturation site for tissue perfusion – especially after prolonged usage
08_F10417_Ch02.indd 12808_F10417_Ch02.indd 128 6/11/2009 4:47:09 PM6/11/2009 4:47:09 PM
■ apprehension ■ uncooperativeness ■ irritability ■ short-term memory may also be
impaired Hypoxia can cause vasoconstriction of blood vessels and thus redistribute the circulating volume. Most cells require oxygen to survive, function correctly, and maintain tissues.
Th ere may be changes in BP, pulse, and colour of mucous membranes. Th is may lead the nurse to extend the assessment for hypoxia, by obtaining an oxygen saturation measurement, or by the doctor obtaining arterial blood for blood gas analysis (see later). Very early signs of cerebral under-perfusion are the inability to think abstractly or perform complex mental tasks, restlessness, apprehension, uncooperativeness and irritability. Short-term memory may also be impaired. Th is is because the brain continuously needs a steady supply of oxygenated blood fl ow. A family member may need to be called upon for documentation of the patient’s normal personality and intellectual status.
Oxygen saturation monitoring Oxygen saturation is the measure of molecules of oxygen attached to haemoglobin, and is widely used in many patient care settings. Th ere are four molecules of oxygen attached to each haemoglobin; when this occurs blood is fully saturated at the normal percentage of 98%. O 2 monitoring uses pulse oximetry, which is a non-invasive technique to measure the saturation of blood in the arterial capillaries. It is a spectrophotometric measurement of the
proportion of oxygenated haemoglobin in the arteries. Th e absorption of light by de-saturated and fully saturated haemoglobin is diff erent.
Th is light absorption is measured by a special light detector and appears as the percentage oxygen saturation of the haemoglobin in the arteries. Th e light detector of the oximeter is attached to a tissue that is reasonably transparent to these wavelengths of light. Th is may be the: ■ fi nger ■ toe ■ ear lobe. As such, it is very useful in following changes in arterial oxygenation. Th ere must be: ■ A good fl ow of blood to the area
(not eff ective if severe vasoconstriction is present)
■ No mechanical movement of the probe – will cause interference
■ No nail varnish – this will aff ect the normal haemoglobin saturation measured.
Pulse oximetry is used: ■ To estimate arterial oxygen saturation
(SpaO 2 ) ■ To monitor changes in arterial oxygen
saturation. O 2 monitoring uses pulse oximetry and the nurse is frequently the fi rst to observe the presence of hypoxia and the one who can intervene to correct the problem. Most cells require oxygen to survive, function correctly, and to maintain organ function. Hypoxia can occur from a blockage and reduced blood fl ow, as in arteriosclerosis; or from the loss of red blood cells which carry oxygen to the cells, often observed in haemorrhage;
Patient assessment and investigationsHaemodynamic monitoring
129
08_F10417_Ch02.indd 12908_F10417_Ch02.indd 129 6/11/2009 4:47:09 PM6/11/2009 4:47:09 PM
or from the inability to get oxygen into the circulation, seen in patients with impaired respiratory function.
Adequate tissue oxygenation depends on a balance between oxygen supply and delivery, and the tissue demand for oxygen. When oxygen demands exceed oxygen supply, hypoxia occurs. Hypoxia may be observed in a number of ways. Th ere may be changes in behaviour and level of consciousness. Th is is because the brain continuously needs a steady supply of oxygenated blood fl ow, and this is why the brain is a sensitive indicator of a patient’s perfusion status.
Limitations of O 2 monitoring It is important for practitioners to note that the oxygen saturation monitor can give misleading information regarding the true nature of the patient’s oxygen status. Th is is due to how oxygen is loaded onto haemoglobin: ■ Each haemoglobin molecule can
combine with four molecules of O 2 ■ After the fi rst molecule binds the
haemoglobin molecule changes shape
■ Haemoglobin more readily takes up two more molecules – uptake of fourth is further facilitated
■ All four are bound – fully saturated ■ One, two, three – partially saturated ■ Th e unloading of one oxygen
molecule enhances the unloading of the next, and so on. Critical care nurses need to be made
aware that: ■ An oxygen saturation of 90% may not
indicate to the nurse that there is a low oxygen supply in the blood (determined by partial pressure of oxygen).
■ If the oxygen saturation falls below 85% the pulse oximeter may become progressively less accurate.
■ Pulse oximetry cannot be used in any form of carbon monoxide inhalation because the carboxyhaemoglobin will result in the oximeter over-reading the saturation level.
■ In anaemia there is a reduction in haemoglobin; those available will be fully saturated. When using pulse oximetry in
practice other observations should be undertaken with it: ■ colour ■ pulse rate ■ breathing pattern and rate ■ arterial blood gases (which gives
partial pressure of oxygen) . An awareness of these principles will ensure that oxygen saturation monitoring is safe, and minimize the potential for unrecognised hypoxaemic episodes.
Patient assessment and investigationsHaemodynamic monitoring
130
End-tidal carbon dioxide ( P ET CO 2 ) monitoring
Th e P ET CO 2 monitors exhaled carbon dioxide on both intubated and non-intubated patients. Th e normal range for expired P ET CO 2 is generally between 4.5 and 5.7 kPa.
! Always check an abnormal reading twice; try repositioning the probe initially and assessing the patient
08_F10417_Ch02.indd 13008_F10417_Ch02.indd 130 6/11/2009 4:47:10 PM6/11/2009 4:47:10 PM

Th is method of expiratory gas analysis can be undertaken through a nasal cannula which simultaneously delivers supplemental oxygen. In lungs where ventilation is uniformly distributed and evenly matched to perfusion end-tidal CO 2 ( P ET CO 2 ) reasonably refl ects partial pressure of arterial CO 2 : ■ Pulmonary embolism or decreased
cardiac output is associated with a decrease in P ET CO 2 , because of decreased alveolar blood fl ow.
■ An increase in P ET CO 2 refl ects the presence of airway narrowing or other lung disease associated with respiratory changes in the mechanical properties of the lungs.
Th is method of expiratory gas analysis is not commonly used in all clinical practice areas, but studies are showing its benefi ts and value in respiratory management of patients. In the future in may be as normal as attaching an oxygen saturation monitor.
Patient assessment and investigationsHaemodynamic monitoring
131
! A false reading may be given if the probe is in contact with water
Invasive Cardiovascular Haemodynamic Monitoring
Invasive cardiac monitoring gives a much clearer picture of a patient’s haemodynamic state; however, it is invasive and therefore has numerous complications attached.
Arterial blood pressure monitoring Th is involves a needle being put into a patient artery, generally the radial or brachial. Th is measure of BP determines BP in a diff erent way (BP is measured by the pressure exerted on the sides of the blood vessels) from manual BP and therefore the two measures cannot be compared. It depends on: ■ compliance (distensibility) of elastic
arteries ■ stroke volume ■ rises during ventricular systole,
decreases during diastole ■ systolic pressure (P S ) – pressure in
arteries during ventricular systole (cardiac contraction)
■ diastolic pressure (P D ) – pressure in arteries during ventricular diastole (resting period)
Systolic and diastolic pressures ■ Systolic pressure (P S ) �
110–120 mmHg ● semilunar valves open and blood is
ejected ● compliance decreases pressure
needed to eject blood into arteries ● increased stroke volume (amount
ejected) → increased pressure ■ Diastolic pressure (P D ) �
70–80 mmHg ● semilunar valves closed
! Regularly check the zero on the patient monitor
08_F10417_Ch02.indd 13108_F10417_Ch02.indd 131 6/11/2009 4:47:10 PM6/11/2009 4:47:10 PM
● controlled by cardiac centers in medulla oblongata
● sympathetic outfl ow ● parasympathetic outfl ow ■ Blood volume (BV) ■ Peripheral resistance (PR) . Based on controlling blood vessel diameter. Th e mechanisms include neural and chemical controls alter distribution to meet demands of various organs/tissues to maintain overall MAP through vasomotor tone .
1. Neural control of resistance ■ Vasomotor centre (VMC) controls
vasomotor tone ● located in medulla oblongata
(as part of cardiovascular centre) ● maintains vasomotor tone in all
vessels ■ Refl exes initiated by baroreceptors or
chemoreceptors integrated in medulla oblongata (reticular formation)
■ Vasomotor tone ● vasomotor fi bres (sympathetic
outfl ow) – most fi bres use noradrenaline – increased sympathetic activity
→ vasoconstriction → increased BP
● fi bres to vessels serving skeletal muscle use ACh – increased sympathetic activity →
vasodilation → increased fl ow to skeletal muscle (generally little importance to overall BP) .
2. Baroreceptors ■ Baroreceptors (pressoreceptors)
present in carotid sinus, aortic arch, most other elastic arteries of neck and thorax
Patient assessment and investigationsHaemodynamic monitoring
132
● elastic recoil of arteries contributes to continued pressure → movement of blood.
Mean arterial pressure (MAP) ■ average pressure in main arteries ■ heart spends more time in diastole ● therefore, MAP � diastolic pressure
(P D ) � (pulse pressure [P P ] divided by 3)
● MAP � P D � (P P /3)
Capillary blood pressure ■ Pressure in capillaries ■ Pressure drops from �35–40 mmHg
(at arterial end) to � 15–20 mmHg (at venous end)
■ Lower pressure helps prevent breakage of capillary walls and decreases fl uid loss to tissues
Venous blood pressures ■ Low, steady pressure ■ Venous return supported by: ● valves – prevent backfl ow: varicose
veins – failure of valves allows blood to accumulate in veins; especially common in legs
● respiratory pump – changes in thoracic and abdominal pressures during breathing
● thoracic pressure decreases and abdominal pressure increases during inspiration, decreases and abdominal pressure increases during inspiration
● muscular pump ‘milking ’ by skeletal muscle promotes return prolonged inactivity or prolonged contraction causes blood to pool (may allow clots to form)
Maintaining blood pressure Blood pressure (BP) varies directly with: ■ Cardiac output (CO)
08_F10417_Ch02.indd 13208_F10417_Ch02.indd 132 6/11/2009 4:47:10 PM6/11/2009 4:47:10 PM
■ Increased BP stimulates baroreceptors ● increases impulses to inhibit
vasomotor centre ● decreased sympathetic outfl ow ● vasodilation ● decreased BP ■ Concurrent impulses from
baroreceptors (stimulated by increased BP) to CIC increase parasympathetic outfl ow to heart also decrease sympathetic outfl ow
■ Prolonged hypertension causes baroreceptors to ‘ reset ’ to higher pressure .
3. Chemoreceptors ■ Chemoreceptors located in aortic arch
and large arteries of neck ■ Connected to CAC and vasomotor
centre by aff erent fi bres ■ Respond to oxygen (O 2 ), pH
(hydrogen ion), carbon dioxide (CO 2 ) levels
● decreased O 2 or pH, or increased CO 2 → increases impulses to CAC and vasomotor centre → increased sympathetic outfl ow → increased heart rate and vasoconstriction → increased BP → helps move blood through system faster → gets blood to lungs faster .
4. Chemical control of resistance Chemicals that act on vessels, heart or blood volume: ■ Noradrenaline (norepinephrine)
(NE; from adrenal medulla) → vasoconstriction
■ Adrenaline (epinephrine) (epi; from adrenal medulla):
● vasoconstriction, except in skeletal and cardiac muscle
● nicotine (in tobacco) – stimulates sympathetic ganglionic neurons and adrenal medulla
■ Antidiuretic hormone (ADH; a.k.a. vasopressin; released from neurohypophysis)
● stimulates water reabsorption ● at high levels, causes
vasoconstriction ■ Angiotensin II ● produced from angiotensinogen in
response to renin from kidney ● causes intense vasoconstriction ● stimulates secretion of ADH and
aldosterone (long-term control) ■ Atrial natriuretic peptide (ANP;
from atria of heart) – antagonizes aldosterone and causes general vasodilation
■ Alcohol ● inhibits ADH secretion ● depresses vasomotor centre ■ Endothelium-derived factors – aff ect
vascular smooth muscle ● infl ammatory chemicals –
vasodilation – histamine, prostacyclins, kinins
and others – released during infl ammatory
response ● endothelin – potent vasoconstrictor,
released in response to low blood fl ow ● nitric oxide (NO) – vasodilator
released in response to high blood fl ow; causes systemic and local vasodilation .
5. Regulates blood volume (BV) ■ Blood volume important to: venous
pressure, venous return, EDV, SV, CO control:
● direct renal control – responds to both increased and decreased blood pressure
Patient assessment and investigationsHaemodynamic monitoring
133
08_F10417_Ch02.indd 13308_F10417_Ch02.indd 133 6/11/2009 4:47:11 PM6/11/2009 4:47:11 PM
– Increased BP → increased fi ltration → increased water loss → decreased BV
– Decreased BP → decreased fi ltration → decreased water loss → increased BV
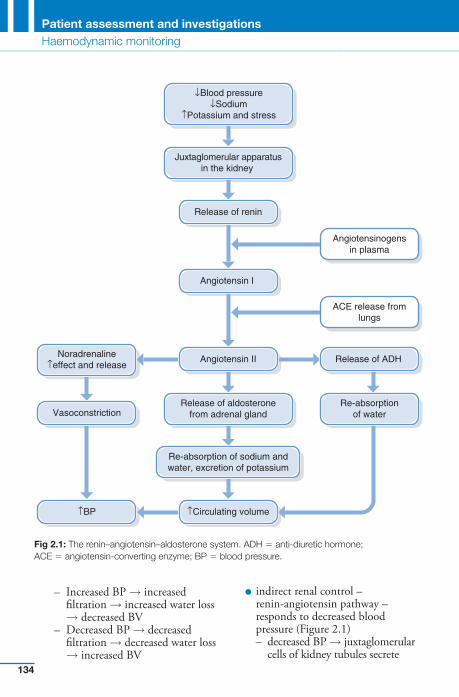
● indirect renal control – renin-angiotensin pathway – responds to decreased blood pressure ( Figure 2.1 ) – decreased BP → juxtaglomerular
cells of kidney tubules secrete
↓Blood pressure↓Sodium
↑Potassium and stress
Juxtaglomerular apparatusin the kidney
Release of renin
Angiotensin I
Angiotensinogensin plasma
Angiotensin II
ACE release fromlungs
Noradrenaline↑effect and release
Release of ADH
VasoconstrictionRelease of aldosterone
from adrenal glandRe-absorption
of water
Re-absorption of sodium andwater, excretion of potassium
↑Circulating volume↑BP
Fig 2.1 : The renin–angiotensin–aldosterone system. ADH � anti-diuretic hormone; ACE � angiotensin-converting enzyme; BP � blood pressure.
Patient assessment and investigationsHaemodynamic monitoring
134
08_F10417_Ch02.indd 13408_F10417_Ch02.indd 134 6/11/2009 4:47:11 PM6/11/2009 4:47:11 PM
renin → converts angiotensinogen to angiotensin I → II
– kidney also releases renin in response to sympathetic impulses
● Angiotensin II – stimulates aldosterone secretion – stimulates ADH secretion – causes vasoconstriction .
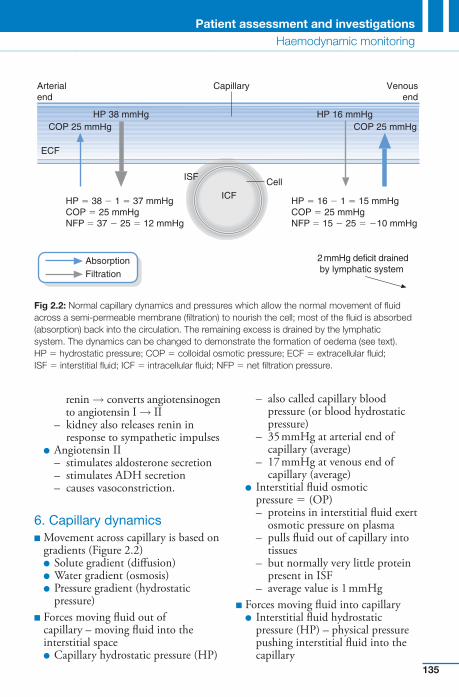
6. Capillary dynamics ■ Movement across capillary is based on
gradients ( Figure 2.2 ) ● Solute gradient (diff usion) ● Water gradient (osmosis) ● Pressure gradient (hydrostatic
pressure) ■ Forces moving fl uid out of
capillary – moving fl uid into the interstitial space
● Capillary hydrostatic pressure (HP)
– also called capillary blood pressure (or blood hydrostatic pressure)
– 35 mmHg at arterial end of capillary (average)
– 17 mmHg at venous end of capillary (average)
● Interstitial fl uid osmotic pressure � (OP) – proteins in interstitial fl uid exert
osmotic pressure on plasma – pulls fl uid out of capillary into
tissues – but normally very little protein
present in ISF – average value is 1 mmHg
■ Forces moving fl uid into capillary ● Interstitial fl uid hydrostatic
pressure (HP) – physical pressure pushing interstitial fl uid into the capillary
Patient assessment and investigationsHaemodynamic monitoring
135
ECF
COP 25 mmHgHP 38 mmHg HP 16 mmHg
ICF
ISF
HP � 38 � 1 � 37 mmHgCOP � 25 mmHgNFP � 37 � 25 � 12 mmHg
Cell
Capillary
2mmHg deficit drainedby lymphatic system
HP � 16 � 1 � 15 mmHgCOP � 25 mmHgNFP � 15 � 25 � �10 mmHg
AbsorptionFiltration
Arterialend
Venousend
COP 25 mmHg
Fig 2.2 : Normal capillary dynamics and pressures which allow the normal movement of fl uid across a semi-permeable membrane (fi ltration) to nourish the cell; most of the fl uid is absorbed (absorption) back into the circulation. The remaining excess is drained by the lymphatic system. The dynamics can be changed to demonstrate the formation of oedema (see text). HP � hydrostatic pressure; COP � colloidal osmotic pressure; ECF � extracellular fl uid; ISF � interstitial fl uid; ICF � intracellular fl uid; NFP � net fi ltration pressure.
08_F10417_Ch02.indd 13508_F10417_Ch02.indd 135 6/11/2009 4:47:12 PM6/11/2009 4:47:12 PM
– ranges from slightly negative to slightly positive
– generally 0 mmHg used in equations
– fl uid removed by lymphatic system
● Capillary osmotic pressure (OP) – pressure due to presence of large, non-diff usible molecules (e.g. plasma protein) that draws fl uid into the capillary from the interstitial fl uid – average value is 26 mmHg – little change along capillary from
arterial to venous end . For a summary of homeostatic mechanisms to control BP see Table 2.9 . Th erefore, due to the many mechanisms that control BP it is a poor indicator of shock. For early detection of changes: ■ Tachycardia, ↑ in temp. and blood
glucose level due to stress and the release of catecholamines
■ Pale skin colour, cool to cold skin due to redistribution of blood
■ in UO, due to selective vasoconstriction of the renal bed, actions of ADH and aldosterone
■ Absent bowel sounds ■ An ↑ or → in BP and rate and depth of
breathing ■ Mental state alterations ranging from
restlessness to coma ■ Complaining of thirst. Th ese are much more reliable, as the body will maintain BP at all costs.
Central venous pressure (CVP) monitoring Th e measurement of the central venous pressure (CVP) provides important
haemodynamic information to guide the therapy of patients. Central venous pressure (CVP) is indicated: ■ To obtain blood for laboratory
estimation ■ To administer parenteral nutrition ■ Administration of hypertonic or
irritating solutions ■ Administration of vasoactive or
inotropic agents and monitor eff ect ■ As a venous access when all other
routes exhausted ■ Where massive fl uid replacement is
required and monitor eff ect ■ Acute circulatory failure . Th e CVP normally refl ects the volume of blood returning to the heart, which exerts a pressure on the walls of the right atrium and measuring it can provide information about: ■ Th e adequacy of the body’s volume
of blood in relation to circulatory capacity
■ Th e eff ectiveness of the right side of the heart as a pump
■ Vascular tone ■ Pulmonary vascular resistance. Measurements on critical care are usually made using a CVP placed within the subclavian vein or internal jugular vein attached to a transducer and then plugged into a monitor. However, a CVP line can also be placed in the external jugular or femoral vein. Th e insertion of a CVP is a strict aseptic procedure. Th e patient should be in the supine position. If breathlessness occurs when lying fl at, the CVP readings may need to be taken with the patient lying at a greater angle no more than 30°, in which case the angle used should always be indicated alongside the recorded
Patient assessment and investigationsHaemodynamic monitoring
136
08_F10417_Ch02.indd 13608_F10417_Ch02.indd 136 6/11/2009 4:47:12 PM6/11/2009 4:47:12 PM
CVP measurement. Th e monitor has to be zeroed at regular intervals. Th e CVP is a dynamic measure and as such diff ers between individuals; the average is 4–12 cm H 2 O for water manometers and 2–8 mmHg for mercury transducers.
It is not the single CVP reading that is important but the trend demonstrated by a series of readings over time. Th erefore, each time a CVP measurement is made, it is essential that it is made under identical conditions so that all possible variables (such as patient position) remain constant. Patient management should not result from the information received from CVP measurements alone. Th e wider clinical picture needs to be considered, e.g. blood pressure, cardiac output, heart rate, respiratory characteristics, urine output.
Complications of a CVP ■ Air embolism – the lines used to
measure CVP are central venous lines and thus present the inherent danger of air embolism. All intravenous administration equipment should, therefore, possess Luer lock connections to minimize accidental disconnection.
■ Pneumothorax – damage to the apices of the lungs, leading to pneumothorax.
■ Damage to the ventricular muscles of the heart causing ventricular arrhythmias.
■ Risk of infection and subsequent septicaemia; maintenance of asepsis is therefore essential.
Changes in the CVP reading Generally, there is an overestimation of the value of the CVP reading. If a fall in
CVP occurs this is proposed to indicate a moderate fall; for example, in patients who bleed following surgery, or because of extreme vasodilatation, whereby the capacity of the circulation is increased but the circulating volume remains constant, as in patients with a pyrexia or from the excessive use of vasodilator drugs (Edwards & Manley 1998).
A consequent rise in CVP is proposed to give rise to concerns about fl uid overload. Th is can lead to circulatory collapse, whereby the left side of the heart becomes dysfunctional. Th e consequences being that the heart is unable to pump blood, leading to a low cardiac output and an increase in right and left ventricular fi lling pressures. It is presumed, therefore, that the CVP can be used as a guide both to determine severity of fl uid loss and measure when too much fl uid has been administered, and to ascertain cardiac instability.
Th is, however, is an overestimation of the value of the CVP reading, as a reduction in CVP will occur in hypovolaemia, during hypervolaemia and left-sided cardiac failure. In the instance of hypervolaemia and the CVP, it may take nearly 24 hours for events occurring in the left side of the heart to refl ect through the lungs into the right ventricle, atria, and superior vena cava, and be mirrored as an increased CVP reading.
A common problem caused by hypervolaemia is cardiac failure, and in this instance the left side of the heart generally fails fi rst. Th is will cause severe systolic dysfunction of the left ventricle and eventually a consequent reduction in stroke volume. As a result there is a decline in the amount of blood returning to the heart (venous return) and hence a reduction in CVP will be
Patient assessment and investigationsHaemodynamic monitoring
137
08_F10417_Ch02.indd 13708_F10417_Ch02.indd 137 6/11/2009 4:47:13 PM6/11/2009 4:47:13 PM
recorded. Th is implies that CVP levels are not completely reliable in estimating circulatory function. Th erefore, a more accurate measure would be that which could determine the pressure in the left side of the heart.
Patient assessment and investigationsHaemodynamic monitoring
138
(LVEDP), and left ventricular preload. Th e PAWP is a much more reliable measurement than the CVP in determining cardiac function. Th e normal PAWP is 5–12 mmHg, but many patients may require a much higher pressure – 15–20 mmHg – to achieve optimal preload.
If the PAWP is high and CO low, this may indicate hypervolaemia, giving rise to left ventricular insuffi ciency, and cardiac dysfunction. If hypovolaemia is present both PAWP and CO would be reduced. Hypervolaemia and hypovolaemia require diff erent therapies to maintain adequate cardiac function.
However, this method involves the threading of a catheter from a central vein through the right atrium and right ventricle and into the pulmonary artery. It is a highly invasive technique with a recognized risk of morbidity and mortality. Th ere is an increase in the use of other techniques that adequately measure PAP, PAWP, CO, and SVR, which are becoming more frequently incorporated into critical care haemodynamic monitoring practice.
Indications for use ■ acute cardiac failure ■ shock ■ diagnosis of tamponade ■ mitral regurgitation ■ ruptured ventricular septum ■ management of high-risk obstetrical
patients ■ intraoperative and postoperative
management of high-risk patient. ■ the CVP fails to give accurate or
suffi cient detail regarding cardiac function.
! Always look at the overall trend rather than a one-off reading
Pulmonary artery pressure (PAP) In the late 1960s the fi rst fl ow-directed catheter measuring pulmonary right, and left heart pressures was developed. Th e PAP catheter measures right atrial pressure, right ventricular pressure, pulmonary artery wedge pressure (PAWP), systemic vascular resistance (SVR), cardiac output (CO) and more recently mixed venous oxygen saturation (Sv O2 ).
A special catheter tip (Swan Ganz or thermodilution pulmonary artery catheter) that sits at the distal port of the pulmonary artery and includes a balloon obtains these measurements. When the balloon is defl ated the pressure refl ected is the PAP. Th e PAP indirectly measures the left ventricle’s end-diastolic pressure (LVEDP) and is an invaluable assessment. Th e normal systolic pressure is 20–30 mmHg and the diastolic is 8–15 mmHg.
When the balloon is infl ated or ‘ wedged ’ the right pressures become blocked by the infl ated balloon and the PAWP is recorded, and the tip indirectly refl ects left atrial pressure, left ventricular end-diastolic pressure
08_F10417_Ch02.indd 13808_F10417_Ch02.indd 138 6/11/2009 4:47:13 PM6/11/2009 4:47:13 PM

The PAP measure ■ When the balloon is defl ated the
pressure refl ected is the pulmonary artery pressure (PAP). Th e normal systolic pressure is 17–32, the diastolic is 7–13, and the mean is 9–19 mmHg (these measures may vary in the literature).
■ Th e pulmonary artery pressure (PAP) catheter measures right atrial pressure or CVP, right ventricular pressure (PAP), PAWP, systemic vascular resistance (SVR), and cardiac output (CO). Th e PAP is elevated in:
■ pulmonary hypertension caused by tension pneumothorax, haemothorax, COPD
■ left-sided heart failure ■ mitral stenosis/insuffi ciency ■ fl uid overload ■ tamponade . Th e PAP will be decreased in: ■ beta-adrenergic stimulation ■ hypovolaemic shock.
Pulmonary artery wedge pressure (PAWP) When the balloon is infl ated the right pressures become blocked by the infl ated balloon and the PAWP is recorded: ■ indirectly refl ecting left atrial
pressure ■ left ventricular end-diastolic pressure
(LVEDP) ■ left ventricular preload . Th e PAWP is a much more reliable measure, in determining the circulating
volume. Th e normal PAWP is 5–12 mmHg, but many patients may require a much higher pressure, 15–25 mmHg.
Changes in PAWP Th e PAWP will be elevated in: ■ valvular-dependent cardiac
dysfunction in mitral stenosis insuffi ciency or severe aortic stenosis
■ left-sided heart failure ■ decreased left ventricular compliance
by cardiac tamponade ■ PEEP ■ myocardial infarction ■ vasopressors ■ PE, hypoxia, ARDS . Th e PAP will be decreased in: ■ hypovolaemia ■ after load reduction caused by
vasodilating agents .
Cardiac output (CO) Th is is the amount of blood pumped by the heart per minute (l/min) and determines the function of the heart and cardiovascular system.
Th e CO changes according to diff erent needs of the body; it is generally about 4–8 l/min. Two variables contribute to CO – stroke volume (SV) and heart rate (HR) – ml/beat. Th e SV is the volume of blood pumped by the heart in a single systolic contraction of the LV and remains stable at 75 ml/beat. Th e product of the SV and the HR is equal to the CO, or:
CO (ml/min)SV (ml/beat) HR (bpm).� �
Patient assessment and investigationsHaemodynamic monitoring
139
08_F10417_Ch02.indd 13908_F10417_Ch02.indd 139 6/11/2009 4:47:13 PM6/11/2009 4:47:13 PM
Cardiac index ■ A CO value is dependent on body size ■ To account for changes in CO that
occur in patients with diff erent body size, CO is divided by body surface area (units are square metres)
■ Body surface area is automatically calculated by the software from the values for height and weight of the patient or nomograms can be used
■ Normal range 2.5–4.2 l/min/m 2
CO and PAWP ■ If the PAWP is high and CO low, this
may indicate hypervolaemia giving rise to left ventricular insuffi ciency, and cardiac dysfunction.
■ If hypovolaemia is present both PAWP and CO would be reduced.
■ Hypervolaemia and hypovolaemia require diff erent therapies to maintain adequate cardiac functioning.
Systemic vascular resistance (SVR) Th e average or total resistance to blood fl ow in the entire systemic circulation. Lower values indicate vasodilatation (sepsis) while higher values indicate vasoconstriction (stress, hypothermia). Most patients have a range of 9.6–18.8 min/l (770–1500 dyn s/cm � 5 )
SRV � (Mean arterial pressure � central venous pressure � 80/cardiac output)
Factors that decrease SVR: ■ vasodilator therapy ■ hyperdynamic septic shock
■ cirrhosis ■ aortic regurgitation ■ anaemia ■ anaphylactic and neurogenic
shock . Factors that increase SVR: ■ hypovolaemia ■ hypothermia .
CO and SVR In sepsis the CO may be normal or high due to changes in HR, despite a reduced SV due to the severe vasodilatation from the increase in body temperature. In this instance CO is not a good indicator of circulatory function.Th e SVR will be reduced but the CO may be normal or high, indications of sepsis and determines treatment, e.g. noradrenaline.
Mixed venous oxygen monitoring (SvO 2 ) Th e SvO 2 or the percentage of saturation of venous haemoglobin, refl ects the overall balance between oxygen delivery and oxygen consumption of perfused tissues (Shailer et al 1992). Measurement of SvO 2 is determined by the saturation of haemoglobin in the pulmonary artery. It refl ects a mixture of venous saturation from various organ systems and represents oxygen saturation of the body, rather than one organ or area. Th e normal value for SvO 2 is 75%, with a range of 60–80%.
A decrease in SvO 2 is an early indication that oxygen transport and uptake may be inadequate and
Patient assessment and investigationsHaemodynamic monitoring
140
08_F10417_Ch02.indd 14008_F10417_Ch02.indd 140 6/11/2009 4:47:14 PM6/11/2009 4:47:14 PM
interventions may be necessary. Low values may result from increased oxygen demand or decreased oxygen delivery. Abnormally high SvO 2 ( � 80%) levels can be caused by high FiO 2 rates or decreases in oxygen demand, such as with hypothermic patients or those who are anaesthetized.
Any changes in SvO 2 outside the normal range of 60–80% or a trend of deviation from the baseline that is greater than 10% should be considered for further assessment or intervention. Nevertheless, continuous SvO 2 monitoring can be used as an indicator of the adequacy of oxygen supply to the tissues and as an early warning sign of cardiopulmonary changes and pathophysiological events.
Mixed venous oxygen saturation is used as a measure of adequacy of tissue perfusion. It varies directly with CO, haemoglobin and saturation of arterial blood, and inversely with metabolic rate. Normal is 75%. Decreases occur when oxygen delivery falls or tissue oxygen demand increases: ■ all types of shock ■ pyrexia, e.g. hyperpyrexia/
hyperthermia ■ hypoxia ■ when it drops as low as 30%,
oxygen delivery is insuffi cient to meet tissue oxygen demand, with anaerobic metabolism and lactic acidosis . Increases are more diffi cult to
interpret but are observed in conditions such as: ■ arteriovenous fi stulae ■ cirrhosis ■ left to right cardiac shunts ■ cyanide poisoning
■ hypothermia ■ unintentional PA catheter
wedging. Increased readings refl ect a failure of cells to take up and utilize oxygen. Can be measured continuously using a fi breoptic PA catheter or from intermittent blood sampling.
Patient assessment and investigationsHaemodynamic monitoring
141
! Always remember to enter the patient’s weight and height details for cardiac calculations
Transoesophageal echocardiography (TOE) Th is uses an ultrasound probe attached to the end of a fl exible endoscope, which is introduced into the oesphagus. It is possible to measure cardiac output via an ultrasound probe in this way, as the oesophagus runs parallel with the descending aorta at the level of the fi fth and sixth thoracic vertebra. Th e aorta crosses the oesophagus anteriorly at the arch and it is because of this that the probe placed into the oesophagus requires an angled tip. Th e probe emits a beam of ultrasound waves of known frequency from the oesophagus across the descending aorta.
Th e ultrasound waves are refl ected off moving objects, e.g. red blood cells, and back to the probe. During diastole when the blood is not moving, the refl ected wave is at the same frequency as the emitted wave. During systole, the blood is moving away from the probe and the frequency of the refl ected wave is lower. Th e faster the blood is moving away the greater the drop in frequency. Th us, the Doppler measures the velocity
08_F10417_Ch02.indd 14108_F10417_Ch02.indd 141 6/11/2009 4:47:14 PM6/11/2009 4:47:14 PM
which is refl ected by elevated left atrial pressures. Cardiogenic shock is therefore recognized as a reduction in ejection fraction and the pulmonary venous fl ow pattern will show predominantly low fl ow state as evidence of elevated LA pressure.
■ Severe fl uid overload – there may be evidence of right atrial and ventricular distension with a poorly functioning right ventricle.
■ Cardiac tamponade – which is specifi c for the diagnosis of tamponade.
■ Assessment of left ventricular function
■ Myocardial ischaemia and infarction
■ Complications of cardiac surgery ■ Valvular heart disease ■ Aortic dissection ■ Suspected endocarditis ■ Pulmonary embolism ■ Th oracic trauma ■ TOE can also determine: ● Right ventricular (RV) infarction ● RV dilatation ● RV anterior wall hypokinesis ● Paradoxical septal motion and small
LV dimensions ● Diff erential diagnosis as well as
diagnosis, where the origin of cardiac dysfunction is uncertain.
Th is technique holds some obvious advantages over pulmonary artery catheter insertion, namely:
■ a reduction in the risk of complications which have been quoted up to 7.2% for the more invasive procedure
Patient assessment and investigationsHaemodynamic monitoring
142
of the blood fl ow in the descending aorta.
Th e oesophageal Doppler technique has the advantage of being continuous and relatively non-invasive – it involves no skin punctures: ■ Th e probes are simple to insert and
information on cardiac function is instantly available.
■ Th e ODM has the ability to evaluate cardiac anatomy and performance, together with the facility to accurately estimate volume status.
■ Th e estimation of pulmonary pressures has been shown to have a high degree of correlation with simultaneous invasive measurements.
■ Th e shape of the waveform provides valuable information on circulating blood volume and heart contractility. Th e probe determines CO and other haemodynamic changes by assessing size, shape, and changes in shape of the velocity waveforms of the descending aortic blood fl ow, which demonstrates increases in resistance.
■ Patients with TOE often show haemodynamic improvement after fl uid loading.
■ TOE gives a visual display of the heart and blood fl ow in the descending aorta allowing non-invasive assessment of cardiac output and recognition of overfi lling of the left ventricle. Changes in cardiac output can be more accurately followed.
TOE is used to determine:
■ Cardiogenic shock – a high diastolic pulmonary venous fl ow pattern into the left atrium is observed,
08_F10417_Ch02.indd 14208_F10417_Ch02.indd 142 6/11/2009 4:47:15 PM6/11/2009 4:47:15 PM
■ ease and minimal expertise required for insertion of the probe and acquisition of signals
■ negligible running costs after the initial capital expenditure with the transducer reusable after sterilization in a suitable detergent
■ prolonged usage in the same patient
■ continuous appreciation of circulatory changes, ventricular function, and the eff ects of therapies by both medical and nursing staff .
However, a pulmonary artery catheter may still be necessary for absolute measurements of CO, PAWP, SVO 2 , and SVR, especially in situations such as severe septicaemia. During septicaemia the CO may be normal, despite the reduction in stroke volume, but CO is maintained by the consequent increase in heart rate. Th erefore, to obtain an eff ective diagnosis of septicaemia and to assist in the determination of support therapies, a measure of SVR is necessary.
To determine hypervolaemia does not necessarily require a defi nite measure of SVR. It could prove useful in patients who it is felt did not warrant the invasive PA technique, and is an attractive proposition for critical care areas possessing neither equipment nor experience in invasive monitoring or concerned about the potential hidden risks.
Haemodynamic information only previously obtainable by pulmonary artery catheterization is now available from this non-invasive technique. Even though, familiarization is needed with this method and a reasonable evaluation period is necessary.
Gastric Intramucosal pH (pHi)
Th e gut is sensitive to decreases in oxygen delivery. Vasoconstrictors are secreted (angiotensin II and vasopressin) causing redistribution of blood fl ow to the heart and brain; the gut mucosa is in danger from hypoxia. If oxygen is reduced gut cell respiration switches to anaerobic metabolism, and lactic acid is formed – which is buff ered by bicarbonate causing carbon dioxide and water to be released. Th erefore, the carbon dioxide levels in the gastric mucosa determine the degree of perfusion.
Gastric tonometry determines gastric intramucosal carbon dioxide and is compared to arterial bicarbonate (assumed to be the same) into a equation to determine pHi. Low intramucosal pHi values are associated with worse prognosis.
Intracranial pressure monitoring (ICP) Th e skull and meninges contain three major components: ■ Brain tissue (80%) ■ Cerebral spinal fl uid (CSF) (10%) ■ Cerebral blood fl ow (CBF) (10%) . Th e pressure these three components exert in the rigid skull is termed the intracranial pressure (ICP). Th e normal range of ICP is between 0 and 15 mmHg; above 15 mmHg is determined a raised ICP. Th e brain maintains this normal pressure by compensation mechanisms known as autoregulation, which occurs following an insult or injury leading to increased
Patient assessment and investigationsHaemodynamic monitoring
143
08_F10417_Ch02.indd 14308_F10417_Ch02.indd 143 6/11/2009 4:47:15 PM6/11/2009 4:47:15 PM
brain, blood or CSF volume. To compensate the following occurs: ■ Displacement of CSF from the cranial
subarachnoid space, spinal and lumbar space; CSF production decreases and CSF absorption increases.
■ Reduction in CBF, venous blood is shunted away from the aff ected areas. A wide spread reduction in CBF to compensate can lead to further brain insult or ischaemia due to the reduced cerebral perfusion.
Patient assessment and investigationsHaemodynamic monitoring
144
Th ese compensatory mechanisms may become exhausted and an increase in ICP above 15 mmHg may occur. Th is may occur due to: ■ Trauma ■ Hydrocephalus ■ Infection ■ Tumours ■ Metabolic disorders ■ Cerebrovascular accident ■ Encephalopathies . In certain injuries monitoring techniques can be employed to measure the ICP. Th ere are three types of ICP monitoring device – all monitors but only one can drain; these include: 1. Fluid-coupled systems with external
transducers: ■ Ventriculostomy (intraventricular
catheter, IVC), able to drain excess CSF 2. Fluid-coupled surface devices: ■ Subarachnoid (SA) bolts devised
because of the concern for infection with IVCs – unable to drain CSF
! Always remember to calibrate the machinery before taking a reading
■ Is only a monitoring instrument ■ Can be inaccurate and tend to
underestimate the ICP 3. Solid state systems include the
fi breoptic system and cable: ■ Can be combined with IVC for
simultaneous ICP monitoring and CSF drainage
■ Solid-state systems are not always directly compatible with common critical care bedside monitoring – a separate system for recording and trending is necessary. Can be placed in the:
● Lateral ventricle ● Brain parenchyma ● Epidural space . Complications of IVC ICP monitors are the risk of infection such as meningitis or ventriculitis, which is related to the duration of catheter insertion. SA bolt infection is rare and generally infections are superfi cial and rarely involve the brain or the meninges. Injury to the brain due to ICP monitoring includes direct brain puncture, parenchymal or subdural haemorrhage but is uncommon.
Close recording of observations is necessary, especially of mean arterial pressure (MAP). Th is is necessary to determine adequate CBF. Calculate and record ICP and cerebral perfusion pressure (CPP). CPP is the pressure needed to perfuse the brain, and the normal range is 80–90 mmHg. It is calculated by subtracting the ICP from the MAP:
CPP MAP ICP.� �
CBF is compromised if the CPP is below 60 mmHg. Reduced CPP may result in irreversible brain damage or death. It is thought that the threshold
08_F10417_Ch02.indd 14408_F10417_Ch02.indd 144 6/11/2009 4:47:15 PM6/11/2009 4:47:15 PM
for mechanical brain injury is an ICP is between 20 and 30 mmHg. Factors that reduce the ICP: ■ Position – head elevated by 30° ■ Fluid restriction – slightly dehydrated
state ■ Temperature control – hypothermia ■ Drugs ● Diuretics ● Corticosteroids ● Anticonvulsants ■ Hyperventilation – reduced partial
pressure of carbon dioxide will cause cerebral vasoconstriction and a reduction in ICP – hypercarbia is important to avoid in patients with increased ICP
■ A reduced level of oxygen will increase ICP and hypoxia or cerebral ischaemia should be avoided
■ Removal of the cause, e.g. surgery .
2.4 Diagnostic procedures
The Electrocardiogram (ECG) Rhythm Strip
Th e ECG is a record of the changes in electrical activity occurring within cardiac muscle. Th e cardiac cells involved in the contraction are specialized and are unlike any other cells in the body, as each individual cell can initiate its own electrical impulse (Edwards 2000b). Although cardiac muscle has this special property, hormones and chemical transmitters
are important in producing the fi ner control of the heart and maintenance of homeostasis.
Bipolar and unipolar electrodes provide an ECG rhythm known as the PQRST waves, which detect the electrical charges within the cardiac cell. Th e ECG can provide information about the heart rate and rhythm, the eff ects of electrolytes or drugs on the heart and the electrical orientation of the cardiac muscle. Th e normal ECG trace should record between 60 and 100 complexes (PQRST) per minute.
What is an ECG? Th e action potentials transmitted through the heart during the cardiac cycle can be recorded on the surface of the body. Th e recording can be obtained by electrodes on the body, connected to an ECG machine. Th e voltage changes are fed to the machine, amplifi ed and displayed visually on a screen, graphically on ECG paper, or both.
Terminology
■ iso-electric line – baseline ■ positive – upward defl ection ■ negative – downward defl ection ■ voltage – height and depth of a wave ■ time – measured along horizontal
axis; one second � 5 large squares ■ cardiac cycle – represented on ECG
by P wave, QRS complex, T wave ■ bi-phasic – defl ection which is both
positive and negative
ECG leads Th e ECG leads provide a variety of views of the heart’s electrical activity
Patient assessment and investigationsDiagnostic procedures
145
08_F10417_Ch02.indd 14508_F10417_Ch02.indd 145 6/11/2009 4:47:15 PM6/11/2009 4:47:15 PM