Embed Size (px)
Citation preview
2.3 Measuring Biotic Components
What is classification?
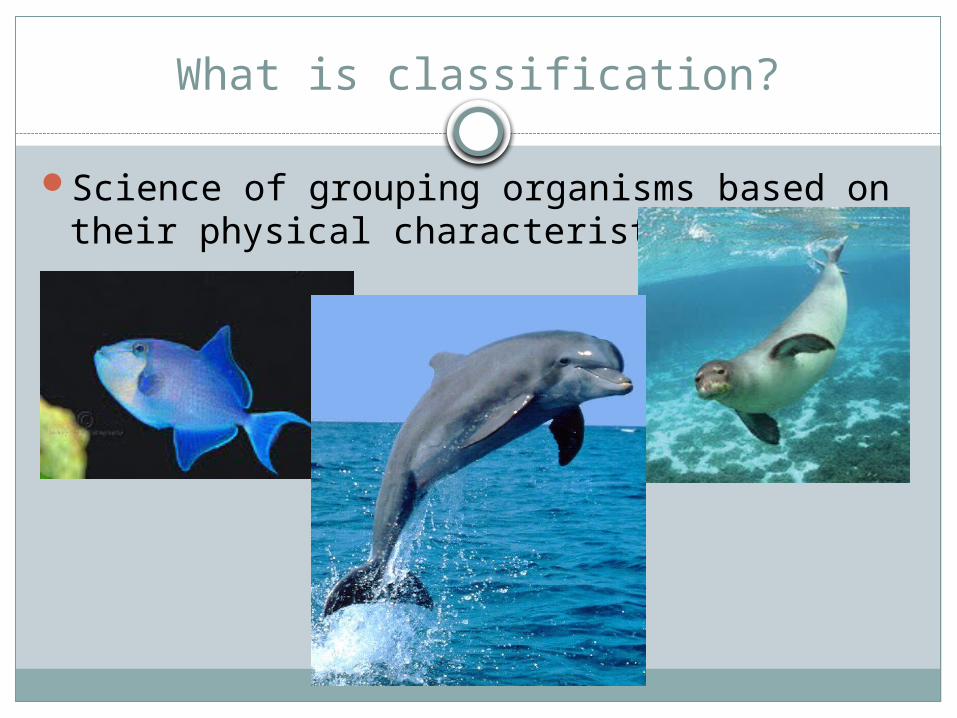
Science of grouping organisms based on their physical characteristics.
What characteristics do we use?
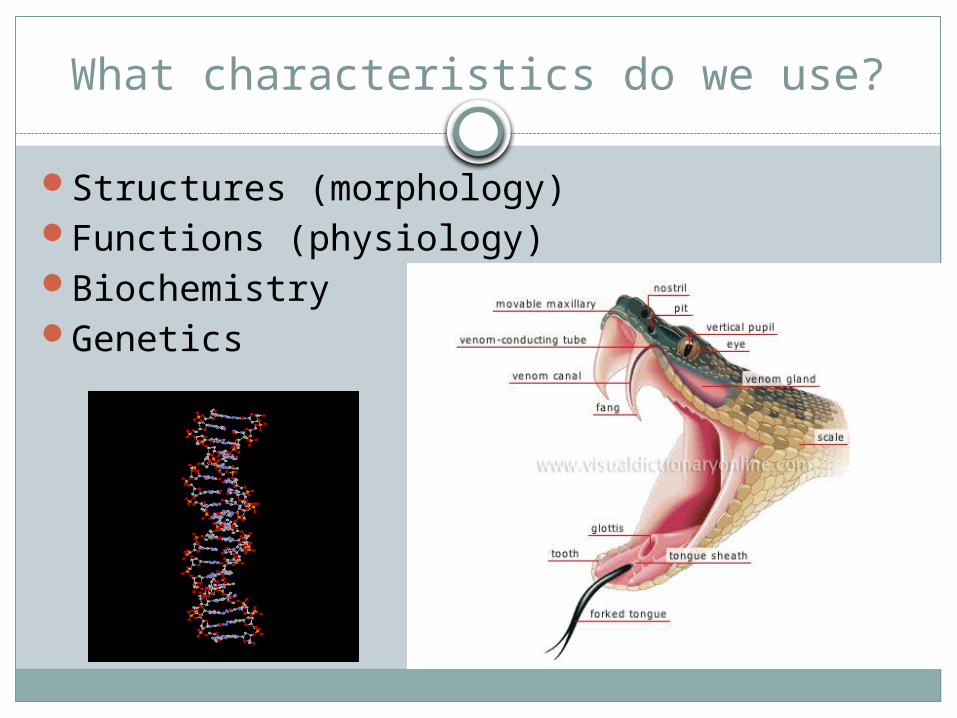
Structures (morphology)Functions (physiology)BiochemistryGenetics
Why do we classify?
Identify organismsCompare organismsIdentify relationships among organismsCommunicate with others (universal
language)Identify evolutionary relationships
Why do we classify?
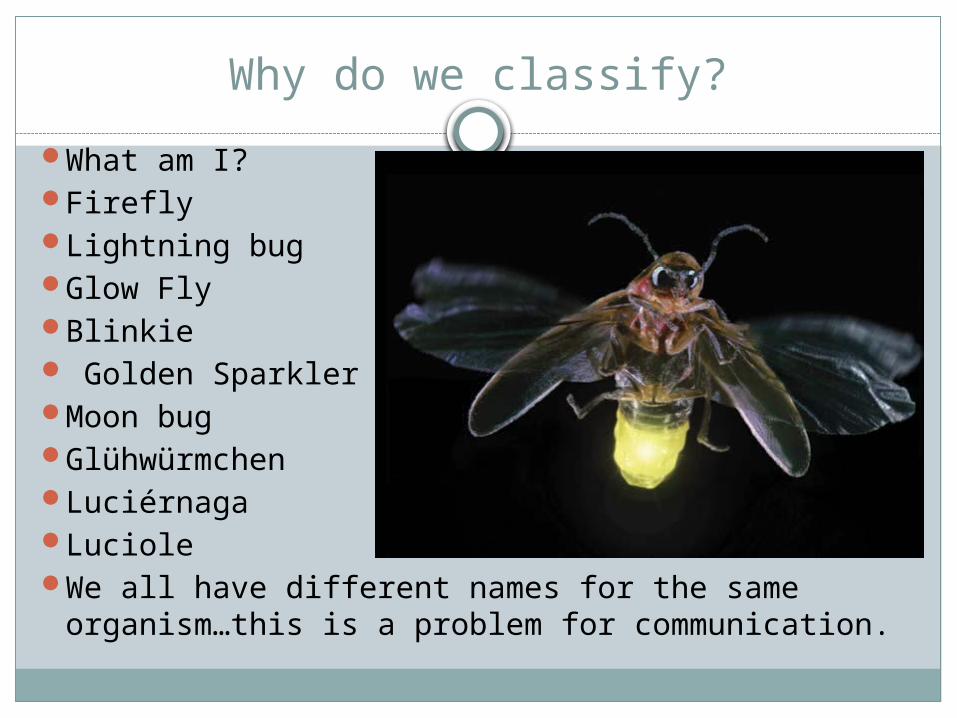
What am I?FireflyLightning bugGlow FlyBlinkie Golden SparklerMoon bugGlühwürmchenLuciérnagaLucioleWe all have different names for the same
organism…this is a problem for communication.
From Aristotle to Linneaus
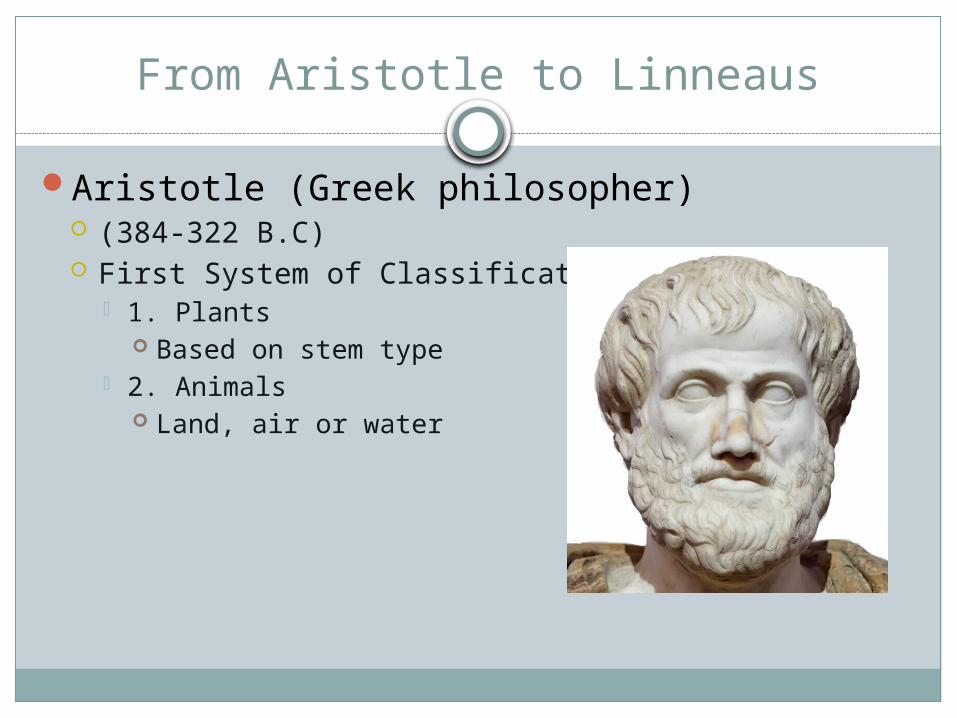
Aristotle (Greek philosopher) (384-322 B.C) First System of Classification
1. Plants Based on stem type
2. Animals Land, air or water
From Aristotle to Linneaus
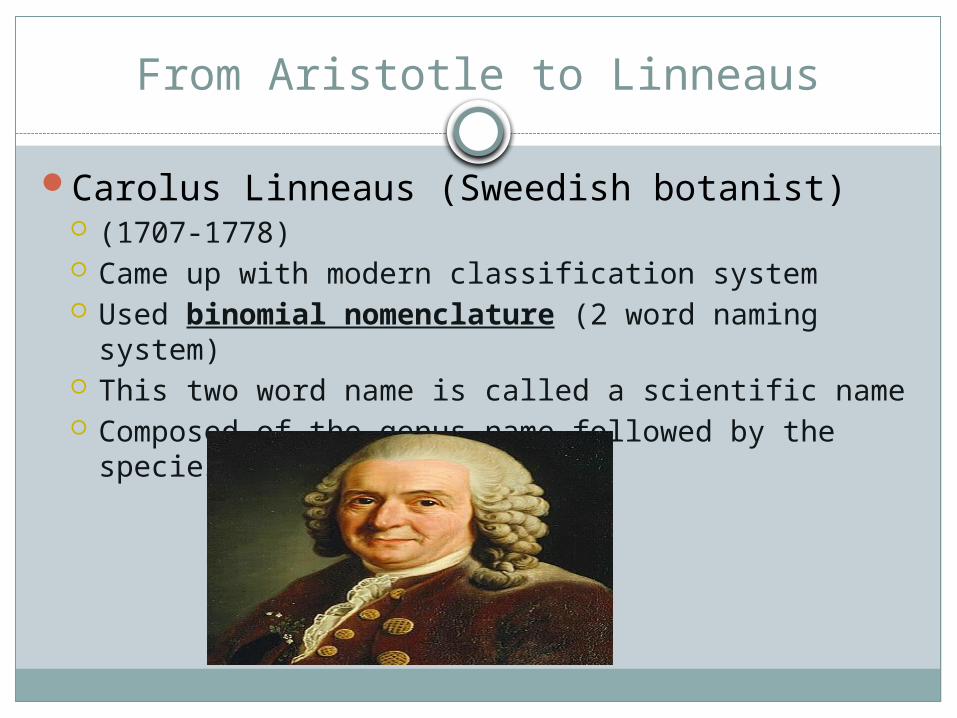
Carolus Linneaus (Sweedish botanist) (1707-1778) Came up with modern classification system Used binomial nomenclature (2 word naming
system) This two word name is called a scientific name Composed of the genus name followed by the species
name
Scientific Names
Either written in italics or underlinedGenus is always capitalized and species is
always lowercaseBased on Latin Examples:
Cat: Felix domesticus Mosquito: Colex pipens Human: Homo sapien
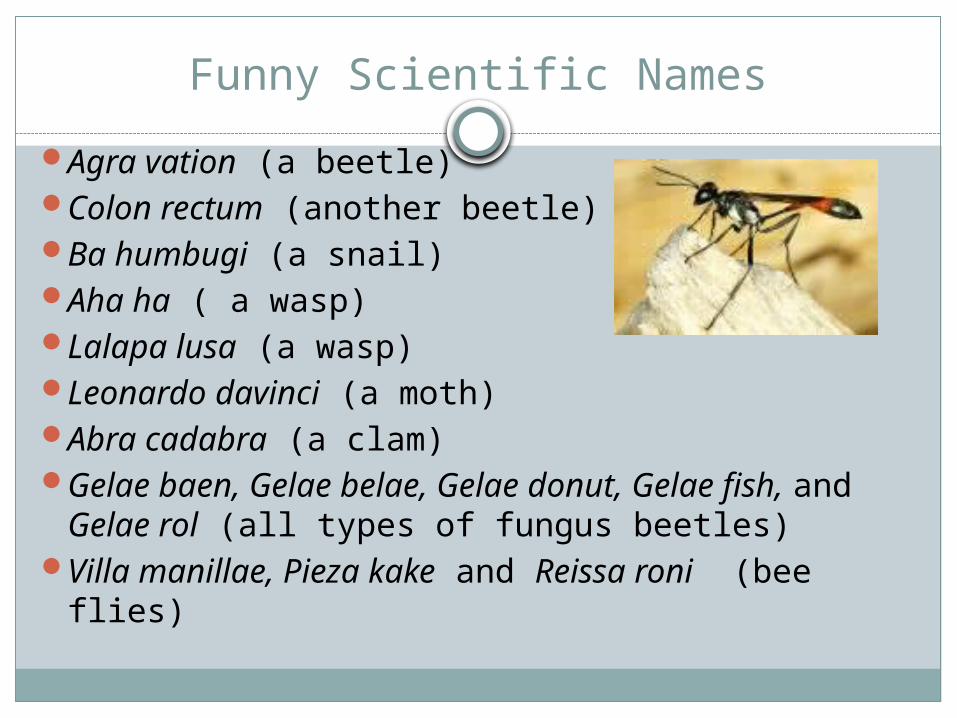
Funny Scientific Names
Agra vation (a beetle)Colon rectum (another beetle)Ba humbugi (a snail)Aha ha ( a wasp)Lalapa lusa (a wasp)Leonardo davinci (a moth)Abra cadabra (a clam)Gelae baen, Gelae belae, Gelae donut, Gelae fish,
and Gelae rol (all types of fungus beetles)Villa manillae, Pieza kake and Reissa roni (bee
flies)
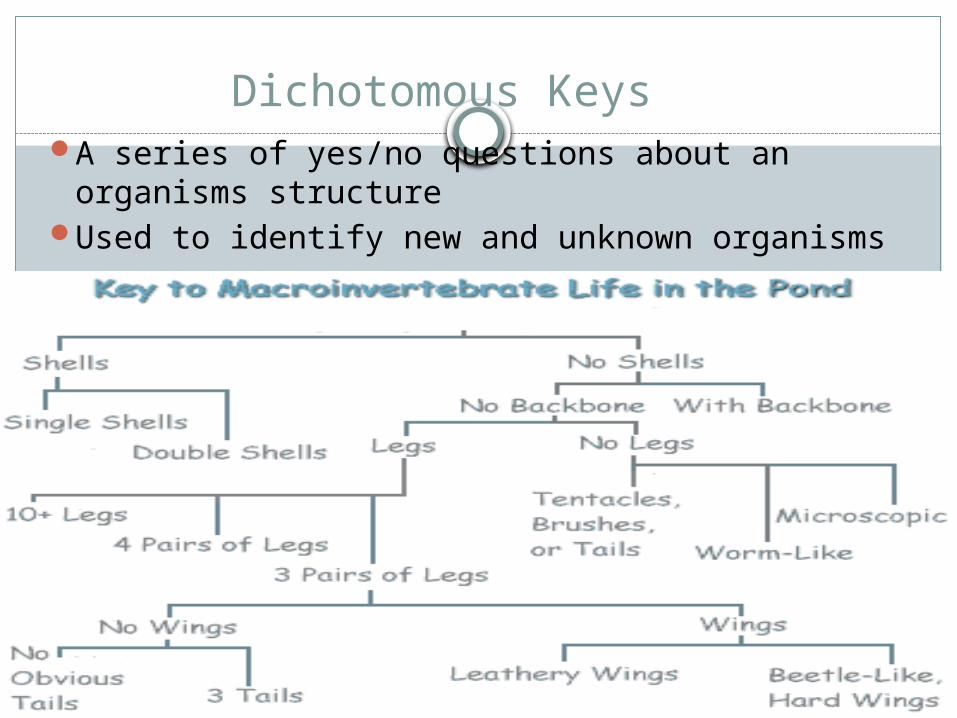
Dichotomous Keys A series of yes/no questions about an
organisms structure Used to identify new and unknown organisms
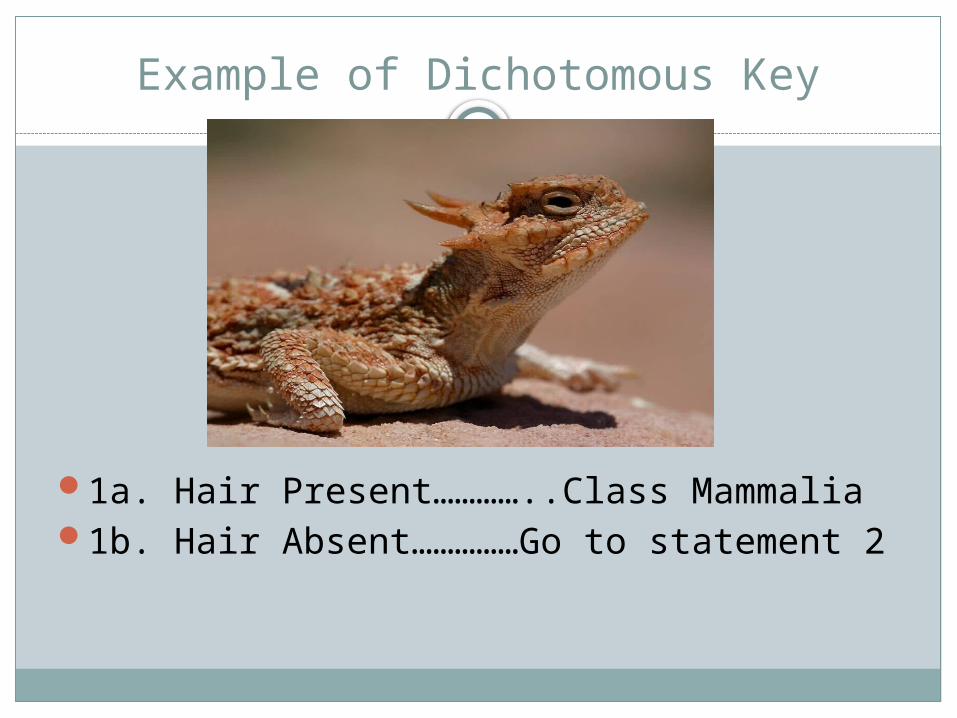
Example of Dichotomous Key
1a. Hair Present…………..Class Mammalia1b. Hair Absent……………Go to statement 2

Example of Dichotomous Key
2a. Feathers present…………..Class Aves2b. Feathers absent…………….Go to statement 33a. Jaw Present…………………..Go to statement 43b. Jaw Absent……………………Class Agnatha
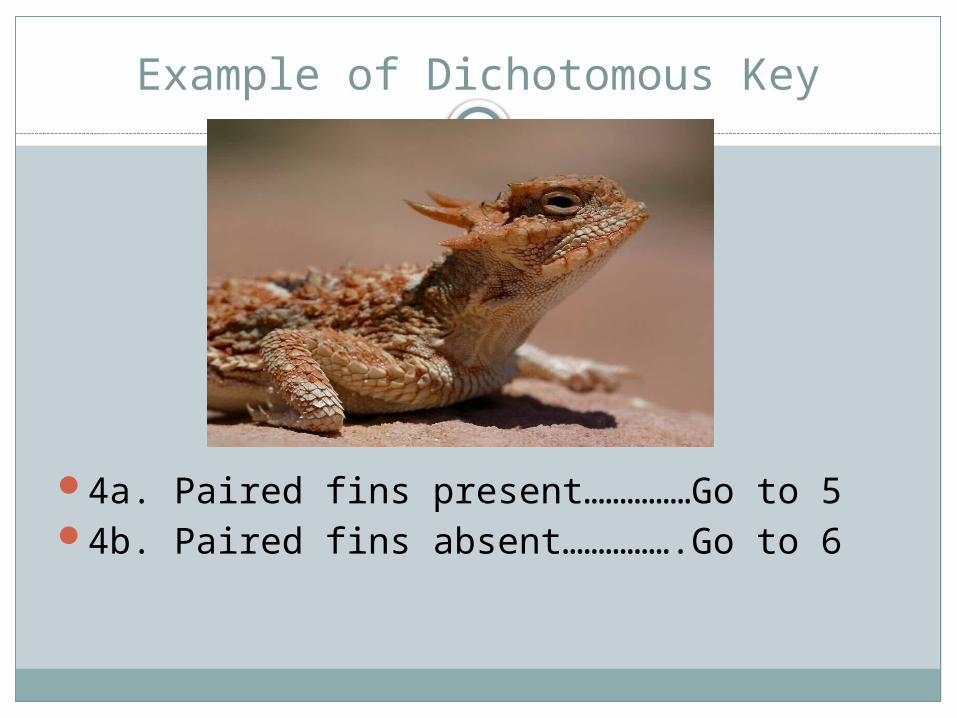
Example of Dichotomous Key
4a. Paired fins present……………Go to 54b. Paired fins absent…………….Go to 6
Example of Dichotomous Key
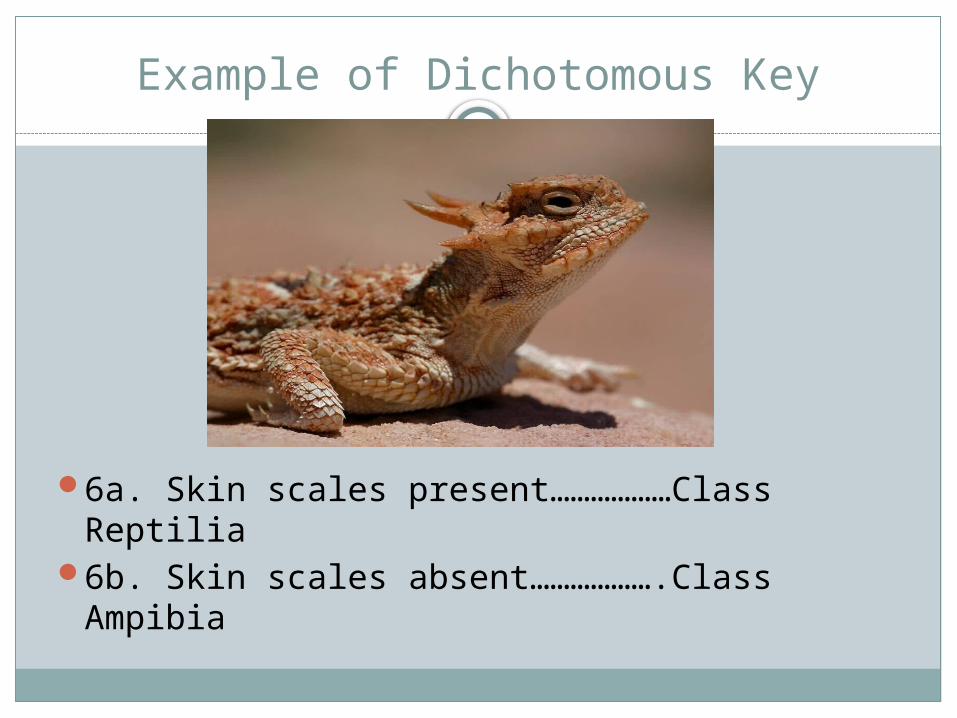
6a. Skin scales present………………Class Reptilia
6b. Skin scales absent……………….Class Ampibia
Estimating Populations of Organisms
We estimate populations because it would take way too long to count every living thing in a given ecosystem.
We can estimate populations of plants or animals
Random Sampling: All organisms must have an equal chance of being captured.
Estimating Populations of Animals
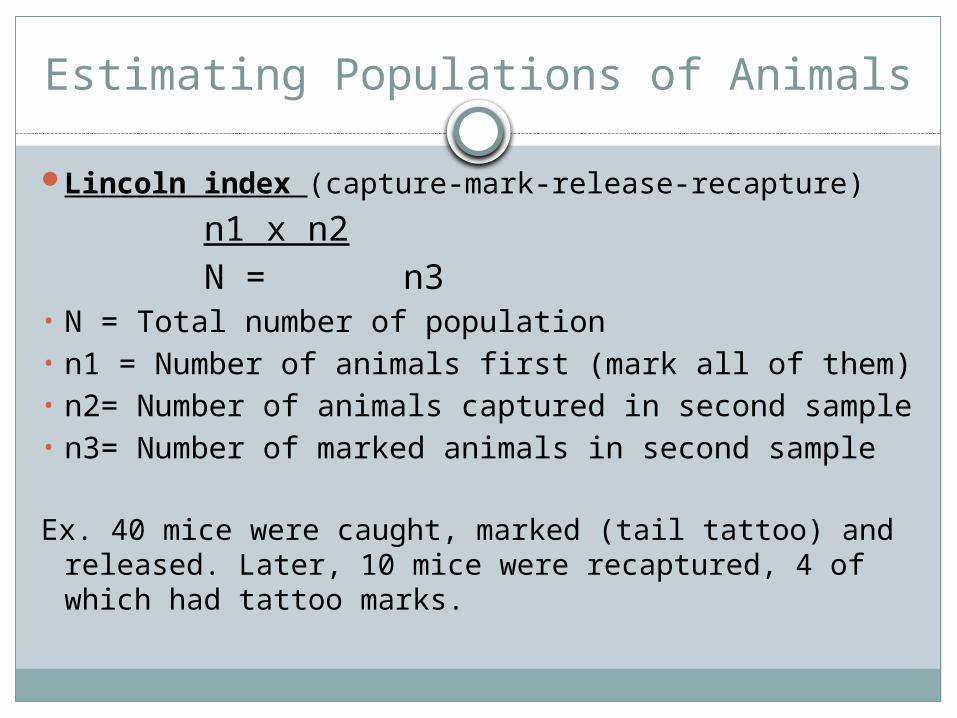
Lincoln index (capture-mark-release-recapture)
n1 x n2N = n3
• N = Total number of population • n1 = Number of animals first (mark all of them)• n2= Number of animals captured in second
sample• n3= Number of marked animals in second sample
Ex. 40 mice were caught, marked (tail tattoo) and released. Later, 10 mice were recaptured, 4 of which had tattoo marks.
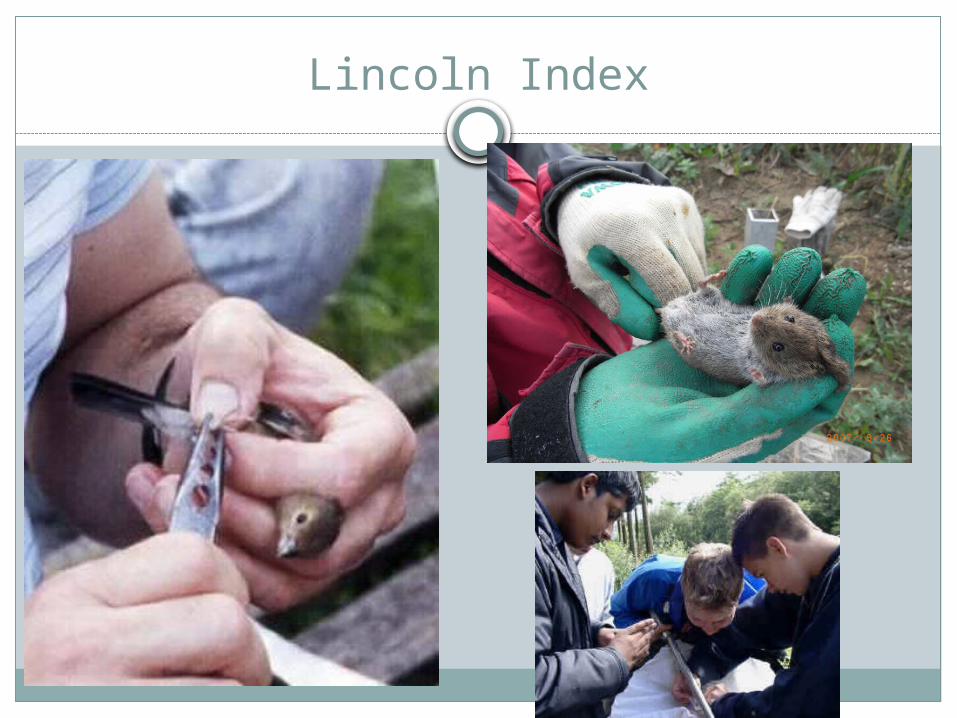
Lincoln Index
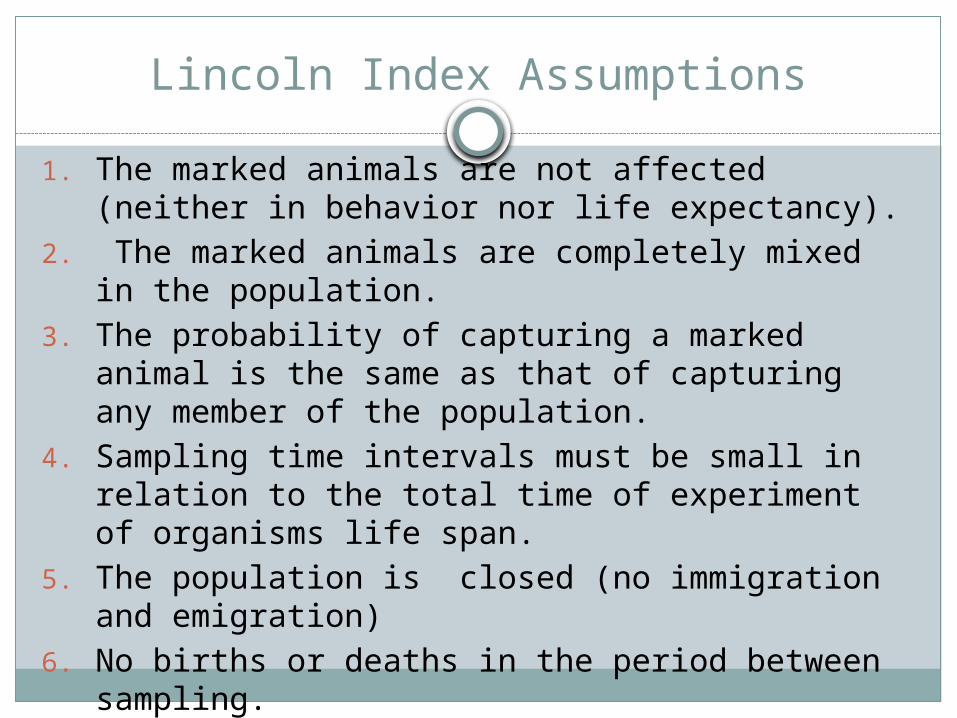
Lincoln Index Assumptions
1. The marked animals are not affected (neither in behavior nor life expectancy).
2. The marked animals are completely mixed in the population.
3. The probability of capturing a marked animal is the same as that of capturing any member of the population.
4. Sampling time intervals must be small in relation to the total time of experiment of organisms life span.
5. The population is closed (no immigration and emigration)
6. No births or deaths in the period between sampling.
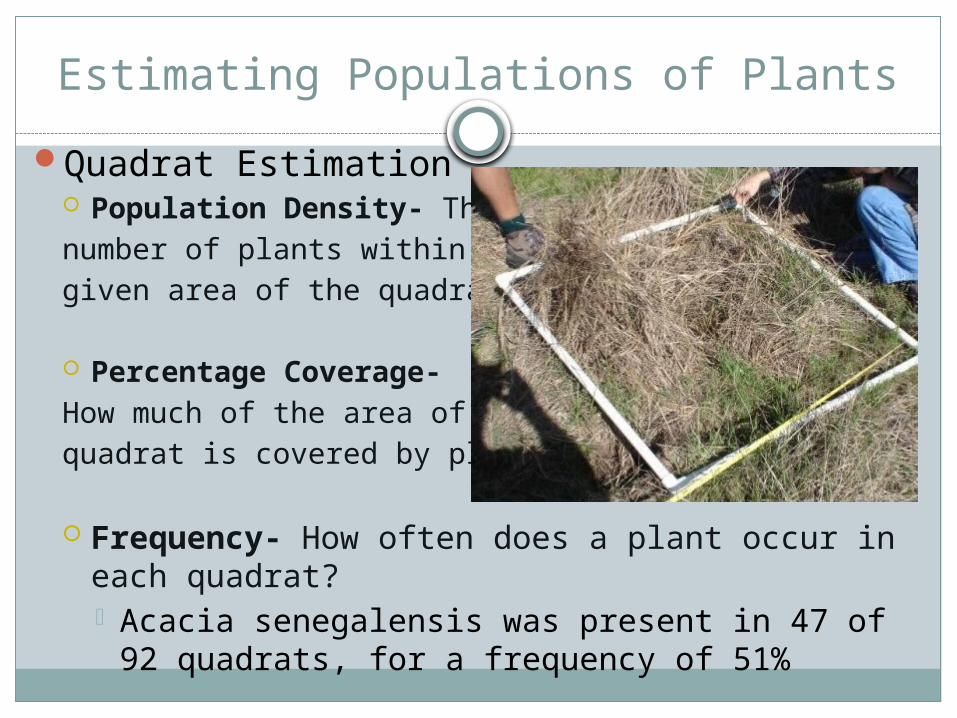
Estimating Populations of Plants
Quadrat Estimation Population Density- The number of plants within the given area of the quadrat (m2)
Percentage Coverage- How much of the area of a quadrat is covered by plants?
Frequency- How often does a plant occur in each quadrat? Acacia senegalensis was present in 47 of 92
quadrats, for a frequency of 51%
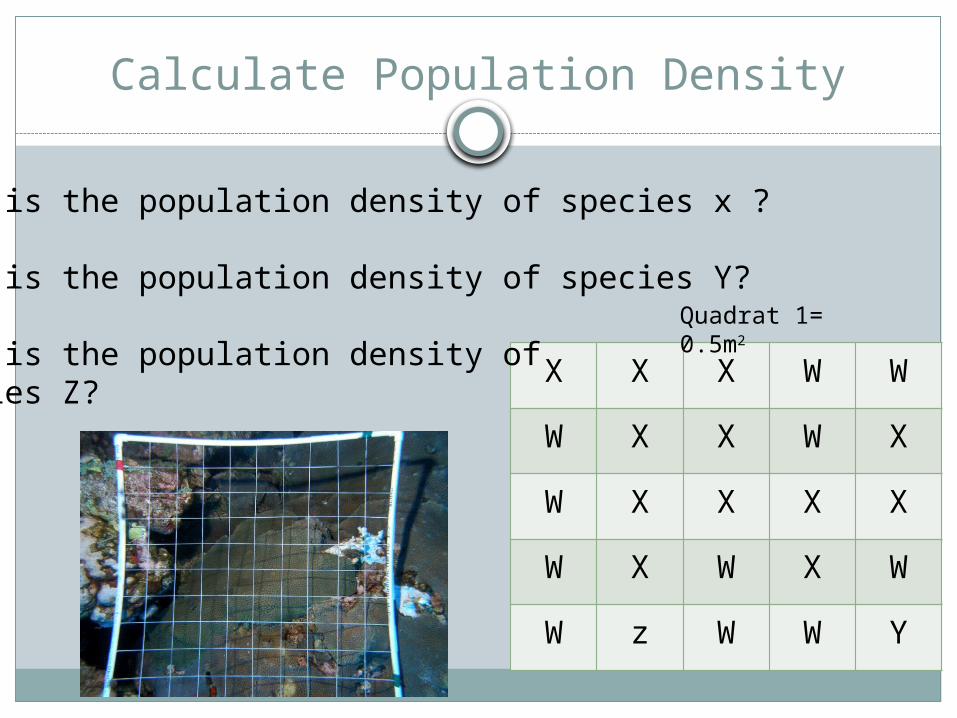
Calculate Population Density
X X X W W
W X X W X
W X X X X
W X W X W
W z W W Y
What is the population density of species x ?
What is the population density of species Y?
What is the population density of species Z?
Quadrat 1= 0.5m2
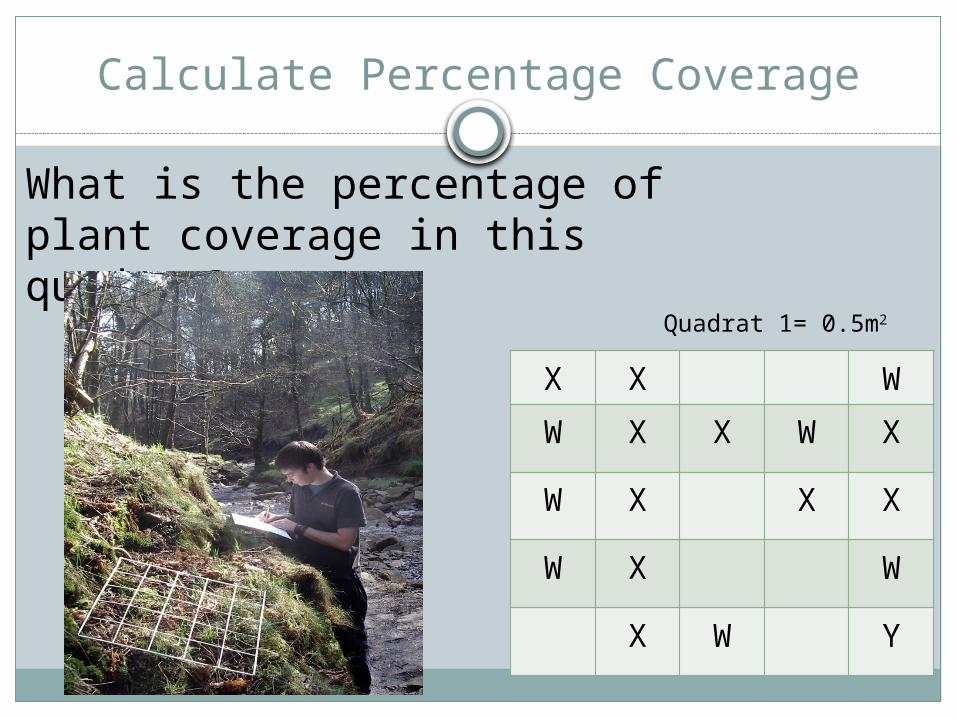
Calculate Percentage Coverage
X X W
W X X W X
W X X X
W X W
X W Y
What is the percentage of plant coverage in this quadrat?
Quadrat 1= 0.5m2
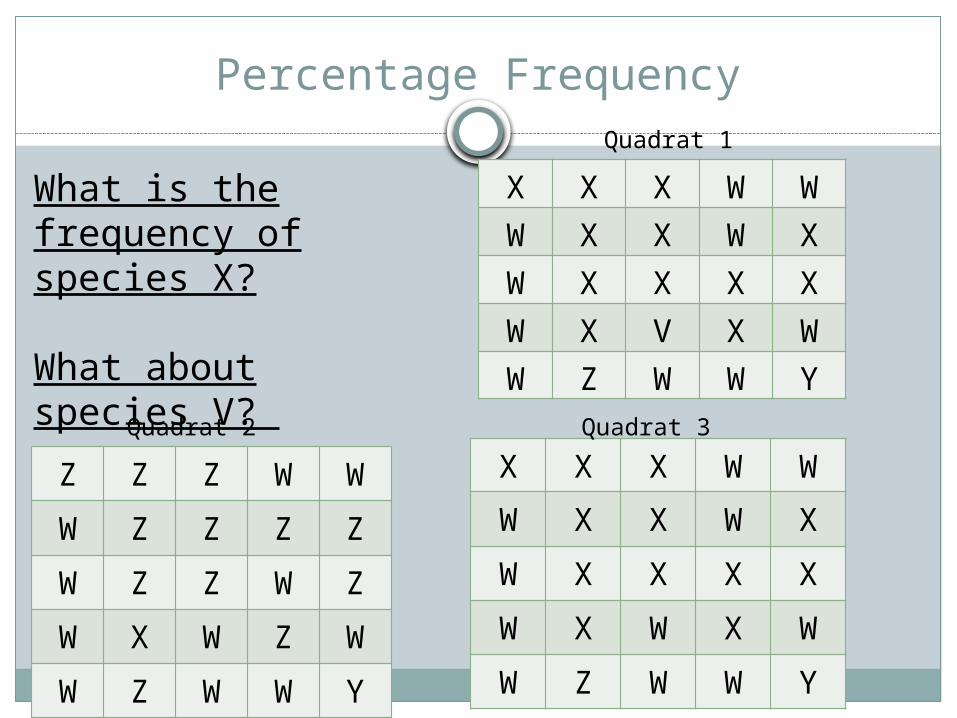
Percentage Frequency
X X X W W
W X X W X
W X X X X
W X W X W
W Z W W Y
What is the frequency of species X?
What about species V?
Z Z Z W W
W Z Z Z Z
W Z Z W Z
W X W Z W
W Z W W Y
Quadrat 2 Quadrat 3
X X X W W
W X X W X
W X X X X
W X V X W
W Z W W Y
Quadrat 1
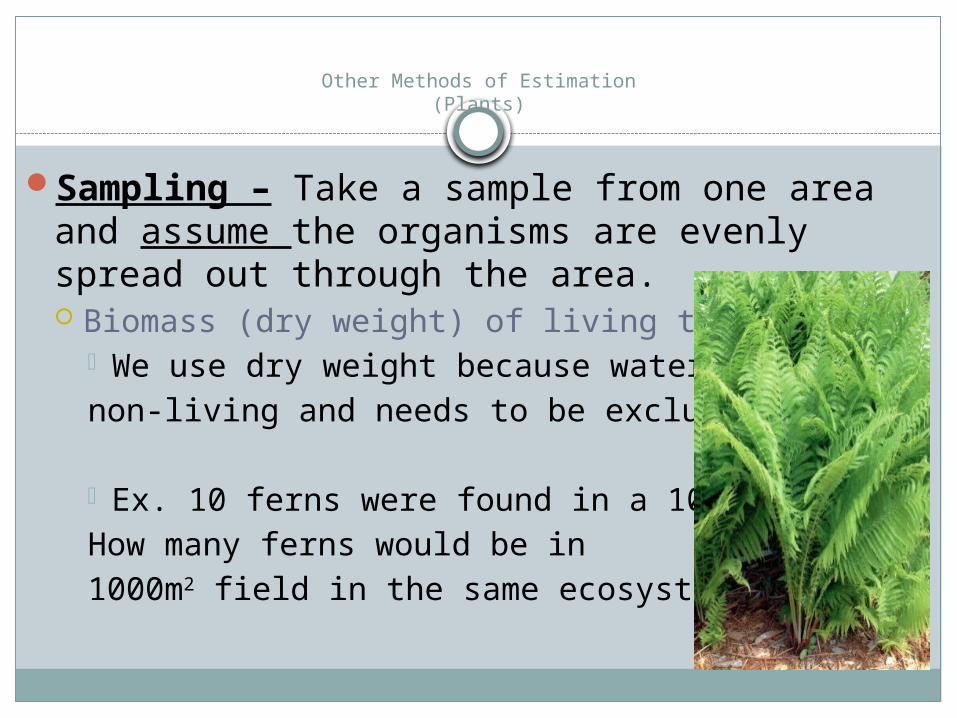
Other Methods of Estimation(Plants)
Sampling – Take a sample from one area and assume the organisms are evenly spread out through the area. Biomass (dry weight) of living tissue
We use dry weight because water is non-living and needs to be excluded
Ex. 10 ferns were found in a 100m2 area. How many ferns would be in 1000m2 field in the same ecosystem?
What is diversity?
Diversity is the variety of lifeDiversity is a combination of two components
Evenness: The number individuals of each species present in a sample
Richness: The total number of different species in a sample
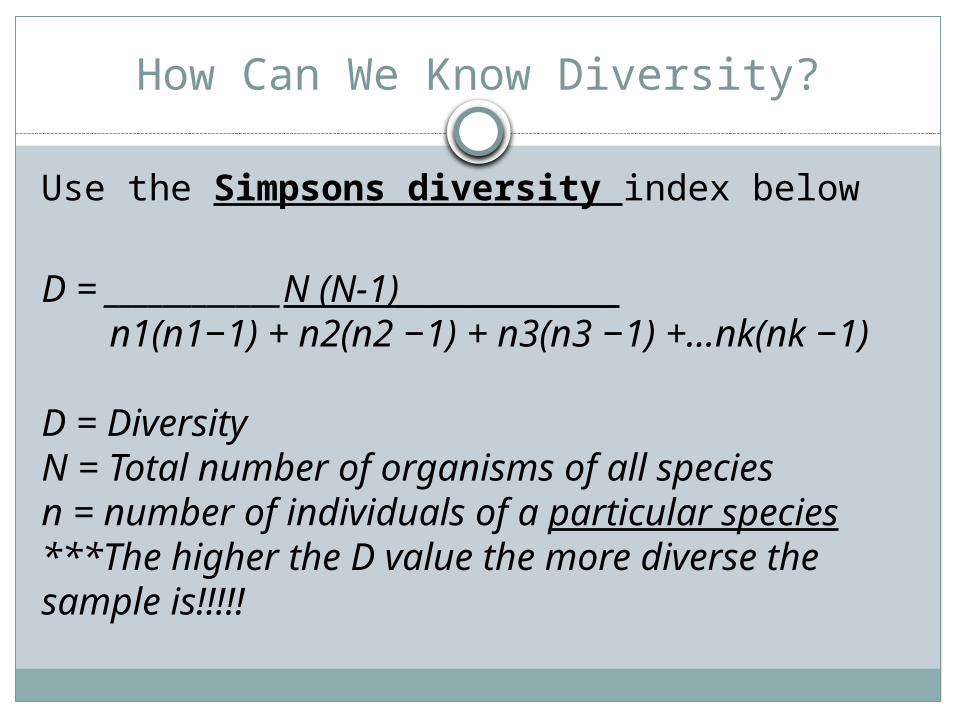
How Can We Know Diversity?
Use the Simpsons diversity index below
D = ____________N (N-1)_______________ n1(n1−1) + n2(n2 −1) + n3(n3 −1) +…nk(nk −1)
D = DiversityN = Total number of organisms of all speciesn = number of individuals of a particular species***The higher the D value the more diverse the sample is!!!!!
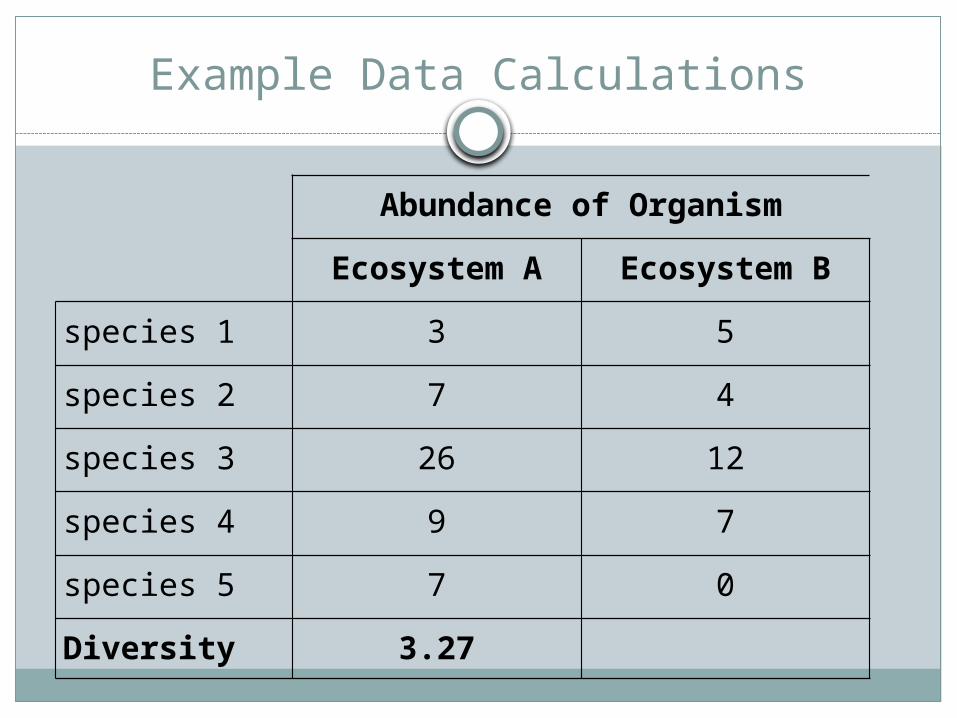
Example Data Calculations
Abundance of Organism
Ecosystem A Ecosystem B
species 1 3 5
species 2 7 4
species 3 26 12
species 4 9 7
species 5 7 0
Diversity 3.27