Embed Size (px)
Citation preview
www.ck12.org
CHAPTER 2 Conditional ProbabilityChapter Outline
2.1 TREE DIAGRAMS
2.2 PERMUTATIONS AND COMBINATIONS COMPARED
2.3 PERMUTATION PROBLEMS
2.4 PERMUTATIONS WITH REPETITION
2.5 COMBINATIONS
2.6 COMBINATION PROBLEMS
2.7 CONDITIONAL PROBABILITY
Introduction
This chapter builds on the concepts learned in the previous chapter on probability. Starting with tree diagrams as ameans of displaying outcomes for various trials, we will learn how to read the diagrams and find probabilities. Wewill also find that order does not matter unless working with permutations. Permutations, such as the combinationof your lock at the gym, require their own special formula. When outcomes for permutations have repetitions, theserepetitions must also be included in the calculations in order to account for the multiple entries. Combinations,like permutations, also have their own special formula. Combinations, such as the number of teams of 4 that can bearranged in a class of 15 students, are different from permutations, because the order in combinations is insignificant.In this chapter, we will also learn about conditional probability. Conditional probability comes into play when theprobability of the second event occurring is dependent on the probability of the first event.
30
www.ck12.org Chapter 2. Conditional Probability
2.1 Tree Diagrams
Here you’ll learn how to construct a tree diagram.
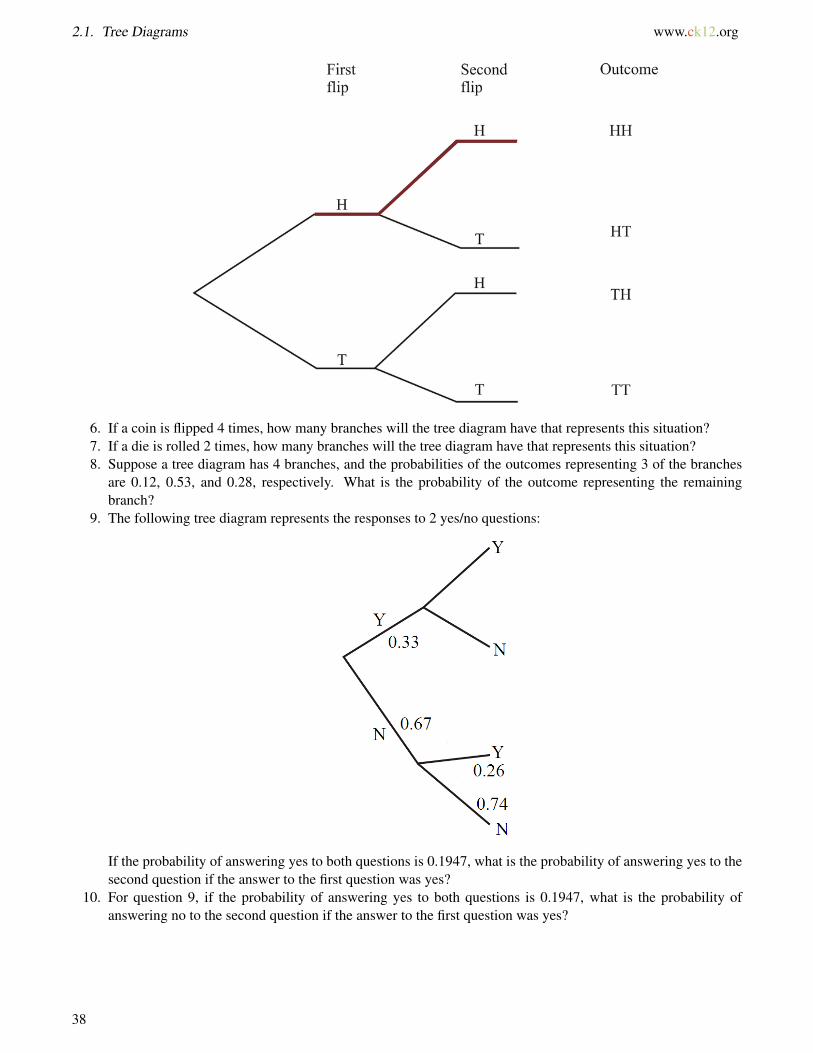
Suppose you flip a coin three times in succession. How can you illustrate all your possible outcomes? What is theprobability that your coin will come up heads three times in a row?
Watch This
First watch this video to learn about tree diagrams.
MEDIAClick image to the left for more content.
CK-12 Foundation: Chapter2Tree DiagramsA
Then watch this video to see some examples.
MEDIAClick image to the left for more content.
CK-12 Foundation: Chapter2TreeDiagramsB
Watch this video for more help.
MEDIAClick image to the left for more content.
Khan Academy Probability (part 2)
Guidance
In previous Concepts, we studied independent and dependent events, as well as mutually inclusive and mutuallyexclusive events. We used the Addition Rule for dependent events, as well as mutually inclusive and mutuallyexclusive events. The Addition Rule, or Addition Principle, is used to find P(A or B), while the Multiplication Ruleis used for independent events.
31
2.1. Tree Diagrams www.ck12.org
Addition Rule –For 2 events, A and B, the probability of selecting one event or another is given by: P(A or B) =P(A)+P(B)−P(A and B).
Multiplication Rule –For 2 independent events, A and B, where the outcome of A does not change the probabilityof B, the probability of A and B is given by: P(A and B) = P(A)×P(B).
Tree diagrams are another way to show the outcomes of simple probability events. In a tree diagram, each outcomeis represented as a branch on a tree.
Example A
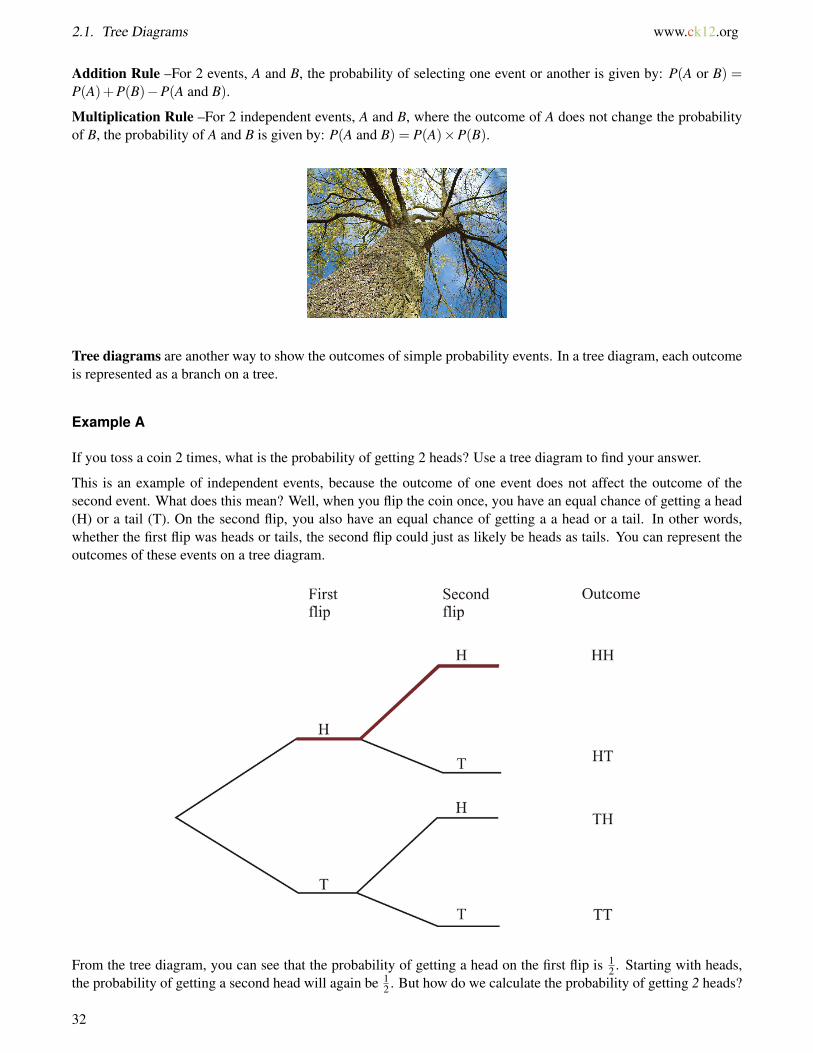
If you toss a coin 2 times, what is the probability of getting 2 heads? Use a tree diagram to find your answer.
This is an example of independent events, because the outcome of one event does not affect the outcome of thesecond event. What does this mean? Well, when you flip the coin once, you have an equal chance of getting a head(H) or a tail (T). On the second flip, you also have an equal chance of getting a a head or a tail. In other words,whether the first flip was heads or tails, the second flip could just as likely be heads as tails. You can represent theoutcomes of these events on a tree diagram.
From the tree diagram, you can see that the probability of getting a head on the first flip is 12 . Starting with heads,
the probability of getting a second head will again be 12 . But how do we calculate the probability of getting 2 heads?
32
www.ck12.org Chapter 2. Conditional Probability
These are independent events, since the outcome of tossing the first coin in no way affects the outcome of tossingthe second coin. Therefore, we can calculate the probability as follows:
P(A and B) =12× 1
2
P(A and B) =14
Therefore, we can conclude that the probability of getting 2 heads when tossing a coin twice is 14 , or 25%. Let’s try
an example that is a little more challenging.
Example B
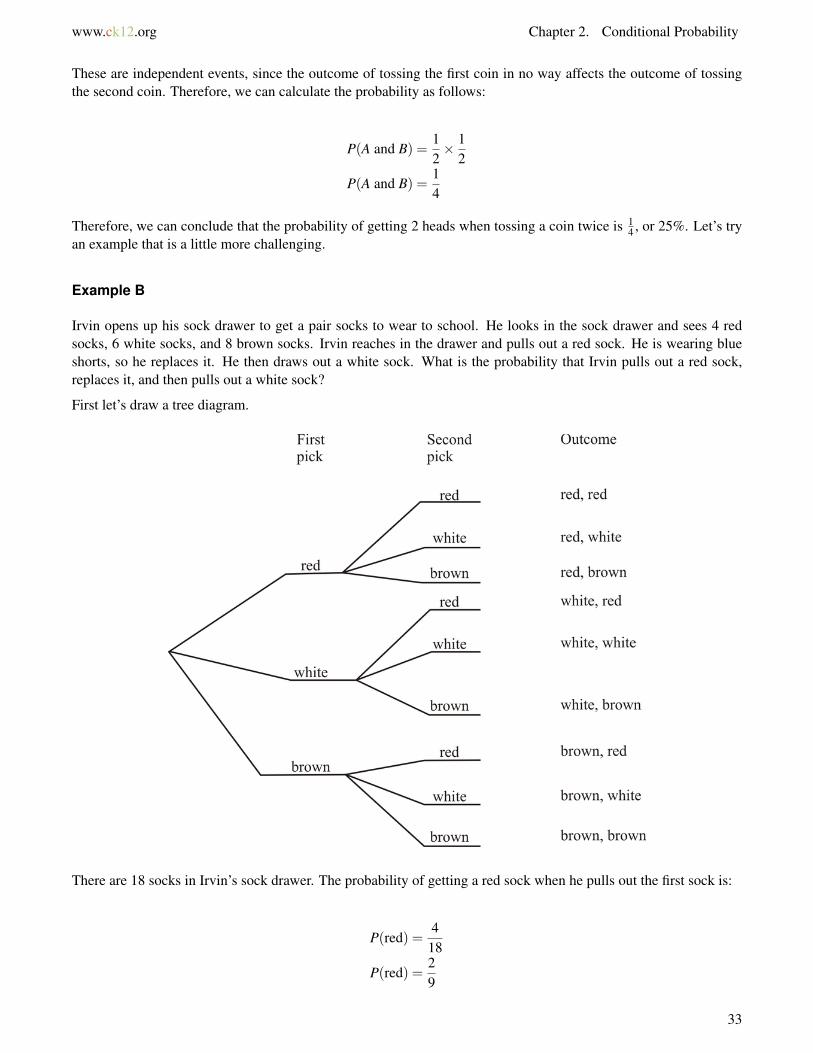
Irvin opens up his sock drawer to get a pair socks to wear to school. He looks in the sock drawer and sees 4 redsocks, 6 white socks, and 8 brown socks. Irvin reaches in the drawer and pulls out a red sock. He is wearing blueshorts, so he replaces it. He then draws out a white sock. What is the probability that Irvin pulls out a red sock,replaces it, and then pulls out a white sock?
First let’s draw a tree diagram.
There are 18 socks in Irvin’s sock drawer. The probability of getting a red sock when he pulls out the first sock is:
P(red) =4
18
P(red) =29
33
2.1. Tree Diagrams www.ck12.org
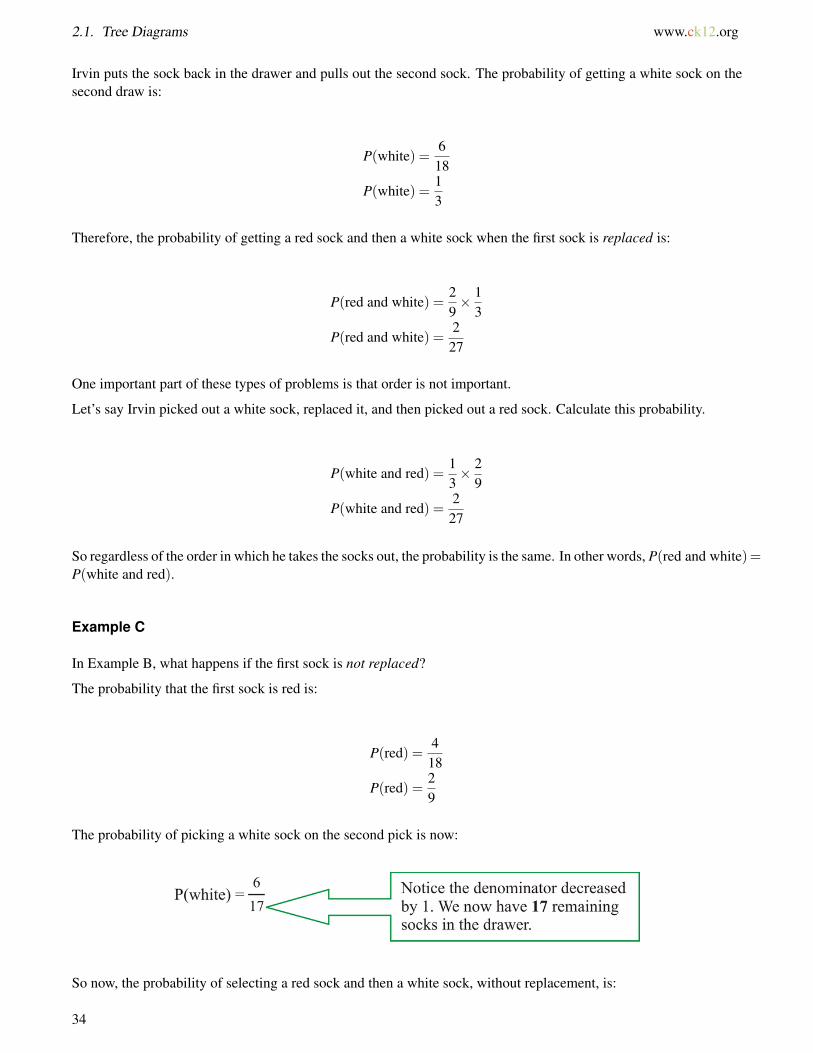
Irvin puts the sock back in the drawer and pulls out the second sock. The probability of getting a white sock on thesecond draw is:
P(white) =618
P(white) =13
Therefore, the probability of getting a red sock and then a white sock when the first sock is replaced is:
P(red and white) =29× 1
3
P(red and white) =227
One important part of these types of problems is that order is not important.
Let’s say Irvin picked out a white sock, replaced it, and then picked out a red sock. Calculate this probability.
P(white and red) =13× 2
9
P(white and red) =227
So regardless of the order in which he takes the socks out, the probability is the same. In other words, P(red and white)=P(white and red).
Example C
In Example B, what happens if the first sock is not replaced?
The probability that the first sock is red is:
P(red) =4
18
P(red) =29
The probability of picking a white sock on the second pick is now:
So now, the probability of selecting a red sock and then a white sock, without replacement, is:
34
www.ck12.org Chapter 2. Conditional Probability
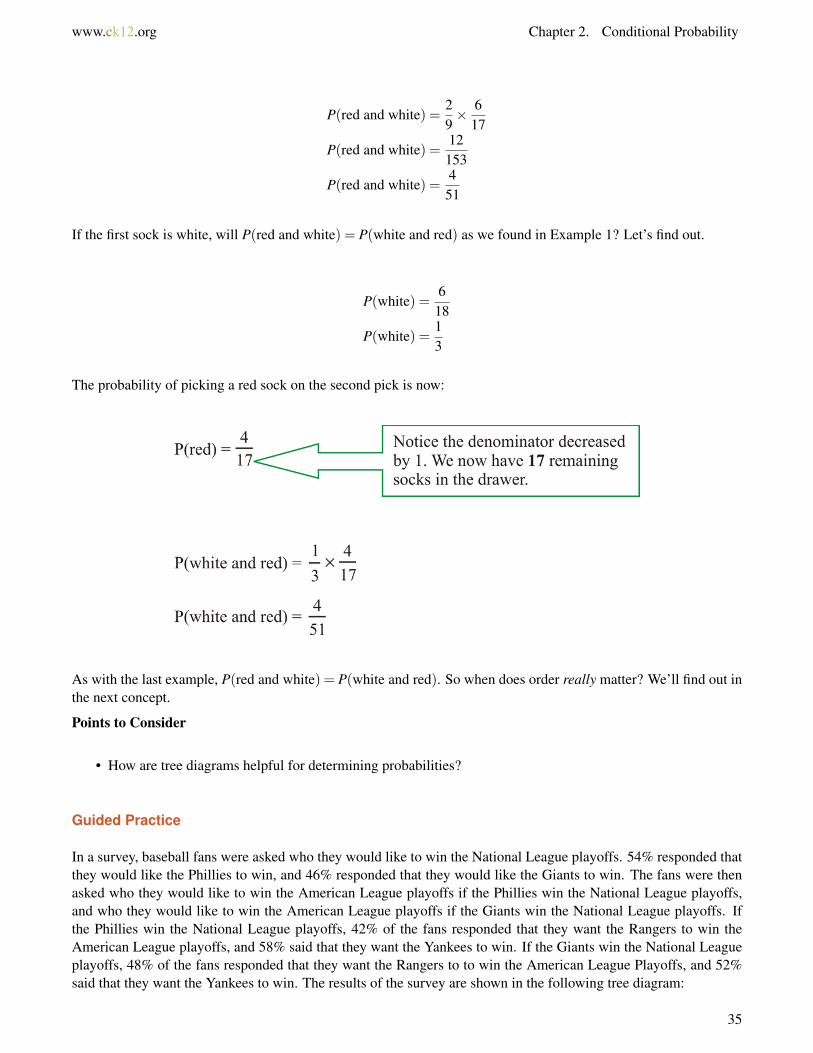
P(red and white) =29× 6
17
P(red and white) =12153
P(red and white) =451
If the first sock is white, will P(red and white) = P(white and red) as we found in Example 1? Let’s find out.
P(white) =618
P(white) =13
The probability of picking a red sock on the second pick is now:
As with the last example, P(red and white) = P(white and red). So when does order really matter? We’ll find out inthe next concept.
Points to Consider
• How are tree diagrams helpful for determining probabilities?
Guided Practice
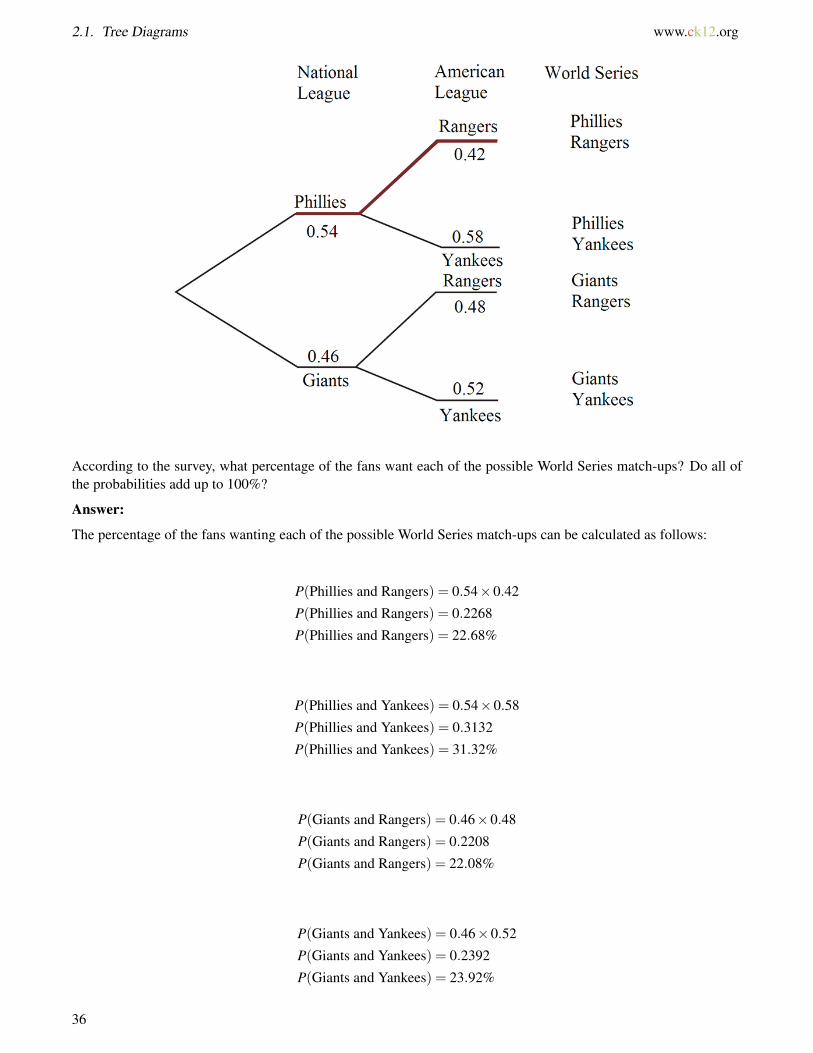
In a survey, baseball fans were asked who they would like to win the National League playoffs. 54% responded thatthey would like the Phillies to win, and 46% responded that they would like the Giants to win. The fans were thenasked who they would like to win the American League playoffs if the Phillies win the National League playoffs,and who they would like to win the American League playoffs if the Giants win the National League playoffs. Ifthe Phillies win the National League playoffs, 42% of the fans responded that they want the Rangers to win theAmerican League playoffs, and 58% said that they want the Yankees to win. If the Giants win the National Leagueplayoffs, 48% of the fans responded that they want the Rangers to to win the American League Playoffs, and 52%said that they want the Yankees to win. The results of the survey are shown in the following tree diagram:
35
2.1. Tree Diagrams www.ck12.org
According to the survey, what percentage of the fans want each of the possible World Series match-ups? Do all ofthe probabilities add up to 100%?
Answer:
The percentage of the fans wanting each of the possible World Series match-ups can be calculated as follows:
P(Phillies and Rangers) = 0.54×0.42
P(Phillies and Rangers) = 0.2268
P(Phillies and Rangers) = 22.68%
P(Phillies and Yankees) = 0.54×0.58
P(Phillies and Yankees) = 0.3132
P(Phillies and Yankees) = 31.32%
P(Giants and Rangers) = 0.46×0.48
P(Giants and Rangers) = 0.2208
P(Giants and Rangers) = 22.08%
P(Giants and Yankees) = 0.46×0.52
P(Giants and Yankees) = 0.2392
P(Giants and Yankees) = 23.92%
36
www.ck12.org Chapter 2. Conditional Probability
Now let’s add up all the probabilities.
22.68%+31.32%+22.08%+23.92% = 100%
All of the probabilities do, in fact, add up to 100%.
Practice
1. A bag contains 3 red balls and 4 blue balls. Thomas reaches in the bag and picks a ball out at random fromthe bag. He places it back into the bag. Thomas then reaches in the bag and picks another ball at random.
(a) Draw a tree diagram to represent this problem.(b) What is the probability that Thomas picks:
i. 2 red ballsii. a red ball in his second draw
2. A teacher has a prize box on her front desk for when students do exceptional work in math class. Inside the boxthere are 20 math pencils and 10 very cool erasers. Janet completed a challenge problem for Ms. Cameron,and Ms. Cameron rewarded Janet’s innovative problem-solving approach with a trip to the prize box. Janetreaches into the box and picks out a prize and then drops it back in. Then she reaches in again and picks out aprize a second time.
a. Draw a tree diagram to represent this problem.b. What is the probability that Janet reaches into the box and picks out an eraser on the second pick?
3. Students in BDF High School were asked about their preference regarding the new school colors. They weregiven a choice between green and blue as the primary color and red and yellow as the secondary color. Theresults of the survey are shown in the tree diagram below. You can see that 75% of the students choose greenas the primary color. Of this 75%, 45% chose yellow as the secondary color. What is the probability that astudent in BDF High School selected red as the secondary color if he or she chose blue as the primary color?
4. In question 3, what color combination do the students in BDF High School want the most?5. According to the following tree diagram, what is the probability of getting 1 head and 1 tail when flipping a
coin 2 times? Note that 1 head and 1 tail can mean a head and then a tail or a tail and then a head.
37
2.1. Tree Diagrams www.ck12.org
6. If a coin is flipped 4 times, how many branches will the tree diagram have that represents this situation?7. If a die is rolled 2 times, how many branches will the tree diagram have that represents this situation?8. Suppose a tree diagram has 4 branches, and the probabilities of the outcomes representing 3 of the branches
are 0.12, 0.53, and 0.28, respectively. What is the probability of the outcome representing the remainingbranch?
9. The following tree diagram represents the responses to 2 yes/no questions:
If the probability of answering yes to both questions is 0.1947, what is the probability of answering yes to thesecond question if the answer to the first question was yes?
10. For question 9, if the probability of answering yes to both questions is 0.1947, what is the probability ofanswering no to the second question if the answer to the first question was yes?
38


![Parallel Algorithms for Solvable Permutation Groupssystem of linear congruences, do not seem to generalize. McKenzie [M&4] com- pares non-Abelian permutation group problems with respect](https://img.pdfslide.net/doc/110x75/5e7a33f7c23135431a221539/parallel-algorithms-for-solvable-permutation-groups-system-of-linear-congruences.jpg)