Embed Size (px)
Citation preview

23.8.2007
TOLERATE research meeting
Progress by FMI: results & planned actions
Kirsti Jylhä
Thanks to material: Kimmo Ruosteenoja, Ari Venäläinen, Seppo Saku,Tiina Kilpeläinen, Teija Seitola
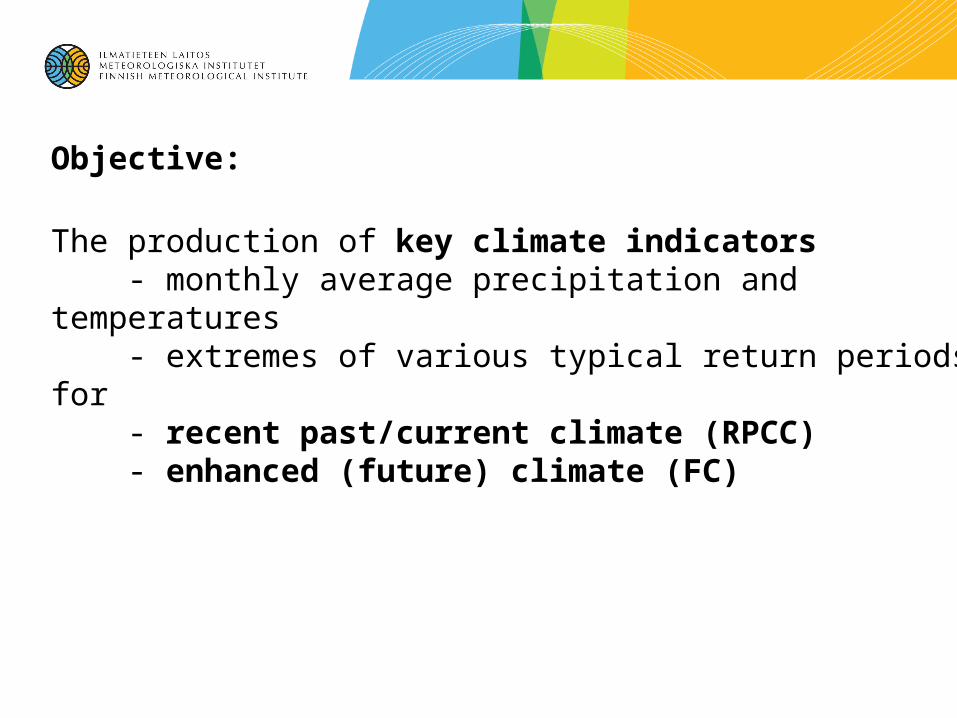
The production of key climate indicators - monthly average precipitation and temperatures - extremes of various typical return periods for - recent past/current climate (RPCC) - enhanced (future) climate (FC)
Objective:

- 2.5 ° x 2.5° grid covering Finland and the surroundings- Both multi-model mean changes based on 19 global climate models and projected changes separately from a subset of the models (7 GCMs) - A2, A1B and B1 emission scenarios - future periods 2020-49 and 2070-99, control period 1971-2000
Deliverables from FMI to SYKE by August 2007
• A draft for the report by Venäläinen et al. (2007): Sään ääri-ilmiöistä Suomessa. (Aspects about climate extremes in Finland) Raportteja 2007: x, Ilmatieteen laitos. (about 75 pages, including Appendices)
• Two data files for changes in monthly mean temperature and precipitation:
Work in progress: changes in precipitation amounts with return periods of 10 and 100 years

Recent past/current climate (RPCC)
• 12 weather stations in Finland
• Daily data from ~ 40 – 60 years
Ref. Venäläinen et al. (2007)
Peaks-over-threshold (POT) method (Generalized Pareto distribution)using the eXtremes Toolkit (developed in NCAR)

Pre
cip
itat
ion
(m
m)
Return period (years) Return period (years)
Return period (years)Ref. Venäläinen et al. (2007)
max75th percentilemedian25th percentilemin
Return level estimates for precipitation amounts:rather large inter-stationdifferences
• random variability
• the relatively short periods of data (in digital form)
• spatial variation of climate
12 stations
Pre
cip
itat
ion
(m
m)
Pre
cip
itat
ion
(m
m)
RPCC

Return level estimates for duration of spells with only a small amount of precipitation*
max75th percentilemedian25th percentilemin
12 stations
Ref. Venäläinen et al. (2007)
*Total accumulated rain amountduring the time periodremains below a fixed threshold (10, 50, 100 or 200 mm)
RPCC

1971-2000 => 2020-2049Scenario Temperature rise (ºC)
A1FI 2.3 (1.2 – 3.3)
A2 2.0 (1.1 – 2.9)
A1B 2.1 (1.1 – 3.1)
A1T 2.5 (1.4 – 3.7)
B2 2.2 (1.2 – 3.2)
B1 1.9 (0.9 – 2.9)
Projected warming in Finland
Annual mean temperature
Cha
nge
in t
empe
ratu
re
(ºC
)Future climate FC
Ref: K. Ruosteenoja
Based on 19 GCMs, employed in the IPCC 4th Assessment Report
Multi-model means and 5-95% rangesof the model resultsbased on a Gaussian fit
0
10
20
30
2000 2050 2100
(Gt
C/v
uosi
)
Emission scenario
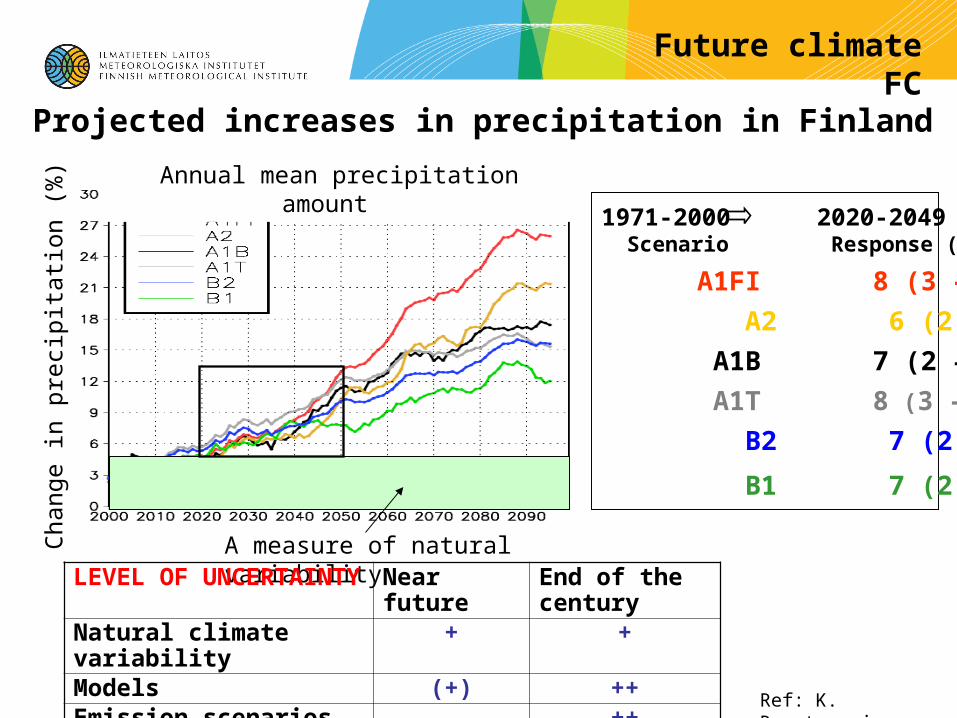
1971-2000 2020-2049 Scenario Response (%)
A1FI 8 (3 – 13)
A2 6 (2 – 11)
A1B 7 (2 – 12)
A1T 8 (3 – 14)
B2 7 (2 – 12)
B1 7 (2 – 11) Cha
nge
in p
reci
pita
tion
(%)
Annual mean precipitation amount
Projected increases in precipitation in Finland
Ref: K. Ruosteenoja
A measure of natural variability
Future climate FC
LEVEL OF UNCERTAINTY
Near future End of the century
Natural climate variability + +Models (+) ++Emission scenarios ++

• Larger changes in winter than in summer
• Little differences between the various emission scenarios
0
10
20
30
2000 2050 2100
(Gt
C/v
uosi
)
Emission scenario
Projected changes in monthly mean temperature (°C) in Finland by 2020-49*
*relative to 1971-2000
Cha
nge
in t
empe
ratu
re
(ºC
)
J F M A M J J A S O N D

1 vrk sademäärä
0
20
40
60
80
100
DMI_1 DMI_2 DMI_3 HC ETH SMHI KNMI
tois
tuvuusta
so [m
m]
10 v: 1961-1990
100 v:1961-1990
10 v: 2071-2100
100 v: 2071-2100
One-day precipitation amount (mm) with a return period of 10 and 100 years on the basis observations and climate model simulations (an example, Turku)
Ret
urn
leve
l (m
m)
Regional climate model experiments
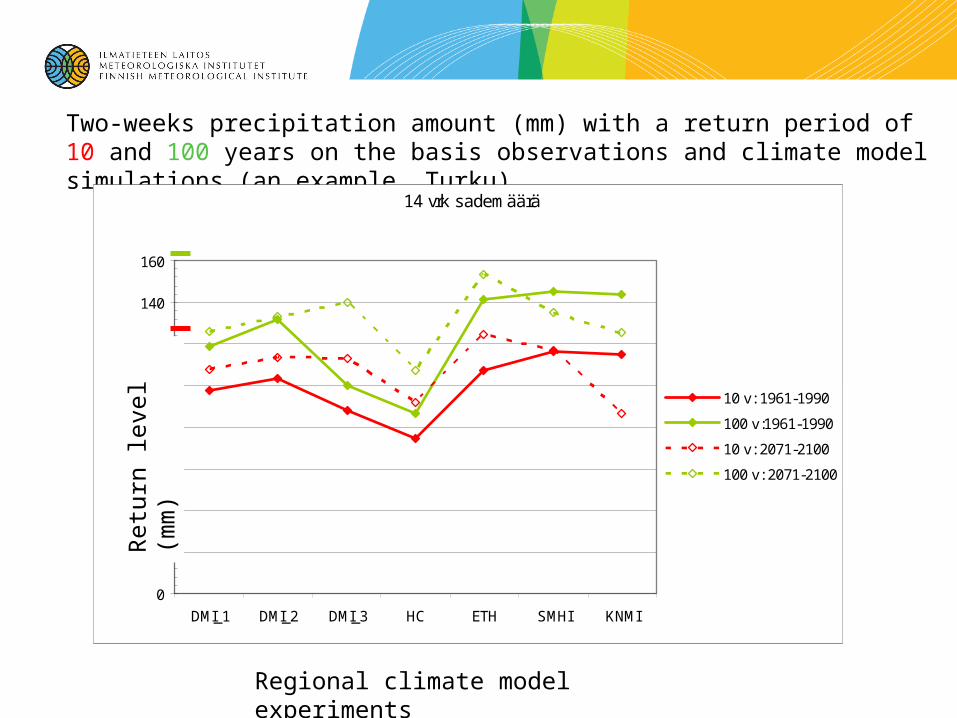
Two-weeks precipitation amount (mm) with a return period of 10 and 100 years on the basis observations and climate model simulations (an example, Turku)
Regional climate model experiments
Ret
urn
leve
l (m
m)
14 vrk sademäärä
0
20
40
60
80
100
120
140
160
DMI_1 DMI_2 DMI_3 HC ETH SMHI KNMI
tois
tuvu
ust
aso
[mm
]
10 v: 1961-1990
100 v:1961-1990
10 v: 2071-2100
100 v: 2071-2100
Ret
urn
leve
l (m
m)
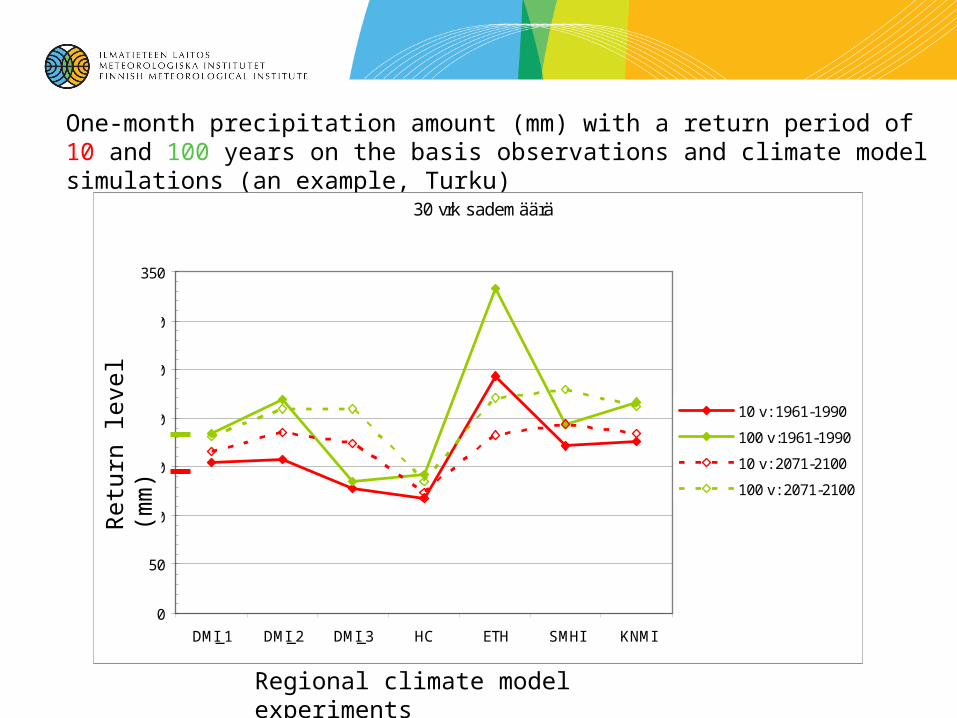
One-month precipitation amount (mm) with a return period of 10 and 100 years on the basis observations and climate model simulations (an example, Turku)
Regional climate model experiments
30 vrk sademäärä
0
50
100
150
200
250
300
350
DMI_1 DMI_2 DMI_3 HC ETH SMHI KNMI
tois
tuvu
ust
aso
[mm
]
10 v: 1961-1990
100 v:1961-1990
10 v: 2071-2100
100 v: 2071-2100
Ret
urn
leve
l (m
m)

90th percentile of the monthly mean daily maximum temperature in summers 1961-1990 in a regional climate model experiment driven by ERA40*
*ERA40= a global atmospheric analysis of conventional and satellite observations in 1957-2002
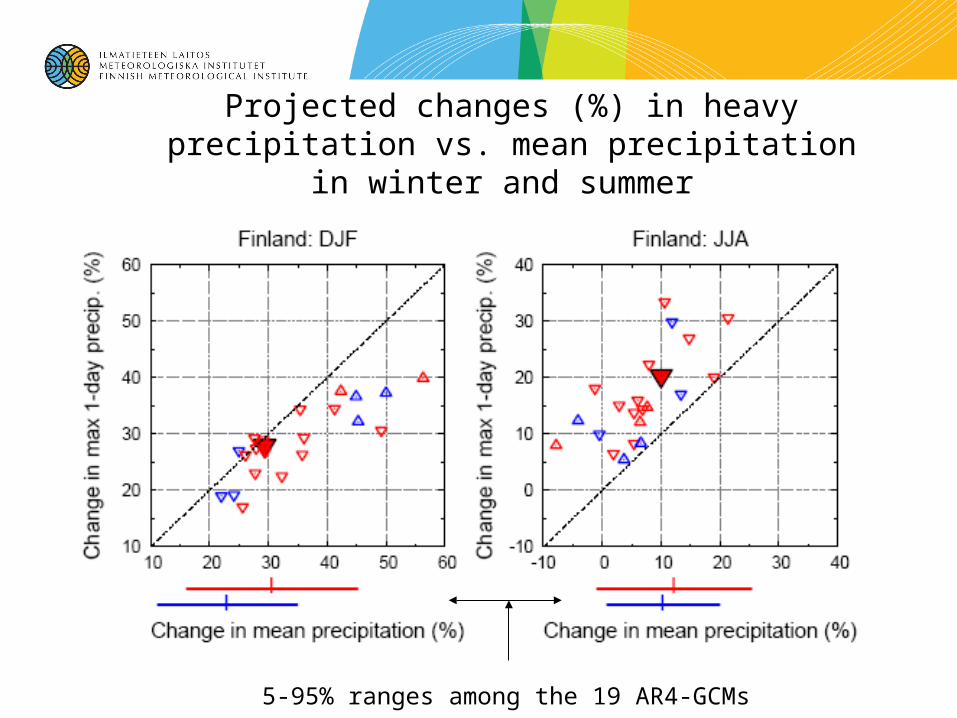
Projected changes (%) in heavy precipitation vs. mean precipitation in winter and summer
5-95% ranges among the 19 AR4-GCMs

- 2.5 ° x 2.5° grid covering Finland and the surroundings- Both multi-model mean changes based on 19 global climate models and projected changes separately from a subset of the models (7 GCMs) - A2, A1B and B1 emission scenarios - future periods 2020-49 and 2070-99, control period 1971-2000
Deliverables from FMI to SYKE by August 2007
• A draft for the report by Venäläinen et al. (2007): Sään ääri-ilmiöistä Suomessa. (Aspects about climate extremes in Finland) Raportteja 2007: x, Ilmatieteen laitos. (about 75 pages, including Appendices)
• Two data files for changes in monthly mean temperature and precipitation:
Work in progress: changes in precipitation amounts with return periods of 10 and 100 years


![[Elisabeth Ellingsen, Kirsti Mac Donald] Pa Vei (T(BookFi.org)](https://img.pdfslide.net/doc/110x75/55cf9783550346d0339209c5/elisabeth-ellingsen-kirsti-mac-donald-pa-vei-tbookfiorg.jpg)