Embed Size (px)
Citation preview

2016 ANNUAL BUSINESS MEETING Via Web Conference
Audio Participation US/CAN Toll free: 800-238-9007
Int'l Toll: 719-325-2139 Participant Passcode: 499726
Thursday, November 3, 2016
5:00PM (ET)
Association for Professionals in Infection Control and Epidemiology 1400 Crystal Drive, Suite 900
Arlington, VA 22202 Phone: 202-789-1890
Fax: 202-789-1899

ANNUAL BUSINESS MEETING via WEB CONFERENCE November 3, 2016
5:00 – 6:00 PM (ET)
AGENDA 5:00 pm Call to Order/President’s Welcome ..........................................Susan Dolan, President 5:02 pm Explanation of Meeting Rules of Conduct .................................Susan Dolan 5:07 pm Adoption of Agenda ................................................................Susan Dolan 5:08 pm Approval of the Minutes: 2015 Annual Business Meeting ...........Linda McKinley, Secretary 5:10 pm State of the Association Report ...............................................Susan Dolan Katrina Crist, Chief Executive Officer 5:25 pm Finance Committee Report......................................................Marc-Oliver Wright, Treasurer George Margula, Chief Financial Officer 5:35 pm Audit Committee Report .........................................................Linda Greene, President-elect 5:45 pm Questions & Answers Session..................................................Susan Dolan 6:00 pm Closing Remarks/Adjourn .......................................................Susan Dolan Written reports included in Annual Business Meeting Packet:
Future Annual Business Meetings to be held by web conference
Affiliate Reports • Report of the American Journal of
Infection Control • Report of APIC Consulting Services • Report of the Certification Board of
Infection Control
• 2015 APIC Audited Financial Statements

SSttaannddiinngg RRuulleess ooff tthhee AAPPIICC BBuussiinneessss MMeeeettiinngg//WWeebb CCoonnffeerreennccee
Please review these rules prior to the Annual Business Meeting. 1. Any agenda items for the Business Meeting/Web Conference must be
presented in writing by 5:00 p.m. the day before the event. Items should be emailed to [email protected]. Please indicate Annual Business Meeting in the subject line.
2. A member desiring to address the Business Meeting shall be recognized by
indicating to the conference operator your desire to speak. Instructions will be provided by the operator at the start of the meeting. When recognized, state your name, city or Chapter before addressing the Assembly.
3. Questions, parliamentary inquiries or information may be addressed by
using the “chat” feature of the online web conference or by indicating to the operator your desire to speak.
4. No member shall speak in debate more than once on the same question or
longer than two minutes without permission of the Assembly. 5. The question will automatically be called on each item of business after
five minutes of debate except for Bylaw amendments, where each article shall be allowed five minutes of debate.
6. The Chair may request that all motions be in writing, signed by the maker
and presented to the Secretary.
7. Affiliate Reports will not be read during the Business Meeting. They are included as informational items as part of the Business Meeting agenda packet.

2015 Annual Business Meeting
MINUTES
Thursday, November 12, 2015

42nd ANNUAL BUSINESS MEETING Held via web conference
Thursday, November 12, 2015
1. Call to Order APIC’s 42nd Annual Business Meeting was called to order by 2015 President, Mary Lou manning at 4:00pm (ET).
2. Board Members Participating
Mary Lou Manning, PhD, CRNP, CIC, FAAN, FNAP (President) Jennie Mayfield, BSN, MPH, CIC (Immediate Past President) Connie Steed, RN, MSN, CIC (Secretary) Joseph Bosco, MD Kim Delahanty, RN, BSN, PHN, MBA/HCM, CIC Susan Dolan, RN, MS, CIC Gail Fraine, RN, MMHC, BSN, CIC Deborah Friberg, MBA, FACHE Brenda Grant, RN, BSN, MPH, CIC, CHES Janet Haas, RN, PhD, CIC Karen Hoffmann, RN, MS, CIC Linda McKinley, RN, BSN, MPH, CIC Ann Marie Pettis, RN, BSN, CIC Kathy Ward, RN, BSN, MPH, CIC Kathy Ware, RN, BSN, CIC
Ex Officio: Katrina Crist, MBA (Chief Executive Officer)
3. Board Members Unable to Participate Marc-Oliver Wright, MT(ASCP), MS, CIC (Treasurer)
4. Introductions and Welcome
Dr. Manning welcomed participants to APIC’s Annual Business Meeting. Members of the 2015 Board of Directors were introduced.
5. Explanation of Meeting Rules of Conduct
Dr. Manning directed the audience’s attention to the Standing Rules document included in the agenda packet for the Business Meeting. Hearing no questions, the Standing Rules were adopted as presented. Dr. Manning announced that APIC Staff would serve as timekeeper for the meeting.

2015 Annual Business Meeting Page 2 of 2
6. Adoption of the Agenda
Dr. Manning directed the audience’s attention to the agenda included in their meeting packet. Hearing no objections regarding the agenda, the agenda was adopted as presented.
7. Approval of the Minutes of the 2014 Annual Business Meeting
Ms. Steed, 2015 Secretary, announced that the APIC Board of Directors had approved the minutes of the 2014 Annual Business Meeting. Members were offered an opportunity to ask questions regarding the minutes. Hearing no questions regarding the 2014 Annual Business Meeting minutes, Ms. Steed announced that the APIC Board of Directors would be asked to approve the minutes of the 2015 Annual Business Meeting in the same manner. The 2015 minutes will be presented to the membership at the next 2016 Annual Business Meeting.
8. State of the Association Report Ms. Crist, APIC CEO, provided the State of the Association Report. The 2015 report focused on three themes – rapid response, meeting members where they are and defining the need/framing the future.
9. Finance Report
Mr. Margula provided a brief overview of the Association’s finances highlighting key areas. His report included a review of the September 2015 statement of financial activities and statement of financial position.
10. Audit Committee Report Ms. Dolan presented the results of the 2014 Audit. Ms. Dolan reviewed the audit procedures and rationale as well as provided an overview of APIC’s financial performance for 2013 and 2014. She reported that since the meeting materials were made available to the membership, APIC had received a final “clean” audit report.
11. Questions and Answers Session Dr. Manning opened the floor to questions from members.
12. Adjournment There being no additional business to discuss, Dr. Manning adjourned the meeting at approximately 5:00 pm (ET).
Respectfully Submitted, Connie Steed, RN, MSN, CIC (2015 Secretary) Approved by APIC Board of Directors: August 3,2015

Finance Committee Report

Page 1 of 12
MEMORANDUM August 25, 2016 To: Board of Directors Finance Committee From: Katrina Crist, CEO George Margula, EVP/CFO Re: July 2016 Financial Update and Reports. Enclosed please find the following financial reports for the seven months ended July 31, 2016:
� Statement of Financial Activity – Consolidated � Statement of Financial Position � Statement of Financial Activity by Program
Statement of Financial Activity:
Y-T-D Y-T-D Fav(UnFav) 2016 Pct of Actual Budget Variance Budget Bdgt
Revenue $9,340,552 $9,764,508 ($423,956) $12,721,100 73.4%Expense 7,357,063 7,807,216 450,153 12,706,100 57.9%
Net revenue 1,983,489 1,957,292 26,197 15,000
Investments 161,899 161,899
Incr net assets $2,145,388 $1,957,292 $188,096 $15,000
Overview: Overall Revenues were $9.3M and were ($424K) or (4.3%) less than YTD budget. Revenue from member dues was at $2.35M, 92% of $2.56M annual budget and currently tracking ahead of prior year’s actual. Total registrations were $2.3M, ($54K) unfavorable to YTD budget; total annual conference registrations were $1.5M and at budget: Conference registrations were $1.46M, $13K better than annual budget and the pre-conference course registrations were $41K, ($18K) less than the annual budget. Overall registrations for Education was $780K, ($42) under YTD budget: registrations for the Academy includes four live courses: EPI 101/201; $273K, $27K better than budget; Ambulatory care 101/201; $78K, ($39K) under budget; and one workshop, $21K, ($2K) under budget. Online courses registration was $173K, $48K over YTD budget.

Page 2 of 12
The four completed EPI Intensives had registrations at $178K, $18K better than budget. Other revenues: two preconference courses at $68K, ($42K) less than budget; Healthcare Learning Lab at $9.5K, ($28K) under budget, and AAAHC at $20K, $7K better than YTB budget. Advertising revenue was $28K, ($7K) under YTD budget. Ad Sales for E-News and other online newsletters was ($2K) under YTD budget but trending ahead of last year’s level of $4K. It is anticipated that advertising sales would increase in the third quarter of the year when the Industry Perspective website will be launched in September 2016. Total sponsorships were $1.32M, ($278K) less than YTD budget of $1.6M. Conference sponsorships were $480K, ($99K) less than annual budget of $580K. The decline in conference sponsorship revenue is attributed to reduction in spending for 5 key 2015 Sponsors. Strategic partners were at $645K, ($150K) unfavorable with 11 of 15 committed; other sponsorships include $44K, ($30K) under YTD budget for the academies, $25K for Peer Panels, $7K, ($8K) under YTD budget for Healthcare IT, and $93K for AJIC, which is at par with budget. Exhibitor fees revenue was $1.64M, or 99.6% of annual budget and exceeded last year levels by $73K. Products revenue was $488K, ($24K) unfavorable to YTD budget; sales of APIC TEXT were $162K, ($61K) less than YTD budget and all other product sales were $325K, $37K over YTD budget. Sales of the IP Manual for Construction were $48K, ($16K) under YTD budget; Long Term Care Manual, $39K, $20K over YTD budget; sales of the Certification Study Guide were $131K, $33K over YTD budget; sales of the new statistics book released at the annual conference was $32K, $2K over YTD budget and already attained over 63% of annual budget; logo merchandise sales attained 100% of annual budget at $25K; other products including Ready Reference and Infection Preventionists’ Guide to Labs had combined sales of $41K, $5K over YTD budget. Grant funding from HRET was $149K, ($4K) under $154K YTD budget. The revenue includes the ongoing HRET grants plus additional grants for long term care and ambulatory care. Other grants with the CDC and New Hampshire are planned to begin in the third quarter of the year. Subscription revenue for the APIC Text Online was $435K, $5K ahead of YTD budget of $430K; prior year revenue was $390K for the same period for individuals and institutions. Expenses: Overall expenses were $7.3M and were $530K or 6.3% favorable to YTD budget. Key expense variances favorable (unfavorable) occurred in the following cost areas: Event expenses, ($46K); Travel, $123K; Printing & Production, ($6K); Marketing costs, $51K; Professional fees, ($19K); Technology costs, $7K; Administration costs, $12K; Financial expenses, $47K; and Compensation costs were $281K less than YTD budget of $3.1M.
Favorable / unfavorable variances exceeding +/- $30K:
• Audio Visual, ($27K) unfavorable to budget for annual conference ($15.7K) and the spring academy ($21K).

Page 3 of 12
• Catering, ($47K) unfavorable for catering costs: ($54K) unfavorable for spring academy sessions in San Diego; $23K favorable for annual conference and ($11K) unfavorable for membership events at annual conference, and ($12K) unfavorable for governance.
• Decorator Fees, $36K favorable; $33K favorable for setups for exhibitors at annual conference.
• Logistics Management, ($44K) unfavorable for fees paid to our outsource conference managers and offset by hotel commissions recorded under other revenue.
• Hotel, $65K favorable to budget; $43K for discounts and comp rooms from the various hotels at annual conference and $15K timing of activities for other program areas and to some extent may be due to timing of travel expense submissions by speakers and others.
• Transfer to inventory, ($69K) unfavorable for cost of design and printing of books, (Statistics, Construction Manual, Ready Reference to Research) that are transferred from printing expense.
• Temporary Help, ($33K) unfavorable variance to YTD budget due to temporary staffing for open positions in membership, accounting, education and strategic partner and special projects.
• Salaries, $182K favorable variance to YTD budget due to staff position vacancies that are in various stages of recruitment.
The net revenue from operations was $2.0M compared to YTD budget of $1.96M. Investment income was $162K. The change in net assets including investments was $2.15M or $188K favorable to YTD budget of $1.96M. Programs: Annual Conference: YTD revenue of $3.8M was ($107K) unfavorable to the $3.87M YTD budget. Total registrations were $1.5M, ($6K) under YTD budget; last year registrations were $1.64M. Sponsorship revenue was $480K compared to budget of $580K. Exhibitor space sales were $1.6M, 99.6% of budget and ($7K) under the $1.65M budget. Total operating expenses were $1.7M, $114K under $1.8M YTD budget; last year for the same period expenses were $1.7M. Expenses incurred were in line with budget except for AV equipment and logistics management fees, which were over budget by $16K and $42K, respectively. The overall expenses to budget were favorable by $114K with some additional minor invoices and adjustments still pending. Education: YTD revenue of $858K was ($54K) under YTD budget of $912K. The online e-learning courses had $172K, $48K favorable to YTD budget. Registrations for the live spring Academy for EPI 101 & 102 were $272K, $27K over budget and the Ambulatory care (ASC’s) course was $77k, ($39K) under budget, the advanced workshop had $21K in registrations, ($2K) unfavorable to budget; sponsorships for the academy’s live courses was $34K, (40K) unfavorable to YTD budget. Additionally, preconference registration was $27K and the EPI Intensive courses had $178K in registration revenue, $18k favorable to YTD budget. Overall expenses were $578K, ($73K) over YTD budget of $505K, last year for the same period expenses were $430K. SPP and Special Programs: YTD revenues of $698K, ($142K) unfavorable to YTD budget; revenue is from the strategic partner program at $645K with 11 out of 15 strategic partners
Page 4 of 12
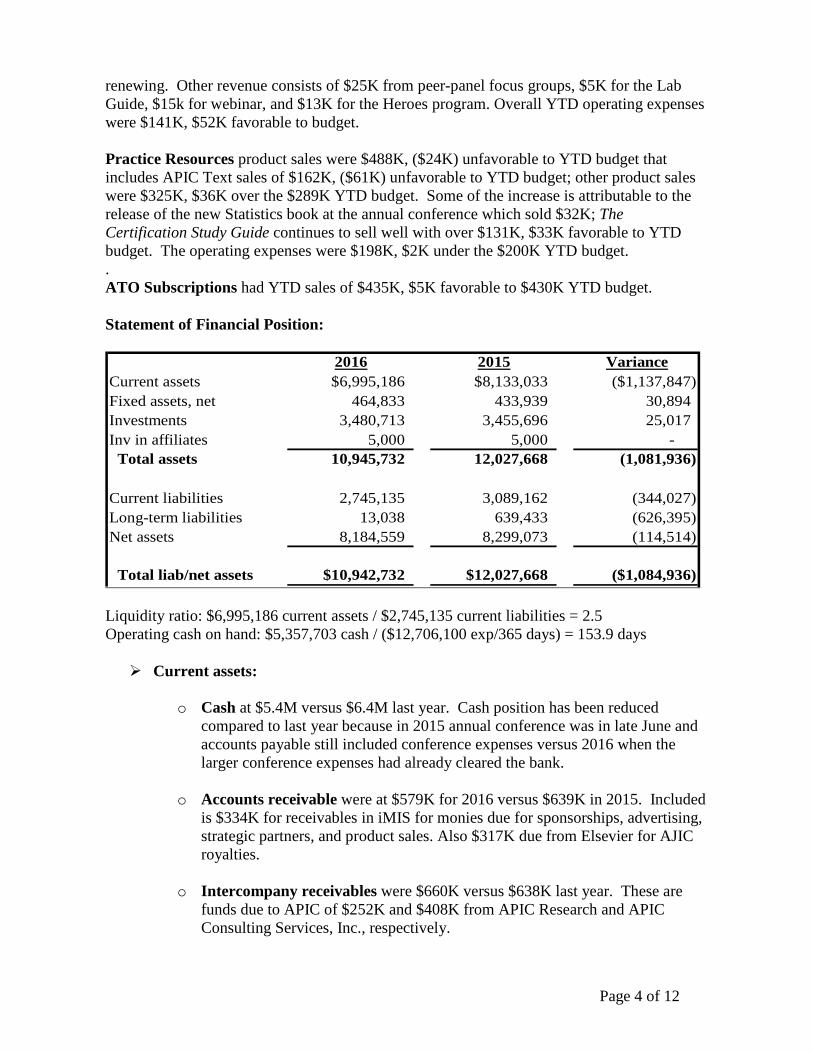
renewing. Other revenue consists of $25K from peer-panel focus groups, $5K for the Lab Guide, $15k for webinar, and $13K for the Heroes program. Overall YTD operating expenses were $141K, $52K favorable to budget. Practice Resources product sales were $488K, ($24K) unfavorable to YTD budget that includes APIC Text sales of $162K, ($61K) unfavorable to YTD budget; other product sales were $325K, $36K over the $289K YTD budget. Some of the increase is attributable to the release of the new Statistics book at the annual conference which sold $32K; The Certification Study Guide continues to sell well with over $131K, $33K favorable to YTD budget. The operating expenses were $198K, $2K under the $200K YTD budget. . ATO Subscriptions had YTD sales of $435K, $5K favorable to $430K YTD budget. Statement of Financial Position:
2016 2015 VarianceCurrent assets $6,995,186 $8,133,033 ($1,137,847)Fixed assets, net 464,833 433,939 30,894 Investments 3,480,713 3,455,696 25,017 Inv in affiliates 5,000 5,000 - Total assets 10,945,732 12,027,668 (1,081,936)
Current liabilities 2,745,135 3,089,162 (344,027) Long-term liabilities 13,038 639,433 (626,395) Net assets 8,184,559 8,299,073 (114,514)
Total liab/net assets $10,942,732 $12,027,668 ($1,084,936)
Liquidity ratio: $6,995,186 current assets / $2,745,135 current liabilities = 2.5 Operating cash on hand: $5,357,703 cash / ($12,706,100 exp/365 days) = 153.9 days
� Current assets:
o Cash at $5.4M versus $6.4M last year. Cash position has been reduced compared to last year because in 2015 annual conference was in late June and accounts payable still included conference expenses versus 2016 when the larger conference expenses had already cleared the bank.
o Accounts receivable were at $579K for 2016 versus $639K in 2015. Included
is $334K for receivables in iMIS for monies due for sponsorships, advertising, strategic partners, and product sales. Also $317K due from Elsevier for AJIC royalties.
o Intercompany receivables were $660K versus $638K last year. These are
funds due to APIC of $252K and $408K from APIC Research and APIC Consulting Services, Inc., respectively.
Page 5 of 12
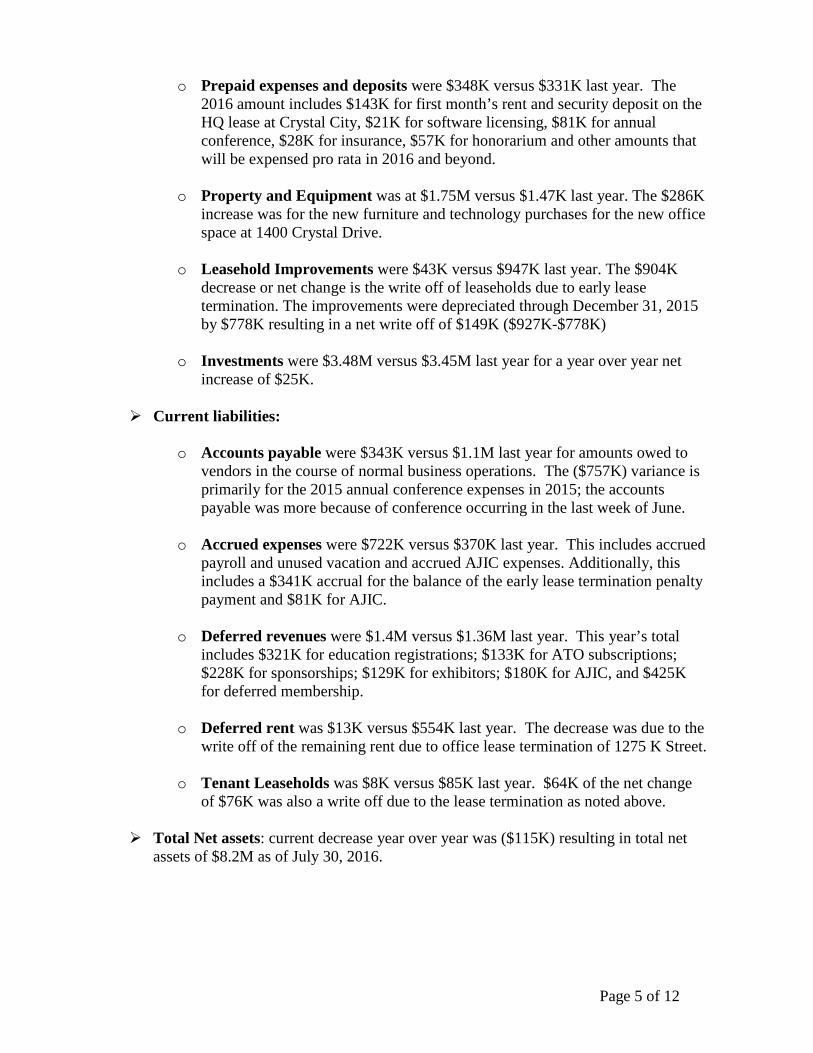
o Prepaid expenses and deposits were $348K versus $331K last year. The 2016 amount includes $143K for first month’s rent and security deposit on the HQ lease at Crystal City, $21K for software licensing, $81K for annual conference, $28K for insurance, $57K for honorarium and other amounts that will be expensed pro rata in 2016 and beyond.
o Property and Equipment was at $1.75M versus $1.47K last year. The $286K
increase was for the new furniture and technology purchases for the new office space at 1400 Crystal Drive.
o Leasehold Improvements were $43K versus $947K last year. The $904K
decrease or net change is the write off of leaseholds due to early lease termination. The improvements were depreciated through December 31, 2015 by $778K resulting in a net write off of $149K ($927K-$778K)
o Investments were $3.48M versus $3.45M last year for a year over year net
increase of $25K.
� Current liabilities:
o Accounts payable were $343K versus $1.1M last year for amounts owed to vendors in the course of normal business operations. The ($757K) variance is primarily for the 2015 annual conference expenses in 2015; the accounts payable was more because of conference occurring in the last week of June.
o Accrued expenses were $722K versus $370K last year. This includes accrued
payroll and unused vacation and accrued AJIC expenses. Additionally, this includes a $341K accrual for the balance of the early lease termination penalty payment and $81K for AJIC.
o Deferred revenues were $1.4M versus $1.36M last year. This year’s total
includes $321K for education registrations; $133K for ATO subscriptions; $228K for sponsorships; $129K for exhibitors; $180K for AJIC, and $425K for deferred membership.
o Deferred rent was $13K versus $554K last year. The decrease was due to the
write off of the remaining rent due to office lease termination of 1275 K Street.
o Tenant Leaseholds was $8K versus $85K last year. $64K of the net change of $76K was also a write off due to the lease termination as noted above.
� Total Net assets: current decrease year over year was ($115K) resulting in total net
assets of $8.2M as of July 30, 2016.
Budget Actual Actual VarianceDescription Annual Year-to-Date Year-to-Date Year-to-Date Actual Vs.
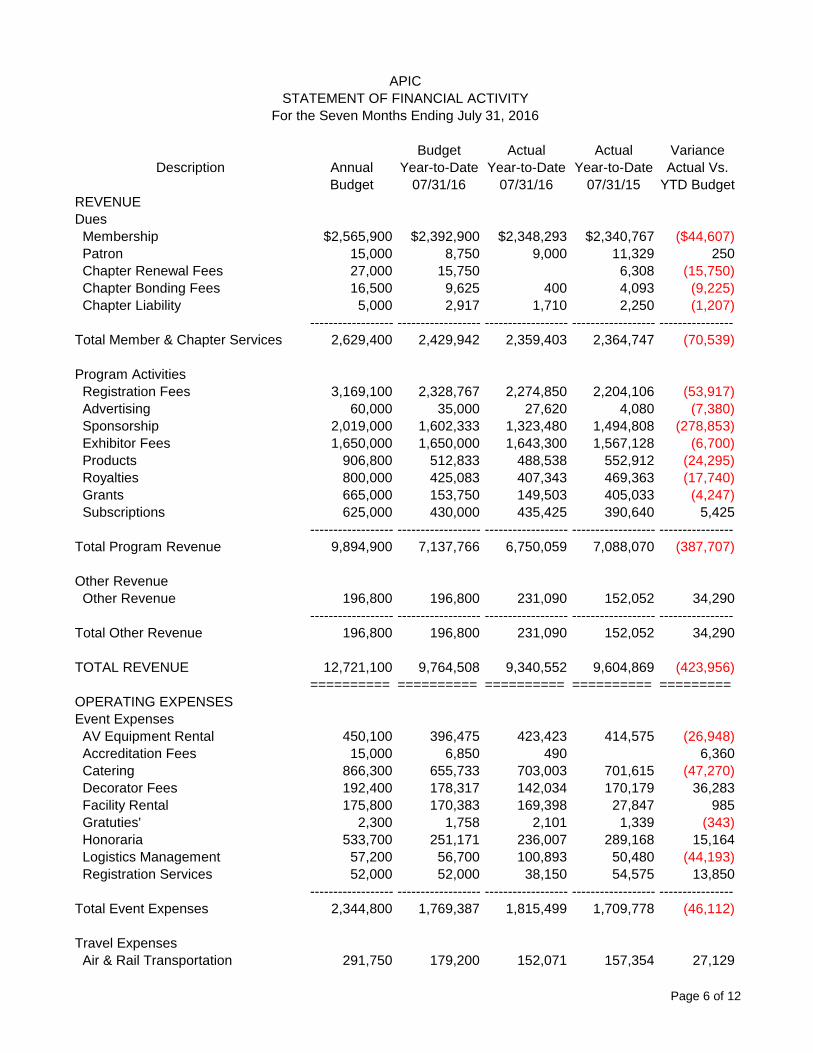
Budget 07/31/16 07/31/16 07/31/15 YTD BudgetREVENUEDues Membership $2,565,900 $2,392,900 $2,348,293 $2,340,767 ($44,607) Patron 15,000 8,750 9,000 11,329 250 Chapter Renewal Fees 27,000 15,750 6,308 (15,750) Chapter Bonding Fees 16,500 9,625 400 4,093 (9,225) Chapter Liability 5,000 2,917 1,710 2,250 (1,207)
------------------ ------------------ ------------------ ------------------ ----------------Total Member & Chapter Services 2,629,400 2,429,942 2,359,403 2,364,747 (70,539)
Program Activities Registration Fees 3,169,100 2,328,767 2,274,850 2,204,106 (53,917) Advertising 60,000 35,000 27,620 4,080 (7,380) Sponsorship 2,019,000 1,602,333 1,323,480 1,494,808 (278,853) Exhibitor Fees 1,650,000 1,650,000 1,643,300 1,567,128 (6,700) Products 906,800 512,833 488,538 552,912 (24,295) Royalties 800,000 425,083 407,343 469,363 (17,740) Grants 665,000 153,750 149,503 405,033 (4,247) Subscriptions 625,000 430,000 435,425 390,640 5,425
------------------ ------------------ ------------------ ------------------ ----------------Total Program Revenue 9,894,900 7,137,766 6,750,059 7,088,070 (387,707)
Other Revenue Other Revenue 196,800 196,800 231,090 152,052 34,290
------------------ ------------------ ------------------ ------------------ ----------------Total Other Revenue 196,800 196,800 231,090 152,052 34,290
TOTAL REVENUE 12,721,100 9,764,508 9,340,552 9,604,869 (423,956)========== ========== ========== ========== =========
OPERATING EXPENSESEvent Expenses AV Equipment Rental 450,100 396,475 423,423 414,575 (26,948) Accreditation Fees 15,000 6,850 490 6,360 Catering 866,300 655,733 703,003 701,615 (47,270) Decorator Fees 192,400 178,317 142,034 170,179 36,283 Facility Rental 175,800 170,383 169,398 27,847 985 Gratuties' 2,300 1,758 2,101 1,339 (343) Honoraria 533,700 251,171 236,007 289,168 15,164 Logistics Management 57,200 56,700 100,893 50,480 (44,193) Registration Services 52,000 52,000 38,150 54,575 13,850
------------------ ------------------ ------------------ ------------------ ----------------Total Event Expenses 2,344,800 1,769,387 1,815,499 1,709,778 (46,112)
Travel Expenses Air & Rail Transportation 291,750 179,200 152,071 157,354 27,129
APICSTATEMENT OF FINANCIAL ACTIVITY
For the Seven Months Ending July 31, 2016
Page 6 of 12

Budget Actual Actual VarianceDescription Annual Year-to-Date Year-to-Date Year-to-Date Actual Vs.
Budget 07/31/16 07/31/16 07/31/15 YTD Budget
APICSTATEMENT OF FINANCIAL ACTIVITY
For the Seven Months Ending July 31, 2016
Hotel & Lodging 379,300 258,565 193,694 249,002 64,871 Meals & Entertainment 97,000 54,450 28,580 33,184 25,870 Ground Transportation 60,350 36,704 31,364 80,847 5,340
------------------ ------------------ ------------------ ------------------ ----------------Total Travel and Transportation 828,400 528,919 405,709 520,387 123,210
Printing , Production & Delivery Printing 250,100 135,875 89,956 91,369 45,919 Video & Audio Reproduction 70,500 65,292 60,384 112,505 4,908 Editorial Service Fees 175,600 99,517 94,579 106,147 4,938 Graphic Design Fees 24,500 16,375 12,719 39,774 3,656 Scanning Service Fees 3,218 5,397 (3,218) Mail House (Non Marketing) 42,500 24,792 30,841 37,206 (6,049) Cost of Sales (Products) 162,350 86,392 65,148 107,183 21,244 Transfer to Inventory (207,850) (109,871) (40,818) (62,632) (69,053) Postage 71,800 41,883 65,114 40,340 (23,231) Shipping & Delivery 19,800 6,092 9,014 9,702 (2,922) Shipping Recovery (50,000) (29,167) (47,180) (43,948) 18,013 Logo Merchandise 20,800 19,217 19,114 24,625 103 Wholesale Costs Re-sale items 83,500 23,000 23,617 25,573 (617) Order Fulfillment 61,100 32,725 31,771 33,256 954 Discount Coupons 1,000 449 (1,000)
------------------ ------------------ ------------------ ------------------ ----------------Total Printing, Production, Delivery 724,700 412,122 418,477 526,946 (6,355)
Marketing Costs Creative Costs 98,700 61,492 45,441 47,832 16,051 Mail House 11,900 8,567 3,215 8,567 Mail Lists 6,600 3,850 3,502 5,704 348 Postage (Marketing ) 49,500 35,125 41,071 43,397 (5,946) Printing & Production 64,100 48,558 31,561 43,972 16,997 Space Advertising 52,400 30,400 13,764 17,740 16,636 Blast E-Mail & Fax 16,700 11,033 8,191 8,366 2,842 Registration & Exhibit Expenses 2,500 1,458 6,353 3,788 (4,895)
------------------ ------------------ ------------------ ------------------ ----------------Total Marketing 302,400 200,483 149,883 174,014 50,600
Professional Fees Legal 63,000 48,000 51,224 24,722 (3,224) Accounting, Audit, Tax Services 71,000 69,000 75,554 66,833 (6,554) Public Relations 97,000 56,583 52,500 55,000 4,083 Other Professional Fees 342,900 160,488 173,611 133,504 (13,123)
------------------ ------------------ ------------------ ------------------ ----------------Total Professional Fees 573,900 334,071 352,889 280,059 (18,818)
Page 7 of 12
Budget Actual Actual VarianceDescription Annual Year-to-Date Year-to-Date Year-to-Date Actual Vs.
Budget 07/31/16 07/31/16 07/31/15 YTD Budget
APICSTATEMENT OF FINANCIAL ACTIVITY
For the Seven Months Ending July 31, 2016
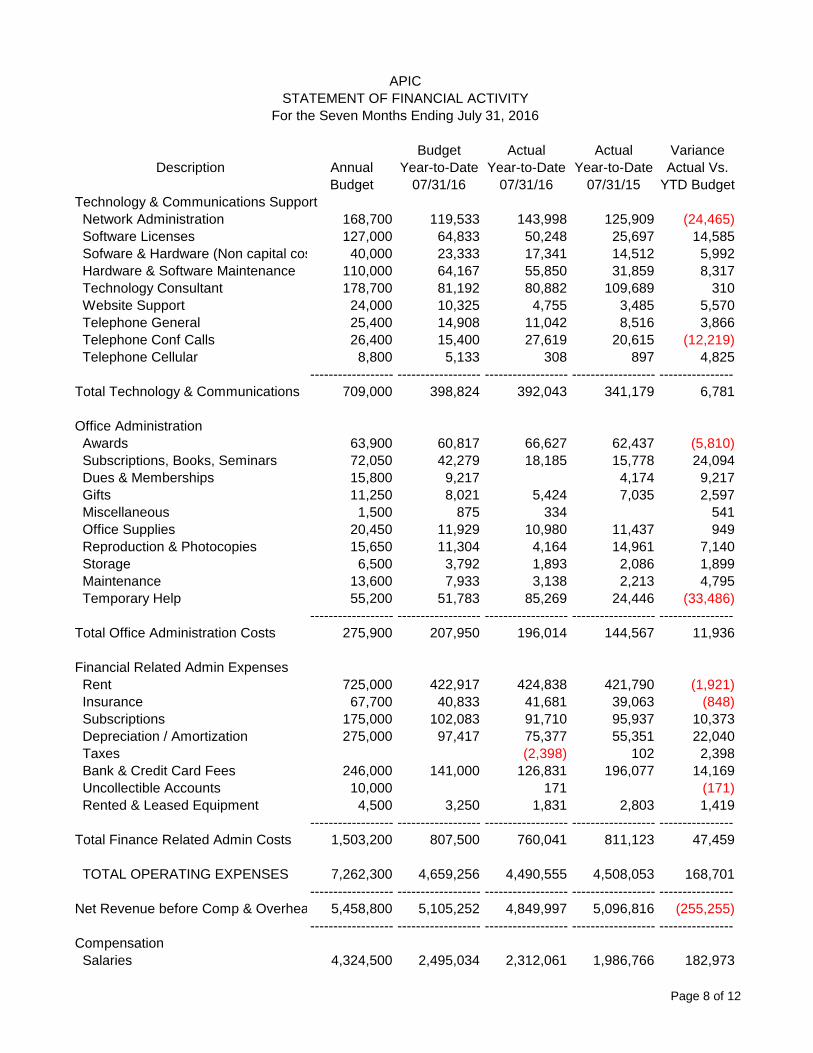
Technology & Communications Support Network Administration 168,700 119,533 143,998 125,909 (24,465) Software Licenses 127,000 64,833 50,248 25,697 14,585 Sofware & Hardware (Non capital costs) 40,000 23,333 17,341 14,512 5,992 Hardware & Software Maintenance 110,000 64,167 55,850 31,859 8,317 Technology Consultant 178,700 81,192 80,882 109,689 310 Website Support 24,000 10,325 4,755 3,485 5,570 Telephone General 25,400 14,908 11,042 8,516 3,866 Telephone Conf Calls 26,400 15,400 27,619 20,615 (12,219) Telephone Cellular 8,800 5,133 308 897 4,825
------------------ ------------------ ------------------ ------------------ ----------------Total Technology & Communications 709,000 398,824 392,043 341,179 6,781
Office Administration Awards 63,900 60,817 66,627 62,437 (5,810) Subscriptions, Books, Seminars 72,050 42,279 18,185 15,778 24,094 Dues & Memberships 15,800 9,217 4,174 9,217 Gifts 11,250 8,021 5,424 7,035 2,597 Miscellaneous 1,500 875 334 541 Office Supplies 20,450 11,929 10,980 11,437 949 Reproduction & Photocopies 15,650 11,304 4,164 14,961 7,140 Storage 6,500 3,792 1,893 2,086 1,899 Maintenance 13,600 7,933 3,138 2,213 4,795 Temporary Help 55,200 51,783 85,269 24,446 (33,486)
------------------ ------------------ ------------------ ------------------ ----------------Total Office Administration Costs 275,900 207,950 196,014 144,567 11,936
Financial Related Admin Expenses Rent 725,000 422,917 424,838 421,790 (1,921) Insurance 67,700 40,833 41,681 39,063 (848) Subscriptions 175,000 102,083 91,710 95,937 10,373 Depreciation / Amortization 275,000 97,417 75,377 55,351 22,040 Taxes (2,398) 102 2,398 Bank & Credit Card Fees 246,000 141,000 126,831 196,077 14,169 Uncollectible Accounts 10,000 171 (171) Rented & Leased Equipment 4,500 3,250 1,831 2,803 1,419
------------------ ------------------ ------------------ ------------------ ----------------Total Finance Related Admin Costs 1,503,200 807,500 760,041 811,123 47,459
TOTAL OPERATING EXPENSES 7,262,300 4,659,256 4,490,555 4,508,053 168,701------------------ ------------------ ------------------ ------------------ ----------------
Net Revenue before Comp & Overhead 5,458,800 5,105,252 4,849,997 5,096,816 (255,255)------------------ ------------------ ------------------ ------------------ ----------------
Compensation Salaries 4,324,500 2,495,034 2,312,061 1,986,766 182,973
Page 8 of 12

Budget Actual Actual VarianceDescription Annual Year-to-Date Year-to-Date Year-to-Date Actual Vs.
Budget 07/31/16 07/31/16 07/31/15 YTD Budget
APICSTATEMENT OF FINANCIAL ACTIVITY
For the Seven Months Ending July 31, 2016
FICA / OASDI 287,000 167,417 181,669 151,587 (14,252) DC Unemployment 15,000 8,750 3,132 7,375 5,618 Pension/401(k)/457(b) 300,000 175,000 161,079 151,618 13,921 Life/Disability Insurance 45,000 26,250 25,128 22,852 1,122 Health Insurance 300,000 175,000 154,901 115,775 20,099 Dental / Vision 50,000 29,167 12,442 14,074 16,725 Training & Professional Dev. 39,700 23,158 17,252 16,453 5,906 Professional Dues 6,500 3,792 2,777 5,043 1,015 Recruitment Costs 1,100 642 3,878 4,796 (3,236) Commuter Benefits 55,000 32,083 31,795 29,765 288 Other Benefits 500 876 (500) Payroll Processing 20,000 11,667 2,600 1,180 9,067
------------------ ------------------ ------------------ ------------------ ----------------Total Compensation Costs 5,443,800 3,147,960 2,909,214 2,508,160 238,746Allocated G & A Costs (42,706) (27,704) 42,706
------------------ ------------------ ------------------ ------------------ ----------------Total Compensation & Overhead 5,443,800 3,147,960 2,866,508 2,480,456 281,452
TOTAL EXPENSES 12,706,100 7,807,216 7,357,063 6,988,509 450,153------------------ ------------------ ------------------ ------------------ ----------------
Net Revenue From Operations 15,000 1,957,292 1,983,489 2,616,360 26,197------------------ ------------------ ------------------ ------------------ ----------------
Investment Revenue/Expense Interest Income 8,647 7,964 8,647 Investment Earnings 40,151 34,801 40,151 Investment Management Fees (14,390) (14,494) (14,390) Realized Gain (Loss) (40,259) 63,244 (40,259) Unrealized Gain (Loss) 167,750 40,282 167,750
------------------ ------------------ ------------------ ------------------ ----------------Net Investment Rev (Loss) 161,899 131,797 161,899
------------------ ------------------ ------------------ ------------------ ----------------
NET CHANGE IN ASSETS $15,000 $1,957,292 $2,145,388 $2,748,157 $188,096------------------ ------------------ ------------------ ------------------ ----------------
Page 9 of 12

APICSTATEMENT OF FINANCIAL POSITION
July 31, 2016
2016 2015 Variance
AssetsCurrent Assets: Cash $5,357,703 $6,456,024 ($1,098,321) Inventory 49,439 67,742 (18,303) Accounts Receivable 579,550 639,062 (59,512) Intercompany Receivables 660,027 638,539 21,488 Prepaid Expenses & Deposits 348,467 331,666 16,801
------------------ ------------------ ------------------ Total Current Assets $6,995,186 $8,133,033 ($1,137,847)
Property & Equipment Furniture & Equipment 1,759,014 1,473,327 285,687 Leasehold Improvements 42,632 946,509 (903,877) Less: Accumulated Depreciation (1,336,813) (1,985,897) 649,084
------------------ ------------------ ------------------ Net Fixed Assets $464,833 $433,939 $30,894
Investments: Securities - Equities and Fixed Income 3,480,713 3,455,696 25,017
------------------ ------------------ ------------------ Total Investments in Securities $3,480,713 $3,455,696 $25,017
Investments in Affiliates: Investment in APIC Consulting 5,000 5,000 0
------------------ ------------------ ------------------ Total Investments in Affiliates $5,000 $5,000 $0
------------------ ------------------ ------------------TOTAL ASSETS $10,945,732 $12,027,668 ($1,081,936)
========== ========== ==========
Liabilities and Net AssetsCurrent Liabilities: Accounts Payable $343,224 $1,100,325 ($757,101) Other Accounts Payable 249,610 255,902 (6,292) Accrued Expenses 722,221 370,118 352,098 Deferred Revenues 1,433,080 1,362,817 70,263
------------------ ------------------ ------------------ Total Current Liabilities $2,748,135 $3,089,162 ($341,032)
Long-Term Liabilities: Deferred Rent 4,560 554,653 (550,093) Tenant Leaseholds 8,478 84,780 (76,302)
------------------ ------------------ ------------------ Total Long Term Liabilities $13,038 $639,433 ($626,395)
------------------ ------------------ ------------------Total Liabilities $2,761,173 $3,728,595 ($967,427)
Net Assets: Net Assets at Beginning of Year $6,039,171 $5,550,915 $488,256 Current Year Net Revenue/(Loss) 2,145,388 2,748,158 (602,770)
------------------ ------------------ ------------------Total Net Assets $8,184,559 $8,299,073 ($114,514)
------------------ ------------------ ------------------TOTAL LIABILITIES & NET ASSETS $10,945,732 $12,027,668 ($1,081,936)
========== ========== ==========
Page 10 of 12

APICSTATEMENT OF FINANCIAL ACTIVITY BY PROGRAM
FOR THE SEVEN MONTHS ENDED JULY 31, 2016
Y-T-D Y-T-D % Chg 2016 Actual asActual Budget Actual vs % of
07/31/2016 7/31/2016 Budget Budget BudgetPrimary Operational Activities
Membership Revenue $2,359,403 $2,429,942 -3% $2,629,400 90% Expenses 151,985 105,522 -31% 168,750 90% Change in Net Assets 2,207,418 2,324,420 -5% 2,460,650 90%
Annual Conference Revenue 3,769,152 3,877,100 -3% 3,920,100 96% Expenses 1,719,087 1,833,275 7% 1,852,100 93% Change in Net Assets 2,050,065 2,043,825 0% 2,068,000 99%
Education Courses & Conferences Revenue 858,401 912,217 -6% 1,798,800 48% Expenses 578,538 505,115 -13% 1,051,750 55% Change in Net Assets 279,863 407,102 -31% 747,050 37%
Webinars Revenue 1,575 - #DIV/0! 20,000 8% Expenses 31,999 18,267 -43% 65,600 49% Change in Net Assets (30,424) (18,267) -267% (45,600) -67%
SPP and Special Projects Revenue 698,306 875,000 -20% 1,185,000 59% Expenses 141,679 193,501 37% 304,200 47% Change in Net Assets 556,627 681,499 -18% 880,800 63%
APIC Text & On-line Revenue 597,480 653,125 -9% 1,007,500 59% Expenses 69,986 71,251 2% 127,300 55% Change in Net Assets 527,494 581,874 -9% 880,200 60%
Practice Resources Revenue 325,497 293,791 11% 531,300 61% Expenses 128,892 129,741 1% 291,050 44% Change in Net Assets 196,605 164,050 20% 240,250 82%
AJIC Revenue 523,225 523,167 0% 854,000 61% Expenses 182,277 197,458 8% 338,500 54% Change in Net Assets 340,948 325,709 5% 515,500 66%
Grants Revenue 149,503 153,750 -3% 665,000 Expenses 66,483 56,833 -15% 442,000 15% Change in Net Assets 83,020 96,917 17% 223,000 37%
SUB-TOTAL PRIMARY REVENUE GENERATING ACTIVITIES Revenue 9,282,542 9,718,092 -4% 12,611,100 74% Expenses 3,070,926 3,110,963 1% 4,641,250 66% Change in Net Assets from Operations 6,211,616 6,607,129 -6% 7,969,850 78%
Page 11 of 12

APICSTATEMENT OF FINANCIAL ACTIVITY BY PROGRAM
FOR THE SEVEN MONTHS ENDED JULY 31, 2016
Y-T-D Y-T-D % Chg 2016 Actual asActual Budget Actual vs % of
07/31/2016 7/31/2016 Budget Budget BudgetAdministrative & Other ActivitiesGovernance Revenue - - - - - Expenses 353,651 365,081 3% 476,250 74% Change in Net Assets (353,651) (365,081) 3% (476,250) 74%
Communications Revenue 57,970 46,417 25% 110,000 53% Expenses 97,392 107,772 11% 184,750 53% Change in Net Assets (39,422) (61,355) -36% (74,750) 53%
Public Policy Revenue - - - - - Expenses 46,691 78,944 69% 131,900 35% Change in Net Assets (46,691) (78,944) 69% (131,900) 35%
Practice Guidance Expenses 32,203 41,144 28% 70,250 46% Change in Net Assets (32,203) (41,144) 28% (70,250) 46%
International Activities Revenue - - - - Expenses 20,740 15,634 -25% 26,800 77% Change in Net Assets (20,740) (15,634) -25% (26,800) 77%
General & Administrative Revenue 40 - - - - Expenses 3,735,460 4,087,678 9% 7,174,900 52% Change in Net Assets (3,735,420) (4,087,678) 9% (7,174,900) 52%
Sub Total Administrative & Other Activities Revenue 58,010 46,417 25% 110,000 53% Expenses 4,286,137 4,696,253 10% 8,064,850 53% Change in Net Assets - Admin & Other Activities (4,228,127) (4,649,836) 10% (7,954,850) 53%
Recap APIC Totals Revenue 9,340,552 9,764,509 -4% 12,721,100 73% Expenses 7,357,063 7,807,216 6% 12,706,100 58%Change in Net Assets (Excl Invest.) $1,983,489 $1,957,293 -1% $15,000
Investment Activity Interest (Ckg Acct) 8,647 Interest & Dividends 40,151 Investment Management Fees (14,390) Realized Gains / Loss (40,259) Unrealized Gains & Losses 167,750 Total Investment Activity 161,899 - Increase in Net Assets 2,145,388$ 1,957,293$ 10% 15,000$
Page 12 of 12

2015 Audited Financial Statements
Consolidated Financial Statements, Supplementary Information and Report of Independent Certified Public Accountants
Association for Professionals in Infection Control and Epidemiology, Inc. and Affiliates
December 31, 2015 and 2014

Contents
Page(s) Report of Independent Certified Public Accountants 1 - 2
Consolidated Financial Statements:
Consolidated Statements of Financial Position 3
Consolidated Statements of Activities 4 - 5
Consolidated Statements of Cash Flows 6
Notes to Consolidated Financial Statements 7 - 15
Supplementary Information:
Consolidating Statements of Financial Position 16 - 17
Consolidating Statements of Activities 18 - 19
Consolidated Schedules of Support and Revenue 20
Consolidated Schedules of Expenses by Natural Classification 21

Report of Independent Certified Public Accountants To the Board of Directors Association for Professionals in Infection Control and Epidemiology, Inc. and Affiliates We have audited the accompanying consolidated financial statements of the Association for Professionals in Infection Control and Epidemiology, Inc. and Affiliates (collectively, the “Organization”), which comprise the consolidated statements of financial position as of December 31, 2015 and 2014, and the related consolidated statements of activities and cash flows for the years then ended, and the related notes to the consolidated financial statements.
Management’s responsibility for the financial statements Management is responsible for the preparation and fair presentation of these consolidated financial statements in accordance with accounting principles generally accepted in the United States of America; this includes the design, implementation, and maintenance of internal control relevant to the preparation and fair presentation of consolidated financial statements that are free from material misstatement, whether due to fraud or error.
Auditor’s responsibility Our responsibility is to express an opinion on these consolidated financial statements based on our audits. We conducted our audits in accordance with auditing standards generally accepted in the United States of America. Those standards require that we plan and perform the audit to obtain reasonable assurance about whether the consolidated financial statements are free from material misstatement. An audit involves performing procedures to obtain audit evidence about the amounts and disclosures in the consolidated financial statements. The procedures selected depend on the auditor’s judgment, including the assessment of the risks of material misstatement of the consolidated financial statements, whether due to fraud or error. In making those risk assessments, the auditor considers internal control relevant to the Organization’s preparation and fair presentation of the consolidated financial statements in order to design audit procedures that are appropriate in the circumstances, but not for the purpose of expressing an opinion on the effectiveness of the Organization’s internal control. Accordingly, we express no such opinion. An audit also includes evaluating the appropriateness of accounting policies used and the reasonableness of significant accounting estimates made by management, as well as evaluating the overall presentation of the consolidated financial statements.
Grant Thornton LLP 757 Third Avenue, 9th Floor New York, NY 10017
T 212.599.0100 F 212.370.4520 GrantThornton.com linkd.in/GrantThorntonUS twitter.com/GrantThorntonUS
Grant Thornton LLP U.S. member firm of Grant Thornton International Ltd
We believe that the audit evidence we have obtained is sufficient and appropriate to provide a basis for our audit opinion.
Opinion In our opinion, the consolidated financial statements referred to above present fairly, in all material respects, the financial position of the Association for Professionals in Infection Control and Epidemiology, Inc. and Affiliates as of December 31, 2015 and 2014, and the changes in their net assets and their cash flows for the years then ended in accordance with accounting principles generally accepted in the United States of America.
Supplementary information Our audits were conducted for the purpose of forming an opinion on the consolidated financial statements as a whole. The consolidating statements of financial position, consolidating statements of activities, consolidated schedules of support and revenue, consolidated schedules of expenses by functional classification and consolidated schedules of expenses by natural classification are presented for purposes of additional analysis and are not a required part of the consolidated financial statements. Such supplementary information is the responsibility of management and was derived from and relates directly to the underlying accounting and other records used to prepare the consolidated financial statements. The information has been subjected to the auditing procedures applied in the audits of the consolidated financial statements and certain additional procedures. These additional procedures included comparing and reconciling the information directly to the underlying accounting and other records used to prepare the consolidated financial statements or to the consolidated financial statements themselves, and other additional procedures in accordance with auditing standards generally accepted in the United States of America. In our opinion, the supplementary information is fairly stated, in all material respects, in relation to the consolidated financial statements as a whole.
New York, New York September 9, 2016

Consolidated Statements of Financial PositionAs of December 31, 2015 and 2014
2015 2014
Current assets:Cash and cash equivalents $ 5,395,287 $ 4,423,984 Marketable securities 5,078,204 5,227,026 Accounts receivable, net of allowance of approximately $133,000and $67,000 in 2015 and 2014, respectively 1,280,231 1,228,936 Inventories 77,923 114,368 Prepaid expenses 435,355 571,383
12,267,000 11,565,697 Property and equipment:
Leasehold improvements 946,509 946,509 Computer equipment 1,218,576 1,149,034 Office equipment and furniture 275,887 275,887
2,440,972 2,371,430 Less: accumulated depreciation and amortization 2,194,215 1,932,558
246,757 438,872 Other assets:
Deposits 45,859 45,859
Total assets $ 12,559,616 $ 12,050,428
Current liabilities:Accounts payable $ 714,170 $ 573,507 Accrued expenses 1,022,723 654,531 Deferred revenue 3,044,582 2,842,623
4,781,475 4,070,661
Deferred rent 40,374 652,788
Total liabilities 4,821,849 4,723,449
Net assets:Unrestricted 7,309,811 6,863,100 Temporarily restricted 397,956 433,879 Permanently restricted 30,000 30,000
Total net assets 7,737,767 7,326,979
Total liabilities and net assets $ 12,559,616 $ 12,050,428
Liabilities and Net Assets
ASSOCIATION FOR PROFESSIONALS IN INFECTION CONTROL AND EPIDEMIOLOGY, INC. AND AFFILIATES
Assets
The accompanying notes are an integral part of these consolidated financial statements.
3

Consolidated Statement of Activities
Temporarily PermanentlyUnrestricted Restricted Restricted Total
Support and revenues:Conferences, educational courses and services $ 5,469,434 $ - $ - $ 5,469,434 Examination and certification fees 715,289 - - 715,289 Publications and educational products 3,370,995 - - 3,370,995 Membership dues and fees 2,588,825 - - 2,588,825 Grants 654,900 - - 654,900 Miscellaneous income 550 - - 550 Consulting income 1,130,834 - - 1,130,834 Contributions - 13,511 - 13,511 Net assets released from restrictions 47,129 (47,129) - -
Total support and revenues 13,977,956 (33,618) - 13,944,338
Expenses:Program services:
Conferences, educational courses and services 4,921,652 - - 4,921,652 Publications and educational products 2,310,099 - - 2,310,099 Professional practice 1,040,523 - - 1,040,523 Assessments and training 926,916 - - 926,916 Grant programs 654,900 - - 654,900 Examination and certification expenses 629,488 - - 629,488 APIC research 47,129 - - 47,129
Total program services 10,530,707 - - 10,530,707
Supporting services:General and administrative 2,780,771 - - 2,780,771
Total expenses 13,311,478 - - 13,311,478
Change in net assets from operations 666,478 (33,618) - 632,860
Non-operating items:Net investment loss (24,849) (2,305) - (27,154) Impairment loss on property and equipment (152,255) - - (152,255) Lease termination costs (42,663) - - (42,663)
(219,767) (2,305) - (222,072)
Change in net assets 446,711 (35,923) - 410,788
Net assets, beginning of the year 6,863,100 433,879 30,000 7,326,979
Net assets, end of the year $ 7,309,811 $ 397,956 $ 30,000 $ 7,737,767
ASSOCIATION FOR PROFESSIONALS IN INFECTION CONTROL AND EPIDEMIOLOGY, INC. AND AFFILIATES
For the year ended December 31, 2015
The accompanying notes are an integral part of this consolidated financial statement.
4

Consolidated Statement of Activities
Temporarily PermanentlyUnrestricted Restricted Restricted Total
Support and revenues:Conferences, educational courses and services $ 4,793,414 $ - $ - $ 4,793,414 Examination and certification fees 569,934 - - 569,934 Publications and educational products 3,123,871 - - 3,123,871 Membership dues and fees 2,562,717 - - 2,562,717 Grants 620,633 - - 620,633 Miscellaneous income 5,364 - - 5,364 Consulting income 706,191 - - 706,191 Contributions 334 6,900 - 7,234 Net assets released from restrictions 4,315 (4,315) - -
Total support and revenues 12,386,773 2,585 - 12,389,358
Expenses:Program services:
Conferences, educational courses and services 4,430,111 - - 4,430,111 Publications and educational products 2,076,002 - - 2,076,002 Professional practice 1,110,656 - - 1,110,656 Assessments and training 473,188 - - 473,188 Grant programs 620,633 - - 620,633 Examination and certification expenses 523,215 - - 523,215 APIC research 4,315 - - 4,315
Total program services 9,238,120 - - 9,238,120
Supporting services:General and administrative 2,990,965 - - 2,990,965
Total expenses 12,229,085 - - 12,229,085
Change in net assets before investment return 157,688 2,585 - 160,273
Net investment return 180,613 19,771 - 200,384
Change in net assets 338,301 22,356 - 360,657
Net assets, beginning of the year 6,524,799 411,523 30,000 6,966,322
Net assets, end of the year $ 6,863,100 $ 433,879 $ 30,000 $ 7,326,979
ASSOCIATION FOR PROFESSIONALS IN INFECTION CONTROL AND EPIDEMIOLOGY, INC. AND AFFILIATES
For the year ended December 31, 2014
The accompanying notes are an integral part of this consolidated financial statement.
5

2015 2014Cash flows from operating activities
Change in net assets $ 410,788 $ 360,657 Adjustments to reconcile change in net assets to net cash
provided by operating activities:Realized gains on marketable securities (172,097) (65,054) Unrealized lossess on marketable securities 375,582 60,621 Bad debt expense (recoveries) 66,030 (83,651) Depreciation and amortization 109,401 171,656 Impairment loss on property and equpment 152,255 -
Changes in operating assets and liabilities:Accounts receivable (117,325) (263,924) Inventories 36,445 (47,837) Prepaid expenses 136,028 (110,711) Accounts payable 140,663 147,192 Accrued expenses 368,192 (116,132) Deferred revenue 201,959 362,939 Deferred rent (612,414) (20,915)
Net cash provided by operating activities 1,095,507 394,841
Cash flows from investing activitiesPurchases of property and equipment (69,541) (176,847) Purchases of marketable securities (564,897) (1,943,704) Proceeds from sales of marketable securities 510,234 760,741
Net cash used for investing activities (124,204) (1,359,810)
Net increase (decrease) in cash and cash equivalents 971,303 (964,969)
Cash and cash equivalents - beginning 4,423,984 5,388,953
Cash and cash equivalents - ending $ 5,395,287 $ 4,423,984
ASSOCIATION FOR PROFESSIONALS IN INFECTION
Consolidated Statements of Cash FlowsFor the years ended December 31, 2015 and 2014
CONTROL AND EPIDEMIOLOGY, INC. AND AFFILIATES
The accompanying notes are an integral part of these consolidated financial statements.
6

ASSOCIATION FOR PROFESSIONALS IN INFECTION CONTROL AND EPIDEMIOLOGY, INC. AND AFFILIATES Notes to Consolidated Financial Statements For the years ended December 31, 2015 and 2014
7
1. NATURE OF OPERATIONS
The Association for Professionals in Infection Control and Epidemiology, Inc. (APIC) has been in existence since 1972 and is a tax-exempt corporation governed by a Board of Directors elected by its over 15,000 members. APIC members include nurses, physicians, medical technologists, consultants, educators, and researchers in the field of infection control and epidemiology. APIC has chartered 117 Chapters to provide local resources for members. The chapters are not required to be consolidated or combined and their activity is not reflected in these financial statements as APIC neither controls nor derives beneficial economic interest from these organizations. APIC also created two affiliate organizations – the Certification Board of Infection Control and Epidemiology, Inc. (CBIC) in 1981, and APIC Consulting Services, Inc. (ACSI) in 2008. The financial statements of APIC have been consolidated with CBIC and ACSI as APIC has the ability to nominate CBIC’s Board of Directors after consultation with CBIC leadership and ACSI is a wholly owned subsidiary of APIC. APIC's purpose is to influence, support, and improve the quality of health care through the practice and management of infection control and the application of epidemiology in all health settings. APIC is committed to improving patient care, preventing adverse outcomes, and to minimizing occupational hazards associated with the delivery of health care. APIC research funds grants for infection control research and is committed to improve the quality, value and cost effectiveness of health care and evaluating the efficiency of infection control practices. ACSI is an organization designed to help healthcare facilities solve their biggest and most urgent infection-related issues. ACSI’s vast resources allow it to quickly mobilize the nation’s leading infection control experts and tackle larger projects that individual healthcare facilities or small consulting firms cannot. ACSI is a wholly-owned for-profit subsidiary of APIC. CBIC’s purpose is to protect the public through the development, administration, and promotion of an accredited certification in infection prevention and control. CBIC’s major sources of revenue are examination and recertification fees. CBIC primarily conducts its management, testing and administrative operations at the executive office in Milwaukee, Wisconsin. The examinations are primarily computer based tests administered nationally and internationally.
2. SUMMARY OF SIGNIFICANT ACCOUNTING POLICIES
Basis of Presentation and Consolidation
The consolidated financial statements include the accounts and transactions of APIC and its affiliates, CBIC and ACSI, (collectively, the “Organization”). All material intercompany transactions and balances have been eliminated in consolidation.
ASSOCIATION FOR PROFESSIONALS IN INFECTION CONTROL AND EPIDEMIOLOGY, INC. AND AFFILIATES Notes to Consolidated Financial Statements - Continued For the years ended December 31, 2015 and 2014
8
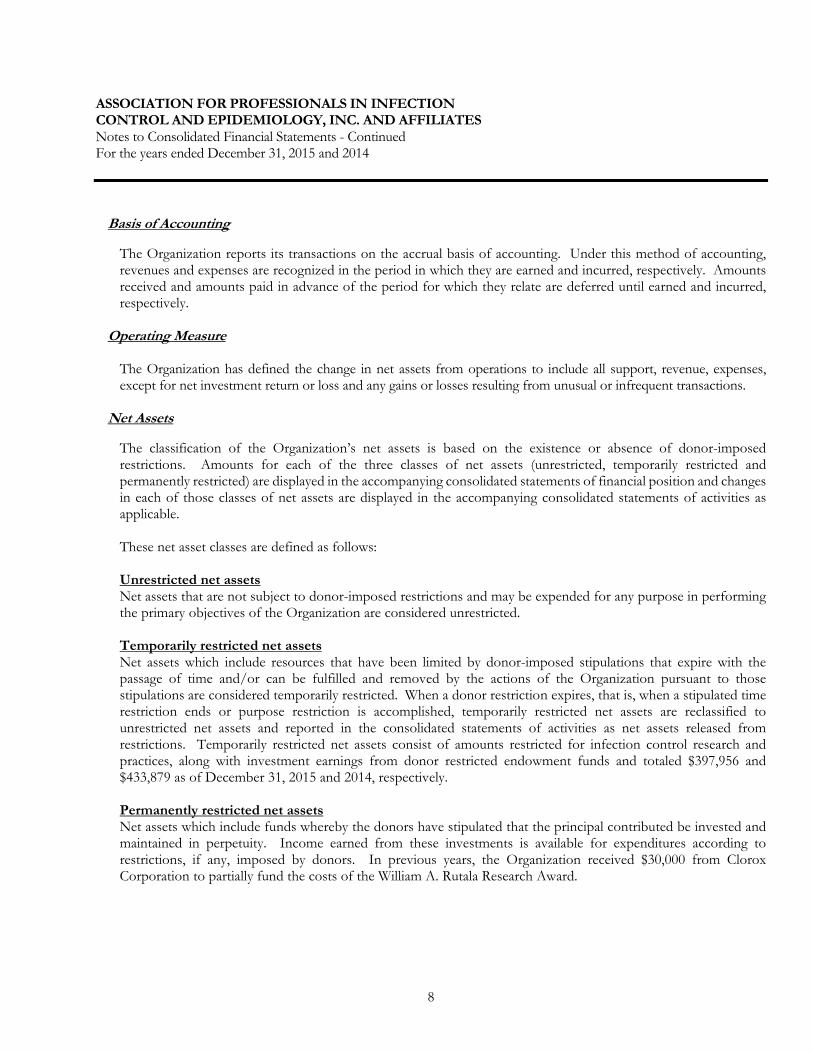
Basis of Accounting
The Organization reports its transactions on the accrual basis of accounting. Under this method of accounting, revenues and expenses are recognized in the period in which they are earned and incurred, respectively. Amounts received and amounts paid in advance of the period for which they relate are deferred until earned and incurred, respectively.
Operating Measure
The Organization has defined the change in net assets from operations to include all support, revenue, expenses, except for net investment return or loss and any gains or losses resulting from unusual or infrequent transactions.
Net Assets The classification of the Organization’s net assets is based on the existence or absence of donor-imposed restrictions. Amounts for each of the three classes of net assets (unrestricted, temporarily restricted and permanently restricted) are displayed in the accompanying consolidated statements of financial position and changes in each of those classes of net assets are displayed in the accompanying consolidated statements of activities as applicable. These net asset classes are defined as follows: Unrestricted net assets Net assets that are not subject to donor-imposed restrictions and may be expended for any purpose in performing the primary objectives of the Organization are considered unrestricted. Temporarily restricted net assets Net assets which include resources that have been limited by donor-imposed stipulations that expire with the passage of time and/or can be fulfilled and removed by the actions of the Organization pursuant to those stipulations are considered temporarily restricted. When a donor restriction expires, that is, when a stipulated time restriction ends or purpose restriction is accomplished, temporarily restricted net assets are reclassified to unrestricted net assets and reported in the consolidated statements of activities as net assets released from restrictions. Temporarily restricted net assets consist of amounts restricted for infection control research and practices, along with investment earnings from donor restricted endowment funds and totaled $397,956 and $433,879 as of December 31, 2015 and 2014, respectively. Permanently restricted net assets Net assets which include funds whereby the donors have stipulated that the principal contributed be invested and maintained in perpetuity. Income earned from these investments is available for expenditures according to restrictions, if any, imposed by donors. In previous years, the Organization received $30,000 from Clorox Corporation to partially fund the costs of the William A. Rutala Research Award.

ASSOCIATION FOR PROFESSIONALS IN INFECTION CONTROL AND EPIDEMIOLOGY, INC. AND AFFILIATES Notes to Consolidated Financial Statements - Continued For the years ended December 31, 2015 and 2014
9
Cash and Cash Equivalents
All highly liquid investments with initial maturities of three months or less when purchased are considered cash equivalents. Financial instruments which potentially subject the Organization to concentrations of credit risk consist principally of cash and marketable securities. The Organization places its cash in highly rated financial institutions, which are continually reviewed by senior management for financial stability. The Organization has not experienced any losses in such accounts and believes that its cash is not exposed to significant credit risk.
Marketable Securities
The Organization carries investments in marketable securities with readily determinable fair values at their fair value in the accompanying consolidated statements of financial position. The Organization considers investments in mutual funds and exchange traded and closed-end funds to be sufficiently diversified to minimize individual investment and industry concentration risks. However, all investments are subject to the risks of the securities markets as a whole. Unrealized and realized gains and losses are included in the accompanying consolidated statements of activities. Purchases and sales of securities are reflected on a trade-date basis. Gains and losses on sales of securities are based on average cost and are recorded in the consolidated statements of activities in the period in which the securities are sold. Dividends are accrued based on the ex-dividend date. Interest is recognized as earned. All investment securities are exposed to various risks such as interest rate, market, and credit risks. Due to the level of risk associated with certain investment securities, it is at least reasonably possible that changes in the values of investment securities will occur in the near term and such changes could materially affect the amounts reported in the consolidated statements of financial position.
Deferred Revenue and Revenue Recognition
Deferred revenue consists of educational and conference course registrations, grants, membership dues and fees for examinations received in advance. The Organization recognizes grant revenues associated with cost reimbursement grants when the related expenditures are incurred. All unexpended grants at year-end are deferred and recognized when the related expenditures occur. Performance based grants are recognized upon the attainment of specific performance goals, therefore, revenue is recognized to the extent of performance achieved. Membership dues are recognized on a pro-rata basis over the annual membership period. Examination fees are not recognized until the examination is administered. The Organization recognizes the examination application processing fee as revenue immediately upon submission of application instead of upon completion of examination. The processing fee represents a portion of the total examination fee and is non-refundable. Education and conference course registrations are not recognized as revenues until the completion of the event. The Organization recognizes revenues from publications and educational products at the time the products are shipped to the customer. Revenues from consulting services are recognized when services are completed and billed.
Contributions Gifts received are recognized as unrestricted unless the donor has specifically limited the use of the donation, or unless a multi-year pledge is received. The Organization reports gifts of cash and other assets as restricted support if they are received with donor stipulations that limit the use of the donated assets. When a donor restriction expires, that is, when a stipulated time restriction ends or purpose restriction is accomplished, temporarily restricted

ASSOCIATION FOR PROFESSIONALS IN INFECTION CONTROL AND EPIDEMIOLOGY, INC. AND AFFILIATES Notes to Consolidated Financial Statements - Continued For the years ended December 31, 2015 and 2014
10
net assets are reclassified to unrestricted net assets and are reported in the statement of activities as net assets released from restrictions. However, if a restriction is fulfilled in the same time period in which the contribution is received, the Organization reports the support as unrestricted
Donated Services
Donated services are recognized if the services (a) create or enhance nonfinancial assets or (b) require specialized skills, are performed by people with those skills, and would otherwise be purchased by the Organization. Volunteers provide content expertise, lead workshops, conceive, write and edit educational materials and provide other invaluable services to the Organization throughout the year that are not recognized as contributions in the financial statements since the recognition criteria are not met. No amounts have been reflected in the financial statements for donated services. The Organization generally pays for services requiring specific expertise.
Accounts Receivable
Accounts receivable consists primarily of amounts due from the sale of publications, advertising, exhibit space, convention registrations and certification exam registrations. The allowance method is used to determine the uncollectible amounts. The allowance is based upon prior years' experience and management's analysis of subsequent collections.
Inventories
Inventories consist of publications and custom lapel pins and are stated at the lower of replacement cost, estimated net realizable value, or market value, using the first-in first-out method.
Property and Equipment
Property and equipment are stated at cost. The Organization capitalizes all expenditures for property and equipment over $1,000. Depreciation and amortization are provided utilizing the straight-line method over the shorter of the estimated useful lives of the assets (3-5 years) or over the life of the lease for leasehold improvements, whichever is shorter. When assets are sold or otherwise disposed of, the asset and related accumulated depreciation and amortization are removed from the accounts, and any remaining gain or loss is recorded as a non-operating item in the statement of activities. Repairs and maintenance are charged to expense when incurred. For the years ended December 31, 2015 and 2014, depreciation and amortization expense amounted to $109,401 and $171,656, respectively. In addition, the Organization recorded an impairment loss of $152,255 for the year ended December 31, 2015 relating to office furniture and leasehold improvements that are expected to be disposed of when the Organization relocates to its new location in September 2016.

ASSOCIATION FOR PROFESSIONALS IN INFECTION CONTROL AND EPIDEMIOLOGY, INC. AND AFFILIATES Notes to Consolidated Financial Statements - Continued For the years ended December 31, 2015 and 2014
11
Functional Allocation of Expenses
The costs of providing the various programs and services have been summarized on a functional basis in the accompanying consolidated statements of activities. Accordingly, certain costs have been allocated to the program and supporting services benefited based on labor distribution and the level of effort expended to the respective program.
Income Tax Status
APIC follows guidance that clarifies the accounting for uncertainty in tax positions taken or expected to be taken in a tax return, including issues relating to financial statement recognition and measurement. This guidance provides that the tax effects from an uncertain tax position can only be recognized in the financial statements if the position is “more-likely-than-not” to be sustained if the position were to be challenged by a taxing authority. The assessment of the tax position is based solely on the technical merits of the position, without regard to the likelihood that the tax position may be challenged. APIC is exempt from federal income tax under IRC section 501(c)(3). CBIC is recognized as exempt from most federal income taxes under IRC section 501(c)(6). Both entities are subject to tax on income unrelated to the Organization’s exempt purpose, unless that income is otherwise excluded by the Code. APIC has processes presently in place to ensure the maintenance of its tax-exempt status; to identify and report unrelated income; to determine its filing and tax obligations in jurisdictions for which it has nexus; and to identify and evaluate other matters that may be considered tax positions. The tax years ending December 31, 2015, 2014, 2013 and 2012 are still open to audit for both federal and state purposes. APIC and CBIC have determined that there are no material unrelated uncertain tax positions that require recognition or disclosure in the consolidated financial statements. ACSI is subject to federal and state income taxes on its net taxable income. ACSI accounts for federal and state income taxes using the liability method, under which deferred tax assets or liabilities are recognized based on temporary differences between the financial statement and tax basis of assets and liabilities using the currently enacted tax rates. Differences between the effective tax rate and the federal statutory rate of 35% are primarily attributable to state income taxes and the recognition of a valuation allowance on net operating loss carryforwards and other deferred tax assets. The deferred tax asset attributable to temporary differences as of December 31, 2015 and 2014, respectively, are offset by a valuation allowance in a corresponding amount. No benefit has been recorded for the amount of these operating loss carryforwards.
No provision for federal or state income taxes has been recorded, as ACSI has incurred cumulative net operating losses since inception. As of December 31, 2015 and 2014, ACSI had net operating gain of approximately $38,000 and a net operating loss of $1,000, respectively.
Use of Estimates
The preparation of financial statements in conformity with accounting principles generally accepted in the United States of America requires management to make estimates and assumptions that affect the reported amounts of assets and liabilities and the disclosure of contingent assets and liabilities at the date of the financial statements and the reported amounts of revenues and expenses during the reporting period. Actual results could differ from those estimates.

ASSOCIATION FOR PROFESSIONALS IN INFECTION CONTROL AND EPIDEMIOLOGY, INC. AND AFFILIATES Notes to Consolidated Financial Statements - Continued For the years ended December 31, 2015 and 2014
12
Subsequent Events
Subsequent events were evaluated through September 9, 2016, which is the date the consolidated financial statements were available to be issued.
On March 2, 2016, the Organization entered into a new operating lease for office space in Arlington, Virginia, commencing September 1, 2016 through August 31, 2028.
Reclassifications Certain reclassifications have been made to the December 31, 2014 consolidated financial statements to conform to the December 31, 2015 presentation. Such reclassifications did not change total assets, liabilities, revenues and expenses or changes in net assets reflected in the 2014 consolidated financial statements.
3. FAIR VALUE MEASUREMENTS AND MARKETABLE SECURITIES
Fair Value Measurements
Fair value is defined as the price that would be received to sell an asset or paid to transfer a liability in an orderly transaction between market participants, as of the measurement date. Authoritative guidance establishes a hierarchy of valuation techniques based upon whether the inputs to those valuation techniques reflect assumptions other market participants would use based upon market data obtained from independent sources (also referred to as observable inputs). The following summarizes the fair value hierarchy:
Level 1 Quoted prices in active markets that are unadjusted and accessible at the measurement date for
identical, unrestricted assets or liabilities; Level 2 Quoted prices for identical assets and liabilities in markets that are not active, quoted prices for similar
assets and liabilities in active markets or financial instruments for which significant observable inputs are available, either directly or indirectly such as interest rates and yield curves that are observable at commonly quoted intervals; and
Level 3 Prices or valuations that require inputs that are unobservable.
As of December 31, 2015 and 2014, the Organization did not have any assets or liabilities that were classified as Level 2 or 3 within the fair value hierarchy.
ASSOCIATION FOR PROFESSIONALS IN INFECTION CONTROL AND EPIDEMIOLOGY, INC. AND AFFILIATES Notes to Consolidated Financial Statements - Continued For the years ended December 31, 2015 and 2014
13
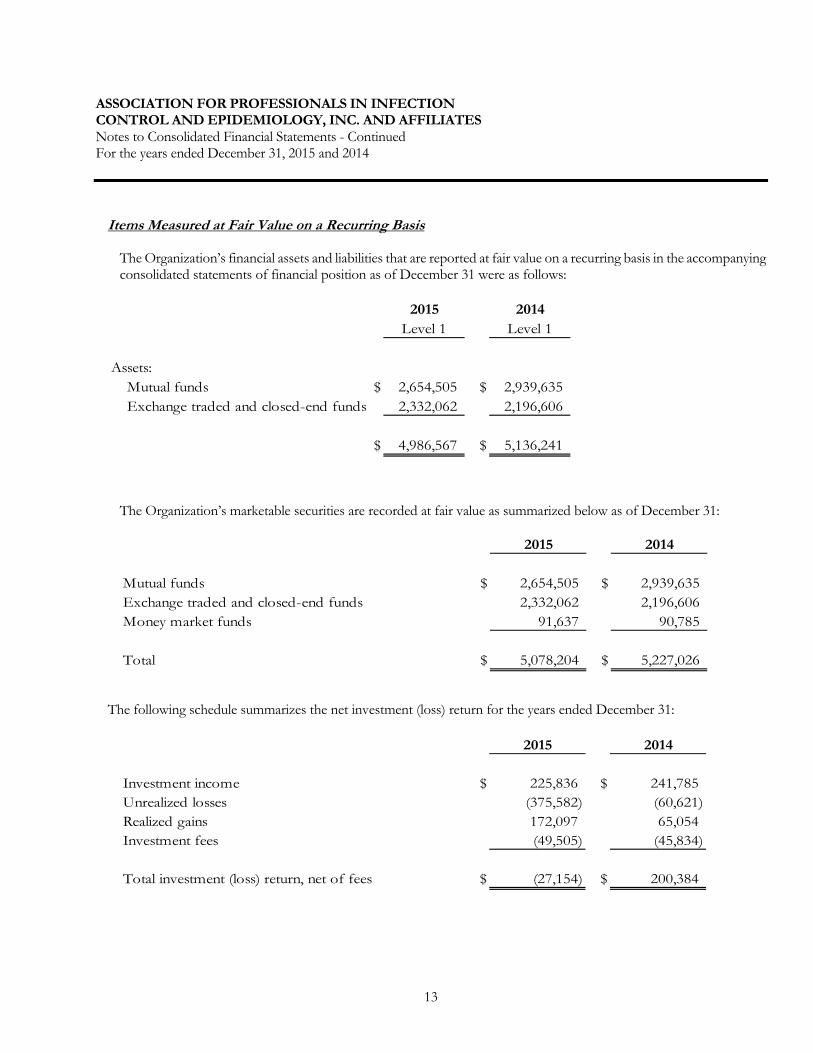
Items Measured at Fair Value on a Recurring Basis
The Organization’s financial assets and liabilities that are reported at fair value on a recurring basis in the accompanying consolidated statements of financial position as of December 31 were as follows:
2015 2014Level 1 Level 1
Assets:Mutual funds $ 2,654,505 $ 2,939,635 Exchange traded and closed-end funds 2,332,062 2,196,606
$ 4,986,567 $ 5,136,241
The Organization’s marketable securities are recorded at fair value as summarized below as of December 31:
2015 2014
Mutual funds $ 2,654,505 $ 2,939,635 Exchange traded and closed-end funds 2,332,062 2,196,606 Money market funds 91,637 90,785
Total $ 5,078,204 $ 5,227,026
The following schedule summarizes the net investment (loss) return for the years ended December 31:
2015 2014
Investment income $ 225,836 $ 241,785 Unrealized losses (375,582) (60,621) Realized gains 172,097 65,054 Investment fees (49,505) (45,834)
Total investment (loss) return, net of fees $ (27,154) $ 200,384

ASSOCIATION FOR PROFESSIONALS IN INFECTION CONTROL AND EPIDEMIOLOGY, INC. AND AFFILIATES Notes to Consolidated Financial Statements - Continued For the years ended December 31, 2015 and 2014
14
4. CONTRACT SERVICES
The Organization, through CBIC, contracted with Prometric to provide examination services during 2015 and 2014. CBIC also entered into a contract with Executive Director, Inc. (EDI) to provide management services. Management services include administrative and executive office management, monthly financial services, recertification processing, candidate database services, publication development, examination marketing, and meeting support, planning, and management. Management fees for the years ended December 31, 2015 and 2014 totaled $297,205 and $242,602, respectively, and have been allocated between examination and certification expenses, and general and administrative expenses in the consolidated statements of activities. Examination services include examination and Self-Assessment Recertification Exam (SARE) development and computer-based administration, scoring, analysis, and reporting of examinations. The examination agreement expires on December 31, 2017. Examination fees for the years ended December 31, 2015 and 2014 totaled $138,872 and $127,114, respectively, and are included in examination and certification expenses in the accompanying consolidated statements of activities.
5. DEFERRED COMPENSATION PLANS
The Organization has a qualified employee benefit plan under Section 401(k) of the Internal Revenue Code covering all eligible employees. Eligibility for participation requires employees to have at least 1 year of service and be at least 18 years of age. Employees can make contributions of their compensation, subject to Internal Revenue Code limitations. The Organization matches 100% of the first 4% of each employee’s contribution. The Organization may also make discretionary contributions to the plan for the benefit of the participants at the end of the plan year based upon achieved versus budgeted results of operations. No discretionary contributions were made in 2015 and 2014. Total contributions to the plan by the Organization for the years ended December 31, 2015 and 2014 were $257,796 and $273,989, respectively.
The Organization has a non-qualified Section 457 retirement plan for its executive director. Total expense relating to this plan for the years ended December 31, 2015 and 2014 was $10,154 and $9,923, respectively.
6. COMMITMENTS AND CONTINGENCIES
The Organization has contracts with various hotels and conference centers related to the annual conferences it plans to hold over the next five years. These contracts have various cancellation clauses. Accordingly, as the conference dates approach, the Organization’s liability under these contracts increases, subject to the other party’s ability to fulfill the commitments made by the Organization. Through APIC, the Organization has an operating lease for office space. In April 2010, a second amendment to the lease became effective which extended the lease through August 2021, however during 2015, the Organization exercised its one-time right to terminate the lease effective August 31, 2016.
Rent expense for all operating leases totaled $725,923 and $755,045 for the years ended December 31, 2015 and 2014, respectively.
ASSOCIATION FOR PROFESSIONALS IN INFECTION CONTROL AND EPIDEMIOLOGY, INC. AND AFFILIATES Notes to Consolidated Financial Statements - Continued For the years ended December 31, 2015 and 2014
15
The Organization is involved in certain legal proceedings and is subject to certain lawsuits and claims in the ordinary course of its business. Although the ultimate effect of these matters is often difficult to predict, management believes that their resolution will not have a material adverse effect on the Organization’s consolidated financial statements.

SUPPLEMENTARY SCHEDULES

Association for Professionals in
Infection Control and Epidemiology, Inc.
Certification Board of Infection Control and Epidemiology, Inc.
APIC Consulting Services, Inc.
Consolidating Entries Consolidated
Current assets:Cash and cash equivalents $ 5,237,553 $ 61,173 $ 96,561 $ - $ 5,395,287 Marketable securities 3,827,414 1,250,790 - - 5,078,204
1,020,516 10,415 249,300 - 1,280,231 Inventories 73,769 4,154 - - 77,923 Due from affiliates 315,145 - - (315,145) - Prepaid expenses 407,142 12,804 15,409 - 435,355
10,881,539 1,339,336 361,270 (315,145) 12,267,000
Property and equipment:Leasehold improvements 946,509 - - - 946,509 Computer equipment 1,218,576 - - - 1,218,576 Office equipment and furniture 273,035 2,852 - - 275,887
2,438,120 2,852 - - 2,440,972
2,191,363 2,852 - - 2,194,215 246,757 - - - 246,757
Other assets:Investment in affiliate 5,000 - - (5,000) - Deposits 45,859 - - - 45,859
50,859 - - (5,000) 45,859
Total assets $ 11,179,155 $ 1,339,336 $ 361,270 $ (320,145) $ 12,559,616
Current liabilities:Accounts payable $ 667,186 $ 30,411 $ 16,573 $ - $ 714,170 Accrued expenses 1,021,723 - 1,000 - 1,022,723 Due to affiliate - - 315,145 (315,145) - Deferred revenue 2,996,237 48,345 - - 3,044,582
4,685,146 78,756 332,718 (315,145) 4,781,475
Deferred rent 40,374 - - - 40,374
Total liabilities 4,725,520 78,756 332,718 (315,145) 4,821,849
Net assets:Unrestricted 6,025,679 1,260,580 - 23,552 7,309,811 Common stock - - 5,000 (5,000) - Retained earnings - - 23,552 (23,552) - Temporarily restricted 397,956 - - - 397,956 Permanently restricted 30,000 - - - 30,000
Total net assets 6,453,635 1,260,580 28,552 (5,000) 7,737,767
Total liabilities and net assets $ 11,179,155 $ 1,339,336 $ 361,270 $ (320,145) $ 12,559,616
Liabilities and Net Assets
ASSOCIATION FOR PROFESSIONALS IN INFECTION CONTROL AND EPIDEMIOLOGY, INC. AND AFFILIATESConsolidating Statement of Financial Position As of December 31, 2015
Assets
Less: accumulated depreciation and amortization
Accounts receivable, net of allowance of approximately $133,000
This schedule should be read in conjunction with the accompanying consolidated financial statements and notes thereto.16

Association for Professionals in
Infection Control and Epidemiology, Inc.
Certification Board of Infection Control and Epidemiology, Inc.
APIC Consulting Services, Inc.
Consolidating Entries Consolidated
Current assets:Cash and cash equivalents $ 4,376,396 $ 36,038 $ 11,550 $ - $ 4,423,984 Marketable securities 3,832,471 1,394,555 - - 5,227,026
847,312 2,400 379,224 - 1,228,936 Inventories 112,294 2,074 - - 114,368 Due from affiliates 301,617 - - (301,617) - Prepaid expenses 545,566 16,004 9,813 - 571,383
10,015,656 1,451,071 400,587 (301,617) 11,565,697
Property and equipment:Leasehold improvements 946,509 - - - 946,509 Computer equipment 1,149,034 - - - 1,149,034 Office equipment and furniture 273,035 2,852 - - 275,887
2,368,578 2,852 - - 2,371,430
1,930,546 2,012 - - 1,932,558 438,032 840 - - 438,872
Other assets:Investment in affiliate 5,000 - - (5,000) - Deposits 45,859 - - - 45,859
50,859 - - (5,000) 45,859
Total assets $ 10,504,547 $ 1,451,911 $ 400,587 $ (306,617) $ 12,050,428
Current liabilities:Accounts payable $ 478,595 $ 29,754 $ 65,158 $ - $ 573,507 Accrued expenses 650,531 - 4,000 - 654,531 Due to affiliate - - 301,617 (301,617) - Deferred revenue 2,740,613 62,520 39,490 - 2,842,623
3,869,739 92,274 410,265 (301,617) 4,070,661
Deferred rent 652,788 - - - 652,788
Total liabilities 4,522,527 92,274 410,265 (301,617) 4,723,449
Net assets:Unrestricted 5,518,141 1,359,637 - (14,678) 6,863,100 Common stock - - 5,000 (5,000) - Retained earnings - - (14,678) 14,678 - Temporarily restricted 433,879 - - - 433,879 Permanently restricted 30,000 - - - 30,000
Total net assets 5,982,020 1,359,637 (9,678) (5,000) 7,326,979
Total liabilities and net assets $ 10,504,547 $ 1,451,911 $ 400,587 $ (306,617) $ 12,050,428
Liabilities and Net Assets
ASSOCIATION FOR PROFESSIONALS IN INFECTION CONTROL AND EPIDEMIOLOGY, INC. AND AFFILIATESConsolidating Statement of Financial PositionAs of December 31, 2014
Assets
Less: accumulated depreciation and amortization
Accounts receivable, net of allowance of approximately $67,000
This schedule should be read in conjunction with the accompanying consolidated financial statements and notes thereto.17

ASSOCIATION FOR PROFESSIONALS IN INFECTION CONTROL AND EPIDEMIOLOGY, INC. AND AFFILIATESConsolidating Statement of ActivitiesFor the year ended December 31, 2015
Association for Professionals in
Infection Control and Epidemiology, Inc.
Certification Board of Infection Control and
Epidemiology, Inc. APIC Consulting
Services, Inc. Consolidating
Entries Consolidated
Support and revenues:
Conferences, educational courses and services $ 5,469,434 $ - $ - $ - $ 5,469,434
Examination and certification fees - 715,289 - - 715,289
Publications and educational products 3,353,939 17,056 - - 3,370,995
Membership dues and fees 2,588,825 - - - 2,588,825
Grants 654,900 - - - 654,900
Miscellaneous income - 550 - - 550
Consulting income - - 1,130,834 - 1,130,834
Contributions 13,511 - - - 13,511
Total support and revenues 12,080,609 732,895 1,130,834 - 13,944,338
Expenses:
Program services:
Conferences, educational courses and services 4,921,652 - - - 4,921,652
Publications and educational products 2,310,099 - - - 2,310,099
Professional practice 1,040,523 - - - 1,040,523
Assessments and training - - 926,916 - 926,916
Grant programs 654,900 - - - 654,900
Examination and certification expenses - 629,488 - - 629,488
APIC research 47,129 - - - 47,129
Total program services 8,974,303 629,488 926,916 - 10,530,707
Supporting services:
General and administrative 2,456,310 158,773 165,688 - 2,780,771
Total expenses 11,430,613 788,261 1,092,604 - 13,311,478
Change in net assets from operations 649,996 (55,366) 38,230 - 632,860
Non-operating items:Investment return (loss) 16,537 (43,691) - - (27,154) Impairment loss on property and equipment (152,255) - - - (152,255) Lease termination costs (42,663) - - - (42,663)
(178,381) (43,691) - - (222,072)
Change in net assets 471,615 (99,057) 38,230 - 410,788
Net assets, beginning of the year 5,982,020 1,359,637 (9,678) (5,000) 7,326,979
Net assets, end of the year $ 6,453,635 $ 1,260,580 $ 28,552 $ (5,000) $ 7,737,767
This schedule should be read in conjunction with the accompanying consolidated financial statements and notes thereto.18

Consolidating Statement of ActivitiesFor the year ended December 31, 2014
Association for Professionals in
Infection Control and Epidemiology, Inc.
Certification Board of Infection Control and
Epidemiology, Inc.APIC Consulting
Services, Inc.Consolidating
Entries Consolidated
Support and revenues:
Conferences, educational courses and services $ 4,793,414 $ - $ - $ - $ 4,793,414
Examination and certification fees - 569,934 - - 569,934
Publications and educational products 3,109,287 14,584 - - 3,123,871
Membership dues and fees 2,562,717 - - - 2,562,717
Grants 620,633 - - - 620,633
Miscellaneous income 5,092 272 - - 5,364
Consulting income - - 706,191 - 706,191
Contributions 6,900 334 - - 7,234
Total support and revenues 11,098,043 585,124 706,191 - 12,389,358
Expenses:
Program services:
Conferences, educational courses and services 4,430,111 - - - 4,430,111
Publications and educational products 2,076,002 - - - 2,076,002
Professional practice 1,110,656 - - - 1,110,656
Assessments and training - - 473,188 - 473,188
Grant programs 620,633 - - - 620,633
Examination and certification expenses - 523,215 - - 523,215
APIC research 4,315 - - - 4,315
Total program services 8,241,717 523,215 473,188 - 9,238,120
Supporting services:
General and administrative 2,728,879 164,192 97,894 - 2,990,965
Total expenses 10,970,596 687,407 571,082 - 12,229,085
Change in net assets before investment return 127,447 (102,283) 135,109 - 160,273
Investment return 124,316 76,068 - 200,384
Change in net assets 251,763 (26,215) 135,109 - 360,657
Net assets, beginning of the year 5,730,257 1,385,852 (144,787) (5,000) 6,966,322
Net assets, end of the year $ 5,982,020 $ 1,359,637 $ (9,678) $ (5,000) $ 7,326,979
ASSOCIATION FOR PROFESSIONALS IN INFECTION CONTROL AND EPIDEMIOLOGY, INC. AND AFFILIATES
This schedule should be read in conjunction with the accompanying consolidated financial statements and notes thereto. 19

Consolidated Schedules of Support and RevenueFor the years ended December 31, 2015 and 2014
2015 2014
Conferences and educational courses:Annual conference $ 4,086,769 $ 3,583,754 Seminars and courses 1,382,665 1,209,660 Examination and certification fees 715,289 569,934
Total conferences and educational courses 6,184,723 5,363,348
Publications and educational products:Program and product development 855,053 827,442 Educational products 511,858 390,583 Advertising, royalties and other revenues 143,590 178,742 American Journal of Infection Control 886,069 723,792 Prevention Strategist and other newsletters 82,755 101,318 APIC Text of Infection Control and Epidemiology 891,670 901,994
Total publications and educational products 3,370,995 3,123,871
Membership dues and fees:Active and associate members 2,570,655 2,528,852 Patron members 18,170 33,865
Total membership dues and fees 2,588,825 2,562,717
General:Miscellaneous income 550 5,364
Total general 550 5,364
Consulting income:Service revenue 1,130,834 706,191
Total consulting income 1,130,834 706,191
Grants:Government grants 654,900 620,633
Total grants 654,900 620,633
Contributions:Chapter contributions 10,105 4,600 Individual contributions 3,406 2,634
Total contributions 13,511 7,234
Total support and revenues $ 13,944,338 $ 12,389,358
ASSOCIATION FOR PROFESSIONALS IN INFECTION CONTROL AND EPIDEMIOLOGY, INC. AND AFFILIATES
These schedules should be read in conjunction with the accompanying consolidated financial statements and notes thereto. 20
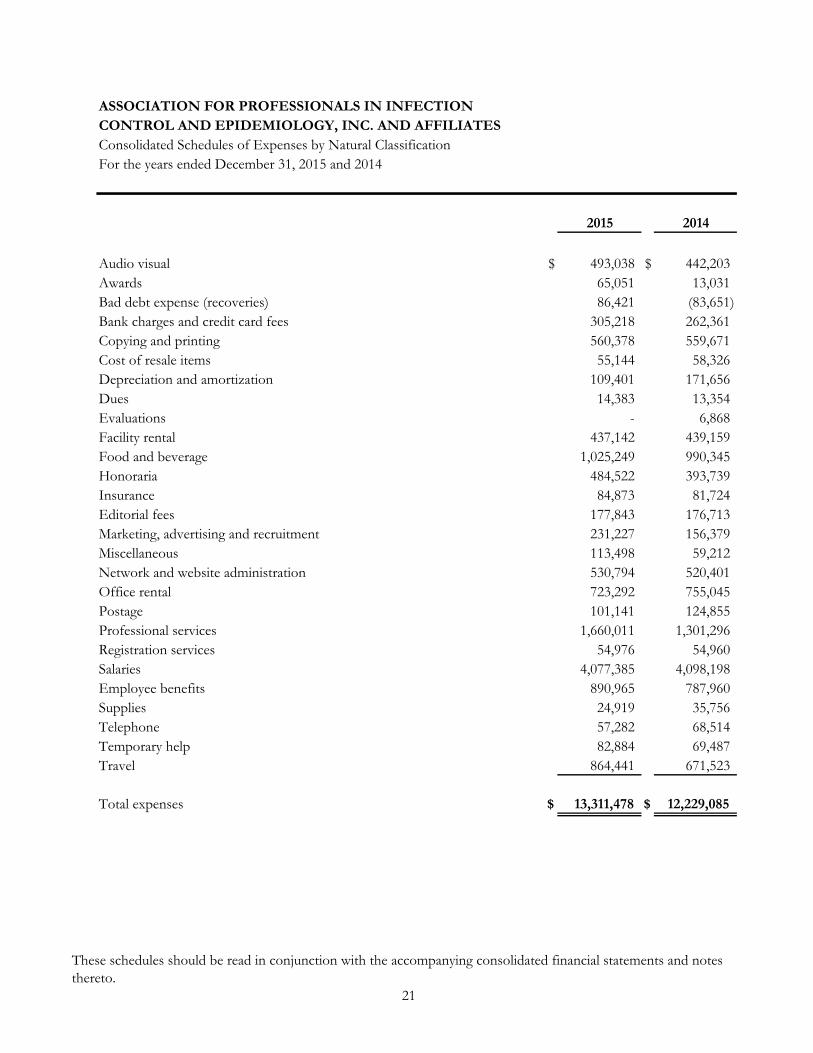
Consolidated Schedules of Expenses by Natural ClassificationFor the years ended December 31, 2015 and 2014
2015 2014
Audio visual $ 493,038 $ 442,203 Awards 65,051 13,031 Bad debt expense (recoveries) 86,421 (83,651) Bank charges and credit card fees 305,218 262,361 Copying and printing 560,378 559,671 Cost of resale items 55,144 58,326 Depreciation and amortization 109,401 171,656 Dues 14,383 13,354 Evaluations - 6,868 Facility rental 437,142 439,159 Food and beverage 1,025,249 990,345 Honoraria 484,522 393,739 Insurance 84,873 81,724 Editorial fees 177,843 176,713 Marketing, advertising and recruitment 231,227 156,379 Miscellaneous 113,498 59,212 Network and website administration 530,794 520,401 Office rental 723,292 755,045 Postage 101,141 124,855 Professional services 1,660,011 1,301,296 Registration services 54,976 54,960 Salaries 4,077,385 4,098,198 Employee benefits 890,965 787,960 Supplies 24,919 35,756 Telephone 57,282 68,514 Temporary help 82,884 69,487 Travel 864,441 671,523
Total expenses $ 13,311,478 $ 12,229,085
ASSOCIATION FOR PROFESSIONALS IN INFECTION CONTROL AND EPIDEMIOLOGY, INC. AND AFFILIATES
These schedules should be read in conjunction with the accompanying consolidated financial statements and notes thereto.
21
Affiliates Reports
American Journal of Infection Control

AJIC: 2016 Midyear Report
I. So far in 2016, AJIC has published a special online issue, “Disinfection, Sterilization and Antisepsis: Principles, Practices, Current Issues, New Research and New Technologies,” in May
II. So far, 2016 has seen a 10% increase in manuscript submissions over this time last year (n=328) and the highest number of submissions by this date of any year
*as of May 24, 2016
III.
306 352 385
508560
617 611704
835
361*
2007 2008 2009 2010 2011 2012 2013 2014 2015 2016
Total Manuscripts Submitted to AJIC
2008 2009 2010 2011 2012 2013 2014 2015 2016Series1 51.0% 50.7% 57.7% 49.2% 53.0% 49.3% 46.6% 55.2% 56.6%Series2 49.0% 49.3% 42.3% 50.8% 47.0% 50.7% 53.4% 44.8% 43.4%
0.0%10.0%20.0%30.0%40.0%50.0%60.0%70.0%
Accepted vs. Rejected Manuscripts

IV. The percentage of domestic submissions is approximately the same as 2015, with 30% of manuscripts coming from the United States and 70% coming from other countries (vs. 29%/71% last year).
V. 79% of manuscripts by US authors have been accepted so far in 2016, whereas 47% of manuscripts by foreign authors have been accepted. This represents a slight uptick in international acceptances over 2015, when 67% of US manuscripts and 34% of international submissions were accepted.
VI. One fourth of invited reviewers completed reviews in 2016, down slightly from prior years.
1010 reviewer invitations have been sent out so far in 2016, compared to 995 the same period last year.
30%
70%
Domestic vs. International SubmissionsUS Submissions Foreign Submissions
79%
21%
Domestic
Accepted
Rejected47%
53%
Foreign
Accepted
Rejected

Total Reviewers Invited 1010
Completed reviews 225 Declined to review 234 Uninvited or terminated (no response) 465 Has not yet responded to invitation (active) 66
VII. Goals for 2015-2017:
1. Continue to enhance collaboration with APIC national office and their other publications. 2. Publish at least one supplement. 3. Decrease time between manuscript submission and acceptance.
Completed reviews
25%
Declined to review
25%
Uninvited or terminated (no
response)50%
Breakdown of invited reviewers' responses
6/1/2016
1
|American Journal of Infection Control│
American Journal of Infection Control
June 2016Editorial Board Meeting
Presented by: Chris Baumle, Elsevier
Publisher’s Report
This information contained in this report is submitted on a confidential basis. It is provided with the understanding that it is to be used solely for discussion and none of its content may be divulged to any persons not directly involved with American Journal of Infection Control..
|American Journal of Infection Control│ 2
Business Analysis

6/1/2016
2
|American Journal of Infection Control│
CHANNEL REVENUE
3
The following outlines journal revenue sources as a percentage of total revenue.
*Includes back issue sales, copyright permissions, publication rights, and other miscellaneous revenue
*Institutions only
YTD Mar2016 2015 2014 2013
Electronic Usage 31% 34% 30.5% 28%
Print Subscriptions 14% 14% 15.5% 17%
Commercial Sales 49% 35% 43.5% 43%
Supplements 0 4% 2.5% 6%
Reprints 3% 8% 4.0% 5%
All other sources* 3% 5% 4.0% 1%
|American Journal of Infection Control│ 4
Content Overview

6/1/2016
3
|American Journal of Infection Control│ 5
ARTICLE FLOWSubmitted Articles
Accepted Articles
Published Articles
Jan Feb Mar Apr May Jun Jul Aug Sep Oct Nov Dec Total Growth2014 57 71 52 53 53 54 74 64 50 68 54 50 700 16.3%
2015 48 72 67 74 72 59 70 60 71 79 86 75 833 19.0%
2016 84 74 76 234 25.1%
Jan Feb Mar Apr May Jun Jul Aug Sep Oct Nov Dec Total Growth2014 19 15 26 23 28 28 26 22 17 28 20 19 271 ‐1.8%
2015 29 22 32 24 38 18 41 19 27 33 30 31 344 36.9%
2016 31 34 35 100 20.5%
Jan Feb Mar Apr May Jun Jul Aug Sep Oct Nov Dec Total Growth2014 51 28 31 29 23 28 0 23 59 24 19 0 315 ‐2.2%
2015 20 41 20 26 0 51 21 26 26 22 25 0 278 ‐11.5%
2016 26 25 54 105 29.6%
#VALUE! total:
prev 12 months: Apr '14 ‐ Mar '15 707
last year: Jan '15 ‐ Dec '15 833
last 12 months: Apr '15 ‐ Mar '16 880 24.5% ↑
total:
prev 12 months: Apr '14 ‐ Mar '15 294
last year: Jan '15 ‐ Dec '15 344
last 12 months: Apr '15 ‐ Mar '16 361 22.8% ↑
total:
prev 12 months: Apr '14 ‐ Mar '15 286
last year: Jan '15 ‐ Dec '15 278
last 12 months: Apr '15 ‐ Mar '16 302 5.6% ↑
|American Journal of Infection Control│
SPEED TO PUBLICATION
6
Processing time in Weeks Results
YearArticles
SubmittedFinal
DispositionSubmit to 1st
DecisionAuthor
RevisionSubmission
to Disposition Withdrawn Accepted RejectedRejection
Rate
YTD Mar 2016 234 230 5.0 5.6 9.79 0 132 98 43%2015 833 741 4.7 5.9 8.5 3 414 324 44%2014 700 645 4.1 6.4 7.6 1 324 320 50%
2013 602 608 3.5 6 9.6 4 319 285 47%
*Green bars indicate journal performs better than comparable journals**Yellow bar indicates journal performs on par with comparable journals
All Issues
# mssTIME to FIRST DECISION (jnls in
EES) # mss EDITORIAL SPEEDS (accepted mss) TIME to s250/s300 (citeable article)
AVERAGE FOR: l12m 2015 l12mYTD
Mar 2016 l12m 2015 l12mYTD
Mar 2016 2015 l12mYTD
Mar 2016 YMIC 789 4.1 4.5 g 5.1 ↑ 320 13.7 13.9 g 13.9 ↑ 14.1 16.5 y 19.0 ↑
AJIC
6/1/2016
4
Electronic Reach and Usage
Reach and Usage Analytics
|American Journal of Infection Control│
SCOPUSAJIC Top Ten most Cited Articles published in 2013-2014
8
Article First AuthorTimes Cited
National Healthcare Safety Network (NHSN) report, data summary for 2012, Device-associated module, Vol. 41, No. 12, 2013 Dudeck, M.A. 54
Evidence that contaminated surfaces contribute to the transmission of hospital pathogens and an overview of strategies to address contaminated surfaces in hospital settings, Vol. 41, 5 SUPPL , 2013 Otter, J.A. 42
National Healthcare Safety Network report, data summary for 2011, device-associated module, Vol. 41, No. 4, 2013 Dudeck, M.A.. 42
Does improving surface cleaning and disinfection reduce health care-associated infections?, Vol. 41, 5 SUPPL , 2013 Donskey, C.J. 35
Asymptomatic Clostridium difficile colonization in a tertiary care hospital: Admission prevalence and risk factors, Vol. 41, No. 5, 2013 Leekha, S. 30
Duration of carriage of carbapenem-resistant Enterobacteriaceae following hospital discharge, Vol. 41, No. 3, 2013 Zimmerman, F.S. 28
Preoperative chlorhexidine shower or bath for prevention of surgical site infection: A meta-analysis, Vol. 41, No. 2, 2013 Chlebicki, M.P. 26
Clinical and economic outcomes from a community hospital's antimicrobial stewardship program, Vol. 41, No. 2, 2013 Malani, A.N. 25
International Nosocomial Infection Control Consortiu (INICC) report, data summary of 43 countries for 2007-2012. Device-associated module, Vol. 42, No. 9, 2014 Rosenthal, V.D. 24Eradication of carbapenem-resistant Enterobacteriaceae gastrointestinal colonization with nonabsorbable oral antibiotic treatment: A prospective controlled trial, Vol. 41, No. 12, 2013 Oren, I. 21

6/1/2016
5
│American Journal of Infection Control |
ELECTRONIC USAGE
9
Platform YTD Mar 2016 2015 2014 2013
ScienceDirect Full-text Downloads 236,318 846,752 758,113 624,804AJIC Online www.ajicjournal.org
Page Views 265,474 1,040,283 967,409 861,607Article Views 47,193 117,543 123,465 95,282
Nursing Consult Article Views N/A 20,359 36,081 35,099Ovid Page Views 7,536 29,972 26,367 22,102
0
100,000
200,000
300,000
400,000
500,000
600,000
700,000
800,000
900,000
1,000,000
YTD Mar 2016 2015 2014 2013
ScienceDirect Full‐text Downloads
AJIC Online Page Views
AJIC Online Article Views
Nursing Consult Article Views
Ovid Page Views
*We are no longer reporting on Nursing Consult
|American Journal of Infection Control│
SCIENCEDIRECTTop ten AJIC article downloads, January 2015 – March 2016
10
Article TitleFirst Authors Cover
Date DownloadsNurse-directed interventions to reduce catheter-associated urinary tract infections Oman, K.S., et al. Aug 2012 7,497Cleaning and disinfecting environmental surfaces in health care: Toward an integrated framework for infection and occupational illness prevention Quinn, M.M.; Henneberger, P.K. May 2015 6,758National Healthcare Safety Network report, data summary for 2013, Device-associated Module Dudeck, M.A., et al. Mar 2015 6,282Successful reduction in catheter-associated urinary tract infections: Focus on nurse-directed catheter removal Parry, M.F.; Grant, B.; Sestovic, M. Dec 2013 5,825Impact of universal disinfectant cap implementation on central line-associated bloodstream infections Merrill, K.C.; Sumner, S., et al. Dec 2014 5,702Indwelling urinary catheter management and catheter-associated urinary tract infection prevention practices in Nurses Improving Care for Healthsystem Elders hospitals Fink, R.; Gilmartin, H., et al. Oct 2012 5,605
Guidelines for the prevention of intravascular catheter-related infections
Healthcare Infection Control Practices Advisory Committee (HICPAC) (Appendix 1); O'Grady, N.P., et al. May 2011 5,357
Comparative efficacy of hand hygiene agents in the reduction of bacteria and viruses Sickbert-Bennett, E.E., et al. Mar 2005 5,278Nurse staffing, burnout, and health care-associated infection Cimiotti, J.P., et al. Aug 2012 4,843
Guideline for Prevention of Surgical Site Infection, 1999
The Hospital Infection Control Practices Advisory Committee; Mangram, A.J., et al. Apr 1999 4,823
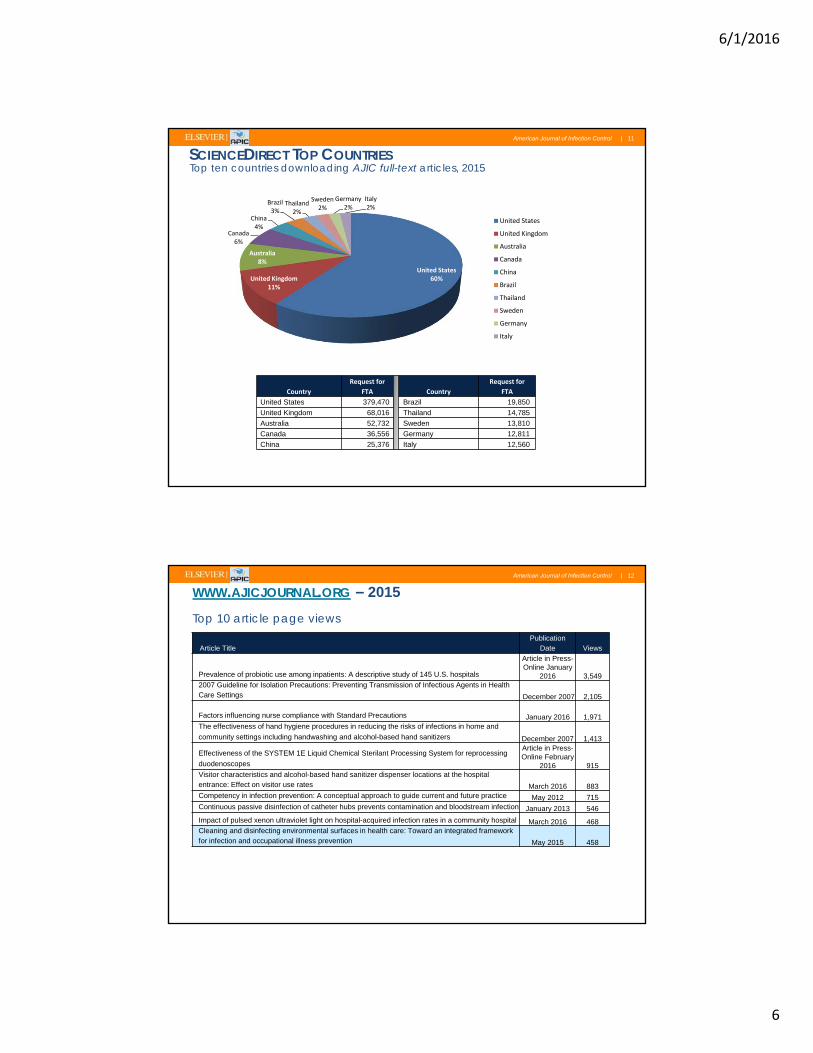
6/1/2016
6
|American Journal of Infection Control│
SCIENCEDIRECT TOP COUNTRIESTop ten countries downloading AJIC full-text articles, 2015
11
United States60%United Kingdom
11%
Australia8%
Canada6%
China4%
Brazil3%
Thailand2%
Sweden2%
Germany2%
Italy2%
United States
United Kingdom
Australia
Canada
China
Brazil
Thailand
Sweden
Germany
Italy
Country
Request for
FTA Country
Request for
FTA
United States 379,470 Brazil 19,850United Kingdom 68,016 Thailand 14,785Australia 52,732 Sweden 13,810Canada 36,556 Germany 12,811China 25,376 Italy 12,560
|American Journal of Infection Control│
WWW.AJICJOURNAL.ORG – 2015Top 10 article page views
12
Article TitlePublication
Date Views
Prevalence of probiotic use among inpatients: A descriptive study of 145 U.S. hospitals
Article in Press-Online January
2016 3,5492007 Guideline for Isolation Precautions: Preventing Transmission of Infectious Agents in Health Care Settings December 2007 2,105
Factors influencing nurse compliance with Standard Precautions January 2016 1,971The effectiveness of hand hygiene procedures in reducing the risks of infections in home and community settings including handwashing and alcohol-based hand sanitizers December 2007 1,413
Effectiveness of the SYSTEM 1E Liquid Chemical Sterilant Processing System for reprocessing duodenoscopes
Article in Press-Online February
2016 915Visitor characteristics and alcohol-based hand sanitizer dispenser locations at the hospital entrance: Effect on visitor use rates March 2016 883Competency in infection prevention: A conceptual approach to guide current and future practice May 2012 715Continuous passive disinfection of catheter hubs prevents contamination and bloodstream infection January 2013 546Impact of pulsed xenon ultraviolet light on hospital-acquired infection rates in a community hospital March 2016 468Cleaning and disinfecting environmental surfaces in health care: Toward an integrated framework for infection and occupational illness prevention May 2015 458
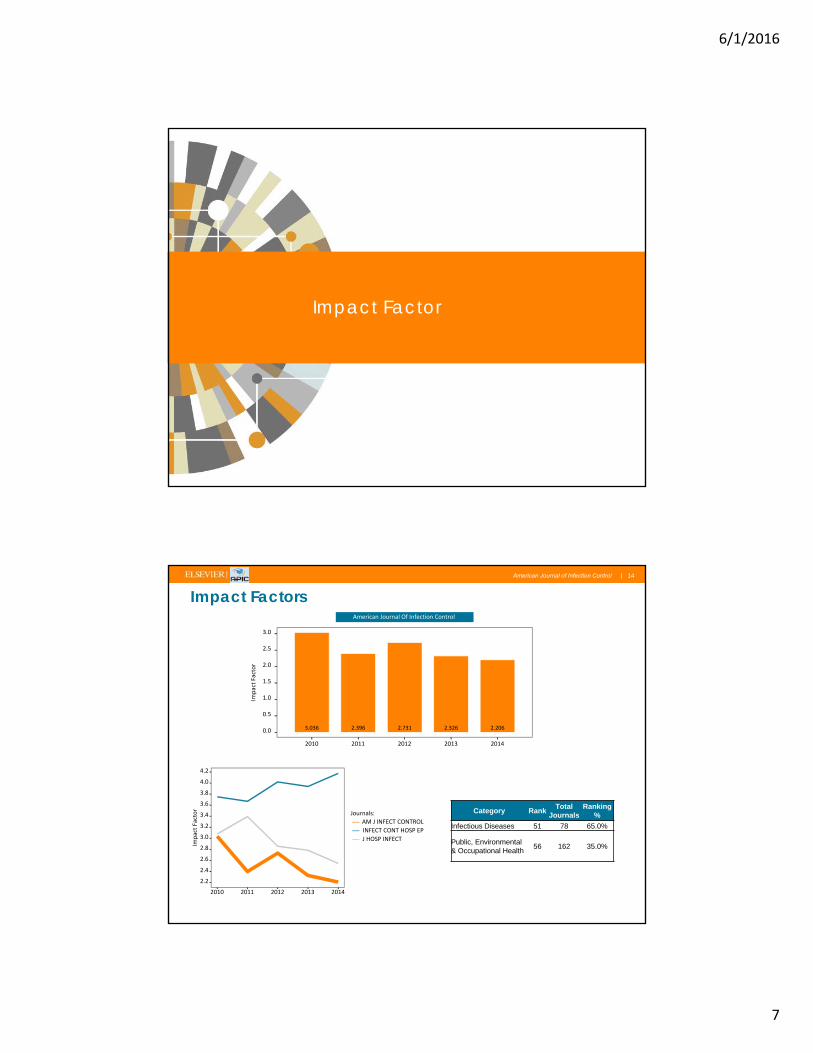
6/1/2016
7
|American Journal of Infection Control│ 13
Impact Factor
|American Journal of Infection Control│ 14
Impact Factors
2.2
2.4
2.6
2.8
3.0
3.2
3.4
3.6
3.8
4.0
4.2
2010 2011 2012 2013 2014
Impact Factor
Journals:
AM J INFECT CONTROL
INFECT CONT HOSP EP
J HOSP INFECT
Category Rank Total Journals
Ranking %
Infectious Diseases 51 78 65.0%
Public, Environmental & Occupational Health 56 162 35.0%
3.036 2.396 2.731 2.326 2.2060.0
0.5
1.0
1.5
2.0
2.5
3.0
2010 2011 2012 2013 2014
Impact Factor
American Journal Of Infection Control

6/1/2016
8
|American Journal of Infection Control│ 15
Marketing
|American Journal of Infection Control│ 16
‘ONLINE MARKETING (PLEASE UPDATE)
Campaigns for AJIC typically include Impact Factor results, calls for papers, and most popular articles and issues.
Email Campaigns
Campaign Description 2015 SentOpenRate
ClickRate
Top downloaded articles Journal level 20 Mar 2015 5,000 49.4% 14%
Nurses Week Email 11 May 2015 29,353 20% 16.6%
Top 25 downloaded articles - Subject level 1 May 2015 5,000 41% 16.1%
NursingPlus Newsletter 12 May 2015 28,694 21.6% 14.8%
Global campaign to promote SNIP/SJR on journal level 16 Jun 2015 5,000 45% 5.5%
Global Campaign to Promote Impact factor for Editors 19 Jun 2015 49821 37.4% 1.6%
Global campaign to promote the new Impact Factors, and SNIP/SJR on subject level 1 Jul 2015 5146 30.7% 9.9%
6/1/2016
9
|American Journal of Infection Control│ 17
EXHIBITIONSAJIC was promoted at the following conferences:
Conference Location 2016
Association of Peri-Operative Registered Nurses Anaheim 2 Apr
National Association of Pediatric Nurse Practitioners Atlanta 16 Mar
American Organization of Nurse Executives Forth Worth 3 Mar
Conference Location 2015
International AIDS Society Vancouver 19 Jul
Association for Professionals in Infection Control Nashville Jun 27
American Association of Nurse Practitioners New Orleans 9 Jun
American Organization of Nurse Executives Phoenix 15 Apr
AMDA Long Term Care Medicine 2015 – American Medical Directors Association Louisville 19 Mar
National Association of Pediatric Nurse Practitioners Las Vegas 11 Mar
Association of Peri-Operative Registered Nurses Denver 7 Mar
18
August 2015
6/1/2016
10
19
What is EVISE®?
EVISE® is the successor of the Elsevier Editorial System (EES) and will ultimately replace it.
Key features:
• Single sign on • Integrated plagiarism check (CrossCheck) - An automated plagiarism
check through iThenticate• Increased reviewer finding options • Integration with Scopus • Automatic manuscript assignment • Manuscript viewable as HTML or PDF • Full ORCID support
August 2015
20
EES / EVISE update
• In the journal update EES and EVISE data are in the process of being combined
• Currently these metrics are already combined in the journal update:• Submitted, Accepted, Rejected and rejections rates (slide 14)• Speed metrics (slide 24)• Speed and articles per editor (slide 25-28)• More metrics will be added the weeks to come• Slide 15 and 29-31 currently only contain EES data, these metrics
might be available in the Evise journal report• Please note that combining these metrics between systems can
cause small discrepancies

6/1/2016
11
21
What is EVISE®?
Benefits for Editors:
• Automatic manuscript assignment ensures accuracy and saves time • EVISE® is linked to Scopus for seamless access to abstracts and citation
data • Homepage for all submissions - each submission will have its own
dedicated homepage from which Editors will be able to take all relevant actions, such as making an editorial decision, inviting reviewers, or sending a reminder
• Visual timelines for an instant view on manuscript workflow stage and status
• Visualized reviewer status • Identify potential relevant reviewers using Scopus data • Integrated Plagiarism Check • Automated reference linking using CrossRef• Adjustable communication templates save time while allowing for personal
messages.
August 2015
|American Journal of Infection Control│ 22
Elsevier Initiatives

6/1/2016
12
• Extend the format of the article to also capture data (as well as computer code, multimedia files, etc.)
• Offer authors the best possible way to present their work• Enabling other researchers explore and engage with rich articles
Interactive plots... Google Maps... 3D models... Virtual Microscope...
And much more!See Content Innovation on Elsevier.com
24
• Content Innovation on Elsevier.com – including full listing of available innovations, and a search tool to see what innovations are available for your journal
• All journal homepages feature links to Content Innovations available for that journal

6/1/2016
13
25
August 2015
26
Elsevier publishing campusDesigned to give researchers free access to online lectures, interactive training and professional advice on a range of topics, Publishing Campus represents a new way for Elsevier to connect meaningfully with (early career) researchers.
August 2015
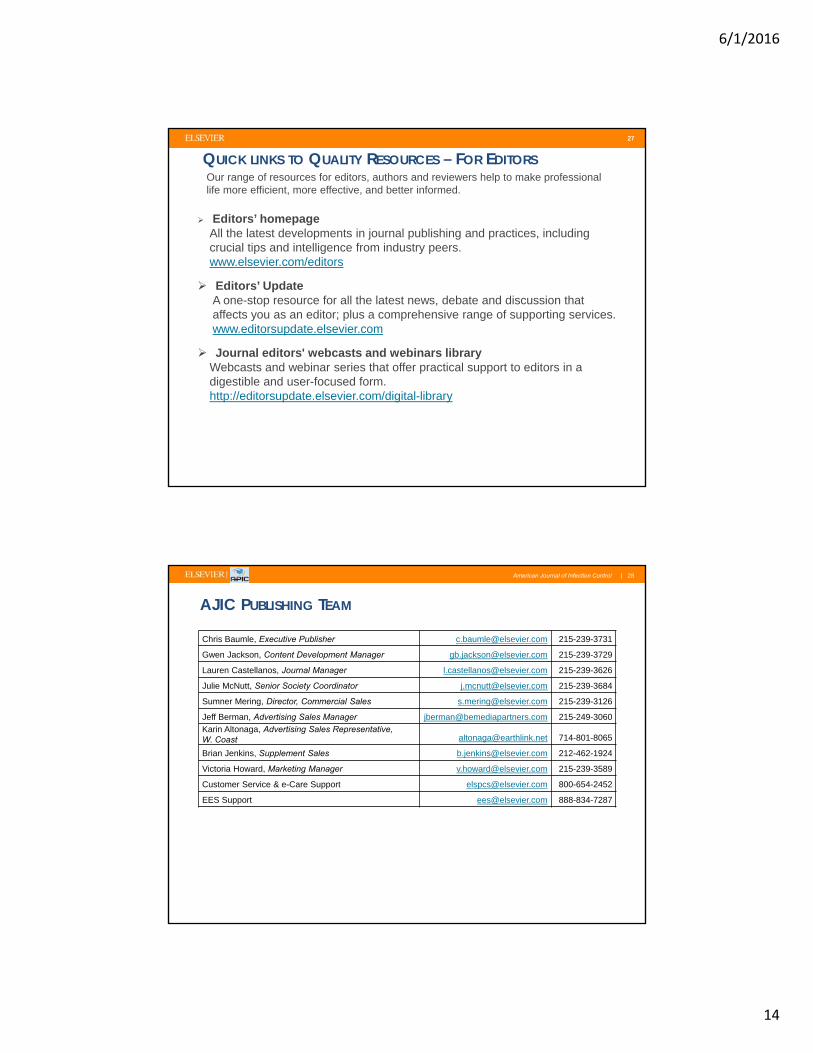
6/1/2016
14
2727
QUICK LINKS TO QUALITY RESOURCES – FOR EDITORSOur range of resources for editors, authors and reviewers help to make professional life more efficient, more effective, and better informed.
Editors’ homepageAll the latest developments in journal publishing and practices, including crucial tips and intelligence from industry peers.www.elsevier.com/editors
Editors’ UpdateA one-stop resource for all the latest news, debate and discussion that affects you as an editor; plus a comprehensive range of supporting services.www.editorsupdate.elsevier.com
Journal editors' webcasts and webinars libraryWebcasts and webinar series that offer practical support to editors in a digestible and user-focused form.http://editorsupdate.elsevier.com/digital-library
|American Journal of Infection Control│
AJIC PUBLISHING TEAM
28
Chris Baumle, Executive Publisher [email protected] 215-239-3731
Gwen Jackson, Content Development Manager [email protected] 215-239-3729
Lauren Castellanos, Journal Manager [email protected] 215-239-3626
Julie McNutt, Senior Society Coordinator [email protected] 215-239-3684
Sumner Mering, Director, Commercial Sales [email protected] 215-239-3126
Jeff Berman, Advertising Sales Manager [email protected] 215-249-3060Karin Altonaga, Advertising Sales Representative, W. Coast [email protected] 714-801-8065
Brian Jenkins, Supplement Sales [email protected] 212-462-1924
Victoria Howard, Marketing Manager [email protected] 215-239-3589
Customer Service & e-Care Support [email protected] 800-654-2452
EES Support [email protected] 888-834-7287

Affiliates Reports
APIC Consulting Services

1275 K Street NW, Suite 1000 Washington, DC 20005
Phone: 202-464-4252 Fax: 202-789-1899 www.apicconsulting.com
Annual Report
for the APIC Board of Directors
June 2016
Activities from the Past Year (June 2015-June 2016)
For the first time since its inception in 2008, APIC Consulting surpassed the $1M revenue mark.
Additionally, APIC Consulting:
Won two multi-year, multi-million dollar state and local health department grants to deliver
assessments and training to Ebola treatment facilities, acute care, long-term care, long-term acute
care, ambulatory, ambulatory surgery center, and dialysis facilities.
Completed one state health department grant for Ebola-specific and other acute facilities at the
$100K level.
Expanded staff with a fourth full-time employee, Sr. Manager, Project Execution.
Completed components for the Program of Distinction, and prepared for piloting the program.
Developed Consultant Guidelines, SOPs, and other policies for standardizing operations, and
introduced a new Consultant Orientation onboarding process.
Growth Strategy:
While state and local health department grants/contracts make up the majority of the FY2016 budget, the
chart below details the way APIC Consulting is growing revenue streams to ensure continuous growth
once current grants/contracts are completed. We continue to negotiate with additional states for similar
work (estimated at the $150-$400K level), so there is a possibility that the grants/contracts revenue stream
will be maintained at the $1-$2M level in 2019.
Upcoming:
Next steps for APIC Consulting Services include piloting the Program of Distinction, finalizing contracts
with additional state health departments and developing a remote surveillance offering.
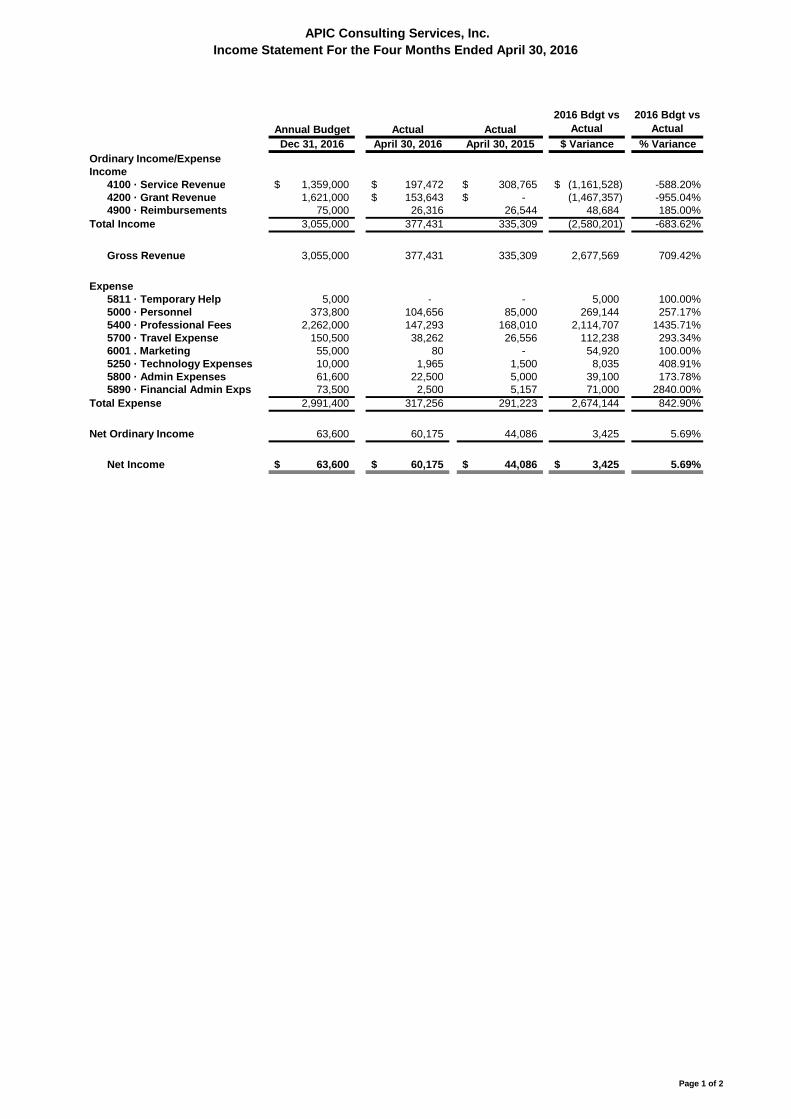
APIC Consulting Services, Inc. Income Statement For the Four Months Ended April 30 , 2016
Annual Budget Actual Actual2016 Bdgt vs
Actual2016 Bdgt vs
ActualDec 31, 2016 April 30, 2016 April 30, 2015 $ Variance % Variance
Ordinary Income/ExpenseIncome
4100 · Service Revenue 1,359,000$ 197,472$ 308,765$ (1,161,528)$ -588.20%4200 · Grant Revenue 1,621,000 153,643$ -$ (1,467,357) -955.04%4900 · Reimbursements 75,000 26,316 26,544 48,684 185.00%
Total Income 3,055,000 377,431 335,309 (2,580,201) -683.62%
Gross Revenue 3,055,000 377,431 335,309 2,677,569 709.42%
Expense5811 · Temporary Help 5,000 - - 5,000 100.00%5000 · Personnel 373,800 104,656 85,000 269,144 257.17%5400 · Professional Fees 2,262,000 147,293 168,010 2,114,707 1435.71%5700 · Travel Expense 150,500 38,262 26,556 112,238 293.34%6001 . Marketing 55,000 80 - 54,920 100.00%5250 · Technology Expenses 10,000 1,965 1,500 8,035 408.91%5800 · Admin Expenses 61,600 22,500 5,000 39,100 173.78%5890 · Financial Admin Exps 73,500 2,500 5,157 71,000 2840.00%
Total Expense 2,991,400 317,256 291,223 2,674,144 842.90%
Net Ordinary Income 63,600 60,175 44,086 3,425 5.69%
Net Income 63,600$ 60,175$ 44,086$ 3,425$ 5.69%
Page 1 of 2

APIC Consulting Services, Inc. Balance Sheet
As of April 30, 2016
April 30, 2016 April 30, 2015 $ Change % ChangeASSETS
Current AssetsChecking/Savings
1000 · Checking Account 141,900 97,118 44,782 46.1%Total Checking/Savings 141,900 97,118 44,782 46.1%Accounts Receivable
1495 · Doubtful debt (10,000) - (10,000) -100.0%1400 · Accounts Receivable 303,656 280,608 23,047 8.2%
Total Accounts Receivable 293,656 280,608 13,047 4.7%Other Current Assets
1499 · Undeposited Funds - 5,485 (5,485) -100.0%1600 · Prepaid Expenses 15,409 4,907 10,502 214.0%
Total Other Current Assets 15,409 10,392 5,017 48.3%Total Current Assets 450,965 388,118 62,846 16.2%
TOTAL ASSETS 450,965 388,118 62,846 16.2%
LIABILITIES & EQUITYLiabilities
Current LiabilitiesAccounts Payable
2000 · Accounts Payable - 1,000 (1,000) -100.0%2501 · Note Payable APIC 361,237 351,617 9,620 2.7%
Total Accounts Payable 361,237 352,617 8,620 2.4%Other Current Liabilities
2300 · Accrued Expenses 1,000 1,093 (93) -8.5%Total Other Current Liabilities 1,000 1,093 (93) -8.5%
Total Current Liabilities 362,237 353,710 8,527 2.4%Total Liabilities 362,237 353,710 8,527 2.4%Equity
3010 · Common Stock 5,000 5,000 - 0.0%3900 · Retained Earnings 23,553 (14,677) 38,230 260.5%Net Income 60,175 44,086 16,090 36.5%
Total Equity 88,728 34,408 54,320 157.9%TOTAL LIABILITIES & EQUITY 450,965 388,118 62,846 16.2%
Page 2 of 2
Association for Professionals in Infection Control and Epidemiology 1275 K Street, NW, Suite 1000
Washington, DC 20005 Phone: 202-789-1890 Fax: 202-789-1899
Affiliates Reports
Certification Board of Infection Control and Epidemiology (CBIC)
2016 MID-YEAR REPORT
Introduction The Certification Board of Infection Control and Epidemiology, Inc. (CBIC) is a voluntary, autonomous, multidisciplinary board which provides direction for and administers the certification process for infection prevention and control. Please see attachment for the 2016 Board of Directors. CBIC’s certification process was established to protect the public by providing standardized measurement of the current essential knowledge needed for persons practicing infection prevention. Prometric, an independent testing agency, provides testing and measurement services to CBIC. Certification examination questions are the copyrighted property of CBIC. CBIC formally recognizes infection prevention and control professionals who fulfill the requirements for certification and recertification by bestowing the CIC® designation, a registered trademark. The CBIC certification program is accredited by the National Commission for Certifying Agencies (NCCA). NCCA accreditation signifies that CBIC has met the highest national voluntary standards for private certification organizations. Summary of 2016 Activities to-date 2016 has already been an exciting and busy year for CBIC which included meeting goals and objectives as outlined in our new strategic plan that was approved in February. The summary of activities below is a reflection of CBIC’s new strategic plan. Goal Area 1: Create new, and leverage existing, partnerships
a) Bring new candidates for certification This spring, we developed a list of current, budding, and potential future relationships that CBIC currently has with other infection prevention and control organizations. This will help us catalog and build upon existing partnerships. In addition to this, we continue to work with APIC, IPAC Canada, ASCA, SHEA, AIPI, NOVA, and state HAI coordinators.
b) Establish a CBIC Outreach Task Force The CBIC Board has developed a strategy for reaching out to like-minded organizations. To assist with implementation of that strategy, the Outreach Task Force was established at our May Board Meeting. The Task Force will work on identifying and prioritizing new potential partners, identify and communicate mutual goals, interests, and gains, and ultimately, develop a formal outreach strategy.

2016 CBIC Mid-year Report to APIC
Ruth Carrico, 2016 CBIC President
c) Work to overcome objections to becoming certified CBIC conducted a survey of booth visitors who were not certified at IPAC Canada 2016, with the intention of doing the same at APIC 2016. Survey results will be compiled and analyzed after APIC 2016. Questions on the survey included:
1. Are you currently working in infection prevention and control? 2. Are you currently certified in infection prevention and control (CIC®)? 3. Do you plan to become CIC® certified? 4. If not, what are your reasons for not becoming certified? 5. What do you think are the primary and secondary benefits to becoming certified? 6. If so, when do you intend to sit for the CIC® exam? 7. What are your reasons for not becoming certified earlier? 8. Do you think certification is important for IP/ICPs? 9. Why? 10. Do you have any other comments on certification in infection prevention and
control (CIC®) or barriers to becoming certified?
d) Continue to work with existing partnerships (APIC/IPAC Canada) CBIC launched the French Canadian translation of the initial CIC® examination in February. To help promote this, we sent out emails to prospective candidates in Canada and sent information to AIPI to distribute along with fliers for AIPI to include in their conference bags. At IPAC Canada 2016, the CBIC Board was fortunate to attend the Interactive Lunch in which we networked with conference attendees and answered questions about CIC® certification. CBIC President, Ruth Carrico, also gave a brief presentation at the Chapter President’s Meeting and attended the International President’s Luncheon. We reached out to APIC and IPAC Canada to determine how many members were certified in each state or province and created maps that were posted on the CBIC website. We also exhibited at IPAC Canada 2016 and planned the booth activities for APIC 2016. Articles for the winter and spring issues of Prevention Strategist were submitted.
Goal 2: Study the value of certification with the goal of demonstrating a data driven value proposition to our constituents
a) Create a task force / sub-committee At the May Board Meeting, a Data Management Task Force was established to help organize and gather data on current certificants and future candidates. This Task Force will also draft a report to determine first steps for this goal.
Goal 3: Create segmented (define, clarify, and prioritize) marketing strategies that reflect the value of certification to each constituency
a) Reach out to APIC and IPAC chapters to gather feedback on materials sent in 2015 In 2015, CBIC staff contacted all APIC chapters and offered to send materials on the CIC® exam. The response was overwhelmingly positive. To follow up, CBIC has drafted a survey to be sent to APIC Chapters who received materials in 2015 to assess the value of the materials sent.
2016 CBIC Mid-year Report to APIC
Ruth Carrico, 2016 CBIC President
b) Establish CBIC Data Management Task Force The Data Management Task Force was established at the May Board Meeting. The task force will work with current data provided by the APIC mega-survey. CBIC also reached out to IPAC Canada to see if they have similar data.
c) Engage CICs in telling their story and share on social media and web CBIC sends quarterly engagement emails to CICs to encourage them to stay informed and become more involved. These emails have generated several requests to be featured in both the e-newsletter and on social media. Every Friday, one of these stories is posted to Facebook, Twitter, LinkedIn, and Instagram. In addition, at IPAC Canada 2016 current and future CICs completed tasks that encouraged them to get involved and network and then post photos using #CBICBingo and #IPAC2016. The same social media strategy will be employed at APIC 2016.
Goal 4: Increase the net number of CICs by 840 NEW certificants (minimum) each year for the next 3 years
a) Identify why CICs don't recertify in order to minimize attrition CBIC created a survey to send to certificants who lapsed in 2015. Hopefully, the results of the survey will provide some insight as to why certificants lapse and will assist CBIC with developing tools to improve retention.
b) Identify chapters with a low number of CICs The CBIC Board has outlined a strategy to focus on successful study groups to use as a model. We plan to reach out to chapters to gather this information and then post links on the CBIC website, as well as creating podcasts of successful chapters and providing a list of virtual resources. The CBIC Marketing Committee has been tasked with creating a Chapter Toolkit that any APIC or IPAC Canada chapter may utilize so that all information regarding the CIC® that goes out to the chapters in consistent.
While the goal of 840 new certificants each year seems like a lofty one, the CBIC Board is committed to increasing the number of certificants to continue to support our mission of protecting the public. Other Initiatives During the first few months of 2016, CBIC was wrapping up initiatives from our previous strategic plan as outlined below. Mentoring Program
The mentoring program creates a bridge between experienced and new CICs. Mentors gain personal satisfaction, growth within the infection prevention and control field, and networking opportunities. Mentees obtain advice, as well as an expanded base of skills, knowledge, and networking opportunities. The mentor-mentee relationship is intended to foster maximum outreach and commitment to the field of infection prevention and control through encouraging strong collegial relationships, training, support, and recognition.
2016 CBIC Mid-year Report to APIC
Ruth Carrico, 2016 CBIC President
CICs who volunteer to be a mentor are not representatives of CBIC. Currently we have matched 17 newly certified CICs with experienced mentors. Communications CBIC is continuously working to improve our website for current and future certificants. Recently we have added items such as the Code of Ethics for Certificants and the CIC® Verification page. In addition to this, CBIC has worked to significantly grow its followers on social media and has seen steady growth on all platforms. In 2016, we implemented a new initiative to highlight CICs on Fridays. Alongside the website and social media, we use emails to connect with our CICs. In 2016, we started a new email campaign called “Behind the Scenes with CBIC” where we clarify the reasons behind CBIC policies such as governance and education and training. As always, CBIC continues to send out quarterly e-newsletters and other engagement emails.
Ongoing Activities Of course, CBIC participates in many ongoing activities throughout the year. We continue to provide Board development activities to our directors along with strategic succession planning. In 2016, CBIC will hold an Item Writing Workshop, Item Review Workshop, and a Form Review Meeting as part of our test development process. As President, I also enjoy sending personalized notes to successful initial and recertification candidates. As mentioned above, CBIC is accredited by the National Commission for Certifying Agencies (NCCA). In 2016, we will submit our application for reaccreditation. Accreditation for professional or personnel certification programs provides impartial, third-party validation that our program has met recognized national and international credentialing industry standards for development, implementation, and maintenance of certification programs. Accreditation enables credentialing organizations to demonstrate to the profession it represents, and to the general public its certificants serve, that their program has met the stringent standards set by the credentialing community; enhances a program's credibility and legitimacy by providing impartial, third party oversight of a conformity assessment system and; provides organizations with a way to answer the question "who reviewed your certificate or certification program?", a question often posed by members of an occupation, employers, and sometimes, the courts. Certification Statistics
2016* 2015 2014 Recert Exam Purchases 352 689 510 First-Time certifiers 286 1144 692 Recertified by CBT** 1 227 244 International Applicants 87 328 245 Percentage who recertified 36% 67% 74%
*2016 numbers are as of April 30, 2016 **As of January 1, 2016 CICs must first attempt the recertification examination. If they are unsuccessful, they are allowed one attempt to recertify by the initial certification exam.
2016 CBIC Mid-year Report to APIC
Ruth Carrico, 2016 CBIC President
Board of Directors The Certification Board of Infection Control and Epidemiology, Inc. is served by a group of dedicated volunteers, who donate their time, energy, and passion to maintain and improve an accredited certification program for infection prevention and control professionals. The 2016 Board includes the following champions for certification: Kathy McGhie RN, BScN, CIC – Immediate Past President Lita Jo Henman, MPH, CIC – President-Elect Linda Goss, APRN, CIC - Secretary Constance J. Cutler, RN, MS, CIC, FSHEA - Treasurer Karen G. Anderson, MT, MPH, CIC JoAnn Andrews, RN, DNP, CIC Roy Boukidjian RN, BSN, PHN, CIC, NE-BC Sandra Callery, RN, CIC Vincent Hsu, MD, MPH, FACP, CIC James F. Marx, PhD, RN, CIC Bonnie Sue Norrick, MT(ASCP), EdM, CIC Christine C. Zirges, RN, ACNS-BS, CIC Steven Langan, Public Consumer Member Anne N. Krolikowski, CAE, Executive Director 2016 Liaisons to CBIC: Janet Haas PhD, RN, CIC, FSHEA – APIC Liaison Suzanne Rhodenizer-Rose, RN, BScN, MHS, CIC – IPAC-Canada Liaison CBIC plans to maintain our current staffing pattern of an Executive Director, Senior Program Manager, Marketing Coordinator, and Administrative Coordinator in 2016. In an effort to reduce expenses and to be able to focus our resources to promoting the credential, the CBIC Board will continue to hold two in-person meetings and one conference call in 2016. Respectfully submitted, Ruth M. Carrico, PhD, RN, CIC 2016 CBIC President

NOTES