Embed Size (px)
Citation preview
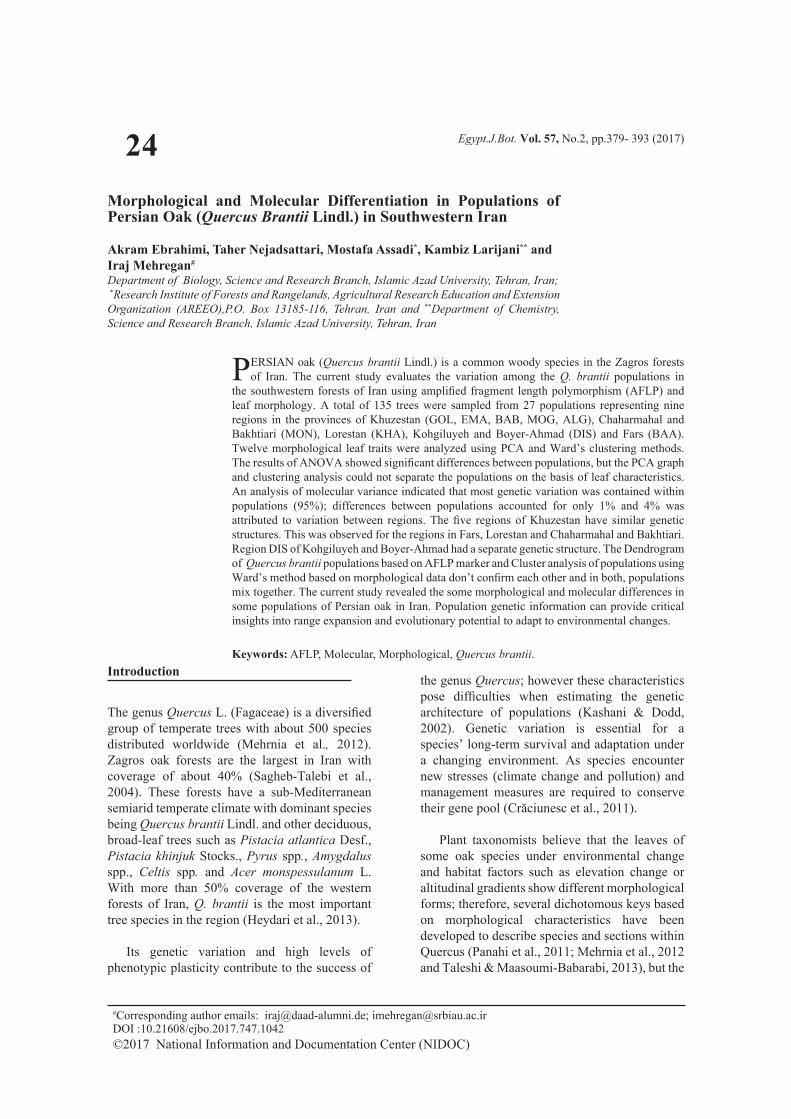
Egypt.J.Bot. Vol. 57, No.2, pp.379- 393 (2017)
#Corresponding author emails: [email protected]; [email protected] DOI :10.21608/ejbo.2017.747.1042©2017 National Information and Documentation Center (NIDOC)
Introduction
The genus Quercus L. (Fagaceae) is a diversified group of temperate trees with about 500 species distributed worldwide (Mehrnia et al., 2012). Zagros oak forests are the largest in Iran with coverage of about 40% (Sagheb-Talebi et al., 2004). These forests have a sub-Mediterranean semiarid temperate climate with dominant species being Quercus brantii Lindl. and other deciduous, broad-leaf trees such as Pistacia atlantica Desf., Pistacia khinjuk Stocks., Pyrus spp., Amygdalus spp., Celtis spp. and Acer monspessulanum L. With more than 50% coverage of the western forests of Iran, Q. brantii is the most important tree species in the region (Heydari et al., 2013).
Its genetic variation and high levels of
phenotypic plasticity contribute to the success of
the genus Quercus; however these characteristics pose difficulties when estimating the genetic architecture of populations (Kashani & Dodd, 2002). Genetic variation is essential for a species’ long-term survival and adaptation under a changing environment. As species encounter new stresses (climate change and pollution) and management measures are required to conserve their gene pool (Crăciunesc et al., 2011).
Plant taxonomists believe that the leaves of
some oak species under environmental change and habitat factors such as elevation change or altitudinal gradients show different morphological forms; therefore, several dichotomous keys based on morphological characteristics have been developed to describe species and sections within Quercus (Panahi et al., 2011; Mehrnia et al., 2012 and Taleshi & Maasoumi-Babarabi, 2013), but the
PERSIAN oak (Quercus brantii Lindl.) is a common woody species in the Zagros forests of Iran. The current study evaluates the variation among the Q. brantii populations in
the southwestern forests of Iran using amplified fragment length polymorphism (AFLP) and leaf morphology. A total of 135 trees were sampled from 27 populations representing nine regions in the provinces of Khuzestan (GOL, EMA, BAB, MOG, ALG), Chaharmahal and Bakhtiari (MON), Lorestan (KHA), Kohgiluyeh and Boyer-Ahmad (DIS) and Fars (BAA). Twelve morphological leaf traits were analyzed using PCA and Ward’s clustering methods. The results of ANOVA showed significant differences between populations, but the PCA graph and clustering analysis could not separate the populations on the basis of leaf characteristics. An analysis of molecular variance indicated that most genetic variation was contained within populations (95%); differences between populations accounted for only 1% and 4% was attributed to variation between regions. The five regions of Khuzestan have similar genetic structures. This was observed for the regions in Fars, Lorestan and Chaharmahal and Bakhtiari. Region DIS of Kohgiluyeh and Boyer-Ahmad had a separate genetic structure. The Dendrogram of Quercus brantii populations based on AFLP marker and Cluster analysis of populations using Ward’s method based on morphological data don’t confirm each other and in both, populations mix together. The current study revealed the some morphological and molecular differences in some populations of Persian oak in Iran. Population genetic information can provide critical insights into range expansion and evolutionary potential to adapt to environmental changes.
Keywords: AFLP, Molecular, Morphological, Quercus brantii.
24 Morphological and Molecular Differentiation in Populations ofPersian Oak (Quercus Brantii Lindl.) in Southwestern Iran
Akram Ebrahimi, Taher Nejadsattari, Mostafa Assadi*, Kambiz Larijani** and Iraj Mehregan# Department of Biology, Science and Research Branch, Islamic Azad University, Tehran, Iran; *Research Institute of Forests and Rangelands, Agricultural Research Education and Extension Organization (AREEO),P.O. Box 13185-116, Tehran, Iran and **Department of Chemistry, Science and Research Branch, Islamic Azad University, Tehran, Iran

380
Egypt. J.Bot. 57, No.2 (2017)
AKRAM EBRAHIMI et al.
use of these characteristics alone is not sufficient because of the influence of environmental conditions. For this reason, molecular markers are commonly used to evaluate genetic variation in plant communities. DNA-based markers have numerous benefits over morphological markers because they lack the influence of environment (Duran et al., 2009).
Evaluation of genetic diversity is necessary for germplasm conversion and optimized forest management. Because oaks are important components of temperate forests, they have been the subject of many studies using different morphological and molecular markers (González-Rodríguez & Oyama, 2005; Birchenko, 2008; Ballian et al., 2010; Crăciunesc et al., 2011; Lind & Gailing, 2013; Yücedağ1 & Gailing, 2013; Bakiş & Babaç, 2014 and Lee et al., 2014).
Amplified fragment length polymorphism
(AFLP) technique is a highly repeatable method that produces a large number of markers, which makes it suitable for genetic population studies (Vos et al., 1995). AFLP produces a notably higher amount of markers in comparison with microsatellite markers (Mariette et al., 2002). It has been shown that the vast majority of diversity present occurs by within-population variation rather than between populations or between species (Coart et al., 2002; Kashani & Dodd, 2002 and Coelho et al., 2006).
Shiran et al. (2011) used morphological and AFLP markers and reported a high rate of variation within the Iranian populations of Q. brantii. This study was performed only in one province (Chaharmahal va Bakhtiari) of Iran. Issues such as genetic structure and the impact of environmental factors on morphological traits of populations have not been investigated. Zolfaghari et al. (2009) evaluated genetic diversity in the Persian oak using simple sequence repeat (SSR) and found that middle altitude populations have higher genetic diversity than those at lower and higher altitudes. Using internal transcribed spacer (ITS) markers, Mehrnia et al. (2012) grouped the all populations of oaks in the Zagros Mountains into eight species. Other studies on oaks from other parts of Iran used both molecular and morphological markers (Taleshi & Maasoumi-Babarabi, 2013 and Alikhani et al., 2014).
Historically, oaks have been an important
source of fuel, fodder and building materials. They are also sources of tannin and dye. Oak bark and leaves are used for tanning leather. The fruit of this tree is used in a decoction or as a powder to treat acute diarrhea, inflammation and stomachache (Shikov et al., 2014) in traditional medicine.
The present study evaluates the genetic and morphological variation of Q. brantii populations in the provinces of Lorestan, Khuzestan, Chaharmahal and Bakhtiari, Kohgiluyeh and Boyer-Ahmad and Fars using AFLP markers technique and leaf morphology. This study answer to some important questions; (1) If there morphological and molecular differences between and among populations of Quercus brantii? (2) If the morphological and molecular results confirm each other? (3) In ordination of populations, morphological marker is better or molecular marker? (4) How is that the genetic variation within populations, among populations and among regions? (5) How is that the genetic structure of populations? (6) If the environmental conditions affect the morphological traits?
Materials and Methods
Plant materialsThis study was performed on the materials
from 27 populations collected from nine regions in southwestern Iran (Table 1 and Fig. 1). The regions were located in the provinces of Lorestan (KHA), Chaharmahal and Bakhtiari (MON), Khuzestan (ALG, GOL, MOG, BAB, EMA), Kohgiluyeh and Boyer-Ahmad (DIS) and Fars (BAA). The geographical coordinates, altitude, aspect, annual precipitation average and annual temperature average for each region are shown in Table 1. The collection of acorns was carried out at low, middle and high altitudes at each site during the autumn of 2014. Each population was represented by at least five individual trees at least 50 m apart. All step of this study carried out 2014-2015, in laboratory and herbarium of department of biology, science and research branch, Islamic Azad University, Tehran, Iran.
DNA extraction Because the mature leaves of oaks
contain high amounts of tannin and phenolic compounds, immature fresh leaves of seedlings were used as the DNA source. Fully mature acorns of Q. brantii were collected in the

381
Egypt. J.Bot. 57, No.2 (2017)
MORPHOLOGICAL AND MOLECULAR DIFFERENTIATION.............
Pop. Reg. Prov. Abr. Alt. Lat. Long. Asp. APA ATA
1
2
3Golzar Khuzestan GOL
850
1350
1600
3254.3 ’12°”
329.3’11°”
3216.4’9°”
4940.1’43°”
4946.2’42°”
4936.5’43° “
South
West
East
35 21
4
5
6
Emamzadeh-
AbdollahKhuzestan
EMA
1630
1801
2086
3146.1 ’24°”
3138.6 ’23°”
312.1 ’23°”
5054.1 ’9° “
5046.6 ’9°”
5021.9 ’9° “
East
West
West
132 27
7
8
9
Baloot-Boland Khuzestan BAB
910
1540
2030
3126.4’45°”
3151.1’41°”
3143.5’39°”
5047.1’8°”
5025.7’18°”
5026.6’23° “
South
South
North
34 19
10
11
12
Mongasht Khuzestan MOG950
1285
1621
3154.9’47°”
3130.1’46°”
3115.7’46°”
499.3’59° “
4937.0’59°”
5023.7’0°”
East
West
West
35 21
13
14
15
Alvar-Garm-siri
Khuzestan ALG650
800
1000
3224.7’50°”
3245.4’49°”
328.2’53°”
4834.5’22°”
482.8’16°”
4853.0’15°”
East
West
East
20 26
16
17
18
DishmookKohgiluyeh and Boyer-
AhmadDIS
700
1435
2000
3129.1’14°”
318.5’17°”
3120.8’16°”
500.2’18°”
5051.8’16°”
5012.1’22°”
East
West
East
372 25
19
20
21
Monj Chaharmahal and Bakhtiari MON
1550
1830
2245
3127.1’30°”
3145.9’29° “
3110.3’30°”
5055.5’38°”
503.8’365°”
5029.0’35°”
South
West
West
35 16
22
23
24
Khorram-
AbadLorestan KHA
1162
1420
1874
3318.1’26°”
332’20.5°”
334’17.29°”
485.3’12°”
489’25.18°”
481’26.15°”
South
East
East
30 17
25
26
27
Barm-Arjan Fars BAA1249
1655
2101
2946.6’33°”
2928.7’29°”
2919.3’32°”
5119.5’51°”
5122.4’58°”
5131.8’57°”
North
North
West
13 22
TABLE 1. Geographical and climatic details of 27 populations of Quercus brantii collected for this study. Abbreviations: Pop., population; Reg., Region; Prov., Province; Abr., Abbreviation; Alt., Altitude; Lat., Latitude; Long., Longitude; Asp., Aspect; APA, Annual Precipitation Average (mm); ATA, Annual Temperature Average (°C). Climatic Data were obtained from the Iran Agency of Meteorology (IRIMO) (http://www. irimo.ir).

382
Egypt. J.Bot. 57, No.2 (2017)
AKRAM EBRAHIMI et al.
Fig. 1. Map of Iran indicating locality of collected plant material. Each point represents the region in which three populations are collected (further details in Table1). Abbreviations: GOL, Golzar; EMA, Emamzadeh-Abdollah; BAB, Baloot-Boland; MOG, Mongasht; ALG, Alvar- Garmsiri; DIS, Dishmook; MON, Monj; KHA, Khorram-Abad; BAA, Barm-Arjan.
autumn and then planted in pots. After 3-4 week the leaves appeared. Young fresh leaves were collected from each seedling and stored in plastic bags filled with silica gel pearls until DNA extraction. The total DNA was extracted from the silica-gel dried leaf samples using the modified protocol of Doyle & Doyle (1990) and DNeasy Plant Mini Kits (Germany) following manufacturer protocols. The quality of the extracted DNA was checked on 1% agarose gel. High-quality DNA samples were stored at -20°C until required.
PCR-AFLP analysisFor the AFLP, the Scalone & Albach
(2012) method was used with the following modifications. The total DNA was simultaneously digested with 0.3 µl EcoRI and 0.1 µl MseI (10 U/µl; Thermoscientific; Lithuania) and ligated with T4 DNA ligase (5 U/µl; Thermoscientific; Lithuania) in a reaction buffer (10 mM tris-HCl (pH 7.5), 10 mM Mg acetate, 50 mM K acetate, 1 µl 0.5 mol NaCl and 0.25 µl bovine serum albumin (BSA; 2 mg/ml; Thermoscientific; Lithuania) and 0.091 µl T4 DNA ligase) for 3h at 37°C. Amplification
was carried out in a standard polymerase chain reaction (PCR) cocktail containing 1.5 mM MgCl2, 0.2 mM of each dNTP, 0.1 mM of Taq DNA polymerase, PCR buffer, 1% Tween 20 (Ampliqon; Denmark), 0.125 µl 10 pmol/µl preselective primers E01 and Mo2, 2.25 µl DEPC H2O, 1 µl DMSO and 3 µl diluted product (1:3) of the digestion-ligation reaction. For the primers, the EcoRI primer sequence was identical to the adapter sequence, but the MseI primer had an extra cytosine (C) as a selective nucleotide. Two adaptors, one for the 0.5 µl 5 pmol/µl EcoRI ends and one for the 0.5 µl 5 pmol/µl MseI ends to avoid the reconstruction of the restriction sites. Following incubation, enzymes were inactivated by at 65°C for 10 min. Subsequently, the ligation product was diluted at 1:3 for primary amplification. Primary The PCR reaction was performed in a thermocycler (Labcycler; Sensquest; Germany) for 20 cycles using the following cycling parameters: 20 s at 94°C, 30 s at 56°C, 2 min at 72°C and 30 min at 60°C. The primary amplification product was then diluted at 1:10 for selective amplification selective amplification which involved the use of 4 different primer pair combinations. Selective amplification was carried out in a

383
Egypt. J.Bot. 57, No.2 (2017)
MORPHOLOGICAL AND MOLECULAR DIFFERENTIATION.............
standard PCR reaction cocktail containing 1.5 mM MgCl2, 0.2 mM of each dNTP, 0.1 mM of Taq DNA polymerase, PCR buffer, 1% Tween 20, 0.18 µl 10 pmol/µl EcoRI primer and 0.25 µl 10 pmol/µl MseI primer, 2.07 µl DEPC H2O and 5 µl diluted product of the preselective amplification. The four primer combinations for the selective PCR were E38-Hex combined with M50; E31-Pet and M54; E45-Fam and E40-Ned with M57 (Table 2). The PCR
program had two cycles: 10 cycles of 30 s at 94°C, 30 s at 65°C and 2 min at 72°C, followed by 25 cycles of 30 s at 94°C, 30s at 56°C and 2 min at 72°C. Selective amplification products were resolved on 6% polyacrylamide native gel. The gels were stained with Gelstar (FMC Bioproducts; USA) following manufacturer protocol and documented with a Kodak DC 120 digital camera.
TABLE 2 . Name and sequences of primer pairs that was used in selective-PCR reactions.
Row Forwardprimer
Forward primer sequences
(labeled) Reverseprimer
Reverse primer sequences
(non- labeled)
1E385’HEX-GACTGCGTACCAATTCACT-3’M505’-GATGAGTCCTGAGTAACAT-3’2E315’PET-GACTGCGTACCAATTCAAA-3’M545’-GATGAGTCCTGAGTAACCT-3’3E455’FAM-GACTGCGTACCAATTCATG-3’M575’-GATGAGTCCTGAGTAACGG-3’4E405’NED-GACTGCGTACCAATTCAGC-3’M57’5-’GATGAGTCCTGAGTAACGG-3
Statistical data analysisThe bands on the gel obtained using Gelstar
and scored as present (1) or absent (0) in the readable region of the bands from 50-500 bp in length using Gene Marker (v. 1.95). Each peak having a signal intensity of more than 1000 was selected and checked for presence in each sample. The genetic diversity and structure of populations was calculated using GenAlex (v. 6.501) and Structure (v. 2.3.4), respectively. Some of this work was done in SPSS (v. 22) and Adobe Illustrator CS6.
Morphological dataFive leaves from each of the 135 trees
were selected randomly and measured for biometrical verification of the 27 populations using 12 leaf characteristics (Table 3 and Fig. 2). All measurements were linear and taken with a digital caliper except the number of rays in stellate trichomes on leaf adaxial side and number of rays in stellate trichomes on leaf abaxial side of the leaf, which were measured using a light microscope.
TABLE 3. Measured traits of leaves (Abbreviation letters are defined based on Fig. 2).
Measured traits of Leaf AbbreviationLeaf blade length LBLLeaf blade width (at widest point) LBWLeaf petiole length LPLTotal leaf length (leaf blade length + leaf petiole length) TLLTotal number of tooth TNTNumber of intercalary vein on right side NVRNumber of intercalary vein on left side NVLNervure length in the center of blade NLCInterval between central nervure in apical leaf INALeaf blade shape (leaf blade length/ leaf blade width (at widest point)) LBSNumber of rays in stellate trichomes on leaf adaxial side RADNumber of rays in stellate trichomes on leaf abaxial side RAB

384
Egypt. J.Bot. 57, No.2 (2017)
AKRAM EBRAHIMI et al.
Fig. 2. Definition of oak leaf traits used in this study. Abbreviations: T, Teeth; V, Vein; LBW, leaf blade width; LBL, leaf blade length; LPL, leaf petiole length; INA, interval between central nervure in apical leaf; NLC, nervure length in the center of blade.
Statistical analysisAnalysis of variance (ANOVA) was used
with 5% error and multiple comparisons were done using Duncan's test. Principal component analysis (PCA) was used to determine the most differentiating characteristics of the leaves. Cluster analysis using Ward’s method was performed to examine leaf variation within and between populations. Pearson’s correlation was carried out to test for correlations between leaf morphological characteristics, climate and geographical data. Data analysis was performed using SPSS (v. 22).
Results and Discussion
Analysis of molecular variance (AMOVA) in GenAlex showed that 95% of the total variation could be attributed to differences between individuals within the same population; 1% of the overall variation could be attributed to differences between populations and 4% between regions (Table 4). The greatest genetic
variation was within populations, which agree with the findings of Coart et al. (2002), Kashani & Dodd (2002), Mariette et al. (2002), Coelho et al. (2006), Shiran et al. (2011) and Alikhani et al. (2014). But, there are drawbacks in interpreting results. Five individuals representing each population is very small sample size which for sure affects the results. It doesn’t allow to capture all genetic diversity maybe present in populations and hence results in less differentiation among populations.
A general pattern in temperate tree species is high genetic diversity and low genetic differentiation between populations. This pattern has been explained to be the result of long generation times, woody life forms, out-crossing mating system, high fecundity, mechanism of pollination (anemophily), long age and dispersal of seeds by animals. These are responsible for the low levels of differentiation between populations, which

385
Egypt. J.Bot. 57, No.2 (2017)
MORPHOLOGICAL AND MOLECULAR DIFFERENTIATION.............
TABLE 4. Analysis of molecular variance (AMOVA) of genetic variation in Quercus brantii populations. Abbreviation: Df, Degrees of freedom; SS, Sum of squares; MS, Mean squares; Est.Var., Estandard variation; %, Percent of genetic variation.
%Est.Var.MSSSdfSource of variation
4%
1%
95%
100%
0.189
0.048
5.040
5.345
6.928
4.894
5.156
55.426
127.244
515.600
698.270
8
26
100
134
Among Regions
Among Populations
Within Populations
Total
improves the homogeneity of the allele frequency between adjacent local populations (González-Rodríguez & Oyama, 2005; Coelho et al., 2006; Shiran et al., 2011; QIN et al., 2012; Zhang et al., 2013; Alfonso-Corrado et al., 2014; Porth & El-Kassaby, 2014; Valencia-Cuevas et al., 2014 and Wang et al., 2014).
The dendrogram of AFLP data and indicates that populations mixed and were not separate from each other (Fig. 3 and Table 5). Shiran et al. (2011) showed that, at the morphological level, macromorphological traits significantly differentiate between populations. The clustering pattern from AFLP and morphological analysis was complex in detail, but some general features were evident. The AFLP tree of individuals from different populations were mixed, and this case may correlate with shared old genes by individuals or gene exchange between individuals (González-Rodríguez & Oyama, 2005 and Shiran et al., 2011).
The oak populations may retain high genetic variation because they are long-lived and wind-pollinated plants with large geographic ranges for which a higher number of diverse or more heterozygous individuals may survive over time. They do not generally show separate and specified genetic foundations (Kittelson et al., 2009). Moreover, gene flow is a key factor in species evolution that affects the hybridization
and local adaptation (Gerber et al., 2014). Factors such as forest fragmentation, rapid climate change and interference of humans effect genetic diversity of the population in forest trees that are long-lived (Birchenko, 2008).
Figure 4 shows the results of evaluation of genetic structure and the two gene pools available in the populations are denoted in red and green. Calculation of the percentage of alleles in different regions (Table 6) indicated that five regions have the same genetic pool (GOL, EMA, BAB, MOG and ALG). This was also observed between regions in Fars (BAA), Lorestan (KHA) and Chaharmahal and Bakhtiari (MON). The DIS region of Kohgiluyeh and Boyer-Ahmad had a specific and separate genetic structure.
The pattern of diversity and population genetic structure are determined by the interaction of different factors related to life history traits and ecological features of species, evolutionary history, and natural disturbances. The balance achieved by a population among these factors determines its special genetic structure (Valencia-Cuevas et al., 2014). Genetic structure can be associated with geographical region, climate conditions (Neophytou et al., 2010), hybridization (Curtu et al., 2014), breaking of primary reproductive

386
Egypt. J.Bot. 57, No.2 (2017)
AKRAM EBRAHIMI et al.
Fig. 3. Dendrogram of Quercus brantii populations based on AFLP marker.

387
Egypt. J.Bot. 57, No.2 (2017)
MORPHOLOGICAL AND MOLECULAR DIFFERENTIATION.............
TABLE 5. Explanation of letters and numbers in figure 3. Abbreviations: GOL, Golzar; EMA, Emamzadeh-Abdollah; BAB, Baloot-Boland; MOG, Mongasht; ALG, Alvar- Garmsiri; DIS, Dishmook; MON, Monj; KHA, Khorram-Abad; BAA, Barm-Arjan.
BAAKHAMONDISALGMOGBABEMAGOLRegionPO1-PO27Population
Numbers (1-135): individuals of each populationIndividual
Fig. 4. Correlation between genetic structures of Querus brantii populations in studied regions. Abbreviations: GOL, Golzar; EMA, Emamzadeh-Abdollah; BAB, Baloot-Boland; MOG, Mongasht; ALG, Alvar-Garmsiri; DIS, Dishmook; MON, Monj; KHA, Khorram-Abad; BAA, Barm-Arjan.
TABLE 6. Mean % of allele in Quercus brantii populations in studied regions. The descriptive statistics are presented in terms of the Mean ± SD (Standard deviation). Mean values with the same letters indicate homogeneous subsets for P ≤ 0.05 according to Duncan test.
Region (%) Red allele (%) Green alleleGolzar (GOL)
Emamzadeh-Abdollah (EMA)
Baloot-Boland (BAB)
Mongasht (MOG)
Alvar-Garmsiri (ALG)
Dishmook (DIS)
Monj (MON)
Khorram-Abad (KHA)
Barm-Arjan (BAA)
69.38 ± 25.70 cd
34.08 ± 29.51 ab
58.08 ± 27.97 bcd
43.29 ± 32.46 ab
45.92 ± 29.02 abc
74.00 ± 13.70 d
26.78 ± 25.51 a
20.71 ± 21.83 a
31.63 ± 28.76 a
30.62 ± 25.70 ab
65.92 ± 29.51 cd
41.92 ± 27.97 abc
56.71 ± 32.46 cd
54.08 ± 29.02 bcd
26.00 ± 13.70 a
73.22 ± 25.51 d
79.29 ± 21.83 d
68.38 ± 28.76 d

388
Egypt. J.Bot. 57, No.2 (2017)
AKRAM EBRAHIMI et al.
barriers (Valencia-Cuevas et al., 2014), altitude, historical movements, evolution, phenology and seed dispersal over a large area by animals (Ohsawa et al., 2007; Zhang et al., 2013 and Wang et al., 2014).
A one-way analysis of variance (ANOVA) of all leaf characteristics showed that the populations were significantly different at the 5% level (Table 7). Measures carried out are summarized as three varimax-rotated principal components in Table 8. Principal component analysis (PCA) showed that the variation explained by the first component was mostly accounted for by variables related to TLL (total leaf length) and LBL (leaf blade length) and comprised 37% of the total variation. These traits had the greatest impact on ordination. The second component explained 18% of the total variation and was mostly due to the variation in NVR (number of intercalary veins on the right side) and NVL (number of intercalary veins on the left side). Morphological characters on the third principal component explained 15% of the total variation. In total, these three factors explained 70% of the total variance in the data; thus, the traits of total leaf length, leaf blade length, number of intercalary veins on the right side and number of intercalary veins on the left side had the greatest impact on ordination.
The principal component analysis graph of the first two components from principal component analysis could not separate the populations on the basis of leaf characteristics (Fig. 5). One of the first steps was to determine and identify population variation using morphological markers. Among the morphological traits, the leaves and fruit have special importance. In the current study, despite significant differences between populations for leaf morphological traits, the populations could not be separated and the results of the morphological traits data differed from the AFLP markers. Mehrnia et al. (2012) found that leaf morphological traits were not important
for separation of the Quercus species. The current study and Taleshi & Maasoumi-Babarabi (2013) showed that the principal component analysis graph and cluster analysis were unable to separate populations on the basis of leaf characteristics but that leaf blade length was an important trait in ordination.
The results of cluster analysis by Ward’s method using of total leaf characteristics showed that all populations fell into major clades A and B and except a few (8-9,10-11 and 17-18) populations that could not be separated. One point in this cluster was for the population at high altitudes in clade B (Fig. 6). Shiran et al. (2011) reported that the dendrogram obtained from AFLP markers showed a general pattern that was quite different from the pattern obtained by morphological analysis.
Table 9 shows the correlation between leaf morphological characteristics, geographical conditions and climatic factors. The results indicate that geographical conditions influence a number of leaf characteristics, but that temperature and precipitation effect more leaf characteristics.
Conclusion
Despite the fact that this investigation was carried out in part of the Zagros forest, analysis revealed the some morphological and molecular differentiations in some populations of Persian oaks in Iran. The pattern of diversity differs depending on the kind of marker and the analysis performed. Further molecular investigations are required in this case to test for historical evolutionary forces that shape species population structure.
Acknowledgments: This article is extracted from Akram Ebrahimi Ph.D thesis. We want to finally thank Islamic Azad University-Tehran Science and Research Branch for providing the facilities necessary to carry out the work.

389
Egypt. J.Bot. 57, No.2 (2017)
MORPHOLOGICAL AND MOLECULAR DIFFERENTIATION.............
TABLE 7. The results of Duncan's mean comparison test for leaf morphological characters in different regions of Quercus brantii. The descriptive statistics are presented in terms of the Mean ± SD (Standard deviation). Mean values with the same letters indicate homogeneous subsets for P ≤ 0.05 according to Duncan test. Abbreviations: GOL, Golzar; EMA, Emamzadeh-Abdollah; BAB, Baloot-Boland; MOG, Mongasht; ALG, Alvar-Garmsiri; DIS, Dishmook; MON, Monj; KHA, Khorram-Abad; BAA, Barm-Arjan.
Region LBL LBW LPL TLLGOL
EMA
BAB
MOG
ALG
DIS
MON
KHA
BAA
8.34±1.35bcd
8.26±1.68bcd
8.44±1N73bcd
7.61±1.70ab
7.28±1.54a
9.14±1.67d
8.22±1.33bc
8.53±1.42cd
7.11±1.51a
4.66±1.10abc
4.82±1.04bc
5.21±1.42c
4.82±1.32bc
4.05±0.83a
4.69±1.23abc
4.73±1.10abc
4.36±0.93ab
4.57±1.48abc
1.54±0.30ab
1.57±0.39ab
1.60±0.43ab
1.38±0.49a
1.50±0.40ab
1.93±0.58c
1.60±0.53ab
1.65±0.38b
1.55±0.45ab
9.88±1.44bc
9.82±1.86bc
10.04±2.04c
8.99±1.83ab
8.78±1.75a
11.06±2.09d
9.83±1.61bc
10.18±1.66cd
8.67±1.81aRegion TNT NVR NVL NLC
GOL
EMA
BAB
MOG
ALG
DIS
MON
KHA
BAA
21.90±6.34bc
20.80±5.14abc
23.83±5.65c
21.10±7.38abc
18.77±6.67ab
20.50±4.67abc
19.67±5.25ab
21.90±5.75bc
18.03±4.86a
11.03±2.62bcd
10.37±1.97ab
11.97±1.90cd
10.53±2.73ab
9.50±2.01a
12.03±2.13d
11.57±2.32bcd
10.43±2.61ab
10.73±1.84abc
11.40±2.62bc
10.47±2.13ab
11.87±1.98c
10.60±2.63abc
9.40±2.28a
11.53±1.85bc
11.07±2.13bc
10.47±2.39ab
10.83±2.04bc
3.03±0.67abc
3.12±0.72bc
3.31±0.96c
3.02±0.69abc
2.64±0.45a
3.09±0.80bc
3.04±0.78abc
2.74±0.66ab
2.83±0.80abRegion INA RAD RAB LBS
GOL
EMA
BAB
MOG
ALG
DIS
MON
KHA
BAA
1.02±0.18ab
0.99±0.26a
0.89±0.30a
1.06±0.88ab
0.88±0.31a
1.33±1.47b
0.86±0.27a
0.92±0.33a
0.70±0.22a
5.77±1.04d
5.40±1.07cd
5.73±1.34d
5.37±0.10bcd
5.37±1.16bcd
4.77±1.14ab
4.37±1.03a
5.07±0.83bc
4.83±1.02abc
5.83±0.99cd
6.07±0.98d
6.03±1.45d
5.83±1.02cd
5.67±1.06bcd
5.63±1.10bcd
5.20±1.19ab
4.93±0.91a
5.23±0.94abc
1.84±.300bc
1.73±.182ab
1.66±.255ab
1.62±.293a
1.84±.417bc
2.01±.370c
1.78±.341ab
2.01±.379c
1.61±.299a

390
Egypt. J.Bot. 57, No.2 (2017)
AKRAM EBRAHIMI et al.
TABLE 8. Principal component analysis carried out on morphological traits: Factor loadings and % of exploited variability.
CharactersComponent
1 2 3 4
LBL 0.931 0.240 -0.015 0.014LBW 0.678 0.104 0.697 0.003
LPL 0.692 -0.035 -0.005 -0.213
TLL 0.969 0.199 -0.015 -0.040
TNT 0.025 0.824 -0.090 0.059
NVR 0.136 0.913 0.017 -0.098
NVL 0.108 0.935 0.027 -0.022
NLC 0.689 0.033 0.588 0.021
INA 0.355 -0.288 0.037 -0.071
RAD -0.077 -0.042 0.085 0.821
RAB -0.083 0.022 -0.063 0.817
LBS 0.131 0.112 -0.957 -0.017
Fig. 5. The scatter plot of the populations on the basis of first two component of PCA. Abbreviations: GOL, Golzar; EMA, Emamzadeh-Abdollah; BAB, Baloot-Boland; MOG, Mongasht; ALG, Alvar-Garmsiri; DIS, Dishmook; MON, Monj; KHA, Khorram-Abad; BAA, Barm-Arjan.

391
Egypt. J.Bot. 57, No.2 (2017)
MORPHOLOGICAL AND MOLECULAR DIFFERENTIATION.............
Fig. 6. Cluster analysis of Quercus brantii population using Ward’s method based on morphological data..
TABLE 9. Correlation between leaf morphological characters, geographical conditions and climatic factors. Pearson’s correlation coefficient is indicated with level of significance (P ≤ 0.05 and P ≤ 0.01). Minus sign (-) shows the negative and plus sign (+) shows the positive correlation between factors. *Correlation is significant at the 0.05 level (2-tailed). **Correlation is significant at the 0.01 level (2-tailed).
PrecipitationTemperatureAspectLongitudeLatitudeAltitudeCharacters**0.308
0.104
*0.132
**0.297
*0.154
*0.126
0.098
*0.151
**0.200
0.035
*0.132
**0.171
*-0.142
-0.097
-0.064
*-0.138
*-0.130
**-0.204
**-0.175
-0.070
0.039
0.103
**0.157
-0.045
0.057
0.013
0.051
0.062
**-0.178
**-0.197
**-0.216
0.037
0.048
-0.078
-0.006
0.027
-0.089
*0.121
0.020
-0.072
-0.092
0.119
0.097
0.087
-0.056
*-0.154
0.001
**-0.250
0.089
*-0.121
-0.020
0.072
0.092
-0.119
-0.097
-0.087
0.056
*0.154
-0.001
**0.250
0.063
0.024
*0.149
0.090
*-0.122
0.040
0.019
0.025
-0.039
*-0.146
-0.039
0.001
LBL
LBW
LPL
TLL
TNT
NVR
NVL
NLC
INA
RAD
RAB
LBS
392
Egypt. J.Bot. 57, No.2 (2017)
AKRAM EBRAHIMI et al.
References
Alfonso-Corrado, C., Clark-Tapia, R., Monsalvo - Reyes, A., Rosas-Osorio, C., González-Adame, G., Naranjo - Luna, F., Venegas - Barrera, C.S. and E. Campos, J. (2014) Ecological-genetic studies and conservation of endemic Quercus sideroxyla (Trel.) in Central Mexico. Nat Resour. 5,442-453.
Alikhani, L., Rahmani, M.S., Shabanian, N., Badakhshan, H. and Khadivi-Khub, A. (2014) Genetic variability and structure of Quercus brantii assessed by ISSR, IRAP and SCoT markers. Gene.552(1),176-83.
Bakiş, Y. and Babaç, M.T. (2014) Morphological variability of acorns and its taxonomic significance in Quercus L. from Turkey. Bangladesh J. Bot. 43(3), 293-299.
Ballian, D., Belletti, P., Ferrazzini, D., Bogunić, F. and Kajba, D. (2010) Genetic variability of Pedunculate Oak (Quercus robur L.) in Bosnia and Herzegovina. Period Boil. 112(3), 353–362.
Birchenko, I. (2008) Genetic diversity of native northern red oak (Quercus rubra L.) populations. Ph.D. Dissertation, University of Notre Dame, Notre Dame, France.
Coart, E., Lamote, V., De Loose, M., Van Bockstaele, E., Lootens, P. and Roldán-Ruiz, I. (2002) AFLP markers demonstrate local genetic differentiation between two indigenous oak species [Quercus robur L. and Quercus petraea (Matt.) Liebl.] in Flemish populations. Theor Appl Genet. 105(2-3), 431-439.
Coelho, A.C, Lima, M.B., Neves, D. and Cravador, A. (2006) Genetic diversity of two evergreen Oaks [Quercus suber (L.) and Quercus ilex subsp rotundifolia (Lam.)] in Portugal using AFLP markers. Silvae Genet. 55(3),105-118.
Crăciunesc, I., Ciocîrlan, E., Şofletea, N. And Curtu, A.L. (2011) Genetic diversity of pedunculate oak (Quercus robur L.) in Prejmer natural reserve. Bulletin of the Transilvania University of Braşov series II: F. 4(53) 1, 15-20.
Curtu, A.L., Craciunesc, L., Enescu, C.M., Vidalis, A. and Sofletea, N. (2014) Fine-scale spatial genetic structure in a multi-oak-species (Quercus spp.) forest. I Forest, 8,324-332.
Doyle, J.J. and Doyle, J.H. (1990) Isolation of plants DNA from fresh tissue. Focus, 12,13-15.
Duran, C.N., Appleby, T., Clark, D., Wood, M., Batley, I.J. and Edwards, D. (2009) AutoSNPdb: an annotated single nucleotide polymorphism data base for crop plants. Nucleic Acids Res. 37, 951-953.
Gerber, S., Chadoeuf, J., Gugerli, F., Lascoux, M., Buiteveld, J., Cottrell, J., Dounavi, A., Fineschi, S., Forrest, L.L., Fogelqvist, J., Goicoechea, P.G., Svejgaard, Jensen J., Salvini, D., Vendramin. G.G. and Kremer, A. (2014) High rates of gene flow by pollen and seed in oak populations across Europe. Plos One. 9(1), 1-16.
González-rodríguez, A. and Oyama, K. (2005) Leaf morphometric variation in Quercus affinis and Quercus laurina (Fagaceae), two hybridizing Mexican red oaks. Bot. J. Linnean Soci. 147, 425-435.
Heydari, M., Poorbabaei, H., Rostami, T., Begim-Faghir, M., Salehi, A. and Ostad-Hashmei, R. (2013) Plant species in Oak (Quercus brantii Lindl.) understory and their relationship with physical and chemical properties of soil in different altitude classes in the Arghavan valley protected area, Iran. Caspian J. Env. Sci. 11(1), 97-110.
Kashani, N. and Dodd, R. (2002) Genetic differentiation of two California red oak species, Quercus parvula var. Shreveii and Q. wislizeni, based on AFLP genetic markers. USDA Forest Service Gen. Tech. Rep. 184, 417-426.
Kittelson, P.M., Pinahs, C., Dwyer, J., Ingersoll, A., Mans, E., Rieke, J., Rutman, B. and Volenec, M. (2009) Age structure and genetic diversity of four Quercus macrocarpa (Michx.) populations in fragmented oak savanna along the Central Minnesota River valley. Am. Midl. Nat.161(2), 301-312.
Lee, J.H., Lee, D.H., Choi, I.S. and Choi, B.H. (2014) Genetic diversity and historical migration patterns of an endemic evergreen oak, Quercus acuta, across Korea and Japan, inferred from nuclear microsatellites. Plant Sys. Evol. 300(8), 1913-1923.
Lind, J. and Gailing, O. (2013) Genetic structure of Quercus rubra L. and Quercus ellipsoidalis E. J. Hill populations at gene-based EST-SSR and nuclear SSR markers. Tree Genet. Genomes.9(3), 707-722.
Mariette, S., Cottrell, J., Csaikl, U., Goikoechea, P., König, A., Lowe, A., Van Dam, B., Barreneche, T., Bodénès, C., Streiff, R., Burg, K., Groppe, K., Munro, R. and Tabbener Hand Kremer, A. (2002) Comparison of levels of genetic diversity detected with AFLP and microsatellite markers within and

393
Egypt. J.Bot. 57, No.2 (2017)
MORPHOLOGICAL AND MOLECULAR DIFFERENTIATION.............
among mixed Q.petraea (Matt.) Liebl. and Q. robur L. stands. Silvae Genet. 51(2-3), 72-79.
Mehrnia, M., Nejadsattari, T., Assadi, M. and Mehregan, I. (2012) Biosystematics and species delimination of Quercus L. (Fagaceae) in the Zagros Mountains (Iran) using molecular markers. Ph.D. Dissertation, Islamic Azad University of Tehran, Tehran, Iran.
Neophytou, C., Aravanopoulos, F.A., Fink, S. and Dounavi, A. (2010) Detecting interspecific and geographic differentiation patterns in two interfertile oak species (Quercus petraea (Matt.) Liebl. and Q. robur L.) using small sets of microsatellite markers. For. Ecol. Manage. 259, 2026-2035.
Ohsawa, T., Tsuda, Y., Saito, Y., Sawada, H. and Ide, Y. (2007) Altitudinal genetic diversity and differentiation of Quercus crispula in the Chichibu Mountains, central Japan. Int. J. Plant Sci. 168(3), 333-340.
Panahi, P., Pourmajidian, M.R., Jamzad, Z. and Fallah, A. (2011) Importance of micromorphological characteristics of foliar and pollen grains for delimitation of Oak species in Iran. IJFPR, 19(1),163-179[Iran].
Porth, I. and El-Kassaby, Y.A. (2014) Assessment of the genetic diversity in forest tree populations using molecular markers. Diversity, 6, 283-295.
Qin, Y.Y., Han, H.R., Kang, F.F. and Zhao, Q. (2012) Genetic diversity in natural populations of Quercus liaotungensis in Shanxi Province based on nuclear SSR markers. J. Beijing For. Univ. 34(2),61-65.
Sagheb-Talebi, KH., Sajedi, T. and Yazdian, F. (2004) Forests of Iran. Research Institute of Forests & Rangelands. Tec.Pub. 339. 29 pp.
Scalone, R. and Albach, D. (2012) Degradation of sexual reproduction in Veronica filiformis after introduction to Europe. BMC Evol. Biol.12(233),1-19.
Shikov, A.N., Pozharitskaya, O.N., Makarov, V.G., Wagner, H., Verpoorte, R. and Heinrich, M. (2014) Medicinal
plants of the Russian pharmacopoeia; their history and applications. J.Ethnopharmacol.154, 481-536.
Shiran, B., Mashayekhi, S., Jahanbazi, H., Soltani, A.. and Bruschi, P. (2011) Morphological and molecular diversity among populations of Quercus brantii Lindl. in western forest of Iran. Plant Biosyst. 145(2), 452-460.
Taleshi, H. and Maasoumi-Babarabi, M. (2013) Leaf morphological variation of Quercus brantii Lindl. along an altitudinal gradient in Zagros forests of Fars Province, Iran. Euro. J. Exp. Bio. 3(5),463-468.
Valencia-Cuevas, L., Piñero, D., Mussali-Galante, P., Valencia-Ávalos, S. and Tovar-Sánchez, E. (2014) Effect of a red oak species gradient on genetic structure and diversity of Quercus castanea (Fagaceae) in Mexico. Tree Genet. Genomes, 10(3), 641-652.
Vos, P., Hogers, R., Bleeker, M., Reijans, M., Lee, T., Hornes, M., Frijters, A., Pot, J., Peleman, J., Kuiper, M. and Zabeau, M. (1995) AFLP: A new technique for DNA fingerprinting. Nucleic Acids Res. 23(21), 4407-4414.
Wang, G., Wei, Q.Y., Lu, S.J., Chen, Y.F. and Wang, Y.L. (2014) Genetic diversity of Quercus liaotungensis Koidz populations at different altitudes. Sci. Res. Essays. 9(8), 249-256.
Yücedağ, C. and Gailing, O. (2013) Morphological and genetic variation within and among four Quercus petraea and Q. robur natural populations. Turk. J.Bot. 37, 619-629.
Zhang, Y.Y., Fang, Y.M., Yu, M-K. and Zhou, X-L. (2013) Molecular characterization of sawtooth oak (Quercus acutissima) germplasm based on randomly amplified polymorphic DNA. Plant Syst. Evol. 299(10), 1829-1837.
Zolfaghari, R., Akbarinia, M., Mardi, M. and Ghanati, F. (2009) Genetic diversity in Persian oak (Quercus brantii Lindl) from Kohgiluyeh and Boyer-Ahmad using SSR. IJFPR, 16(2),172-181 [Iran].
Received: 9 / 3/ 2017Accepted: 27 / 4 / 2017


![Tannin gel derived from Leaves of Ricinus Communis as an ... · Tannin gel preparation (TGLRC) Tannin gels were prepared according to the basis of Nakano et al. [17]. Five grams of](https://img.pdfslide.net/doc/110x75/5c94e7e309d3f2737b8baf63/tannin-gel-derived-from-leaves-of-ricinus-communis-as-an-tannin-gel-preparation.jpg)