Embed Size (px)
Citation preview

25-Sept-08
Defining indicators for European cities: bridging the gap between policy demand and statistical information supply
“International Forum on Metropolitan Statistics“
Beijing Teodora BrandmullerEurostat Unit D2
What is the Urban Audit?
The Urban Audit is a joint effort by the European Commission and the European Statistical System to provide reliable and comparative statistical information on selected urban areas
Dimensions of the dataset:
– Spatial dimension– Indicators dimension
– Time dimension
Spatial dimension

The demand
To cover all cities in Europe To delineate cities according to the functional
boundaries (irrespective of administrative units) To give information on the relation between the
city and its hinterland To give information on inner city disparities

Cities participating in the Urban Audit
321 cities in EU27
Cities in HR, TR, NO and CH

Hamburg, Germany

Hamburg
Urban Morphological Zone

Hamburg
Core city

Hamburg
Sub-city districts

Unemployment

Proportion of households living in social housing

Number of recorded crime per inhabitant

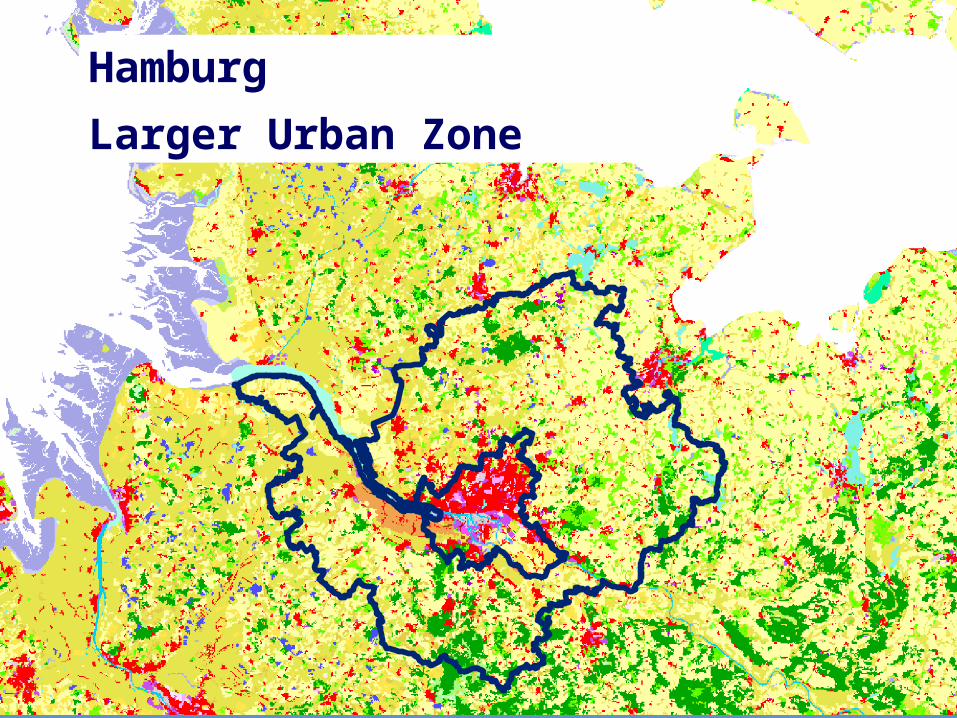
Hamburg
Larger Urban Zone
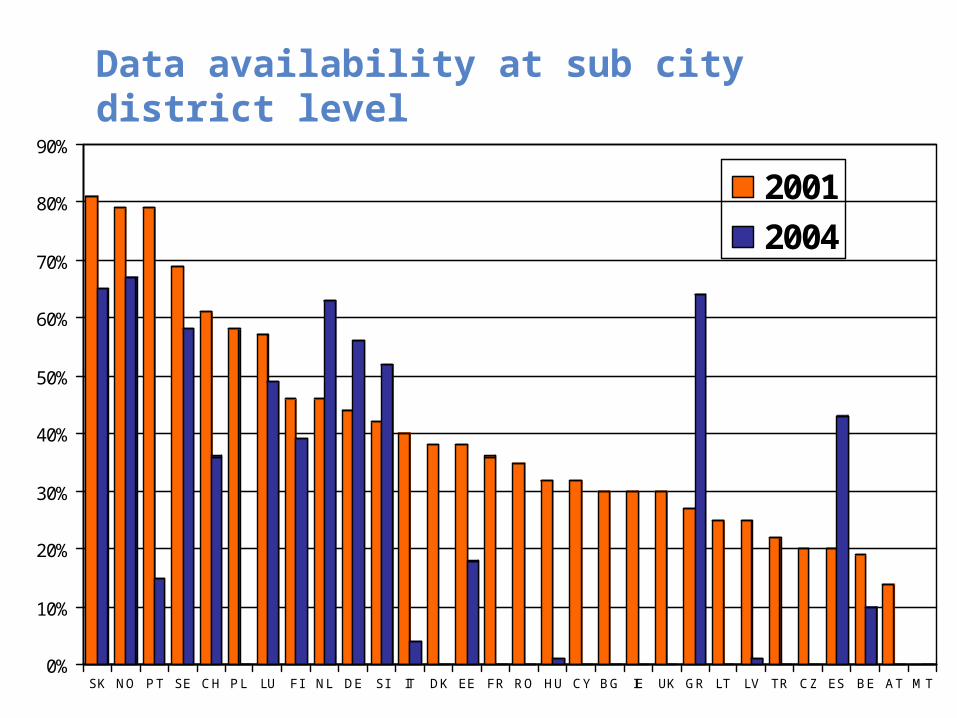
Data availability at sub city district level
0%
10%
20%
30%
40%
50%
60%
70%
80%
90%
SK NO PT SE CH PL LU FI NL DE SI IT DK EE FR RO HU CY BG IE UK GR LT LV TR CZ ES BE AT MT
2001
2004

The demand
To cover all cities in Europe
To delineate cities according to the functional boundaries (irrespective of administrative units)
To give information on the relation between the city and its hinterland
To give information on inner city disparities
The supply
The Urban Audit is a good sample
Only administrative units have sufficient data – these boundaries are verified by the morphological zones
The LUZ is based on commuter flows, a good proxy.
Providing inner city information is important but in non census years it is extremely difficult
Indicators dimension
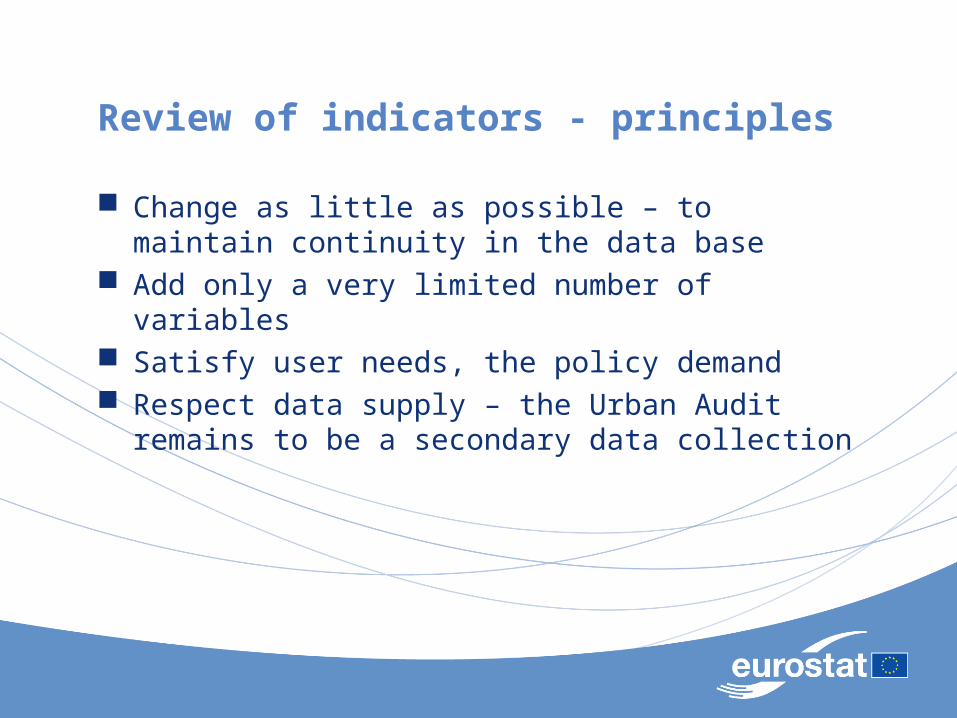
Review of indicators - principles
Change as little as possible – to maintain continuity in the data base
Add only a very limited number of variables Satisfy user needs, the policy demand Respect data supply – the Urban Audit remains to be a
secondary data collection

Review of indicators
Demand Review policy need Consult stakeholders Contributions received from:
– DG ENVIRONMENT– EUROPEAN ENVIRONMENT
AGENCY (EEA)– DG HEALTH– DG ENTERPRISE– DG TRANSPORT– DG EMPLOYMENT– EUROSTAT TEAM FOR WASTE
STATISTICS – EUROSTAT TEAM FOR WATER
INDICATORS– EUROSTAT TEAM FOR CULTURE– EUROPEAN COUNCIL OF
ARCHITECTS (ACE)
Supply Review what is available Consult stakeholders Contributions received from:
– National Urban Audit Co-ordinators– EUROPEAN ENVIRONMENT
AGENCY (EEA)– EUROSTAT GISCO TEAM

Lo
w
D
ata
av
aila
bili
ty
H
igh
Low Policy relevance High
Data to be collected
in the Urban AuditData should
not
be collectedData to be collected
with other methods
Evaluation matrix

Incidence rate of victimisation
Very low response rate
All municipal authority income variables
No comparable data is available
All local e-government variables
No longer relevant
Data not to be collected

New Indicators to be collected
Median population age Number of persons born abroad
(not only nationals), broken down by continent
Proportion of households with at least 3 children less than 17 years old
Number of unemployed person households with children
Suicide rate (by age groups) Number of general practitioners Number of specialist doctors The employment rates by gender
with/without children (0-17)
Number of enterprises that had a revenue increase last year (size class >250 employees)
Employment growth last year (size class 1-250 employees)
Employment growth last year (size class >250 employees)
Average size of school classes Percentage of population exposed to
concentrations in exceedance for fine particles PM2.5
Proportion of solid waste which is composted
Average length of commuting trips

Indicators NOT included due tolow data availability
Frequency of extreme weather conditions
Number of days of peak heat Maximum number of consecutive
days without rain People affected by health
problems due to extreme weather conditions
Emissions from domestic heating (PM10, PM2.5, SO2, NOX)
Transport emissions (PM10, PM2.5, SO2, NOX)
Proportion of solid waste produced by construction
Demolition waste; Industrial waste Proportion of solid waste which is composted Total surface area of the sites classified as
potentially contaminated sites Primary energy demand (toe) by fuel Final energy consumption (toe) by fuel Electricity demand per capita (kWh/capita) Total energy consumption in kWh/ y for
electricity, heating and cooling, hot water Primary/Final energy consumption by sector
(toe) Consumption of renewable energies by
source percent of total consumption)

Alternative methods to collect data on cities – The Urban Atlas
Reference year 2006 +- 1 year Goal cover all Urban Audit Larger Urban Zones Ideally, updating should be less expensive and could be
envisaged every 3 years Next update for reference year 2011
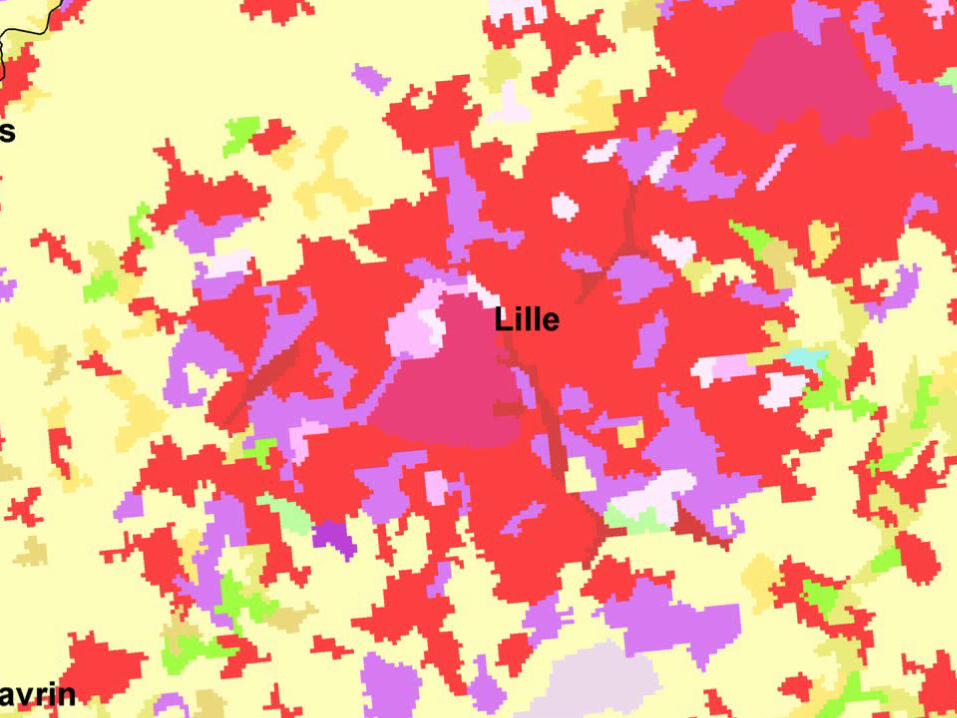


The Urban Atlas
Possible new indicators Land use in cities Urban sprawl Green space availability Accessibility …

25-Sept-08
Time dimension

Timeliness
Timeliness meets the highest international standards.
Periodicity takes into account user requirements as much as possible.
Timeliness of 2 years
Periodicity of 3 years
Data is 5-year-old
Increase periodicity

Non-Excessive Burden on Respondents
The reporting burden should be proportionate to the needs of the users and should not be excessive for respondents. The statistical authority monitors the response burden and sets targets for its reduction over time.
Timeliness
Increase periodicity
Annual data collection for a limited data set

Future plans in the time dimension
The Think Tank recommended an annual data collection– Starting in 2009
– Collecting data for the years 2004 to 2007
– For core city and LUZ
– A very limited number of variables (20 to 30)
The exhaustive Urban Audit will continue– Reduced frequency (every 4 to 5 years)
– Take place in census years


![IEEE Standards for Local and Metropolitan Area Networks ...mv/standards/ieee/802_1Q-1998.pdf · • ANSI/IEEE Std 802.1G [ISO/IEC 15802-5] Remote Media Access Control (MAC) bridging](https://img.pdfslide.net/doc/110x75/5ad4a91d7f8b9aff228c1ba5/ieee-standards-for-local-and-metropolitan-area-networks-mvstandardsieee8021q-1998pdf.jpg)